Attached files
| file | filename |
|---|---|
| EXCEL - IDEA: XBRL DOCUMENT - CRAFT BREW ALLIANCE, INC. | Financial_Report.xls |
| EX-23.1 - EXHIBIT 23.1 - CRAFT BREW ALLIANCE, INC. | ex23_1.htm |
| EX-31.1 - EXHIBIT 31.1 - CRAFT BREW ALLIANCE, INC. | ex31_1.htm |
| EX-99.1 - EXHIBIT 99.1 - CRAFT BREW ALLIANCE, INC. | ex99_1.htm |
| EX-32.1 - EXHIBIT 32.1 - CRAFT BREW ALLIANCE, INC. | ex32_1.htm |
| EX-31.2 - EXHIBIT 31.2 - CRAFT BREW ALLIANCE, INC. | ex31_2.htm |
| EX-24.1 - EXHIBIT 24.1 - CRAFT BREW ALLIANCE, INC. | ex24_1.htm |
| EX-10.19 - EXHIBIT 10.19 - CRAFT BREW ALLIANCE, INC. | ex10_19.htm |
| EX-10.18 - EXHIBIT 10.18 - CRAFT BREW ALLIANCE, INC. | ex10_18.htm |
UNITED STATES
SECURITIES AND EXCHANGE COMMISSION
WASHINGTON, D. C. 20549
FORM 10-K
☒ ANNUAL REPORT PURSUANT TO SECTION 13 OR 15(d) OF THE
SECURITIES EXCHANGE ACT OF 1934
For the Fiscal Year Ended: December 31, 2014
OR
☐ TRANSITION REPORT PURSUANT TO SECTION 13 OR 15(d) OF THE
SECURITIES EXCHANGE ACT OF 1934
Commission File Number: 0-26542
CRAFT BREW ALLIANCE, INC.
(Exact name of registrant as specified in its charter)
|
Washington
|
91-1141254
|
|
|
(State or other jurisdiction of incorporation or organization)
|
(I.R.S. Employer Identification No.)
|
|
929 North Russell Street
|
||
|
Portland, Oregon
|
97227-1733
|
|
|
(Address of principal executive offices)
|
(Zip Code)
|
Registrant’s telephone number, including area code: (503) 331-7270
|
Securities Registered pursuant to Section 12(b) of the Act:
|
||
|
Title of each class
|
Name of each exchange on which registered
|
|
|
Common Stock, $0.005 par value
|
The NASDAQ Stock Market LLC
|
Securities registered pursuant to Section 12(g) of the Act: None
Indicate by check mark if the Registrant is a well-known seasoned issuer, as defined in Rule 405 of the Securities Act.
Yes ☐ No☒
Indicate by check mark if the Registrant is not required to file reports pursuant to Section 13 or Section 15(d) of the Act.
Yes ☐ No ☒
Indicate by check mark whether the registrant (1) has filed all reports required to be filed by Section 13 or 15(d) of the Securities Exchange Act of 1934 during the preceding 12 months (or for such shorter period that the registrant was required to file such reports), and (2) has been subject to such filing requirements for the past 90 days: Yes ☒ No ☐
Indicate by check mark whether the registrant has submitted electronically and posted on its corporate Web site, if any, every Interactive Data File required to be submitted and posted pursuant to Rule 405 of Regulation S-T (§ 232.405 of this chapter) during the preceding 12 months (or for such shorter period that the registrant was required to submit and post such files). Yes ☒ No ☐
Indicate by check mark if disclosure of delinquent filers pursuant to Item 405 of Regulation S-K is not contained herein, and will not be contained, to the best of registrant's knowledge, in definitive proxy or information statements incorporated by reference in Part III of this Form 10-K, or any amendment to this Form 10-K. ☐
Indicate by check mark whether the registrant is a large accelerated filer, an accelerated filer, a non-accelerated filer or a smaller reporting company. See definition of “accelerated filer,” “large accelerated filer” and “smaller reporting company” in Rule 12b-2 of the Exchange Act.
Large accelerated filer ☐ Accelerated filer ☒ Non-accelerated filer ☐ (Do not check if a smaller reporting company) Smaller reporting company ☐
Indicate by check mark whether the registrant is a shell company (as defined in Rule 12b-2 of the Act). Yes ☐ No ☒
The aggregate market value of the common equity held by non-affiliates of the registrant as of the last day of the registrant’s most recently completed second quarter on June 30, 2014 (based upon the closing price of the registrant’s common stock, as reported by the NASDAQ Stock Market, of $11.06 per share) was $122,055,981.
The number of shares outstanding of the registrant’s common stock as of February 16, 2015 was 19,115,396 shares.
Documents Incorporated by Reference
Portions of the registrant’s definitive Proxy Statement for the 2015 Annual Shareholders’ Meeting are incorporated by reference into Part III.
CRAFT BREW ALLIANCE, INC.
2014 FORM 10-K ANNUAL REPORT
|
Page
|
|||
|
PART I
|
|||
|
Item 1.
|
2
|
||
|
Item 1A.
|
12
|
||
|
Item 1B.
|
18
|
||
|
Item 2.
|
18
|
||
|
Item 3.
|
19
|
||
|
Item 4.
|
19
|
||
|
PART II
|
|||
|
Item 5.
|
20
|
||
|
Item 6.
|
22
|
||
|
Item 7.
|
23
|
||
|
Item 7A.
|
34
|
||
|
Item 8.
|
35
|
||
|
Item 9.
|
62
|
||
|
Item 9A.
|
62
|
||
|
Item 9B.
|
64
|
||
|
PART III
|
|||
|
Item 10.
|
64
|
||
|
Item 11.
|
64
|
||
|
Item 12.
|
64
|
||
|
Item 13.
|
65
|
||
|
Item 14.
|
65
|
||
|
PART IV
|
|||
|
Item 15.
|
65
|
||
|
66
|
|||
INFORMATION REGARDING FORWARD-LOOKING STATEMENTS
This annual report on Form 10-K includes forward-looking statements. Generally, the words “believe,” “expect,” “intend,” “estimate,” “anticipate,” “project,” “will,” ”may,” “plan” and similar expressions or their negatives identify forward-looking statements, which generally are not historical in nature. These statements are based upon assumptions and projections that we believe are reasonable, but are by their nature inherently uncertain. Many possible events or factors could affect our future financial results and performance, and could cause actual results or performance to differ materially from those expressed, including those risks and uncertainties described in “Item 1A. - Risk Factors” and those described from time to time in our future reports filed with the Securities and Exchange Commission. Caution should be taken not to place undue reliance on these forward-looking statements, which speak only as of the date of this annual report.
THIRD-PARTY INFORMATION
In this report, we rely on and refer to information regarding industry data obtained from market research, publicly available information, industry publications, U.S. government sources or other third parties. Although we believe that the third-party sources of information we use are materially complete, accurate and reliable, there is no assurance of the accuracy, completeness or reliability of third-party information.
Overview
Craft Brew Alliance is a leading craft brewing company that brews, brands and markets some of the world’s most respected and best-loved American craft beers.
The company is home to three of the earliest pioneers in craft beer: Redhook Ale Brewery, Washington’s largest craft brewery founded in 1981; Widmer Brothers Brewing, Oregon’s largest craft brewery founded in 1984; and Kona Brewing Company, Hawaii’s oldest and largest craft brewery founded in 1994. As part of Craft Brew Alliance, these craft brewing legends have expanded their reach across the U.S. and more than 15 international markets.
In addition to growing and nurturing distinctive brands rooted in local heritage, Craft Brew Alliance is committed to developing innovative new category leaders, such as Omission Beer, which is the #1 beer in the gluten free beer segment, and Square Mile Cider, a tribute to the early American settlers who purchased the first plots of land in the Pacific Northwest.
Publicly traded on NASDAQ under the ticker symbol BREW, Craft Brew Alliance is headquartered in Portland, Oregon and operates five breweries and five pub restaurants across the U.S. For more information about CBA and its brands, see “Available Information” on page 12.
We proudly brew our craft beers in four company-owned breweries located in Portland, Oregon; the Seattle suburb of Woodinville, Washington; Portsmouth, New Hampshire; and Kailua-Kona, Hawaii; and one brewery in Memphis, Tennessee owned by our brewing partner. Additionally, we own and operate two small innovation breweries, primarily used for small batch production and innovative brews, in Portland, Oregon and Portsmouth, New Hampshire.
We distribute our beers to retailers through independent wholesalers that are aligned with the Anheuser-Busch, LLC (“A-B”) network. These sales are made pursuant to a Master Distributor Agreement (the “A-B Distributor Agreement”) with A-B. As a result of this distribution arrangement, we believe that, under alcohol beverage laws in a majority of states, these wholesalers would own the exclusive right to distribute our beers in their respective markets if the A-B Distributor Agreement expires or is terminated. Redhook and Widmer Brothers beers are distributed in all 50 states and Kona beers are distributed in 40 states. Omission Beer continues to expand into new markets in the U.S. and internationally. Square Mile is currently available in 10 states in the West. Separate from our A-B wholesalers, we maintain an internal independent sales and marketing organization with resources across the key functions of brand management, field marketing, field sales, and national retail sales.
We operate in two segments: Beer Related operations and Pubs operations. Beer Related operations include the brewing and sale of craft beers and cider from our breweries, both domestically and internationally. Pubs operations primarily include our five pubs, four of which are located adjacent to our Beer Related operations, as well as other merchandise sales, and sales of our beers directly to customers.
Industry Background
We are one of the top five brewers in the craft brewing segment of the U.S. brewing industry. The domestic beer market includes ales and lagers produced by large domestic brewers, international brewers and craft brewers. Shipments of craft beer in the U.S. are estimated by industry sources to have increased by approximately 17.6% in 2014 over 2013 and by 15.4% in 2013 over 2012. While the overall domestic market experienced a modest decrease in shipments of 0.6% in 2014, the craft beer segment continued its strong growth and captured market share from the rest of the domestic market. Craft beer shipments in 2014 and 2013 were approximately 9.2% and 7.9%, respectively, of total beer shipped in the U.S. Approximately 19.0 million barrels and 16.5 million barrels, respectively, were shipped in the U.S. by the craft beer segment during 2014 and 2013, while total beer sold in the U.S., including imported beer, was 206.2 million barrels and 206.2 million barrels, respectively. Compared with the other segments of the U.S. brewing industry, craft brewing is a relative newcomer. Twenty years ago, Redhook and Widmer Brothers Brewery were two of the approximately 200 craft breweries in operation. By the end of 2014, the number of craft breweries in operation had grown to 3,040. Industry sources estimate that craft beer produced by regional and national craft brewers, similar to us, accounts for approximately two-thirds of total craft beer sales, with one-third of the production brewed by smaller craft breweries.
The recent competitive environment has been characterized by three trends: the number and diversity of craft brewers have significantly increased, Crown has emerged as a significant player in imports with its brewing capacity in Mexico, and the large national domestic brewers have been acquired by or merged with other national domestic and foreign brewers. In 2014, according to industry sources, A‑B and MillerCoors accounted for more than 70% of total beer shipped in the U.S., excluding imports. In addition, A-B and MillerCoors have invested in existing smaller craft breweries and created separate craft-focused divisions in an effort to capitalize on the growing craft beer segment.
Business Strategy
At Craft Brew Alliance, we believe that we have an advantaged strategy that differentiates us in the rapidly evolving craft beer segment.
The central elements of our business strategy include:
| · | An innovative complementary portfolio of beers and ciders that reflects changing consumer trends in craft beer and is designed to satisfy a wide range of variety-seeking consumers’ experiences and preferences. The breadth of our product offerings also provides consumers with the opportunity to match specific consumer occasions with a product in our brand families. |
| · | Distinct, authentic craft beer brands that represent legacy pioneers such as Widmer Brothers, Redhook Brewery, and Kona Brewing Company, as well as bold new trailblazers, including Omission Beer and Square Mile Cider Company. |
| · | A national brewing footprint that allows us to get our beers to market faster, fresher and more efficiently. We have significant flexibility to fully leverage the specific strengths of our distinct breweries and operations. Additionally, we guarantee the quality and consistency of all of our products through fine-tuned processes that ensure everything from brewing to quality-assurance to warehousing and distribution meets our high standards. We believe that maximizing the production under our direct supervision and through accomplished and expert partners is critical to our success. Further, we believe that our ability to engage in ongoing product innovation and to control product quality provides critical competitive advantages. Each of our breweries is modern, has flexible production capabilities, and is designed to produce beer in smaller batches relative to the national domestic brewers, thereby allowing us to brew a wide variety of brand offerings. We believe that our investment in brewing and logistics technologies enables us to minimize brewery operating costs and consistently produce innovative beer styles. |
| · | Nationwide sales activation through robust partnerships with leading retailers such as Buffalo Wild Wings, Safeway, and Costco. We leverage our national sales and marketing capabilities and complementary brand families to create a unique identity in the distribution channel and with the consumer. Our sales force calls on all retail channels nationally, including grocery, drug and convenience stores, something most other craft brewers are not able to do. |
| · | National seamless distribution through the Anheuser-Busch wholesaler network alliance. This distribution footprint provides efficiencies in logistics and product delivery, state reporting and licensing, billing and collections. We have realized these efficiencies while maintaining full autonomy over the production, sale and marketing of our products as an independent craft beer company. |
| · | A diverse leadership team with extensive experience in the beer and beverage industries. The team has a proven ability to manage brand lifecycles, from development to turnaround, in both large and growth-company settings. |
Brand Overview
Our brand portfolio comprises the Kona Brewing Company, Widmer Brothers Brewing, Redhook Brewery, Omission Beer and Square Mile Cider Company brand families.
We produce a variety of specialty craft beers and ciders using traditional brewing methods complemented by American innovation and invention. We brew our beers using high-quality hops, malted barley, wheat, rye and other natural traditional and nontraditional ingredients. To craft our ciders, we use three apple varieties from the Pacific Northwest and then use a lager beer yeast to make a unique and easy-to-drink hard cider.
Below is an overview of our five brands:
Kona Brewing Company
Kona Brewing Company was started in the spring of 1994 in Kailua-Kona, Hawaii by father and son team Cameron Healy and Spoon Khalsa, who had a dream to create fresh, local island brews made with spirit, passion and quality. It is a Hawaii-born and Hawaii-based craft brewery that prides itself on brewing the freshest beer of exceptional quality, closest to market. This helps to minimize its carbon footprint by reducing shipping of raw materials, finished beer and wasteful packaging materials. The brewery is headquartered where it began, in Kailua-Kona on Hawaii’s Big Island.
Widmer Brothers Brewing
Founded in 1984, Widmer Brothers Brewing is celebrating 30 years of beer from April 2014 – April 2015. Founders Kurt and Rob Widmer helped create the Pacific Northwest craft beer movement in 1984 when, in their 20s, they began brewing unique interpretations of traditional German beer styles. In 1986, Widmer Brothers Brewing introduced the original American-style Hefeweizen, which elevated the brewery to national acclaim and has long been Oregon’s favorite craft beer. Since then, the brewery has continued to push the boundaries of craft beer, developing a variety of beers with an unapologetic, uncompromised commitment to innovation. Based in Portland, Oregon, the brewery currently brews a variety of beers including Hefeweizen, Upheaval IPA, Alchemy Pale Ale, Drop Top Amber Ale, a full seasonal lineup, and a series of limited edition beers.
Redhook Brewery
Redhook was born out of the energy and spirit of the early 80’s in the heart of Seattle. While the term didn’t exist at the time, Redhook became one of America’s first “craft” breweries. From a modest start in a former transmission shop in the Seattle neighborhood of Ballard, to the current breweries in Woodinville, Washington and Portsmouth, New Hampshire, Redhook has become one of America’s most recognized craft breweries.
While Redhook has “grown up” over the past 30-plus years, one thing has never changed – Redhook is still brewing great beers like ESB, Long Hammer IPA, and Audible Ale. Most importantly, Redhook has fun doing it. Redhook beers are available both on draught and in bottles.
Omission Beer
Omission Beer is a brand of craft beers introduced in 2012 by Craft Brew Alliance in Portland, Oregon. Omission is the first craft beer brand in the U.S. focused exclusively on brewing great-tasting beers with traditional beer ingredients, including malted barley, that are specially crafted to remove gluten. Each batch of Omission Beer is tested independently using the R5 competitive ELISA test to ensure that it contains gluten levels below the U.S. Food and Drug Administration gluten-free standard of 20ppm or less. Omission produces three craft beers specially crafted to remove gluten: Omission Lager, Omission Pale Ale and Omission IPA.
Square Mile Cider Company
Square Mile Cider Company was launched in 2013. The brand’s name pays homage to the fortitude and perseverance of the early American settlers who traveled the Oregon Trail in search of a better future. When they arrived in Oregon in the 1850s, they were granted square mile parcels of land to stake their claims. It was on these square mile claims that some of the original Northwest orchards were planted, and where Square Mile Cider Company chose to stake its claim.
New Brands and Packaging
Our recent brand and packaging announcements include:
Kona Brewing
As Kona’s 20th year in business, 2014 represented the fifth consecutive year of double-digit growth for the Hawaiian brewery on the mainland. We continued to expand Longboard Lager and Big Wave Golden Ale into new markets, entering three new states and increasing our U.S. distribution to 40 states. We also added several new countries to our ever-growing line-up, with the long-anticipated move into Canada bringing us to 17 countries at year’s end. During the summer, we launched our first-ever integrated marketing campaign that included TV, radio, digital and out of home to drive brand awareness and trial. Additionally, we launched Castaway IPA, previously available only in Hawaii, on the mainland during the summer season.
Widmer Brothers Brewing
In March 2014, Widmer Brothers introduced a new year-round IPA, Upheaval, to its core lineup. This Northwest Style India Pale Ale unleashes a huge hop flavor and aroma with serious bitterness and a balanced finish. Hazy and bold, Upheaval is left unfiltered for the full IPA experience. As part of the brewery’s 30th anniversary celebration, Widmer Brothers brewed a series of collaboration beers with six of Oregon’s best craft breweries including: Boneyard, Breakside, 10 Barrel, Gigantic, Ninkasi and Deschutes. The limited edition collaboration beers were distributed to select markets on draught and in 22oz bottles. The brewery also introduced the most ambitious beer series ever from an American craft brewery with its 30 Beers for 30 Years Series. Beginning in April, Widmer Brothers brewed one beer to commemorate each year since the brewery was founded in 1984. These are the most memorable, beloved and innovative beers in the brewery’s history. Each recipe was faithfully recreated and each bottle features special artwork designed by Portland artists.
Redhook Brewery
Redhook continued to build on its partnerships with the ongoing promotion of Game Changer Ale in all 1,000-plus Buffalo Wild Wings locations across the U.S. Redhook also continued its partnership with theCHIVE, a popular online media platform, to promote KCCO Black Lager. Redhook’s partnership beer with sports commentator Dan Patrick, Audible Ale, won Gold at the World Beer Cup. Redhook also launched False Start Session IPA at the Richard Sherman Celebrity Softball Game to celebrate Super Bowl XLVIII Champions, the Seattle Seahawks.
Omission Beer
In 2014, Omission Beer became the official market leader in the gluten free beer category and continued to gain dollar share over the competition. Omission IPA continued to expand into new markets across the country, following in the footsteps of Omission Lager and Pale Ale. With a major focus on the casual dining sector, Omission Beer is on the menu of such large, national chains as Olive Garden, Red Robin, and T.G.I. Friday’s.
Square Mile Cider Company
In 2014, Square Mile Cider Company expanded distribution in select Western states, becoming the number two cider in the Northwest. The brand, which finds its inspiration from the pioneering spirit of the original Oregon pioneers, offers two varieties: The Original, a classic American hard cider; and Spur & Vine, a hopped version of the classic American hard cider, with the addition of Galaxy hops.
Multi-Brand Beer Packages
During 2014, we added a Summer Variety Pack to complement our Winter Variety Pack released in 2012. Both Variety Packs include beers from Kona, Widmer Brothers and Redhook to satisfy consumers’ thirst for two popular trends in craft beer: seasonal beers and variety packs.
Brewing Operations
Brewing Facilities
We use highly automated brewing equipment at our four owned production breweries and also operate two smaller, manual brewpub-style brewing systems. As of December 31, 2014, our total owned production capacity was 1,075,000 barrels. Our breweries consist of the following:
| · | Oregon Brewery. Our Oregon Brewery is our largest capacity production brewery, consisting of a 230-barrel brewing system with an annual capacity of 630,000 barrels. |
| · | Washington Brewery. Our Washington Brewery utilizes a 100-barrel brewing system and has an annual capacity of 220,000 barrels. |
| · | New Hampshire Brewery. Our New Hampshire Brewery utilizes a 100-barrel brewing system and has an annual capacity of 215,000 barrels. It uses an anaerobic waste-water treatment facility that completes the process cycle. |
| · | Hawaiian Brewery. Our Hawaiian Brewery utilizes a 25-barrel brewing system and has an annual capacity of 10,000 barrels. The Hawaiian Brewery utilizes a 229-kilowatt photovoltaic solar energy generating system to supply approximately 50 percent of its energy requirements through renewable energy. |
| · | Innovation Breweries. Our Portland, Oregon innovation brewery maintains a 10-barrel pilot brewing system and is located in the Rose Quarter sports and entertainment district. Our New Hampshire innovation brewery maintains a 3-barrel pilot brewing system and is located on the same site as our New Hampshire production brewery. |
In June 2014, we initiated full-scale brewing with our brewing partner in Memphis, Tennessee. This partnership provides us scalable capacity, and we anticipate producing up to 100,000 barrels at this location annually.
Packaging
We package our craft beers in cans, bottles and kegs. All of our production breweries, with the exception of the Hawaiian Brewery, have fully automated bottling and keg lines. The bottle fillers at all of the breweries utilize a carbon dioxide environment during bottling, ensuring that minimal oxygen is dissolved in the beer and extending the beer’s shelf life. In February 2012, we added a canning line at our Oregon Brewery to package our Kona Longboard Island Lager and Redhook Longhammer IPA in various can sizes. We offer an assortment of packages to highlight the unique characteristics of each of our beers and to provide greater opportunities for customers to drink our beers in more locations and at more events and occasions, matching the active lifestyles and preferences of our consumers.
Quality Control
We monitor production and quality control at all of our breweries, with central coordination at the Oregon Brewery. All of the breweries have an on-site laboratory where microbiologists and lab technicians supervise on-site yeast propagation, monitor product quality, test products, measure color and bitterness, and test for oxidation and unwanted bacteria. We also regularly utilize outside laboratories for independent product analysis. In addition, every batch of beer that we produce goes through an internal taste panel to ensure that it meets our taste and profile standards.
Ingredients and Raw Materials
We currently purchase a significant portion of our malted barley from two suppliers and our premium-quality select hops, mostly grown in the Pacific Northwest, from competitive sources. We also periodically purchase small lots of hops from international sources, such as New Zealand and Western Europe, which we use to achieve a special hop character in certain beers. In order to ensure the supply of the hop varieties used in our products, we enter into supply contracts for our hop requirements. We believe that comparable quality malted barley and hops are available from alternate sources at competitive prices, although there can be no assurance that pricing would be consistent with our current arrangements. We currently cultivate our own yeast supply for certain strains and maintain a separate, secure supply in‑house. We have access to multiple competitive sources for packaging materials, such as labels, six‑pack carriers, crowns, cans and shipping cases.
Contract Brewing
In order to profitably use excess capacity, we enter into contract brewing arrangements under which we produce beer in volumes and per specifications as designated by the arrangements.
Effective September 1, 2012, in the best interest of both parties, we mutually agreed with Fulton Street Brewery, LLC (“FSB”) to end our contract brewing arrangement with them. Under the termination agreement, we phased out production of FSB branded beers utilizing remaining inventory on-hand. In consideration, FSB paid us $70,000 per month through September 2013.
During 2014, we shipped 39,700 barrels under contract brewing arrangements compared to 30,300 barrels in 2013 and 49,600 in 2012.
Pubs Operations
We own and operate five brew-pub restaurants and retail stores that support consumer awareness and research and development. Our five brew-pub restaurants allow us to interact directly with over 1.5 million consumers annually in our home markets, which creates a sense of brand loyalty. Our brewers are continually experimenting with new and different varieties of hops and malts in all styles of beer, and our brew pubs allow us to bring those beers to market in test-size batches in order to evaluate their strengths prior to releasing them on a wider basis.
Distribution
With limited exceptions, all brewers in the United States are required to sell their beers to independent wholesalers, who then sell the beers to retailers. We are the only independent craft brewer in the U.S. to have established a wholly aligned distribution network through our partnership with A-B. This partnership provides us national distribution, which results in both an effective distribution presence in each market and administrative efficiencies. Our beers are available for sale directly to consumers in draft, cans and bottles at restaurants, bars and liquor stores, as well as in cans and bottles at supermarkets, warehouse clubs, convenience stores and drug stores. We sell beer directly to consumers at our brew pubs and breweries.
Our products are distributed in all 50 states, pursuant to a master distributor agreement with A-B that allows us access to A-B’s national distribution network. For additional information regarding our relationship with A-B, see “Relationship with Anheuser-Busch, LLC” below. Management believes that our competitors in the craft beer segment generally negotiate distribution relationships separately with wholesalers in each locality and, as a result, typically distribute through a variety of wholesalers representing differing national beer brands with uncoordinated territorial boundaries.
In 2014 and 2013, we sold approximately 766,600 barrels and 708,100 barrels, respectively, to the wholesalers in A-B’s distribution network through the A-B Distributor Agreement, accounting for 92.3% and 93.6%, respectively, of our shipment volume for the corresponding periods.
Sales and Marketing
In addition to leveraging our owned brew pubs and retail locations, we promote our products through a national sales and marketing network that includes but is not limited to i) creating and executing a range of advertising programs; ii) training and educating wholesalers and retailers about our products; and iii) promoting our name, product offerings and brands, and experimental beers at local festivals, venues and pubs.
We advertise and promote our products through an assortment of media, including television, radio, billboard, print and social media, including Facebook, Twitter and Instagram, in key markets and by participating in cooperative programs with our wholesalers whereby our spending is matched by the distributor. We believe that the financial commitment by the distributor helps align the distributor’s interests with ours, and the distributor’s knowledge of the local market results in an advertising and promotion program that is targeted in a manner that will best promote our products.
Our breweries also play a significant role in increasing consumer awareness of our products and enhancing our image as a craft brewer. Thousands of visitors per year take tours at our breweries and all of our production breweries have a retail restaurant or pub where our products are served. In addition, several of the breweries have meeting rooms that the public can rent for business meetings, parties and holiday events, and that we use to entertain and educate wholesalers, retailers and the media about our products. At our pubs, we sell various items of apparel and other merchandise bearing our trademarks, which creates further awareness of our beers and reinforces our brand image. To further promote retail canned and bottled product sales and in response to local competitive conditions, we regularly recommend that wholesalers offer discounts to retailers in most of our markets.
Relationship with Anheuser-Busch, LLC
Exchange Agreement
Under the Amended and Restated Exchange and Recapitalization Agreement (the “Exchange Agreement”) with A-B, we granted A-B certain contractual rights. The Exchange Agreement was entered into as part of a recapitalization in which we redeemed preferred shares held by A-B in exchange for cash and our common stock currently held by A-B, which represents 31.7% of our outstanding shares of common stock at December 31, 2014.
The Exchange Agreement entitles A-B to designate two members of our board of directors. A-B also generally has the right to have a designee on each committee of the board of directors, except where prohibited by law or stock exchange requirements, or with respect to a committee formed to evaluate transactions or proposed transactions between A-B and us. The Exchange Agreement contains limitations on our ability to take certain actions without A-B’s prior consent, including, but not limited to, our ability to issue equity securities or acquire or sell assets or stock, amend our Articles of Incorporation or Bylaws, grant board representation rights, enter into certain transactions with affiliates, distribute our products in the United States other than through A-B or as provided in the A-B Distributor Agreement, or voluntarily terminate our listing on the Nasdaq Stock Market.
Distributor Agreement
The A-B Distributor Agreement provides for the distribution of Kona, Widmer Brothers, Redhook, Omission and Square Mile in all states, territories and possessions of the United States, including the District of Columbia and, except with respect to Kona beers, all U.S. military, diplomatic, and governmental installations in a U.S. territory or possession. Under the A-B Distributor Agreement, we granted A-B the right of first refusal to distribute our products, including any internally developed new products but excluding new products that we acquire. We are responsible for marketing our products to A-B’s wholesalers, as well as to retailers and consumers.
The A-B Distributor Agreement has a term that expires on December 31, 2018, subject to automatic renewal for an additional ten-year period unless A-B provides written notice of non-renewal to us on or prior to June 30, 2018. The A-B Distributor Agreement is also subject to immediate termination, by either party, upon the occurrence of standard events of default as defined in the agreement.
Additionally, the A-B Distributor Agreement may be terminated by A-B, with six months’ prior written notice to us, upon the occurrence of any of the following events:
| · | we engage in incompatible conduct that damages the reputation or image of A‑B or the brewing industry; |
| · | any A-B competitor or affiliate thereof acquires 10% or more of our outstanding equity securities, and that entity designates one or more persons to our board of directors; |
| · | our current chief executive officer ceases to function in that role or is terminated, and a satisfactory successor, in A‑B’s opinion, is not appointed within six months; |
| · | we are merged or consolidated into or with any other entity or any other entity merges or consolidates into or with us without A-B’s prior approval; or |
| · | A-B, its subsidiaries, affiliates, or parent, incur any obligation or expense as a result of a claim asserted against them by or in our name, or by our affiliates or shareholders, and we do not reimburse and indemnify A-B and its corporate affiliates on demand for the entire amount of the obligation or expense. |
Fees
We pay fees to A-B in connection with the sale of our products, including margin fees, invoicing, staging and cooperage handling fees, and inventory manager fees.
See Note 17 of Notes to Consolidated Financial Statements included in Part II, Item 8 of this Annual Report on Form 10-K for additional information.
Seasonality
Our sales generally reflect a degree of seasonality, with the first and fourth quarters historically exhibiting low sales levels compared to the second and third quarters. Accordingly, our results for any particular quarter are not likely to be indicative of the results to be achieved for the full year.
Competition
We compete in the craft brewing market as well as in the much larger alcoholic beverage market, which encompasses domestic and imported beers, flavored alcohol beverages, spirits, wine and ciders.
The craft beer segment is increasingly competitive due to the proliferation of small craft brewers, including contract brewers, and the large number of products offered by such brewers. Craft brewers have also encountered more competition as their peers expand distribution. Competition also varies by regional market. Depending on the local market preferences and distribution, we have encountered strong competition from microbreweries, regional specialty brewers and several national craft brewers that include MillerCoors’ Tenth and Blake Beer Company division (“Tenth and Blake”), and A-B’s Craft division. A-B’s Craft division includes Goose Island, Blue Point Brewing, 10 Barrel Brewing Company and Shock Top. Because of the large number of participants and number of different products offered in this segment, the competition for packaged product placements and especially for draft beer placements has intensified. Although certain of these competitors distribute their products nationally and may have greater financial and other resources than we have, we believe that we possess certain competitive advantages, including our broad array of brand offerings within our five brand families and the scale of our production breweries.
We also compete against imported brands, such as Heineken, Corona Extra and Guinness. Most of these foreign brewers have significantly greater financial resources than we have. Although imported beers currently account for a greater share of the U.S. beer market than craft beers, we believe that craft brewers possess certain competitive advantages over some importers, including lower transportation costs, no importation costs, proximity to and familiarity with local consumers, a higher degree of product freshness, eligibility for lower federal excise taxes and absence of exposure to currency fluctuations.
In response to the growth of the craft beer segment, most of the major domestic national brewers have introduced fuller-flavored beers, including well-funded significant product launches in the wheat category. While these product offerings are intended to compete with craft beers, many of them are brewed according to methods used by these brewers in their other product offerings. The major national brewers, including Tenth and Blake through MillerCoors, and A-B Craft brands through A-B, have significantly greater financial resources than us and have access to a greater array of advertising and marketing tools to create product awareness of these offerings. Although increased participation by the major national brewers increases competition for market share and can heighten price sensitivity within the craft beer segment, we believe that their participation tends to increase advertising, distribution and consumer education and awareness of craft beers, and thus may ultimately contribute to further growth of this industry segment.
In the past several years, several major distilled spirits producers and national brewers have introduced flavored alcohol beverages. Products such as the Bud Light Rita family, Smirnoff Ice and Mike’s Hard Lemonade have captured sizable market share in the higher-priced end of the malt beverage industry. We believe sales of these products, along with strong growth in the imported and craft beer segments of the malt beverage industry, contributed to an increase in the overall U.S. alcohol market. These products are particularly popular in certain regions and markets in which we sell our products.
Competition for consumers of craft beers has also come from wine and spirits. Growth in this segment appears to be attributable to competitive pricing, television advertising, increased merchandising and increased consumer interest in wine and spirits. Recently, the wine industry has been aided, on a limited basis, by its ability to sell outside of the three-tier system, allowing sales to be made directly to the consumer. While the craft beer segment competes with wine and spirits, it also benefits from many of the same advantages enjoyed by wine and spirit producers. These include consumers who allow themselves affordable luxuries in the form of high quality alcoholic beverages.
A significant portion of our sales continues to be in the Pacific Northwest and in California, which we believe are among the most competitive craft beer markets in the United States, both in terms of number of participants and consumer awareness. We believe that these areas offer significant competition for our products, not only from other craft brewers but also from the growing wine market and from flavored alcohol beverages. Our recent marketing efforts have been focused on creating appealing new brands and better communicating the attributes of our portfolio of existing beers, highlighting and strengthening the identities to better match the preferences and lifestyles of a greater number of consumers. We believe that our broad array of beers and brands enables us to offer an assortment of flavors and experiences that appeal to more people.
Segment and Enterprise-Wide Information
See Note 11 of Notes to Consolidated Financial Statements included in Part II, Item 8 of this Annual Report on Form 10-K for the required segment and enterprise-wide information.
Regulation
Our business is highly regulated at federal, state and local levels. Various permits, licenses and approvals necessary for our brewery and pub operations and the sale of alcoholic beverages are required from a number of agencies, including the U.S. Treasury Department, the Alcohol and Tobacco Tax and Trade Bureau (“TTB”), the U.S. Department of Agriculture, the U.S. Food and Drug Administration, state alcohol regulatory agencies, and state and local health, sanitation, safety, fire and environmental agencies. In addition, the beer industry is subject to substantial federal and state excise taxes.
We operate our breweries under federal licensing requirements imposed by the TTB. The TTB requires the filing of a “Brewer’s Notice” upon the establishment of a commercial brewery and the filing of an amended Brewer’s Notice any time there is a material change in the brewing or warehousing locations, brewing or packaging equipment, brewery ownership, or officers or directors. Our operations are subject to audit and inspection by the TTB at any time.
Management believes that we currently have all of the licenses, permits and approvals required for our current operations. Existing permits or licenses could be revoked if we fail to comply with the terms of such permits or licenses and additional permits or licenses may be required in the future for our current operations or as a result of expanding our operations.
The U.S. federal government currently levies an excise tax of $18 per barrel on beer sold for consumption in the United States; however, brewers, such as us, that produce less than two million barrels annually are taxed at $7 per barrel on the first 60,000 barrels shipped, with shipments above this amount taxed at the normal rate. Certain states also levy excise taxes on alcoholic beverages. Excise taxes may be increased in the future by the federal government or any state government or both. In the past, increases in excise taxes on alcoholic beverages have been considered in connection with various governmental budget-balancing or funding proposals.
Federal and State Environmental Regulation
Our brewing operations are subject to environmental regulations and local permitting requirements and agreements regarding, among other things, air emissions, water discharges and the handling and disposal of hazardous wastes. While we have no reason to believe the operation of our breweries violate any such regulation or requirement, if such a violation were to occur, or if environmental regulations were to become more stringent in the future, we could be adversely affected.
Dram Shop Laws
The serving of alcoholic beverages to a person known to be intoxicated may, under certain circumstances, result in the server being held liable to third parties for injuries caused by the intoxicated customer. Our restaurants and pubs have addressed this issue by maintaining reasonable hours of operation and routinely performing training for personnel.
Trademarks
We have obtained U.S. trademark registrations for our numerous products, including our proprietary bottle designs. Trademark registrations generally include specific product names, marks and label designs. The Kona Brewing, Widmer Brothers, Redhook, and Omission marks and certain other marks are also registered in various foreign countries. We regard our Kona Brewing, Widmer Brothers, Redhook, Omission, Square Mile and other trademarks as having substantial value and as being an important factor in the marketing of our products. We are not aware of any infringing uses that could materially affect our current business or any prior claim to the trademarks that would prevent us from using such trademarks in our business. Our policy is to pursue registration of our trademarks in our markets whenever possible and to oppose vigorously any infringement of our trademarks.
Employees
At December 31, 2014, we employed approximately 785 people, including 385 employees in the pubs and retail stores, 210 employees in production, 130 employees in sales and marketing and 60 employees in corporate and administration. Included in the totals above are 244 part-time employees and 6 seasonal or temporary employees. None of our employees are represented by a union or employed under a collective bargaining agreement. We believe our relations with our employees to be good.
Available Information
Our Internet address is www.craftbrew.com. There we make available, free of charge, our annual report on Form 10‑K, quarterly reports on Form 10-Q, current reports on Form 8-K, proxy statements and any amendments to those reports, as soon as reasonably practicable after we electronically file such material with the Securities and Exchange Commission (“SEC”). Our SEC reports can be accessed through the investor relations section of our website. The information found on our website is not part of this or any other report we file with or furnish to the SEC.
If we are unable to gauge trends and react to changing consumer preferences in a timely and cost-effective manner, our sales and market share may decrease and our gross margin may be adversely affected.
The costs and management attention involved in maintaining an innovative brand portfolio have been, and are expected to continue to be, significant. If we have not gauged consumer preferences correctly, or are unable to maintain consistently high quality beers as we develop new brands, our overall brand image may be damaged. If this were to occur, our future sales, results of operations and cash flows would be adversely affected. Also, increased costs associated with developing new products may have a negative effect on our gross margin.
Increased competition could adversely affect sales and results of operations.
We compete in the highly competitive craft beer market, as well as in the much larger specialty beer category, which includes the imported beer segment and fuller-flavored beers offered by major national brewers. We also face increasing competition from producers of wine, spirits and flavored alcohol beverages offered by the larger spirit producers and national brewers. Increased competition could cause our future sales and results of operations to be adversely affected.
Our information systems may experience an interruption or breach in security.
We rely on computer information systems in the conduct of our business. We have policies and procedures in place to protect against and reduce the occurrence of failures, interruptions, or breaches of security of these systems. However, there can be no assurances that these policies and procedures will eliminate the occurrence of failures, interruptions or breaches of security or that they will adequately restore our systems or minimize any such events. The occurrence of a failure, interruption or breach of security of our computer information systems could result in loss of intellectual property, delays in our production, loss of critical information, or other events, any of which could harm our future sales or operating results.
We manage and store various proprietary information and sensitive or confidential data relating to our business, including sensitive and personally identifiable information. Breaches of our security measures or the accidental loss, inadvertent disclosure or unapproved dissemination of proprietary information or sensitive or confidential data about us, our employees, or our customers, including the potential loss or disclosure of such information or data as a result of hacking, fraud, trickery or other forms of deception, could expose us, our customers or the individuals affected to a risk of loss or misuse of this information. This could result in litigation and potential liability for us, damage our brand image and reputation or otherwise harm our business. In addition, our current data protection measures might not protect us against increasingly sophisticated and aggressive threats and the cost and operational consequences of implementing further data protection measures could be significant.
Our business is sensitive to reductions in discretionary consumer spending.
Consumer demand for luxury or perceived luxury goods, including craft beer, can be sensitive to downturns in the economy and the corresponding impact on discretionary spending. Changes in discretionary consumer spending or consumer preferences brought about by factors such as perceived or actual general economic conditions, job losses and the resultant rising unemployment rate, perceived or actual disposable consumer income and wealth, and changes in consumer confidence in the economy, could significantly reduce customer demand for craft beer in general, and the products we offer specifically. Furthermore, our consumers may choose to replace our products with the fuller-flavored national brands or other more affordable, although lower quality, alternatives available in the market. Any such decline in consumption of our products would likely have a significant negative impact on our operating results.
Changes in consumer preferences or public attitudes about alcohol could decrease demand for our products.
If consumers were unwilling to accept our products or if general consumer trends caused a decrease in the demand for beer, including craft beer, it would adversely impact our sales and results of operations. There is no assurance that the craft brewing segment will continue to experience growth in future periods. If the markets for wine, spirits or flavored alcohol beverages continue to grow, this could draw consumers away from the beer industry in general and our products specifically and have an adverse effect on our sales and results of operations. Further, the alcoholic beverage industry has become the subject of considerable societal and political attention in recent years due to increasing public concern over alcohol-related social problems, including drunk driving, underage drinking and health consequences from the misuse of alcohol. As an outgrowth of these concerns, the possibility exists that advertising by beer producers could be restricted, that additional cautionary labeling or packaging requirements may be imposed or that there may be renewed efforts to impose, at either the federal or state level, increased excise or other taxes on beer sold in the United States. If beer in general were to fall out of favor among domestic consumers, or if the domestic beer industry were subjected to significant additional governmental regulation, it would likely have a significant adverse impact on our financial condition, operating results and cash flows.
Product safety and quality concerns may have a material adverse effect on our business.
Our success depends in large part on our ability to maintain consumer confidence in the safety and quality of our products. We have rigorous product safety and quality standards which we expect our breweries and our brewing partner to meet. However, we cannot assure you that, despite our strong commitment to product safety and quality, we will always meet these standards. If we, or our brewing partner, fail to comply with applicable product safety and quality standards and our products on the market are, or become, contaminated or adulterated, we may be required to conduct costly product recalls and may become subject to product liability claims and negative publicity, which could cause our reputation and business to suffer.
We have a continuing relationship with Anheuser-Busch, LLC and the current distribution network that would be difficult to replace.
Substantially all of our products are sold and distributed through A-B’s distribution network. If the A-B Distributor Agreement were terminated, we would be faced with a number of operational tasks, including establishing and maintaining direct contracts with the existing wholesaler network or negotiating agreements with replacement wholesalers on an individual basis, and enhancing our credit evaluation, billing and accounts receivable processes. Such an undertaking would require significant effort and substantial time to complete, during which the distribution of our products could be impaired.
We are dependent on our wholesalers for the sale of our products.
Although substantially all of our products are sold and distributed through A-B, we continue to rely heavily on wholesalers, most of which are independent, for the sale of our products to retailers. Independent wholesalers make their own business decisions that may not align with our interests and there is no assurance that the sales efforts of distributors will be effective in generating sales of our products. Any disruption in the ability of the wholesalers, A-B, or us to distribute products efficiently due to any significant operational problems, such as wide-spread labor union strikes or the loss of a major wholesaler as a customer, could hinder our ability to get our products to retailers and could have a material adverse impact on our sales, results of operations and cash flows. A-B has been purchasing distributors in states where it is legally permissible, which could impact our distribution if the A-B relationship were to end. 32% of our shipments during 2014 were through A-B owned distributors.
Our agreements with A-B may limit our ability to engage in certain activities and investments.
The Exchange Agreement requires us to obtain A-B's consent prior to undertaking certain activities and investments. For example, we must obtain A-B's consent before acquiring another brewer if the purchase price exceeds $30 million or to purchase a non-brewing entity if the purchase price exceeds $2 million. If A-B opposes strategic or financial investments proposed by our management, A-B may decline to give its consent to activities or investments that our management believes are in the best interest of our shareholders.
A-B has an influential voice in decisions of the board of directors and shareholders.
A-B has acquired craft breweries and is seeking to increase sales in the high-end category while it owns 31.7% of our outstanding common stock, which makes A-B our largest shareholder. Under the Exchange Agreement, A-B may designate two nominees to our board of directors, who also participate on our audit, compensation, and nominating and governance committees as non-voting observers. This gives A-B an influential voice in board and shareholder deliberations.
Operating breweries at production levels substantially below their current designed capacities could negatively impact our financial results.
As of December 31, 2014, the annual working capacity of our breweries was approximately 1,075,000 barrels. Due to many factors, including seasonality and production schedules of various draft products and bottled products and packages, actual production capacity will rarely, if ever, approach full working capacity. We believe that capacity utilization of the breweries will fluctuate throughout the year, and even though we expect that capacity of our breweries will be efficiently utilized during periods when our sales are strongest, there likely will be periods when the capacity utilization will be lower. If we experience contraction in our sales volumes, the resulting excess capacity and unabsorbed overhead will have an adverse effect on our gross margins, operating cash flows and overall financial performance. We periodically evaluate whether we expect to recover the costs of our production breweries over the course of their useful lives. If facts and circumstances indicate that the carrying value of these long-lived assets may be impaired, an evaluation of recoverability will be performed by comparing the carrying value of the assets to projected future undiscounted cash flows along with other quantitative and qualitative analyses. If we determine that the carrying value of such assets does not appear to be recoverable, we will recognize an impairment loss by a charge against current operations, which could have a material adverse effect on our results of operations.
Our sales are concentrated in the Pacific Northwest and California.
Approximately 53% of our sales in 2014 were in the Pacific Northwest and California and, consequently, our future sales may be adversely affected by changes in economic and business conditions within these areas. We also believe these regions are among the most competitive craft beer markets in the United States, both in terms of number of market participants and consumer awareness. The Pacific Northwest and California offer significant competition to our products, not only from other craft brewers, but also from the major domestic brewers, wine producers and flavored alcohol beverages.
We are dependent upon the services of our key personnel.
We may be unable to retain or recruit qualified personnel in key positions, which could have a material adverse effect on our operations. Additionally, the loss of Andrew Thomas as our chief executive officer, and the failure to find a replacement satisfactory to A-B, would be a termination event under the A-B Distributor Agreement.
Our gross margin may fluctuate.
Future gross margin may fluctuate and even decline as a result of many factors, including: product pricing levels; sales mix between draft and packaged product sales and within the various bottled product packages; level of fixed and semi-variable operating costs; level of production at our breweries in relation to current production capacity; availability and prices of raw materials, production inputs such as energy, and packaging materials; rates charged for freight; and federal and state excise taxes. The high percentage of fixed and semi-variable operating costs causes our gross margin to be particularly sensitive to relatively small changes in sales volume.
Higher health care costs may have an adverse effect on our operating results.
We are self-insured with respect to health care expenses for our employees. During 2014, we experienced higher than average medical expense claims, which increased our Selling, general and administrative expenses. If this trend continues, our operating results may be negatively affected.
A failure in any of our supply chain processes could harm our ability to effectively operate our business.
Our results are highly dependent on our ability to accurately forecast and execute throughout the entire supply chain, including sales forecasting, raw material ordering, brewing and distribution. The combination of our recent growth and increased brand complexity has increased the operating complexity of our business. We cannot guarantee that we will effectively manage such complexity without experiencing planning failures, operating inefficiencies or other issues that could have an adverse effect on our business.
We engage in electronic communications between third parties, including A-B and our wholesalers, as part of our supply chain processes. Any interruptions or errors in our electronic interfaces may negatively affect our operating activities.
Unavailability of production at our brewing partner may adversely affect our capacity and disrupt our ability to satisfy demand for our products.
During 2014, we entered into a contract brewing relationship with our brewing partner in Memphis, Tennessee, and anticipate producing up to 100,000 barrels of our beer at that facility annually. If production at that facility should be disrupted due to unforeseen circumstances, our ability to produce and ship sufficient quantities of our beer to meet demand in certain key geographic markets, particularly Texas and the southeastern United States, could be significantly impaired, resulting in decreased sales revenue and a negative impact on our wholesaler relationships.
An increase in excise taxes could adversely affect our financial condition and results of operations.
The U.S. federal government currently levies an excise tax of $18 per barrel on beer sold for consumption in the United States; however, brewers that produce less than two million barrels annually are taxed at $7 per barrel on the first 60,000 barrels shipped, with the remainder of the shipments taxed at the normal rate. Individual states that we operate in also impose excise taxes on beer and other alcohol beverages in varying amounts, which have been subject to change. Federal and state legislators routinely consider various proposals to impose additional excise taxes on the production of alcoholic beverages, including beer. Any such increases in excise taxes, if enacted, would adversely affect our financial condition, results of operations and cash flows.
We are subject to governmental regulations affecting our breweries and pubs.
Federal, state and local laws and regulations govern the production and distribution of beer, including permitting, licensing, trade practices, labeling, advertising and marketing, distributor relationships and various other matters. A variety of federal, state and local governmental authorities also levy various taxes, license fees and other similar charges and may require bonds to ensure compliance with applicable laws and regulations. Noncompliance with such laws and regulations may cause the Alcohol and Tobacco Tax and Trade Bureau or any particular state or jurisdiction to revoke its license or permit, restricting our ability to conduct business, or result in the imposition of significant fines or penalties. One or more regulatory authorities could determine that we have not complied with applicable licensing or permitting regulations or have not maintained the approvals necessary for us to conduct business within our jurisdiction. If licenses, permits or approvals necessary for our brewery or pub operations were unavailable or unduly delayed, or if any permits or licenses that we hold were to be revoked, or additional permits or licenses were required in the future, including as a result of expanding our operations, our ability to conduct business may be disrupted, which would have a material adverse effect on our financial condition, results of operations and cash flows.
The craft beer business is seasonal in nature, and we are likely to experience fluctuations in results of operations and financial condition.
Sales of craft beer products are somewhat seasonal, with the first and fourth quarters historically being lower and the rest of the year generating stronger sales. Our sales volume may also be affected by weather conditions and selling days within a particular period. Therefore, the results for any given quarter will likely not be indicative of the results that may be achieved for the full fiscal year. If an adverse event such as a regional economic downturn or poor weather conditions should occur during the second and third quarters, the adverse impact to our revenues would likely be greater as a result of the seasonal business.
We may be unable to access public or private debt markets to fund our operations and contractual commitments at competitive rates, on commercially reasonable terms, or in sufficient amounts, if at all.
We depend, in part, on our revolving line of credit with Bank of America, N.A. ("BofA"), to fund our operations and commitments for capital expenditures. Our capital expenditures in 2015 are expected to range from $17 million to $21 million. A number of factors could cause us to incur increased borrowing costs and to have greater difficulty accessing public and private markets for debt. These factors include general economic conditions, disruptions or declines in the global capital markets, and our financial performance or outlook, or credit. An adverse change in any or all of these factors may materially adversely affect our ability to fund our operations and contractual or financing commitments.
If our business does not perform as expected, including if we generate less revenue than anticipated from our operations or encounter significant unexpected costs, we may fail to comply with the financial covenants under our credit facilities. If we do not comply with our financial covenants and we do not obtain a waiver or amendment, BofA may elect to cause all amounts owed to become immediately due and payable. Any default may require us to seek additional capital or modifications to our credit facilities, which may not be available or which may be costly. Any of these risks and uncertainties could have a material adverse effect on our business, financial position, results of operations, and cash flows.
Failure to realize expected benefits from capital investments in our breweries and information technology may impact our operating results and cash flows.
Over the past several years, we have made, and expect to continue to make, significant investments in improvements aimed at increasing the efficiency, capabilities and capacity of our breweries, improving our ordering and logistics systems, and enhancing the customer experience at our restaurant facilities. Failure to realize the anticipated benefits and generate adequate returns on such capital improvement projects may have a material adverse effect on our results of operations and cash flows.
Acquisitions subject us to various risks, including risks relating to selection and pricing of acquisition targets, integration of acquired companies into our business and assumption of unanticipated liabilities.
We have completed two acquisitions since 2008 and may pursue additional acquisitions or joint venture or investment opportunities. We cannot assure, however, that we will be able to identify or take advantage of such opportunities. If we do pursue such transactions, we may not realize the anticipated benefits. Acquisitions involve many risks, including risks relating to the assumption of unforeseen liabilities of an acquired business, adverse accounting charges resulting from the acquisition, and difficulties in integrating acquired companies into our business, both from a cultural perspective, as well as with respect to technological integration. Our inability to successfully integrate acquired businesses or manage joint ventures may lead to increased costs, failure to generate expected returns, or even a total loss of amounts invested, any of which could have a material adverse effect on our financial condition and results of operations.
Changes in state laws regarding distribution arrangements may adversely impact our operations.
States in which we have a significant sales presence may enact legislation that significantly alters the competitive environment for the beer distribution industry. Any change in the competitive environment in those states could have an adverse effect on our future sales and results of operations and may impact the financial stability of wholesalers on which we rely.
We may experience a shortage of kegs necessary to distribute draft beer.
We distribute our draft beer in kegs that are owned by us. During periods when we experience stronger sales, we may need to rely on kegs leased from A-B to address the additional demand. If shipments of draft beer increase, we may experience a shortage of available kegs to fill sales orders. If we cannot meet our keg requirements through either lease or purchase, we may be required to delay some draft shipments. Such delays could have an adverse impact on sales and relationships with wholesalers and A-B.
A loss of involvement by the founders of Widmer Brothers Brewing Company in promoting that brand family could adversely affect sales.
The founders of Widmer Brothers Brewing Company, Kurt R. Widmer (“Kurt”) and Robert P. Widmer (“Rob”), are integral to our current Widmer Brothers brand family messaging and we rely on the positive public perception of their images, as founders. The role of Kurt, as founder and chairman of the board, and Rob, as founder and vice president of corporate quality assurance and industry relations, are emphasized as part of our Widmer Brothers brand communication and have appeal to some drinkers. If Kurt or Rob were not willing or able to continue in their active roles, their absence could detrimentally affect the strength of our messaging and, accordingly, our growth prospects.
We are dependent on certain suppliers for key raw materials, packaging materials and production inputs.
Although we seek to maintain back-up and alternative suppliers for all key raw materials and production inputs, we are reliant on certain third parties for key raw materials, packaging materials and utilities. Any disruption in the willingness or ability of these third parties to supply these critical components could hinder our ability to continue production of our products, which could have a material adverse impact on our financial condition, results of operations and cash flows.
Violation of federal and state environmental regulations could adversely affect our operations.
Our brewing operations are subject to environmental regulations and local permitting requirements and agreements regarding, among other things, air emissions, water discharges and the handling and disposal of hazardous wastes. While we have no reason to believe the operation of our breweries violates any such regulation or requirement, if such a violation were to occur, or if environmental regulations were to become more stringent in the future, we could be adversely affected.
A small number of shareholders hold a significant ownership percentage of our common stock and uncertainty over their continuing ownership plans could cause the market price of our common stock to decline.
As noted above, A‑B has a significant ownership stake in us. In addition, Kurt Widmer and Rob Widmer together beneficially own approximately 2.2 million shares, or 11.6%, of our common stock. Collectively, these two groups own 43.3% of our equity. All of these shares are available for sale in the public market, subject to volume, manner of sale and other requirements under the Securities Act of 1933. Such sales in the public market, or the perception that such sales may occur, could cause the market price of our common stock to decline.
We do not intend to pay and are limited in our ability to declare or pay dividends; accordingly, shareholders must rely on stock appreciation for any return on their investment in us.
We do not anticipate paying cash dividends. Further, under our loan agreement with BofA, we are not permitted to declare or pay a dividend unless we meet certain financial covenants. As a result, only appreciation of the price of our common stock will provide a return to shareholders. Investors seeking cash dividends should not invest in our common stock.
The fair value of our intangible assets, including goodwill, may become impaired.
As a result of the acquisition of Kona Brewing Company, we have recognized a significant increase in our total intangible assets, including goodwill. As of December 31, 2014, we had $29.4 million in an assortment of intangible assets, on a net basis, which represented nearly 16.5% of our total assets. If any circumstances were to occur, such as economic recession or other factors causing a reduction in consumer demand, or for any other reason we were to experience a significant decrease in sales growth, which had a negative impact on our estimated cash flows associated with these assets, our analyses of these assets may conclude that a decrease in the fair value of these assets occurred. If this were to occur, we would be required to recognize a potentially significant loss on impairment of these assets. Any such impairment loss would be charged against current operations in the period of change.
None.
We own and operate four highly-automated, small-batch production breweries: the Oregon Brewery, the Washington Brewery, the New Hampshire Brewery, and the Hawaiian Brewery, as well as two small, innovation brewing systems in Portland, Oregon and Portsmouth, New Hampshire. We lease the sites upon which the Hawaiian Brewery and Pubs, the New Hampshire Breweries and Pub, the Portland Innovation Brewery, and Oregon Pub are located, in addition to our office space and warehouse locations in Portland, Oregon for our corporate, administrative and sales functions. In 2014, we entered into a lease for space in Southern California for our national sales office. These operating leases expire at various times between 2016 and 2047. Certain of these leases are with related parties. See Notes 16 and 17 of Notes to Consolidated Financial Statements included in Part II, Item 8 of this report for further discussion regarding these arrangements.
Certain information regarding our production breweries is as follows (capacity in thousands of barrels):
|
Production Breweries
|
Square
Footage
|
Current
Annual Capacity
|
Maximum
Annual Capacity
|
|||||||||
|
Oregon Brewery
|
185,000
|
630
|
650
|
|||||||||
|
Washington Brewery
|
128,000
|
220
|
280
|
|||||||||
|
New Hampshire Brewery
|
125,000
|
215
|
280
|
|||||||||
|
Hawaiian Brewery
|
11,000
|
10
|
10
|
|||||||||
|
1,075
|
1,220
|
|||||||||||
As a result of adding fermentation capacity and modifying our brewing schedules during 2012, the total annual capacity of all our breweries was approximately 1,075,000 barrels as of December 31, 2014 and 2013. Combined, our breweries have the potential to reach 1,220,000 barrels in annual capacity when fully optimized based on the currently available space and current product mix.
In June 2014, we initiated full-scale brewing with our brewing partner in Memphis, Tennessee. This partnership provides us scalable capacity and we anticipate producing up to 100,000 barrels at this location in 2015.
Substantially all of the personal property and the real properties associated with the Oregon Brewery secure our loan agreement with BofA. See Note 8 of Notes to Consolidated Financial Statements included in Part II, Item 8 of this report.
We are involved, from time to time, in claims, proceedings and litigation arising in the normal course of business. We believe that, to the extent that any pending or threatened litigation involving us or our properties exists, such litigation is not likely to have a material adverse effect on our financial condition or results of operations.
Not applicable.
PART II
| Item 5. | Market for Registrant’s Common Equity, Related Stockholder Matters and Issuer Purchases of Equity Securities |
Our common stock trades on the NASDAQ Stock Market (“NASDAQ”) under the trading symbol BREW. The table below sets forth, for the fiscal quarters indicated, the reported high and low closing sale prices of our common stock, as reported on NASDAQ:
|
2013
|
High
|
Low
|
||||||
|
Quarter 1
|
$
|
7.50
|
$
|
6.39
|
||||
|
Quarter 2
|
8.24
|
7.19
|
||||||
|
Quarter 3
|
13.80
|
8.40
|
||||||
|
Quarter 4
|
17.78
|
13.00
|
||||||
|
2014
|
High
|
Low
|
||||||
|
Quarter 1
|
$
|
17.77
|
$
|
13.99
|
||||
|
Quarter 2
|
15.60
|
10.14
|
||||||
|
Quarter 3
|
14.40
|
8.40
|
||||||
|
Quarter 4
|
17.47
|
13.00
|
||||||
We had 696 common shareholders of record as of February 16, 2015.
We have not declared or paid any dividends during our existence. Under the terms of our loan agreement with BofA, we may not declare or pay dividends without BofA’s consent. We anticipate that, for the foreseeable future, all earnings will be retained for the operation and expansion of our business and that we will not pay cash dividends. The payment of dividends, if any, in the future, will be at the discretion of our Board of Directors and will depend upon, among other things, future earnings, capital and operating requirements, restrictions in future financing agreements, our general financial condition, and general business conditions.
Equity Compensation Plans
Information regarding securities authorized for issuance under equity compensation plans is included in Item 12 of this Form 10-K.
Recent Sales of Unregistered Securities
None.
Issuer Purchases of Equity Securities
We did not repurchase any of our common stock during the fourth quarter of 2014.
Stock Performance Graph
The following line-graph presentation compares cumulative five-year shareholder returns on an indexed basis, assuming a $100 initial investment and reinvestment of dividends, of (a) Craft Brew Alliance, Inc., (b) a broad-based equity market index and (c) an industry-specific index. The broad-based market index used is the NASDAQ Composite Index and the industry-specific index used is the S&P 500 Beverages Index.
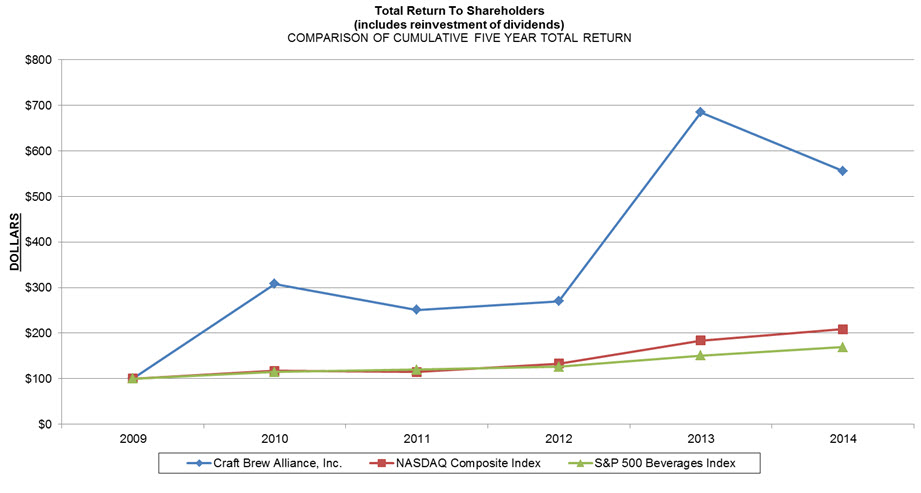
|
Base
|
Indexed Returns
|
|||||||||||||||||||||||
|
Period
|
Year Ended
|
|||||||||||||||||||||||
|
Company/Index
|
12/31/09
|
12/31/10
|
12/31/11
|
12/31/12
|
12/31/13
|
12/31/14
|
||||||||||||||||||
|
Craft Brew Alliance, Inc.
|
$
|
100.00
|
$
|
307.92
|
$
|
250.83
|
$
|
270.00
|
$
|
684.17
|
$
|
555.83
|
||||||||||||
|
NASDAQ Composite
|
100.00
|
116.91
|
114.81
|
133.07
|
184.06
|
208.71
|
||||||||||||||||||
|
S&P 500 Beverages Index
|
100.00
|
114.65
|
119.86
|
126.03
|
150.53
|
169.39
|
||||||||||||||||||
The selected consolidated financial data below should be read in conjunction with “Management’s Discussion and Analysis of Financial Condition and Results of Operations” and the consolidated financial statements and notes thereto included elsewhere in this Form 10-K.
|
In thousands,
except per share amounts
|
Year Ended December 31,
|
|||||||||||||||||||
|
Statement of Operations Data
|
2014
|
2013
|
2012
|
2011
|
2010
|
|||||||||||||||
|
Net sales
|
$
|
200,022
|
$
|
179,180
|
$
|
169,287
|
$
|
149,197
|
$
|
131,731
|
||||||||||
|
Cost of sales
|
141,312
|
128,919
|
119,261
|
104,011
|
98,064
|
|||||||||||||||
|
Gross profit
|
$
|
58,710
|
$
|
50,261
|
$
|
50,026
|
$
|
45,186
|
$
|
33,667
|
||||||||||
|
Selling, general and administrative expenses
|
$
|
53,000
|
$
|
46,461
|
$
|
44,890
|
$
|
39,742
|
$
|
29,938
|
||||||||||
|
Operating income
|
$
|
5,710
|
$
|
3,800
|
$
|
5,136
|
$
|
5,444
|
$
|
3,170
|
||||||||||
|
Gain on sale of equity interest in Fulton Street Brewery, LLC
|
$
|
-
|
$
|
-
|
$
|
-
|
$
|
10,432
|
$
|
-
|
||||||||||
|
Income before provision for income taxes
|
$
|
5,099
|
$
|
3,263
|
$
|
4,477
|
$
|
15,692
|
$
|
2,786
|
||||||||||
|
Provision for income taxes
|
2,022
|
1,304
|
1,951
|
6,041
|
1,100
|
|||||||||||||||
|
Net income
|
$
|
3,077
|
$
|
1,959
|
$
|
2,526
|
$
|
9,651
|
$
|
1,686
|
||||||||||
|
Basic and diluted net income per share
|
$
|
0.16
|
$
|
0.10
|
$
|
0.13
|
$
|
0.51
|
$
|
0.10
|
||||||||||
|
Shares used in basic per share calculations
|
19,038
|
18,923
|
18,862
|
18,834
|
17,523
|
|||||||||||||||
|
Shares used in diluted per share calculations
|
19,126
|
19,042
|
18,934
|
18,931
|
17,568
|
|||||||||||||||
|
December 31,
|
||||||||||||||||||||
|
2014
|
2013
|
2012
|
2011
|
2010
|
||||||||||||||||
|
Balance Sheet Data
|
||||||||||||||||||||
|
Cash and cash equivalents
|
$
|
981
|
$
|
2,726
|
$
|
5,013
|
$
|
795
|
$
|
164
|
||||||||||
|
Working capital (deficit)
|
8,050
|
5,782
|
5,207
|
2,327
|
(4,435
|
)
|
||||||||||||||
|
Total assets
|
178,601
|
170,286
|
165,664
|
158,908
|
158,266
|
|||||||||||||||
|
Current portion of long-term debt and capital leases
|
1,157
|
710
|
642
|
596
|
2,460
|
|||||||||||||||
|
Long-term debt and capital leases, net of current portion
|
13,720
|
11,050
|
12,440
|
13,188
|
24,675
|
|||||||||||||||
|
Other long-term obligations
|
19,738
|
18,303
|
17,903
|
16,261
|
11,388
|
|||||||||||||||
|
Shareholders’ equity
|
115,417
|
111,232
|
108,195
|
104,509
|
94,196
|
|||||||||||||||
Overview
Craft Brew Alliance is a leading craft brewing company that brews, brands and markets some of the world’s most respected and best-loved American craft beers.
The company is home to three of the earliest pioneers in craft beer: Redhook Ale Brewery, Washington’s largest craft brewery founded in 1981; Widmer Brothers Brewing, Oregon’s largest craft brewery founded in 1984; and Kona Brewing Company, Hawaii’s oldest and largest craft brewery founded in 1994. As part of Craft Brew Alliance, these craft brewing legends have expanded their reach across the U.S. and more than 15 international markets.
In addition to growing and nurturing distinctive brands rooted in local heritage, Craft Brew Alliance is committed to developing innovative new category leaders, such as Omission Beer, which is the #1 beer in the gluten free beer segment, and Square Mile Cider, a tribute to the early American settlers who purchased the first plots of land in the Pacific Northwest.
Publicly traded on NASDAQ under the ticker symbol BREW, Craft Brew Alliance is headquartered in Portland, Oregon and operates five breweries and five pub restaurants across the U.S. For more information about CBA and its brands, see “Available Information” on page 12.
We proudly brew our craft beers in four company-owned breweries located in Portland, Oregon; the Seattle suburb of Woodinville, Washington; Portsmouth, New Hampshire; and Kailua-Kona, Hawaii; and one brewery in Memphis, Tennessee owned by our brewing partner. Additionally, we own and operate two small innovation breweries, primarily used for small batch production and innovative brews, in Portland, Oregon and Portsmouth, New Hampshire.
We distribute our beers to retailers through independent wholesalers that are aligned with the Anheuser-Busch, LLC (“A-B”) network. These sales are made pursuant to a Master Distributor Agreement (the “A-B Distributor Agreement”) with A-B. As a result of this distribution arrangement, we believe that, under alcohol beverage laws in a majority of states, these wholesalers would own the exclusive right to distribute our beers in their respective markets if the A-B Distributor Agreement expires or is terminated. Redhook and Widmer Brothers beers are distributed in all 50 states and Kona beers are distributed in 40 states. Omission Beer continues to expand into new markets in the U.S. and internationally. Square Mile is currently available in 10 states in the West. Separate from our A-B wholesalers, we maintain an internal independent sales and marketing organization with resources across the key functions of brand management, field marketing, field sales, and national retail sales.
We operate in two segments: Beer Related operations and Pubs operations. Beer Related operations include the brewing and sale of craft beers and cider from our breweries, both domestically and internationally. Pubs operations primarily include our five pubs, four of which are located adjacent to our Beer Related operations, as well as other merchandise sales, and sales of our beers directly to customers.
Following is a summary of our financial results:
|
Net Sales
|
Net Income
|
Number of
Barrels Sold
|
||||||
|
2014
|
$200.0 million
|
$3.1 million
|
830,200
|
|||||
|
2013
|
$179.2 million
|
$2.0 million
|
756,600
|
|||||
|
2012
|
$169.3 million
|
$2.5 million
|
724,900
|
|||||
Results of Operations
The following table sets forth, for the periods indicated, certain information from our Consolidated Statements of Income expressed as a percentage of Net sales(1):
|
Year Ended December 31,
|
||||||||||||
|
2014
|
2013
|
2012
|
||||||||||
|
Sales
|
107.3
|
%
|
107.4
|
%
|
107.5
|
%
|
||||||
|
Less excise tax
|
7.3
|
7.4
|
7.5
|
|||||||||
|
Net sales
|
100.0
|
100.0
|
100.0
|
|||||||||
|
Cost of sales
|
70.6
|
71.9
|
70.4
|
|||||||||
|
Gross profit
|
29.4
|
28.1
|
29.6
|
|||||||||
|
Selling, general and administrative expenses
|
26.5
|
25.9
|
26.5
|
|||||||||
|
Operating income
|
2.9
|
2.1
|
3.0
|
|||||||||
|
Interest expense
|
(0.2
|
)
|
(0.3
|
)
|
(0.4
|
)
|
||||||
|
Other income (expense), net
|
(0.1
|
)
|
-
|
-
|
||||||||
|
Income before income taxes
|
2.5
|
1.8
|
2.6
|
|||||||||
|
Income tax provision
|
1.0
|
0.7
|
1.2
|
|||||||||
|
Net income
|
1.5
|
%
|
1.1
|
%
|
1.5
|
%
|
||||||
| (1) | Percentages may not sum due to rounding. |
Segment Information
Net sales, Gross profit and gross margin information by segment was as follows (dollars in thousands):
|
Year Ended December 31,
|
||||||||||||
|
2014
|
Beer Related
|
Pubs
and Other
|
Total
|
|||||||||
|
Net sales
|
$
|
173,687
|
$
|
26,335
|
$
|
200,022
|
||||||
|
Gross profit
|
$
|
55,174
|
$
|
3,536
|
$
|
58,710
|
||||||
|
Gross margin
|
31.8
|
%
|
13.4
|
%
|
29.4
|
%
|
||||||
|
2013
|
||||||||||||
|
Net sales
|
$
|
154,830
|
$
|
24,350
|
$
|
179,180
|
||||||
|
Gross profit
|
$
|
47,055
|
$
|
3,206
|
$
|
50,261
|
||||||
|
Gross margin
|
30.4
|
%
|
13.2
|
%
|
28.1
|
%
|
||||||
|
2012
|
||||||||||||
|
Net sales
|
$
|
145,670
|
$
|
23,617
|
$
|
169,287
|
||||||
|
Gross profit
|
$
|
46,341
|
$
|
3,685
|
$
|
50,026
|
||||||
|
Gross margin
|
31.8
|
%
|
15.6
|
%
|
29.6
|
%
|
||||||
Net Sales by Category
The following tables set forth a comparison of Net sales by category (dollars in thousands):
|
Year Ended December 31,
|
Dollar
Change
|
% Change
|
||||||||||||||
|
Sales by Category
|
2014
|
2013
|
||||||||||||||
|
A-B and A-B related
|
$
|
176,161
|
$
|
159,001
|
$
|
17,160
|
10.8
|
%
|
||||||||
|
Contract brewing and beer related(1)
|
12,113
|
9,082
|
3,031
|
33.4
|
%
|
|||||||||||
|
Excise taxes
|
(14,587
|
)
|
(13,253
|
)
|
(1,334
|
)
|
10.1
|
%
|
||||||||
|
Net beer related sales
|
173,687
|
154,830
|
18,857
|
12.2
|
%
|
|||||||||||
|
Pubs(2)
|
26,335
|
24,350
|
1,985
|
8.2
|
%
|
|||||||||||
|
Net sales
|
$
|
200,022
|
$
|
179,180
|
$
|
20,842
|
11.6
|
%
|
||||||||
|
Year Ended December 31,
|
Dollar
Change
|
% Change
|
||||||||||||||
|
Sales by Category
|
2013
|
2012
|
||||||||||||||
|
A-B and A-B related
|
$
|
159,001
|
$
|
147,628
|
$
|
11,373
|
7.7
|
%
|
||||||||
|
Contract brewing and beer related(1)
|
9,082
|
10,773
|
(1,691
|
)
|
(15.7
|
)%
|
||||||||||
|
Excise taxes
|
(13,253
|
)
|
(12,731
|
)
|
(522
|
)
|
4.1
|
%
|
||||||||
|
Net beer related sales
|
154,830
|
145,670
|
9,160
|
6.3
|
%
|
|||||||||||
|
Pubs(2)
|
24,350
|
23,617
|
733
|
3.1
|
%
|
|||||||||||
|
Net sales
|
$
|
179,180
|
$
|
169,287
|
$
|
9,893
|
5.8
|
%
|
||||||||
| (1) | Beer related includes international beer sales. |
| (2) | Pubs sales include sales of promotional merchandise and sales of beer directly to customers. |
Shipments by Category
Shipments by category were as follows (in barrels):
|
Year Ended
December 31,
|
2014 Shipments
|
2013 Shipments
|
Increase
(Decrease)
|
%
Change
|
Change in
Depletions(1)
|
|||||||||||||||
|
A-B and A-B related
|
766,600
|
708,100
|
58,500
|
8.3
|
%
|
7
|
%
|
|||||||||||||
|
Contract brewing and beer related(2)
|
52,700
|
37,100
|
15,600
|
42.0
|
%
|
|||||||||||||||
|
Pubs
|
10,900
|
11,400
|
(500
|
)
|
(4.4
|
)%
|
||||||||||||||
|
Total
|
830,200
|
756,600
|
73,600
|
9.7
|
%
|
|||||||||||||||
|
Year Ended
December 31,
|
2013 Shipments
|
2012 Shipments
|
Increase
(Decrease)
|
%
Change
|
Change in
Depletions(1)
|
|||||||||||||||
|
A-B and A-B related
|
708,100
|
660,000
|
48,100
|
7.3
|
%
|
11
|
%
|
|||||||||||||
|
Contract brewing and beer related(2)
|
37,100
|
52,700
|
(15,600
|
)
|
(29.6
|
)%
|
||||||||||||||
|
Pubs
|
11,400
|
12,200
|
(800
|
)
|
(6.6
|
)%
|
||||||||||||||
|
Total
|
756,600
|
724,900
|
31,700
|
4.4
|
%
|
|||||||||||||||
| (1) | Change in depletions reflects the year-over-year change in barrel volume sales of beer by wholesalers to retailers. |
| (2) | Contract brewing and beer related includes international shipments of our beers. |
The increase in sales to A-B and A-B related in 2014 compared to 2013 was primarily due to the increase in shipments, a shift in package mix from draft to packaged, which has a higher selling price per barrel than draft, and price increases.
The increase in sales to A-B and A-B related in 2013 compared to 2012 was primarily due to the increase in shipments and a shift in package mix from draft to packaged.
The average revenue per barrel on shipments of beer through the A-B distribution network increased by 1.8% in 2014 compared to 2013, and 0.4% in 2013 compared to 2012, primarily due to pricing increases and shifts in brand, package and geographic mix. Price changes implemented by us have generally followed craft beer market pricing trends. During 2014, 2013 and 2012, we sold 92.3%, 93.6% and 91.0%, respectively, of our beer through A‑B at wholesale pricing levels.
The increase in contract brewing and beer related sales in 2014 compared to 2013 was primarily due to an increase in international shipments of our beers, which sell at a higher rate per barrel than contract brewing sales, as we expanded into additional countries. Contract brewing also saw an increase in shipments as we began brewing for a new contract brewing customer in 2014.
The decrease in contract brewing and beer related sales in 2013 compared to 2012 was due to a $3.1 million decrease related to the mutually-agreed upon termination of our contract brewing agreement with Fulton Street Brewery (“FSB”) effective September 1, 2012. This decrease was partially offset by a $1.2 million increase in international shipments of our beers, which sell at a higher rate per barrel than contract brewing sales. Pursuant to our agreement with FSB, we phased out production of FSB branded beers by the end of November 2012 utilizing remaining inventory on-hand. In consideration, FSB agreed to a termination fee of $0.8 million that we recorded in Sales during the period from September 1, 2012 to December 31, 2012 and, under the terms of the termination agreement, we collected $70,000 per month from FSB through September 2013.
The increases in excise taxes in 2014 compared to 2013 and in 2013 compared to 2012 were due to higher shipments.
Pubs sales increased in 2014 compared to 2013, primarily as a result of our Kona Pubs in Hawaii experiencing increased sales, and our Redhook Pub in Woodinville being open the full year in 2014 compared to the twelve-week closure for a full remodel of that location during 2013, as well an increase in average pricing. The increase in Pubs sales was partially offset by the decrease in beer shipment volume through our Pubs.
Pubs sales increased in 2013 compared to 2012 primarily as a result of our Kona Pubs in Hawaii experiencing increased sales as a result of higher guest counts, as well as increased average pricing. The increase in Pubs sales was partially offset by lower sales at our Redhook Pub in Woodinville as a result of its closure for remodeling, in addition to a decrease in beer shipment volume through our pubs. The Redhook Pub in Woodinville, Washington re-opened at the end of May 2013.
The overall increase in volume in 2014 compared to 2013 reflected the continued strength of the Kona Brewing, Omission Beer and Redhook Brewery brands, partially offset by a decrease in the Widmer Brothers brand as we continued repositioning it in the marketplace.
The overall increase in volume in 2013 compared to 2012 reflected the continued strength of the Kona Brewing, Redhook Brewery and Omission Beer brands, partially offset by a decrease in the Widmer Brothers brand as we continued its repositioning in the marketplace.
Shipments by Brand
The following table sets forth a comparison of shipments by brand (in barrels):
|
Year Ended
December 31,
|
2014
Shipments
|
2013
Shipments
|
Increase
|
%
Change
|
Change in
Depletions
|
|||||||||||||||
|
Kona
|
300,600
|
256,800
|
43,800
|
17.1
|
%
|
13
|
%
|
|||||||||||||
|
Widmer Brothers(1)
|
266,800
|
252,600
|
14,200
|
5.6
|
%
|
2
|
%
|
|||||||||||||
|
Redhook
|
223,100
|
216,900
|
6,200
|
2.9
|
%
|
3
|
%
|
|||||||||||||
|
Total(2)
|
790,500
|
726,300
|
64,200
|
8.8
|
%
|
7
|
%
|
|||||||||||||
|
Year Ended
December 31,
|
2013
Shipments
|
2012
Shipments
|
Increase
(Decrease)
|
%
Change
|
Change in
Depletions
|
|||||||||||||||
|
Kona
|
256,800
|
220,000
|
36,800
|
16.7
|
%
|
23
|
%
|
|||||||||||||
|
Widmer Brothers(1)
|
252,600
|
264,300
|
(11,700
|
)
|
(4.4
|
)%
|
(3
|
)%
|
||||||||||||
|
Redhook
|
216,900
|
191,000
|
25,900
|
13.6
|
%
|
15
|
%
|
|||||||||||||
|
Total(2)
|
726,300
|
675,300
|
51,000
|
7.6
|
%
|
11
|
%
|
|||||||||||||
| (1) | Widmer Brothers includes the shipments and depletions from our Omission Beer and Square Mile brand families. |
| (2) | Total shipments by brand include international shipments and exclude shipments produced under our contract brewing arrangements. |
The increase in our Kona brand shipments in 2014 compared to 2013 was primarily due to the release of Castaway IPA on the mainland and continued sales growth of our Big Wave Golden Ale and Longboard Lager.
The increase in our Kona brand shipments in 2013 compared to 2012 was primarily due to the introduction on the mainland of our Big Wave Golden Ale during the third quarter of 2012, as well as expansion of sales of our Kona brands into certain Midwest states at the beginning of 2013, which also contributed to the continued sales growth of our Longboard Lager.
The increase in our Widmer Brothers brand shipments in 2014 compared to 2013 was primarily due to increases in shipments of the Omission Beer brand and Upheaval IPA, partially offset by the discontinuation of our Rotator IPA series.
The decrease in our Widmer Brothers brand shipments in 2013 compared to 2012 was primarily due to a decline in shipments of Hefeweizen, partially offset by an increase in shipments of Omission.
The increase in our Redhook brand shipments in 2014 compared to 2013 was primarily the result of increased sales of KCCO Black Lager, as well as further penetration into existing markets, particularly by our Long Hammer IPA, partially offset by declines in sales of ESB and Audible Ale.
The increase in our Redhook brand shipments in 2013 compared to 2012 was primarily the result of launching our new Audible Ale, a craft beer developed in partnership with Dan Patrick, at the Super Bowl in February 2013, as well as our new Game Changer Ale, co-developed with Buffalo Wild Wings as a craft beer that pairs well with wings. Redhook is also experiencing further penetration into existing markets, particularly by our Long Hammer IPA.
For each of the brand families discussed above, shipments lagged depletions for 2013 as a result of optimizing our supply chain processes, including brewing, during the 2013 first quarter to more closely align with the seasonality of our beer sales.
Shipments by Package
The following table sets forth a comparison of our shipments by package, excluding contract brewing shipments produced under our contract brewing arrangements (in barrels):
|
Year Ended
|
2014
|
2013
|
2012
|
|||||||||||||||||||||
|
December 31,
|
Shipments
|
% of Total
|
Shipments
|
% of Total
|
Shipments
|
% of Total
|
||||||||||||||||||
|
Draft
|
198,500
|
25.1
|
%
|
205,500
|
28.3
|
%
|
214,800
|
31.8
|
%
|
|||||||||||||||
|
Packaged
|
592,000
|
74.9
|
%
|
520,800
|
71.7
|
%
|
460,500
|
68.2
|
%
|
|||||||||||||||
|
Total
|
790,500
|
100.0
|
%
|
726,300
|
100.0
|
%
|
675,300
|
100.0
|
%
|
|||||||||||||||
The shift in mix from draft to packaged in 2014 compared to 2013 was primarily the result of the increases in volumes on our Kona, Omission and Redhook packaged beers and lower volumes on our Widmer Brothers draft beer. Increased competition across the industry, as a result of both the entry of large, multi-national brewers into the craft beer segment and the significant increase in small, local breweries nationally, is making on‑premise draft sales more challenging.
The shift in mix from draft to packaged in 2013 compared to 2012 was primarily the result of the increases in volumes of our Kona and Redhook packaged beers and lower volumes on our Widmer Brothers draft beer.
Capacity Utilization
Capacity utilization is calculated by dividing total shipments by approximate working capacity and was as follows:
|
Year Ended December 31,
|
||||||||||||
|
2014
|
2013
|
2012
|
||||||||||
|
Capacity utilization
|
75
|
%
|
70
|
%
|
73
|
%
|
||||||
During 2012, we increased the combined capacity of our production breweries from approximately 900,000 barrels per year to approximately 1,075,000 barrels per year. Utilization in 2012 would have been 67% if this increased capacity of our breweries had been available since January 1, 2012.
In June 2014, we initiated full-scale brewing with our brewing partner in Memphis, Tennessee. This partnership provides us scalable capacity and we anticipate producing up to 100,000 barrels at this location in 2015.
Cost of Sales
Cost of sales includes purchased raw materials, direct labor, overhead and shipping costs.
Information regarding Cost of sales was as follows (dollars in thousands):
|
Year Ended December 31,
|
Dollar
|
|||||||||||||||
|
2014
|
2013
|
Change
|
% Change
|
|||||||||||||
|
Beer Related
|
$
|
118,513
|
$
|
107,775
|
$
|
10,738
|
10.0
|
%
|
||||||||
|
Pubs
|
22,799
|
21,144
|
1,655
|
7.8
|
%
|
|||||||||||
|
Total
|
$
|
141,312
|
$
|
128,919
|
$
|
12,393
|
9.6
|
%
|
||||||||
|
Year Ended December 31,
|
Dollar
|
|||||||||||||||
|
2013
|
2012
|
Change
|
% Change
|
|||||||||||||
|
Beer Related
|
$
|
107,775
|
$
|
99,329
|
$
|
8,446
|
8.5
|
%
|
||||||||
|
Pubs
|
21,144
|
19,932
|
1,212
|
6.1
|
%
|
|||||||||||
|
Total
|
$
|
128,919
|
$
|
119,261
|
$
|
9,658
|
8.1
|
%
|
||||||||
The increase in Beer Related Cost of sales in 2014 compared to 2013 was primarily due to the increases in shipments discussed above, as well as the mix shift from draft to packaged product as the per barrel equivalent cost of packaged product is higher than draft. These increases were partially offset by increased efficiencies, primarily through better capacity utilization of our breweries.
Also contributing to the increase in Beer Related Cost of sales in 2014 compared to 2013 were various one-time costs incurred as a result of initiating brewing operations in Memphis, Tennessee. We experienced incremental startup costs for initial shipments out of the Memphis brewery as a result of launching during the peak selling season. The impact of decreased production and higher shipment costs represented approximately $0.7 million, or $420,000 after tax, reflected in Beer Related Cost of sales.
The increase in Beer Related Cost of sales in 2013 compared to 2012 was primarily due to the increase in shipment volume discussed above, as well as the mix shift from draft to packaged as the per barrel equivalent cost of packaged is higher than draft, and increased distribution costs per barrel as a result of expanding distribution.
Pubs Cost of sales increased in 2014 compared to 2013 primarily due to increases in Sales and cost increases across various categories, including labor, merchandise and administrative costs.
The increase in Pubs Cost of sales in 2013 compared to 2012 was primarily due to cost increases across various categories, including labor, food, merchandise and rent.
Gross Profit
Information regarding Gross profit was as follows (dollars in thousands):
|
Year Ended December 31,
|
Dollar
Change
|
% Change
|
||||||||||||||
|
2014
|
2013
|
|||||||||||||||
|
Beer Related
|
$
|
55,174
|
$
|
47,055
|
$
|
8,119
|
17.3
|
%
|
||||||||
|
Pubs
|
3,536
|
3,206
|
330
|
10.3
|
%
|
|||||||||||
|
Total
|
$
|
58,710
|
$
|
50,261
|
$
|
8,449
|
16.8
|
%
|
||||||||
|
Year Ended December 31,
|
Dollar
Change
|
% Change
|
||||||||||||||
|
2013
|
2012
|
|||||||||||||||
|
Beer Related
|
$
|
47,055
|
$
|
46,341
|
$
|
714
|
1.5
|
%
|
||||||||
|
Pubs
|
3,206
|
3,685
|
(479
|
)
|
(13.0
|
)%
|
||||||||||
|
Total
|
$
|
50,261
|
$
|
50,026
|
$
|
235
|
0.5
|
%
|
||||||||
Gross profit as a percentage of Net sales, or gross margin rate, was as follows:
|
Year Ended December 31,
|
||||||||||||
|
2014
|
2013
|
2012
|
||||||||||
|
Beer Related
|
31.8
|
%
|
30.4
|
%
|
31.8
|
%
|
||||||
|
Pubs
|
13.4
|
%
|
13.2
|
%
|
15.6
|
%
|
||||||
|
Total
|
29.4
|
%
|
28.1
|
%
|
29.6
|
%
|
||||||
The increase in the Beer Related Gross profit in 2014 compared to 2013 was due to the increase in shipment volume, as well as increased pricing, improved operating efficiencies of our breweries and optimization of our supply chain, partially offset by the additional costs incurred related to initiating brewing in Memphis, Tennessee, as discussed above.
The increase in the Beer Related gross margin rate in 2014 compared to 2013 was primarily due to the improved operating efficiencies of our breweries, as discussed above, optimization of our supply chain, and increases in pricing, partially offset by the effect of changes in product mix and additional costs incurred related to initiating brewing in Memphis, Tennessee. The increase in the Pubs gross margin rate in 2014 over 2013 was primarily due to the 2013 temporary closure of our Woodinville, Washington Pub for remodeling as discussed above.
The decrease in the Beer Related gross margin rate in 2013 compared to 2012 was primarily due to the change in product mix and higher distribution costs per barrel; the decrease was also due to the $0.8 million recorded in Sales in 2012 under the terms of the termination agreement with FSB with no associated costs. The decline in the Pubs gross margin rate in 2013 compared to 2012 was primarily due to the closure and post‑renovation ramp‑up of our Woodinville Pub, as discussed above, and increases in food and labor costs.
Selling, General and Administrative Expenses
Selling, general and administrative expenses (“SG&A”) include compensation and related expenses for our sales and marketing activities, management, legal and other professional and administrative support functions.
Information regarding SG&A was as follows (dollars in thousands):
|
Year Ended December 31,
|
Dollar
Change
|
% Change
|
||||||||||||||
|
2014
|
2013
|
|||||||||||||||
|
$
|
53,000
|
$
|
46,461
|
$
|
6,539
|
14.1
|
%
|
|||||||||
|
As a % of Net sales
|
26.5
|
%
|
25.9
|
%
|
||||||||||||
|
Year Ended December 31,
|
Dollar
Change
|
% Change
|
||||||||||||||
|
2013
|
2012
|
|||||||||||||||
|
$
|
46,461
|
$
|
44,890
|
$
|
1,571
|
3.5
|
%
|
|||||||||
|
As a % of Net sales
|
25.9
|
%
|
26.5
|
%
|
||||||||||||
The increase in SG&A in 2014 compared to 2013, both in dollars and as a percentage of Net sales, was primarily due to the planned increases in SG&A spending, primarily for Kona television advertising in select markets, as well as an increase in employee related benefit costs in 2014 when compared to 2013.
The increase in SG&A in 2013 compared to 2012 was primarily due to increases in employee related costs, and new packaging design and development costs. SG&A decreased as a percentage of Net sales in 2013 compared to 2012 primarily due to our leveraging of spending in prior periods.
Interest Expense
Information regarding Interest expense was as follows (dollars in thousands):
|
Year Ended December 31,
|
Dollar
Change
|
% Change
|
||||||||||||||
|
2014
|
2013
|
|||||||||||||||
|
Interest expense
|
$
|
431
|
$
|
464
|
$
|
(33
|
)
|
(7.1
|
)%
|
|||||||
| 2013 | 2012 | |||||||||||||||
|
Interest expense
|
$
|
464
|
$
|
663
|
$
|
(199
|
)
|
(30.0
|
)%
|
|||||||
|
Year Ended December 31,
|
||||||||||||
|
2014
|
2013
|
2012
|
||||||||||
|
Average debt outstanding
|
$
|
12,311
|
$
|
12,615
|
$
|
13,436
|
||||||
|
Average interest rate
|
1.83
|
%
|
2.92
|
%
|
2.74
|
%
|
||||||
The decrease in Interest expense in 2014 compared to 2013 was due to lower average outstanding borrowings, as well as lower average interest rates.
The decrease in Interest expense in 2013 compared to 2012 was due to the expiration of an interest rate swap contract, lower average outstanding borrowings and lower average interest rates.
Income Tax Provision
Our effective income tax rate was 39.7%, 40.0% and 43.6% in 2014, 2013 and 2012, respectively. The effective income tax rates reflect the impact of non-deductible expenses (primarily meals and entertainment expenses), state and local taxes, tax credits, and income excluded from taxation under the domestic production activities exclusion.
The rate in 2012 reflects the impact of increasing the tax rate applied against the net deferred tax liability due to the State of California changing income apportionment rules to a single sales factor methodology effective January 1, 2013. This one-time adjustment resulted in a 3.4 percentage point increase to our 2012 effective income tax rate, or $153,000 of our Income tax provision.
Liquidity and Capital Resources
We have required capital primarily for the construction and development of our production breweries, to support our expansion and growth plans, and to fund our working capital needs. Historically, we have financed our capital requirements through cash flows from operations, bank borrowings and the sale of common and preferred stock. We anticipate meeting our obligations for the twelve months beginning January 1, 2015 primarily from cash flows generated from operations and borrowing under our line of credit facility as the need arises. Capital resources available to us at December 31, 2014 included $1.0 million of Cash and cash equivalents and $19 million available under our line of credit facility.
We had $8.0 million of working capital and our debt as a percentage of total capitalization (total debt and common shareholders’ equity) was 11.4% at December 31, 2014.
A summary of our cash flow information was as follows (dollars in thousands):
|
Year Ended December 31,
|
||||||||||||
|
2014
|
2013
|
2012
|
||||||||||
|
Cash flows provided by operating activities
|
$
|
9,911
|
$
|
8,457
|
$
|
13,105
|
||||||
|
Cash flows used in investing activities
|
(15,529
|
)
|
(9,894
|
)
|
(8,683
|
)
|
||||||
|
Cash flows provided by (used in) financing activities
|
3,873
|
(850
|
)
|
(204
|
)
|
|||||||
|
Increase (decrease) in cash and cash equivalents
|
$
|
(1,745
|
)
|
$
|
(2,287
|
)
|
$
|
4,218
|
||||
Cash provided by operating activities of $9.9 million in 2014 resulted from our Net income of $3.1 million, net non-cash expenses of $9.8 million, and changes in our operating assets and liabilities as discussed in more detail below.
Accounts receivable, net, increased $0.3 million to $11.7 million at December 31, 2014 compared to $11.4 million at December 31, 2013. This increase was primarily due to an increase in our Contract Brewing and Beer Related revenue, partially offset by a $0.6 million decrease in our receivable from A-B to a total of $7.8 million at December 31, 2014, due to the timing of shipments. Historically, we have not had collection problems related to our accounts receivable.
Inventories increased $2.4 million to $19.0 million at December 31, 2014 compared to $16.6 million at December 31, 2013, primarily to support expansion into new geographic markets and sales growth.
Other current assets increased $1.0 million to $4.4 million at December 31, 2014 compared to $3.4 million at December 31, 2013, primarily due to increases in prepaid property and excise taxes, and income taxes receivable.
Accounts payable decreased $1.7 million to $13.0 million at December 31, 2014 compared to $14.7 million at December 31, 2013, primarily due to the timing of payments for brewing and production activities. The portion of our payable to A-B that is included in our Accounts payable totaled $1.8 million at December 31, 2014, which is consistent with the balance at December 31, 2013.
Other accrued expenses increased $0.9 million to $2.3 million at December 31, 2014 compared to $1.4 million at December 31, 2013, primarily due to an increase in incentives owed to our wholesalers as a result of increased sales.
As of December 31, 2014, we had the following net operating loss carryforwards (“NOLs”) and federal credit carry forwards available to offset payment of future income taxes:
| · | state NOLs of $32,000, tax-effected; and |
| · | federal alternative minimum tax (“AMT”) credit carry forwards of $332,000. |
We anticipate that we will utilize the remaining NOLs and federal credit carry forwards in the near future and, accordingly, once utilized, we will be required to satisfy all of our income tax obligations with cash.
Capital expenditures of $15.8 million in 2014 were primarily directed to beer production capacity and efficiency improvements and Pubs remodeling. As of December 31, 2014, we had an additional $0.6 million of expenditures recorded in Accounts payable on our Consolidated Balance Sheets, compared to $0.3 million at December 31, 2013. In June 2014, we entered into a capital lease financing arrangement related to equipment already purchased and included in the $15.8 million above, and received cash proceeds of $0.8 million. The lease term is 84 months with an effective interest rate of 2.98% per annum and payments due monthly. We anticipate capital expenditures of approximately $17 million to $21 million in 2015 primarily for capacity and efficiency improvements, quality initiatives and restaurant and retail.
Loan Agreement
We have a loan agreement (as amended, the “Loan Agreement”) with Bank of America, N.A., which consists of a $22.0 million revolving line of credit (“Line of Credit”), including provisions for cash borrowings and up to $2.5 million notional amount of letters of credit, and a $10.4 million term loan (“Term Loan”). We may draw upon the Line of Credit for working capital and general corporate purposes until expiration on October 31, 2018. The maturity date of the Term Loan is September 30, 2023. At December 31, 2014, we had $3.0 million of borrowings outstanding under the Line of Credit and $10.4 million outstanding under the Term Loan.
Under the Loan Agreement, interest accrues at an annual rate based on the London Inter-Bank Offered Rate (“LIBOR”) Daily Floating Rate plus a marginal rate. The marginal rate varies from 1.00% to 2.25% based on our funded debt ratio. At December 31, 2014, our marginal rate was 1.00%, resulting in an annual interest rate of 1.16%. Accrued interest for the Line of Credit and the Term Loan is due and payable monthly.
In connection with an amendment to the Loan Agreement on November 15, 2013, we paid down the Term Loan by $0.6 million in order to bring the outstanding principal balance to $10.8 million to achieve an 80% loan to value ratio on certain property securing the Loan Agreement. Principal payments are due monthly in accordance with an agreed-upon schedule set forth in the Loan Agreements, with any unpaid principal and accrued interest being paid on September 30, 2023.
The November 15, 2013 amendment also provided for the approval of acquisitions within the same line of business as long as we remain in compliance with the financial covenants of the Loan Agreement and at least $5.0 million remains available on the Line of Credit following the acquisition. In addition, the amendment released our Woodinville, Washington property as collateral and, accordingly, only our Oregon brewery is collateral on the Term Loan.
Contractual Commitments and Obligations
The following is a summary of our contractual commitments and obligations as of December 31, 2014 (in thousands):
|
Payments Due By Period
|
||||||||||||||||||||
|
Contractual Obligations
|
Total
|
2015
|
2016 and 2017
|
2018 and 2019
|
2020 and beyond
|
|||||||||||||||
|
Term loan
|
$
|
10,421
|
$
|
377
|
$
|
799
|
$
|
864
|
$
|
8,381
|
||||||||||
|
Interest on term loan(1)
|
879
|
120
|
225
|
206
|
328
|
|||||||||||||||
|
Line of credit
|
3,000
|
-
|
-
|
3,000
|
-
|
|||||||||||||||
|
Interest on line of credit(1)
|
135
|
35
|
70
|
30
|
-
|
|||||||||||||||
|
Promissory notes
|
600
|
600
|
-
|
-
|
-
|
|||||||||||||||
|
Interest on promissory notes
|
60
|
60
|
-
|
-
|
-
|
|||||||||||||||
|
Operating leases
|
18,879
|
1,839
|
3,114
|
2,522
|
11,404
|
|||||||||||||||
|
Capital leases
|
872
|
139
|
267
|
266
|
200
|
|||||||||||||||
|
Purchase commitments
|
34,710
|
20,822
|
8,327
|
3,989
|
1,572
|
|||||||||||||||
|
Sponsorship obligations
|
3,345
|
1,407
|
1,488
|
450
|
-
|
|||||||||||||||
|
Interest rate swap(2)
|
1,544
|
211
|
395
|
362
|
576
|
|||||||||||||||
|
$
|
74,445
|
$
|
25,610
|
$
|
14,685
|
$
|
11,689
|
$
|
22,461
|
|||||||||||
| (1) | The variable interest rate on our term loan and line of credit was 1.16% at December 31, 2014. |
| (2) | The fixed rate on our interest rate swap is 2.86%. We pay that fixed rate less the Benchmark Rate, which was 0.16% at December 31, 2014. |
See Notes 8 and 16 of Notes to Consolidated Financial Statements included in Part II, Item 8 of this Form 10-K for additional information.
Inflation
We believe that the impact of inflation was minimal on our business in 2014, 2013 and 2012.
Critical Accounting Policies and Estimates
Our financial statements are based upon the selection and application of significant accounting policies that require management to make significant estimates and assumptions. Judgments and uncertainties affecting the application of these policies may result in materially different amounts being reported under different conditions or using different assumptions. Our estimates are based upon historical experience, market trends and financial forecasts and projections, and upon various other assumptions that management believes to be reasonable under the circumstances at various points in time. Actual results may differ, potentially significantly, from these estimates.
Goodwill and Other Indefinite-Lived Intangible Assets
We test goodwill and other indefinite-lived intangible assets for impairment on an annual basis, or as indicators of impairment are present. We have an option to first assess certain qualitative factors for indications of impairment in order to determine whether it is necessary to perform the quantitative, two-step impairment test. If we choose not to first perform the qualitative test, or we determine that it is more likely than not that the fair value of the reporting unit is less than the carrying amount, we perform the quantitative two-step impairment test.
Our goodwill and other indefinite-lived intangible assets impairment loss calculations contain uncertainties because they require management to make assumptions in the qualitative assessment of relevant events and circumstances and to estimate the fair value of our reporting units and indefinite-lived intangible assets, including estimating future cash flows. These calculations contain uncertainties because they require management to make assumptions and apply judgment to estimate economic factors and the profitability of future business operations and, if necessary, the fair value of a reporting unit’s assets and liabilities. Further, our ability to realize the future cash flows used in our fair value calculations is affected by changes in such factors as economic conditions, our operating performance, our industry and our business strategies.
We do not believe there is a reasonable likelihood that there will be a material change in the future estimates or assumptions we use to test for impairment losses on goodwill. Based on the results of our annual impairment test for goodwill and other indefinite-lived intangible assets, no impairment was recorded. We believe, based on our assessment discussed above, that our goodwill and other indefinite-lived intangible assets are not at risk of impairment. However, if actual results are not consistent with our estimates or assumptions or there are significant changes in any of these estimates, projections or assumptions, the fair value of these assets in future measurement periods could be materially affected resulting in an impairment that could materially affect our results of operations.
Refundable Deposits on Kegs
We distribute our draft beer in kegs that are owned by us and are reflected as a component of Property, equipment and leasehold improvements in our Consolidated Balance Sheets at cost and are depreciated over the estimated useful life of the keg. When draft beer is shipped to the wholesaler, we collect a refundable deposit, reflected as a current liability in our Consolidated Balance Sheets. Upon return of the keg to us, the deposit is refunded to the wholesaler. When a wholesaler cannot account for some of our kegs for which it is responsible, it pays us a fixed fee and forfeits its deposit for each keg determined to be lost. We have experienced some loss of kegs and anticipate that some loss will occur in future periods due to the significant volume of kegs handled by each wholesaler and retailer, the similarities between kegs owned by most brewers, and the relatively low deposit collected on each keg when compared with the market value of the keg. We believe that this is an industry-wide issue and our loss experience is typical of the industry. In order to estimate forfeited deposits attributable to lost kegs, we periodically use internal records, A-B records, other third-party records, and historical information to estimate the physical count of kegs held by wholesalers and A-B.
These estimates affect the amount recorded as brewery equipment and refundable deposits as of the date of the consolidated financial statements. The actual liability for refundable deposits could differ from estimates.
Revenue Recognition
We recognize revenue from product sales, net of excise taxes, discounts and certain fees we must pay in connection with sales to a member of the A-B wholesale distributor network, when the products are delivered to the member. A member of the A-B wholesale distributor network may be a branch of A‑B or an independent wholesale distributor.
We recognize revenue on contract brewing sales when the product is shipped to our contract brewing customer.
We recognize revenue on retail sales at the time of sale and we recognize revenue from events at the time of the event.
Deferred Taxes
Deferred tax assets arise from the tax benefit of amounts expensed for financial reporting purposes but not yet deducted for tax purposes and from unutilized tax credits and net operating loss carry forwards. We evaluate our deferred tax assets on a regular basis to determine if a valuation allowance is required. To the extent it is determined the recoverability of the deferred tax assets is not more likely than not, we will record a valuation allowance against deferred tax assets. If we are unable to generate adequate taxable income in future periods or our assessment that it is more likely than not that certain deferred tax assets will be realized is otherwise not accurate, we may incur charges in future periods to record a valuation allowance on our gross deferred tax assets.
Off-Balance Sheet Arrangements
We do not have any off-balance sheet arrangements that have or are reasonably likely to have a material current or future effect on our financial condition, changes in financial condition, revenue or expenses, results of operations, liquidity, capital expenditures or capital resources.
Recent Accounting Pronouncements
See Note 3 of Notes to Consolidated Financial Statements included in Part II, Item 8 of this Form 10-K.
Interest Rate Risk
We have assessed our vulnerability to certain market risks, including interest rate risk associated with financial instruments included in Cash and cash equivalents and Long-term debt. To mitigate this risk, on January 23, 2014, we entered into an $8.0 million notional amount interest rate swap agreement, which expires September 29, 2023, to hedge the variability of interest payments associated with our variable-rate borrowings. Since the interest rate swap hedges the variability of interest payments on variable rate debt with similar terms, it qualifies for cash flow hedge accounting treatment. This interest rate swap hedges 75% of our total term loan outstanding and reduces our overall interest rate risk. As of December 31, 2014, we had unhedged variable-rate debt outstanding of $2.6 million on our term loan and $3.0 million on our line of credit. A 10% increase or decrease in the interest rate on our variable-rate debt would not have a material effect on our financial position, results of operations or cash flows.
Due to the nature of our highly liquid Cash and cash equivalents, an increase or decrease in interest rates would not materially affect the fair value of our cash or the related interest income.
Unaudited quarterly financial data for each of the eight quarters in the two-year period ended December 31, 2014 is as follows:
|
2014 (In thousands, except per share data)
|
1st Quarter
|
2nd Quarter
|
3rd Quarter
|
4th Quarter
|
||||||||||||
|
Net sales
|
$
|
43,826
|
$
|
56,686
|
$
|
52,073
|
$
|
47,437
|
||||||||
|
Cost of sales
|
31,986
|
38,112
|
37,428
|
33,786
|
||||||||||||
|
Gross profit
|
11,840
|
18,574
|
14,645
|
13,651
|
||||||||||||
|
Selling, general and administrative expenses
|
12,062
|
15,208
|
13,554
|
12,176
|
||||||||||||
|
Operating income (loss)
|
(222
|
)
|
3,366
|
1,091
|
1,475
|
|||||||||||
|
Interest expense and Other expense, net
|
(107
|
)
|
(96
|
)
|
(165
|
)
|
(243
|
)
|
||||||||
|
Income (loss) before income taxes
|
(329
|
)
|
3,270
|
926
|
1,232
|
|||||||||||
|
Income tax provision (benefit)
|
(128
|
)
|
1,275
|
361
|
514
|
|||||||||||
|
Net income (loss)
|
$
|
(201
|
)
|
$
|
1,995
|
$
|
565
|
$
|
718
|
|||||||
|
Basic and diluted net income (loss) per share(1)
|
$
|
(0.01
|
)
|
$
|
0.10
|
$
|
0.03
|
$
|
0.04
|
|||||||
|
Shares used in basic per share calculation
|
18,976
|
19,029
|
19,052
|
19,093
|
||||||||||||
|
Shares used in diluted per share calculation
|
18,976
|
19,087
|
19,103
|
19,167
|
||||||||||||
|
2013 (In thousands, except per share data)
|
1st Quarter
|
2nd Quarter
|
3rd Quarter
|
4th Quarter
|
||||||||||||
|
Net sales
|
$
|
36,609
|
$
|
49,007
|
$
|
49,354
|
$
|
44,210
|
||||||||
|
Cost of sales
|
27,666
|
34,043
|
34,512
|
32,698
|
||||||||||||
|
Gross profit
|
8,943
|
14,964
|
14,842
|
11,512
|
||||||||||||
|
Selling, general and administrative expenses
|
11,760
|
12,950
|
11,602
|
10,149
|
||||||||||||
|
Operating income (loss)
|
(2,817
|
)
|
2,014
|
3,240
|
1,363
|
|||||||||||
|
Interest expense and Other expense, net
|
(179
|
)
|
(150
|
)
|
(120
|
)
|
(88
|
)
|
||||||||
|
Income (loss) before income taxes
|
(2,996
|
)
|
1,864
|
3,120
|
1,275
|
|||||||||||
|
Income tax provision (benefit)
|
(1,222
|
)
|
769
|
1,228
|
529
|
|||||||||||
|
Net income (loss)
|
$
|
(1,774
|
)
|
$
|
1,095
|
$
|
1,892
|
$
|
746
|
|||||||
|
Basic and diluted net income (loss) per share(1)
|
$
|
(0.09
|
)
|
$
|
0.06
|
$
|
0.10
|
$
|
0.04
|
|||||||
|
Shares used in basic per share calculation
|
18,884
|
18,926
|
18,937
|
18,946
|
||||||||||||
|
Shares used in diluted per share calculation
|
18,884
|
18,992
|
19,067
|
19,113
|
||||||||||||
| (1) | Basic and diluted net income (loss) per share may not sum to the full year as presented on the Consolidated Statements of Income due to rounding. |
REPORT OF INDEPENDENT REGISTERED PUBLIC ACCOUNTING FIRM
The Board of Directors and Shareholders
Craft Brew Alliance, Inc.
We have audited the accompanying consolidated balance sheets of Craft Brew Alliance, Inc. (the “Company”) as of December 31, 2014 and 2013, and the related consolidated statements of income, comprehensive income, shareholders’ equity, and cash flows for each of the three years in the period ended December 31, 2014. These consolidated financial statements are the responsibility of the Company’s management. Our responsibility is to express an opinion on these consolidated financial statements based on our audits.
We conducted our audits in accordance with the standards of the Public Company Accounting Oversight Board (United States). Those standards require that we plan and perform the audit to obtain reasonable assurance about whether the consolidated financial statements are free of material misstatement. An audit includes examining, on a test basis, evidence supporting the amounts and disclosures in the consolidated financial statements. An audit also includes assessing the accounting principles used and significant estimates made by management, as well as evaluating the overall consolidated financial statement presentation. We believe that our audits provide a reasonable basis for our opinion.
In our opinion, the consolidated financial statements referred to above present fairly, in all material respects, the consolidated financial position of Craft Brew Alliance, Inc. as of December 31, 2014 and 2013, and the consolidated results of its operations and its cash flows for each of the three years in the period ended December 31, 2014, in conformity with accounting principles generally accepted in the United States of America.
We also have audited, in accordance with the standards of the Public Company Accounting Oversight Board (United States), Craft Brew Alliance Inc.’s internal control over financial reporting as of December 31, 2014, based on criteria established in Internal Control - Integrated Framework (2013) issued by the Committee of Sponsoring Organizations of the Treadway Commission and our report dated March 4, 2015 expressed an unqualified opinion thereon.
/s/ Moss Adams LLP
Portland, Oregon
March 4, 2015
CRAFT BREW ALLIANCE, INC.
CONSOLIDATED BALANCE SHEET
(Dollars in thousands, except per share amounts)
|
|
December 31,
|
|||||||
|
|
2014
|
2013
|
||||||
|
|
||||||||
|
Assets
|
||||||||
|
Current assets:
|
||||||||
|
Cash and cash equivalents
|
$
|
981
|
$
|
2,726
|
||||
|
Accounts receivable, net
|
11,741
|
11,370
|
||||||
|
Inventories
|
18,971
|
16,639
|
||||||
|
Deferred income tax asset, net
|
1,670
|
1,345
|
||||||
|
Other current assets
|
4,413
|
3,403
|
||||||
|
Total current assets
|
37,776
|
35,483
|
||||||
|
|
||||||||
|
Property, equipment and leasehold improvements, net
|
110,350
|
104,193
|
||||||
|
Goodwill
|
12,917
|
12,917
|
||||||
|
Intangible and other assets, net
|
17,558
|
17,693
|
||||||
|
Total assets
|
$
|
178,601
|
$
|
170,286
|
||||
|
|
||||||||
|
Liabilities and Shareholders' Equity
|
||||||||
|
Current liabilities:
|
||||||||
|
Accounts payable
|
$
|
12,987
|
$
|
14,742
|
||||
|
Accrued salaries, wages and payroll taxes
|
5,114
|
4,616
|
||||||
|
Refundable deposits
|
8,152
|
8,252
|
||||||
|
Other accrued expenses
|
2,316
|
1,381
|
||||||
|
Current portion of long-term debt and capital lease obligations
|
1,157
|
710
|
||||||
|
Total current liabilities
|
29,726
|
29,701
|
||||||
|
|
||||||||
|
Long-term debt and capital lease obligations, net of current portion
|
13,720
|
11,050
|
||||||
|
Fair value of derivative financial instruments
|
503
|
-
|
||||||
|
Deferred income tax liability, net
|
18,570
|
17,719
|
||||||
|
Other liabilities
|
665
|
584
|
||||||
|
Total liabilities
|
63,184
|
59,054
|
||||||
|
|
||||||||
|
Commitments and contingencies (Note 16)
|
||||||||
|
|
||||||||
|
Common shareholders' equity:
|
||||||||
|
Common stock, $0.005 par value. Authorized 50,000,000 shares; issued and outstanding 19,115,396 and 18,972,247
|
96
|
95
|
||||||
|
Additional paid-in capital
|
138,391
|
136,972
|
||||||
|
Accumulated other comprehensive loss
|
(312
|
)
|
-
|
|||||
|
Accumulated deficit
|
(22,758
|
)
|
(25,835
|
)
|
||||
|
Total common shareholders' equity
|
115,417
|
111,232
|
||||||
|
Total liabilities and common shareholders' equity
|
$
|
178,601
|
$
|
170,286
|
||||
The accompanying notes are an integral part of these financial statements.
CRAFT BREW ALLIANCE, INC.
CONSOLIDATED STATEMENTS OF INCOME
(In thousands, except per share amounts)
|
Year Ended December 31,
|
||||||||||||
|
2014
|
2013
|
2012
|
||||||||||
|
Sales
|
$
|
214,609
|
$
|
192,433
|
$
|
182,018
|
||||||
|
Less excise taxes
|
14,587
|
13,253
|
12,731
|
|||||||||
|
Net sales
|
200,022
|
179,180
|
169,287
|
|||||||||
|
Cost of sales
|
141,312
|
128,919
|
119,261
|
|||||||||
|
Gross profit
|
58,710
|
50,261
|
50,026
|
|||||||||
|
Selling, general and administrative expenses
|
53,000
|
46,461
|
44,890
|
|||||||||
|
Operating income
|
5,710
|
3,800
|
5,136
|
|||||||||
|
Interest expense
|
(431
|
)
|
(464
|
)
|
(663
|
)
|
||||||
|
Other income (expense), net
|
(180
|
)
|
(73
|
)
|
4
|
|||||||
|
Income before income taxes
|
5,099
|
3,263
|
4,477
|
|||||||||
|
Income tax provision
|
2,022
|
1,304
|
1,951
|
|||||||||
|
Net income
|
$
|
3,077
|
$
|
1,959
|
$
|
2,526
|
||||||
|
Basic and diluted net income per share
|
$
|
0.16
|
$
|
0.10
|
$
|
0.13
|
||||||
|
Shares used in basic per share calculations
|
19,038
|
18,923
|
18,862
|
|||||||||
|
Shares used in diluted per share calculations
|
19,126
|
19,042
|
18,934
|
|||||||||
The accompanying notes are an integral part of these financial statements.
CRAFT BREW ALLIANCE, INC.
CONSOLIDATED STATEMENTS OF COMPREHENSIVE INCOME
(In thousands)
|
Year Ended December 31,
|
||||||||||||
|
2014
|
2013
|
2012
|
||||||||||
|
Net income
|
$
|
3,077
|
$
|
1,959
|
$
|
2,526
|
||||||
|
Unrealized gain (loss) on derivative hedge transactions, net of tax
|
(312
|
)
|
135
|
221
|
||||||||
|
Comprehensive income
|
$
|
2,765
|
$
|
2,094
|
$
|
2,747
|
||||||
The accompanying notes are an integral part of these financial statements.
CRAFT BREW ALLIANCE, INC.
CONSOLIDATED STATEMENTS OF COMMON SHAREHOLDERS’ EQUITY
(In thousands)
|
Additional
Paid-In
Capital
|
Accumulated
Other
Comprehensive
Loss
|
Retained
Deficit
|
Total
Common
Shareholders'
Equity
|
|||||||||||||||||||||
|
Common Stock
|
||||||||||||||||||||||||
|
Shares
|
Par Value
|
|||||||||||||||||||||||
|
Balance at December 31, 2011
|
18,845
|
$
|
94
|
$
|
135,091
|
$
|
(356
|
)
|
$
|
(30,320
|
)
|
$
|
104,509
|
|||||||||||
|
Issuance of shares under stock plans
|
6
|
-
|
13
|
-
|
-
|
13
|
||||||||||||||||||
|
Stock-based compensation
|
23
|
-
|
547
|
-
|
-
|
547
|
||||||||||||||||||
|
Tax benefit related to stock options
|
-
|
-
|
379
|
-
|
-
|
379
|
||||||||||||||||||
|
Unrealized gains on derivative financial instruments, net of tax provision of $132
|
-
|
-
|
-
|
221
|
-
|
221
|
||||||||||||||||||
|
Net income
|
-
|
-
|
-
|
-
|
2,526
|
2,526
|
||||||||||||||||||
|
Balance at December 31, 2012
|
18,874
|
94
|
136,030
|
(135
|
)
|
(27,794
|
)
|
108,195
|
||||||||||||||||
|
Issuance of shares under stock plans
|
75
|
1
|
243
|
-
|
-
|
244
|
||||||||||||||||||
|
Stock-based compensation
|
23
|
-
|
549
|
-
|
-
|
549
|
||||||||||||||||||
|
Tax benefit related to stock options
|
-
|
-
|
150
|
-
|
-
|
150
|
||||||||||||||||||
|
Unrealized gains on derivative financial instruments, net of tax provision of $84
|
-
|
-
|
-
|
135
|
-
|
135
|
||||||||||||||||||
|
Net income
|
-
|
-
|
-
|
-
|
1,959
|
1,959
|
||||||||||||||||||
|
Balance at December 31, 2013
|
18,972
|
95
|
136,972
|
-
|
(25,835
|
)
|
111,232
|
|||||||||||||||||
|
Issuance of shares under stock plans
|
105
|
1
|
487
|
-
|
-
|
488
|
||||||||||||||||||
|
Stock-based compensation
|
38
|
-
|
784
|
-
|
-
|
784
|
||||||||||||||||||
|
Tax benefit related to stock options
|
-
|
-
|
298
|
-
|
-
|
298
|
||||||||||||||||||
|
Unrealized losses on derivative financial instruments, net of tax benefit of $191
|
-
|
-
|
-
|
(312
|
)
|
-
|
(312
|
)
|
||||||||||||||||
|
Tax payments related to performance shares issued
|
-
|
-
|
(150
|
)
|
-
|
-
|
(150
|
)
|
||||||||||||||||
|
Net income
|
-
|
-
|
-
|
-
|
3,077
|
3,077
|
||||||||||||||||||
|
Balance at December 31, 2014
|
19,115
|
$
|
96
|
$
|
138,391
|
$
|
(312
|
)
|
$
|
(22,758
|
)
|
$
|
115,417
|
|||||||||||
The accompanying notes are an integral part of these financial statements.
CRAFT BREW ALLIANCE, INC.
CONSOLIDATED STATEMENTS OF CASH FLOWS
(In thousands)
|
Year Ended December 31,
|
||||||||||||
|
2014
|
2013
|
2012
|
||||||||||
|
Cash flows from operating activities:
|
||||||||||||
|
Net income
|
$
|
3,077
|
$
|
1,959
|
$
|
2,526
|
||||||
|
Adjustments to reconcile net income to net cash provided by operating activities:
|
||||||||||||
|
Depreciation and amortization
|
8,648
|
8,164
|
7,369
|
|||||||||
|
Loss on sale or disposal of property, equipment and leasehold improvements
|
213
|
195
|
23
|
|||||||||
|
Deferred income taxes
|
709
|
374
|
1,458
|
|||||||||
|
Stock-based compensation
|
784
|
549
|
547
|
|||||||||
|
Excess tax benefit from employee stock plans
|
(298
|
)
|
(150
|
)
|
(379
|
)
|
||||||
|
Other
|
(286
|
)
|
286
|
(329
|
)
|
|||||||
|
Changes in operating assets and liabilities:
|
||||||||||||
|
Accounts receivable, net
|
(371
|
)
|
(858
|
)
|
2,396
|
|||||||
|
Inventories
|
(2,185
|
)
|
(5,577
|
)
|
(1,855
|
)
|
||||||
|
Other current assets
|
(1,011
|
)
|
407
|
(994
|
)
|
|||||||
|
Accounts payable and other accrued expenses
|
(825
|
)
|
2,630
|
1,269
|
||||||||
|
Accrued salaries, wages and payroll taxes
|
498
|
(651
|
)
|
743
|
||||||||
|
Refundable deposits
|
958
|
1,129
|
331
|
|||||||||
|
Net cash provided by operating activities
|
9,911
|
8,457
|
13,105
|
|||||||||
|
Cash flows from investing activities:
|
||||||||||||
|
Expenditures for property, equipment and leasehold improvements
|
(15,783
|
)
|
(9,894
|
)
|
(9,138
|
)
|
||||||
|
Proceeds from sale of property, equipment and leasehold improvements
|
254
|
-
|
37
|
|||||||||
|
Proceeds from the sale of equity interest in Fulton Street Brewery, LLC
|
-
|
-
|
418
|
|||||||||
|
Net cash used in investing activities
|
(15,529
|
)
|
(9,894
|
)
|
(8,683
|
)
|
||||||
|
Cash flows from financing activities:
|
||||||||||||
|
Principal payments on debt and capital lease obligations
|
(604
|
)
|
(1,208
|
)
|
(596
|
)
|
||||||
|
Net borrowings under revolving line of credit
|
3,000
|
-
|
-
|
|||||||||
|
Proceeds from capital lease financing
|
841
|
-
|
-
|
|||||||||
|
Proceeds from issuances of common stock
|
488
|
244
|
13
|
|||||||||
|
Debt issuance costs
|
-
|
(46
|
)
|
-
|
||||||||
|
Tax payments related to performance shares issued
|
(150
|
)
|
-
|
-
|
||||||||
|
Excess tax benefit from employee stock plans
|
298
|
160
|
379
|
|||||||||
|
Net cash provided by (used in) financing activities
|
3,873
|
(850
|
)
|
(204
|
)
|
|||||||
|
Increase (decrease) in cash and cash equivalents
|
(1,745
|
)
|
(2,287
|
)
|
4,218
|
|||||||
|
Cash and cash equivalents:
|
||||||||||||
|
Beginning of period
|
2,726
|
5,013
|
795
|
|||||||||
|
End of period
|
$
|
981
|
$
|
2,726
|
$
|
5,013
|
||||||
|
Supplemental disclosure of cash flow information:
|
||||||||||||
|
Cash paid for interest
|
$
|
540
|
$
|
601
|
$
|
774
|
||||||
|
Cash paid for income taxes, net
|
1,187
|
543
|
416
|
|||||||||
|
Supplemental disclosure of non-cash information:
|
||||||||||||
|
Purchases of Property, equipment and leasehold improvements included in Accounts payable
|
$
|
636
|
$
|
331
|
$
|
-
|
||||||
The accompanying notes are an integral part of these financial statements.
| Note 1. | Nature of Operations |
Overview
Craft Brew Alliance, Inc. was formed in 1981 to brew and sell craft beer. We produce, sell and market on a national basis innovative packaged and draft products for the Kona, Widmer Brothers, Redhook, Omission and Square Mile brands at our six company-owned breweries and operate five pubs that promote our products, offer dining and entertainment facilities and sell retail merchandise. Our common stock trades on the Nasdaq Stock Market under the trading symbol “BREW.”
Our products are distributed domestically in all 50 states. This national footprint was established primarily through a series of distribution agreements with Anheuser-Busch, LLC (“A-B”), a significant shareholder. In 2004, we and A‑B entered into three agreements, an exchange and recapitalization agreement (as amended, the “Exchange Agreement”), a master distributor agreement (as amended, the “A-B Distributor Agreement”) and a registration rights agreement that collectively constitute the framework of our existing relationship with A-B.
Under the present terms of the A‑B Distributor Agreement, we distribute our products in substantially all of our markets through A‑B’s seamless national wholesale distributor network. As a result of this distribution arrangement, we believe that, under alcohol beverage laws in a majority of states, these wholesalers own the exclusive right to distribute our beers in their respective markets if the A-B Distributor Agreement expires or is terminated. A-B’s domestic wholesaler network consists primarily of independent wholesalers, together with branches owned by A-B. The A-B Distributor Agreement is subject to early termination by either party upon the occurrence of certain events. The A‑B Distributor Agreement expires December 31, 2018, but may be renewed automatically for an additional ten-year period unless A‑B provides written notice to the contrary on or before June 30, 2018.
Basis of Presentation
The consolidated financial statements include the accounts of Craft Brew Alliance, Inc. and our wholly owned subsidiaries. All intercompany transactions and balances are eliminated in consolidation.
| Note 2. | Significant Accounting Policies |
Cash and Cash Equivalents
We maintain cash balances with financial institutions that may exceed federally insured limits. We consider all highly liquid investments with an original maturity of three months or less to be cash equivalents. As of December 31, 2014, there were no cash equivalents. Cash equivalents totaled $2.7 million at December 31, 2013.
Under our cash management system, we utilize a controlled disbursement account to fund cash distribution checks presented for payment by the holder. Checks issued but not yet presented to banks may result in overdraft balances for accounting purposes. As of December 31, 2014, there were no bank overdrafts. As of December 31, 2013, bank overdrafts totaling $0.7 million were included in Accounts payable on our Consolidated Balance Sheets. Changes in book overdrafts from period to period are reported in the Consolidated Statement of Cash Flows as a component of operating activities within Accounts payable and Other accrued expenses.
Accounts Receivable
Accounts receivable primarily consists of trade receivables due from wholesalers and A-B for beer and promotional product sales. Because of state liquor laws and each wholesaler’s agreement with A-B, we do not have collectability issues related to the sale of our beer products. Accordingly, we do not regularly provide an allowance for doubtful accounts for beer sales. We have provided an allowance for promotional merchandise receivables that have been invoiced to the wholesaler, which reflects our best estimate of probable losses inherent in the accounts. We determine the allowance based on historical customer experience and other currently available evidence. When a specific account is deemed uncollectible, the account is written off against the allowance. The allowance for doubtful accounts was $25,000 at both December 31, 2014 and 2013.
Activity related to our allowance for doubtful accounts was immaterial in 2014, 2013 and 2012.
Inventories
Inventories, except for pub food, beverages and supplies, are stated at the lower of standard cost or market. Pub food, beverages and supplies are stated at the lower of cost or market.
We regularly review our inventories for the presence of obsolete product attributed to age, seasonality and quality. If our review indicates a reduction in utility below the product’s carrying value, we reduce the product to a new cost basis. We record the cost of inventory for which we estimate we have more than a twelve-month supply as a component of Intangible and other assets on our Consolidated Balance Sheets.
Property, Equipment and Leasehold Improvements
Property, equipment and leasehold improvements are stated at cost, less accumulated depreciation and accumulated amortization. Expenditures for repairs and maintenance are expensed as incurred; renewals and betterments are capitalized. Upon disposal of equipment and leasehold improvements, the accounts are relieved of the costs and related accumulated depreciation or amortization, and resulting gains or losses are reflected in our Consolidated Statements of Income.
Depreciation and amortization of property, equipment and leasehold improvements is provided on the straight-line method over the following estimated useful lives:
|
Buildings
|
30 – 50 years
|
|
Brewery equipment
|
10 – 25 years
|
|
Furniture, fixtures and other equipment
|
2 – 10 years
|
|
Vehicles
|
5 years
|
|
Leasehold improvements
|
The lesser of useful life or term of the lease
|
Valuation of Long-Lived Assets
We evaluate potential impairment of long-lived assets when facts and circumstances indicate that the carrying values of such assets may be impaired. An evaluation of recoverability is performed by comparing the carrying value of the assets to projected future undiscounted cash flows. Upon indication that the carrying value of such assets may not be recoverable, we recognize an impairment loss in the current period in our Consolidated Statements of Income. We did not identify indicators of impairment during 2014, 2013 or 2012.
Definite-lived intangible assets are amortized using a straight line basis of accounting. Definite-lived intangible assets and their respective estimated lives are as follows:
|
Distributor agreements
|
15 years
|
|
Non-compete agreements
|
5 years
|
Goodwill
Goodwill is not amortized but rather is reviewed for impairment at least annually, or more frequently if an event occurs or circumstances change that indicate that the carrying value may not be recoverable. We first make a qualitative assessment of whether it is more likely than not that a reporting unit’s fair value is less than its carrying amount before applying the two-step goodwill impairment test. If the conclusion is that it is more likely than not that the fair value of a reporting unit is less than its carrying amount, we then perform a two-step goodwill impairment test. Under the first step, the fair value of the reporting unit is compared to its carrying value, and, if an indication of goodwill impairment exists in the reporting unit, the second step of the impairment test is performed to measure the amount of any impairment loss. Under step two, an impairment loss is recognized for any excess of the carrying amount of the reporting unit’s goodwill as determined by allocating the fair value of the reporting unit in a manner similar to a purchase price allocation. The residual fair value after this allocation is the implied fair value of the reporting unit goodwill. If the fair value of the reporting unit exceeds its carrying value, step two does not need to be performed. We conduct our annual impairment test as of December 31 of each year and have determined there to be no impairment for any of the periods presented.
Indefinite-Lived Intangible Assets
Indefinite-lived intangible assets consist primarily of trademarks, domain name and recipes. We evaluate the recoverability of indefinite-lived intangible assets annually, or more frequently if events or changes in circumstances indicate that the asset might be impaired, by comparing the carrying amount of the asset to its estimated fair value measured by using discounted cash flows that the asset is expected to generate. We have determined there to be no impairment for any of the periods presented.
Refundable Deposits on Kegs
We distribute our draft beer in kegs that are owned by us and are reflected in our Consolidated Balance Sheets at cost and are depreciated over the estimated useful life of the keg. When draft beer is shipped to the wholesaler, we collect a refundable deposit, presented as a current liability – Refundable deposits in our Consolidated Balance Sheets. Upon return of the keg to us, the deposit is refunded to the wholesaler.
We have experienced some loss of kegs and anticipate that some loss will occur in future periods due to the significant volume of kegs handled by each wholesaler and retailer, the homogeneous nature of kegs owned by most brewers, and the relatively small deposit collected for each keg when compared with its market value. In order to estimate forfeited deposits attributable to lost kegs, we periodically use internal records, records maintained by A‑B, records maintained by other third party vendors and historical information to estimate the physical count of kegs held by wholesalers and A-B. These estimates affect the amount recorded as equipment and refundable deposits as of the date of the consolidated financial statements. The actual liability for refundable deposits may differ from estimates. Our Consolidated Balance Sheets included $8.0 million at December 31, 2014 and 2013 in refundable deposits on kegs and $10.1 million and $6.5 million, respectively, in keg equipment, net of accumulated depreciation.
Concentrations of Risk
Financial instruments that potentially subject us to credit risk consist principally of Accounts receivable. While wholesalers and A-B account for substantially all Accounts receivable, this concentration risk is limited due to the number of wholesalers, their geographic dispersion and state laws regulating the financial affairs of wholesalers of alcoholic beverages.
Comprehensive Income
Comprehensive income includes changes in the fair value of interest rate derivatives that are designated as cash flow hedges.
Revenue Recognition
We recognize revenue from product sales, net of excise taxes, discounts and certain fees we must pay in connection with sales to a member of the A-B wholesale distributor network, when the products are delivered to the member. A member of the A-B wholesale distributor network may be a branch of A‑B or an independent wholesale distributor.
We recognize revenue on contract brewing sales when the product is shipped to our contract brewing customer.
We recognize revenue on retail sales at the time of sale and we recognize revenue from events at the time of the event.
Excise Taxes
The federal government levies excise taxes on the sale of alcoholic beverages, including beer. For brewers producing less than two million barrels of beer per calendar year, the federal excise tax is $7 per barrel on the first 60,000 barrels of beer removed for consumption or sale during the calendar year, and $18 per barrel for each barrel in excess of 60,000 barrels. Individual states also impose excise taxes on alcoholic beverages in varying amounts. As presented in our Consolidated Statements of Income, Sales reflects the amounts invoiced to A-B, wholesalers and other customers. Excise taxes due to federal and state agencies are not collected from our customers, but rather are our responsibility. Net sales, as presented in our Consolidated Statements of Income, are reduced by applicable federal and state excise taxes.
Taxes Collected from Customers and Remitted to Governmental Authorities
We account for tax assessed by a governmental authority that is directly imposed on a revenue-producing transaction (i.e., sales, use, value added) on a net (excluded from revenue) basis.
Shipping and Handling Costs
Costs incurred to ship our product are included in Cost of sales in our Consolidated Statements of Income.
Advertising Expenses
Advertising costs, consisting of television, radio, print, outdoor advertising, on-line and social media, sponsorships, trade events, promotions and printed product information, as well as costs to produce these media, are expensed as incurred. The costs associated with point of sale display items and related promotional merchandise are inventoried and charged to expense when first used. For the years ended December 31, 2014, 2013 and 2012, we recognized costs for all of these activities totaling $15.0 million, $12.4 million and $12.4 million, respectively, which are reflected as Selling, general and administrative expenses in our Consolidated Statements of Income.
Advertising expenses frequently involve the local wholesaler sharing in the cost of the program. Reimbursements from wholesalers for advertising and promotion activities are recorded as a reduction to Selling, general and administrative expenses in our Consolidated Statements of Income. Pricing discounts to wholesalers are recorded as a reduction of Sales in our Consolidated Statements of Income.
Stock-Based Compensation
The fair value of restricted stock awards is determined based on the number of shares granted and the quoted price of our common stock on the date of grant. The fair value of stock option awards is estimated at the grant date as calculated by the Black-Scholes-Merton (“BSM”) option-pricing model. The BSM model requires various judgmental assumptions including expected volatility and option life.
The estimated fair value of stock-based awards is recognized as compensation expense over the vesting period of the award, net of estimated forfeitures. We estimate forfeitures of stock-based awards based on historical experience and expected future activity.
The estimated fair value of performance-based stock awards is recognized over the service period based on an assessment of the probability that performance goals will be met. We re-measure the probability of achieving the performance goals during each reporting period. In future reporting periods, if we determine that performance goals are not probable of occurrence, no compensation expense will be recognized and any previously recognized compensation expense would be reversed.
Legal Costs
We are a party to legal proceedings arising in the normal course of business. We accrue for certain legal costs, including attorney fees, and potential settlement claims related to various legal proceedings that are estimable and probable. If not estimable and probable, legal costs are expensed as incurred as a component of Selling, general and administrative expenses.
Income Taxes
Deferred income taxes are established for the difference between the financial reporting and income tax basis of assets and liabilities as well as operating loss and tax credit carryforwards. Deferred tax assets are reduced by a valuation allowance when, in the opinion of management, it is more likely than not that some portion of the deferred tax assets will not be realized. Deferred tax assets and liabilities are measured using enacted tax rates expected to apply to taxable income in the years in which those temporary differences are expected to be recovered or settled. The effect on deferred taxes of a change in tax rates is recognized in income in the period that includes the enactment date.
We recognize the benefits of tax return positions when it is determined that the positions are “more-likely-than-not” to be sustained by the taxing authority. Interest and penalties accrued on unrecognized tax benefits are recorded as tax expense in the period incurred. At December 31, 2014 and 2013, we did not have any unrecognized tax benefits or any interest and penalties accrued on unrecognized tax benefits.
Segment Information
Our chief operating decision maker monitors Net sales and gross margins of our Beer Related operations and our Pubs operations. Beer Related operations include the brewing operations and related domestic and international beer and cider sales of our Kona, Widmer Brothers, Redhook and Omission beer brands and Square Mile cider brand. Pubs operations primarily include our pubs, some of which are located adjacent to our Beer Related operations. We do not track operating results beyond the gross margin level or our assets on a segment level.
Earnings per Share
Basic earnings per share is computed on the basis of the weighted average number of shares that were outstanding during the period. Diluted earnings per share include the dilutive effect of common share equivalents calculated under the treasury stock method. Performance-based restricted stock grants are included in basic and diluted earnings per share when the underlying performance metrics have been met.
Use of Estimates
The preparation of financial statements in conformity with accounting principles generally accepted in the United States of America requires management to make estimates and assumptions that affect the reported amounts of assets and liabilities and disclosure of contingent assets and liabilities at the date of the financial statements and the reported amounts of revenues and expenses during the reporting period. We base our estimates on historical experience and on various assumptions that are believed to be reasonable under the circumstances at the time. Actual results could differ from those estimates under different assumptions or conditions.
| Note 3. | Recent Accounting Pronouncements |
ASU 2015-1
In January 2015, the Financial Accounting Standards Board ("FASB") issued Accounting Standards Update (“ASU”) No. 2015-1, “Income Statement - Extraordinary and Unusual Items (Subtopic 225-20): Simplifying Income Statement Presentation by Eliminating the Concept of Extraordinary Items.” This ASU eliminates from U.S. GAAP the concept of extraordinary items. ASU 2015-1 is effective for fiscal years, and interim periods within those fiscal years, beginning after December 15, 2015. A reporting entity may apply the amendments prospectively. We do not expect the adoption of ASU 2015-1 to have a material effect on our financial position, results of operations or cash flows.
ASU 2014-17
In November 2014, the FASB issued ASU No. 2014-17, “Business Combinations (Topic 805): Pushdown Accounting.” This ASU provides an acquired entity with an option to apply pushdown accounting in its separate financial statements upon occurrence of an event in which an acquirer obtains control of the acquired entity. An acquired entity may elect the option to apply pushdown accounting in the reporting period in which the change-in-control event occurs. If pushdown accounting is applied to an individual change-in-control event, that election is irrevocable. ASU 2014-17 was effective on November 18, 2014. We do not expect the adoption of ASU 2014-17 to have a material effect on our financial position, results of operations or cash flows.
ASU 2014-16
In November 2014, the FASB issued ASU 2014-16, “Derivatives and Hedging (Topic 815).” ASU 2014-16 addresses whether the host contract in a hybrid financial instrument issued in the form of a share should be accounted for as debt or equity. ASU 2014-16 is effective for annual periods and interim periods beginning after December 15, 2015. We do not currently have issued, nor are we investors in, hybrid financial instruments. Accordingly, we do not expect the adoption of ASU 2014-16 to have any effect on our financial position, results of operations or cash flows.
ASU 2014-15
In August 2014, the FASB issued ASU No. 2014-15, "Presentation of Financial Statements - Going Concern (Subtopic 205-40)". ASU 2014-15 provides guidance related to management's responsibility to evaluate whether there is substantial doubt about an entity's ability to continue as a going concern and to provide related footnote disclosure. ASU 2014-15 is effective for annual periods ending after December 15, 2016, and for interim and annual periods thereafter. Early application is permitted. We do not expect the adoption of ASU 2014-15 to have a material effect on our financial position, results of operations or cash flows.
ASU 2014-12
In June 2014, the FASB issued ASU No. 2014-12, “Compensation – Stock Compensation (Topic 718): Accounting for Share-Based Payments When the Terms of an Award Provide That a Performance Target Could Be Achieved after the Requisite Service Period.” This ASU requires that a performance target that affects vesting and that could be achieved after the requisite service period be treated as a performance condition. ASU 2014-12 is effective for annual periods beginning after December 15, 2015, and interim periods within annual periods beginning after December 15, 2015. We do not expect the adoption of ASU 2014-12 to have a material effect on our financial position, results of operations or cash flows.
ASU 2014-09
In May 2014, the FASB issued ASU No. 2014-09, “Revenue from Contracts with Customers (Topic 606).” ASU 2014-09 affects any entity using U.S. GAAP that either enters into contracts with customers to transfer goods or services or enters into contracts for the transfer of nonfinancial assets unless those contracts are within the scope of other standards (e.g., insurance contracts or lease contracts). ASU 2014-09 is effective for annual periods beginning after December 15, 2016, and interim periods within annual periods beginning after December 15, 2016. We are still evaluating the effect of the adoption of ASU 2014-09.
ASU 2014-08
In April 2014, the FASB issued ASU No. 2014-08, "Presentation of Financial Statements (Topic 205) and Property, Plant, and Equipment (Topic 360) and Reporting Discontinued Operations and Disclosures of Disposals of Components of an Entity." ASU 2014-08 amends the definition for what types of asset disposals are to be considered discontinued operations, as well as amending the required disclosures for discontinued operations and assets held for sale. ASU 2014-08 is effective for annual periods beginning on or after December 15, 2014, and interim periods within annual periods beginning on or after December 15, 2014. We do not expect the adoption of ASU 2014-08 to have a material effect on our financial position, results of operations or cash flows.
ASU 2013-11
In July 2013, the FASB issued ASU No. 2013-11, “Presentation of an Unrecognized Tax Benefit When a Net Operating Loss Carryforward, a Similar Tax Loss, or a Tax Credit Carryforward Exists.” ASU 2013-11 amends the guidance related to the presentation of unrecognized tax benefits and allows for the reduction of a deferred tax asset for a net operating loss (“NOL”) carryforward whenever the NOL or tax credit carryforward would be available to reduce the additional taxable income or tax due if the tax position is disallowed. ASU 2013-11 is effective for annual and interim periods for fiscal years beginning after December 15, 2013. The adoption of ASU 2013-11 in January 2014 did not have any effect on our financial position, results of operations or cash flows.
| Note 4. | Inventories |
Inventories consisted of the following (in thousands):
|
December 31,
|
||||||||
|
2014
|
2013
|
|||||||
|
Raw materials
|
$
|
4,414
|
$
|
4,934
|
||||
|
Work in process
|
2,781
|
3,313
|
||||||
|
Finished goods
|
8,986
|
5,927
|
||||||
|
Packaging materials
|
627
|
442
|
||||||
|
Promotional merchandise
|
1,531
|
1,539
|
||||||
|
Pub food, beverages and supplies
|
632
|
484
|
||||||
|
$
|
18,971
|
$
|
16,639
|
|||||
Work in process is beer held in fermentation tanks prior to the filtration and packaging process.
| Note 5. | Other Current Assets |
Other current assets consisted of the following (in thousands):
|
December 31,
|
||||||||
|
2014
|
2013
|
|||||||
|
Deposits paid to keg lessor
|
$
|
2,336
|
$
|
2,228
|
||||
|
Prepaid property taxes
|
367
|
215
|
||||||
|
Prepaid insurance
|
369
|
332
|
||||||
|
Income tax receivable
|
250
|
68
|
||||||
|
Other
|
1,091
|
560
|
||||||
|
$
|
4,413
|
$
|
3,403
|
|||||
| Note 6. | Property, Equipment and Leasehold Improvements |
Property, equipment and leasehold improvements consisted of the following (in thousands):
|
December 31,
|
||||||||
|
2014
|
2013
|
|||||||
|
Brewery equipment
|
$
|
101,258
|
$
|
93,711
|
||||
|
Buildings
|
55,254
|
55,051
|
||||||
|
Land and improvements
|
7,621
|
7,617
|
||||||
|
Furniture, fixtures and other equipment
|
12,501
|
9,895
|
||||||
|
Leasehold improvements
|
7,058
|
6,592
|
||||||
|
Vehicles
|
72
|
135
|
||||||
|
Construction in progress
|
4,528
|
2,052
|
||||||
|
188,292
|
175,053
|
|||||||
|
Less accumulated depreciation and amortization
|
(77,942
|
)
|
(70,860
|
)
|
||||
|
$
|
110,350
|
$
|
104,193
|
|||||
| Note 7 | Goodwill and Intangible and Other Assets |
Goodwill
Goodwill totaled $12.9 million at both December 31, 2014 and 2013 and there were no changes to the goodwill balance during 2014, 2013 or 2012. There are no impairment losses netted against the goodwill balance.
Intangible and Other Assets
Intangible and other assets and the related accumulated amortization are as follows (in thousands):
|
December 31,
|
||||||||
|
2014
|
2013
|
|||||||
|
Trademarks and domain name
|
$
|
14,429
|
$
|
14,429
|
||||
|
Recipes
|
700
|
700
|
||||||
|
Distributor agreements
|
2,200
|
2,200
|
||||||
|
Accumulated amortization
|
(953
|
)
|
(807
|
)
|
||||
|
1,247
|
1,393
|
|||||||
|
Non-compete agreements
|
440
|
440
|
||||||
|
Accumulated amortization
|
(374
|
)
|
(286
|
)
|
||||
|
66
|
154
|
|||||||
|
Favorable contracts
|
31
|
31
|
||||||
|
Accumulated amortization
|
(31
|
)
|
(31
|
)
|
||||
|
-
|
-
|
|||||||
|
Other
|
250
|
250
|
||||||
|
Accumulated amortization
|
(208
|
)
|
(201
|
)
|
||||
|
42
|
49
|
|||||||
|
16,484
|
16,725
|
|||||||
|
Promotional merchandise
|
1,074
|
968
|
||||||
|
$
|
17,558
|
$
|
17,693
|
|||||
Amortization expense was as follows (in thousands):
|
Year Ended December 31,
|
||||||||||||
|
2014
|
2013
|
2012
|
||||||||||
|
Amortization expense
|
$
|
241
|
$
|
247
|
$
|
253
|
||||||
Estimated amortization expense to be recorded for the next five fiscal years and thereafter is as follows (in thousands):
|
2015
|
$
|
223
|
||
|
2016
|
154
|
|||
|
2017
|
154
|
|||
|
2018
|
153
|
|||
|
2019
|
149
|
|||
|
Thereafter
|
522
|
|||
|
$
|
1,355
|
| Note 8. | Debt and Capital Lease Obligations |
Long-term debt and capital lease obligations consisted of the following (in thousands):
|
December 31,
|
||||||||
|
2014
|
2013
|
|||||||
|
Term loan, due September 30, 2023
|
$
|
10,421
|
$
|
10,800
|
||||
|
Line of credit, due October 31, 2018
|
3,000
|
-
|
||||||
|
Promissory notes payable to related parties, all due July 1, 2015
|
600
|
600
|
||||||
|
Premium on promissory notes
|
63
|
184
|
||||||
|
Note with affiliated party, due November 15, 2014
|
-
|
165
|
||||||
|
Capital lease obligations for equipment
|
793
|
11
|
||||||
|
14,877
|
11,760
|
|||||||
|
Less current portion
|
(1,157
|
)
|
(710
|
)
|
||||
|
$
|
13,720
|
$
|
11,050
|
|||||
Required principal payments on outstanding debt obligations as of December 31, 2014 for the next five years and thereafter are as follows (in thousands):
|
Term
Loan
|
Line of
Credit
|
Promissory
Notes
|
Capital
Lease
Obligations
|
|||||||||||||
|
2015
|
$
|
377
|
$
|
-
|
$
|
600
|
$
|
139
|
||||||||
|
2016
|
391
|
-
|
-
|
134
|
||||||||||||
|
2017
|
408
|
-
|
-
|
133
|
||||||||||||
|
2018
|
422
|
3,000
|
-
|
133
|
||||||||||||
|
2019
|
442
|
-
|
-
|
133
|
||||||||||||
|
Thereafter
|
8,381
|
-
|
-
|
200
|
||||||||||||
|
10,421
|
3,000
|
600
|
872
|
|||||||||||||
|
Amount representing interest
|
-
|
-
|
-
|
79
|
||||||||||||
|
$
|
10,421
|
$
|
3,000
|
$
|
600
|
$
|
793
|
|||||||||
Term Loan and Line of Credit
We have a loan agreement (as amended, the “Loan Agreement”) with Bank of America, N.A., which presently comprises a $22.0 million revolving line of credit (“Line of Credit”), including provisions for cash borrowings and up to $2.5 million notional amount of letters of credit, and a $10.4 million term loan (“Term Loan”). We may draw upon the Line of Credit for working capital and general corporate purposes until expiration on October 31, 2018. The maturity date of the Term Loan is September 30, 2023. At December 31, 2014, we had $3.0 million outstanding under the Line of Credit.
Under the Loan Agreement, interest accrues at an annual rate based on the London Inter-Bank Offered Rate (“LIBOR”) Daily Floating Rate plus a marginal rate. The marginal rate varies from 1.00% to 2.25% based on our funded debt ratio. At December 31, 2014, our marginal rate was 1.00%, resulting in an annual interest rate of 1.16%. Accrued interest for the Line of Credit and the Term Loan is due and payable monthly.
In connection with an amendment to the Loan Agreement on November 15, 2013, we paid down the Term Loan by $0.6 million in order to bring the outstanding principal balance to $10.8 million to achieve an 80% loan to value ratio on certain property securing the Loan Agreement. Accrued interest for the Term Loan is due and payable monthly. Principal payments are due monthly in accordance with an agreed-upon schedule set forth in the Loan Agreement, with any unpaid principal balance and unpaid accrued interest due and payable on September 30, 2023.
The November 15, 2013 amendment also provided for the approval of acquisitions within the same line of business as long as we remain in compliance with the financial covenants of the Loan Agreement and there is at least $5.0 million of availability remaining on the Line of Credit following the acquisition. In addition, the amendment released our Woodinville, Washington property as collateral and, accordingly, only our Oregon brewery is collateral on the Term Loan.
Under the Loan Agreement, a quarterly fee on the unused portion of the Line of Credit, including the undrawn amount of the related standby letter of credit, varies from 0.15% to 0.30% based upon our funded debt ratio. At December 31, 2014, the quarterly fee was 0.15% and the fee totaled the following (in thousands):
|
Year Ended December 31,
|
||||||||||||
|
2014
|
2013
|
2012
|
||||||||||
|
Loan Agreement fee
|
$
|
33
|
$
|
33
|
$
|
34
|
||||||
An annual fee is payable in advance on the notional amount of each standby letter of credit issued and outstanding multiplied by an applicable rate ranging from 1.00% to 2.00%. We had no letters of credit outstanding during 2014, 2013 or 2012.
We were in compliance with all applicable contractual financial covenants of the Loan Agreement at December 31, 2014. These financial covenants under the Loan Agreement are measured on a trailing four-quarter basis. We are required to maintain a funded debt ratio of up to 3.0 to 1 and a fixed charge coverage ratio above 1.25 to 1.
The Loan Agreement is secured by substantially all of our personal property and by our Oregon brewery (“Collateral”). In addition, we are restricted in our ability to declare or pay dividends, repurchase outstanding common stock, incur additional debt or enter into any agreement that would result in a change in control.
Promissory Notes Payable to Individual Lenders
We assumed an obligation for promissory notes signed in connection with the acquisition of commercial real estate related to our Portland, Oregon brewery. These notes were separately executed with three individuals, but with substantially the same terms and conditions. Each promissory note is secured by a deed of trust on the commercial real estate. The outstanding note balance to each lender as of December 31, 2014 and 2013 was $200,000, with each note bearing a fixed interest rate of 24% per annum through June 30, 2010, after which time the rate increased to 26.9% per annum as a result of a one-time adjustment reflecting the change in the consumer price index from the date of issue, July 1, 2005, to July 1, 2010. The promissory notes are carried at the total of stated value plus a premium reflecting the difference between our incremental borrowing rate and the stated note rate. The effective interest rate for each note is 6.31%. Each note matures on the earlier of the individual lender’s death or July 1, 2015, with prepayment of principal not allowed under the notes’ terms. Interest payments are due and payable monthly.
Note with Affiliated Party
In connection with the acquisition of Kona Brewing Company (“KBC”), we assumed an obligation for a promissory note payable (“Related Party Note”) to a counterparty that was a significant KBC shareholder and remains a shareholder of Craft Brew Alliance, Inc. The Related Party Note was secured by the equipment comprising a photovoltaic cell generation system (“photovoltaic system”) installed at our brewery located in Kailua-Kona, Hawaii. Accrued interest on the Related Party Note was due and payable monthly at a fixed interest rate of 4.75%, with monthly loan payments of $16,129. Any unpaid principal balance and unpaid accrued interest under the Related Party Note was due and payable on November 15, 2014. As of December 31, 2014, no amounts remained due pursuant to the Related Party Note.
| Note 9. | Derivative Financial Instruments |
Interest Rate Swap Contract
Our risk management objectives are to ensure that business and financial exposures to risk that have been identified and measured are minimized using the most effective and efficient methods to reduce, transfer and, when possible, eliminate such exposures. Operating decisions contemplate associated risks and management strives to structure proposed transactions to avoid or reduce risk whenever possible.
We have assessed our vulnerability to certain business and financial risks, including interest rate risk associated with our variable-rate long-term debt. To mitigate this risk, effective January 23, 2014, we entered into an interest rate swap contract with Bank of America, N.A. (“BofA”) for 75% of the Term Loan balance, to hedge the variability of interest payments associated with our variable-rate borrowings under our Term Loan with BofA. On July 1, 2013 our previous swap contract terminated. The current swap contract terminates on September 29, 2023, and had a total notional value of $7.8 million as of December 31, 2014. Through this swap agreement, we pay interest at a fixed rate of 2.86% and receive interest at a floating-rate of the one-month LIBOR, which was 0.16% at December 31, 2014. Since the interest rate swap hedges the variability of interest payments on variable rate debt with similar terms, it qualifies for cash flow hedge accounting treatment. As of December 31, 2014, unrealized net losses of $503,000 were recorded in Accumulated other comprehensive loss as a result of this hedge. The effective portion of the gain or loss on the derivative is reclassified into Interest expense in the same period during which we record Interest expense associated with the Term Loan. There was no hedge ineffectiveness during 2014, 2013 or 2012.
The fair value of our derivative instrument is as follows (in thousands):
|
Fair Value of Derivative Instrument
|
||||||||
|
December 31,
|
||||||||
|
2014
|
2013
|
|||||||
|
Fair value of interest rate swap
|
$
|
(503
|
)
|
$
|
-
|
|||
The effect of our interest rate swap contract that was accounted for as a derivative instrument on our Consolidated Statements of Income was as follows (in thousands):
|
Derivatives in Cash
Flow Hedging
Relationships
|
Amount of Gain/(Loss)
Recognized in Accumulated
OCI (Effective Portion)
|
Location of Loss Reclassified
from Accumulated OCI into
Income (Effective Portion)
|
Amount of Loss Reclassified
from Accumulated OCI into
Income (Effective Portion)
|
||||||
|
Year Ended
December 31,
|
|||||||||
|
2014
|
$
|
(503
|
)
|
Interest expense
|
$
|
205
|
|||
|
2013
|
$
|
219
|
Interest expense
|
$
|
188
|
||||
|
2012
|
$
|
353
|
Interest expense
|
$
|
387
|
||||
| Note 10. | Fair Value Measurements |
Factors used in determining the fair value of our financial assets and liabilities are summarized into three broad categories:
| · | Level 1 – quoted prices in active markets for identical securities as of the reporting date; |
| · | Level 2 – other significant directly or indirectly observable inputs, including quoted prices for similar securities, interest rates, prepayment speeds and credit risk; and |
| · | Level 3 – significant inputs that are generally less observable than objective sources, including our own assumptions in determining fair value. |
The factors or methodology used for valuing securities are not necessarily an indication of the risk associated with investing in those securities.
The following tables summarize assets and (liabilities) measured at fair value on a recurring basis (in thousands):
|
Fair Value at December 31, 2014
|
Level 1
|
Level 2
|
Level 3
|
Total
|
||||||||||||
|
Interest rate swap
|
$
|
-
|
$
|
(503
|
)
|
$
|
-
|
$
|
(503
|
)
|
||||||
|
Fair Value at December 31, 2013
|
Level 1
|
Level 2
|
Level 3
|
Total
|
||||||||||||
|
Money market funds
|
$
|
2,650
|
$
|
-
|
$
|
-
|
$
|
2,650
|
||||||||
We did not have any financial liabilities recorded at fair value on a recurring basis at December 31, 2013.
The fair value of our money market funds was based on quoted prices from our financial institution. The fair value of our interest rate swap was based on quarterly statements from the issuing bank. There were no changes to our valuation techniques during 2014, 2013 or 2012.
We believe the carrying amounts of Cash, Accounts receivable, Other current assets, Accounts payable, Accrued salaries, wages and payroll taxes and Other accrued expenses are a reasonable approximation of the fair value of those financial instruments because of the nature of the underlying transactions and the short-term maturities involved.
We had fixed-rate debt outstanding as follows (in thousands):
|
December 31,
|
||||||||
|
2014
|
2013
|
|||||||
|
Fixed-rate debt on balance sheet
|
$
|
1,456
|
$
|
960
|
||||
|
Fair value of fixed-rate debt
|
$
|
1,513
|
$
|
985
|
||||
We calculate the estimated fair value of our fixed-rate debt using a discounted cash flow methodology. Using estimated current interest rates based on a similar risk profile and duration (Level 2), the fixed cash flows are discounted and summed to compute the fair value of the debt.
| Note 11. | Segment Results and Concentrations |
Net sales, Gross profit and gross margin information by segment was as follows (dollars in thousands):
|
2014
|
Beer
Related
|
Pubs
|
Total
|
|||||||||
|
Net sales
|
$
|
173,687
|
$
|
26,335
|
$
|
200,022
|
||||||
|
Gross profit
|
$
|
55,174
|
$
|
3,536
|
$
|
58,710
|
||||||
|
Gross margin
|
31.8
|
%
|
13.4
|
%
|
29.4
|
%
|
||||||
|
2013
|
||||||||||||
|
Net sales
|
$
|
154,830
|
$
|
24,350
|
$
|
179,180
|
||||||
|
Gross profit
|
$
|
47,055
|
$
|
3,206
|
$
|
50,261
|
||||||
|
Gross margin
|
30.4
|
%
|
13.2
|
%
|
28.1
|
%
|
||||||
|
2012
|
||||||||||||
|
Net sales
|
$
|
145,670
|
$
|
23,617
|
$
|
169,287
|
||||||
|
Gross profit
|
$
|
46,341
|
$
|
3,685
|
$
|
50,026
|
||||||
|
Gross margin
|
31.8
|
%
|
15.6
|
%
|
29.6
|
%
|
||||||
The segments use many of the same assets. For internal reporting purposes, we do not allocate assets by segment and, therefore, no asset by segment information is provided to our chief operating decision maker.
In preparing this financial information, certain expenses were allocated between the segments based on management estimates, while others were based on specific factors such as headcount. These factors can have a significant impact on the amount of gross profit for each segment. While we believe we have applied a reasonable methodology, assignment of other reasonable cost allocations to each segment could result in materially different segment gross profit.
Sales to wholesalers through the A-B Distributor Agreement represented the following percentage of our Sales:
|
Year Ended December 31,
|
||||||||||
|
2014
|
2013
|
2012
|
||||||||
|
82.1
|
% |
82.6
|
%
|
81.1
|
%
|
|||||
Receivables from A-B represented the following percentage of our Accounts receivable balance:
|
December 31
|
||||||
|
2014
|
2013
|
|||||
|
66.8
|
% |
74.4
|
%
|
|||
All of our long-term assets are located in the U.S. and Sales outside of the U.S. are insignificant.
| Note 12. | Stock-Based Plans and Stock-Based Compensation |
We maintain several stock incentive plans under which stock-based awards are, or have been, granted to employees and non-employee directors. We issue new shares of common stock upon exercise or settlement of the stock-based awards. All of our stock plans are administered by the Compensation Committee of our Board of Directors, which determines the grantees, the number of shares of common stock for which awards may be exercised or settled and the exercise or grant prices of such shares, among other terms and conditions of stock-based awards under our stock-based plans.
With the approval of the 2014 Stock Incentive Plan (the “2014 Plan”) in May 2014, no further grants of stock-based awards may be made under our 2002 Stock Option Plan (the “2002 Plan”), our 2007 Stock Incentive Plan (the “2007 Plan”) or our 2010 Stock Incentive Plan (the “2010 Plan”). However, the provisions of these plans will remain in effect until all outstanding awards are exercised, settled or terminated. Shares subject to terminated awards under the 2002 Plan, the 2007 Plan and the 2010 Plan are not added to the pool of shares available for grant pursuant to the 2014 Plan.
2014 Stock Incentive Plan
The 2014 Plan provides for grants of stock options, restricted stock, restricted stock units, performance awards and stock appreciation rights, as well as other stock-based awards. While incentive stock options may only be granted to employees, awards other than incentive stock options may be granted to employees, non-employee directors and outside consultants. Options granted to our employees have generally been subject to a five-year vesting period. Vested options generally remain exercisable until ten years following the date of grant. The exercise price of stock options must be at least equal to the fair market value per share of our common stock on the date of grant. A maximum of 1,000,000 shares of common stock are authorized for issuance under the 2014 Plan. As of December 31, 2014, there were 988,347 shares available for future awards pursuant to the 2014 Plan.
Terms of awards granted pursuant to the 2002 Plan, the 2007 Plan and the 2010 Plan were similar to the terms of awards granted pursuant to the 2014 Plan.
Stock-Based Compensation
Certain information regarding our stock-based compensation was as follows (in thousands, except per share amounts):
|
Year Ended December 31,
|
||||||||||||
|
2014
|
2013
|
2012
|
||||||||||
|
Weighted average per share fair value of stock options granted
|
$
|
6.89
|
$
|
4.90
|
$
|
4.84
|
||||||
|
Intrinsic value of stock options exercised
|
932
|
554
|
40
|
|||||||||
|
Intrinsic value of fully-vested stock awards granted
|
288
|
1,039
|
366
|
|||||||||
Stock-based compensation expense was recognized in our Consolidated Statements of Income as follows (in thousands):
|
Year Ended December 31,
|
||||||||||||
|
2014
|
2013
|
2012
|
||||||||||
|
Selling, general and administrative expense
|
$
|
666
|
$
|
464
|
$
|
547
|
||||||
|
Cost of sales
|
118
|
85
|
-
|
|||||||||
|
Total stock-based compensation expense
|
$
|
784
|
$
|
549
|
$
|
547
|
||||||
We amortize stock-based compensation on a straight-line basis over the vesting period of the individual awards, which is the requisite service period, with estimated forfeitures considered.
At December 31, 2014, we had total unrecognized stock-based compensation expense of $1.7 million, which will be recognized over the weighted average remaining vesting period of 3.2 years.
The following weighted average assumptions were utilized in determining fair value pursuant to the Black-Scholes option pricing model:
|
Year Ended December 31,
|
||||||||||||
|
2014
|
2013
|
2012
|
||||||||||
|
Risk-free interest rate
|
2.11
|
%
|
1.61
|
%
|
1.46
|
%
|
||||||
|
Dividend yield
|
0.0
|
%
|
0.0
|
%
|
0.0
|
%
|
||||||
|
Expected life
|
7.34 years
|
7.85 years
|
8.15 years
|
|||||||||
|
Volatility
|
60.20
|
%
|
58.91
|
%
|
60.39
|
%
|
||||||
The risk-free rate used is based on the U.S. Treasury yield curve over the estimated term of the options granted. Expected lives were estimated based on historical exercise data. The expected volatility is calculated based on the historical volatility of our common stock.
Stock-Based Awards Plan Activity
Stock Option Activity
Stock option activity for the year ended December 31, 2014 was as follows:
|
Options Outstanding
|
Weighted Average Exercise Price
|
|||||||
|
Outstanding at December 31, 2013
|
298,954
|
$
|
6.73
|
|||||
|
Granted
|
141,955
|
11.17
|
||||||
|
Exercised
|
(104,804
|
)
|
4.65
|
|||||
|
Cancelled
|
(31,074
|
)
|
8.33
|
|||||
|
Forfeited
|
-
|
-
|
||||||
|
Outstanding at December 31, 2014
|
305,031
|
9.35
|
||||||
Certain information regarding options outstanding as of December 31, 2014 was as follows:
|
Options
Outstanding
|
Options
Exercisable
|
|||||||
|
Number
|
305,031
|
53,390
|
||||||
|
Weighted average exercise price
|
$
|
9.35
|
$
|
8.00
|
||||
|
Aggregate intrinsic value
|
$
|
1,248,000
|
$
|
288,000
|
||||
|
Weighted average remaining contractual term
|
8.5 years
|
7.5 years
|
||||||
Performance-Based Stock Grants
During the second quarter of each of 2014, 2013, 2012 and 2011, we granted performance-based common stock awards to selected executives under the 2010 Plan, with vesting contingent upon meeting various company-wide performance goals. The performance goals were tied to target amounts of adjusted EBITDA and Net sales for each of the three-year periods ending December 31, 2015, 2014 and 2013, respectively; for the awards in 2014, the measurement period is the 11 quarters ending December 31, 2016. The awards earned on the 2014, 2013 and 2012 grants will range from zero to 125% of the targeted number of performance shares for the performance periods ending March 31, 2017, 2016 and 2015, respectively. For the 2011 grant, 50% of the targeted number of performance shares were earned for the performance period ended March 31, 2014. Awards, if earned, are paid in shares of common stock.
Activity related to performance-based awards was as follows (in shares):
|
2014
Awards
|
2013
Awards
|
2012
Awards
|
2011
Awards
|
Total
|
||||||||||||||||
|
Granted (target amount)
|
77,443
|
50,347
|
42,450
|
57,145
|
227,385
|
|||||||||||||||
|
Vested
|
-
|
-
|
-
|
(28,571
|
)
|
(28,571
|
)
|
|||||||||||||
|
Canceled due to termination of employee
|
(12,561
|
)
|
(16,999
|
)
|
-
|
-
|
(29,560
|
)
|
||||||||||||
|
Canceled due to failure to meet performance goals
|
-
|
-
|
-
|
(28,574
|
)
|
(28,574
|
)
|
|||||||||||||
|
Not expected to vest due to failure to meet performance goals
|
-
|
-
|
(22,938
|
)
|
-
|
(22,938
|
)
|
|||||||||||||
|
Expected to vest as of December 31, 2014
|
64,882
|
33,348
|
19,512
|
-
|
117,742
|
|||||||||||||||
Stock Grants
On the date of our Annual Meeting of Shareholders, each non-employee director received an annual grant of fully-vested shares of our common stock with a fair value of $30,000 in 2014 and $25,000 in each of 2013 and 2012. The 2014 amount included 2,804 fully-vested shares of common stock granted to each of our seven non-employee directors for a total of 19,628 shares.
| Note 13. | Earnings Per Share |
The following table reconciles shares used for basic and diluted earnings per share (“EPS”) and provides certain other information (in thousands):
|
Year Ended December 31,
|
||||||||||||
|
2014
|
2013
|
2012
|
||||||||||
|
Weighted average common shares for basic EPS
|
19,038
|
18,923
|
18,862
|
|||||||||
|
Dilutive effect of stock-based awards
|
88
|
119
|
72
|
|||||||||
|
Shares used for diluted EPS
|
19,126
|
19,042
|
18,934
|
|||||||||
|
Stock-based awards not included in diluted per share calculations as they would be antidilutive
|
85
|
1
|
124
|
|||||||||
| Note 14. | Income Taxes |
All of our income is generated in the U.S. The components of income tax expense were as follows (in thousands):
|
Year Ended December 31,
|
||||||||||||
|
2014
|
2013
|
2012
|
||||||||||
|
Current federal
|
$
|
1,079
|
$
|
746
|
$
|
292
|
||||||
|
Current state
|
234
|
184
|
201
|
|||||||||
|
1,313
|
930
|
493
|
||||||||||
|
Deferred federal
|
595
|
305
|
1,116
|
|||||||||
|
Deferred state
|
114
|
69
|
342
|
|||||||||
|
709
|
374
|
1,458
|
||||||||||
|
$
|
2,022
|
$
|
1,304
|
$
|
1,951
|
|||||||
Income tax expense differs from the amount computed by applying the statutory federal income tax rate to income before income taxes as follows (in thousands):
|
Year Ended December 31,
|
||||||||||||
|
2014
|
2013
|
2012
|
||||||||||
|
Provision at U.S. statutory rate
|
$
|
1,734
|
$
|
1,109
|
$
|
1,522
|
||||||
|
State taxes, net of federal benefit
|
217
|
182
|
148
|
|||||||||
|
Permanent differences, primarily meals and entertainment
|
304
|
198
|
232
|
|||||||||
|
Domestic production activities deduction
|
(113
|
)
|
(98
|
)
|
-
|
|||||||
|
Tax credits
|
(120
|
)
|
(87
|
)
|
(104
|
)
|
||||||
|
Increase to deferred tax liability tax rate
|
-
|
-
|
153
|
|||||||||
|
$
|
2,022
|
$
|
1,304
|
$
|
1,951
|
|||||||
Significant components of our deferred tax assets and liabilities were as follows (in thousands):
|
December 31,
|
||||||||
|
2014
|
2013
|
|||||||
|
Deferred tax assets
|
||||||||
|
Net operating losses and alternative minimum tax credit carryforwards
|
$
|
364
|
$
|
470
|
||||
|
Accrued salaries and severance
|
1,150
|
922
|
||||||
|
Other
|
1,153
|
918
|
||||||
|
2,667
|
2,310
|
|||||||
|
Deferred tax liabilities
|
||||||||
|
Property, equipment and leasehold improvements
|
(13,139
|
)
|
(12,158
|
)
|
||||
|
Intangible assets
|
(6,240
|
)
|
(6,323
|
)
|
||||
|
Other
|
(188
|
)
|
(203
|
)
|
||||
|
(19,567
|
)
|
(18,684
|
)
|
|||||
|
$
|
(16,900
|
)
|
$
|
(16,374
|
)
|
|||
As of December 31, 2014, included in our net operating losses and alternative minimum tax credit carryforwards were the following (in thousands):
|
State NOLs, tax effected
|
$
|
32
|
||
|
Federal alternative minimum tax credit carryforwards
|
$
|
332
|
In assessing the realizability of our deferred tax assets, we consider future taxable income expected to be generated by the projected differences between financial statement depreciation and tax depreciation, cumulative earnings generated to date and other evidence available to us. Based upon this consideration, we assessed that all of our deferred taxes are more likely than not to be realized, and, as such, we have not recorded a valuation allowance as of December 31, 2014 or 2013.
There were no unrecognized tax benefits as of December 31, 2014 or 2013 and we do not anticipate significant changes to our unrecognized tax benefits within the next twelve months.
Our major tax jurisdictions include U.S. federal and various U.S. states. Tax years that remain open for examination by the IRS include the years from 2011 through 2014. Tax years remaining open in states where we have a significant presence range from 2010 to 2014. In addition, tax years from 1998 to 2004 and 2008 are eligible for examination by the IRS and state tax jurisdictions due to our utilization of the NOLs generated in these tax years in our tax returns.
| Note 15. | Employee Benefit Plans |
We sponsor a defined contribution 401(k) plan for all employees 18 years or older. Employee contributions may be made on a before-tax basis, limited by IRS regulations. For the years ended December 31, 2014, 2013 and 2012, we matched 50% of the employee’s contributions up to 6% of eligible compensation. Eligibility for the matching contribution in all years began after the participant had worked a minimum of three months. Our matching contributions to the plan vest ratably over five years of service by the employee. During 2014, we used approximately $165,000 of previously forfeited matching contributions to fund current matching contributions, which decreased our 2014 expense. We recognized expense associated with matching contributions as follows (in thousands):
|
Year Ended December 31,
|
||||||||||||
|
2014
|
2013
|
2012
|
||||||||||
|
401(k) expense
|
$
|
632
|
$
|
744
|
$
|
705
|
||||||
| Note 16. | Commitments |
Operating Leases
We lease office space, restaurant and production facilities, warehouse and storage space, land and equipment under operating leases that expire at various dates through the year ending December 31, 2047. Certain leases contain renewal options for varying periods and escalation clauses for adjusting rent to reflect changes in price indices. Certain leases require us to pay for insurance, taxes and maintenance applicable to the leased property. Under the terms of the land lease for our New Hampshire Brewery, we hold a first right of refusal to purchase the property should the lessor decide to sell the property.
Minimum aggregate future lease payments under non-cancelable operating leases as of December 31, 2014 are as follows (in thousands):
|
2015
|
$
|
1,839
|
||
|
2016
|
1,630
|
|||
|
2017
|
1,484
|
|||
|
2018
|
1,285
|
|||
|
2019
|
1,237
|
|||
|
Thereafter
|
11,404
|
|||
|
$
|
18,879
|
Rent expense under all operating leases, including short-term rentals as well as cancelable and noncancelable operating leases, gross, was as follows (in thousands):
|
Year Ended December 31,
|
||||||||||||
|
2014
|
2013
|
2012
|
||||||||||
|
Rent expense
|
$
|
2,323
|
$
|
2,554
|
$
|
2,665
|
||||||
We sub-lease corporate office space to an unrelated party pursuant to a 5-year lease that began in February 2011. The lessee also leased this space pursuant to a previous lease agreement in 2010 and 2009. In December 2014, the lease agreement was amended to extend the lease through 2025, with an option to cancel in 2020 with 180 days’ written notice and a fee of $150,000. We recognized rental income related to the sublease, which was recorded as an offset to rent expense in our Consolidated Statements of Income, as follows (in thousands):
|
Year Ended December 31,
|
||||||||||||
|
2014
|
2013
|
2012
|
||||||||||
|
Rental income
|
$
|
269
|
$
|
266
|
$
|
254
|
||||||
Future minimum lease rentals pursuant to this agreement as of December 31, 2014 are as follows (in thousands):
|
2015
|
$
|
369
|
||
|
2016
|
369
|
|||
|
2017
|
369
|
|||
|
2018
|
369
|
|||
|
2019
|
369
|
|||
|
Thereafter
|
2,219
|
|||
|
$
|
4,064
|
We lease our headquarters office space, restaurant and storage facilities located in Portland, land and certain equipment from two limited liability companies, both of whose members include our current Board Chair and a nonexecutive officer. Lease payments to these lessors were as follows (in thousands) and are included in the Rent expense under all operating leases above:
|
Year Ended December 31,
|
|||||||||||
|
2014
|
2013
|
2012
|
|||||||||
|
$
|
125
|
$
|
127
|
$
|
125
|
||||||
The lease for the headquarters office space and restaurant facility expires in 2034, with an extension at our option for two 10-year periods, while the lease for the other facilities, land and equipment expires in 2017 with an extension at our option for two five-year periods. We hold a right to purchase the headquarters office space and restaurant facility at the greater of $2.0 million or the fair market value of the property as determined by a contractually established appraisal method. The right to purchase is not valid in the final year of the lease term or in each of the final years of the renewal terms, as applicable. All lease terms are considered to be arm’s-length transactions.
We hold lease and sublease obligations for certain office space and the land underlying the brewery and pub location in Kona, Hawaii, with a company whose owners include a shareholder who owns more than 5% of our common stock and a nonexecutive officer. The sublease contracts expire on various dates through 2020, with an extension at our option for two five-year periods. Lease payments to this lessor were as follows (in thousands) and are included in the Rent expense under all operating leases above:
|
Year Ended December 31,
|
|||||||||||
|
2014
|
2013
|
2012
|
|||||||||
|
$
|
499
|
$
|
428
|
$
|
402
|
||||||
All lease terms are considered to be arm’s-length transactions.
Purchase and Sponsorship Commitments
We periodically enter into commitments to purchase certain raw materials in the normal course of business. Furthermore, we have entered into purchase commitments and commodity contracts to ensure we have the necessary supply of malt and hops to meet future production requirements. Certain of the malt and hop commitments are for crop years through 2019. We believe that malt and hop commitments in excess of future requirements, if any, will not have a material impact on our financial condition or results of operations. We may take delivery of the commodities in excess of our requirements or make payments against the purchase commitments earlier than contractually obligated, which means our cash outlays in any particular year may exceed or be less than the commitment amount disclosed.
In certain cases, we have executed agreements with selected vendors to source our requirements for specific malt and hop varieties for the years ending December 31, 2015, 2016, 2017, 2018 and 2019; however, either the quantity to be delivered or the full price for the commodity has not been established at the present time. To the extent the commitment is not measurable or has not been fixed, that portion of the commitment has been excluded from the table below.
We have entered into multi-year sponsorship and promotional commitments with certain professional sports teams and entertainment companies. Generally, in exchange for our sponsorship consideration, we post signage and provide other promotional materials at the site or the event. The terms of these sponsorship commitments expire at various dates through May 31, 2018.
Aggregate future payments under purchase and sponsorship commitments as of December 31, 2014 are as follows (in thousands):
|
Purchase
Obligations
|
Sponsorship
Obligations
|
Total
|
||||||||||
|
2015
|
$
|
20,822
|
$
|
1,407
|
$
|
22,229
|
||||||
|
2016
|
4,794
|
918
|
5,712
|
|||||||||
|
2017
|
3,533
|
570
|
4,103
|
|||||||||
|
2018
|
2,468
|
450
|
2,918
|
|||||||||
|
2019
|
1,521
|
-
|
1,521
|
|||||||||
|
Thereafter
|
1,572
|
-
|
1,572
|
|||||||||
|
$
|
34,710
|
$
|
3,345
|
$
|
38,055
|
|||||||
| Note 17. | Related-Party Transactions |
For additional related party transactions, see Notes 8 and 16.
As of December 31, 2014 and 2013, A-B owned approximately 31.7% and 32.0%, respectively, of our outstanding common stock.
Modifications to A-B Agreements
In connection with the sale of our interest in FSB, we modified two agreements with A-B originally executed in 2004: the Master Distributor Agreement (as amended and restated, the “A-B Distributor Agreement”), which was amended primarily to lower our margin fees (“Margin Fees”) to be paid to A‑B; and the Exchange and Recapitalization Agreement (as amended and restated, the “Exchange Agreement”).
The modifications to the A-B Distributor Agreement reduced the Margin Fees to be paid to A‑B for beer sold through A-B or the associated A‑B distribution network, except for beer sold in qualifying territories, as defined, from May 1, 2011 (the “Commencement Date”) until December 31, 2018, to $0.25 per case equivalent from $0.74 per case equivalent. Beer sold through A-B or the associated A-B distribution network in qualifying territories, as defined, was exempt from Margin Fees until September 30, 2013, and thereafter are assessed Margin Fees at the $0.25 per case equivalent through December 31, 2018. The exemption from Margin Fees for beer sold in the qualifying territories was subject to certain conditions, including incurring sales and marketing expenses in the qualifying territories at or above specified amounts. In the event the A-B Distributor Agreement is renewed beyond December 31, 2018, the A-B Distributor Agreement sets Margin Fees to be paid to A‑B for the period beginning January 1, 2019 and ending December 31, 2028, at $0.75 per case equivalent. The A-B Distributor Agreement no longer provides for the incremental fees that were previously paid to A-B for shipments above the volume of shipments during 2003.
If we purchase additional beer brands, we may distribute those brands outside of the A-B Distributor Agreement while still selling existing brands to A-B affiliated wholesalers. We would not be obligated to pay margin fees on sales of the new brand.
Transactions with A-B
Transactions with A-B consisted of the following (in thousands):
|
Year Ended December 31,
|
||||||||||||
|
2014
|
2013
|
2012
|
||||||||||
|
Gross sales to A-B
|
$
|
178,805
|
$
|
161,010
|
$
|
149,492
|
||||||
|
Margin fee paid to A-B, classified as a reduction of Sales
|
2,644
|
2,009
|
1,864
|
|||||||||
|
Sales to FSB through a contract brewing arrangement, classified in Sales(1)
|
-
|
-
|
3,083
|
|||||||||
|
Sales to FSB pursuant to termination agreement discussed below
|
-
|
-
|
838
|
|||||||||
|
Handling, inventory management, royalty and other fees paid to A-B, classified in Cost of sales
|
393
|
402
|
449
|
|||||||||
|
Amounts received from A-B for lost keg fees and forfeited deposits, included as a reduction of Property, equipment and leasehold improvements, net
|
-
|
-
|
122
|
|||||||||
| (1) | We owned 42% of FSB prior to its becoming a wholly owned subsidiary of A-B in May 2011 and, accordingly, transactions with FSB are considered to be related-party transactions in all periods. |
Effective September 1, 2012, in the best interest of both parties, we mutually agreed with FSB to end our contract brewing arrangement. Under the termination agreement, we phased out production of FSB branded beers through November 2012 utilizing remaining inventory on-hand. In consideration, FSB paid us $70,000 per month through September 2013, all of which was recognized as Sales on September 1, 2012, the effective date of agreement.
Amounts due to or from A-B were as follows (in thousands):
|
December 31,
|
||||||||
|
2014
|
2013
|
|||||||
|
Amounts due from A-B related to beer sales pursuant to the A-B Distributor Agreement
|
$
|
7,846
|
$
|
8,457
|
||||
|
Refundable deposits due to A-B
|
(2,629
|
)
|
(2,728
|
)
|
||||
|
Amounts due to A-B for services rendered
|
(1,821
|
)
|
(1,852
|
)
|
||||
|
Net amount due from A-B
|
$
|
3,396
|
$
|
3,877
|
||||
None.
Disclosure Controls and Procedures
Our management, including our Chief Executive Officer and our Principal Financial Officer, carried out an evaluation of the effectiveness of the design and operation of our disclosure controls and procedures (as defined in Exchange Act Rule 13a-15(e) or 15d-15(e)) under the Securities Exchange Act of 1934 (“Exchange Act”) as of the end of the period covered by this Report. Based upon that evaluation, our Chief Executive Officer and Principal Financial Officer concluded that, as of the end of the period covered by this report, disclosure controls and procedures were effective to ensure that information required to be disclosed in the reports filed or submitted by us under the Exchange Act is recorded, processed, summarized and reported within the time periods specified by the Securities and Exchange Commission’s rules and forms and that such information is accumulated and communicated to management, including our Chief Executive Officer and Principal Financial Officer, as appropriate, to allow timely decisions regarding required disclosures. While reasonable assurance is a high level of assurance, it does not mean absolute assurance. Disclosure controls and internal control over financial reporting cannot prevent or detect all errors, misstatements or fraud. In addition, the design of a control system must recognize that there are resource constraints, and the benefits associated with controls must be proportionate to their costs.
Changes in Internal Control Over Financial Reporting
During the fourth quarter of 2014, no changes in our internal control over financial reporting were identified in connection with the evaluation required by Exchange Act Rule 13a-15 or 15d-15 that have materially affected, or are reasonably likely to materially affect, our internal control over financial reporting.
Report of Management on Internal Control over Financial Reporting
Our management is responsible for establishing and maintaining adequate internal control over financial reporting in accordance with Exchange Act Rule 13a-15(f). Our internal control system was designed to provide reasonable assurance to our management and Board of Directors regarding the preparation and fair presentation of published financial statements. Because of its inherent limitations, internal control over financial reporting is not intended to provide absolute assurance that a misstatement of our financial statements would be prevented or detected.
Our management assessed the effectiveness of our internal control over financial reporting based on the framework and criteria established in Internal Control — Integrated Framework, issued in 2013 by the Committee of Sponsoring Organizations of the Treadway Commission. Based on this evaluation, management concluded that our internal control over financial reporting was effective as of December 31, 2014.
Moss Adams LLP, an independent registered public accounting firm, has audited the effectiveness of our internal control over financial reporting as of December 31, 2014, as stated in their report, which is included herein.
REPORT OF INDEPENDENT REGISTERED PUBLIC ACCOUNTING FIRM
The Board of Directors and Shareholders
Craft Brew Alliance, Inc.
We have audited Craft Brew Alliance, Inc.’s (the “Company”) internal control over financial reporting as of December 31, 2014, based on criteria established in Internal Control - Integrated Framework (2013) issued by the Committee of Sponsoring Organizations of the Treadway Commission. The Company’s management is responsible for maintaining effective internal control over financial reporting and for its assessment of the effectiveness of internal control over financial reporting, included in the accompanying Management’s Annual Report on Internal Control over Financial Reporting. Our responsibility is to express an opinion on the Company’s internal control over financial reporting based on our audit.
We conducted our audit in accordance with the standards of the Public Company Accounting Oversight Board (United States). Those standards require that we plan and perform the audit to obtain reasonable assurance about whether effective internal control over financial reporting was maintained in all material respects. Our audit included obtaining an understanding of internal control over financial reporting, assessing the risk that a material weakness exists, and testing and evaluating the design and operating effectiveness of internal control based on the assessed risk. Our audit also included performing such other procedures as we considered necessary in the circumstances. We believe that our audit provides a reasonable basis for our opinion.
A company’s internal control over financial reporting is a process designed to provide reasonable assurance regarding the reliability of financial reporting and the preparation of financial statements for external purposes in accordance with generally accepted accounting principles. A company’s internal control over financial reporting includes those policies and procedures that (1) pertain to the maintenance of records that, in reasonable detail, accurately and fairly reflect the transactions and dispositions of the assets of the company; (2) provide reasonable assurance that transactions are recorded as necessary to permit preparation of financial statements in accordance with generally accepted accounting principles, and that receipts and expenditures of the company are being made only in accordance with authorizations of management and directors of the company; and (3) provide reasonable assurance regarding prevention or timely detection of unauthorized acquisition, use, or disposition of the company’s assets that could have a material effect on the financial statements.
Because of its inherent limitations, internal control over financial reporting may not prevent or detect misstatements. Also, projections of any evaluation of effectiveness to future periods are subject to the risk that controls may become inadequate because of changes in conditions, or that the degree of compliance with the policies or procedures may deteriorate.
In our opinion, Craft Brew Alliance, Inc. maintained, in all material respects, effective internal control over financial reporting as of December 31, 2014, based on criteria established in Internal Control - Integrated Framework (2013) issued by the Committee of Sponsoring Organizations of the Treadway Commission.
We also have audited, in accordance with the standards of the Public Company Accounting Oversight Board (United States), the consolidated balance sheets of Craft Brew Alliance, Inc. as of December 31, 2014 and 2013, and the consolidated statements of income, comprehensive income, shareholders’ equity, and cash flows for each of the three years in the period ended December 31, 2014, and our report dated March 4, 2015 expressed an unqualified opinion on those consolidated financial statements.
/s/ Moss Adams LLP
Portland, Oregon
March 4, 2015
None.
PART III
The information required by this Item is contained in part in our definitive proxy statement for our 2015 Annual Meeting of Shareholders to be held on May 20, 2015 (the “2015 Proxy Statement”) under the captions “Board of Directors – Nominees for Director,” “Board of Directors – Committees of the Board – Audit Committee,” “Executive Officers,” and “Section 16(a) Beneficial Ownership Reporting Compliance,” and the information contained therein is incorporated herein by reference.
Code of Conduct
We adopted a Code of Conduct and Ethics (the “Code”) applicable to all employees, including our principal executive officer, principal financial officer, principal accounting officer and directors. The Code and the charters of each of the Board committees are posted on our website at www.craftbrew.com (select Investor Relations — Governance — Highlights). Copies of these documents are available to any shareholder who requests them. Such requests should be directed to Investor Relations, Craft Brew Alliance, Inc., 929 N. Russell Street, Portland, OR 97227. Any waivers of the Code for our directors or executive officers are required to be approved by our Board of Directors. We will disclose any such waivers on a current report on Form 8-K within four business days after the waiver is approved.
Information required by this Item is contained in our 2015 Proxy Statement under the captions “Compensation Committee Report,” “Compensation Discussion and Analysis,” “Executive Compensation,” “Employment Agreements and Potential Payments Upon Termination or Change-in-Control,” “Director Compensation” and “Board of Directors – Committees of the Board – Compensation Committee” and the information contained therein is incorporated herein by reference.
| Item 12. | Security Ownership of Certain Beneficial Owners and Management and Related Stockholder Matters |
Securities Authorized for Issuance Under Equity Compensation PlansThe following is a summary as of December 31, 2014 of all of our plans that provide for the issuance of equity securities as compensation. See Note 12 of Notes to Consolidated Financial Statements in Item 8 for additional information.
|
Plan Category
|
Number of securities
to be issued upon
exercise of
outstanding options,
warrants and rights (a)
|
Weighted average
exercise price of
outstanding options,
warrants and rights (b)
|
Number of securities
remaining available for future
issuance under equity
compensation plans
(excluding securities reflected
in column (a)) (c)
|
|||||||||
|
Equity compensation plans approved by shareholders
|
422,773
|
(1)
|
$
|
9.35
|
988,347
|
|||||||
|
Equity compensation plans not approved by shareholders
|
-
|
-
|
-
|
|||||||||
|
Total
|
422,773
|
$
|
9.35
|
988,347
|
||||||||
| (1) | Includes a total of 117,742 performance shares that may vest between March 31, 2015 and March 31, 2017, based on the achievement of financial targets over three separate performance periods. The shares are not included in the calculation of weighted average price in column (b). |
The remaining information required by this Item is contained in our 2015 Proxy Statement under the caption “Security Ownership of Certain Beneficial Owners and Management,” and the information contained therein is incorporated herein by reference.
The information required by this Item is contained in our 2015 Proxy Statement under the captions “Transactions with Related Persons” and “Board of Directors – Director Independence” and the information contained therein is incorporated herein by reference.
The information required by this Item is contained in our 2015 Proxy Statement under the caption “Proposal No. 2 — Ratification of Appointment of Independent Registered Public Accounting Firm” and the information contained therein is incorporated herein by reference.
PART IV
Financial Statements and Schedules
|
Page
|
||
|
Report of Moss Adams LLP, Independent Registered Public Accounting Firm
|
36
|
|
|
Consolidated Balance Sheets as of December 31, 2014 and 2013
|
37
|
|
|
Consolidated Statements of Income for the Years Ended December 31, 2014, 2013 and 2012
|
38
|
|
|
Consolidated Statements of Comprehensive Income for the Years Ended December 31, 2014, 2013 and 2012
|
39
|
|
|
Consolidated Statements of Common Shareholders’ Equity for the Years Ended December 31, 2014, 2013 and 2012
|
40
|
|
|
Consolidated Statements of Cash Flows for the Years Ended December 31, 2014, 2013 and 2012
|
41
|
|
|
Notes to Consolidated Financial Statements
|
42
|
|
There are no schedules required to be filed herewith.
Exhibits
Exhibits are listed in the Exhibit Index that appears immediately following the signature page of this report and is incorporated herein by reference, and are filed or incorporated by reference as part of this Annual Report on Form 10-K.
Pursuant to the requirements of Section 13 or 15(d) of the Securities Exchange Act of 1934, the Registrant has duly caused this Report to be signed on its behalf by the undersigned, thereunto duly authorized, in Portland, Oregon, on March 4, 2015.
Craft Brew Alliance, Inc.
|
By:
|
/s/ Joseph K. O’Brien
|
|
|
Joseph K. O’Brien
|
||
|
Corporate Controller and Principal
|
||
|
Accounting Officer
|
Pursuant to the requirements of the Securities Exchange Act of 1934, this Report has been signed below by the following persons on behalf of the Registrant and in the capacities indicated, on March 4, 2015.
|
Signature
|
Title
|
|
|
/s/ Andrew J. Thomas
|
Chief Executive Officer
|
|
|
Andrew J. Thomas
|
(Principal Executive Officer)
|
|
|
/s/ Joseph K. O’Brien
|
Corporate Controller and Principal Accounting Officer
|
|
|
Joseph K. O’Brien
|
(Principal Financial and Accounting Officer)
|
|
|
*
|
Chairman of the Board and Director
|
|
|
Kurt R. Widmer
|
||
|
*
|
Director
|
|
|
Timothy P. Boyle
|
||
|
*
|
Director
|
|
|
Marc J. Cramer
|
||
|
*
|
Director
|
|
|
Randall S. Jozwiakowski
|
||
|
*
|
Director
|
|
|
Kevin R. Kelly
|
||
|
*
|
Director
|
|
|
Thomas D. Larson
|
||
|
*
|
Director
|
|
|
David R. Lord
|
||
|
*
|
Director
|
|
|
John D. Rogers, Jr.
|
|
*By:
|
/s/ Andrew J. Thomas | |
|
|
Andrew J. Thomas, | |
|
as attorney in fact
|
EXHIBIT INDEX
|
Exhibit
Number
|
Description
|
|
|
3.1
|
Restated Articles of Incorporation of the Registrant, dated January 2, 2012 (incorporated by reference from Exhibit 3.1 to the Registrant’s Annual Report on Form 10-K for the year ended December 31, 2011)
|
|
|
3.2
|
Amended and Restated Bylaws of the Registrant, dated December 1, 2010 (incorporated by reference from Exhibit 3.2 to the Registrant’s Annual Report on Form 10-K for the year ended December 31, 2010 filed on April 1, 2011)
|
|
|
10.1*
|
2002 Stock Option Plan (incorporated by reference from Exhibit A to the Registrant’s Proxy Statement for its 2002 Annual Meeting of Shareholders (File No. 0-26542)
|
|
|
10.2*
|
Form of Stock Option Agreement (Directors Grants) for the 2002 Stock Option Plan (incorporated by reference from Exhibit 10.10 to the Registrant’s Form 10-K for the year ended December 31, 2004)
|
|
|
10.3*
|
Form of Nonqualified Stock Option Agreement (Executive Officer Grants) for the 2002 Stock Option Plan (incorporated by reference from Exhibit 10.1 to the Registrant’s Form 10-Q for the quarter ended September 30, 2010)
|
|
|
10.4*
|
2010 Stock Incentive Plan (incorporated by reference from Appendix B to the Registrant’s Proxy Statement for its 2010 Annual Meeting of Shareholders)
|
|
|
10.5*
|
Form of Nonqualified Stock Option Agreement (Executive Officer Grants) for the 2010 Stock Incentive Plan (incorporated by reference from Exhibit 10.11 to the Registrant’s Form 10-K for the year ended December 31, 2010)
|
|
|
10.6*
|
Form of Performance Share Award Agreement for Executive Officers ((incorporated by reference from Exhibit 10.1 to the Registrant’s Form 10-Q for the quarter ended March 31, 2014)
|
|
|
10.7*
|
2014 Stock Incentive Plan (incorporated by reference from Exhibit 10.1 to the Registrant’s Current Report on Form 8-K filed on May 27, 2014)
|
|
|
10.8*
|
Letter of Agreement between the Registrant and Mark D. Moreland dated March 29, 2010 (incorporated by reference from Exhibit 10.15 to the Registrant’s Form 10-K for the year ended December 31, 2009)
|
|
|
10.9*
|
Transition and Separation Agreement between the Registrant and Mark D. Moreland, dated October 31, 2014 (incorporated by reference from Exhibit 10.1 to the Registrant’s Current Report on Form 8-K filed on November 5, 2014)
|
|
|
10.10*
|
Letter of Agreement between the Registrant and Kurt Widmer dated May 26, 2010 (incorporated by reference from Exhibit 10.1 to the Registrant’s Form 10-Q for the quarter ended June 30, 2010)
|
|
|
10.11*
|
Letter of Agreement between the Registrant and Robert Widmer dated May 26, 2010 (incorporated by reference from Exhibit 10.2 to the Registrant’s Form 10-Q for the quarter ended June 30, 2010)
|
|
|
10.12*
|
Employment Letter Agreement between the Registrant and Andrew J. Thomas, dated November 20, 2013 (incorporated by reference from Exhibit 10.1 to the Registrant’s Current Report on Form 8-K filed on November 21, 2013)
|
|
|
10.13*
|
Employee Noncompetition and Nonsolicitation Agreement between the Registrant and Andrew J. Thomas, dated November 20, 2013 (incorporated by reference from Exhibit 10.2 to the Registrant’s Current Report on Form 8-K filed on November 21, 2013)
|
|
|
10.14*
|
Non-Competition and Non-Solicitation Agreement dated October 1, 2010 between the Registrant and Mattson Davis (incorporated by reference from Exhibit 10.3 to the Registrant’s Current Report on Form 8-K filed on October 6, 2010)
|
|
|
10.15*
|
Letter of Agreement between the Registrant and J. Scott Mennen dated August 4, 2014 (incorporated by reference from Exhibit 10.1 to the Registrant’s Quarterly Report on Form 10-Q for the quarter ended September 30, 2014)
|
|
|
10.16*
|
Letter of Agreement between the Registrant and John W. Glick dated August 5, 2014 (incorporated by reference from Exhibit 10.2 to the Registrant’s Quarterly Report on Form 10-Q for the quarter ended September 30, 2014)
|
|
|
10.17*
|
Letter of Agreement between the Registrant and Kenneth C. Kunze dated August 5, 2014 (incorporated by reference from Exhibit 10.3 to the Registrant’s Quarterly Report on Form 10-Q for the quarter ended September 30, 2014)
|
|
|
Summary of Compensation Arrangements for Non-Employee Directors as of January 1, 2015
|
||
|
Summary of Annual Cash Incentive Bonus Plan for Executive Officers
|
|
Exhibit
Number
|
Description
|
|
|
10.20
|
Sublease between Pease Development Authority as Sublessor and the Registrant as Sublessee, dated May 30, 1995 (incorporated by reference from Exhibit 10.11 to the Registrant’s Registration Statement on Form S-1, No. 33-94166)
|
|
|
10.21
|
Loan Agreement dated as of July 1, 2008 between Registrant and Bank of America, N.A. (incorporated by reference from Exhibit 10.1 to the Registrant’s Current Report on Form 8-K filed on July 7, 2008)
|
|
|
10.22
|
Loan Modification Agreement dated November 14, 2008 to Loan Agreement dated July 1, 2008 between Registrant and Bank of America, N.A. (incorporated by reference from Exhibit 10.1 to the Registrant’s Form 10-Q for the quarter ended September 30, 2008)
|
|
|
10.23
|
Second Loan Modification Agreement dated June 8, 2010 to the Loan Agreement dated July 1, 2008 between the Registrant and Bank of America, N.A. (incorporated by reference from Exhibit 10.4 to the Registrant’s Form 10-Q for the quarter ended June 30, 2010)
|
|
|
10.24
|
Third Loan Modification Agreement dated September 30, 2010 to the Loan Agreement dated July 1, 2008 between the Registrant and Bank of America, N.A. (incorporated by reference from Exhibit 10.1 to the Registrant’s Current Report on Form 8-K filed on October 6, 2010)
|
|
|
10.25
|
Fourth Loan Modification Agreement dated November 15, 2013 to the Loan Agreement dated July 1, 2008 between the Registrant and Bank of America, N.A. (incorporated by reference from Exhibit 10.1 to the Registrant’s Current Report on Form 8-K filed on November 19, 2013)
|
|
|
10.26
|
Amended and Restated Exchange and Recapitalization Agreement dated as of May 1, 2011 between the Registrant and A-B (incorporated by reference from Exhibit 10.1 to the Registrant’s Current Report on Form 8-K filed on May 4, 2011)
|
|
|
10.27
|
Amended and Restated Master Distributor Agreement dated as of May 1, 2011 between the Registrant and A-B (incorporated by reference from Exhibit 10.2 to the Registrant’s Current Report on Form 8-K filed on May 4, 2011)
|
|
|
10.28
|
Amendment to A-B Master Distributor Agreement dated May 11, 2012 (incorporated by reference from Exhibit 10.1 to the Registrant’s Quarterly Report on Form 10-Q filed on August 9, 2012)
|
|
|
10.29
|
Amendment to A-B Master Distributor Agreement dated November 20, 2013 (incorporated by reference from Exhibit 10.35 to the Registrant’s Annual Report on Form 10-K for the year ended December 31, 2013)
|
|
|
10.30
|
Registration Rights Agreement dated as of July 1, 2004 between the Registrant and A‑B (incorporated by reference from Exhibit 10.3 to the Registrant’s Current Report on Form 8-K filed on July 2, 2004)
|
|
|
10.31
|
Master Lease Agreement dated as of June 6, 2007 between Banc of America Leasing & Capital, LLC and Widmer Brothers Brewing Company (incorporated by reference from Exhibit 10.2 to the Registrant’s Amendment No. 1 to the Registration Statement on Form S-4, No. 333-149908 filed on May 2, 2008 (“S-4 Amendment No. 1”))
|
|
|
10.32
|
Amended and Restated License Agreement dated as of February 28, 1997 between Widmer Brothers Brewing Company and Widmer’s Wine Cellars, Inc. and Canandaigua Wine Company, Inc. (incorporated by reference to Exhibit 10.3 from the S-4 Amendment No. 1)
|
|
|
10.33
|
Restated Lease dated as of January 1, 1994 between Smithson & McKay Limited Liability Company and Widmer Brothers Brewing Company (incorporated by reference to Exhibit 10.3 to the Registrant’s Form 10-Q for the quarter ended September 30, 2010)
|
|
|
10.34
|
Commercial Lease (Restated) dated as of December 18, 2007 between Widmer Brothers LLC and Widmer Brothers Brewing Company (incorporated by reference to Exhibit 10.5 from the S-4 Amendment No. 1)
|
|
|
10.35
|
Sublease dated as of September 1, 2010 between Manini Holdings, LLC and Kona Brewing Co., Inc. (incorporated by reference from Exhibit 10.41 to the Registrant’s Form 10-K for the year ended December 31, 2010)
|
|
|
10.36†
|
Amended and Restated Continental Distribution and Licensing Agreement between the Registrant and Kona Brewery LLC dated March 26, 2009 (incorporated by reference from Exhibit 10.4 to the Registrant’s Form 10-Q for the quarter ended September 30, 2010)
|
|
|
10.37
|
Sublease dated as of March 31, 2011 between Manini Holdings, LLC and Kona Brewing Co., LLC (incorporated by reference from Exhibit 10.43 to the Registrant’s Amendment No. 1 to Form 10-K for the year ended December 31, 2010 filed on April 22, 2011)
|
|
Exhibit
Number
|
Description
|
|
|
21.1
|
Subsidiaries of the Registrant (incorporated by reference from Exhibit 21.1 to the Registrant’s Form 10-K for the year ended December 31, 2010 filed on April 1, 2011)
|
|
|
Consent of Moss Adams LLP, Independent Registered Public Accounting Firm
|
||
|
Power of Attorney – Directors of Craft Brew Alliance, Inc.
|
||
|
Certification of Chief Executive Officer of Craft Brew Alliance, Inc. pursuant to Section 302 of the Sarbanes-Oxley Act of 2002
|
||
|
Certification of Principal Financial Officer of Craft Brew Alliance, Inc. pursuant to Section 302 of the Sarbanes-Oxley Act of 2002
|
||
|
Certification of Form 10-K for the year ended December 31, 2014 pursuant to 18 U.S.C. Section 1350, as adopted pursuant to Section 906 of the Sarbanes-Oxley Act of 2002
|
||
|
Press Release dated March 4, 2015
|
||
|
99.2
|
Description of Common Stock (incorporated by reference from Exhibit 99.2 to the Registrant’s Form 10-K for the year ended December 31, 2012 filed on March 12, 2013)
|
|
|
101.INS
|
XBRL Instance Document
|
|
|
101.SCH
|
XBRL Taxonomy Extension Schema Document
|
|
|
101.CAL
101.DEF
|
XBRL Taxonomy Extension Calculation Linkbase Document
XBRL Taxonomy Extension Definition Linkbase Document
|
|
|
101.LAB
|
XBRL Taxonomy Extension Label Linkbase Document
|
|
|
101.PRE
|
XBRL Taxonomy Extension Presentation Linkbase Document
|
|
*
|
Denotes a management contract or a compensatory plan or arrangement.
|
|
†
|
Confidential treatment has been requested with respect to portions of this exhibit. A complete copy of the agreement, including the redacted terms, has been separately filed with the Securities and Exchange Commission.
|
E-3