Attached files
| file | filename |
|---|---|
| EX-21 - EXHIBIT 21 - BADGER METER INC | bmiex21_2014123110k.htm |
| EX-23 - EXHIBIT 23 - BADGER METER INC | bmiex23_2014123110k.htm |
| EX-32 - EXHIBIT 32 - BADGER METER INC | bmi-ex32_20141231x10k.htm |
| EX-31.2 - EXHIBIT 31.2 - BADGER METER INC | bmi-ex312_20141231x10k.htm |
| EXCEL - IDEA: XBRL DOCUMENT - BADGER METER INC | Financial_Report.xls |
| EX-31.1 - EXHIBIT 31.1 - BADGER METER INC | bmi-ex311_20141231x10k.htm |
UNITED STATES SECURITIES AND EXCHANGE COMMISSION
Washington, D.C. 20549
FORM 10-K
Annual Report Pursuant to Section 13 or 15(d) of the Securities Exchange Act of 1934
for the fiscal year ended December 31, 2014
BADGER METER, INC.
4545 W. Brown Deer Road
Milwaukee, Wisconsin 53223
(414) 355-0400
A Wisconsin Corporation
IRS Employer Identification No. 39-0143280
Commission File No. 001-06706
The Company has the following classes of securities registered pursuant to Section 12(b) of the Act:
Title of class: | Name of each exchange on which registered: | |
Common Stock | New York Stock Exchange | |
Common Share Purchase Rights | New York Stock Exchange | |
The Company does not have any securities registered pursuant to Section 12(g) of the Act.
Indicate by check mark if the Company is a well-known seasoned issuer, as defined in Rule 405 of the Securities Act. Yes ý No ¨
Indicate by check mark if the Company is not required to file reports pursuant to Section 13 or Section 15(d) of the Exchange Act. Yes ¨ No ý
Indicate by check mark whether the Company (1) has filed all reports required to be filed by Section 13 or 15(d) of the Securities Exchange Act of 1934 during the preceding 12 months (or for such shorter period that the Company was required to file such reports), and (2) has been subject to such filing requirements for the past 90 days. Yes ý No ¨
Indicate by check mark whether the registrant has submitted electronically and posted on its corporate Web site, if any, every Interactive Data File required to be submitted and posted pursuant to Rule 405 of Regulation S-T during the preceding 12 months (or for such shorter period that the registrant was required to submit and post such files). Yes ý No ¨
Indicate by check mark if disclosure of delinquent filers pursuant to Item 405 of Regulation S-K is not contained herein, and will not be contained, to the best of registrant’s knowledge, in definitive proxy or information statements incorporated by reference in Part III of this Form 10-K or any amendment to this Form 10-K. ý
Indicate by check mark whether the registrant is a large accelerated filer, an accelerated filer, a non-accelerated filer, or a smaller reporting company. See definitions of “large accelerated filer,” “accelerated filer,” “non-accelerated filer” and “smaller reporting company” in Rule 12b-2 of the Exchange Act: (Check one).
Large accelerated filer | ¨ | Accelerated filer | ý | |
Non-accelerated filer | ¨ | Smaller reporting company | ¨ | |
Indicate by check mark whether the registrant is a shell company (as defined in Rule 12b-2 of the Exchange Act). Yes ¨ No ý
The aggregate market value of the Common Stock held by non-affiliates of the Company as of June 30, 2014 was $651,621,555. For purposes of this calculation only, (i) shares of Common Stock are deemed to have a market value of $52.65 per share, the closing price of the Common Stock as reported on the New York Stock Exchange on June 30, 2014, and (ii) each of the Company's executive officers and directors is deemed to be an affiliate of the Company.
As of February 11, 2015, there were 14,454,020 shares of Common Stock outstanding with a par value of $1 per share.
Portions of the Company's Proxy Statement for the 2015 Annual Meeting of Shareholders, which will be filed with the Securities and Exchange Commission under Regulation 14A within 120 days after the end of the registrant's fiscal year, are incorporated by reference from the definitive Proxy Statement into Part III of this Annual Report on Form 10-K.
Special Note Regarding Forward Looking Statements
Certain statements contained in this Annual Report on Form 10-K, as well as other information provided from time to time by Badger Meter, Inc. (the “Company”) or its employees, may contain forward looking statements that involve risks and uncertainties that could cause actual results to differ materially from those in the forward looking statements. The words “anticipate,” “believe,” “estimate,” “expect,” “think,” “should,” “could” and “objective” or similar expressions are intended to identify forward looking statements. All such forward looking statements are based on the Company’s then current views and assumptions and involve risks and uncertainties. Some risks and uncertainties that could cause actual results to differ materially from those expressed or implied in forward looking statements include those described in Item 1A of the Company’s Annual Report on Form 10-K for the year ended December 31, 2014 that include, among other things:
• | the continued shift in the Company’s business from lower cost, manually read meters toward more expensive, value-added automatic meter reading (AMR) systems, advanced metering infrastructure (AMI) systems and advanced metering analytics (AMA) systems that offer more comprehensive solutions to customers’ metering needs; |
• | the success or failure of newer Company products; |
• | changes in competitive pricing and bids in both the domestic and foreign marketplaces, and particularly in continued intense price competition on government bid contracts for lower cost, manually read meters; |
• | the actions (or lack thereof) of the Company’s competitors; |
• | changes in the Company’s relationships with its alliance partners, primarily its alliance partners that provide radio solutions, and particularly those that sell products that do or may compete with the Company’s products; |
• | changes in the general health of the United States and foreign economies, including to some extent such things as the length and severity of global economic downturns, international or civil conflicts that affect international trade, the ability of municipal water utility customers to authorize and finance purchases of the Company’s products, the Company’s ability to obtain financing, housing starts in the United States, and overall industrial activity; |
• | unusual weather, weather patterns or other natural phenomena, including related economic and other ancillary effects of any such events; |
• | the timing and impact of government funding programs that stimulate national and global economies, as well as the impact of government budget cuts or partial shutdowns of governmental operations; |
• | changes in the cost and/or availability of needed raw materials and parts, such as volatility in the cost of brass castings as a result of fluctuations in commodity prices, particularly for copper and scrap metal at the supplier level, foreign-sourced electronic components as a result of currency exchange fluctuations and/or lead times, and plastic resin as a result of changes in petroleum and natural gas prices; |
• | the Company’s expanded role as a prime contractor for providing complete technology systems to governmental entities, which brings with it added risks, including but not limited to, the Company’s responsibility for subcontractor performance, additional costs and expenses if the Company and its subcontractors fail to meet the timetable agreed to with the governmental entity, and the Company’s expanded warranty and performance obligations; |
• | the Company’s ability to successfully integrate acquired businesses or products; |
• | changes in foreign economic conditions, particularly currency fluctuations in the United States dollar, the Euro and the Mexican peso; |
• | the inability to develop technologically advanced products; |
• | the failure of the Company’s products to operate as intended; |
• | the inability to protect the Company’s proprietary rights to its products; |
• | disruptions and other damages to information technology and other networks and operations due to breaches in data security; |
• | transportation delays or interruptions; |
• | the loss of certain single-source suppliers; and |
• | changes in laws and regulations, particularly laws dealing with the use of lead (which can be used in the manufacture of certain meters incorporating brass housings) and the United States Federal Communications Commission rules affecting the use and/or licensing of radio frequencies necessary for technology products. |
All of these factors are beyond the Company's control to varying degrees. Shareholders, potential investors and other readers are urged to consider these factors carefully in evaluating the forward looking statements contained in this Annual Report on Form 10-K and are cautioned not to place undue reliance on such forward looking statements. The forward looking statements made in this document are made only as of the date of this document and the Company assumes no obligation, and disclaims any obligation, to update any such forward looking statements to reflect subsequent events or circumstances.
1
PART I
ITEM 1. BUSINESS
Badger Meter, Inc. (the “Company”) is a leading innovator, manufacturer and marketer of products incorporating flow measurement and control technologies serving markets worldwide. The Company was incorporated in 1905.
Throughout this 2014 Annual Report on Form 10-K, the words “we,” “us” and “our” refer to the Company.
Available Information
The Company's Internet address is http://www.badgermeter.com. The Company makes available free of charge (other than an investor's own Internet access charges) through its Internet website its Annual Report on Form 10-K, Quarterly Reports on Form 10-Q, Current Reports on Form 8-K, and amendments to those reports, on the same day they are electronically filed with, or furnished to, the Securities and Exchange Commission. The Company is not including the information contained on or available through its website as a part of, or incorporating such information by reference into, this Annual Report on Form 10-K.
Market Overview, Products, Systems and Solutions
Badger Meter is an innovator in flow measurement and control products, serving water utilities, municipalities, and commercial and industrial customers worldwide. The Company’s products measure water, oil, chemicals and other fluids, and are known for accuracy, long-lasting durability and for providing valuable and timely measurement data. The Company’s product lines fall into three categories: sales of water meters and related technologies to municipal water utilities (municipal water), sales of meters to various industries for water and other fluids (flow instrumentation), and sales of gas meter radios and concrete vibrators to unique markets (specialty products). The Company estimates that over 75% of its products are used in water applications when all categories are grouped together.
Municipal water, the largest category by sales volume, includes mechanical and electronic (static) water meters and related technologies and services used by water utilities as the basis for generating water and wastewater revenues. The key market for the Company’s water meter products is North America, primarily the United States, because most meters are designed and manufactured to conform to standards promulgated by the American Water Works Association. The majority of water meters sold continues to be mechanical in nature. In recent years, the Company has made inroads in selling electronic (static) meters. This recent development of static water meters combined with updated radio technology now provides the Company with the opportunity to sell into other geographical markets, for example Europe, Middle East and South America. In the municipal water category, sales of water meters and related technologies and services are commonly referred to as residential or commercial water meter sales, the latter referring to larger sizes of meters.
Flow instrumentation includes meters and valves sold worldwide to measure and control materials flowing through a pipe or pipeline including water, air, steam, oil, and other liquids and gases. These products are used in a variety of applications, such as water/wastewater; heating, ventilating and air conditioning (HVAC); oil and gas; chemical and petrochemical; food and beverage; and pharmaceutical production. Furthermore, the Company’s flow measurement technologies are sold to original equipment manufacturers as the primary flow measurement device within a product or system.
Specialty products include sales of radio technology to natural gas utilities for installation on their gas meters, and concrete vibrators used in the concrete construction process.
Residential and commercial water meters are generally classified as either manually read meters or remotely read meters via radio technology. A manually read meter consists of a water meter and a register that gives a visual meter reading display. Meters equipped with radio transmitters (endpoints) use encoder registers to convert the measurement data from the meter (mechanical or static) into an encrypted digital format which is then transmitted via radio frequency to a receiver that collects and formats the data appropriately for water utility billing systems. These remotely read, or mobile, systems are either automatic meter reading (AMR) systems, where a vehicle equipped for meter reading purposes, including a radio receiver, computer and reading software, collects the data from utilities’ meters; or fixed network advanced metering infrastructure (AMI) systems, where data is gathered utilizing a network of permanent data collectors or gateway receivers that are always active or listening for the radio transmission from the utilities’ meters. AMI systems eliminate the need for utility personnel to drive through service territories to collect meter reading data. These systems provide the utilities with more frequent and diverse data at specified intervals from the utilities’ meters.
2
In 2011, the Company introduced what it believes is the next generation of metering technology, advanced metering analytics (AMA), along with a host of automated utility management tools to facilitate the ability of water and gas utilities to increase their productivity and revenue, as well as proactively utilize their data. AMA is comprised of both software and hardware, including the ORION® SE two-way fixed network or GALAXY® one-way fixed network technology, which is complemented by a family of highly accurate and reliable water meters.
The ORION SE system can operate in either a mobile or fixed network mode depending on the deployment needs of the utility. For example, a water or gas utility can begin deployment in mobile mode and transition to a fixed network system without visiting the endpoint. Once deployed, if the system is operating in fixed network mode and the gateway data collector stops functioning, the endpoint will continue to send data that can be captured by a mobile system. Once the gateway data collector functions again, the utility will again receive data through the fixed network system.
In January 2014, the Company enhanced its AMA offering by launching its new BEACON® AMA system. BEACON AMA combines the BEACON analytical software suite with proven ORION AMI technology using fixed and cellular networks in a managed solution, improving utilities’ visibility of their water consumption and reducing the need for costly infrastructure. With the release of BEACON AMA, the Company became the first major worldwide water meter company to release a cost-effective cellular-based solution for system-wide deployment. BEACON AMA enables two-way communication between the water meter and the meter reading system.
The BEACON AMA secure, hosted software suite includes a customizable dashboard, the ability to establish alerts for specific conditions, and consumer engagement tools that allow end water customers to view and manage their water usage activity. Benefits to the utility include improved customer service, increased visibility through faster leak detection, the ability to promote and quantify the effects of its water conservation efforts, and easier compliance reporting.
The Company’s net sales and corresponding net earnings depend on unit volume and product mix, with the Company generally earning higher margins on meters equipped with radio technology. In addition to selling its proprietary radio products, including the ORION and GALAXY radio technologies combined with the BEACON AMI/AMA software, the Company also remarkets the Itron® radio products under a license and distribution agreement with Itron, Inc. The Company’s proprietary radio products generally result in higher margins than the remarketed, non-proprietary technology products. The Company also sells registers and endpoints separately to customers who wish to upgrade their existing meters in the field.
The proprietary ORION endpoint technology has been licensed to other technology providers on a non-exclusive basis, including those providing radio products that communicate over power lines, broadband networks and proprietary radio frequency networks, allowing ORION a distinct advantage in the radio solutions market. In addition, the ORION universal gateway receiver transmits data over a variety of public wireless networks, which allows for strategic deployments, such as monitoring large commercial users.
Water meter replacement and the adoption and deployment of new technology comprise the majority of water meter product sales, including radio products. To a much lesser extent, housing starts also contribute to the new product sales base. Over the last decade, there has been a growing trend in the conversion from manually read water meters to radio technology. This conversion rate is accelerating and contributes to an increased water meter and radio solutions base of business. The Company estimates that less than 43% of water meters installed in the United States have been converted to a radio solutions technology. The Company’s strategy is to fulfill customers’ metering expectations and requirements with its proprietary meter reading systems or other systems available through its alliance partners in the marketplace.
Flow instrumentation and specialty products serve flow measurement and control applications across a broad industrial spectrum, occasionally with the same technologies used for municipal water sales. Specialized communication protocols that control the entire flow measurement process drive these markets. The Company’s specific flow measurement and control applications and technologies serve the flow measurement market through both customized and standard precision flow measurement technologies.
The Company's products are primarily manufactured and assembled in the Company's Milwaukee, Wisconsin; Racine, Wisconsin; Tulsa, Oklahoma; Scottsdale, Arizona; Nogales, Mexico; Neuffen, Germany; Brno, Czech Republic; and Bern, Switzerland facilities.
The Company's products are sold throughout the world through employees, resellers and representatives. Depending on the customer mix, there can be a moderate seasonal impact on sales, primarily relating to higher sales of certain municipal water products during the spring and summer months. No single customer accounts for more than 10% of the Company's sales.
3
Competition
There are competitors in each category in which the Company sells its products, and the competition varies from moderate to intense. Major competitors for utility water meters include Sensus, Neptune Technology Group Inc., Master Meter, Inc. and Mueller Water Products, Inc. Together with Badger Meter, it is estimated these companies sell in excess of 90% of the meters in the North American market, which has been insulated from other competitors due to the nature of the mechanical technology used and the standards promulgated by the American Water Works Association. The Company, as well as some of its competitors, have introduced various forms of electronic (static) meters, which have no moving parts, in recent years and have seen sales of those products begin to grow. As the global water metering market, including the North American market, begins to adopt electronic (static) technology, Kamstrup A/S, Diehl Metering GmbH and Itron, Inc. are also potential competitors.
The Company's primary competitors for water utility radio products in North America are Itron, Inc., Neptune Technology Group Inc. and Sensus. Outside of North America, the primary competitors include Itron, Inc., Sensus, Diehl Metering GmbH and Elster Group GmbH. While the Company sells its own proprietary radio systems (ORION and GALAXY), it is also a reseller of the Itron products. A number of the Company's competitors in certain markets have greater financial resources than the Company. However, the Company believes it currently provides the leading technology in water meters and radio water systems. As a result of significant research and development activities, the Company enjoys favorable patent positions and trade secret protections for several of its technologies and products.
There are many competitors in the industrial flow and specialty products markets due to the various markets and applications being served. For example, major competitors in the industrial flow markets include Emerson Electric Co., Krohne Messtechnik GmbH, Endress+Hauser AG and Yokogawa Electric Corporation. In the HVAC market, the key competitor is Onicon Incorporated. In upstream oil and gas, Cameron International Corp. is the primary competitor. The Company competes with AW-Lake Company in the measurement of on-machine hydraulic fluids. With the acquisition of Racine Federated, Inc. in January 2012, the Company has a large portfolio of metering technologies to compete in these markets.
Backlog
The Company's total backlog of unshipped orders at December 31, 2014 and 2013 was $33.6 million and $31.7 million, respectively. The backlog is comprised of firm orders and signed contractual commitments, or portions of such commitments that call for shipment within 12 months. Backlog can be significantly affected by the timing of orders for large projects and the amounts can vary due to the timing of work performed.
Raw Materials
Raw materials used in the manufacture of the Company's products include purchased castings made of metal or alloys (such as brass, which uses copper as its main component, aluminum, stainless steel and cast iron), plastic resins, glass, microprocessors and other electronic subassemblies and components. There are multiple sources for these raw materials, but the Company relies on single suppliers for certain brass castings and certain electronic subassemblies. The Company believes these items would be available from other sources, but that the loss of certain suppliers would result in a higher cost of materials, delivery delays, short-term increases in inventory and higher quality control costs in the short term. The Company carries business interruption insurance on key suppliers. The Company's purchases of raw materials are based on production schedules, and as a result, inventory on hand is generally not exposed to price fluctuations. World commodity markets and currency exchange rates may also affect the prices of material purchased in the future. The Company does not hold significant amounts of precious metals.
Research and Development
Expenditures for research and development activities relating to the development of new products, the improvement of existing products and manufacturing process improvements were $9.5 million in 2014 compared to $10.5 million in 2013 and $9.6 million in 2012. Research and development activities are primarily sponsored by the Company. The Company also engages in some joint research and development with other companies.
Intangible Assets
The Company owns or controls several trade secrets and many patents, trademarks and trade names in the United States and other countries that relate to its products and technologies. No single patent, trademark, trade name or trade secret is material to the Company's business as a whole.
4
Environmental Protection
The Company is subject to contingencies related to environmental laws and regulations. The Company is named as one of many potentially responsible parties in two landfill lawsuits. The landfill sites are impacted by the Federal Comprehensive Environmental Response, Compensation and Liability Act and other environmental laws and regulations. At this time, the Company does not believe the ultimate resolution of these matters will have a material adverse effect on the Company’s financial position or results of operations, either from a cash flow perspective or on the financial statements as a whole. This belief is based on the Company’s assessment of its limited past involvement with these landfill sites as well as the substantial involvement of and government focus on other named third parties with these landfill sites. However, due to the inherent uncertainties of such proceedings, the Company cannot predict the ultimate outcome of any of these matters. A future change in circumstances with respect to these specific matters or with respect to sites formerly or currently owned or operated by the Company, off-site disposal locations used by the Company, and property owned by third parties that is near such sites, could result in future costs to the Company and such amounts could be material. Expenditures for compliance control provisions and regulations during 2014, 2013 and 2012 were not material.
Employees
The Company and its subsidiaries employed 1,431 persons at December 31, 2014, 117 of whom are covered by a collective bargaining agreement with District 10 of the International Association of Machinists. The Company is currently operating under a five-year contract with the union, which expires on October 31, 2016. The Company believes it has good relations with the union and all of its employees.
The following table sets forth certain information regarding the Executive Officers of the Registrant.
Name | Position | Age at 2/28/2015 |
Richard A. Meeusen | Chairman, President and Chief Executive Officer | 60 |
Richard E. Johnson | Senior Vice President — Finance, Chief Financial Officer and Treasurer | 60 |
Fred J. Begale | Vice President — Engineering | 50 |
William R. A. Bergum | Vice President — General Counsel and Secretary | 50 |
Gregory M. Gomez | Vice President — Flow Instrumentation | 50 |
Horst E. Gras | Vice President — International Operations | 59 |
Raymond G. Serdynski | Vice President — Manufacturing | 58 |
Beverly L. P. Smiley | Vice President — Controller | 65 |
Kimberly K. Stoll | Vice President — Sales and Marketing | 48 |
There are no family relationships between any of the executive officers. Officers are elected annually at the first meeting of the Board of Directors held after each annual meeting of the shareholders. Each officer holds office until his or her successor has been elected or until his or her death, resignation or removal. There is no arrangement or understanding between any executive officer and any other person pursuant to which he or she was elected as an officer.
Mr. Meeusen has served as Chairman, President and Chief Executive Officer for more than five years.
Mr. Johnson has served as Senior Vice President - Finance, Chief Financial Officer and Treasurer for more than five years.
Mr. Begale was elected Vice President - Engineering in December 2010. Mr. Begale served as Vice President - Business Development from April 2009 to December 2010.
Mr. Bergum has served as Vice President - General Counsel and Secretary for more than five years.
Mr. Gomez became Vice President - Flow Instrumentation in September 2014. Mr. Gomez served as Vice President - Business Development from December 2010 to September 2014, and served as Vice President - Engineering from February 2008 to December 2010.
Mr. Gras has served as Vice President - International Operations for more than five years.
5
Mr. Serdynski has served as Vice President - Manufacturing for more than five years.
Ms. Smiley has served as Vice President - Controller for more than five years.
Ms. Stoll was elected Vice President - Sales and Marketing in February 2012. Ms. Stoll served as Vice President - Marketing from April 2009 to February 2012.
Foreign Operations and Export Sales
The Company distributes its products through employees, resellers and representatives throughout the world. Additionally, the Company has a sales, distribution and manufacturing facility in Neuffen, Germany; sales and customer service offices in Mexico, Singapore, China and Slovakia; manufacturing facilities in Nogales, Mexico; and manufacturing and sales facilities in Brno, Czech Republic and Bern, Switzerland. The Company exports products from the United States that are manufactured in Milwaukee, Wisconsin; Racine, Wisconsin; Tulsa, Oklahoma; and Scottsdale, Arizona.
Information about the Company's foreign operations and export sales is included in Note 10 “Industry Segment and Geographic Areas” in the Notes to Consolidated Financial Statements in Part II, Item 8 of this 2014 Annual Report on Form 10-K.
Financial Information about Industry Segments
The Company operates in one industry segment as an innovator, manufacturer and marketer of products incorporating flow measurement and control technologies as described in Note 10 “Industry Segment and Geographic Areas” in the Notes to Consolidated Financial Statements in Part II, Item 8 of this 2014 Annual Report on Form 10-K.
ITEM 1A. RISK FACTORS
Shareholders, potential investors and other readers are urged to consider the significant business risks described below in addition to the other information set forth or incorporated by reference in this 2014 Annual Report on Form 10-K, including the “Special Note Regarding Forward Looking Statements” at the front of this 2014 Annual Report on Form 10-K. If any of the events contemplated by the following risks actually occur, our financial condition or results of operations could be materially adversely affected. The following list of risk factors may not be exhaustive. We operate in a continually changing business, economic and geopolitical environment, and new risk factors may emerge from time to time. We can neither predict these new risk factors with certainty nor assess the precise impact, if any, on our business, or the extent to which any factor, or combination of factors, may adversely impact our results of operations. While there is much uncertainty, we do analyze the risks we face, perform a probability assessment of their impacts and attempt to soften their potential impact when and if possible.
Competitive pressures in the marketplace could decrease our revenues and profits.
Competitive pressures in the marketplace for our products could adversely affect our competitive position, leading to a possible loss of market share or a decrease in prices, either of which could result in decreased revenues and profits. We operate in an environment where competition varies from moderate to intense and a number of our competitors have greater financial resources. Our competitors also include alliance partners that sell products that do or may compete with our products, particularly those that provide radio solutions. The principal elements of competition for our most significant product applications, residential and commercial water meters for the municipal water utility market (with various radio technology systems), are price, product technology, quality and service. The competitive environment is also affected by the movement toward radio technologies and away from manually read meters, the demand for replacement units and, to some extent, such things as global economic conditions, the timing and size of governmental programs such as stimulus fund programs, the ability of municipal water utility customers to authorize and finance purchases of our products, our ability to obtain financing, housing starts in the United States, and overall economic activity. For our industrial flow and specialty products, the competitive environment is affected by the general economic health of various industrial sectors particularly in the United States and Europe.
6
The inability to develop technologically advanced products could harm our future success.
We believe that our future success depends, in part, on our ability to develop technologically advanced products that meet or exceed appropriate industry standards. Although we believe that we currently have a competitive advantage in this area, maintaining such advantage will require continued investment in research and development, sales, marketing and manufacturing capabilities. There can be no assurance that we will have sufficient resources to make such investments or that we will be able to make the technological advances necessary to maintain such competitive advantage. If we are unable to maintain our competitive advantage, our future financial performance may be adversely affected. We are not currently aware of any emerging standards or new products that could render our existing products obsolete in the near term. The water utility industry is beginning to see the adoption of electronic (static) water meters. Electronic water metering has lower barriers to entry that could affect the competitive landscape in North America. We believe we have a competitive product if the adoption rate for electronic meters were to accelerate.
The inability to obtain adequate supplies of raw materials and component parts at favorable prices could decrease our profit margins and negatively impact timely delivery to customers.
We are affected by the availability and prices for raw materials, including purchased castings made of metal or alloys (such as brass, which uses copper as its main component, aluminum, stainless steel and cast iron), plastic resins, glass, microprocessors and other electronic subassemblies, and components that are used in the manufacturing process. The inability to obtain adequate supplies of raw materials and component parts for our products at favorable prices could have a material adverse effect on our business, financial condition or results of operations by decreasing profit margins and by negatively impacting timely deliveries to customers. In the past, we have been able to offset increases in raw materials and component parts by increased sales prices, active materials management, product engineering programs and the diversity of materials used in the production processes. However, we cannot be certain that we will be able to accomplish this in the future. Since we do not control the actual production of these raw materials and component parts, there may be delays caused by an interruption in the production or transportation of these materials for reasons that are beyond our control. World commodity markets and inflation may also affect raw material and component part prices.
New regulations related to conflict minerals may force us to incur additional expenses.
The Securities and Exchange Commission has adopted disclosure requirements related to certain minerals sourced from the Democratic Republic of Congo and surrounding countries, or “conflict minerals,” that are necessary to the functionality of a product manufactured, or contracted to be manufactured, by a Securities and Exchange Commission reporting company. The minerals that the final rules cover are commonly referred to as “3TG” and include tin, tantalum, tungsten and gold. Implementation of the new disclosure requirements could affect the sourcing and availability of some of the materials that we use in the manufacture of our products. Our supply chain is complex, and if we are not able to determine the origins for all conflict minerals used in our products or that our products are “conflict free,” then we may face reputational challenges with customers or investors. We could also incur significant costs related to the compliance process, including potential difficulty or added costs in satisfying the disclosure and audit requirements.
Economic conditions could cause a material adverse impact on our sales and operating results.
As a supplier of products, the majority of which are to water utilities, we may be adversely affected by global economic conditions, delays in governmental programs created to stimulate the economy, and the impact of government budget cuts or partial shutdowns of governmental operations that affect our customers, including independent distributors, large city utilities, private water companies and numerous smaller municipal water utilities. These customers may delay capital projects, including non-critical maintenance and upgrades, or may not have the ability to authorize and finance purchases during economic downturns or instability in world markets. We also sell products for other applications to reduce our dependency on the municipal water market. A significant downturn in this market could cause a material adverse impact on sales and operating results. Therefore, a downturn in general economic conditions, as well as in the municipal water market, and delays in the timing or amounts of possible economic stimulus fund programs, government budget cuts or partial shutdowns of governmental operations, or the availability of funds to municipalities could result in a reduction in demand for our products and services and could harm the business.
Unusual weather and other natural phenomena could adversely affect our business.
Our sales may be adversely affected by unusual weather and natural phenomena that could have an impact on the timing of orders in given periods, depending on the particular mix of customers being served by us at the time.
7
Failure to manufacture quality products could have a material adverse effect on our business.
If we fail to maintain and enforce quality control and testing procedures, our products will not meet required performance standards. Product quality and performance are a priority for us since our products are used in various applications where precise control of fluids is essential. Although we believe we have a very good reputation for product quality, any future production and/or sale of substandard products would seriously harm our reputation, resulting in both a loss of current customers to competitors and damage to our ability to attract new customers. In addition, if any of our products prove to be defective, we may be required to participate in a recall involving such products. A successful claim brought against us with respect to a defective product in excess of available insurance coverage, if any, or a requirement to participate in a major product recall, could have a material adverse effect on our business, results of operations or financial condition.
Litigation against us could be costly, time consuming to defend and could adversely affect our profitability.
From time to time, we are subject to legal proceedings and claims that arise in the ordinary course of business. For example, we may be subject to workers' compensation claims, employment/labor disputes, customer and supplier disputes, product liability claims, intellectual property disputes and contractual disputes related to warranties arising out of the conduct of our business. Litigation may result in substantial costs and may divert management's attention and resources, which could adversely affect our profitability or financial condition.
If our technology products do not operate as intended, our business could be materially and adversely affected.
We sell and install software products that may contain unexpected design defects or may encounter unexpected complications during installation or when used with other technologies utilized by the customer. A failure of our technology products to operate as intended and in a seamless fashion with other products could materially and adversely affect our results of operations, financial position and cash flows.
Disruptions and other damages to our information technology and other networks and operations, and breaches in data security could have a negative financial impact and damage our reputation.
Our ability to serve customers, as well as increase revenues and control costs, depends in part on the reliability of our sophisticated technologies and system networks. We use information technology and other systems to manage our business in order to maximize our revenue, effectiveness and efficiency. Unauthorized parties gaining access to digital systems and networks for purposes of misappropriating assets or sensitive financial, medical or other personal or business information, corrupting data, causing operational disruptions and other cyber-related risks could adversely impact our customer relationships, business plans and our reputation. In some cases, we are dependent on third-party technologies and service providers for which there is no certainty of uninterrupted availability or through which hackers could gain access to sensitive information. These potential disruptions and cyber-attacks could negatively affect revenues, costs, customer demand, system availability and our reputation.
If we are not able to protect our proprietary rights to our software and related products, our ability to market our software products could be hindered and our results of operations, financial position and cash flows could be materially and adversely affected.
We rely on our agreements with customers, confidentiality agreements with employees, and our trademarks, trade secrets, copyrights and patents to protect our proprietary rights. These legal protections and precautions may not prevent misappropriation of our proprietary information. In addition, substantial litigation regarding intellectual property rights exists in the software industry, and software products may increasingly be subject to third-party infringement claims. Such litigation and misappropriation of our proprietary information could hinder our ability to market and sell products and services and our results of operations, financial position and cash flows could be materially and adversely affected.
8
Changes in environmental or regulatory requirements could entail additional expenses that could decrease our profitability.
We cannot predict the nature, scope or effect of future environmental or regulatory requirements to which our operations might be subject or the manner in which existing or future laws will be administered or interpreted. Compliance with such laws or regulations may entail additional expenses that could decrease profitability. We are subject to a variety of environmental laws, such as lead content in certain meters incorporating brass housings, and regulatory laws affecting the use and/or licensing of radio frequencies necessary for radio products, as well as regulations related to customs and trade practices. Currently, the cost of complying with existing laws is included as part of our on-going expenses and does not have a material effect on our business or financial position, but a change in the future could adversely affect our profitability.
Risks related to foreign markets could decrease our profitability.
Since we sell products worldwide as well as manufacture products in several countries, we are subject to risks associated with doing business internationally. These risks include such things as changes in foreign currency exchange rates, changes in political or economic conditions of specific countries or regions, potentially negative consequences from changes in tax laws or regulatory requirements, differing labor regulations and the difficulty of managing widespread operations.
An inability to attract and retain skilled employees could negatively impact our growth and decrease our profitability.
Our success depends on our continued ability to identify, attract, develop and retain skilled personnel throughout our organization. Current and future compensation arrangements, including benefits, may not be sufficient to attract new employees or retain existing employees, which may hinder our growth.
Rising healthcare and retirement benefit costs could increase cost pressures and decrease our profitability.
We estimate liabilities and expenses for retirement plans and other postretirement benefits that require the use of assumptions relating to the rates used to discount the future estimated liability, rate of return on any assets and various assumptions related to the age and cost of the workforce. Actual results may differ from the estimates and have a material adverse effect on future results of operations or on the financial statements as a whole. Rising healthcare and retirement benefit costs in the United States may also add to cost pressures and decrease our profitability.
A failure to maintain good corporate governance practices could damage our reputation and adversely affect our future success.
We have a history of good corporate governance, including procedures and processes that are required by the Sarbanes-Oxley Act of 2002 and related rules and regulations, such as board committee charters, and a code of business conduct that defines how employees interact with our various stakeholders and addresses issues such as confidentiality, conflict of interest and fair dealing, and applicable exchange listing standards. Failure to maintain these corporate governance practices could harm our reputation and have a material adverse effect on our business and results of operations.
Failure to successfully identify, complete and integrate acquired businesses or products could adversely affect our operations.
As part of our business strategy, we continue to evaluate and may pursue selected business or product acquisition opportunities that we believe may provide us with certain operating and financial benefits. There can be no assurance that we will identify or complete transactions with suitable acquisition candidates in the future. If we complete any such acquisitions, they may require integration into our existing business with respect to administrative, financial, sales, marketing, manufacturing and other functions to realize these anticipated benefits. If we are unable to successfully integrate a business or product acquisition, we may not realize the benefits identified in our due diligence process, and our financial results may be negatively impacted. Additionally, significant unexpected liabilities may arise during or after completion of an acquisition.
ITEM 1B. UNRESOLVED STAFF COMMENTS
None.
9
ITEM 2. PROPERTIES
The principal facilities utilized by the Company at December 31, 2014 are listed below. The Company owns all such facilities in fee simple except as noted. The Company believes that its facilities are generally well maintained and have sufficient capacity for its current needs.
Approximate area | |||||||
Location | Principal use | (square feet) | |||||
Scottsdale, Arizona, USA | Manufacturing and offices | 32,000 | (1 | ) | |||
Los Gatos, California, USA | Offices | 2,000 | (2 | ) | |||
Centennial, Colorado, USA | Distribution and offices | 12,000 | |||||
Tulsa, Oklahoma, USA | Manufacturing and offices | 59,500 | |||||
Milwaukee, Wisconsin, USA | Manufacturing and offices | 323,500 | |||||
Racine, Wisconsin, USA | Manufacturing and offices | 134,300 | (3 | ) | |||
Brno, Czech Republic | Manufacturing and offices | 32,000 | |||||
Neuffen, Germany | Manufacturing and offices | 24,700 | |||||
Nogales, Mexico | Manufacturing and offices | 181,300 | |||||
Bern, Switzerland | Manufacturing and offices | 1,100 | (4 | ) | |||
(1) Leased facility. Lease term expires September 1, 2019.
(2) Leased facility. Lease term expires March 31, 2016.
(3) Leased facility. Lease term expires December 31, 2025.
(4) Building is owned, but land is leased from the government. Lease term expires October 18, 2021.
ITEM 3. LEGAL PROCEEDINGS
In the normal course of business, the Company is named in legal proceedings from time to time. There are currently no material legal proceedings pending with respect to the Company. The more significant legal proceedings are discussed below.
Like other companies in recent years, the Company is named as a defendant in numerous pending multi-claimant/multi-defendant lawsuits alleging personal injury as a result of exposure to asbestos, manufactured by third parties, and integrated into or sold with a very limited number of the Company’s products. The Company is vigorously defending itself against these claims. Although it is not possible to predict the ultimate outcome of these matters, the Company does not believe the ultimate resolution of these issues will have a material adverse effect on the Company’s financial position or results of operations, either from a cash flow perspective or on the financial statements as a whole. This belief is based in part on the fact that no claimant has proven or substantially demonstrated asbestos exposure caused by products manufactured or sold by the Company and that a number of cases have been voluntarily dismissed.
The Company is subject to contingencies related to environmental laws and regulations. Information about the Company's compliance with environmental regulations is included in Part I, Item 1 of this 2014 Annual Report on Form 10-K under the heading “Environmental Protection.”
ITEM 4. MINE SAFETY DISCLOSURES
Not applicable.
10
PART II
ITEM 5. MARKET FOR THE REGISTRANT'S COMMON STOCK, RELATED STOCKHOLDER MATTERS AND ISSUER PURCHASES OF EQUITY SECURITIES
Information required by this Item is set forth in Note 11 “Unaudited: Quarterly Results of Operations, Common Stock Price and Dividends” in the Notes to Consolidated Financial Statements in Part II, Item 8 of this 2014 Annual Report on Form 10-K.
The following information in Item 5 of this Annual Report on Form 10-K is not deemed to be “soliciting material” or to be “filed” with the Securities and Exchange Commission or subject to Regulation 14A or 14C under the Securities Exchange Act of 1934, as amended, or to the liabilities of Section 18 of the Securities Exchange Act of 1934, as amended, and will not be deemed to be incorporated by reference into any filing under the Securities Act of 1933, as amended, or the Securities Exchange Act of 1934, as amended, except to the extent the Company specifically incorporates it by reference into such a filing.
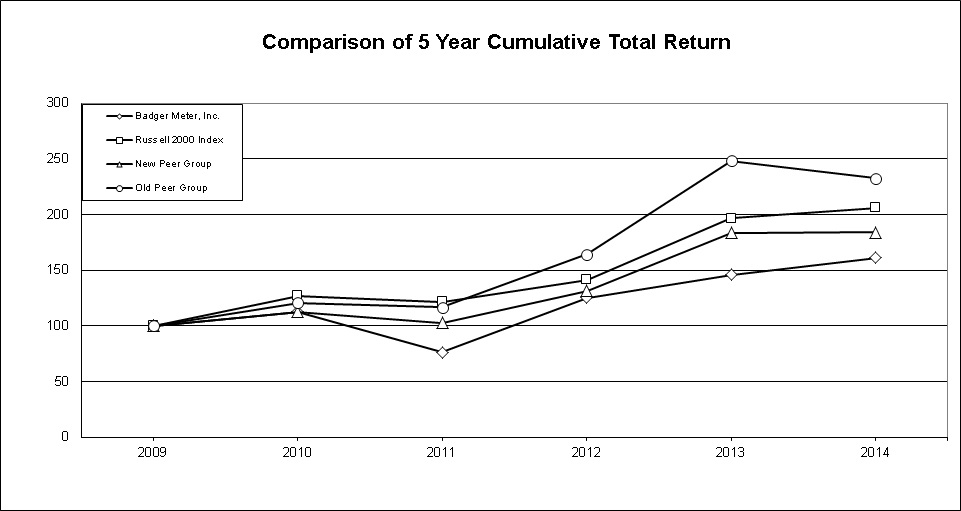
The following graph compares on a cumulative basis the yearly percentage change since January 1, 2010 in (a) the total shareholder return on the Common Stock with (b) the total return on the Russell 2000 Index, and (c) the total return of the new peer group made up of 15 companies in similar industries and with similar market capitalization, and (d) the total return of the old peer group made up of 11 companies.
The Company has chosen this new peer group of 15 companies because, over the years, the old peer group had decreased to only 11 companies as a result of the companies being acquired. The Board of Directors believed that the old peer group had become too small to provide a fair comparison to our performance. During 2014, the Compensation Committee had requested that Towers Watson, an independent consulting firm, develop a list of comparable publicly-held manufacturing companies. The Board of Directors then selected 15 companies from that list as the new peer group, concluding that those 15 companies most closely compared to the Company with regard to operations and market size.
The graph assumes $100 invested on December 31, 2009. It further assumes the reinvestment of dividends. The returns of each component company in the peer groups have been weighted based on such company's relative market capitalization.
11
December 31 | 2009 | 2010 | 2011 | 2012 | 2013 | 2014 | |
Badger Meter, Inc. | Return % | 12.55% | (32.27)% | 63.98% | 16.64% | 10.43% | |
Cumulative $ | $100.00 | $112.55 | $76.23 | $125.00 | $145.79 | $161.01 | |
Russell 2000 Index | Return % | 26.81% | (4.18)% | 16.37% | 38.82% | 4.90% | |
Cumulative $ | $100.00 | $126.81 | $121.52 | $141.42 | $196.32 | $205.93 | |
New Peer Group | Return % | 12.65% | (8.81)% | 28.04% | 39.37% | 0.27% | |
Cumulative $ | $100.00 | $112.65 | $102.73 | $131.53 | $183.32 | $183.81 | |
New Peer Group with Badger Meter, Inc. | Return % | 12.64% | (9.90)% | 29.30% | 38.52% | 0.58% | |
Cumulative $ | $100.00 | $112.64 | $101.49 | $131.22 | $181.77 | $182.83 | |
Old Peer Group | Return % | 20.53% | (3.29)% | 40.87% | 51.09% | (6.42)% | |
Cumulative $ | $100.00 | $120.53 | $116.57 | $164.22 | $248.13 | $232.20 | |
Old Peer Group with Badger Meter, Inc. | Return % | 19.95% | (5.26)% | 41.99% | 49.52% | (5.84)% | |
Cumulative $ | $100.00 | $119.95 | $113.64 | $161.36 | $241.27 | $227.19 | |
The new Peer Group consists of A.O. Smith Corp. (AOS), Badger Meter, Inc. (BMI), CIRCOR International, Inc. (CIR), CLARCOR Inc. (CLC), ESCO Technologies Inc. (ESE), Franklin Electric Co, Inc. (FELE), Fuel Systems Solutions, Inc. (FSYS), Gorman-Rupp Company (GRC), Itron, Inc. (ITRI), Lindsay Corporation (LNN), MFRI, Inc. (MFRI), Mueller Water Products (MWA), Northwest Pipe Company (NWPX) , Rexnord Corporation (RXN), Sun Hydraulics Corporation (SNHY), and Watts Water Technologies, Inc. (WTS).
The old Peer Group consists of A.O. Smith Corp. (AOS), Badger Meter, Inc. (BMI), CIRCOR International, Inc. (CIR), Colfax Corporation (CFX), ESCO Technologies Inc. (ESE), Franklin Electric Co, Inc. (FELE), Fuel Systems Solutions, Inc. (FSYS), Gorman-Rupp Company (GRC), Lindsay Corporation (LNN), MFRI, Inc. (MFRI), Mueller Water Products (MWA), and Watts Water Technologies, Inc. (WTS).
12
ITEM 6. SELECTED FINANCIAL DATA
BADGER METER, INC.
Ten Year Summary of Selected Consolidated Financial Data
Years ended December 31, | ||||||||||
(In thousands except per share data) | 2014 | 2013 | 2012 | 2011 | 2010 | 2009 | 2008 | 2007 | 2006 | 2005 |
Operating results | ||||||||||
Net sales | $364,768 | 334,122 | 319,660 | 262,915 | 276,634 | 250,337 | 279,552 | 234,816 | 229,754 | 203,637 |
Research and development | $9,496 | 10,504 | 9,567 | 8,086 | 7,164 | 6,910 | 7,136 | 5,714 | 5,458 | 5,343 |
Earnings from continuing operations before income taxes | $44,912 | 38,009 | 43,471 | 27,349 | 44,438 | 42,333 | 39,555 | 29,325 | 27,489 | 25,664 |
Earnings from continuing operations | $29,678 | 24,617 | 28,032 | 19,161 | 28,662 | 26,780 | 25,084 | 18,386 | 16,568 | 16,164 |
Earnings (loss) from discontinued operations (1) | $ n/a | n/a | n/a | n/a | n/a | 7,390 | n/a | (1,929) | (9,020) | (2,911) |
Net earnings | $29,678 | 24,617 | 28,032 | 19,161 | 28,662 | 34,170 | 25,084 | 16,457 | 7,548 | 13,253 |
Earnings from continuing operations to sales | 8.1% | 7.4% | 8.8% | 7.3% | 10.4% | 10.7% | 9.0% | 7.8% | 7.2% | 7.4% |
Per Common share | ||||||||||
Basic earnings from continuing operations | $2.07 | 1.71 | 1.96 | 1.28 | 1.92 | 1.81 | 1.72 | 1.29 | 1.19 | 1.20 |
Basic earnings (loss) from discontinued operations | $ n/a | n/a | n/a | n/a | n/a | 0.50 | n/a | (0.13) | (0.65) | (0.22) |
Total basic earnings | $2.07 | 1.71 | 1.96 | 1.28 | 1.92 | 2.31 | 1.72 | 1.16 | 0.54 | 0.98 |
Diluted earnings from continuing operations | $2.06 | 1.70 | 1.95 | 1.27 | 1.91 | 1.79 | 1.69 | 1.26 | 1.15 | 1.15 |
Diluted earnings (loss) from discontinued operations | $ n/a | n/a | n/a | n/a | n/a | 0.49 | n/a | (0.13) | (0.63) | (0.20) |
Total diluted earnings | $2.06 | 1.70 | 1.95 | 1.27 | 1.91 | 2.28 | 1.69 | 1.13 | 0.52 | 0.95 |
Cash dividends declared: Common Stock | $0.74 | 0.70 | 0.66 | 0.60 | 0.52 | 0.46 | 0.40 | 0.34 | 0.31 | 0.29 |
Price range - high | $60.91 | 56.36 | 48.60 | 45.47 | 45.49 | 44.90 | 62.74 | 46.43 | 32.20 | 25.63 |
Price range - low | $46.47 | 41.88 | 29.30 | 26.86 | 32.58 | 22.50 | 17.58 | 23.00 | 19.51 | 13.23 |
Closing price | $59.35 | 54.50 | 47.41 | 29.43 | 44.22 | 39.82 | 29.02 | 44.95 | 27.70 | 19.62 |
Book value * | $14.82 | 13.64 | 11.96 | 11.85 | 11.19 | 9.65 | 7.50 | 6.33 | 5.07 | 5.36 |
Shares outstanding at year-end | ||||||||||
Common Stock | 14,461 | 14,412 | 14,314 | 15,123 | 15,048 | 14,973 | 14,808 | 14,519 | 14,154 | 13,696 |
Financial position | ||||||||||
Working capital * | $34,030 | 29,122 | 27,294 | 78,782 | 64,658 | 60,419 | 35,740 | 38,725 | 33,648 | 32,923 |
Current ratio * | 1.3 to 1 | 1.3 to 1 | 1.3 to 1 | 4.5 to 1 | 3.0 to 1 | 3.3 to 1 | 1.7 to 1 | 1.9 to 1 | 1.7 to 1 | 1.8 to 1 |
Net cash provided by operations | $35,735 | 34,818 | 34,802 | 31,317 | 18,396 | 36,588 | 26,143 | 27,934 | 16,750 | 18,361 |
Capital expenditures | $12,332 | 14,311 | 8,202 | 5,336 | 9,238 | 7,750 | 13,237 | 15,971 | 11,060 | 9,088 |
Total assets | $341,158 | 316,058 | 290,453 | 218,910 | 215,864 | 191,016 | 195,358 | 150,301 | 139,383 | 145,867 |
Short-term and current portion of long-term debt | $75,927 | 70,045 | 66,730 | 1,790 | 12,878 | 8,003 | 19,670 | 13,582 | 17,037 | 13,328 |
Long-term debt | $ n/a | n/a | n/a | n/a | n/a | n/a | 5,504 | 3,129 | 5,928 | 15,360 |
Shareholders' equity (2) | $214,331 | 196,563 | 171,247 | 179,281 | 168,383 | 144,461 | 111,023 | 91,969 | 71,819 | 73,416 |
Debt as a percent of total debt and equity * | 26.2% | 26.3% | 28.0% | 1.0% | 7.1% | 5.2% | 18.5% | 15.4% | 26.8% | 30.1% |
Return on shareholders' equity * | 13.8% | 12.5% | 16.4% | 10.7% | 17.0% | 18.5% | 22.6% | 20.0% | 23.1% | 22.0% |
Price/earnings ratio * | 28.8 | 32.1 | 24.3 | 23.2 | 23.2 | 22.2 | 17.2 | 35.7 | 24.1 | 17.1 |
(1) The Company's French operations have been presented as discontinued operations through 2007, the years of ownership. In 2009, discontinued operations represented the recognition of previously unrecognized tax benefits for certain deductions that were taken on prior tax returns related to the shutdown of the Company's French operations.
13
(2) The Company adopted the provisions of the Financial Accounting Standards Board Accounting Standards Codification 715, “Compensation - Retirement Benefits” on December 31, 2006, with respect to recognizing the funded status of pension and postretirement benefit plans, and at December 31, 2008, with respect to changing the measurement date.
*Description of calculations as of the applicable year end:
Book value per share equals total shareholders' equity at year-end divided by the number of common shares outstanding.
Working capital equals total current assets less total current liabilities.
Current ratio equals total current assets divided by total current liabilities.
Debt as a percent of total debt and equity equals total debt (the sum of short-term debt, current portion of long-term debt and long-term debt) divided by the sum of total debt and total shareholders' equity at year-end. The debt of the discontinued French operations is included in this calculation through 2007, the years of ownership, although there was no debt at the end of 2007 related to the French operations.
Return on shareholders' equity equals earnings from continuing operations divided by total shareholders' equity at year-end.
Price/earnings ratio equals the year-end closing stock price for common stock divided by diluted earnings per share from continuing operations.
ITEM 7. MANAGEMENT'S DISCUSSION AND ANALYSIS OF FINANCIAL CONDITION AND RESULTS OF OPERATIONS
BUSINESS DESCRIPTION AND OVERVIEW
Badger Meter is an innovator in flow measurement and control products, serving water utilities, municipalities, and commercial and industrial customers worldwide. The Company’s products measure water, oil, chemicals and other fluids, and are known for accuracy, long-lasting durability and for providing valuable and timely measurement data. The Company’s product lines fall into three categories: sales of water meters and related technologies to municipal water utilities (municipal water), sales of meters to various industries for water and other fluids (flow instrumentation), and sales of gas meter radios and concrete vibrators to unique markets (specialty products). The Company estimates that over 75% of its products are used in water applications when all categories are grouped together.
Municipal water, the largest category by sales volume, includes mechanical and electronic (static) water meters and related technologies and services used by water utilities as the basis for generating water and wastewater revenues. The key market for the Company’s water meter products is North America, primarily the United States, because most meters are designed and manufactured to conform to standards promulgated by the American Water Works Association. The majority of water meters sold continues to be mechanical in nature. In recent years, the Company has made inroads in selling electronic (static) meters. This recent development of static water meters combined with updated radio technology now provides the Company with the opportunity to sell into other geographical markets, for example Europe, Middle East and South America. In the municipal water category, sales of water meters and related technologies and services are commonly referred to as residential or commercial water meter sales, the latter referring to larger sizes of meters.
Flow instrumentation includes meters and valves sold worldwide to measure and control materials flowing through a pipe or pipeline including water, air, steam, oil, and other liquids and gases. These products are used in a variety of applications, such as water/wastewater; heating, ventilating and air conditioning (HVAC); oil and gas; chemical and petrochemical; food and beverage; and pharmaceutical production. Furthermore, the Company’s flow measurement technologies are sold to original equipment manufacturers as the primary flow measurement device within a product or system.
Specialty products include sales of radio technology to natural gas utilities for installation on their gas meters, and concrete vibrators used in the concrete construction process.
Residential and commercial water meters are generally classified as either manually read meters or remotely read meters via radio technology. A manually read meter consists of a water meter and a register that gives a visual meter reading display. Meters equipped with radio transmitters (endpoints) use encoder registers to convert the measurement data from the meter (mechanical or static) into an encrypted digital format which is then transmitted via radio frequency to a receiver that collects and formats the data appropriately for water utility billing systems. These remotely read, or mobile, systems are either automatic meter reading (AMR) systems, where a vehicle equipped for meter reading purposes, including a radio receiver, computer and reading software, collects the data from utilities’ meters; or fixed network advanced metering infrastructure (AMI) systems, where data is gathered utilizing a network of permanent data collectors or gateway receivers that are always active or listening for the radio transmission from the utilities’ meters. AMI systems eliminate the need for utility personnel to drive through service territories to collect meter reading data. These systems provide the utilities with more frequent and diverse data at specified intervals from the utilities’ meters.
14
In 2011, the Company introduced what it believes is the next generation of metering technology, advanced metering analytics (AMA), along with a host of automated utility management tools to facilitate the ability of water and gas utilities to increase their productivity and revenue, as well as proactively utilize their data. AMA is comprised of both software and hardware, including the ORION® SE two-way fixed network or GALAXY® one-way fixed network technology, which is complemented by a family of highly accurate and reliable water meters.
The ORION SE system can operate in either a mobile or fixed network mode depending on the deployment needs of the utility. For example, a water or gas utility can begin deployment in mobile mode and transition to a fixed network system without visiting the endpoint. Once deployed, if the system is operating in fixed network mode and the gateway data collector stops functioning, the endpoint will continue to send data that can be captured by a mobile system. Once the gateway data collector functions again, the utility will again receive data through the fixed network system.
In January 2014, the Company enhanced its AMA offering by launching its new BEACON® AMA system. BEACON AMA combines the BEACON analytical software suite with proven ORION AMI technology using fixed and cellular networks in a managed solution, improving utilities’ visibility of their water consumption and reducing the need for costly infrastructure. With the release of BEACON AMA, the Company became the first major worldwide water meter company to release a cost-effective cellular-based solution for system-wide deployment. BEACON AMA enables two-way communication between the water meter and the meter reading system.
The BEACON AMA secure, hosted software suite includes a customizable dashboard, the ability to establish alerts for specific conditions, and consumer engagement tools that allow end water customers to view and manage their water usage activity. Benefits to the utility include improved customer service, increased visibility through faster leak detection, the ability to promote and quantify the effects of its water conservation efforts, and easier compliance reporting.
The Company’s net sales and corresponding net earnings depend on unit volume and product mix, with the Company generally earning higher margins on meters equipped with radio technology. In addition to selling its proprietary radio products, including the ORION and GALAXY radio technologies combined with the BEACON AMI/AMA software, the Company also remarkets the Itron® radio products under a license and distribution agreement with Itron, Inc. The Company’s proprietary radio products generally result in higher margins than the remarketed, non-proprietary technology products. The Company also sells registers and endpoints separately to customers who wish to upgrade their existing meters in the field.
The proprietary ORION endpoint technology has been licensed to other technology providers on a non-exclusive basis, including those providing radio products that communicate over power lines, broadband networks and proprietary radio frequency networks, allowing ORION a distinct advantage in the radio solutions market. In addition, the ORION universal gateway receiver transmits data over a variety of public wireless networks, which allows for strategic deployments, such as monitoring large commercial users.
Water meter replacement and the adoption and deployment of new technology comprise the majority of water meter product sales, including radio products. To a much lesser extent, housing starts also contribute to the new product sales base. Over the last decade, there has been a growing trend in the conversion from manually read water meters to radio technology. This conversion rate is accelerating and contributes to an increased water meter and radio solutions base of business. The Company estimates that less than 43% of water meters installed in the United States have been converted to a radio solutions technology. The Company’s strategy is to fulfill customers’ metering expectations and requirements with its proprietary meter reading systems or other systems available through its alliance partners in the marketplace.
Flow instrumentation and specialty products serve flow measurement and control applications across a broad industrial spectrum, occasionally with the same technologies used for municipal water sales. Specialized communication protocols that control the entire flow measurement process drive these markets. The Company’s specific flow measurement and control applications and technologies serve the flow measurement market through both customized and standard precision flow measurement technologies.
15
Business Trends
Increasingly, the electric utility industry relies on AMI technology for two-way communication to monitor and control electrical devices at the customer's site. Although the Company does not sell products for electric market applications, the trend toward AMI affects the markets in which the Company does participate, particularly for those customers in the water utility market that are interested in more frequent and diverse data collection. Specifically, AMI and AMA technologies enable water utilities to capture readings from each meter at more frequent and variable intervals. Similar to the electric utility industry in recent years, the water utility industry is beginning to see the adoption of electronic (static) meters. Electronic water metering has lower barriers to entry which could affect the competitive landscape in North America.
The Company sells its technology solutions to meet customer requirements. Since the technology products have comparable margins, any change in the mix between AMR, AMI or AMA is not expected to have a significant impact on the Company's net sales related to meter reading technology.
There are approximately 52,000 water utilities in the United States and the Company estimates that less than 43% of them have converted to a radio solutions technology. Although there is growing interest in AMI and AMA communication by water utilities, the vast majority of utilities installing such technology continue to select AMR technologies for their applications. The Company's ORION technology has experienced rapid acceptance in the United States as an increasing number of water utilities have selected ORION as their AMR solution. The Company anticipates that even with growing interest in AMI and AMA, AMR will continue to be the primary product of choice for a number of years. For many water utilities, AMR technology is simply the most cost-effective solution available today. However, with the introduction of its newer product offerings, including the recently introduced BEACON AMA system, the Company believes it is well-positioned to meet customers' future needs.
Acquisition
On October 1, 2014, the Company acquired 100% of the outstanding common stock of National Meter and Automation, Inc. (“National Meter”) of Centennial, Colorado. The purchase is estimated to add approximately $15 million of incremental annual revenues to Badger Meter, after eliminating what would be intercompany sales. National Meter was a major distributor of Badger Meter products for the municipal water utility market, serving customers in Colorado, California, Nevada, Arizona and southern Wyoming. National Meter will become a regional distribution center for Badger Meter. In addition to its primary product line of water meters and meter reading systems, National Meter provides services including meter testing, leak detection, water audits, meter and meter reading system installation and meter reading.
The total purchase consideration for National Meter was $22.9 million, which included $20.3 million in cash, a small working capital adjustment and settlement of pre-existing receivables. The Consolidated Balance Sheets at December 31, 2014 included a final $2.5 million of deferred payments, of which $2.0 million is payable in October 2015 and is recorded in payables, and $0.5 million is payable in October 2016 and is recorded in other long-term liabilities. As of December 31, 2014, the Company had not completed its analysis for estimating the fair value of the assets acquired and liabilities assumed. This acquisition is further described in Note 3 “Acquisitions” in the Notes to Unaudited Consolidated Condensed Financial Statements.
On April 1, 2013, the Company acquired 100% of the outstanding common stock of Aquacue, Inc. (“Aquacue”) of Los Gatos, California. The Aquacue acquisition provides the Company with intellectual property that complements and expands the Company’s advanced metering analytics offerings by adding an integrated software platform that allows utility managers to monitor and control their water systems, while providing water management data to consumers.
The purchase price for Aquacue was $13.8 million in cash, including a small working capital adjustment. The purchase price included a final $3.0 million payment, which was paid in 2014. This amount was recorded in payables on the Consolidated Balance Sheets at December 31, 2013. As of December 31, 2013, the Company completed its analysis for estimating the fair value of the assets acquired and liabilities assumed, and merged the Aquacue, Inc. legal entity into the Company. This acquisition is further described in Note 3 “Acquisitions” in the Notes to Unaudited Consolidated Condensed Financial Statements.
16
Revenue and Product Mix
Prior to the Company's introduction of its own proprietary radio products, for example ORION, GALAXY and BEACON, Itron water utility-related products were a dominant radio products contributor to the Company's results. Itron products are sold under an agreement between the Company and Itron, Inc. that has been renewed multiple times and is in effect until early 2016. The Company's radio products directly compete with Itron water radio products. In recent years, many of the Company's customers have selected the Company's proprietary products over Itron products. While the Company's proprietary product sales are generally greater than those of the Itron licensed products, the Company expects that Itron products will remain a significant component of sales to water utilities. Continuing substantial sales in both product lines underscores the continued acceptance of radio technology by water utilities and affirms the Company's strategy of selling Itron products in addition to its own proprietary products.
As the industry continues to evolve, the Company has been vigilant in anticipating and exceeding customer expectations. In 2011, the Company introduced AMA as a hardware and software solution for water and gas utilities, and then in early 2014 launched its new BEACON AMA system as a managed solution which it believes will help maintain the Company's position as a market leader. While results for this new product were not significant in 2014, there were a number of starter kits sold to utilities who generally field test products before making final purchase decisions.
The Company continues to seek opportunities for additional revenue enhancement. For instance, the Company is periodically asked to oversee and perform field installation of its products for certain customers. The Company assumes the role of general contractor, hiring installation subcontractors and supervising their work. The Company also supports its product and technology sales with the sale of extended service programs that provide additional services beyond the standard warranty. In recent years, the Company has sold ORION radio technology to natural gas utilities for installation on their gas meters. And most recently, the introduction of the BEACON AMA system opens the door to “software as a service” revenues. With the exception of a large sale of gas radios to one particular customer several years ago, revenues from such products and services are not yet significant and the Company is uncertain of the potential growth achievable for such products and services in future periods.
RESULTS OF OPERATIONS
Net Sales
Net sales in 2014 increased $30.7 million, or 9.2%, to $364.8 million from $334.1 million in 2013. The overall increase was due primarily to higher sales of municipal water and flow instrumentation products as a result of higher volumes of units sold and the purchase of National Meter, offset slightly by lower sales of specialty products.
Municipal water sales increased $29.0 million, or 12.5%, to $260.1 million in 2014 from $231.1 million in 2013. These sales represented 71.3% of total net sales in 2014 compared to 69.2% in 2013. Included in the increase for 2014 was $6.2 million of incremental sales associated with the acquisition of National Meter on October 1, 2014. The majority of the increase was due to higher sales of residential meters sold both with and without technology, as well as higher commercial meter sales. Sales of residential meters and related technology increased 14.6% for the year due to higher volumes of product sold, offset slightly by lower average prices. Commercial water meter sales increased 4.0% in 2014 compared to 2013 due primarily to higher volumes of product sold.
Industrial flow products represented 26.1% of total net sales in 2014 compared to 27.3% in 2013. These sales increased $3.9 million, or 4.3%, to $95.1 million from $91.2 million in 2013. Most product lines in this grouping saw higher sales driven primarily by higher volumes of product sold.
Specialty products represented 2.6% of total net sales in 2014 compared to 3.5% in 2013. These sales decreased $2.2 million in 2014, or 18.6%, to $9.6 million from $11.8 million in 2013. The decline was caused by lower sales of radios into the natural gas market, offset somewhat by increased sales of concrete vibrators.
International sales for municipal water meters and related technologies are generally made to customers in Canada and Mexico, which use similar mechanical technology and standards as customers in the U.S, although the recent introduction of electronic (static) meters allows the Company greater opportunities in other parts of the world. International sales for flow instrumentation and specialty products are generally made throughout the world. In Europe, sales are made primarily in Euros. Other international sales are made in U.S. dollars or local currencies. International sales increased 24.9% to $55.1 million in 2014 from $44.1 million in 2013 primarily due to sales of electronic (static) meters into the Middle East, overall increases in sales internationally, and slightly favorable foreign currency translation effects.
17
Net sales in 2013 increased $14.4 million, or 4.5%, to $334.1 million from $319.7 million in 2012. The overall increase was due primarily to higher sales of municipal water products as a result of higher volumes of units sold, offset somewhat by lower sales of industrial and specialty products.
Municipal water sales increased $17.9 million, or 8.4%, to $231.1 million in 2013 from $213.2 million in 2012. These sales represented 69.2% of total net sales in 2013 compared to 66.7% in 2012. The sales increase was due to higher sales of residential meters sold both with and without technology as well as higher commercial meter sales. Sales of residential meters and related technology increased 6.9% for the year due to higher volumes of product sold, slightly offset by lower average prices. Commercial water meter sales increased 15.2% in 2013 compared to 2012 due primarily to higher volumes of product sold. The Company believes the net overall increase for the year was a continuation of a return to normal buying patterns that began in 2012, although sales were negatively affected in early 2013 by a colder and snowier winter and the effects of Hurricane Sandy. In addition, part of the increase was due to additional sales to former customers of a competitor that ceased North American production of mechanical meters on June 30, 2013. The Company estimates sales to these customers were approximately $4.1 million in 2013.
Industrial flow products represented 27.3% of total net sales in 2013 compared to 29.0% in 2012. These sales decreased $1.6 million, or 1.7%, to $91.2 million from $92.8 million in 2012. Sales of products within this category were affected by general economic conditions which resulted in weaker orders.
Specialty products represented 3.5% of total net sales in 2013 compared to 4.3% in 2012. These sales decreased $1.9 million in 2013, or 13.9%, to $11.8 million from $13.7 million in 2012. The decline was caused by lower sales of radios into the natural gas market and lower sales of concrete vibrators.
International sales for municipal water meters and related technologies are generally made to customers in Canada and Mexico, which use similar mechanical technology and standards as customers in the U.S. International sales for industrial flow and specialty products are generally made throughout the world. In Europe, sales are made primarily in Euros. Other international sales are made in U.S. dollars or local currencies. International sales decreased 9.3% to $44.1 million in 2013 from $48.6 million in 2012 primarily due to the timing of large projects and general economic conditions.
Gross Margins
Gross margins as a percentage of sales were 36.0%, 35.0% and 38.2% for 2014, 2013 and 2012, respectively. The increase in 2014 from the 2013 rate was due to higher volumes of product sold, lower obsolescence expenses, lower raw material costs and favorable exchange rates, offset somewhat by a greater mix of municipal water products that carry lower margins than the flow instrumentation products, higher warranty costs, and the impacts of the integration of National Meter.
The percentage decline in 2013 from the 2012 rate was due to a higher mix of municipal water sales compared to industrial flow sales that carry higher margins, lower prices charged to the former customers of a competitor that ceased North American production of water meters, higher obsolete inventory charges, higher costs of electronics due to foreign exchange effects, and higher costs of metal alloy as the shift to lead-free brass was completed.
Operating Expenses
Selling, engineering and administration expenses in 2014 were $7.2 million, or 9.3%, higher than these expenses in 2013. Included in this increase was $2.5 million of expenses associated with National Meter, which was acquired on October1, 2014. Also included in this year’s expense were charges totaling $1.7 million (approximately $0.07 per diluted share) for due diligence and other transaction costs related to a potential acquisition that ultimately was not pursued. The remainder of the increase was due to higher employee incentive compensation due to improved financial results and normal inflationary increases, offset somewhat by lower product development costs that returned to more historic levels.
Selling, engineering and administration expenses in 2013 were $0.1 million, or 0.1%, higher than these expenses in 2012. The 2012 amounts included a $1.0 million charge related to the write down of the Company’s investment in an emerging technology company. The 2013 amounts include intangible amortization charges associated with the Aquacue acquisition, charges associated with a legal issue and normal inflationary increases. Offsetting these increases were lower employee incentive compensation and continuing cost control measures.
18
Operating Earnings
Operating earnings in 2014 increased $6.9 million, or 17.6%, to $46.0 million, compared with $39.1 million in 2013. The increase was the result of higher sales due to increased volumes of product sold at a higher gross profit percentage, offset somewhat by higher operating expenses.
Operating earnings in 2013 decreased $5.4 million, or 12.1%, to $39.1 million compared to $44.5 million in 2012. The decrease was the result of the lower gross margins resulting from the mix of sales, the lower prices charged to customers of a former competitor, higher obsolescence costs and higher alloy costs, all offset somewhat by the higher net sales.
Interest Expense, Net
Interest expense, net was $1.1 million in 2014 and 2013 due to relatively stable interest rates and similar average borrowing levels. Even with increased earnings, average borrowings remained relatively constant due to the acquisition of National Meter and increased balances of receivables and inventories.
Interest expense, net was $1.1 million in 2013 compared to $1.0 million in 2012. The slight increase was due to higher average borrowings due in part to the Aquacue acquisition in April 2013.
Income Taxes
Income taxes as a percentage of earnings before income taxes were 33.9%, 35.2% and 35.5% for 2014, 2013 and 2012, respectively. The variances in all three years presented were due primarily to the changes in state taxes depending on each year’s sales and the relationship of foreign and domestic income which were taxed at different rates, particularly in 2014 which saw higher foreign income.
Earnings and Diluted Earnings Per Share
Because of the increased operating earnings and the lower tax rate, net earnings were $29.7 million in 2014 compared to $24.6 million in 2013. On a diluted basis, earnings per share were $2.06 in 2014 compared to $1.70 in 2013.
Because of the decreased operating earnings, net earnings were $24.6 million in 2013 compared to $28.0 million in 2012. On a diluted basis, earnings per share were $1.70 in 2013 compared to $1.95 in 2012.
LIQUIDITY AND CAPITAL RESOURCES
The main sources of liquidity for the Company are cash from operations and borrowing capacity. In addition, depending on market conditions, the Company may access the capital markets to strengthen its capital position and to provide additional liquidity for general corporate purposes. Cash provided by operations in 2014 was $35.7 million compared to $34.8 million in 2013. The 2014 amount was primarily due to increased earnings, offset somewhat by an increase in inventories.
Receivables at December 31, 2014 were $54.0 million compared to $50.1 million at the end of 2013. The increase was due to the inclusion of the receivables of National Meter, which was acquired on October 1, 2014. Without National Meter, the receivable amounts between years were comparable. The Company believes its net receivables balance is fully collectible.
Inventories at December 31, 2014 were $71.8 million compared with $60.9 million at December 31, 2013. Approximately $4.5 million of the increase was due to the National Meter acquisition. The remainder of the increase was due primarily to the build-up of certain inventories prior to a planned temporary production halt to move product lines scheduled in early 2015.
Property, plant and equipment increased as a net result of capital expenditures offset by depreciation expense. Capital expenditures totaled $12.3 million in 2014 compared to $14.3 million in 2013. These amounts vary due to the timing of capital expenditures. Also included in the December 31, 2014 amount was $2.8 million of National Meter assets acquired. The Company believes it has adequate capacity to increase production levels with minimal additional capital expenditures.
19
Intangible assets increased to $61.7 million at December 31, 2014 from $57.3 million at December 31, 2013. This was the net impact of a $9.8 million increase due to the acquisition of National Meter, offset by normal amortization expense. Also, as a result of the National Meter acquisition, goodwill increased to $47.7 million at December 31, 2014 compared to $44.7 million at December 31, 2013.
The prepaid pension was $0.5 million at December 31, 2014 compared with $4.3 million at December 31, 2013. The decrease was due to a lower discount rate used to calculate the benefit obligation, as well as a change in the mortality assumptions, which in turn reduced the prepaid amount.
Short-term debt increased from December 31, 2013 to December 31, 2014 as the Company borrowed funds for its acquisition of National Meter. At the end of 2014, debt represented 26.2% of the Company’s total capitalization. None of the debt is secured by the Company’s assets.
Payables decreased at December 31, 2014 to $16.1 million compared to $18.6 million at December 31, 2013. The 2013 amount included $3.0 million owed to the sellers of Aquacue that was paid in 2014. The 2014 amount included $2.0 million owed to the sellers of National Meter that will be paid in late 2015 and early 2016. The remainder of the decrease was due to the timing of purchases and payments.
Accrued compensation and employee benefits increased to $11.9 million at December 31, 2014 from $7.3 million at December 31, 2013 primarily due to higher accrued employee incentive compensation.
The overall increase in total shareholders’ equity from $196.6 million at December 31, 2013 to $214.3 million at December 31, 2014 was principally the result of net earnings and stock options exercised, offset by an increase in Accumulated Other Comprehensive Loss as a result of unfavorable actuarial losses on the Company’s pension plan, net of their tax effect, and dividends paid.
The Company’s financial condition remains strong. In May 2012, the Company signed a credit agreement that increased its principal line of credit from $90.0 million to $125.0 million with its primary lender for a three year period. The line was reduced by $16.7 million in May 2013 and was scheduled to be reduced by a similar amount in May 2014. The Company restructured and amended this line of credit effective May 1, 2014 to a three-year $105.0 million line of credit that supports commercial paper (up to $70.0 million) and includes $5.0 million of a Euro line of credit. While the facility is unsecured, there are a number of financial covenants with which the Company is in compliance as of December 31, 2014. The Company believes that its operating cash flows, available borrowing capacity, and its ability to raise capital provide adequate resources to fund ongoing operating requirements, future capital expenditures and the development of new products. The Company continues to take advantage of its local commercial paper market and carefully monitors the current borrowing market. The Company had $37.5 million of unused credit lines available at December 31, 2014.
OFF-BALANCE SHEET ARRANGEMENTS
The Company had no off-balance sheet arrangements at December 31, 2014.
CONTRACTUAL OBLIGATIONS
In 2010, the Company restructured the outstanding debt of its Employee Savings and Stock Option Plan (the “ESSOP”) by loaning the ESSOP $0.5 million to repay a loan to a third party and loaning the ESSOP an additional $1.0 million to purchase additional shares of the Company's Common Stock for future 401(k) savings plan matches under a program that will expire on December 31, 2020. Under this program, the Company agreed to pay the principal and interest on the new loan amount of $1.5 million. The receivable from the ESSOP and the related obligation were therefore netted to zero on the Company's Consolidated Balance Sheets at December 31, 2014 and 2013. The terms of the loan call for equal payments of principal with the final payment due on December 31, 2020. At December 31, 2014, $0.9 million of the loan balance remains.
20
The following table includes the Company's significant contractual obligations as of December 31, 2014. There are no material undisclosed guarantees.
Payments due by period | |||||||||||||||||||
Total | Less than 1 year | 1-3 years | 3-5 years | Beyond | |||||||||||||||
(In thousands) | |||||||||||||||||||
Short-term debt | $ | 75,927 | $ | 75,927 | $ | — | $ | — | $ | — | |||||||||
Operating leases | 14,401 | 2,282 | 3,549 | 2,725 | 5,845 | ||||||||||||||
Total contractual obligations | $ | 90,328 | $ | 78,209 | $ | 3,549 | $ | 2,725 | $ | 5,845 | |||||||||
Other than items included in the preceding table, as of December 31, 2014, the Company had no additional material purchase obligations other than those created in the ordinary course of business related to inventory and property, plant and equipment, which generally have terms of less than 90 days. The Company also has long-term obligations related to its pension and postretirement plans which are discussed in detail in Note 7 “Employee Benefit Plans” in the Notes to Consolidated Financial Statements in Part II, Item 8 of this 2014 Annual Report on Form 10-K. As of the most recent actuarial measurement date, the Company is not required to make a minimum contribution for its pension plan for the 2015 calendar year. Postretirement medical claims are paid by the Company as they are submitted, and they are anticipated to be $0.5 million in 2015 based on actuarial estimates; however, these amounts can vary significantly from year to year because the Company is self-insured.
CRITICAL ACCOUNTING POLICIES AND USE OF ESTIMATES
The Company's accounting policies are more fully described in Note 1 “Summary of Significant Accounting Policies” in the Notes to Consolidated Financial Statements in Part II, Item 8 of this 2014 Annual Report on Form 10-K. As discussed in Note 1, the preparation of financial statements in conformity with U.S. generally accepted accounting principles requires management to make estimates and assumptions that affect the amounts reported in the financial statements and accompanying notes. The Company's more significant estimates relate primarily to the following judgmental reserves: allowance for doubtful accounts, reserve for obsolete inventories, warranty and after-sale costs reserve, and the healthcare reserve for claims incurred, but not reported. Each of these reserves is evaluated quarterly and is reviewed with the Company's internal Disclosure Committee and the Audit and Compliance Committee of the Board of Directors. The basis for the reserve amounts is determined by analyzing the anticipated exposure for each account, and then selecting the most likely amount based upon historical experience and various other considerations that are believed to be reasonable under the circumstances. These methods have been used for all years in the presented financials and have been used consistently throughout each year. Actual results may differ from these estimates if actual experiences vary from the Company's assumptions.
The criteria used for calculating each of the reserve amounts vary by type of reserve. For the allowance for doubtful accounts reserve, significant past due balances are individually reviewed for collectibility, while the balance of accounts are reviewed in conjunction with applying historical write-off ratios. The calculation for the obsolete inventories reserve is determined by analyzing the relationship between the age and quantity of items on hand versus estimated usage to determine if excess quantities exist. The calculation for warranty and after-sale costs reserve uses criteria that include known potential problems on past sales as well as historical claim experience and current warranty trends. The healthcare reserve for claims incurred, but not reported is determined by using medical cost trend analyses, reviewing subsequent payments made and estimating unbilled amounts. The changes in the balances of these reserves at December 31, 2014 compared to the prior year were due to normal business conditions and are not deemed to be significant. While the Company continually tries to improve its estimates, no significant changes in the underlying processes are expected in 2015.
21
The Company also uses estimates in four other significant areas: (i) pension and other postretirement obligations and costs, (ii) stock-based compensation, (iii) income taxes, and (iv) evaluating goodwill at least annually for impairment. The actuarial valuations of benefit obligations and net periodic benefit costs rely on key assumptions including discount rates and long-term expected returns on plan assets. The Company's discount rate assumptions for its pension and postretirement plans are based on the average yield of a hypothetical high quality bond portfolio with maturities that approximately match the estimated cash flow needs of the plans. The assumptions for expected long-term rates of return on assets for its pension plan are based on historical experience and estimated future investment returns, taking into consideration anticipated asset allocations, investment strategies and the views of various investment professionals. The total cost of the Company's stock-based awards is equal to the grant date fair value per award multiplied by the number of awards granted, adjusted for forfeitures. Forfeitures are initially estimated based on historical Company information and subsequently updated over the life of the awards to ultimately reflect actual forfeitures, which could have an impact on the amount of stock compensation cost recognized from period to period. The grant date fair value of stock options relies on assumptions including the risk-free interest rate, dividend yield, market volatility and expected option life. In calculating the provision for income taxes on an interim basis, the Company uses an estimate of the annual effective tax rate based upon the facts and circumstances known at each interim period. On a quarterly basis, the actual effective tax rate is adjusted as appropriate based upon the actual results compared to those forecasted at the beginning of the fiscal year. Deferred tax assets and liabilities are measured using enacted tax rates expected to apply to taxable income in the years in which those temporary differences are expected to be recovered or settled. The reserve for uncertainty in income taxes is a matter of judgment based on an evaluation of the individual facts and circumstances of each tax position in light of all available evidence, including historic data and current trends. A tax benefit is recognized when it is “more likely than not” to be sustained based solely on the technical merits of each tax position. The Company evaluates and updates all of these assumptions quarterly. Goodwill impairment, if any, is determined by comparing the fair value of the reporting unit with its carrying value and is reviewed at least annually. Actual results may differ from these estimates.
OTHER MATTERS
The Company is subject to contingencies related to environmental laws and regulations. The Company is named as one of many potentially responsible parties in two landfill lawsuits. The landfill sites are impacted by the Federal Comprehensive Environmental Response, Compensation and Liability Act and other environmental laws and regulations. At this time, the Company does not believe the ultimate resolution of these matters will have a material adverse effect on the Company’s financial position or results of operations, either from a cash flow perspective or on the financial statements as a whole. This belief is based on the Company’s assessment of its limited past involvement with these landfill sites as well as the substantial involvement of and government focus on other named third parties with these landfill sites. However, due to the inherent uncertainties of such proceedings, the Company cannot predict the ultimate outcome of any of these matters. A future change in circumstances with respect to these specific matters or with respect to sites formerly or currently owned or operated by the Company, off-site disposal locations used by the Company, and property owned by third parties that is near such sites, could result in future costs to the Company and such amounts could be material. Expenditures for compliance with environmental control provisions and regulations during 2014, 2013 and 2012 were not material.
Like other companies in recent years, the Company is named as a defendant in numerous pending multi-claimant/multi-defendant lawsuits alleging personal injury as a result of exposure to asbestos, manufactured by third parties, and integrated into or sold with a very limited number of the Company’s products. The Company is vigorously defending itself against these claims. Although it is not possible to predict the ultimate outcome of these matters, the Company does not believe the ultimate resolution of these issues will have a material adverse effect on the Company’s financial position or results of operations, either from a cash flow perspective or on the financial statements as a whole. This belief is based in part on the fact that no claimant has proven or substantially demonstrated asbestos exposure caused by products manufactured or sold by the Company and that a number of cases have been voluntarily dismissed.
See the “Special Note Regarding Forward Looking Statements” at the front of this Annual Report on Form 10-K and Part I, Item 1A “Risk Factors” in this Annual Report on Form 10-K for the year ended December 31, 2014 for a discussion of risks and uncertainties that could impact the Company's financial performance and results of operations.
22
MARKET RISKS
In the ordinary course of business, the Company is exposed to various market risks. The Company operates in an environment where competition varies from moderate to intense. The Company believes it currently provides the leading technology in water meters and radio systems for water utilities. A number of the Company's competitors in certain markets have greater financial resources. Competitors also include alliance partners that sell products that do or may compete with our products, particularly those that provide radio solutions. As the global water metering market begins to shift to adopt electronic (static) technology, the number of competitors may increase. In addition, the market's level of acceptance of the Company's newer product offerings, including the BEACON AMA system, may have a significant effect on the Company's results of operations. As a result of significant research and development activities, the Company enjoys favorable patent positions for several of its products.
The Company's ability to generate operating income and to increase profitability depends somewhat on the general health of the United States and foreign economies, including to some extent such things as the length and severity of global economic downturns; the timing and size of governmental programs such as stimulus fund programs, as well as the impact of government budget cuts or partial shutdowns of governmental operations; international or civil conflicts that affect international trade; the ability of municipal water utility customers to authorize and finance purchases of the Company's products; the Company's ability to obtain financing; housing starts in the United States; and overall industrial activity. In addition, changes in governmental laws and regulations, particularly laws dealing with the use of lead or rules affecting the use and/or licensing of radio frequencies necessary for radio products may impact the results of operations. These factors are largely beyond the Company's control and depend on the economic condition and regulatory environment of the geographic region of the Company's operations.
The Company relies on single suppliers for certain castings and components in several of its product lines. Although alternate sources of supply exist for these items, the loss of certain suppliers could temporarily disrupt operations in the short term. The Company attempts to mitigate these risks by working closely with key suppliers, purchasing minimal amounts from alternative suppliers and by purchasing business interruption insurance where appropriate.
Raw materials used in the manufacture of the Company's products include purchased castings made of metal or alloys (such as brass, which uses copper as its main component, aluminum, stainless steel and cast iron), plastic resins, glass, microprocessors and other electronic subassemblies and components. The Company does not hold significant amounts of precious metals. The price and availability of raw materials is influenced by economic and industry conditions, including supply and demand factors that are difficult to anticipate and cannot be controlled by the Company. Commodity risk is managed by keeping abreast of economic conditions and locking in purchase prices for quantities that correspond to the Company's forecasted usage.
The Company's foreign currency risk relates to the sales of products to foreign customers and purchases of material from foreign vendors. The Company uses lines of credit with U.S. and European banks to offset currency exposure related to European receivables and other monetary assets. As of December 31, 2014 and 2013, the Company's foreign currency net monetary assets were partially offset by comparable debt resulting in no material exposure to the results of operations. The Company believes the effect of a change in foreign currency rates will not have a material adverse effect on the Company's financial position or results of operations, either from a cash flow perspective or on the financial statements as a whole.
The Company typically does not hold or issue derivative instruments and has a policy specifically prohibiting the use of such instruments for trading purposes.
The Company's short-term debt on December 31, 2014 was floating rate debt with market values approximating carrying value. Future annual interest costs for short-term debt will fluctuate based upon short-term interest rates. For the short-term debt on hand on December 31, 2014, the effect of a 1% change in interest rates is approximately $0.8 million.
ITEM 7A. QUANTITATIVE AND QUALITATIVE DISCLOSURES ABOUT MARKET RISK
Information required by this Item is set forth in Part II, Item 7 “Management's Discussion and Analysis of Financial Condition and Results of Operations” under the heading “Market Risks” in this 2014 Annual Report on Form 10-K.
23
ITEM 8. FINANCIAL STATEMENTS AND SUPPLEMENTAL DATA
BADGER METER, INC.
Management's Annual Report on Internal Control over Financial Reporting
The Company's management is responsible for establishing and maintaining adequate internal control over financial reporting, as such term is defined in Rule 13a-15(f) under the Securities Exchange Act of 1934. The Company's internal control over financial reporting is designed to provide reasonable assurance regarding the reliability of financial reporting and the preparation of financial statements for external purposes in accordance with U.S. generally accepted accounting principles.
Due to its inherent limitations, internal control over financial reporting may not prevent or detect misstatements. Also, projections of any evaluation of effectiveness to future periods are subject to risk that controls may become inadequate because of changes in conditions, or that the degree of compliance with the policies or procedures may deteriorate.
The Company's management assessed the effectiveness of the Company's internal control over financial reporting as of December 31, 2014 using the criteria set forth in Internal Control - Integrated Framework issued by the Committee of Sponsoring Organizations of the Treadway Commission (2013 Framework). Based on this assessment, the Company's management believes that, as of December 31, 2014, the Company's internal control over financial reporting was effective based on those criteria. As allowed by the Securities and Exchange Commission guidance, management excluded from its assessment National Meter and Automation, Inc., which was acquired in 2014 and constituted 7.5% and 11.3% of total and net assets, respectively, as of December 31, 2014, and 2.8% and 3.1% of net sales and net income, respectively, for the year then ended.
Ernst & Young LLP, an independent registered public accounting firm, has audited the Consolidated Financial Statements included in this Annual Report on Form 10-K and, as part of its audit, has issued an attestation report, included herein, on the effectiveness of the Company's internal control over financial reporting.
24
BADGER METER, INC.
Report of Independent Registered Public Accounting Firm
The Board of Directors and Shareholders of Badger Meter, Inc.
We have audited Badger Meter, Inc.’s (the “Company”) internal control over financial reporting as of December 31, 2014, based on criteria established in Internal Control-Integrated Framework issued by the Committee of Sponsoring Organizations of the Treadway Commission (2013 framework) (the COSO criteria). Badger Meter, Inc.’s management is responsible for maintaining effective internal control over financial reporting, and for its assessment of the effectiveness of internal control over financial reporting included in the accompanying Management’s Annual Report on Internal Control over Financial Reporting. Our responsibility is to express an opinion on the Company’s internal control over financial reporting based on our audit.
We conducted our audit in accordance with the standards of the Public Company Accounting Oversight Board (United States). Those standards require that we plan and perform the audit to obtain reasonable assurance about whether effective internal control over financial reporting was maintained in all material respects. Our audit included obtaining an understanding of internal control over financial reporting, assessing the risk that a material weakness exists, testing and evaluating the design and operating effectiveness of internal control based on the assessed risk, and performing such other procedures as we considered necessary in the circumstances. We believe that our audit provides a reasonable basis for our opinion.
A company’s internal control over financial reporting is a process designed to provide reasonable assurance regarding the reliability of financial reporting and the preparation of financial statements for external purposes in accordance with generally accepted accounting principles. A company’s internal control over financial reporting includes those policies and procedures that (1) pertain to the maintenance of records that, in reasonable detail, accurately and fairly reflect the transactions and dispositions of the assets of the company; (2) provide reasonable assurance that transactions are recorded as necessary to permit preparation of financial statements in accordance with generally accepted accounting principles, and that receipts and expenditures of the company are being made only in accordance with authorizations of management and directors of the company; and (3) provide reasonable assurance regarding prevention or timely detection of unauthorized acquisition, use, or disposition of the company’s assets that could have a material effect on the financial statements.
Because of its inherent limitations, internal control over financial reporting may not prevent or detect misstatements. Also, projections of any evaluation of effectiveness to future periods are subject to the risk that controls may become inadequate because of changes in conditions, or that the degree of compliance with the policies or procedures may deteriorate.
As indicated in the accompanying Management’s Annual Report on Internal Control over Financial Reporting, management assessment of and conclusion on the effectiveness of internal control over financial reporting did not include the internal controls of National Meter and Automation, Inc., which is included in the 2014 consolidated financial statements of Badger Meter, Inc. and constituted 7.5% and 11.3% of total and net assets, respectively, as of December 31, 2014 and 2.8% and 3.1% of revenue and net income, respectively, for the year then ended. Our audit of internal control over financial reporting of Badger Meter, Inc. also did not include the evaluation of internal control over financial reporting of National Meter and Automation, Inc.
In our opinion, Badger Meter, Inc. maintained, in all material respects, effective internal control over financial reporting as of December 31, 2014, based on the COSO criteria.
We also have audited, in accordance with the standards of the Public Company Accounting Oversight Board (United States), the consolidated balance sheets of Badger Meter, Inc. as of December 31, 2014 and 2013, and the related consolidated statements of operations, comprehensive income, shareholders’ equity and cash flows for each of the three years in the period ended December 31, 2014 and our report dated March 4, 2015, expressed an unqualified opinion thereon.
/s/ Ernst & Young LLP
Milwaukee, Wisconsin
March 4, 2015
25
BADGER METER, INC.
Report of Independent Registered Public Accounting Firm
The Board of Directors and Shareholders of Badger Meter, Inc.
We have audited the accompanying consolidated balance sheets of Badger Meter, Inc. (the “Company”) as of December 31, 2014 and 2013, and the related consolidated statements of operations, comprehensive income, shareholders' equity and cash flows for each of the three years in the period ended December 31, 2014. These financial statements are the responsibility of the Company's management. Our responsibility is to express an opinion on these financial statements based on our audits.
We conducted our audits in accordance with the standards of the Public Company Accounting Oversight Board (United States). Those standards require that we plan and perform the audit to obtain reasonable assurance about whether the financial statements are free of material misstatement. An audit includes examining, on a test basis, evidence supporting the amounts and disclosures in the financial statements. An audit also includes assessing the accounting principles used and significant estimates made by management, as well as evaluating the overall financial statement presentation. We believe that our audits provide a reasonable basis for our opinion.
In our opinion, the financial statements referred to above present fairly, in all material respects, the consolidated financial position of Badger Meter, Inc. at December 31, 2014 and 2013, and the consolidated results of its operations and its cash flows for each of the three years in the period ended December 31, 2014, in conformity with U.S. generally accepted accounting principles.
We also have audited, in accordance with the standards of the Public Company Accounting Oversight Board (United States), Badger Meter, Inc.’s internal control over financial reporting as of December 31, 2014, based on criteria established in Internal Control-Integrated Framework issued by the Committee of Sponsoring Organizations of the Treadway Commission (2013 framework) and our report dated March 4, 2015 expressed an unqualified opinion thereon.
/s/ Ernst & Young LLP
Milwaukee, Wisconsin
March 4, 2015
26
BADGER METER, INC.
Consolidated Balance Sheets
December 31, | |||||||
2014 | 2013 | ||||||
(Dollars in thousands) | |||||||
Assets | |||||||
Current assets: | |||||||
Cash | $ | 6,656 | $ | 7,263 | |||
Receivables | 53,967 | 50,133 | |||||
Inventories: | |||||||
Finished goods | 25,362 | 17,704 | |||||
Work in process | 13,047 | 12,330 | |||||
Raw materials | 33,365 | 30,905 | |||||
Total inventories | 71,774 | 60,939 | |||||
Prepaid expenses and other current assets | 4,538 | 3,994 | |||||
Deferred income taxes | 4,170 | 4,834 | |||||
Total current assets | 141,105 | 127,163 | |||||
Property, plant and equipment, at cost: | |||||||
Land and improvements | 9,182 | 8,941 | |||||
Buildings and improvements | 57,872 | 55,018 | |||||
Machinery and equipment | 110,346 | 100,179 | |||||
177,400 | 164,138 | ||||||
Less accumulated depreciation | (95,594 | ) | (87,722 | ) | |||
Net property, plant and equipment | 81,806 | 76,416 | |||||
Intangible assets, at cost less accumulated amortization | 61,672 | 57,317 | |||||
Prepaid pension | 456 | 4,312 | |||||
Other assets | 8,397 | 6,155 | |||||
Goodwill | 47,722 | 44,695 | |||||
Total assets | $ | 341,158 | $ | 316,058 | |||
Liabilities and Shareholders’ Equity | |||||||
Current liabilities: | |||||||
Short-term debt | $ | 75,927 | $ | 70,045 | |||
Payables | 16,059 | 18,554 | |||||
Accrued compensation and employee benefits | 11,901 | 7,337 | |||||
Warranty and after-sale costs | 1,739 | 882 | |||||
Income and other taxes | 1,449 | 1,223 | |||||
Total current liabilities | 107,075 | 98,041 | |||||
Other long-term liabilities | 1,735 | 1,324 | |||||
Deferred income taxes | 6,399 | 9,790 | |||||
Accrued non-pension postretirement benefits | 6,342 | 5,934 | |||||
Other accrued employee benefits | 5,276 | 4,406 | |||||
Commitments and contingencies (Note 6) | |||||||
Shareholders’ equity: | |||||||
Common Stock, $1 par; authorized 40,000,000 shares; issued 20,522,864 shares in 2014 and 20,503,604 shares in 2013 | 20,523 | 20,504 | |||||
Capital in excess of par value | 48,353 | 45,627 | |||||
Reinvested earnings | 189,365 | 170,318 | |||||
Accumulated other comprehensive loss | (11,856 | ) | (7,524 | ) | |||
Less: Employee benefit stock | (922 | ) | (1,075 | ) | |||
Treasury stock, at cost; 6,061,671 shares in 2014 and 6,091,728 shares in 2013 | (31,132 | ) | (31,287 | ) | |||
Total shareholders’ equity | 214,331 | 196,563 | |||||
Total liabilities and shareholders’ equity | $ | 341,158 | $ | 316,058 | |||
See accompanying notes.
27
BADGER METER, INC.
Consolidated Statements of Operations
Years ended December 31, | |||||||||||
2014 | 2013 | 2012 | |||||||||
(In thousands except per share amounts) | |||||||||||
Net sales | $ | 364,768 | $ | 334,122 | $ | 319,660 | |||||
Cost of sales | 233,626 | 217,133 | 197,414 | ||||||||
Gross margin | 131,142 | 116,989 | 122,246 | ||||||||
Selling, engineering and administration | 85,095 | 77,882 | 77,777 | ||||||||
Operating earnings | 46,047 | 39,107 | 44,469 | ||||||||
Interest expense, net | 1,135 | 1,098 | 998 | ||||||||
Earnings before income taxes | 44,912 | 38,009 | 43,471 | ||||||||
Provision for income taxes | 15,234 | 13,392 | 15,439 | ||||||||
Net earnings | $ | 29,678 | $ | 24,617 | $ | 28,032 | |||||
Earnings per share: | |||||||||||
Basic | $ | 2.07 | $ | 1.71 | $ | 1.96 | |||||
Diluted | $ | 2.06 | $ | 1.70 | $ | 1.95 | |||||
Shares used in computation of earnings per share: | |||||||||||
Basic | 14,307 | 14,362 | 14,332 | ||||||||
Impact of dilutive securities | 71 | 78 | 67 | ||||||||
Diluted | 14,378 | 14,440 | 14,399 | ||||||||
See accompanying notes.
28
BADGER METER, INC.
Consolidated Statements of Comprehensive Income
Years ended December 31, | |||||||||||
2014 | 2013 | 2012 | |||||||||
(Dollars in thousands) | |||||||||||
Net earnings | $ | 29,678 | $ | 24,617 | $ | 28,032 | |||||
Other comprehensive income : | |||||||||||
Foreign currency translation adjustment | (1,721 | ) | 172 | 393 | |||||||
Pension and postretirement benefits, net of tax | (2,611 | ) | 6,252 | 225 | |||||||
Comprehensive income | $ | 25,346 | $ | 31,041 | $ | 28,650 | |||||
See accompanying notes.
29
BADGER METER, INC.
Consolidated Statements of Cash Flows
Years ended December 31, | |||||||||||
2014 | 2013 | 2012 | |||||||||
(Dollars in thousands) | |||||||||||
Operating activities: | |||||||||||
Net earnings | $ | 29,678 | $ | 24,617 | $ | 28,032 | |||||
Adjustments to reconcile net earnings to net cash provided by operations: | |||||||||||
Depreciation | 8,891 | 8,512 | 7,587 | ||||||||
Amortization | 6,773 | 4,982 | 4,467 | ||||||||
Deferred income taxes | (1,334 | ) | 1,462 | (551 | ) | ||||||
Contributions to pension plan | — | — | (1,097 | ) | |||||||
Noncurrent employee benefits | 4,417 | 1,392 | 122 | ||||||||
Stock-based compensation expense | 1,449 | 1,388 | 1,266 | ||||||||
Changes in: | |||||||||||
Receivables | (997 | ) | (3,991 | ) | 812 | ||||||
Inventories | (6,943 | ) | 247 | (4,743 | ) | ||||||
Prepaid expenses and other current assets | (2,060 | ) | 368 | (905 | ) | ||||||
Liabilities other than debt | (4,139 | ) | (4,159 | ) | (188 | ) | |||||
Total adjustments | 6,057 | 10,201 | 6,770 | ||||||||
Net cash provided by operations | 35,735 | 34,818 | 34,802 | ||||||||
Investing activities: | |||||||||||
Property, plant and equipment additions | (12,332 | ) | (14,311 | ) | (8,202 | ) | |||||
Acquisitions, net of cash acquired | (20,829 | ) | (15,401 | ) | (51,518 | ) | |||||
Net cash used for investing activities | (33,161 | ) | (29,712 | ) | (59,720 | ) | |||||
Financing activities: | |||||||||||
Net increase in short-term debt | 6,653 | 3,205 | 65,136 | ||||||||
Dividends paid | (10,633 | ) | (10,004 | ) | (9,513 | ) | |||||
Proceeds from exercise of stock options | 730 | 1,640 | 382 | ||||||||
Tax benefit on stock options | 38 | 382 | 297 | ||||||||
Repurchase of Common Stock | — | — | (30,000 | ) | |||||||
Issuance of treasury stock | 469 | 498 | 477 | ||||||||
Net cash (used for) provided by financing activities | (2,743 | ) | (4,279 | ) | 26,779 | ||||||
Effect of foreign exchange rates on cash | (438 | ) | (118 | ) | (282 | ) | |||||
(Decrease) increase in cash | (607 | ) | 709 | 1,579 | |||||||
Cash — beginning of year | 7,263 | 6,554 | 4,975 | ||||||||
Cash — end of year | $ | 6,656 | $ | 7,263 | $ | 6,554 | |||||
Supplemental disclosures of cash flow information: | |||||||||||
Cash paid during the year for: | |||||||||||
Income taxes | $ | 17,218 | $ | 15,292 | $ | 15,247 | |||||
Interest | $ | 1,144 | $ | 1,114 | $ | 1,113 | |||||
Non cash transaction: | |||||||||||
Settlement of National Meter and Automation, Inc. accounts payable prior to the acquisition | $ | 2,623 | $ | — | $ | — | |||||
See accompanying notes.
30
BADGER METER, INC.
Consolidated Statements of Shareholders’ Equity
Years ended December 31, | |||||||||||||||||||||||||||
Common Stock at $1 par value* | Capital in excess of par value | Reinvested earnings | Accumulated other comprehensive income (loss) | Employee benefit stock | Treasury stock | Total | |||||||||||||||||||||
(In thousands except per share amounts) | |||||||||||||||||||||||||||
Balance, December 31, 2011 | $ | 21,292 | $ | 39,445 | $ | 166,271 | $ | (14,566 | ) | $ | (1,485 | ) | $ | (31,676 | ) | $ | 179,281 | ||||||||||
Net earnings | — | — | 28,032 | — | — | — | 28,032 | ||||||||||||||||||||
Pension and postretirement benefits (net of $(247) tax effect) | — | — | — | 225 | — | — | 225 | ||||||||||||||||||||
Foreign currency translation | — | — | — | 393 | — | — | 393 | ||||||||||||||||||||
Cash dividends of $0.66 per share | — | — | (9,497 | ) | — | — | — | (9,497 | ) | ||||||||||||||||||
Stock options exercised | 37 | 345 | — | — | — | — | 382 | ||||||||||||||||||||
Tax benefit on stock options and dividends | — | 297 | — | — | — | — | 297 | ||||||||||||||||||||
ESSOP transactions | — | 140 | — | — | 251 | — | 391 | ||||||||||||||||||||
Stock-based compensation | — | 1,266 | — | — | — | — | 1,266 | ||||||||||||||||||||
Shares purchased and retired | (888 | ) | — | (29,112 | ) | — | — | — | (30,000 | ) | |||||||||||||||||
Issuance of treasury stock (42 shares) | — | 262 | — | — | — | 215 | 477 | ||||||||||||||||||||
Balance, December 31, 2012 | 20,441 | 41,755 | 155,694 | (13,948 | ) | (1,234 | ) | (31,461 | ) | 171,247 | |||||||||||||||||
Net earnings | — | — | 24,617 | — | — | — | 24,617 | ||||||||||||||||||||
Pension and postretirement benefits (net of $(3,826) tax effect) | — | — | — | 6,252 | — | — | 6,252 | ||||||||||||||||||||
Foreign currency translation | — | — | — | 172 | — | — | 172 | ||||||||||||||||||||
Cash dividends of $0.70 per share | — | — | (9,993 | ) | — | — | — | (9,993 | ) | ||||||||||||||||||
Stock options exercised | 63 | 1,577 | — | — | — | — | 1,640 | ||||||||||||||||||||
Tax benefit on stock options and dividends | — | 382 | — | — | — | — | 382 | ||||||||||||||||||||
ESSOP transactions | — | 201 | — | — | 159 | — | 360 | ||||||||||||||||||||
Stock-based compensation | — | 1,388 | — | — | — | — | 1,388 | ||||||||||||||||||||
Issuance of treasury stock (35 shares) | — | 324 | — | — | — | 174 | 498 | ||||||||||||||||||||
Balance, December 31, 2013 | 20,504 | 45,627 | 170,318 | (7,524 | ) | (1,075 | ) | (31,287 | ) | 196,563 | |||||||||||||||||
Net earnings | — | — | 29,678 | — | — | — | 29,678 | ||||||||||||||||||||
Pension and postretirement benefits (net of $(1,381) tax effect) | — | — | — | (2,611 | ) | — | — | (2,611 | ) | ||||||||||||||||||
Foreign currency translation | — | — | — | (1,721 | ) | — | — | (1,721 | ) | ||||||||||||||||||
Cash dividends of $0.74 per share | — | — | (10,631 | ) | — | — | — | (10,631 | ) | ||||||||||||||||||
Stock options exercised | 19 | 711 | — | — | — | — | 730 | ||||||||||||||||||||
Tax benefit on stock options and dividends | — | 38 | — | — | — | — | 38 | ||||||||||||||||||||
ESSOP transactions | — | 214 | — | — | 153 | — | 367 | ||||||||||||||||||||
Stock-based compensation | — | 1,449 | — | — | — | — | 1,449 | ||||||||||||||||||||
Issuance of treasury stock (30 shares) | — | 314 | — | — | — | 155 | 469 | ||||||||||||||||||||
Balance, December 31, 2014 | $ | 20,523 | $ | 48,353 | $ | 189,365 | $ | (11,856 | ) | $ | (922 | ) | $ | (31,132 | ) | $ | 214,331 | ||||||||||
* | Each common share of stock equals $1 par value; therefore, the number of common shares is the same as the dollar value. |
See accompanying notes.
31
BADGER METER, INC.
Notes to Consolidated Financial Statements
December 31, 2014, 2013 and 2012
Note 1 Summary of Significant Accounting Policies
Profile
Badger Meter is an innovator in flow measurement and control products, serving water utilities, municipalities, and commercial and industrial customers worldwide. The Company’s products measure water, oil, chemicals and other fluids, and are known for accuracy, long-lasting durability and for providing valuable and timely measurement data. The Company’s product lines fall into three categories: sales of water meters and related technologies to municipal water utilities (municipal water), sales of meters to various industries for water and other fluids (flow instrumentation), and sales of gas meter radios and concrete vibrators to unique markets (specialty products). The Company estimates that over 75% of its products are used in water applications when all categories are grouped together.
Municipal water, the largest category by sales volume, includes mechanical and electronic (static) water meters and related technologies and services used by water utilities as the basis for generating water and wastewater revenues. The key market for the Company’s water meter products is North America, primarily the United States, because most meters are designed and manufactured to conform to standards promulgated by the American Water Works Association. The majority of water meters sold continues to be mechanical in nature. In recent years, the Company has made inroads in selling electronic (static) meters. This recent development of static water meters combined with updated radio technology now provides the Company with the opportunity to sell into other geographical markets, for example Europe, Middle East and South America. In the municipal water category, sales of water meters and related technologies and services are commonly referred to as residential or commercial water meter sales, the latter referring to larger sizes of meters.
Flow instrumentation includes meters and valves sold worldwide to measure and control materials flowing through a pipe or pipeline including water, air, steam, oil, and other liquids and gases. These products are used in a variety of applications, such as water/wastewater; heating, ventilating and air conditioning (HVAC); oil and gas; chemical and petrochemical; food and beverage; and pharmaceutical production. Furthermore, the Company’s flow measurement technologies are sold to original equipment manufacturers as the primary flow measurement device within a product or system.
Specialty products include sales of radio technology to natural gas utilities for installation on their gas meters, and concrete vibrators used in the concrete construction process.
Consolidation
The consolidated financial statements include the accounts of the Company and its wholly owned subsidiaries. All intercompany transactions have been eliminated in consolidation.
Receivables
Receivables consist primarily of trade receivables. The Company does not require collateral or other security and evaluates the collectability of its receivables based on a number of factors. An allowance for doubtful accounts is recorded for significant past due receivable balances based on a review of the past due items and the customer's ability and likelihood to pay, as well as applying a historical write-off ratio to the remaining balances. Changes in the Company's allowance for doubtful accounts are as follows:
Balance at beginning of year | Provision and reserve adjustments | Write-offs less recoveries | Reserve acquired | Balance at end of year | |||||||||||||||
(In thousands) | |||||||||||||||||||
2014 | $ | 531 | $ | 305 | $ | (25 | ) | $ | — | $ | 811 | ||||||||
2013 | $ | 488 | $ | 78 | $ | (35 | ) | $ | — | $ | 531 | ||||||||
2012 | $ | 298 | $ | 138 | $ | (30 | ) | $ | 82 | (a) | $ | 488 | |||||||
(a) The reserve increased $82,000 in 2012 related to the acquisition of Racine Federated, Inc. Refer to Note 3 “Acquisitions” for a description of the acquisition.
32
BADGER METER, INC.
Notes to Consolidated Financial Statements (continued)
December 31, 2014, 2013 and 2012
Inventories
Inventories are valued at the lower of cost or market. Cost is determined using the first-in, first-out method. The Company estimates and records provisions for obsolete inventories. Changes to the Company's obsolete inventories reserve are as follows:
Balance at beginning of year | Net additions charged to earnings | Disposals | Balance at end of year | ||||||||||||
(In thousands) | |||||||||||||||
2014 | $ | 4,236 | $ | 974 | $ | (1,896 | ) | $ | 3,314 | ||||||
2013 | $ | 2,880 | $ | 2,322 | $ | (966 | ) | $ | 4,236 | ||||||
2012 | $ | 2,680 | $ | 1,082 | $ | (882 | ) | $ | 2,880 | ||||||
Property, Plant and Equipment
Property, plant and equipment are stated at cost. Depreciation is provided over the estimated useful lives of the respective assets by the straight-line method. The estimated useful lives of assets are: for land improvements, 15 years; for buildings and improvements, 10 — 39 years; and for machinery and equipment, 3 — 20 years.
Capitalized Software and Hardware
Capitalized internal use software and hardware included in prepaid expenses and other current assets in the Consolidated Balance Sheets were $1.2 million and $0.8 million at December 31, 2014 and 2013, respectively. In addition, there was $4.9 million and $2.8 million at December 31, 2014 and 2013, respectively, included in other assets in the Consolidated Balance Sheets. These amounts are amortized on a straight-line basis over the software’s estimated useful lives, ranging from 1 to 5 years. Amortization expense recognized for the years ending December 31, 2014, 2013 and 2012 was $1.4 million, $1.1 million and $0.8 million, respectively.
Long-Lived Assets
Property, plant and equipment and identifiable intangible assets are reviewed for impairment whenever events or changes in circumstances indicate that the carrying amount may not be recoverable. If the sum of the expected undiscounted cash flows is less than the carrying value of the related asset or group of assets, a loss is recognized for the difference between the fair value and carrying value of the asset or group of assets. No adjustments were recorded as a result of these reviews during 2014, 2013 and 2012.
33
BADGER METER, INC.
Notes to Consolidated Financial Statements (continued)
December 31, 2014, 2013 and 2012
Intangible Assets
Intangible assets are amortized on a straight-line basis over their estimated useful lives, ranging from 5 to 20 years. The Company does not have any intangible assets deemed to have indefinite lives. Amortization expense recognized for the years ending December 31, 2014, 2013 and 2012 was $5.5 million, $5.0 million and $4.5 million, respectively. Amortization expense expected to be recognized is $5.8 million in each of 2015, 2016 and 2017, $5.7 million in each of 2018 and 2019, and $32.9 million thereafter. The carrying value and accumulated amortization by major class of intangible assets are as follows:
December 31, 2014 | December 31, 2013 | ||||||||||||||
Gross carrying amount | Accumulated amortization | Gross carrying amount | Accumulated amortization | ||||||||||||
(In thousands) | |||||||||||||||
Technologies | $ | 47,157 | $ | 13,244 | $ | 47,157 | $ | 10,384 | |||||||
Non-compete agreements | 2,022 | 1,243 | 1,932 | 1,048 | |||||||||||
Licenses | 650 | 424 | 650 | 407 | |||||||||||
Customer lists | 3,423 | 1,053 | 3,423 | 679 | |||||||||||
Customer relationships | 20,700 | 3,575 | 11,690 | 2,218 | |||||||||||
Trade names | 9,325 | 2,066 | 8,615 | 1,414 | |||||||||||
Total intangibles | $ | 83,277 | $ | 21,605 | $ | 73,467 | $ | 16,150 | |||||||
Goodwill
Goodwill is tested for impairment annually during the fourth fiscal quarter or more frequently if an event indicates that the goodwill might be impaired. Potential impairment is identified by comparing the fair value of a reporting unit with its carrying value. No adjustments were recorded to goodwill as a result of these reviews during 2014, 2013 and 2012.
Goodwill was $47.7 million, $44.7 million and $35.9 million at December 31, 2014, 2013 and 2012, respectively. The increases were the result of the National Meter and Automation, Inc. of Centennial, Colorado acquisition in 2014, and the Aquacue, Inc. of Los Gatos, California acquisition in 2013. These acquisitions are further described in Note 3 “Acquisitions.”
Revenue Recognition
Revenues are generally recognized upon shipment of product, which corresponds with the transfer of title. The costs of shipping are billed to the customer upon shipment and are included in cost of sales. A small portion of the Company's sales includes shipments of products combined with services, such as meters sold with installation. The product and installation components of these multiple deliverable arrangements are considered separate units of accounting. The value of these separate units of accounting is determined based on their relative fair values determined on a stand-alone basis. Revenue is generally recognized when the last element of the multiple deliverable is delivered, which corresponds with installation and acceptance by the customer. The Company also sells a small number of extended support service agreements on certain products for the period subsequent to the normal support service provided with the original product sale. Revenue is recognized over the service agreement period, which is generally one year. In 2014, the company began offering software as a service with its BEACON AMA product. While the amounts were insignificant in 2014, revenue for this service is recognized on a monthly basis as the service is performed.
34
BADGER METER, INC.
Notes to Consolidated Financial Statements (continued)
December 31, 2014, 2013 and 2012
Warranty and After-Sale Costs
The Company estimates and records provisions for warranties and other after-sale costs in the period in which the sale is recorded, based on a lag factor and historical warranty claim experience. After-sale costs represent a variety of activities outside of the written warranty policy, such as investigation of unanticipated problems after the customer has installed the product, or analysis of water quality issues. Changes in the Company's warranty and after-sale costs reserve are as follows:
Balance at beginning of year | Net additions charged to earnings | Costs incurred and adjustments | Reserve acquired | Balance at end of year | |||||||||||||||||
(In thousands) | |||||||||||||||||||||
2014 | $ | 882 | $ | 2,512 | $ | (1,655 | ) | $ | — | $ | 1,739 | ||||||||||
2013 | $ | 881 | $ | 1,005 | $ | (1,068 | ) | $ | 64 | (a) | $ | 882 | |||||||||
2012 | $ | 1,593 | $ | 719 | $ | (1,431 | ) | $ | — | $ | 881 | ||||||||||
(a) | The reserve increased $64,000 in 2013 related to the acquisition of Aquacue, Inc. Refer to Note 3 “Acquisitions” for a description of the acquisition. |
Research and Development
Research and development costs are charged to expense as incurred and amounted to $9.5 million, $10.5 million and $9.6 million in 2014, 2013 and 2012, respectively.
Stock-Based Compensation Plans
As of December 31, 2014, the Company has an Omnibus Incentive Plan under which 700,000 shares are reserved for restricted stock and stock options grants for employees as well as stock grants for directors as described in Note 5 “Stock Compensation.” The plan was approved in 2011 and replaced all prior stock-based plans except for shares and options previously issued under those plans.
The Company recognizes the cost of stock-based awards in net earnings for all of its stock-based compensation plans on a straight-line basis over the service period of the awards. The Company estimates the fair value of its option awards using the Black-Scholes option-pricing formula, and records compensation expense for stock options ratably over the stock option grant's vesting period. The Company values restricted stock and stock grants for directors on the closing price of the Company's stock on the day the grant was awarded. Total stock compensation expense recognized by the Company was $1.4 million for 2014 and 2013, and $1.3 million for 2012.
Healthcare
The Company estimates and records provisions for healthcare claims incurred but not reported, based on medical cost trend analyses, reviews of subsequent payments made and estimates of unbilled amounts.
Accumulated Other Comprehensive Loss
Components of accumulated other comprehensive loss at December 31, 2014 are as follows:
Pension and postretirement benefits | Foreign currency | Total | |||||||||
(In thousands) | |||||||||||
Balance at beginning of period | $ | (9,280 | ) | $ | 1,756 | $ | (7,524 | ) | |||
Other comprehensive income before reclassifications | (4,968 | ) | (1,721 | ) | (6,689 | ) | |||||
Amounts reclassified from accumulated other comprehensive loss, net of tax of $(1.2) million | 2,357 | — | 2,357 | ||||||||
Net current period other comprehensive income, net | (2,611 | ) | (1,721 | ) | (4,332 | ) | |||||
Accumulated other comprehensive (loss) income | $ | (11,891 | ) | $ | 35 | $ | (11,856 | ) | |||
35
BADGER METER, INC.
Notes to Consolidated Financial Statements (continued)
December 31, 2014, 2013 and 2012
Details of reclassifications out of accumulated other comprehensive loss during 2014 are as follows:
Amount reclassified from accumulated other comprehensive loss | |||
(In thousands) | |||
Amortization of employee benefit plan items: | |||
Prior service cost (1) | $ | 161 | |
Settlement expense (1) | 858 | ||
Amortization of actuarial loss (1) | 2,547 | ||
Total before tax | 3,566 | ||
Income tax benefit | (1,209 | ) | |
Amount reclassified out of accumulated other comprehensive loss | $ | 2,357 | |
(1) | These accumulated other comprehensive loss components are included in the computation of benefit plan costs in Note 7 “Employee Benefit Plans.” |
Components of accumulated other comprehensive loss at December 31, 2013 are as follows:
Pension and postretirement benefits | Foreign currency | Total | |||||||||
(In thousands) | |||||||||||
Balance at beginning of period | $ | (15,532 | ) | $ | 1,584 | $ | (13,948 | ) | |||
Other comprehensive income before reclassifications | 5,116 | 172 | 5,288 | ||||||||
Amounts reclassified from accumulated other comprehensive loss, net of tax of $(0.6) million | 1,136 | — | 1,136 | ||||||||
Net current period other comprehensive income, net | 6,252 | 172 | 6,424 | ||||||||
Accumulated other comprehensive (loss) income | $ | (9,280 | ) | $ | 1,756 | $ | (7,524 | ) | |||
Details of reclassifications out of accumulated other comprehensive loss during 2013 are as follows:
Amount reclassified from accumulated other comprehensive loss | |||
(In thousands) | |||
Amortization of employee benefit plan items: | |||
Prior service cost (1) | $ | 161 | |
Settlement expense (1) | 806 | ||
Amortization of actuarial loss (1) | 786 | ||
Total before tax | 1,753 | ||
Income tax benefit | (617 | ) | |
Amount reclassified out of accumulated other comprehensive loss | $ | 1,136 | |
(1) | These accumulated other comprehensive loss components are included in the computation of benefit plan costs in Note 7 “Employee Benefit Plans.” |
36
BADGER METER, INC.
Notes to Consolidated Financial Statements (continued)
December 31, 2014, 2013 and 2012
Use of Estimates
The preparation of financial statements in conformity with U.S. generally accepted accounting principles requires management to make estimates and assumptions that affect the amounts reported in the financial statements and accompanying notes. Actual results could differ from those estimates.
Fair Value Measurements of Financial Instruments
The carrying amounts of cash, receivables and payables in the financial statements approximate their fair values due to the short-term nature of these financial instruments. Short-term debt is comprised of notes payable drawn against the Company's lines of credit and commercial paper. Because of its short-term nature, the carrying amount of the short-term debt also approximates fair value. Included in other assets are insurance policies on various individuals who were associated with the Company. The carrying amounts of these insurance policies approximate their fair value.
Subsequent Events
The Company evaluates subsequent events at the date of the balance sheet as well as conditions that arise after the balance sheet date but before the financial statements are issued. The effects of conditions that existed at the date of the balance sheet date are recognized in the financial statements. Events and conditions arising after the balance sheet date but before the financial statements are issued are evaluated to determine if disclosure is required to keep the financial statements from being misleading. To the extent such events and conditions exist, if any, disclosures are made regarding the nature of events and the estimated financial effects for those events and conditions. For purposes of preparing the accompanying consolidated financial statements and the notes to these financial statements, the Company evaluated subsequent events through the date the accompanying financial statements were issued.
New Pronouncements
In May 2014, the Financial Accounting Standards Board ("FASB") issued Accounting Standards Update (“ASU”) No. 2014-09 "Revenue from Contracts with Customers." ASU 2014-09 provides a single principles-based, five-step model to be applied to all contracts with customers. The five steps are to identify the contract(s) with the customer, to identify the performance obligations in the contact, to determine the transaction price, to allocate the transaction price to the performance obligations in the contract and to recognize revenue when each performance obligation is satisfied. Revenue will be recognized when promised goods or services are transferred to the customer in an amount that reflects the consideration expected in exchange for those goods or services. ASU 2014-09 will be effective for the Company beginning on January 1, 2017 and the standard allows for either full retrospective adoption or modified retrospective adoption. The Company is continuing to evaluate the impact that the adoption of this guidance will have on its financial condition, results of operations and the presentation of its financial statements.
In November 2014, the FASB issued ASU No. 2014-17 “Business Combinations (Topic 805): Pushdown Accounting.” In addition, the staff of the Securities and Exchange Commission released Staff Accounting Bulletin (“SAB”) No. 115, which rescinds SAB Topic 5J, “New Basis of Accounting Required in Certain Circumstances.” Pushdown accounting refers to pushing down the acquirer’s accounting and reporting basis (which is recognized in conjunction with its accounting for a business combination) to the acquiree’s standalone financial statements. Under the new guidance, pushdown accounting is optional for any transaction in which another party obtains control of the reporting company. An acquired entity can make the election to apply the guidance to future change in control events or to its most recent change-in-control event if the financial statements have not been issued. ASU No. 2014-17 was effective upon issuance, which was November 18, 2014. The adoption of ASU No. 2014-17 did not have any impact on the Company’s financial condition or results of operation.
37
BADGER METER, INC.
Notes to Consolidated Financial Statements (continued)
December 31, 2014, 2013 and 2012
Note 2 Common Stock
Common Stock and Rights Agreement
The Company has Common Stock and also Common Share Purchase Rights that trade with the Common Stock. The Common Share Purchase Rights were issued pursuant to the shareholder rights plan discussed below.
On February 15, 2008, the Board of Directors of the Company adopted a shareholder rights plan and declared a dividend of one Common Share Purchase Right for each outstanding share of Common Stock of the Company payable to the shareholders of record on May 26, 2008. The plan was effective as of May 27, 2008. Each right entitles the registered holder to purchase from the Company one share of Common Stock at a price of $200.00 per share, subject to adjustment. Subject to certain conditions, the rights are redeemable by the Company and are exchangeable for shares of Common Stock at a favorable price. The rights have no voting power and unless the rights are redeemed, exchanged or terminated earlier, they will expire on May 26, 2018. The rights are an embedded feature of the Company’s Common Stock and not a free-standing instrument, and therefore, do not require separate accounting treatment.
Stock Options
Stock options to purchase 47,067 shares of the Company's Stock in 2014, 23,258 shares in 2013 and 60,400 shares in 2012 were not included in the computation of dilutive securities because the exercise price was greater than the average stock price for that period, and accordingly their inclusion would have been anti-dilutive.
Note 3 Acquisitions
On October 1, 2014, the Company acquired 100% of the outstanding common stock of National Meter and Automation, Inc. (“National Meter”) of Centennial, Colorado. The purchase is estimated to add approximately $15 million of incremental annual revenues to Badger Meter, after eliminating what would be intercompany sales. National Meter was a major distributor of Badger Meter products for the municipal water utility market, serving customers in Colorado, California, Nevada, Arizona and southern Wyoming. National Meter will become a regional distribution center for Badger Meter. In addition to its primary product line of water meters and meter reading systems, National Meter provides services including meter testing, leak detection, water audits, meter and meter reading system installation and meter reading.
The total purchase consideration for National Meter was $22.9 million, which included $20.3 million in cash, a small working capital adjustment and settlement of pre-existing receivables. The Consolidated Balance Sheets at December 31, 2014 included $2.5 million of deferred payments, of which $2.0 million is payable in October 2015 and early 2016 and is recorded in payables, and $0.5 million is payable in early 2017 and is recorded in other long-term liabilities. The Company’s allocation of the purchase price as of December 31, 2014 included $3.9 million of receivables, $4.5 million of inventory, $2.8 million of property, plant and equipment, $9.8 million of intangibles, $3.0 million of goodwill, and $0.1 million of current liabilities. As of December 31, 2014, the preliminary allocation of the purchase price to the assets acquired and liabilities assumed is based upon the estimated fair values at the date of acquisition. The intangible assets acquired are primarily customer relationships with an estimated average useful life of 12 years. There was approximately $0.4 million of transaction costs related to the acquisition that were included in selling, engineering and administration for 2014 in the Company’s Consolidated Statements of Operations.
The acquisition was accounted for under the purchase method, and accordingly, the results of operations were included in the Company’s financial statements from the date of acquisition. The acquisition did not have a material impact on the Company’s consolidated financial statements or the notes thereto.
On April 1, 2013, the Company acquired 100% of the outstanding common stock of Aquacue, Inc. (“Aquacue”) of Los Gatos, California. The Aquacue acquisition provides the Company with intellectual property that complements and expands the Company’s advanced metering analytics offerings by adding an integrated software platform that allows utility managers to monitor and control their water systems, while providing water management data to consumers. Sales of Aquacue products and the impact on consolidated net earnings were immaterial for 2013.
38
BADGER METER, INC.
Notes to Consolidated Financial Statements (continued)
December 31, 2014, 2013 and 2012
The purchase price was $13.8 million in cash, including a small working capital adjustment. The purchase price included a final $3.0 million payment, of which half was due January 10, 2014 and half was due October 10, 2014, and these amounts were recorded in payables on the Consolidated Balance Sheets at December 31, 2013. The Company’s allocation of the purchase price as of December 31, 2013 included $0.1 million of current assets, $1.3 million of deferred tax assets, $3.9 million of intangibles, $8.8 million of goodwill and $0.3 million of current liabilities. As of December 31, 2013, the Company has completed its analysis for estimating the fair value of the assets acquired and liabilities assumed. The intangible assets acquired are primarily developed technology with an estimated average useful life of 10 years. There was approximately $0.1 million of transaction costs related to the acquisition that were included in selling, engineering and administration for 2013 in the Company’s Consolidated Statements of Operations. The Company merged Aquacue into Badger Meter, Inc. on December 31, 2013.
The acquisition was accounted for under the purchase method, and accordingly, the results of operations were included in the Company’s financial statements from the date of acquisition. The acquisition did not have a material impact on the Company’s consolidated financial statements or the notes thereto.
On January 31, 2012, the Company completed its acquisition of 100% of the outstanding common stock of Racine Federated, Inc. of Racine, Wisconsin and its subsidiary Premier Control Technologies, Ltd. (“PCT”) located in Thetford, England for approximately $57.3 million in cash, plus a small working capital adjustment. The purchase price included a final $4.6 million payment which was due and paid in 2013. Racine Federated manufactures and markets flow meters for the water industry as well as various industrial metering and specialty products. These products complement and expand the Company's existing lines for the global flow measurement business.
The acquisition was accounted for under the purchase method, and accordingly, the results of operations were included in the Company's financial statements from the date of acquisition. The acquisition did not have a material impact on the Company’s consolidated financial statements or the notes thereto. During the fourth quarter of 2012, the Company sold PCT for a nominal amount after the majority of its functions were absorbed by the Company's European subsidiary. The Company also merged Racine Federated into Badger Meter, Inc. on December 31, 2012.
Note 4 Short-term Debt and Credit Lines
Short-term debt at December 31, 2014 and 2013 consisted of:
2014 | 2013 | ||||||
(In thousands) | |||||||
Notes payable to banks | $ | 5,977 | $ | 4,795 | |||
Commercial paper | 69,950 | 65,250 | |||||
Total short-term debt | $ | 75,927 | $ | 70,045 | |||
Included in notes payable to banks in 2014 was $4.5 million outstanding under a 4.0 million Euro-base revolving loan facility (U.S. dollar equivalent of $4.8 million at December 31, 2014) that does not expire, and which bore interest at 1.51%. Included in notes payable to banks in 2013 was $4.8 million outstanding under a 4.0 million Euro-based revolving loan facility (U.S. dollar equivalent of $5.5 million at December 31, 2013) that does not expire, and which bore interest at 1.72%.
In May 2012, the Company signed a credit agreement that increased its principal line of credit from $90.0 million to $125.0 million with its primary lender for a three year period. The line was reduced by $16.7 million in May 2013 and was scheduled to be reduced by a similar amount in May 2014. The Company amended this line of credit effective May 1, 2014 to a three-year $105.0 million line of credit that supports commercial paper (up to $70.0 million) and includes $5.0 million of a Euro line of credit. Borrowings of commercial paper bore interest at 1.25% in 2014 and 2013. Under the principal line of credit, the Company had $33.6 million of unused credit lines available out of its total $37.5 million short-term credit lines at December 31, 2014. While the facility is unsecured, there are a number of financial covenants with which the Company is in compliance as of December 31, 2014.
39
BADGER METER, INC.
Notes to Consolidated Financial Statements (continued)
December 31, 2014, 2013 and 2012
Note 5 Stock Compensation
As of December 31, 2014, the Company has an Omnibus Incentive Plan under which 700,000 shares are reserved for restricted stock and stock options grants for employees as well as stock grants for directors. The plan was approved in 2011 and replaced all prior stock-based plans except for shares and options previously issued under those plans. As of December 31, 2014 and 2013, there were 456,000 shares and 505,000 shares of the Company’s Common Stock available for grant under the 2011 Omnibus Incentive Plan. The Company recognizes the cost of stock-based awards in net earnings for all of its stock-based compensation plans on a straight-line basis over the service period of the awards. The following sections describe the three types of grants in more detail.
Stock Options
The Company estimates the fair value of its option awards using the Black-Scholes option-pricing formula, and records compensation expense for stock options ratably over the stock option grant’s vesting period. Stock option compensation expense recognized by the Company for the year ended December 31, 2014 related to stock options was $0.4 million compared to $0.5 million in 2013 and $0.4 million in 2012.
The following table summarizes the transactions of the Company’s stock option plans for the three-year period ended December 31, 2014:
Number of shares | Weighted-average exercise price | |||||
Options outstanding - December 31, 2011 | 245,090 | $ | 30.30 | |||
Options granted | 45,100 | $ | 36.15 | |||
Options exercised | (37,450 | ) | $ | 10.25 | ||
Options forfeited | (5,160 | ) | $ | 37.19 | ||
Options outstanding - December 31, 2012 | 247,580 | $ | 34.26 | |||
Options granted | 23,258 | $ | 51.29 | |||
Options exercised | (66,660 | ) | $ | 24.91 | ||
Options forfeited | (1,800 | ) | $ | 37.78 | ||
Options outstanding - December 31, 2013 | 202,378 | $ | 39.27 | |||
Options granted | 23,958 | $ | 54.36 | |||
Options exercised | (23,016 | ) | $ | 32.57 | ||
Options forfeited | — | n/a | ||||
Options outstanding - December 31, 2014 | 203,320 | $ | 41.80 | |||
Price range $18.33 — $36.15 | ||||||
(weighted-average contractual life of 5.9 years) | 56,320 | $ | 34.20 | |||
Price range $36.16 — $38.41 | ||||||
(weighted-average contractual life of 5.8 years) | 54,220 | $ | 37.59 | |||
Price range $38.42 — $54.36 | ||||||
(weighted-average contractual life of 6.3 years) | 92,780 | $ | 48.88 | |||
Options outstanding - December 31, 2014 | 203,320 | |||||
Exercisable options — | ||||||
December 31, 2012 | 141,740 | $ | 31.72 | |||
December 31, 2013 | 113,060 | $ | 38.18 | |||
December 31, 2014 | 111,016 | $ | 39.68 | |||
40
BADGER METER, INC.
Notes to Consolidated Financial Statements (continued)
December 31, 2014, 2013 and 2012
The following assumptions were used for valuing options granted in the years ended December 31:
2014 | 2013 | ||||
Per share fair value of options granted during the period | $22.35 | $20.34 | |||
Risk-free interest rate | 1.73 | % | 0.82 | % | |
Dividend yield | 1.31 | % | 1.31 | % | |
Volatility factor | 49.9 | % | 49.7 | % | |
Weighted-average expected life in years | 5.3 | 5.3 | |||
The expected life is based on historical exercise behavior and the projected exercise of unexercised stock options. The risk-free interest rate is based on the U.S. Treasury yield curve in effect on the date of grant for the respective expected life of the option. The expected dividend yield is based on the expected annual dividends divided by the grant date market value of the Company’s Common Stock. The expected volatility is based on the historical volatility of the Company’s Common Stock.
The following table summarizes the aggregate intrinsic value related to options exercised, outstanding and exercisable as of and for the years ended December 31:
2014 | 2013 | ||||||
(In thousands) | |||||||
Exercised | $ | 493 | $ | 1,743 | |||
Outstanding | $ | 3,568 | $ | 3,083 | |||
Exercisable | $ | 2,184 | $ | 1,846 | |||
As of December 31, 2014, the unrecognized compensation cost related to stock options was approximately $1.0 million, which will be recognized over a weighted average period of 2.6 years.
Director Stock Grant
Non-employee directors receive an annual award of $50,000 worth of shares of the Company’s Common Stock under the shareholder-approved 2011 Omnibus Incentive Plan. The Company values stock grants for directors on the closing price of the Company’s stock on the day the grant was awarded. The Company records compensation expense for this plan ratably over the annual service period beginning May 1. Director stock compensation expense recognized by the Company for the year ended December 31, 2014, 2013 and 2012 was $0.4 million in each year. As of December 31, 2014, the unrecognized compensation cost related to the director stock award that is expected to be recognized over the remaining four months is estimated to be approximately $0.1 million.
41
BADGER METER, INC.
Notes to Consolidated Financial Statements (continued)
December 31, 2014, 2013 and 2012
Restricted Stock
The Company periodically issues nonvested shares of the Company's Common Stock to certain eligible employees, generally with a three-year cliff vesting period contingent on employment. The Company values restricted stock on the closing price of the Company's stock on the day the grant was awarded. The Company records compensation expense for these plans ratably over the vesting periods. Nonvested stock compensation expense recognized by the Company for the year ended December 31, 2014 was $1.0 million compared to $0.9 million in 2013 and $0.9 million in 2012.
The fair value of nonvested shares is determined based on the market price of the shares on the grant date.
Shares | Fair value per share | |||||
Nonvested at December 31, 2011 | 63,300 | $ | 37.69 | |||
Granted | 30,325 | $ | 36.15 | |||
Vested | (17,900 | ) | $ | 38.69 | ||
Forfeited | (1,900 | ) | $ | 21.77 | ||
Nonvested at December 31, 2012 | 73,825 | $ | 37.01 | |||
Granted | 21,425 | $ | 51.12 | |||
Vested | (16,875 | ) | $ | 38.41 | ||
Forfeited | (3,900 | ) | $ | 37.69 | ||
Nonvested at December 31, 2013 | 74,475 | $ | 40.54 | |||
Granted | 21,956 | $ | 54.36 | |||
Vested | (24,350 | ) | $ | 36.59 | ||
Forfeited | (3,625 | ) | $ | 41.61 | ||
Nonvested at December 31, 2014 | 68,456 | $ | 46.32 | |||
As of December 31, 2014, there was $1.3 million of unrecognized compensation cost related to nonvested restricted stock that is expected to be recognized over a weighted average period of 1.3 years.
Note 6 Commitments and Contingencies
Commitments
The Company makes commitments in the normal course of business. The Company leases equipment and facilities under non-cancelable operating leases, some of which contain renewal options. Total future minimum lease payments consisted of the following at December 31, 2014:
Total leases | |||
(In thousands) | |||
2015 | $ | 2,282 | |
2016 | 1,861 | ||
2017 | 1,688 | ||
2018 | 1,451 | ||
2019 | 1,274 | ||
Thereafter | 5,845 | ||
Total lease obligations | $ | 14,401 | |
Total rental expense charged to operations under all operating leases was $3.1 million, $2.8 million and $2.7 million in 2014, 2013 and 2012, respectively.
42
BADGER METER, INC.
Notes to Consolidated Financial Statements (continued)
December 31, 2014, 2013 and 2012
Contingencies
In the normal course of business, the Company is named in legal proceedings. There are currently no material legal proceedings pending with respect to the Company. The more significant legal proceedings are discussed below.
The Company is subject to contingencies related to environmental laws and regulations. The Company is named as one of many potentially responsible parties in two landfill lawsuits. The landfill sites are impacted by the Federal Comprehensive Environmental Response, Compensation and Liability Act and other environmental laws and regulations. At this time, the Company does not believe the ultimate resolution of these matters will have a material adverse effect on the Company’s financial position or results of operations, either from a cash flow perspective or on the financial statements as a whole. This belief is based on the Company’s assessment of its limited past involvement with these landfill sites as well as the substantial involvement of and government focus on other named third parties with these landfill sites. However, due to the inherent uncertainties of such proceedings, the Company cannot predict the ultimate outcome of any of these matters. A future change in circumstances with respect to these specific matters or with respect to sites formerly or currently owned or operated by the Company, off-site disposal locations used by the Company, and property owned by third parties that is near such sites, could result in future costs to the Company and such amounts could be material. Expenditures for compliance with environmental control provisions and regulations during 2014, 2013 and 2012 were not material.
Like other companies in recent years, the Company is named as a defendant in numerous pending multi-claimant/multi-defendant lawsuits alleging personal injury as a result of exposure to asbestos, manufactured by third parties, and integrated into or sold with a very limited number of the Company’s products. The Company is vigorously defending itself against these claims. Although it is not possible to predict the ultimate outcome of these matters, the Company does not believe the ultimate resolution of these issues will have a material adverse effect on the Company’s financial position or results of operations, either from a cash flow perspective or on the financial statements as a whole. This belief is based in part on the fact that no claimant has proven or substantially demonstrated asbestos exposure caused by products manufactured or sold by the Company and that a number of cases have been voluntarily dismissed.
The Company relies on single suppliers for most brass castings and certain electronic subassemblies in several of its product lines. The Company believes these items would be available from other sources, but that the loss of certain suppliers would result in a higher cost of materials, delivery delays, short-term increases in inventory and higher quality control costs in the short term. The Company attempts to mitigate these risks by working closely with key suppliers, purchasing minimal amounts from alternative suppliers and by purchasing business interruption insurance where appropriate.
The Company reevaluates its exposures on a periodic basis and makes adjustments to reserves as appropriate.
Note 7 Employee Benefit Plans
The Company maintains a non-contributory defined benefit pension plan that covers substantially all U.S. employees who were employed at December 31, 2011. After that date, no further benefits are being accrued in this plan. For the frozen pension plan, benefits are based primarily on years of service and, for certain plans, levels of compensation.
The Company also maintains supplemental non-qualified plans for certain officers and other key employees, and an Employee Savings and Stock Option Plan (“ESSOP”).
The Company also has a postretirement healthcare benefit plan that provides medical benefits for certain U.S. retirees and eligible dependents hired prior to November 1, 2004. Employees are eligible to receive postretirement healthcare benefits upon meeting certain age and service requirements. No employees hired after October 31, 2004 are eligible to receive these benefits. This plan requires employee contributions to offset benefit costs.
43
BADGER METER, INC.
Notes to Consolidated Financial Statements (continued)
December 31, 2014, 2013 and 2012
Amounts included in accumulated other comprehensive loss, net of tax, at December 31, 2014 that have not yet been recognized in net periodic benefit cost are as follows:
Pension plans | Other postretirement benefits | ||||||
(In thousands) | |||||||
Prior service cost | $ | — | $ | 6 | |||
Net actuarial loss | $ | 11,156 | $ | 314 | |||
Amounts included in accumulated other comprehensive loss, net of tax, at December 31, 2014 expected to be recognized in net periodic benefit cost during the fiscal year ending December 31, 2015 are as follows:
Pension plans | Other postretirement benefits | ||||||
(In thousands) | |||||||
Prior service credit | $ | — | $ | 33 | |||
Net actuarial loss | $ | 471 | $ | — | |||
Qualified Pension Plan
The Company maintains a non-contributory defined benefit pension plan (sometimes referred to as the “qualified pension plan”) for certain employees. On December 31, 2010, the Company froze the qualified pension plan for its non-union participants and formed a new defined contribution feature within the ESSOP plan in which each employee received a similar benefit. On December 31, 2011, the Company froze the qualified pension plan for its union participants and included them in the same defined contribution feature within the ESSOP. After December 31, 2011, employees receive no future benefits under the qualified pension benefit plan as benefits were frozen and the employees now receive a defined contribution in its place. Employees will continue to earn returns on their frozen balances.
The following table sets forth the components of net periodic pension cost for the years ended December 31, 2014, 2013 and 2012 based on a December 31 measurement date:
2014 | 2013 | 2012 | |||||||||
(In thousands) | |||||||||||
Service cost — benefits earned during the year | $ | 4 | $ | 5 | $ | 6 | |||||
Interest cost on projected benefit obligations | 1,888 | 1,842 | 2,205 | ||||||||
Expected return on plan assets | (2,806 | ) | (2,744 | ) | (3,190 | ) | |||||
Amortization of net loss | 606 | 719 | 645 | ||||||||
Settlement expense | 858 | 806 | 1,075 | ||||||||
Net periodic pension cost | $ | 550 | $ | 628 | $ | 741 | |||||
Actuarial assumptions used in the determination of the net periodic pension cost are:
2014 | 2013 | 2012 | ||||||
Discount rate | 4.47 | % | 3.68 | % | 4.69 | % | ||
Expected long-term return on plan assets | 6.50 | % | 6.50 | % | 7.00 | % | ||
Rate of compensation increase | n/a | n/a | n/a | |||||
44
BADGER METER, INC.
Notes to Consolidated Financial Statements (continued)
December 31, 2014, 2013 and 2012
The Company's discount rate assumptions for the qualified pension plan are based on the average yield of a hypothetical high quality bond portfolio with maturities that approximately match the estimated cash flow needs of the plan. The assumptions for expected long-term rates of return on assets are based on historical experience and estimated future investment returns, taking into consideration anticipated asset allocations, investment strategies and the views of various investment professionals. The use of these assumptions can cause volatility if actual results differ from expected results.
The following table provides a reconciliation of benefit obligations, plan assets and funded status based on a December 31 measurement date:
2014 | 2013 | ||||||
(In thousands) | |||||||
Change in benefit obligation: | |||||||
Benefit obligation at beginning of plan year | $ | 45,561 | $ | 50,700 | |||
Service cost | 4 | 5 | |||||
Interest cost | 1,888 | 1,842 | |||||
Actuarial (gain)/loss | 4,989 | (3,208 | ) | ||||
Benefits paid | (4,242 | ) | (3,778 | ) | |||
Projected benefit obligation at measurement date | $ | 48,200 | $ | 45,561 | |||
Change in plan assets: | |||||||
Fair value of plan assets at beginning of plan year | $ | 49,873 | $ | 46,547 | |||
Actual return on plan assets | 3,025 | 7,104 | |||||
Benefits paid | (4,242 | ) | (3,778 | ) | |||
Fair value of plan assets at measurement date | $ | 48,656 | $ | 49,873 | |||
Funded status of the plan: | |||||||
Benefit plan assets of benefit obligation | 456 | 4,312 | |||||
Prepaid pension asset (accrued pension liability) | $ | 456 | $ | 4,312 | |||
The actuarial assumption used in the determination of the benefit obligation of the above data is:
2014 | 2013 | ||||
Discount rate | 3.81 | % | 4.47 | % | |
The fair value of the qualified pension plan assets was $48.7 million at December 31, 2014 and $49.9 million at December 31, 2013. The variation in the fair value of the assets between years was due to the change in the market value of the underlying investments and benefits paid. Estimated future benefit payments expected to be paid in each of the next five years beginning with 2015 are $4.5 million, $4.3 million, $4.1 million, $3.7 million and $3.4 million, with an aggregate of $16.4 million for the five years thereafter. As of the most recent actuarial measurement date, the Company is not required to make a minimum contribution for the 2015 calendar year.
Historically the Company employed a total return investment approach whereby a mix of equities and fixed income investments were used to maximize the long-term return of plan assets for a prudent level of risk. Because of volatility in market returns and the plan’s current funding status, the decision was made in 2014 to move towards a liability driven investing strategy whereby the assets are primarily fixed income investments. The fixed income investments chosen under this strategy, while not precisely the same, are meant to parallel the investments selected in determining the discount rate used to calculate the Company’s pension liability. The purpose of this strategy is to minimize equity exposure and interest risk and thereby maintain the funding status of the plan, regardless of movement in interest rates. In 2014, the Company adjusted the investment portfolio to reduce its equity allocation and introduced higher fixed-income investments that matched the duration of the estimated pension liability. The remaining equity investments are diversified across various stocks, as well as growth, value, and small and large capitalizations. Investment risk is measured and monitored on an ongoing basis through quarterly investment portfolio reviews, annual liability measurements and periodic asset/liability studies.
45
BADGER METER, INC.
Notes to Consolidated Financial Statements (continued)
December 31, 2014, 2013 and 2012
As a result of the change in investing strategy in 2014, changes were made to the investment policy for the plan. The target allocations for plan assets are 0%-18% for public equities, 0%-14% for bank loans, and 68%-100% for traditional and cash balance liability-hedging assets.
Accounting Standards Codification 820, “Fair Value Measurements and Disclosures,” establishes a fair value hierarchy that prioritizes the inputs to valuation techniques used to measure fair value. This hierarchy consists of three broad levels: Level 1 inputs consist of unadjusted quoted prices in active markets for identical assets and have the highest priority. Level 2 inputs consist of inputs other than quoted prices included in Level 1 that are observable for the asset or liability, either directly or indirectly. Level 3 inputs are unobservable inputs for determining the fair value of assets or liabilities that reflect assumptions that market participants would use in pricing assets or liabilities. The plan uses appropriate valuation techniques based on the available inputs to measure the fair value of its investments.
The fair value of the Company's qualified pension plan assets by category at December 31, 2014 are as follows:
Market value | Quoted prices in active markets for identical assets (Level 1) | Significant observable inputs (Level 2) | Significant unobservable inputs (Level 3) | ||||||||||||
(In thousands) | |||||||||||||||
Equity securities (a) | $ | 6,356 | $ | — | $ | 6,356 | $ | — | |||||||
Fixed income funds (b) | 41,351 | — | 41,351 | — | |||||||||||
Cash/cash equivalents (c) | 949 | 949 | — | — | |||||||||||
Total | $ | 48,656 | $ | 949 | $ | 47,707 | $ | — | |||||||
(a) | The Equity funds in aggregate are well diversified by market capitalization, investment style and geography. The funds seek to provide investment results approximating the aggregate price and dividend performance of securities included in the S&P 500 Index, Russell 2000 Index and MSCI All Country World ex-US Index. |
(b) | The Fixed Income funds consist of bonds. In aggregate, the funds seek to provide investment return approximating the return of the Plan’s obligations. The funds consist of Long Credit bonds, Intermediate Credit bonds, Short Duration Government Credit bonds and Bank Loans. |
(c) | This category comprises the cash held to pay beneficiaries. The fair value of cash equals its book value. |
The fair value of the Company’s qualified pension plan assets by category at December 31, 2013 are as follows:
Market value | Quoted prices in active markets for identical assets (Level 1) | Significant observable inputs (Level 2) | Significant unobservable inputs (Level 3) | ||||||||||||
(In thousands) | |||||||||||||||
Equity securities (a) | $ | 27,049 | $ | 27,049 | $ | — | $ | — | |||||||
Fixed income funds (b) | 18,990 | 18,990 | — | — | |||||||||||
Cash/cash equivalents (c) | 3,834 | 3,834 | — | — | |||||||||||
Total | $ | 49,873 | $ | 49,873 | $ | — | $ | — | |||||||
(a) | This category includes investments in equity securities of large, small and medium sized companies, equity securities of foreign companies and equity funds, or 52.8%, 11.1%, 12.1%, 17.2% and 6.8% of total assets, respectively. Of the total equity amount, 11.1% was invested in common stocks in a wide variety of industries and 88.9% was invested in mutual funds. The funds are valued using the closing market prices at December 31, 2013. |
(b) | This category includes investments in investment-grade fixed-income instruments and corporate bonds. Government instruments were 33.4% of the total. The funds are valued using the closing market prices at December 31, 2013. |
(c) | This category comprises the cash held to pay beneficiaries. The fair value of cash equals its book value. |
46
BADGER METER, INC.
Notes to Consolidated Financial Statements (continued)
December 31, 2014, 2013 and 2012
The pension plan has a separately determined accumulated benefit obligation that is the actuarial present value of benefits based on service rendered and current and past compensation levels. Prior to December 31, 2012, this differed from the projected benefit obligation in that it included no assumption about future compensation levels. The accumulated benefit obligation was $48.2 million at December 31, 2014 and $45.6 million at December 31, 2013.
Supplemental Non-qualified Unfunded Plans
The Company also maintains supplemental non-qualified unfunded plans for certain officers and other key employees. Expense for these plans was $0.3 million for the year ended 2014, $0.2 million for the year ended 2013, and $0.3 million for the year ended 2012. The amount accrued was $1.6 million and $1.5 million as of December 31, 2014 and 2013, respectively. Amounts were determined based on similar assumptions as the qualified pension plan as of the December 31 measurement date for 2014 and 2013.
Other Postretirement Benefits
The Company has a postretirement plan that provides medical benefits for certain U.S. retirees and eligible dependents hired prior to November 1, 2004. The following table sets forth the components of net periodic postretirement benefit cost for the years ended December 31, 2014, 2013 and 2012:
2014 | 2013 | 2012 | |||||||||
(In thousands) | |||||||||||
Service cost, benefits attributed for service of active employees for the period | $ | 130 | $ | 154 | $ | 143 | |||||
Interest cost on the accumulated postretirement benefit obligation | 269 | 255 | 295 | ||||||||
Amortization of prior service cost | 161 | 161 | 161 | ||||||||
Net periodic postretirement benefit cost | $ | 560 | $ | 570 | $ | 599 | |||||
The discount rate used to measure the net periodic postretirement benefit cost was 4.73% for 2014, 3.92% for 2013 and 4.79% for 2012. It is the Company's policy to fund healthcare benefits on a cash basis. Because the plans are unfunded, there are no plan assets. The following table provides a reconciliation of the projected benefit obligation at the Company's December 31 measurement date:
2014 | 2013 | ||||||
(In thousands) | |||||||
Benefit obligation at beginning of year | $ | 6,376 | $ | 6,940 | |||
Service cost | 130 | 154 | |||||
Interest cost | 269 | 255 | |||||
Actuarial loss (gain) | 462 | (746 | ) | ||||
Plan participants' contributions | 708 | 716 | |||||
Benefits paid | (1,178 | ) | (943 | ) | |||
Benefit obligation and funded status at end of year | $ | 6,767 | $ | 6,376 | |||
The amounts recognized in the Consolidated Balance Sheets at December 31 are:
2014 | 2013 | ||||||
(In thousands) | |||||||
Accrued compensation and employee benefits | $ | 425 | $ | 442 | |||
Accrued non-pension postretirement benefits | 6,342 | 5,934 | |||||
Amounts recognized at December 31 | $ | 6,767 | $ | 6,376 | |||
47
BADGER METER, INC.
Notes to Consolidated Financial Statements (continued)
December 31, 2014, 2013 and 2012
The discount rate used to measure the accumulated postretirement benefit obligation was 4.01% for 2014 and 4.73% for 2013. The Company's discount rate assumptions for its postretirement benefit plan are based on the average yield of a hypothetical high quality bond portfolio with maturities that approximately match the estimated cash flow needs of the plan. Because the plan requires the Company to establish fixed Company contribution amounts for retiree healthcare benefits, future healthcare cost trends do not generally impact the Company's accruals or provisions.
Estimated future benefit payments of postretirement benefits, assuming increased cost sharing, expected to be paid in each of the next five years beginning with 2015 are $0.4 million in each year of 2015 and 2016, $0.5 million in each year of 2017, 2018 and 2019, with an aggregate of $2.2 million for the five years thereafter. These amounts can vary significantly from year to year because the cost sharing estimates can vary from actual expenses as the Company is self-insured.
Badger Meter Employee Savings and Stock Ownership Plan
In 2010, the Company restructured the outstanding debt of its ESSOP by loaning the ESSOP $0.5 million to repay a loan to a third party and loaning the ESSOP an additional $1.0 million to purchase additional shares of the Company’s Common Stock for future 401(k) savings plan matches under a program that will expire on December 31, 2020. Under this program, the Company agreed to pay the principal and interest on the new loan amount of $1.5 million. The receivable from the ESSOP and the related obligation were therefore netted to zero on the Company’s Consolidated Balance Sheets at December 31, 2014 and 2013. The terms of the loan call for equal payments of principal with the final payment due on December 31, 2020, and prepayments are allowed under the plan terms. At December 31, 2014, $0.9 million of the loan balance remained.
The Company made principal payments of $154,000, $154,000 and $256,000 in 2014, 2013 and 2012, respectively. The associated commitments released shares of Common Stock (11,077 shares in 2014 for the 2013 obligation, 9,918 shares in 2013 for the 2012 obligation, and 16,151 shares in 2012 for the 2011 obligation) for allocation to participants in the ESSOP. The ESSOP held unreleased shares of 72,362, 83,439 and 93,357 as of December 31, 2014, 2013 and 2012, respectively, with a fair value of $4.3 million, $4.5 million and $4.4 million as of December 31, 2014, 2013 and 2012, respectively. Unreleased shares are not considered outstanding for purposes of computing earnings per share.
The ESSOP includes a voluntary 401(k) savings plan that allows certain employees to defer up to 20% of their income on a pretax basis subject to limits on maximum amounts. The Company matches 25% of each employee’s contribution, with the match percentage applying to a maximum of 7% of each employee's salary. The match is paid using the Company's Common Stock released through the ESSOP loan payments. For ESSOP shares purchased prior to 1993, compensation expense is recognized based on the original purchase price of the shares released and dividends on unreleased shares are charged to compensation expense. For shares purchased in or after 1993, expense is based on the market value of the shares on the date released and dividends on unreleased shares are charged to compensation expense. Compensation expense of $0.3 million was recognized for the match for each of 2014, 2013 and 2012.
On December 31, 2010, the Company froze the qualified pension plan for its non-union participants and formed a new defined contribution feature within the ESSOP plan in which each employee received a similar benefit. On December 31, 2011, the Company froze the qualified pension plan for its union participants and included them in the same defined contribution feature within the ESSOP. For 2014, compensation expense under the defined contribution feature totaled $2.3 million.
48
BADGER METER, INC.
Notes to Consolidated Financial Statements (continued)
December 31, 2014, 2013 and 2012
Note 8 Income Taxes
The Company is subject to income taxes in the United States and numerous foreign jurisdictions. Significant judgment is required in determining the worldwide provision for income taxes and recording the related deferred tax assets and liabilities.
Details of earnings before income taxes are as follows:
2014 | 2013 | 2012 | |||||||||
(In thousands) | |||||||||||
Domestic | $ | 41,022 | $ | 34,687 | $ | 40,650 | |||||
Foreign | 3,890 | 3,322 | 2,821 | ||||||||
Total | $ | 44,912 | $ | 38,009 | $ | 43,471 | |||||
The provision (benefit) for income taxes is as follows:
2014 | 2013 | 2012 | |||||||||
(In thousands) | |||||||||||
Current: | |||||||||||
Federal | $ | 14,362 | $ | 12,630 | $ | 13,908 | |||||
State | 1,086 | 2,394 | 1,455 | ||||||||
Foreign | 1,120 | 802 | 507 | ||||||||
Deferred: | |||||||||||
Federal | (1,323 | ) | (2,174 | ) | (663 | ) | |||||
State | 208 | (228 | ) | (165 | ) | ||||||
Foreign | (219 | ) | (32 | ) | 397 | ||||||
Total | $ | 15,234 | $ | 13,392 | $ | 15,439 | |||||
The provision for income taxes differs from the amount that would be provided by applying the statutory
U.S. corporate income tax rate in each year due to the following items:
2014 | 2013 | 2012 | |||||||||
(In thousands) | |||||||||||
Provision at statutory rate | $ | 15,720 | $ | 13,303 | $ | 15,215 | |||||
State income taxes, net of federal tax benefit | 841 | 1,408 | 1,018 | ||||||||
Foreign income taxes | (454 | ) | (393 | ) | (87 | ) | |||||
Domestic production activities deduction | (675 | ) | (498 | ) | (529 | ) | |||||
Tax audit settlements | — | — | (101 | ) | |||||||
Other | (198 | ) | (428 | ) | (77 | ) | |||||
Actual provision | $ | 15,234 | $ | 13,392 | $ | 15,439 | |||||
49
BADGER METER, INC.
Notes to Consolidated Financial Statements (continued)
December 31, 2014, 2013 and 2012
The components of deferred income taxes as of December 31 are as follows:
2014 | 2013 | ||||||
(In thousands) | |||||||
Deferred tax assets: | |||||||
Reserve for receivables and inventories | $ | 2,769 | $ | 2,850 | |||
Accrued compensation | 1,105 | 1,087 | |||||
Payables | 694 | 364 | |||||
Non-pension postretirement benefits | 2,601 | 2,447 | |||||
Net operating loss and credit carryforwards | 1,668 | 2,645 | |||||
Accrued pension benefits | 1,122 | — | |||||
Accrued employee benefits | 2,405 | 1,681 | |||||
Other | 858 | 793 | |||||
Total deferred tax assets | 13,222 | 11,867 | |||||
Deferred tax liabilities: | |||||||
Depreciation | 4,570 | 4,408 | |||||
Amortization | 10,881 | 12,165 | |||||
Prepaid pension benefits | — | 236 | |||||
Other | — | 14 | |||||
Total deferred tax liabilities | 15,451 | 16,823 | |||||
Net deferred tax liabilities | $ | (2,229 | ) | $ | (4,956 | ) | |
At December 31, 2014 and 2013, the Company had federal carryforwards of $4.1 million and $5.0 million, respectively. At December 31, 2014 and 2013, the Company also had state net operating loss carryforwards of $4.1 million and $5.0 million, respectively. The Company’s U.S. federal and state net operating loss carryforwards expire between 2029 and 2033.
At December 31, 2014 and 2013, the Company had federal and state general business credit carryforwards of $0.2 million in each year. The Company’s U.S. federal and state tax credit carryforwards expire between 2029 and 2033.
The Company’s federal and state net operating loss and federal and state credit carryforwards are limited on an annual basis to $1.2 million under Internal Revenue Code Section 382 and Section 383. The federal and state net operating loss carryforwards must be fully utilized prior to the utilization of the federal and state credit carryforwards.
No provision for federal income taxes was made on the earnings of foreign subsidiaries that are considered indefinitely invested or that would be offset by foreign tax credits upon distribution. Such undistributed earnings at December 31, 2014 were $20.5 million.
50
BADGER METER, INC.
Notes to Consolidated Financial Statements (continued)
December 31, 2014, 2013 and 2012
Changes in the Company's gross liability for unrecognized tax benefits, excluding interest and penalties, are as follows:
2014 | 2013 | ||||||
(In thousands) | |||||||
Balance at beginning of year | $ | 880 | $ | 698 | |||
Increases in unrecognized tax benefits as a result of positions taken during the prior period | 11 | 80 | |||||
Increases in unrecognized tax benefits as a result of positions taken during the current period | 185 | 216 | |||||
Reductions to unrecognized tax benefits as a result of a lapse of the applicable statute of limitations | (230 | ) | (114 | ) | |||
Balance at end of year | $ | 846 | $ | 880 | |||
The Company does not expect a significant increase or decrease to the total amounts of unrecognized tax benefits during the fiscal year ending December 31, 2015. To the extent these unrecognized tax benefits are ultimately recognized, they will impact the effective tax rate.
The Company and its subsidiaries file income tax returns in the U.S. federal jurisdiction, and various states and foreign jurisdictions. The Company is no longer subject to U.S. federal income tax examinations by tax authorities for years prior to 2011, and, with few exceptions, state and local income tax examinations by tax authorities for years prior to 2010. The Company's policy is to recognize interest related to unrecognized tax benefits as interest expense and penalties as operating expenses. Accrued interest was approximately $0.1 million at both December 31, 2014 and 2013, and there were no penalties accrued in either year.
The Company believes that it has appropriate support for the income tax positions taken and to be taken on its tax returns and that its accruals for tax liabilities are adequate for all open years based on an assessment of many factors including past experience and interpretations of tax law applied to the facts of each matter.
Note 9 Long-Term Debt
In 2010, the Company restructured the outstanding debt of its ESSOP by loaning the ESSOP $0.5 million to repay a loan to a third party and loaning the ESSOP an additional $1.0 million to purchase additional shares of the Company’s Common Stock for future 401(k) savings plan matches under a program that will expire on December 31, 2020. Under this program, the Company agreed to pay the principal and interest on the new loan amount of $1.5 million. The receivable from the ESSOP and the related obligation were therefore netted to zero on the Company’s Consolidated Balance Sheets at December 31, 2014 and 2013. The terms of the loan call for equal payments of principal with the final payment due on December 31, 2020, and prepayments are allowed under the plan terms. At December 31, 2014, $0.9 million of the loan balance remained.
51
BADGER METER, INC.
Notes to Consolidated Financial Statements (continued)
December 31, 2014, 2013 and 2012
Note 10 Industry Segment and Geographic Areas
The Company is an innovator, manufacturer and a marketer of products incorporating flow measurement and control technologies, which comprise one reportable segment. The Company manages and evaluates its operations as one segment primarily due to similarities in the nature of the products, production processes, customers and methods of distribution.
Information regarding revenues by geographic area is as follows:
2014 | 2013 | 2012 | |||||||||
(In thousands) | |||||||||||
Revenues: | |||||||||||
United States | $ | 309,651 | $ | 290,019 | $ | 271,045 | |||||
Foreign: | |||||||||||
Asia | 10,647 | 8,085 | 10,075 | ||||||||
Canada | 12,092 | 8,514 | 8,752 | ||||||||
Europe | 19,448 | 15,677 | 16,001 | ||||||||
Mexico | 3,941 | 4,226 | 6,636 | ||||||||
Middle East | 6,221 | 1,604 | 2,232 | ||||||||
Other | 2,768 | 5,997 | 4,919 | ||||||||
Total | $ | 364,768 | $ | 334,122 | $ | 319,660 | |||||
Information regarding assets by geographic area is as follows:
2014 | 2013 | ||||||
(In thousands) | |||||||
Long-lived assets (all non-current assets): | |||||||
United States | $ | 162,368 | $ | 150,997 | |||
Foreign: | |||||||
Europe | 16,273 | 17,409 | |||||
Mexico | 21,412 | 20,489 | |||||
Total | $ | 200,053 | $ | 188,895 | |||
2014 | 2013 | ||||||
(In thousands) | |||||||
Total assets: | |||||||
United States | $ | 278,094 | $ | 255,881 | |||
Foreign: | |||||||
Europe | 38,453 | 36,838 | |||||
Mexico | 24,611 | 23,339 | |||||
Total | $ | 341,158 | $ | 316,058 | |||
52
BADGER METER, INC.
Notes to Consolidated Financial Statements (continued)
December 31, 2014, 2013 and 2012
Note 11 Unaudited: Quarterly Results of Operations, Common Stock Price and Dividends
Quarter ended | |||||||||||||||
March 31 | June 30 | September 30 | December 31 | ||||||||||||
(In thousands except per share data) | |||||||||||||||
2014 | |||||||||||||||
Net sales | $ | 83,496 | $ | 95,662 | $ | 96,271 | $ | 89,339 | |||||||
Gross margin | $ | 28,951 | $ | 34,831 | $ | 36,465 | $ | 30,895 | |||||||
Net earnings | $ | 4,632 | $ | 8,814 | $ | 10,231 | $ | 6,001 | |||||||
Earnings per share: | |||||||||||||||
Basic | $ | 0.33 | $ | 0.62 | $ | 0.71 | $ | 0.42 | |||||||
Diluted | $ | 0.32 | $ | 0.61 | $ | 0.71 | $ | 0.42 | |||||||
Dividends declared | $ | 0.18 | $ | 0.18 | $ | 0.19 | $ | 0.19 | |||||||
Stock price: | |||||||||||||||
High | $ | 56.03 | $ | 56.96 | $ | 54.33 | $ | 60.91 | |||||||
Low | $ | 47.90 | $ | 46.47 | $ | 47.32 | $ | 47.46 | |||||||
Quarter-end close | $ | 55.10 | $ | 52.65 | $ | 50.45 | $ | 59.35 | |||||||
2013 | |||||||||||||||
Net sales | $ | 71,808 | $ | 88,341 | $ | 92,963 | $ | 81,010 | |||||||
Gross margin | $ | 25,037 | $ | 29,846 | $ | 33,103 | $ | 29,003 | |||||||
Net earnings | $ | 2,907 | $ | 6,281 | $ | 9,049 | $ | 6,380 | |||||||
Earnings per share: | |||||||||||||||
Basic | $ | 0.21 | $ | 0.44 | $ | 0.63 | $ | 0.44 | |||||||
Diluted | $ | 0.20 | $ | 0.44 | $ | 0.63 | $ | 0.44 | |||||||
Dividends declared | $ | 0.17 | $ | 0.17 | $ | 0.18 | $ | 0.18 | |||||||
Stock price: | |||||||||||||||
High | $ | 54.20 | $ | 54.28 | $ | 49.96 | $ | 56.36 | |||||||
Low | $ | 46.82 | $ | 41.88 | $ | 43.96 | $ | 44.80 | |||||||
Quarter-end close | $ | 53.52 | $ | 44.55 | $ | 46.50 | $ | 54.50 | |||||||
The Company's Common Stock is listed on the New York Stock Exchange under the symbol BMI. Earnings per share are computed independently for each quarter. As such, the annual per share amount may not equal the sum of the quarterly amounts due to rounding. The Company currently anticipates continuing to pay cash dividends. Shareholders of record as of December 31, 2014 and 2013 totaled 948 and 969, respectively. Voting trusts and street name shareholders are counted as single shareholders for this purpose.
53
ITEM 9. CHANGES IN AND DISAGREEMENTS WITH ACCOUNTANTS ON ACCOUNTING AND FINANCIAL DISCLOSURE
None.
ITEM 9A. CONTROLS AND PROCEDURES
Evaluation of Disclosure Controls and Procedures
In accordance with Rule 13a-15(b) of the Securities Exchange Act of 1934 (the “Exchange Act”), as amended, the Company's management evaluated, with the participation of the Company's Chairman, President and Chief Executive Officer and the Company's Senior Vice President - Finance, Chief Financial Officer and Treasurer, the effectiveness of the design and operation of the Company's disclosure controls and procedures (as defined in Rule 13a-15(e) under the Exchange Act) as of the end of the year ended December 31, 2014. Based upon their evaluation of these disclosure controls and procedures, the Company's Chairman, President and Chief Executive Officer and the Company's Senior Vice President - Finance, Chief Financial Officer and Treasurer concluded that, as of the date of such evaluation, the Company's disclosure controls and procedures were effective.
Changes in Internal Controls over Financial Reporting
There was no change in the Company's internal control over financial reporting that occurred during the quarter ended December 31, 2014 that has materially affected, or is reasonably likely to materially affect, the Company's internal control over financial reporting.
Management's Annual Report on Internal Control over Financial Reporting
The report of management required under this Item 9A is contained in Item 8 of this 2014 Annual Report on Form 10-K under the heading “Management's Annual Report on Internal Control over Financial Reporting.”
Report of Independent Registered Public Accounting Firm on Internal Control over Financial Reporting
The attestation report required under this Item 9A is contained in Item 8 of this 2014 Annual Report on Form 10-K under the heading “Report of Independent Registered Public Accounting Firm.”
ITEM 9B. OTHER INFORMATION
None.
54
PART III
ITEM 10. DIRECTORS, EXECUTIVE OFFICERS AND CORPORATE GOVERNANCE
Information required by this Item with respect to directors is included under the headings “Nomination and Election of Directors” and “Section 16(a) Beneficial Ownership Reporting Compliance” in the Company's definitive Proxy Statement relating to the Annual Meeting of Shareholders to be held on April 24, 2015, and is incorporated herein by reference.
Information concerning the executive officers of the Company is included in Part I, Item 1 of this 2014 Annual Report on Form 10-K under the heading “Business - Employees.”
The Company has adopted the Badger Meter, Inc. Code of Conduct for Financial Executives that applies to the Company's Chairman, President and Chief Executive Officer, the Company's Senior Vice President - Finance, Chief Financial Officer and Treasurer and other persons performing similar functions. A copy of the Badger Meter, Inc. Code of Conduct for Financial Executives is posted on the Company's website at www.badgermeter.com. The Badger Meter, Inc. Code of Conduct for Financial Executives is also available in print to any shareholder who requests it in writing from the Secretary of the Company. The Company satisfies the disclosure requirements under Item 5.05 of Form 8-K regarding amendments to, or waivers from, the Badger Meter, Inc. Code of Conduct for Financial Executives by posting such information on the Company's website at www.badgermeter.com.
The Company is not including the information contained on its website as part of, or incorporating it by reference into, this 2014 Annual Report on Form 10-K
ITEM 11. EXECUTIVE COMPENSATION
Information required by this Item is included under the headings “Executive Compensation” and “Compensation Committee Interlocks and Insider Participation” in the Company's definitive Proxy Statement relating to the Annual Meeting of Shareholders to be held on April 24, 2015, and is incorporated herein by reference; provided, however, that the information under the subsection “Executive Compensation - Compensation Committee Report” is not deemed to be “soliciting material” or to be “filed” with the Securities and Exchange Commission or subject to Regulation 14A or 14C under the Exchange Act or to be the liabilities of Section 18 of the Exchange Act, and will not be deemed to be incorporated by reference into any filing under the Securities Act of 1933, as amended, or the Exchange Act, except to the extent it is specifically incorporated by reference into such a filing.
ITEM 12. SECURITY OWNERSHIP OF CERTAIN BENEFICIAL OWNERS AND MANAGEMENT AND RELATED STOCKHOLDER MATTERS
Information required by this Item is included under the headings “Stock Ownership of Beneficial Owners Holding More than Five Percent,” “Stock Ownership of Management” and “Equity Compensation Plan Information” in the Company's definitive Proxy Statement relating to the Annual Meeting of Shareholders to be held on April 24, 2015, and is incorporated herein by reference.
ITEM 13. CERTAIN RELATIONSHIPS AND RELATED TRANSACTIONS, AND DIRECTOR INDEPENDENCE
Information required by this Item is included under the headings “Related Person Transactions” and “Nomination and Election of Directors - Independence, Committees, Meetings and Attendance” in the Company's definitive Proxy Statement relating to the Annual Meeting of Shareholders to be held on April 24, 2015, and is incorporated herein by reference.
ITEM 14. PRINCIPAL ACCOUNTANT FEES AND SERVICES
Information required by this Item is included under the heading “Principal Accounting Firm Fees” in the Company's definitive Proxy Statement relating to the Annual Meeting of Shareholders to be held on April 24, 2015, and is incorporated herein by reference.
55
PART IV
ITEM 15. EXHIBITS, FINANCIAL STATEMENT SCHEDULES
Documents filed as part of this Annual Report on Form 10-K:
1. | Financial Statements. See the financial statements included in Part II, Item 8 “Financial Statements and Supplementary Data” in this 2014 Annual Report on Form 10-K, under the headings “Consolidated Balance Sheets,” “Consolidated Statements of Operations,” ”Consolidated Statements of Comprehensive Income,” “Consolidated Statements of Cash Flows” and “Consolidated Statements of Shareholders' Equity.” |
2. | Financial Statement Schedules. Financial statement schedules are omitted because the information required in these schedules is included in the Notes to Consolidated Financial Statements. |
3. | Exhibits. See the Exhibit Index included in this 2014 Annual Report on Form 10-K that is incorporated herein by reference. |
56
SIGNATURES
Pursuant to the requirements Section 13 or 15(d) of the Securities Exchange Act of 1934, the registrant has duly caused this report to be signed on its behalf by the undersigned, thereunto duly authorized, on March 4, 2015.
BADGER METER, INC. | ||
By: | /s/ Richard A. Meeusen | |
Richard A. Meeusen | ||
Chairman, President and Chief Executive Officer | ||
Pursuant to the requirements of the Securities Exchange Act of 1934, this report has been signed below by the following persons on behalf of the registrant and in the capacities indicated on March 4, 2015.
Name | Title | |
/s/ Richard A. Meeusen | Chairman, President and Chief Executive Officer and Director (Principal executive officer) | |
Richard A. Meeusen | ||
/s/ Richard E. Johnson | Senior Vice President — Finance, Chief Financial Officer and Treasurer (Principal financial officer) | |
Richard E. Johnson | ||
/s/ Beverly L. P. Smiley | Vice President — Controller (Principal accounting officer) | |
Beverly L. P. Smiley | ||
/s/ Ronald H. Dix | Director | |
Ronald H. Dix | ||
/s/ Thomas J. Fischer | Director | |
Thomas J. Fischer | ||
/s/ Gale E. Klappa | Director | |
Gale E. Klappa | ||
/s/ Gail A. Lione | Director | |
Gail A. Lione | ||
/s/ Andrew J. Policano | Director | |
Andrew J. Policano | ||
/s/ Steven J. Smith | Director | |
Steven J. Smith | ||
/s/ Todd J. Teske | Director | |
Todd J. Teske | ||
57
EXHIBIT INDEX
EXHIBIT NO. | EXHIBIT DESCRIPTION | |
(2.0)* | Acquisition Agreement dated as of December 30, 2011, by and among Racine Federated, Inc. the Shareholders’ Representative (named therein), Badger Meter, Inc. and RFI Acquisition Corp. | |
[Incorporated by reference to Exhibit (2.1) to Badger Meter, Inc.’s Current Report on Form 8-K dated December 30, 2011 (Commission File No. 001-06706)]. | ||
(3) | Restated Articles of Incorporation (as in effect as of August 8, 2008). | |
[Incorporated by reference to Exhibit (3.2) to Badger Meter, Inc.’s Quarterly Report on Form 10-Q for the period ended September 30, 2008 (Commission File No. 001-06706)]. | ||
(3.1) | Restated By-Laws (as amended and restated as of February 12, 2010). | |
[Incorporated by reference to Exhibit (3.1) to Badger Meter, Inc.’s Annual Report on Form 10-K for the period ended December 31, 2009 (Commission File No. 001-06706)]. | ||
(4) | Rights Agreement, dated February 15, 2008, between Badger Meter, Inc. and American Stock Transfer & Trust Company. | |
[Incorporated by reference to Exhibit (4.1) to Badger Meter, Inc.’s Current Report on Form 8-K, dated February 22, 2008 (Commission File No. 001-06706)]. | ||
(4.1) | Loan Agreement dated May 23, 2012 between Badger Meter, Inc. and BMO Harris Bank relating to Badger Meter, Inc.'s revolving credit agreement. | |
[Incorporated by reference from Exhibit (4.1) to Badger Meter, Inc.'s Quarterly Report on Form 10-Q for the period ended June 30, 2012 (Commission File No. 001-06706)]. | ||
(4.2) | First Amendment to Credit Agreement dated May 21, 2013, related to the Loan Agreement dated May 23, 2012 between Badger Meter, Inc. and BMO Harris Bank NA for Badger Meter, Inc.'s credit agreement. | |
[Incorporated by reference from Exhibit (4.1) to Badger Meter, Inc.'s Quarterly Report on Form 10-Q for the period ended June 30, 2013 (Commission File No. 001-06706)]. | ||
(4.3) | Second Amendment to Credit Agreement dated May 21, 2014, related to the Loan Agreement dated May 23, 2012 between Badger Meter, Inc. and BMO Harris Bank NA for Badger Meter, Inc.'s credit agreement. | |
[Incorporated by reference from Exhibit (4.1) to Badger Meter, Inc.'s Quarterly Report on Form 10-Q for the period ended June 30, 2014 (Commission File No. 001-06706)]. | ||
(10.0)** | Badger Meter, Inc. Employee Savings and Stock Ownership Plan. | |
[Incorporated by reference from Exhibit (4.1) to Badger Meter, Inc.’s Form S-8 Registration Statement (Registration No. 33-62241)]. | ||
(10.1)** | Badger Meter, Inc. 1997 Stock Option Plan. | |
[Incorporated by reference from Exhibit (4.1) to Badger Meter, Inc.’s Form S-8 Registration Statement (Registration No. 333-28617)]. | ||
(10.2)** | Badger Meter, Inc. 1999 Stock Option Plan. | |
[Incorporated by reference from Exhibit (4.1) to Badger Meter, Inc.’s Form S-8 Registration Statement (Registration No. 333-73228)]. | ||
(10.3)** | Badger Meter, Inc. 2003 Stock Option Plan. | |
[Incorporated by reference from Exhibit (4.1) to Badger Meter, Inc.’s Form S-8 Registration Statement (Registration No. 333-107850)]. | ||
(10.4)** | Form of the Key Executive Employment and Severance Agreements between Badger Meter, Inc. and the applicable executive officers. | |
58
EXHIBIT INDEX (CONTINUED)
EXHIBIT NO. | EXHIBIT DESCRIPTION | |
[Incorporated by reference from Exhibit (10.12) to Badger Meter, Inc.’s Annual Report on Form 10-K for the period ended December 31, 2008 (Commission File No. 001-06706)]. | ||
(10.5)** | Amended and Restated Badger Meter, Inc. Executive Supplemental Plan. | |
[Incorporated by reference from Exhibit (10.13) to Badger Meter, Inc.’s Annual Report on Form 10-K for the period ended December 31, 2008 (Commission File No. 001-06706)]. | ||
(10.6)** | Amended and Restated Badger Meter, Inc. Deferred Compensation Plan. | |
[Incorporated by reference from Exhibit (10.14) to Badger Meter, Inc.’s Annual Report on Form 10-K for the period ended December 31, 2008 (Commission File No. 001-06706)]. | ||
(10.7)** | Amended and Restated Deferred Compensation Plan for Certain Directors. | |
[Incorporated by reference from Exhibit (10.15) to Badger Meter, Inc.’s Annual Report on Form 10-K for the period ended December 31, 2008 (Commission File No. 001-06706)]. | ||
(10.8)** | Amended and Restated Executive Supplemental Plan II. | |
[Incorporated by reference from Exhibit (10.16) to Badger Meter, Inc.’s Annual Report on Form 10-K for the period ended December 31, 2008 (Commission File No. 001-06706)]. | ||
(10.9)** | Badger Meter, Inc. 2011 Omnibus Incentive Plan. | |
[Incorporated by reference from Exhibit (4.1) to Badger Meter, Inc.’s Form S-8 Registration Statement (Registration No. 333-173966)]. | ||
(10.10)** | Form of Nonqualified Stock Option Agreement under Badger Meter, Inc. 2011 Omnibus Incentive Plan. | |
[Incorporated by reference from Badger Meter, Inc.’s Form 8-K dated April 29, 2011 (Commission No. 001-06760)]. | ||
(10.11)** | Form of Restricted Stock Award Agreement under Badger Meter, Inc. 2011 Omnibus Incentive Plan. | |
[Incorporated by reference from Badger Meter, Inc.’s Form 8-K dated April 29, 2011 (Commission No. 001-06760)]. | ||
(21) | Subsidiaries of the Registrant. | |
(23) | Consent of Ernst & Young LLP. | |
(31.1) | Certification by the Chief Executive Officer pursuant to Section 302 of the Sarbanes-Oxley Act of 2002. | |
(31.2) | Certification by the Chief Financial Officer pursuant to Section 302 of the Sarbanes-Oxley Act of 2002. | |
(32) | Certification of Periodic Financial Report by the Chief Executive Officer and Chief Financial Officer pursuant to Section 906 of the Sarbanes-Oxley Act of 2002. | |
(99) | Definitive Proxy Statement for the Annual Meeting of Shareholders to be held April 25, 2014. To be filed with the Securities and Exchange Commission under Regulation 14A within 120 days after the end of the Registrant’s fiscal year. With the exception of the information incorporated by reference into Items 10, 11, 12, 13 and 14 of this Annual Report on Form 10-K, the definitive Proxy Statement is not deemed filed as part of this report. | |
(101) | The following materials from the Company's Annual Report on Form 10-K for the year ended December 31, 2013 formatted in Extensible Business Reporting Language (XBRL): (i) the Consolidated Balance Sheets, (ii) the Consolidated Statements of Operations, (iii) the Consolidated Statements of Comprehensive Income, (iv) the Consolidated Statements of Cash Flows, (v) the Consolidated Statements of Shareholders' Equity, (vi) Notes to Consolidated Financial Statements, tagged as blocks of text and (vii) document and entity information. | |
* | The disclosure schedules and exhibits to the Acquisition Agreement are not being filed herewith. Badger Meter, Inc. agrees to furnish supplementally a copy of any such schedules and exhibits to the Securities and Exchange Commission upon request. |
** | A management contract or compensatory plan or arrangement. |
59