Attached files
| file | filename |
|---|---|
| 8-K - FORM 8-K - TEMPUR SEALY INTERNATIONAL, INC. | d883865d8k.htm |
 Tempur Sealy International, Inc.
March 3-4, 2015
“Improving the Sleep of More People Every Night,
All Around the World
”
Exhibit 99.1 |
 2
This investor presentation contains "forward-looking statements,” within the meaning of
the federal securities laws, which include information concerning one or more of the Company's
plans, objectives, goals, strategies, and other information that is not historical information. When
used in this presentation, the words "assumes," "estimates," "expects," “guidance,”
"anticipates," "projects," "plans," “proposed,” "intends,"
"believes," and variations of such words or similar expressions are intended to identify forward-looking statements. These
forward-looking statements include, without limitation, statements relating to the Company’s
expectations regarding its key strategic growth initiatives and strategic priorities,
expectations regarding the Company’s net sales, revenue performance, adjusted EBITDA, adjusted
EPS, operating cash flow, free cash flow, synergies and pricing increases and related
assumptions for 2015 and subsequent years, expectations regarding net sales growth rates, sales growth opportunities for Sealy in international markets and for the TEMPUR-
Flex line of products, margin improvements, expansion of distribution, AUSP growth, the impact of
foreign exchange, the Company’s leverage ratio, and expectations regarding growth
opportunities relating to acquisitions and returning value to stockholders. All forward looking
statements are based upon current expectations and beliefs and various assumptions. There can
be no assurance that the Company will realize these expectations or that these beliefs will prove correct.
Numerous factors, many of which are beyond the Company's control, could cause actual results to differ
materially from those expressed as forward-looking statements in this investor presentation.
These risk factors include risks associated with the Company’s capital structure and increased debt level; the ability to successfully integrate Sealy into the Company’s
operations and realize cost and revenue synergies and other benefits from the transaction; whether the
Company will realize the anticipated benefits from its asset dispositions in 2014 and the
acquisition of brand rights in certain international markets in 2014; general economic, financial and industry conditions, particularly in the retail sector, as well as consumer
confidence and the availability of consumer financing; changes in product and channel mix and the
impact on the Company's gross margin; changes in interest rates; the impact of the
macroeconomic environment in both the U.S. and internationally on the Company's business segments;
uncertainties arising from global events; the effects of changes in foreign exchange rates on
the Company’s reported net sales and earnings; consumer acceptance of the Company’s products; industry competition; the efficiency and effectiveness of the
Company’s advertising campaigns and other marketing programs; the Company’s ability to
increase sales productivity within existing retail accounts and to further penetrate the
Company’s retail channel, including the timing of opening or expanding within large retail
accounts and the timing and success of product launches; the effects of consolidation of
retailers on revenues and costs; the Company’s ability to expand brand awareness, distribution
and new products; the Company’s ability to continuously improve and expand its product
line, maintain and improve efficient, timely and cost-effective production and delivery of its products, and manage its growth; the effects of strategic investments on the
Company’s operations; changes in foreign tax rates and changes in tax laws generally, including
the ability to utilize tax loss carry forwards; the outcome of various pending tax audits or
other tax, regulatory or litigation proceedings; changing commodity costs; and the effect of future legislative or regulatory changes.
Additional information concerning these and other risks and uncertainties are discussed in the
Company's filings with the Securities and Exchange Commission, including without limitation the
Company's 2014 Annual Report on Form 10-K filed on February 13, 2015 with the SEC, under the headings "Special Note Regarding Forward-Looking Statements" and
"Risk Factors." Any forward-looking statement speaks only as of the date on which it is
made, and the Company undertakes no obligation to update any forward-looking statements for
any reason, including to reflect events or circumstances after the date on which such statements are
made or to reflect the occurrence of anticipated or unanticipated events or circumstances.
Forward-Looking Statements
In this investor presentation we provide or refer to certain historical information
for the Company. For a more detailed discussion of the Company’s financial performance please refer to the
Company’s SEC filings.
TEMPUR, Tempur-Pedic, TEMPUR-Cloud, TEMPUR-Choice,
TEMPUR-Weightless, TEMPUR-Contour, TEMPUR-Rhapsody, TEMPUR-Flex, GrandBed, TEMPUR-Simplicity, TEMPUR-
Ergo, TEMPUR-UP, TEMPUR-Neck, TEMPUR-Symphony, TEMPUR-Comfort,
TEMPUR-Traditional, TEMPUR-Home, Sealy, Sealy Posturepedic, Stearns & Foster, and Optimum are
trademarks, trade names or service marks of Tempur Sealy International, Inc. and/or
its subsidiaries. All other trademarks, trade names and service marks in this presentation are the
property of the respective owners.
Note Regarding Historical Financial Information: Note Regarding Trademarks, Trade Names and Service
Marks: |
 3
Mark Sarvary
President & Chief Executive Officer |
 4
Largest And Only Truly Global Bedding Company
Comprehensive Portfolio of Iconic Brands
Complete and Complementary Product Offering
Strong Management Team, Executing A Compelling Strategy
Significant Sales, Margin and Earnings Growth Opportunity
Strong Cash Flow |
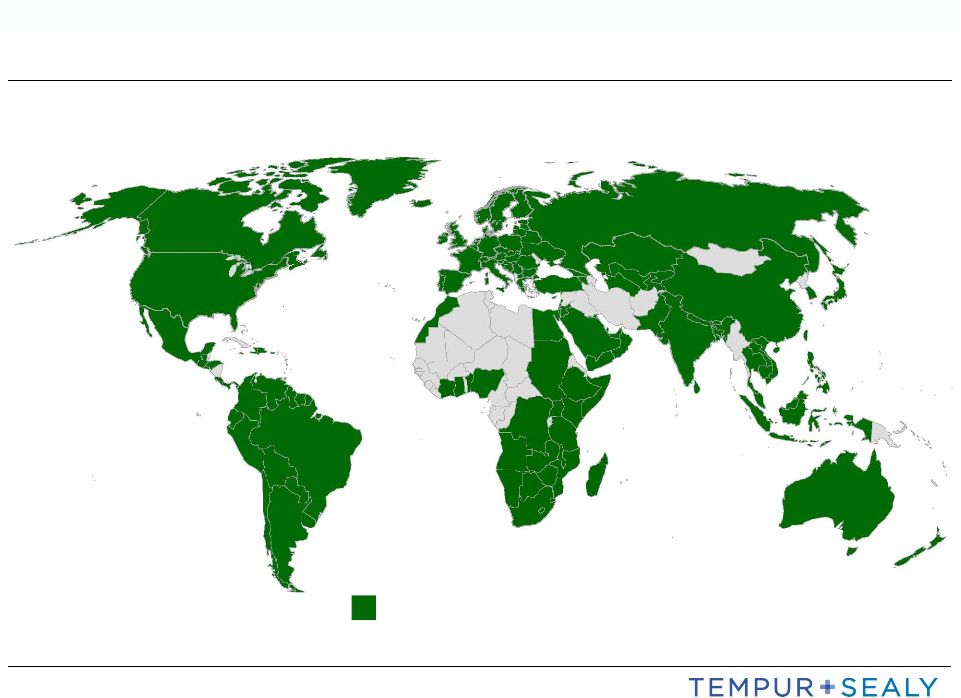 The
Industry’s Only Truly Global Company Tempur Sealy Presence
Note: Presence includes subsidiaries, joint ventures, third party, and licensee
markets. 5 |
 Complete
and Complementary Portfolio of Brands Luxury
Premium
Mid-Price
Value
6
•
#1 US Brand People Are Most Interested In Purchasing
•
#1 US Brand In Total Awareness
•
#1 US Brand People Are Most Likely To Buy
•
#1 US Brand In Luxury Innerspring Sales
Note
1:
2014
Mattress
Industry
Consumer
Research
–
U.S.
Market
Note
2:
Stearns
&
Foster
#1
US
Brand
in
Luxury
Innerspring
Sales
based
on
management
estimates.
Tempur-Pedic
Stearns & Foster
Sealy |
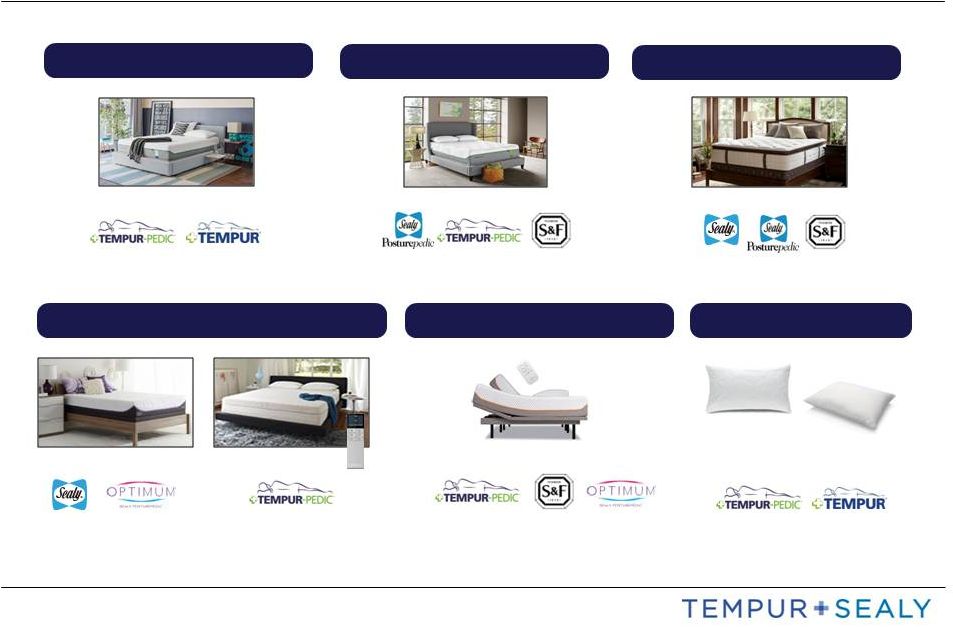 Complete
Range Of Products Innerspring
Hybrid
Stearns & Foster
TEMPUR-Flex
Adjustable Comfort
TEMPUR-Cloud
Memory Foam, Gel Visco, Latex
Tempur Material
Other Specialty
7
Adjustable Bases
TEMPUR-Ergo Plus
Pillows
TEMPUR Pillows |
 Strong,
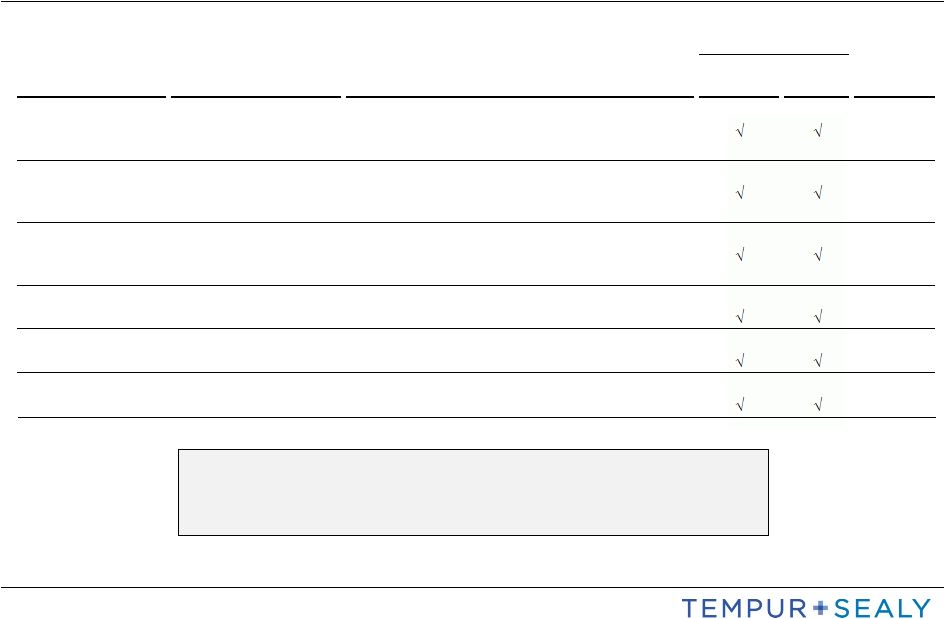
Established Management Team 8
Experienced Management Team With Proven Track
Record Of Execution
Years with
Consumer
Tempur
Name
Position
Prior Experience
Products
Inter'l
Sealy
Mark Sarvary
President and CEO
President, Campbell Soup North America
CEO, J. Crew Group
6
President, Stouffer's Frozen Food Division at Nestle
Tim Yaggi
COO
Group President, Masco Corporation
EVP, Whirlpool Corporation
2
Norelco (Philips)
Dale Williams
EVP and CFO
CFO, Honeywell Control Products
CFO, Saga Systems
11
CFO, GE Information Systems
Rick Anderson
EVP and President,
VP, Gillette
North America
Gillette / Procter & Gamble
8
David Montgomery
EVP and President,
President, Rubbermaid Europe
International
VP, Black & Decker Europe, Middle East, Africa
12
Jay Spenchian
EVP and Chief Marketing
EVP and CMO, Olive Garden and Red Lobster
Officer
Executive Director, Marketing, General Motors
Prior Experience
Joined in
2014 |
 Key
Priorities 2012 – 2014
Return Tempur North America to growth and improve operating margins
Revamped entire product offering (2012-2014) and improved retailer economics
(August 2012) Sales growth resumed and margins expanded significantly in
2H-2014 and expected to further expand in 2015 Maintain Sealy sales
growth momentum and margins Sales growth had just begun prior to the
acquisition in 2013, and growth continued in 2013 and accelerated in
2014
Margins, however, declined in 2014 and are a primary area of focus in 2015 and
beyond Integrate Sealy
Organizational integration with Sealy essentially complete in North America
Cost synergies realized from the acquisition are ahead of our projections
Capitalizing on strategic growth initiatives of complementary brand and product
portfolio Position International business for future growth
Acquired Sealy brand rights in Europe (ex. UK) and Japan, and commenced
roll-out in 3Q 2014 (Weakness in Central Europe affected overall
International performance) Reinvested A Significant Portion Of Cost
Synergies Realized From Sealy Acquisition To Support These Key
Priorities 9 |
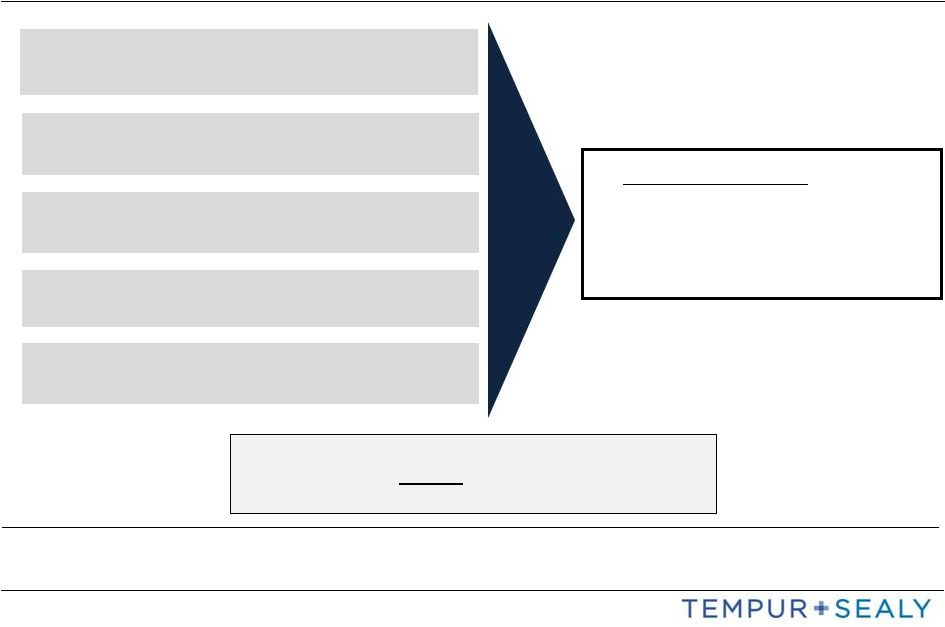 10
Tempur Sealy Strategic Priorities
Leverage and Strengthen Our Comprehensive
Portfolio Of Iconic Brands & Products
Expand Distribution And Seek Highest Dealer
Advocacy
Expand Margins With Focus On Driving
Significant Cost Improvement
Accretive Acquisitions Of Licensees And Joint
Ventures
Leverage Global Scale For Competitive
Advantage
•
Base Annual Targets:
Sales Growth Of 6% And Adjusted
EPS Growth Of 15%
•
Strong Cash Flow To Reduce Debt
And Return Value to Stockholders
Delivering Value
For Stockholders
Note 1: Management estimates. Please refer to “Forward Looking Statements”.
Note 2: Targets are based on constant currency. For information on the methodology used to
present constant currency information please refer to slide 31. Note 3: Adjusted EPS (which is a non-GAAP measure) is EPS adjusted for Sealy
transaction and integration costs, loss on disposal of business related to the disposition of the three U.S. innerspring
component facilities and related equipment, interest and fees incurred in connection with debt
refinancings, normalized tax rate adjustments and to exclude certain non-recurring items. Please refer
to the reconciliations on slide 23 and the Company’s SEC filings for more information regarding
the definition of adjusted EPS. |
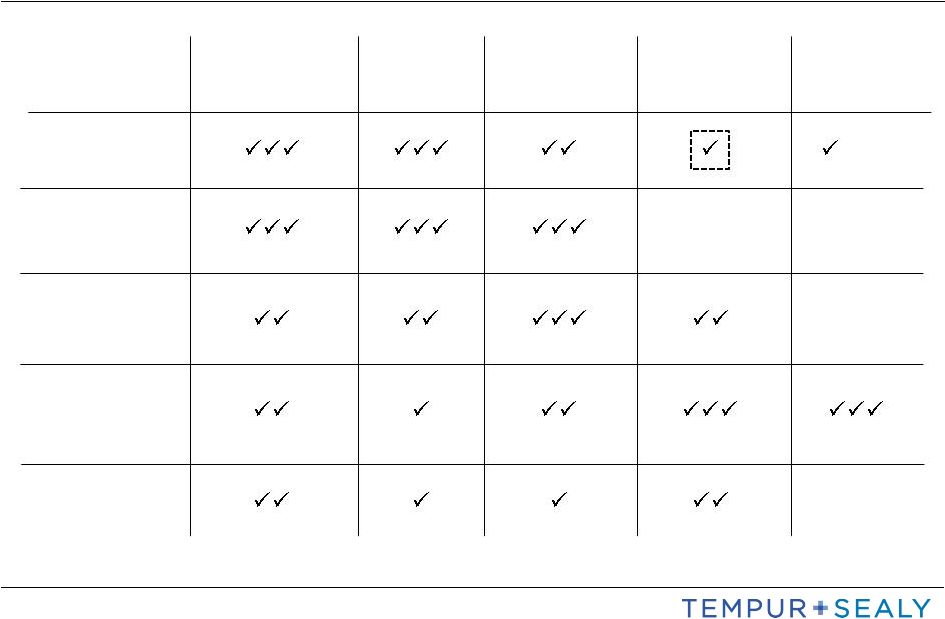 US
Canada
Europe
Asia Pacific
Latin America
11
Growth Drivers By Geography
Marketing
Product
Innovation
Opening Own
Stores
Leveraging
Distribution
Synergies
Leverage
JV
(CR) |
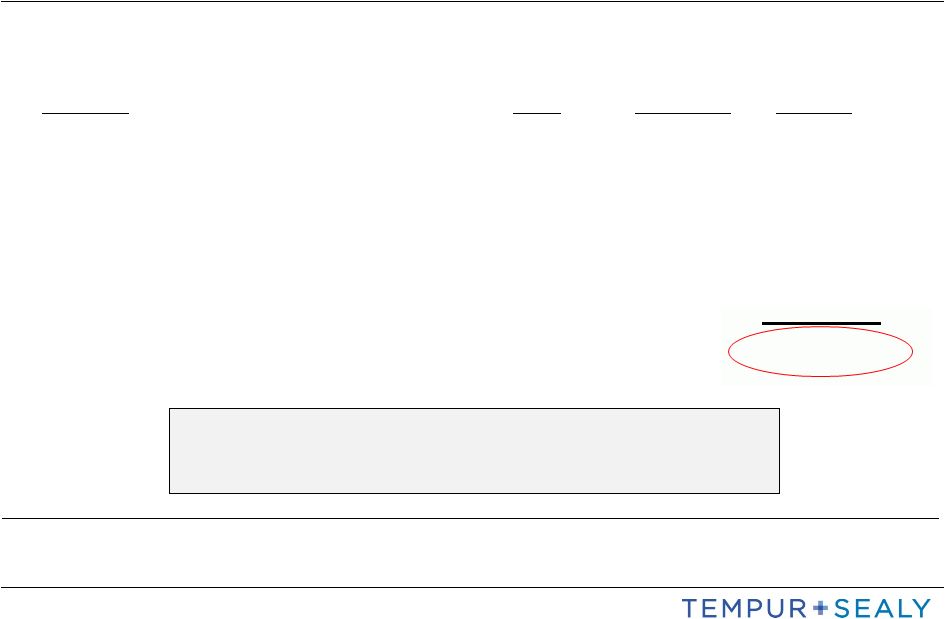 Expand
Margins With Focus On Driving Significant Cost Improvement
12
2015 -2018
Objective
2014
Annual
Incremental
Operating
Income
1
Initiative
Sealy
US
Gross
Margin
Improvement
2
30%
33%
$45 million
Cost
Synergies
4
$45 million
$70 million
$25 million
Adjusted
Operating
Expense
Leverage
3
29%
28%
$30 million
$125 million
2015 Pricing
–
$25 million
$25 million
These Initiatives Alone Provide More Than 300bps Of
Operating Margin Improvement
Note 1: Represents initiatives to be achieved by 2018. Our expectation is that they will ramp
through the period. Approximately 30% of the total $125 million is incorporated into our full year 2015 adjusted EPS guidance. See
“Forward Looking Statements”.
Note 2: Refers to Sealy gross margin in the U.S. of 30% in 2014. Sealy US gross margin
improvement excludes the benefit from cost synergies. Note 3: Adjusted operating expense leverage is a non-GAAP measure. For information on the
methodology used to present adjusted operating expense leverage and a reconciliation to GAAP operating expense leverage
please refer to slide 26.
Note 4: Cost synergies reflect annualized cost synergies realized from the Sealy transaction.
|
 Leverage
Global Scale For Competitive Advantage Tempur Sealy Is Uniquely Positioned
To Capitalize On Its Integrated Product And Brand Portfolio On A Global
Basis •
Procurement
•
R&D
•
Engineering and design
Product Development
•
Cloud and Breeze Beds
•
Stearns & Foster
•
Posturepedic Hybrid
Distribution
Brand
13 |
 Dale Williams
Executive Vice President & Chief Financial Officer
14 |
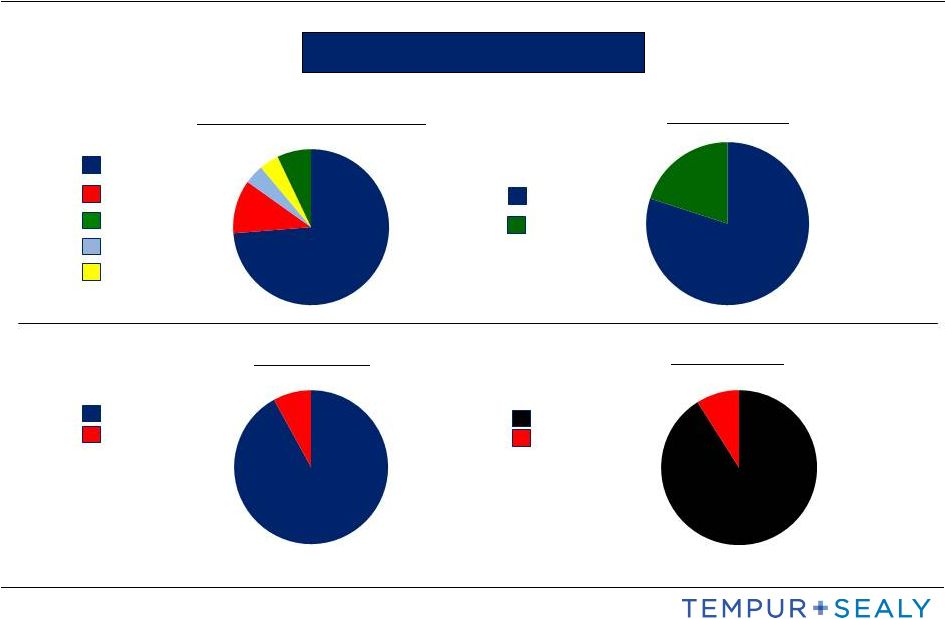 Globally
Diverse Bedding Provider Largely Sold In The Retail Channel
2014 Net Sales
By Segment
International
North America
15
By Geographic Region
Europe
US
Canada
Asia Pacific
Latin America
Other
Retail
By Channel
Other
By Product
Bedding
73%
11%
7%
80%
20%
92%
8%
91%
9% |
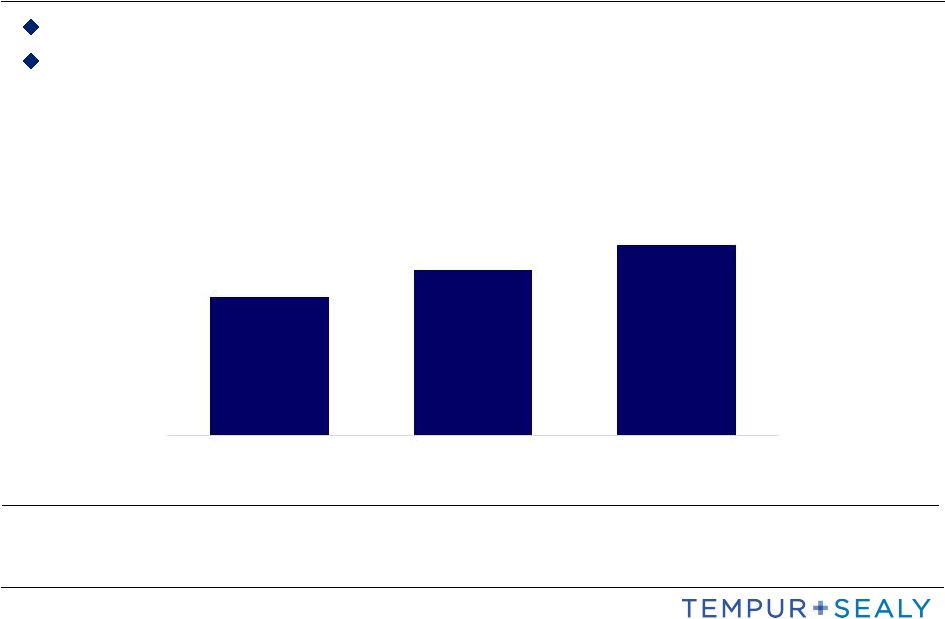
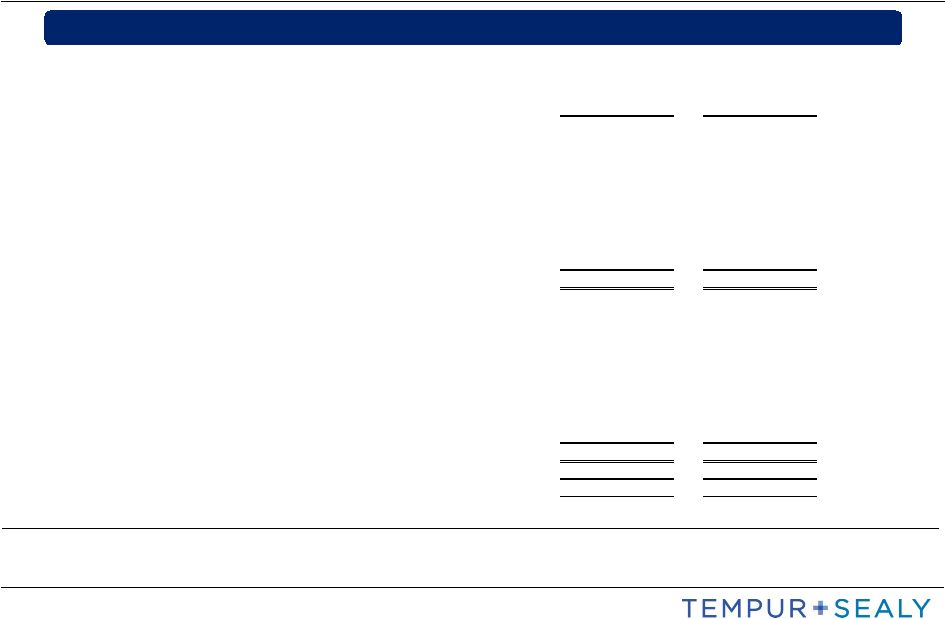
 2014 Net Sales increased 21%
Estimated net sales growth would have been +8% had we owned Sealy for all of
2013 2015 Net Sales growth guidance of 2% to 5%, and includes unfavorable FX
of 3.5% Net Sales
16
($ in millions)
$2,464
$2,990
2013
2014
2015P
Net Sales
$3,050-$3,150
Note 1: Please refer to “Forward Looking Statements”.
Note 2: Estimated net sales growth of 8% for 2014 is based on Tempur Sealy International
consolidated net sales for 2013 plus management’s estimates for Sealy sales for the period of January 1, 2013 to
March 17, 2013. The Sealy acquisition was completed on March 18, 2013.
Note 3: 2015P is the Company’s Net Sales guidance issued on February 5, 2015, which
consisted of full year 2015 Net Sales of $3.050 billion to $3.150 billion. Note 4: For information on the methodology used to present constant currency information please
refer to slide 31. |
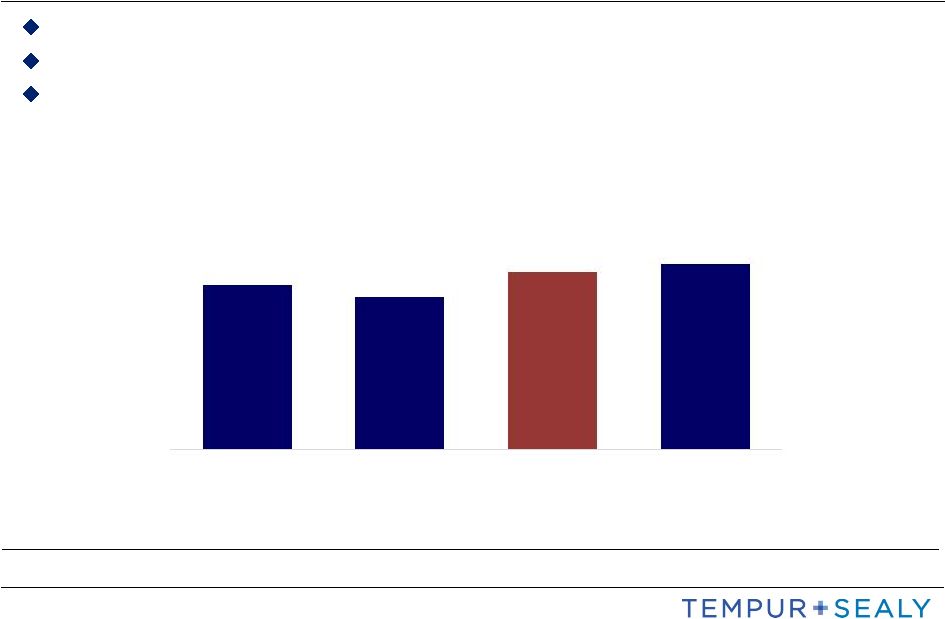 17
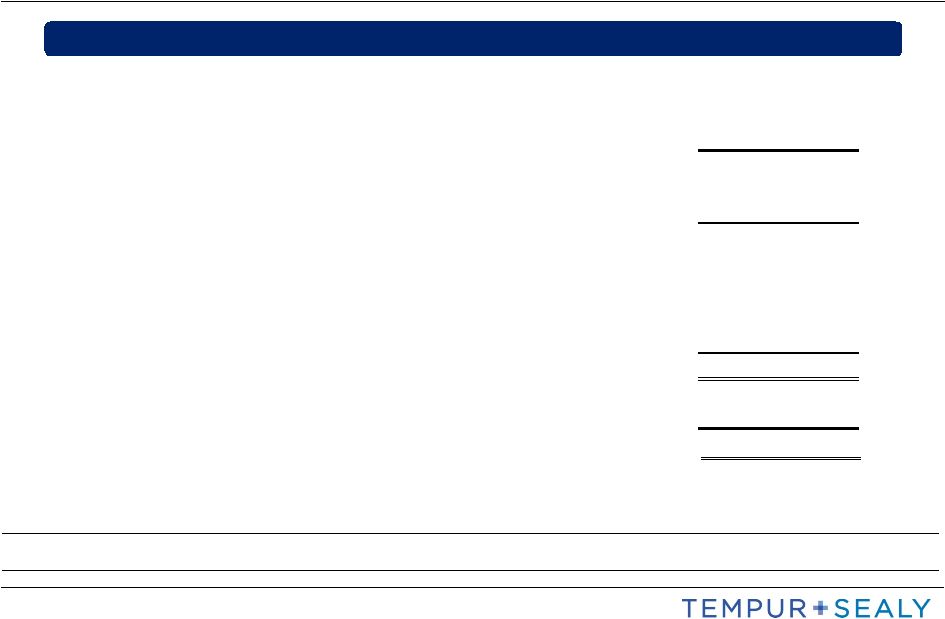
(GAAP Reported Operating Margin)
2014
GAAP
operating
margin
includes
$43.8
million
of
integration
costs
(1.5%
of
net
sales)
Adjusted
operating
margin
is
expected
to
be
up
10bps
to
80bps
in
2015
On a constant currency basis, adjusted operating margin is expected
to be up 75bps to 150bps in 2015
Operating Margin
Note 1: 2015 operating margin improvement based on management estimates.
Please refer to “Forward Looking Statements”. Note 2: Adjusted
operating margin is a non-GAAP measure. For information on the methodology used to present Adjusted operating margin and a reconciliation to GAAP operating margin please refer to slide 27.
Note 3: For information on the methodology used to present constant currency
information please refer to slide 31. Adjusted Operating
Margin
Adjusted Operating
Margin
9.9%
9.2%
10.7%
10.8%-11.5%
2013
2014
2014
2015P
Operating Margin |
 18
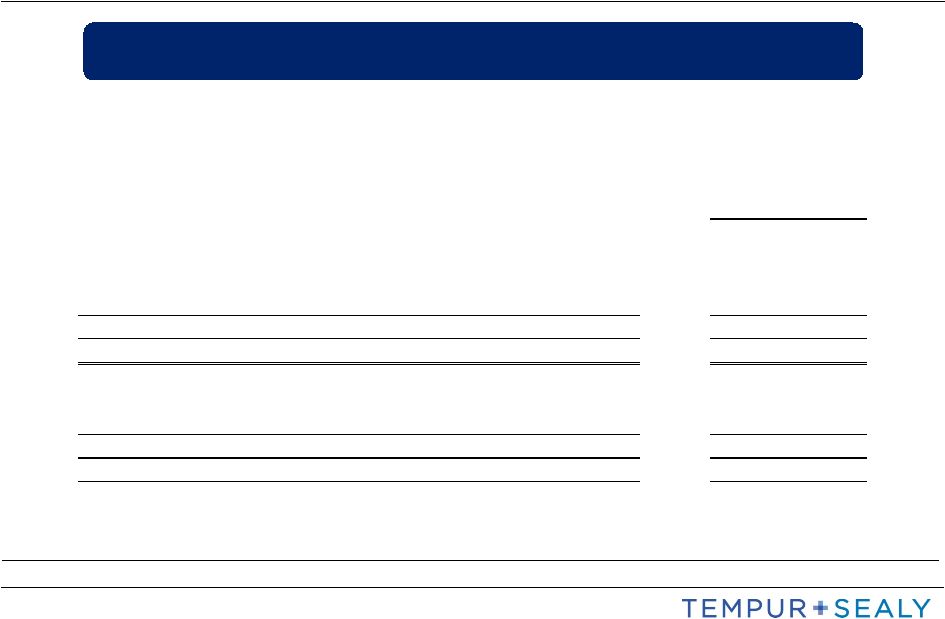
Adjusted EPS
2014 Adjusted EPS increased 11%; on a constant currency basis
would have increased 18% 2015 Adjusted
EPS is expected to grow 12% to 27% on a constant currency basis Note 1: Adjusted EPS
amounts for 2015 based on management estimates. On February 5, 2015, the Company issued guidance for Adjusted EPS for full year 2015 of $2.70 to $3.10. Please refer to “Forward Looking
Statements”.
Note 2: GAAP EPS for 2013 was $1.28 and GAAP EPS for 2014 was $1.75.
Note 3: Base Annual Adjusted EPS Growth Target is based on constant currency. For information on
the methodology used to present constant currency information please refer to slide 31.
Note 4: Adjusted EPS (which is a non-GAAP measure) is EPS adjusted for Sealy transaction and
integration costs, loss on disposal of business related to the disposition of the three U.S. innerspring component facilities
and related equipment, interest and fees incurred in connection with debt refinancings, normalized tax
rate adjustments and to exclude certain non-recurring items. Please refer to the reconciliations on slide 23
and the Company’s SEC filings for more information regarding the definition of adjusted EPS.
$2.38
$2.65
$2.70-$3.10
2013
2014
2015P
Adjusted EPS |
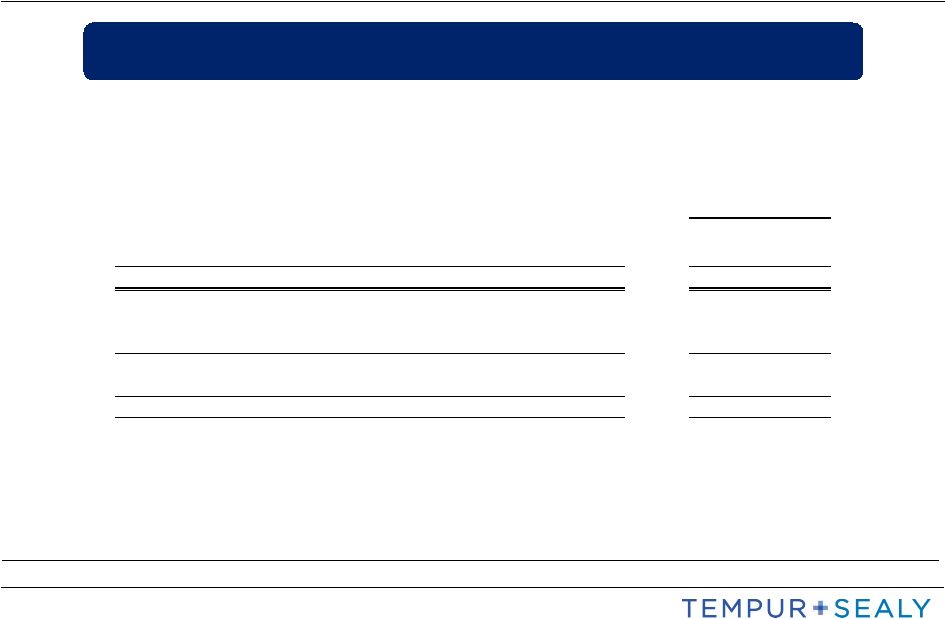
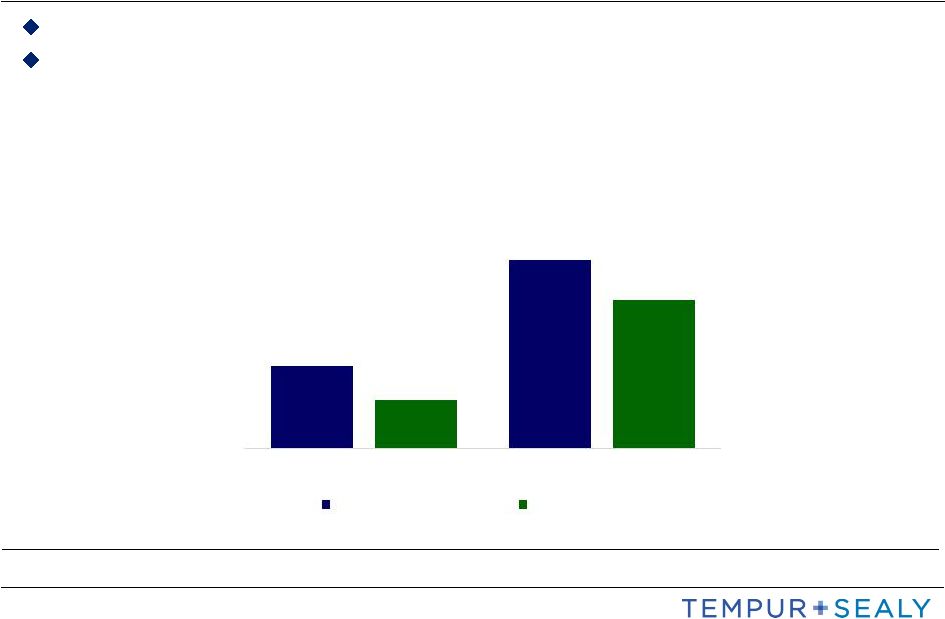 Strong
Cash Flow Characteristics 19
($ in millions)
Operating and Free Cash Flow
Multi-year add back to net income as D&A should continue to exceed annual
Capex by $30M+ Expect continued growth in operating and free cash flow in
2015 Note 1: Operating and free cash flow for 2013 only include Sealy from March 18, 2013
to December 31, 2013. Note 2: Free cash flow is a non-GAAP measure. For information on the methodology used to
present free cash flow information and a reconciliation to operating cash flow please refer to slide 30.
Note 3: For information on the methodology used to present constant currency information please
refer to slide 31. $98.5
$225.2
$58.5
$177.7
2013
2014
Operating Cash Flow
Free Cash Flow |
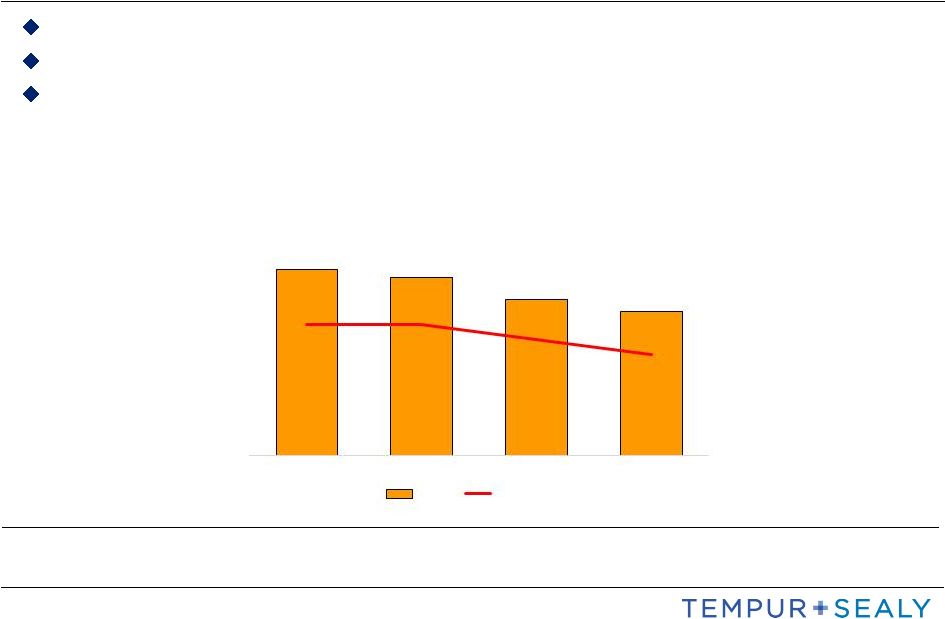 20
Improving Capital Structure
($ in millions)
Consolidated Funded Debt Less
Qualified Cash to Adjusted EBITDA
As a larger more stable company, our optimal capital structure is 3x
2014 credit agreement amendment allows cash utilization flexibility below
3.5x Value creation generated through deleverage and/or returning value to
shareholders $1,869
$1,798
$1,573
$1,450
4.4x
4.4x
3.9x
3.4x
31-Mar-13
2013
2014
2015P
Debt
Leverage
Note 1: Information for 2015 based on management estimates. Please refer to “Forward Looking
Statements”. Note 2: Adjusted EBITDA (which is a non-GAAP measure) represents EBITDA adjusted for the loss
on disposal of business, Sealy transaction and integration costs, and purchase price allocation (“PPA”)
inventory adjustments related to the Sealy acquisition, financing and refinancing costs, non-cash
compensation, restructuring and other. Please refer to the reconciliation included on slides 24-25
of this presentation and the Company’s SEC filings for more information regarding the definition
of adjusted EBITDA and the calculation of consolidated funded debt less qualified cash (which are
non-GAAP measures) and the calculation of the leverage ratio for purposes of the Company’s
senior secured facility. |
 Appendix
21 |
 Use of
Non-GAAP Financial Measures In this investor presentation and certain of
its press releases and SEC filings, the Company provides information regarding adjusted net income, adjusted earnings per share,
earnings before interest, taxes, depreciation, and amortization
(“EBITDA”), adjusted EBITDA, and consolidated funded debt and consolidated funded debt less qualified cash,
Sealy Corporation and Sealy segment adjusted operating income and operating margin,
adjusted operating expenses, adjusted operating income and operating margin and
free cash flow, which are not recognized terms under U.S. Generally Accepted
Accounting Principles (“GAAP”) and do not purport to be alternatives to net income as a
measure of operating performance or total debt. Because not all companies use
identical calculations, these presentations may not be comparable to other similarly titled
measures of other companies.
Adjusted Net Income/Adjusted EPS
EBITDA/Adjusted EBITDA
A reconciliation of EBITDA and adjusted EBITDA to the Company’s net income and
a reconciliation of total debt to consolidated funded debt and consolidated funded debt less
qualified cash are provided on slides 24 and 25. Management believes that the use
of EBITDA and adjusted EBITDA also provides investors with useful information with
respect to the terms of the Company’s senior secured credit facility and the
Company’s compliance with key financial covenants. Adjusted Operating
Expenses Adjusted Operating Income and Margin
Sealy Corporation 2012 Adjusted Operating Income and Margin and Sealy Segment 2014
Adjusted Operating Income and Margin Free Cash Flow
22
A reconciliation of GAAP operating expenses to adjusted operating expenses, which is GAAP operating
expenses less integration and financing costs, is provided on slide 26. Management
believes that the use of this non-GAAP financial measure provides investors with additional useful information with respect to the Company’s operating
performance and initiative to deleverage operating expenses during 2015-2018. The reconciliation
provides information on the methodology used to present operating expenses, including the
exclusion of integration and financing costs related to the Sealy acquisition. A reconciliation of GAAP operating income and operating margin to adjusted operating income and
operating margin, which are GAAP operating income and GAAP operating margin less integration
and financing costs, is provided on slide 27. Management believes that the use of these non-GAAP financial measures
provides investors with additional useful information with respect to the Company’s operating
income and margin performance excluding the impact of integration and financing costs related
to the Sealy acquisition.
A reconciliation of GAAP operating income and operating margin to adjusted operating income and
operating margin, which are GAAP operating income and GAAP operating margin less integration
and financing costs, acquisition and merger costs, restructuring and impairment related charges, and conforming the
accounting of equity in earnings of unconsolidated affiliates is provided on slides 28 and 29.
Management believes that the use of these non-GAAP financial measures provides investors
with additional useful information with respect to the Sealy business operating income and margin performance excluding the
impact of integration and financing costs related to the Sealy acquisition.
A reconciliation of cash provided by operating activities to free cash flow, which is cash provided by
operating activities less purchases of property, plant and equipment, is presented on slide 30.
Management believes that the use of this non-GAAP financial measure provides investors with additional useful
information with respect to the Company’s cash generation and financial strength.
A reconciliation of adjusted net income and adjusted earnings per share is provided on slide 23.
Management believes that the use of these non-GAAP financial measures provides investors
with additional useful information with respect to the impact of various costs associated with the Sealy acquisition and the disposal of the three U.S.
innerspring component facilities and the accelerated amortization of deferred financing charges for
voluntary prepayment of Term A and Term B loans, other income related to certain other
non-recurring items, including income from a partial settlement of a legal dispute, and adjustment of taxes to a normalized rate related to the aforementioned
items and other discrete income tax events.
For more information regarding adjusted EPS, adjusted EBITDA and other terms used in the
Company’s senior secured facility, please refer to the Company’s SEC filings.
|
 2014
Adjusted EPS Reconciliation
2013 and 2014 Adjusted EPS
(1) Loss on disposal of business represents costs associated with the disposition of
the three U.S. innerspring component facilities and related equipment. (2)
Transaction and integration represents costs, including legal fees, professional fees and other charges to align the businesses related to the Sealy acquisition.
(3) Financing costs represent costs incurred in connection with the amendment and
refinancing of our senior secured credit facility in 2014 and 2013, respectively.
(4) Other
income
includes
certain
other
non-recurring
items,
including
income
from
a
partial
settlement
of
a
legal
dispute.
(5) Adjustment of taxes to normalized rate represents adjustments associated with
the aforementioned items and other discrete income tax events. Note: 2013
includes Sealy from March 18 to December 31, 2013. 23
Year Ended
Year Ended
(in millions, except per share amounts)
December 31,
December 31,
2013
2014
Net income
78.6
$
108.9
$
Plus:
Loss on disposal of business, net of tax
(1)
--
16.7
Transaction costs, net of tax
(2)
13.2
--
Integration costs, net of tax
(2)
37.2
30.6
Financing costs, net of tax
(3)
6.5
3.4
Other income, net of tax
(4)
--
(11.3)
Adjustment of taxes to normalized rate
(5)
10.9
16.3
Adjusted net income
146.4
$
164.6
$
Earnings per share, diluted
1.28
$
1.75
$
Loss on disposal of business, net of
tax (1)
--
0.27
Transaction costs, net of tax
(2)
0.21
--
Integration costs, net of tax
(2)`
0.60
0.49
Financing costs, net of tax
(3)
0.11
0.05
Other income, net of tax
(4)
--
(0.18)
Adjustment of taxes to normalized rate
(5)
0.18
0.27
Adjusted earnings per share, diluted
2.38
$
2.65
$
Diluted shares outstanding
61.6
62.1 |
 Adjusted
EBITDA Reconciliation 2013 and 2014 Adjusted EBITDA
24
Year Ended
Year Ended
(in millions)
December 31,
December 31,
2013
(1)
2014
Net income attributable to Tempur Sealy International, Inc.
75.6
$
108.9
$
Interest expense
133.2
91.9
Income taxes
39.0
64.9
Depreciation & amortization
98.6
89.7
EBITDA
346.4
$
355.4
$
Adjustments for financial covenant purposes:
Transaction costs
(2)
25.2
__
Integration costs
(2)
15.3
40.3
Financing and Refinancing charges
(3)
2.4
1.3
Non-cash compensation
(4)
5.8
__
Restructuring and impairment related charges
(5)
7.8
__
Loss on disposal of business and discontinued operations
(6)
0.6
23.2
Other
(7)
7.6
(15.6)
Adjusted EBITDA
411.1
$
404.6
$
(1) 2013 is presented according to the methodology used for the Company’s senior secured
facilities and is based on the mathematical combination of the Company’s historical financial results for the
twelve months ended December 31, 2013 and Sealy’s historical financial results for the
pre-acquisition period from December 3, 2012 through March 3, 2013.
(2) Transaction and integration represent costs related to the Sealy acquisition, including legal
fees, professional fees and other charges to align the businesses.
(3) Financing costs represent costs incurred in connection with the amendment of our senior
secured credit facility and refinancing charges represent costs associated with debt refinanced by Sealy
prior to the Sealy acquisition.
(4) Non-cash compensation represent costs associated with various share-based
awards. (5) Restructuring and impairment represent costs related to restructuring the Tempur Sealy
business and asset impairment costs recognized by Sealy prior to the Sealy acquisition.
(6) Loss on disposal of business represents costs associated with the disposition of the three
U.S. innerspring component production facilities and related equipment and discontinued operations
represent losses from Sealy's divested operation prior to the Sealy acquisition.
(7) Other income in 2014 includes certain other non-recurring items, including income from a
partial settlement of a legal dispute. |
 Debt
Reconciliation and Leverage Ratio Calculation Reconciliation of Total Debt to
Consolidated Funded Debt Less Qualified Cash (1)
Qualified
cash
as
defined
in
the
Company's
senior
secured
credit
facility
equals
100.0%
of
unrestricted
domestic
cash
plus
60.0%
of
unrestricted
foreign
cash.
For
purposes
of
calculating
leverage
ratios,
qualified
cash
is
capped at $150.0 million.
(2)
The ratio of consolidated debt less qualified cash to adjusted EBITDA was 3.89
times, within the Company's covenant, which requires this ratio to be less than 4.75 times at December 31, 2014.
Note: For more details regarding consolidated funded debt, consolidated funded debt
less qualified cash and Adjusted EBITDA, please refer to the Company’s SEC filings.
25
As of
(in millions, except ratio)
December 31,
2014
Total debt
1,602.3
$
Plus:
Letters of credit outstanding
18.2
Consolidated funded debt
1,620.5
Less:
Domestic qualified cash
(1)
25.9
Foreign qualified cash
(1)
21.9
Consolidated funded debt less qualified cash
1,572.7
$
Adjusted EBITDA
404.6
$
Consolidated funded debt less qualified cash to Adjusted EBITDA
(2)
3.89 times |
 Adjusted
Operating Expenses 2014 Adjusted Operating Expenses
26
Tempur Sealy International, Inc.
Year Ended
(in millions, except percentage amounts)
December 31,
2014
Consolidated net sales
$2,989.8
Selling and marketing expenses
619.9
General, administrative and other expenses
280.6
Operating Expenses
900.5
Operating Expenses as a % of Consolidated Net Sales
30%
Operating Expenses
$900.5
Less: Integration and financing costs
43.8
Operating Expenses less Integration and financing costs
$856.7
Adjusted Operating Expenses as a % of Consolidated Net Sales
29%
Note 1: Integration costs represents costs, including legal fees, professional
fees and other charges to align the businesses related to the Sealy acquisition.
Note 2: Financing costs represent costs incurred in connection with the
amendment of our senior secured credit facility. |
 Adjusted
Operating Margin 2014 Adjusted Operating Income and Margin
27
Tempur Sealy International, Inc.
Year Ended
(in millions, except percentage amounts)
December 31,
2014
Operating Income, Tempur Sealy International, Inc.
$276.3
Consolidated net sales
2,989.8
Operating Margin (GAAP)
9.2%
Operating Income, Tempur Sealy International, Inc.
$276.3
Plus: Integration and financing costs
43.8
Adjusted Operating Income
$320.1
Consolidated net sales
2,989.8
Adjusted Operating Margin (Non-GAAP)
10.7%
Note 1: Integration costs represents costs, including legal fees, professional
fees and other charges to align the businesses related to the Sealy acquisition.
Note 2: Financing costs represent costs incurred in connection with the
amendment of our senior secured credit facility. |
 Sealy
Corporation 2012 Adjusted Operating Margin 2012 Adjusted Operating Income and
Margin 28
Sealy Corporation
Year Ended
(in millions, except percentage amounts)
December 2,
2012
Operating Income, Sealy Corporation
$100.6
Consolidated net sales
1,347.9
Operating Margin (GAAP)
7.5%
Operating Income, Sealy Corporation
$100.6
Plus:
Comfort Revolution acquisition costs
1.2
Merger costs
2.5
Restructuring and impairment related charges
2.4
Equity in earnings of unconsolidated affiliates
5.2
Other (various)
1.9
Total adjustments
13.2
Adjusted Operating Income
$113.8
Consolidated net sales
1,347.9
Adjusted Operating Margin (Non-GAAP)
8.4%
Note 1: Information based on data provided in Sealy 10-K for fiscal year ended December 2,
2012. Note 2: Adjustments to GAAP operating margin include costs associated with the acquisition of 45%
interest in the Comfort Revolution joint venture, merger costs associated with the Tempur-Pedic International Inc.
transaction, restructuring and impairment related charges related to certain of Sealy manufacturing
facilities, other (various) charges and conforming the accounting of equity in earnings of unconsolidated affiliates.
|
 Sealy
Adjusted Operating Margin – 2014
2014 Adjusted Operating Income and Margin
29
Note: Integration costs represents charges to align the businesses related to
the Sealy acquisition. Sealy Segment
Year Ended
(in millions, except percentage amounts)
December 31,
2014
Operating Income, Sealy Segment
$99.8
Consolidated net sales
1,524.6
Operating Margin (GAAP)
6.5%
Operating Income, Sealy Segment
$99.8
Plus:
Integration costs
19.8
Adjusted Operating Income
$119.6
Consolidated net sales
1,524.6
Adjusted Operating Margin (Non-GAAP)
7.8% |
 Free
Cash Flow 2014 Free Cash Flow
30
Tempur Sealy International, Inc.
Year Ended
Year Ended
(in millions)
December 31,
December 31,
2013
2014
Net cash provided by operating activities
$98.5
$225.2
Less: Purchases of property, plant and equipment
40.0
47.5
Free Cash Flow
$58.5
$177.7 |
 Constant
Currency Information 31
In this investor presentation the Company refers to, and in other press releases and other
communications with investors the Company may refer to, net sales or earnings or other
historical financial information on a “constant currency basis” or “excluding FX”,
which is a non-GAAP measure. These references to constant currency basis do not include
operational impacts that could result from fluctuations in foreign currency rates. To provide
information on a constant currency basis, the applicable financial results are adjusted based
on a simple mathematical model that translates current period results in local currency using the comparable prior
year period’s currency conversion rate. This approach is used for countries where the functional
currency is the local country currency. This information is provided so that certain financial
results can be viewed without the impact of fluctuations in foreign currency rates, thereby
facilitating period-to-period comparisons of business performance. The information presented on a constant
currency basis is not recognized under U.S. GAAP, and this information is not intended as a substitute
for reviewing information presented on a GAAP basis. |