Attached files
| file | filename |
|---|---|
| EXCEL - IDEA: XBRL DOCUMENT - MAVENIR SYSTEMS INC | Financial_Report.xls |
| EX-10.28 - EXHIBIT 10.28 - MAVENIR SYSTEMS INC | ex1028-consentandthirdloan.htm |
| EX-23.1 - EXHIBIT 23.1 - MAVENIR SYSTEMS INC | ex231.htm |
| EX-31.2 - EXHIBIT 31.2 - MAVENIR SYSTEMS INC | ex312.htm |
| EX-32.1 - EXHIBIT 32.1 - MAVENIR SYSTEMS INC | ex321.htm |
| EX-31.1 - EXHIBIT 31.1 - MAVENIR SYSTEMS INC | ex311.htm |
| EX-32.2 - EXHIBIT 32.2 - MAVENIR SYSTEMS INC | ex322.htm |
| EX-21.1 - EXHIBIT 21.1 - MAVENIR SYSTEMS INC | ex211.htm |
| EX-10.27 - EXHIBIT 10.27 - MAVENIR SYSTEMS INC | ex1027-joinderandsecondloa.htm |
UNITED STATES
SECURITIES AND EXCHANGE COMMISSION
Washington, D.C. 20549
FORM 10-K | ||
ANNUAL REPORT PURSUANT TO SECTION 13 OR 15(d)
OF THE SECURITIES EXCHANGE ACT OF 1934
For the fiscal year ended December 31, 2014
Commission file number: 001-36171
Mavenir Systems, Inc. (Exact name of registrant as specified in its charter) | ||
Delaware | 61-1489105 | |
(State or other jurisdiction of incorporation or organization) | (I.R.S. Employer Identification No.) | |
1700 International Parkway, Suite 200 Richardson, TX | 75081 | |
(Address of principal executive offices) | (Zip Code) | |
Registrant’s telephone number, including area code: (469) 916-4393
Securities registered pursuant to Section 12(b) of the Act:
Title of Each Class | Name of Exchange on Which Registered | |
Common Stock, $0.001 par value per share | New York Stock Exchange LLC | |
Securities registered pursuant to Section 12(g) of the Act:
None
Indicate by check mark if the registrant is a well-known seasoned issuer, as defined in Rule 405 of the Securities Act. Yes ¨ No ý
Indicate by check mark if the registrant is not required to file reports pursuant to Section 13 or Section 15(d) of the Act. Yes ¨ No ý
Indicate by check mark whether the registrant (1) has filed all reports required to be filed by Section 13 or 15(d) of the Securities Exchange Act of 1934 during the preceding 12 months (or for such shorter period that the registrant was required to file such reports), and (2) has been subject to such filing requirements for the past 90 days. Yes ý No ¨
Indicate by check mark whether the registrant has submitted electronically and posted on its corporate Web site, if any, every Interactive Data File required to be submitted and posted pursuant to Rule 405 of Regulation S-T (§ 232.405 of this chapter) during the preceding 12 months (or for such shorter period that the registrant was required to submit and post such files). Yes ý No ¨
Indicate by check mark if disclosure of delinquent filers pursuant to Item 405 of Regulation S-K (§ 229.405 of this chapter) is not contained herein, and will not be contained, to the best of registrant’s knowledge, in definitive proxy or information statements incorporated by reference in Part III of this Form 10-K or any amendment to this Form 10-K. ý
Indicate by check mark whether the registrant is a large accelerated filer, an accelerated filer, a non-accelerated filer, or a smaller reporting company. See definitions of “large accelerated filer,” “accelerated filer,” and “smaller reporting company” in Rule 12b-2 of the Exchange Act. (Check one):
Large accelerated filer | ¨ | Accelerated filer | x | |||
Non-accelerated filer | ¨ (Do not check if a smaller reporting company) | Smaller reporting company | ¨ | |||
Indicate by check mark whether the registrant is a shell company (as defined in Rule 12b-2 of the Act). Yes ¨ No ý
The aggregate market value of common shares based on June 30, 2014, the last business day of the registrant’s most recently completed second fiscal quarter, was approximately $373.6 million.
As of February 26, 2015, there were 28,975,992 shares of the registrant’s common stock, par value $0.001 per share, outstanding.
DOCUMENTS INCORPORATED BY REFERENCE
Portions of the definitive proxy statement relating to the 2015 Annual Meeting of Shareholders of Mavenir Systems, Inc., which will be filed with the Securities and Exchange Commission within 120 days of December 31, 2014, are incorporated by reference in Item 10, Item 11, Item 12, Item 13 and Item 14 of Part III of this Form 10-K
1
TABLE OF CONTENTS
Part I | ||
Item 1. | Business | |
Item 1A. | Risk Factors | |
Item 1B. | Unresolved Staff Comments | |
Item 2. | Properties | |
Item 3. | Legal Proceedings | |
Item 4. | Mine Safety Disclosures | |
Part II | ||
Item 5. | Market for Registrant’s Common Equity, Related Stockholder Matters and Issuer Purchases of Equity Securities | |
Item 6. | Selected Financial Data | |
Item 7. | Management’s Discussion and Analysis of Financial Condition and Results of Operations | |
Item 7A. | Quantitative and Qualitative Disclosures About Market Risk | |
Item 8. | Financial Statements and Supplementary Data | |
Item 9. | Changes in and Disagreements With Accountants on Accounting and Financial Disclosure | |
Item 9A. | Controls and Procedures | |
Item 9B. | Other Information | |
Part III | ||
Item 10. | Directors, Executive Officers and Corporate Governance | |
Item 11. | Executive Compensation | |
Item 12. | Security Ownership of Certain Beneficial Owners and Management and Related Stockholder Matters | |
Item 13. | Certain Relationships and Related Transactions, and Director Independence | |
Item 14. | Principal Accountant Fees and Services | |
Part IV | ||
Item 15. | Exhibits, Financial Statement Schedules | |
SPECIAL NOTE REGARDING FORWARD-LOOKING STATEMENTS
This Annual Report on Form 10-K contains forward-looking statements within the meaning of Section 21E of the Securities Exchange Act of 1934, as amended, or the Exchange Act. The forward-looking statements are contained principally in the Part I, Item 1: “Business,” Part I, Item 1A: “Risk Factors,” and Part II, Item 7: “Management’s Discussion and Analysis of Financial Condition and Results of Operations.” All statements other than statements of historical facts contained in this Annual Report, including statements regarding our future results of operations or financial condition, business strategy and plans and objectives of management for future operations, are forward-looking statements. In some cases, you can identify forward-looking statements by terminology such as “believe,” “will,” “may,” “estimate,” “continue,” “anticipate,” “intend,” “should,” “plan,” “expect,” “predict,” “could,” “potentially” or other similar expressions. We have based these forward-looking statements largely on our current expectations and projections about future events and financial trends that we believe may affect our financial condition, results of operations, business strategy and financial needs.
Forward-looking statements include, but are not limited to, statements about:
• | our expectations regarding our revenue, expenses, sales, operations and profitability; |
• | commercial acceptance of 4G LTE technology; |
• | the development of markets for our products and solutions; |
• | our ability to attract and retain customers; |
• | future purchases of our solutions and support and maintenance services by existing customers; |
• | the potential loss of or reductions in orders from our significant customers; |
• | our ability to compete in our industry and innovation by our competitors; |
• | our ability to anticipate market needs or develop new or enhanced solutions to meet those needs; |
• | our ability to successfully identify, manage and integrate any potential acquisitions; |
• | our ability to establish and maintain intellectual property protection for our solutions; |
• | our ability to hire and retain key personnel; |
• | our ability to integrate recent acquisitions into our portfolio of products and services, as well as culturally; and |
• | our anticipated cash needs and our estimates regarding our capital requirements. |
These statements involve known and unknown risks, uncertainties and other factors that may cause our actual results of operation, financial condition, levels of activity, performance or achievements to be materially different from the information expressed or implied by these forward-looking statements. Although we believe that the expectations reflected in the forward-looking statements contained in this Annual Report are reasonable, we caution you that these statements are based on a combination of facts and factors currently known by us and our projections of the future, about which projections we cannot be certain. Moreover, we operate in a competitive and rapidly-changing industry in which new risks may emerge from time to time, and it is not possible for management to predict all risks.
You should refer to the section of this Annual Report entitled “Risk Factors” for a discussion of important risks that may cause our actual results to differ materially from those expressed or implied by our forward-looking statements. As a result of these factors and new risks that may emerge in the future, we cannot assure you that the forward-looking statements in this Annual Report will prove to be accurate. Furthermore, if our forward-looking statements prove to be inaccurate, the inaccuracy may be material. In light of the significant uncertainties in these forward-looking statements, you should not regard these statements as a representation or warranty by us or any other person that we will achieve our objectives and plans in any specified time frame, or at all. We do not undertake to update any of the forward-looking statements after the date of this Annual Report, except to the extent required by law.
3
Item 1. | Business |
In this Annual Report on Form 10-K, unless the context otherwise requires, references to “Mavenir Systems,” “Mavenir,” “we,” “our,” “us,” and the “company” refer to Mavenir Systems, Inc. together with its subsidiaries.
Overview
We are a leading provider of software-based telecommunications networking solutions that enable mobile service providers to deliver internet protocol (IP)-based voice, video, rich communications and enhanced messaging services to their subscribers globally. Our solutions deliver Rich Communication Services (RCS), which enable enhanced mobile communications, such as group text messaging, multi-party voice or video calling and live video streaming as well as the exchange of files or images, over existing 2G and 3G networks as well as next generation 4G Long Term Evolution (LTE) networks. Our solutions also deliver voice services over LTE technology and wireless (Wi-Fi) networks, known respectively as Voice over LTE (VoLTE) and Voice over Wi-Fi (VoWi-Fi). We enable mobile service providers to offer services that generate increased revenue and improve subscriber satisfaction and retention, while allowing them to improve time-to-market of new services and reduce network costs. Our mOne® Convergence Platform has enabled MetroPCS (now part of T-Mobile), a leading mobile service provider, to introduce the industry’s first live network deployment of VoLTE and the industry’s first live deployment of next-generation RCS 5.
The capabilities of smartphones and tablets have caused consumers to shift their communication preferences from traditional voice service to a combination of voice, video and messaging services, which are offered by rich communication services. Additionally, many consumers are using their mobile devices to browse the internet, run software applications, access cloud-based services and consume, create and share rich multimedia and user-generated content. As a result, mobile data traffic is projected to continue to increase exponentially, driven by the rapid adoption of smartphones and tablets and the demand for enhanced and high-bandwidth mobile services such as video. These trends have placed substantial capacity constraints on the existing networks of mobile service providers. In order to alleviate the resulting spectrum and network capacity challenges, mobile service providers are making significant investments to transition their networks to the 4G LTE standard for voice and data transmission over mobile networks, as that standard enables higher data speeds and allows more efficient use of the frequency spectrum.
Because our solutions are interoperable across network generations, we enable mobile service providers to leverage their existing investments in 2G and 3G networks while offering a seamless, cost-effective migration path to 4G LTE networks. Our end customers include AT&T, MetroPCS (now part of T-Mobile), T-Mobile USA, Vodafone and Telstra. Our customers include the first mobile service provider to deploy VoLTE and RCS 5 services to its subscribers, MetroPCS, which deployed these services utilizing our technology. Our solutions can be deployed on-premise within the mobile service provider’s network or hosted in a mobile cloud environment. Our solutions enable mobile service providers to generate additional revenues by providing their subscribers with rich communications and cloud-based services, including:
• | carrier-grade (at least 99.999% reliable), integrated communication services, including voice calling, video calling and messaging; |
• | a rich communications experience, which includes integrated one-to-one and group voice chat, video chat, messaging and sharing of content such as videos, images, links or locations; |
• | a single identity across multiple devices and services, based on a subscriber’s mobile phone number, that allows seamless delivery of mobile services and applications globally; |
• | interworking with legacy short message service (SMS), which is an older technology used to convey short text messages, multimedia messaging service (MMS), which is an existing technology allowing delivery of images in a relatively low-resolution format, and social networks; and |
• | cloud-based delivery of next-generation mobile communications, including voice, video, enhanced messaging, which includes voice and video mail and interworking with social media platforms, and storage of mobile subscriber content and media. |
In 2014 we broadened our product portfolio with the introduction of our Evolved Packet Core (“EPC”). With the introduction of this solution, Mavenir is able to separate the signaling from the forwarding planes and offer secure access to mobile devices on Wi-Fi access and enabling seamless mobility to the macro cellular network.
4
Additionally, in November of 2014, we acquired Stoke Inc. (“Stoke”). This acquisition strengthened our Security Gateway which allows our solution to secure 4G LTE traffic from the LTE radio access network to the mobile operator’s EPC network. Additionally, Stoke has strong customer presence in Japan and thus, through this acquisition Mavenir was able to gain a strong foothold in the Japanese market, a market that Mavenir had not previously invested in.
In January of 2015, we continued to strengthen our product portfolio and extend our customer reach with the acquisition of Ulticom Inc. (“Ulticom”). Ulticom delivers the Diameter Signaling Controller, which is a key technology used for authentication, authorization, and accounting in modern telecommunications networks.
We commenced operations in 2005 and began product sales in 2007. For the year ended December 31, 2014, our revenue was $129.8 million, representing 28% year-over-year growth. For the year ended December 31, 2013, our revenue was $101.3 million, representing 37.2% year-over-year growth. For the year ended December 31, 2012, our reported revenue was $73.8 million, compared with $48.2 million for the year ended December 31, 2011. In addition, our operating loss was $(17.1) million, $(7.7) million and $(14.6) million for the years ended December 31, 2014, 2013 and 2012, respectively.
Our principal executive office is located at 1700 International Parkway, Suite 200, Richardson, TX 75081 and our telephone number is (469) 916-4393. Our website address is http://www.mavenir.com. The information contained in or accessible from our website is not incorporated into this Annual Report on Form 10-K, and you should not consider it part of this report.
The “Mavenir Systems®” name, the “mOne®” name, the “Airwide®” name, the “AirMessenger®” name, the “Mavenir™” name, the “mStore™” name, the “mCloud™” name, “Transforming Mobile Networks™” and related images, logos and symbols appearing in this Annual Report on Form 10-K are our properties, trademarks and service marks. Other marks appearing in this Annual Report are the property of their respective owners.
Industry Background
The market for mobile communications services is evolving rapidly, characterized by the following trends:
Proliferation of Smartphones and Tablets. Global adoption of smartphones and tablets is in its early stages, and future growth is expected to accelerate as mobile subscribers increasingly rely on these powerful devices.
Increased Use of Mobile Applications, Mobile Media and Cloud-Based Services. Powerful smartphones and tablets are rapidly replacing desktop computers and laptops as the primary computing platform used for browsing the internet, running software applications, accessing cloud-based services, and consuming media content such as streaming video and internet radio. Many consumers are increasingly creating, sharing and accessing user-generated content, such as photos and videos, on their mobile devices through online services such as Facebook and YouTube. In addition, cloud-based storage is growing significantly as consumers purchase content from media services, such as Amazon, Apple and Google, and utilize online storage services to access their purchased content from multiple mobile device types. Furthermore, mobile subscribers are increasingly seeking more rich communication services, such as video chat, to enhance the communications experience on their mobile devices. These trends in consumer behavior related to mobile device usage are driving a substantial increase in the amount of mobile data traffic.
Mobile Service Provider Challenges
Proliferation of smartphones and tablets as well as increased use of mobile applications and cloud-based services by subscribers present the following challenges for mobile service providers:
Strain on Existing Network Resources. Faced with increased subscriber demand for bandwidth-consuming mobile applications and cloud-based services, mobile service providers are facing spectrum and capacity constraints. During times of peak usage, mobile service providers are often unable to deliver the expected level of service that subscribers demand, which results in subscriber dissatisfaction and increased subscriber turnover.
Competition from Over-The-Top / Web Services. Over-The-Top (OTT) applications compete with services that are, or could be, offered by mobile service providers, reducing revenue sources that traditionally have gone to mobile service providers. For example, OTT services such as Skype, Apple Facetime, Facebook Chat and Blackberry Messenger, allow consumers to engage in rich communications experiences in a simple, easy-to-use interface. These OTT services provide free and feature-rich alternatives that compete with traditional voice and SMS services offered by mobile service providers.
Need to Offer Subscribers Enhanced Services. As mobile voice service access has become commoditized, and average voice revenue per subscriber has decreased, mobile service providers are seeking to offer their subscribers new, differentiated
5
services that increase revenue per subscriber, enhance customer satisfaction and reduce subscriber turnover. To make up for the declining voice and text revenue, and to optimize the transition to data revenue, mobile service providers need to offer new services to provide enhanced communication experiences, including a converged communication experience across multiple mobile devices, to their subscribers, capitalizing on their inherent ability to provide a unique and unified communications experience.
Migration Path to 4G LTE. As mobile service providers migrate to 4G LTE, they will look to minimize capital expenditures and operational costs, while maximizing subscriber usage of their network. Mobile service providers are seeking a common solution platform that can address existing 2G and 3G network requirements without requiring additional investments and that can also be utilized for next-generation 4G LTE network introductions. We believe that mobile service providers want to avoid a complete replacement of their network elements but, at the same time, do not want to invest in disparate systems to support existing and 4G LTE networks. With the growth and adoption of 4G LTE, competition among mobile service providers will continue to intensify as subscribers seek an increasing number of high-quality services.
Benefits of 4G LTE
The next generation of mobile technology, broadly defined as 4G, includes Long Term Evolution (LTE), Worldwide Interoperability Microwave Access (WiMAX) and Evolved High Speed Packet Access (HSPA+) and can be extended to include Wi-Fi. 4G LTE has been developed to handle mobile data more efficiently and allows for faster, more reliable and more secure mobile service than existing 2G and 3G networks. The faster data transfer capabilities of 4G LTE networks enable mobile subscribers to use a wide variety of bandwidth-intensive software applications and cloud-based services with a rich mobile computing experience.
In addition to the benefits for mobile subscribers, 4G LTE technology is inherently more efficient and cost-effective, resulting in a better network infrastructure for mobile service providers. 4G LTE uses wireless spectrum more efficiently than existing 2G and 3G technology, creating more available bandwidth to expand network capacity and enabling mobile service providers to simultaneously offer higher speed data service and enhanced mobile communication services to their subscribers from a single, consolidated next generation network.
4G LTE offers the opportunity to fundamentally lower the cost of network operational centers by leveraging technologies widely used in the IT industry, such as Network Functions Virtualization (NFV), which refers to the deployment of telecommunications application software on virtualized hardware platforms often referred to as “private clouds,” and Software-Defined Networking (SDN), which simplifies network administration through the use of software. Both of these technologies drive down network cost and complexity and increase network flexibility and responsiveness.
4G LTE is a new architecture that enables mobile service providers to offer a wide range of new services across their networks. Mobile service providers can deliver device independent services over 4G LTE networks and offer a cloud-based subscriber experience that is comparable to communication services providers such as Apple, Google and Skype. Mobile service providers will be able to offer a platform that third-party application developers can leverage to integrate new services through open network standards.
Our Solutions
Our solutions, based on our mOne® Convergence Platform, enable mobile service providers to deliver voice, video, rich communications and enhanced messaging services over their existing 2G and 3G networks and next-generation 4G LTE networks. IP-based communication services, which involve the transmission of voice and text data using the more efficient internet protocol that underlies the internet, rather than through traditional and less efficient circuit-switched phone networks, are being developed and deployed today. These services are faster, more efficient and demand less spectrum than the circuit-based communication methods employed by existing 2G and 3G networks.
Our solutions are focused on delivering a seamless and intuitive communications experience to mobile subscribers and an integrated, flexible, differentiated platform for mobile service providers. We enable mobile service providers to capitalize on their IP-based network investments by efficiently and cost-effectively offering a broad range of services.
Our mOne® Convergence Platform offers our customers the following key benefits:
6
Comprehensive, Highly Configurable and Converged Communication Solution. The mOne® Convergence Platform enables mobile service providers to deploy any or all of a wide range of services. Some of these services include:
• | carrier-grade, integrated communication services, including voice calling, video calling and messaging over the same networks and devices; |
• | a rich communications experience, with integrated one-to-one and group voice chat, video chat, messaging and sharing of content such as videos, images, links or locations; |
• | a single identity across multiple devices and services, based on a subscriber’s mobile phone number, that allows seamless delivery of mobile services and applications globally; and |
• | interworking with legacy SMS/MMS and social networks. |
Cloud-Based Implementation. The design of our software products enables mobile service providers to use private cloud implementations to deliver next generation mobile communications, including voice, video, enhanced messaging and storage of mobile subscriber content and media. These solutions allow our customers to share capacity in a cloud deployment with commercial off-the-shelf servers for all services rather than deploying dedicated, proprietary hardware for each service. The key benefits of utilizing private clouds include more agile use of the network infrastructure, the ability to deploy and prove-in new services rapidly using commercially available off-the-shelf hardware available from major manufacturers, combined with our software, without large up-front infrastructure costs, and avoiding the network upgrade costs associated with obsolescence of proprietary hardware. For example, Deutsche Telekom, one of the largest pan-European mobile service providers, has commercially launched our virtualized Rich Communication Services to provide joyn® — an industry initiative that enables one-on-one and group chat services and the enhancement of voice calls through the sharing of multi-media content such as videos, pictures and music — on its own single common hardware platform for nine different national networks across the continent, thereby deploying its own mobile cloud environment. Although we offer to host our solutions in our own cloud-computing center for mobile service providers, we do not currently have any contracts to provide cloud-based hosting services.
Seamless Migration Path to 4G LTE. Historically, mobile service providers have made substantial investments in their existing networks, and these networks will continue to deliver communications and data services for many years into the future. Therefore, mobile service providers are looking for 4G LTE networking solutions that integrate with existing network standards to enable them to transition seamlessly to 4G LTE and cost-effectively optimize their infrastructure investments. Our solutions offer mobile service providers a cost-effective migration path to 4G LTE by supporting existing 2G and 3G networks and next-generation 4G LTE networks, eliminating the need to prematurely retire existing investments. Our platform features a comprehensive, standards-based set of interfaces to ensure a seamless integration into existing infrastructure that includes technology from multiple vendors, and can be deployed over a wide range of network types including 2G, 3G, LTE, WiMAX, HSPA+ and Wi-Fi.
Ability to Improve Subscriber Experience and Deliver Revenue-Generating Services. Mobile service provider competition continues to exert downward pressure on the prices and profits associated with traditional voice, SMS and data services. To counteract this trend, mobile service providers can leverage our solutions to offer differentiated next-generation services that build customer loyalty, improve subscriber retention and generate additional revenues. When a mobile service provider offers a rich communications platform with multiple high-value services, its subscribers will be more likely to pay for these services, either by direct subscription or through increased data revenue, and less likely to switch providers.
Scalable Architecture and Carrier-Grade Reliability. Mobile service providers require networking solutions that enable deployment of networks covering large geographic areas and support millions of simultaneous end users with the traditional mobile telecommunications requirement of 99.999% availability. Additionally, mobile service providers need the flexibility to add capacity to support subscriber growth and increased network traffic as new, high-bandwidth services are introduced. Our solutions form a highly scalable carrier-grade platform that provides subscribers with high-quality service, as measured by the breadth of services offered and reliability, or lack of downtime. Our platform is fully compatible with the mobile industry’s standards and interoperability framework, allowing full compatibility across mobile service providers and geographies. Unlike OTT service providers, who cannot control quality or reliability of service because they do not own or control underlying access networks, mobile service providers using our solutions over their networks can deliver high-quality and consistent service to all subscribers.
Open Platform and Social Interworking. Our standards-based open solution architecture and Application Programming Interfaces (APIs) allow mobile service providers to develop or incorporate third-party enhancements, for example, by embedding messaging or voice calling capabilities within consumer applications such as shopping or banking applications. We enable mobile service providers to interconnect various OTT applications and social networking services so that a subscriber can engage in voice, video and rich messaging communications with anyone, anywhere, on any device or in any communications ecosystem. A subscriber can communicate with another subscriber through one central identity based on the
7
subscriber’s mobile phone number, rather than having to worry about what specific application to use to connect with that other subscriber. Mobile service providers can leverage this neutral position and technology to bring more users into their networks.
Our Competitive Strengths
We are a leading provider of software-based telecommunications networking solutions that transform mobile networks to deliver enhanced new services to their subscribers globally. Because we have been first to market with solutions that enable many enhanced subscriber services, we have a broad customer base and we have a history of successfully competing for business with some of the largest solutions providers in the mobile industry. Our competitive strengths include the following:
First-Mover Advantage. Since our inception, we have developed significant expertise around solving the key challenges that mobile service providers face as they deploy next-generation networks and we have been first to market with solutions that enable many enhanced subscriber services. Decisions and deployments of network infrastructure and solutions require significant lead time, typically 12 to 24 months. Our past large-scale deployments for existing customers have increased our brand awareness and provided us with customer validations that serve as a significant competitive advantage as additional mobile service providers evaluate their next-generation communications solutions needs. Based on our deployments and contracts to date, we believe we have delivered significant industry ‘firsts’, such as the first commercial deployment of VoLTE, deployed by MetroPCS, and plan to continue to be a first mover.
Singular Focus on Next-Generation Communication Solutions. We are focused on developing and selling next-generation IP-based voice, video, rich communications and enhanced messaging services to mobile service providers. Unlike many of our competitors, we are not encumbered by a product portfolio full of legacy solutions and an installed customer base that generates significant revenue and cash flow streams from legacy solutions. Rather, we can focus on selling transformational solutions to mobile service providers that enable them to take advantage of the inherent benefits of 4G LTE and offer services that increase revenue, improve subscriber satisfaction and reduce customer turnover.
Modular Platform for Next-Generation Communication Solutions. Our mOne® Convergence Platform is based on a flexible software architecture that enables mobile service providers to provide IP-based voice, video, rich communications and advanced messaging applications to their subscribers. We have worked closely with many of our mobile service provider customers to understand their unique requirements and have developed a platform with the specific product features that are most relevant to help them achieve their strategic priorities. Our modular platform approach allows mobile service providers to selectively deploy the services they want for their subscribers, with the ability to add additional services and scale as needed. We believe that our ability to provide mobile service providers with customized deployment strategies, which allow them to gradually add services, gives us a significant competitive advantage. Our EPC products are built on this same flexible platform and provides for an elegant deployment of multiple Mavenir products in the core of a mobile operators network. The addition of the Security Gateway products from the Stoke acquisition and the Diameter Signaling Controller products from the Ulticom acquisition, further extend the completeness and flexibility of Mavenir’s platform.
Interoperability across Network Generations. Seamless and cost-effective migration of subscribers and services from 2G and 3G networks to 4G LTE networks can be achieved by bridging disparate technologies, while preserving existing investments, through intelligent gateways and interworking software. Our industry standards-based products support fully-integrated legacy interfaces, that enable mobile service providers to continue to use much of their existing core network infrastructure which is the centralized network of switches, routers and application services that deliver consumer services and includes elements such as subscriber databases, billing systems and intelligent network systems, without costly upgrades or replacements. Our ability to interoperate across traditional network boundaries mitigates the cost and complexity of deploying 4G LTE networks and accelerates time-to-market.
Technology Team. We believe our management team and the depth and diversity of our engineering and operations talent provide us with a competitive advantage. The extensive domain expertise of our engineering team is derived from its members’ combined experience in different areas of technology, including voice technology, software development, cellular/mobility applications, internet protocol networking, social networking and communications networks. Our solutions require expertise in the convergence of voice and data networking as well as the evolution of 2G and 3G technology to 4G LTE networks. Our expertise includes developing market-defining telecommunications products, implementing our solutions in small- and large-scale network environments, and supporting our global customer base from within our customers’ regional geographies.
Our Strategy
Our goal is to establish our position as the leading global provider of 4G LTE solutions, providing a full suite of solutions for the core of the mobile operators’ networks. Initially we have incurred and will continue to incur significant sales and marketing
8
expenses to capture new product opportunities principally from our existing customer base. Additionally, as we win these new product sales we expect to incur considerable product and employee related expenses for technology trials, market trials, initial testing and deployment of our solutions. As we expand our product footprint within our customers we expect significant expansion of business with these individual customers with considerably lower ongoing expenses. We expanded our product portfolio in 2014 with the development of our EPC product and with the acquisition of Stoke and its Security Gateway product. We continued with that strategy in January 2015 with the acquisition of Ulticom and its Diameter Signaling Controller. The resulting increased sales and improving margins driven by relative cost efficiencies are expected to drive improvement in our overall profitability. Key elements of our strategy include:
Leverage First-Mover Advantage to Increase Sales to Existing Customers and to Grow Our Customer Base. We have the advantage of being a first-mover with innovative solutions that enable operators to efficiently address network challenges, with several major global mobile service providers having already chosen our solutions for their 4G LTE network needs. We believe that the experience and detailed technical knowledge that our employees obtained while providing solutions to these customers, including enabling MetroPCS to launch its first-to-market RCS 5 and VoLTE services, will be directly applicable to expanding existing customer networks, as well as new customer networks, with our next-generation solutions. We intend to further capitalize on our early market success in deploying next-generation 4G LTE solutions and the strong relationships we have with mobile service providers to supply our existing customers with new product offerings as well as to gain new customers. For example, we provided legacy messaging solutions to MetroPCS initially and expanded the solutions we provide to that customer to include voice and messaging over LTE. In order to continue to increase our global presence, we intend to continue to expand our sales, marketing and design teams to generate demand for our solutions and further leverage our channel relationships to increase our global reach. For example, we have a channel partner relationship with Cisco Systems that enables us to leverage Cisco Systems’ global sales force to market and sell our full suite of voice, video and messaging solutions to mobile service providers globally.
Extend our Technology Advantage Through Continued Innovation. We have a track record of providing differentiated solutions across both voice and messaging service domains. For example, our solutions enabled the first network with voice and messaging on LTE. Also, we enabled Vodafone’s early market deployment of LTE circuit switch fallback, which enables support for voice and messaging services to LTE smartphones over mixed 2G, 3G and 4G LTE environments and therefore enables the early introduction of LTE smartphones onto mobile service provider networks. We will utilize the valuable insight into product and performance requirements that we have gained in our early market achievements in the transition from 2G and 3G to 4G LTE to continue to deliver market-leading solutions focused on 4G LTE services, with the ability to deliver operator-specific customizations and solutions and to deliver a full suite of integrated mobile communications that can be deployed through a cloud-based implementation. We believe our collaborative engagements with mobile service providers as they undergo the transition from 2G and 3G to 4G LTE have provided us with valuable insight into product and performance requirements in the past and have helped us stay ahead of our competition by enabling us to offer highly differentiated products, thereby extending our technology advantage.
Simplify Mobile Service Providers’ Transition to 4G LTE. Our solutions give mobile service providers the ability to deliver next-generation services over existing networks, which positions them to cost-effectively optimize the useful lives of their existing networks. Mobile service providers can then focus their investments on a seamless, cost-effective path from existing 2G and 3G networks to next-generation 4G LTE networks. We believe we are well-positioned to provide more efficient solutions that will lead to new revenue opportunities for mobile service providers as they refresh legacy equipment. Our solution works within existing 2G and 3G networks as well as next-generation 4G LTE networks, which allows us to capture rich communications business from mobile service providers using 2G and 3G networks today, and then to cost-effectively transition them to 4G LTE in the future.
Leverage Virtualization Technology to Enable Cloud Computing and Service Deployment Flexibility. We believe that virtualization technology can be leveraged to build 4G LTE core networks on standard cloud computing platforms, significantly lowering the cost for network infrastructure equipment. As many of the largest mobile service providers pursue strategies to implement their own private cloud infrastructures, we intend to continue pioneering solutions for virtualized cloud-based environments. Virtualization also allows more agile use of network infrastructure and is an ideal approach to providing hosted services, which we can deliver for both small and large mobile service providers. For example Deutsche Telekom, one of the largest pan-European mobile service providers, has commercially launched our virtualized Rich Communication Services to provide joyn® — an industry initiative that enables one-on-one and group chat services and the enhancement of voice calls through the sharing of multi-media content such as videos, pictures and music — on a single common hardware platform for nine different national networks across the continent, therefore deploying its own mobile cloud environment. Other virtualization benefits include the ability to rapidly deploy and test new services without large up-front infrastructure investments, as well as the flexibility to bundle application software together onto common hardware, thus lowering entry costs
9
for smaller, regional mobile service providers. Although we offer to host our solutions in a cloud-computing center for mobile service providers, we do not currently have any contracts to provide hosted services.
Selectively Pursue Strategic Acquisitions. We intend to continue to expand our product portfolio through opportunistic business acquisitions and intellectual property transactions. For example, we acquired Airwide Solutions in May 2011 to strengthen our mobile messaging solutions portfolio and expand our global market presence with additional locations in Europe, the Middle East and Africa (EMEA) and the Asia-Pacific region, in addition to significantly expanding our employee and talent base.
Expand into Adjacent Market Segments. As access networks converge towards all-IP, mobile service providers with solutions across wireless, wireline and enterprise see an opportunity for significant savings by consolidating infrastructure equipment into a single converged 4G LTE network. Given the technical complexities associated with mobile networks, and the standardization of solutions such as VoLTE and RCS, we believe that mobile service providers will ultimately choose to converge wireline, and to a lesser degree, enterprise onto the wireless 4G LTE network. With our expertise and first-mover advantage in VoLTE and RCS, we intend to provide converged solutions for adjacent market segments such as residential wireline, mobile center office exchange service (centrex) and enterprise.
Our Products
Our products support services in two broad categories — Voice and Video and Enhanced Messaging. The products can be sold individually or packaged together as fully integrated solutions that we deliver to our customers. Revenues from our Voice and Video product group comprised 69.5%, 30.8% and 34.1% of our revenues for the years ended December 31, 2014, 2013 and 2012, respectively. Revenues from our Enhanced Messaging product group comprised 30.5%, 69.2% and 65.9% of our revenues for the years ended December 31, 2014, 2013 and 2012, respectively. The functions provided by our products are described below.
Voice and Video
Telephony Application Server, or TAS:
Our Telephony Application Server (TAS) is a standards-based highly scalable product that provides voice, video and supplementary services over broadband IP networks. Based on its unique convergence capabilities and flexible software packaging, TAS is designed to enable service parity and consistency with the legacy circuit-switched (CS) mobile network, as well as simplify and accelerate 4G LTE network deployments. Our TAS enables advanced mobile functionalities in 4G LTE networks and provides the seamless mobility needed while roaming across networks of different generations and access topologies.
TAS supports a rich suite of advanced IP services, such as HD audio, video conferencing, multi-device and multi-access, that mobile service providers can use to create a differentiated and compelling service offering for their subscribers. Mobile service providers can use TAS to provide the following services: VoLTE, VoWi-Fi, Fixed Mobile Convergence (FMC), Mobile Video Calling, Mobile Enterprise and Fixed Residential. TAS is essential to the roll out of next-generation voice and video services. For example, our TAS solution enabled the first-to-market launch of VoLTE by MetroPCS (now part of T-Mobile) in August 2012.
Voice over LTE Interworking Function, or VoLTE IWF:
Our Voice over LTE Interworking Function (VoLTE IWF) product is deployed as a simple, cost-effective overlay to legacy (circuit-switched) networks, enabling voice and SMS services across next-generation LTE networks. VoLTE IWF is a framework that removes dependencies and alleviates costly upgrades to legacy networks through support for two applications: Circuit-Switched Fallback (CSFB) enabling the early introduction of LTE smartphones using legacy networks and Single Radio Voice Call Continuity (SR-VCC) enabling VoLTE call continuity in the event a subscriber roams out of LTE coverage. Mobile service providers can implement CSFB as an interim solution to start offering LTE services right away, and later perform a software upgrade to enable SR-VCC functionality as a final solution for VoLTE, thereby avoiding any costly upgrades. Our VoLTE IWF framework also allows mobile service providers to address evolving LTE standards through software upgrades.
Media Resource Function, or MRF:
Our Media Resource Function (MRF) is a media processing engine that is deployed along with our TAS to provide real-time voice and mobile video services. The MRF provides intelligent video and audio transcoding to optimize service delivery, which becomes an essential capability when interconnecting voice and video services between the mobile service provider network and OTT applications. The MRF also performs adaptive policy-driven traffic shaping based on network conditions and device capabilities to manage the subscribers’ Quality of Experience (QoE), which OTT service providers cannot offer.
10
Mobility Application Server, or MAS:
Our Mobility Application Server (MAS) is a standards-based application server that provides service continuity as mobile devices roam in or out of cellular coverage areas. MAS can be deployed as a stand-alone product or can be fully integrated with TAS. MAS supports multimedia session continuity between different networks, such as Wi-Fi and cellular.
Call Session Control Function, or CSCF:
Our Call Session Control Function (CSCF) provides subscriber and session management services to the core network, including authentication functions and service orchestration, routing and delivery. Our CSCF framework is designed with the scalability, reliability and performance density needed for the significantly larger number of devices in wireless networks compared to wireline networks. Our CSCF is designed for deployment in multi-vendor networks with support for both open standard interfaces and the flexibility to work around non-standard third-party implementations, thus ensuring successful interoperability and rapid deployment of services.
Equipment Identity Register, or EIR:
Our Equipment Identity Register (EIR) allows operators to control access to mobile networks, deterring device theft and fraud, and enables provisioning of optimized services, such as transcoding and ringtones, based on device type. EIR has advanced administrative and customer management capabilities that allow mobile operators to block any blacklisted mobile equipment and to lock subsidized handsets to specific SIM cards to enforce subscriber contract agreements. Our EIR solution allows mobile service providers in North America to comply with a recently announced Federal Communications Commission mandate requiring mobile service providers to expeditiously disable mobile devices that are reported stolen. Our unified EIR solution allows global mobile service providers to support all 2G, 3G and 4G LTE devices on their networks using a single solution.
Unified Access Gateway, or UAG:
Our Unified Access Gateway (UAG) is a multi-application solution that is used to authenticate end-user access to the converged services network. Our UAG includes Session Border Controller (SBC) and other gateway functions that are needed to extend mobile operator services to a variety of IP devices and web browsers. The UAG supports the requisite 4G LTE functional components needed to support mobility and roaming, while accessing VoLTE and RCS services. UAG is deployed at the edge of the mobile service provider network to secure service access, including traffic from other provider networks, and is a security gateway that supports key data encryption methods to ensure data integrity and protects the network against malicious attacks, such as denial of service.
Evolved Packet Core, or EPC:
Our EPC, which includes the Mobility Management Entity or MME, the System Architecture Evolution Gateway or SAE-GW, and the Evolved Packet Data Gateway or ePDG, is a 3GPP compliant software solution incorporating SDN principles to completely separate the signaling and forwarding planes. This innovative architecture enables operators to meet the challenges of increasing data usage and decreasing ARPU by reducing backhaul costs and decreasing the number of complex nodes in the network. Our fully virtualized solution can scale from the thousands of users to tens of millions, all on COTS hardware. The ePDG is a critical part of next generation Wi-Fi calling, offering secure access to mobile devices on Wi-Fi access and enabling seamless mobility to the macro cellular network. Our EPC solution also includes a Security Gateway which is used to secure 4G LTE traffic from the LTE RAN to the mobile operator’s EPC network.
Diameter Signaling Controller, or DSC:
Our Diameter Signaling Controller (DSC) helps operators manage the Diameter traffic flows that are prevalent in today's LTE and IMS networks. Diameter is a key technology used for authentication, authorization, and accounting in modern telecommunications networks. In particular, as Mobile Network Operators (MNOs) move forward to deploy LTE, they eventually confront challenges relating to scale, security, and interoperability. With our DSC, network integrity is provided through configurable security features, including network topology hiding, robust load distribution, congestion management, and signaling storm isolation. Our DSC also helps prevent and mitigate overload of critical resources such as policy servers, home subscriber servers, and online charging. With the ability to route on any Attribute/Value pair, our DSC enables Service-Oriented Routing™. Interworking between incompatible Diameter implementations is provided via powerful and flexible scripting support, enabling planned and ad hoc response to special routing needs and interoperability challenges.
Enhanced Messaging
Rich Messaging Server, or RMS:
Our Rich Messaging Server (RMS) is a flexible IP messaging application server with intelligent routing, policy-driven services and multiple domain delivery capabilities that provides a complete suite of text, picture and instant messaging services on a single consolidated platform. RMS allows mobile service providers to seamlessly migrate legacy messaging services such as
11
SMS and MMS to 4G, as well as offer new multimedia messaging services that are competitive with OTT messaging service providers.
RMS can be used by mobile service providers to provide the following services: LTE Messaging, Web Messaging, Converged IP Messaging (CPM), and RCS. With support for programmable interfaces, RMS allows operators to open up their messaging infrastructure to third-party application developers and introduce innovative new services at a rapid pace. Through the use of open APIs, RMS messaging services can be interworked to social networks to extend the reachability of the mobile service provider’s messaging services to include OTT communities.
Messaging Routers and Gateways:
Our portfolio of Messaging Routers and Gateways is based on a proven set of SMS and MMS messaging products that can be easily and rapidly deployed, and gives mobile service providers a comprehensive messaging solution for all of their messaging needs. Our Universal Messaging Repository (UMR) solution is a flexible, modular SMS messaging platform that provides intelligent, optimized routing features and policy-driven subscriber service profiles. The modularity of our UMR solution allows mobile service providers to deploy high-performance message routing, personalized SMS services and in-line security services such as content filtering. Our Messaging Router is an optimized routing solution for the growing machine-to-machine SMS market segment. Other products of ours, such as Messaging Firewall, Personal, Store and Rapid Service, protect mobile service provider infrastructures from security threats and provide differentiated messaging capabilities needed for high-value services such as mobile banking and client relationship management (CRM) systems. Our Messaging Gateway product is a multimedia messaging gateway that controls access to the network from third-party content providers for delivery of high-value SMS and MMS messaging services and content.
Presence and Resource List Server, or PRS:
Our Presence and Resource List Service (PRS) supports a rich suite of presence features that are optimized for deployment in mobile service provider networks. Presence features allow a user to share information, such as availability, pictures, or away messages, with authorized contacts in the user’s address book. PRS is designed with all the requisite features and functionality to support the RCS, providing both social presence and device capabilities discovery, and thus ensuring an optimum user experience for mobile subscribers.
PRS accepts, stores and distributes presence information, manages buddy and group lists, performs subscription authorization and enforces privacy rules. More importantly, PRS is scalable to cost-effectively support presence service for the mobile mass market through our network optimization capabilities.
XML Document Management System, or XDMS:
Our XML Document Management System (XDMS) is a high-performance and reliable database system that supports the management and storage of user-generated content such as icons, pictures and taglines, for social presence sharing and is used to store pre-defined group contact lists, such as a subscriber’s friends and family. Additionally, XDMS can also be used as a next-generation Network Address Book (NAB) that manages and stores a subscriber’s contacts, which can then be accessed from multiple devices, thereby enabling a cloud-based service model.
Technology and Architecture
Our technology has been designed to meet the challenges that mobile service providers face to evolve their networks to support next-generation services and devices. Our ability to interwork new technologies, such as 4G LTE, with the existing 2G and 3G core network infrastructure lowers investment cost for mobile service providers through continued use of legacy equipment, accelerates time-to-market by minimizing impacts on the surrounding network infrastructure and enables service parity across 2G, 3G and 4G LTE networks. Also, our ability to interwork 4G LTE with social networks and the support we provide for open APIs enables collaboration with OTT service providers, encourages new business models and extends the reach of the mobile provider’s services.
Our differentiated capability for service interworking is based on our mOne® Convergence Platform. The mOne® Convergence Platform is a carrier-grade software platform that enables rapid service development and service delivery across multiple network domains, including circuit-switch, IP, OTT and web-based access. The platform is comprised of three software layers — an applications and services layer, a functional layer and an interface abstraction layer. The applications and services layer provides application- or service-specific logic needed to support standards-based solutions such as VoLTE, RCS and CPM. The functional layer consists of discrete functional modules that are common to the various applications or services, such as billing, subscriber management, call preservation and routing. Finally, the interface abstraction layer provides the flexibility to connect any application or service to any multi-vendor network element over different types of network protocols, thereby providing convergence across disparate service domains.
12
Our ability to package multiple services and solutions across voice, video, messaging and presence on a single common platform reduces the cost and complexity of deploying 4G LTE-based networks. The mOne® Convergence Platform supports a wide range of applications and functionalities to deliver services over 2G, 3G and 4G LTE networks — such as VoLTE, LTE Messaging, Mobile Video, RCS and CPM — all on a single common platform and all with common management.
The mOne® Convergence Platform complies with all leading industry standards from key standards development organizations including the 3rd Generation Partnership Project (commonly known as 3GPP), the Internet Engineering Task Force (commonly known as IETF) and the Open Mobile Alliance (commonly known as OMA) and supports industry-standard open interfaces to connect with existing mobile access and core networks.
The mOne® Convergence Platform is a software-based platform that can be deployed on different types of commercial off-the-shelf (COTS) hardware platforms, including Advanced Telecommunications Computing Architecture (ATCA) hardware platforms, industry standard IT server and blade server hardware platforms and virtualized cloud environments, giving mobile service providers the flexibility to choose the solution that best suits their needs. Our technology makes use of Network Functions Virtualization (NFV) and enables mobile service providers to transition from telecommunications-specific purpose-built hardware platforms onto widely-available industry-standard general computing platforms, thereby significantly lowering costs.
Our technology is based on the following design principles:
• | Openness: Our products and solutions are based on leading industry standards and designed to be fully interoperable with third-party vendor equipment. |
• | Flexibility: Our software is highly modular and can easily adapt to interwork with the wide variety of equipment typically found across different mobile service provider networks. |
• | Innovation: Our unique convergence capabilities enable solutions that address deployment challenges and accelerate time-to-market. |
• | Scalability: Our platform is designed to seamlessly scale to meet traffic growth requirements with minimal impact on network design and provisioning. |
• | High Availability: Our platform is designed against any single point of failure, meeting or exceeding the traditional mobile telecommunications industry requirements for 99.999% availability. In addition, our solutions are designed for geographical redundancy which maintains network and service availability. |
Customers
Our primary customers are mobile service providers that are deploying or seeking to deploy next-generation converged communications services, such as VoLTE and RCS, over 4G LTE networks. We sell our products directly and through channel partners and system integrators. We continued to grow our next-generation customer base in 2014, winning 11 new customers for our voice and video products and 5 new customers for our enhanced messaging products. Additionally, we extended our customer reach into Japan with the acquisition of Stoke.
Revenue from customers located outside the United States represented 51% of our total revenue in 2014, 58% of our total revenue in 2013 and 54% of our total revenue for the year ended December 31, 2012.
In 2014, T-Mobile USA accounted for 39% of our total revenue. In 2013 AT&T, T-Mobile USA (now includes MetroPCS), and Deutsche Telekom accounted for approximately 20%, 17%, and 13%, respectively, of our total revenue. In 2012, AT&T, MetroPCS, T-Mobile USA and Vodafone accounted for 21%, 13%, 11% and 10%, respectively, of our total revenue. No other end customer accounted for more than 10% of our revenue in those respective periods.
Customer Support and Services
We provide critical and hands-on support and services to our customers to define, deploy and operate the products and solutions we sell, which we believe is a critical component of our overall platform offering. Our support and services effort covers pre-sales technical consultation, specification and solution design, solution testing and certification, operation, post-sales maintenance and training.
The provision of a broad range of professional support services is an integral part of our business model. We offer services designed to deliver comprehensive support to our mobile service provider customers and channel partners through every stage of product deployment.
13
The services we provide to our customers include:
Customer Service and Technical Support. Our support organization provides 24-hour, 7 days a week, 365 days a year operational support to our customers. The support team and resources are strategically located within our customers’ geographical regions in order to deliver personalized and high-quality engineering and support capabilities. Our service and support team is dedicated to providing high quality and responsive support to ensure that our customers successfully deliver IP-based voice, video, rich communications and enhanced messaging services to their subscribers.
Professional Services. We offer a range of professional services to support every step of the deployment and use of our solutions: pre-installation services, installation, network monitoring and training. Our professional services group provides pre-installation services, such as service and architecture definition and pre-sales support, to help our customers identify the relevant set of services and the associated use cases that they require and better understand their customer-specific requirements. Our installation services include network design, project management, physical installation and commissioning. We integrate our solutions with other network components and back office management systems. Our expertise in all of these steps is critical to the successful launch of new services on 4G LTE, and we have differentiated experience based on the commercial launch of the first VoWi-Fi network and first VoLTE network. We also offer network monitoring services to assess network health and we provide recommendations for network expansions, upgrades, optimization and evolution. Finally, we provide detailed product documentation and training that are adapted to the specific network deployment of each customer.
Sales and Marketing
As of December 31, 2014, we had a total sales and marketing staff of 115 employees, with 56 located in the Americas, 33 located in Europe, the Middle East and Africa (EMEA) and 26 in the Asia-Pacific region. Our sales and marketing expenses were $34.2 million, $20.5 million and $20.6 million in the years ended December 31, 2014, 2013 and 2012, respectively.
We market and sell our solutions directly to our customers through our sales force and indirectly through channel partner relationships.
Direct Sales. Our direct sales organization focuses on selling to leading mobile service providers throughout the world. The typical selling cycle begins with mobile service providers requesting information either informally or formally through a request for information (RFI) and/or request for proposal (RFP). In many instances, mobile service providers will first issue an open-ended RFI, then a more detailed and specific RFP. The RFP process includes assessment of responses as well as, in most cases, lab testing and potentially field testing of the service to be deployed. Our relationships with leading mobile service providers and experience in their labs have given us significant insight into their networks and their decision-making processes with respect to their deployment of solutions.
We maintain sales and support offices in several markets around the world, including the United States, Canada, the United Kingdom, India, Singapore, China and Australia, and we have sales personnel in an additional nine countries. The sales team is managed geographically and by key accounts to ensure appropriate focus on our global customer base. Given the large portion of mobile subscribers that are accounted for by the largest mobile service providers, we are focused on addressing those large mobile service providers.
For the years ended December 31, 2014, 2013 and 2012 respectively, approximately 72%, 48% and 44% of our revenues resulted from our direct sales team.
Channel Partner Relationships. We have developed relationships with a number of channel partners, including Cisco Systems and other Value Added Resellers (VARs). These relationships have allowed us to reach a broader mobile service provider market than was possible through our direct sales efforts.
For the years ended December 31, 2014, 2013 and 2012, respectively, approximately 28%, 52% and 56% of our revenues resulted from our channel partner relationships.
Marketing. We market and promote our products and solutions through a series of coordinated efforts that include customer workshops, customer social events, participation on discussion panels at industry events, speeches, webinars and seminars for customers, industry analyst and press briefings, press releases, attendance at trade shows, demonstrations of product capabilities and trials, including early adopters programs and marketing collateral such as product briefs, solution briefs, advertising in trade journals, placed articles and white papers. These marketing activities are typical for the telecommunications industry. We also use social media, such as blogs and posts on Twitter and LinkedIn, to broadcast time-sensitive information of topical interest.
14
Research and Development
Our technology requires continued investment to maintain our market and technology leadership position. Accordingly, we believe that a strong research and development program is critical to our success. Our research and development efforts are focused on designing, developing and enhancing our products as well as the technology underlying our products, investigating new technologies, performing testing, quality assurance and certification activities with major operators and integrating our solutions with third-party products, if necessary.
Continued investment and innovation in research and development is critical to our business. As of December 31, 2014, we had approximately 638 engineering development personnel located in the United States, India, China and other countries. These personnel are skilled with deep domain expertise in the diverse areas of telecommunications, IP networking, software development, web technologies, and have successfully delivered high-availability voice and video telephony applications leveraging cloud computing and open source software. We deliver end-to-end solutions combining our products and best-of-breed third-party components. This open approach is supported by a highly scalable software platform, flexible software architecture and a skilled employee base. Our delivery of the first operational VoLTE solution at MetroPCS (now part of T-Mobile) in a complex multi-vendor environment illustrates our position at the forefront of the technology space and our ability to execute in a demanding customer environment.
Our research and development expenses were $30.5 million, $22.8 million and $23.3 million during the years ended December 31, 2014, 2013 and 2012, respectively.
Competition
The market for mobile network infrastructure products and solutions is highly competitive and evolving rapidly. The market is subject to changing technology trends and shifting subscriber needs and expectations that lead our customers to introduce new services frequently. With the growth and adoption of 4G LTE technology, we expect competition to continue and intensify for all of our solutions, and in all of our target markets.
We believe there are a number of important factors to compete effectively in our market, including:
• | Voice, Video and Messaging Features. Mobile service providers are increasingly demanding a comprehensive set of solutions that includes closely integrated mobile voice, video and messaging features. |
• | Solution Scalability and Robustness. The transition to 4G LTE technology is starting with small-scale deployments with the mobile service providers’ expectation of expanding the deployed services to address all subscribers over time. Mobile service providers are seeking solutions that can be grown seamlessly from the initial small-scale deployments for a subset of subscribers to full deployment for all subscribers and that have the required carrier-grade robustness. |
• | Competitive Pricing. Total cost of ownership is one of the key attributes that mobile service providers evaluate when selecting a solution. With declining revenues for voice services and basic messaging, mobile service providers expect that the evolved networks will lower costs to deliver equivalent services, and provide the infrastructure necessary to deliver enhanced services, both now and in the future. |
• | Flexibility and Responsiveness. Mobile service providers typically require functionality to be integrated into their networks on aggressive timelines to meet their desired service launch dates. Also, the specific features required for launch of new services varies among mobile service providers due to each provider’s unique network requirements and the new service set being launched. We believe it is critical that solutions providers have the flexibility to offer customized solutions and implementation approaches. |
• | Market Recognition. The implementation of network infrastructure often ties mobile service providers into their chosen vendors for extended periods. As a result, mobile service providers tend to favor suppliers who are well-known, whose successes are demonstrated and whose reputations are well-established. |
Our primary competitors consist of two broad categories:
• | Major Network Infrastructure Providers. These competitors include Alcatel-Lucent, Ericsson, Nokia Siemens Networks and Huawei. We believe that we are generally very competitive against these vendors because of the features we offer within our solutions, our flexibility in delivering solutions that are well optimized and deliver the specific feature set required for each mobile service provider’s unique network requirements, the timeliness of |
15
delivering solutions, and competitive pricing. We believe that the large infrastructure vendors generally face structural challenges to both support their legacy businesses and deliver the innovative next-generation solutions – challenges that we believe will prevent them from delivering the innovation that mobile service providers need to quickly launch new enhanced services.
• | Specialty Solution Providers. These competitors include solutions providers such as Acme Packet (recently acquired by Oracle), Broadsoft and Sonus Networks, voice providers such as Broadsoft and Metaswitch and messaging specialists such as Comverse and Acision. Each of these solution providers has the ability to deliver one communications medium but lacks the ability to deliver comprehensive communication solutions. We believe that we are very competitive against these vendors with the breadth of our voice, video and messaging solutions, the features we offer within each of the solutions, the timeliness of delivering the solutions, and competitive pricing. Additionally, we believe that we are becoming better known than these niche vendors as a leading provider of mobile communications solutions for next-generation 4G LTE networks and RCS services with the early successes we have earned with our customers. |
We also compete with some of our channel partners that sell our Equipment Identity Register (EIR). We believe that the areas in which we compete with these channel partners will have no material impact on existing resale arrangements.
Our current and potential competitors may have significantly greater financial, technical, marketing and other resources than we do and may be able to devote greater resources to the development, promotion, sale and support of their products. Our competitors may have more extensive customer bases and broader customer relationships than we do, including relationships with our potential customers. In addition, these competitors may have longer operating histories and greater brand recognition than we do. Our competitors may be in a stronger position to respond quickly to new technologies and may be able to market and sell their products more effectively. Moreover, if one or more of our competitors were to merge or partner with another of our competitors, the change in the competitive landscape could adversely affect our customer relationships and competitive position or otherwise affect our ability to compete effectively. For more information on the competitive risks we face, please read “Risk Factors — Risks Related to Our Business and Our Industry.”
Intellectual Property
Our success depends to a significant degree upon our ability to protect our core technology and intellectual property. To accomplish this, we rely on a combination of intellectual property rights, including patents, trade secrets, copyrights and trademarks, as well as customary confidentiality and other contractual protections. Our policy is to seek to protect our proprietary position by, among other methods, filing U.S. and non-U.S. patent applications related to our proprietary technology, inventions and improvements that are important to the development of our business. As of December 31, 2014, we had been issued 21 U.S. patents and 28 non-U.S. patents. In addition, as of December 31, 2014, we had a total of 11 patent applications pending in the United States, and 32 pending non-U.S. patent applications. Many of the non-U.S. patents and applications are counterparts to the U.S. patents or certain of the U.S. patent applications.
Our U.S. patents are scheduled to expire at various dates between March 2021 and May 2031. The expiration dates of our pending U.S. patent applications, if those applications are issued as patents, will presently be as late as November 2034. Our non-U.S. patents are scheduled to expire at various dates between August 2021 and July 2028. The expiration dates of our pending non-U.S. patent applications if those applications are issued as patents, will presently be as late as October 2033.
Our registered trademarks in the United States consist of the Mavenir Systems® name, mOne®, AirMessenger® and Airwide®.
Our software is protected by U.S. and international copyright laws. We also incorporate a number of third-party software programs into our solutions, pursuant to license agreements. Our software is not substantially dependent on any third-party software, although it utilizes open source code.
In addition to the protections described above, we generally control access to and use of our proprietary software and other confidential information through the use of internal and external controls, including nondisclosure agreements with employees, consultants, customers and vendors and other measures for maintaining trade secret protection. We license our software to customers pursuant to agreements that impose restrictions on the customers’ ability to use the software, including prohibitions on reverse engineering and limitations on the use of copies. We also seek to avoid disclosure of our intellectual property by requiring employees and consultants with access to our proprietary information to execute nondisclosure and assignment of intellectual property agreements and by restricting access to our source code. For information on the risks associated with our use and protection of intellectual property, please see “Risk Factors — Risks Related to Our Intellectual Property and Our Technology.”
16
Employees
As of December 31, 2014, we had 1,183 full-time employees, 638 of whom were primarily engaged in engineering, 115 of whom were primarily engaged in sales and marketing, 328 of whom were primarily engaged in providing implementation and professional support services and 102 of whom were primarily engaged in administration and finance. These employees are located in the United States, India, China, the United Kingdom, Canada, Australia, Croatia, Germany, Singapore, France, the Netherlands, and other locations globally. While the laws of certain of the jurisdictions in which we have employees do not require employees to advise us of union membership, to our knowledge, none of our employees is represented by a labor union or covered by a collective bargaining agreement, except that all of our several employees located in Finland are covered by a collective bargaining agreement. We consider our relationship with employees to be good.
Available Information
We file with the Securities and Exchange Commission (the SEC) annual reports on Form 10-K, quarterly reports on Form 10-Q, current reports on Form 8-K, proxy and information statements and amendments to reports filed or furnished pursuant to Sections 13(a), 14 and 15(d) of the Securities Exchange Act of 1934, as amended. The public may obtain these filings at the SEC’s Public Reference Room at 100 F Street, NE, Washington, DC 20549 or by calling the SEC at 1-800-SEC-0330. The SEC also maintains a website at http://www.sec.gov that contains reports, proxy and information statements and other information regarding Mavenir and other companies that file materials with the SEC electronically. Copies of our reports on Form 10-K, Forms 10-Q and Forms 8-K may also be obtained, free of charge, electronically through the investor relations portion of our website, http://investor.mavenir.com/investor-relations/sec-filings/default.aspx.
We webcast our earnings calls on our investor relations website. Additionally, we provide notifications of news or announcements regarding our financial performance, including SEC filings, investor events and press and earnings releases, on the investor relations portion of our website. Further corporate governance information, including our corporate governance guidelines, board committee charters, Code of Business Conduct and Ethics and our Code of Ethics for Certain Senior Officers, is also available on our investor relations website under the heading “Corporate Governance.” The contents of our website are not intended to be incorporated by reference into this Annual Report on Form 10-K or in any other report or document we file with the SEC.
Item 1A | Risk Factors |
We operate in a dynamic and rapidly changing business environment that involves multiple risks and substantial uncertainty. The following discussion addresses risks and uncertainties that could cause, or contribute to causing, actual results to differ from expectations in material ways. In evaluating our business, investors should pay particular attention to the risks and uncertainties described below and in other sections of this report and in our subsequent filings with the SEC. These risks and uncertainties, or other events that we do not currently anticipate or that we currently deem immaterial also may affect our results of operations, cash flows and financial condition. The trading price of our common stock could also decline due to any of these risks, and you could lose all or part of your investment.
Risks Related to Our Business and Our Industry
We have incurred net losses in the past and may not be able to achieve or sustain profitability in the future.
We have incurred significant losses in each year since inception. As a result of ongoing net losses, we had an accumulated deficit of $138.2 million at December 31, 2014. We expect to continue to incur significant product development, sales and marketing, administrative and other expenses. We have only a limited operating history on which you can base your evaluation of our business and our ability to increase our revenue. We commenced operations in 2005 and began product sales in 2007. We will need to generate significant additional revenue to achieve and maintain profitability, and even if we achieve profitability, we cannot be sure that we will remain profitable for any substantial period of time. To the extent we are unable to become or remain profitable, the market price of our common stock will probably decline.
Our future revenue growth is substantially dependent upon the speed of adoption of 4G LTE technology by mobile service providers.
While we derive, and expect to continue to derive, a substantial portion of our revenue from our messaging solutions, we expect our future revenue growth to be driven largely by sales of our internet protocol (IP)-based voice, video, rich communications and enhanced messaging services, which collectively represent our 4G LTE solutions. IP-based communication services and 4G LTE technology represent new, data-packet-based mobile communications technologies, and their deployment is still in its early stages. Our 4G LTE solutions are dependent upon the use of 4G LTE technology because
17
these solutions are high-bandwidth data applications that require the high-bandwidth access networking provided by 4G LTE technology.
Mobile service providers have delayed implementation of 4G LTE technology for one or a number of reasons, including costs associated with transitioning, costs of handsets, and that their subscribers may not be willing or able to pay for any increased costs of plans that result from the implementation of 4G LTE technology. As a result, if widespread move to 4G LTE technology continues at a slower pace than we expect, our future revenue growth will be materially and adversely affected.
Our revenue growth will be limited if mobile service providers choose the 4G LTE solutions of our competitors over ours, or if 4G LTE products and solutions do not achieve and sustain high levels of demand and market acceptance.
Our future revenue growth depends on mobile service providers choosing our 4G LTE solutions over those of our competitors. Additionally, the market for 4G LTE products and solutions is relatively new and still evolving, and it is uncertain whether these products and solutions will achieve and sustain high levels of demand and market acceptance. Even if mobile service providers perceive the benefits of 4G LTE products and solutions, they may not select our 4G LTE solutions for implementation and may instead choose our competitors’ solutions or wait for the introduction of other solutions and technologies that might serve as a replacement or substitute for, or represent an improvement over, our 4G LTE solutions, which would significantly and adversely affect our operating results.
Our future success depends significantly on our ability to sell our solutions to mobile service providers operating wireless networks that serve large numbers of subscribers.
Our future success depends significantly on our ability to sell our solutions to mobile service providers operating wireless networks that serve large numbers of subscribers and transport high volumes of traffic. The mobile communications services industry historically has been concentrated among a relatively small number of providers. For example, as of June 2014, the largest twenty mobile service providers in the world, as measured by number of mobile device connections, accounted for approximately 43% of total mobile device connections globally. Because the twenty largest mobile service providers continue to constitute a significant portion of the market for mobile communications equipment, our success depends significantly on our ability to sell solutions to them. Additionally, if we fail to expand our customer base to include additional customers that deploy our solutions in large-scale networks serving significant numbers of subscribers, our revenue growth will be limited.
Our future software products and maintenance revenue and our revenue growth depend significantly on the success of our efforts to sell additional solutions and maintenance services to our existing mobile service provider customers.
Our business strategy and our plan to achieve profitability depend significantly on our sales of additional solutions to our existing mobile service provider customers. In addition, our solutions are generally accompanied by right-to-use licenses under which we receive periodic payments based upon the numbers of subscribers to such services from time to time. Therefore, our growth will also depend on our customers’ expanded use of our solutions over greater numbers of subscribers over time. Mobile service providers may choose not to purchase additional solutions from us or may choose not to expand their use of, or not to purchase continued maintenance and support for, our solutions, or might delay additional purchases that we may expect. These events could occur for a number of reasons, including because our mobile service provider customers are not experiencing sufficient subscriber demand for the services that our solutions enable, or because mobile service providers choose solutions other than ours. If we are not successful in selling new and additional solutions to our existing mobile service provider customers or if those customers do not elect to expand their use of our solutions over additional subscribers in their networks, our revenue could grow at a slow rate or decrease and we may not achieve or maintain profitability.
Our success depends in large part on mobile service providers’ continued deployment of, and investment in, modern telephony equipment and rich communications solutions.
A significant portion of our product and solution suite is dedicated to enabling mobile service providers to deliver voice and multimedia services over newer and faster IP-based broadband networks. As a result, our success depends significantly on these mobile service providers’ continued deployment of, and investment in, their IP-based networks. Mobile service providers’ deployment of IP-based networks and their migration of communications services from existing circuit-based 2G and 3G networks to IP-based networks is still in its early stages. These mobile service providers’ continued deployment of, and investment in, IP-based networks and rich communications solutions depends on a number of factors outside of our control. These factors include capital constraints, the presence of available capacity on legacy networks, perceived subscriber demand for rich communications solutions, competitive conditions within the telecommunications industry and regulatory issues. If mobile service providers do not continue deploying and investing in their IP-based networks, for these or other reasons, our operating results will be materially and adversely affected.
18
Most of our competitors have longer operating histories, greater brand recognition, larger product and customer bases and significantly greater resources (financial, technical, sales, marketing and other) than we do, and we may lack sufficient financial or other resources to maintain or improve our competitive position.
Our principal competitors include major network infrastructure providers such as Alcatel-Lucent, Ericsson, Huawei, Nokia Siemens Networks, Samsung Electronics and ZTE Corporation as well as specialty solutions providers such as Acision, Acme Packet (recently acquired by Oracle), Broadsoft, Comverse, Metaswitch and Sonus Networks. Our brand is not currently as well-known as those of our larger and more established competitors. In addition, many of our competitors have significantly broader product bases and intellectual property portfolios, as well as significantly greater financial, technical, sales, marketing and other resources than we do. They therefore may be better positioned to acquire and offer complementary solutions and technologies. As a result, potential customers may prefer to purchase products or solutions from their existing suppliers or one of our larger competitors. In addition, larger competitors may have more flexibility to agree to financial terms that we are unable to agree to by virtue of our more limited financial resources. We expect increased competition from other established and emerging companies if our market continues to develop and expand. As we enter new markets, we expect to face competition from incumbent and new market participants.
In addition, some of our competitors have made acquisitions or entered into partnerships or other strategic relationships with one another to offer a more comprehensive solution than they had offered individually. This consolidation may continue as companies attempt to strengthen or maintain their market positions in an evolving industry and as companies enter into partnerships or are acquired. The competitors resulting from these possible consolidations may develop more compelling product or solution offerings and be able to offer greater pricing flexibility, making it more difficult for us to compete effectively, including on the basis of price, sales and marketing programs, technology, support capacity or product functionality. Industry consolidation may adversely impact perceptions of the viability of smaller and even medium-sized technology companies and, consequently, willingness of mobile service providers to purchase from such companies. These pricing pressures and competition from more comprehensive solutions could impair our ability to sell our solutions, which could negatively affect our revenues and results of operations.
We depend on a limited number of mobile service provider customers for a substantial portion of our revenue in any fiscal period, and the loss of, or a significant shortfall in orders from, key customers could significantly reduce our revenue.
We derive a substantial portion of our total revenue in any fiscal period from a limited number of mobile service provider customers as a result of the relatively concentrated nature of our target market and the relatively early stage of our development. During any given fiscal period, a small number of customers may account for a significant percentage of our revenue. For example, one of our customers (T-Mobile USA) accounted for approximately 39% of our total revenue for the year ended December 31, 2014. Generally, we do not have and we do not enter into multi-year purchase contracts with our customers, nor do we have contractual arrangements to ensure future sales of our solutions to our existing customers. Our inability to generate anticipated revenue from our key existing or targeted customers, or a significant shortfall in sales to them, would significantly reduce our revenue and adversely affect our business. Our operating results in the foreseeable future will continue to depend on our ability to effect sales to existing and other large mobile service provider customers.
We have relied significantly on channel partners to sell our solutions in domestic and international markets, and if we are unable to maintain successful relationships with them, our business, operating results, liquidity and financial condition could be harmed.
We sell our solutions to mobile service providers both directly and, particularly in international markets, indirectly through channel partners such as telecommunications equipment vendors, value-added resellers and other resellers. We believe that establishing and maintaining successful relationships with these channel partners contributes, and will continue to contribute, to our success, but there can be no guarantee that any such relationships will continue. For example, our contract with Cisco Systems, currently our most significant channel partner in terms of revenue, may be terminated by Cisco with advance notice prior to the end of each automatically renewable one-year term, and we cannot be certain that Cisco will choose not to terminate this contract. Notwithstanding any such decision by Cisco, under our contract with Cisco we would have continuing fulfillment, maintenance and support obligations with respect to any ongoing end-user projects, and we must offer maintenance and support services to Cisco for all of our products already deployed by Cisco at the time of expiration or termination for at least five years from the last commercial sale of our products by Cisco prior to such expiration or termination.
Recruiting and retaining qualified channel partners and training them in our technology and solutions offerings require significant time and resources. To develop and expand our channels, we must continue to scale and improve our processes and procedures that support our channels, including investment in systems and training. In addition, existing and future channel partners will only partner with us if we are able to provide them with competitive solutions on terms that are acceptable to
19
them. If we fail to maintain the quality of our solutions or to update and enhance them, existing and future channel partners may elect to partner with one or more of our competitors.
The reduction in or loss of sales by these channel partners could materially reduce our revenue, either temporarily or permanently. For example, our reseller agreement with Cisco, accounted 19% of our revenue for the year ended December 31, 2014. We cannot assure you that our channel partners will continue to cooperate with us when our reseller agreements expire or are up for renewal. If we fail to maintain successful relationships with our channel partners, fail to develop new relationships with other channel partners in new markets, fail to manage, train or incentivize existing channel partners effectively, fail to provide channel partners with competitive solutions on terms acceptable to them, or if these partners are not successful in their sales efforts, our revenue may decrease and our operating results could suffer.
Our channel partners may offer their customers the products of several different companies, including those of our competitors. Our channel partners generally do not have an exclusive relationship with us; thus, we cannot be certain that they will prioritize or provide adequate resources for selling our solutions. Divergence in strategy or contract defaults by any of these channel partners may harm our ability to develop, market, sell or support our solutions. Furthermore, some of our competitors may have stronger relationships with our channel partners than we do, and we have limited control, if any, as to whether those partners resell our solutions, rather than our competitors’ products or solutions, or whether they devote resources to market and support our products or solutions rather than those of our competitors. Our failure to establish and maintain successful relationships with channel partners could materially and adversely affect our business, operating results, liquidity and financial condition.
The long and variable sales and deployment cycles for our solutions may cause our operating results to vary materially from quarter to quarter, which may negatively affect our operating results, and potentially our stock price, for any given quarter.
Our solutions have lengthy sales cycles, which typically extend from six to eighteen months. A mobile service provider’s decision to purchase our solutions often involves a significant commitment of its resources after an evaluation, qualification and competitive bid process with an unpredictable length. The length of our sales cycles also varies depending on the type of mobile service provider to which we are selling, the solution being sold and the type of network in which our product will be utilized. We may incur substantial sales, marketing and technical expenses and expend significant management effort during this time, regardless of whether we make a sale.
Even after making the decision to purchase our products, our mobile service provider customers may deploy our products slowly. Timing of deployment can vary widely among mobile service providers. The length of a mobile service provider’s deployment period may directly affect the timing of any subsequent purchase of additional solutions by that mobile service provider. In addition, in some situations we recognize revenue only upon the final acceptance of our solution by a customer, so the timing of purchase and deployment by our customers can significantly affect our operating results for a fiscal period.
As a result of the lengthy and uncertain sales and deployment cycles for our solutions, it is difficult for us to predict the quarter in which our mobile service provider customers may purchase additional solutions or features from us or in which we may recognize revenues. Therefore, our operating results may vary significantly from quarter to quarter, which may negatively affect our operating results, and potentially our stock price, for any given quarter.
As a further result of these lengthy sales cycles, we may accept terms or conditions that negatively affect pricing or payment in order to consummate a sale. Doing so can negatively affect our gross margin and results of operations. Alternatively, if mobile service providers ultimately insist upon terms and conditions that we deem too onerous or not to be commercially prudent, we may decline, and thus incur substantial expenses and devote time and resources to potential relationships that never result in completed sales or revenue. If this were to happen often, it would have a material adverse impact on our results of operations.
Our large mobile service provider customers have substantial negotiating leverage, which may require that we agree to terms and conditions that could result in increased cost of sales, decreased revenues or delayed recognition of revenues and could adversely affect our operating results.
Many of our customers are large mobile service providers that have substantial purchasing power and leverage in negotiating contractual arrangements with us, including pricing terms, aggressive timelines, penalties and liquidated damages. Any of our present or future mobile service provider customers may require us to develop additional features, undertake additional testing, and/or may impose penalties, service credits or seek damages relating to product or support performance issues such as delivery, warranty, outages and response times. As we seek to sell more solutions to these mobile service providers, we may be required to agree to more onerous terms and additional performance-based terms and conditions, which may increase cost of sales, affect the timing of revenue recognition or adversely affect our operating results.
20
Our quarterly revenue and operating results are unpredictable and may fluctuate significantly from quarter to quarter due to factors outside our control, which could adversely affect our business, consolidated financial statements and the trading price of our common stock.
Our revenues and operating results may vary significantly from quarter to quarter due to a number of factors, many of which are outside of our control and any of which may cause our stock price to fluctuate. Generally, purchases by mobile service providers of telecommunications solutions from software-based network solutions providers have been unpredictable and clustered, rather than steady, as the various mobile service providers build out their networks according to their own timing, resources and surrounding circumstances. The primary factors that may affect our revenues and operating results include, but are not limited to, the following:
• | fluctuations in demand for our 4G LTE solutions, our messaging solutions or our services, and the timing and size of customer orders; |
• | length and variability of the sales cycle for our solutions; |
• | competitive conditions in our markets, including the effects of new entrants, consolidation, technological innovation and substantial price discounting; |
• | new solution announcements, introductions and enhancements by us or our competitors, which could result in deferrals of customer orders; |
• | market acceptance of new solutions and solution enhancements that we offer and our services; |
• | the mix of solution configurations sold; |
• | the quality and degree of execution of our business strategy and operating plan, and the effectiveness of our sales and marketing programs; |
• | our ability to develop, introduce, ship and successfully deliver new solutions and solution enhancements that meet customer requirements in a timely manner; |
• | our ability to provide customer support solutions in a timely manner; |
• | our ability to meet mobile service providers’ solution installation and acceptance deadlines; |
• | our ability to attain and maintain production volumes and quality levels for our solutions; |
• | cancellation or deferral of existing customer orders or the renegotiation of existing contractual commitments; |
• | changes in our pricing policies, the pricing policies of our competitors and the prices of the components of our solutions; |
• | timing of revenue recognition and the application of complex revenue recognition accounting rules to our customer arrangements, including rules requiring that we estimate percentage of completion of a contract, the amount of time required to complete a contract and whether or not we expect to incur a loss on a contract; |
• | consolidation within the telecommunications industry, including acquisitions of or by our mobile service provider customers; |
• | general economic conditions in our markets, both domestic and international, as well as the level and pace of discretionary IT spending by businesses and of service choices by individual consumers; |
• | fluctuations in foreign exchange rates; |
• | variability and unpredictability in the rate of growth in the markets in which we compete; |
• | costs related to acquisitions and integration of any acquisitions; and |
• | corporate restructurings. |
As with other software-based network solutions providers, we typically recognize a portion of our revenue in a given quarter from sales booked and shipped in the last weeks of that quarter. As a result, delays in customer orders may result in delays in shipments and recognition of revenue beyond the end of a given quarter. Additionally, as discussed elsewhere in this section, it can be difficult for us to predict the timing of receipt of major customer orders, and we are unable to control timing decisions
21
made by our customers. As a result, our quarterly operating results are difficult to predict even in the near term and a delay in an anticipated sale past the end of a particular quarter may negatively impact our results of operations for that quarter, or in some cases, that year. Therefore, we believe that quarter-to-quarter comparisons of our operating results are a poor indication of our future performance. If our revenue or operating results fall below the expectations of investors or securities analysts or below any guidance we may provide to the market, the price of our common stock could decline substantially. Such a stock price decline could also occur when we have met our publicly stated revenue or operating results guidance.
A significant portion of our operating expenses is fixed in the short term. If revenues for a particular quarter are below expectations, we would likely be unable to reduce costs and expenses proportionally for that quarter. Any such revenue shortfall would, therefore, have a significant effect on our operating results for that quarter.
Consolidation in the communications industry can reduce the number of mobile service provider customers and adversely affect our business.
Historically, the communications industry has experienced, and it may continue to experience, consolidation and an increased formation of alliances among mobile service providers and between mobile service providers and other entities. Should one of our significant mobile service provider customers consolidate or enter into an alliance with another customer, it is possible that the combined entity could reduce capital expenditures on technology that requires our solutions. It is also possible that such combined entity could decide to either use a different supplier or to renegotiate its supply and service arrangements with us. These consolidations or alliances may cause us to lose customers or require us to reduce prices as a result of enhanced customer leverage, which could have a material adverse effect on our business. We may not be able to offset the effects of any price reductions. We may not be able to expand our customer base to make up any revenue declines if we lose customers or business.
The quality of our support and services offerings is important to our mobile service provider customers, and if we fail to offer high quality support and services, mobile service providers may not buy our solutions and our revenue may decline.
Once our solutions are deployed within our mobile service provider customers’ networks, the customers generally depend on our support organization to resolve issues relating to those solutions. A high level of support is critical for the successful marketing and sale of our solutions. If we are unable to provide the necessary level of support and service to our customers, we could experience:
• | a loss of customers and market share; |
• | a failure to attract new customers, including in new geographic regions; |
• | increased service, support and warranty costs and a diversion of development resources; and |
• | network performance penalties, including liquidated damages for periods of time that our customers’ networks are inoperable. |
Any of the above results would likely have a material adverse impact on our business, revenue, results of operations, financial condition, liquidity and reputation.
Our business is dependent on our ability to maintain and scale our resources, and any significant disruption in our service and support could damage our reputation, result in a potential loss of customers and adversely affect our financial results.
Our reputation and ability to attract, retain and serve our mobile service provider customers is dependent upon the reliable performance of our service and support and our underlying technical infrastructure. Our systems may not be adequately designed with the necessary reliability and redundancy to avoid performance delays or outages that could be harmful to our business. If our services and/or support are unavailable when our customers attempt to access them, mobile service providers may not continue to purchase our services and support or our solutions as often in the future, or at all. In addition, customers of ours may seek a refund for solutions purchased under warranty.
As our customer base continues to grow, we will need an increasing amount of technical infrastructure, including human resources, to continue to satisfy the needs of our mobile service provider customers. It is possible that we may fail to effectively scale and grow our technical infrastructure to accommodate these increased demands. In addition, our business is subject to interruptions, delays or failures resulting from earthquakes, other natural disasters, terrorism or other catastrophic events.
22
We might require additional capital to support business growth, and this capital might not be available on terms favorable to us or at all.
We intend to continue to make investments to support our business growth and may require additional funds to respond to business challenges, including the need to develop new solutions or enhance our existing solutions and platform, upgrade our operating infrastructure and acquire complementary businesses and technologies. Accordingly, we may need to engage in equity or debt financings to secure additional funds. If we raise additional funds through further issuances of equity or convertible debt securities, our existing stockholders could suffer significant dilution, and any new equity securities we issue could have rights, preferences and privileges superior to those of holders of our common stock. Any debt financing obtained by us in the future would likely be senior to our common stock, would likely cause us to incur interest expenses and could involve restrictive covenants relating to our capital raising activities and other financial and operational matters, which may increase our expenses, make it more difficult for us to obtain additional capital and to pursue business opportunities, including potential acquisitions. We may also be required to secure any such debt obligations with some or all of our assets. In addition, we may not be able to obtain additional financing on terms favorable to us, if at all. It is also possible that we may allocate significant amounts of capital toward solutions or technologies for which market demand is lower than anticipated and, as a result, abandon such efforts. If we are unable to obtain adequate financing or financing on terms satisfactory to us when we require it, or if we expend capital on projects that are not successful, our ability to continue to support our business growth and to respond to business challenges could be significantly limited, or we may be required to reduce the scale of our operations. Any of these negative developments could have a material adverse effect on our business, operating results, liquidity, financial condition and common stock price.
If we lose members of our senior management or development team or are unable to recruit and retain key employees on a cost-effective basis, we may not be able to successfully grow our business.
Our success is substantially dependent upon the performance of our senior management and other key technical and development personnel. The loss of the services of one or more of these members of our team may significantly delay or prevent our development of successful solutions and the achievement of our business objectives. Our future success will also depend on our ability to attract, retain and motivate skilled personnel in the United States and internationally. Experienced management and technical, sales, marketing and support personnel in the telecom industry are in high demand, and competition for their talents is intense. We may not be successful in attracting and retaining such personnel on a timely basis, on competitive terms, or at all. The loss of, or the inability to recruit and retain, such employees could have a material adverse effect on our business.
We have experienced rapid growth in recent periods. If we fail to manage our growth effectively and develop and implement appropriate control systems, our business and financial performance may suffer.
We have substantially expanded our overall business, number of customers, headcount and operations in recent periods. Our expansion and continued growth has placed, and will continue to place, a significant strain on our managerial, administrative, operational, financial and other resources. Our business model reflects our operation with limited infrastructure, support and administrative headcount, so risks related to managing our growth are particularly salient and we may not have sufficient internal resources to adapt or respond to unexpected challenges. Although we have put certain policies and procedures in place, certain of these policies have recently been adopted or recently changed. We also continue to improve and expand our policies and implement procedures but we have limited staff responsible for their implementation, training and enforcement. If we are unable to manage our growth successfully, or if our control systems do not operate effectively, our ability to provide high quality solutions and services could be harmed, which would damage our reputation and brand, and our business and operating results would suffer.
Unfavorable general economic conditions in countries where we operate could negatively impact our financial performance.
Unfavorable general economic conditions, such as a recession or economic slowdown in one or more of the countries in which we operate, could negatively affect consumer demand for our products, the ability of mobile service providers to seek our services and to pay for our services or obtain financing, if needed.
Consumer purchases of discretionary items tend to decline during recessionary periods or hard economic times when disposable income is lower. Consumers may shift away from high priced phone and data services and opt for lower-priced product offerings such that mobile service providers may be less apt to undertake the purchase of our products and/or delay the purchase or spread the purchase of such product solutions out over time. In addition, the disruption in the credit markets could impact our ability to manage normal commercial relationships with our customers, supplies and creditors in such countries. If
23
the current economic situation deteriorates significantly in the countries in which we operate, our business could be negatively impacted due to consumer preferences, supplier or customer disruptions resulting from tighter credit markets or other economic factors.
If we undertake business combinations and acquisitions, they may be difficult to close or integrate, or they could disrupt our business, dilute stockholder value or divert management’s attention.
We have completed a few business acquisitions to date. The primary purpose of the acquisitions were to gain access to additional customers, and expand on our infrastructure and our strategic product portfolio while gaining some skilled resources. In the future, we may continue to support our growth through acquisitions of businesses, services or technologies that we perceive to be complementary or otherwise beneficial to us. Current and/or future acquisitions have and may involve risks, such as:
• | misjudgment with respect to the value, return on investment or strategic fit of any acquired operations or assets; |
• | challenges associated with integrating acquired technologies, operations, financial reporting systems and cultures of acquired companies; |
• | exposure to unforeseen liabilities; |
• | diversion of management and personnel and other resources from day-to-day operations and longer than expected integration schedules; |
• | possible loss of key employees, clients, suppliers and partners; |
• | higher than expected transaction costs; |
• | potential loss of commercial relationships and customers based on their concerns regarding the acquired business or technologies; and |
• | additional dilution to our existing stockholders if we use our common stock as consideration for such acquisitions. |
As a result of these risks, we may not be able to achieve the expected benefits of any acquisition. If we are unsuccessful in completing or integrating acquisitions, we may be required to reevaluate our growth strategy and we may incur substantial expenses and devote significant management time and resources in seeking to complete and integrate the acquisitions.
Future business combinations could involve the acquisition of significant intangible assets. We may need to record write-downs from future impairments of identified intangible assets and goodwill. These accounting charges would reduce any future reported earnings or increase a reported loss. In addition, we could use substantial portions of our available cash to acquire companies or assets. Subject to the provisions of our existing indebtedness, it is possible that we could incur additional debt or issue additional equity securities as consideration for these acquisitions, which could cause our stockholders to suffer significant dilution.
We have and continue to experience material weaknesses and significant deficiencies in our internal controls over financial reporting and we may experience additional material weaknesses or significant deficiencies in the future or otherwise fail to maintain an effective system of internal controls in the future, and may not be able to accurately report our financial condition or results of operations, which may adversely affect investor confidence in us and, as a result, the value of our common stock.
As a result of becoming a public company, we are required, under Section 404 of the Sarbanes-Oxley Act, to furnish a report by management on, among other things, the effectiveness of our internal controls over financial reporting beginning with our Annual Report on Form 10-K for the year ended December 31, 2014. This assessment includes disclosure of any material weaknesses identified by our management in our internal controls over financial reporting. A material weakness is a deficiency or combination of deficiencies in internal controls over financial reporting, such that there is a reasonable possibility that a material misstatement of a company’s annual and interim financial statements will not be detected or prevented on a timely basis.
Any material weakness could result in a misstatement of our accounts or disclosures that would result in a material misstatement of our annual or interim combined financial statements that would not be prevented or detected on a timely basis. We cannot assure you that the measures we have taken to date, or any measures we may take in the future, will be sufficient to remediate the material weaknesses described above or avoid potential future material weaknesses.
24
We continue to enhance our computer systems processes and related documentation necessary to perform the evaluation needed to comply with Section 404 of the Sarbanes-Oxley Act. We may not be able to complete our evaluation, testing and any required remediation in a timely fashion. During the evaluation and testing process, if we identify one or more material weaknesses in our internal controls over financial reporting, we will be unable to assert that our internal controls over financial reporting are effective. If we are unable to conclude that our internal controls over financial reporting are effective, we could lose investor confidence in the accuracy and completeness of our financial reports, which would likely cause the price of our common stock to decline.
After we cease to be an emerging growth company under the federal securities laws, our independent registered public accounting firm will be required to express an opinion on the effectiveness of our internal controls over financial reporting. Until that time, it is possible that a material weakness in internal controls over financial reporting could remain undetected as a result of our exemption from these auditor attestation requirements under the Jumpstart Our Business Startups Act of 2012, or the JOBS Act. If we are unable to confirm that our internal controls over financial reporting are effective, or if our independent registered public accounting firm is unable to express an opinion on the effectiveness of our internal controls over financial reporting, we could lose investor confidence in the accuracy and completeness of our financial reports, which would cause the price of our common stock to decline.
We have incurred and will continue to incur significant additional costs as a result of being a public company and our management is required to devote significant time and attention to compliance matters.
We incur costs associated with corporate governance requirements, including requirements under the Sarbanes-Oxley Act, as well as rules implemented by the Dodd-Frank Wall Street Reform and Consumer Protection Act, the SEC and the national stock exchanges. These rules and regulations have increased our accounting, legal and financial compliance costs, and make some activities more time-consuming and costly. We expect those costs to increase in the future. For example, we are required to devote significant resources to complete the assessment and documentation of our internal control system and financial process under Section 404 of the Sarbanes-Oxley Act, including an assessment of the design, implementation and operating effectiveness of our information systems associated with our internal controls over financial reporting. We will continue to incur significant costs to remediate any material weaknesses we identify through these efforts. We also expect these rules and regulations to make it more expensive for us to maintain directors’ and officers’ liability insurance and we may be required to accept reduced policy limits and coverage or incur substantially higher costs to obtain the same or similar coverage. As a result, it may be more difficult for us to attract and retain qualified persons to serve on our Board of Directors, our board committees or as executive officers. We cannot predict or estimate the amount of additional costs we may incur or the timing of such costs.
New laws and regulations, as well as changes to existing laws and regulations affecting public companies, including the provisions of the Sarbanes-Oxley Act, the Dodd-Frank Wall Street Reform and Consumer Protection Act and rules adopted by the SEC and the national stock exchanges, would likely result in increased costs to us as we respond to their requirements, which may adversely affect our operating results and financial condition.
Changes in effective income tax rates or adverse outcomes resulting from examinations of our tax returns could adversely affect our operating results and financial condition.
Our future effective tax rates could be subject to volatility or adversely affected by a number of factors, including:
• | any earnings being lower than anticipated in countries where we have lower statutory tax rates and higher than anticipated in countries where we have higher statutory tax rates; |
• | changes in the valuation of our deferred tax assets and liabilities; |
• | expiration of, or lapses in, the research and development tax credit laws; |
• | expiration or non-utilization of net operating losses; |
• | foreign withholding taxes for which no benefit is realizable; |
• | tax effects of stock-based compensation; |
• | costs related to intercompany restructurings; |
• | changes in transfer pricing studies; or |
• | changes in tax laws, regulations, accounting principles or interpretations thereof. |
25
In addition, in the ordinary course of business we are subject to routine examinations of our income tax returns by federal, state and non-U.S. tax authorities regarding the amount of taxes due. An unfavorable outcome from one of these examinations may result in additional tax liabilities or other adjustments to our historical results.
Despite our intentions not to, at some point we may determine that it is advisable from time to time to repatriate earnings from non-U.S. subsidiaries under circumstances that could give rise to the imposition of potentially significant withholding taxes by the jurisdictions in which such amounts were earned and substantial tax liabilities in the United States. In addition, we may not receive the benefit of any offsetting tax credits, which also could adversely impact our effective tax rate.
Although we believe our tax estimates are reasonable, our ultimate tax liabilities may materially differ from the tax amounts recorded in our consolidated financial statements and may materially affect our income tax provision, net income or cash flows in the period or periods for which such determination is made.
Our ability to use our net operating loss carryforwards and certain other tax attributes may be limited.
As of December 31, 2014, we had U.S. federal net operating loss carryforwards of $115.0 million and total foreign net operating loss carryforwards $18.3 million. Under Sections 382 and 383 of Internal Revenue Code of 1986, as amended, or the Code, if a corporation undergoes an “ownership change,” the corporation’s ability to use its pre-change net operating loss carryforwards and other pre-change tax attributes, such as research tax credits, to offset its post-change income and taxes may be limited. In general, an “ownership change” occurs if there is a cumulative change in our ownership by “5% shareholders” that exceeds 50 percentage points over a rolling three-year period. Similar rules may apply under state tax laws. In the event that it is determined that we have in the past experienced an ownership change, or if we experience one or more ownership changes as a result of our initial public offering or future transactions in our stock, then we may be limited in our ability to use our net operating loss carryforwards and other tax assets to reduce taxes owed on the net taxable income that we earn. Any such limitations on the ability to use our net operating loss carryforwards and other tax assets could adversely impact our business, financial condition and operating results.
Public scrutiny of data privacy issues, worldwide or in particular countries or markets, may result in increased regulation and different industry standards, which could require us to incur significant expenses in order to comply or support compliance with such regulations or deter or prevent us from providing our solutions or services to our mobile service provider customers, thereby harming our business.
As part of our business, we supply and support telecommunications equipment as part of mobile service provider networks that collect and store personal information. We expect that collection and storage of personal information to increase, primarily in connection with increased use of mobile data access. The regulatory framework for privacy issues worldwide is currently uncertain and is likely to remain so for the foreseeable future. We or our mobile service provider customers may also face additional privacy issues as we or they expand in international markets, as many nations have privacy protections more stringent than those in the United States. For example, the European Union is in the process of proposing reforms to its existing data protection legal framework, which may result in a greater compliance burden for mobile service providers with subscribers in Europe. Various government and consumer agencies have also called for new regulation and changes in industry practices.
We have incurred, and will continue to incur, expenses to comply with privacy and security standards and protocols imposed by law, regulation, industry standards or contractual obligations. Increased domestic or international regulation of data utilization and distribution practices, including self-regulation, could require us to modify our operations and incur significant expense, which could have an adverse effect on our business, financial condition and results of operations. Our business, including our ability to operate and expand internationally, could be adversely affected if legislation or regulations are adopted, interpreted or implemented in a manner that is inconsistent with our current or planned business practices and that require changes to these practices, the design of our solutions or our customers’ or our privacy policies.
Compliance with worker health and safety laws and environmental laws could be costly, and noncompliance with these laws could cause us to be subject to material fines and result in substantial additional expenses.
Our hardware suppliers manufacture the standard servers and other hardware necessary to operate our solutions using substances regulated under various federal, state, local and international laws and regulations governing worker health and safety and the environment. If we and our contract manufacturers do not comply with these laws and regulations, we may suffer a loss of revenues, be unable to sell our solutions in certain markets and/or countries, be subject to penalties and enforced fees and/or suffer a competitive disadvantage. Costs to comply with current laws and regulations and/or similar future laws and regulations, if applicable, could include costs associated with modifying our solutions, recycling and other waste processing costs, legal and regulatory costs and insurance costs. We have recorded and may also be required to record additional expenses
26
for costs associated with compliance with these regulations. We cannot assure you that the costs to comply with these new laws, or with current and future worker health and safety laws and environmental laws will not have a material adverse effect on our business, operating results and financial condition.
Our business is subject to complex and evolving U.S. and foreign laws and regulations. These laws and regulations are subject to change and uncertain interpretation, and could result in claims, changes to our business practices, monetary penalties, increased cost of operations or declines in the growth of our business, or otherwise harm our business.
We are subject to a variety of laws and regulations in the United States and abroad that involve matters central to our business, including privacy, rights of publicity, data protection, content regulation, intellectual property, competition and taxation. Many of these laws and regulations are still evolving and being tested in courts and could be interpreted or applied in ways that could harm our business, particularly in the new and rapidly evolving industry in which we operate. In addition, foreign data protection, privacy, consumer protection, content regulation and other laws and regulations are often more restrictive than those in the United States. In particular, the European Union and its member states traditionally have taken broader views as to types of data that are subject to privacy and data protection, and have imposed greater legal obligations on companies in this regard. A number of proposals are pending before federal, state and foreign legislative and regulatory bodies that could significantly disrupt or affect our business. Further, it is difficult to predict how existing laws and regulations will be applied to our business and the new laws and regulations to which we may become subject, and it is possible that they may be interpreted and applied in a manner that is inconsistent with our current operating practices. These existing and proposed laws and regulations can be costly to comply with and can delay or impede the development of new products and services, significantly increase our operating costs, require significant time and attention of management and technical personnel and subject us to inquiries or investigations, claims or other remedies, including fines or demands that we modify or cease existing business practices.
Risks Related to Our Intellectual Property and Our Technology
Infringement claims are common in our industry and third parties, including competitors, have and could in the future assert infringement claims against us or our customers that we are obligated to indemnify.
The communications industry is highly competitive and its technologies are complex. Companies file patent applications and obtain patents covering these technologies frequently and maintain programs to protect their intellectual property portfolios. In addition, patent holding companies regularly bring claims against communications companies. These patent holding companies and some communications companies actively search for, and routinely bring claims against, alleged infringers. For example, we were previously a defendant, along with a number of other communications companies, in a suit brought by a non-operating patent holding company alleging that each of the defendants had infringed upon one of its patents, which suit has been settled with respect to Mavenir.
Our solutions are technically complex and compete with the products and solutions of significantly larger companies. The likelihood of our being subject to infringement claims may increase as a result of our real or perceived success in selling solutions to mobile service providers, as the number of competitors in our industry grows and as we add functionality to our solutions. We may in the future receive communications from third parties alleging that we may be infringing their intellectual property rights. The visibility we receive from being a public company may result in a greater number of such allegations.
We have also agreed, and expect to continue to agree, to indemnify our customers for certain expenses or liabilities resulting from claimed infringement of intellectual property rights of third parties with respect to our solutions and software. As a result, in the case of infringement claims against these customers, we could be required to indemnify them for losses resulting from such claims or to refund license fees they have paid to us. If a customer asserts a claim for indemnification against us, we could incur significant costs and reputational harm disputing it. If we do not succeed in disputing it, we could face substantial liability.
Regardless of the merit of third-party claims that we or our customers infringe their rights, these claims could:
• | be time-consuming and costly to defend; |
• | divert our management’s attention and resources; |
• | require us to redesign our solutions, which may not be feasible or cost-effective; |
• | cause us to cease producing, licensing or using software or solutions that incorporate challenged intellectual property; |
• | damage our reputation and cause customer reluctance to license our solutions; or |
27
• | require us to pay amounts for past infringement, potentially including treble damages, or enter into royalty or licensing agreements to obtain the right to use a necessary product or component, which may not be available on terms acceptable to us, or at all. |
It is possible that other companies hold patents covering technologies similar to one or more of the technologies that we incorporate into our solutions. In addition, new patents may be issued covering these technologies. Unless and until the U.S. Patent and Trademark Office issues a patent to an applicant, there is no reliable way to assess the scope of the potential patent. We may face claims of infringement from both holders of issued patents and, depending upon the timing, scope and content of patents that have not yet been issued, patents issued in the future. The application of patent law to the software technologies in the communications industry is particularly uncertain because the time that it takes for a software-related patent to issue is lengthy, which increases the likelihood of pending patent applications claiming inventions that may pre-date development of our own proprietary software. This uncertainty, coupled with litigation or the potential threat of litigation related to our intellectual property, could adversely affect our business, revenue, results of operations, financial condition and reputation.
Our patent applications may not result in issued patents, which may allow competitors to more easily exploit technology similar to ours.
Our business depends in part on our ability to maintain adequate protection of our intellectual property for our technologies and solutions and potential solutions in the United States and other countries. We have adopted a strategy of seeking patent protection in the United States and in other countries with respect to certain of the technologies used in or relating to our solutions and processes. As of December 31, 2014, we had a total of 11 patent applications pending in the United States, and 32 pending non-U.S. patent applications, many of which are counterparts to our U.S. patents or patent applications. These patent applications are directed to aspects of our technology and/or to our methods and solutions that support our business. However, the issuance and enforcement of patents involve complex legal and factual questions. Accordingly, we cannot be certain that the patent applications that we file will result in patents being issued, or that our patents and any patents that may be issued to us will cover our technology or the methods or products that support our business, or afford protection against competitors with similar technology. Moreover, the issuance of a patent is not conclusive as to its validity, scope or enforceability, and competitors or other third parties might successfully challenge the validity, scope or enforceability of any issued patents should we try to enforce them. In addition, patent applications filed in other countries are subject to laws, rules and procedures that differ from those of the United States, and thus we cannot be certain that non-U.S. patent applications will be granted even if corresponding U.S. patents are issued.
If we are unable to protect our intellectual property rights, our competitive position could be harmed or we could be required to incur significant expenses to enforce our rights.
Our success depends to a significant degree upon the protection of our software and other proprietary technology rights, particularly our 4G LTE solutions. In addition to patents, we rely on trade secret, copyright and trademark laws and confidentiality agreements with employees and third parties, all of which offer only limited protection. Our confidentiality agreements may not effectively prevent disclosure of our confidential information or provide an adequate remedy in the event of unauthorized disclosure. Others may independently discover our trade secrets and proprietary information, in which case we could not assert any trade secret rights against such parties. Furthermore, the steps we have taken to protect our intellectual property may not prevent misappropriation of our proprietary rights, the reverse engineering of our solutions or other circumvention, invalidation or challenge of our intellectual property.
Additionally, patent and other intellectual property protection outside the United States is generally not as comprehensive as in the United States and may not protect our intellectual property in some countries where our solutions are sold or may be sold in the future. Even if patents are granted outside the United States, effective enforcement in those countries may not be available. Many companies have encountered substantial intellectual property infringement in countries where we sell, or intend to sell, our solutions. Consequently, we may be unable to prevent our proprietary technology from being exploited abroad.
Policing the unauthorized use of our solutions, trademarks and other proprietary rights is expensive, difficult and, in some cases, impossible. Litigation may be necessary in the future to enforce or defend our intellectual property rights, to protect our trade secrets or to determine the validity and scope of the proprietary rights of others. Such litigation could result in substantial costs and diversion of management resources, either of which could harm our business. Moreover, such litigation could provoke our opponents to assert counterclaims that we infringe their own intellectual property. Accordingly, despite our efforts, we may not be able to prevent third parties from infringing upon or misappropriating our intellectual property.
28
Our patent applications may not result in issued patents, which may allow competitors to more easily exploit technology similar to ours.
Our business depends in part on our ability to maintain adequate protection of our intellectual property for our technologies and solutions and potential solutions in the United States and other countries. We have adopted a strategy of seeking patent protection in the United States and in other countries with respect to certain of the technologies used in or relating to our solutions and processes. As of December 31, 2014, we had a total of 11 patent applications pending in the United States, and 32 pending non-U.S. patent applications, many of which are counterparts to our U.S. patents or patent applications. These patent applications are directed to aspects of our technology and/or to our methods and solutions that support our business. However, the issuance and enforcement of patents involve complex legal and factual questions. Accordingly, we cannot be certain that the patent applications that we file will result in patents being issued, or that our patents and any patents that may be issued to us will cover our technology or the methods or products that support our business, or afford protection against competitors with similar technology. Moreover, the issuance of a patent is not conclusive as to its validity, scope or enforceability, and competitors or other third parties might successfully challenge the validity, scope or enforceability of any issued patents should we try to enforce them. In addition, patent applications filed in other countries are subject to laws, rules and procedures that differ from those of the United States, and thus we cannot be certain that non-U.S. patent applications will be granted even if corresponding U.S. patents are issued.
If new industry standards emerge or if we are unable to respond to rapid technological advances in a timely manner, mobile service providers may not buy our solutions and our revenue may decline.
The market for telecommunications products and solutions is characterized by rapid technological advances, frequent introductions of new products, evolving industry standards and recurring or unanticipated changes in customer requirements. To succeed, we must effectively anticipate, and adapt in a timely manner to, customer requirements and continue to develop or acquire new solutions and features that meet market demands, technology and architectural trends and new industry standards. This requires us to identify and gain access to or develop new technologies. The introduction of new or enhanced solutions also requires that we carefully manage the transition from older products to minimize disruption in customer ordering practices and ensure that new solutions can be timely delivered to meet demand.
Developing our solutions is expensive, complex and involves uncertainties and requires significant research and development expenditures. We may not have sufficient resources to successfully manage lengthy development cycles. We believe we must continue to dedicate a significant amount of resources to our research and development efforts to remain competitive. These investments may take several years to generate positive returns or they may never do so. In addition, we may experience design, manufacturing, marketing and other difficulties that could delay or prevent the development, introduction or marketing of new solutions and enhancements. If we fail to meet our development targets, demand for our solutions will decline. Even if we introduce new solutions and enhancements, we may experience a decline in demand for, or revenue from, our existing solutions that is not fully matched by the revenue from new solutions. For example, customers may delay making purchases of a new solution to make a more thorough evaluation of such solution, or until industry reviews become widely available. In addition, we may lose existing customers who choose a competitor’s solution rather than migrate to our new solution. This could result in a temporary or permanent revenue shortfall and harm our business.
Furthermore, because our solutions are based on complex technology, we can experience unanticipated delays in developing, improving or deploying them. Each phase in the development of our solutions presents serious risks of failure, rework or delay, any one of which could impact the timing and cost effective development of such solution and could jeopardize customer acceptance of the solution. Intensive software testing and validation are critical to the timely introduction of enhancements to several of our solutions and schedule delays sometimes occur in the final validation phase. Unexpected intellectual property disputes, failure of critical design elements and a variety of other execution risks may also delay or even prevent the introduction of these solutions. In addition, the introduction of new solutions by competitors, the emergence of new industry standards or the development of entirely new technologies to replace existing product offerings could render our existing or future solutions obsolete. If our solutions become technologically obsolete, mobile service providers may purchase solutions from our competitors and we may be unable to sell our solutions in the marketplace and generate revenue, which would have a material adverse effect on our financial condition, results of operations or cash flows.
We may not be able to detect errors or defects in our solutions until after full deployment and product liability claims by customers could result in substantial costs.
Our solutions are sophisticated and are designed to be deployed in large and complex telecommunications networks that require a very high degree of reliability. Because of the nature of our solutions, they can only be fully tested when substantially deployed in very large networks with high volumes of telecommunications traffic. Some of our mobile service provider
29
customers have only recently begun to commercially deploy our solutions and they may discover errors or defects in the software, or the solutions may not operate as expected. Because we may not be able to detect these problems until full deployment, any errors or defects in our solutions could affect the functionality of the networks in which they are deployed, given the use of our solutions in business-critical applications. As a result, the time it may take us to rectify errors can be critical to our mobile service provider customers. Because of the complexity of our solutions, it may take a material amount of time and resources for us to resolve errors or defects, if we can resolve them at all. The likelihood of such errors or defects is heightened as we acquire new products and solutions from third parties, whether as a result of acquisitions or otherwise.
Because our mobile service provider customers’ telecommunications networks into which they deploy our solutions require a very high degree of reliability, the consequences of an adverse effect on their networks, including any type of communications outage, can be very significant and costly. If any network problems were caused, or perceived to be caused, by errors or defects in our solutions, our reputation and the reputation of our solutions could be significantly damaged with respect to that customer and other customers. Such problems could lead to a loss of that customer or other customers.
If one of our solutions fails, we could also experience:
• | payment of liquidated damages for performance failures; |
• | loss of, or delay in, revenue recognition; |
• | increased service, support, warranty, product replacement and product liability insurance costs, as well as a diversion of development resources; and |
• | costly and time-consuming legal actions by our customers, which could result in significant damages awards against us. |
Any of the above events would likely have a material adverse impact on our business, revenue, results of operations, financial condition and reputation.
We currently use a limited number of standard hardware suppliers, and in the event any such supplier ceases to supply us timely, qualifying a replacement hardware supplier could require thirty to sixty days, during which time there could be some delay in our scheduled delivery to one or more of our mobile service provider customers, potentially damaging that customer relationship.
We currently use a limited number of suppliers for the standard servers and other standard hardware necessary to operate our solutions and to fulfill our customers’ orders on a timely basis. Although we have not experienced any significant supplier delays in the past, purchasing from third-party hardware suppliers exposes us to a limited risk of short-term unavailability of adequate supply because we do not have hardware manufacturing capabilities. In the event any such supplier ceases to supply us timely, qualifying a replacement hardware supplier could require thirty to sixty days, during which time there could be some delay in our scheduled delivery to one or more of our customers, potentially damaging that customer relationship and resulting in payment of liquidated damages or incurrence of service credits which would have a material adverse impact on our business, revenue, results of operations, financial condition and reputation.
Man-made problems such as computer viruses or terrorism may disrupt our operations and could adversely affect our operating results and financial condition.
Despite our implementation of network security measures, our servers are vulnerable to computer viruses, break-ins and similar disruptions from unauthorized tampering with our computer systems. Any such event could have a material adverse effect on our business, operating results and financial condition. Efforts to limit the ability of third parties to disrupt the operations of the Internet or undermine our own security efforts may be ineffective. In addition, the continued threat of terrorism and heightened security and military action in response to this threat, or any future acts of terrorism, may cause further disruptions to the economies of the United States and other countries and create further uncertainties or otherwise materially harm our business, operating results, and financial condition. Likewise, events such as widespread electrical blackouts could have similar negative impacts. To the extent that such disruptions or uncertainties result in delays or cancellations of customer orders or the development or shipment of our solutions, our business, operating results, financial condition and reputation could be materially and adversely affected.
30
We may not be able to obtain necessary licenses of third-party technology on acceptable terms, or at all, which could delay sales and development and adversely impact the quality of our solutions.
We have incorporated third-party licensed technology into our current solutions. We anticipate that we are also likely to need to license additional technology from third parties to develop new solutions or enhancements in the future. Third-party licenses may not be available or continue to be available to us on commercially reasonable terms or at all. The inability to retain any third-party licenses required in our current solutions or to obtain any new third-party licenses to develop new solutions and enhancements could require us to obtain substitute technology of lower quality or performance standards or at greater cost, and delay or prevent us from making these solutions or enhancements, any of which could seriously harm the competitive position of our solutions.
We use some open source software in developing our solutions, which could in certain circumstances subject us to claims or judgments that some of our proprietary code is subject to general release or could require us to re-engineer our solutions and the firmware contained therein, which could materially harm our business and operating results.
We use open source software in developing our solutions, including in connection with our proprietary software, and we may use more open source software in the future. From time to time, there have been claims against companies that use open source software in their products challenging the ownership of such open source software or the terms and conditions upon which those companies make such products available to end users. As a result, we could be subject to suits by parties claiming ownership of what we believe to be open source software or claiming that we have failed to comply with applicable licensing terms. Some open source licenses contain requirements that the licensee make available source code for modifications or derivative works created based upon the open source software and that the licensee license such modifications or derivative works under the terms of a particular open source license or other license granting third parties certain rights of further use. If we combine our proprietary firmware or other software with open source software in a certain manner, we could, under certain of the open source licenses, be required to release our proprietary source code publicly or license such source code on unfavorable terms or at no cost. Although we take steps to protect against our using any open source software that may subject our firmware to general release or require us to re-engineer our solutions and the firmware contained therein, we cannot guarantee that they will be effective, nor that we will not be subject to claims asserting or judgments holding that some of our proprietary source code is subject to general release or that we are required to re-engineer our solutions and firmware. In addition to risks related to license requirements, usage of open source software can lead to greater risks than use of third-party commercial software, as open source licensors generally do not provide warranties or controls on origin of the software. Open source license terms relating to the disclosure of source code in modifications or derivative works to the open source software are often ambiguous, and few if any courts in jurisdictions applicable to us have interpreted such terms. As a result, many of the risks associated with usage of open source software cannot be eliminated, and could, if not properly addressed, negatively affect our business.
Risks Related to Our International Operations
We are exposed to risks related to our international operations and failure to manage these risks may adversely affect our operating results and financial condition.
We market, license and service our solutions globally and have a number of offices around the world. During the year ended December 31, 2014, 51% of our revenue was attributable to our customers outside of the United States, respectively. As of December 31, 2014, approximately 80% of our employees were located outside of the United States. We expect that our international activities will be dynamic over the foreseeable future as we continue to pursue opportunities in international markets. Therefore, we are subject to risks associated with having worldwide operations. These international operations will require significant management attention and financial resources.
International operations are subject to inherent risks and our future results could be adversely affected by a number of factors, including:
• | requirements or preferences for domestic products or solutions, which could reduce demand for our solutions; |
• | differing technical standards, existing or future regulatory and certification requirements and required features and functionality; |
• | management communication and integration problems related to entering new markets with different languages, cultures and political systems; |
• | greater difficulty in collecting accounts receivable and longer collection periods; |
31
• | difficulties in enforcing contracts; |
• | difficulties and costs of staffing and managing operations outside of the United States; |
• | the uncertainty of protection for intellectual property rights in some countries; |
• | the uncertainty and costs of compliance with differing foreign laws and regulations; |
• | potentially adverse tax consequences, including regulatory requirements regarding our ability to repatriate profits to the United States; |
• | tariffs and trade barriers, export regulations and other regulatory and contractual limitations on our ability to sell our solutions in certain non-U.S. markets; |
• | enforceability of contractual terms due to differing laws and regulations; and |
• | political and economic instability and terrorism. |
Additionally, our international operations expose us to risks of fluctuations in foreign currency exchange rates. In certain circumstances and depending on the currencies in which certain sales are denominated and the countries in which we are profitable or not profitable, a significant decrease or increase in the value of the U.S. dollar relative to the value of other local currencies could have a material adverse effect on the gross margins and profitability of our international operations. To date, we have not used risk management techniques to hedge the risks associated with these fluctuations. Even if we were to implement hedging strategies, not every exposure can be hedged and, where hedges are put in place based on expected foreign currency exchange exposure, they are based on forecasts that may vary or that may later prove to have been inaccurate. As a result, fluctuations in foreign currency exchange rates or our failure to successfully hedge against these fluctuations could have a material adverse effect on our operating results and financial condition.
Failure to comply with the United States Foreign Corrupt Practices Act, or FCPA, and similar laws associated with our activities outside the United States could subject us to penalties and other adverse consequences.
As a substantial portion of our revenues is, and we expect will continue to be, from jurisdictions outside of the United States, we face significant risks if we fail to comply with the FCPA and other laws that prohibit improper payments or offers of payment to governments and their officials and political parties by us and other business entities for the purpose of obtaining or retaining business. In many countries, particularly in countries with developing economies, some of which represent significant markets for us, it may be a local custom that businesses operating in such countries engage in business practices that are prohibited by the FCPA or other laws and regulations. Although we have implemented a company policy requiring our employees and consultants to comply with the FCPA and similar laws, such policy may not be effective at preventing all potential FCPA or other violations. We also cannot guarantee the compliance by our channel partners, resellers, suppliers and agents with applicable U.S. laws, including the FCPA, or applicable non-U.S. laws. Therefore there can be no assurance that none of our employees and agents, or those companies to which we outsource certain of our business operations, will take actions in violation of our policies or of applicable laws, for which we may be ultimately held responsible. As a result of our focus on managing our growth, our development of infrastructure designed to identify FCPA matters and monitor compliance is at an early stage. Any violation of the FCPA and related policies could result in severe criminal or civil sanctions, which could have a material and adverse effect on our reputation, business, operating results and financial condition.
We may become subject to governmental export and import controls that could subject us to liability or impair our ability to compete in international markets.
Our solutions may become subject to United States export controls under which they would be permitted to be exported outside the United States only with the required level of export license, through an available export license exception or if designated EAR 99 (no license required), if certain of our solutions in the future contain certain levels of encryption technology. In addition, various countries regulate the import of certain encryption technology and have enacted laws that could limit our ability to distribute certain of our solutions or could limit our mobile service provider customers’ ability to implement these solutions in those countries. Changes in our solutions or changes in export and import regulations may create delays in the introduction of our solutions in non-U.S. markets, prevent our customers with international operations from deploying our solutions throughout their networks or, in some cases, prevent the export or import of our solutions to certain countries altogether. Any change in export or import laws and regulations, shifts in approach to the enforcement or scope of existing laws and regulations, or change in the countries, persons or technologies targeted by such regulations, could result in decreased use of our solutions by, or in our decreased ability to export or sell our solutions to, existing or potential customers with international operations. Any decreased use of our solutions or limitation on our ability to export or sell our solutions would likely adversely affect our business, operating results and financial condition.
32
Risks Related to Ownership of Our Common Stock
Our stock price may be volatile, and you may not be able to resell shares of our common stock at or above the price you paid.
Our stock price may be highly volatile and could be subject to wide fluctuations in response to various factors, some of which are beyond our control. These factors include those discussed in this “Risk Factors” section of this report and others such as:
• | a slowdown in the telecommunications industry or the general economy; |
• | actual or anticipated quarterly or annual variations in our results of operations or those of our competitors; |
• | actual or anticipated changes in our growth rate relative to our competitors; |
• | changes in earnings estimates or recommendations by securities analysts; |
• | fluctuations in the values of companies perceived by investors to be comparable to us; |
• | announcements by us or our competitors of new products or services, significant contracts, commercial relationships, capital commitments or acquisitions; |
• | competition from existing technologies and products or new technologies and products that may emerge; |
• | the entry into, modification or termination of customer contracts; |
• | developments with respect to intellectual property rights; |
• | sales, or the anticipation of sales, of our common stock by us, our insiders or our other stockholders, including upon the expiration of contractual lock-up agreements; |
• | our ability to develop and market new and enhanced solutions on a timely basis; |
• | our commencement of, or involvement in, litigation; |
• | additions or departures of key management or technical personnel; and |
• | changes in governmental regulations applicable to our solutions. |
In addition, in recent years, the stock markets generally, and the market for technology stocks in particular, have experienced extreme price and volume fluctuations that have often been unrelated or disproportionate to the operating performance of those companies. Broad market and industry factors may significantly affect the market price of our common stock, regardless of our actual operating performance. You may not realize any return on your investment in us and may lose some or all of your investment.
In addition, in the past, class action litigation has often been instituted against companies whose securities have experienced periods of volatility in market price. Securities litigation brought against us following volatility in our stock price, regardless of the merit or ultimate results of such litigation, could result in substantial costs, which would hurt our financial condition and operating results and divert management’s attention and resources from our business.
Securities analysts may not publish favorable research or reports about our business or may publish no information at all, which could cause our stock price or trading volume to decline.
The trading market for our common stock will be influenced to some extent by the research and reports that industry or financial analysts publish about us and our business. We do not control these analysts. As a newly public company, we may be slow to attract research coverage and the analysts who publish information about our common stock will have had relatively little experience with our company, which could affect their ability to accurately forecast our results and could make it more likely that we fail to meet their estimates. In the event we obtain securities or industry analyst coverage, if any of the analysts who cover us provide inaccurate or unfavorable research or issue an adverse opinion regarding our stock price, our stock price could decline. If one or more of these analysts cease coverage of our company or fail to regularly publish reports covering us, we could lose visibility in the market, which in turn could cause our stock price or trading volume to decline.
33
The concentration of our capital stock ownership with insiders will likely limit your ability to influence corporate matters.
Our executive officers, directors, current five percent or greater stockholders and affiliated entities together owned approximately 61% of our common stock at December 31, 2014. These stockholders may in some instances exercise their influence in ways that you do not believe are in your best interests as a stockholder. In particular, these stockholders, acting together, may be able to control our management and affairs and matters requiring stockholder approval, including the election of directors and approval of significant corporate transactions, such as mergers, consolidations or the sale of substantially all of our assets. Consequently, this concentration of ownership could limit your ability to influence corporate matters and may have the effect of delaying or preventing a change of control, including a merger, consolidation or other business combination involving us, or discouraging a potential acquirer from making a tender offer or otherwise attempting to obtain control, even if such a change of control would benefit our other stockholders. This significant concentration of share ownership may adversely affect the trading price for our common stock because some investors perceive disadvantages in owning stock in companies with concentrated equity ownership.
We are an emerging growth company and we cannot be certain if the reduced disclosure requirements applicable to emerging growth companies will make our common stock less attractive to investors.
We are an “emerging growth company,” as defined in the JOBS Act, and we may take advantage of certain exemptions and relief from various reporting requirements that are applicable to other public companies that are not emerging growth companies. In particular, while we are an emerging growth company (i) we will not be required to comply with the auditor attestation requirements of Section 404(b) of the Sarbanes-Oxley Act, (ii) we will be exempt from any rules that may be adopted by the Public Company Accounting Oversight Board requiring mandatory audit firm rotations or a supplement to the auditor’s report on financial statements, (iii) we will be subject to reduced disclosure obligations regarding executive compensation in our periodic reports and proxy statements, and (iv) we will not be required to hold nonbinding advisory votes on executive compensation or stockholder approval of any golden parachute payments not previously approved. We may remain an emerging growth company until as late as December 31, 2018 (the fiscal year-end following the fifth anniversary of the completion of our November 2013 initial public offering), though we may cease to be an emerging growth company earlier under certain circumstances, including (i) if the market value of our common stock that is held by nonaffiliates exceeds $700 million as of any June 30, in which case we would cease to be an emerging growth company as of the following December 31, (ii) if our gross revenues exceed $1 billion in any fiscal year, or (iii) if we issue, during any three-year period, more than $1 billion in non-convertible debt.
The exact implications of the JOBS Act are still subject to interpretation and guidance by the SEC and other regulatory agencies, and we cannot assure you that we will be able to take advantage of all of the benefits of the JOBS Act. In addition, investors may find our common stock less attractive if we rely on the exemptions and relief granted by the JOBS Act. If some investors find our common stock less attractive as a result, there may be a less active trading market for our common stock, our stock price may decline and/or become more volatile and we may face difficulties raising capital from the public equity markets in the future.
A significant portion of our total outstanding shares of common stock may be sold into the market in the near future. This could cause the market price of our common stock to drop significantly, even if our business is operating successfully.
Sales of a substantial number of shares of our common stock in the public market could occur at any time. These sales, or the perception in the market that the holders of a large number of shares of common stock intend to sell shares, could reduce the market price of our common stock. At December 31, 2014, entities affiliated with North Bridge Venture Partners, entities affiliated with Austin Ventures, entities affiliated with Alloy Ventures, entities affiliated with Wellington Capital Management LLP, entities affiliated with August Capital and Goldman Sachs Asset Management owned, collectively, approximately 61% of our outstanding common stock. If one or more of them were to sell a substantial portion of the shares they hold, it could cause our stock price to decline.
Holders of an aggregate of approximately 14 million shares of our common stock currently have rights, subject to some conditions, to require us to file registration statements covering their shares or to include their shares in registration statements that we may file for ourselves or other stockholders.
In addition, shares issued or issuable in connection with equity awards granted under our equity incentive plans as well as shares we may issue under our employee stock purchase plan will become eligible for sale in the public market to the extent permitted by any applicable vesting requirements, the lock-up agreements described above and Rules 144 and 701 under the Securities Act of 1933.
34
We do not anticipate paying any cash dividends in the foreseeable future, and accordingly, stockholders must rely on stock appreciation for any return on their investment.
We do not currently anticipate declaring any cash dividends to holders of our common stock in the foreseeable future. In addition, the terms of our loan and security agreement with Silicon Valley Bank currently restrict our ability to pay dividends. Consequently, investors must rely on sales of their common stock after price appreciation, which may never occur, as the only way to realize any future gains on their investment. Investors seeking cash dividends should not invest in our common stock.
Anti-takeover provisions contained in our certificate of incorporation and bylaws, as well as provisions of Delaware law, could impair a takeover attempt.
Our amended and restated certificate of incorporation and our amended and restated bylaws contain provisions that could delay or prevent a change in control of our company. These provisions could also make it more difficult for stockholders to elect directors and take other corporate actions. These provisions include:
• | providing for a classified Board of Directors with staggered, three-year terms; |
• | prohibiting cumulative voting in the election of directors; |
• | providing that our directors may be removed only for cause; |
• | authorizing the Board of Directors to issue, without stockholder approval, preferred stock with rights senior to those of our common stock; |
• | authorizing the Board of Directors to change the authorized number of directors and to fill board vacancies until the next annual meeting of the stockholders; |
• | requiring the approval of our Board of Directors or the holders of a supermajority of our outstanding shares of capital stock to amend our bylaws and certain provisions of our amended and restated certificate of incorporation; |
• | requiring stockholders that seek to present proposals before, or to nominate candidates for election of directors at, a meeting of stockholders to provide advance written notice of such proposals or nominations; |
• | prohibiting stockholder action by written consent; |
• | limiting the liability of, and providing indemnification to, our directors and officers; |
• | prohibiting our stockholders from calling a special stockholder meeting; |
• | requiring an advance notification procedure for stockholder nominations and proposals; and |
• | providing that the Court of Chancery of the State of Delaware will be the exclusive forum for any derivative action, actions asserting a breach of fiduciary duty and certain other actions against us or any directors or executive officers. |
As a Delaware corporation, we are subject to Section 203 of the Delaware General Corporation Law, which, subject to some exceptions, prohibits “business combinations” between a Delaware corporation and an “interested stockholder,” which is generally defined as a stockholder who becomes a beneficial owner of 15% or more of a Delaware corporation’s voting stock, for a three-year period following the date that the stockholder became an interested stockholder.
These and other provisions in our amended and restated certificate of incorporation and our amended and restated bylaws and under Delaware law could discourage potential takeover attempts, reduce the price that investors might be willing to pay in the future for shares of our common stock and result in the market price of our common stock being lower than it would be without these provisions.
Item 1B. | Unresolved Staff Comments |
None.
35
Item 2. | Properties |
Our principal offices occupy approximately 30,500 square feet of leased office space in Richardson, Texas. The lease term for our headquarters runs through April 2019, and we have a one-time option to terminate the lease early in February 2018.
We also maintain sales, development or technical assistance offices in the following cities: Reading, United Kingdom; Espoo, Finland; North Sydney, Australia; Kuala Lumpur, Malaysia; Singapore; Shanghai, China; Bangalore, India; Cologne, Germany; Zagreb, Croatia; Santa Clara, California and Mount Laurel, New Jersey.
We believe that our current facilities are suitable and adequate to meet our current needs. We intend to add new facilities or expand existing facilities as we add employees, and we believe that suitable additional or substitute space will be available as needed to accommodate any such expansion of our operations.
We incorporate by reference in response to this item the information set forth in Item 1 of this Annual Report.
Item 3. | Legal Proceedings |
From time to time, we, our customers and our competitors are subject to various litigation and claims arising in the ordinary course of business. The software and communications infrastructure industries are characterized by frequent litigation and claims, including claims regarding patent and other intellectual property rights, claims for damages or indemnification for alleged breach under commercial supply or service contracts and claims regarding alleged improper hiring practices. From time to time we may be involved in various legal proceedings or claims but we are not aware of any pending or threatened legal proceeding against us that could have a material adverse effect on our business, operating results or financial condition.
Item 4. | Mine Safety Disclosures |
Not applicable.
36
PART II
Item 5. | Market for Registrant’s Common Equity, Related Stockholder Matters and Issuer Purchases of Equity Securities |
Our common stock has been listed on the New York Stock Exchange (the NYSE) under the symbol “MVNR” since November 7, 2013. Prior to that date, there was no public trading market for our common stock. The following table sets forth for the periods indicated the high and low sales price per share of our common stock as reported on the NYSE for the periods indicated:
High | Low | ||||||
Year Ended December 31, 2014 | |||||||
Fourth Quarter | $ | 14.50 | $ | 9.36 | |||
Third Quarter | $ | 15.35 | $ | 10.35 | |||
Second Quarter | $ | 18.00 | $ | 11.87 | |||
First Quarter | $ | 18.78 | $ | 10.25 | |||
Year Ended December 31, 2013 | |||||||
Fourth Quarter (from November 7, 2013) | $ | 12.00 | $ | 8.50 | |||
On December 31, 2014, the last reported sale price of our common stock on the NYSE was $13.56 per share. As of December 31, 2014, we had 65 holders of record of our common stock. The actual number of stockholders is greater than this number of record holders, and includes stockholders who are beneficial owners, but whose shares are held in street name by brokers and other nominees. This number of holders of record also does not include stockholders whose shares may be held in trust by other entities.
We have not declared or paid any cash dividends on our capital stock. We currently intend to retain any future earnings to fund the development and expansion of our business, and therefore we do not anticipate paying cash dividends on our common stock in the foreseeable future. In addition, the terms of our loan and security agreement with Silicon Valley Bank currently restrict our ability to pay dividends.
Any future determination to pay dividends will be at the discretion of our Board of Directors and will depend on our results of operations, financial condition, capital requirements and other factors deemed relevant by our Board of Directors.
Shareholder Return Performance Graph(1)
The following graph shows a comparison from November 7, 2013 (the date our common stock began trading on the NYSE) through December 31, 2014 of cumulative total return on assumed investment of $100.00 in cash in our common stock, the NYSE Composite Index, and the NYSE ARCA Tech 100 Index. Such returns are based on historical results and are not intended to suggest future performance.
37
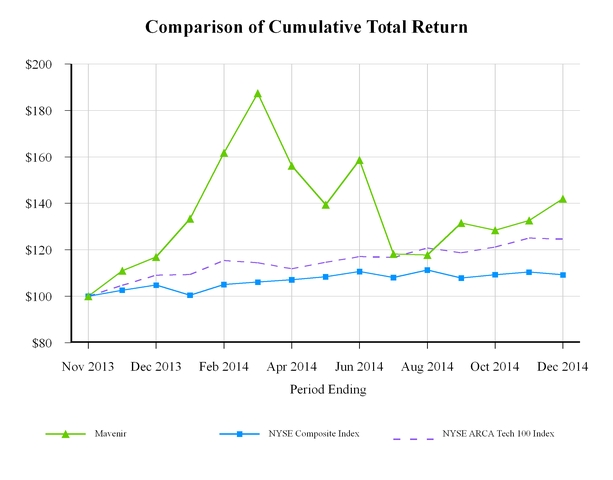
11/7/2013 | 12/31/2013 | 12/31/2014 | |||||||||
Mavenir Systems, Inc. | $ | 100.00 | $ | 116.86 | $ | 141.99 | |||||
NYSE Composite Index | $ | 100.00 | $ | 104.80 | $ | 109.22 | |||||
NYSE ARCA Tech 100 Index | $ | 100.00 | $ | 109.07 | $ | 124.58 | |||||
(1) | This performance graph shall not be deemed “soliciting material” or to be “filed” with the SEC for purposes of Section 18 of the Securities Exchange Act of 1934, as amended, or otherwise subject to the liabilities under that Section, and shall not be deemed incorporated by reference into any filing of Mavenir Systems, Inc. under the Securities Act of 1933, as amended or the Securities Exchange Act of 1934, as amended. |
Securities Authorized for Issuance under Equity Compensation Plans
The information concerning our equity compensation plans is incorporated by reference herein to the section of our Proxy Statement entitled “Equity Compensation Plan Information.”
Unregistered Sales of Equity Securities and Use of Proceeds
(a) Sales of Unregistered Securities
None.
(b) Use of Proceeds from Initial Public Offering
In November 2013, we closed our initial public offering (our IPO), in which we sold 5,320,292 shares of common stock and certain selling stockholders sold 129,708 shares of common stock at a price to the public of $10.00 per share, before underwriting discounts and commissions. In December 2013, the underwriters partially exercised their option to purchase additional shares and we issued and sold 145,339 additional shares at the same price to the public, before underwriting discounts and commissions. The aggregate offering price for shares sold in the offering, including the over-allotment option,
38
was approximately $54.7 million. The offer and sale of all of the shares in the IPO were registered under the Securities Act pursuant to a registration statement on Form S-1 (File No. 333-191563), which was declared effective by the SEC on November 5, 2013 and a registration statement on Form S-1 (File No. 333-192148), which became automatically effective on November 6, 2013 pursuant to Rule 462(b) under the Securities Act. The offering commenced as of November 6, 2013 and did not terminate before all of the securities registered under the registration statements were sold. Morgan Stanley, BofA, Merrill Lynch, Deutsche Bank Securities and Needham & Company acted as the underwriters.
We raised approximately $44.8 million in net proceeds after deducting underwriting discounts and commissions of approximately $3.8 million and other estimated offering expenses of approximately $6.1 million. We did not receive any proceeds from the sale of shares by the selling stockholders in the IPO. No payments were made by us to directors, officers or persons owning ten percent or more of our common stock or to their associates, or to our affiliates, other than payments in the ordinary course of business to officers for salaries.
On November 19, 2013, we repaid $10.0 million outstanding under our senior loan with SVB. On March 5, 2014, we repaid the full $15.0 million amount outstanding under our subordinated loan agreement with Silver Lake. In addition to the repayment to Silver Lake, we used the remaining $19.8 million of the proceeds from our IPO for working capital and other general purposes during the year ended December 31, 2014.
(c) Issuer Purchases of Equity Securities
None.
Item 6. | Selected Financial Data |
The following tables present our selected consolidated financial and operating data for the periods indicated. The summary consolidated statement of operations data for the years ended December 31, 2014, 2013 and 2012 and the summary consolidated balance sheet data as of December 31, 2014 and 2013 have been derived from our audited consolidated financial statements included elsewhere in this Annual Report on Form 10-K. The summary consolidated statement of operations data for the year ended December 31, 2011 and 2010 and the summary consolidated balance sheet data as of December 31, 2012, 2011, and 2010 have been derived from our audited consolidated financial statements, which are not included in this Annual Report on Form 10-K. Our historical results are not necessarily indicative of the results that may be expected in the future.
The summary financial information below should be read in conjunction with the information contained in “Management’s Discussion and Analysis of Financial Condition and Results of Operations,” the consolidated financial statements and notes thereto, and other financial information included elsewhere in this Annual Report on Form 10-K.
39
December 31, | |||||||||||||||||||
2014 (4) | 2013 | 2012 | 2011 (2) (3) | 2010 | |||||||||||||||
(as adjusted) | |||||||||||||||||||
(in thousands, except per share amounts) | |||||||||||||||||||
Consolidated Statement of Operations Data: | |||||||||||||||||||
Total revenue | $ | 129,795 | $ | 101,308 | $ | 73,840 | $ | 48,184 | $ | 8,251 | |||||||||
Cost of revenue | 58,849 | 45,173 | 30,459 | 30,784 | 5,103 | ||||||||||||||
Gross profit | 70,946 | 56,135 | 43,381 | 17,400 | 3,148 | ||||||||||||||
Total operating expenses | 88,018 | 63,843 | 57,944 | 37,905 | 13,324 | ||||||||||||||
Operating loss | (17,072 | ) | (7,708 | ) | (14,563 | ) | (20,505 | ) | (10,176 | ) | |||||||||
Net interest expense | 1,966 | 3,185 | 383 | 61 | 108 | ||||||||||||||
Loss on early extinguishment of debt | 1,783 | — | — | — | — | ||||||||||||||
Foreign exchange loss (gain) | 4,699 | 1,901 | (529 | ) | 1,182 | (21 | ) | ||||||||||||
Loss before income tax expense | (25,520 | ) | (12,794 | ) | (14,417 | ) | (21,748 | ) | (10,263 | ) | |||||||||
Income tax expense | 516 | 2,496 | 1,152 | 1,330 | 131 | ||||||||||||||
Net loss | $ | (26,036 | ) | $ | (15,290 | ) | $ | (15,569 | ) | $ | (23,078 | ) | $ | (10,394 | ) | ||||
Net loss per share attributable to common shareholders (basic and diluted) | $ | (1.00 | ) | $ | (3.57 | ) | $ | (12.09 | ) | $ | (19.96 | ) | $ | (9.42 | ) | ||||
Weighted average common shares outstanding (basic and diluted) | 25,988 | 4,278 | 1,288 | 1,156 | 1,104 | ||||||||||||||
As adjusted net loss per share (1) | $ | (1.00 | ) | $ | (0.82 | ) | $ | (0.88 | ) | $ | (1.31 | ) | $ | (0.80 | ) | ||||
As adjusted weighted-average shares outstanding used to compute net loss per share (1) | 25,988 | 18,537 | 17,740 | 17,608 | 13,001 | ||||||||||||||
(1) | As adjusted amounts give effect to the automatic conversion of all outstanding shares of our redeemable convertible preferred stock into 16,452,467 shares of our common stock at the beginning of all periods presented. |
(2) | On May 27, 2011, the Company acquired all of the outstanding capital stock of Airwide Solutions, Inc (“Airwide”). The results of operations and financial condition of Airwide are included from the acquisition date of May 27, 2011. |
(3) | Total revenue for the year ended December 31, 2011 has been decreased by $1.3 million, from the previously reported amount of $49.5 million, to recognize the fair value ascribed to performance-based warrants issued to a channel partner in 2008. These warrants were earned in 2011, upon achievement of the performance milestone, and exercised in April of 2014. As a result of this adjustment, accumulated deficit increased by $1.3 million, with an offsetting increase in additional-paid-in capital of $1.3 million, as of December 31, 2011, 2012 and 2013. |
(4) | On November 21, 2014, the Company acquired Stoke, Inc. ("Stoke"). The results of operations and financial condition of Stoke are included from the acquisition date of November 21, 2014. |
December 31, | |||||||||||||||||||
2014 | 2013 (1) | 2012 (1) | 2011 (1) | 2010 (1) | |||||||||||||||
(as adjusted) | |||||||||||||||||||
(in thousands) | |||||||||||||||||||
Consolidated Balance Sheet Data: | |||||||||||||||||||
Cash and cash equivalents | $ | 54,699 | $ | 38,930 | $ | 7,402 | $ | 19,466 | $ | 5,425 | |||||||||
Working capital | 72,798 | 58,179 | 16,281 | 18,781 | 5,812 | ||||||||||||||
Total assets | 139,521 | 106,599 | 60,481 | 60,387 | 16,797 | ||||||||||||||
Long-term debt, net of current portion | 21,797 | 23,423 | 14,700 | — | — | ||||||||||||||
Total liabilities | 72,798 | 62,568 | 48,718 | 34,131 | 9,682 | ||||||||||||||
Total liabilities and shareholders’ equity | 139,521 | 106,599 | 60,481 | 60,387 | 16,797 | ||||||||||||||
(1) | Total revenue for the year ended December 31, 2011 has been decreased by $1.3 million, from the previously reported amount of $49.5 million, to recognize the fair value ascribed to performance-based warrants issued to a channel partner in 2008. These warrants were earned in 2011, upon achievement of the performance milestone, and exercised in April of 2014. As a result of this adjustment, accumulated deficit increased by $1.3 million, with an offsetting increase in additional-paid-in capital of $1.3 million, as of December 31, 2011, 2012 and 2013. |
40
Item 7. | Management’s Discussion and Analysis of Financial Condition and Results of Operations |
The following discussion and analysis of our financial condition and results of operations should be read in conjunction with our consolidated financial statements and related notes included elsewhere in this Annual Report on Form 10-K. In addition to historical consolidated financial information, the following discussion contains forward-looking statements that reflect our plans, estimates, and beliefs. Our actual results could differ materially from those discussed in the forward-looking statements. Factors that could cause or contribute to these differences include those discussed below and elsewhere in this Annual Report on Form 10-K, particularly in “Risk Factors.” For more information, see “Special Note Regarding Forward-Looking Statements.”
Overview
We are a leading provider of software-based telecommunications networking solutions that enable mobile service providers to deliver internet protocol (IP)-based voice, video, rich communications and enhanced messaging services to their subscribers globally. Our solutions deliver Rich Communication Services (RCS), which enable enhanced mobile communications, such as group text messaging, multi-party voice or video calling and live video streaming as well as the exchange of files or images, over existing 2G and 3G networks and next generation 4G Long Term Evolution (LTE) networks. Our solutions also deliver voice services over LTE technology and wireless (Wi-Fi) networks, known respectively as Voice over LTE (VoLTE) and Voice over Wi-Fi (VoWi-Fi). We enable mobile service providers to offer services that generate increased revenue and improve subscriber satisfaction and retention, while allowing them to improve time-to-market of new services and reduce network costs. Our mOne® Convergence Platform has enabled MetroPCS (now part of T-Mobile), a leading mobile service provider, to introduce the industry’s first live network deployment of VoLTE and the industry’s first live deployment of next-generation RCS 5.
We sell our solutions principally to wireless mobile service providers globally through our direct sales force or strategic third-party reseller partners. In 2014, 2013, and 2012, approximately 51%, 58% and 54%, respectively, of our revenue came from outside of the United States.
Revenue from our solutions is generated from the sale of software products and maintenance and support. Software products revenues consist of software licenses, hardware and professional services fees from software customizations, feature development and training for customers. Maintenance revenue includes support, annual software maintenance agreements and extended hardware warranty arrangements.
In our competitive industry, it is critical that we provide high-quality solutions at pricing levels that are attractive to our customers. This is especially true for new customers, given that we are less well-established than some of our larger competitors. When we acquire a new customer, we generally initiate our relationship with the customer by providing our solutions on off-the-shelf, industry-standard third-party hardware. The hardware we sell initially serves as a high-capacity platform to enable highly scalable implementation of additional Mavenir solutions.
Since the solutions we sell represent innovative technology, in some cases the first of its kind installed in the marketplace, it is also important that we provide considerable on-site support to the initial deployments of our solutions by our mobile service provider customers as they test, trial and implement our solutions. As a result, we have incurred, and expect to continue to incur over the near-term, significant costs to provide support for our initial solution deployments.
As our existing mobile service provider customers experience that our products reliably deliver the solutions purchased, we expect those customers to deploy our solutions across broader portions of their subscriber bases. We also anticipate that mobile service provider customers who purchase certain solutions of ours will purchase additional solutions from us for deployment in their networks. As our customers’ networks mature, we also expect that they will purchase ongoing support and maintenance services from us. We expect that our cost to provide these incremental expansions will be lower than the cost of our initial deployments to these customers. Additionally, as our customer relationships deepen, we expect that our customer base will become more heavily-weighted toward existing customers as compared to new customers. We believe that a combination of these factors will improve our profitability.
As our sales grow, it will be critical that we attract highly-qualified employees and successfully develop and streamline business processes in order to support our global customer base and grow profitably. It will also be critical that we accurately foresee the direction of mobile technology deployments and develop solutions that address the demands of mobile service providers. In addition, in order to be successful we will have to compete effectively for customers with incumbent providers of
41
core network solutions. Many of these incumbents have greater financial, technical, marketing and other resources than we do and also have, in many cases, pre-existing relationships with our customers and potential customers.
We had net losses of $(26.0) million, $(15.3) million and $(15.6) million in 2014, 2013, and 2012, respectively.
GAAP financial highlights for the year ended December 31, 2014 include:
• | For the year ended December 31, 2014, we generated revenues of $129.8 million, representing growth of 28.1% over 2013. |
• | Revenues from our Voice and Video product group increased by 189.0% for the year ended December 31, 2014 compared to 2013. |
• | We experienced revenue growth of 49.0% in the Americas region, 7.6% in the Europe, Middle East and Africa region, and 13.5% in the Asia-Pacific region, for the year ended December 31, 2014, as compared to 2013. |
Non-GAAP financial highlights for the year ended December 31, 2014 include:
• | Non-GAAP gross profit increased to $72.6 million, or 56% of revenue, compared to $56.9 million, or 56.2% of revenue, in 2013. |
• | Non-GAAP operating loss increased to $6.3 million, compared to a loss of $2.1 million in 2013. |
• | Non-GAAP net loss increased to $8.9 million, compared to a loss of $7.8 million in 2013. |
For a discussion of these non-GAAP financial measures and a reconciliation of GAAP and non-GAAP financial results, please refer to “Non-GAAP Financial Measures” included elsewhere in this Management’s Discussion and Analysis of Financial Condition and Results of Operations.
Recent Developments
On August 6, 2014, we closed a follow-on public offering, in which we sold 4,090,000 shares of common stock at a price to the public of $11.00 per share, before underwriting discounts and commissions. We raised approximately $41.7 million in net proceeds after deducting underwriting discounts and commissions of approximately $2.5 million and other estimated offering costs of approximately $0.8 million.
On November 18, 2014, we acquired Stoke, Inc., a Delaware corporation (“Stoke”). Stoke provides mobile gateway solutions to the broadband network industry. The Stoke acquisition is included in the consolidated financial statements from the date of acquisition.
Key Operating and Financial Performance Metrics
We monitor and evaluate the key operating and financial performance metrics noted below to help us establish our budgets, measure our business operating performance, assess trends and evaluate our performance as compared to that of our competitors. We discuss revenue, gross profit margin and operating results below under “Components of Operating Results.” We discuss cash and cash equivalents and cash flows from operations below under “Liquidity and Capital Resources.”
Year Ended December 31, | |||||||||||
2014 | 2013 | 2012 | |||||||||
(in thousands) | |||||||||||
Revenues | $ | 129,795 | $ | 101,308 | $ | 73,840 | |||||
Gross Profit Margin | 54.7 | % | 55.4 | % | 58.8 | % | |||||
Operating Loss | $ | (17,072 | ) | $ | (7,708 | ) | $ | (14,563 | ) | ||
Cash and Cash Equivalents | $ | 54,699 | $ | 38,930 | $ | 7,402 | |||||
Cash used in Operations | $ | (17,304 | ) | $ | (20,498 | ) | $ | (22,387 | ) | ||
Components of Operating Results
Revenue
Revenue from our solutions is generated from the sale of software products and maintenance and support. Software products revenues consist of software licenses, hardware and professional services fees from software customizations, feature
42
development and training for customers. Maintenance revenue includes support, annual software maintenance agreements and extended hardware warranty arrangements.
We report two classifications of revenue:
• | Software products revenue includes revenue arrangements that consist of tangible products with essential software elements, perpetual right-to-use (RTU) software licenses and sales of industry standard hardware. Software products revenue is supported by customer contracts that generally outline terms and conditions, including those that relate to acceptance of the product. Software products revenue also includes software customizations and feature development for individual customers and training of customers. |
• | Maintenance revenue includes support, annual software maintenance agreements and extended hardware warranty arrangements. Revenue from these services is recognized ratably over the service delivery period. |
Please refer to “Critical Accounting Policies and Significant Judgments and Estimates” included in this section, for a detailed description of our revenue recognition.
Cost of Revenue
Our cost of software products revenue consists of payroll-related costs of service personnel, third-party hardware and third-party software licenses and the shipping and installation costs to any of our customers. The costs associated with our RTU software licenses are expensed as incurred in operating costs under research and development.
Our cost of maintenance revenue includes salaries, employee benefits, stock-based compensation and other related expenses. Additionally, hardware and third-party software licenses and services are included.
Gross Profit and Gross Profit Margin
Gross profit is the calculation of total revenue minus total cost of revenue. Our gross profit margin is our gross profit expressed as a percentage of revenue. Our gross profit margin has been and will continue to be affected by a variety of factors, including the mix of customers and types of revenue, cost fluctuations and reduction activities, including technological changes. Additionally, changes in foreign exchange rates may impact gross profit and gross profit margin.
Operating Expenses
Operating expenses consist of research and development, sales and marketing, and general and administrative expenses. Salaries and personnel costs are the most significant component of each of these expense categories.
Research and Development Expenses. Research and development expenses primarily consist of salaries and personnel costs for research and development employees, including stock-based compensation and bonuses. Additional expenses include costs related to development, quality assurance and testing of new software and enhancement of existing software, consulting, travel and other related overhead such as facility costs.
Additionally, we supplement our own research and development resources with third-party international and domestic subcontractors for software development, documentation, quality assurance and software support. We believe continuing to invest in research and development efforts is essential to maintaining our competitive position. We expect research and development expenses to increase in the foreseeable future as we continue to broaden our product portfolio.
Sales and Marketing Expenses. Sales and marketing expenses consist primarily of salaries and personnel costs for our sales and marketing employees, including stock-based compensation, commissions and bonuses. Additional expenses include attendance at trade shows, marketing programs, consulting, travel and other related overhead. We expect our sales and marketing expenses to increase in the foreseeable future as we further increase the number of our sales and marketing professionals as we continue our geographic expansion and continue to grow our business.
General and Administrative Expenses. General and administrative expenses primarily consist of salary and personnel costs for administration, finance and accounting, legal, information systems and human resources employees, including stock-based compensation and bonuses. Additional expenses include consulting and professional fees, travel, insurance and other corporate expenses and gain or loss on disposal of assets. Expenses related to our acquisitions, including the amortization of intangible assets, are included.
43
Operating Results
Operating results are the result of subtracting our total operating expenses from our gross profits. We use operating results to analyze the profitability of our operations without the effects of non-operating income and expenses.
Stock-Based Compensation
We include stock-based compensation as part of cost of revenue and operating expenses in connection with the grant or modification of stock options and other equity awards to our independent directors, employees and consultants. We apply the fair value method in accordance with authoritative guidance for determining the cost of stock-based compensation. The total cost of the grant or modification is measured based on the estimated fair value of the award at the date of grant.
The following table presents our stock-based compensation expense resulting from stock options and our employee stock purchase program that we recorded in our Consolidated Statement of Operations and Comprehensive Loss for 2014, 2013, and 2012 (in thousands):
December 31, | |||||||||||
2014 | 2013 | 2012 | |||||||||
Cost of revenues | $ | 582 | $ | 187 | $ | — | |||||
Research and development | 787 | 321 | — | ||||||||
Sales and marketing | 1,032 | 482 | — | ||||||||
General and administrative | 2,154 | 640 | 291 | ||||||||
Total | $ | 4,555 | $ | 1,630 | $ | 291 | |||||
Net Interest Expense
Net interest expense consists of the difference between interest income and interest expense. Interest income represents interest received on our cash and cash equivalents. Interest expense is due to commercial loans. See “Liquidity and Capital Resources” elsewhere in this section.
Income Tax Expense
Income tax expense consists of U.S. federal, state and foreign income taxes. We are required to pay income taxes in certain states and foreign jurisdictions. Historically, we have not been required to pay U.S. federal income taxes due to our accumulated net operating losses. For the year ended December 31, 2014, we have net operating loss carryforwards to utilize in the U.S.
44
Results of Operations — Summary
Year Ended December 31, | |||||||||||
2014 | 2013 | 2012 | |||||||||
(in thousands) | |||||||||||
Consolidated Statement of Operations Data: | |||||||||||
Software product revenue | $ | 104,216 | $ | 79,342 | $ | 52,409 | |||||
Maintenance revenue | 25,579 | 21,966 | 21,431 | ||||||||
Total revenue | 129,795 | 101,308 | 73,840 | ||||||||
Cost of software product revenue | 46,102 | 35,971 | 23,891 | ||||||||
Cost of maintenance revenue | 12,747 | 9,202 | 6,568 | ||||||||
Cost of revenue | 58,849 | 45,173 | 30,459 | ||||||||
Gross profit | 70,946 | 56,135 | 43,381 | ||||||||
Gross Profit Margin | 54.7 | % | 55.4 | % | 58.8 | % | |||||
Research and development expenses | 30,459 | 22,775 | 23,312 | ||||||||
Sales and marketing expenses | 34,208 | 20,485 | 20,580 | ||||||||
General and administrative expenses | 23,351 | 20,583 | 14,052 | ||||||||
Total operating expenses | 88,018 | 63,843 | 57,944 | ||||||||
Operating loss | (17,072 | ) | (7,708 | ) | (14,563 | ) | |||||
Net interest expense | 1,966 | 3,185 | 383 | ||||||||
Loss on early extinguishment of debt | 1,783 | — | — | ||||||||
Foreign exchange loss (gain) | 4,699 | 1,901 | (529 | ) | |||||||
Loss before income tax expense | (25,520 | ) | (12,794 | ) | (14,417 | ) | |||||
Income tax expense | 516 | 2,496 | 1,152 | ||||||||
Net loss | $ | (26,036 | ) | $ | (15,290 | ) | $ | (15,569 | ) | ||
Comparison For the Years Ended December 31, 2014 and 2013
Revenue
Year Ended December 31, | Change | |||||||||||||||||||
2014 | % of Total Revenue | 2013 | % of Total Revenue | Amount | % | |||||||||||||||
(in thousands) | ||||||||||||||||||||
Revenue by type: | ||||||||||||||||||||
Software products | $ | 104,216 | 80.3 | % | $ | 79,342 | 78.3 | % | $ | 24,874 | 31.4 | % | ||||||||
Maintenance | 25,579 | 19.7 | % | 21,966 | 21.7 | % | 3,613 | 16.4 | % | |||||||||||
Total revenue | $ | 129,795 | 100 | % | $ | 101,308 | 100 | % | $ | 28,487 | 28.1 | % | ||||||||
Revenue by geographic area: | ||||||||||||||||||||
Americas | $ | 71,479 | 55.1 | % | $ | 47,957 | 47.3 | % | $ | 23,522 | 49.0 | % | ||||||||
Europe, Middle East and Africa | 40,772 | 31.4 | % | 37,887 | 37.4 | % | 2,885 | 7.6 | % | |||||||||||
Asia-Pacific | 17,544 | 13.5 | % | 15,464 | 15.3 | % | 2,080 | 13.5 | % | |||||||||||
Total revenue | $ | 129,795 | 100 | % | $ | 101,308 | 100 | % | $ | 28,487 | 28.1 | % | ||||||||
Revenue by Product Group: | ||||||||||||||||||||
Voice & Video | $ | 90,177 | 69.5 | % | $ | 31,206 | 30.8 | % | $ | 58,971 | 189.0 | % | ||||||||
Enhanced Messaging | 39,618 | 30.5 | % | 70,102 | 69.2 | % | (30,484 | ) | (43.5 | )% | ||||||||||
Total revenue | $ | 129,795 | 100 | % | $ | 101,308 | 100 | % | $ | 28,487 | 28.1 | % | ||||||||
Revenue increased $28.5 million, or 28.1%, to $129.8 million for the year ended December 31, 2014 from $101.3 million for the year ended December 31, 2013. Our revenue growth was the result of the expansion of existing customer relationships, in particular additional sales opportunities for our solutions generated by successful product launches. Software products revenue grew $24.9 million, or 31.4%, to $104.2 million in 2014 from $79.3 million in 2013. The increased revenues were primarily
45
from additional sales to new and existing customers. Software products revenues increased at a faster pace than maintenance revenues during 2014, as growth in this revenue type lags behind the increase in software revenues.
Total revenue from the Americas region grew by $23.5 million, or 49.0%, to $71.5 million for the year ended December 31, 2014 from $48.0 million for the year ended December 31, 2013. Revenues in the EMEA region increased $2.9 million, or 7.6%, to $40.8 million in 2014 from $37.9 million in 2013. Revenues in the Asia-Pacific (APAC) region increased $2.1 million, or 13.5%, to $17.5 million in 2014 from $15.5 million in 2013. Revenues in the Americas, EMEA, and APAC regions increased due to strong sales of Voice and Video solutions. The increases in each region were partially offset by decreases in Enhanced Messaging sales.
Revenue from the Voice and Video product group grew by $59.0 million, or 189.0%, to $90.2 million in 2014 from $31.2 million in 2013. Revenues from Voice and Video products increased as we generated additional sales of next-generation solutions to existing customers and our existing customers rolled out our solutions to larger numbers of subscribers. Revenues from Enhanced Messaging products decreased by $30.5 million, or 43.5%, to $39.6 million in 2014 from $70.1 million in 2013. Revenues from Enhanced Messaging products decreased due to a large initial deployment in 2013 that we did not have in 2014.
Cost of Revenue and Gross Profit
Year Ended December 31, | Change | |||||||||||||||||||
2014 | % of Related Revenue | 2013 | % of Related Revenue | Amount | % | |||||||||||||||
(in thousands) | ||||||||||||||||||||
Cost of Revenue | ||||||||||||||||||||
Software products | $ | 46,102 | 44.2 | % | $ | 35,971 | 45.3 | % | $ | 10,131 | 28.2 | % | ||||||||
Maintenance | 12,747 | 49.8 | % | 9,202 | 41.9 | % | 3,545 | 38.5 | % | |||||||||||
Total | $ | 58,849 | 45.3 | % | $ | 45,173 | 44.6 | % | $ | 13,676 | 30.3 | % | ||||||||
Gross Profit | ||||||||||||||||||||
Software products | $ | 58,114 | 55.8 | % | $ | 43,371 | 54.7 | % | $ | 14,743 | 34.0 | % | ||||||||
Maintenance | 12,832 | 50.2 | % | 12,764 | 58.1 | % | 68 | 0.5 | % | |||||||||||
Total | $ | 70,946 | 54.7 | % | $ | 56,135 | 55.4 | % | $ | 14,811 | 26.4 | % | ||||||||
Our cost of revenue increased $13.7 million, or 30.3%, to $58.8 million for the year ended December 31, 2014, from $45.2 million in 2013. Cost of revenue increased due to an increase in revenues, as well as increased operations personnel costs to expand into new markets.
Total gross profit increased $14.8 million, or 26.4%, to $70.9 million for the year ended December 31, 2014, from $56.1 million million in 2013. Gross profit margin decreased to 54.7% for the year ended December 31, 2014 from 55.4% for 2013. The decrease was primarily due to a greater mix of early phase hardware deployments and lab equipment, which are generally lower margin.
Operating Expenses
Year Ended December 31, | Change | |||||||||||||||||||
2014 | % of Revenue | 2013 | % of Revenue | Amount | % | |||||||||||||||
(in thousands) | ||||||||||||||||||||
Research and Development | $ | 30,459 | 23.5 | % | $ | 22,775 | 22.5 | % | $ | 7,684 | 33.7 | % | ||||||||
Sales and Marketing | 34,208 | 26.4 | % | 20,485 | 20.2 | % | 13,723 | 67.0 | % | |||||||||||
General and Administrative | 23,351 | 18.0 | % | 20,583 | 20.3 | % | 2,768 | 13.4 | % | |||||||||||
Total | $ | 88,018 | 67.8 | % | $ | 63,843 | 63.0 | % | $ | 24,175 | 37.9 | % | ||||||||
46
Research and Development
Research and development expenses increased by $7.7 million, or 33.7%, for the year ended December 31, 2014, compared to the prior year. Research and development expense increased as we added headcount to enhance existing products and develop future product capability and new customer solutions.
Sales and Marketing
Sales and marketing costs increased by $13.7 million, or 67.0%, for the year ended December 31, 2014, compared to the prior year. The growth in sales and marketing expense was primarily due to an increase in personnel costs and related expense to further enhance direct selling opportunities and to support sales growth into additional geographic areas.
General and Administrative
General and administrative expenses increased by $2.8 million for the year ended December 31, 2014, compared to the prior year. The growth in general and administrative expense was primarily due to an increase in personnel costs and related expenses of $3.2 million driven by a 40% increase in headcount to support our growth, as well as and increased costs of being a public company of approximately $0.9 million. These increases were partially offset by a reduction in our professional services expense of approximately $0.7 million and bad debt expense of approximately $0.8 million. The remaining increase was primarily related to our acquisition of Stoke.
Net Interest Expense
Year Ended December 31, | Change | |||||||||||||||||||
2014 | % of Revenue | 2013 | % of Revenue | Amount | % | |||||||||||||||
(in thousands) | ||||||||||||||||||||
Interest Income | $ | (102 | ) | (0.1 | )% | $ | (18 | ) | — | % | $ | (84 | ) | 466.7 | % | |||||
Interest Expense | 2,068 | 1.6 | % | 3,203 | 3.2 | % | (1,135 | ) | (35.4 | )% | ||||||||||
Total Net Interest Expense | $ | 1,966 | 1.5 | % | $ | 3,185 | 3.2 | % | $ | (1,219 | ) | (38.3 | )% | |||||||
Net interest expense decreased by $1.2 million, or 38.3%, to $2.0 million for the year ended December 31, 2014 from $3.2 million for 2013. The decrease was primarily attributable to the amendments made to our debt facility in March 2014 and November 2014, which lowered the overall interest rate on our outstanding debt balances.
Foreign exchange
Foreign exchange loss increased by $2.8 million, to $4.7 million for the year ended December 31, 2014, from a loss of $1.9 million for 2013. This is due to changes in transactional currencies compared to the functional currencies during the respective periods.
Income Tax Expense
Income tax expense was $0.5 million and $2.5 million for the years ended December 31, 2014 and 2013, respectively. The decrease in income tax expense in 2014 is primarily the result of the release of $2.7 million in valuation allowances in Canada, China, and India resulting from the expectation that the net deferred tax assets in those jurisdictions will be realized.
47
Comparison For the Years Ended December 31, 2013 and 2012
Revenue
Year Ended December 31, | Change | |||||||||||||||||||
2013 | % of Total Revenue | 2012 | % of Total Revenue | Amount | % | |||||||||||||||
(in thousands) | ||||||||||||||||||||
Revenue by type: | ||||||||||||||||||||
Software products | $ | 79,342 | 78.3 | % | $ | 52,409 | 71.0 | % | $ | 26,933 | 51.4 | % | ||||||||
Maintenance | 21,966 | 21.7 | % | 21,431 | 29.0 | % | 535 | 2.5 | % | |||||||||||
Total revenue | $ | 101,308 | 100 | % | $ | 73,840 | 100 | % | $ | 27,468 | 37.2 | % | ||||||||
Revenue by geographic area: | ||||||||||||||||||||
Americas | $ | 47,957 | 47.3 | % | $ | 37,314 | 50.6 | % | $ | 10,643 | 28.5 | % | ||||||||
Europe, Middle East and Africa | 37,887 | 37.4 | % | 20,476 | 27.7 | % | 17,411 | 85.0 | % | |||||||||||
Asia-Pacific | 15,464 | 15.3 | % | 16,050 | 21.7 | % | (586 | ) | (3.7 | )% | ||||||||||
Total revenue | $ | 101,308 | 100 | % | $ | 73,840 | 100 | % | $ | 27,468 | 37.2 | % | ||||||||
Revenue by Product Group: | ||||||||||||||||||||
Voice & Video | $ | 31,206 | 30.8 | % | $ | 25,211 | 34.1 | % | $ | 5,995 | 23.8 | % | ||||||||
Enhanced Messaging | 70,102 | 69.2 | % | 48,629 | 65.9 | % | 21,473 | 44.2 | % | |||||||||||
Total revenue | $ | 101,308 | 100 | % | $ | 73,840 | 100 | % | $ | 27,468 | 37.2 | % | ||||||||
Revenue increased $27.5 million, or 37.2%, to $101.3 million for the year ended December 31, 2013 from $73.8 million for the year ended December 31, 2012. Our revenue growth is from our expansion of existing customer relationships, in particular additional sales opportunities for our solutions generated by successful product launches. Software products revenue grew $26.9 million, or 51.4%, to $79.3 million in 2013 from $52.4 million in 2012. The increased revenues were primarily from additional volume while pricing was stable. Maintenance revenues remained consistent from period to period, as growth in this revenue type lags behind the increase in software revenues.
Total revenue from the Americas region grew by $10.6 million, or 28.5%, to $48.0 million for the year ended December 31, 2013 from $37.3 million for the year ended December 31, 2012. Revenues in the EMEA region increased $17.4 million, or 85.0%, to $37.9 million in 2013 from $20.5 million in 2012. Revenues in the Asia-Pacific (APAC) region decreased $0.6 million, or (3.7)%, to $15.5 million in 2013 from $16.1 million in 2012. Revenues in the EMEA region increased at a greater percentage than in the Americas due to strong sales of Voice and Video solutions in the market. The decrease in the APAC region was primarily due to slowing sales of Enhanced Messaging compared to the prior year period.
Revenues from Enhanced Messaging products grew by $21.5 million, or 44.2%, to $70.1 million in 2013 from $48.6 million in 2012. Revenue from the Voice and Video product group grew by $6.0 million, or 23.8%, to $31.2 million in 2013 from $25.2 million in 2012. Revenues in both product groups increased, as we generated additional sales opportunities for our next-generation solutions through successful product launches with existing customers and our existing customers rolled out our solutions to larger numbers of subscribers.
48
Cost of Revenue and Gross Profit
Year Ended December 31, | Change | |||||||||||||||||||
2013 | % of Related Revenue | 2012 | % of Related Revenue | Amount | % | |||||||||||||||
(in thousands) | ||||||||||||||||||||
Cost of Revenue | ||||||||||||||||||||
Software products | $ | 35,971 | 45.3 | % | $ | 23,891 | 45.6 | % | $ | 12,080 | 50.6 | % | ||||||||
Maintenance | 9,202 | 41.9 | % | 6,568 | 30.6 | % | 2,634 | 40.1 | % | |||||||||||
Total | $ | 45,173 | 44.6 | % | $ | 30,459 | 41.3 | % | $ | 14,714 | 48.3 | % | ||||||||
Gross Profit | ||||||||||||||||||||
Software products | $ | 43,371 | 54.7 | % | $ | 28,518 | 54.4 | % | $ | 14,853 | 52.1 | % | ||||||||
Maintenance | 12,764 | 58.1 | % | 14,863 | 69.4 | % | (2,099 | ) | (14.1 | )% | ||||||||||
Total | $ | 56,135 | 55.4 | % | $ | 43,381 | 58.8 | % | $ | 12,754 | 29.4 | % | ||||||||
Our cost of revenue increased $14.7 million, or 48.3%, to $45.2 million for the year ended December 31, 2013, from $30.5 million in 2012. Cost of revenue increased due to an increase in our sales volumes, as well as increased operations personnel costs to expand into new markets.
Total gross profit increased $12.8 million, or 29.4%, to $56.1 million for the year ended December 31, 2013, from $43.4 million in 2012. Gross profit margin decreased to 55.4% for the year ended December 31, 2013 from 58.8% for 2012. The decrease was primarily due to a greater mix of early phase hardware deployments and lab equipment, which are generally lower margin.
Operating Expenses
Year Ended December 31, | Change | |||||||||||||||||||
2013 | % of Revenue | 2012 | % of Revenue | Amount | % | |||||||||||||||
(in thousands) | ||||||||||||||||||||
Research and Development | $ | 22,775 | 22.5 | % | $ | 23,312 | 31.6 | % | $ | (537 | ) | (2.3 | )% | |||||||
Sales and Marketing | 20,485 | 20.2 | % | 20,580 | 27.9 | % | (95 | ) | (0.5 | )% | ||||||||||
General and Administrative | 20,583 | 20.3 | % | 14,052 | 19.0 | % | 6,531 | 46.5 | % | |||||||||||
Total | $ | 63,843 | 63.0 | % | $ | 57,944 | 78.5 | % | $ | 5,899 | 10.2 | % | ||||||||
Research and Development
Research and development expenses decreased by $0.5 million for the year ended December 31, 2013, compared to the prior year as we shifted this function to lower cost regions.
Sales and Marketing
Sales and marketing costs decreased by $0.1 million for the year ended December 31, 2013, compared to the prior year. The decrease in sales and marketing expense was primarily due to a selling effort intangible acquired in the Airwide acquisition being fully amortized in 2012. This decrease in 2013 was partially offset by an increase in personnel costs and related expenses, driven by a headcount increase to support our growth.
General and Administrative
General and administrative expenses increased by $6.5 million for the year ended December 31, 2013, compared to the prior year. The growth in general and administrative expense was primarily due to an increase in personnel costs and related expenses, driven by a headcount increase to support our growth.
49
Net Interest Expense
Year Ended Year Ended December 31, | Change | |||||||||||||||||||
2013 | % of Revenue | 2012 | % of Revenue | Amount | % | |||||||||||||||
(in thousands) | ||||||||||||||||||||
Interest Income | $ | (18 | ) | — | % | $ | (10 | ) | — | % | $ | (8 | ) | 80 | % | |||||
Interest Expense | 3,203 | 3.2 | % | 393 | 0.5 | % | 2,810 | 715 | % | |||||||||||
Total Net Interest Expense | $ | 3,185 | 3.2 | % | $ | 383 | 0.5 | % | $ | 2,802 | 731.6 | % | ||||||||
Net interest expense increased by $2.8 million, or 731.6%, to $3.2 million for the year ended December 31, 2013 from $0.4 million for 2012. The change was primarily attributable to an increase in interest expense due to an increase in our outstanding debt in the second half of 2012 and during the first half of 2013.
Foreign exchange
Foreign exchange loss increased by $2.4 million, to $(1.9) million for the year ended December 31, 2013, from a gain of $0.5 million for 2012. This is due to changes in transactional currencies compared to the functional currencies during the respective periods.
Income Tax Expense
Income tax expense was $2.5 million and $1.2 million for the years ended December 31, 2013 and 2012, respectively. During 2013, it was determined that certain foreign withholding taxes would not be realizable as foreign tax credits due to extended net operating losses in the entities in which the withholding taxes were incurred. Therefore, $1.3 million of foreign withholding taxes are included in income tax expense.
Critical Accounting Policies and Significant Judgments and Estimates
Our management’s discussion and analysis of our financial condition and results of operations is based on our consolidated financial statements, which have been prepared in accordance with generally accepted accounting principles in the United States (U.S. GAAP). The preparation of these consolidated financial statements requires us to make estimates and assumptions that affect the reported amounts of assets and liabilities, disclosure of contingent assets and liabilities at the date of the consolidated financial statements and the reported amounts of revenue and expenses during the reported period. In accordance with U.S. GAAP, we base our estimates on historical experience and on various other assumptions that we believe are reasonable under the circumstances. Actual results may differ from these estimates under different assumptions or conditions.
While our significant accounting policies are more fully described in Note 2 to our consolidated financial statements appearing elsewhere in this Annual Report on Form 10-K, we believe the following accounting policies are critical to the process of making significant judgments and estimates in the preparation of our consolidated financial statements.
Revenue Recognition
We generate revenues from the sale of software, hardware, professional services, and product support. Professional services consist primarily of software development and implementation services, but also can include training of customer personnel. Our products and services are generally sold as part of a contractual agreement, the terms of which are considered as a whole to determine the appropriate revenue recognition.
Our products and services are sold through distribution partners and directly through our sales force. We typically do not offer contractual rights of return, stock balancing or price protection to our distribution partners, however, we do offer certain price guarantees to a limited number of large customers. When appropriate, a reserve based on specific identification is recorded for estimated reductions to revenues for potential customer claims.
We recognize revenue when persuasive evidence of an arrangement exists, delivery has occurred, the sale price is fixed or determinable and collectability is reasonably assured. We recognize revenue in accordance with the provisions of ASC 985-605, Software Revenue Recognition, as amended, or with ASC 605-25 Multiple Element Arrangements (“MEAs”), with consideration to ASC 605-35, Construction-Type and Production-Type Contracts.
First, we determine if the contract's deliverables consist of tangible products that contain essential software elements and as such, are excluded from the software revenue recognition method of accounting. If the hardware included in the arrangement requires the software in order to be of value to the customer, then the hardware is considered tangible product with essential software elements.
50
Our software related products include software, non-essential hardware, maintenance, and typically involve significant professional services for customization and implementation of our software. We generally recognize all deliverables within our multiple element arrangements except maintenance using percentage of completion accounting for our projects based on hours incurred to date as a percentage of total budgeted hours. Revenue for hardware that is non-essential and not material to the project is recognized on a percentage of completion basis along with the software related products. Maintenance is allocated based on Vendor-Specific Objective Evidence (“VSOE”) using the residual method.
Our tangible products containing essential software MEAs typically include hardware, software essential to the functionality of the hardware, installation, and maintenance and are dependent on final customer acceptance, except maintenance, which is recognized ratably over the term of coverage. All multiple elements with tangible products containing essential software, except maintenance, are recognized upon fulfillment of delivery and installation, which is typically customer acceptance and the total transaction price is allocated using the relative selling price method based on the Estimated Selling Price (“ESP”) for the accepted product and maintenance.
Certain of our software products are delivered under contracts, which generally require significant integration within a customer’s production and business system environment. As the customer agreements generally require significant production, modification, or customization of the software, we account for these agreements under the percentage-of-completion method based on hours incurred to date compared to total hours expected under the contract. The percentage-of-completion method generally results in the recognition of consistent profit margins over the life of the contract since management has the ability to estimate contract billings and contract costs. We use the level of profit margin that is most likely to occur on a contract. If the most likely profit margin cannot be precisely determined, the lowest probable level of profit in the range of estimates is used until the results can be estimated more precisely. Under the percentage-of-completion method of accounting, management must also make key judgments in areas such as estimated project revenue and costs, total and remaining project hours, and potential customer claims. Changes in job performance, job conditions, estimated profitability, final contract settlements, and the resolution of claims may result in revised job costs and income amounts from what was originally estimated. At the time a loss on a contract is expected, the entire amount of the estimated loss is accrued.
Software contracts that do not qualify for use of the percentage-of-completion method, when reasonable estimates of percentage of completion are not available, are accounted for using the completed-contract method. Under the completed-contract method, all billings and related costs, net of anticipated losses, are deferred until completion of the contract.
During the second quarter of 2014, we determined it was possible to reasonably estimate percentage-of-completion on our Next Generation products. Next Generation product contracts entered into before this were accounted for using the completed-contract method and amounts due were billed in accordance with the schedule specified in each contractual arrangement. In 2014 and before, the majority of legacy product software contracts were accounted for using the percentage-of-completion accounting method since we could reasonably estimate the efforts required.
Customers are billed in accordance with specific contract terms, which may differ from the rate at which revenue is earned. Revenue recognized in excess of the amount billed is classified as unbilled revenue. Amounts received from customers pursuant to the terms specified in contracts, but for which revenue has not yet been recognized, are recorded as deferred revenue. We evaluate revenue recognition in accordance with ASC 605-45, Principal Agent Considerations, regarding gross versus net revenue recognition. We believe that our contractual arrangements meet the criteria for gross revenue recognition.
In certain situations, we sell software that does not require significant modification of services considered essential to the software’s functionality. Such software, generally consisting of capacity license upgrades, is recognized upon delivery if the other revenue recognition criteria are met.
Some of our software arrangements include services, such as training, not considered essential for the customer to be able to use the software for their purposes. When software services are not considered essential, the fee allocable to the service element is recognized as revenue as we perform the services. Revenue for hardware that is non-essential and not material to the project is recognized on a percentage-of-completion basis along with the software related products.
For software related products, each element of the arrangement is analyzed and a portion of the total arrangement fee is allocated to the elements based on the fair value of the element using VSOE of fair value, regardless of any separate prices stated within the contract for each element. Fair value is considered the price a customer would be required to pay if the element were sold separately based on our historical experience of stand-alone sales of these elements to third parties. For post-contract customer support (“PCS”) such as maintenance, we use renewal rates for continued support arrangements to determine fair value. For software services, we use the fair value we charge our customers when those services are sold separately. We monitor our transactions at least annually to ensure we maintain and periodically revise VSOE to reflect fair value.
The deliverables included in the MEAs are separated into more than one unit of accounting when (i) the delivered equipment has value to the customer on a stand-alone basis, and (ii) delivery of the undelivered service element(s) is probable and substantially in our control. Revenue from arrangements for the sale of tangible products containing both software and non-
51
software components that function together to deliver the product’s essential functionality requires allocation of the arrangement consideration to the separate deliverables using the relative selling price method (“RSP”) of each unit of accounting based first on VSOE, if it exists, second on third-party evidence (“TPE”), if it exists, and finally on estimated selling price ("ESP") if neither VSOE nor TPE exist.
• | VSOE — For certain elements of an arrangement, VSOE is based on the price of the element in comparable transactions in which the element is sold separately. We determine VSOE based on our pricing and discounting practices for the specific product or service when it is sold separately, including consideration of geographical, customer, and other economic or marketing variables, as well as renewal rates or stand-alone prices for the service element(s). |
• | TPE — If we cannot establish VSOE of selling price for a specific product or service included in an MEA, we use TPE to determine the selling price. We determine TPE based on sales of comparable amounts of similar products or services offered by multiple third parties with consideration given to the degree of customization and similarity of the product or service sold. |
• | ESP — ESP represents the price at which we would sell a product or service if it were sold on a stand-alone basis. When VSOE or TPE does not exist for an element, we determine ESP for the element based on sales, cost and margin analysis, pricing practices, and potential market constraints. Adjustments for other market and company-specific factors are made as deemed necessary to determine ESP. |
Certain contracts include multiple elements for which we determine whether the various elements meet the applicable criteria to be accounted for as separate elements and make estimates regarding their relative selling price. We use ESP when allocating arrangement consideration to each separate deliverable as we do not have VSOE or TPE of selling price for our various applicable tangible products containing essential software products and services. We allocate the total transaction price of an arrangement based on each separate unit of accounting relative to ESP. Revenue for elements that cannot be separated is recognized once the revenue recognition criteria for the entire arrangement has been met or over the period that our last remaining obligation to perform is fulfilled. Consideration for elements that are deemed separable is allocated to the separate elements at the inception of the arrangement based on their relative selling price and recognized based on the authoritative criteria. We consider the installation and delivery of our software products to be part of a single unit of accounting due to the complexity of installation and nature of the contractual arrangements.
Cost of Revenues
Cost of revenues consists of payroll-related costs for service personnel, contractor costs, third-party hardware costs, third-party license fees, and the cost of delivering product to customers. The costs associated with any product that does not yet meet the criteria to be recognized as revenue are deferred.
Unbilled Revenue
If final acceptance has occurred but we have not invoiced the customer, we account for the amount invoiced as unbilled revenue and recognize the revenues and related costs. Customers are billed in accordance with specific contract terms, which may differ from the rate at which revenues are earned. Revenue recognized in excess of the amount billed of $13.7 million and $11.2 million at December 31, 2014 and 2013, respectively, are classified as unbilled revenue. Amounts received from customers pursuant to the contractual terms, but for which revenue has not yet been earned, are recorded as deferred revenue.
Maintenance
Maintenance consists of PCS agreements and subsequent support services purchased by our customers after the initial support period. Our customers generally enter into PCS agreements when they purchase our products. Our PCS agreements range from three months to three years and are typically renewable on an annual basis thereafter at the option of the customer. Revenue allocated to PCS is recognized ratably on a straight-line basis over the period the PCS is provided, assuming all other criteria for revenue recognition have been met. All significant costs and expenses associated with PCS are expensed as incurred with the exception of customer specific, third-party costs, which are expensed ratably over the PCS term. We have established VSOE for our legacy software products. For our next generation products, rates for maintenance, including subsequent renewal rates, are established based on a specific percentage of the arrangement's fair value. For our tangible, products, which contain essential software, our customers generally enter into PCS arrangements at the time of purchase. Relative selling price for the support obligations for tangible products containing essential software is based on ESP.
52
Accounts Receivable and Allowance for Doubtful Accounts
Accounts receivable are stated at realizable value, net of an allowance for doubtful accounts that is maintained for estimated losses that would result from the inability of some customers to make payments as they become due. The allowance is based on an analysis of past due amounts and ongoing credit evaluations. Customers are generally evaluated for creditworthiness through a credit review process at the time of each order. Our collection experience has been consistent with our estimates.
Business Combinations
We account for business combinations under the acquisition method of accounting, which requires the assets acquired and liabilities assumed to be recorded at their respective fair values as of the acquisition date in our consolidated financial statements.
Intangible Assets and Goodwill
Our business acquisitions typically result in the creation of goodwill and other intangible asset balances, and these balances affect the amount and timing of future period amortization expense, as well as expense we could possibly incur as a result of an impairment charge. The cost of acquired companies is allocated to identifiable tangible and intangible assets based on estimated fair value, with the excess allocated to goodwill. Accordingly, we have a significant balance of acquisition date intangible assets, including, customer-related intangibles, technology, beneficial lease asset and goodwill. These intangible assets (other than goodwill) are amortized over their estimated useful lives. We currently have no intangible assets with indefinite lives other than goodwill. We evaluate goodwill for impairment annually as of October 1, or more frequently if impairment indicators arise. Accounting Standards Update ("ASU") No. 2011-08, Intangibles - Goodwill and Other (Topic 350): Testing Goodwill for Impairment (“ASU Topic 350”) permits an entity to make a qualitative assessment of whether it is more likely than not that a reporting unit’s fair value is less than its carrying amount before applying a two-step goodwill impairment test. This step is referred to as “step zero.” If an entity concludes that it is not likely that the fair value of the reporting unit is less than its carrying amount, it would not be required to perform a two-step impairment test for that reporting unit. The guidance lists certain factors to consider when making the qualitative assessment. In the event that the conclusion requires the two-step test, the first step compares the fair value of the reporting unit with its carrying value, including goodwill. If the fair value of the reporting unit is less than its carrying value, an indication of goodwill impairment exists for the reporting unit and the entity must perform step two of the impairment test. Under step two, an impairment loss is recognized for any excess of the carrying amount of the reporting unit’s goodwill over the implied fair value of that goodwill. The implied fair value of goodwill is determined by allocating the fair value of the reporting unit in a manner similar to a purchase price allocation and the residual fair value after this allocation is the implied fair value of the reporting unit goodwill. Fair value of the reporting unit is determined using a discounted cash flow analysis. If the fair value of the reporting unit exceeds its carrying value, step two does not need to be performed. An impairment loss is recognized to the extent that the carrying amount of goodwill exceeds its implied fair value.
We determine fair value using widely accepted valuation techniques, including discounted cash flows and market multiple analyses. These types of analyses contain uncertainties because they require management to make assumptions and to apply judgment to estimate industry economic factors and the profitability of future business strategies. It is our policy to conduct impairment testing based on our current business strategy in light of present industry and economic conditions, as well as our future expectations.
Our valuation methodology for assessing impairment requires management to make judgments and assumptions based on historical experience and projections of future operating performance. If these assumptions differ materially from future results, we may record impairment charges in the future.
In connection with our annual goodwill impairment test, we have not recorded any impairment of such assets during 2014, 2013, and 2012.
All intangible assets with definite lives are reviewed for impairment annually or whenever events or changes in circumstances indicate that the carrying amount of an asset may not be recoverable. Recoverability of other intangible assets is measured by comparison of the carrying amount to estimated undiscounted future cash flows. The assessment of recoverability or of the estimated useful life for amortization purposes will be affected if the timing or the amount of estimated future operating cash flows is not achieved. Such indicators may include, among others: a significant decline in expected future cash flows; a sustained, significant decline in stock price and market capitalization; a significant adverse change in legal factors or in the business climate; unanticipated competition; and reductions in growth rates. In addition, products, capabilities, or technologies developed by others may render our software products obsolete or non-competitive. Any adverse change in these factors could have a significant impact on the recoverability of goodwill or other intangible assets. During 2014, we did not identify any triggering events which would require an update to our annual impairment review of intangible assets.
53
The weighted estimated useful lives used in computing amortization of intangible assets are as follows:
Technology | 72 months | ||
Customer Relationships | 72 months | ||
Certification and Licenses | 36 months | ||
Beneficial Lease | 27 months | ||
Contractual Backlog | 7 months | ||
Stock-Based Compensation
Stock-based compensation represents the cost related to stock-based awards granted to employees. We measure stock-based compensation cost at the grant date, based on the estimated fair value of the award and recognize the cost as an expense on a straight-line basis over the employee requisite service period, which is generally the vesting period.
We estimate the fair value of stock options without market-based performance conditions using the Black-Scholes valuation model which is affected by our common stock fair value as well as a number of assumptions, including the risk-free interest rate, expected dividend yield, expected term and expected volatility. These assumptions are highly subjective and complex and require the use of our judgment. These assumptions are estimated as follows:
• | Fair value of common stock. Because our stock was not publicly traded prior to our November 2013 initial public offering, the fair value of our common stock underlying our stock options was determined by our Board of Directors, which intended all options granted to be exercisable at a price per share not less than the per share fair value of our common stock underlying those options on the date of grant. Following our initial public offering on November 7, 2013, our common stock has been valued using the closing sales price of our common stock as reported on the New York Stock Exchange on the grant date. |
• | Expected dividends. We have assumed no dividend yield because we do not expect to pay dividends in the near future, which is consistent with our history of not paying dividends. |
• | Risk-free interest rate (U.S. Treasury). The risk-free interest rate assumption is based upon observed interest rates for constant maturity U.S. Treasury securities consistent with the expected term of our employee stock options. |
• | Expected term. The expected life of a stock option is derived from the average of the vesting period and the expiration period from the date of issue of the award. |
• | Expected volatility. Expected volatility is based on the historical volatility of comparable public companies, including public communications software and telecommunications companies. We use this method because we have limited information on the volatility of our common stock due to our short trading history following our November 2013 initial public offering. We intend to continue to consistently apply this process using the same or similar public companies until a sufficient amount of historical information regarding the volatility of our own common stock share price becomes available. |
The following summarizes the assumptions used for estimating the fair value of stock options granted for the periods indicated:
Year Ended December 31, | ||||||||
2014 | 2013 | 2012 | ||||||
Expected dividends | — | % | — | % | — | % | ||
Risk-free interest rate (U.S. Treasury) | 2.0 | % | 1.8 | % | 1.7 | % | ||
Expected term | 6.3 | 6.3 | 6.3 | |||||
Expected volatility | 60.9 | % | 57.5 | % | 62.0 | % | ||
We will continue to use our judgment in evaluating the assumptions related to our share-based compensation on a prospective basis. As we continue to accumulate additional data related to our common stock, we may have refinements to our estimates, which could materially impact our future stock-based compensation expense.
54
Income Taxes
Income taxes are accounted for under the asset and liability method. Deferred tax assets and liabilities are recognized for the future tax consequences attributable to differences between the financial statement carrying amounts of existing assets and liabilities and their respective tax bases and operating loss and tax credit carryforwards. Deferred tax assets and liabilities are measured using enacted tax rates expected to apply to taxable income in the years in which those temporary differences are expected to be recovered or settled. The effect on deferred tax assets and liabilities related to a change in tax rates is recognized in operations in the period that includes the enactment date.
We provide a valuation allowance for our deferred tax assets when it is more likely than not that our deferred tax assets will not be realized, based on expectations of generating future taxable income. Due to our historical losses, the net deferred tax assets related to foreign and federal jurisdictions have been fully reserved with the establishment of a valuation allowance. With respect to Canada, China, and our operations in India, and the State of Texas, management has determined that the realization of the deferred tax assets is more likely than not to occur, and has, therefore, released the respective valuation allowances in 2014.
We recognize the effect of an income tax position only if it is more likely than not (a likelihood of greater than 50%) that such position will be sustained upon examination by the relevant taxing authorities. Recognized income tax positions are measured at the largest amount that is greater than 50% likely of being realized. Changes in recognition or measurement are reflected in the period in which the change in judgment occurs. We recognized an uncertain tax positions liability of $3.0 million and $3.1 million as of December 31, 2014 and 2013, respectively, as a result of related party foreign transactions. We recognize both interest and penalties related to uncertain tax positions as part of the income tax provision.
Liquidity and Capital Resources
We have funded our operations from 2005 to December 31, 2014 primarily with net proceeds from issuances of preferred stock of approximately $105 million, net proceeds from our initial public offering and secondary offering of approximately $44.8 million and $41.7 million during 2013 and 2014 respectively and, to a lesser extent, borrowings under credit facilities.
We restructured our loan arrangement with Silicon Valley Bank during the first quarter of 2014 to reduce our financing costs. We also used a portion of our initial public offering proceeds to repay the entire $15.0 million outstanding principal amount under our subordinated loan agreement with Silver Lake Waterman in the first quarter of 2014 and terminated our Silver Lake Waterman loan. Our Silicon Valley Bank loan arrangement is described below.
As of December 31, 2014, our capital resources consisted principally of cash and cash equivalents totaling $54.7 million. Our cash, cash equivalents, and short-term investments are comprised primarily of commercial paper, certificates of deposit, fixed income securities, and time deposits.
Cash continues to be used in operations, but we expect that cash generated from operations, together with the net proceeds from our secondary stock offering and amounts available under our credit facility will provide cash sufficient to meet our currently anticipated cash requirements for at least the next twelve months.
Cash, Cash Equivalents and Working Capital
The following table presents a summary of our cash and cash equivalents, accounts receivable and working capital for the periods indicated (in thousands):
December 31, | |||||||
2014 | 2013 | ||||||
Cash and Cash Equivalents | $ | 54,699 | $ | 38,930 | |||
Trade Accounts Receivable (Net) | $ | 38,525 | $ | 23,641 | |||
Working Capital | $ | 72,798 | $ | 58,179 | |||
Year Ended December 31, | |||||||||||
2014 | 2013 | 2012 | |||||||||
Cash Provided by (Used in) | |||||||||||
Operations | $ | (17,304 | ) | $ | (20,498 | ) | $ | (22,387 | ) | ||
Investing | $ | (10,264 | ) | $ | (2,798 | ) | $ | (5,217 | ) | ||
Financing | $ | 44,814 | $ | 55,439 | $ | 14,259 | |||||
55
Cash and cash equivalents are held for working capital purposes and were invested primarily in demand deposit accounts or money market funds. We do not enter into investments for trading or speculative purposes.
As of December 31, 2014, we held $17.9 million of our $54.7 million of cash and cash equivalents in accounts of our subsidiaries outside of the United States. We currently plan to use this cash to fund our ongoing non-U.S. operations. However, if we were to attempt to repatriate those amounts to meet future U.S. cash needs, we may incur tax liabilities that could limit our ability to fund our U.S. operations or obligations using cash and cash equivalents held outside the United States.
Cash Flows from Operating Activities
Cash flows from operating activities are an additional measure of our overall business performance, as it enables us to analyze our financial performance without the effects of certain non-cash items such as depreciation, amortization and stock-based compensation expense.
Cash used in operating activities during the year ended December 31, 2014 primarily consisted of a net loss of $26.0 million as well as working capital requirements and other activities of $6.7 million, offset by approximately $15.9 million of non-cash related expenses. The decrease in cash used from operating activities during the year ended December 31, 2014 compared to 2013 was primarily due to an increase in adjustments from non-cash related items in 2014, which was partially offset by increased accounts receivable balances in 2014.
For the year ended December 31, 2013, operating activities used $20.5 million in cash, primarily as a result of a net loss of $15.3 million as well as working capital requirements and other activities of $5.2 million as business activity accelerated.
For the year ended December 31, 2012, operating activities used $22.4 million in cash, primarily as a result of a net loss of $15.6 million as well as working capital requirements and other activities of $(6.8) million as business activity accelerated.
Cash Flows from Investing Activities
Our investing activities have consisted primarily of business combinations as well as purchases of equipment, including software.
For the year ended December 31, 2014, net cash used for investing activities was $10.3 million, compared to $2.8 million in 2013. Cash used in investing activities increased by $7.5 million during the year ended December 31, 2014 compared to the same period in the prior year, primarily due to our acquisition of Stoke during 2014, which accounted for $5.2 million of the increase. The remaining increase of $2.3 million was due to the purchase of capital assets to support our continued growth.
For the year ended December 31, 2012, net cash used in investing activities was $5.2 million consisting primarily of capital expenditures.
Cash Flows from Financing Activities
Our financing activities have consisted primarily of the issuances of preferred stock in private financings, common stock in our initial public offering and the incurrence and repayment of indebtedness under loan arrangements.
For the year ended December 31, 2014, net cash provided by financing activities was $44.8 million, consisting primarily of proceeds of $41.7 million from our August 2014 follow-on public offering. We also increased our borrowings with Silicon Valley Bank by $1.9 million in connection with our acquisition of Stoke.
For the year ended December 31, 2013, net cash provided by financing activities was $55.4 million, consisting primarily of proceeds of $45.3 million from our initial public offering. In addition, we received net proceeds of $10.0 million from borrowings on our debt.
For the year ended December 31, 2012, net cash provided by financing activities was $14.3 million, consisting primarily of proceeds from borrowings on debt.
Silicon Valley Bank Loans. On October 18, 2012, we entered into loan agreements with Silicon Valley Bank (“SVB”) for 2 loans totaling $32.5 million. The loans included a $22.5 million Senior Loan secured by substantially all of our assets, including intellectual property, and a $10.0 million Subordinated Loan with a three year term and a fixed rate of 11%, which was also secured by substantially all of our assets, including intellectual property.
On March 6, 2014, we entered into an Amended and Restated Agreement with SVB to replace both the Senior Loan and the Subordinated Loan. The Amended and Restated Agreement includes a P5Y-year term loan of $25.0 million (“Term Loan”), a $15.0 million secured revolving line of credit (“Revolver”) and a $5 million secured line for letters of credit, foreign exchange and cash management services. The Term Loan had an initial floating interest rate of 2.75% above the U.S. prime rate, subject to a minimum interest rate of 4.25% and is secured by substantially all of our assets, including intellectual property. At December 31, 2014, the interest rate was 5.25%. The Term Loan initially provided for monthly payments of interest only until
56
April 1, 2015; thereafter we were required to repay the outstanding principal amount in 48 monthly installments. The Term Loan has a maturity of March 1, 2019.
Under the Revolver, we may draw up to 80% of eligible domestic trade receivables, 70% of eligible foreign trade receivables and 35% of eligible accrued but unbilled accounts up to a maximum of $15.0 million. The Revolver has a three-year term and bears interest at a floating interest rate of 1% above the U.S. prime rate, subject to a minimum interest rate of 4.25% and is secured by substantially all of our assets, including intellectual property. We are also required to pay an unused facility fee, monthly in arrears, of 0.25% per annum of the unused amount of the Revolver. The Revolver may be prepaid at any time without penalty. As of December 31, 2014, we had no borrowings outstanding on the Revolver and had $15.0 million available. At December 31, 2014, the interest rate was 5.5%.
In connection with the Stoke Acquisition, on November 19, 2014, we entered into a Consent, Joinder and Second Loan Modification Agreement with SVB ("Second Loan Modification Agreement"). Under the terms of the Second Loan Modification Agreement, the former Stoke, Inc. became a borrower under our loan agreements with SVB and granted a security interest to SVB in substantially all of its assets. Our Term Loan was increased from $25.0 million to $26.9 million, and the increase used to repay approximately $1.9 million of outstanding indebtedness owed by Stoke, Inc. to SVB. The interest rate on our Term Loan was reduced by 0.50%, from prime plus 2.75% to prime plus 2.25%.
In connection with the Ulticom acquisition, on January 16, 2015, we entered into a Consent and Third Loan Modification Agreement with SVB ("Third Loan Modification Agreement"). Under the terms of the Third Loan Modification Agreement, SVB consented to the acquisition of Ulticom provided that it join as a borrower under our loan agreements with SVB. Additionally, the interest-only period of the Term Loan was extended from April 1, 2015 until January 1, 2016, meaning that we will not be required to begin making principal payments under the Term Loan until January 1, 2016.
The Silicon Valley Bank loan agreements contain certain restrictive covenants, and the Senior Loan requires us to maintain a minimum tangible net worth at all times. At December 31, 2014, we were in default under of our minimum EBITDA covenant. We sought and obtained a waiver for this breach. The agreements also contain usual and customary events of default, the occurrence of which may result in all outstanding amounts under the loan agreements becoming due and payable immediately, and they also impose an interest penalty of an additional 5% above the otherwise applicable interest rate at any time when an event of default is continuing.
Silver Lake Waterman Growth Capital Loan. On June 4, 2013, we entered into a loan agreement with Silver Lake Waterman Fund, L.P. (“Silver Lake Loan”), for a $15.0 million subordinated term loan. The Silver Lake Loan bore interest at 12% annually and was repaid on March 5, 2014, using funds from our initial public offering.
Operating and Capital Expenditure Requirements
We believe the net proceeds from our initial public offering, our follow-on public offering, together with the Silicon Valley Bank loan and cash generated from operations, our cash balances and interest income we earn on these balances, will be sufficient to meet our anticipated cash requirements through at least the next twelve months. In the future, we expect our operating and capital expenditures to increase as we increase headcount, expand our business activities, grow our customer base, implement and enhance our information technology and enterprise resource planning system and operate as a public company. As revenues increase, we expect our accounts receivable balance to increase. Any such increase in accounts receivable may not be completely offset by increases in accounts payable and accrued expenses, which would likely result in greater working capital requirements.
If our available cash balances are insufficient to satisfy our liquidity requirements, we may seek to sell equity or convertible debt securities or enter into additional credit facilities. The sale of equity and convertible debt securities may result in dilution to our stockholders and those securities may have rights senior to those of our common shares. If we raise additional funds through the issuance of convertible debt securities, these securities could contain covenants that would restrict our operations. We may require additional capital beyond our currently anticipated amounts. Additional capital may not be available on reasonable terms, or at all.
Our estimates of the period of time through which our financial resources will be adequate to support our operations and the costs to support research and development and our sales and marketing activities are forward-looking statements and involve risks and uncertainties and actual results could vary materially and negatively as a result of a number of factors, including the factors discussed in the section “Risk Factors” of this Annual Report on Form 10-K. We have based our estimates on assumptions that may prove to be wrong and we could utilize our available capital resources sooner than we currently expect.
57
Our short- and long-term capital requirements will depend on many factors, including the following:
• | our development of new products; |
• | market acceptance of our products and our competitive position in the marketplace; |
• | our ability to generate cash from operations; |
• | our ability to control our costs; |
• | the emergence of competing or complementary technological developments; |
• | the costs of filing, prosecuting, defending and enforcing any patent claims and other intellectual property rights or participating in litigation-related activities; and |
• | the acquisition of businesses, products and technologies. |
Contractual Obligations
We have contractual obligations relating to our office lease as well as loans from commercial banks.
The following table discloses aggregate information about our contractual obligations and periods in which payments are due as of December 31, 2014 (in thousands):
Payments Due By Period | |||||||||||||||||||
Total | Less Than 1 Year | 1-3 Years | 3-5 Years | More Than 5 Years | |||||||||||||||
Operating Leases | $ | 9,238 | $ | 3,456 | $ | 4,001 | $ | 1,305 | $ | 476 | |||||||||
Silicon Valley Bank senior loan (1) | 26,900 | 5,044 | 13,450 | 8,406 | — | ||||||||||||||
Total | $ | 36,138 | $ | 8,500 | $ | 17,451 | $ | 9,711 | $ | 476 | |||||||||
(1) In January of 2015, in connection with the closing of Ulticom, we amended our credit facility to extend the monthly interest only payments until April 2016
Operating leases relate to our office leases for various locations across the globe. We have several office leases expiring at different times through 2019. Our principal office leases are in Richardson, Texas, Reading, UK, and Bangalore, India.
Off-Balance Sheet Arrangements
As of December 31, 2014, we did not have any off-balance sheet arrangements, as defined in Item 303(a)(4)(ii) of SEC Regulation S-K.
Non-GAAP Financial Measures
In addition to our GAAP operating results, we use certain non-GAAP financial measures when planning, monitoring, and evaluating our performance. We consider these non-GAAP financial measures to be useful metrics for management and investors to facilitate operating performance comparisons from period to period by excluding potential differences caused by variations in capital structures, tax position, depreciation, amortization, stock-based compensation expense and certain other expenses. While we believe that these non-GAAP financial measures are useful in evaluating our business, this information should be considered as supplemental in nature and is not meant as a substitute for revenue recognized in accordance with GAAP. In addition, other companies, including companies in our industry, may calculate such measures differently, which reduces its usefulness as a comparative measure. We believe that these non-GAAP measures reflect our ongoing business in a manner that allows for meaningful period-to-period comparisons and analysis of trends in our business.
The presentation of non-GAAP net loss, non-GAAP net loss per share, non-GAAP gross profit, non-GAAP operating loss and other non-GAAP financial measures in this Annual Report on Form 10-K is not meant to be a substitute for “net loss,” “net loss per share,” “gross profit,” “operating loss” or other financial measures presented in accordance with GAAP, but rather should be evaluated in conjunction with such data. Our definition of “non-GAAP net loss,” “non-GAAP net loss per share,” “non-GAAP gross profit,” “non-GAAP operating loss” and other non-GAAP financial measures may differ from similarly titled non-GAAP measures used by other companies and may differ from period to period. In reporting non-GAAP measures in the future, we may make other adjustments for expenses and gains we do not consider reflective of core operating performance in a particular period and may modify “non-GAAP net loss,” “non-GAAP net loss per share,” “non-GAAP gross profit,” “non-GAAP operating loss” and such other non-GAAP measures by excluding these expenses and gains.
58
Non-GAAP gross profit, software products gross profit and maintenance gross profit. We define non-GAAP gross profit as gross profit plus stock-based compensation expense and amortization and depreciation expense. We consider non-GAAP gross profit to be a useful metric for management and our investors because it excludes the effect of certain non-cash expenses, allowing for a comparison of our sales margins over multiple periods.
Non-GAAP operating expenses, research and development expense, sales and marketing expense, and general and administrative expense. We define non-GAAP operating expenses as operating expense plus stock-based compensation expense and amortization and depreciation expense allocated to research and development, sales and marketing and general and administrative expenses. Similarly, we define non-GAAP research and development, sales and marketing and general and administrative expenses as the relevant GAAP measure plus stock-based compensation expense, amortization and depreciation expense and acquisition related transaction costs and restructuring charges allocated to the particular expense item.
Non-GAAP operating loss. We define non-GAAP operating loss as operating loss plus stock-based compensation expense, amortization and depreciation expense, acquisition related transaction costs and restructuring charges. We consider non-GAAP operating loss to be a useful metric for management and investors because it excludes the effect of certain non-cash expenses so management and investors can compare our core business operating results over multiple periods.
Non-GAAP net loss. We define non-GAAP net loss as non-GAAP operating loss after interest and taxes. We consider non-GAAP net loss to be a useful metric for management and investors because it excludes the effect of certain non-cash expenses and foreign exchange gains and losses that are shown on the consolidated statement of operations and comprehensive loss. Excluding Foreign exchange gains and losses helps management and investors compare our results to companies without such charges and over multiple periods, as foreign exchange gain or loss is difficult to predict and can vary greatly over multiple periods.
Non-GAAP net loss per share. We define non-GAAP net loss per share as non-GAAP net income divided by the adjusted weighted average common shares outstanding, which assumes the conversion of preferred shares at the beginning of the period.
59
Mavenir Systems, Inc. and Subsidiaries
Reconciliation of GAAP Financial Measures to Non-GAAP Financial Measures
(in thousands)
(unaudited)
Year Ended December 31, | |||||||||||
2014 | 2013 | 2012 | |||||||||
Software Products | |||||||||||
Revenue | $ | 104,216 | $ | 79,342 | $ | 52,409 | |||||
Cost of revenue | 46,102 | 35,971 | 23,891 | ||||||||
Amortization and depreciation | 1,101 | 592 | 1,067 | ||||||||
Stock-based compensation | 582 | 187 | — | ||||||||
Gross profit (GAAP) | 58,114 | 43,371 | 28,518 | ||||||||
Gross profit (Non-GAAP) | 59,797 | 44,150 | 29,585 | ||||||||
Maintenance | |||||||||||
Revenue | 25,579 | 21,966 | 21,431 | ||||||||
Cost of revenue | 12,747 | 9,202 | 6,568 | ||||||||
Gross profit (GAAP) | 12,832 | 12,764 | 14,863 | ||||||||
Gross profit (Non-GAAP) | 12,832 | 12,764 | 14,863 | ||||||||
Total Revenue | 129,795 | 101,308 | 73,840 | ||||||||
Total Gross Profit (GAAP) | 70,946 | 56,135 | 43,381 | ||||||||
Gross Profit Margin % (GAAP) | 54.7 | % | 55.4 | % | 58.8 | % | |||||
Gross Profit (Non-GAAP) | 72,629 | 56,914 | 44,448 | ||||||||
Gross Profit Margin % (Non-GAAP) | 56 | % | 56.2 | % | 60.2 | % | |||||
Operations Expenses | |||||||||||
R&D (GAAP) | 30,459 | 22,775 | 23,312 | ||||||||
Amortization and depreciation | 2,083 | 1,150 | 792 | ||||||||
Stock-based compensation | 787 | 321 | — | ||||||||
R&D (Non-GAAP) | 27,589 | 21,304 | 22,520 | ||||||||
S&M (GAAP) | 34,208 | 20,485 | 20,580 | ||||||||
Amortization and depreciation | — | — | — | ||||||||
Stock-based compensation | 1,032 | 482 | — | ||||||||
S&M (Non-GAAP) | 33,176 | 20,003 | 20,580 | ||||||||
G&A (GAAP) | 23,351 | 20,583 | 14,052 | ||||||||
Amortization and depreciation | 2,240 | 2,264 | 2,189 | ||||||||
Stock-based compensation | 2,154 | 640 | 291 | ||||||||
Acquisition related transaction costs | 728 | — | — | ||||||||
Acquisition related restructuring charges | 51 | — | — | ||||||||
G&A (Non-GAAP) | 18,178 | 17,679 | 11,572 | ||||||||
Total Operating Expenses (GAAP) | 88,018 | 63,843 | 57,944 | ||||||||
Operating Expenses (Non-GAAP) | 78,943 | 58,986 | 54,672 | ||||||||
Operating Loss (GAAP) | $ | (17,072 | ) | $ | (7,708 | ) | $ | (14,563 | ) | ||
Net interest | 1,966 | 3,185 | 383 | ||||||||
Loss on early extinguishment of debt | 1,783 | — | — | ||||||||
Foreign exchange loss (gain) | 4,699 | 1,901 | (529 | ) | |||||||
Income taxes | 516 | 2,496 | 1,152 | ||||||||
Net Loss (GAAP) | $ | (26,036 | ) | $ | (15,290 | ) | $ | (15,569 | ) | ||
Operating Loss (Non-GAAP) | $ | (6,314 | ) | $ | (2,072 | ) | $ | (10,224 | ) | ||
Net interest | 1,966 | 3,185 | 383 | ||||||||
Income taxes | 516 | 2,496 | 1,152 | ||||||||
Adjusted for uncertain tax positions component | 142 | — | — | ||||||||
Net Loss (Non-GAAP) | $ | (8,938 | ) | $ | (7,753 | ) | $ | (11,759 | ) | ||
60
Mavenir Systems, Inc. and Subsidiaries
Non-GAAP Net Loss Per Share
(all shares are weighted-average outstanding for period presented)
(In thousands, except per share data)
(unaudited)
Year Ended December 31, | |||||||||||
2014 | 2013 | 2012 | |||||||||
GAAP weighted average common shares outstanding | $ | 25,988 | $ | 4,278 | $ | 1,288 | |||||
Conversion of preferred shares * | — | 14,259 | 16,452 | ||||||||
Adjusted weighted average common shares outstanding | 25,988 | 18,537 | 17,740 | ||||||||
Non-GAAP net loss | $ | (8,938 | ) | $ | (7,753 | ) | $ | (11,759 | ) | ||
Non-GAAP net loss per share | $ | (0.34 | ) | $ | (0.42 | ) | $ | (0.66 | ) | ||
* | Assumes conversion of preferred shares at beginning of period |
Implications of Being an Emerging Growth Company
While we are an emerging growth company, as defined under the Jumpstart Our Business Startups Act of 2012 (JOBS Act), we are subject to certain reduced public company reporting requirements. For example, until we are no longer an emerging growth company, we will not be required to comply with the auditor attestation requirements of Section 404(b) of the Sarbanes-Oxley Act and we will be exempt from any rules that may be adopted by the Public Company Accounting Oversight Board requiring mandatory audit firm rotations or a supplement to the independent registered public accounting firm’s report on financial statements. We could remain an emerging growth company until as late as December 31, 2018 (the fiscal year-end following the fifth anniversary of our IPO).
Item 7A. | Quantitative and Qualitative Disclosures About Market Risk |
We are exposed to market risk related to inflation, changes in interest rates and foreign currency exchange rates. We do not use derivative financial instruments for speculative, hedging or trading purposes, although in the future we may enter into interest rate or exchange rate hedging arrangements to manage the risks described below.
Inflation Risk
We may be exposed to inflation risk in that some of our international operations, particularly in developing countries, may be subject to increased costs as a result of higher inflation. Because we compete with other solutions providers on a global basis, our customers would not expect, and may not be willing, to pay for any cost increases from inflation. Therefore, our future margins could be impacted. Where competitively possible we attempt to offset some of this risk with contracted price adjustments.
Interest Rate Risk
Cash held in our operating business units is generally available for local operations. Most of our cash is retained by our U.S. business. The majority of these funds are in low to zero interest bank accounts. Our borrowings under our senior loan with Silicon Valley Bank are at variable rates based on the U.S. prime rate and, as a result, increases in interest rates would generally result in increased interest expense on outstanding borrowings. A one-percent increase above the minimum floor calculation would increase our interest expense by as much as $0.3 million if the entire facility were drawn throughout the year.
Foreign Currency Exchange Risk
We have significant international operations with subsidiaries and operations in eight countries outside of the U.S. and as such we face exposure to adverse movements in foreign currency exchange rates. While these exposures may change over time as business practices evolve, adverse movements in foreign currency exchange rates may have a material adverse impact on our financial results. Our primary exposures have been related to non-U.S. dollar-denominated net operating income or net operating losses. As a consequence, our results of operations would generally be adversely affected by an increase in the value of the U.S. dollar relative to the currencies of the countries in which we are profitable and a decrease in the value of the U.S.
61
dollar relative to the currencies of the countries in which we are not profitable. However, based on the locations of our international operations and the amount of our operating results denominated in foreign currencies, we would not expect a 10% change in the value of the U.S. dollar from rates as of December 31, 2014, to have a material effect on our financial position or results of operations. If and when our international business grows substantially, relative to our U.S. business, the net exposure is likely to increase as will the impact of foreign exchange rate movements.
The functional currency for each of our non-U.S. subsidiaries is the applicable local currency. Assets and liabilities of a non-U.S. subsidiary are translated to U.S. dollars at period end exchange rates. Income and expense items are translated at the rates of exchange prevailing during the year. The adjustments resulting from translating the financial statements of the non-U.S. subsidiary are reflected in comprehensive income or loss.
Foreign currency transaction gains and losses that arise from exchange rate fluctuations on transactions denominated in a currency other than the functional currency are included in the results of operations as incurred. Intercompany foreign currency transactions that are not of a long-term investment nature affect functional currency cash flows and are accounted for as currency transaction gains and losses and included in determining net income (loss). Intercompany transactions are considered to be of a long-term investment nature if settlement is not planned or anticipated in the foreseeable future.
We had $4.7 million of net foreign currency transaction losses for 2014, $1.9 million of net transaction losses for 2013 and $0.5 million of net transaction gains for 2012.
Item 8. | Financial Statements and Supplementary Data |
62
INDEX TO CONSOLIDATED FINANCIAL STATEMENTS
Report of BDO USA, LLP., Independent Registered Public Accounting Firm | |
Consolidated Balance Sheets as of December 31, 2014 and 2013 | |
Consolidated Statements of Operations and Comprehensive Loss for the years ended December 31, 2014, 2013, and 2012 | |
Consolidated Statements of Changes in Shareholders’ Equity for the years ended December 31, 2014, 2013, and 2012 | |
Consolidated Statements of Cash Flows for the years ended December 31, 2014, 2013, and 2012 | |
Notes to the Consolidated Financial Statements | |
63
Report of Independent Registered Public Accounting Firm
Board of Directors and Stockholders
Mavenir Systems, Inc.
Richardson, Texas
We have audited the accompanying consolidated balance sheets of Mavenir Systems, Inc. and Subsidiaries (the “Company”) as of December 31, 2014 and 2013 and the related consolidated statements of operations and comprehensive loss, shareholders’ equity and cash flows for each of the three years in the period ended December 31, 2014. These financial statements are the responsibility of the Company’s management. Our responsibility is to express an opinion on these financial statements based on our audits.
We conducted our audits in accordance with the standards of the Public Company Accounting Oversight Board (United States). Those standards require that we plan and perform the audit to obtain reasonable assurance about whether the financial statements are free of material misstatement. The Company is not required to have, nor were we engaged to perform, an audit of its internal control over financial reporting. Our audits included consideration of internal control over financial reporting as a basis for designing audit procedures that are appropriate in the circumstances, but not for the purpose of expressing an opinion on the effectiveness of the Company’s internal control over financial reporting. Accordingly, we express no such opinion. An audit also includes examining, on a test basis, evidence supporting the amounts and disclosures in the financial statements, assessing the accounting principles used and significant estimates made by management, as well as evaluating the overall financial statement presentation. We believe that our audits provide a reasonable basis for our opinion.
In our opinion, the consolidated financial statements referred to above present fairly, in all material respects, the financial position of Mavenir Systems, Inc. and Subsidiaries at December 31, 2014 and 2013, and the results of its operations and its cash flows for each of the three years in the period ended December 31, 2014, in conformity with accounting principles generally accepted in the United States of America.
/s/ BDO USA, LLP
Dallas, Texas
March 3, 2015
64
Mavenir Systems, Inc. and Subsidiaries
Consolidated Balance Sheets
(in thousands, except per share amounts)
December 31, | |||||||
2014 | 2013 | ||||||
Assets | (as adjusted, see Note 1) | ||||||
Current assets: | |||||||
Cash and cash equivalents | $ | 54,699 | $ | 38,930 | |||
Accounts receivable, net of allowance of $269 and $587 at December 31, 2014, and December 31, 2013, respectively | 38,525 | 23,641 | |||||
Unbilled revenue | 13,714 | 11,213 | |||||
Inventories | 3,853 | 7,109 | |||||
Prepaid expenses and other current assets | 2,434 | 3,614 | |||||
Deferred contract costs | 5,705 | 9,313 | |||||
Total current assets | 118,930 | 93,820 | |||||
Non-current assets: | |||||||
Property and equipment, net | 6,598 | 5,054 | |||||
Intangible assets, net | 8,180 | 5,202 | |||||
Deposits and other assets | 1,977 | 1,657 | |||||
Deferred tax assets | 1,008 | — | |||||
Goodwill | 2,828 | 866 | |||||
Total assets | $ | 139,521 | $ | 106,599 | |||
Liabilities and shareholders’ equity: | |||||||
Current liabilities: | |||||||
Trade accounts payable | $ | 7,573 | $ | 7,152 | |||
Accrued liabilities | 17,844 | 11,939 | |||||
Deferred revenue | 15,671 | 15,417 | |||||
Income tax payable | — | 765 | |||||
Current portion of long-term debt | 5,044 | — | |||||
Total current liabilities | 46,132 | 35,273 | |||||
Non-current liabilities: | |||||||
Uncertain tax positions | 3,051 | 3,153 | |||||
Long-term deferred revenue and other liabilities | 1,818 | 719 | |||||
Long-term debt | 21,797 | 23,423 | |||||
Total liabilities | 72,798 | 62,568 | |||||
Commitments and contingencies | |||||||
Shareholders’ equity: | |||||||
Common stock, $0.001 par value. 300,000 shares authorized; 28,915 and 23,421 shares issued and outstanding at December 31, 2014, and December 31, 2013, respectively. | 29 | 23 | |||||
Additional paid-in capital | 202,662 | 155,198 | |||||
Accumulated deficit | (138,223 | ) | (112,187 | ) | |||
Accumulated other comprehensive income | 2,255 | 997 | |||||
Total shareholders’ equity | 66,723 | 44,031 | |||||
Total liabilities and shareholders’ equity | $ | 139,521 | $ | 106,599 | |||
See Accompanying Notes to Consolidated Financial Statements
65
Mavenir Systems, Inc. and Subsidiaries
Consolidated Statements of Operations and Comprehensive Loss
(in thousands, except per share data)
Year Ended December 31, | |||||||||||
2014 | 2013 | 2012 | |||||||||
Revenues | |||||||||||
Software products | $ | 104,216 | $ | 79,342 | $ | 52,409 | |||||
Maintenance | 25,579 | 21,966 | 21,431 | ||||||||
129,795 | 101,308 | 73,840 | |||||||||
Cost of revenues | |||||||||||
Software products | 46,102 | 35,971 | 23,891 | ||||||||
Maintenance | 12,747 | 9,202 | 6,568 | ||||||||
58,849 | 45,173 | 30,459 | |||||||||
Gross profit | 70,946 | 56,135 | 43,381 | ||||||||
Operating expenses: | |||||||||||
Research and development | 30,459 | 22,775 | 23,312 | ||||||||
Sales and marketing | 34,208 | 20,485 | 20,580 | ||||||||
General and administrative | 23,351 | 20,583 | 14,052 | ||||||||
Total operating expenses | 88,018 | 63,843 | 57,944 | ||||||||
Operating loss | (17,072 | ) | (7,708 | ) | (14,563 | ) | |||||
Other expense (income): | |||||||||||
Interest and other income | (102 | ) | (18 | ) | (10 | ) | |||||
Interest and other expense | 2,068 | 3,203 | 393 | ||||||||
Loss on early extinguishment of debt | 1,783 | — | — | ||||||||
Foreign exchange loss (gain) | 4,699 | 1,901 | (529 | ) | |||||||
Total other expense (income), net | 8,448 | 5,086 | (146 | ) | |||||||
Loss before income tax | (25,520 | ) | (12,794 | ) | (14,417 | ) | |||||
Income tax (benefit) expense | 516 | 2,496 | 1,152 | ||||||||
Net loss | $ | (26,036 | ) | $ | (15,290 | ) | $ | (15,569 | ) | ||
Other comprehensive income (loss) | |||||||||||
Foreign currency translation adjustments | 1,258 | (569 | ) | 387 | |||||||
Total comprehensive loss | $ | (24,778 | ) | $ | (15,859 | ) | $ | (15,182 | ) | ||
Net loss per common share: | |||||||||||
Basic | $ | (1.00 | ) | $ | (3.57 | ) | $ | (12.09 | ) | ||
Diluted | $ | (1.00 | ) | $ | (3.57 | ) | $ | (12.09 | ) | ||
Weighted average common shares outstanding: | |||||||||||
Basic and diluted | 25,988 | 4,278 | 1,288 | ||||||||
See Accompanying Notes to Consolidated Financial Statements
66
Mavenir Systems, Inc. and Subsidiaries
Consolidated Statements of Changes in Shareholders’ Equity
(in thousands)
Additional | Accumulated Other | Total | ||||||||||||||||||||
Common Stock | Paid-In | Accumulated | Comprehensive | Stockholders’ | ||||||||||||||||||
Shares | Amount | Capital | Deficit | Income (Loss) | Equity | |||||||||||||||||
Balance as of January 1, 2012 (See Note 1) | 1,216 | $ | 1 | $ | 1,846 | $ | (81,328 | ) | $ | 1,179 | $ | (78,302 | ) | |||||||||
Exercise of stock options | 122 | — | 73 | — | — | 73 | ||||||||||||||||
Stock-based compensation expense | — | — | 291 | — | — | 291 | ||||||||||||||||
Warrants issued | — | — | 325 | — | — | 325 | ||||||||||||||||
Net loss | — | — | — | (15,569 | ) | — | (15,569 | ) | ||||||||||||||
Foreign currency translation adjustment | — | — | — | — | 387 | 387 | ||||||||||||||||
Balance as of December 31, 2012 | 1,338 | $ | 1 | $ | 2,535 | $ | (96,897 | ) | $ | 1,566 | $ | (92,795 | ) | |||||||||
Issuance of common stock upon initial public offering, net of offering costs | 5,466 | 6 | 44,759 | — | — | 44,765 | ||||||||||||||||
Conversion of preferred stock to common stock upon initial public offering | 16,453 | 16 | 104,542 | — | — | 104,558 | ||||||||||||||||
Exercise of stock options | 163 | — | 91 | — | — | 91 | ||||||||||||||||
Stock-based compensation expense | — | — | 1,630 | — | — | 1,630 | ||||||||||||||||
Warrants exercised | 1 | — | 7 | — | — | 7 | ||||||||||||||||
Warrants issued | — | — | 1,634 | — | — | 1,634 | ||||||||||||||||
Net loss | — | — | — | (15,290 | ) | — | (15,290 | ) | ||||||||||||||
Foreign currency translation adjustment | — | — | — | — | (569 | ) | (569 | ) | ||||||||||||||
Balance as of December 31, 2013 | 23,421 | $ | 23 | $ | 155,198 | $ | (112,187 | ) | $ | 997 | $ | 44,031 | ||||||||||
Issuance of common stock upon follow-on public offering, net of offering costs | 4,090 | 4 | 41,682 | — | — | 41,686 | ||||||||||||||||
Exercise of stock options | 558 | 1 | 1,153 | — | — | 1,154 | ||||||||||||||||
Stock-based compensation expense | — | — | 4,555 | — | — | 4,555 | ||||||||||||||||
Warrants exercised | 846 | 1 | 74 | — | — | 75 | ||||||||||||||||
Net loss | — | — | — | (26,036 | ) | — | (26,036 | ) | ||||||||||||||
Foreign currency translation adjustment | — | — | — | — | 1,258 | 1,258 | ||||||||||||||||
Balance as of December 31, 2014 | 28,915 | $ | 29 | $ | 202,662 | $ | (138,223 | ) | $ | 2,255 | $ | 66,723 | ||||||||||
See Accompanying Notes to Consolidated Financial Statements
67
Mavenir Systems, Inc. and Subsidiaries
Consolidated Statements of Cash Flows
(in thousands)
Year Ended December 31, | |||||||||||
2014 | 2013 | 2012 | |||||||||
Operating activities: | |||||||||||
Net loss | $ | (26,036 | ) | $ | (15,290 | ) | $ | (15,569 | ) | ||
Adjustments to reconcile net loss to net cash used in operating activities: | |||||||||||
Depreciation of property and equipment | 3,345 | 2,472 | 1,527 | ||||||||
Amortization of intangible assets | 2,079 | 1,534 | 2,521 | ||||||||
Amortization of debt discount | 122 | 357 | 25 | ||||||||
Provision for bad debt | (281 | ) | 537 | 199 | |||||||
Stock-based compensation expense | 4,555 | 1,630 | 291 | ||||||||
Unrealized foreign currency loss/(gain) | 3,754 | 74 | (1,194 | ) | |||||||
Loss on early extinguishment of debt | 1,783 | — | — | ||||||||
Write-off of assets | 61 | 2 | 281 | ||||||||
Deferred income tax | (602 | ) | (50 | ) | — | ||||||
Changes in operating assets and liabilities: | |||||||||||
Accounts receivable | (15,736 | ) | (8,565 | ) | (103 | ) | |||||
Unbilled revenue | (3,143 | ) | (1,480 | ) | (2,735 | ) | |||||
Deposits and other assets | (1,167 | ) | (327 | ) | 1,126 | ||||||
Inventories | 4,740 | (4,854 | ) | (20 | ) | ||||||
Prepaid expenses | 1,937 | 2,290 | (3,556 | ) | |||||||
Deferred contract costs | 3,279 | (3,821 | ) | (1,770 | ) | ||||||
Deferred revenues | (757 | ) | 3,151 | (9,734 | ) | ||||||
Accounts payable and accrued liabilities | 4,763 | 1,842 | 6,324 | ||||||||
Net cash used in operating activities | (17,304 | ) | (20,498 | ) | (22,387 | ) | |||||
Investing activities: | |||||||||||
Acquisition of Stoke, net of cash acquired | (5,225 | ) | — | — | |||||||
Purchases of property and equipment | (5,039 | ) | (2,798 | ) | (5,217 | ) | |||||
Net cash used in investing activities | (10,264 | ) | (2,798 | ) | (5,217 | ) | |||||
Financing activities: | |||||||||||
Proceeds from initial public offering, net of offering costs | — | 45,348 | — | ||||||||
Proceeds from follow-on public offering, net of offering costs | 41,686 | — | — | ||||||||
Borrowing of long-term debt | 26,900 | 27,000 | 5,000 | ||||||||
Repayments of long-term debt | (15,000 | ) | (17,000 | ) | — | ||||||
Borrowing from line of credit | — | — | 13,000 | ||||||||
Repayments of line of credit borrowing | (10,000 | ) | — | (3,814 | ) | ||||||
Exercise of options and warrants to purchase common stock | 1,228 | 91 | 73 | ||||||||
Net cash provided by financing activities | 44,814 | 55,439 | 14,259 | ||||||||
Effect of foreign currency exchange rate changes on cash and cash equivalents | (1,477 | ) | (615 | ) | 1,281 | ||||||
Net increase (decrease) in cash and cash equivalents | 15,769 | 31,528 | (12,064 | ) | |||||||
Cash and cash equivalents at beginning of year | 38,930 | 7,402 | 19,466 | ||||||||
Cash and cash equivalents at end of year | $ | 54,699 | $ | 38,930 | $ | 7,402 | |||||
Supplemental cash flow information: | |||||||||||
Cash paid for interest | $ | 1,454 | $ | 2,449 | $ | 83 | |||||
Income tax payments, net | $ | 1,000 | $ | 346 | $ | 47 | |||||
Non-cash financing activities | |||||||||||
Conversion of preferred stock into common stock | $ | — | $ | 104,558 | $ | — | |||||
Unpaid offering costs in additional paid-in-capital | $ | — | $ | 583 | $ | — | |||||
Issuance of warrants | $ | — | $ | 1,634 | $ | 325 | |||||
Cashless exercise of warrants | $ | 1 | $ | 7 | $ | — | |||||
See Accompanying Notes to Consolidated Financial Statements
68
Mavenir Systems, Inc. and Subsidiaries
Notes to Consolidated Financial Statements
1. Description of the Business and Basis of Presentation
Description of Business
Throughout these consolidated financial statements, Mavenir Systems, Inc. is referred to as “Mavenir,” the “Company,” “we,” “us” and “our.”
Mavenir was originally formed as a limited liability company on April 26, 2005. We were incorporated under the laws of Texas in August 2005, and subsequently incorporated under the laws of the state of Delaware in March 2006.
We are a leading provider of software-based telecommunications networking solutions that enable mobile service providers to deliver internet protocol (IP)-based voice, video, rich communication and enhanced messaging services to their subscribers globally. Our solutions deliver Rich Communication Suite (“RCS”)-based services, which enable enhanced mobile communications such as group text messaging, multi-party voice or video calling and live video streaming as well as the exchange of files or images, over existing 2G and 3G networks as well as next generation 4G networks. Our solutions also deliver voice services over Long Term Evolution (“LTE”) technology and wireless (“Wi-Fi”) networks known respectively as Voice over LTE (“VoLTE”) and Voice over Wi-Fi (“VoWi-Fi”).
We are headquartered in Richardson, Texas, and have research and development personnel located at our wholly-owned subsidiaries in China and India. Additionally, we have a sales and operations presence in the Asia Pacific (“APAC”) and the Europe, Middle East and Africa (“EMEA”) regions.
On November 18, 2014, we acquired Stoke, Inc., a Delaware corporation (the "Stoke Acquisition" or "Stoke"). Stoke provides mobile gateway solutions to the broadband network industry. The Stoke acquisition is included in the consolidated financial statements from the date of acquisition.
Basis of Presentation and Consolidation
The consolidated financial statements have been prepared in accordance with accounting principles generally accepted in the United States of America and include the accounts of Mavenir and its wholly-owned subsidiaries (collectively, the “Company” or “we”). All intercompany accounts and transactions have been eliminated in consolidation.
Reclassifications
Certain prior year amounts have been reclassified to conform to current year presentation. Specifically, the beginning balance of our uncertain tax positions presented in Note 12 is now presented gross, in accordance with Financial Accounting Standard Board (“FASB”) Accounting Standards Codification (“ASC”) 740, Income Taxes, and the amounts are now presented separately as components of non-current liabilities on the consolidated balance sheet.
Additionally, at December 31, 2013, approximately $0.4 million of deferred revenue is now classified as a non-current liability.
Revision of Prior Period Financial Statements and Out-of-Period Adjustment
During our review of the three months ended March 31, 2014, we identified a non-cash error that originated in prior periods. The error related to performance-based warrants issued to a channel partner in 2008, earned in 2011 and exercised in April of 2014. The achievement of the performance milestone occurred in 2011 and would have resulted in a reduction to revenue of $1.3 million in 2011. We assessed the materiality of this error in accordance with the SEC guidance on considering the effects of prior period misstatements based on an analysis of quantitative and qualitative factors. Based on this analysis, we determined that the error was immaterial to the prior reporting periods affected and, therefore, amendments of reports previously filed with the SEC were not required. However, we have concluded that correcting the error in our 2014 financial statements would materially impact our results for the quarter ended March 31, 2014 and the year ending December 31, 2014. Accordingly, we have reflected the correction of this prior period error in the period in which it originated and revised our consolidated balance sheet as of December 31, 2013, as presented in this Annual Report on Form 10-K. In addition, a reduction to accumulated deficit has been reflected as an adjustment to the beginning balance for the earliest year presented.
69
The effect of the immaterial correction on the consolidated balance sheet as of December 31, 2013 is as follows (in thousands):
As Reported | Correction | As Revised | |||||||||
Other shareholders’ equity | $ | 1,020 | $ | — | $ | 1,020 | |||||
Additional paid-in capital | 153,878 | 1,320 | 155,198 | ||||||||
Accumulated deficit | (110,867 | ) | (1,320 | ) | $ | (112,187 | ) | ||||
Total shareholders’ equity | $ | 44,031 | $ | — | $ | 44,031 | |||||
2. Summary of Significant Accounting Policies
Business Combination
We account for business combinations under the acquisition method of accounting, which requires the assets acquired and liabilities assumed to be recorded at their respective fair values as of the acquisition date in our consolidated financial statements. The determination of estimated fair value may require management to make significant estimates and assumptions. The purchase price is the fair value of the total consideration conveyed to the seller and the excess of the purchase price over the fair value of the acquired identifiable net assets, where applicable, is recorded as goodwill. The results of operations of an acquired business are included in our consolidated financial statements from the date of acquisition. Costs associated with the acquisition of a business are expensed in the period incurred.
Cash and Cash Equivalents
Cash and cash equivalents consist of corporate bank accounts and money market funds with an original maturity of three months or less. For purposes of the statement of cash flows, we consider all highly liquid instruments with original maturities of three months or less to be cash equivalents. Cash balances consisted of U.S. Dollar, Australian Dollar (“AUD”), British Pound (“GBP”), Canadian Dollar (“CAD”), Chinese Yuan Renminbi (“CNY”), Croatian Kuna (“HRK”), European Union (“EURO”), Indian Rupee (“INR”), Malaysian Ringgit (“MYR”), Swedish Krona (“SEK”), Singapore Dollar (“SGD”), Japanese Yen ("JPY") and South Korean Won ("KRW").
Cash and cash equivalents are maintained at high credit-quality financial institutions. Balances may exceed the limits of government provided insurance, if applicable or available. We have never experienced any losses resulting from a financial institution failure or default. In 2014, FDIC insurance coverage is $0.3 million per depositor at each financial institution, and our non-interest bearing cash balances in the United States may again exceed federally insured limits.
Accounts Receivable
Our accounts receivable are primarily due from companies in the mobile telecommunications industry. Credit is extended based on evaluation of the customer’s financial condition and generally collateral is not required. Accounts receivable are determined by the payment milestones referenced and agreed to in each of the commercial agreements. Payment milestones vary by contract. Payment terms typically range from 30 to 60 days from invoice date. Accounts outstanding longer than the contractual payment term are considered past due (in thousands).
Allowance for doubtful accounts | Balance at Beginning of Period | Charged to Costs and Expense | Deductions | Balance at End of Period | |||||||||||
Year ended December 31, 2012 | $ | 641 | $ | 199 | $ | (458 | ) | $ | 382 | ||||||
Year ended December 31, 2013 | $ | 382 | $ | 537 | $ | (332 | ) | $ | 587 | ||||||
Year ended December 31, 2014 | $ | 587 | $ | (281 | ) | $ | (37 | ) | $ | 269 | |||||
Revenue Recognition
We generate revenues from the sale of software, hardware, professional services, and product support. Professional services consist primarily of software development and implementation services, but also can include training of customer personnel. Our products and services are generally sold as part of a contractual agreement, the terms of which are considered as a whole to determine the appropriate revenue recognition.
Our products and services are sold through distribution partners and directly through our sales force. We typically do not offer contractual rights of return, stock balancing or price protection to our distribution partners, however, we do offer certain price guarantees to a limited number of large customers. When appropriate, a reserve based on specific identification is recorded for estimated reductions to revenues for potential customer claims.
70
We recognize revenue when persuasive evidence of an arrangement exists, delivery has occurred, the sale price is fixed or determinable and collectability is reasonably assured. We recognize revenue in accordance with the provisions of ASC 985-605, Software Revenue Recognition, as amended, or with ASC 605-25 Multiple Element Arrangements (“MEAs”), with consideration to ASC 605-35, Construction-Type and Production-Type Contracts.
First, we determine if the contract's deliverables consist of tangible products that contain essential software elements and as such, are excluded from the software revenue recognition method of accounting. If the hardware included in the arrangement requires the software in order to be of value to the customer, then the hardware is considered tangible product with essential software elements.
Our software related products include software, non-essential hardware, maintenance, and typically involve significant professional services for customization and implementation of our software. We generally recognize all deliverables within our multiple element arrangements except maintenance using percentage of completion accounting for our projects based on hours incurred to date as a percentage of total budgeted hours. Revenue for hardware that is non-essential and not material to the project is recognized on a percentage of completion basis along with the software related products. Maintenance is allocated based on Vendor-Specific Objective Evidence (“VSOE”) using the residual method.
Our tangible products containing essential software MEAs typically include hardware, software essential to the functionality of the hardware, installation, and maintenance and are dependent on final customer acceptance, except maintenance, which is recognized ratably over the term of coverage. All multiple elements with tangible products containing essential software, except maintenance, are recognized upon fulfillment of delivery and installation, which is typically customer acceptance and the total transaction price is allocated using the relative selling price method based on the Estimated Selling Price (“ESP”) for the accepted product and maintenance.
Certain of our software products are delivered under contracts, which generally require significant integration within a customer’s production and business system environment. As the customer agreements generally require significant production, modification, or customization of the software, we account for these agreements under the percentage-of-completion method based on hours incurred to date compared to total hours expected under the contract. The percentage-of-completion method generally results in the recognition of consistent profit margins over the life of the contract since management has the ability to estimate contract billings and contract costs. We use the level of profit margin that is most likely to occur on a contract. If the most likely profit margin cannot be precisely determined, the lowest probable level of profit in the range of estimates is used until the results can be estimated more precisely. Under the percentage-of-completion method of accounting, management must also make key judgments in areas such as estimated project revenue and costs, total and remaining project hours, and potential customer claims. Changes in job performance, job conditions, estimated profitability, final contract settlements, and the resolution of claims may result in revised job costs and income amounts from what was originally estimated. At the time a loss on a contract is expected, the entire amount of the estimated loss is accrued.
Software contracts that do not qualify for use of the percentage-of-completion method, when reasonable estimates of percentage of completion are not available, are accounted for using the completed-contract method. Under the completed-contract method, all billings and related costs, net of anticipated losses, are deferred until completion of the contract.
During the second quarter of 2014, we determined it was possible to reasonably estimate percentage-of-completion on our Next Generation products. Next Generation product contracts entered into before this were accounted for using the completed-contract method and amounts due were billed in accordance with the schedule specified in each contractual arrangement. In 2014 and before, the majority of legacy product software contracts were accounted for using the percentage-of-completion accounting method since we could reasonably estimate the efforts required.
Customers are billed in accordance with specific contract terms, which may differ from the rate at which revenue is earned. Revenue recognized in excess of the amount billed is classified as unbilled revenue. Amounts received from customers pursuant to the terms specified in contracts, but for which revenue has not yet been recognized, are recorded as deferred revenue. We evaluate revenue recognition in accordance with ASC 605-45, Principal Agent Considerations, regarding gross versus net revenue recognition. We believe that our contractual arrangements meet the criteria for gross revenue recognition.
In certain situations, we sell software that does not require significant modification of services considered essential to the software’s functionality. Such software, generally consisting of capacity license upgrades, is recognized upon delivery if the other revenue recognition criteria are met.
Some of our software arrangements include services, such as training, not considered essential for the customer to be able to use the software for their purposes. When software services are not considered essential, the fee allocable to the service element is recognized as revenue as we perform the services. Revenue for hardware that is non-essential and not material to the project is recognized on a percentage-of-completion basis along with the software related products.
71
For software related products, each element of the arrangement is analyzed and a portion of the total arrangement fee is allocated to the elements based on the fair value of the element using VSOE of fair value, regardless of any separate prices stated within the contract for each element. Fair value is considered the price a customer would be required to pay if the element were sold separately based on our historical experience of stand-alone sales of these elements to third parties. For post-contract customer support (“PCS”) such as maintenance, we use renewal rates for continued support arrangements to determine fair value. For software services, we use the fair value we charge our customers when those services are sold separately. We monitor our transactions at least annually to ensure we maintain and periodically revise VSOE to reflect fair value.
The deliverables included in the MEAs are separated into more than one unit of accounting when (i) the delivered equipment has value to the customer on a stand-alone basis, and (ii) delivery of the undelivered service element(s) is probable and substantially in our control. Revenue from arrangements for the sale of tangible products containing both software and non-software components that function together to deliver the product’s essential functionality requires allocation of the arrangement consideration to the separate deliverables using the relative selling price method (“RSP”) of each unit of accounting based first on VSOE, if it exists, second on third-party evidence (“TPE”), if it exists, and finally on estimated selling price ("ESP") if neither VSOE nor TPE exist.
• | VSOE — For certain elements of an arrangement, VSOE is based on the price of the element in comparable transactions in which the element is sold separately. We determine VSOE based on our pricing and discounting practices for the specific product or service when it is sold separately, including consideration of geographical, customer, and other economic or marketing variables, as well as renewal rates or stand-alone prices for the service element(s). |
• | TPE — If we cannot establish VSOE of selling price for a specific product or service included in an MEA, we use TPE to determine the selling price. We determine TPE based on sales of comparable amounts of similar products or services offered by multiple third parties with consideration given to the degree of customization and similarity of the product or service sold. |
• | ESP — ESP represents the price at which we would sell a product or service if it were sold on a stand-alone basis. When VSOE or TPE does not exist for an element, we determine ESP for the element based on sales, cost and margin analysis, pricing practices, and potential market constraints. Adjustments for other market and company-specific factors are made as deemed necessary to determine ESP. |
Certain contracts include multiple elements for which we determine whether the various elements meet the applicable criteria to be accounted for as separate elements and make estimates regarding their relative selling price. We use ESP when allocating arrangement consideration to each separate deliverable when we do not have VSOE or TPE of selling price for our various applicable tangible products containing essential software products and services. We allocate the total transaction price of an arrangement based on each separate unit of accounting relative to ESP. Revenue for elements that cannot be separated is recognized once the revenue recognition criteria for the entire arrangement has been met or over the period that our last remaining obligation to perform is fulfilled. Consideration for elements that are deemed separable is allocated to the separate elements at the inception of the arrangement based on their relative selling price and recognized based on the authoritative criteria. We consider the installation and delivery of our software products to be part of a single unit of accounting due to the complexity of installation and nature of the contractual arrangements.
Cost of Revenues
Cost of revenues consists of payroll-related costs for service personnel, contractor costs, third-party hardware costs, third-party license fees, and the cost of delivering product to customers. The costs associated with any product that does not yet meet the criteria to be recognized as revenue are deferred.
Unbilled Revenue
If final acceptance has occurred but we have not invoiced the customer, we account for the amount invoiced as unbilled revenue and recognize the revenues and related costs. Customers are billed in accordance with specific contract terms, which may differ from the rate at which revenues are earned. Revenue recognized in excess of the amount billed of $13.7 million and $11.2 million at December 31, 2014 and 2013, respectively, are classified as unbilled revenue. Amounts received from customers pursuant to the contractual terms, but for which revenue has not yet been earned, are recorded as deferred revenue.
Maintenance
Maintenance consists of PCS agreements and subsequent support services purchased by our customers after the initial support period. Our customers generally enter into PCS agreements when they purchase our products. Our PCS agreements range from three months to three years and are typically renewable on an annual basis thereafter at the option of the customer. Revenue allocated to PCS is recognized ratably on a straight-line basis over the period the PCS is provided, assuming all other criteria for revenue recognition have been met. All significant costs and expenses associated with PCS are expensed as incurred with
72
the exception of customer specific, third-party costs, which are expensed ratably over the PCS term. We have established VSOE for our legacy software products. For our next generation products, rates for maintenance, including subsequent renewal rates, are established based on a specific percentage of the arrangement's fair value. For our tangible, products, which contain essential software, our customers generally enter into PCS arrangements at the time of purchase. Relative selling price for the support obligations for tangible products containing essential software is based on ESP.
Shipping Costs
Outbound shipping and handling costs are included in cost of revenues, in the accompanying consolidated statements of operations and comprehensive loss.
Inventories
Inventories consist of finished goods and are stated at the lower of cost (first-in, first-out method) or market, net of reserve for obsolete inventory. We maintain a small warranty stock, however, substantially all inventories at period end are related to actual or planned customer orders. The reserve for obsolescence at December 31, 2014, 2013 and 2012, was $0.5 million, $0.2 million, and $0.3 million respectively.
Our costs of sales also include overhead costs, including capitalized inventory costs, deferred contract costs, and other direct and allocated support costs related to equipment and installation when sold.
Inventory shipped to customers is generally covered under a twelve-month warranty and returns have historically been nominal.
Long-lived Assets, Goodwill, and Intangible Assets
Property and Equipment
Property and equipment is stated at cost and depreciated using the straight-line method over the estimated useful life of the respective asset of two to five years. Maintenance and repairs is charged to expense when incurred.
When events or changes in circumstances indicate that the carrying amount of our property and equipment might not be recoverable, the expected future undiscounted cash flows from the asset is estimated and compared with the carrying amount of the asset. If the sum of the estimated undiscounted cash flows is less than the carrying amount of the asset, an impairment loss is recorded. The impairment loss is measured by comparing the fair value of the asset with its carrying amount. Fair value is generally determined based on discounted cash flows or appraised values, as appropriate. We did not record any impairment losses related to our property and equipment during 2014, 2013, and 2012.
Intangible Assets
Our intangible assets are primarily comprised of the intangible assets that we acquired from our acquisitions. Specifically, we recognized intangible assets for (i) contractual backlog; (ii) customer relationships; (iii) beneficial lease asset; and (iv) technology.
The intangible assets related to customer relationships are amortized over six years using a method that reflects an appropriate allocation of the costs of these intangible assets to earnings in proportion to the amount of economic benefits obtained in each reporting period. The intangible assets related to technology is amortized on a straight-line basis over an estimated useful life of six years. The beneficial lease asset is being amortized over the life of the associated lease.
Intangible assets are tested for impairment whenever events or circumstances indicate that the carrying amount of an asset may not be recoverable. An impairment loss would be recognized when the carrying amount of the asset exceeds the estimated undiscounted future cash flows expected to result from the use of the asset and its eventual disposition. The impairment loss to be recorded would be the excess of the asset’s carrying value over its fair value. Fair value is generally determined using a discounted cash flow analysis or other valuation technique. We have not recorded any impairment charges related to our intangible assets during 2014, 2013, and 2012.
Goodwill
Goodwill represents the excess of the purchase price over the fair value of the identifiable net assets acquired. Goodwill and other intangible assets with indefinite lives are not amortized to operations, but instead are reviewed for impairment at least annually, or when there is an indicator of impairment. We have no intangible assets with indefinite useful lives, other than goodwill.
Accounting Standards Update ("ASU") No. 2011-08, Intangibles — Goodwill and Other (Topic 350): Testing Goodwill for Impairment (“ASU Topic 350”) permits an entity to make a qualitative assessment of whether it is more likely than not that a reporting unit’s fair value is less than its carrying amount before applying a two-step goodwill impairment test. This step is referred to as “step zero.” If an entity concludes that it is not likely that the fair value of the reporting unit is less than its
73
carrying amount, it would not be required to perform a two-step impairment test for that reporting unit. The guidance lists certain factors to consider when making the qualitative assessment. In the event that the conclusion requires the two-step test, the first step compares the fair value of the reporting unit with its carrying value, including goodwill. If the fair value of the reporting unit is less than its carrying value, an indication of goodwill impairment exists for the reporting unit and the entity must perform step two of the impairment test. Under step two, an impairment loss is recognized for any excess of the carrying amount of the reporting unit’s goodwill over the implied fair value of that goodwill. The implied fair value of goodwill is determined by allocating the fair value of the reporting unit in a manner similar to a purchase price allocation and the residual fair value after this allocation is the implied fair value of the reporting unit goodwill. Fair value of the reporting unit is determined using a discounted cash flow analysis. If the fair value of the reporting unit exceeds its carrying value, step two does not need to be performed. An impairment loss is recognized to the extent that the carrying amount of goodwill exceeds its implied fair value.
We determine fair value using widely accepted valuation techniques, including discounted cash flows and market multiple analyses. These types of analyses contain uncertainties because they require management to make assumptions and to apply judgment to estimate industry economic factors and the profitability of future business strategies. It is our policy to conduct impairment testing based on our current business strategy in light of present industry and economic conditions, as well as our future expectations.
Our valuation methodology for assessing impairment requires management to make judgments and assumptions based on historical experience and projections of future operating performance. If these assumptions differ materially from future results, we may record impairment charges in the future.
In connection with our annual goodwill impairment test, we have not recorded any impairment of such assets during 2014, 2013, and 2012.
Income Taxes
Income taxes are accounted for under the asset and liability method. Deferred tax assets and liabilities are recognized for the future tax consequences attributable to differences between the financial statement carrying amounts of existing assets and liabilities and their respective tax bases and operating loss and tax credit carryforwards. Deferred tax assets and liabilities are measured using enacted tax rates expected to apply to taxable income in the years in which those temporary differences are expected to be recovered or settled. The effect on deferred tax assets and liabilities related to a change in tax rates is recognized in operations in the period that includes the enactment date.
We provide a valuation allowance for our deferred tax assets when it is more likely than not that our deferred tax assets will not be realized, based on expectations of generating future taxable income. Due to our historical losses, the majority of our net deferred tax assets have been fully reserved with a valuation allowance. With respect to Canada, China, our operations in India, and the State of Texas, management has determined that the realization of the deferred tax assets is more likely than not to occur, and has, therefore, released the respective valuation allowances in 2014.
We are electing to early adopt the provisions of ASU 2013-11: “Presentation of an Unrecognized Tax Benefit when a Net Operating Loss Carryforward, a Similar Tax Loss, or a Tax Credit Carryforward Exists.” Unrecognized tax benefits are presented as a reduction of the deferred tax asset for net operating losses and similar tax loss or tax credit carryforwards in lieu of a liability when (1) the uncertain tax position would reduce the NOL or other carryforward under the tax law of the applicable jurisdiction, and (2) we intend to use the deferred tax asset for that purpose. The change in accounting principle will not have an impact to continuing operations in current or prior periods. All unrecognized tax benefits are subjected to a valuation allowance in the applicable filing jurisdiction and thus a corresponding write-down to the valuation allowance results in no impact to income tax expense.
We apply a two-step process for the evaluation of uncertain income tax positions based on a “more likely than not” threshold to determine if a tax position will be sustained upon examination by the taxing authorities. The recognition threshold in step one permits the benefit from an uncertain position to be recognized only if it is more likely than not, or 50% assured that the tax position will be sustained upon examination by the taxing authorities. The measurement methodology in step two is based on “cumulative probability,” resulting in the recognition of the largest amount that is greater than 50% likely of being realized upon settlement with the taxing authority.
Management has elected to recognize accrued interest and penalties related to uncertain tax positions as a component of income tax expense.
74
Fair Value of Financial Instruments
In accordance with ASC 825, Financial Instruments, we are required to disclose the fair value of financial instruments for which it is practical to estimate fair value. We calculate the fair value of financial instruments in accordance with ASC 820, Fair Value Measurements and Disclosures (“ASC 820”), which provides a framework for measuring fair value and expands required disclosure about fair value measurements of assets and liabilities. ASC 820 defines fair value as the exchange price that would be received for an asset or paid to transfer a liability, an exit price, in the principal or most advantageous market for the asset or liability in an orderly transaction between market participants on the measurement date. ASC 820 also establishes a fair value hierarchy which requires an entity to maximize the use of observable inputs and minimize the use of unobservable inputs when measuring fair value.
ASC 820 describes three levels of inputs that may be used to measure fair value:
Level 1 — Quoted prices in active markets for identical assets or liabilities.
Level 2 — Inputs other than quoted prices included within Level 1 that are either directly or indirectly observable.
Level 3 — Unobservable inputs that are supported by little or no market activity, therefore requiring an entity to develop its own assumptions about the assumptions that market participants would use in pricing. These techniques involve judgment and, as a result, are not necessarily indicative of the amounts we would realize in a current market exchange. The use of different assumptions or estimation techniques may have a material effect on the estimated fair value amounts.
Our financial instruments consist primarily of cash and cash equivalents, billed and unbilled accounts receivable, accounts payable and debt. The carrying amounts of financial instruments, other than debt, are representative of their fair values due to their short maturities. We have elected not to carry our debt at fair value.
The carrying amounts and fair values of our borrowings at December 31, 2014 and 2013 are as follows (in thousands):
December 31, 2014 | December 31, 2013 | ||||||||||||||
Carrying Amount | Fair Value | Carrying Amount | Fair Value | ||||||||||||
Silicon Valley Bank senior loan | $ | 26,900 | $ | 26,900 | $ | — | $ | — | |||||||
Silicon Valley Bank subordinated loan | — | — | 10,000 | 10,900 | |||||||||||
Silver Lake subordinated loan | — | — | 15,000 | 17,600 | |||||||||||
Debt | $ | 26,900 | $ | 26,900 | $ | 25,000 | $ | 28,500 | |||||||
The carrying amount of our debt at December 31, 2014 is representative of its fair value since the interest rate is market sensitive. The fair value of our debt at December 31, 2013 was estimated using Level 3 inputs and was based on discounting the remaining principal payments using current market rates for similar debt and consideration of credit and default risk.
Concentration of Credit Risk
Financial instruments that potentially subject us to concentrations of credit risk consist primarily of cash and cash equivalents. We maintain cash and cash equivalent balances in the USA, Australia, Canada, China, Croatia, Finland, India, Japan, Malaysia, Singapore, Spain, South Korea and the United Kingdom. The balances in the USA are FDIC insured. We maintain cash deposits with financial institutions with balances that often exceed federally insured amounts. We have experienced no losses related to these deposits.
Foreign Currency
The functional currency for each of our foreign subsidiaries is the applicable local currency. Assets and liabilities of the foreign subsidiary are translated to U.S. dollars at year-end exchange rates. Income and expense items are recorded at the rates of exchange prevailing during the period. We had $4.7 million of net transaction losses for 2014, $1.9 million of net transaction losses for 2013 and $0.5 million of net transaction gains for 2012. Currency translation adjustments are recorded as a component of other comprehensive income (loss). Intercompany foreign currency transactions that are not of a long-term investment nature affect functional currency cash flows and are accounted for as currency transaction gains and losses and included in determining net income (loss). Intercompany transactions are considered to be of a long-term investment nature if settlement is not planned or anticipated in the foreseeable future.
Net Loss per Common Share
Basic net loss per common share is computed by dividing the net loss available to common shareholders by the weighted average number of common shares outstanding during the period. Diluted net loss per common share is computed by dividing the net loss available to common shareholders by the weighted average number of common shares outstanding and potentially dilutive securities outstanding during the period. Potentially dilutive securities include stock options, warrants, and convertible
75
preferred stock during the period, using the treasury stock method. Potentially dilutive securities are excluded from the computations of diluted earnings per share if their effect would be anti-dilutive. Note 9 provides additional information regarding net loss per common share.
Research, Development, and Engineering Costs
Costs related to research, design, and development of service infrastructure technology are charged to research and development expense as incurred. Generally accepted accounting standards provide for the capitalization of certain software development costs once technological feasibility has been established and for the evaluation of the recoverability of any capitalized costs on a periodic basis. Our software products have historically reached technological feasibility late in the developmental process, and developmental costs incurred after technological feasibility and prior to product release have been insignificant to date. Accordingly, no development costs have been capitalized to date and all research and product development expenditures have been expensed as incurred.
Restructuring Charges
Restructuring charges consist primarily of severance and benefits costs resulting from strategic management decisions to consolidate operations supporting our business following our acquisitions. Restructuring charges represent costs related to the realignment and restructuring of our business operations. These charges include expenses incurred in connection with strategic planning, certain cost reduction programs and acquisition integrations that we have implemented and consist of the cost of involuntary termination benefits, facilities charges, asset write-offs and other costs of exiting activities or geographies.
The charges for involuntary termination costs and associated expenses often require the use of estimates, primarily related to the number of employees to be paid severance and the amounts to be paid, largely based on years of service and statutory requirements. Assumptions to estimate facility exit costs include the ability to secure sublease income largely based on market conditions, the likelihood and amounts of a negotiated settlement for contractual lease obligations and other exit costs. Other estimates for restructuring charges consist of the realizable value of assets including associated disposal costs and termination fees with third parties for other contractual commitments.
Restructuring charges incurred during 2014 totaled $0.1 million, which is included in general and administration in the consolidated statements of operations and comprehensive loss. No restructuring charges were incurred during 2013 or 2012.
Stock-based Compensation
Stock-based compensation represents the cost related to stock-based awards granted to employees. We measure stock-based compensation cost at the grant date, based on the estimated fair value of the award and recognizes the cost as an expense on a straight-line basis over the employee requisite service period. We estimate the fair value of stock options without market-based performance conditions using the Black-Scholes valuation model with the following weighted average assumptions:
• | Risk-free interest rate — U.S. Federal Reserve treasury constant maturities rate consistent vesting period; |
• | Expected dividend yield — measured as the average annualized dividend estimated to be paid over the expected life of the award as a percentage of the share price at the grant date; |
• | Expected term — the period of time for which the instrument is expected to be outstanding; and |
• | Weighted average expected volatility — measured using historical volatility of similar public entities for which share or option price information is available. |
The following table presents our stock-based compensation expense resulting from stock options and our employee stock purchase program as recorded in our consolidated statement of operations and comprehensive loss for 2014, 2013 and 2012 (in thousands):
Year Ended December 31, | |||||||||||
2014 | 2013 | 2012 | |||||||||
Cost of revenues | $ | 582 | $ | 187 | $ | — | |||||
Research and development | 787 | 321 | — | ||||||||
Sales and marketing | 1,032 | 482 | — | ||||||||
General and administrative | 2,154 | 640 | 291 | ||||||||
Total | $ | 4,555 | $ | 1,630 | $ | 291 | |||||
76
Advertising Costs
Advertising costs are expensed as incurred or the first time the advertising takes place, applied consistently based on the nature of the advertising activity. Advertising expenses for 2014, 2013, and 2012, were $1.2 million, $0.8 million, and $0.7 million, respectively.
Use of Estimates
The preparation of our consolidated financial statements in conformity with accounting principles generally accepted in the United States of America requires management to make estimates and assumptions that affect the reported amounts of assets and liabilities, disclosure of contingent assets and liabilities, and the reported amounts of revenues and expenses. Actual results could differ from those estimates.
Recent Accounting Pronouncements
In May 2014, the FASB issued ASU 2014-9, Revenue from Contracts with Customers: Topic 606 (“ASU 2014-9”). ASU 2014-9 is intended to enhance comparability of revenue recognition practices across entities, industries, jurisdictions, and capital markets, improve disclosure to help users of financial statements better understand the nature, amount, timing, and uncertainty of revenue that is recognized, and provide guidance for transactions that are not currently addressed comprehensively. The standard is effective for fiscal years beginning after December 15, 2016, and interim periods therein, and does not allow for early adoption. Entities have the option of using either a full retrospective or modified retrospective approach for the adoption of the standard. The Company has begun the evaluation of the impact that the standard will have on its consolidated financial statements but has not yet selected a transition method.
In August 2014, the FASB issued ASU 2014-15, Disclosure of Uncertainties about an Entity’s Ability to Continue as a Going Concern ("ASU 2014-15"), which provides guidance for management to evaluate whether there are conditions or events that raise a substantial doubt about the entity's ability to continue as a going concern. ASU 2014-15 is effective for periods after December 15, 2016. We do not expect ASU 2014-15 to have a material impact on our consolidated financial statements or disclosures.
We have reviewed other recently issued, but not yet adopted, accounting standards in order to determine their effects, if any, on our consolidated results of operations, financial position and cash flows.
3. Business Combination
On November 18, 2014, we acquired all of the outstanding capital stock of Stoke for the purchase price of approximately $5.5 million. The Stoke Acquisition was funded through the use of cash on hand at Mavenir of $3.7 million and the proceeds of a $1.9 million addition to our loan with Silicon Valley Bank under a loan modification agreement. Under the terms of the loan modification, our term loan was increased from $25.0 million to $26.9 million and the interest rate was reduced by 0.50%, from prime plus 2.75% to prime plus 2.25%. We used the proceeds of the term loan increase to repay the existing Stoke bank loan and paid out approximately $2.9 million of cash on hand to, and on behalf of, the shareholders of Stoke. In addition, during October and November 2014, prior to the closing of the transaction, we advanced approximately $0.8 million in cash to provide operating cash to Stoke.
Prior to the acquisition, Stoke was a provider of mobile gateway solutions to the broadband network industry and market leader in deployed LTE security gateways. Stoke was based in Santa Clara, CA and had an international presence in its’ served markets. This acquisition was completed to expand our global reach adding presence in markets like Japan and South Korea, enhance our security product portfolio with the addition of LTE security gateways, and entry into the small-cell market with high performance gateway products.
The Stoke Acquisition was accounted for under the acquisition method of accounting. The assets acquired and the liabilities assumed by us were recognized at their fair values at the acquisition date. We recorded goodwill of $2.0 million, which is attributable to expected growth and cost synergies resulting from the acquisition. The goodwill is not deductible for income tax purposes. We incurred approximately $0.4 million of acquisition-related costs, all of which were expensed and included in general and administrative expenses on the consolidated statements of operations and comprehensive loss.
The allocation of the total purchase price of Stoke’s net tangible and identifiable intangible assets was based upon the estimated fair value of those assets as of November 18, 2014.
77
The following table presents the preliminary allocation of the total purchase price to the assets acquired and liabilities assumed at the date of the acquisition. The primary areas of the preliminary allocation that are not yet finalized are the fair value of income and non-income based taxes, and residual goodwill (in thousands):
Cash and cash equivalents | $ | 321 | |
Accounts receivable | 62 | ||
Inventories | 1,484 | ||
Prepaid expenses | 693 | ||
Property, plant and equipment | 745 | ||
Intangible assets | 4,360 | ||
Deposits | 204 | ||
Accounts payable and other liabilities | (1,698 | ) | |
Deferred revenue | (2,576 | ) | |
Deferred tax liabilities | (79 | ) | |
Total identifiable net assets | 3,516 | ||
Goodwill | 2,030 | ||
Total consideration transferred | $ | 5,546 | |
As part of the purchase price allocation, we determined that the identifiable intangible assets were customer relationships, software technology, and a beneficial lease asset. We valued the customer relationships using the excess earnings method. We applied the relief-from-royalty method to estimate the fair value of the software technology. For the beneficial lease asset, we compared the rates under the Stoke lease to relevant market rates. These intangible assets are amortized with estimated useful lives ranging from 2 to 6 years from the date of acquisition over a method that reflects an appropriate allocation of the costs of these intangible assets to earnings in proportion to the amount of economic benefits obtained in each reporting period.
Acquired intangible assets | Fair Value (in thousands) | Estimated Useful Life (Years) | ||
Establish customer relationships asset value | $ | 2,580 | 6 | |
Establish software technology asset value | 1,460 | 6 | ||
Establish beneficial lease asset value | 320 | 2.25 | ||
Total | $ | 4,360 | ||
Some of the more significant estimates and assumptions inherent in the estimates of the fair values of identifiable intangible assets include all assumptions associated with forecasting product profitability from the perspective of a market participant. Specifically:
• | Revenue - we use historical, forecast, and industry or other sources of market data, including the number of units to be sold, selling prices, market penetration, market share, and year-over-year growth rates over the product life cycles. |
• | Cost of sales, research and development expenses, sales and marketing expenses and general administrative expenses - we use historical, forecast, industry, or other sources of market data, including any expected synergies that can be realized by a market participant. |
• | Estimated life of the asset - we assess the asset’s life cycle by considering the impact of technology changes and applicable compliance and regulatory requirements. |
• | Discount rates - we use a discount rate that is based on the weighted average cost of capital with adjustments to reflect the risks associated with the specific intangible assets, such as country risks and commercial risks. |
• | Customer attrition rates - we use historical and forecast data to determine the customer attrition rates and the expected customer life. |
The discount rates used in the intangible asset valuations ranged from 6.0% to 50.5% depending on the relative risk profile of the intangible assets. The customer attrition rates used in our valuation of customer relationship intangible assets were 5.0%. The royalty rate used in the valuation of the software technology intangible asset was 10.0%. All of these judgments and estimates can materially impact the fair values of intangible assets.
78
Below are our selected unaudited pro forma results for the years ended December 31, 2014 and 2013 as if the acquisition occurred as of January 1, 2013. These results are not intended to reflect the actual operations had the acquisition occurred at January 1, 2013 (in thousands, except per share data).
2014 | 2013 | |||||
Revenues | $ | 136,187 | $ | 111,062 | ||
Net Loss | (39,432 | ) | (32,378 | ) | ||
Basic and diluted loss per common share | $ | (1.52 | ) | $ | (7.57 | ) |
The amounts of revenue and earnings of Stoke included in our consolidated statement of operations and comprehensive loss from the acquisition date of November 18, 2014 are as follows (in thousands):
2014 | |||
Revenue | $ | 649 | |
Net Loss | $ | (958 | ) |
4. Property and Equipment
The following table presents the detail of property and equipment for the period ends presented (in thousands):
Estimated Useful Life | December 31, | ||||||||
2014 | 2013 | ||||||||
Computer software | 3 years | $ | 5,161 | $ | 5,046 | ||||
Computer and lab equipment | 3 years | 12,750 | 8,917 | ||||||
Other equipment | 2-5 years | 2,286 | 1,468 | ||||||
Property and equipment, gross | 20,197 | 15,431 | |||||||
Less: accumulated depreciation | (13,599 | ) | (10,377 | ) | |||||
Property and equipment, net | $ | 6,598 | $ | 5,054 | |||||
Property and equipment depreciation expense totaled $3.3 million, $2.5 million, and $1.5 million, for the years ended December 31, 2014, 2013, and 2012.
5. Intangible Assets and Goodwill
Intangible assets primarily include the intangible assets that we acquired in acquisitions, including the acquisition of Stoke, (see Note 3 to the consolidated financial statements for further information). The intangible assets are being amortized using a patterns of consumption method based on the estimated cash flows associated with each asset. As a result, year-to-year amortization expense will vary with the associated estimated cash flows used in the valuation of these assets. The amortization methods reflect an appropriate allocation of the costs of these intangible assets to earnings in proportion to the amount of economic benefits obtained in the reporting period.
Intangible assets as of December 31, 2014 are as follows (in thousands):
Description | Weighted Average Amortization period (in months) | Gross Carrying Amount | Accumulated Amortization | Net Carrying Amount as of December 31, 2014 | |||||||||
Contractual backlog | 7 | $ | 1,292 | $ | (1,292 | ) | $ | — | |||||
Customer relationships | 72 | 7,135 | (2,740 | ) | 4,395 | ||||||||
Technology | 72 | 2,213 | (498 | ) | 1,715 | ||||||||
Certification and licenses | 36 | 3,766 | (2,005 | ) | 1,761 | ||||||||
Beneficial lease | 27 | 320 | (11 | ) | 309 | ||||||||
Total | $ | 14,726 | $ | (6,546 | ) | $ | 8,180 | ||||||
79
Intangible assets as of December 31, 2013 are as follows (in thousands):
Description | Weighted Average Amortization period (in months) | Gross Carrying Amount | Accumulated Amortization | Net Carrying Amount as of December 31, 2013 | |||||||||
Contractual backlog | 7 | $ | 1,382 | $ | (1,382 | ) | $ | — | |||||
Customer relationships | 72 | 4,897 | (2,108 | ) | 2,789 | ||||||||
Technology | 72 | 799 | (344 | ) | 455 | ||||||||
Certification and licenses | 36 | 2,957 | (999 | ) | 1,958 | ||||||||
Total | $ | 10,035 | $ | (4,833 | ) | $ | 5,202 | ||||||
Total amortization expense for the years ended December 31, 2014, 2013, and 2012, was $2.1 million, $1.5 million, and $2.5 million, respectively of which $1.1 million, $0.6 million, and $0, respectively, was included in cost of revenues related to software products and $1.0 million, $0.9 million, and $2.5 million, respectively, was included in operating expenses on the consolidated statements of operations and comprehensive loss. The following table presents the expected amortization expense for each of the next five years ending December 31, for those intangible assets with remaining carrying values as of December 31, 2014 (in thousands):
Years Ending December 31, | Amortization of Intangible Assets | ||
2015 | $ | 2,649 | |
2016 | 2,350 | ||
2017 | 1,123 | ||
2018 | 990 | ||
2019 | 646 | ||
2020 | 422 | ||
Total | $ | 8,180 | |
A summary of changes in our carrying value of goodwill is as follows (in thousands):
Year ended December 31, | |||||||
2014 | 2013 | ||||||
Balance, beginning of period | $ | 866 | $ | 923 | |||
Acquired goodwill | 2,030 | — | |||||
Foreign currency exchange translation | (68 | ) | (57 | ) | |||
Balance, end of period | $ | 2,828 | $ | 866 | |||
6. Accrued Liabilities
The following table presents the detail of accrued liabilities for the period ends presented (in thousands):
December 31, | |||||||
2014 | 2013 | ||||||
Accrued payroll | $ | 10,163 | $ | 7,221 | |||
Accrued expenses on contracts | 4,448 | 1,446 | |||||
Accrued professional fees | 551 | 136 | |||||
Other | 2,682 | 3,136 | |||||
Total accrued liabilities | $ | 17,844 | $ | 11,939 | |||
80
7. Debt
The following table presents the detail of debt for the period ends presented (in thousands):
December 31, | |||||||
2014 | 2013 | ||||||
Silicon Valley Bank senior loan | $ | 26,900 | $ | — | |||
Silicon Valley Bank subordinated loan | — | 10,000 | |||||
Silver Lake Waterman subordinated loan | — | 15,000 | |||||
Discount related to issuance of warrants | (59 | ) | (1,577 | ) | |||
Total debt | 26,841 | 23,423 | |||||
Less: current portion | 5,044 | — | |||||
Long-term portion | $ | 21,797 | $ | 23,423 | |||
We had $26.9 million and $25.0 million gross debt before discount of $0.1 million and $1.6 million, outstanding under our revolving credit facility and senior and subordinated loans as of December 31, 2014 and 2013, respectively.
Silicon Valley Bank Subordinated and Senior Loans
On October 18, 2012, we entered into loan agreements with Silicon Valley Bank (“SVB”). Under the agreements, we obtained two loans totaling $32.5 million. In February 2013, we amended these loans to join certain of our subsidiaries, including our non-U.S. subsidiaries, as co-borrowers. We also amended our minimum tangible net worth covenant. The loans included a $22.5 million Senior Loan (“Senior Loan”) secured by substantially all of our assets, including intellectual property. The Senior Loan had a term of three years at a floating rate of 1% above the U.S. prime rate, subject to a minimum interest rate of 4.25%. We also obtained a $10.0 million Subordinated Loan, also secured by substantially all of our assets including intellectual property that had a three years term at a fixed rate of 11%.
On March 6, 2014, we entered into an Amended and Restated Agreement with SVB to replace both the $22.5 million Senior Loan facility and the $10.0 million Subordinated Loan. The Amended and Restated Agreement includes a five-year term loan of $25.0 million (“Term Loan”), a $15.0 million secured revolving line of credit (“Revolver”) and a $5 million secured line for letters of credit, foreign exchange and cash management services. The Term Loan had an initial floating interest rate of 2.75% above the U.S. prime rate, subject to a minimum interest rate of 4.25% and is secured by substantially all of our assets, including intellectual property. The Term Loan provided for monthly payments of interest only until April 1, 2015; thereafter we were required to repay the outstanding principal amount in 48 monthly installments. The Term Loan has a maturity of March 1, 2019. If we prepay the Term Loan within one year of the Amended and Restated Loan Agreement, we will have to pay a prepayment premium of $250,000; thereafter, the Term Loan may be prepaid without penalty.
In accordance with ASC 470, Debt (“ASC 470”), we recorded a $0.3 million loss on early extinguishment of debt in 2014 related to the Amended and Restated Agreement.
In connection with the Stoke Acquisition, on November 19, 2014, we entered into a Consent, Joinder and Second Loan Modification Agreement with SVB ("Second Loan Modification Agreement"). Under the terms of the Second Loan Modification Agreement, the former Stoke, Inc. became a borrower under our loan agreements with SVB and granted a security interest to SVB in substantially all of its assets. Our Term Loan was increased from $25.0 million to $26.9 million, and the increase used to repay approximately $1.9 million of outstanding indebtedness owed by Stoke, Inc. to SVB. The interest rate on our Term Loan was reduced by 0.50%, from prime plus 2.75% to prime plus 2.25%, the time period during which the 1.0% prepayment penalty is in effect under the Term Loan was extended from March 6, 2015 through November 19, 2015, and the amount of the penalty was increased from $250,000 to $269,000. Upon successful achievement of one of two performance triggers, the interest rate will be reduced to 1.75% above the U.S. prime rate. The interest rate will be further reduced to 1.25% above the U.S. prime rate upon the successful achievement of the second performance trigger. The performance triggers are as follows: (i) our achievement, on a consolidated basis, of positive EBITDA, as defined, for two consecutive fiscal quarters, and (ii) the completion of an equity offering resulting in net proceeds of at least $50 million.
Under the Revolver, we may draw up to 80% of eligible domestic trade receivables, 70% of eligible foreign trade receivables and 35% of eligible accrued but unbilled accounts up to a maximum of $15.0 million. The Revolver has a three-year term and bears interest at a floating interest rate of 1% above the U.S. prime rate, subject to a minimum interest rate of 4.25% and is secured by substantially all of our assets, including intellectual property. We are also required to pay an unused facility fee, monthly in arrears, of 0.25% per annum of the unused amount of the Revolver. The Revolver may be prepaid at any time without penalty. As of December 31, 2014, we had no borrowings outstanding on the Revolver and had $15.0 million available. At December 31, 2014, the interest rate was 5.5%.
81
The Silicon Valley Bank loan agreements contain certain restrictive covenants, and the Senior Loan requires us to maintain a minimum tangible net worth at all times. At December 31, 2014, we were in default under of our minimum EBITDA covenant. We sought and obtained a waiver for this breach. The agreements also contain usual and customary events of default, the occurrence of which may result in all outstanding amounts under the loan agreements becoming due and payable immediately, and they also impose an interest penalty of an additional 5% above the otherwise applicable interest rate at any time when an event of default is continuing.
Silver Lake Waterman Growth Capital Loan
On June 4, 2013, we entered into a growth capital loan agreement with Silver Lake Waterman Fund, L.P. (“Silver Lake Loan”), for a $15.0 million subordinated term loan. The Silver Lake Loan was scheduled to mature on June 30, 2017 and bore interest at 12% annually. On March 5, 2014, we repaid the balance of our Silver Lake Loan using funds from our initial public offering.
As of March 5, 2014, we had approximately $0.2 million in deferred costs and $1.3 million in debt discount related to the Silver Lake Loan on our consolidated balance sheet. The entire $1.5 million was recognized during the year ended December 31, 2014, as a loss on early extinguishment of debt related to the payoff of the Silver Lake Loan on March 5, 2014.
8. Commitments and Contingencies
Lease Commitments
We lease office space and equipment under operating leases expiring in various years through 2019 or later. Rent expense for the years ended December 31, 2014, 2013, and 2012 was $2.8 million, $2.1 million, and $2.4 million, respectively.
Future minimum lease payments under the non-cancelable operating leases as of December 31, 2014 are as follows (in thousands):
Years ending December 31, | |||
2015 | $ | 3,456 | |
2016 | 2,694 | ||
2017 | 1,307 | ||
2018 | 786 | ||
2019 | 519 | ||
Thereafter | 476 | ||
Total | $ | 9,238 | |
Future minimum sublease rentals to be received under non-cancelable operating leases as of December 31, 2014 are $0.9 million.
Legal Proceedings
From time to time, we, our customers and our competitors are subject to various litigation and claims arising in the ordinary course of business. The software and communications infrastructure industries are characterized by frequent litigation and claims, including claims regarding patent and other intellectual property rights, claims for damages or indemnification for alleged breach under commercial supply or service contracts and claims regarding alleged improper hiring practices. From time to time we may be involved in various additional legal proceedings or claims.
We are not aware of any pending or threatened legal proceeding against us that could have a material adverse effect on our business, operating results or financial condition.
9. Loss per Common Share Applicable to Common Shareholders
We calculate basic net loss per share by dividing net loss attributable for the period by the weighted average number of shares of common stock outstanding during the period. Diluted net loss per share is computed giving effect to all potential weighted average diluted common stock, including options and warrants, using the treasury stock method.
82
The computation of basic and diluted net loss per share is as follows (in thousands, except per share amounts):
Year Ended December 31, | |||||||||||
2014 | 2013 | 2012 | |||||||||
Net loss | $ | (26,036 | ) | $ | (15,290 | ) | $ | (15,569 | ) | ||
Basic common shares: | |||||||||||
Weighted average number of shares outstanding | 25,988 | 4,278 | 1,288 | ||||||||
Diluted common shares: | |||||||||||
Weighted average shares used to compute diluted net loss per share | 25,988 | 4,278 | 1,288 | ||||||||
Net loss per share attributable to common stockholders: | |||||||||||
Basic and diluted | $ | (1.00 | ) | $ | (3.57 | ) | $ | (12.09 | ) | ||
The convertible preferred stock numbers shown in the table below are on a common stock equivalent basis as a result of the reverse stock split described in Note 10, Shareholders’ Equity.
The following weighted-average common stock equivalents were excluded from the calculation of diluted net loss per share because their effect would have been anti-dilutive for the periods presented due to the net loss for all periods presented (in thousands):
Year Ended December 31, | ||||||||
2014 | 2013 | 2012 | ||||||
Convertible preferred stock | — | — | 16,452 | |||||
Stock options | 1,572 | 1,532 | 1,474 | |||||
Warrants | — | 1,233 | — | |||||
10. Shareholders’ Equity
Initial Public offering
In November 2013, we closed our initial public offering ("IPO"), in which we sold 5,320,292 shares of common stock and certain selling stockholders sold 129,708 shares of common stock at a price to the public of $10.00 per share, before underwriting discounts and commissions. In December 2013, the underwriters partially exercised their option to purchase additional shares and we issued and sold 145,339 additional shares at the same price to the public, before underwriting discounts and commissions. We raised approximately $44.8 million in net proceeds after deducting underwriting discounts and commissions of approximately $3.8 million and other estimated offering expenses of approximately $6.1 million. We did not receive any proceeds from the sale of shares by the selling stockholders in the IPO.
Follow-on Public offering
On August 6, 2014, we closed a follow-on public offering, in which we sold 4,090,000 shares of common stock at a price to the public of $11.00 per share, before underwriting discounts and commissions. We raised approximately $41.7 million in net proceeds after deducting underwriting discounts and commissions of approximately $2.5 million and other estimated offering costs of approximately $0.8 million.
Common Stock
In preparation for the IPO, our Board of Directors and stockholders approved a 7-for-1 reverse stock split of our common stock. The reverse stock split became effective on November 1, 2013. All share and per share amounts in the consolidated financial statements and notes thereto have been retrospectively adjusted for all periods presented to give effect to this reverse stock split, including reclassifying an amount equal to the reduction in par value of common stock to additional paid-in capital.
In connection with the closing of the IPO in November 2013, all of our outstanding preferred stock automatically converted into an aggregate of 16,452,467 shares of our common stock. Additionally, we amended and restated our certificate of incorporation increasing the number of authorized shares of common stock from 22,171,986 to 300,000,000.
83
Stock Option Plan
We have two stock option plans: the Amended and Restated 2005 Stock Plan (the “2005 Plan”), and the Amended and Restated 2013 Equity Incentive Plan (the “2013 Plan”). In January 2013, we terminated the 2005 Plan and provided that no further stock awards were to be granted under the 2005 Plan and adopted the 2013 Plan as a continuation of and successor to the 2005 Plan. Upon the IPO, all shares that were reserved under the 2005 Plan but not issued were assumed by the 2013 Plan. All outstanding stock awards under the 2005 Plan continue to be governed by the existing terms.
Awards granted under the 2005 Plan may be immediately exercisable, but not vested, and are subject to a right of repurchase by us, at our option, at the lower of the original exercise price or fair market value for all unvested restricted shares at the termination of service.
Under the 2013 Plan, we have the ability to issue incentive stock options (“ISOs”), nonstatutory stock options (“NSOs”), stock appreciation rights, restricted stock, restricted stock units (“RSUs”), performance units and/or performance shares. Additionally, the 2013 Plan provides for the grant of performance cash awards to employees, directors and consultants. Stock options are granted at a price per common share not less than the fair value at date of grant. Stock options granted to date generally vest over a four-year period with 25% vesting at the end of one year and the remaining vest monthly thereafter. Stock options granted generally are exercisable up to ten years from the date of grant.
The number of shares available for issuance under the 2013 Plan increases on January 1 of each calendar year during the term of the 2013 Plan by (i) an amount equal to the lesser of (A) 4.5% of the total number of common shares outstanding on the last trading day in December of the immediately preceding calendar year and (B) 2,857,776 shares, or (ii) an amount determined by the Board of Directors that is lower than the lesser determined by (i)(A) or (i)(B). At December 31, 2014, there were 1,073,231 common shares available for future grants under the 2013 Plan.
To determine the weighted average fair value of stock options granted, we used the Black-Scholes option-pricing model with the following weighted average assumptions during the periods presented:
Year Ended December 31, | ||||||||
2014 | 2013 | 2012 | ||||||
Expected dividends | — | % | — | % | — | % | ||
Risk-free interest rate (U.S. Treasury) | 2.0 | % | 1.8 | % | 1.7 | % | ||
Expected term | 6.3 | 6.3 | 6.3 | |||||
Expected volatility | 60.9 | % | 57.5 | % | 62.0 | % | ||
The fair value of all the awards granted is amortized to expense on a straight-line basis over the requisite service periods, which are generally the vesting periods.
The following tables summarize the stock option activity for the periods presented (in thousands, except per share amounts):
Shares | Weighted Average Exercise Price | Weighted Average Remaining Contractual Term (in years) | Aggregate Intrinsic Value | |||||||||
Outstanding as of January 1, 2012 | 2,647 | $ | 1.12 | |||||||||
Granted | 488 | 4.77 | ||||||||||
Exercised | (121 | ) | 0.59 | |||||||||
Forfeited or expired | (317 | ) | 1.14 | |||||||||
Outstanding as of December 31, 2012 | 2,697 | $ | 1.80 | 7.3 | $ | 16,465 | ||||||
Exercisable as of December 31, 2012 | 2,041 | $ | 1.16 | 6.6 | $ | 13,789 | ||||||
84
Shares | Weighted Average Exercise Price | Weighted Average Remaining Contractual Term (in years) | Aggregate Intrinsic Value | |||||||||
Outstanding as of January 1, 2013 | 2,697 | $ | 1.80 | |||||||||
Granted | 880 | 9.56 | ||||||||||
Exercised | (163 | ) | 0.56 | |||||||||
Forfeited or expired | (127 | ) | 3.88 | |||||||||
Outstanding as of December 31, 2013 | 3,287 | $ | 3.86 | 7.2 | $ | 24,002 | ||||||
Exercisable as of December 31, 2013 | 2,106 | $ | 1.53 | 5.7 | $ | 17,622 | ||||||
Shares | Weighted Average Exercise Price | Weighted Average Remaining Contractual Term (in years) | Aggregate Intrinsic Value | |||||||||
Outstanding as of January 1, 2014 | 3,287 | $ | 3.86 | |||||||||
Granted | 1,303 | 15.95 | ||||||||||
Exercised | (558 | ) | 2.07 | |||||||||
Forfeited or expired | (206 | ) | 11.66 | |||||||||
Outstanding as of December 31, 2014 | 3,826 | $ | 7.90 | 7.4 | $ | 24,648 | ||||||
Exercisable as of December 31, 2014 | 2,119 | $ | 3.80 | 6.1 | $ | 20,880 | ||||||
We granted stock options with a weighted-average grant date fair value per share during the years ended December 31, 2014, 2013, and 2012 of $9.30, $5.29, and $2.80, respectively.
The following table summarizes additional information about stock options outstanding at December 31, 2014:
Exercise Price | Options Outstanding | Options Exercisable | Weighted Average Remaining Contractual Term (in years) | ||||
$ 0.42 - $ 0.56 | 421 | 421 | 2.1 | ||||
$ 0.63 - $ 0.77 | 428 | 426 | 5.4 | ||||
$ 2.10 - $ 2.10 | 700 | 664 | 7.0 | ||||
$ 5.11 - $ 8.40 | 490 | 253 | 7.9 | ||||
$10.00 - $10.00 | 642 | 193 | 8.8 | ||||
$10.78 - $16.47 | 490 | 38 | 9.3 | ||||
$18.09 - $18.09 | 655 | 124 | 9.2 | ||||
3,826 | 2,119 | 7.4 | |||||
The total intrinsic value of options exercised during the years ended December 31, 2014, 2013, and 2012, was $6.3 million, $1.4 million, and $0.5 million, respectively.
At December 31, 2014, there was $10.4 million of total unrecognized cost related to unvested stock options granted under the stock option plan, which is expected to be recognized over a weighted average period of 2.5 years.
Employee Stock Purchase Plan
In November 2014, we implemented an Employee Stock Purchase Plan ("ESPP") in accordance with the terms of the Amended and Restated Employee Stock Purchase Plan ("ESPP Plan"). Our ESPP has a six-month offering period, a 15% discount, and a six-month look-back feature. Initially, 482,143 shares of our common stock are reserved for issuance to our employees under the ESPP. The number of shares available for issuance under the ESPP increases on January 1 of each calendar year, beginning with the 2015 calendar year, during the term of the ESPP by an amount equal to 1.0% of the total number of common shares outstanding on the last trading day in December of the immediately preceding calendar year. The annual increase can not exceed 428,572 shares in any calendar year.
During an offering period, employees make contributions to the ESPP through payroll deductions. At the end of each offering period, we use the accumulated contributions to issue shares of our common stock to the participating employees. The issue price of those shares is equal to the lesser of (i) 85% of our stock price on the first day of the offering period, or (ii) 85% of our stock price on the purchase date. No participant may be issued more than $25,000 of common stock in any calendar year and
85
the maximum number of shares a participant may be issued during a single offering period is 1,000 shares. The maximum number of shares issuable to all participants on any one purchase date is 312,500 shares.
We recognized approximately $0.1 million of stock-based compensation expense during the fourth quarter of 2014 as a result of our ESPP.
Warrants
In March 2014, we issued 44,340 shares of our common stock to SVB upon the exercise in full of a warrant held by SVB. The warrant gave SVB the right to purchase up to 64,286 shares of our common stock at $5.11 per share. The warrant was fully exercised in a "cashless" transaction pursuant to the terms of the agreement.
In April 2014, we issued 555,034 shares of our common stock to Cisco Systems, Inc. ("Cisco") upon the exercise in full of a warrant held by Cisco. The warrant gave Cisco the right to purchase up to 898,294 shares of our common stock at $6.6794 per share on the achievement of certain bookings milestones. The warrant was fully exercised in a "cashless" transaction pursuant to the terms of the agreement.
In May 2014, we issued 40,871 shares of our common stock to WestRiver Mezzanine Loans, LLC ("WestRiver") upon the exercise in full of a warrant held by WestRiver. The warrant gave WestRiver the right to purchase up to 64,285 shares of our common stock at $5.11 per share. The warrant was fully exercised in a "cashless" transaction pursuant to the terms of the agreement.
In June 2014, we issued 194,606 shares of our common stock to Silver Lake Waterman Fund, L.P. ("Silver Lake") upon the exercise in full of a warrant held by Silver Lake. The warrant gave Silver Lake the right to purchase up to 194,694 shares of our common stock at $0.007 per share. The warrant was fully exercised in a "cashless" transaction pursuant to the terms of the agreement.
In June 2014, we issued 11,228 shares of our common stock to Comerica Ventures Incorporated ("Comerica") upon the exercise in full of a warrant held by Comerica. The exercise price was $6.6794 per share, which resulted in proceeds of approximately $0.1 million.
11. Employee Benefit Plan
In the United States, we maintain a defined contribution plan consisting of a 401(k) retirement savings plan, which covers substantially all eligible U.S. employees. Participants can, in accordance with Internal Revenue Service (“IRS”) guidelines, set aside both pre- and post-tax savings in this account. In addition to participant’s savings, we have the option of making discretionary matching contributions to plan participant’s accounts; however, no contributions were made to date as of December 31, 2014. Eligible employees can participate in the plan on the first day following their hire date.
Our employees in Canada and the United Kingdom have defined contribution plans. The cost of the plans for the years ended December 31, 2014, 2013, and 2012 was $0.7 million, $0.6 million, and $0.8 million respectively, and is included in operating expenses.
12. Income Taxes
The following table summarizes the income tax expense (in thousands):
Year Ended December 31, | |||||||||||
2014 | 2013 | 2012 | |||||||||
Current: | |||||||||||
Federal | $ | — | $ | — | $ | — | |||||
State | (58 | ) | 218 | — | |||||||
Foreign | 1,176 | 2,328 | 1,152 | ||||||||
Total current | 1,118 | 2,546 | 1,152 | ||||||||
Deferred: | |||||||||||
Federal | — | — | — | ||||||||
State | (2 | ) | (50 | ) | — | ||||||
Foreign | (600 | ) | — | — | |||||||
Total deferred | (602 | ) | (50 | ) | — | ||||||
Income tax expense | $ | 516 | $ | 2,496 | $ | 1,152 | |||||
86
The components of income (loss) before income tax expense consisted of the following (in thousands):
Year Ended December 31, | |||||||||||
2014 | 2013 | 2012 | |||||||||
Domestic | $ | (25,969 | ) | $ | (12,947 | ) | $ | (18,941 | ) | ||
Foreign | 449 | 153 | 4,524 | ||||||||
Total | $ | (25,520 | ) | $ | (12,794 | ) | $ | (14,417 | ) | ||
Deferred income taxes reflect the net tax effects of temporary differences between the carrying amounts of assets and liabilities for financial reporting purposes and the amounts used for income tax purposes. Significant components of deferred tax assets and liabilities are as follows (in thousands):
As of December 31, | |||||||
2014 | 2013 | ||||||
Deferred tax assets | |||||||
Net operating loss carryforwards | $ | 43,234 | $ | 35,918 | |||
Deferred revenue | 3,630 | 2,741 | |||||
Accrued expenses | 3,336 | 1,696 | |||||
Allowance for bad debt | 74 | 149 | |||||
Start-up costs | 908 | 1,057 | |||||
Depreciation of property and equipment | 80 | 30 | |||||
Unrealized gain/loss on foreign currency translations | — | 411 | |||||
Tax credit carryforwards | 2,039 | 2,010 | |||||
Inventories | 3,035 | 1,032 | |||||
Stock-based compensation | 672 | 231 | |||||
Capitalized research and development | 12,692 | — | |||||
Other | 64 | (116 | ) | ||||
Total deferred tax assets | $ | 69,764 | $ | 45,159 | |||
As of December 31, | |||||||
2014 | 2013 | ||||||
Deferred tax liabilities | |||||||
Amortization of intangible assets | $ | (2,397 | ) | $ | (1,472 | ) | |
Unrealized gain/loss on foreign currency translations | (317 | ) | — | ||||
Prepaid items | (145 | ) | (233 | ) | |||
Other | (21 | ) | — | ||||
Total deferred tax liabilities | (2,880 | ) | (1,705 | ) | |||
Net deferred tax assets | 66,884 | 43,454 | |||||
Valuation allowance | (66,107 | ) | (43,404 | ) | |||
Net deferred tax assets | $ | 777 | $ | 50 | |||
87
A reconciliation of the federal statutory income tax rate to the effective income tax rate is as follows (in thousands):
December 31, | ||||||||||||||||||||
2014 | 2013 | 2012 | ||||||||||||||||||
Amount | Percent | Amount | Percent | Amount | Percent | |||||||||||||||
Computed tax at statutory rates: | $ | (8,677 | ) | 34.0 | % | $ | (4,478 | ) | 35.0 | % | $ | (5,046 | ) | 35.0 | % | |||||
Permanent differences | 225 | (0.9 | )% | (122 | ) | 1.0 | % | 362 | (3.0 | )% | ||||||||||
Difference resulting from state income taxes, net of federal income tax benefits | (60 | ) | 0.2 | % | 128 | (1.0 | )% | (337 | ) | 2.0 | % | |||||||||
Change in valuation allowance | 10,124 | (39.6 | )% | (7,453 | ) | 58.3 | % | 4,678 | (32.0 | )% | ||||||||||
Release of valuation allowance | (2,680 | ) | 10.5 | % | — | — | % | — | — | % | ||||||||||
Effect of tax credits | (586 | ) | 2.3 | % | (1,954 | ) | 15.3 | % | (100 | ) | 1.0 | % | ||||||||
Foreign tax differential | 432 | (1.7 | )% | (556 | ) | 4.3 | % | 922 | (6.0 | )% | ||||||||||
Uncertain tax positions | (142 | ) | 0.6 | % | 404 | (3.2 | )% | — | — | % | ||||||||||
Change in control limitations on net operating losses | — | — | % | 12,824 | (100.2 | )% | — | — | % | |||||||||||
Foreign withholding taxes | 804 | (3.2 | )% | 1,342 | (10.5 | )% | — | — | % | |||||||||||
Change in tax rates | 1,403 | (5.5 | )% | 1,881 | (14.7 | )% | — | — | % | |||||||||||
Other, net | (327 | ) | 1.3 | % | 480 | (3.8 | )% | 673 | (5.0 | )% | ||||||||||
Total | $ | 516 | (2.0 | )% | $ | 2,496 | (19.5 | )% | $ | 1,152 | (8.0 | )% | ||||||||
At December 31, 2014, we had U.S. federal net operating loss carryforwards of $115.0 million. These losses expire in various years between 2019 and 2034, and are subject to limitations on their utilization to the extent of future taxable income. We had total foreign net operating loss carryforwards of $18.3 million. Of these foreign net operating losses, $15.3 million are not currently subject to expiration dates and the remainder, $3.0 million expire beginning in 2015 through 2034. A portion of the federal loss carryforwards include net operating losses that were acquired as part of our acquisition of Stoke, Inc. We have performed a preliminary Section 382 calculation and have determined that $57.0 million of the $62.0 million net operating losses acquired from Stoke will not be available to offset future taxable income, and have therefore not included them in our total U.S. federal net operating carryforwards of $115.0 million. The amount included may change, subject to finalizing a Section 382 study. Additionally, with the Stoke acquisition, we also acquired $6.2 million of research and development tax credit carryforwards, which we believe are fully limited under Section 383 and have, therefore, assigned them no benefit. We have available tax credit carryforwards of $1.3 million and $2.1 million, which can be used to reduce U.S. federal and Canadian federal tax, respectively. However, we have applied tax credits of $0.4 million and $1.3 million associated with unrecognized tax liabilities that expire between 2024 and 2034 to offset these credits, reducing their benefit.
We have recorded a full valuation allowance on all federal and foreign net operating losses, with the exception of the $1.0 million net operating loss associated with China. During 2014, we released the full valuation allowance on the net deferred tax assets associated with China and Canada. It is foreseeable that the income generated in these jurisdictions will allow for the full realization of the applicable deferred tax assets and thus a net deferred tax asset of $1.5 million was recorded in the period ended December 31, 2014. Additionally, the valuation allowance of $1.2 million associated with our operations in India was released during 2014, as these operations are now in a net deferred tax liability position, and such deferred tax liabilities are sufficient to offset the net deferred tax assets within the same future periods. The valuation allowance on the net deferred tax assets association with the State of Texas was released in 2013. The remaining net deferred tax assets of all other federal and foreign jurisdictions are still fully offset by a valuation allowance, which includes the net deferred tax assets associated with the acquisition of Stoke. The Stoke acquisition increased the valuation allowance be $15.1 million during the year ended December 31, 2014. Other notable changes to our valuation allowance during 2014 include an increase of $12.0 million due to current operations, a decrease of $1.4 million due to tax rate changes recorded for federal and foreign jurisdictions, and a $1.2 million decrease due to uncertain tax position liability offsets to net deferred tax assets.
During 2014, it was determined that certain foreign withholding taxes would not be realizable as foreign tax credits due to extended net operating losses in the entities in which the withholding taxes were incurred. Therefore, $0.8 million of foreign withholding taxes are included in income tax expense. We file federal, state and foreign income tax returns in jurisdictions with varying statutes of limitations. Generally, for federal income tax purposes, all years prior to 2011 are closed; however, these years remain open to examination to the extent of the utilization of net operating losses generated during these years. The 2010 through 2014 tax years generally remain subject to examination by federal and most state tax authorities. In foreign jurisdictions, varying tax years between 2006 through 2014 generally remain subject to examination by tax authorities.
88
A reconciliation of the beginning and ending amount of unrecognized tax benefits for the years ended December 31, 2014 and 2013 is as follows (in thousands):
2014 | 2013 | ||||||
Beginning Balance at January 1, | $ | 4,207 | $ | 3,904 | |||
Additions to unrecognized tax benefits taken during the period | 271 | 303 | |||||
Additions to unrecognized tax benefits as a result of positions taken in prior periods | 1,806 | — | |||||
Reductions to unrecognized benefits as a result of positions taken during the period | (2,273 | ) | — | ||||
Additions to unrecognized tax benefits as a result of current year acquisitions | 1,696 | — | |||||
Ending Balance at December 31, | $ | 5,707 | $ | 4,207 | |||
During the quarter ended June 30, 2014, we revised the beginning balance of our uncertain tax positions to reflect a gross presentation, rather than a presentation net of our deferred tax liability offset.
The total amount of these unrecognized tax benefits would affect the effective tax rate, if recognized. It is reasonably possible that certain of the uncertain tax positions disclosed in the table above could increase or decrease within the next 12 months as a result of developing issues, management’s continuing review of existing positions, examinations or expiration of statute of limitations. We are not able to make an estimate of the range of the reasonably possible change. We have elected to recognize accrued interest and penalties related to uncertain tax positions as a component of income tax expense. Cumulative interest and penalties recorded to this liability for the period ended December 31, 2014 equals $1.4 million with $1.0 million recognized in income tax expense during the year ended December 31, 2014.
Any undistributed earnings of our foreign subsidiaries are considered to be indefinitely reinvested and, accordingly, no provision for U.S. federal and state income taxes has been provided thereon and we expect that future earnings will also be reinvested in foreign operations indefinitely. Upon repatriation of these earnings, in the form of dividends or otherwise, we would be subject to both U.S. income taxes (subject to an adjustment for foreign credits) and withholding taxes payable to various foreign countries. Determination of the amount of unrecognized deferred U.S. income tax liability is not practicable due to the complexities associated with its hypothetical calculation. Income taxes have not been provided on $21.0 million of undistributed earnings of foreign subsidiaries as of December 31, 2014.
13. Financial Instruments
The majority of our operations are international, giving rise to significant exposure to market risks from changes in foreign exchange rates. Our results of operations would generally be adversely affected by an increase in the value of the U.S. dollar relative to the currencies of the countries in which we are profitable and a decrease in the value of the U.S. dollar relative to the currencies of the countries in which we are not profitable. In the future, we may use derivative financial instruments to reduce these risks, but does not hold or issue financial instruments for trading purposes. These financial instruments are subject to normal credit standards, financial controls, risk management and monitoring procedures.
Currency Risk
We have currency exposure arising from significant operations and contracts in multiple jurisdictions. We have limited its currency exposure to freely-tradable and liquid currencies of first world countries.
Concentration of Credit Risk
Accounts receivable are generally with diversified customers and dispersed across many geographical regions. As of December 31, 2014 and 2013, two customer balances represented more than 10% of the overall account receivable balance. We believe no significant concentration of credit risk exists with respect to these accounts receivable. For the year ended December 31, 2014, one customer represented 39% of the total revenues. For the year ended December 31, 2013, four customers represented 58% of the total revenues. For the year ended December 31, 2012, four customers represented 46% of the total revenues.
We are required to estimate the collectability of our accounts receivable each accounting period and record a reserve for bad debts. A considerable amount of judgment is required in assessing the realization of these receivables, including the current creditworthiness of each customer, current and historical collection history and the related aging of past due balances. We evaluate specific accounts when it becomes aware of information indicating that a customer may not be able to meet its financial obligations due to the deterioration of its financial condition, lower credit ratings, bankruptcy or other factors, affecting the ability to render payment. Reserve requirements are based on the facts available and are re-evaluated and adjusted as additional information is received.
89
14. Segment and Geographic Information
Operating segments are defined as components of an enterprise about which separate financial information is available that is evaluated regularly by the chief operating decision makers, in deciding how to allocate resources and in assessing performance. Our chief operating decision-maker reviews financial information presented on a consolidated basis, accompanied by disaggregated information about revenues by geographic region for purposes of allocating resources and evaluating financial performance. We have concluded that we operate in one segment and have provided the required enterprise-wide disclosures.
Revenues by geographic area are based on the deployment site location of the end customers. The following tables present revenue and long-lived assets as of and for the year ended December 31 by geographic area (in thousands):
2014 | Revenues | Long-lived Assets | |||||
North America | $ | 71,479 | $ | 15,317 | |||
EMEA (or Europe, Middle East and Africa) | 40,772 | 1,295 | |||||
APAC (or Asia-Pacific) | 17,544 | 994 | |||||
Consolidated Total | $ | 129,795 | $ | 17,606 | |||
2013 | Revenues | Long-lived Assets | |||||
North America | $ | 48,130 | $ | 8,475 | |||
EMEA (or Europe, Middle East and Africa) | 38,469 | 1,888 | |||||
APAC (or Asia-Pacific) | 14,709 | 759 | |||||
Consolidated Total | $ | 101,308 | $ | 11,122 | |||
2012 | Revenues | Long-lived Assets | |||||
North America | $ | 37,314 | $ | 9,627 | |||
EMEA (or Europe, Middle East and Africa) | 20,547 | 2,314 | |||||
APAC (or Asia-Pacific) | 15,979 | 615 | |||||
Consolidated Total | $ | 73,840 | $ | 12,556 | |||
15. Quarterly Financial Data (unaudited)
Three Months Ended, | |||||||||||||||
Mar. 31, 2014 | June 30, 2014 | September 30, 2014 | December 31, 2014 | ||||||||||||
(in thousands, except per share amounts) | |||||||||||||||
Total Revenues | $ | 28,729 | $ | 33,287 | $ | 34,052 | $ | 33,727 | |||||||
Gross Profit | 16,032 | 18,432 | 17,982 | 18,500 | |||||||||||
Operating loss | (2,222 | ) | (2,230 | ) | (3,837 | ) | (8,783 | ) | |||||||
Net loss | (4,045 | ) | (3,891 | ) | (5,805 | ) | (12,295 | ) | |||||||
Net loss per share: | |||||||||||||||
Basic and Diluted | $ | (0.17 | ) | $ | (0.16 | ) | $ | (0.21 | ) | $ | (0.43 | ) | |||
Three Months Ended, | |||||||||||||||
Mar. 31, 2013 | June 30, 2013 | September 30, 2013 | December 31, 2013 | ||||||||||||
(in thousands, except per share amounts) | |||||||||||||||
Total Revenues | $ | 22,438 | $ | 25,752 | $ | 25,971 | $ | 27,147 | |||||||
Gross Profit | 14,457 | 13,492 | 12,449 | 15,737 | |||||||||||
Operating loss | (1,697 | ) | (869 | ) | (3,407 | ) | (1,735 | ) | |||||||
Net loss | (4,294 | ) | (3,641 | ) | (4,513 | ) | (2,842 | ) | |||||||
Net loss per share: | |||||||||||||||
Basic and Diluted | $ | (3.21 | ) | $ | (2.72 | ) | $ | (3.35 | ) | $ | (0.22 | ) | |||
90
16. Subsequent Events
Shares available for grant under the 2013 Plan increased by 1,301,176 shares on January 1, 2015, in accordance with the terms of the 2013 Plan.
Shares available for issuance under the ESPP increased by 289,150 shares on January 1, 2015, in accordance with the terms of the ESPP Plan.
In January 2015, we closed our acquisition of Ulticom, Inc. for total consideration of $20.0 million, subject to certain customary closing adjustments. We used cash on hand to fund the acquisition. The valuation of the assets acquired and liabilities assumed is currently in process. In connection with the closing of Ulticom, we amended our credit facility to extend the monthly interest only payments until April 2016.
On February 28, 2015, we entered into a definitive merger agreement in which Mitel Networks Corporation ("Mitel") will acquire all of our outstanding shares of common stock in a cash and stock deal valued at approximately $560.0 million (based on the closing price of Mitel shares on February 27, 2015). We expect the merger to close in the second quarter of 2015.
91
Item 9. | Changes in and Disagreements With Accountants on Accounting and Financial Disclosure |
None.
Item 9A. | Controls and Procedures |
Acquisition of Stoke
On November 18, 2014, we acquired Stoke. For purposes of determining the effectiveness of our disclosure controls and procedures and internal control over financial reporting as of December 31, 2014, and any change in our internal control over financial reporting for the fourth quarter of 2014, management has excluded the internal control over financial reporting of Stoke from its evaluation of these matters. The acquired businesses represent approximately 6.6% of our consolidated total assets at December 31, 2014 and approximately 3.7% of our consolidated net loss for the year ended December 31, 2014. Any material change to our internal control over financial reporting due to the acquisition of Stoke will be disclosed in our annual report for the year ending December 31, 2015 in which our assessment that encompasses Stoke will be included.
Evaluation of Disclosure Controls and Procedures
Disclosure controls and procedures are controls and other procedures that are designed to ensure that information required to be disclosed in our reports filed or submitted under the Securities Exchange Act of 1934, as amended (the Exchange Act), is recorded, processed, summarized and reported within the time periods specified in the SEC’s rules and forms. Disclosure controls and procedures include, without limitation, controls and procedures designed to ensure that information required to be disclosed in our reports filed or submitted under the Exchange Act is accumulated and communicated to management, including our chief executive officer and chief financial officer, as appropriate to allow timely decisions regarding required disclosure.
As of December 31, 2014, management carried out an evaluation, under the supervision and with the participation of our chief executive officer and chief financial officer, of the effectiveness of our disclosure controls and procedures (as defined in Rules 13a-15(e) and 15d-15(e) of the Exchange Act). Based upon the evaluation, which excluded Stoke, and due to the presence of the material weaknesses in internal control over financial reporting that are described below, our chief executive officer and chief financial officer concluded that, as of December 31, 2014, our disclosure controls and procedures were not effective at the reasonable assurance level. See “Acquisition of Stoke.”
Management’s Report on Internal Control Over Financial Reporting
Our management is responsible for establishing and maintaining adequate internal control over financial reporting. Internal control over financial reporting, as defined in Rules 13a-15(f) and 15d-15(f) of the Exchange Act, is a process designed by, or under the supervision of, the chief executive officer and chief financial officer, or persons performing similar functions, and effected by the board of directors, management and other personnel, to provide reasonable assurance regarding the reliability of financial reporting and the preparation of financial statements for external purposes in accordance with U.S. GAAP and includes those policies and procedures that: (i) pertain to the maintenance of records that in reasonable detail accurately and fairly reflect the transactions and dispositions of the assets of the Company; (ii) provide reasonable assurance that transactions are recorded as necessary to permit preparation of financial statements in accordance with U.S. GAAP, and that receipts and expenditures of the Company are being made only in accordance with authorizations of management and directors of the Company; and (iii) provide reasonable assurance regarding prevention or timely detection of unauthorized acquisition, use or disposition of the Company’s assets that could have a material effect on the financial statements.
Because of inherent limitations, internal control over financial reporting may not prevent or detect misstatements. Also, projections of any evaluation of effectiveness to future periods are subject to the risk that controls may become inadequate because of changes in conditions or that the degree of compliance with the policies or procedures may deteriorate.
Our management, under the supervision and with the participation of our chief executive officer and chief financial officer, conducted an evaluation of the effectiveness of our internal control over financial reporting using the criteria set forth by the Committee of Sponsoring Organizations of the Treadway Commission (“COSO”) in Internal Control-Integrated Framework (2013). Based on its evaluation, which excluded the internal control over financial reporting of Stoke, our management concluded that our internal control over financial reporting was not effective as of December 31, 2014 because of the identification of the material weaknesses identified below. See “-Acquisition of Stoke.”
92
In connection with the audit of our consolidated financial statements for the year ended December 31, 2014, management and our independent registered public accounting firm identified the following material weaknesses:
Period-end financial close and reporting process. Specifically, this material weakness was the result of the following:
a. | the ineffective implementation of a period-end closing calendar and an aggressive filing schedule that does not allow proper time for management and its oversight committees to properly review SEC filings; |
b. | ineffective controls over the timely preparation, review and approval of all financial statement account reconciliations; and |
c. | ineffective control over the review, approval, documentation and recording of our journal entries. Specifically, effective controls were not designed and in place to ensure the existence, accuracy and completeness of the journal entries recorded, both recurring and non-recurring. |
Accounting for income taxes. We have not implemented effective internal controls over the preparation of our income tax provisions and related accounts and disclosures. Specifically, we outsource the preparation of the income tax provision, but lack reconciliation and management review controls that operate at a sufficient level of precision to ensure the completeness and accuracy of the data used in the computation of income tax expense, taxes payable or receivable and deferred taxes assets and liabilities. This material weakness resulted in material late adjustments to our income tax provision.
As a result of these material weaknesses, our control environment is ineffective to ensure that the design and execution of our controls have consistently resulted in effective and timely review of our financial statements and supervision by appropriate individuals.
Under standards established by the Public Company Accounting Oversight Board, a material weakness is a deficiency, or combination of deficiencies, in internal control over financial reporting, such that there is a reasonable possibility that a material misstatement of our annual or interim financial statements will not be prevented or detected and corrected on a timely basis.
Management’s Plan for Remediation of Our Material Weaknesses
While the material weakness related to the period-end close process has existed since in 2012, management has made efforts to improve the design and operating effectiveness of internal control over financial reporting. In 2014, we implemented a system that interfaces with our general ledger and allows us to set up rules to ensure all accounts that meet the criteria are reconciled and approved in accordance with our policy. However, we failed to ensure the timely completion of the reconciliations. We will continue to stress the importance of timeliness and accountability and begin testing early in the year to ensure time for remediation. We have begun to evaluate automated journal entry review and approval options and will implement a manual review process in the second quarter of 2015, should an automated solution not be implemented at that time. We will continue to explore ways to shorten our close calendar, as well as move our filing date out to accommodate proper reviews of SEC documents.
A knowledgeable person within Mavenir, whether a consultant representing management or a permanent employee, will be hired to supervise the third party preparation of tax related items and review for completeness, accuracy and proper presentation.
Management expects remediation efforts to continue throughout 2015 to continue to improve our internal control over financial reporting.
Attestation of the Registered Public Accounting Firm
This Annual Report on Form 10-K does not include an attestation report of our independent registered public accounting firm due to an exemption provided under the JOBS Act.
93
Changes in Internal Control over Financial Reporting
Other than the acquisition of Stoke, discussed above, there was no change in our internal control over financial reporting identified in connection with the evaluation required by Rule 13a-15(d) and 15d-15(d) of the Exchange Act that occurred during the most recently completed fiscal quarter that has materially affected, or is reasonably likely to materially affect, our internal control over financial reporting.
Item 9B. | Other Information |
None.
PART III.
Item 10. | Directors, Executive Officers and Corporate Governance |
The information required by this item will be contained in our definitive proxy statement to be filed with the Securities and Exchange Commission in connection with our 2015 annual meeting of stockholders (the “Proxy Statement”), or an amendment to this report, which is to be filed not later than 120 days after December 31, 2014, and is incorporated in this report by reference.
Code of Business Conduct and Ethics
Our Board of Directors has adopted a Code of Business Conduct and Ethics. The Code of Business Conduct and Ethics will apply to all of our employees, officers, agents and representatives, including directors and consultants.
Our Board of Directors has also adopted an additional Code of Ethics for our Chief Executive Officer, Chief Financial Officer and Principal Accounting Officer. This Code of Ethics, applicable to the specified officers, contains additional requirements including a prohibition on personal loans from the company (except where permitted by, and disclosed pursuant to, applicable law), and a requirement to review reports to be filed with SEC.
We intend to disclose future amendments to certain provisions of our Code of Business Conduct and Ethics and our Code of Ethics for our Chief Executive Officer, Chief Financial Officer and Principal Accounting Officer, or waivers of those provisions, applicable to any principal executive officer, principal financial officer, principal accounting officer or controller, or persons performing similar functions or our directors on our website identified below. The full text of our Code of Business Conduct and Ethics and our Code of Ethics for our Chief Executive Officer, Chief Financial Officer and Principal Accounting Officer can be found in the Investor Relations section of our website at http://investor.mavenir.com.
Item 11. | Executive Compensation |
The information required by this item will be set forth in the Proxy Statement or an amendment to this report and is incorporated herein by reference.
Item 12. | Security Ownership of Certain Beneficial Owners and Management and Related Stockholder Matters |
The information required by this item will be set forth in the Proxy Statement or an amendment to this report and is incorporated herein by reference.
Item 13. | Certain Relationships and Related Transactions, and Director Independence |
The information required by this item will be set forth in the Proxy Statement or an amendment to this report and is incorporated herein by reference.
Item 14. | Principal Accountant Fees and Services |
The information required by this item will be set forth in the Proxy Statement or an amendment to this report and is incorporated herein by reference.
94
PART IV.
Item 15. | Exhibits, Financial Statement Schedules |
(a) | The following documents are included as part of this report: |
(a) | Consolidated Financial Statements—See Index to Consolidated Financial Statements at Item 8 of Part II of this Annual Report on Form 10-K. |
(b) | Financial Statement Schedules—Schedules not listed above have been omitted because the information required to be set forth therein is not applicable or is shown in the financial statements or notes herein. |
(c) | Exhibits—See the Exhibit Index immediately following the signature page of this Annual Report on Form 10-K. |
95
SIGNATURES
Pursuant to the requirements of Section 13 or 15(d) of the Securities Exchange Act of 1934, the Registrant has duly caused this report to be signed on its behalf by the undersigned, thereunto duly authorized, in the City of Richardson, State of Texas.
Mavenir Systems, Inc. | ||||||
Dated: March 3, 2015 | By: | /s/ Pardeep Kohli | ||||
Pardeep Kohli | ||||||
President and Chief Executive Officer | ||||||
POWER OF ATTORNEY
KNOW ALL PERSONS BY THESE PRESENTS, that each person whose signature appears below constitutes and appoints Pardeep Kohli and Terry Hungle, and each of them, either of whom may act without the joinder of the other, as his true and lawful attorneys-in-fact and agents with full power of substitution and re-substitution, for him or her and in his or her name, place and stead, in any and all capacities, to sign any and all amendments to this Annual Report on Form 10-K, and to file the same, with all exhibits thereto and all documents in connection therewith, with the Securities and Exchange Commission, granting unto said attorneys-in-fact and agents, and each of them, full power and authority to do and perform each and every act and thing requisite and necessary to be done in and about the premises, as fully to all intents and purposes as he might or could do in person, hereby ratifying and confirming all that said attorneys-in-fact and agents or any of them, or his or their substitute or substitutes, may lawfully do or cause to be done or by virtue hereof.
Pursuant to the requirements of the Securities Exchange Act of 1934, this report has been signed by the following persons on behalf of the Registrant and in the capacities indicated on March 3, 2015.
96
Signature | Title | |
/s/ Pardeep Kohli | President, Chief Executive Officer and Director (Principal Executive Officer) | |
Pardeep Kohli | ||
/s/ Terry Hungle | Chief Financial Officer (Principal Financial Officer) | |
Terry Hungle | ||
/s/ David Lunday | Controller (Principal Accounting Officer) | |
David Lunday | ||
/s/ Benjamin L. Scott | Chairman of the Board | |
Benjamin L. Scott | ||
/s/ Ammar H. Hanafi | Director | |
Ammar H. Hanafi | ||
/s/ Jeffrey P. McCarthy | Director | |
Jeffrey P. McCarthy | ||
/s/ Vivek Mehra | Director | |
Vivek Mehra | ||
/s/ Hubert de Pesquidoux | Director | |
Hubert de Pesquidoux | ||
/s/ Venu Shamapant | Director | |
Venu Shamapant | ||
97
INDEX OF EXHIBITS
The following exhibits are included as a part of this report.
Exhibits designated by a cross (†) are management contracts or compensatory plans or arrangements required to be filed as exhibits to this Form 10-K by Item 601(b)(10)(iii) of Regulation S-K.
The agreements included as exhibits are included only to provide information to investors regarding their terms. The agreements listed below may contain representations, warranties and other provisions that were made, among other things, to provide the parties thereto with specified rights and obligations and to allocate risk among them, and such agreements should not be relied upon as constituting or providing any factual disclosures about us, any other persons, any state of affairs or other matters.
Incorporated by Reference | ||||||||||
Exhibit Number | Exhibit Description | Form | File No. | Date of First Filing | Exhibit Number | Provided Herewith | ||||
2.1 | Agreement and Plan of Merger, dated November 12, 2014, by and among Mavenir Systems, Inc., Storm Merger Sub, Inc., Stoke, Inc., the Equityholders of Stoke, Inc. named therein, and the Equityholders' Representative. | 8-K | 001-36171 | 11/21/2014 | 2.1 | |||||
2.2 | Stock Purchase Agreement, dated January 20, 2015, by and among Mavenir Systems, Inc., Ulticom, Inc., Utah Holding, Inc., and the stockholders of Utah Holding, Inc. | 8-K | 001-36171 | 1/20/2015 | 2.2 | |||||
3.1 | Amended and Restated Certificate of Incorporation of the Registrant filed on November 13, 2013. | 10-Q | 001-36171 | 12/5/2013 | 3.1 | |||||
3.2 | Amended and Restated Bylaws of the Registrant. | S-1 | 333-191563 | 10/4/2013 | 3.4 | |||||
4.1 | Amended and Restated Investors’ Rights Agreement, dated July 15, 2014. | S-1 | 333-197436 | 7/15/2014 | 4.1 | |||||
10.1† | Form of Indemnification Agreement for Directors and Officers of the Registrant. | S-1 | 333-191563 | 10/4/2013 | 10.1 | |||||
10.2† | Amended and Restated 2005 Stock Plan, as amended. | S-1 | 333-191563 | 10/4/2013 | 10.2 | |||||
10.3† | Form of Stock Option Agreement — Early Exercise for 2005 Stock Plan. | S-1 | 333-191563 | 10/4/2013 | 10.3 | |||||
10.4† | Form of Stock Option Agreement — Standard Exercise for 2005 Stock Plan. | S-1 | 333-191563 | 10/4/2013 | 10.4 | |||||
10.5† | Form of U.K. Stock Option Agreement for 2005 Stock Plan. | S-1 | 333-191563 | 10/4/2013 | 10.5 | |||||
10.6† | Form of International Stock Option Agreement for 2005 Stock Plan. | S-1 | 333-191563 | 10/4/2013 | 10.6 | |||||
98
Incorporated by Reference | ||||||||||
Exhibit Number | Exhibit Description | Form | File No. | Date of First Filing | Exhibit Number | Provided Herewith | ||||
10.7† | Amended and Restated 2013 Equity Incentive Plan. | S-1 | 333-191563 | 11/1/2013 | 10.7 | |||||
10.8† | Form of Notice of Grant — Early Exercise Option for 2013 Equity Incentive Plan. | S-1 | 333-191563 | 10/4/2013 | 10.8 | |||||
10.9† | Form of Notice of Grant — Standard Exercise Option for 2013 Equity Incentive Plan. | S-1 | 333-191563 | 10/4/2013 | 10.9 | |||||
10.10† | Form of Notice of Grant — Non-Employee Director Option for 2013 Equity Incentive Plan. | S-1 | 333-191563 | 10/4/2013 | 10.1 | |||||
10.11† | Form of Notice of Grant — Restricted Stock Unit for 2013 Equity Incentive Plan. | S-1 | 333-191563 | 10/4/2013 | 10.11 | |||||
10.12† | Form of Notice of Grant — International Option for 2013 Equity Incentive Plan. | S-1 | 333-191563 | 10/4/2013 | 10.12 | |||||
10.13† | Form of Notice of Grant — International Restricted Stock Unit for 2013 Equity Incentive Plan. | S-1 | 333-191563 | 10/4/2013 | 10.13 | |||||
10.14† | Amended and Restated Employee Stock Purchase Plan. | 10-Q | 001-36171 | 10/28/2014 | 10.1 | |||||
10.15† | Form of Omnibus Option Amendment for Certain Executive Officers (six months’ acceleration). | S-1 | 333-191563 | 10/4/2013 | 10.17.1 | |||||
10.16† | Form of Omnibus Option Amendment for Certain Executive Officers (twelve months’ acceleration). | S-1 | 333-191563 | 10/4/2013 | 10.17.2 | |||||
10.17† | Amended and Restated Executive Employment Agreement, dated December 18, 2012, between the Registrant and Pardeep Kohli. | S-1 | 333-191563 | 10/4/2013 | 10.18 | |||||
10.18† | Form of Pardeep Kohli Option Agreement for 2005 Stock Plan. | S-1 | 333-191563 | 10/4/2013 | 10.19 | |||||
10.19† | Amended and Restated Executive Employment Agreement, dated December 18, 2012, between the Registrant and Terry Hungle. | S-1 | 333-191563 | 10/4/2013 | 10.2 | |||||
10.20† | Executive Employment Agreement, dated December 18, 2012, between the Registrant and Bahram Jalalizadeh. | S-1 | 333-191563 | 10/4/2013 | 10.21 | |||||
10.21† | Amended and Restated Executive Employment Agreement, dated December 18, 2012, between the Registrant and Ashok Khuntia. | 10-Q | 001-36171 | 5/8/2014 | 10.1 | |||||
10.22† | Participation Agreement, dated June 27, 2011, between the Registrant and Terence McCabe. | S-1 | 333-191563 | 10/4/2013 | 10.22 | |||||
10.23† | Separation Agreement, dated August 12, 2013, by and between the Registrant and Matt Dunnett. | S-1 | 333-191563 | 10/4/2013 | 10.23 | |||||
10.24 | Form of Employment, Confidential Information, and Invention Assignment Agreement. | S-1 | 333-191563 | 10/4/2013 | 10.24 | |||||
10.25 | Amended and Restated Loan and Security Agreement, dated March 6, 2014. | 8-K | 001-36171 | 3/10/2014 | 10.1 | |||||
10.26 | First Loan Modification with Silicon Valley Bank, dated July 28, 2014. | 10-Q | 001-36171 | 7/28/2014 | 10.1 | |||||
10.27 | Second Loan Modification with Silicon Valley Bank, dated November 19, 2014. | X | ||||||||
99
Incorporated by Reference | ||||||||||
Exhibit Number | Exhibit Description | Form | File No. | Date of First Filing | Exhibit Number | Provided Herewith | ||||
10.28 | Third Loan Modification with Silicon Valley Bank, dated January 16, 2015. | X | ||||||||
10.29 | Intellectual Property Security Agreement, dated October 18, 2012, by and among the Registrant, Mavenir Holdings, Inc. and Silicon Valley Bank. | S-1 | 333-191563 | 10/4/2013 | 10.28 | |||||
10.30 | Reseller OEM Agreement, dated October 28, 2008, by and between the Registrant and Starent Networks Corp., assigned to Cisco Systems, Inc. as of September 3, 2010 (including amendments and addendums to date). | S-1 | 333-191563 | 10/4/2013 | 10.29 | |||||
10.31 | Extension of Reseller OEM Agreement, dated August 27, 2013, by Cisco Systems, Inc. | S-1 | 333-191563 | 10/4/2013 | 10.29.1 | |||||
10.32 | Loan and Security Agreement (Growth Capital Loan), dated as of June 4, 2013, by and among the Registrant, Silver Lake Waterman Fund, L.P. and certain subsidiaries of the Registrant. | S-1 | 333-191563 | 10/4/2013 | 10.3 | |||||
10.34† | Executive Bonus Plan. | S-1 | 333-191563 | 10/4/2013 | 10.31 | |||||
10.35† | Sales Incentive Plan | 10-K | 001-36171 | 2/21/2014 | 10.36 | |||||
21.1 | Subsidiaries of the Registrant. | X | ||||||||
23.1 | Consent of BDO USA, LLP, Independent Registered Public Accounting Firm. | X | ||||||||
31.1 | Certification of Chief Executive Officer Pursuant to Securities Exchange Act Rule 13a-14(a). | X | ||||||||
31.2 | Certification of Chief Financial Officer Pursuant to Securities Exchange Act Rule 13a-14(a). | X | ||||||||
32.1 | Certification of Chief Executive Officer Pursuant to 18 U.S.C. Section 1350 and Securities Exchange Act Rule 13a-14(b). | X | ||||||||
32.2 | Certification of Chief Financial Officer Pursuant to 18 U.S.C. Section 1350 and Securities Exchange Act Rule 13a-14(b). | X | ||||||||
101* | Consolidated financial statements from the Company’s Annual Report on Form 10-K for the year ended December 31, 2014, formatted in XBRL. | X | ||||||||
(†) | Management contract, compensatory plan or arrangement. |
(*) | The following consolidated financial statements from the Company’s Annual Report on Form 10-K for the fiscal year ended December 31, 2014, formatted in XBRL: (i) Consolidated Statements of Operations and Comprehensive Loss, (ii) Consolidated Balance Sheets, (iii) Consolidated Statements of Cash Flows, and (iv) Notes to Consolidated Financial Statements. |
100