Attached files
| file | filename |
|---|---|
| 8-K - FORM 8-K - Atlantic Union Bankshares Corp | v402791_8k.htm |
Exhibit 99.1

Investor Presentation February/March 2015
Forward - Looking Statement Certain statements in this report may constitute “forward - looking statements” within the meaning of the Private Securities Litigation Reform Act of 1995. Forward - looking statements are statements that include projections, predictions, expectations, or beliefs about future events or results or otherwise and are not statements of historical fact. Such statements are often characterized by the use of qualified words (and their derivatives) such as “expect,” “believe,” “estimate,” “plan,” “project,” “anticipate,” “intend,” “will,” or words of similar meaning or other statements concerning opinions or judgment of the Company and its management about future events. Although the Company believes that its expectations with respect to forward - looking statements are based upon reasonable assumptions within the bounds of its existing knowledge of its business and operations, there can be no assurance that actual results, performance, or achievements of the Company will not differ materially from any future results, performance, or achievements expressed or implied by such forward - looking statements. Actual future results and trends may differ materially from historical results or those anticipated depending on a variety of factors, including, but not limited to, the effects of and changes in: general economic and bank industry conditions, the interest rate environment, legislative and regulatory requirements, competitive pressures, new products and delivery systems, inflation, changes in the stock and bond markets, accounting standards or interpretations of existing standards, mergers and acquisitions, technology, and consumer spending and savings habits. More information is available on the Company’s website, http://investors.bankatunion.com and on the Securities and Exchange Commission’s website, www.sec.gov. The information on the Company’s website is not a part of this press release. The Company does not intend or assume any obligation to update or revise any forward - looking statements that may be made from time to time by or on behalf of the Company. 2
Company Overview • The largest community banking organization headquartered in Virginia • Holding company formed in 1993 – Banking history goes back more than 100 years • Assets of $7.4 Billion • Comprehensive financial services provider offering commercial and retail banking, mortgage, investment, trust and insurance products and services 3
Union’s Strengths • Unique branch network across Virginia, competitive banking products and services and a loyal client base • Well positioned for organic growth given commercial activity, household income levels and population growth in its footprint • Strong balance sheet and solid capital base • Conservative in - market lender • Experienced management team • Successful acquirer and integrator • Proven financial performance in both good and bad economic climates 4
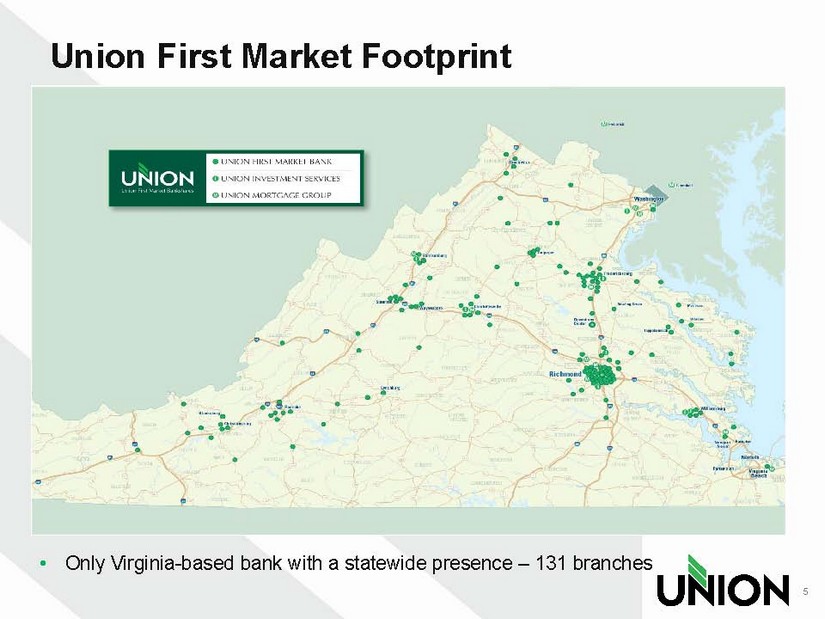
Union First Market Footprint 5 • Only Virginia - based bank with a statewide presence – 131 branches
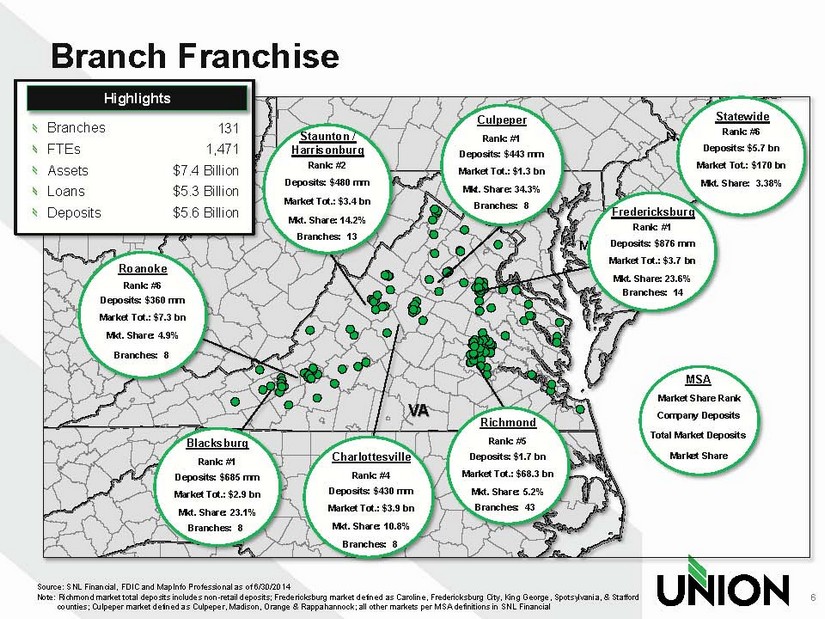
NC DC VA AL CT DE GA IL IN KY MA MD MI MS NJ NY OH RI SC TN WV Branch Franchise 6 Branches FTEs Assets Loans Deposits 131 1,471 $7.4 Billion $5 .3 Billion $5.6 Billion Source: SNL Financial, FDIC and MapInfo Professional as of 6/30/2014 Note: Richmond market total deposits includes non - retail deposits; Fredericksburg market defined as Caroline, Fredericksburg Cit y, King George, Spotsylvania, & Stafford counties; Culpeper market defined as Culpeper, Madison, Orange & Rappahannock; all other markets per MSA definitions in SNL F ina ncial Richmond Rank: #5 Deposits: $1.7 bn Market Tot.: $68.3 bn Mkt. Share: 5.2% Blacksburg Rank: #1 Deposits: $685 mm Market Tot.: $2.9 bn Mkt. Share: 23.1% Staunton / Harrisonburg Rank: #2 Deposits: $480 mm Market Tot.: $3.4 bn Mkt. Share: 14.2% Culpeper Rank: #1 Deposits: $443 mm Market Tot.: $ 1 .3 bn Mkt. Share: 34.3% MSA Market Share Rank Company Deposits Total Market Deposits Market Share Roanoke Deposits: $360 mm Market Tot.: $7.3 bn Mkt. Share: 4.9% Rank : #6 Charlottesville Rank: #4 Deposits: $430 mm Market Tot.: $3.9 bn Mkt. Share: 10.8% VA Fredericksburg Rank: #1 Deposits: $876 mm Market Tot.: $3.7 bn Mkt. Share: 23.6% Branches: 8 Branches: 13 Branches: 8 Branches: 14 Branches: 43 Branches: 8 Branches: 8 Statewide Rank: #6 Deposits: $5.7 bn Market Tot.: $170 bn Mkt. Share: 3.38% Highlights
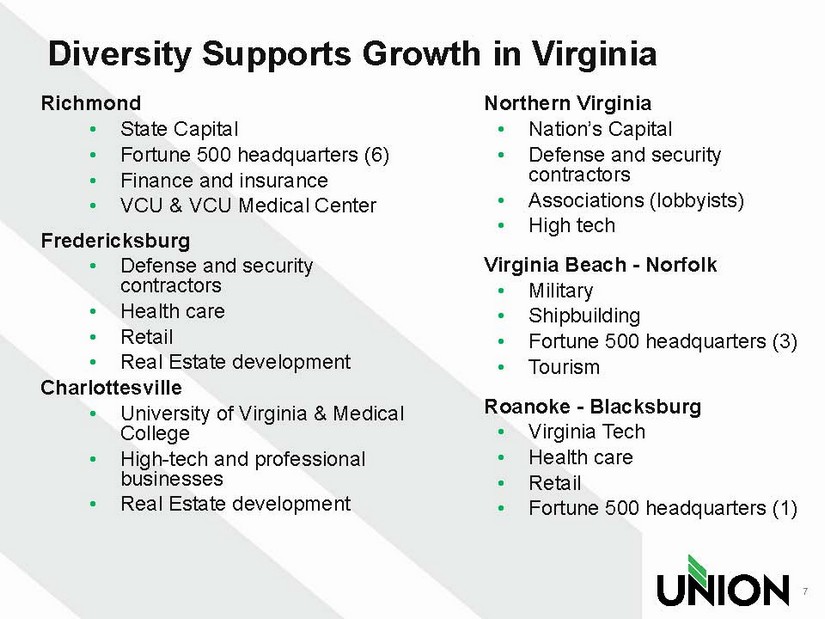
Diversity Supports Growth in Virginia Richmond • State Capital • Fortune 500 headquarters (6) • Finance and insurance • VCU & VCU Medical Center Fredericksburg • Defense and security contractors • Health care • Retail • Real Estate development Charlottesville • University of Virginia & Medical College • High - tech and professional businesses • Real Estate development Northern Virginia • Nation’s Capital • Defense and security contractors • Associations (lobbyists) • High tech Virginia Beach - Norfolk • Military • Shipbuilding • Fortune 500 headquarters (3) • Tourism Roanoke - Blacksburg • Virginia Tech • Health care • Retail • Fortune 500 headquarters (1) 7
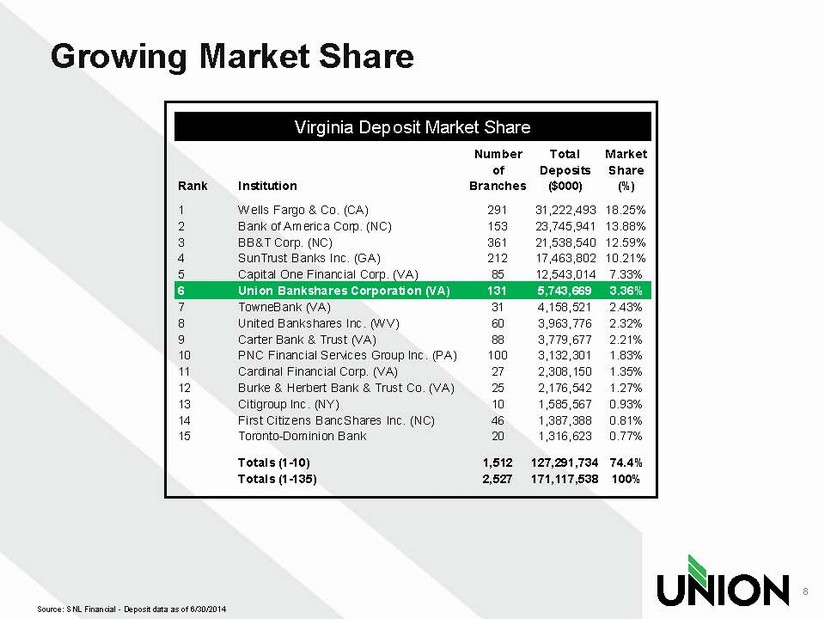
Growing Market Share 8 Source: SNL Financial - Deposit data as of 6/30/2014 Rank Institution Number of Branches Total Deposits ($000) Market Share (%) 1 Wells Fargo & Co. (CA) 291 31,222,493 18.25% 2 Bank of America Corp. (NC) 153 23,745,941 13.88% 3 BB&T Corp. (NC) 361 21,538,540 12.59% 4 SunTrust Banks Inc. (GA) 212 17,463,802 10.21% 5 Capital One Financial Corp. (VA) 85 12,543,014 7.33% 6 Union Bankshares Corporation (VA) 131 5,743,669 3.36% 7 TowneBank (VA) 31 4,158,521 2.43% 8 United Bankshares Inc. (WV) 60 3,963,776 2.32% 9 Carter Bank & Trust (VA) 88 3,779,677 2.21% 10 PNC Financial Services Group Inc. (PA) 100 3,132,301 1.83% 11 Cardinal Financial Corp. (VA) 27 2,308,150 1.35% 12 Burke & Herbert Bank & Trust Co. (VA) 25 2,176,542 1.27% 13 Citigroup Inc. (NY) 10 1,585,567 0.93% 14 First Citizens BancShares Inc. (NC) 46 1,387,388 0.81% 15 Toronto-Dominion Bank 20 1,316,623 0.77% Totals (1-10) 1,512 127,291,734 74.4% Totals (1-135) 2,527 171,117,538 100% Virginia Deposit Market Share
Uniquely Positioned To Grow • Unmatched footprint in Virginia – significant barriers for competitors to overcome • Higher lending capacity than other Virginia banks – larger potential customer base • Expansion opportunities in Northern Virginia and Virginia Beach • Consolidation opportunities in the current footprint • E xcess capital ready to deploy 9
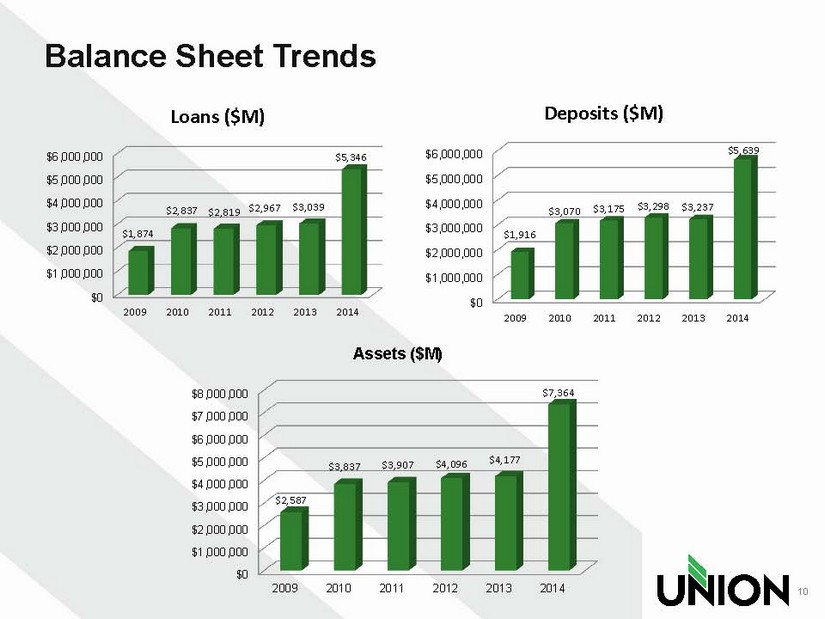
Balance Sheet Trends 10 $0 $1,000,000 $2,000,000 $3,000,000 $4,000,000 $5,000,000 $6,000,000 2009 2010 2011 2012 2013 2014 $1,874 $2,837 $2,819 $2,967 $3,039 $5,346 Loans ($M) $0 $1,000,000 $2,000,000 $3,000,000 $4,000,000 $5,000,000 $6,000,000 2009 2010 2011 2012 2013 2014 $1,916 $3,070 $3,175 $3,298 $3,237 $5,639 Deposits ($M) $0 $1,000,000 $2,000,000 $3,000,000 $4,000,000 $5,000,000 $6,000,000 $7,000,000 $8,000,000 2009 2010 2011 2012 2013 2014 $2,587 $3,837 $3,907 $4,096 $4,177 $7,364 Assets ($M)
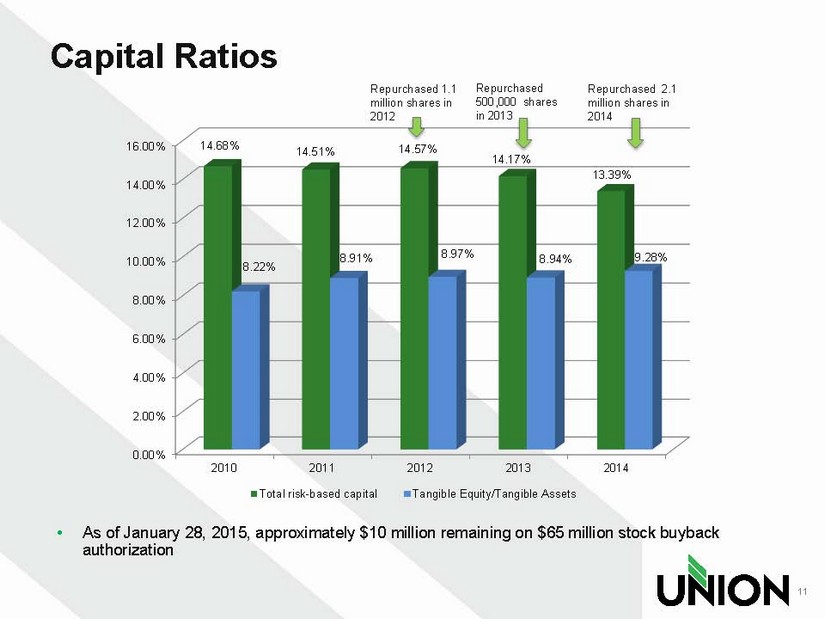
Capital Ratios 11 • As of January 28, 2015, approximately $10 million remaining on $65 million stock buyback authorization 0.00% 2.00% 4.00% 6.00% 8.00% 10.00% 12.00% 14.00% 16.00% 2010 2011 2012 2013 2014 14.68% 14.51% 14.57% 14.17% 13.39% 8.22% 8.91% 8.97% 8.94% 9.28% Total risk-based capital Tangible Equity/Tangible Assets Repurchased 1.1 million shares in 2012 Repurchased 500,000 shares in 2013 Repurchased 2.1 million shares in 2014
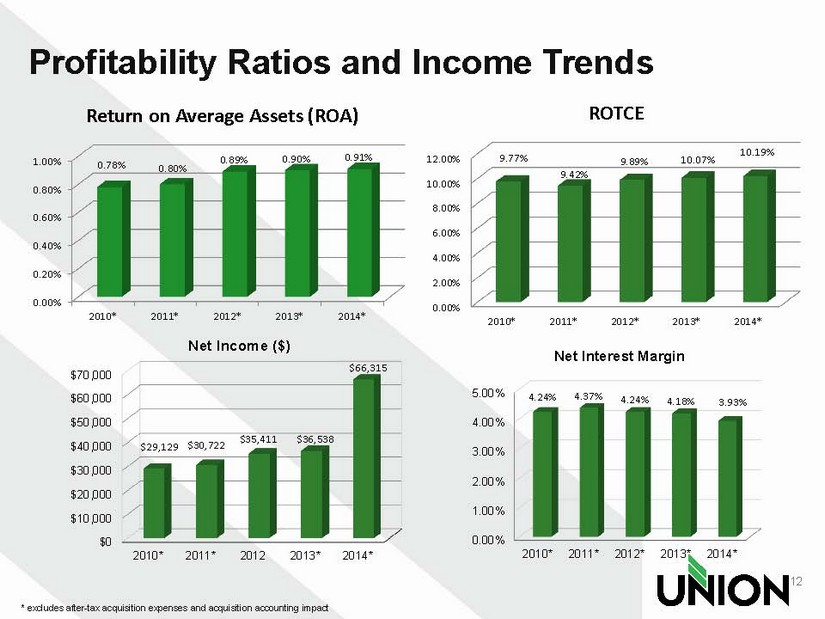
Profitability Ratios and Income Trends 12 * excludes after - tax acquisition expenses and acquisition accounting impact 0.00% 0.20% 0.40% 0.60% 0.80% 1.00% 2010* 2011* 2012* 2013* 2014* 0.78% 0.80% 0.89% 0.90% 0.91% Return on Average Assets (ROA) 0.00% 2.00% 4.00% 6.00% 8.00% 10.00% 12.00% 2010* 2011* 2012* 2013* 2014* 9.77% 9.42% 9.89% 10.07% 10.19% ROTCE $0 $10,000 $20,000 $30,000 $40,000 $50,000 $60,000 $70,000 2010* 2011* 2012 2013* 2014* $29,129 $30,722 $35,411 $36,538 $66,315 Net Income ($) 0.00% 1.00% 2.00% 3.00% 4.00% 5.00% 2010* 2011* 2012* 2013* 2014* 4.24% 4.37% 4.24% 4.18% 3.93% Net Interest Margin
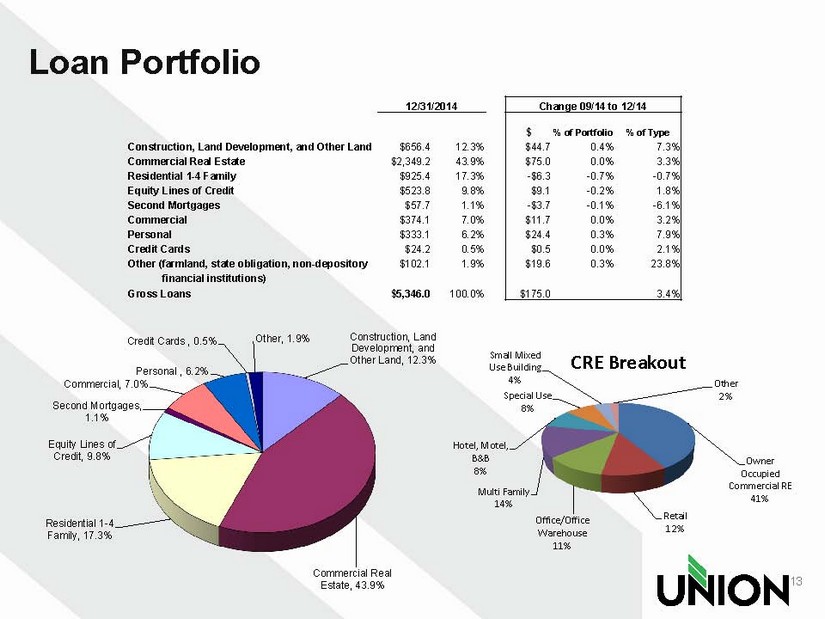
Loan Portfolio 13 12/31/2014 Change 09/14 to 12/14 $ % of Portfolio % of Type Construction, Land Development, and Other Land $656.4 12.3% $44.7 0.4% 7.3% Commercial Real Estate $2,349.2 43.9% $75.0 0.0% 3.3% Residential 1 - 4 Family $925.4 17.3% - $6.3 - 0.7% - 0.7% Equity Lines of Credit $523.8 9.8% $9.1 - 0.2% 1.8% Second Mortgages $57.7 1.1% - $3.7 - 0.1% - 6.1% Commercial $374.1 7.0% $11.7 0.0% 3.2% Personal $333.1 6.2% $24.4 0.3% 7.9% Credit Cards $24.2 0.5% $0.5 0.0% 2.1% Other (farmland , state obligation, non - depository $102.1 1.9% $19.6 0.3% 23.8% financial institutions) Gross Loans $5,346.0 100.0% $175.0 3.4% Construction, Land Development, and Other Land, 12.3% Commercial Real Estate , 43.9% Residential 1 - 4 Family , 17.3% Equity Lines of Credit, 9.8% Second Mortgages , 1.1% Commercial, 7.0% Personal , 6.2% Credit Cards , 0.5% Other, 1.9% Owner Occupied Commercial RE 41% Retail 12% Office/Office Warehouse 11% Multi Family 14% Hotel, Motel, B&B 8% Special Use 8% Small Mixed Use Building 4% Other 2% CRE Breakout
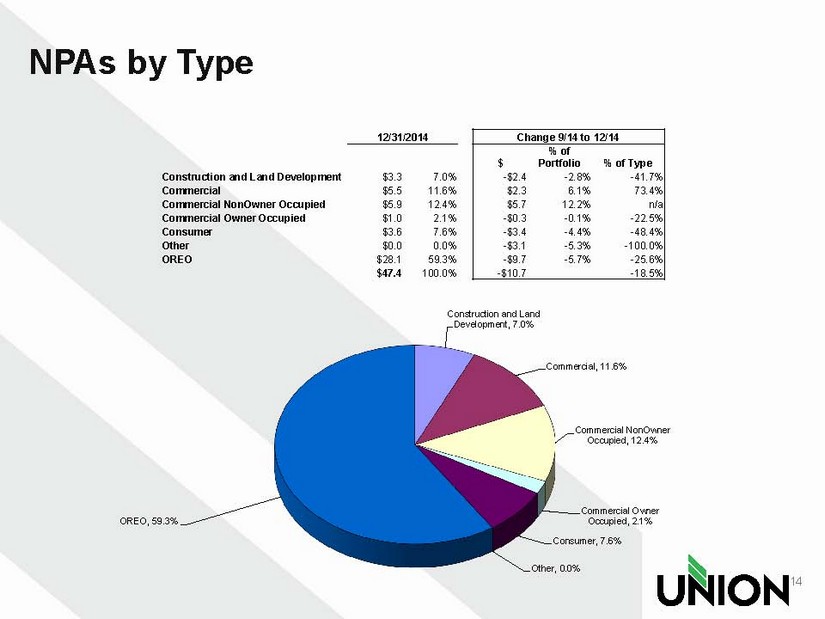
NPAs by Type 14 12/31/2014 Change 9/14 to 12/14 $ % of Portfolio % of Type Construction and Land Development $3.3 7.0% - $2.4 - 2.8% - 41.7% Commercial $5.5 11.6% $2.3 6.1% 73.4% Commercial NonOwner Occupied $5.9 12.4% $5.7 12.2% n/a Commercial Owner Occupied $1.0 2.1% - $0.3 - 0.1% - 22.5% Consumer $3.6 7.6% - $3.4 - 4.4% - 48.4% Other $0.0 0.0% - $3.1 - 5.3% - 100.0% OREO $28.1 59.3% - $9.7 - 5.7% - 25.6% $47.4 100.0% - $10.7 - 18.5% Construction and Land Development , 7.0% Commercial , 11.6% Commercial NonOwner Occupied , 12.4% Commercial Owner Occupied , 2.1% Consumer , 7.6% Other, 0.0% OREO , 59.3%
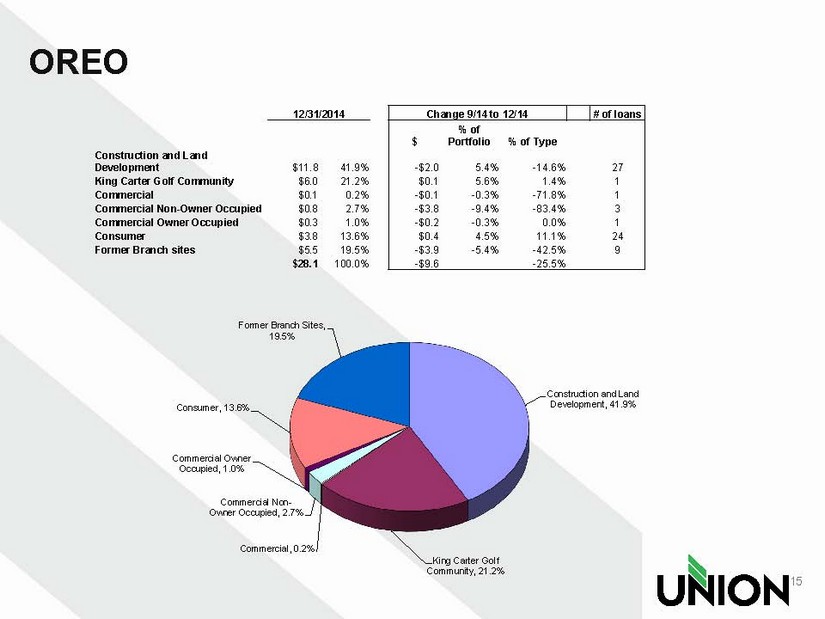
Construction and Land Development , 41.9% King Carter Golf Community , 21.2% Commercial , 0.2% Commercial Non - Owner Occupied , 2.7% Commercial Owner Occupied , 1.0% Consumer , 13.6% Former Branch Sites, 19.5% OREO 15 12/31/2014 Change 9/14 to 12/14 # of loans $ % of Portfolio % of Type Construction and Land Development $11.8 41.9% - $2.0 5.4% - 14.6% 27 King Carter Golf Community $6.0 21.2% $0.1 5.6% 1.4% 1 Commercial $0.1 0.2% - $0.1 - 0.3% - 71.8% 1 Commercial Non - Owner Occupied $0.8 2.7% - $3.8 - 9.4% - 83.4% 3 Commercial Owner Occupied $0.3 1.0% - $0.2 - 0.3% 0.0% 1 Consumer $3.8 13.6% $0.4 4.5% 11.1% 24 Former Branch sites $5.5 19.5% - $3.9 - 5.4 % - 42.5% 9 $28.1 100.0% - $9.6 - 25.5%
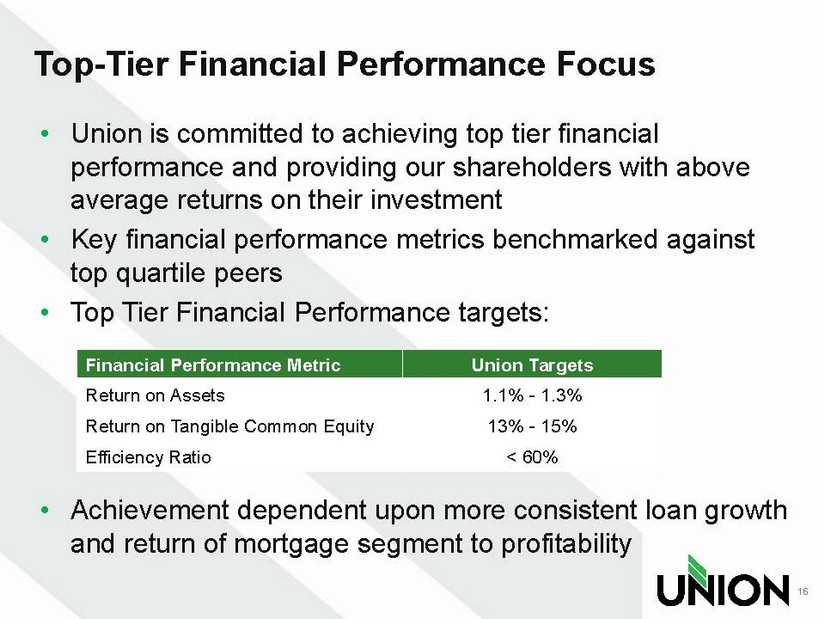
Top - Tier Financial Performance Focus • Union is committed to achieving top tier financial performance and providing our shareholders with above average returns on their investment • Key financial performance metrics benchmarked against top quartile peers • Top Tier Financial Performance targets: • Achievement dependent upon more consistent loan growth and return of mortgage segment to profitability 16 Financial Performance Metric Union Targets Return on Assets 1.1% - 1.3% Return on Tangible Common Equity 13% - 15% Efficiency Ratio < 60%
2015 Outlook • Leveraging new franchise • Stable to growing economy in footprint • Mid single digit loan growth • Modest net interest margin compression • Continued asset quality improvement – reduction of OREO • Improving ROA, ROTCE and Efficiency Ratio • $65 million in share repurchases authorized through 2015 - $10 million remaining 17
Value Proposition • Statewide Branch footprint is a competitive advantage and brings a unique franchise value • Strong balance sheet and capital base • Organic growth and acquisition opportunities • Experienced management team • Committed to top tier financial performance • Shareholder Value Driven • Solid dividend yield and payout ratio with earnings upside 18

THANK YOU!