Attached files
UNITED STATES
SECURITIES AND EXCHANGE COMMISSION
Washington, D.C. 20549
FORM 10-K
(Mark One)
|
☒ |
ANNUAL REPORT PURSUANT TO SECTION 13 OR 15(d) OF THE SECURITIES EXCHANGE ACT OF 1934 |
For the fiscal year ended December 31, 2014
OR
|
☐ |
TRANSITION REPORT PURSUANT TO SECTION 13 OR 15(d) OF THE SECURITIES EXCHANGE ACT OF 1934 |
Commission file number: 1-34036
John Bean Technologies Corporation
(Exact name of registrant as specified in its charter)
|
Delaware |
|
91-1650317 |
|
(State or other jurisdiction of incorporation or organization) |
|
(I.R.S. Employer Identification Number) |
70 West Madison Street
Chicago, IL 60602
(Address of principal executive offices)
(312) 861-5900
(Registrant’s telephone number, including area code)
Securities registered pursuant to Section 12(b) of the Act:
|
|
|
|
|
Title of Each Class |
|
Name of Exchange on Which Registered |
|
Common Stock, $0.01 par value Preferred Share Purchase Rights |
|
New York Stock Exchange New York Stock Exchange |
Securities registered pursuant to Section 12(g) of the Act: None
Indicate by check mark if the registrant is a well-known seasoned issuer as defined in Rule 405 of the Securities Act. Yes ☒ No ☐
Indicate by check mark if the registrant is not required to file reports pursuant to Section 13 or Section 15(d) of the Act. Yes ☐ No ☒
Indicate by check mark whether the registrant (1) has filed all reports required to be filed by Section 13 or 15(d) of the Securities Exchange Act of 1934 during the preceding 12 months (or for such shorter period that the registrant was required to file such reports), and (2) has been subject to such filing requirements for the past 90 days. Yes ☒ No ☐
Indicate by check mark if disclosure of delinquent filers pursuant to Item 405 of Regulation S-K is not contained herein, and will not be contained, to the best of the registrant’s knowledge, in definitive proxy or information statements incorporated by reference in Part III of this Form 10-K or any amendment to this Form 10-K. ☒
Indicate by check mark whether the registrant has submitted electronically and posted on its corporate Web site, if any, every Interactive Data File required to be submitted and posted pursuant to Rule 405 of Regulation S-T during the preceding 12 months (or for such shorter period that the registrant was required to submit and post such files). Yes ☒ No ☐
Indicate by check mark whether the registrant is a large accelerated filer, an accelerated filer, a non-accelerated filer or a smaller reporting company. See definitions of “large accelerated filer,” “accelerated filer” and “smaller reporting company” in Rule 12b-2 of the Exchange Act. (Check one):
Large accelerated filer ☒ Accelerated filer ☐ Non-accelerated filer ☐ Smaller reporting company ☐
Indicate by check mark whether the registrant is a shell company (as defined in Rule 12b-2 of the Exchange Act). Yes ☐ No ☒
The aggregate market value of common stock held by non-affiliates of the registrant on the last business day of the registrant’s most recently completed second fiscal quarter was: $875,899,523.
At February 19, 2015, there were 29,316,041 shares of the registrant’s common stock outstanding.
DOCUMENTS INCORPORATED BY REFERENCE
Portions of the registrant’s Proxy Statement for the 2015 Annual Meeting of Stockholders are incorporated herein by reference in Part III of this Annual Report on Form 10-K to the extent stated herein.
TABLE OF CONTENTS
|
|
Page |
|||
|
PART I |
|
|||
|
Item 1. Business |
4 |
|||
|
Item 1A. Risk Factors |
16 |
|||
|
Item 1B. Unresolved Staff Comments |
26 |
|||
|
Item 2. Properties |
26 |
|||
|
Item 3. Legal Proceedings |
26 |
|||
|
Item 4. Mine Safety Disclosures |
26 | |||
|
PART II |
||||
|
|
||||
|
Item 5. Market for Registrant’s Common Equity and Related Stockholder Matters |
27 |
|||
|
Item 6. Selected Financial Data |
28 | |||
|
Item 7. Management’s Discussion and Analysis of Financial Condition and Results of Operations |
30 |
|||
|
Item 7A. Qualitative and Quantitative Disclosures About Market Risk |
41 |
|||
|
Item 8. Financial Statements and Supplementary Data |
42 |
|||
|
Item 9. Changes in and Disagreements with Accountants on Accounting and Financial Disclosure |
72 | |||
|
Item 9A. Controls and Procedures |
72 | |||
|
PART III |
||||
|
|
||||
|
Item 10. Directors, Executive Officers and Corporate Governance |
75 |
|||
|
Item 11. Executive Compensation |
75 | |||
|
Item 12. Security Ownership of Certain Beneficial Owners and Management and Related Stockholder Matters |
75 | |||
|
Item 13. Certain Relationships and Related Transactions, and Director Independence |
75 | |||
|
Item 14. Principal Accountant Fees and Services |
75 | |||
|
PART IV |
||||
|
|
||||
|
Item 15. Exhibits and Financial Statement Schedules |
76 |
|||
|
Signatures |
82 | |||
SPECIAL NOTE ABOUT FORWARD-LOOKING STATEMENTS
This Annual Report on Form 10-K and other materials filed or to be filed by John Bean Technologies Corporation, as well as information in oral statements or other written statements made or to be made by us, contain statements that are, or may be considered to be, forward-looking statements. All statements that are not historical facts, including statements about our beliefs or expectations, are forward-looking statements. You can identify these forward-looking statements by the use of forward-looking words such as “outlook,” “believes,” “expects,” “potential,” “continues,” “may,” “will,” “should,” “seeks,” “approximately,” “predicts,” “intends,” “plans,” “estimates,” “anticipates,” “foresees” or the negative version of those words or other comparable words and phrases. Any forward-looking statements contained in this Annual Report on Form 10-K are based upon our historical performance and on current plans, estimates and expectations. The inclusion of this forward-looking information should not be regarded as a representation by us or any other person that the future plans, estimates or expectations contemplated by us will be achieved. These forward looking statements include, among others, statements relating to:
|
• |
Fluctuations in our financial results; | |
|
|
• |
Unanticipated delays or acceleration in our sales cycles; |
|
|
• |
Deterioration of economic conditions; |
|
|
• |
Sensitivity of segments to variable or volatile factors; |
|
|
• |
Changes in demand for our products and services; |
|
• |
Changes in commodity prices, including those impacting materials used in our business; | |
|
|
• |
Disruptions in the political, regulatory, economic and social conditions of the foreign countries in which we conduct business; |
|
|
• |
Increases in energy prices; |
|
|
• |
Changes in food consumption patterns; |
|
|
• |
Impacts of pandemic illnesses, food borne illnesses and diseases to various agricultural products; |
|
|
• |
Weather conditions and natural disasters; |
|
|
• |
Acts of terrorism or war; |
|
|
• |
Termination or loss of major customer contracts; |
|
|
• |
Customer sourcing initiatives; |
|
|
• |
Competition and innovation in our industries; |
|
|
• |
Our ability to develop and introduce new or enhanced products and services; |
|
|
• |
Difficulty in developing, preserving and protecting our intellectual property; |
|
|
• |
Our ability to protect our information systems; |
|
|
• |
Adequacy of our internal controls; |
|
|
• |
Our ability to successfully integrate, operate and manage acquired businesses and assets; |
|
|
• |
Loss of key management and other personnel; |
|
|
• |
Potential liability arising out of the installation or use of our systems; |
|
|
• |
Our ability to comply with the laws and regulations governing our U.S. government contracts; |
|
|
• |
Our ability to comply with U.S. and international laws governing our operations and industries; |
|
|
• |
The outcome of pending or future litigation; |
|
|
• |
Increases in tax liabilities; |
|
|
• |
Difficulty in implementing our business strategies; and |
|
|
• |
Availability and access to financial and other resources. |
We believe that the factors that could cause our actual results to differ materially include but are not limited to the factors we describe herein, including under “Risk Factors,” and “Management’s Discussion and Analysis of Financial Condition and Results of Operations.” If one or more of those or other risks or uncertainties materialize, or if our underlying assumptions prove to be incorrect, actual results may vary materially from what we projected. Consequently, actual events and results may vary significantly from those included in or contemplated or implied by our forward-looking statements. The forward-looking statements included in this Annual Report on Form 10-K are made only as of the date hereof, and we undertake no obligation to publicly update or review any forward-looking statement made by us or on our behalf, whether as a result of new information, future developments, subsequent events or circumstances or otherwise.
PART I
Unless otherwise specified or indicated by the context, JBT Corporation, JBT, we, us, our and the Company refer to John Bean Technologies Corporation and its subsidiaries.
ITEM 1. BUSINESS
We are a global technology solutions provider for the food processing and air transportation industries. We design, manufacture, test and service technologically sophisticated systems and products for customers through our JBT FoodTech and JBT AeroTech segments.
JBT FoodTech markets its solutions and services to multi-national and regional industrial food processing companies. The product offerings of our FoodTech businesses include:
|
|
• |
Protein Processing Equipment. JBT FoodTech provides comprehensive solutions to our protein processing customers that include mixing/grinding, injecting, marinating, tumbling, portioning, coating, frying, and freezing for meat, seafood, and poultry, as well as ready-to-eat meals, fruits, vegetables, dairy, and bakery products. |
|
|
• |
Liquid Foods Processing Equipment. Our liquid foods portfolio includes in-container processing solutions for the filling, closing and sterilization of fruits, vegetables, soups, sauces, dairy, and pet food products as well as ready-to-eat meals in a wide variety of modern packages. It also includes fruit and juice processing solutions that extract, concentrate and aseptically process citrus, tomato and other fruits, vegetables, and juices. |
|
|
• |
Automated Systems. JBT FoodTech provides automatic guided vehicles for material handling in the food and beverage, manufacturing, warehouse, automotive, hospital, and printing industries. |
JBT AeroTech markets its solutions and services to domestic and international airport authorities, passenger airlines, airfreight and ground handling companies and military forces. The product offerings of our AeroTech businesses include:
|
|
• |
Mobile Equipment. JBT AeroTech’s portfolio of mobile air transportation equipment includes commercial and military cargo loading, aircraft deicing, aircraft towing, and ground aircraft power and cooling systems. |
|
|
• |
Fixed Equipment. JBT AeroTech provides gate equipment for passenger boarding. |
|
|
• |
Airport Services. JBT AeroTech includes the maintenance of airport equipment, systems, and facilities. |
For financial information about our business segments see Note 16 of our consolidated financial statements included in Item 8 of this Annual Report on Form 10-K.
In 2014, we instituted management changes and developed our Next Level strategy to capitalize on the leadership position of our businesses and accelerate growth and profitability. The Next Level strategy is based on a three-pronged plan to “fix”, “strengthen”, and “grow” JBT.
|
|
• |
Fix. We are implementing a “One JBT” cultural transformation across JBT, built on our long-standing values of integrity, accountability, and teamwork. At the organization level, we are implementing a shared services model, consolidating back office operations in the U.S. to standardize practices and leverage the scale of our two businesses. We have also consolidated smaller operations enabling JBT FoodTech and JBT AeroTech to operate shared facilities and look to expand the shared services model in Europe beginning in 2015.
We also are driving organization simplification to lay a growth foundation. We have undertaken restructuring actions across JBT to improve efficiency and right-size our business. We recorded restructuring charges totaling $14.5 million in 2014. We completed our corporate office and most of our U.S. restructuring in 2014. Our European restructuring is well underway. |
|
|
• |
Strengthen. We implemented leadership and management changes, including the appointment of Brian Deck as Executive Vice President and Chief Financial Officer, Dave Burdakin as Executive Vice President and President, JBT AeroTech, and the promotion of Jim Marvin to Executive Vice President and General Counsel. To strengthen the business, we introduced the JBT Excellence Model (or JEM). JEM includes value-based pricing, which has been rolled out across all major businesses. JEM also includes implementation of Lean initiatives or what we call “Relentless Continuous Improvement”. This is an integrated focus on safety, quality, delivery, and cost that establishes a sustainable competitive advantage. We have introduced RCI via extensive leadership training and have implemented at many JBT production facilities in 2014. |
|
|
• |
Grow. There are specific components to our growth strategy. We are investing in the profitable aftermarket business, building a dedicated sales and service network that will capitalize on our global installed base of equipment. We also are capitalizing on growth opportunities in emerging markets through locally-tailored products. We are establishing a robust, direct presence in Asia, which we believe is critical to winning business from local producers. In 2014, we opened a joint JBT FoodTech and JBT AeroTech manufacturing center. We plan to complete a full technology center adjacent to the manufacturing center – which will allow customers to conduct test production runs.
Beyond organic growth initiatives, we are pursuing strategic acquisitions. We completed three bolt-on acquisitions in 2014. All three support our strategy of acquiring strong companies that complement our protein processing and liquid foods portfolios. Looking ahead, we continue to establish a pipeline of mergers and acquisition (M&A) opportunities. Our successful acquisition activity is the result of building our corporate M&A capabilities and engaging the field operations in the process of identifying, executing, and integrating acquisitions. |
We continue to enhance a comprehensive approach to Corporate Social Responsibility (CSR), building on our culture and long tradition of concern for our employees’ health, safety, and well-being; partnering with our customers to improve their operations; and giving back to the communities where we live and work. Building upon that strong foundation, we cultivate CSR teams at each business unit which share energy efficiency best practices, measure resource utilization, and establish improvement targets across multiple resource streams including energy, water, and waste. Our equipment and technology continues to deliver quality performance while striving to minimize waste and maximize efficiency in order to create shared value for both our food processing and air transportation customers. A key CSR objective is to further align our business with our customers, in order to support their ambitious quality, financial, and CSR goals.
Our principal executive offices are located at 70 West Madison, Suite 4400, Chicago, Illinois 60602.
BUSINESS SEGMENTS
JBT FoodTech
JBT FoodTech supplies customized industrial solutions and services used in the food processing industry. We design, manufacture and service technologically sophisticated food processing systems for the preparation of meat, seafood and poultry products, ready-to-eat meals, shelf stable packaged foods, bakery products, juice and dairy products, and fruit and vegetable products.
We believe our success is derived from our continued innovation, applying our differentiated and proprietary technologies to meet our customers’ food processing needs. We continually strive to improve our existing solutions and develop new solutions by working closely with our food processing customers to meet their evolving needs.
Our historically strong position in the markets we serve has provided us with a large installed base of systems and equipment. Throughout our history, we have delivered over 40,000 pieces of food processing equipment which includes more than 8,000 industrial freezers, 2,200 industrial citrus juice extractors, 3,000 industrial sterilization systems and 8,500 coating systems. This installed base provides a stream of recurring revenue from aftermarket products, parts, services, and lease arrangements. Recurring revenue accounted for 49% of our FoodTech total revenue in 2014. Our installed base also provides us with strong, long-term customer relationships from which we derive information for new product development to meet the evolving needs of our food processing customers.
We have operations positioned around the world to serve our existing JBT FoodTech equipment base located in more than 100 countries. Our principal production facilities are located in the United States (California, Florida, New York, Ohio, and Pennsylvania), Brazil, Belgium, Italy, Sweden, the United Kingdom, South Africa and China. In addition to sales and services offices based in more than 25 countries, we also support our customers in their development of new food products and processes as well as the refinement and testing of their current applications through ten technical centers located in the United States (California, Florida, and Ohio), Mexico, Brazil, Belgium, Italy, Spain, and Sweden. Our global presence allows us to provide direct customized support to customers virtually anywhere they process foods.
Solutions, Products and Services
We offer a broad portfolio of systems, equipment and services to our customers which are often sold as part of a fully integrated processing line solution. Our systems are typically customized to meet the specific customer application needs. Thus, actual production capacity ranges vary and are dependent on the food and product packaging type being processed.
Protein Processing Equipment. Our broad array of protein processing systems includes the DSI™ waterjet portioners, slicers and attribute scanner/sorters; the Stein™ coating and seasoning applicators, THERMoFIN® fryers, GYRoCOMPACT® spiral ovens, JSO Jet Stream® ovens; and Double D™ Revoband™ linear ovens and cooking systems. Our fully integrated processing lines often span from the initial point of entry of raw products through final packaging. Although our solutions are primarily used in the processing of poultry (including nuggets, strips, and wings), we also provide systems that portion, coat or cook other food products ranging from breads and pizzas to meat patties, seafood, and ready-to-eat meals to pet food. We believe that our installed base of cooking systems processes more meat, seafood, and poultry products in North America than that of any other food processing equipment supplier.
In 2014, we acquired the businesses of two protein processing equipment providers, Formcook AB and Wolf-Tec, Inc. As a result, JBT’s protein processing product portfolio now also includes teflon coated Formcook Contact and Combi Cookers, and Wolf-Tec Polar Dissolver brine preparation, IMAX injection, Polar Massager marination, Polar Flex Carve maceration, TMAX tenderization, and TVI portion cutting systems.
With our first commercial food processing freezers developed in the 1960s, we believe that we remain the world’s leading supplier of freezing and chilling solutions to the food processing industry. We design, assemble, test, and install industry-leading technologies under the Frigoscandia® brand, which include the GYRoCOMPACT® self-stacking spiral, the FLoFREEZE® individual quick freezing (IQF) system, and the ADVANTEC™ linear/impingement freezing system, as well as flat product and contact freezers, chillers and proofers. We also offer a structure supported Northfield SuperTRAK® spiral freezer for high volume, large packaged products. Our freezers are designed to meet the most stringent demands for quality, economy, food safety and user-friendliness. Our industrial freezers can be found in plants that are processing food products ranging from meat, seafood, and poultry to bakery products and ready-to-eat meals, fruits, vegetables, and dairy products.
The following is an overview of our protein processing technology offerings, which accounted for 32% of our total revenue in 2014.
|
Product Offering |
|
Product Description |
|
Food Applications |
|
Capacity |
|
Polar Dissolver Brine Systems |
|
Intelligent systems that dissolve ingredients precisely to prepare brine |
|
Meat, Poultry, Seafood |
|
Up to 800 gallons/hour |
|
|
|
|
|
|
|
|
|
IMAX injection and marination systems |
Patented needle feed system for all bone-in and boneless injection and marination applications |
Meat, Poultry, Seafood |
|
Up to 30,000 gallons/hour | ||
|
Polar Flex Carve Macerator |
Patented automatically adjustable knife rollers that provide multiple surface treatment options |
Meat, Poultry |
Up to 40,000 lbs/hour | |||
|
Polar Massager |
Patented paddle action system that provides quick, uniform dispersion of ingredients throughout product |
Meat, Poultry |
Up to 22,500 lbs/batch | |||
|
TVI portioning system |
Integrates advanced product molding and measuring, slicing technologies to deliver exact weight portions |
Meat, Poultry |
Up to 3,000 lbs/hour | |||
|
DSI™ Portioning Systems |
|
Computer-positioned vertical high-pressure water-jets cut complex shapes |
|
Poultry, Meat, Seafood, Pizza |
|
Over 14,000 lbs/hour |
|
|
|
|
|
|
|
|
|
DSI™ Adaptive Thickness Systems |
|
Intelligent slicing for consistent product thickness |
|
Poultry, Meat, Seafood |
|
Over 4,000 lbs/hour |
|
|
|
|
|
|
|
|
|
DSI™ J-Scan |
|
Attribute scanning and sorting of various products |
|
Poultry, Meat, Seafood, Pizza, Bakery, Ready Meal |
|
Over 14,000 lbs/hour |
|
Product Offering |
|
Product Description |
|
Food Applications |
|
Capacity |
|
Stein™ Coating Applicators |
|
Application of batter, tempura or breading prior to cooking |
|
Poultry, Meat, Seafood, Vegetables |
|
Over 12,000 lbs/hour (over 210,000 of 0.9 oz nuggets/hour) |
|
|
|
|
| |||
|
THERMoFIN® Frying Systems |
|
Patented technology that heats oil quickly and precisely for even and cost effective frying |
|
Poultry, Meat, Seafood |
|
Over 14,000 lbs/hour (over 250,000 of 0.9 oz nuggets/hour) |
|
|
|
|
| |||
|
GYRoCOMPACT® Spiral Ovens |
|
Multi-zone spiral oven with programmable air control for consistent and uniform cooking |
|
Poultry, Meat, Seafood |
|
Over 18,000 lbs/hour (over 70,000 of 4 oz chicken breasts/hour) |
|
|
|
|
| |||
|
Stein™ JSO Jet Stream® Linear Ovens |
|
High intensity convection oven for fast cooking with optimal flavor sealing and browning |
|
Poultry, Meat, Seafood |
|
Over 9,000 lbs/hour (over 35,000 ¼ lb. burgers per hour) |
|
|
|
|
|
|
|
|
|
Stein™ PRoGRILL® Contact Cookers |
High Production contact cooking of boneless products |
Poultry, Meat, Seafood, Vegetables |
Over 18,000 lbs/hour | |||
|
Double D™ Revoband Linear OvenTVI portioning system |
|
Custom built, high impingement oven for roasting, steaming, and baking Integrates advanced product molding and measuring, slicing technologies to deliver exact weight portions |
|
Bakery, Meat, Seafood, Poultry, Vegetables, Meat, Poultry |
|
Over 2,000 lbs/hour Up to 3,000 lbs/hour |
Liquid Foods Processing Equipment. We are a global supplier of fully integrated industrial sterilization systems that enable production of shelf stable foods in a wide variety of flexible and rigid packages. These integrated solutions for the processing of shelf-stable food and liquid products include our continuous rotary sterilizers, Steam Water Spray static and SuperAgi™ batch retorts, XL-series fillers, SeamTec™ and X-series closers, material handling systems and LOG-TEC® thermal process controls. We are a recognized U.S. Department of Agriculture and Food and Drug Administration Food Process Authority and offer the largest selection of sterilization products in the industry. We also provide automated batch retorts which can process an array of flexible and rigid packages such as plastic pouches, cartons, glass and cans. Our solutions also include specialized material handling systems to automate the handling and tracking of processed and unprocessed containers. Additionally, we offer modeling software as well as thermal processing controls that help our customers optimize and track their cooking processes and introduce on-line corrections in the case of process deviations.
In 2014, we acquired the ICS Solutions business, now known as JBT Netherlands B.V., adding a line of continuous hydrostatic sterilizers to our product portfolio.
We also supply industrial citrus processing equipment. Our citrus processing solutions include citrus extractors, finishers, pulp systems, evaporators, and citrus ingredient recovery systems as well as aseptic systems (including sterilizers, fillers, and controls) integrated with bulk aseptic storage systems for not-from-concentrate orange juice. Our READYGo™ family of skid-mounted products includes solutions for aseptic sterilization and bulk filling, as well as ingredients and by-products recovery and clean-up systems. In addition to our high capacity industrial extractors, we also offer point of use Fresh’n Squeeze® produce juicers. These patented juicers are used around the world in hotels, restaurants, coffee shops, grocery stores, convenience stores, quick service restaurants, and juice bars.
We are among the leading suppliers of fruit, vegetable, and juice processing equipment and aseptic sterilization and bulk filling systems. Our fruit, vegetable, and juice processing lines are comprised of extraction, finishing, heating and mixing equipment, enzyme inactivators, evaporators, flash coolers, sterilizers, and aseptic fillers. Our equipment is primarily sold as an integrated processing line, but can also satisfy a specific need within a line. Our tomato processing lines are installed with processors throughout the world’s key tomato growing regions and produce a range of finished tomato products including tomato paste, concentrates, peeled tomato products, diced tomatoes, salsa, pizza sauce, ketchup, and pureed and crushed tomatoes. Our aseptic processing lines are used in the bulk processing of a wide range of temperate and tropical fruits into juices, particulates, purees, and concentrates. These fruit products are used as ingredients for dairy products (yogurts, smoothies, flavored milk, and ice cream), bakery products, and fruit-based beverages.
We provide technology solutions and products to extend the life, improve the appearance and preserve the taste of fresh fruits and vegetables. Once protected, fresh fruits and vegetables can be individually labeled by our fast and efficient produce labeling systems. We also provide an integrated equipment and aftermarket service program, including the patented Bin Scrubber System, the Single Pass Dryer and Smart Dryer System, and additional ancillary produce processing technologies.
The following is an overview of our liquid foods processing technology offerings, which accounted for 29% of our total revenue in 2014.
|
Product Offering |
|
Product Description |
|
Food Applications |
|
Capacity |
|
Extractors, Pulpers, Finishers |
|
Extract juice and/or pulp from fruit for large-scale processing and point-of-sale applications |
|
Citrus, Tomatoes, Berries, Temperate and Tropical Fruits |
|
Industrial extractor: over 900 gallons of juice per hour |
|
|
|
|
|
|
|
|
|
Hot & Cold Breaks, Evaporators |
|
Enzymatic inactivation, concentration, and aseptic cooling to preserve fruit product color and taste |
|
Citrus, Tomatoes, Berries, Temperate and Tropical Fruits |
|
Over 70 tons/hour |
|
Fresh Produce Technologies |
|
Preservation of fresh produce life, appearance, and taste
High speed application of Produce Identification labels |
|
Fruits, Vegetables |
|
Coating application rates variable to match line speed
Apply 900+ labels per minute |
|
Aseptic Sterilizers and Fillers |
|
Aseptic commercial sterilization, cooling, and bulk filling of fruit puree, concentrate, or paste into 3 gallon to 300 gallon containers |
|
Citrus, Tomatoes, Temperate and Tropical Fruits |
|
Aseptic sterilizer: over 60 tons/hour Aseptic filler: over 19 tons/hour |
|
Fillers |
|
Filling of rigid and pre-formed containers with food and beverage products |
|
Ready Meals, Soups, Sauces, Baby Food, Fruits, Vegetables, Seafood, Meat, Poultry, Milk, Ready to Drink Coffee and Tea, Pet Food |
|
Over 1,200 containers per minute |
|
|
|
|
|
|
|
|
|
Closers |
|
Closing and seaming of cans after filling |
|
Ready Meals, Soups, Sauces, Baby Food, Fruits, Vegetables, Seafood, Meat, Poultry, Milk, Ready to Drink Coffee and Tea, Pet Food, Infant Formula |
|
Up to 2,000 containers per minute |
|
|
|
|
|
|
|
|
|
Continuous Rotary Sterilizers |
|
Commercial sterilization of food in cans |
|
Ready Meals, Canned Milk, Soups, Sauces, Fruits, Vegetables, Seafood, Meat |
|
Up to 1,200 containers per minute |
|
Continuous Hydrostatic Sterilizers |
|
Commercial sterilization of food in cans |
|
Ready Meals, Canned Milk, Soups, Sauces, Fruits, Vegetables, Pet Food |
|
Up to 2,000 containers per minute |
|
Automated Batch Retorts |
|
Commercial sterilization of foods in flexible or rigid pre-formed packaging |
|
Ready Meals, Soups, Sauces, Baby Food, Fruits, Vegetables, Seafood, Meat, Poultry |
|
Over 1,500 containers per minute (600 microwave pasta bowls per minute) |
|
|
|
|
|
|
|
|
|
LOG-TEC ™ Control Systems and Modeling Software |
|
Automated control and documentation of sterilization process; modeling software to optimize cooking processes |
|
Ready Meals, Canned Milk, Soups, Sauces, Baby Food, Fruits, Vegetables, Seafood, Meat, Poultry, Pet Food |
|
Matches the sterilization system capacity |
Automated Systems. We provide fully integrated automatic guided vehicle systems for repetitive material movement requirements in the food & beverage, manufacturing, warehouse, automotive, hospital, and printing industries. We provide engineering services and simulations to evaluate the material handling requirements, automatic guided vehicle system hardware and software, and hardware and software integration for a complete, seamless solution. We have delivered more than 500 automatic guided vehicle systems including over 3,500 guided vehicles.
Aftermarket Products, Parts, and Services. We provide aftermarket products, parts, and services for all of our integrated food processing systems and equipment. We provide retrofits and refurbishments to accommodate changing operational requirements, and we supply our own brand of food grade lubricants and cleaners designed specifically for our equipment. We also provide continuous, proactive service to our customers including the fulfillment of preventative maintenance agreements, consulting services such as water treatment, corrosion monitoring control, food safety and process auditing, and the provision of on-site technical personnel. In addition to helping our customers reduce their operating costs and improve efficiencies, our customer service focus also helps us maintain strong commercial relationships and provides us with ongoing access to information about our customers’ requirements and strategies to foster continuing product development. Our aftermarket products, parts, and services coupled with our large installed base of food processing systems and equipment, provide us with a strong base for growing recurring revenue. Sales of aftermarket products, parts and services are consolidated within the total revenue of their associated JBT FoodTech businesses.
JBT AeroTech
JBT AeroTech supplies customized solutions and services used for applications in the air transportation industry, including airport authorities, airlines, airfreight, and ground handling companies, and the military. We believe our strong market positions result from our ability to customize our equipment and services utilizing differentiated technology to meet the specific needs of our customers. We continually strive to improve our existing technologies and develop new technologies by working closely with our well established customer base.
There is a significant installed base of our airport and airline equipment around the world. We have delivered the largest volume of cargo loaders (9,500+), passenger boarding bridges (7,900+), and aircraft deicers (4,700+). We have also sold more than 2,200+ mobile passenger steps, 2000+ cargo transporters, and 1,800+ tow tractors that are operating at airports around the world. This installed base provides a stream of recurring revenue from aftermarket parts, products, and services. Recurring revenue accounted for 36% of AeroTech total revenue in 2014. Our installed base also offers continuous access to customer feedback for improvements and new product development.
JBT AeroTech products have been delivered to more than 100 countries. To support this equipment, we have operations located throughout the world. Our principal production facilities are located in the United States (Florida and Utah), China, Mexico and Spain. To augment our sourcing and manufacturing capabilities, we have established dedicated sourcing resources in India and China as well as regional manufacturing in Asia. We also have sales and services offices located in nine countries and collaborative relationships with independent sales representatives, distributors, and service providers in over thirty additional countries.
Solutions, Products, and Services
We offer a broad portfolio of systems, equipment, and services to our airport authority, airline, air cargo, ground handling, and military customers.
Mobile Equipment. We supply air cargo loaders, aircraft deicers, and mobile power and environmental air conditioning systems to commercial air passenger and freight carriers and ground handlers.
Our Commander™ loaders service containerized narrow-body and wide-body jet aircraft and are available in a wide range of configurations. Our Tempest™ aircraft deicers offer a broad range of options that can be configured to meet customers’ specific and regional need to provide efficient aircraft deicing while on the tarmac. We manufacture and supply a full array of B-series conventional and Expeditor™ towbarless aircraft tow tractors for moving aircraft without consumption of jet fuel and self-propelled transporters for pallet and container handling.
Airlines and ground handling companies face increased pressure to reduce emissions and minimize fuel usage. We have a long history of delivering alternative fuel ground support equipment that provides a solution to these environmental and operational challenges. Our alternative fuel design approach is to provide modular ground support equipment, capable of being powered by a variety of power sources. Our electric powered product offering includes Commander cargo loaders, cargo transporters, conventional aircraft pushback tractors, and passenger boarding steps. We also offer electric retrofit kits for our existing delivered base of diesel powered Commander cargo loaders.
We manufacture a variety of sizes and configurations of auxiliary equipment including 400 Hertz ground power and preconditioned air units that supply aircraft requirements for electrical power and cooled air circulation for the environmental control system (air-conditioning) and main engine starting during ground operations. We also offer aircraft in-ground service pits to provide utility access on airport ramps, hangars and remote parking areas.
Within mobile equipment, we also have a portfolio of military equipment, including a wide range of ground power and mobile air conditioning units for the U.S. Air Force, the U.S. Navy, international military forces and airframe manufacturers.
The following is an overview of our mobile equipment technology offerings, which accounted for 18% of our total revenue in 2014.
|
Product Offering |
|
Product Description |
|
Aircraft Ranges |
|
Capacity |
|
CommanderTM Cargo Loaders |
|
Loading and unloading of containerized cargo onto main and lower decks of aircraft |
|
Wide variety of passenger and freighter aircraft up to Airbus A380 |
|
Up to 66,000 lbs. |
|
|
|
|
|
|
|
|
|
Commander™ Cargo Transporters |
|
Transport of containerized cargo to or from aircraft |
|
Aircraft handling full size pallets or containers |
|
Up to 15,400 lbs. at 15.5 mph |
|
|
|
|
|
|
|
|
|
Tempest™ Aircraft Deicers |
|
Deicing of aircraft on the ground including removal of snow, ice, and frost |
|
Wide variety of aircraft up to Airbus A380 |
|
Up to 2,200 gallons capacity of deicing fluid |
|
|
|
|
|
|
|
|
|
Expeditor™ Aircraft Tow Tractors |
|
Pushing back of aircraft from gate or aircraft towing between gate and hangar |
|
Regional to wide-body aircraft including Airbus A380 |
|
Draw bar pull of up to 72,000 lbs. |
|
Pit Aircraft Utility Systems |
|
In-ground vault systems for use on airport ramps, hangars, and remote parking areas to supply aircraft with utilities |
|
Commercial regional jets up to Airbus A380 and military jet fighters up to cargo transport aircraft |
|
Vault systems for utilities including preconditioned air (PCAir), 400Hz power, waste, blue and potable water |
|
Military Mobile Power |
|
Mobile and hangar-based power units used for aircraft servicing, testing, and starting |
|
Jet fighters up to cargo transport aircraft |
|
400 Hertz power, including 28 VDC and 270 VDC service |
|
|
|
|
|
|
|
|
|
Military Mobile Air Conditioning |
|
Mobile and hangar-based air conditioning and high pressure units used for on the ground cooling and starting |
|
Jet fighters up to cargo transport aircraft |
|
30 to 110 ton mobile air conditioning and high pressure units |
Fixed Equipment. We supply airport gate equipment. Our Jetway® passenger boarding bridges have set the standard for airlines and airport authorities to move passengers between the terminal building and the aircraft since 1959. Our passenger boarding bridges support a range of aircraft types, from regional jets up to the Airbus A380. Within fixed equipment, we also supply point-of-use and mobile 400 Hertz and pre-conditioned air units that enable our customers to reduce fuel consumption and emissions by minimizing requirements to use auxiliary power units or aircraft engines while parked at the gate. Fixed equipment accounted for 12% of our total revenue in 2014.
Airport Services. We are an industry provider for the design and management of technical support programs supplied exclusively to airlines and airports at over 27 major locations throughout the United States. Our specialty services extend to expertise in the development of sustainable and value orientated operation, maintenance, and repair of sophisticated in-line baggage handling systems, gate equipment, terminals, facilities, and ground support equipment. We also offer technology for enterprise asset management and real-time operations monitoring with our patented iOPS™ suite that links alert management notification with mobile capability for automated work order generation and immediate dispatch of service technicians that delivers improved productivity, greater equipment availability, and lower cost.
Aftermarket Products, Parts, and Services. We provide aftermarket products, parts, and services for our installed base of JBT AeroTech equipment. We also provide retrofits to accommodate changing operational requirements and continuous, proactive service, including, in some cases, on-site technical personnel. These systems and other services represent an integrated approach to addressing critical problems faced by our customers and ensure that we remain well positioned to respond to their new requirements and strategic initiatives through our strong customer relations. Sales of aftermarket products, parts and services are consolidated within the total revenue of their associated JBT AeroTech businesses.
In support of our focus and strategy of meeting our customers’ needs, we have developed a global parts service network to enable us to market with confidence our ability to “provide the right part in the right place.” Our highly experienced global parts representatives help reduce equipment downtime by providing fast, accurate responses to technical questions. We also provide worldwide operations and maintenance training programs to provide maintenance technicians with the tools necessary to deliver the highest possible level of systems reliability.
OTHER BUSINESS INFORMATION RELEVANT TO ALL OF OUR BUSINESS SEGMENTS
Order Backlog
For information regarding order backlog, refer to the section entitled “Inbound Orders and Order Backlog” in Item 7 of this Annual Report on Form 10-K.
Sources and Availability of Raw Materials
All of our business segments purchase carbon steel, stainless steel, aluminum, and steel castings and forgings both domestically and internationally. We do not use single source suppliers for the majority of our raw material purchases and believe the available supplies of raw materials are adequate to meet our needs.
Research and Development
The objectives of our research and development programs are to create new products and business opportunities in relevant fields, and to improve existing products.
For additional financial information about our research and development activities, refer to Note 16 to our consolidated financial statements included in Item 8 of this Annual Report on Form 10-K.
Sales and Marketing
We sell and market our products and services predominantly through a direct sales force, supplemented with independent distributors and sales representatives. Our experienced international sales force is comprised of individuals with strong technical expertise in our products and services and the industries in which they are sold.
We support our sales force with marketing and training programs that are designed to increase awareness of our product offerings and highlight our differentiation while providing a set of sales tools to aid in the sales of our technology solutions. We actively employ a broad range of marketing programs to inform and educate customers, the media, industry analysts, and academia through targeted newsletters, our web site, seminars, trade shows, user groups, and conferences.
Patents, Trademarks and Other Intellectual Property
We own a number of United States and foreign patents, trademarks, and licenses that are cumulatively important to our business. We own approximately 513 United States and foreign patents and have approximately 212 patent applications pending in the United States and abroad. Further, we license certain intellectual property rights to or from third parties. We also own numerous United States and foreign trademarks and trade names and have approximately 366 registrations and pending applications in the United States and abroad. Developing and maintaining a strong intellectual property portfolio is an important component of our strategy to extend our technology leadership. However, we do not believe that the loss of any one or group of related patents, trademarks, or licenses would have a material adverse effect on our overall business.
Competition
We conduct business worldwide and compete with a variety of local and regional companies, which typically are focused on a specific application, technology or geographical area, and large multinational or regional companies.
We compete by leveraging our industry expertise to provide differentiated and proprietary technology, integrated systems, high product quality and reliability, and quality aftermarket service. We strive to provide our customers with equipment that achieves their lowest total cost of ownership; in the food processing industry, we also distinguish ourselves by providing increased yields with improved final product quality.
JBT FoodTech’s major competitors include Advanced Equipment Inc.; Alit SRL; Allpax Products, Inc.; Atlas Pacific Engineering Company, Inc.; Barry-Wehmiller Companies, Inc.; Brown International Corp.; CFT S.p.A.; Cooling and Applied Technology, Inc.; Ferrum; Food Processing Equipment Company; FPS Process Foods Solutions; GEA Group Aktiengesellschaft; Heat & Control, Inc.; Heinen Freezing; Hydrolock; I.J. White Systems; IQF Frost AB; Krones; Marel Food Systems; Marel hf.; METALQUIMIA, S.A.; MYCOM; Middleby Corporation; Nantong Freezing Equipment Company, Ltd.; Provisur Technologies, Inc.; Scanico A/S; Starfrost; Steriflow SAS.; Tetra Laval; and Tecnopool S.p.A.
JBT AeroTech’s major competitors include ABM Industries Inc.; Cavotec SA; Elite Line Services Inc.; ERMC; FCX Systems Inc.; Global Ground Support LLC; Goldhofer AG; Illinois Tool Works Inc.; Johnson Controls Inc.; Shenzhen CIMC-TianDa Airport Support Ltd.; ThyssenKrupp AG; TLD Group SAS; Trepel Airport Equipment GmbH; Textron Inc.-Tug Technologies; Vanderlande Industries B.V.; Vestergaard Company A/S; and Weihai Guangtai Airport Equipment Co., LTD.
Employees
We have approximately 3,500 employees with approximately 2,200 located in the United States. Approximately 10% of our employees in the United States are represented by one collective bargaining agreement that covers those employees through August of 2019.
Outside the United States, we enter into employment contracts and agreements in those countries in which such relationships are mandatory or customary. The provisions of these agreements correspond in each case with the required or customary terms in the subject jurisdiction. Approximately 60% of our international employees are covered under national employee unions.
We maintain good employee relations and have successfully concluded all of our recent negotiations without a work stoppage. However, we cannot predict the outcome of future contract negotiations.
Customers
No single customer accounted for more than 10% of our total revenue in any of the last three fiscal years.
Government Contracts
We supply equipment and logistics support to the U.S. Department of Defense and international forces. The amount of equipment and parts supplied to these programs is dependent upon annual government appropriations and levels of military spending. In addition, United States defense contracts are unilaterally terminable at the option of the United States government with compensation for work completed and costs incurred. Contracts with the United States government are subject to special laws and regulations, the noncompliance with which may result in various sanctions that could materially affect our ongoing government business.
Governmental Regulation and Environmental Matters
Our operations are subject to various federal, state, local, and foreign laws and regulations governing the prevention of pollution and the protection of environmental quality. If we fail to comply with these environmental laws and regulations, administrative, civil, and criminal penalties may be imposed, and we may become subject to regulatory enforcement actions in the form of injunctions and cease and desist orders. We may also be subject to civil claims arising out of an accident or other event causing environmental pollution. These laws and regulations may expose us to liability for the conduct of or conditions caused by others or for our own acts even though these actions were in compliance with all applicable laws at the time they were performed.
Under the Comprehensive Environmental Response, Compensation and Liability Act, referred to as CERCLA, and related state laws and regulations, joint and several liability can be imposed without regard to fault or the legality of the original conduct on certain classes of persons that contributed to the release of a hazardous substance into the environment. These persons include the owner and operator of a contaminated site where a hazardous substance release occurred and any company that transported, disposed of, or arranged for the transport or disposal of hazardous substances that have been released into the environment, and including hazardous substances generated by any closed operations or facilities. In addition, neighboring landowners or other third parties may file claims for personal injury, property damage, and recovery of response cost. We may also be subject to the corrective action provisions of the Resource, Conservation and Recovery Act, or RCRA, and analogous state laws that require owners and operators of facilities that treat, store, or dispose of hazardous waste to clean up releases of hazardous waste constituents into the environment associated with their operations.
Some of our facilities and operations are also governed by laws and regulations relating to worker health and workplace safety, including the Federal Occupational Safety and Health Act, or OSHA. We believe that appropriate precautions are taken to protect our employees and others from harmful exposure to potentially hazardous materials handled and managed at our facilities, and that we operate in substantial compliance with all OSHA or similar regulations.
We are also subject to laws and regulations related to conflict minerals, export compliance, local hiring and anti-corruption, and we have adopted policies, procedures and employee training programs that are designed to facilitate compliance with those laws and regulations.
Financial Information about Geographic Areas
A significant portion of our consolidated revenue is generated in markets outside of the United States. For financial information about geographic areas see Note 16 of our financial statements in Item 8 of this Annual Report on Form 10-K.
Available Information
All periodic and current reports, registration statements, and other filings that we are required to make with the Securities and Exchange Commission (SEC), including annual reports on Form 10-K, quarterly reports on Form 10-Q, current reports on Form 8-K, and amendments to those reports filed or furnished pursuant to Section 13(a) or 15(d) of the Securities Exchange Act of 1933, proxy statements and other information are available free of charge through our website as soon as reasonably practicable after we file them with, or furnish them to, the SEC. You may access and read our SEC filings free of charge through our website at www.jbtcorporation.com, under “Investor Relations – Corporate Information – SEC Filings,” or the SEC’s website at www.sec.gov. These reports are also available to read and copy at the SEC’s Public Reference Room by contacting the SEC at 1-800-SEC-0330.
The information contained on or connected to our website, www.jbtcorporation.com, is not incorporated by reference into this Annual Report on Form 10-K or any other report we file with the SEC.
EXECUTIVE OFFICERS OF THE REGISTRANT
The executive officers of JBT Corporation, together with the offices currently held by them, their business experience and their ages as of February 20, 2015, are as follows:
|
Name |
|
Age |
|
Office |
|
Thomas W. Giacomini |
49 |
Chairman, President and Chief Executive Officer | ||
|
Brian A. Deck |
46 |
Executive Vice President and Chief Financial Officer | ||
|
Steven R. Smith |
|
54 |
|
Executive Vice President and Division President-JBT FoodTech |
|
David C. Burdakin |
59 |
Executive Vice President and Division President-JBT AeroTech | ||
|
James L. Marvin |
|
54 |
|
Executive Vice President, General Counsel and Secretary |
|
Mark K. Montague |
|
61 |
|
Executive Vice President, Human Resources |
|
Megan J. Rattigan |
|
46 |
|
Vice President and Controller |
THOMAS W. GIACOMINI became the President and Chief Executive Officer of JBT Corporation as well as a member of the JBT Board of Directors in September 2013. In May 2014, Mr. Giacomini was elected Chairman of the Board. Prior to joining JBT, he served as Vice President (since February 2008) of Dover Corporation, a diversified global manufacturer, and President and Chief Executive Officer (since November 2011) of Dover Engineered Systems. Prior to serving in these roles, Mr. Giacomini served as President (from April 2009 to November 2011) and Chief Executive Officer (from July 2009 to November 2011) of Dover Industrial Products and President (from October 2007 to July 2009) of Dover's Material Handling Platform. Mr. Giacomini joined Dover in 2003 following its acquisition of Warn Industries, an industrial manufacturer specializing in vehicle performance enhancing equipment. During his 12 year tenure at Warn Industries he held a variety of leadership roles including President and Chief Operating Officer. Prior to joining Warn Industries, Mr. Giacomini held various positions at TRW, Inc.
BRIAN A. DECK became the Vice President and Chief Financial Officer of JBT Corporation in February 2014. In May 2014, Mr. Deck’s title changed to Executive Vice President and Chief Financial Officer, and he was appointed Treasurer. In December 2014, Mr. Deck appointed a Treasurer and resigned from that position. Prior to joining JBT, he served as Chief Financial Officer (since May 2011) of National Material L.P., a private diversified industrial holding company. Mr. Deck served as Vice President of Finance and Treasury (from November 2007 to May 2011) and as Director, Corporate Financial Planning and Analysis (from August 2005 to November 2007) of Ryerson Inc., a metals distributor and processor. Prior to his service with Ryerson, Mr. Deck had increasing responsibilities with General Electric Capital, Bank One (now JPMorgan Chase & Co.), and Cole Taylor Bank.
STEVEN R. SMITH became the Vice President and Division Manager-JBT FoodTech in December 2013. In May 2014, Mr. Smith’s title changed to Executive Vice President and Division President- JBT FoodTech. Previously Mr. Smith served as our Vice President and Division Manager-Food Processing Systems (since October 2011). Mr. Smith joined FMC Corporation in 1989 as a Business Planner with FMC's Petroleum Equipment Group in Houston, Texas. Since then, he has served in a variety of sales, marketing, and line management roles within FMC Corporation and FMC Technologies, Inc., JBT's previous parent companies, as well as with JBT FoodTech, including most recently serving as the General Manager for the America's Operations of FoodTech's Food Solutions and Services Division from 2003 to 2011.
DAVID C. BURDAKIN became the Vice President and Division Manager-JBT AeroTech in January 2014. In May 2014, Mr. Burdakin’s title changed to Executive Vice President and Division President- JBT AeroTech. Prior to joining JBT, he worked as an independent consultant and as Non-Executive Chairman of Mayline Corporation, a private equity owned industrial company (2012 to 2013). Prior to Mayline, he served as President and Chief Executive Officer (2007 to 2012) of Paladin Brands, a leading independent manufacturer of attachment tools for construction equipment including mobile aviation support equipment. Prior to that, Mr. Burdakin progressed through various leadership roles at HNI Corporation (1993 to 2007), including seven years as President of The HON Company, HNI's largest operating company. Prior to joining HNI, he held various positions at Illinois Tool Works Inc. and Bendix Industrial Group. Mr. Burdakin continues to serve as a Director of Mayline Corporation.
JAMES L. MARVIN became our Executive Vice President and General Counsel in May 2014, and has served as Secretary since July 2008. From July 2008 until May 2014, Mr. Marvin served as Deputy General Counsel and Secretary, acting as Division Counsel for JBT AeroTech and managing corporate legal matters. Mr. Marvin joined FMC Technologies, Inc. in April 2003, serving as Assistant General Counsel and Assistant Secretary, acting as Division Counsel for FMC Technologies’ Airport Systems Division and managing corporate legal matters. Before joining FMC Technologies in 2003, Mr. Marvin served in the roles of Chief Corporate Counsel and Division Counsel for Corporate Finance at Heller Financial, Inc., a publicly-traded middle-market financial services business. Mr. Marvin was previously a partner with the Chicago-based law firm Katten Muchin Zavis, with a practice focused in commercial financial transactions. Mr. Marvin began his professional career as a corporate securities attorney with O’Connor Cavanagh Anderson Westover Killingsworth & Beshears in Phoenix, Arizona.
MARK K. MONTAGUE has served as our Vice President of Human Resources since August 2008. In May 2014, Mr. Montague’s title changed to Executive Vice President, Human Resources. Prior to joining the Company, Mr. Montague worked for Molex, Inc., where he served as Senior Vice President, Corporate Human Resources since 2006. From 1999 to 2006, Mr. Montague served as Vice President, Human Resources, Americas Region. Prior to Molex, Mr. Montague worked for Whirlpool Corporation, serving as its Vice President, Human Resources, North America Appliance Group from 1997 to 1998, its Group Director, Human Resources and Quality, Corporate Technology Group from 1996 to 1997, and as its Group Director, Human Resources, Manufacturing and Technology in 1996. From 1992 through 1996, Mr. Montague worked for the consulting group, Competitive Human Resources Strategies. Mr. Montague worked for Whirlpool Corporation from 1981 through 1992, in a variety of Human Resources Group Director and Vice President positions, and as a Labor Relations Attorney from 1981 to 1984. Mr. Montague began his professional career as an attorney with Shughart, Thomson & Kilroy.
MEGAN J. RATTIGAN became a Vice President in August 2014 and has served as our Controller since December 2013. Previously, Ms. Rattigan served as our Chief Accounting Officer (since November 2008) and Director of Financial Control (since July 2008). Ms. Rattigan was FMC Technologies’ Manager of Financial Reporting and Accounting Research from April 2005 until July 2008. Prior to that, Ms. Rattigan served as a consultant to FMC Technologies from January 2002 until April 2005. From July 1998 until December 2001, Ms. Rattigan was Director of Finance for Chart House Enterprises, Inc. Ms. Rattigan is a certified public accountant and began her professional career in the Assurance practice of Ernst & Young LLP in 1992.
ITEM 1A. RISK FACTORS
You should carefully consider the risks described below, together with all of the other information included in this Annual Report on Form 10-K, in evaluating our company and our common stock. If any of the risks described below actually occurs, our business, financial condition, results of operations, cash flows and stock price could be materially adversely affected.
Our financial results are subject to fluctuations caused by many factors that could result in our failing to achieve anticipated financial results.
Our quarterly and annual financial results have varied in the past and are likely to continue to vary in the future due to a number of factors, many of which are beyond our control. In particular, the contractual terms and the number and size of orders in the capital goods industries in which we compete vary significantly over time. The timing of our sales cycle from receipt of orders to shipment of the products or provision of services can significantly impact our sales and income in any given fiscal period. These and any one or more of the factors listed below, among other things, could cause us not to achieve our revenue or profitability expectations in any given period and the resulting failure to meet such expectations could cause a drop in our stock price:
|
|
• |
volatility in demand for our products and services, including volatility in growth rates in the food processing and air transportation industries; |
|
|
• |
downturns in our customers’ businesses resulting from deteriorating domestic and international economies where our customers conduct substantial business; |
|
|
• |
increases in commodity prices resulting in increased manufacturing costs, such as petroleum-based products, metals or other raw materials we use in significant quantities; |
| • | supply chain interruptions; |
|
|
• |
changes in pricing policies resulting from competitive pressures, including aggressive price discounting by our competitors and other market factors; |
|
|
• |
our ability to develop and introduce on a timely basis new or enhanced versions of our products and services; |
|
|
• |
unexpected needs for capital expenditures or other unanticipated expenses; |
|
|
• |
changes in the mix of revenue attributable to domestic and international sales; |
|
|
• |
changes in the mix of products and services that we sell; |
| • | changes in foreign currency rates; |
|
|
• |
seasonal fluctuations in buying patterns; and |
|
|
• |
future acquisitions and divestitures of technologies, products, and businesses. |
Variability in the length of our sales cycles makes accurate estimation of our revenue in any single period difficult and can result in significant fluctuation in quarterly operating results.
The length of our sales cycle varies depending on a number of factors over which we may have little or no control, including the size and complexity of a potential transaction, the level of competition that we encounter during our selling process, and our current and potential customers’ internal budgeting and approval process. Many of our sales are subject to an extended sales cycle. As a result, we may expend significant effort and resources over a significant period of time in an attempt to obtain an order, but ultimately not obtain the order, or obtain an order that is smaller than we anticipated. Revenue generated by any one of our customers may vary from quarter to quarter, and a customer who places a large order in one quarter may generate significantly lower revenue in subsequent quarters. Due to the length and uncertainty of our sales cycle, and the variability of orders from period to period, we believe that quarter-to-quarter comparisons of our revenue and operating results may not be an accurate indicator of our short term or future performance.
Deterioration of economic conditions could adversely impact our business.
Our business may be adversely affected by changes in current or future national or global economic conditions, including lower growth rates or recession, high unemployment, rising interest rates, limited availability of capital, decreases in consumer spending rates, the availability and cost of energy, and the effect of government deficit reduction, sequestration, and other austerity measures impacting the markets we serve. Any such changes could adversely affect the demand for our products or the cost and availability of our required raw materials, which can have a material adverse effect on our financial results. Adverse national and global economic conditions could, among other things:
|
● |
make it more difficult or costly for us to obtain necessary financing for our operations, our investments, or to refinance our debt; |
|
● |
cause our lenders or other financial instrument counterparties to be unable to honor their commitments or otherwise default under our financing arrangements; |
|
● |
impair the financial condition of some of our customers, thereby hindering our customers’ ability to obtain financing to purchase our products and/or increasing customer bad debts; |
|
● |
cause customers to forgo or postpone new purchases in favor of repairing existing equipment and machinery, and delay or reduce preventative maintenance, thereby reducing our revenue and/or profits; |
|
● |
negatively impact our customers’ ability to raise pricing to counteract increased fuel, labor, and other costs, making it less likely that they will expend the same capital and other resources on our equipment as they have in the past; |
|
● |
impair the financial condition of some of our suppliers thereby potentially increasing both the likelihood of our having to renegotiate supply terms on terms that may not be as favorable to us and the risk of non-performance by suppliers; |
|
● |
negatively impact global demand for air transportation services as well as protein food products and processed food products, which could result in a reduction of sales, operating income, and cash flows in our JBT AeroTech and JBT FoodTech segments; |
|
● |
negatively affect the rates of expansion, consolidation, renovation, and equipment replacement within the air transportation industry and within the food processing industry, which may adversely affect the results of operations of our JBT AeroTech and JBT FoodTech segments; and |
|
● |
impair the financial viability of our insurers. |
Disruptions in the political, regulatory, economic and social conditions of the foreign countries in which we conduct business could negatively affect our business, financial condition, and results of operations.
We operate manufacturing facilities in nine countries other than the United States, the largest of which are located in Belgium, China, Sweden, Brazil, Italy, Spain and Scotland. Our international sales accounted for approximately 48% of our 2014 revenue. Multiple factors relating to our international operations and to those particular countries in which we operate or seek to expand our operations could have an adverse effect on our financial condition or results of operations. These factors include, among others:
|
● |
economic downturns, inflationary and recessionary markets, including in capital and equity markets; |
|
● |
civil unrest, political instability, terrorist attacks, and wars; |
|
● |
nationalization, expropriation, or seizure of assets; |
|
● |
potentially burdensome taxation in other jurisdictions; |
|
● |
changes in the mix of our international business operations and revenue relative to our domestic operations, resulting in increasing tax liabilities resulting from repatriation of income generated outside of the United States; |
|
● |
inability to repatriate income or capital; |
|
● |
foreign ownership restrictions; |
|
● |
export regulations that could erode profit margins or restrict exports, including import or export licensing regulations; |
|
● |
trade restrictions, trade protection measures, or price controls; |
|
● |
restrictions on operations, trade practices, trade partners, and investment decisions resulting from domestic and foreign laws and regulations; |
|
● |
compliance with the U.S. Foreign Corrupt Practices Act and other similar laws; |
|
● |
uncertainties arising from foreign local business practices and cultural considerations; |
|
● |
burden and cost of complying with foreign laws, treaties, and technical standards and changes in those regulations; |
|
● |
transportation delays and interruptions; and |
|
● |
reductions in the availability of qualified personnel. |
Fluctuations in currency exchange rates could negatively affect our business, financial condition, and results of operations.
A significant portion of our revenue and expenses are realized in foreign currencies. As a result, changes in exchange rates will result in increases or decreases in our costs and earnings and may adversely affect our consolidated financial statements, which are stated in U.S. dollars. Although we may seek to minimize currency exchange risk by engaging in hedging transactions where we deem appropriate, we cannot be assured that our efforts will be successful. Currency fluctuations may also result in our systems and services becoming more expensive and less competitive than those of other suppliers in the foreign countries in which we sell our systems and services.
Our restructuring initiatives may not achieve the expected cost reductions or other anticipated benefits.
We regularly evaluate our existing operations, service capacity, and business efficiencies to determine if a realignment or restructuring could improve our results of operations or achieve some other business goal. Our realignment and restructuring initiatives are designed to result in more efficient and increasingly profitable operations. Our ability to achieve the anticipated cost savings and other benefits from these initiatives within the expected time frame is subject to many estimates and assumptions. These estimates and assumptions are subject to significant economic, competitive, and other uncertainties, some of which are beyond our control. We incurred restructuring charges in 2014 as a result of restructuring activities, and may incur such charges in the future. Failure to achieve the expected cost reductions related to these restructuring initiatives could have a material adverse effect on our business and results of operations.
Our inability to obtain raw materials, component parts, and/or finished goods in a timely and cost-effective manner from suppliers would adversely affect our ability to manufacture and market our products.
We purchase raw materials and component parts from suppliers for use in manufacturing our products. We also purchase certain finished goods from suppliers. Changes in our relationships with suppliers or increases in our costs for raw materials, component parts, or finished goods we purchase could result in manufacturing interruptions, delays, inefficiencies, or our inability to market products if we cannot timely and efficiently manufacture them. In addition, our gross margins could decrease if prices of purchased raw materials, component parts, or finished goods increase and we are unable to pass on such price increases to customers.
Regulations related to conflict minerals could adversely impact our business.
The Dodd-Frank Wall Street Reform and Consumer Protection Act contains provisions to improve transparency and accountability concerning the supply of certain minerals, known as “conflict minerals”, originating from the Democratic Republic of Congo (DRC) and adjoining countries. To implement this legislation, the SEC adopted annual disclosure and reporting requirements for those companies that use conflict minerals mined from the DRC and adjoining countries in their products. We will continue to incur costs associated with complying with these annual disclosure requirements, including those incurred to conduct diligence to determine the sources of conflict minerals used in our products and other potential changes to products, processes, or sources of supply as a consequence of such verification activities. The implementation of these rules could adversely affect the sourcing, supply and pricing of materials used in our products. As there may be only a limited number of suppliers offering “conflict free” conflict minerals of certain types, we cannot be certain that we will continue to be able to obtain necessary conflict minerals from such suppliers in sufficient quantities or at competitive prices. Also, we may face reputational challenges if we determine that certain of our products contain minerals not determined to be conflict free or if we are unable to sufficiently verify the origins for all conflict minerals used in our products through the procedures we may implement.
An increase in energy or raw material prices may reduce the profitability of our customers, which ultimately could negatively affect our business, financial condition, results of operations, and cash flows.
Energy prices are volatile and have been historically high over the last several years. High energy prices have a negative trickledown effect on our customers’ business operations by reducing their profitability because of increased operating costs. Our customers require large amounts of energy to run their businesses, particularly in the air transportation industry. Higher energy prices can reduce passenger and cargo air carrier profitability as a result of increased jet and ground support equipment fuel prices. Higher energy prices also increase food processors’ operating costs through increased energy and utility costs to run their plants, higher priced chemical and petroleum based raw materials used in food processing, and higher fuel costs to run their logistics and service fleet vehicles.
Food processors are also affected by the cost and availability of raw materials such as feed grains, livestock, produce, and dairy products. Increases in the cost of and limitations in the availability of such raw materials can negatively affect the profitability of food processors’ operations.
Any reduction in our customers’ profitability due to higher energy or raw material costs or otherwise may reduce their future expenditures in the food processing equipment or airport equipment that we provide. This reduction may have a material adverse effect on our business, financial condition, results of operations, and cash flows.
Changes in food consumption patterns due to dietary trends or economic conditions may adversely affect our business, financial condition, results of operations, and cash flows.
Dietary trends can create demand for protein food products but negatively impact demand for high-carbohydrate foods, or create demand for easy to prepare, transportable meals but negatively impact traditional canned food products. Because different food types and food packaging can quickly go in and out of style as a function of dietary, health, or convenience trends, food processors can be challenged in accurately forecasting their needed manufacturing capacity and the related investment in equipment and services. During periods of economic uncertainty, consumer demand for protein products or processed food products may be negatively impacted by increases in food prices. A demand shift away from protein products or processed foods could have a material adverse effect on our business, financial condition, results of operations, and cash flows.
An outbreak of animal borne diseases (H5N1, BSE, or other virus strains affecting poultry or livestock), citrus tree diseases, or food borne illnesses or other food safety or quality concerns may negatively affect our business, financial condition, results of operations, and cash flows.
An outbreak or pandemic stemming from H5N1 (avian flu) or BSE (mad cow disease) or any other animal related disease strains could reduce the availability of poultry or beef that is processed for the restaurant, food service, wholesale or retail consumer. Any limitation on the availability of such raw materials could discourage food producers from making additional capital investments in processing equipment, aftermarket products, parts, and services that our JBT FoodTech business provides. Such a decrease in demand for our products could have a material adverse effect on our business, financial condition, results of operations, and cash flows.
The success of our business that serves the citrus food processing industry is directly related to the viability and health of citrus crops. The citrus industries in Florida, Brazil, and other countries are facing increased pressure on their harvest productivity and citrus bearing acreage due to citrus canker and greening diseases. These citrus tree diseases are often incurable once a tree has been infested and the end result can be the destruction of the tree. Reduced amounts of available fruit for the processed or fresh food markets could materially adversely affect our business, financial condition, results of operations, and cash flows.
In the event an E. coli or other food borne illness causes a recall of meat or produce, the companies supplying those fresh, further processed or canned forms of those products could be severely adversely affected. Any negative impact on the financial viability of our fresh or processed food provider customers could adversely affect our immediate and recurring revenue base.
Freezes, hurricanes, droughts, or other natural disasters may negatively affect our business, financial condition, results of operations, and cash flows.
In the event a natural disaster negatively affects growers’ or farm production, the food processing industry may not have the fresh food raw materials necessary to meet consumer demand. Crops of entire groves or fields can be severely damaged by a drought, freeze, or hurricane. An extended drought or freeze or a high category hurricane could permanently damage or destroy a tree crop area. If orchards have to be replanted, trees may not produce viable product for several years. Since our recurring revenue is dependent on growers’ and farmers’ ability to provide high quality crops to certain of our customers, our business, financial condition, results of operations, and cash flows could be materially adversely impacted in the event of a freeze, hurricane, drought, or other natural disaster.
Our failure to comply with the laws and regulations governing our U.S. government contracts or the loss of production funding of any of our U.S. government contracts could harm our business.
The U.S. government is the largest contractor in the United States and represented approximately 4% of our 2014 revenue. Our JBT AeroTech business contracts with the U.S. government. As a result, we are subject to various laws and regulations that apply to companies doing business with the U.S. government.
The laws governing U.S. government contracts differ in several respects from the laws governing private company contracts. Government contracts are highly regulated to curb misappropriation of funds and to ensure uniform policies and practices across various governmental agencies. Funding for such contracts is tied to National Defense Budgets and Procurement Programs that are annually negotiated and approved or disapproved by the U.S. Department of Defense, the Executive Branch, and the Congress. For example, if there were any shifts in spending priorities or if funding for the military cargo loader program were reduced or cancelled as a result of the sequestration, policy changes, or for other reasons, the resulting loss of revenue could have a material adverse impact on our JBT AeroTech business. Many U.S. government contracts contain pricing terms and conditions that are not applicable to private contracts. In particular, U.S. defense contracts are unilaterally terminable at the option of the U.S. government with compensation only for work completed and costs incurred to date. In addition, any deliverable delays under such contracts as a result of our non-performance could also have a negative impact on these contracts.
Non-compliance with the laws and regulations governing U.S. government contracts may result in significant sanctions such as debarment (restrictions from future business with the government). If we were found not to be in compliance now or in the future with any such laws or regulations, our results of operations could be adversely impacted.
Terrorist attacks and threats, escalation of military activity in response to such attacks, or acts of war may negatively affect our business, financial condition, results of operations, and cash flows.
Any future terrorist attacks against U.S. targets, rumors or threats of war, actual conflicts involving the United States or its allies, or military or trade disruptions affecting our customers or the economy as a whole may materially adversely affect our operations or those of our customers. As a result, there could be delays or losses in transportation and deliveries to our customers, decreased sales of our products, and delays in payments by our customers. Strategic targets such as those relating to transportation and food processing may be at greater risk of future terrorist attacks than other targets in the United States. It is possible that any of these occurrences, or a combination of them, could have a material adverse effect on our business, financial condition, results of operations, and cash flows.
The cumulative loss of several significant contracts may negatively affect our business, financial condition, results of operations, and cash flows.
We often enter into large, project-oriented contracts, or long-term equipment leases and service agreements. These agreements may be terminated or breached, or our customers may fail to renew these agreements. If we were to lose several significant agreements and if we were to fail to develop alternative business opportunities, we could experience a material adverse effect on our business, financial condition, results of operations, and cash flows.
We may lose money or not achieve our expected profitability on fixed-price contracts.
As is customary for several of the business areas in which we operate, we may provide products and services under fixed-price contracts. Under such contracts, we are typically responsible for cost overruns. Our actual costs and any gross profit realized on these fixed-price contracts may vary from our estimates on which the pricing for such contracts was based. There are inherent risks and uncertainties in the estimation process, including those arising from unforeseen technical and logistical challenges or longer than expected lead times for sourcing raw materials and assemblies. A fixed-price contract may significantly limit or prohibit our ability to mitigate the impact of unanticipated increases in raw material prices (including the price of steel and other significant raw materials) by passing on such price increases. Depending on the volume of our work performed under fixed-price contracts at any one time, differences in actual versus estimated performance could have a material adverse impact on our business, financial condition, results of operations, and cash flows.
Customer sourcing initiatives may adversely affect our new equipment and aftermarket businesses.
Many multi-national companies, including our customers and prospective customers, have undertaken supply chain integration to provide a sustainable competitive advantage against their competitors. Under continued price pressure from consumers, wholesalers and retailers, our manufacturer customers are focused on controlling and reducing cost, enhancing their sourcing processes, and improving their profitability.
A key value proposition of our equipment and services is low total cost of ownership. If our customers implement sourcing initiatives that focus solely on immediate cost savings and not on total cost of ownership, our new equipment and aftermarket sales could be adversely affected.
To remain competitive, we need to rapidly and successfully develop and introduce complex new solutions in a global, competitive, demanding, and changing environment.
If we lose our significant technology advantage in our products and services, our market share and growth could be materially adversely affected. In addition, if we are unable to deliver products, features, and functionality as projected, we may be unable to meet our commitments to customers, which could have a material adverse effect on our reputation and business. Significant investments in research and development efforts that do not lead to successful products, features, and functionality could also materially adversely affect our business, financial condition, and results of operations.
Our business, financial condition, results of operations, and cash flows could be materially adversely affected by competing technology. Some of our competitors are large multinational companies that may have greater financial resources than us, and they may be able to devote greater resources to research and development of new systems, services, and technologies than we are able to do. Moreover, some of our competitors operate in narrow business areas, allowing them to concentrate their research and development efforts more directly on products and services for those areas than we may be able to.
High capacity products or products with new technology may be more likely to experience reliability, quality, or operability problems.
Even with rigorous testing prior to release and investment on product quality processes, problems may be found in newly developed or enhanced products after such products are launched and shipped to customers. Resolution of such issues may cause project delays, additional development costs, and deferred or lost revenue.
New products and enhancements of our existing products may also reduce demand for our existing products or could delay purchases by customers who instead decide to wait for our new or enhanced products. Difficulties that arise in our managing the transition from our older products to our new or enhanced products could result in additional costs and deferred or lost revenue.
We may need to make significant capital and operating expenditures to keep pace with technological developments in our industry.
The industries in which we participate are constantly undergoing development and change, and it is likely that new products, equipment, and service methods will be introduced in the future. We may need to make significant expenditures to purchase new equipment and to train our employees to keep pace with any new technological developments. These expenditures could adversely affect our results of operations and financial condition.
If we are unable to develop, preserve, and protect our intellectual property assets, our business, financial condition, results of operations, and cash flows may be negatively affected.
We strive to protect and enhance our proprietary intellectual property rights through patent, copyright, trademark, and trade secret laws, as well as through technological safeguards and operating policies. To the extent we are not successful, our business, financial condition, results of operations, and cash flows could be materially adversely impacted. We may be unable to prevent third parties from using our technology without our authorization, or from independently developing technology that is similar to ours, particularly in those countries where the laws do not protect our proprietary rights as fully as in the United States. With respect to our pending patent applications, we may not be successful in securing patents for these claims, and our competitors may already have applied for patents that, once issued, will prevail over our patent rights or otherwise limit our ability to sell our products.
Claims by others that we infringe their intellectual property rights could harm our business, financial condition, results of operations, and cash flows.
We have seen a trend towards aggressive enforcement of intellectual property rights as product functionality in our industry increasingly overlaps and the number of issued patents continues to grow. As a result, there is a risk that we could be subject to infringement claims which, regardless of their validity, could:
|
● |
be expensive, time consuming, and divert management attention away from normal business operations; |
|
● |
require us to pay monetary damages or enter into non-standard royalty and licensing agreements; |
|
● |
require us to modify our product sales and development plans; or |
|
● |
require us to satisfy indemnification obligations to our customers. |
Regardless of whether these claims have any merit, they can be burdensome and costly to defend or settle and can harm our business and reputation.
The business continuity of our information systems, computer equipment, and information databases are critical to our business operations, and any damage or disruptions could negatively affect our business, financial condition, results of operations, and cash flows.
Our operations are dependent on our ability to protect our computer equipment and the information stored in our databases from damage by, among other things, earthquake, fire, natural disaster, power loss, telecommunications failures, unauthorized intrusions, and other catastrophic events. A part of our operations is based in an area of California that has experienced power outages and earthquakes, while another part of our operations is based in an area of Florida that has experienced power outages and hurricanes. Despite our best efforts at planning for such contingencies, catastrophic events of this nature may still result in system failures and other interruptions in our operations, which could have a material adverse effect on our business, financial condition, results of operations, and cash flows.
In addition, it is periodically necessary to replace, upgrade, or modify our internal information systems. If we are unable to do this in a timely and cost-effective manner, especially in light of demands on our information technology resources, our ability to capture and process financial transactions and therefore our business, financial condition, results of operations, and cash flows may be materially adversely impacted.
We are subject to cyber-security risks arising out of breaches of security relating to sensitive company, client, and employee information and to the technology that manages our operations and other business processes.
Our business operations rely upon secure information technology systems for data capture, processing, storage, and reporting. Notwithstanding careful security and controls design, our information technology systems, and those of our third-party providers could become subject to cyber-attacks. Network, system, application, and data breaches could result in operational disruptions or information misappropriation, including, but not limited to, interruptions to systems availability and denial of access to and misuse of applications required by our clients to conduct business with us. Theft of intellectual property or trade secrets and inappropriate disclosure of confidential information could stem from such incidents. Any such operational disruption and/or misappropriation of information could result in lost sales, negative publicity or business delays and could have a material adverse effect on our business.
We face risks associated with future acquisitions.
We evaluate expansion opportunities such as acquiring other businesses or assets. Significant expansion involves risks such as additional debt incurred to finance the acquisition or expansion, liabilities (whether known or unknown), environmental or pension liabilities of the acquired business or assets, risks and costs associated with integrating the acquired business or new facility into our operations, unanticipated demands on our management, operational resources and financial and internal control systems, and risks in attracting and retaining customers. If we are unable to integrate acquired businesses or newly formed operations, or if such acquired businesses underperform relative to our expectations, such an expansion may have a material adverse effect on our business, financial position, and results of operations. When making acquisitions, we may be required to obtain licenses, permits, and approvals from state, local, and foreign governments, and we run the risk of being denied the necessary consents from such governmental bodies.
Our business success depends on retaining our senior management and other key personnel and attracting and retaining other qualified employees.
We depend on our senior executive officers and other key personnel. The loss of any of these officers or key personnel could materially adversely affect our business, financial condition, results of operations, and cash flows. In addition, competition for skilled and non-skilled employees among companies that rely heavily on engineering, technology, and manufacturing is intense, and the loss of skilled or non-skilled employees or an inability to attract, retain, and motivate additional skilled and non-skilled employees required for the operation and expansion of our business could hinder our ability to conduct research activities successfully, develop new products and services and meet our customers’ requirements.
The industries in which we operate expose us to potential liabilities arising out of the installation or use of our systems that could negatively affect our business, financial condition, results of operations, and cash flows.
Our businesses supply equipment and systems for use in food processing as well as equipment, systems, and services used in airports all over the world, which creates potential exposure for us for personal injury, wrongful death, product liability, commercial claims, product recalls, property damage, pollution, and other environmental damages. In the event that a customer who purchases our equipment becomes subject to claims relating to food borne illnesses or other food safety or quality issues relating to food processed through the use of our equipment, we could be exposed to claims from our customers. Although we have obtained business and related risk insurance, we cannot assure you that our insurance will be adequate to cover all potential liabilities. Further, we cannot assure you that insurance will generally be available in the future or, if available, that premiums to obtain such insurance will be commercially reasonable. If we incur substantial liability and damages arising from such liability are not covered by insurance or are in excess of policy limits, or if we were to incur liability at a time when we are not able to obtain liability insurance, our business, financial condition, results of operations, and cash flows could be materially adversely affected.
Environmental protection initiatives may negatively impact the profitability of our business.
Future environmental regulatory developments in the United States and abroad concerning environmental issues, such as climate change, could adversely affect our operations and increase operating costs and, through their impact on our customers, reduce demand for our products and services. Actions may be taken in the future by the U.S. government, state governments within the United States, foreign governments, or by signatory countries through a new global climate change treaty to regulate the emission of greenhouse gases. Pressures to reduce the footprint of carbon emissions impact the air transportation and manufacturing sectors. Airports, airlines, and air cargo providers are continually looking for new ways to become more energy efficient and reduce pollutants. Manufacturing plants are seeking means to reduce their heat-trapping emissions and minimize their energy and water usage. The precise nature of any such future environmental regulatory requirements and their applicability to us and our customers are difficult to predict, but the impact to us and the industries that we serve would likely be adverse and could be significant, including the potential for increased fuel costs, carbon taxes or fees, or a requirement to purchase carbon credits.
Our operations and industries are subject to a variety of U.S. and international laws, which can change. We therefore face uncertainties with regard to lawsuits, regulations, and other related matters.
In the normal course of business, we are subject to proceedings, lawsuits, claims, and other matters, including those that relate to the environment, health and safety, employee benefits, export compliance, intellectual property, product liability, tax matters, and regulatory compliance. For example, we are subject to changes in foreign laws and regulations that may encourage or require us to hire local contractors or require foreign contractors to employ citizens of, or purchase supplies from, a particular non-U.S. jurisdiction. In addition, environmental laws and regulations affect the systems and services we design, market and sell, as well as the facilities where we manufacture our systems. We are required to invest financial and managerial resources to comply with environmental laws and regulations and anticipate that we will continue to be required to do so in the future.
We could be adversely affected by violations of the U.S. Foreign Corrupt Practices Act and similar worldwide anti-bribery laws.
The U.S. Foreign Corrupt Practices Act (FCPA), the U.K. Bribery Act of 2010 (the U.K. Bribery Act), and similar anti-bribery laws in other jurisdictions generally prohibit companies and their intermediaries from making improper payments for the purpose of obtaining or retaining business. Our policies mandate compliance with these anti-bribery laws. We operate in many parts of the world that have experienced governmental corruption to some degree and, in certain circumstances, strict compliance with anti-bribery laws may conflict with local customs and practices. Despite our training and compliance programs, there is no assurance that our internal control policies and procedures will protect us from acts committed by our employees or agents. If we are found to be liable for FCPA, the U.K. Bribery Act or other similar violations (either due to our own acts or our inadvertence, or due to the acts or inadvertence of others), we could suffer from civil and criminal penalties or other sanctions, which could have a material adverse impact on our business, financial condition, and results of operations.
We are subject to governmental export controls and economic sanctions laws that could impair our ability to compete in international markets and subject us to liability if we are not in full compliance with applicable laws.
Our business activities are subject to various restrictions under U.S. export controls and trade and economic sanctions laws, including the U.S. Commerce Department’s Export Administration Regulations (EAR), the International Traffic in Arms Regulations (ITAR), and economic and trade sanctions regulations maintained by the U.S. Treasury Department’s Office of Foreign Assets Control (OFAC). If we fail to comply with these laws and regulations, we and certain of our employees could be subject to civil or criminal penalties and reputational harm. Obtaining the necessary authorizations, including any required license, for a particular transaction may be time-consuming, is not guaranteed, and may result in the delay or loss of sales opportunities. Furthermore, U.S. export control laws and economic sanctions laws prohibit certain transactions with U.S. embargoed or sanctioned countries, governments, persons and entities. Although we take precautions to prevent transactions with U.S. sanction targets, the possibility exists that we could inadvertently provide our products or services to persons prohibited by U.S. sanctions. This could result in negative consequences to us, including government investigations, penalties, and reputational harm.
Unfavorable tax law changes and tax authority rulings may adversely affect results.
We are subject to income taxes in the United States and in various foreign jurisdictions. Domestic and international tax liabilities are subject to the allocation of income among various tax jurisdictions. Our effective tax rate could be adversely affected by changes in the mix of earnings among countries with differing statutory tax rates, changes in the valuation allowance of deferred tax assets, or tax laws. The amount of income taxes and other taxes are subject to ongoing audits by U.S. federal, state, and local tax authorities and by non-U.S. authorities. If these audits result in assessments different from amounts we record, future financial results may include unfavorable tax adjustments.
If we repatriate any cash and cash equivalents from our foreign subsidiaries back to the U.S., we could be subject to significant tax liabilities.
As of December 31, 2014, our foreign subsidiaries held $25.7 million, or 77%, of our cash and cash equivalents. While we currently intend that cash and cash equivalents held by these foreign subsidiaries will be indefinitely reinvested in foreign jurisdictions in order to fund working capital requirements, make investments, and repay debt (primarily inter-company), if, in the future, cash and cash equivalents held by foreign subsidiaries are needed to fund our operations in the United States or for the purpose of making certain strategic investments in the United States or otherwise, the repatriation of such amounts to the United States could result in a significant incremental tax liability in the period in which the decision to repatriate occurs. Payment of any incremental tax liability would reduce the cash available to us to fund our operations or to make such strategic investment in the United States or otherwise.
Our business could suffer in the event of a work stoppage by our unionized labor force.
We employ approximately 3,500 people with approximately 2,200 located in the United States. Approximately 10% of our employees in the United States are represented by a single collective bargaining agreement that covers these employees through August of 2019.
Outside the United States, we enter into employment contracts and agreements in those countries in which such relationships are mandatory or customary, such as in Belgium, Sweden, Spain and Italy. The provisions of these agreements correspond in each case with the required or customary terms in the subject jurisdiction. Approximately 60% of our international employees are covered under national employee unions.
Any future strikes, employee slowdowns, or similar actions by one or more unions, in connection with labor contract negotiations or otherwise, could have a material adverse effect on our ability to operate our business.
Our existing financing agreements include restrictive and financial covenants.
Certain of our loan agreements require us to comply with various restrictive covenants and some contain financial covenants that require us to comply with specified financial ratios and tests. Our failure to meet these covenants could result in default under these loan agreements and would result in a cross-default under other loan agreements. In the event of a default and our inability to obtain a waiver of the default, all amounts outstanding under loan agreements could be declared immediately due and payable. Our failure to comply with these covenants could adversely affect our results of operations and financial condition.
Significant changes in actual investment return on pension assets, discount rates, and other factors could affect our results of operations, equity, and pension contributions in future periods.
Our results of operations may be positively or negatively affected by the amount of income or expense we record for our defined benefit pension plans. U.S. generally accepted accounting principles (GAAP) require that we calculate income or expense for the plans using actuarial valuations. These valuations reflect assumptions about financial market and other economic conditions, which may change based on changes in key economic indicators. The most significant year-end assumptions we use to estimate pension income or expense are the discount rate and the expected long-term rate of return on plans assets. In addition, we are required to make an annual measurement of plan assets and liabilities, which may result in a significant change to equity through a reduction or increase to accumulated other comprehensive income. For a discussion regarding how our financial statements can be affected by pension plan accounting policies, see Critical Accounting Estimates – Defined Benefit Pension and Other Postretirement Plans in Part II, Item 7. “Management’s Discussion and Analysis of Financial Condition and Results of Operations” and Note 8 to the consolidated financial statements in Part II, Item 8. “Financial Statements and Supplementary Data” of this Annual Report on Form 10-K. Although GAAP expense and pension funding contributions are not directly related, key economic factors that affect GAAP expense would also likely affect the amount of cash we would contribute to pension plans as required under the Employee Retirement Income Security Act.
As a publicly traded company, we incur regulatory costs that reduce profitability.
As a publicly traded corporation, we incur certain costs to comply with regulatory requirements of the NYSE and of the federal securities laws. If regulatory requirements were to become more stringent or if accounting or other controls thought to be effective later fail, we may be forced to make additional expenditures, the amounts of which could be material. Many of our competitors are privately owned, so our accounting and control costs can be a competitive disadvantage.
Our share repurchase program could increase the volatility of the price of our common stock.
On October 27, 2011, our Board of Directors authorized a share repurchase program for up to $30 million of our common stock, which is now effective through December 31, 2015. We repurchased $0.2 million of common stock in 2013, $2.8 million in 2014 and have $23.1 million in remaining purchases under the authorization. We plan to fund the repurchases through cash flows generated by our operations. The amount and timing of share repurchases will be based on a variety of factors. Important factors that could cause us to limit, suspend or delay the Company’s stock repurchases include unfavorable market conditions, the trading price of the Company’s common stock, the nature of other investment opportunities presented to us from time to time, the ability to obtain financing at attractive rates, and the availability of U.S. cash. Repurchases of our shares will reduce the number of outstanding shares of our common stock and might incrementally increase the potential for volatility in our common stock by reducing the potential volumes at which our common stock may trade in the public market.
Our corporate governance documents, our rights plan, and Delaware law may delay or discourage takeovers and business combinations that our stockholders might consider in their best interests.
Provisions in our amended and restated certificate of incorporation and by-laws may make it difficult and expensive for a third-party to pursue a tender offer, change-in-control, or takeover attempt that is opposed by our management and Board of Directors. These provisions include, among others:
|
● |
A Board of Directors that is divided into three classes with staggered terms; |
|
● |
Limitations on the right of stockholders to remove directors; |
|
● |
The right of our Board of Directors to issue preferred stock without stockholder approval; |
|
● |
The inability of our stockholders to act by written consent; and |
|
● |
Rules and procedures regarding how stockholders may present proposals or nominate directors at stockholders meetings. |
Public stockholders who might desire to participate in this type of transaction may not have an opportunity to do so. These anti-takeover provisions could substantially impede the ability of public stockholders to benefit from a change-in-control or a change in our management or Board of Directors and, as a result, may adversely affect the marketability and market price of our common stock.
In addition, we have adopted a stockholder rights plan intended to deter hostile or coercive attempts to acquire us. Under the plan, if any person or group acquires, or begins a tender or exchange offer that could result in such person acquiring 15% or more of our common stock, without approval of our Board of Directors under specified circumstances, our other stockholders will have the right to purchase shares of our common stock, or shares of the acquiring company, at a substantial discount to the public market price. Therefore, the rights will cause substantial dilution to a person or group that attempts to acquire us on terms not approved by our Board of Directors, except pursuant to any offer conditioned on a substantial number of rights being acquired. Although we believe these provisions protect our stockholders from coercive or otherwise unfair takeover tactics and thereby provide for an opportunity to receive a higher bid by requiring potential acquirers to negotiate with our Board of Directors, these provisions apply even if the offer may be considered beneficial by some stockholders.
ITEM 1B. UNRESOLVED STAFF COMMENTS
None.
ITEM 2. PROPERTIES
We lease executive offices totaling approximately 24,000 square feet in Chicago, Illinois. We believe that our properties and facilities meet our current operating requirements and are in good operating condition. However, our facility in Lakeland is one of our older facilities, and we are in the process of replacing the existing facility. We believe that each of our significant manufacturing facilities is operating at a level consistent with the industries in which we operate. The following are significant production facilities for our JBT operations:
|
LOCATION |
SEGMENT |
|
SQUARE FEET (approximate) |
|
LEASED OR OWNED |
|
United States: |
|
|
|
| |
|
Madera, California |
JBT FoodTech |
|
271,000 |
|
Owned |
|
Orlando, Florida |
JBT AeroTech |
248,000 |
|
Owned | |
|
Ogden, Utah |
JBT AeroTech |
240,000 |
|
Owned/Leased | |
|
Lakeland, Florida |
JBT FoodTech |
|
200,000 |
|
Owned |
|
Sandusky, Ohio |
JBT FoodTech |
|
140,000 |
|
Owned |
|
Kingston, New York |
JBT FoodTech |
133,000 |
Owned | ||
|
Chalfont, Pennsylvania |
JBT FoodTech |
67,000 |
Leased | ||
|
Riverside, California |
JBT FoodTech |
50,000 |
Leased | ||
|
|
|
| |||
|
International: |
|
|
|
| |
|
St. Niklaas, Belgium |
JBT FoodTech |
|
289,000 |
|
Owned |
|
Helsingborg, Sweden |
JBT FoodTech |
|
227,000 |
|
Owned/Leased |
|
Araraquara, Brazil |
JBT FoodTech |
|
128,000 |
|
Owned |
|
Madrid, Spain |
JBT FoodTech, JBT AeroTech |
88,000 |
|
Owned | |
|
Parma, Italy |
JBT FoodTech |
|
72,000 |
|
Owned |
|
Kunshan, China |
JBT FoodTech, JBT AeroTech |
|
70,000 |
|
Leased |
|
Shenzhen, China |
JBT AeroTech |
43,000 |
|
Leased | |
|
Edinburgh, Scotland |
JBT FoodTech |
|
41,000 |
|
Leased |
|
Cape Town, South Africa |
JBT FoodTech |
|
38,000 |
|
Leased |
|
Juarez, Mexico |
JBT AeroTech |
27,000 |
|
Leased | |
ITEM 3. LEGAL PROCEEDINGS
We are involved in legal proceedings arising in the ordinary course of business. Although the results of litigation cannot be predicted with certainty, we do not believe that the resolution of the proceedings that we are involved in, either individually or taken as a whole, will have a material adverse effect on our business, results of operations, cash flows or financial condition.
In the normal course of our business, we are at times subject to pending and threatened legal actions, some for which the relief or damages sought may be substantial. Although we are not able to predict the outcome of such actions, after reviewing all pending and threatened actions with counsel and based on information currently available, management believes that the outcome of such actions, individually or in the aggregate, will not have a material adverse effect on the results of operations or financial position of our Company. However, it is possible that the ultimate resolution of such matters, if unfavorable, may be material to the results of operations in a particular future period as the time and amount of any resolution of such actions and its relationship to the future results of operations are not currently known.
Liabilities are established for pending legal claims only when losses associated with the claims are judged to be probable, and the loss can be reasonably estimated. In many lawsuits and arbitrations, it is not considered probable that a liability has been incurred or not possible to estimate the ultimate or minimum amount of that liability until the case is close to resolution, in which case no liability would be recognized until that time.
ITEM 4. MINE SAFETY DISCLOSURES
Not applicable.
PART II
ITEM 5. MARKET FOR REGISTRANT’S COMMON EQUITY AND RELATED STOCKHOLDER MATTERS
Our common stock is listed on the New York Stock Exchange under the symbol JBT. As of February 19, 2015, there were 1,871 holders of record of our common stock. Information regarding the market prices of our common stock and dividends declared for the two most recent fiscal years is provided in Note 18 to our consolidated financial statements. Other information required by this Item can be found in the Proxy Statement for our 2015 Annual Meeting of Stockholders and is incorporated herein by reference.
The following graph shows the cumulative total return of an investment of $100 (and reinvestment of any dividends thereafter) on December 31, 2009 in: (i) our common stock, (ii) the S&P Smallcap 600 Stock Index and (iii) the Russell 2000 Index. These indices are included for comparative purposes only and do not necessarily reflect management’s opinion that such indices are an appropriate measure of the relative performance of the stock involved, and are not intended to forecast or be indicative of possible future performance of the common stock.
CUMULATIVE TOTAL RETURN
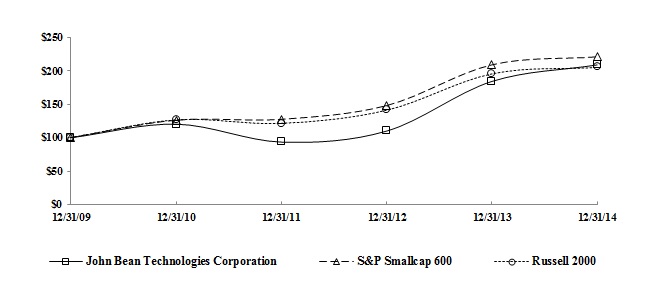
Issuer purchases of Equity Securities
The following table includes information about the Company’s stock repurchases during the three months ended December 31, 2014:
|
(Dollars in millions, except per share amounts) |
||||||||||||||||
| Period |
Total Number of Shares Purchased |
Average Price Paid per Share |
Total Number of Shares Purchased as part of Publicly Announced Program (1) |
Approximate Dollar Value of Shares that may yet be Purchased under the Program |
||||||||||||
|
October 1, 2014 through October 31, 2014 |
- | $ | - | - | $ | 24.1 | ||||||||||
|
November 1, 2014 through November 30, 2014 |
- | - | - | 24.1 | ||||||||||||
|
December 1, 2014 through December 31, 2014 |
30,000 | 32.29 | 30,000 | 23.1 | ||||||||||||
| 30,000 | $ | 32.29 | 30,000 | $ | 23.1 | |||||||||||
|
(1) |
Shares repurchased under a share repurchase plan for up to $30 million of our common stock authorized in 2011. (see Note 11 to our consolidated financial statements for more information). |
ITEM 6. SELECTED FINANCIAL DATA
The following table presents selected financial and other data about us for the most recent five fiscal years. The data has been derived from our consolidated financial statements. The historical consolidated balance sheet data set forth below reflects the assets and liabilities that existed as of the dates presented.
The selected financial data should be read in conjunction with, and are qualified by reference to, Item 7. Management’s Discussion and Analysis of Financial Condition and Results of Operations. The income statement and cash flow data for the three years ended December 31, 2014, and the balance sheet data as of December 31, 2014 and 2013 are derived from our audited consolidated financial statements included elsewhere in this report, and should be read in conjunction with those financial statements and the accompanying notes. The balance sheet data as of December 31, 2012, 2011, 2010 and the income statement and cash flow data for the years ended December 31, 2011 and 2010 were derived from audited financial statements that are not presented in this report.
The following financial information may not reflect what our results of operations, financial position and cash flows will be in the future. In addition, Item 1A. Risk Factors of this report includes a discussion of risk factors that could impact our future results of operations
|
Year Ended December 31, |
||||||||||||||||||||
|
(In millions, except per share data) |
2014 |
2013 (a) |
2012 (a) |
2011 (a) |
2010 (a) |
|||||||||||||||
|
Income Statement Data: |
||||||||||||||||||||
|
Revenue: |
||||||||||||||||||||
|
JBT FoodTech |
$ | 634.7 | $ | 611.1 | $ | 592.5 | $ | 594.0 | $ | 563.2 | ||||||||||
|
JBT AeroTech |
350.2 | 323.6 | 325.0 | 362.0 | 317.3 | |||||||||||||||
|
Other revenue and intercompany eliminations |
(0.7 | ) | (0.5 | ) | (0.2 | ) | (0.2 | ) | (0.1 | ) | ||||||||||
|
Total revenue |
$ | 984.2 | $ | 934.2 | $ | 917.3 | $ | 955.8 | $ | 880.4 | ||||||||||
|
Operating expenses: |
||||||||||||||||||||
|
Cost of sales |
$ | 723.5 | $ | 701.3 | $ | 686.5 | $ | 721.2 | $ | 645.8 | ||||||||||
|
Selling, general and administrative expense |
179.3 | 164.3 | 156.6 | 152.9 | 147.8 | |||||||||||||||
|
Research and development expense |
14.6 | 14.0 | 14.3 | 18.5 | 17.5 | |||||||||||||||
|
Restructuring expense |
14.5 | 1.6 | 0.1 | 11.6 | 3.7 | |||||||||||||||
|
Other (income) expense, net |
1.6 | (0.2 | ) | (1.1 | ) | (1.6 | ) | (1.5 | ) | |||||||||||
|
Operating income: |
50.7 | 53.2 | 60.9 | 53.2 | 67.1 | |||||||||||||||
|
Interest income |
1.6 | 2.2 | 0.5 | 0.6 | 0.4 | |||||||||||||||
|
Interest expense |
(7.6 | ) | (7.6 | ) | (7.4 | ) | (7.0 | ) | (8.2 | ) | ||||||||||
|
Income from continuing operations before income taxes |
44.7 | 47.8 | 54.0 | 46.8 | 59.3 | |||||||||||||||
|
Provision for income taxes |
13.9 | 13.8 | 16.9 | 16.0 | 21.4 | |||||||||||||||
|
Income from continuing operations |
30.8 | 34.0 | 37.1 | 30.8 | 37.9 | |||||||||||||||
|
Loss from discontinued operations, net of income taxes |
- | (0.9 | ) | (0.9 | ) | (0.3 | ) | (0.6 | ) | |||||||||||
|
Net income |
$ | 30.8 | $ | 33.1 | $ | 36.2 | $ | 30.5 | $ | 37.3 | ||||||||||
|
Diluted earnings per share: |
||||||||||||||||||||
|
Income from continuing operations |
$ | 1.03 | $ | 1.15 | $ | 1.26 | $ | 1.05 | $ | 1.30 | ||||||||||
|
Net income |
$ | 1.03 | $ | 1.11 | $ | 1.23 | $ | 1.04 | $ | 1.28 | ||||||||||
|
Diluted weighted average shares outstanding |
29.9 | 29.7 | 29.5 | 29.3 | 29.1 | |||||||||||||||
|
Cash dividends declared per common share |
$ | 0.36 | $ | 0.34 | $ | 0.28 | $ | 0.28 | $ | 0.28 | ||||||||||
|
Common Stock Data (unaudited): |
||||||||||||||||||||
|
Common stock sales price range: |
||||||||||||||||||||
|
High |
$ | 33.99 | $ | 30.00 | $ | 18.20 | $ | 21.00 | $ | 21.19 | ||||||||||
|
Low |
$ | 25.52 | $ | 17.78 | $ | 12.76 | $ | 13.16 | $ | 14.34 | ||||||||||
|
At December 31, |
||||||||||||||||||||
|
(In millions) |
2014 |
2013 |
2012 |
2011 |
2010 |
|||||||||||||||
|
Balance Sheet Data: |
||||||||||||||||||||
|
Total assets |
$ | 697.8 | $ | 621.2 | $ | 678.0 | $ | 592.2 | $ | 582.2 | ||||||||||
|
Long-term debt, less current portion |
$ | 173.8 | $ | 94.1 | $ | 189.1 | $ | 135.7 | $ | 145.4 | ||||||||||
|
Year Ended December 31, |
||||||||||||||||||||
|
(In millions) |
2014 |
2013 |
2012 |
2011 |
2010 |
|||||||||||||||
|
Other Financial Information: |
||||||||||||||||||||
|
Capital expenditures |
$ | 36.7 | $ | 29.2 | $ | 24.7 | $ | 20.8 | $ | 24.3 | ||||||||||
|
Cash flows provided by continuing operating activities |
$ | 78.0 | $ | 63.1 | $ | 86.6 | $ | 37.0 | $ | 17.6 | ||||||||||
|
Order backlog (unaudited) |
$ | 366.7 | $ | 376.5 | $ | 283.1 | $ | 246.0 | $ | 286.8 | ||||||||||
|
(a) |
In 2014, we revised our measure of segment operating profit to include foreign currency gains and losses related to segment operations. In the table above, these gains and losses were previously reported in other revenue and intercompany eliminations, and are now reflected in segment revenue. Previously reported amounts have been retroactively adjusted to reflect this change in presentation, which had no effect on the previously reported total revenue, operating income or net income. Refer to note 16 of notes to consolidated financial statements included herein in Item 8. |
ITEM 7. MANAGEMENT’S DISCUSSION AND ANALYSIS OF FINANCIAL CONDITION AND RESULTS OF OPERATIONS
Executive Overview
We are a global technology solutions provider for the food processing and air transportation industries. We design, manufacture, test and service technologically sophisticated systems and products for customers throughout our JBT FoodTech and JBT AeroTech segments.
In 2014, we instituted management changes and developed our Next Level strategy to capitalize on the leadership position of our businesses and accelerate growth and profitability. The Next Level strategy is based on a three-pronged plan to “fix”, “strengthen”, and “grow” JBT.
In the “fix” category, we embarked on efforts to streamline our organization. We incurred restructuring charges totaling $14.5 million in 2014 to improve efficiency and right-size our business. We completed our corporate office and almost all of our U.S. restructuring in 2014. Our European restructuring is well underway and expected to be completed in 2015.
To strengthen the business, we introduced the JBT Excellence Model (or JEM). JEM includes value-based pricing, which has been rolled out across all major businesses. JEM also includes implementation of Lean initiatives or what we call “Relentless Continuous Improvement”. This is an integrated focus on safety, quality, delivery, and cost that establishes a sustainable competitive advantage. We have introduced RCI via extensive leadership training and have implemented it at many JBT production facilities in 2014.
There are several specific components to our strategy to enhance growth. We are investing in the profitable aftermarket business, building a dedicated sales and service network that will capitalize on our global installed base of equipment. We also are capitalizing on growth opportunities in emerging markets through locally-tailored products. We are establishing a robust, direct presence in Asia, which we believe is critical to winning business from local producers. In addition to our ongoing new product development across our businesses, acquisitions are an integral part of JBT’s growth strategy. In 2014, we completed three acquisitions that reflect our strategic focus on companies that complement our protein processing and liquid foods portfolios.
As we evaluate our operating results, we consider our key performance indicators of segment revenue, segment operating profit, and the level of inbound orders and order backlog.
Non-GAAP Financial Measures
The results for the periods ended December 31, 2014, 2013 and 2012 include several items that affect the comparability of our results. These include significant expenses that are not indicative of our ongoing operations as detailed in the table below:
|
December 31, |
||||||||||||
|
(In millions) |
2014 |
2013 |
2012 |
|||||||||
|
Income from continuing operations as reported |
$ | 30.8 | $ | 34.0 | $ | 37.1 | ||||||
|
Non-GAAP adjustments |
||||||||||||
|
Restructuring expense |
14.5 | 1.6 | 0.1 | |||||||||
|
Management succession costs |
6.4 | 2.7 | - | |||||||||
|
Strategy and pricing consulting |
2.4 | 1.0 | - | |||||||||
|
Impact on tax provision from Non-GAAP adjustments |
(7.5 | ) | (2.0 | ) | - | |||||||
|
Adjusted income from continuing operations |
$ | 46.6 | $ | 37.3 | $ | 37.2 | ||||||
|
(In millions, except per share data) |
||||||||||||
|
Income from continuing operations as reported |
30.8 | 34.0 | 37.1 | |||||||||
|
Total shares and dilutive securities |
29.9 | 29.7 | 29.5 | |||||||||
|
Diluted earnings per share from continuing operations |
$ | 1.03 | $ | 1.15 | $ | 1.26 | ||||||
|
Adjusted income from continuing operations |
46.6 | 37.3 | 37.2 | |||||||||
|
Total shares and dilutive securities |
29.9 | 29.7 | 29.5 | |||||||||
|
Adjusted diluted earnings per share from continuing operations |
$ | 1.56 | $ | 1.26 | $ | 1.26 | ||||||
The above table contains non-GAAP financial measures, including adjusted income from continuing operations and adjusted diluted earnings per share from continuing operations. Adjusted income from continuing operations and adjusted diluted earnings per share from continuing operations are intended to provide an indication of our underlying operating results and to enhance investors’ overall understanding of our financial performance by eliminating the effects of certain items that are not comparable from one period to the next. In addition, this information is used as a basis for evaluating Company performance and for the planning and forecasting of future periods. This information is not intended to nor should it be considered in isolation or as a substitute for financial measures prepared in accordance with GAAP.
CONSOLIDATED RESULTS OF OPERATIONS
|
Year Ended December 31, |
Favorable / (Unfavorable) |
|||||||||||||||||||
|
(in millions) |
2014 |
2013 |
2012 |
2014 vs. 2013 |
2013 vs. 2012 |
|||||||||||||||
|
Revenue |
$ | 984.2 | $ | 934.2 | $ | 917.3 | $ | 50.0 | $ | 16.9 | ||||||||||
|
Cost of sales |
723.5 | 701.3 | 686.5 | (22.2 | ) | (14.8 | ) | |||||||||||||
|
Gross profit |
260.7 | 232.9 | 230.8 | 27.8 | 2.1 | |||||||||||||||
|
Selling, general and administrative expense |
179.3 | 164.3 | 156.6 | (15.0 | ) | (7.7 | ) | |||||||||||||
|
Research and development expense |
14.6 | 14.0 | 14.3 | (0.6 | ) | 0.3 | ||||||||||||||
|
Restructuring expense |
14.5 | 1.6 | 0.1 | (12.9 | ) | (1.5 | ) | |||||||||||||
|
Other (income) expense, net |
1.6 | (0.2 | ) | (1.1 | ) | (1.8 | ) | (0.9 | ) | |||||||||||
|
Operating income |
50.7 | 53.2 | 60.9 | (2.5 | ) | (7.7 | ) | |||||||||||||
|
Interest income |
1.6 | 2.2 | 0.5 | (0.6 | ) | 1.7 | ||||||||||||||
|
Interest expense |
(7.6 | ) | (7.6 | ) | (7.4 | ) | - | (0.2 | ) | |||||||||||
|
Income from continuing operations before income taxes |
44.7 | 47.8 | 54.0 | (3.1 | ) | (6.2 | ) | |||||||||||||
|
Provision for income taxes |
13.9 | 13.8 | 16.9 | (0.1 | ) | 3.1 | ||||||||||||||
|
Income from continuing operations |
30.8 | 34.0 | 37.1 | (3.2 | ) | (3.1 | ) | |||||||||||||
|
Loss from discontinued operations, net of income taxes |
- | (0.9 | ) | (0.9 | ) | 0.9 | - | |||||||||||||
|
Net income |
$ | 30.8 | $ | 33.1 | $ | 36.2 | $ | (2.3 | ) | $ | (3.1 | ) | ||||||||
2014 Compared With 2013
Total revenue increased $50.0 million or $64.0 million in constant currency in 2014 compared to 2013. The increase was mainly attributed to higher sales in the U.S. market and, to a lesser extent, the Latin American market. Operating income decreased $2.5 million in 2014 compared to 2013 as a result of investments in our Next Level strategic initiatives and our transition of management. Additionally, we recorded $12.9 million of incremental restructuring charges to improve efficiency and right-size our business, but realized approximately $4 million of cost benefits in 2014 from the restructuring initiatives. Other factors impacting operating income include:
|
● |
Gross profit increased $27.8 million or $32.4 million in constant currency. This is a result of both higher volumes and higher gross profit margins driven by approximately $4 million of benefits from strategic pricing. |
|
● |
Selling, general and administrative (SG&A) expenses increased by $15.0 million. The increase was primarily a result of $7.0 million in investments in Next Level initiatives, including expanding our aftermarket sales and service staff, investments in Asia, RCI related initiatives, and higher costs to acquire companies. In addition, the increase in SG&A was due to $3.7 million of higher costs related to management succession and $1.4 million of higher consulting expenses. |
|
● |
Research and development expense increased by $0.6 million due to higher investments in new product development across both segments. |
|
● |
Other expense, net, increased by $1.8 million, primarily due to $0.9 million in higher acquisition costs. |
Income tax expense for 2014 reflects an income tax rate of 31% compared to 29% in 2013. The increase in effective tax rate was a result of a shift in the mix of earnings towards the U.S. and to higher-tax jurisdictions in our foreign operations.
2013 Compared With 2012
Total revenue increased $16.9 million or $19.4 million in constant currency in 2013 compared to 2012. The increase was mainly attributed to higher sales in emerging markets, particularly in the Middle East, and partially offset by lower airport services revenue. Operating income decreased $7.7 million in 2013 compared to 2012, and operating margin decreased from 6.6% to 5.7%. The decrease in operating income resulted from the following:
|
● |
Gross profit increased $2.1 million or $3.1 million in constant currency. This was mainly the result of higher volumes. |
|
● |
SG&A expenses increased by $7.7 million. The increase was attributed to several factors, primarily a $3.8 million investment in our aftermarket sales structure, $2.7 million of costs related to management succession and $1.7 million of higher self-insured healthcare expenses. |
|
● |
Research and development expense decreased by $0.3 million mainly reflecting a shift of engineering resources from research and development efforts to project production. |
|
● |
Restructuring expense increased $1.5 million due to severance costs incurred in connection with management restructuring. |
Income tax expense for 2013 reflected an income tax rate of 29% compared to 31% in 2012. The lower effective tax rate in 2013 reflected additional research and development credits of $2.1 million claimed in the U.S.
OPERATING RESULTS OF BUSINESS SEGMENTS
|
Year Ended December 31, |
Favorable / (Unfavorable) |
|||||||||||||||||||
|
(in millions) |
2014 |
2013 |
2012 |
2014 vs. 2013 |
2013 vs. 2012 |
|||||||||||||||
|
Revenue |
||||||||||||||||||||
|
JBT FoodTech |
$ | 634.7 | $ | 611.1 | $ | 592.5 | $ | 23.6 | $ | 18.6 | ||||||||||
|
JBT AeroTech |
350.2 | 323.6 | 325.0 | 26.6 | (1.4 | ) | ||||||||||||||
|
Other revenue and intercompany eliminations |
(0.7 | ) | (0.5 | ) | (0.2 | ) | (0.2 | ) | (0.3 | ) | ||||||||||
|
Total revenue |
$ | 984.2 | $ | 934.2 | $ | 917.3 | $ | 50.0 | $ | 16.9 | ||||||||||
|
Income before income taxes |
||||||||||||||||||||
|
Segment operating profit: |
||||||||||||||||||||
|
JBT FoodTech |
$ | 72.7 | $ | 64.5 | $ | 61.3 | $ | 8.2 | $ | 3.2 | ||||||||||
|
JBT AeroTech |
30.0 | 26.8 | 28.2 | 3.2 | (1.4 | ) | ||||||||||||||
|
Total segment operating profit |
102.7 | 91.3 | 89.5 | 11.4 | 1.8 | |||||||||||||||
|
Corporate items: |
||||||||||||||||||||
|
Corporate expense |
(37.5 | ) | (36.5 | ) | (28.5 | ) | (1.0 | ) | (8.0 | ) | ||||||||||
|
Restructuring expense |
(14.5 | ) | (1.6 | ) | (0.1 | ) | (12.9 | ) | (1.5 | ) | ||||||||||
|
Net interest expense |
(6.0 | ) | (5.4 | ) | (6.9 | ) | (0.6 | ) | 1.5 | |||||||||||
|
Total corporate items |
(58.0 | ) | (43.5 | ) | (35.5 | ) | (14.5 | ) | (8.0 | ) | ||||||||||
|
Income from continuing operations before income taxes |
44.7 | 47.8 | 54.0 | (3.1 | ) | (6.2 | ) | |||||||||||||
|
Provision for income taxes |
13.9 | 13.8 | 16.9 | (0.1 | ) | 3.1 | ||||||||||||||
|
Income from continuing operations |
30.8 | 34.0 | 37.1 | (3.2 | ) | (3.1 | ) | |||||||||||||
|
Loss from discontinued operations, net of income taxes |
- | (0.9 | ) | (0.9 | ) | 0.9 | - | |||||||||||||
|
Net income |
$ | 30.8 | $ | 33.1 | $ | 36.2 | $ | (2.3 | ) | $ | (3.1 | ) | ||||||||
Segment operating profit is defined as total segment revenue less segment operating expenses. The following items have been excluded in computing segment operating profit: corporate staff expense, stock-based compensation, LIFO provisions, restructuring costs, certain employee benefit expenses, interest income and expense and income taxes.
During 2014, we revised our measure of segment operating profit to include foreign currency gains and losses related to segment operations, principally from hedging anticipated foreign currency purchases and sales and from the remeasurement of sales related assets and purchases related liabilities denominated in foreign currencies. These gains and losses were previously reported in corporate expenses and are now included in the segment to which they relate. As a result of this change, previously reported amounts in the table above and in the discussion of segment operating results in Item 7 have been retrospectively adjusted to reflect the new presentation for all periods. This change in presentation had no effect on the previously reported amounts of total revenue, income from continuing operations or net income. Refer to Note 16 of Notes to Consolidated Financial Statements included herein in Item 8.
JBT FoodTech
2014 Compared With 2013
JBT FoodTech’s revenue increased by $23.6 million, or $37.4 million in constant currency, in 2014 compared to 2013. Protein processing and liquid foods processing equipment revenue contributed $20.4 million and $15.8 million, respectively, to the increase in constant currency. Acquisitions across both protein processing and liquid foods contributed $22.4 million which is included in the noted increases. Also, across the two segments, recurring revenue contributed $25.1 million, which is also included in the noted increases, driven primarily by a strong increase in aftermarket parts and service.
JBT FoodTech’s operating profit increased by $8.2 million, or $9.6 million in constant currency, in 2014 compared to 2013, and operating profit margin increased from 10.6% to 11.5%. Higher volume and increased profit margins contributed $10.8 million and $12.2 million in increased operating profit, respectively. Gross profit margin improved across both protein processing and liquid foods, driven by benefits from strategic pricing, and increased aftermarket parts and service revenue. These increases were partly offset by increased SG&A costs of $12.4 million, which were primarily a result of investments in Next Level initiatives, including a $3.1 million investment in growth in Asia and $2.5 million in acquisition related costs. Research and development costs increased $1.1 million reflecting investment in new product development across protein processing and liquid foods.
2013 Compared With 2012
JBT FoodTech’s revenue increased by $18.6 million, or $24.1 million in constant currency, in 2013 compared to 2012. Liquid foods processing equipment revenue contributed $33.3 million to the increase, but was partly offset by decreased protein processing product sales in Europe and Latin America markets. Recurring revenue contributed $5.3 million to the increase, which was mainly driven by an increase in liquid foods aftermarket sales and higher leasing revenue.
JBT FoodTech’s operating profit increased by $3.2 million, or $6.4 million in constant currency, in 2013 compared to 2012, and operating profit margin increased from 10.3% to 10.6%. Higher volume and increased profit margins contributed $6.8 million and $3.7 million in increased operating profit, respectively. Gross profit margin improvement mainly resulted from lower costs on protein processing products manufactured in North America that historically were exported from Sweden, improved liquid foods product margins and the effects of other continuing margin improvement initiatives in JBT FoodTech. These increases were partly offset by increased selling, general and administrative costs of $3.8 million. The increase was primarily due to higher employee compensation reflecting pay for performance for strong results in liquid foods, and to a lesser extent inflationary expense increases as well as higher legal costs. Research and development costs increased $0.3 million reflecting investments in our protein processing product lines.
JBT AeroTech
2014 Compared With 2013
JBT AeroTech’s revenue increased by $26.6 million in 2014 compared to 2013. Revenue from fixed equipment increased $19.0 million, driven by higher investment into airport infrastructure in North America. Revenue from mobile equipment increased $8.6 million, primarily driven by demand for our military air conditioning units.
JBT AeroTech’s operating profit increased by $3.2 million in 2014 compared to 2013, which resulted in an operating margin improvement from 8.3% to 8.6%. Higher sales volume accounted for $5.0 million of the improvement. Gross profit margin decreased slightly as improvement from higher sales of high margin military equipment was more than offset by lower margins in airport services. Partly offsetting the profit improvement was an increase in SG&A expenses.
2013 Compared With 2012
JBT AeroTech’s revenue decreased by $1.4 million in 2013 compared to 2012. Lower revenue from maintenance contracts reduced revenue by $5.3 million. However, higher revenue from mobile equipment, driven by aftermarket parts and services and Jetway® aviation support equipment partially offset the decrease.
JBT AeroTech’s operating profit decreased by $1.4 million in 2013 compared to 2012. Lower gross profit margin attributable primarily to an unfavorable product mix and competitive pricing pressure within the mobile equipment business accounted for $2.9 million of the decrease. Selling, general and administrative costs decreased approximately $0.4 million due to various cost cutting measures. Research and development costs decreased $0.7 million due to lower expenditures in research and development activities in gate equipment.
Corporate Items
2014 Compared with 2013
Corporate items increased by $14.5 million compared to 2013. These increased costs reflect higher investments in our Next Level strategy including $0.6 million in higher interest on debt used to fund acquisitions, $0.9 million in higher acquisition related costs, and $12.9 million in higher restructuring costs.
2013 Compared with 2012
Corporate items increased by $8.0 million in 2013 compared to 2012. The increase was primarily attributable to $2.7 million of costs related to our management succession plan, $1.7 million from higher self-insured healthcare costs, $1.5 million in restructuring expense and $1.0 million of higher corporate strategies consulting costs. These increases were partly offset by higher interest income generated by cash held by our foreign subsidiaries of $1.7 million.
Inbound Orders and Order Backlog
Inbound orders represent the estimated sales value of confirmed customer orders received during the years ended December 31, 2014 and 2013.
|
(In millions) |
2014 |
2013 |
||||||
|
JBT FoodTech |
$ | 612.0 | $ | 655.4 | ||||
|
JBT AeroTech |
353.6 | 372.7 | ||||||
|
Other and intercompany eliminations |
(0.7 | ) | (0.5 | ) | ||||
|
Total inbound orders |
$ | 964.9 | $ | 1,027.6 | ||||
Order backlog is calculated as the estimated sales value of unfilled, confirmed customer orders as of December 31, 2014 and 2013.
|
(In millions) |
2014 |
2013 |
||||||
|
JBT FoodTech |
$ | 200.5 | $ | 213.7 | ||||
|
JBT AeroTech |
166.2 | 162.8 | ||||||
|
Total order backlog |
$ | 366.7 | $ | 376.5 | ||||
Order backlog in our JBT FoodTech segment at December 31, 2014 decreased by $13.2 million compared to December 31, 2013. Excluding the effect of foreign exchange, FoodTech backlog increased slightly by $1.3 million. Order activity was slow for protein processing in Asian markets and lower for automated systems. Liquid foods backlog increased, driven by higher orders resulting from the acquisition of ICS Solutions, B.V. We expect to convert almost all of the JBT FoodTech backlog at December 31, 2014 into revenue during 2015.
Order backlog in our JBT AeroTech segment at December 31, 2014 increased by $3.4 million compared to December 31, 2013. Higher orders for mobile equipment were partially offset by an unfavorable comparison in fixed equipment, coming off strong order intake in 2013. We expect to convert approximately 80% of the JBT AeroTech backlog at December 31, 2014 into revenue during 2015.
2015 Outlook
Projected revenue growth of 4 percent in 2015 reflects a 3 percent unfavorable foreign currency translation effect due to the significant appreciation of the US Dollar in the last months of 2014 and early months of 2015. We expect segment operating margins to expand 50 to 100 basis points, resulting from continued benefits from our restructuring actions and Next Level operational initiatives. Based on these expectations, the diluted earnings per share from continuing operations guidance for 2015 is $1.65 - $1.80, which includes an estimated foreign currency translation headwind of $0.10 per share.
Liquidity and Capital Resources
Our primary sources of liquidity are cash provided by operating activities of our U.S. and foreign operations and borrowings from our credit facility. Our liquidity as of December 31, 2014, or cash plus borrowing capacity under our revolving credit facility, was $158.2 million. The cash flows generated by our operations and the credit facility have historically been sufficient to satisfy our working capital needs, research and development activities, capital expenditures, pension contributions, authorized share repurchases, acquisitions and other financing requirements.
On February 10, 2015, we entered into a new five-year $450 million revolving credit facility, with Wells Fargo Securities, LLC as lead arranger, and repaid our existing revolving credit facility. Our new credit facility will increase our liquidity by $150 million. This new credit facility permits borrowings in the U.S. and in The Netherlands. Borrowings bear interest, at our option, at LIBOR or an alternative base rate, which is the greater of Wells Fargo’s Prime Rate, the Federal Funds Rate plus 50 basis points, and LIBOR plus 1%, plus, in each case, a margin dependent on our leverage ratio. We must also pay an annual commitment fee of 15.0 to 30.0 basis points dependent on our leverage ratio. The credit agreement evidencing the facility contains customary representations, warranties, and covenants, including a minimum interest coverage ratio and minimum leverage ratio, as well as certain events of default.
As of December 31, 2014, we had $33.3 million of cash and cash equivalents, $25.7 million of which was held by our foreign subsidiaries. Although these funds are considered permanently invested in our foreign subsidiaries, we are not presently aware of any restriction on the repatriation of these funds. We maintain significant operations outside of the U.S., and many of our uses of cash for working capital, capital expenditures and business acquisitions arise in these foreign geographies. If these funds were needed to fund our operations or satisfy obligations in the U.S., they could be repatriated and their repatriation into the U.S. could cause us to incur additional U.S. income taxes and foreign withholding taxes. Any additional taxes could be offset, in part or in whole, by foreign tax credits. The amount of such taxes and application of tax credits would be dependent on the income tax laws and other circumstances at the time any of these amounts were repatriated.
As noted above, funds held outside of the U.S. are considered permanently invested in our non-U.S. subsidiaries. At times, these foreign subsidiaries have cash balances that exceed their immediate working capital or other cash needs. In these circumstances, the foreign subsidiaries may loan funds to the U.S. parent company on a temporary basis; the U.S. parent company has in the past and may in the future use the proceeds of these temporary intercompany loans to reduce outstanding borrowings under our committed credit facilities. By using available non-U.S. cash to repay our debt on a short-term basis, we can optimize our leverage ratio, which has the effect of both lowering the rate we pay on certain of our borrowings and lowering our interest costs.
Under Internal Revenue Service (IRS) guidance, no incremental tax liability is incurred on the proceeds of these loans as long as each individual loan has a term of 30 days or less and all such loans from each subsidiary is outstanding for a total of less than 60 days during the year. The amount outstanding subject to this IRS guidance at December 31, 2014 was approximately $81.4 million. During 2014, each such loan was outstanding for less than 30 days, and all such loans were outstanding for less than 60 days in the aggregate. The U.S. parent used the proceeds of these intercompany loans to reduce outstanding borrowings under our 5-year credit facility. We may choose to access such funds again in the future to the extent they are available and can be transferred without significant cost, and use them on a temporary basis to repay outstanding borrowings or for other corporate purposes, but intend to do so only as allowed under this IRS guidance.
On October 27, 2011, our Board of Directors authorized a share repurchase program for up to $30 million of our common stock through December 31, 2014. In December 2014, the Board of Directors extended the term of the repurchase authorization through December 31, 2015. We repurchased $2.8 million of common stock in 2014 and have $23.1 million remaining under the authorization. The timing, price and volume of future repurchases will be based on market conditions, relevant securities laws and other factors.
Defined Benefit Pension Plans
We have defined benefit pension plans that cover certain domestic and international employees. Our largest single pension plan is the U.S. qualified plan. At December 31, 2014, this plan accounted for 87% of our consolidated defined benefit pension plans’ projected benefit obligation (PBO) and 96% of the consolidated total pension plans’ assets. Due to a decrease in the discount rate used to value the PBO and a change in mortality assumptions at December 31, 2014, the obligation increased by approximately $45 million while the assets experienced a gain during 2014 of 3%. We expect to contribute approximately $12 million to our U.S. qualified plan during 2015 and $2.5 million to our other pension and postretirement benefit plans in 2015.
Contractual Obligations and Off-Balance Sheet Arrangements
The following is a summary of our contractual obligations at December 31, 2014:
|
Payments due by period |
||||||||||||||||||||
|
(In millions) |
Total payments |
Less than 1 year |
1 - 3 years |
3-5 years |
After 5 years |
|||||||||||||||
|
Long-term debt (a) |
$ | 175.7 | $ | 1.9 | $ | 173.8 | $ | - | $ | - | ||||||||||
|
Interest payments on long-term debt (b) |
7.0 | 5.0 | 2.0 | - | - | |||||||||||||||
|
Operating leases |
21.1 | 5.0 | 7.3 | 3.3 | 5.5 | |||||||||||||||
|
Unconditional purchase obligations (c) |
48.6 | 46.7 | 1.8 | 0.1 | - | |||||||||||||||
|
Pension and other postretirement benefits (d) |
15.0 | 15.0 | - | - | - | |||||||||||||||
|
Total contractual obligations |
$ | 267.4 | $ | 73.6 | $ | 184.9 | $ | 3.4 | $ | 5.5 | ||||||||||
|
(a) |
Our available long-term debt is dependent upon our compliance with covenants described under the heading “Financing Arrangements” later in Item 7. Any violations of covenants or other events of default, which are not waived or cured, could have a material impact on our ability to maintain our committed financial arrangements and could accelerate our obligation to repay the amount due. |
|
(b) |
Interest payments were determined using the weighted average rates for all debt outstanding as of December 31, 2014. |
|
(c) |
In the normal course of business, we enter into agreements with our suppliers to purchase raw materials or services. These agreements include a requirement that our supplier provide products or services to our specifications and require us to make a firm purchase commitment to our supplier. As substantially all of these commitments are associated with purchases made to fulfill our customers’ orders, the costs associated with these agreements will ultimately be reflected in cost of sales on our consolidated statements of income. |
|
(d) |
This amount reflects discretionary contributions in 2015 to our pension plans. Required contributions for future years depend on factors that cannot be determined at this time. |
The following is a summary of other off-balance sheet arrangements at December 31, 2014:
|
Amount of commitment expiration per period |
||||||||||||||||||||
|
(In millions) |
Total amount |
Less than 1 year |
1 - 3 years |
3-5 years |
After 5 years |
|||||||||||||||
|
Letters of credit and bank guarantees |
$ | 24.5 | $ | 22.6 | $ | 1.0 | $ | - | $ | 0.9 | ||||||||||
|
Surety bonds |
53.8 | 37.1 | 16.7 | - | - | |||||||||||||||
|
Total other off-balance sheet arrangements |
$ | 78.3 | $ | 59.7 | $ | 17.7 | $ | - | $ | 0.9 | ||||||||||
To provide required security regarding our performance on certain contracts, we provide letters of credit, surety bonds and bank guarantees, for which we are contingently liable. In order to obtain these financial instruments, we pay fees to various financial institutions in amounts competitively determined in the marketplace. Our ability to generate revenue from certain contracts is dependent upon our ability to obtain these off-balance sheet financial instruments.
Our off-balance sheet financial instruments may be renewed, revised or released based on changes in the underlying commitment. Historically, our commercial commitments have not been drawn upon to a material extent; consequently, management believes it is not likely that there will be claims against these commitments that would result in a negative impact on our key financial ratios or our ability to obtain financing.
Cash Flows
Cash flows for each of the years in the three-year period ended on December 31, 2014 were as follows:
|
(In millions) |
2014 |
2013 |
2012 |
|||||||||
|
Cash provided by continuing operating activities |
$ | 78.0 | $ | 63.1 | $ | 86.6 | ||||||
|
Cash required by continuing investing activities |
(126.6 | ) | (28.1 | ) | (32.6 | ) | ||||||
|
Cash provided (required) by financing activities |
61.9 | (101.6 | ) | 36.1 | ||||||||
|
Cash required by discontinued operations |
(0.3 | ) | (1.1 | ) | (0.6 | ) | ||||||
|
Effect of foreign exchange rate changes on cash and cash equivalents |
(9.1 | ) | (1.9 | ) | 0.5 | |||||||
|
Increase (decrease) in cash and cash equivalents |
$ | 3.9 | $ | (69.6 | ) | $ | 90.0 | |||||
Cash flows provided by continuing operating activities in 2014 were $78.0 million, representing a $14.9 million increase compared to 2013. The change in the operating cash flows is primarily attributable to more than $25 million in improved working capital cash flows offset by $9.6 million in higher pension contributions.
Cash required by investing activities during 2014 was $126.6 million, representing a $98.5 million increase compared to 2013. We invested $91.3 million on acquisitions completed during 2014, with the remainder of the increase resulting from higher capital expenditures in 2014. We are constructing a new JBT FoodTech plant in Lakeland, Florida to replace an existing plant in the same area. We spent approximately $7 million on this project in 2014 and expect to spend approximately $5 million in 2015 to complete the project.
Cash flows provided by financing activities in 2014 were $61.9 million compared to cash flows required by financing activities of $101.6 million in 2013. The change in financing cash flows was primarily driven by borrowings against our 5-year revolving credit facility to provide the funding required for the acquisitions completed during 2014.
Financing Arrangements
At December 31, 2014, we had a $300 million 5-year revolving credit facility that expires on November 30, 2017. Borrowings under the revolving credit facility bore interest, at our option, at LIBOR or an alternative base rate, which is the greater of JPMorgan Chase, N.A.’s Prime Rate, the Federal Funds Rate plus 50 basis points, and LIBOR plus 1%, plus a margin dependent on our leverage ratio. We were required to make periodic interest payments on the borrowed amounts and pay an annual facility fee ranging from 15.0 to 27.5 basis points, depending on our leverage ratio. As of December 31, 2014, we had $94.3 million drawn on the credit facility.
On February 10, 2015, we entered into a new five-year $450 million revolving credit facility, with Wells Fargo Securities, LLC as lead arranger, and repaid our existing revolving credit facility. This credit facility permits borrowings in the U.S. and in The Netherlands. Borrowings bear interest, at our option, at LIBOR or an alternative base rate, which is the greater of Wells Fargo’s Prime Rate, the Federal Funds Rate plus 50 basis points, and LIBOR plus 1%, plus, in each case, a margin dependent on our leverage ratio. We must also pay an annual commitment fee of 15.0 to 30.0 basis points dependent on our leverage ratio. The credit agreement evidencing the facility contains customary representations, warranties, and covenants, including a minimum interest coverage ratio and minimum leverage ratio, as well as certain events of default.
We have $75 million of 6.66% senior unsecured notes outstanding. The senior unsecured notes are due on July 31, 2015 and require us to make semiannual interest payments. We plan to use the $450 million revolving credit facility noted above to fund payment of these senior unsecured notes when due.
Our Brazilian subsidiary entered into two loans during 2013. The first loan was a $4.0 million loan with an annual interest cost of 5.5% that matured and was paid in full on August 20, 2014. The second loan was a Brazilian real denominated loan with an outstanding balance of Br5.3 million (approximately $2.0 million) as of December 31, 2014, which bears an annual interest rate of 5.5%. The first payment on this loan was made on May 15, 2014, with equal monthly payments required for 24 months thereafter.
During 2014, the Brazilian subsidiary entered into an additional Brazilian real denominated loan with an outstanding balance of Br11.4 million (approximately $4.3 million) as of December 31, 2014, which bears an annual interest rate of 8.0%. The first payment on this loan is due November 15, 2015, with equal monthly payments required for 24 months thereafter.
As part of our strategy to grow in Asia, we are expanding our operations in China and India. Due to greater restrictions on foreign currency exchange in these regions, we have established credit facilities to fund some of the local working capital requirements in these markets. Four of our wholly owned subsidiaries have short term credit facilities that allow us to borrow up to approximately $12 million in China, which mature on June 30, 2015. As of December 31, 2014, we had $2.3 million borrowed under these credit facilities. Our wholly-owned subsidiary in India has a short term credit facility that allows us to borrow up to approximately $2.3 million. As of December 31, 2014, we had no outstanding amount borrowed under this credit facility.
Our credit agreement at December 31, 2014, our new credit agreement and our notes include restrictive covenants that, if not met, could lead to a renegotiation of our credit lines, requirement to repay our borrowings and/or a significant increase in our cost of financing. At December 31, 2014, we were in compliance with all financial covenants of our contractual obligations as shown in the following table:
|
Debt Instrument / Covenant |
Measurement |
Result as of December 31, 2014 | ||||
|
Revolving credit facility |
||||||
| Interest coverage ratio (1) |
Not less than 3.5 |
14.9 | ||||
| Leverage ratio (2) |
Not greater than 3.5 |
1.6 | ||||
|
6.66% senior unsecured notes |
||||||
| Interest coverage ratio (3) |
Not less than 2.75 |
12.8 | ||||
| Leverage ratio (4) |
Not greater than 3.25 |
2.0 | ||||
|
(1) |
Interest coverage ratio is a comparison of the trailing twelve months Consolidated EBITDA, defined as net income plus interest expense plus income tax expense plus depreciation and amortization plus non-cash expenses, extraordinary, unusual and non-recurring items excluding certain 2014 payments of extraordinary, unusual and non-recurring items as agreed with the lenders, to trailing twelve months interest expense. |
|
(2) |
Leverage ratio is a comparison of the total indebtedness, defined as total debt plus guarantees of indebtedness of others plus obligations under financial letters of credit issued against the credit facility exceeding $15 million, to the trailing twelve months Consolidated EBITDA, as defined above. Upon extinguishment of the 6.6% senior unsecured notes the maximum leverage ratio becomes not greater than 3.5 on the revolving credit facility. |
|
(3) |
Interest coverage ratio is a comparison of the trailing twelve months Consolidated EBITDA, defined as net income plus interest expense plus income tax expense plus depreciation and amortization plus non-cash expenses and extraordinary, unusual and non-recurring items, to trailing twelve months interest expense. |
|
(4) |
Leverage ratio is a comparison of the total indebtedness, defined as total debt plus guarantees of indebtedness of others plus obligations under financial letters of credit issued against the credit facility, to the trailing twelve months Consolidated EBITDA, as defined above. |
We expect to remain in compliance with all restrictive covenants in the foreseeable future. However, there can be no assurance that continued or increased volatility in global economic conditions will not impair our ability to meet our restrictive covenants, or that volatility in the capital and credit markets will not impair our ability to access these markets on terms acceptable to us or at all.
Critical Accounting Estimates
We prepare our consolidated financial statements in conformity with U.S. generally accepted accounting principles. As such, we are required to make certain estimates, judgments and assumptions about matters that are inherently uncertain. On an ongoing basis, our management re-evaluates these estimates, judgments and assumptions for reasonableness because of the critical impact that these factors have on the reported amounts of assets and liabilities at the dates of the financial statements and the reported amounts of revenue and expenses during the periods presented. Management has discussed the development and selection of these critical accounting estimates with the Audit Committee of our Board of Directors and the Audit Committee has reviewed this disclosure. We believe that the following are the critical accounting estimates used in preparing our financial statements.
Inventory Valuation
Inventory is recorded at the lower of cost or net realizable value. In order to determine net realizable value, we evaluate each component of inventory on a regular basis to determine whether it is excess or obsolete. We record the estimated decline in the carrying value of excess or obsolete inventory as a reduction of inventory and as an expense included in cost of sales in the period in which it is identified. Our estimate of excess and obsolete inventory is a critical accounting estimate because it is highly susceptible to change from period to period. In addition, it requires management to make judgments about the future demand for inventory.
In order to quantify excess or obsolete inventory, we begin by preparing a candidate listing of the components of inventory that have not demonstrated usage within the most recent two-year period. This list is then reviewed with sales, production and materials management personnel to determine whether this list of potential excess or obsolete inventory items is accurate. Management considers as part of this evaluation whether there has been a change in the market for finished goods, whether there will be future demand for on-hand inventory items and whether there are components of inventory that incorporate obsolete technology. Then management assigns a reserve requirement, which is determined based on its assessment of cost recoverability, to the items on the candidate listing. As a result, our estimate of excess or obsolete inventory is sensitive to changes in assumptions about future demand for the inventory. Since the determination of the reserve requirement is based on management judgment rather than a formulaic approach, we are unable to quantify with a high level of precision the effect that a change in demand assumptions would have on management’s assessment of the excess and obsolete inventory reserve, although lower demand assumptions would generally result in an increase in excess and obsolete inventory.
Goodwill
Goodwill represents the excess of the cost of an acquired business over the amounts assigned to the identifiable net assets. Goodwill is not amortized but is tested for impairment at a reporting unit level on an annual basis, or whenever an event occurs or circumstances change that would more likely than not reduce the fair value of a reporting unit below its carrying amount. We are required to make certain subjective and complex judgments in assessing whether an event that could indicate an impairment of goodwill has occurred, and must make assumptions and estimates to determine the fair value of our reporting units. We may assess qualitative factors to make this determination, or bypass such a qualitative assessment and proceed directly to testing goodwill for impairment using a two-step process. Qualitative factors we may consider include, but are not limited to, macroeconomic conditions, industry conditions, the competitive environment, changes in the market for our products and services, regulatory and political developments and entity specific factors such as strategies and financial performance. If, after completing such assessment, it is determined to be more likely than not that the fair value of a reporting unit is less than its carrying value, we proceed to a two-step impairment test, whereby the first step is comparing the fair value of a reporting unit with its carrying amount, including goodwill. If the fair value of a reporting unit exceeds its carrying amount, goodwill of the reporting unit is considered not impaired and the second step of the test is not performed. The second step of the impairment test is performed when the carrying amount of the reporting unit exceeds the fair value, in this case, the implied fair value of the reporting unit goodwill is compared with the carrying amount of that goodwill. If the carrying amount of the reporting unit goodwill exceeds the implied fair value of that goodwill, an impairment loss is recognized in an amount equal to the excess.
We completed our annual goodwill impairment test as of October 31, 2014 using a qualitative assessment approach. As a result of the assessment of the qualitative factors, we have determined it is not necessary to perform the quantitative goodwill impairment test on any of our reporting units.
Self-Insurance Reserves
We purchase third-party insurance for workers’ compensation, automobile, product and general liability claims that exceed a certain level. We are responsible for the payment of claims below the limits of the applicable insurance coverage as well as claims under our self-insured healthcare plans. The obligations associated with the incurred losses are determined using actuarial estimates. These estimates are based on historical information along with certain assumptions about future events. Changes in assumptions for medical costs, environmental hazards and legal actions, as well as changes in actual claim experience, could cause these estimates to change which could potentially be material to our results of operations and financial condition.
Income Taxes
In determining our current income tax provision, we assess temporary differences resulting from differing treatments of items for tax and accounting purposes. These differences result in deferred tax assets and liabilities, which are recorded in our consolidated balance sheets. When we maintain deferred tax assets, we must assess the likelihood that these assets will be recovered through adjustments to future taxable income. To the extent we believe recovery is not likely, we establish a valuation allowance. We record an allowance reducing the asset to a value we believe will be more likely than not recoverable based on our expectation of future taxable income. We believe the accounting estimate related to the valuation allowance is a critical accounting estimate because it is highly susceptible to change from period to period as it requires management to make assumptions about our future income over the lives of the deferred tax assets, and the impact of increasing or decreasing the valuation allowance is potentially material to our results of operations.
Forecasting future income requires us to use a significant amount of judgment. In estimating future income, we use our internal operating budgets and long-range planning projections. We develop our budgets and long-range projections based on recent results, trends, economic and industry forecasts influencing our segments’ performance, our backlog, planned timing of new product launches, and customer sales commitments. Significant changes in the expected realization of the net deferred tax assets would require that we adjust the valuation allowance, resulting in a change to net income.
Defined Benefit Pension and Other Postretirement Plans
The measurement of pension and other postretirement plans’ costs require the use of assumptions for discount rates, investment returns, employee turnover rates, retirement rates, mortality rates and other factors. The actuarial assumptions used in our pension and postretirement benefit reporting are reviewed annually and compared with external benchmarks to ensure that they appropriately account for our future pension and postretirement benefit obligations. While we believe that the assumptions used are appropriate, differences between assumed and actual experience may affect our operating results.
Our accrued pension and other postretirement benefits liability reflects the funded status of our worldwide plans, or the projected benefit obligation net of plan assets. The projected benefit obligation is sensitive to changes in our estimate of the discount rate. The discount rate used in calculating the projected benefit obligation for the U.S. pension plan, which represents 87% of all pension plan obligations, was 4.3% in 2014, 5.1% in 2013 and 4.3% in 2012. A change of 50 basis points in the discount rate used in our calculation would impact our projected benefit obligation by approximately $23 million.
Our pension expense is sensitive to changes in our estimate of the expected rate of return on plan assets. The expected return on assets used in calculating the pension expense for the U.S. pension plan, which represents 96% of all pension plan assets, was 8.0% for 2014, 8.0% for 2013 and 8.0% for 2012. For 2015, the rate is expected to be 7.25%. A change of 50 basis points in the expected return on assets assumption would impact pension expense by approximately $1 million (pre-tax).
See Note 8 of the notes to consolidated financial statements in Item 8 for additional discussion of our assumptions and the amounts reported in the consolidated financial statements.
Recently issued accounting standards not yet adopted
In May 2014, the Financial Accounting Standards Board (FASB) issued ASU No. 2014-09, Revenue from Contracts with Customers (Topic 606). The new standard will replace most existing revenue recognition guidance in U.S. GAAP. The core principle of the ASU is that an entity should recognize revenue for the transfer of good or services equal to the amount it expects to receive for those goods or services. The ASU requires additional disclosure about the nature, amount, timing and uncertainty of revenue and cash flows arising from customer contracts, including significant judgments and estimates, and changes in those estimates. The new standard becomes effective for us as of January 1, 2017, and allows for both retrospective and modified-retrospective methods of adoption. We are currently evaluating the effect, if any, that the updated standard will have on our consolidated financial statements and related disclosures.
ITEM 7A. QUANTITATIVE AND QUALITATIVE DISCLOSURES ABOUT MARKET RISK
We are subject to financial market risks, including fluctuations in foreign currency exchange rates and interest rates. In order to manage and mitigate our exposure to these risks, we may use derivative financial instruments in accordance with established policies and procedures. We do not use derivative financial instruments where the objective is to generate profits solely from trading activities. At December 31, 2014 and 2013, our derivative holdings consisted of foreign currency forward contracts and foreign currency instruments embedded in purchase and sale contracts.
These forward-looking disclosures address potential impacts from market risks only as they affect our financial instruments. They do not include other potential effects which could impact our business as a result of changes in foreign currency exchange rates, interest rates, commodity prices or equity prices.
Foreign Currency Exchange Rate Risk
During 2014, our foreign subsidiaries generated approximately 37% of our revenue, driven by our operations in Sweden which generated approximately 13% of our revenue. Financial statements of our foreign subsidiaries for which the U.S. dollar is not the functional currency are translated into U.S. dollars. As a result, we are exposed to foreign currency translation risk.
When we sell or purchase products or services, transactions are frequently denominated in currencies other than an operation’s functional currency. When foreign currency exposures exist, we may enter into foreign exchange forward instruments with third parties to economically hedge foreign currency exposures. Our hedging policy reduces, but does not entirely eliminate, the impact of foreign currency exchange rate movements. We do not apply hedge accounting for our foreign currency forward instruments.
We economically hedge our recognized foreign currency assets and liabilities to reduce the risk that our earnings and cash flows will be adversely affected by fluctuations in foreign currency exchange rates. We expect any gains or losses in the hedging portfolio to be substantially offset by a corresponding gain or loss in the underlying exposures being hedged. We also economically hedge firmly committed anticipated transactions in the normal course of business. As these are not offset by an underlying balance sheet position being hedged, our earnings can be significantly impacted on a periodic basis by the change in unrealized value of these hedges.
We use a sensitivity analysis to measure the impact of an immediate 10% adverse movement in the foreign currency exchange rates. This calculation assumes that each exchange rate would change in the same direction relative to the U.S. dollar and all other variables are held constant. We expect that changes in the fair value of derivative instruments will offset the changes in fair value of the underlying assets and liabilities on the balance sheet. A 10% adverse movement in the foreign currency exchange rates would reduce the value of our derivative instruments by approximately $1.1 million (pre-tax) as of December 31, 2014. This amount would be reflected in our net income but would be significantly offset by the changes in the fair value of the underlying hedged assets and liabilities.
Interest Rate Risk
Our debt instruments subject us to market risk associated with movements in interest rates. We had $94.3 million in variable rate debt outstanding at December 31, 2014. A hypothetical 10% adverse movement in the interest rate would not significantly impact the annual interest expense.
ITEM 8. FINANCIAL STATEMENTS AND SUPPLEMENTARY DATA
Report of Independent Registered Public Accounting Firm
The Board of Directors and Stockholders
John Bean Technologies Corporation:
We have audited the accompanying consolidated balance sheets of John Bean Technologies Corporation and subsidiaries (the Company) as of December 31, 2014 and 2013, and the related consolidated statements of income, comprehensive income (loss), changes in stockholders’ equity, and cash flows for each of the years in the three-year period ended December 31, 2014. In connection with our audits of the consolidated financial statements, we have also audited the financial statement schedule II. These consolidated financial statements and financial statement schedule are the responsibility of the Company’s management. Our responsibility is to express an opinion on these consolidated financial statements and financial statement schedule based on our audits.
We conducted our audits in accordance with the standards of the Public Company Accounting Oversight Board (United States). Those standards require that we plan and perform the audit to obtain reasonable assurance about whether the financial statements are free of material misstatement. An audit includes examining, on a test basis, evidence supporting the amounts and disclosures in the financial statements. An audit also includes assessing the accounting principles used and significant estimates made by management, as well as evaluating the overall financial statement presentation. We believe that our audits provide a reasonable basis for our opinion.
In our opinion, the consolidated financial statements referred to above present fairly, in all material respects, the financial position of John Bean Technologies Corporation and subsidiaries as of December 31, 2014 and 2013, and the results of their operations and their cash flows for each of the years in the three-year period ended December 31, 2014, in conformity with U.S. generally accepted accounting principles. Also in our opinion, the related financial statement schedule, when considered in relation to the basic consolidated financial statements taken as a whole, presents fairly, in all material respects, the information set forth therein.
We also have audited, in accordance with the standards of the Public Company Accounting Oversight Board (United States), John Bean Technologies Corporation’s internal control over financial reporting as of December 31, 2014, based on criteria established in Internal Control – Integrated Framework (1992) issued by the Committee of Sponsoring Organizations of the Treadway Commission (COSO), and our report dated March 2, 2015 expressed an unqualified opinion on the effectiveness of the Company’s internal control over financial reporting. Our report refers to the exclusion of certain acquired businesses from the scope of our audit of internal control over financial reporting as of December 31, 2014.
/s/ KPMG LLP
Chicago, Illinois
March 2, 2015
JOHN BEAN TECHNOLOGIES CORPORATION
CONSOLIDATED STATEMENTS OF INCOME
|
Year Ended December 31, |
||||||||||||
|
(In millions, except per share data) |
2014 |
2013 |
2012 |
|||||||||
|
Revenue: |
||||||||||||
|
Product revenue |
$ | 857.5 | $ | 811.8 | $ | 793.9 | ||||||
|
Service revenue |
126.7 | 122.4 | 123.4 | |||||||||
|
Total revenue |
984.2 | 934.2 | 917.3 | |||||||||
|
Operating expenses: |
||||||||||||
|
Cost of products |
629.7 | 608.7 | 591.8 | |||||||||
|
Cost of services |
93.8 | 92.6 | 94.7 | |||||||||
|
Selling, general and administrative expense |
179.3 | 164.3 | 156.6 | |||||||||
|
Research and development expense |
14.6 | 14.0 | 14.3 | |||||||||
|
Restructuring expense |
14.5 | 1.6 | 0.1 | |||||||||
|
Other (income) expense, net |
1.6 | (0.2 | ) | (1.1 | ) | |||||||
|
Operating income: |
50.7 | 53.2 | 60.9 | |||||||||
|
Interest income |
1.6 | 2.2 | 0.5 | |||||||||
|
Interest expense |
(7.6 | ) | (7.6 | ) | (7.4 | ) | ||||||
|
Income from continuing operations before income taxes |
44.7 | 47.8 | 54.0 | |||||||||
|
Provision for income taxes |
13.9 | 13.8 | 16.9 | |||||||||
|
Income from continuing operations |
30.8 | 34.0 | 37.1 | |||||||||
|
Loss from discontinued operations, net of income taxes |
- | (0.9 | ) | (0.9 | ) | |||||||
|
Net income |
$ | 30.8 | $ | 33.1 | $ | 36.2 | ||||||
|
Basic earnings per share: |
||||||||||||
|
Income from continuing operations |
$ | 1.04 | $ | 1.16 | $ | 1.27 | ||||||
|
Loss from discontinued operations |
- | (0.03 | ) | (0.03 | ) | |||||||
|
Net income |
$ | 1.04 | $ | 1.13 | $ | 1.24 | ||||||
|
Diluted earnings per share: |
||||||||||||
|
Income from continuing operations |
$ | 1.03 | $ | 1.15 | $ | 1.26 | ||||||
|
Loss from discontinued operations |
- | (0.04 | ) | (0.03 | ) | |||||||
|
Net income |
$ | 1.03 | $ | 1.11 | $ | 1.23 | ||||||
|
Dividends declared per share |
$ | 0.36 | $ | 0.34 | $ | 0.28 | ||||||
|
Weighted average shares outstanding: |
||||||||||||
|
Basic |
29.5 | 29.2 | 29.1 | |||||||||
|
Diluted |
29.9 | 29.7 | 29.5 | |||||||||
CONSOLIDATED STATEMENTS OF COMPREHENSIVE INCOME (LOSS)
|
Year Ended December 31, |
||||||||||||
|
(In millions) |
2014 |
2013 |
2012 |
|||||||||
|
Net income |
$ | 30.8 | $ | 33.1 | $ | 36.2 | ||||||
|
Other comprehensive income (loss) |
||||||||||||
|
Foreign currency translation adjustments |
(20.6 | ) | (4.5 | ) | 0.7 | |||||||
|
Pension and other postretirement benefits adjustments, net of tax |
(36.4 | ) | 25.4 | (5.2 | ) | |||||||
|
Derivatives designated as hedges, net of tax |
- | - | 0.2 | |||||||||
|
Other comprehensive income (loss) |
(57.0 | ) | 20.9 | (4.3 | ) | |||||||
|
Comprehensive income (loss) |
$ | (26.2 | ) | $ | 54.0 | $ | 31.9 | |||||
The accompanying notes are an integral part of the consolidated financial statements.
JOHN BEAN TECHNOLOGIES CORPORATION
CONSOLIDATED BALANCE SHEETS
|
December 31, |
December 31, |
|||||||
|
(In millions, except per share and number of shares) |
2014 |
2013 |
||||||
|
Assets |
||||||||
|
Current Assets: |
||||||||
|
Cash and cash equivalents |
$ | 33.3 | $ | 29.4 | ||||
|
Trade receivables, net of allowances of $3.0 and $3.7, respectively |
176.2 | 186.4 | ||||||
|
Inventories |
111.8 | 117.6 | ||||||
|
Prepaid expenses |
7.3 | 6.5 | ||||||
|
Deferred income taxes |
23.2 | 20.6 | ||||||
|
Assets held for sale |
2.9 | 3.0 | ||||||
|
Other current assets |
33.2 | 33.1 | ||||||
|
Total current assets |
387.9 | 396.6 | ||||||
|
Investments |
11.0 | 12.2 | ||||||
|
Property, plant and equipment, net of accumulated depreciation of $232.7 and $241.9, respectively |
147.6 | 132.7 | ||||||
|
Goodwill |
69.2 | 30.8 | ||||||
|
Intangible assets, net |
60.0 | 21.4 | ||||||
|
Deferred income taxes |
12.5 | 9.9 | ||||||
|
Other assets |
9.6 | 17.6 | ||||||
|
Total Assets |
$ | 697.8 | $ | 621.2 | ||||
|
Liabilities and Stockholders' Equity |
||||||||
|
Current Liabilities: |
||||||||
|
Short-term debt and current portion of long-term debt |
$ | 4.2 | $ | 6.3 | ||||
|
Accounts payable, trade and other |
89.5 | 88.1 | ||||||
|
Advance and progress payments |
86.2 | 88.3 | ||||||
|
Accrued payroll |
34.4 | 35.5 | ||||||
|
Deferred income taxes |
4.1 | 5.1 | ||||||
|
Other current liabilities |
68.0 | 54.3 | ||||||
|
Total current liabilities |
286.4 | 277.6 | ||||||
|
Long-term debt, less current portion |
173.8 | 94.1 | ||||||
|
Accrued pension and other postretirement benefits, less current portion |
93.1 | 52.5 | ||||||
|
Deferred income taxes |
1.3 | 10.9 | ||||||
|
Other liabilities |
24.0 | 31.7 | ||||||
|
Commitments and contingencies (Note 15) |
||||||||
|
Stockholders' Equity: |
||||||||
|
Preferred stock, $0.01 par value; 20,000,000 shares authorized; no shares issued in 2014 or 2013 |
- | - | ||||||
|
Common stock, $0.01 par value; 120,000,000 shares authorized; 2014: 29,138,162 issued and 29,091,502 outstanding; 2013: 28,979,080 issued and outstanding |
0.3 | 0.3 | ||||||
|
Common stock held in treasury, at cost; 2014: 46,660 shares |
(1.5 | ) | - | |||||
|
Additional paid-in capital |
71.1 | 67.7 | ||||||
|
Retained earnings |
166.4 | 146.5 | ||||||
|
Accumulated other comprehensive loss |
(117.1 | ) | (60.1 | ) | ||||
|
Total Stockholders' Equity |
119.2 | 154.4 | ||||||
|
Total Liabilities and Stockholders' Equity |
$ | 697.8 | $ | 621.2 | ||||
The accompanying notes are an integral part of the consolidated financial statements.
JOHN BEAN TECHNOLOGIES CORPORATION
CONSOLIDATED STATEMENTS OF CASH FLOWS
|
Year Ended December 31, |
||||||||||||
|
(In millions) |
2014 |
2013 |
2012 |
|||||||||
|
Cash Flows From Operating Activities: |
||||||||||||
|
Net income |
$ | 30.8 | $ | 33.1 | $ | 36.2 | ||||||
|
Loss from discontinued operations, net of income taxes |
- | 0.9 | 0.9 | |||||||||
|
Income from continuing operations |
30.8 | 34.0 | 37.1 | |||||||||
|
Adjustments to reconcile net income from continuing operations to cash provided by operating activities of continuing operations: |
||||||||||||
|
Depreciation |
19.1 |
20.6 |
20.3 |
|||||||||
|
Amortization |
6.2 | 4.4 | 3.3 | |||||||||
|
Stock-based compensation |
7.3 | 6.9 | 7.5 | |||||||||
|
Pension and other postretirement benefits expense |
2.7 | 1.3 | 0.4 | |||||||||
|
Deferred income taxes |
4.9 | 5.7 | 6.7 | |||||||||
|
Other |
(0.9 | ) | (3.5 | ) | 0.8 | |||||||
|
Changes in operating assets and liabilities, net of effects of acquisitions: |
||||||||||||
|
Trade receivables, net |
9.8 | 0.8 | 2.3 | |||||||||
|
Inventories |
7.7 | (9.6 | ) | 14.6 | ||||||||
|
Accounts payable, trade and other |
2.1 | (1.9 | ) | 5.2 | ||||||||
|
Advance payments and progress billings |
1.4 | 14.1 | 15.8 | |||||||||
|
Accrued pension and other postretirement benefits, net |
(19.9 | ) | (10.7 | ) | (14.7 | ) | ||||||
|
Other assets and liabilities, net |
6.8 | 1.0 | (12.7 | ) | ||||||||
|
Cash provided by continuing operating activities |
78.0 | 63.1 | 86.6 | |||||||||
|
Net cash required by discontinued operating activities |
(0.3 | ) | (1.1 | ) | (0.6 | ) | ||||||
|
Cash provided by operating activities |
77.7 | 62.0 | 86.0 | |||||||||
|
Cash Flows From Investing Activities: |
||||||||||||
|
Acquisitions, net of cash acquired |
(91.3 | ) | - | (10.0 | ) | |||||||
|
Capital expenditures |
(36.7 | ) | (29.2 | ) | (24.7 | ) | ||||||
|
Proceeds from disposal of assets |
1.4 | 1.1 | 2.1 | |||||||||
|
Cash required by investing activities |
(126.6 | ) | (28.1 | ) | (32.6 | ) | ||||||
|
Cash Flows From Financing Activities: |
||||||||||||
|
Net increase (decrease) in short-term debt |
1.5 | (0.3 | ) | (0.9 | ) | |||||||
|
Net proceeds (payments) on credit facilities |
77.5 | (97.0 | ) | 52.7 | ||||||||
|
Issuance of long-term debt |
4.5 | 8.0 | 0.8 | |||||||||
|
Payments of long-term debt |
(5.6 | ) | (0.2 | ) | (1.4 | ) | ||||||
|
Excess tax benefits |
1.0 | 0.5 | 0.7 | |||||||||
|
Tax witholdings on stock-based compensation awards |
(3.6 | ) | (2.3 | ) | (2.3 | ) | ||||||
|
Purchase of stock held in treasury |
(2.8 | ) | (0.2 | ) | (3.6 | ) | ||||||
|
Dividends paid |
(10.7 | ) | (10.1 | ) | (8.5 | ) | ||||||
|
Other |
0.1 | - | (1.4 | ) | ||||||||
|
Cash provided (required) by financing activities |
61.9 | (101.6 | ) | 36.1 | ||||||||
|
Effect of foreign exchange rate changes on cash and cash equivalents |
(9.1 | ) | (1.9 | ) | 0.5 | |||||||
|
Increase (decrease) in cash and cash equivalents |
3.9 | (69.6 | ) | 90.0 | ||||||||
|
Cash and cash equivalents, beginning of period |
29.4 | 99.0 | 9.0 | |||||||||
|
Cash and cash equivalents, end of period |
$ | 33.3 | $ | 29.4 | $ | 99.0 | ||||||
|
Supplemental Cash Flow Information: |
||||||||||||
|
Interest paid |
$ | 7.7 | $ | 6.7 | $ | 6.9 | ||||||
|
Income taxes paid |
8.2 | 7.7 | 9.2 | |||||||||
The accompanying notes are an integral part of the consolidated financial statements.
JOHN BEAN TECHNOLOGIES CORPORATION
CONSOLIDATED STATEMENTS OF CHANGES IN STOCKHOLDERS’ EQUITY
|
Accumulated |
||||||||||||||||||||||||
|
Common |
Other |
|||||||||||||||||||||||
|
Stock |
Additional |
Comprehensive |
||||||||||||||||||||||
|
Common |
Held in |
Paid-In |
Retained |
Income |
Total |
|||||||||||||||||||
|
(In millions) |
Stock |
Treasury |
Capital |
Earnings |
(Loss) |
Equity |
||||||||||||||||||
|
December 31, 2011 |
$ | 0.3 | $ | (0.3 | ) | $ | 60.7 | $ | 95.8 | $ | (76.7 | ) | $ | 79.8 | ||||||||||
|
Net income |
- | - | - | 36.2 | - | 36.2 | ||||||||||||||||||
|
Issuance of common stock |
- | 0.5 | (0.4 | ) | - | - | 0.1 | |||||||||||||||||
|
Taxes withheld on issuance of stock-based awards |
- | - | (2.3 | ) | - | - | (2.3 | ) | ||||||||||||||||
|
Excess tax benefits on stock-based payment arrangements |
- | - | 0.7 | - | - | 0.7 | ||||||||||||||||||
|
Dividends on stock-based payment arrangements |
- | - | - | (0.4 | ) | - | (0.4 | ) | ||||||||||||||||
|
Common stock cash dividends |
- | - | - | (8.1 | ) | - | (8.1 | ) | ||||||||||||||||
|
Share repurchases |
- | (3.6 | ) | - | - | - | (3.6 | ) | ||||||||||||||||
|
Foreign currency translation adjustments |
- | - | - | - | 0.7 | 0.7 | ||||||||||||||||||
|
Derivatives designated as hedges, net of income taxes of $0.0 |
- | - | - | - | 0.2 | 0.2 | ||||||||||||||||||
|
Pension and other postretirement liability adjustments, net of income taxes of $3.0 |
- | - | - | - | (5.2 | ) | (5.2 | ) | ||||||||||||||||
|
Stock-based compensation expense |
- | - | 7.5 | - | - | 7.5 | ||||||||||||||||||
|
December 31, 2012 |
$ | 0.3 | $ | (3.4 | ) | $ | 66.2 | $ | 123.5 | $ | (81.0 | ) | $ | 105.6 | ||||||||||
|
Net income |
- | - | - | 33.1 | - | 33.1 | ||||||||||||||||||
|
Issuance of common stock |
- | 3.6 | (3.6 | ) | - | - | - | |||||||||||||||||
|
Taxes withheld on issuance of stock-based awards |
- | - | (2.3 | ) | - | - | (2.3 | ) | ||||||||||||||||
|
Excess tax benefits on stock-based payment arrangements |
- | - | 0.5 | - | - | 0.5 | ||||||||||||||||||
|
Dividends on stock-based payment arrangements |
- | - | - | (0.3 | ) | - | (0.3 | ) | ||||||||||||||||
|
Common stock cash dividends |
- | - | - | (9.8 | ) | - | (9.8 | ) | ||||||||||||||||
|
Share repurchases |
- | (0.2 | ) | - | - | - | (0.2 | ) | ||||||||||||||||
|
Foreign currency translation adjustments |
- | - | - | - | (4.5 | ) | (4.5 | ) | ||||||||||||||||
|
Pension and other postretirement liability adjustments, net of income taxes of $15.5 |
- | - | - | - | 25.4 | 25.4 | ||||||||||||||||||
|
Stock-based compensation expense |
- | - | 6.9 | - | - | 6.9 | ||||||||||||||||||
|
December 31, 2013 |
$ | 0.3 | $ | 0.0 | $ | 67.7 | $ | 146.5 | $ | (60.1 | ) | $ | 154.4 | |||||||||||
|
Net income |
- | - | - | 30.8 | - | 30.8 | ||||||||||||||||||
|
Issuance of common stock |
- | 1.3 | (1.3 | ) | - | - | - | |||||||||||||||||
|
Taxes withheld on issuance of stock-based awards |
- | - | (3.6 | ) | - | - | (3.6 | ) | ||||||||||||||||
|
Excess tax benefits on stock-based payment arrangements |
- | - | 1.0 | - | - | 1.0 | ||||||||||||||||||
|
Dividends on stock-based payment arrangements |
- | - | - | (0.4 | ) | - | (0.4 | ) | ||||||||||||||||
|
Common stock cash dividends |
- | - | - | (10.5 | ) | - | (10.5 | ) | ||||||||||||||||
|
Share repurchases |
- | (2.8 | ) | - | - | - | (2.8 | ) | ||||||||||||||||
|
Foreign currency translation adjustments |
- | - | - | - | (20.6 | ) | (20.6 | ) | ||||||||||||||||
|
Pension and other postretirement liability adjustments, net of income taxes of $21.9 |
- | - | - | - | (36.4 | ) | (36.4 | ) | ||||||||||||||||
|
Stock-based compensation expense |
- | - | 7.3 | - | - | 7.3 | ||||||||||||||||||
|
December 31, 2014 |
$ | 0.3 | $ | (1.5 | ) | $ | 71.1 | $ | 166.4 | $ | (117.1 | ) | $ | 119.2 | ||||||||||
The accompanying notes are an integral part of the consolidated financial statements.
JOHN BEAN TECHNOLOGIES CORPORATION
NOTES TO CONSOLIDATED FINANCIAL STATEMENTS
NOTE 1. SUMMARY OF SIGNIFICANT ACCOUNTING POLICIES
Consolidation
The consolidated financial statements include the accounts of John Bean Technologies Corporation (JBT, we, or the Company) and all wholly-owned subsidiaries. All intercompany investments, accounts, and transactions have been eliminated.
Use of estimates
Preparation of financial statements that follow accounting principles generally accepted in the U.S. (U.S. GAAP) requires management to make estimates and judgments that affect the reported amounts of assets and liabilities and the disclosure of contingent assets and liabilities at the date of the financial statements, and the reported amounts of revenues and expenses during the reporting period. Actual results could differ from these estimates.
Cash and cash equivalents
Cash and cash equivalents consist of cash and highly liquid investments with original maturities of three months or less.
Inventories
Inventories are stated at the lower of cost or net realizable value, which includes an estimate for excess and obsolete inventories. Inventory costs include those costs directly attributable to products, including all manufacturing overhead but excluding costs to distribute. Cost is determined on the last-in, first-out (“LIFO”) basis for all domestic inventories, except certain inventories relating to construction-type contracts, which are stated at the actual production cost incurred to date, reduced by the portion of these costs identified with revenue recognized. The first-in, first-out (“FIFO”) method is used to determine the cost for all other inventories.
Property, plant, and equipment
Property, plant, and equipment are recorded at cost. Depreciation for financial reporting purposes is provided principally on the straight-line basis over the estimated useful lives of the assets (land improvements—20 to 35 years; buildings—20 to 50 years; and machinery and equipment—3 to 20 years). Gains and losses are reflected in other income, net on the consolidated statements of income upon the sale or retirement of assets. Expenditures that extend the useful lives of property, plant, and equipment are capitalized and depreciated over the estimated new remaining life of the asset.
Capitalized software costs
Other assets include the capitalized cost of internal use software (including Internet web sites). The assets are stated at cost less accumulated amortization and totaled $4.1 million and $5.2 million at December 31, 2014 and 2013, respectively. These software costs include the amount paid for purchases of software and internal and external costs incurred during the application development stage of software projects. These costs are amortized on a straight-line basis over the estimated useful lives of the assets. For internal use software, the useful lives range from three to ten years. For Internet web site costs, the estimated useful lives do not exceed three years.
Goodwill
We test goodwill for impairment annually during the fourth quarter and whenever events occur or changes in circumstances indicate that impairment may have occurred. Impairment testing is performed for each of our reporting units by first assessing qualitative factors to see if further testing of goodwill is required. If we conclude that it is more likely than not that a reporting unit’s fair value is less than its carrying amount based on our qualitative assessment, then a quantitative test is required. We may also choose to bypass the qualitative assessment and perform the quantitative test. In performing the quantitative test, we determine the fair value of a reporting unit using the “income approach” valuation method. We use a discounted cash flow model in which cash flows anticipated over several periods, plus a terminal value at the end of that time horizon, are discounted to their present value using an appropriate cost of capital rate. Judgment is required in developing the assumptions for the discounted cash flow model. These assumptions include revenue growth rates, profit margin percentages, discount rates, perpetuity growth rates, future capital expenditures, and working capital requirements, among others. If the estimated fair value of a reporting unit exceeds its carrying value, we consider that goodwill is not impaired. If the carrying value exceeds estimated fair value, there is an indication of potential impairment, and we calculate an implied fair value of goodwill. The implied fair value is calculated as the difference between the fair value of the reporting unit and the fair value of the individual assets and liabilities of the reporting unit, excluding goodwill. An impairment charge is recorded for any excess of the carrying value over the implied fair value.
Based on our 2014 annual assessment, we determined that none of our goodwill was impaired.
Intangible assets
Our acquired intangible assets are being amortized on a straight-line basis over their estimated useful lives, which generally range from less than 1 year to 15 years. None of our acquired intangible assets have indefinite lives.
Impairment of long-lived assets
Our long-lived assets are reviewed for impairment whenever events or changes in circumstances indicate that the carrying amount of the long-lived asset may not be recoverable. The carrying amount of a long-lived asset is not recoverable if it exceeds the sum of the undiscounted cash flows expected to result from the use and eventual disposition of the asset. If it is determined that an impairment loss has occurred, the loss is measured as the amount by which the carrying amount of the long-lived asset exceeds its fair value.
Revenue recognition
We recognize product revenue when we have an agreement with the customer, the product has been delivered to the customer, the sales price is fixed or determinable and collectability is assured.
Each customer arrangement is evaluated to determine the presence of multiple deliverables. For multiple-element revenue arrangements, such as the sale of equipment with a service agreement, we allocate the contract value to the various elements based on relative selling price for each element and recognize revenue consistent with the nature of each deliverable.
Our standard agreements generally do not include customer acceptance provisions. However, if there is a customer acceptance provision, the associated revenue is deferred until we have satisfied the acceptance provision.
Certain of our product sales are generated from construction-type contracts and revenue is recognized under the percentage of completion method. Under this method, revenue is recognized as work progresses on each contract. However, revenue recognition does not begin until a substantial portion of the labor hours are incurred to ensure that revenue is not recognized based solely upon materials procurement. We primarily measure progress toward completion by the units of completion method. Any expected losses are charged to earnings, in total, in the period the losses are identified.
Progress billings generally are issued upon the completion of certain phases of the work as stipulated in the contract. Revenue in excess of progress billings on contracts amounted to $57.5 million and $56.8 million at December 31, 2014 and 2013, respectively. These unbilled receivables are reported in trade receivables on the consolidated balance sheets. Progress billings and cash collections in excess of revenue recognized on a contract are classified as advance and progress payments on the consolidated balance sheets. All unbilled trade payables are accrued in other current liabilities when revenue is recognized. Unbilled trade payables were $3.4 million and $2.7 million at December 31, 2014 and 2013, respectively.
Service revenue is recognized either when performance is complete or proportionately over the period of the underlying contract, depending on the terms of the arrangement.
Some of our operating lease revenue is earned from full-service leases for which we are paid annual fixed rates plus, in some cases, an additional amount based on production volumes. Revenue from production volumes is recognized when determinable and collectible.
We provide an allowance for doubtful accounts on trade receivables equal to the estimated uncollectible amounts. This estimate is based on historical collection experience and a specific review of each customer’s trade receivable balance.
Income taxes
Income taxes are provided on income reported for financial statement purposes, adjusted for permanent differences between financial statement reporting and income tax regulations. Deferred tax assets and liabilities are measured using enacted tax rates, and reflect the expected future tax consequences of temporary differences between the carrying amounts and the tax bases of assets and liabilities. A valuation allowance is established whenever management believes that it is more likely than not that deferred tax assets may not be realizable.
A liability for uncertain tax positions is recorded whenever management believes it is not likely that the position will be sustained on examination based solely on its technical merits. Interest and penalties related to underpayment of income taxes are classified as income tax expense.
Income taxes are not provided on undistributed earnings of foreign subsidiaries or affiliates when it is management’s intention that such earnings will remain invested in those companies. Taxes are provided on such earnings in the year in which the decision is made to repatriate the earnings.
Stock-based employee compensation
We measure compensation cost on restricted stock awards based on the market price of our common stock at the grant date and the number of shares awarded. The compensation cost for each award is recognized ratably over the lesser of the stated vesting period or the period until the employee becomes retirement eligible, after taking into account estimated forfeitures.
Foreign currency
Financial statements of operations for which the U.S. dollar is not the functional currency are translated to the U.S. dollar prior to consolidation. Assets and liabilities are translated at the exchange rate in effect at the balance sheet date, while income statement accounts are translated at the average exchange rate for each period. For these operations, translation gains and losses are recorded as a component of accumulated other comprehensive loss in stockholders’ equity until the foreign entity is sold or liquidated.
Derivative financial instruments
Derivatives are recognized in the consolidated balance sheets at fair value, with classification as current or non-current based upon the maturity of the derivative instrument. We do not offset fair value amounts for derivative instruments held with the same counterparty. Changes in the fair value of derivative instruments are recorded in current earnings or deferred in accumulated other comprehensive income (loss), depending on the type of hedging transaction and whether a derivative is designated as, and is effective as, a hedge.
Changes in fair value of derivatives contracts that are not designated as hedges for accounting purposes are recognized in earnings as they occur and, to the extent these derivatives economically hedge existing assets or liabilities as opposed to anticipated transactions, offset gains or losses on the remeasurement of the related asset or liability. In the consolidated statements of income, earnings from foreign currency derivatives related to sales and remeasurement of sales-related assets, liabilities and contracts are recorded in revenue, while earnings from foreign currency derivatives related to purchases and remeasurement of purchase-related assets, liabilities and contracts are recorded in cost of sales.
When hedge accounting is applied, we ensure that the derivative is highly effective at offsetting changes in anticipated cash flows of the hedged item or transaction. Changes in fair value of derivatives that are designated as cash flow hedges are deferred in accumulated other comprehensive income (loss) until the underlying transactions are recognized in earnings. At such time, related deferred hedging gains or losses are also recorded in earnings on the same line as the hedged item. Effectiveness is assessed at the inception of the hedge and on a quarterly basis. Effectiveness of forward contract cash flow hedges is assessed based solely on changes in fair value attributable to the change in the spot rate. The change in the fair value of the contract related to the change in forward rates is excluded from the assessment of hedge effectiveness. Changes in this excluded component of the derivative instrument, along with any ineffectiveness identified, are recorded in earnings as incurred. We document our risk management strategy and method for assessing hedge effectiveness at the inception of and throughout the term of each hedge.
Cash flows from derivative contracts are reported in the consolidated statements of cash flows in the same categories as the cash flows from the underlying transactions.
Note 2. Acquisitions
Consistent with our growth strategy, we completed three acquisitions during 2014 focused on strengthening our protein processing and liquid foods portfolios.
Wolf-Tec Acquisition
On December 1, 2014, John Bean Technologies Corporation and its wholly-owned subsidiaries JBT Holdings, LLC and John Bean Technologies Limited, acquired substantially all of the assets and assumed certain liabilities of Wolf-Tec, Inc. (Wolf-Tec) for $53.9 million in cash. Consideration for the transaction was provided by cash on hand supplemented with borrowings under our revolving line of credit. The acquisition enables us to better meet customer needs through an expanded portfolio of protein processing equipment and solutions. Our product lines and those of Wolf-Tec are highly complementary, with equipment of both companies frequently utilized on the same production line. The acquisition also provides us with further entry into the beef, pork, and seafood processing markets. The acquisition is strategic in that Wolf-Tec has a strong brand presence, excellent technology and is renowned for its sales and customer support. The acquisition of Wolf-Tec combined with our global reach will create strong future growth opportunities.
This acquisition has been accounted for as a business combination. Tangible and identifiable intangible assets acquired and liabilities assumed were recorded at their respective estimated fair values. The excess of the consideration transferred over the estimated fair value of the net assets received has been recorded as goodwill. The factors that contributed to the recognition of goodwill primarily relate to acquisition-driven anticipated cost savings and revenue enhancement synergies in our protein processing business coupled with the assembled workforce acquired that is not recognized separate and apart from goodwill as it is neither separable nor contractual in nature. We are currently assessing the amount of goodwill that we expect to be deductible for tax purposes.
Acquisition related costs totaling $0.7 million were recognized as other expense at the time they were incurred.
Because the transaction was completed on December 1, 2014, the purchase accounting is preliminary as the valuation of substantially all assets acquired, including inventories, property, plant and equipment, and all identifiable intangibles, and liabilities assumed, including payables and contingent liabilities, as well as income tax balances and residual goodwill related to this acquisition is not complete; and significant information is still being assembled and reviewed. These amounts are subject to adjustment as additional information is obtained within the measurement period (not to exceed 12 months from the acquisition date).
The following table summarizes the provisional fair values recorded for the assets acquired and liabilities assumed for Wolf-Tec:
|
(In millions) |
||||
|
Assets: |
||||
|
Cash |
$ | 0.2 | ||
|
Accounts receivable |
2.4 | |||
|
Other current assets |
0.4 | |||
|
Inventories |
6.1 | |||
|
Property, plant and equipment |
7.3 | |||
|
Intangible assets: |
||||
|
Customer relationships |
14.6 | |||
|
Intellectual property |
6.2 | |||
|
Backlog |
0.4 | |||
|
Total assets |
$ | 37.6 | ||
|
Liabilities: |
||||
|
Accounts payable |
1.7 | |||
|
Deferred revenue |
0.3 | |||
|
Other liabilities |
2.5 | |||
|
Total liabilities |
$ | 4.5 | ||
|
Total purchase price |
$ | 53.9 | ||
|
Goodwill |
$ | 20.8 |
The customer relationships and intellectual property will be amortized over their estimated useful lives of ten years. The non-compete agreement will be amortized over its term of five years and the backlog asset will be amortized over four months, reflecting its expected pattern of use.
ICS Solutions Acquisition
On July 1, 2014, we completed the acquisition of 100% of the outstanding shares of ICS Solutions, a subsidiary of Stork Food & Dairy Systems B.V., for cash consideration of $35.7 million, which is net of cash acquired of $10.0 million. We funded this acquisition with cash on hand as well as borrowings against our revolving line of credit. ICS Solutions, located in Amsterdam, The Netherlands and Gainesville, Georgia, is a worldwide leader in the engineering, installation and servicing of high-capacity food preservation equipment. While the acquisition will not have a material impact to our revenue or earnings in fiscal year 2014, it is strategically important as ICS Solutions’ Hydromatic continuous sterilizer is complementary to our product portfolio of fillers, seamers and in-container sterilization technologies. With this acquisition, we will leverage our worldwide presence and provide a complete range of high-capacity, in-container sterilization solutions to our customers in the growing global beverage, dairy and canning industries. In addition, this acquisition will allow us to improve operational effectiveness as well as enhance sales and service support for our customers through the combination of the businesses.
This acquisition has been accounted for as a business combination. Tangible and identifiable intangible assets acquired and liabilities assumed were recorded at their respective estimated fair values. The excess of the consideration transferred over the estimated fair value of the net assets acquired has been recorded as goodwill. The factors that contributed to the recognition of goodwill primarily relate to expected synergistic benefits from the expansion of our in-container product portfolio. Approximately $4 million of the goodwill is expected to be deductible for tax purposes. Acquisition-related costs were recognized in other expense as incurred and totaled $0.9 million for the year ended December 31, 2014.
Because the transaction was completed in the third quarter, the purchase accounting is preliminary. The primary areas of purchase accounting that are not yet finalized relate to amounts for intangible assets, contingent liabilities, deferred taxes and residual goodwill. The preliminary fair values recorded were determined based upon a valuation and the estimates and assumptions used in such valuation are subject to change as additional information is obtained within the measurement period (not to exceed 12 months from the acquisition date).
The following table summarizes the preliminary fair values recorded for the assets acquired and liabilities assumed for ICS:
| Assets: | ||||
|
Cash |
$ | 10.0 | ||
|
Accounts receivable |
2.3 | |||
|
Inventories |
0.4 | |||
|
Property, plant and equipment |
0.1 | |||
|
Intangible assets: |
||||
|
Customer relationships |
15.7 | |||
|
Other intangible assets |
8.2 | |||
|
Total assets |
$ | 36.7 | ||
|
Liabilities: |
||||
|
Accounts payable |
1.3 | |||
|
Deferred revenue |
2.3 | |||
|
Other liabilities |
2.1 | |||
|
Deferred taxes |
4.1 | |||
|
Total liabilities |
9.8 | |||
|
Total purchase price |
$ | 45.7 | ||
|
Goodwill |
$ | 18.8 |
The customer relationship and other intangible assets will be amortized over a weighted-average useful life of approximately 12 years.
Formcook Acquisition
During the first quarter of 2014, John Bean Technologies AB (JBT AB), our wholly-owned subsidiary, acquired certain assets and liabilities of Helsingborg, Sweden-based Formcook AB, a regional leader in designing, manufacturing and servicing custom-built industrial cooking and forming technologies for the food processing industry. This transaction was accounted for as a business combination. The purchase price was less than $2 million. While the acquisition was not material to our 2014 results, it is strategically important to our efforts to strengthen our protein processing portfolio.
The pro forma impact of these acquisitions is not material individually or in the aggregate and as such, is not presented.
NOTE 3. INVENTORIES
Inventories as of December 31 consisted of the following:
|
(In millions) |
2014 |
2013 |
||||||
|
Raw materials |
$ | 53.7 | $ | 59.9 | ||||
|
Work in process |
45.3 | 41.7 | ||||||
|
Finished goods |
79.2 | 80.5 | ||||||
|
Gross inventories before LIFO reserves and valuation adjustments |
178.2 | 182.1 | ||||||
|
LIFO reserves and valuation adjustments |
(66.4 | ) | (64.5 | ) | ||||
|
Net inventories |
$ | 111.8 | $ | 117.6 | ||||
Inventories accounted for under the LIFO method totaled $106.5 million and $106.0 million at December 31, 2014 and 2013, respectively. The current replacement costs of LIFO inventories exceeded their recorded values by $48.1 million at December 31, 2014 and $49.2 million at December 31, 2013. Liquidation of LIFO layers in 2014 resulted in $0.8 million of income.
NOTE 4. PROPERTY, PLANT AND EQUIPMENT
Property, plant and equipment as of December 31 consisted of the following:
|
(In millions) |
2014 |
2013 |
||||||
|
Land and land improvements |
$ | 9.7 | $ | 9.0 | ||||
|
Buildings |
66.7 | 62.7 | ||||||
|
Machinery and equipment |
282.6 | 289.0 | ||||||
|
Construction in process |
21.3 | 13.9 | ||||||
| 380.3 | 374.6 | |||||||
|
Accumulated depreciation |
(232.7 | ) | (241.9 | ) | ||||
|
Property, plant and equipment, net |
$ | 147.6 | $ | 132.7 | ||||
NOTE 5. GOODWILL AND INTANGIBLE ASSETS
The changes in the carrying amount of goodwill by business segment were as follows:
|
(In millions) |
JBT FoodTech |
JBT AeroTech |
Total |
|||||||||
|
Balance as of January 1, 2013 |
$ | 22.8 | $ | 7.8 | $ | 30.6 | ||||||
|
Currency translation |
0.1 | 0.1 | 0.2 | |||||||||
|
Balance as of December 31, 2013 |
22.9 | 7.9 | 30.8 | |||||||||
|
Acquisitions |
39.8 | - | 39.8 | |||||||||
|
Currency translation |
(1.3 | ) | (0.1 | ) | (1.4 | ) | ||||||
|
Balance as of December 31, 2014 |
$ | 61.4 | $ | 7.8 | $ | 69.2 | ||||||
The components of intangible assets as of December 31 were as follows:
|
2014 |
2013 |
|||||||||||||||
|
(In millions) |
Gross carrying amount |
Accumulated amortization |
Gross carrying amount |
Accumulated amortization |
||||||||||||
|
Customer relationships |
$ | 49.8 | $ | 12.4 | $ | 20.8 | $ | 11.2 | ||||||||
|
Patents and acquired technology |
36.7 | 23.4 | 26.6 | 25.3 | ||||||||||||
|
Trademarks |
14.8 | 7.4 | 16.1 | 7.6 | ||||||||||||
|
Other |
5.6 | 3.7 | 4.4 | 2.4 | ||||||||||||
|
Total intangible assets |
$ | 106.9 | $ | 46.9 | $ | 67.9 | $ | 46.5 | ||||||||
Intangible asset amortization expense was $3.9 million, $2.3 million, and $2.1 million for 2014, 2013 and 2012, respectively. Annual amortization expense is expected to be $5.8 million in 2015, $5.3 million in 2016, $5.0 in 2017, and $4.7 million in 2018 and 2019.
NOTE 6. DEBT
Our short-term debt consists of borrowings under short-term credit facilities entered into by our wholly-owned subsidiaries in China and India. The China short-term credit facilities allow us to borrow up to a total of $12 million maturing on June 30, 2015 and we had $2.3 million and $0.5 million of outstanding borrowings as of December 31, 2014 and 2013, respectively. The Indian credit facility allows us to borrow up to a total of approximately $2.3 million; we had no borrowings and $0.5 million of outstanding borrowings as of December 31, 2014 and 2013, respectively.
Five-year Revolving Credit Facility and Other Long-term Borrowings
We entered into a $300 million 5-year credit facility agreement in November 2012. This credit facility permits borrowings in the U.S., Sweden and The Netherlands. Borrowings bear interest, at our option, at LIBOR or an alternative base rate, which is the greater of JPMorgan Chase, N.A.’s Prime Rate, the Federal Funds Rate plus 50 basis points, and LIBOR plus 1%, plus a margin dependent on our leverage ratio.
We are required to make periodic interest payments on the borrowed amounts and to pay an annual facility fee ranging from 15.0 to 27.5 basis points, depending on our leverage ratio. Our unused commitment totaled approximately $197 million at December 31, 2014. Outstanding letters of credit issued against the credit facility at December 31, 2014 were $9.1 million.
We have $75 million of 6.66% senior unsecured notes. The senior unsecured notes are due on July 31, 2015 and require us to make semiannual interest payments. We have classified this debt as long-term in the consolidated balance sheet as of December 31, 2014 as we have the ability and intent to use our $450 million five-year revolving credit facility entered into on February 10, 2015 to fund payment of these senior unsecured notes if needed.
Our Brazilian subsidiary entered into two loans during 2013. The first loan was a $4.0 million loan with an annual interest cost of 5.5% that matured and was paid in full on August 20, 2014. The second loan was a Brazilian real denominated loan with an outstanding balance of Br 5.3 million (approximately $2.0 million) as of December 31, 2014, that bears an annual interest rate of 5.5%. The first payment on this loan was made on May 15, 2014, with equal monthly payments required for 24 months thereafter.
During 2014, the Brazilian subsidiary entered into an additional Brazilian real denominated loan with an outstanding balance of Br 11.5 million (approximately $4.3 million) as of December 31, 2014, that bears an annual interest rate of 8.0%. The first payment on this loan is due November 15, 2015, with equal monthly payments required for 24 months thereafter.
Our credit facility and notes include restrictive covenants that, if not met, could lead to renegotiation of our credit lines, a requirement to repay our borrowings, and/or a significant increase in our cost of financing. Restrictive covenants include a minimum interest coverage ratio, a maximum leverage ratio, and limitations on payments made to shareholders.
Our debt as of December 31 consisted of the following:
|
(In millions) |
Weighted-Average Interest Rate at December 31, 2014 |
Maturity Date |
2014 |
2013 |
|||||||||||
|
Short-term borrowings |
|||||||||||||||
|
Foreign credit facilities |
6.7 | % | $ | 2.3 | $ | 1.0 | |||||||||
|
Total short-term borrowings |
$ | 2.3 | $ | 1.0 | |||||||||||
|
Long-term debt |
|||||||||||||||
|
Senior unsecured notes |
6.7 | % |
July 31, 2015 |
$ | 75.0 | $ | 75.0 | ||||||||
|
Revolving credit facility |
2.2 | % |
November 30, 2017 |
94.3 | 16.5 | ||||||||||
|
Brazilian US Dollar loan |
5.5 | % |
August 20, 2014 |
- | 4.0 | ||||||||||
|
Brazilian Real Loan |
5.5 | % |
April 15, 2016 |
2.0 | 3.4 | ||||||||||
|
Brazilian Real Loan |
8.0 | % |
October 16, 2017 |
4.3 | - | ||||||||||
|
Other |
Various |
Various |
0.1 | 0.5 | |||||||||||
|
Total long-term debt |
175.7 | 99.4 | |||||||||||||
|
Less: current portion |
(1.9 | ) | (5.3 | ) | |||||||||||
|
Long-term debt, less current portion |
$ | 173.8 | $ | 94.1 | |||||||||||
Scheduled maturities of long-term debt for the years ending December 31 are as follows:
|
(In millions) |
Maturities of Long-term debt |
|||
|
2015 |
$ | 1.9 | ||
|
2016 |
2.9 | |||
|
2017 |
170.9 | |||
|
Total |
$ | 175.7 | ||
On February 10, 2015, we entered into a new five year revolving credit facility and repaid all amounts outstanding under our existing revolving credit facility. See Note 19. Subsequent Events, for information regarding the new revolving credit facility.
NOTE 7. INCOME TAXES
Domestic and foreign components of income from continuing operations before income taxes for the years ended on December 31 are shown below:
|
(In millions) |
2014 |
2013 |
2012 |
|||||||||
|
Domestic |
$ | 18.1 | $ | 18.9 | $ | 23.0 | ||||||
|
Foreign |
26.6 | 28.9 | 31.0 | |||||||||
|
Income before income taxes |
$ | 44.7 | $ | 47.8 | $ | 54.0 | ||||||
The provision for income taxes related to income from continuing operations for the years ended on December 31 consisted of:
|
(In millions) |
2014 |
2013 |
2012 |
|||||||||
|
Current: |
||||||||||||
|
Federal |
$ | 0.4 | $ | 0.6 | $ | 2.1 | ||||||
|
State |
0.3 | 0.5 | 0.5 | |||||||||
|
Foreign |
8.3 | 7.0 | 7.6 | |||||||||
|
Total current |
9.0 | 8.1 | 10.2 | |||||||||
|
Deferred: |
||||||||||||
|
Federal |
4.8 | 3.0 | 6.0 | |||||||||
|
State |
0.8 | 0.7 | 1.0 | |||||||||
|
Foreign |
0.2 | 2.7 | 2.2 | |||||||||
|
Decrease in the valuation allowance for deferred tax assets |
(0.3 | ) | (0.3 | ) | (0.3 | ) | ||||||
|
Decrease in deferred tax liabilities due to foreign tax rate change |
- | - | (1.3 | ) | ||||||||
|
Benefits of operating loss carryforward |
(0.6 | ) | (0.4 | ) | (0.9 | ) | ||||||
|
Total deferred |
4.9 | 5.7 | 6.7 | |||||||||
|
Provision for income taxes |
$ | 13.9 | $ | 13.8 | $ | 16.9 | ||||||
Significant components of our deferred tax assets and liabilities at December 31 were as follows:
|
(In millions) |
2014 |
2013 |
||||||
|
Deferred tax assets attributable to: |
||||||||
|
Accrued pension and other postretirement benefits |
$ | 34.1 | $ | 17.3 | ||||
|
Accrued expenses and accounts receivable allowances |
15.4 | 13.6 | ||||||
|
Net operating loss carryforwards |
4.7 | 6.9 | ||||||
|
Inventories |
9.0 | 7.9 | ||||||
|
Stock-based compensation |
6.8 | 6.1 | ||||||
|
Research and development credit carryforwards |
2.1 | 0.8 | ||||||
|
Foreign tax credit carryforward |
0.4 | 0.2 | ||||||
|
Total deferred tax assets |
72.5 | 52.8 | ||||||
|
Valuation allowance |
- | (0.3 | ) | |||||
|
Deferred tax assets, net of valuation allowance |
72.5 | 52.5 | ||||||
|
Deferred tax liabilities attributable to: |
||||||||
|
Liquidation of subsidiary for income tax purposes |
13.3 | 13.3 | ||||||
|
Property, plant and equipment |
9.7 | 9.0 | ||||||
|
Goodwill and amortization |
13.4 | 9.3 | ||||||
|
Other |
5.8 | 6.4 | ||||||
|
Deferred tax liabilities |
42.2 | 38.0 | ||||||
|
Net deferred tax assets |
$ | 30.3 | $ | 14.5 | ||||
Included in our deferred tax assets are tax benefits related to net operating loss carryforwards attributable to our foreign operations. At December 31, 2014, we had $12.6 million of net operating losses that are available to offset future taxable income in several foreign jurisdictions indefinitely, and $3.6 million of net operating losses that are available to offset future taxable income through 2029. We expect to use $6.4 million of net operating losses relating to prior years in the filing of our 2014 corporate income tax returns.
Also included in our deferred tax assets at December 31, 2014 are $0.4 million of foreign tax credit carryforwards related to our foreign operations, which will expire by 2020 if unused and $2.1 million of research and development credit carryforward, which will expire by 2033, if unused. We anticipate being able to fully utilize the net operating loss carryforwards, the foreign tax credit carryforward, and the research and development credit carryforward before any expiration.
The effective income tax rate on income from continuing operations before income taxes was different from the statutory U.S. federal income tax rate due to the following:
|
(In millions) |
2014 |
2013 |
2012 |
|||||||||
|
Statutory U.S. federal tax rate |
35 |
% |
35 |
% |
35 |
% | ||||||
|
Net difference resulting from: |
||||||||||||
|
Research and development tax credit |
(3 | ) | (4 | ) | - | |||||||
|
Foreign earnings subject to different tax rates |
(3 | ) | (2 | ) | (4 | ) | ||||||
|
Effect of Swedish tax rate decrease |
- | - | (2 | ) | ||||||||
|
Tax on foreign intercompany dividends and deemed dividends for tax purposes |
1 | - | 3 | |||||||||
|
Nondeductible expenses |
1 | 1 | 1 | |||||||||
|
State income taxes |
2 | 2 | 2 | |||||||||
|
Foreign tax credits |
(2 | ) | (2 | ) | (3 | ) | ||||||
|
Foreign withholding taxes |
1 | 1 | 1 | |||||||||
|
Change in valuation allowance |
(1 | ) | (1 | ) | - | |||||||
|
Other |
- | (1 | ) | (2 | ) | |||||||
|
Total difference |
(4 | ) | (6 | ) | (4 | ) | ||||||
|
Effective income tax rate |
31 |
% |
29 |
% |
31 |
% | ||||||
U.S. income taxes have not been provided on $74.2 million of undistributed earnings of foreign subsidiaries at December 31, 2014 as these amounts are considered permanently invested. A liability could arise if our intention to permanently invest such earnings were to change and amounts are distributed by such subsidiaries, or if such subsidiaries are ultimately disposed. It is not practicable to estimate the additional income taxes related to the hypothetical distribution of permanently invested earnings.
We are a party to a Tax Sharing Agreement with FMC Technologies whereby we have agreed to indemnify FMC Technologies for any additional tax liability resulting from John Bean Technologies Corporation businesses. As of December 31, 2014, we are not aware of any additional tax liability.
The following tax years remain subject to examination in the following significant jurisdictions:
|
Belgium |
2010 – 2014 |
|
Brazil |
2009 – 2014 |
|
Italy |
2009 – 2014 |
|
Sweden |
2008 – 2014 |
|
United States |
2011 – 2014 |
NOTE 8. PENSION AND POSTRETIREMENT AND OTHER BENEFIT PLANS
We sponsor qualified and nonqualified defined benefit pension plans that together cover many of our U.S. employees. The plans provide defined benefits based on years of service and final average salary. We also provide postretirement medical and life insurance benefits to some of our U.S. employees. The postretirement medical plan is contributory while the postretirement life insurance plan is noncontributory. Foreign-based employees are eligible to participate in either Company-sponsored or government sponsored benefit plans to which we contribute. We also sponsor separate defined contribution plans that cover substantially all of our U.S. employees and some international employees.
Beginning in 2010, the domestic defined benefit plans were frozen to new entrants and future benefit accruals for non-union participants were discontinued.
The funded status of our pension and postretirement benefit plans, together with the associated balances recognized in our consolidated financial statements as of December 31, 2014 and 2013, were as follows:
|
Pensions |
Other postretirement benefits |
|||||||||||||||
|
(In millions) |
2014 |
2013 |
2014 |
2013 |
||||||||||||
|
Projected benefit obligation at January 1 |
$ | 306.3 | $ | 331.5 | $ | 6.9 | $ | 7.8 | ||||||||
|
Service cost |
1.8 | 1.9 | 0.1 | 0.1 | ||||||||||||
|
Interest cost |
14.7 | 13.7 | 0.3 | 0.3 | ||||||||||||
|
Actuarial (gain) loss |
53.4 | (31.9 | ) | (1.5 | ) | (0.9 | ) | |||||||||
|
Transition |
- | 1.9 | - | - | ||||||||||||
|
Plan participants' contributions |
0.2 | 0.2 | - | - | ||||||||||||
|
Benefits paid |
(20.1 | ) | (12.0 | ) | (0.3 | ) | (0.4 | ) | ||||||||
|
Currency translation adjustments |
(5.7 | ) | 1.0 | - | - | |||||||||||
|
Projected benefit obligation at December 31 |
$ | 350.6 | $ | 306.3 | $ | 5.5 | $ | 6.9 | ||||||||
|
Fair value of plan assets at January 1 |
$ | 255.4 | $ | 231.9 | $ | - | $ | - | ||||||||
|
Company contributions |
19.6 |
10.0 | 0.3 | 0.4 | ||||||||||||
|
Actual return on plan assets |
7.3 | 21.9 | - | - | ||||||||||||
|
Plan participants' contributions |
0.2 | 0.2 | - | - | ||||||||||||
|
Transition |
- | 3.0 | - | - | ||||||||||||
|
Benefits paid |
(20.1 | ) | (12.0 | ) | (0.3 | ) | (0.4 | ) | ||||||||
|
Currency translation adjustments |
(1.7 | ) | 0.4 | - | - | |||||||||||
|
Fair value of plan assets at December 31 |
$ | 260.7 | $ | 255.4 | $ | - | $ | - | ||||||||
|
Funded status of the plans (liability) at December 31 |
$ | (89.9 | ) | $ | (50.9 | ) | $ | (5.5 | ) | $ | (6.9 | ) | ||||
|
Amounts recognized in the Consolidated Balance Sheets at December 31 |
||||||||||||||||
|
Other current liabilities |
$ | (2.0 | ) | $ | (4.9 | ) | $ | (0.3 | ) | $ | (0.4 | ) | ||||
|
Accrued pension and other postretirement benefits, less current portion |
(87.9 | ) | (46.0 | ) | (5.2 | ) | (6.5 | ) | ||||||||
|
Net amount recognized |
$ | (89.9 | ) | $ | (50.9 | ) | $ | (5.5 | ) | $ | (6.9 | ) | ||||
Amounts recognized in accumulated other comprehensive loss at December 31 were as follows:
|
Pensions |
Other postretirement benefits |
|||||||||||||||
|
(In millions) |
2014 |
2013 |
2014 |
2013 |
||||||||||||
|
Unrecognized actuarial (gain) loss |
$ | 158.3 | $ | 98.4 | $ | (2.5 | ) | $ | (1.0 | ) | ||||||
|
Unrecognized prior service cost |
0.2 | 0.3 | - | - | ||||||||||||
|
Total recognized in accumulated other comprehensive (gain) loss |
$ | 158.5 | $ | 98.7 | $ | (2.5 | ) | $ | (1.0 | ) | ||||||
The accumulated benefit obligation for all pension plans was $343.1 million and $299.8 million at December 31, 2014 and 2013. Key information for our plans with accumulated benefit obligations in excess of plan assets as of December 31 was as follows:
|
(In millions) |
2014 |
2013 |
||||||
|
Aggregate projected benefit obligation |
$ | 350.6 | $ | 306.3 | ||||
|
Aggregate accumulated benefit obligation |
343.1 | 299.8 | ||||||
|
Aggregate fair value of plan assets |
260.7 | 255.4 | ||||||
Pension and other postretirement benefit costs (income) for the years ended December 31 were as follows:
|
Pensions |
Other postretirement benefits |
|||||||||||||||||||||||
|
(In millions) |
2014 |
2013 |
2012 |
2014 |
2013 |
2012 |
||||||||||||||||||
|
Service cost |
$ | 1.8 | $ | 1.9 | $ | 1.5 | $ | 0.1 | $ | 0.1 | $ | 0.1 | ||||||||||||
|
Interest cost |
14.7 | 13.7 | 13.8 | 0.3 | 0.3 | 0.3 | ||||||||||||||||||
|
Expected return on plan assets |
(19.7 | ) | (18.2 | ) | (17.7 | ) | - | - | - | |||||||||||||||
|
Curtailment gain |
- | - | (0.1 | ) | - | - | - | |||||||||||||||||
|
Settlement charge |
2.8 | - | - | - | - | - | ||||||||||||||||||
|
Amortization of prior service (credit) cost |
0.1 | 0.2 | 0.2 | - | (0.3 | ) | (0.8 | ) | ||||||||||||||||
|
Amortization of net actuarial (gain) loss |
2.7 | 4.2 | 3.1 | (0.1 | ) | - | - | |||||||||||||||||
|
Total (income) costs |
$ | 2.4 | $ | 1.8 | $ | 0.8 | $ | 0.3 | $ | 0.1 | $ | (0.4 | ) | |||||||||||
Pre-tax changes in projected benefit obligations and plan assets recognized in other comprehensive income during 2014 were as follows:
Changes recognized in OCI
|
(In millions) |
Pensions |
Other postretirement benefits |
||||||
|
Actuarial (gain) loss |
$ | 65.7 | $ | (1.6 | ) | |||
|
Amortization of net actuarial gain (loss) |
(5.5 | ) | 0.1 | |||||
|
Amortization of prior service credit (cost) |
(0.1 | ) | - | |||||
|
Total (income) loss recognized in other comprehensive income |
60.1 | (1.5 | ) | |||||
|
Total recognized in net periodic benefit cost and other comprehensive income |
$ | 62.5 | $ | (1.2 | ) | |||
The Company uses a corridor approach to recognize actuarial gains and losses that result from changes in actuarial assumptions. The corridor approach defers all actuarial gains and losses resulting from changes in assumptions in other accumulated comprehensive income (loss), such as those related to changes in the discount rate and differences between actual and expected returns on plan assets. These unrecognized gains and losses are amortized when the net gains and losses exceed 10% of the higher of the market-related value of the assets or the projected benefit obligation for each respective plan. The amortization is on a straight-line basis over the life expectancy of the plan’s participants for the frozen plans and the expected remaining service periods for the other plans. We expect to amortize $4.6 million of net actuarial loss from accumulated other comprehensive income (loss) into net periodic benefit cost in 2015.
The following weighted-average assumptions were used to determine the benefit obligations:
Weighted-average assumption to determine benefit obligation
|
Pensions |
Other postretirement benefits |
|||||||||||||||||||||||
|
2014 |
2013 |
2012 |
2014 |
2013 |
2012 |
|||||||||||||||||||
|
Discount rate |
4.00 | % | 4.92 | % | 4.19 | % | 4.25 | % | 5.10 | % | 4.30 | % | ||||||||||||
|
Rate of compensation increase |
3.23 | % | 3.45 | % | 3.45 | % | - | - | - | |||||||||||||||
The following weighted-average assumptions were used to determine net periodic benefit cost:
|
Pensions |
Other postretirement benefits |
|||||||||||||||||||||||
|
2014 |
2013 |
2012 |
2014 |
2013 |
2012 |
|||||||||||||||||||
|
Discount rate |
4.93 | % | 4.17 | % | 4.55 | % | 5.10 | % | 4.30 | % | 4.60 | % | ||||||||||||
|
Rate of compensation increase |
3.23 | % | 3.45 | % | 3.45 | % | - | - | - | |||||||||||||||
|
Expected rate of return on plan assets |
7.77 | % | 7.81 | % | 7.82 | % | - | - | - | |||||||||||||||
The estimate of expected rate of return on plan assets is based primarily on the historical performance of plan assets, asset allocation, current market conditions and long-term growth expectations.
Assumed health care cost trend rates for future periods will not have an effect on the amounts reported for the postretirement health care plan as our benefit obligation under the plan was fully capped at the 2002 benefit level.
Plan assets
Our pension investment strategy balances the requirements to generate returns using higher-returning assets, such as equity securities, with the need to control risk in the pension plan with less volatile assets, such as fixed-income securities. Risks include, among others, the likelihood of the pension plans being underfunded, thereby increasing their dependence on Company contributions. The assets are managed by professional investment firms and performance is evaluated against specific benchmarks. Our target asset allocations and actual allocations as of December 31, 2014 and 2013 were as follows:
|
Target |
2014 |
2013 |
||||||||||
|
Equity |
30% - 70% | 48% | 47% | |||||||||
|
Fixed income |
20% - 40% | 24% | 25% | |||||||||
|
Real estate and other |
10% - 30% | 27% | 26% | |||||||||
|
Cash |
0% - 10% | 1% | 2% | |||||||||
| 100% | 100% | 100% | ||||||||||
Our actual pension plans’ asset holdings by category and level within the fair value hierarchy are presented in the following table:
|
As of December 31, 2014 |
As of December 31, 2013 |
|||||||||||||||||||||||||||||||
|
(In millions) |
Total |
Level 1 |
Level 2 |
Level 3 |
Total |
Level 1 |
Level 2 |
Level 3 |
||||||||||||||||||||||||
|
Cash and cash equivalents |
$ | 2.4 | $ | 2.4 | $ | - | $ | - | $ | 4.3 | $ | 4.3 | $ | - | $ | - | ||||||||||||||||
|
Equity securities: |
||||||||||||||||||||||||||||||||
|
Large cap (1) |
45.5 | - | 45.5 | - | 40.2 | - | 40.2 | - | ||||||||||||||||||||||||
|
Small cap (2) |
79.1 | 79.1 | - | - | 81.2 | 81.2 | - | - | ||||||||||||||||||||||||
|
Fixed income securities: |
||||||||||||||||||||||||||||||||
|
Government securities (3) |
17.6 | - | 17.6 | - | 17.5 | - | 17.5 | - | ||||||||||||||||||||||||
|
Corporate bonds (4) |
46.4 | 15.2 | 31.2 | - | 45.1 | 14.8 | 30.3 | - | ||||||||||||||||||||||||
|
Real estate and other investments (5) |
69.7 | 26.6 | 43.1 | - | 67.1 | 27.9 | 39.2 | - | ||||||||||||||||||||||||
|
Total assets at fair value |
$ | 260.7 | $ | 123.3 | $ | 137.4 | $ | - | $ | 255.4 | $ | 128.2 | $ | 127.2 | $ | - | ||||||||||||||||
|
(1) |
Includes funds that invest primarily in large cap equity securities. |
|
(2) |
Includes small cap equity securities and funds that invest primarily in small cap equity securities. |
|
(3) |
Includes U.S. government securities and funds that invest primarily in U.S. government bonds, including treasury inflation protected securities. |
|
(4) |
Includes investment grade bonds, high yield bonds and mortgage-backed fixed income securities and funds that invest in such securities. |
|
(5) |
Includes funds that invest primarily in REITs, funds that invest in commodities and investments in insurance contracts held by one of our foreign pension plans. |
The fair value of assets classified as Level 1 is based on unadjusted quoted prices in active markets for identical assets. The fair value of assets classified as Level 2 is based on quoted prices for similar assets or based on valuations made using inputs that are either directly or indirectly observable as of the reporting date. Such inputs include net asset values reported at a minimum on a monthly basis by investment funds or contract values provided by the issuing insurance company. We are able to sell any of our investment funds with notice of no more than 30 days. For more information on the fair value hierarchy, see Note 14.
Contributions
We expect to contribute $15.0 million to our pension and other postretirement benefit plans in 2015. The pension contributions will be primarily for the U.S. qualified pension plan. All of the contributions are expected to be in the form of cash.
Estimated future benefit payments
The following table summarizes expected benefit payments from our various pension and postretirement benefit plans through 2024. Actual benefit payments may differ from expected benefit payments.
|
(In millions) |
Pensions |
Other postretirement benefits |
||||||||
|
2015 |
$ | 14.0 | $ | 0.3 | ||||||
|
2016 |
13.4 | 0.3 | ||||||||
|
2017 |
15.3 | 0.4 | ||||||||
|
2018 |
15.8 | 0.4 | ||||||||
|
2019 |
15.8 | 0.4 | ||||||||
| 2020 - 2024 | 92.7 | 1.8 | ||||||||
Savings Plans
Our U.S. and some international employees participate in defined contribution savings plans that we sponsor. These plans generally provide company matching contributions on participants’ voluntary contributions and/or company non-elective contributions. Additionally, certain highly compensated employees participate in a non-qualified deferred compensation plan, which also allows for company matching contributions and company non-elective contributions on compensation in excess of the Internal Revenue Code Section 401(a) (17) limit. The expense for matching contributions was $9.6 million, $9.4 million and $8.9 million in 2014, 2013 and 2012, respectively.
Note 9. accumulated other comprehensive income (loss)
Accumulated other comprehensive income or loss (“AOCI”) represents the cumulative balance of other comprehensive income, net of tax, as of the balance sheet date. For JBT, AOCI is primarily composed of adjustments related to pension and other postretirement benefits plans and foreign currency translation adjustments. Changes in the AOCI balances for the year ended December 31, 2014 by component are shown in the following table:
|
Pension and Other Postretirement Benefits |
Foreign Currency Translation |
Total |
||||||||||
|
(In millions) |
||||||||||||
|
Beginning balance, December 31, 2013 |
$ | (60.0 | ) | $ | (0.1 | ) | $ | (60.1 | ) | |||
|
Other comprehensive gain (loss) before reclassification |
(38.0 | ) | (20.6 | ) | (58.6 | ) | ||||||
|
Amounts reclassified from accumulated other comprehensive income |
1.6 | - | 1.6 | |||||||||
|
Ending balance, December 31, 2014 |
$ | (96.4 | ) | $ | (20.7 | ) | $ | (117.1 | ) | |||
Reclassification adjustments from AOCI into earnings for pension and other postretirement benefits plans for the year ended December 31, 2014 were $2.7 million in selling, general and administrative expenses net of $1.1 million in provision for income taxes.
NOTE 10. STOCK-BASED COMPENSATION
We recorded stock-based compensation expense and related income tax effects for the years ended December 31 as follows:
|
(In millions) |
2014 |
2013 |
2012 |
|||||||||
|
Stock-based compensation expense |
$ | 7.3 | $ | 6.9 | $ | 7.5 | ||||||
|
Tax benefit recorded in consolidated statements of income |
$ | 2.8 | $ | 2.6 | $ | 2.7 | ||||||
As of December 31, 2014, there was $7.2 million of unrecognized stock-based compensation expense for outstanding awards expected to be recognized over a weighted average period of 1.9 years.
Incentive Compensation Plan
We sponsor a stock-based compensation plan (the “Incentive Compensation Plan”) that provides certain incentives and awards to our officers, employees, directors and consultants. The Incentive Compensation Plan allows our Board of Directors (the “Board”) to make various types of awards to non-employee directors and the Compensation Committee (the “Committee”) of the Board to make various types of awards to other eligible individuals. Awards that may be issued include common stock, stock options, stock appreciation rights, restricted stock and stock units.
Grants of common stock options may be incentive and/or nonqualified stock options. Under the Incentive Compensation Plan, the exercise price for options cannot be less than the market value of our common stock at the date of grant. Options vest in accordance with the terms of the award as determined by the Committee, which is generally after three years of service, and expire no later than 10 years after the grant date. Restricted stock grants specify any applicable performance goals, the time and rate of vesting and such other provisions as determined by the Committee. Restricted stock grants generally vest after three years of service, but may also vest upon a change of control as defined in the Incentive Compensation Plan. A total of 3.7 million shares of our common stock are authorized to be issued under the Incentive Compensation Plan.
Restricted Stock Units
A summary of the non-vested restricted stock units as of December 31, 2014 and changes during the year is presented below:
|
Shares |
Weighted-Average Grant-Date Fair Value |
|||||||
|
Nonvested at December 31, 2013 |
1,229,394 | $ | 18.50 | |||||
|
Granted |
346,833 | $ | 30.12 | |||||
|
Vested |
(326,274 | ) | $ | 19.55 | ||||
|
Forfeited |
(127,400 | ) | $ | 20.56 | ||||
|
Nonvested at December 31, 2014 |
1,122,553 | $ | 21.06 | |||||
We grant time-based and performance-based restricted stock units that vest after three years. The fair value of these awards is determined using the market value of our common stock on the grant date. Compensation cost is recognized over the lesser of the stated vesting period or the period until the employee reaches age 62, the retirement eligible age under the plan.
For current year performance-based awards, the number of shares to be issued was dependent upon our performance relative to the prior year with respect to growth in earnings and net contribution (which is an economic value added measure calculated by determining the amount by which our net income from continuing operations, after adding back interest expense, exceeds our cost of capital) for the year ended December 31, 2014. Based on results for the performance period, we expect to issue a total of 216,895 shares at the vesting date in January 2017. Compensation cost has been measured for 2014 based on actual performance against the established target.
The following summarizes values for restricted stock activity in each of the years in the three year period ended December 31:
|
2014 |
2013 |
2012 |
||||||||||
|
Weighted-average grant-date fair value of restricted stock units granted |
$ | 30.12 | $ | 20.88 | $ | 17.53 | ||||||
|
Fair value of restricted stock vested (in millions) |
$ | 9.4 | $ | 6.7 | $ | 6.8 | ||||||
Stock Options
There were no options granted, forfeited, expired, or outstanding during the year ended December 31, 2014. For December 31, 2013 and 2012, options exercised were 23,651 and 30,244, respectively.
NOTE 11. STOCKHOLDERS’ EQUITY
The following is a summary of our capital stock activity (in shares) for the year ended on December 31, 2014:
|
Common stock outstanding |
Common stock held in treasury |
|||||||
|
December 31, 2013 |
28,979,080 | - | ||||||
|
Stock awards |
112,422 | (44,746 | ) | |||||
|
Treasury stock purchases |
- | 91,406 | ||||||
|
December 31, 2014 |
29,091,502 | 46,660 | ||||||
On October 27, 2011, the Board authorized a share repurchase program for up to $30 million of our common stock through December 31, 2014. In December 2014, the Board of Directors extended the term of the repurchase authorization through December 31, 2015. Shares may be purchased from time to time in open market transactions, subject to market conditions. Repurchased shares become treasury shares, which are accounted for using the cost method and are used for future awards under the Incentive Compensation Plan.
On July 31, 2008, our Board declared a dividend distribution to each record holder of common stock of one Preferred Share Purchase Right for each share of common stock outstanding on that date. Each right entitles the holder to purchase, under certain circumstances related to a change in control of the Company, one one-hundredth of a share of Series A Junior Participating Preferred Stock, par value $0.01, at a price of $72 per share (subject to adjustment), subject to the terms and conditions of a Rights Agreement dated July 31, 2008. The rights expire on July 31, 2018, unless redeemed by us at an earlier date. The redemption price of $0.01 per right is subject to adjustment to reflect stock splits, stock dividends or similar transactions. We have reserved 1,500,000 shares of Series A Junior Participating Preferred Stock for possible issuance under the agreement.
Accumulated other comprehensive loss as of December 31 consisted of the following:
|
(In millions) |
2014 |
2013 |
||||||
|
Cumulative foreign currency translation adjustments |
$ | (20.7 | ) | $ | (0.1 | ) | ||
|
Cumulative deferral of pension net losses, net of tax of $59.6 in 2014 and $37.7 in 2013 |
(96.4 | ) | (60.0 | ) | ||||
|
Accumulated other comprehensive loss |
$ | (117.1 | ) | $ | (60.1 | ) | ||
NOTE 12. EARNINGS PER SHARE
Basic earnings per share (“EPS”) is computed by dividing net income by the weighted average number of common shares outstanding for the period. Diluted EPS reflects the assumed conversion of all dilutive securities.
The following table sets forth the computation of basic and diluted EPS utilizing income from continuing operations for the respective periods and our basic and dilutive shares outstanding:
|
(In millions, except per share data) |
2014 |
2013 |
2012 |
|||||||||
|
Basic earnings per share: |
||||||||||||
|
Income from continuing operations |
$ | 30.8 | $ | 34.0 | $ | 37.1 | ||||||
|
Weighted average number of shares outstanding |
29.5 | 29.2 | 29.1 | |||||||||
|
Basic earnings per share from continuing operations |
$ | 1.04 | $ | 1.16 | $ | 1.27 | ||||||
|
Diluted earnings per share: |
||||||||||||
|
Income from continuing operations |
$ | 30.8 | $ | 34.0 | $ | 37.1 | ||||||
|
Weighted average number of shares outstanding |
29.5 | 29.2 | 29.1 | |||||||||
|
Effect of dilutive securities: |
||||||||||||
|
Restricted stock |
0.4 | 0.5 | 0.4 | |||||||||
|
Total shares and dilutive securities |
29.9 | 29.7 | 29.5 | |||||||||
|
Diluted earnings per share from continuing operations |
$ | 1.03 | $ | 1.15 | $ | 1.26 | ||||||
NOTE 13. DERIVATIVE FINANCIAL INSTRUMENTS AND CREDIT RISK
Derivative financial instruments
We hold derivative financial instruments for the purpose of hedging foreign currency risks of certain identifiable and anticipated transactions.
We manufacture and sell our products in a number of countries throughout the world and, as a result, are exposed to movements in foreign currency exchange rates. Our major foreign currency exposures involve the markets in Western Europe, South America and Asia. Some of our sales and purchase contracts contain embedded derivatives due to the nature of doing business in certain jurisdictions, which we take into consideration as part of our risk management policy. The purpose of our foreign currency hedging activities is to manage the economic impact of exchange rate volatility associated with anticipated foreign currency purchases and sales made in the normal course of business. We primarily utilize forward foreign exchange contracts with maturities of less than 2 years in managing this foreign exchange rate risk. We do not apply hedge accounting for these forward foreign exchange contracts. As of December 31, 2014, we held forward foreign exchange contracts with an aggregate notional value of $320.0 million.
The following table presents the fair value of foreign currency derivatives included within the consolidated balance sheets:
|
As of December 31, 2014 |
As of December 31, 2013 |
|||||||||||||||
|
(In millions) |
Derivative Assets |
Derivative Liabilities |
Derivative Assets |
Derivative Liabilities |
||||||||||||
|
Other current assets / liabilities |
$ | 6.9 | $ | 3.9 | $ | 5.8 | $ | 3.0 | ||||||||
|
Other assets / liabilities |
2.2 | - | 2.6 | 0.6 | ||||||||||||
|
Total |
$ | 9.1 | $ | 3.9 | $ | 8.4 | $ | 3.6 | ||||||||
Refer to Note 14. Fair Value of Financial Instruments, for a description of how the values of the above financial instruments are determined.
A master netting arrangement allows counterparties to net settle amounts owed to each other as a result of separate offsetting derivative transactions. We enter into master netting arrangements with our counterparties when possible to mitigate credit risk in derivative transactions by permitting us to net settle for transactions with the same counterparty. However, we do not net settle with such counterparties. As a result, we present derivatives at their gross fair values in the consolidated balance sheets. As of December 31, 2014 and 2013, information related to these offsetting arrangements was as follows:
|
(in millions) |
As of December 31, 2014 |
|||||||||||||||||||
|
Offsetting of Assets |
||||||||||||||||||||
|
Gross Amounts of Recognized Assets |
Gross Amounts Offset in the Consolidated Balance Sheets |
Amount Presented in the Consolidated Balance Sheets |
Amount Subject to Master Netting Agreement |
Net Amount |
||||||||||||||||
|
Derivatives |
$ | 9.1 | $ | - | $ | 9.1 | $ | (3.8 | ) | $ | 5.3 | |||||||||
|
Offsetting of Liabilities |
As of December 31, 2014 |
|||||||||||||||||||
|
Gross Amounts of Recognized Liabilities |
Gross Amounts Offset in the Consolidated Balance Sheets |
Amount Presented in the Consolidated Balance Sheets |
Amount Subject to Master Netting Agreement |
Net Amount |
||||||||||||||||
|
Derivatives |
$ | 3.9 | $ | - | $ | 3.9 | $ | (3.8 | ) | $ | 0.1 | |||||||||
|
(in millions) |
As of December 31, 2013 |
|||||||||||||||||||
|
Offsetting of Assets |
||||||||||||||||||||
|
Gross Amounts of Recognized Assets |
Gross Amounts Offset in the Consolidated Balance Sheets |
Amount Presented in the Consolidated Balance Sheets |
Amount Subject to Master Netting Agreement |
Net Amount |
||||||||||||||||
|
Derivatives |
$ | 8.4 | $ | - | $ | 8.4 | $ | (2.9 | ) | $ | 5.5 | |||||||||
|
Offsetting of Liabilities |
As of December 31, 2013 |
|||||||||||||||||||
|
Gross Amounts of Recognized Liabilities |
Gross Amounts Offset in the Consolidated Balance Sheets |
Amount Presented in the Consolidated Balance Sheets |
Amount Subject to Master Netting Agreement |
Net Amount |
||||||||||||||||
|
Derivatives |
$ | 3.6 | $ | - | $ | 3.6 | $ | (2.9 | ) | $ | 0.7 | |||||||||
The following table presents the location and amount of the gain (loss) on foreign currency derivatives and on the remeasurement of assets and liabilities denominated in foreign currencies, as well as the net impact recognized in the consolidated statements of income:
|
Derivatives not designated as hedging instruments |
Location of Gain (Loss) Recognized in Income |
Amount of Gain (Loss) Recognized in Income |
||||||||||||
|
(In millions) |
2014 |
2013 |
2012 |
|||||||||||
|
Foreign exchange contracts |
Revenue |
$ | (1.5 | ) | $ | - | $ | 3.7 | ||||||
|
Foreign exchange contracts |
Cost of sales |
0.9 | 0.4 | (0.6 | ) | |||||||||
|
Foreign exchange contracts |
Other income, net |
(0.1 | ) | (0.7 | ) | 0.4 | ||||||||
|
Total |
(0.7 | ) | (0.3 | ) | 3.5 | |||||||||
|
Remeasurement of assets and liabilities in foreign currencies |
1.0 | (0.2 | ) | (1.0 | ) | |||||||||
|
Net gain (loss) on foreign currency transactions |
$ | 0.3 | $ | (0.5 | ) | $ | 2.5 | |||||||
Credit risk
By their nature, financial instruments involve risk including credit risk for non-performance by counterparties. Financial instruments that potentially subject us to credit risk primarily consist of trade receivables and derivative contracts. We manage the credit risk on financial instruments by transacting only with financially secure counterparties, requiring credit approvals and establishing credit limits, and monitoring counterparties’ financial condition. Our maximum exposure to credit loss in the event of non-performance by the counterparty is limited to the amount drawn and outstanding on the financial instrument. Allowances for losses are established based on collectability assessments.
NOTE 14. FAIR VALUE OF FINANCIAL INSTRUMENTS
The fair value framework requires the categorization of assets and liabilities into three levels based upon the assumptions (inputs) used to price the assets or liabilities. Level 1 provides the most reliable measure of fair value, whereas Level 3 generally requires significant management judgment. The three levels are defined as follows:
|
• |
Level 1: Unadjusted quoted prices in active markets for identical assets and liabilities. |
|
• |
Level 2: Observable inputs other than those included in Level 1. For example, quoted prices for similar assets or liabilities in active markets or quoted prices for identical assets or liabilities in inactive markets. |
|
• |
Level 3: Unobservable inputs reflecting management’s own assumptions about the inputs used in pricing the asset or liability. |
Financial assets and financial liabilities measured at fair value on a recurring basis are as follows:
|
As of December 31, 2014 |
As of December 31, 2013 |
|||||||||||||||||||||||||||||||
|
(In millions) |
Total |
Level 1 |
Level 2 |
Level 3 |
Total |
Level 1 |
Level 2 |
Level 3 |
||||||||||||||||||||||||
|
Assets: |
||||||||||||||||||||||||||||||||
|
Investments |
$ | 10.7 | $ | 10.7 | - | - | $ | 11.9 | $ | 11.9 | - | - | ||||||||||||||||||||
|
Derivatives |
9.1 | - | $ | 9.1 | - | 8.4 | - | $ | 8.4 | - | ||||||||||||||||||||||
|
Total assets |
$ | 19.8 | $ | 10.7 | $ | 9.1 | - | $ | 20.3 | $ | 11.9 | $ | 8.4 | - | ||||||||||||||||||
|
Liabilities: |
||||||||||||||||||||||||||||||||
|
Derivatives |
$ | 3.9 | - | $ | 3.9 | - | $ | 3.6 | - | $ | 3.6 | - | ||||||||||||||||||||
Investments represent securities held in a trust for the non-qualified deferred compensation plan. Investments are classified as trading securities and are valued based on quoted prices in active markets for identical assets that we have the ability to access. Investments are reported separately on the consolidated balance sheet. Investments include an unrealized loss of $0.2 million as of December 31, 2014 and an unrealized gain of $0.5 million as of December 31, 2013.
We use the income approach to measure the fair value of derivative instruments on a recurring basis. This approach calculates the present value of the future cash flow by measuring the change between the derivative contract rate and the published market indicative currency rate, multiplied by the contract notional values, and applying an appropriate discount rate as well as a factor of credit risk.
The carrying amounts of cash and cash equivalents, trade receivables and payables, as well as financial instruments included in other current assets and other current liabilities, approximate fair values because of their short-term maturities.
The carrying values and the estimated fair values of our debt financial instruments as of December 31 are as follows:
|
2014 |
2013 |
|||||||||||||||
|
(In millions) |
Carrying Value |
Estimated Fair Value |
Carrying Value |
Estimated Fair Value |
||||||||||||
|
Senior unsecured notes due July 31, 2015 |
$ | 75.0 | $ | 77.6 | $ | 75.0 | $ | 80.7 | ||||||||
|
Revolving credit facility, expires November 30, 2017 |
94.3 | 94.3 | 16.5 | 16.5 | ||||||||||||
|
Brazilian loan due August 20, 2014 |
- | - | 4.0 | 4.0 | ||||||||||||
|
Brazilian loan due April 15, 2016 |
2.0 | 1.8 | 3.4 | 2.9 | ||||||||||||
|
Brazilian loan due October 16, 2017 |
4.3 | 3.7 | - | - | ||||||||||||
|
Foreign credit facilities |
2.3 | 2.3 | 1.0 | 1.0 | ||||||||||||
|
Other |
0.1 | 0.1 | 0.5 | 0.5 | ||||||||||||
There is no active or observable market for our fixed rate borrowings, which include our senior unsecured notes and our Brazilian loans. Therefore, the estimated fair value of the notes and the Brazilian loans are based on discounted cash flows using current interest rates available for debt with similar terms and remaining maturities. The estimates of the all-in interest rate for discounting the notes and the loans are based on a broker quote for notes and loans with similar terms. We do not have a rate adjustment for risk profile changes, covenant issues or credit rating changes, therefore the broker quote is deemed to be the closest approximation of current market rates. The carrying values of the remaining borrowings approximate their fair values due to their variable interest rates.
NOTE 15. COMMITMENTS AND CONTINGENCIES
We are involved in legal proceedings arising in the ordinary course of business. We also have assumed liabilities related to specified legal proceedings arising from our business prior to our 2008 spin-off from FMC Technologies, Inc. As a result, although FMC Technologies, Inc. will in many cases remain the named defendant, we will manage the litigation and indemnify FMC Technologies, Inc. for costs, expenses and judgments arising from such litigation. We do not believe that any existing litigation we have assumed will have a material effect on our business, results of operations or financial condition.
We are currently the subject of an audit being conducted by the State of Delaware to determine whether the Company has complied with Delaware unclaimed property (escheat) laws. This audit is being conducted by an outside firm on behalf of the State of Delaware and covers the years from 1986 through the present. In addition to seeking the turnover of unclaimed property subject to escheat laws, the State of Delaware may seek interest, penalties, and other relief. An estimate of a possible loss from this audit cannot be made at this time.
In the normal course of our business, we are at times subject to pending and threatened legal actions, some for which the relief or damages sought may be substantial. Although we are not able to predict the outcome of such actions, after reviewing all pending and threatened actions with counsel and based on information currently available, management believes that the outcome of such actions, individually or in the aggregate, will not have a material adverse effect on the results of operations or financial position of our Company. However, it is possible that the ultimate resolution of such matters, if unfavorable, may be material to the results of operations in a particular future period as the time and amount of any resolution of such actions and its relationship to the future results of operations are not currently known.
Liabilities are established for pending legal claims only when losses associated with the claims are judged to be probable, and the loss can be reasonably estimated. In many lawsuits and arbitrations, it is not considered probable that a liability has been incurred or not possible to estimate the ultimate or minimum amount of that liability until the case is close to resolution, in which case no liability would be recognized until that time.
Guarantees and Product Warranties
In the ordinary course of business with customers, vendors and others, we issue standby letters of credit, performance bonds, surety bonds and other guarantees. These financial instruments, which totaled approximately $67.2 million at December 31, 2014, represent guarantees of our future performance. We also have provided approximately $11.1 million of bank guarantees and letters of credit to secure a portion of our existing financial obligations. The majority of these financial instruments expire within two years; we expect to replace them through the issuance of new or the extension of existing letters of credit and surety bonds.
In some instances, we guarantee our customers’ financing arrangements. We are responsible for payment of any unpaid amounts but will receive indemnification from third parties for between sixty and ninety-five percent of the contract values. In addition, we generally retain recourse to the equipment sold. As of December 31, 2014, the gross value of such arrangements was $13.2 million, of which our net exposure under such guarantees is $1.8 million.
We provide warranties of various lengths and terms to certain of our customers based on standard terms and conditions and negotiated agreements. We provide for the estimated cost of warranties at the time revenue is recognized for products where reliable, historical experience of warranty claims and costs exists. We also provide a warranty liability when additional specific obligations are identified. The warranty obligation reflected in other current liabilities in the consolidated balance sheets is based on historical experience by product and considers failure rates and the related costs in correcting a product failure. Warranty cost and accrual information is as follows:
|
(In millions) |
2014 |
2013 |
||||||
|
Balance at beginning of year |
$ | 10.1 | $ | 7.3 | ||||
|
Expenses for new warranties |
10.0 | 13.1 | ||||||
|
Adjustments to existing accruals |
(1.1 | ) | (0.6 | ) | ||||
|
Claims paid |
(9.4 | ) | (9.7 | ) | ||||
|
Added through acquisition |
1.2 | - | ||||||
|
Translation |
(0.6 | ) | - | |||||
|
Balance at end of year |
$ | 10.2 | $ | 10.1 | ||||
Leases
We lease office space, manufacturing facilities and various types of manufacturing and data processing equipment. Leases of real estate generally provide that we pay for repairs, property taxes and insurance. Substantially all leases are classified as operating leases for accounting purposes. Rent expense under operating leases amounted to $9.6 million, $10.4 million and $9.0 million in 2014, 2013 and 2012, respectively.
Future minimum lease payments under non-cancelable operating leases as of December 31, 2014, for the following fiscal years were:
|
(In millions) |
Total Amount |
2015 |
2016 |
2017 |
2018 |
2019 |
After 2019 |
|||||||||||||||||||||
|
Operating lease obligations |
$ | 21.1 | $ | 5.0 | $ | 4.2 | $ | 3.1 | $ | 2.1 | $ | 1.2 | $ | 5.5 | ||||||||||||||
NOTE 16. BUSINESS SEGMENTS
Our determination of the two reportable segments was made on the basis of our strategic business units and the commonalities among the products and services within each segment, and corresponds to the manner in which management reviews and evaluates operating performance.
Our reportable segments are:
|
|
• |
|
JBT FoodTech—designs, manufactures and services technologically sophisticated food processing systems used for, among other things, fruit juice production, frozen food production, in-container food production, automated systems and convenience food preparation by the food industry. |
|
|
• |
|
JBT AeroTech—designs, manufactures and services technologically sophisticated airport ground support and gate equipment and provides services for airport authorities; airlines, airfreight, and ground handling companies; the military and other industries. |
Total revenue by segment includes intersegment sales, which are made at prices that reflect, as nearly as practicable, the market value of the transaction. Segment operating profit is defined as total segment revenue less segment operating expenses. The following items have been excluded in computing segment operating profit: corporate staff expense, LIFO provisions, restructuring costs, certain employee benefit expenses, interest income and expense and income taxes.
During the fourth quarter of 2014, management revised our measure of segment operating profit to include foreign currency gains and losses from (i) hedging anticipated foreign currency purchases and sales in the normal course of segment operations, and (ii) the remeasurement of sales-related asset and purchases-related liabilities denominated in foreign currencies. These gains and losses were previously reported in corporate expense; and we have retroactively adjusted the previously reported amounts of segment operating profit for all periods presented to reflect this change. The change was made to reflect our Chief Operating Decision Maker’s long-term strategic view of our business, and to include these foreign currency gains and losses together with the underlying transactions to which they relate in the measure used to evaluate segment performance.
Segment revenue and segment operating profit
|
(In millions) |
2014 |
2013 |
2012 |
|||||||||
|
Revenue |
||||||||||||
|
JBT FoodTech |
$ | 634.7 | $ | 611.1 | $ | 592.5 | ||||||
|
JBT AeroTech |
350.2 | 323.6 | 325.0 | |||||||||
|
Intercompany eliminations |
(0.7 | ) | (0.5 | ) | (0.2 | ) | ||||||
|
Total revenue |
$ | 984.2 | $ | 934.2 | $ | 917.3 | ||||||
|
Income before income taxes |
||||||||||||
|
Segment operating profit: |
||||||||||||
|
JBT FoodTech |
$ | 72.7 | $ | 64.5 | $ | 61.3 | ||||||
|
JBT AeroTech |
30.0 | 26.8 | 28.2 | |||||||||
|
Total segment operating profit |
102.7 | 91.3 | 89.5 | |||||||||
|
Corporate items: |
||||||||||||
|
Corporate expense (1) |
(37.5 | ) | (36.5 | ) | (28.5 | ) | ||||||
|
Restructuring expense |
(14.5 | ) | (1.6 | ) | (0.1 | ) | ||||||
|
Net interest expense |
(6.0 | ) | (5.4 | ) | (6.9 | ) | ||||||
|
Total corporate items |
(58.0 | ) | (43.5 | ) | (35.5 | ) | ||||||
|
Income from continuing operations before income taxes |
44.7 | 47.8 | 54.0 | |||||||||
|
Provision for income taxes |
13.9 | 13.8 | 16.9 | |||||||||
|
Income from continuing operations |
30.8 | 34.0 | 37.1 | |||||||||
|
Loss from discontinued operations, net of income taxes |
- | (0.9 | ) | (0.9 | ) | |||||||
|
Net income |
$ | 30.8 | $ | 33.1 | $ | 36.2 | ||||||
|
(1) |
Corporate expense generally includes corporate staff costs, stock-based compensation, pension and other postretirement benefits expenses not related to service, LIFO adjustments, and the impact of unusual or strategic transactions not representative of segment operations. |
Segment operating capital employed and segment assets
|
(In millions) |
2014 |
2013 |
2012 |
|||||||||
|
Segment operating capital employed (1): |
||||||||||||
|
JBT FoodTech |
$ | 298.1 | $ | 204.5 | $ | 271.5 | ||||||
|
JBT AeroTech |
114.0 | 138.1 | 132.0 | |||||||||
|
Total segment operating capital employed |
412.1 | 342.6 | 403.5 | |||||||||
|
Segment liabilities included in total segment operating capital employed (2) |
248.6 | 243.2 | 226.6 | |||||||||
|
Corporate (3) |
37.1 | 35.4 | 47.9 | |||||||||
|
Total assets |
$ | 697.8 | $ | 621.2 | $ | 678.0 | ||||||
|
Segment assets: |
||||||||||||
|
JBT FoodTech |
$ | 478.1 | $ | 392.4 | $ | 445.7 | ||||||
|
JBT AeroTech |
183.8 | 194.0 | 184.8 | |||||||||
|
Intercompany eliminations |
(1.2 | ) | (0.6 | ) | (0.4 | ) | ||||||
|
Total segment assets |
660.7 | 585.8 | 630.1 | |||||||||
|
Corporate (3) |
37.1 | 35.4 | 47.9 | |||||||||
|
Total assets |
$ | 697.8 | $ | 621.2 | $ | 678.0 | ||||||
|
(1) |
Management views segment operating capital employed, which consists of segment assets, net of its liabilities, as the primary measure of segment capital. Segment operating capital employed excludes debt, pension liabilities, restructuring reserves, income taxes and LIFO inventory reserves. |
|
(2) |
Segment liabilities included in total segment operating capital employed consist of trade and other accounts payable, advance and progress payments, accrued payroll and other liabilities. |
|
(3) |
Corporate includes cash, LIFO inventory reserves, income tax balances, investments, and property, plant and equipment not associated with a specific segment. |
Geographic segment information
Geographic segment sales were identified based on the location where our products and services were delivered. Geographic segment long-lived assets include property, plant and equipment, net and certain other non-current assets.
|
(In millions) |
2014 |
2013 |
2012 |
|||||||||
|
Revenue (by location of customers): |
||||||||||||
|
United States |
$ | 512.5 | $ | 460.9 | $ | 475.5 | ||||||
|
All other countries |
471.7 | 473.3 | 441.8 | |||||||||
|
Total revenue |
$ | 984.2 | $ | 934.2 | $ | 917.3 | ||||||
|
(In millions) |
2014 |
2013 |
2012 |
|||||||||
|
Long-lived assets: |
||||||||||||
|
United States |
$ | 99.0 | $ | 79.4 | $ | 75.0 | ||||||
|
Brazil |
12.5 | 14.0 | 15.7 | |||||||||
|
All other countries |
41.3 | 45.8 | 43.2 | |||||||||
|
Total long-lived assets |
$ | 152.8 | $ | 139.2 | $ | 133.9 | ||||||
Other business segment information
|
Capital Expenditures |
Depreciation and Amortization |
Research and Development Expense |
||||||||||||||||||||||||||||||||||
|
(In millions) |
2014 |
2013 |
2012 |
2014 |
2013 |
2012 |
2014 |
2013 |
2012 |
|||||||||||||||||||||||||||
|
JBT FoodTech |
$ | 32.8 | $ | 27.7 | $ | 22.7 | $ | 22.2 | $ | 22.0 | $ | 20.7 | $ | 12.1 | $ | 11.2 | $ | 10.8 | ||||||||||||||||||
|
JBT AeroTech |
2.5 | 1.0 | 1.3 | 1.8 | 1.8 | 1.9 | 2.5 | 2.8 | 3.5 | |||||||||||||||||||||||||||
|
Corporate |
1.4 | 0.5 | 0.7 | 1.3 | 1.2 | 1.0 | - | - | - | |||||||||||||||||||||||||||
|
Total |
$ | 36.7 | $ | 29.2 | $ | 24.7 | $ | 25.3 | $ | 25.0 | $ | 23.6 | $ | 14.6 | $ | 14.0 | $ | 14.3 | ||||||||||||||||||
NOTE 17. RESTRUCTURING
Restructuring costs primarily consist of employee separation benefits under our existing severance programs, foreign statutory termination benefits, certain one-time termination benefits, contract termination costs, asset impairment charges and other costs that are associated with restructuring actions. Certain restructuring charges are accrued prior to payments made in accordance with applicable guidance. For such charges, the amounts are determined based on estimates prepared at the time the restructuring actions were approved by management.
During the fourth quarter of 2013, we implemented a restructuring plan that included management changes both in the U.S. and in non-U.S. subsidiaries. We incurred severance costs of $1.6 million in connection with this plan in the fourth quarter of 2013. We expect to complete the plan in 2015.
In the first quarter of 2014, we implemented a plan to optimize the overall JBT cost structure on a global basis. The initiatives under this plan include streamlining operations, consolidating certain facilities and enhancing the Company’s general and administrative infrastructure. Remaining payments required under this plan are expected to be paid during 2015.
Additional information regarding the restructuring activities is presented in the tables below:
|
(In millions) |
||||||||||||
|
Charges incurred during the twelve months ended December 31, |
||||||||||||
|
2014 |
2013 |
2012 |
||||||||||
|
Severance and related expense |
$ | 11.1 | $ | 1.6 | $ | 0.1 | ||||||
|
Asset write-offs |
0.5 | - | - | |||||||||
|
Other |
2.9 | - | - | |||||||||
|
Total Restructuring charges |
$ | 14.5 | $ | 1.6 | $ | 0.1 | ||||||
While restructuring charges are excluded from our calculation of segment operating profit, the table below presents the restructuring charges associated with each segment and with corporate activities for the years ended on December 31:
|
(In millions) |
2014 |
2013 |
2012 |
|||||||||
|
JBT FoodTech |
$ | 11.1 | $ | 0.6 | $ | 0.1 | ||||||
|
JBT AeroTech |
1.5 | - | - | |||||||||
|
Corporate |
1.9 | 1.0 | - | |||||||||
|
Total Restructuring charges |
$ | 14.5 | $ | 1.6 | $ | 0.1 | ||||||
Liability balances for restructuring activities are included in other current liabilities in the accompanying consolidated balance sheets. The table below details the activity in 2014:
|
(In millions) |
Balance as of December 31, 2013 |
Charged to Earnings |
Payments Made /Charges Applied |
Balance as of December 31, 2014 |
||||||||||||
|
Severance and related expense |
$ | 1.6 | $ | 11.1 | $ | (5.1 | ) | $ | 7.6 | |||||||
|
Asset write-offs |
- | 0.5 | (0.5 | ) | - | |||||||||||
|
Other |
- | 2.9 | (2.9 | ) | - | |||||||||||
|
Total |
$ | 1.6 | $ | 14.5 | $ | (8.5 | ) | $ | 7.6 | |||||||
NOTE 18. QUARTERLY INFORMATION (UNAUDITED)
|
(In millions, except per share data and common stock prices) |
2014 |
2013 |
||||||||||||||||||||||||||||||
|
4th Qtr. |
3rd Qtr. |
2nd Qtr. |
1st Qtr. |
4th Qtr. |
3rd Qtr. |
2nd Qtr. |
1st Qtr. |
|||||||||||||||||||||||||
|
Revenue |
$ | 295.4 | $ | 243.2 | $ | 247.6 | $ | 198.0 | $ | 288.1 | $ | 233.5 | $ | 226.9 | $ | 185.7 | ||||||||||||||||
|
Cost of sales |
219.2 | 179.0 | 179.3 | 146.0 | 218.8 | 179.3 | 167.8 | 135.4 | ||||||||||||||||||||||||
|
Income (loss) from continuing operations |
15.1 | 9.0 | 11.4 | (4.7 | ) | 13.7 | 7.4 | 8.8 | 4.1 | |||||||||||||||||||||||
|
Income (loss) from discontinued operations, net of tax |
0.1 | - | - | (0.1 | ) | (0.1 | ) | (0.6 | ) | (0.2 | ) | - | ||||||||||||||||||||
|
Net income |
$ | 15.2 | $ | 9.0 | $ | 11.4 | $ | (4.8 | ) | $ | 13.6 | $ | 6.8 | $ | 8.6 | $ | 4.1 | |||||||||||||||
|
Basic earnings per share (1): |
||||||||||||||||||||||||||||||||
|
Income (loss) from continuing operations |
$ | 0.51 | $ | 0.30 | $ | 0.39 | $ | (0.16 | ) | $ | 0.47 | $ | 0.25 | $ | 0.30 | $ | 0.14 | |||||||||||||||
|
Loss from discontinued operations, net of tax |
0.01 | - | - | - | - | (0.02 | ) | (0.01 | ) | - | ||||||||||||||||||||||
|
Net income |
$ | 0.52 | $ | 0.30 | $ | 0.39 | $ | (0.16 | ) | $ | 0.47 | $ | 0.23 | $ | 0.29 | $ | 0.14 | |||||||||||||||
|
Diluted earnings per share (1): |
||||||||||||||||||||||||||||||||
|
Income (loss) from continuing operations |
$ | 0.51 | $ | 0.30 | $ | 0.38 | $ | (0.16 | ) | $ | 0.46 | $ | 0.25 | $ | 0.30 | $ | 0.14 | |||||||||||||||
|
Income (loss) from discontinued operations, net of tax |
- | - | - | - | - | (0.02 | ) | (0.01 | ) | - | ||||||||||||||||||||||
|
Net income |
$ | 0.51 | $ | 0.30 | $ | 0.38 | $ | (0.16 | ) | $ | 0.46 | $ | 0.23 | $ | 0.29 | $ | 0.14 | |||||||||||||||
|
Dividends declared per share |
$ | 0.09 | $ | 0.09 | $ | 0.09 | $ | 0.09 | $ | 0.09 | $ | 0.09 | $ | 0.09 | $ | 0.07 | ||||||||||||||||
|
Weighted average shares outstanding |
||||||||||||||||||||||||||||||||
|
Basic |
29.6 | 29.6 | 29.5 | 29.4 | 29.3 | 29.2 | 29.2 | 29.2 | ||||||||||||||||||||||||
|
Diluted |
29.9 | 29.9 | 29.8 | 29.4 | 29.8 | 29.7 | 29.6 | 29.5 | ||||||||||||||||||||||||
|
Common stock sales price |
||||||||||||||||||||||||||||||||
|
High |
$ | 33.99 | $ | 31.53 | $ | 31.74 | $ | 32.83 | $ | 30.00 | $ | 24.97 | $ | 22.22 | $ | 21.21 | ||||||||||||||||
|
Low |
$ | 27.02 | $ | 25.52 | $ | 27.83 | $ | 28.24 | $ | 24.66 | $ | 21.01 | $ | 19.26 | $ | 17.78 | ||||||||||||||||
|
(1) |
Basic and diluted earnings per share (EPS) are computed independently for each of the periods presented. Accordingly, the sum of the quarterly EPS amounts may not agree to the annual total. |
NOTE 19. SUBSEQUENT EVENTS
On February 25, 2015, the Board of Directors approved a quarterly cash dividend of $0.09 per share of outstanding common stock. The dividend will be paid on March 23, 2015 to stockholders of record at the close of business on March 9, 2015.
On February 10, 2015, we entered into a new five-year $450 million revolving credit facility, with Wells Fargo Securities, LLC as lead arranger, and repaid our existing revolving credit facility. This credit facility permits borrowings in the U.S. and in The Netherlands. Borrowings bear interest, at our option, at LIBOR or an alternative base rate, which is the greater of Wells Fargo’s Prime Rate, the Federal Funds Rate plus 50 basis points, and LIBOR plus 1%, plus, in each case, a margin dependent on our leverage ratio. We must also pay an annual commitment fee of 15.0 to 30.0 basis points dependent on our leverage ratio. The credit agreement evidencing the facility contains customary representations, warranties, and covenants, including a minimum interest coverage ratio and minimum leverage ratio, as well as certain events of default.
Schedule II—Valuation and Qualifying Accounts
|
(In thousands) |
Additions |
|||||||||||||||||||
|
Decription |
Balance at beginning of period |
charged to costs and expenses |
charged to other accounts (a) |
Deductions and other (b) |
Balance at end of period |
|||||||||||||||
|
Year ended December 31, 2012: |
||||||||||||||||||||
|
Allowance for doubtful accounts |
$ | 4,281 | $ | 1,077 | $ | - | $ | 1,680 | $ | 3,678 | ||||||||||
|
Valuation allowance for deferred tax assets |
$ | 779 | $ | - | $ | - | $ | 230 | $ | 549 | ||||||||||
|
Year ended December 31, 2013: |
||||||||||||||||||||
|
Allowance for doubtful accounts |
$ | 3,678 | $ | 2,479 | $ | - | $ | 2,415 | $ | 3,742 | ||||||||||
|
Valuation allowance for deferred tax assets |
$ | 549 | $ | - | $ | - | $ | 295 | $ | 254 | ||||||||||
|
Year ended December 31, 2014: |
||||||||||||||||||||
|
Allowance for doubtful accounts |
$ | 3,742 | $ | 1,630 | $ | - | $ | 2,330 | $ | 3,042 | ||||||||||
|
Valuation allowance for deferred tax assets |
$ | 254 | $ | - | $ | - | $ | 254 | $ | - | ||||||||||
(a) – “Additions charged to other accounts” includes translation adjustments and allowances added through business combinations.
(b) – “Deductions and other” includes translation adjustments, write-offs, net of recoveries, and reductions in the allowances credited to expense.
See accompanying Report of Independent Registered Public Accounting Firm.
|
ITEM 9. |
CHANGES IN AND DISAGREEMENTS WITH ACCOUNTANTS ON ACCOUNTING AND FINANCIAL DISCLOSURE |
None.
|
ITEM 9A. |
CONTROLS AND PROCEDURES |
|
(a) |
Disclosure Controls and Procedures |
As of the end of the period covered by this Annual Report on Form 10-K, we carried out an evaluation of the effectiveness of the design and operation of our disclosure controls and procedures. Based upon that evaluation, our Chief Executive Officer and Chief Financial Officer concluded that our disclosure controls and procedures were effective to ensure that information required to be disclosed by us in reports we file or submit under the Exchange Act is (1) recorded, processed, summarized and reported within the time periods specified in SEC rules and forms, and (2) accumulated and communicated to our management, including our Chief Executive Officer and Chief Financial Officer, to allow timely decisions regarding required disclosure.
|
(b) |
Management’s Annual Report on Internal Control over Financial Reporting |
Internal control over financial reporting is defined in Rule 13a-15(f) promulgated under the Securities Exchange Act of 1934, as a process designed by, or under the supervision of, the Company’s principal executive and principal financial officers and effected by the Company’s Board, management and other personnel, to provide reasonable assurance regarding the reliability of financial reporting and the preparation of financial statements for external purposes in accordance with U.S. generally accepted accounting principles (GAAP) and includes those policies and procedures that:
|
(i) |
pertain to the maintenance of records that in reasonable detail accurately and fairly reflect the transactions and dispositions of assets of the Company; |
|
(ii) |
provide reasonable assurance that transactions are recorded as necessary to permit preparation of financial statements in accordance with GAAP, and that receipts and expenditures of the Company are being made only in accordance with authorizations of management and directors of the Company; and |
|
(iii) |
provide reasonable assurance regarding prevention or timely detection of unauthorized acquisition, use or disposition of the Company’s assets that could have a material effect on the financial statements. |
Because of its inherent limitations, internal control over financial reporting may not prevent or detect misstatements. Projections of any evaluation of effectiveness to future periods are subject to the risk that controls may become inadequate because of changes in conditions, or that the degree of compliance with the policies or procedures may deteriorate. Management’s report on internal control over financial reporting is set forth below and should be read with these limitations in mind.
Our management is responsible for establishing and maintaining adequate internal control over financial reporting. Under the supervision and with the participation of our management, including our Chief Executive Officer and Chief Financial Officer, we conducted an evaluation of the effectiveness of the Company’s internal control over financial reporting based upon the framework in Internal Control – Integrated Framework (1992) issued by the Committee of Sponsoring Organizations of the Treadway Commission. Based on that evaluation, our management concluded that the Company’s internal control over financial reporting is effective as of December 31, 2014.
The Company completed the acquisitions of Formcook AB, ICS Solutions and Wolf-Tec, Inc. during 2014, and management excluded the internal control over financial reporting of all of these businesses from its assessment of the Company’s internal control over financial reporting as of December 31, 2014. The consolidated financial statements of John Bean Technologies Corporation and subsidiaries as of and for the year ended December 31, 2014 reflect total assets of approximately $102 million and total revenues of approximately $16 million associated with these acquired businesses.
Attestation Report of the Registered Public Accounting Firm
KPMG LLP, the Company’s independent registered public accounting firm, has issued their report, included herein on page 74, on the effectiveness of the Company’s internal control over financial reporting.
|
(c) |
Changes in Internal Control over Financial Reporting |
In the ordinary course of business, we review our system of internal control over financial reporting and make changes to our systems and processes to improve such controls and increase efficiency, while ensuring that we maintain an effective internal control environment. Changes may include such activities as implementing new, more efficient systems, automating manual processes and updating existing systems. For example, in the first quarter of 2014, we implemented a plan to enhance the Company’s general and administrative infrastructure. This included centralizing certain administrative and transaction functions in North America to leverage a shared services model. As a result of the transition of these accounting operations to a central location, the personnel responsible for executing controls over the processing of transactions in certain processes changed beginning in the third quarter of 2014, when the central location began processing transactions. This transition process will continue through 2015. Management believes it took the necessary steps to maintain appropriate internal controls and to monitor their operation during the period of change. The implementation of shared services will allow us to be more efficient and further enhance our internal control over financial reporting.
Other than as noted above, there were no changes in controls identified in the evaluation for the quarter ended December 31, 2014 that have materially affected, or are reasonably likely to materially affect, our internal control over financial reporting, as defined in Rule 13a-15(f) under the Exchange Act.
Report of Independent Registered Public Accounting Firm
The Board of Directors and Stockholders
John Bean Technologies Corporation:
We have audited John Bean Technologies Corporation’s (the Company) internal control over financial reporting as of December 31, 2014, based on criteria established in Internal Control – Integrated Framework (1992) issued by the Committee of Sponsoring Organizations of the Treadway Commission (COSO). John Bean Technologies Corporation’s management is responsible for maintaining effective internal control over financial reporting and for its assessment of the effectiveness of internal control over financial reporting, included in the accompanying Management’s Annual Report on Internal Control over Financial Reporting in Item 9A: Controls and Procedures. Our responsibility is to express an opinion on the Company’s internal control over financial reporting based on our audit.
We conducted our audit in accordance with the standards of the Public Company Accounting Oversight Board (United States). Those standards require that we plan and perform the audit to obtain reasonable assurance about whether effective internal control over financial reporting was maintained in all material respects. Our audit included obtaining an understanding of internal control over financial reporting, assessing the risk that a material weakness exists, and testing and evaluating the design and operating effectiveness of internal control based on the assessed risk. Our audit also included performing such other procedures as we considered necessary in the circumstances. We believe that our audit provides a reasonable basis for our opinion.
A company’s internal control over financial reporting is a process designed to provide reasonable assurance regarding the reliability of financial reporting and the preparation of financial statements for external purposes in accordance with generally accepted accounting principles. A company’s internal control over financial reporting includes those policies and procedures that (1) pertain to the maintenance of records that, in reasonable detail, accurately and fairly reflect the transactions and dispositions of the assets of the company; (2) provide reasonable assurance that transactions are recorded as necessary to permit preparation of financial statements in accordance with generally accepted accounting principles, and that receipts and expenditures of the company are being made only in accordance with authorizations of management and directors of the company; and (3) provide reasonable assurance regarding prevention or timely detection of unauthorized acquisition, use, or disposition of the company’s assets that could have a material effect on the financial statements.
Because of its inherent limitations, internal control over financial reporting may not prevent or detect misstatements. Also, projections of any evaluation of effectiveness to future periods are subject to the risk that controls may become inadequate because of changes in conditions, or that the degree of compliance with the policies or procedures may deteriorate.
In our opinion, John Bean Technologies Corporation maintained, in all material respects, effective internal control over financial reporting as of December 31, 2014, based on criteria established in Internal Control – Integrated Framework (1992) issued by the Committee of Sponsoring Organizations of the Treadway Commission.
The Company completed the acquisitions of Formcook AB, ICS Solutions and Wolf-Tec, Inc. during 2014, and management excluded the internal control over financial reporting of all of these businesses from its assessment of the Company’s internal control over financial reporting as of December 31, 2014. The consolidated financial statements of John Bean Technologies Corporation and subsidiaries as of and for the year ended December 31, 2014 reflect total assets of approximately $102 million and total revenues of approximately $16 million associated with these acquired businesses. Our audit of internal control over financial reporting of the Company also excluded an evaluation of the internal control over financial reporting of the acquired businesses as of December 31, 2014.
We also have audited, in accordance with the standards of the Public Company Accounting Oversight Board (United States), the consolidated balance sheets of John Bean Technologies Corporation and subsidiaries as of December 31, 2014 and 2013, and the related consolidated statements of income, comprehensive income (loss), changes in stockholders’ equity, and cash flows for each of the years in the three-year period ended December 31, 2014 and financial statement schedule II, and our report dated March 2, 2015 expressed an unqualified opinion on those consolidated financial statements.
/s/ KPMG LLP
Chicago, Illinois
March 2, 2015
PART III
|
ITEM 10. |
DIRECTORS, EXECUTIVE OFFICERS AND CORPORATE GOVERNANCE |
We have a code of ethics entitled the “Code of Business Conduct and Ethics” that applies to our employees, including our principal executive and financial officers (including our principal executive officer, principal financial officer and principal accounting officer) as well as our directors. A copy of our Code of Business Conduct and Ethics may be found on our website at www.jbtcorporation.com under “Investor Relations – Corporate Governance” and is available in print to stockholders without charge by submitting a request to the General Counsel and Secretary of JBT Corporation, 70 West Madison Street, Suite 4400, Chicago, Illinois 60602.
We also elect to disclose the information required by Form 8-K, Item 5.05, “Amendments to the registrant’s code of ethics, or waiver of a provision of the code of ethics,” through our website, and such information will remain available on our website for at least a twelve-month period.
Information regarding our executive officers is presented in the section entitled “Executive Officers of the Registrant” in Part I of this Annual Report on Form 10-K.
Other information required by this Item can be found in the Proxy Statement for our 2015 Annual Meeting of Stockholders and is incorporated herein by reference.
|
ITEM 11. |
EXECUTIVE COMPENSATION |
Information required by this item can be found in the sections entitled “Director Compensation,” “Compensation Committee Interlocks and Insider Participation in Compensation Decisions” and “Executive Compensation” of the Proxy Statement for our 2015 Annual Meeting of Stockholders and is incorporated herein by reference.
|
ITEM 12. |
SECURITY OWNERSHIP OF CERTAIN BENEFICIAL OWNERS AND MANAGEMENT AND RELATED STOCKHOLDER MATTERS |
Information required by this item can be found in the sections entitled “Security Ownership of John Bean Technologies Corporation” of the Proxy Statement for our 2015 Annual Meeting of Stockholders and is incorporated herein by reference.
|
ITEM 13. |
CERTAIN RELATIONSHIPS AND RELATED TRANSACTIONS, AND DIRECTOR INDEPENDENCE |
Information required by this item can be found in the sections entitled “Transactions with Related Persons” and “Director Independence” of the Proxy Statement for our 2015 Annual Meeting of Stockholders and is incorporated herein by reference.
|
ITEM 14. |
PRINCIPAL ACCOUNTANT FEES AND SERVICES |
Information required by this item can be found in the section entitled “Ratification of Appointment of Independent Registered Public Accounting Firm” of the Proxy Statement for our 2015 Annual Meeting of Stockholders and is incorporated herein by reference.
PART IV
|
ITEM 15. |
EXHIBITS AND FINANCIAL STATEMENT SCHEDULES |
|
(a) |
The following documents are filed as part of this Report: |
|
1. |
Financial Statements: The consolidated financial statements required to be filed in this Annual Report on Form 10-K are listed below and appear on pages 43 through 70 herein: |
INDEX TO CONSOLIDATED FINANCIAL STATEMENTS
|
Report of Independent Registered Public Accounting Firm |
42 |
|
Consolidated Statements of Income and Consolidated Statements of Comprehensive Income (Loss) for the Years Ended December 31, 2014, 2013 and 2012 |
43 |
|
Consolidated Balance Sheets as of December 31, 2014 and 2013 |
44 |
|
Consolidated Statements of Cash Flows for the Years Ended December 31, 2014, 2013 and 2012 |
45 |
|
Consolidated Statements of Changes in Stockholders’ Equity for the Years Ended December 31, 2014, 2013 and 2012 |
46 |
|
Notes to Consolidated Financial Statements |
47 |
|
2. |
Financial Statement Schedule: Schedule II—Valuation and Qualifying Accounts is included in this Annual Report on Form 10-K on page 71. All other schedules are omitted because of the absence of conditions under which they are required or because information called for is shown in the consolidated financial statements and notes thereto in Item 8 of this Annual Report on Form 10-K. |
|
3. |
Exhibits: |
See Index of Exhibits below for a list of the exhibits being filed or furnished with or incorporated by reference to this Annual Report on Form 10-K.
INDEX OF EXHIBITS
|
Exhibit Number |
|
Exhibit Description |
|
|
|
|
| |
|
2.1 |
|
Separation and Distribution Agreement between FMC Technologies, Inc. and John Bean Technologies Corporation (“JBT Corporation”), incorporated by reference to Exhibit 2.1 to our Current Report on Form 8-K filed with the SEC on August 6, 2008. | |
|
|
|
| |
|
2.1A |
|
Amendment to Separation and Distribution Agreement between FMC Technologies, Inc. and John Bean Technologies Corporation, incorporated by reference to Exhibit 2.1 to our Current Report on Form 8-K filed with the SEC on November 4, 2010. | |
|
|
|
| |
|
3.1 |
|
Amended and Restated Certificate of Incorporation of JBT Corporation, incorporated by reference to Exhibit 3.1 to our Annual Report on Form 10-K filed with the SEC on March 11, 2009. | |
|
|
|
| |
|
3.2 |
|
Certificate of Designations of Series A Junior Participating Preferred Stock of JBT Corporation, incorporated by reference to Exhibit 3.1 to our Current Report on Form 8-K filed with the SEC on August 6, 2008. | |
|
|
|
| |
|
3.3 |
|
Amended and Restated By-Laws of JBT Corporation, incorporated by reference to Exhibit 3.3 to our Annual Report on Form 10-K filed with the SEC on March 11, 2009. | |
|
|
|
| |
|
3.4 |
|
First Amendment to Amended and Restated By-Laws of JBT Corporation, incorporated by reference to Exhibit 3.2 to our Quarterly Report on Form 10-Q filed with the SEC on May 8, 2009. | |
|
3.5 |
Second Amendment to Amended and Restated Bylaws of John Bean Technologies, Inc., incorporated by reference to Exhibit 3.1 of the registrant’s Current Report on Form 8-K filed on May 13, 2014. | ||
|
3.6 |
Second Amended and Restated Bylaws of John Bean Technologies, Inc. incorporated by reference to Exhibit 3.1 of the registrant’s Current Report on Form 8-K filed on August 19, 2014. | ||
|
4.1 |
|
Specimen common stock certificate of JBT Corporation, incorporated by reference to Exhibit 4.1 to Amendment No. 3 to our Form 10 filed with the SEC on July 14, 2008. | |
|
|
|
| |
|
4.2 |
|
Rights Agreement between JBT Corporation and National City Bank, as rights agent, incorporated by reference to Exhibit 4.2 to our Current Report on Form 8-K filed with the SEC on August 6, 2008. | |
|
|
|
| |
|
4.3 |
|
Note Purchase Agreement between JBT Corporation and certain institutional purchasers, incorporated by reference to Exhibit 4.1 to our Current Report on Form 8-K filed with the SEC on August 6, 2008. | |
|
|
|
| |
|
10.1 |
|
Credit Agreement dated November 30, 2012, among JBT Corporation, John Bean Technologies, B.V., John Bean Technologies AB, JP Morgan Chase Bank, N.A. and the other lenders and parties signatories thereto, incorporated by reference to our Current Report on Form 8-K filed with the SEC on December 3, 2012. | |
|
|
|
| |
|
10.2 |
|
Tax Sharing Agreement between JBT Corporation and FMC Technologies, Inc. incorporated by reference to Exhibit 10.1 to our Current Report on Form 8-K filed with the SEC on August 6, 2008. | |
|
10.3 |
|
Trademark License Agreement between JBT Corporation and FMC Technologies, Inc., incorporated by reference to Exhibit 10.2 to our Current Report on Form 8-K filed with the SEC on August 6, 2008. | |
|
|
|
| |
|
10.4 |
|
Trademark Assignment and Coexistence Agreement between JBT Corporation and FMC Technologies, Inc., incorporated by reference to Exhibit 10.3 to our Current Report on Form 8-K filed with the SEC on August 6, 2008. | |
|
|
|
| |
|
10.5 |
|
John Bean Technologies Corporation Incentive Compensation and Stock Plan, incorporated by reference to Exhibit 10.4 to our Current Report on Form 8-K filed with the SEC on August 6, 2008.1 | |
|
|
|
| |
|
10.5A |
|
Form of Nonqualified Stock Option Agreement, incorporated by reference to Exhibit 10.4A to our Current Report on Form 8-K filed with the SEC on August 6, 2008. 1 | |
|
|
|
| |
|
10.5B |
|
Form of [International] Nonqualified Stock Option Agreement, incorporated by reference to Exhibit 10.4B to our Current Report on Form 8-K filed with the SEC on August 6, 2008. 1 | |
|
|
|
| |
|
10.5C |
|
Form of Long-Term Incentive Performance Share Restricted Stock Agreement, incorporated by reference to Exhibit 10.4C to our Current Report on Form 8-K filed with the SEC on August 6, 2008. 1 | |
|
|
|
| |
|
10.5D |
|
Form of Key Managers Restricted Stock Agreement, incorporated by reference to Exhibit 10.4D to our Current Report on Form 8-K filed with the SEC on August 6, 2008. 1 | |
|
|
|
| |
|
10.5E |
|
Form of Restricted Stock Agreement for Non-Employee Directors, incorporated by reference to Exhibit 10.4E to our Current Report on Form 8-K filed with the SEC on August 6, 2008. 1 | |
|
|
|
| |
|
10.5F |
|
Form of Performance Units Award Agreement, incorporated by reference to Exhibit 10.4F to our Current Report on Form 8-K filed with the SEC on August 6, 2008. 1 | |
|
|
|
| |
|
10.5G |
|
Form of Long-Term Incentive Restricted Stock Agreement, incorporated by reference to Exhibit 10.4G to our Current Report on Form 8-K filed with the SEC on August 6, 2008. 1 | |
|
|
|
| |
|
10.5H |
|
Form of Long-Term Incentive Restricted Stock Unit Agreement, incorporated by reference to Exhibit 10.5H to our Annual Report on Form 10-K filed with the SEC on March 3, 2011. 1 | |
|
|
|
| |
|
10.5I |
|
Form of Long-Term Incentive Performance Share Restricted Stock Unit Agreement, incorporated by reference to Exhibit 10.5H to our Annual Report on Form 10-K filed with the SEC on March 3, 2011. 1 | |
|
|
|
| |
|
10.5J |
|
Updated Form of Long-Term Incentive Restricted Stock Unit Agreement, incorporated by reference to our Annual Report on Form 10-K filed with the SEC on March 7, 2013. 1 | |
|
|
|
| |
|
10.5K |
|
Updated Form of Long-Term Incentive Performance Share Restricted Stock Unit Agreement, incorporated by reference to our Annual Report on Form 10-K filed with the SEC on March 7, 2013. 1 | |
|
10.5L |
|
Form of Long-Term Incentive Performance Cash Award Agreement, incorporated by reference to our Annual Report on Form 10-K filed with the SEC on March 7, 2013. 1 | |
|
|
|
| |
|
10.5M* |
Updated Form of Long-Term Incentive Restricted Stock Unit Agreement. 1 | ||
|
10.5N* |
Updated Form of Long-Term Incentive Performance Restricted Stock Unit Agreement. 1 | ||
|
10.5O* |
Updated Form of Long-Term Incentive Restricted Stock Unit Agreement – Executive Officer. 1 | ||
|
10.5P* |
Updated Form of Long-Term Incentive Performance Restricted Stock Unit Agreement – Executive Officer. 1 | ||
|
10.6 |
Amendment No. 1 to John Bean Technologies Corporation Incentive Compensation and Stock Plan, incorporated by reference to Exhibit 10.2 to our Quarterly Report on Form 10-Q filed with the SEC on November 14, 2008. 1 | ||
|
10.6A |
Amendment No. 2 to John Bean Technologies Corporation Incentive Compensation and Stock Plan, incorporated by reference to Exhibit 10.6A to our Current Report on Form 8-K filed with the SEC on March 1, 2010. 1 | ||
|
10.6B |
Amendment No. 3 to John Bean Technologies Corporation Incentive Compensation and Stock Plan, incorporated by reference to Exhibit 10.6B to our Annual Report on Form 10-K filed with the SEC on March 7, 2014. 1 | ||
| 10.6C* |
Amendment No. 4 to John Bean Technologies Corporation Incentive Compensation and Stock Plan. 1 | ||
|
10.7 |
JBT Corporation Non-Qualified Savings and Investment Plan, incorporated by reference to Exhibit 10.5 to our Current Report on Form 8-K filed with the SEC on August 6, 2008. 1 | ||
|
10.7A |
|
First Amendment of JBT Corporation Non-Qualified Savings and Investment Plan, incorporated by reference to Exhibit 10.1 to our Current Report on Form 8-K filed with the SEC on September 18, 2009. 1 | |
|
|
|
| |
|
10.7B |
|
Second Amendment of JBT Corporation Non-Qualified Savings and Investment Plan, incorporated by reference to Exhibit 10.5 to our Quarterly Report on Form 10-Q filed with the SEC on November 6, 2009. 1 | |
|
10.7C* |
|
Third Amendment of JBT Corporation Non-Qualified Savings and Investment Plan. 1 | |
|
|
|
| |
|
10.8 |
|
International Non-Qualified Savings and Investment Plan, incorporated by reference to Exhibit 10.6 to our Current Report on Form 8-K filed with the SEC on August 6, 2008. 1 | |
|
|
|
| |
|
10.9 |
|
JBT Corporation Salaried Employees’ Equivalent Retirement Plan, incorporated by reference to Exhibit 10.7 to our Current Report on Form 8-K filed with the SEC on August 6, 2008. 1 | |
|
|
|
| |
|
10.9A |
|
First Amendment of JBT Corporation Salaried Employees’ Equivalent Retirement Plan, incorporated by reference to Exhibit 10.1 to our Current Report on Form 8-K filed with the SEC on September 15, 2009. 1 | |
|
|
|
| |
|
10.9B |
|
Second Amendment of JBT Corporation Salaried Employees’ Equivalent Retirement Plan, incorporated by reference to Exhibit 10.6 to our Quarterly Report on Form 10-Q filed with the SEC on November 6, 2009. 1 | |
|
|
|
| |
|
10.10 |
|
Form of JBT Corporation Executive Severance Agreement, incorporated by reference to Exhibit 10.12 to our Annual Report on Form 10-K filed with the SEC on March 11, 2009. 1 | |
|
|
|
| |
|
10.10A |
|
Form of Amended and Restated JBT Corporation Executive Severance Agreement, incorporated by reference to Exhibit 10.1 to our Current Report on Form 8-K filed with the SEC on December 21, 2011. 1 | |
|
|
|
| |
|
10.10B |
|
Form of First Amendment to John Bean Technologies Corporation Amended and Restated Executive Severance Agreement, incorporated by reference to Exhibit 10.1 to our Current Report on Form 8-K filed with the SEC on January 2, 2013. 1 | |
|
10.11 |
|
JBT Corporation Employees’ Retirement Program - Part I Salaried and Nonunion Hourly Employees Retirement Program and Part II Union Hourly Employees’ Retirement Plan, incorporated by reference to Exhibit 10.5 to Amendment No. 3 to our Form 10/A filed with the SEC on July 3, 2008. 1 | |
|
10.11A |
|
First Amendment of JBT Corporation Employees’ Retirement Program - Part I Salaried and Nonunion Hourly Employees Retirement Program, incorporated by reference to Exhibit 10.2 to our Current Report on Form 8-K filed with the SEC on September 15, 2009. 1 | |
|
|
|
| |
|
10.11B |
|
Second Amendment of JBT Corporation Employees’ Retirement Program - Part I Salaried and Nonunion Hourly Employees Retirement Plan, incorporated by reference to Exhibit 10.11B to our Annual Report on Form 10-K filed with the SEC on March 4, 2010. 1 | |
|
|
|
||
|
10.11C |
|
First Amendment of JBT Corporation Employees’ Retirement Program – Part II Union Hourly Employees Retirement Plan, incorporated by reference to Exhibit 10.11C to our Annual Report on Form 10-K filed with the SEC on March 4, 2010. 1 | |
|
|
|
| |
|
10.11D |
|
Second Amendment of JBT Corporation Employees’ Retirement Program – Part II Union Hourly Employees Retirement Plan, incorporated by reference to Exhibit 10.11D to our Quarterly Report on Form 10-Q filed with the SEC on November 3, 2011. 1 | |
|
|
|
| |
|
10.11E |
|
Third Amendment of JBT Corporation Employees’ Retirement Program – Part II Union Hourly Employees Retirement Plan, incorporated by reference to Exhibit 10.11E to our Quarterly Report on Form 10-Q filed with the SEC on November 3, 2011. 1 | |
|
|
|
| |
|
10.11F |
|
Amended and Restated John Bean Technologies Corporation Employees’ Retirement Program ● Part I Salaried and Nonunion Hourly Employees’ Retirement Program ● Part II Union Hourly Employees’ Retirement Program incorporated by reference to Exhibit 10.11F to our Quarterly Report on Form 10-Q filed with the SEC on August 8, 2012. 1 | |
|
10.11G |
First Amendment of Amended and Restated John Bean Technologies Corporation Employees’ Retirement Program ● Part I Salaried and Nonunion Hourly Employees’ Retirement Program incorporated by reference to Exhibit 10.11G to our Annual Report on Form 10-K filed with the SEC on March 7, 2014. 1 | ||
|
10.11H |
First Amendment of Amended and Restated John Bean Technologies Corporation Employees’ Retirement Program ● Part II Union Hourly Employees’ Retirement Program incorporated by reference to Exhibit 10.11H to our Annual Report on Form 10-K filed with the SEC on March 7, 2014. 1 | ||
|
10.11I* |
Second Amendment of Amended and Restated John Bean Technologies Corporation Employees’ Retirement Program ● Part II Union Hourly Employees’ Retirement Program 1 | ||
|
|
|
| |
|
10.12 |
|
JBT Corporation Savings and Investment Plan incorporated by reference to Exhibit 10.6 to Amendment No. 3 to our Form 10/A filed with the SEC on July 3, 2008. 1 | |
|
|
|
| |
|
10.12A |
|
First Amendment of JBT Corporation Savings and Investment Plan, incorporated by reference to Exhibit 10.6.1 to our Quarterly Report on Form 10-Q filed with the SEC on August 5, 2009. 1 | |
|
|
|
| |
|
10.12B |
|
Second Amendment of JBT Corporation Savings and Investment Plan, incorporated by reference to Exhibit 10.3 to our Current Report on Form 8-K filed with the SEC on September 15, 2009. 1 | |
|
|
|
| |
|
10.12C |
|
Third Amendment of JBT Corporation Savings and Investment Plan, incorporated by reference to Exhibit 10.12A to our Annual Report on Form 10-K filed with the SEC on March 4, 2010. 1 | |
|
|
|
| |
|
10.12D |
|
Fourth Amendment of JBT Corporation Savings and Investment Plan, incorporated by reference to Exhibit 10.12D to our Annual Report on Form 10-K filed with the SEC on March 4, 2010. 1 | |
|
|
|
| |
|
10.12E |
|
Fifth Amendment of JBT Corporation Savings and Investment Plan, incorporated by reference to Exhibit 10.12E to our Annual Report on Form 10-K filed with the SEC on March 3, 2011. 1 | |
|
10.12F |
|
Amended and Restated John Bean Technologies Corporation Savings and Investment Plan incorporated by reference to Exhibit 10.12F to our Quarterly Report on Form 10-Q filed with the SEC on August 8, 2012. 1 | |
|
|
|
| |
|
10.12G
|
|
First Amendment of Amended and Restated John Bean Technologies Corporation Savings and Investment Plan, incorporated by reference to Exhibit 10.12G to our Quarterly Report on Form 10-Q filed with the SEC on August 8, 2012. 1 | |
|
10.12H |
Second Amendment of Amended and Restated John Bean Technologies Corporation Savings and Investment Plan, incorporated by reference to Exhibit 10.12H to our Annual Report on Form 10-K filed with the SEC on March 7, 2013. 1 | ||
|
10.12I |
Third Amendment of Amended and Restated John Bean Technologies Corporation Savings and Investment Plan, incorporated by reference to Exhibit 10.12I to our Annual Report on Form 10-K filed with the SEC on March 7, 2013. 1 | ||
|
10.12J |
Fourth Amendment of Amended and Restated John Bean Technologies Corporation Savings and Investment Plan, incorporated by reference to Exhibit 10.12J to our Annual Report on Form 10-K filed with the SEC on March 7, 2013. 1 | ||
|
10.12K |
Fifth Amendment of Amended and Restated John Bean Technologies Corporation Savings and Investment Plan, incorporated by reference to Exhibit 10.12K to our Quarterly Report on Form 10-Q filed with the SEC on August 8, 2014. 1 | ||
|
10.12L |
Sixth Amendment of Amended and Restated John Bean Technologies Corporation Savings and Investment Plan, incorporated by reference to Exhibit 10.12L to our Quarterly Report on Form 10-Q filed with the SEC on August 8, 2014. 1 | ||
|
10.12M |
Seven Amendment of Amended and Restated John Bean Technologies Corporation Savings and Investment Plan, incorporated by reference to Exhibit 10.12M to our Quarterly Report on Form 10-Q filed with the SEC on August 8, 2014. 1 | ||
|
10.12N* |
Eighth Amendment of Amended and Restated John Bean Technologies Corporation Savings and Investment Plan. 1 | ||
|
10.12O* |
Ninth Amendment of Amended and Restated John Bean Technologies Corporation Savings and Investment Plan. 1 | ||
|
|
|
| |
|
10.13 |
Employment Agreement dated August 22, 2013, between JBT Corporation and Thomas W. Giacomini, incorporated by reference to Exhibit 10.1 to our Quarterly Report on Form10-Q filed with the SEC on November 1, 2013. 1 | ||
|
10.14 |
Executive Severance Plan, incorporated by reference to Exhibit 10.14 to our Annual Report on Form 10-K filed with the SEC on March 4, 2010. 1 | ||
|
10.14A |
Amended and Restated Executive Severance Plan, incorporated by reference to Exhibit 10.14A to our Annual Report on Form 10-K filed with the SEC on March 7, 2013. 1 | ||
|
10.15 |
Letter Agreement dated August 23, 2013 between JBT Corporation and Charles H. Cannon, Jr., incorporated by reference to Exhibit 10.2 to our Quarterly Report on Form 10-Q filed with the SEC on November 1, 2013. 1 | ||
|
10.16 |
Long Term Incentive Restricted Stock Unit Purchase Agreement pursuant to the JBT Corporation Incentive Compensation and Stock Plan issued to Thomas W. Giacomini on September 10, 2013, incorporated by reference to Exhibit 10.3 to our Quarterly Report on Form 10-Q filed with the SEC on November 1, 2013. 1 | ||
|
10.17 |
Long Term Incentive Restricted Stock Unit Purchase Agreement pursuant to the JBT Corporation Incentive Compensation and Stock Plan issued to Thomas W. Giacomini on September 10, 2013, incorporated by reference to Exhibit 10.17 to our Quarterly Report on Form 10-Q filed with the SEC on November 1, 2013. 1 | ||
|
10.18 |
Offer Letter to Brian A. Deck, incorporated by reference to Exhibit 10.18 to our Annual Report on Form 10-K filed with the SEC on March 7, 2013. 1 | ||
|
10.19 |
Severance Agreement and Release with John Lee, incorporated by reference to Exhibit 10.19 to our Annual Report on Form 10-K filed with the SEC on March 7, 2013. 1 | ||
|
10.20 |
Letter Agreement with Ronald A. Mambu, incorporated by reference to Exhibit 10.20 to our Annual Report on Form 10-K filed with the SEC on March 7, 2013. 1 | ||
|
10.21 |
Retirement Agreement among John Bean Technologies Corporation, John Bean Technologies AB and Olaf Torbjörn Arvidsson dated December 2, 2013, incorporated by reference to Exhibit 10.21 to our Quarterly Report on Form 10-Q filed with the SEC on May 7, 2014. 1 | ||
|
21.1* |
|
List of Subsidiaries of JBT Corporation. | |
|
|
|
| |
|
23.1* |
|
Consent of Independent Registered Public Accounting Firm. | |
|
|
|
| |
|
31.1* |
|
Certification of Principal Executive Officer Pursuant to Rule 13a-14(a). | |
|
|
|
| |
|
31.2* |
|
Certification of Principal Financial Officer Pursuant to Rule 13a-14(a). | |
|
|
|
| |
|
32.1* |
|
Certification of Principal Executive Officer Pursuant to 18 U.S.C. 1350, as adopted pursuant to Section 906 of the Sarbanes-Oxley Act of 2002. | |
|
|
|
| |
|
32.2* |
|
Certification of Principal Financial Officer Pursuant to 18 U.S.C. 1350, as adopted pursuant to Section 906 of the Sarbanes-Oxley Act of 2002. | |
|
|
|
| |
|
101*+ |
|
The following materials from John Bean Technologies Corporation’s Annual Report on Form 10-K for the year ended December 31, 2014, formatted in XBRL (eXtensible Business Reporting Language): (i) Consolidated Statements of Income, (ii) Consolidated Balance Sheets, (iii) Consolidated Statements of Cash Flows, and (iv) Notes to Consolidated Financial Statements. | |
|
1 |
A management contract or compensatory plan required to be filed with this report. | |
|
|
* |
Filed herewith |
|
|
+ |
Pursuant to Rule 406T of Regulation S-T, the Interactive Data Files on Exhibit 101 hereto are deemed not filed or part of a registration statement or prospectus for purposes of Sections 11 or 12 of the Securities Act of 1933, as amended, are deemed not filed for purposes of Section 18 of the Securities and Exchange Act of 1934, as amended, and otherwise are not subject to liability under those sections. |
SIGNATURES
Pursuant to the requirements of Section 13 or 15(d) of the Securities Exchange Act of 1934, the registrant has duly caused this report to be signed on its behalf by the undersigned, thereunto duly authorized.
|
John Bean Technologies Corporation (Registrant) | ||
|
By: |
/s/ THOMAS W. GIACOMINI | |
|
|
Thomas W. Giacomini | |
|
|
President and Chief Executive Officer (Principal Executive Officer) | |
Date: March 2, 2015
Pursuant to the requirements of the Securities Exchange Act of 1934, this report has been signed below by the following persons on behalf of the registrant and in the capacities and on the date indicated.
|
Signature |
|
Title |
|
Date | ||
| /s/ THOMAS W. GIACOMINI | President and | March 2, 2015 | ||||
|
|
|
Chief Executive Officer |
|
| ||
|
Thomas W. Giacomini |
|
(Principal Executive Officer) |
||||
| /s/ Brian A. Deck | Executive Vice President and | March 2, 2015 | ||||
|
|
|
Chief Financial Officer |
|
| ||
|
Brian A. Deck |
|
(Principal Financial Officer) |
||||
| /s/ MEGAN J. Rattigan | Vice President and Controller | March 2, 2015 | ||||
| (Principal Accounting Officer) | ||||||
|
Megan J. Rattigan |
|
|
||||
| /s/ C. MAURY DEVINE | Director | March 2, 2015 | ||||
|
|
||||||
|
C. Maury Devine |
|
|
|
|||
| /s/ EDWARD L. DOHENY, II | Director | March 2, 2015 | ||||
|
Edward L. Doheny, II |
|
|
||||
| /s/ ALAN D. FELDMAN | Director | March 2, 2015 | ||||
|
Alan D. Feldman |
|
|
||||
| / s/ JAMES E. GOODWIN | Director | March 2, 2015 | ||||
|
|
|
|
|
| ||
|
James E. Goodwin |
|
|
|
|||
| /s/ POLLY B. KAWALEK | Director | March 2, 2015 | ||||
|
|
|
|
|
| ||
|
Polly B. Kawalek |
|
|
|
|||
| Director | March 2, 2015 | |||||
| /s/ JAMES M. RINGLER | ||||||
|
James M. Ringler |
|
|
|
|||
82