Attached files
| file | filename |
|---|---|
| EXCEL - IDEA: XBRL DOCUMENT - IMPERVA INC | Financial_Report.xls |
| EX-32.1 - EX-32.1 - IMPERVA INC | d840649dex321.htm |
| EX-31.2 - EX-31.2 - IMPERVA INC | d840649dex312.htm |
| EX-32.2 - EX-32.2 - IMPERVA INC | d840649dex322.htm |
| EX-21.1 - EX-21.1 - IMPERVA INC | d840649dex211.htm |
| EX-31.1 - EX-31.1 - IMPERVA INC | d840649dex311.htm |
| EX-23.1 - EX-23.1 - IMPERVA INC | d840649dex231.htm |
| EX-10.18 - EX-10.18 - IMPERVA INC | d840649dex1018.htm |
Table of Contents
UNITED STATES
SECURITIES AND EXCHANGE COMMISSION
Washington, D.C. 20549
Form 10-K
(Mark One)
| x | ANNUAL REPORT PURSUANT TO SECTION 13 OR 15(d) OF THE SECURITIES EXCHANGE ACT OF 1934 |
For the Fiscal Year Ended December 31, 2014
OR
| ¨ | TRANSITION REPORT PURSUANT TO SECTION 13 OR 15(d) OF THE SECURITIES EXCHANGE ACT OF 1934 |
Commission file number: 001-35338
Imperva, Inc.
(Exact name of registrant as specified in its charter)
| Delaware | 03-0460133 | |
| (State or Other Jurisdiction of Incorporation or Organization) |
(I.R.S. Employer Identification No.) |
3400 Bridge Parkway, Suite 200
Redwood Shores, California 94065
(Address of Principal Executive Offices, including Zip Code)
(650) 345-9000
(Registrant’s Telephone Number, including Area Code)
Securities registered pursuant to Section 12(b) of the Act:
| Title of Each Class |
Name of Each Exchange on Which Registered | |
| Common Stock, par value $0.0001 per share | New York Stock Exchange |
Securities registered pursuant to Section 12(g) of the Act:
None
(Title of Class)
Indicate by check mark if the registrant is a well-known seasoned issuer, as defined in Rule 405 of the Securities Act. Yes x No ¨
Indicate by check mark if the registrant is not required to file reports pursuant to Section 13 or Section 15(d) of the Act. Yes ¨ No x
Indicate by check mark whether the registrant (1) has filed all reports required to be filed by Section 13 or 15(d) of the Securities Exchange Act of 1934 during the preceding 12 months (or for such shorter period that the registrant was required to file such reports), and (2) has been subject to such filing requirements for the past 90 days. Yes x No ¨
Indicate by check mark whether the registrant has submitted electronically and posted on its corporate Web site, if any, every Interactive Data File required to be submitted and posted pursuant to Rule 405 of Regulation S-T (§ 232.405 of this chapter) during the preceding 12 months (or for such shorter period that the registrant was required to submit and post such files). Yes x No ¨
Indicate by check mark if disclosure of delinquent filers pursuant to Item 405 of Regulation S-K (§ 229.405) is not contained herein, and will not be contained, to the best of registrant’s knowledge, in definitive proxy or information statements incorporated by reference in Part III of this Form 10-K or any amendment to this Form 10-K. x
Indicate by check mark whether the registrant is a large accelerated filer, an accelerated filer, a non-accelerated filer, or a smaller reporting company. See the definitions of “large accelerated filer,” “accelerated filer” and “smaller reporting company” in Rule 12b-2 of the Exchange Act. (Check one):
| Large accelerated filer | x | Accelerated filer | ¨ | |||
| Non-accelerated filer | ¨ (Do not check if a smaller reporting company) | Smaller reporting company | ¨ | |||
Indicate by check mark whether the registrant is a shell company (as defined in Rule 12b-2 of the Act). Yes ¨ No x
The aggregate market value of voting and non-voting common equity held by non-affiliates of the registrant as of June 30, 2014 (the last business day of the registrant’s most recently completed second fiscal quarter), based upon the closing price of the common stock reported by the New York Stock Exchange on such date, was approximately $586.3 million. Shares of common stock held by each executive officer and director of the registrant have been excluded in that such persons may be deemed to be affiliates. This determination of affiliate status is not necessarily a conclusive determination for other purposes.
The number of outstanding shares of the registrant’s common stock as of February 17, 2015 was 27,130,846.
Table of Contents

2014 ANNUAL REPORT ON FORM 10-K
Forward Looking Statements
The information in this Annual Report on Form 10-K contains forward-looking statements within the meaning of Section 27A of the Securities Act of 1933, as amended, or the Securities Act, and Section 21E of the Securities Exchange Act of 1934, as amended, or the Exchange Act. Such statements are based upon current expectations that involve risks and uncertainties. Any statements contained herein that are not statements of historical facts may be deemed to be forward-looking statements. For example, words such as “may,” “will,” “should,” “estimates,” “predicts,” “potential,” “continue,” “strategy,” “believes,” “anticipates,” “plans,” “expects,” “intends” and similar expressions are intended to identify forward-looking statements. Our actual results and the timing of certain events may differ significantly from the results discussed in the forward-looking statements. Factors that might cause or contribute to such differences include, but are not limited to, those discussed elsewhere in this Annual Report on Form 10-K in the section titled “Risk Factors” and the risks discussed in our other filings with the Securities and Exchange Commission, or the SEC. We undertake no obligation to publicly release any revisions to the forward-looking statements after the date of this Annual Report on Form 10-K.
Table of Contents
Overview
We are a leader in cyber-security solutions that protect business-critical data and applications whether in the cloud or on premises. Built to keep pace with the evolving threat landscape, our suite of cyber-security offerings are designed to enable organizations to discover data and application assets and vulnerabilities, to protect information wherever it lives and to comply with regulations. Our cyber-security solutions are also designed to fill the gaps left by existing endpoint and network or perimeter security solutions as organizations increasingly adopt “bring your own device” policies and move data and applications to the cloud.
Organizations are facing numerous challenges in providing the visibility and control required to protect business-critical applications and data from attack, theft and fraud from inside and outside the organization. Attacks, whether perpetrated by sophisticated hackers or malicious insiders, continue to increase in sophistication, scale and frequency. Additionally, organizations must comply with increasingly complex regulatory standards enacted to protect business-critical applications and data. Adoption of new technologies and architectures, such as mobile applications, web applications and big data, increases the complexity of, opens access to, and increases the vulnerability of business-critical data and applications. The increasing use of virtualization technologies and cloud delivery models, including unsanctioned, employee-adopted applications, known as “shadow IT,” is forcing organizations to operate outside of the traditional security model. We believe that these challenges are driving the need for cyber-security solutions that protect business-critical applications and data whether in the cloud or on premises.
Our Imperva SecureSphere platform provides database, file and web application security across various physical and virtual systems in data centers, including those in traditional on-premise data centers as well as in private, public and hybrid cloud computing environments. Our Imperva Incapsula product line provides cloud-based website security, denial of service protection and performance solutions that do not require software or hardware changes. Our Imperva Skyfence product line provides visibility into, and control over, cloud and Software-as-a-Service (“SaaS”) applications, including shadow IT, that are in growing use by enterprises of all sizes. In addition, all of our cloud offerings are designed to protect against the unique threats created as enterprises increasingly shift to deploying their applications and storing their data in the cloud to take advantage of the flexibility and cost-efficiency offered by cloud-based solutions.
As of December 31, 2014, we had over 3,700 end user customers, who we refer to in this Annual Report on Form 10 K as our customers, in more than 90 countries. In addition, our solutions are used to protect thousands of organizations through cloud based deployments with our Software as a Service (“SaaS”) customers and managed security service provider (“MSSP”) and hosting partners. Our customers include seven of the top ten global telecommunications companies, three of the top five commercial banks in the United States, three of the top five global consumer financial services firms, three of the top five global computer hardware companies, over 300 government agencies around the world and more than 400 Global 2000 companies. We primarily sell our products and services through our network of over 300 channel partners worldwide, including both distributors and resellers, which provide sales and support leverage to our sales organization. As of December 31, 2014, we had approximately 723 employees, including 231 employees in research and development. We generated revenue of $164.0 million in 2014, an increase of 19% over the $137.8 million in revenue we generated in 2013. Net loss attributable to our stockholders was $59.0 million in 2014 as compared to $25.2 million in 2013.
Our Strategy
Our goal is to extend our leadership position in the cyber- security market. Key elements of our growth strategy include:
| • | Enhance and extend our leadership position through technological and product innovation. We intend to continue to invest in product upgrades and product line extensions as well as the development of new products and services that address emerging cyber-security and regulatory compliance requirements to maintain our technological advantages. We also intend to continue to invest in advanced threat research and increase our threat intelligence leadership as well as to continue our research and development efforts in cyber-security for cloud computing environments. |
1
Table of Contents
| • | Continue to pursue cyber-security opportunities as businesses adopt cloud computing. Our solutions are used to protect thousands of enterprises through cloud-based deployments with our SaaS customers, MSSPs and hosting partners. We intend to continue to focus on capturing the expected increases in spending on securing business-critical applications and data as enterprises pursue cloud computing initiatives for both external and internal facing applications. We intend to develop and expand our relationships with MSSPs and data center hosting providers, and to increase sales to SaaS providers. |
| • | Increase awareness of the importance of cyber-security and drive adoption of our solution. We believe the market for cyber-security is in its early stages and growing rapidly. We plan to continue to increase market awareness of the benefits of our cyber-security solutions and to invest in our brand to further extend our leadership in the cyber-security market. For example, we plan to continue to invest in a broad range of marketing programs that help connect us with potential buyers along paid, earned, shared and owned channels. To further this goal, we plan to leverage online and offline advertising initiatives, targeted event participation, global public relations efforts, direct marketing, web events and participation in social media channels, such as LinkedIn, Facebook and Twitter. |
| • | Further penetrate our existing customer base. We intend to drive further penetration of our suite of cyber-security offerings within our existing customer base by deepening and broadening deployment of our offerings. Many of our customers initially deploy our solution for a limited portion of their business-critical applications and data, providing us with significant opportunities to sell them more of our products. This strategy has proved successful, as more than 60% of our revenues in 2014 were derived from repeat sales to existing customers. In addition, as a leading provider of cyber-security solutions, we believe we are well positioned to benefit as our customers expand the scope of their cyber-security and compliance initiatives both in the cloud and on premises. As of December 31, 2014, approximately 28% of our customers have purchased more than one of our offerings. |
| • | Invest in our global distribution network to expand our customer base. We intend to continue to invest significant resources to further strengthen our existing relationships with channel partners and to expand our network by adding new channel partners across the globe. As we expand our base of partners, we also intend to grow our direct touch sales team and enhance our marketing efforts to support our distribution network. |
| • | Increase our sales in the mid-market and SMB market. We believe there is a significant opportunity to provide cyber-security solutions to smaller businesses as they continue to face increasing security threats and more complex compliance mandates. We plan to continue to grow our business with mid-market enterprises and SMBs by expanding our distribution channels and our cloud-based offerings. |
| • | Pursue strategic opportunities. We intend to pursue targeted acquisition and partnership opportunities to continue to broaden our technology and offerings to better enable organizations to discover assets and vulnerabilities, to protect information wherever it lives and to comply with regulations. |
Cloud and On-Premises Products
Our products include our Imperva SecureSphere platform for enterprise data centers and our Imperva Incapsula and Imperva Skyfence offerings for cloud-based security services.
Our SecureSphere product line secures business-critical applications and data in physical and virtual data centers from hackers and malicious insiders, provides an accelerated and cost-effective route to address regulatory compliance and establishes a repeatable process for data risk management. Our SecureSphere products are built on a common modular platform, which includes a single operating system and common code base. All of our SecureSphere products can be managed either individually as stand-alone appliances or collectively from our SecureSphere MX Management Servers, which provide centralized management, in-depth analytics and customizable reporting. Our SecureSphere MX Management Server product provides a single, centralized point for aggregating and managing SecureSphere security policies, real-time monitoring, logging, auditing and compliance reporting. With this product, administrators can simultaneously manage our database, file and web security products from a single console.
2
Table of Contents
Our Incapsula service is purpose-built to deliver cloud-based Website Security (featuring a Payment Card Industry (“PCI”) certified Web Application Firewall), Distributed Denial of Service (“DDoS”) Protection and Load Balancing & Failover, all of which are fully integrated with, and built on top of, a global Content Delivery Network. Our Incapsula service is designed to be easy to deploy and accessible to businesses of all sizes that want to maximize the security, speed and availability of their websites. Without needing to purchase or install any hardware or software to use our Incapsula service, we estimate that most customers can set up our Incapsula service in less than ten minutes. Our customers typically begin using our Incapsula service by changing their website’s Domain Name System setting to route traffic to the Incapsula network. The global network of Incapsula servers apply security and optimization solutions to traffic on our customers’ websites according to the Incapsula service options they purchase. The screened, filtered and optimized traffic is then routed by the Incapsula network to the customer’s websites.
Our Skyfence service, which we acquired in February 2014, delivers real-time, automated visibility and control over corporate use of cloud and SaaS applications, including employee-adopted SaaS applications, often referred to as shadow IT, applications delivered by cloud providers, and IT-led or sanctioned applications such as Office 365. These applications are accessible from the Internet, which exposes them to the vulnerabilities intrinsic to public-facing applications. These applications also create security, regulatory and compliance challenges as the responsibility for housing and securing the data is transferred to a third party. We believe that today’s traditional perimeter and endpoint security products do not adequately address cyber-security for cloud applications and data. Our Skyfence service enforces security policy, protects sensitive data from external and internal threats, and ensures compliance with standards by using proprietary network traffic analysis and Dynamic User Fingerprinting technology to profile normal user behavior and detect anomalies that could indicate cyber-attacks or internal threats. Our Skyfence solution provides organizations with the power to discover all of the cloud assets that are in use and to uniformly enforce security and compliance policies while controlling user access to sensitive data, privileged user activity and application programming interface (“API”) access to the service.
We sell our cloud-based products and services using subscription-based pricing plans. We also sell our ThreatRadar services as separate add-on, subscription services to our SecureSphere appliances.
We organize our SecureSphere, Incapsula and Skyfence product lines into customer-focused capability areas based on their ability to discover assets and vulnerabilities, to protect information wherever it lives – in the cloud or on premises– and to comply with regulations.
| Discover | ||
| SecureSphere Database Assessment Server: Finds sensitive data and runs assessments | SecureSphere Database Assessment Server automates the process of discovering databases and sensitive business data on the network and performs a security assessment to identify risks to business-critical data. It identifies database vulnerabilities and measures compliance with industry standards and best practices using tests and assessment policies. By identifying where databases and sensitive data are located on the network, and which databases are vulnerable or misconfigured, Database Assessment Server helps organizations prioritize their database risk mitigation efforts. | |
| Incapsula Backdoor Detection: Detects and blocks hackers from installing or operating backdoors |
Incapsula Backdoor Protection detects and blocks attempts by hackers to install or operate a backdoor, which allows a hacker to remotely operate the website or server for future exploitation. It also notifies site administrators of the location of any backdoor so it can be removed. | |
| Skyfence Cloud Discovery: Enables comprehensive visibility of cloud applications | Skyfence Cloud Discovery eliminates blind spots created by the rapid adoption of cloud applications and the bring-your-own-application and shadow IT trends. Skyfence Cloud Discovery discovers and catalogs all cloud applications accessed by users and provides organizations with detailed visibility into the usage, activities, and risk information associated with such catalogued applications. | |
3
Table of Contents
| Protect | ||
| SecureSphere | ||
| SecureSphere Web Application Firewall: Protects business -critical web applications and data | We believe that our SecureSphere Web Application Firewall (“WAF”) is one of the industry’s leading solutions for protecting web assets from application attacks Our SecureSphere WAF protects our customers’ business-critical applications and data from large scale cyber-attacks, adapts to evolving threats to prevent data breaches and enables compliance with regulatory requirements. Based on the feature and traffic capacity requirements of our customers, our web application security products can be deployed as physical or Key capabilities of our SecureSphere WAF include dynamic identification of legitimate web application usage, fortification of web defenses with research-driven intelligence on current threats from our Application Defense Center (“ADC”), alerts and requests blocking as well as virtual patching of application vulnerabilities. | |
| SecureSphere Database Firewall: Secures business-critical data in structured repositories |
SecureSphere Database Firewall secures business-critical data in structured repositories in the data center. It provides comprehensive visibility and control over structured business data repositories, including database data usage, vulnerabilities and access rights and enables security, audit, risk and IT professionals to improve data security and address compliance requirements. SecureSphere Database Firewall can be deployed as a physical or virtual appliance, based on the feature and traffic capacity requirements of our customers. SecureSphere Database Firewall delivers all of the capabilities of SecureSphere Database Activity Monitor, and delivers real-time blocking of external attacks and internal threats from malicious users. | |
| SecureSphere File Firewall: Protects file access activity to ensure business-critical data and applications are secured | SecureSphere File Firewall secures unstructured data, including spreadsheets, presentation slides, word processing documents, movies, videos and PDFs that contain business-critical data and applications that our customers store in unstructured repositories, such as file servers, content management repositories, network-attached storage and storage area network devices. It provides full visibility and control over unstructured business data repositories, including file ownership, usage and access rights and enables security, audit, risk and IT professionals to improve file data security and address compliance requirements. SecureSphere File Firewall can be deployed as a physical or virtual appliance based on feature and traffic capacity requirements of our customers. | |
4
Table of Contents
| ThreatRadar | ||
| ThreatRadar: Provides reputation and crowdsourced security intelligence services | ThreatRadar Reputation Services recognizes attack sources and dynamically adjusts web security policies within our SecureSphere WAF to provide protection against attacks. These attack sources may include known malicious traffic sources that have attacked other web applications, anonymous proxies that may be used by hackers to launch attacks, traffic sources that launch anonymous attacks and phishing URLs. Our dedicated security research team, ADC, globally tracks these different attack sources and compiles this information with third-party research on malicious sources into the ThreatRadar feed.
ThreatRadar Community Defense, a part of ThreatRadar Reputation Services, delivers crowd-based threat intelligence to SecureSphere WAF. ThreatRadar Community Defense gathers attack data from SecureSphere deployments around the world and uses algorithms to translate this data into attack patterns, policies and reputation data. This security content is delivered in near real-time to fortify the entire community against emerging threats. ThreatRadar Reputation Services customers who choose to share anonymized attack data with Imperva receive ThreatRadar Community Defense free of charge.
ThreatRadar Bot Protection Services uses a client classification engine to analyze and classify incoming website traffic, and to distinguish between human and bot traffic. It also identifies good and bad bots and classifies traffic by browser type. The intelligence it collects during this process is then used by SecureSphere to drive WAF policy enforcement decisions. ThreatRadar Bot Protection Services are based on the Incapsula Client Classification Engine and associated Incapsula client classification feeds.
ThreatRadar Fraud Prevention Services is designed to enable organizations to rapidly provision and manage fraud detection solutions without needing to update web applications. By integrating with leading fraud security vendors, the SecureSphere WAF can transparently identify and help to stop fraudulent transactions. ThreatRadar Fraud Prevention also provides powerful monitoring and enforcement capabilities, allowing businesses to centrally manage SecureSphere WAF and fraud policies together. | |
| Incapsula | ||
| Incapsula Infrastructure Protection: Safeguards critical network infrastructure from volumetric and protocol-based DDoS attacks | Incapsula Infrastructure Protection helps protect all elements of an organization’s critical infrastructure, including web, email and FTP, across entire subnet ranges. In the event of a DDoS attack, traffic is re-routed through Incapsula scrubbing centers using Border Gateway Protocol announcements. From that point on, Incapsula acts as the Internet Service Provider and advertises all protected IP range announcements. All incoming network traffic is inspected and filtered, and only legitimate traffic is securely forwarded to the enterprise network via Generic Routing Encapsulation tunneling. | |
| Incapsula Website DDoS Protection: Detects and mitigates DDoS attacks launched at websites and web applications | Incapsula Website Protection uses DNS redirection to persistently reroute website traffic (HTTP/HTTPS) through the Incapsula network. Once traffic enters the Incapsula network, it is subject to progressively more stringent layers of inspection. Using sophisticated security rules and challenges, Incapsula ensures that DDoS attack traffic is identified and filtered out, while allowing legitimate traffic to flow unhindered to protected websites. At the same time, Incapsula also masks the origin server IPs to counter direct-to-IP attacks. | |
| Incapsula Name Server Protection: Safeguards DNS servers from DDoS attacks |
Incapsula Name Server Protection service is deployed in front of protected DNS servers, safeguarding them from all types of DNS-targeted DDoS attacks. The service employs a combination of reputation and rate-based heuristics in order to inspect the incoming flow of DNS queries and filter out malicious DNS packets, without impacting any of the legitimate visitors. | |
| Incapsula Website Security: Blocks attacks against web applications to promote website safety and availability | Incapsula Website Security combines a PCI-certified WAF with advanced bot detection and mitigation. It protects websites and applications against application layer hacking attempts and blocks scrapers, vulnerability scanners and content spammers that overload servers and steal content. Our cloud-based approach, coupled with crowdsourcing techniques, enables us to anonymously harness real data from our customer base to better understand the global attack landscape and continually improve security. | |
5
Table of Contents
| Incapsula Content Delivery Network: Optimizes website performance |
Incapsula Content Delivery Network (“CDN”) is a globally distributed network of data centers that deliver full site acceleration through intelligent caching and content optimization tools. The CDN is application- aware and dynamically profiles website resources and identifies cacheable dynamic and static content, including content that other CDNs consider to be uncacheable. | |
| Incapsula Load Balancing: Balances web traffic load across multiple web servers | Incapsula Load Balancing provides layer 7 load balancing and failover as a service, so organizations can replace costly appliances with an enterprise-grade, cloud-based solution. The service supports all in-datacenter and cross-datacenter high availability scenarios. It also provides real-time health monitoring to ensure that traffic is routed to a viable web server. | |
| Skyfence | ||
| Skyfence Cloud Audit and Protection: Monitors user activity and protects cloud application data | Skyfence Cloud Audit and Protection is a cloud-based offering that provides real-time analytics and controls over corporate use of all SaaS applications. The offering protects sensitive data from external and insider threats, enforces security policies for SaaS accounts, monitors usage, protects against account takeovers and provides compliance with standards. Skyfence Cloud Audit and Protection uses proprietary network and traffic analysis and Dynamic User Fingerprinting technology to profile normal user behavior and detect anomalies that could indicate cyber-attacks or insider threats. The product can be configured to immediately alert, block, or require two-factor identity verification on any activity threshold or user action when it encounters suspicious activities and behaviors. We believe this gives IT security teams flexibility to enforce appropriate security policies across cloud applications. | |
| Skyfence Web Audit and Protection: Audits users and protects accounts for production and customer-facing applications | Many organizations operate business-critical production applications that provide online services to customers. Skyfence Web Audit and Protection monitors and secures production applications running in the corporate data center and in public cloud computing environments, such as AWS and Microsoft Azure. The product offers essential capabilities for intelligent detection of anomalous behavior that signals an account takeover attempt. Automated policies ensure that detection and remediation of account-centric threats happen immediately and also support the creation of custom policies that define specific business rules. With Skyfence Web Audit and Protection, organizations can invoke identity verification using a one-time password challenge in response to any suspicious activity – ensuring that only the right people get access. In addition, Skyfence tracks production application activity so that that user and administrator activity is monitored and consistent access logs are created. Skyfence Web Audit and Protection performs activity monitoring using a transparent deployment model that has no impact on user experience and requires no change to the monitored application. | |
| Comply | ||
| SecureSphere | ||
| SecureSphere Database Activity Monitor: Efficiently demonstrates database compliance | SecureSphere Database Activity Monitor secures business-critical data in databases and data warehouses in the data center. SecureSphere Database Activity Monitor can be deployed as a physical or virtual appliance based on the feature and traffic capacity requirements of our customers. SecureSphere Database Activity Monitor covers the following major enterprise database platforms: Oracle, Oracle Exadata, Microsoft SQL Server, IBM DB2 (on Linux, UNIX, Windows, z/OS and DB2/400), IBM IMS on z/OS, IBM Informix, IBM Netezza, SAP Sybase, Teradata, Oracle MySQL, PostgreSQL, and Progress OpenEdge. | |
| SecureSphere User Rights Management for Databases: Establishes automated access rights review process and demonstrates compliance | SecureSphere User Rights Management for Databases automatically aggregates user rights across heterogeneous databases. This enables organizations to establish an automated access rights review process, identify excessive user rights, and demonstrate compliance with regulations such as Sections 302 and 404 of the Sarbanes Oxley Act of 2002 (“SOX”) and requirements 7 and 8.5 of the PCI Data Security Standards (“PCI DSS”). | |
6
Table of Contents
| SecureSphere Agent for Big Data: Helps pass audits and avoid hefty non-compliance fines | SecureSphere collects and analyzes access activity to big data in real-time, and instantly notifies compliance, security and operations teams about any violation of data access policies. SecureSphere Agent for Big Data is fully integrated into SecureSphere Database Activity Monitor, and audit data from big data is processed and shown with audit data from other enterprise systems. This provides a complete, unified view of user access to sensitive data across databases, data warehouses and big data. | |
| SecureSphere Agent for z/OS: Effectively and efficiently audits critical mainframe databases | SecureSphere Agent for z/OS monitors both DB2 and IMS databases and delivers comprehensive and efficient auditing of database activities and addresses regulatory requirements related to these critical systems. We acquired SecureSphere Agent for z/OS in the asset purchase of Tomium Software, LLC (“Tomium”) in January 2014. | |
| SecureSphere File Activity Monitor: Provides visibility into file access activity to protect business-critical data |
SecureSphere File Activity Monitor is designed to secure unstructured data, including spreadsheets, presentation slides, word processing documents and PDFs containing business-critical data and applications that our customers store in unstructured repositories, such as file servers, network attached storage and storage area network devices. SecureSphere File Activity Monitor can be deployed as a physical or virtual appliance based on feature and traffic capacity requirements of our customers. | |
| SecureSphere User Rights Management for Files: Streamlines and increases accuracy of complex access rights reviews | SecureSphere User Rights Management for Files enables organizations to manage user access rights across unstructured data stored on multiple different file systems. Sold as a part of the SecureSphere File Activity Monitor and SecureSphere File Firewall solutions, SecureSphere User Rights Management for Files aggregates user rights based on organizational context and actual file usage to illustrate what rights users have to sensitive files. This helps secure customer environments by evaluating user access rights, eliminating excessive privileges and disabling dormant accounts. | |
| ADC Insights: Streamlines compliance for common business applications and regulatory requirements | ADC Insights provide predefined, application-specific policies and reports for regulations such as SOX, PCI DSS, and the Health Insurance Portability and Accountability Act of 1996 (“HIPAA”) and for common business application platforms like SAP, Oracle E-Business Suite, and PeopleSoft. | |
| Skyfence | ||
| Skyfence Cloud Governance: Combines traditional cloud discovery and risk assessment with customer-specific risk factors | Skyfence Cloud Governance, a cloud-based offering, combines traditional cloud application discovery data with contextual risk factors to provide enterprise-class cloud risk assessments. Skyfence Cloud Governance goes beyond generic risk factors to identify specific conditions of a customer’s cloud implementation that pose threats including former employees with active accounts, users who may have excessive access rights, external users with access and unsecured cloud application configurations based on industry best practices and regulatory requirements. Using the product’s integrated remediation workflow tools, IT staff can easily remediate their risks to provide safe and productive use of the cloud. | |
Technology
Our solutions include several proprietary technologies described below.
SecureSphere
| • | Dynamic Profiling: Allows customers to create and monitor security policies based on actual application and database behavior, automatically recognizes valid application and database changes over time and automatically updates the profile according to these application and database changes. |
| • | Universal User Tracking: Helps customers achieve the primary requirements of any audit and security process by tracking the individual end user that accessed or modified business data, including web application user tracking, web to database user tracking, SQL connection user tracking and direct user tracking that collectively enable our solution to audit end users regardless of how they connect to the database. |
7
Table of Contents
| • | Transparent Inspection: Provides application layer security without needing to intermediate web connections, allowing our solution to inspect traffic without compromising performance, latency or availability. |
| • | Correlated Attack Validation: Provides our customers with protection against malicious activity by analyzing multiple data points, tracking events over time and correlating disparate events to identify and block sophisticated attacks. |
Skyfence
| • | Dynamic User and Device Fingerprinting: Continuously profiles cloud access, users and their endpoints to develop a fingerprint based on user location, devices, activity and other parameters to prevent high risk insider attacks and external account takeover attacks. |
Incapsula
| • | Client Classification Engine: Analyzes and classifies all incoming traffic to a website, distinguishes between human and bot traffic, identifies “good” and “bad” bots, and classifies traffic by browser type. While this technology was originally developed on the Incapsula service, we recently ported the technology to ThreatRadar Bot Protection Services, which is a SecureSphere add-on service. |
Maintenance and Support
We offer our customers ongoing product support services for both hardware and software. These maintenance programs are typically sold to customers for one- to five-year terms at the time of the initial product sale and typically renew for successive one- to three-year periods. We offer premium levels of service which include advance replacement and greater call center availability. While some of our channel partners provide tier one support, including MSSPs and data center hosting providers, in most instances we provide tier one level support and above.
Our ADC updates are included with maintenance and support contracts. The service consists of a content delivery mechanism by which we can distribute product content enhancements to our customers. Our ADC update servers deliver various types of security content to our appliances deployed in the field without the need for our customers to install a software patch or upgrade. Examples of ADC updates include new security signatures and policies for our WAF, new database assessment tests for our discovery and assessment server and new audit policy functionality for our database products.
Professional Services and Training
Our professional services consultants assist our customers in the deployment and configuration of our products. These fee-based services, provided by our professional services consultants, include providing advice on deployment planning, network design, product configuration and implementation, automating and customizing reports and tuning policies and configuration of our products for the particular characteristics of the customer’s environment. Additionally, we provide our customers with fee-based, hands-on training classes for our solution that are offered regularly and in different parts of the world.
Customers
We provide products and services to a variety of customers worldwide, including some of the world’s largest banks, retailers, insurers, technology and telecommunication companies and hospitals, as well as U.S. and other national, state and local government agencies. As of December 31, 2014, we had over 3,700 customers in more than 90 countries. In addition, our solutions are used to protect thousands of organizations through cloud-based deployments with our SaaS customers and our MSSP and hosting partners. Our customers include seven of the top ten global telecommunications companies, three of the top five commercial banks in the United States, three of the top five global consumer financial services firms, three of the top five global computer hardware companies, over 300 government agencies around the world and more than 400 Global 2000 companies.
With the exception of 2013, in which we had one reseller that represented 10% of our total revenue, no customer accounted for 10% or more of our total revenue in any year since 2004. In 2014, 2013 and 2012, we generated approximately 58%, 61% and 59% of our revenue from customers in the Americas and approximately 42%, 39% and 41% from customers outside of the Americas, respectively.
8
Table of Contents
Sales and Marketing
We believe that our hybrid sales model, which combines the leverage of a channel sales model with the account control of a direct sales model, has played an important role in our success to date. Our hybrid model employs a direct touch sales organization and an overlay channel sales team that actively assist our extensive network of channel partners throughout the sales process. We primarily sell our products and services to our customers through our channel partners, including distributors and resellers. In 2014, our channel partners originated over 50% of our sales and fulfilled almost 85% of our sales. Although our products are designed for turnkey deployment, they are highly customizable, which allows our channel partners to provide a variety of value added services to our customers. As of December 31, 2014, our network of channel partners included more than 360 resellers and distributors worldwide, including leading security value added resellers and some of the world’s largest hosting companies.
Sales
We support the sales of our products and services with a team of experienced channel account managers, sales professionals and sales engineers who provide business planning, joint marketing strategy, and pre-sales and operational sales support. Our overlay channel team is responsible for managing relationships with our resellers, MSSPs and distributors. Our sales professionals are responsible for assisting channel partners in gaining and supporting key customer accounts and acting as liaisons between the end customers and our marketing and product development organizations. Our sales professionals and sales engineers typically work alongside our channel partners and directly engage with customers to address their unique security and deployment requirements. We also have an inside sales team that is principally focused on lead generation for our reseller partners and regional sales professionals. To support our broadly dispersed global channel and customer base, we had, as of December 31, 2014, sales personnel in 24 countries. We plan to continue to invest in our sales organization to support the growth of our channel partners.
Marketing
Our marketing strategy is focused on building brand awareness, driving customer demand for our security solutions and enabling both our direct and channel sales models. We execute this strategy by leveraging a combination of internal marketing professionals and a network of regional and global channel partners. Our internal marketing organization is responsible for building brand awareness, driving demand generation, supporting channel enablement and product marketing, and working with our business operations team to support channel marketing and sales support programs. We focus our resources on targeted, integrated activities that can be leveraged by partners worldwide to extend our reach. Our marketing efforts include public and analyst relations, on- and off-line awareness building and demand generation, seminars, tradeshows, webinars, digital and website marketing, building sales tools and collateral information regarding product awards and technical certifications and social media outreach, including our data security blog.
Research and Development
Our research and development efforts are focused primarily on improving and enhancing our existing security products and services, as well as developing new products, features and functionality and conducting advanced security research. We conduct our research and development activities primarily in Israel, with small engineering teams in Redwood City, California and Austin, Texas. We believe this provides us with access to some of the best engineering talent in the security industry. As of December 31, 2014, we had 231 employees dedicated to research and development, including our advanced security research group, the ADC.
When considering product improvements and enhancements, we communicate with our customers and partners who provide significant feedback for product development and innovation. We regularly release new versions of our products incorporating these improvements and enhancements. Our research and development team works with our customer support group to resolve escalated support issues by providing consultation, bug fixes and patches. Our research and development team also provides technical assistance to our other departments, including to our sales team by overseeing product pilots for potential customers.
In addition to enhancing our products and services, our research and development organization includes our ADC team. We believe our ADC team is an important differentiator for us in the security marketplace. Our ADC team performs security analysis, tracks hackers and trends in the hacker community and undertakes vulnerability discovery, in addition to providing us with regulatory compliance expertise. ADC research combines extensive lab work with hands-on testing in real world environments to ensure that our products, through advanced data security technology, deliver up-to-date threat protection and leading compliance automation. Our ADC has discovered numerous commercial application vulnerabilities and has issued numerous security advisories, providing insight into both published and unpublished security threats to help commercial
9
Table of Contents
application and database vendors and security professionals. Our ADC’s “Hacker Intelligence Initiative” focuses on improving risk management by tracking hackers, developments in attack techniques and potential targets in known hacker forums and chat rooms. The ADC’s research is also the foundation for many of our products, product features and services, including attack signature updates, database vulnerability assessments, pre-defined compliance reports and the engine and analysis behind our crowdsourced security intelligence service, ThreatRadar Community Defense. We deliver automated feeds from our ADC to our products in the field to ensure that our customers are always armed with the latest defenses against new threats, and the most recent regulatory compliance best practices.
Our research and development expense was $43.1 million, $27.6 million and $20.6 million in 2014, 2013 and 2012, respectively.
Intellectual Property
To protect our intellectual property, both domestically and abroad, we rely primarily on patent, trademark, copyright and trade secret laws. As of December 31, 2014, we had 15 issued patents and 11 pending patent applications in the United States. The claims for which we have sought patent protection relate primarily to methods, computer programs, devices and systems we have developed for our products. We also license software from third parties for integration into our products, including open source software and other software available on commercially reasonable terms.
Our industry is characterized by the existence of a large number of relevant patents and frequent claims and related litigation regarding patent and other intellectual property rights. In particular, leading companies in the security industry have extensive patent portfolios. From time to time, third parties, including certain of these leading companies, have asserted and may assert patent, copyright, trademark and other intellectual property rights against us, our channel partners or our customers. Successful claims of infringement by a third party could prevent us from distributing certain products or performing certain services or require us to pay substantial damages (including treble damages if we are found to have willfully infringed patents or copyrights), royalties or other fees. Such claims also could require us to cease making, licensing or using solutions that are alleged to infringe or misappropriate the intellectual property of others, or to expend additional development resources to attempt to redesign our products or services or otherwise to develop non-infringing technology; and to indemnify our partners and other third parties. Even if third parties may offer a license to their technology, the terms of any offered license may not be acceptable and the failure to obtain a license or the costs associated with any license could cause our business, operating results or financial condition to be materially and adversely affected. We typically indemnify our customers and distributors against claims that our products infringe the intellectual property of third parties.
Manufacturing and Suppliers
Our security hardware appliance products are manufactured to our specifications by Caswell, Inc., a Taiwanese original design manufacturer of network appliance hardware products. We have entered into non-exclusive contracts to purchase these hardware appliances from American Portwell Technology, Inc. (a wholly owned subsidiary of Portwell, Inc.), and Dan-el Technologies Ltd., which are value-added distributors of products manufactured by Caswell, Inc. These contracts will remain in effect until terminated by either party. Such contracts are terminable by us for any reason upon six months’ notice, by the value-added distributors upon nine months’ notice or by either party for an uncured material breach. We currently work with American Portwell Technology and provide the value-added distributors with rolling product demand forecasts, but our contracts contain no obligation for us to purchase any minimum amount of products. We submit purchase orders that describe the types and quantities of our products to be manufactured, the delivery dates and other delivery terms. American Portwell Technology receives the hardware appliances from the manufacturer and configure and install our proprietary software on the appliances and then undertake quality testing at their fulfillment centers. American Portwell Technology then ships our appliances directly to our distributors, resellers or customers or our logistic partner, Base Logistics BV. We hold inventory in American Portwell Technology’s fulfillment centers and in our logistic partner’s warehouses, in anticipation of orders for new appliances and to support our advance replacement program with new and repaired appliances. In addition, our contract governs their use of our intellectual property and allocates the responsibilities for warranty repair, out of warranty repair and replacement costs with respect to damaged and defective products. We believe that having third parties manufacture, configure and test our products and provide a substantial portion of our logistics enables us to efficiently allocate capital, better adjust manufacturing volumes to meet changes in demand and more quickly deliver products, allowing us to focus resources on our core competencies.
The hardware components included in our products are sourced from various suppliers by our manufacturer and are principally industry standard parts and components that are available from multiple vendors. We have limited sources of supply for certain key components of our products, such as semiconductors, printed circuit boards and hard disk drives, which exposes us to the risk of component shortages or unavailability. For more information on risks related to product manufacturing and availability of components, see the section entitled “Risk Factors–Risks Related to Our Business–Delays or interruptions in the manufacturing and delivery of SecureSphere appliances by our sole source manufacturer may harm our business.”
10
Table of Contents
Competition
The market for cyber-security solutions is intensely competitive and we expect competition to increase in the future. Our primary competitors by product area include:
| • | Database security. International Business Machines Corporation, Intel Security group of Intel Corporation (formerly McAfee, Inc.) and Oracle Corporation |
| • | File security. EMC Corporation, Symantec Corporation and Varonis Systems, Inc. |
| • | Web application security and DDoS. Akamai Technologies, Inc. and F5 Networks, Inc. |
We believe that the principal competitive factors affecting the market for cyber-security solutions include breadth of product offerings, security effectiveness, manageability, reporting, technical features, performance, ease of use, price, professional services capabilities, distribution relationships and customer service and support. We believe that our solutions generally compete favorably with respect to such factors.
Employees
As of December 31, 2014, our total headcount was 723 employees, with 231 in research and development, 286 in sales and marketing, 89 in services and support, 40 in manufacturing operations and 77 in a general and administrative capacity. As of December 31, 2014, our headcount was 313 people in the United States, 313 in Israel and 97 in other countries. None of our employees is represented by a labor union with respect to his or her employment with us. We have not experienced any work stoppages, and we consider our relations with our employees to be good.
Available Information
Our Internet address is www.imperva.com. There we make available, free of charge, our annual reports on Form 10-K, quarterly reports on Form 10-Q, current reports on Form 8-K and any amendments to those reports, as soon as reasonably practicable after we electronically file such material with, or furnish it to, the SEC. Our SEC reports can be accessed through the Investor Relations section of our website. The information found on our website is not part of this or any other report we file with or furnish to the SEC. The SEC also maintains an Internet website that contains reports, proxy and information statements and other information regarding registrants, such as Imperva, that file electronically with the SEC. The address of the website is www.sec.gov. In addition, you may read and copy any filing that we make with the SEC at the public reference room maintained by the SEC, located at 100 F Street, N.E., Washington, D.C. 20549. Please call the SEC at 1-800-SEC-0330 for further information about the public reference room.
11
Table of Contents
Risks Related to Our Business
We have a history of losses, we may not become profitable and our revenue growth may not continue.
We have incurred net losses in each fiscal year since our inception, including net losses attributable to our stockholders of $7.4 million in 2012, $25.2 million in 2013 and $59.0 million in 2014. As a result, we had an accumulated deficit of $157.7 million at December 31, 2014. We may not become profitable in the future if we fail to increase revenue and manage our expenses, or if we incur unanticipated liabilities. Revenue growth may slow or revenue may decline for a number of possible reasons, including slowing demand for our products or services, increasing competition, a decrease in the growth of, or decline in, our overall market, or our failure to capitalize on growth opportunities or introduce new products and services. In addition, we have incurred, and anticipate that we will continue to incur, significant legal, accounting and other expenses relating to being a public company. If our revenues do not increase at a rate to proportionally offset these expected increases in operating expenses, our operating margins will suffer. Further, in future periods, our revenues could decline and, accordingly, we may not be able to achieve profitability and our losses may increase. Even if we do achieve profitability, we may not be able to sustain or increase profitability on a consistent basis. Any failure by us to achieve, maintain or increase profitability and continue our revenue growth could cause the price of our common stock to materially decline.
Our quarterly operating results are likely to vary significantly and to be unpredictable, which could cause the trading price of our stock to decline.
Our revenues and operating results could vary significantly from period to period as a result of a variety of factors, many of which are outside of our control. As a result, comparing our revenues and operating results on a period-to-period basis may not be meaningful, and you should not rely on our past results as an indication of our future performance. We may not be able to accurately predict our future revenues or results of operations. We base our current and future expense levels on our operating plans and sales forecasts, and our operating costs are relatively fixed in the short-term. As a result, we may not be able to reduce our costs sufficiently to compensate for an unexpected shortfall in revenues, and even a small shortfall in revenues could disproportionately and adversely affect financial results for that quarter. In addition, we recognize revenues from sales to some customers or resellers when cash is received, which may be delayed because of issues with those customers or resellers. If our revenues or operating results fall below the expectations of investors or any securities analysts that cover our stock, the price of our common stock could decline substantially.
In addition to other risk factors listed in this section, factors that may individually or cumulatively affect our operating results from period to period include:
| • | the level of demand for our products and services, and the timing of orders from our channel partners and end-user customers, whom we refer to in this Annual Report on Form 10-K as our customers; |
| • | the timing of sales and shipments of products during a quarter, which may depend on many factors such as inventory and logistics and our ability to ship new products on schedule and accurately forecast inventory requirements; |
| • | the mix of products sold, the mix of revenue between products and services, including subscription services, and the degree to which products and services are bundled and sold together for a package price; |
| • | the budgeting, procurement and work cycles of our customers, which may result in seasonal variation as our business and the market for solutions such as ours mature; |
| • | changes in customer renewal rates for our services; |
| • | general economic conditions, both domestically and in our foreign markets, and economic conditions specifically affecting industries in which our customers participate; |
| • | the timing of satisfying revenue recognition criteria for our sales, particularly where we accrue the associated commission expense in a different period, which may be affected by the mix of sales by our channel partners, the extent to which we bring on new resellers and distributors and establishing vendor-specific objective evidence of fair value, or VSOE, for new products and maintaining VSOE for maintenance and services; |
| • | future accounting pronouncements or changes in our accounting policies; and |
| • | increases or decreases in our expenses caused by fluctuations in foreign currency exchange rates, since a significant portion of our expenses are incurred and paid in the Israeli shekel and other currencies besides the U.S. dollar. |
12
Table of Contents
Reliance on a concentration of shipments at the end of the quarter could cause our revenue to fall below expected levels, resulting in a decline in our stock price.
Historically, we have received a significant majority of a quarter’s sales orders and generated a significant majority of a quarter’s revenue during the last two weeks of the quarter. The fact that so many orders arrive at the end of a quarter means that our revenue may move from one quarter to the next if we cannot fulfill all of the orders and satisfy all of the revenue recognition criteria under our accounting policies before the quarter ends.
This pattern is a result of customer buying habits and the efforts of our sales force and channel partners to meet or exceed quarterly quotas. If expected revenue at the end of any quarter is delayed because anticipated purchase orders fail to materialize, our logistics partners fail to ship products on time, we fail to manage our inventory properly, we fail to release new products on schedule, or for any other reason, then our revenue for that quarter could fall below our expectations or those of securities analysts and investors, resulting in a decline in our stock price.
We rely on third party channel partners to generate a significant portion, and to fulfill a substantial majority, of our revenue, and if we fail to expand and manage our distribution channels, our revenues could decline and our growth prospects could suffer.
Historically our channel partners have originated more than 50%, and fulfilled approximately 85%, of our revenue, and we expect that channel sales will represent a substantial portion of our revenues for the foreseeable future. Our ability to expand our distribution channels depends in part on our ability to educate our channel partners about our products and services, which are often complex. Our agreements with our channel partners are generally non-exclusive and many of our channel partners have more established relationships with our competitors. If our channel partners choose to place greater emphasis on products and services of their own or those offered by our competitors, our ability to grow our business and sell our products may be adversely affected. If our channel partners do not effectively market and sell our products and services, or if they fail to meet the needs of our customers, then our ability to grow our business and sell our products may be adversely affected. The loss of one or more of our larger channel partners, who may cease marketing our products with limited or no notice, and our possible inability to replace them could adversely affect our sales. Our failure to recruit additional channel partners, or any reduction or delay in their sales of our products and services or conflicts between channel sales and our direct sales and marketing activities could materially and adversely affect our results of operations.
We face intense competition, especially from larger, better-known companies and we may lack sufficient financial or other resources to maintain or improve our competitive position.
The market for cyber-security products is intensely competitive and we expect competition to intensify in the future. Our competitors include companies such as Akamai Technologies, Inc., F5 Networks, Inc., International Business Machines Corporation (“IBM”), Intel Security group of Intel Corporation (“Intel”), Oracle Corporation (“Oracle”), Symantec Corporation and other point solution security vendors.
Many of our existing and potential competitors may have substantial competitive advantages such as:
| • | greater name recognition and longer operating histories; |
| • | larger sales and marketing budgets and resources and the capacity to leverage their sales efforts and marketing expenditures across a broader portfolio of products; |
| • | broader, deeper or otherwise more well-established relationships with customers and potential customers; |
| • | broader distribution networks and more established relationships with distributors; |
| • | wider geographic presence; |
| • | access to larger customer bases; |
| • | greater customer support resources; |
| • | greater resources to make acquisitions; |
| • | greater resources to develop and introduce products that compete with our products; |
| • | lower labor and development costs; and |
13
Table of Contents
| • | substantially greater financial, technical and other resources. |
As a result, they may be able to adapt more quickly and effectively to new or emerging technologies and changing opportunities, standards or customer requirements. In addition, these companies could reduce the price of their competing products, resulting in intensified pricing pressures within the markets in which we compete. Further, some of our larger competitors have substantially broader product offerings and leverage their relationships based on other products or incorporate functionality into existing products in a manner that discourages customers from purchasing our products. Our competitors may offer a bundled product offering, and our customers may elect to accept this offering from our competitors, even if it has more limited functionality than our product offering, instead of adding the additional appliances required to implement our offering. The consolidation in our industry, such as IBM’s acquisition of Guardium, Inc., Oracle’s acquisition of Secerno, Ltd. and Intel’s acquisition of McAfee, Inc., increases the likelihood of competition based on integration or bundling, particularly where our competitors’ products and offerings are effectively integrated, and we believe that consolidation in our industry may increase the competitive pressures we face on all our products and services. If we are unable to sufficiently differentiate our products and services from the integrated or bundled products of our competitors, such as by offering enhanced functionality, performance or value, we may see a decrease in demand for those products or services, which would adversely affect our business, operating results and financial condition. Further, it is possible that continued industry consolidation may impact customers’ perceptions of the viability of smaller or even medium-sized software firms and consequently customers’ willingness to purchase from such firms. Similarly, if customers seek to concentrate their software purchases in the product portfolios of a few large providers, we may be at a competitive disadvantage notwithstanding the superior performance that we believe our products and services can deliver. Larger competitors are also often in a better position to withstand any significant reduction in capital spending by customers, and will therefore not be as susceptible to economic downturns.
Also, many of our smaller competitors that specialize in providing protection from a single type of cyber-security threat may deliver these specialized cyber-security products to the market more quickly than we can or may introduce innovative new products or enhancements before we do. Conditions in our markets could change rapidly and significantly as a result of technological advancements.
We may not compete successfully against our current or potential competitors. Companies competing with us may introduce products that have greater performance or functionality, are easier to implement or use, or incorporate technological advances that we have not yet developed or implemented. Our current and potential competitors may also establish cooperative relationships among themselves or with third parties that may further enhance their resources. In addition, companies competing with us may price their products more competitively than ours, or have an entirely different pricing or distribution model. Increased competition could result in fewer customer orders, price reductions, reduced operating margins and loss of market share. Further, we may be required to make substantial additional investments in research, development, marketing and sales in order to respond to such competitive threats, and we cannot assure you that we will be able to compete successfully in the future.
We operate in an evolving market that has not yet reached widespread adoption and where new or existing technologies that may be perceived to address the risks in different ways could gain wide adoption and supplant some or all of our products and services, making analysis of trends or predictions about our business difficult and potentially weakening our sales and our financial results.
We operate in a new, rapidly evolving categories in the security industry that focus on securing our customers’ business-critical data and applications. We offer database, file and web application security in an integrated, modular cyber-security solution. Because we depend in part on the market’s acceptance of our products and customers may choose to acquire technologies that are not directly comparable to ours, it is difficult to evaluate trends that may affect our business, including how large the cyber-security market will be and what products customers will adopt. For example, organizations that use other security products, such as network firewalls, security information and event management (“SIEM”) products or data loss prevention (“DLP”) solutions, may believe that these security solutions sufficiently protect access to sensitive data. Therefore, they may continue to devote their IT security budgets to these products and may not adopt our cyber-security solutions in addition to such products. If customers do not recognize the benefits of our cyber-security solution offers in addition to other security products, then our revenue may not grow as anticipated or may decline, and our stock price could decline.
The introduction of products and services embodying new technologies could render some or all of our existing products and services obsolete or less attractive to customers. Other cyber-security technologies exist or could be developed in the future, and our business could be materially adversely affected if such technologies are widely adopted. We may not be
14
Table of Contents
able to successfully anticipate or adapt to changing technology or customer requirements on a timely basis, or at all. Currently less than 30% of our customers have purchased more than one of our product families. Even if customers purchase our products, they may not make repeat purchases or purchase other elements of our SecureSphere, Incapsula or Skyfence product lines, which may be exacerbated by the rapid evolution of our market. If we are unable to sell additional products from multiple product families to our customers, then our revenue may not grow as anticipated or may decline, and our stock price could decline. If we fail to keep up with technological changes or to convince our customers and potential customers of the value of our solutions even in light of new technologies, our business, financial condition and results of operations could be materially and adversely affected
In addition, because of our rapidly evolving market, any predictions about our revenue in future periods may not be as accurate as they would be if we operated in a more established market.
If we do not successfully anticipate market needs and opportunities or changes in the legal, regulatory and industry standard landscape and make timely enhancements to our products and develop new products that meet those needs, we may not be able to compete effectively and our ability to generate revenues will suffer.
The cyber-security market is characterized by rapid technological advances, changes in customer requirements, including changing customer requirements driven by legal, regulatory and self-regulatory compliance mandates, frequent new product introductions and enhancements and evolving industry standards in computer hardware and software technology. Customers and industry analysts expect speedy introduction of software and new functionality to respond to new threats, requirements and risks and we may be unable to meet these expectations. As a result, we must continually improve our products and introduce new solutions in response to changes in operating systems, application software, computer and communications hardware, networking software, data center architectures, programming tools and computer language technology. Moreover, the technology in our products is especially complex because it needs to effectively identify and respond to methods of attack and theft, while minimizing the impact on network, database, file system and web application performance. In addition, our products must successfully interoperate with products from other vendors.
We cannot guarantee that we will be able to anticipate future market needs and opportunities or be able to develop product enhancements or new products to meet such needs or opportunities in a timely manner or at all. Since developing new products or new versions of, or add-ons to, existing products is complex, the timetable for their commercial release is difficult to predict and may vary from our historical experience, which could result in delays in their introduction from anticipated or announced release dates. We may not offer updates as rapidly as new threats affect our customers or our newly developed products or enhancements may have defects, errors or failures. If we do not quickly respond to the rapidly changing and rigorous needs of our customers by developing and introducing on a timely basis new and effective products, upgrades and services that can respond adequately to new security threats, our competitive position, business and growth prospects will be harmed.
Even if we are able to anticipate, develop and commercially introduce enhancements and new products, there can be no assurance that we will be successful in developing sufficient market awareness of them or that such enhancements or new products will achieve widespread market acceptance. For example, while the majority of our current revenues are derived from the sales of our SecureSphere appliances, we are now offering cloud-based security services through Incapsula and Skyfence. The market for cloud-based security solutions is relatively new and it is uncertain whether Incapsula’s and Skyfence’s services will gain market acceptance. In addition, diversifying our product offerings will require significant investment and planning, will bring us more directly into competition with software providers that may be better established or have greater resources than we do, will require additional investments of time and resources in the development and training of our channel and strategic partners and will entail a significant risk of failure.
Further, one factor that drives demand for our products and services is the legal, regulatory and industry standard framework in which our customers operate, which we expect will continue for the foreseeable future. For example, many of our customers purchase our web application security products to help them comply with the security standards developed and maintained by the Payment Card Industry Security Standards Council (the “PCI Council”), which apply to companies that process or store credit card information. Laws, regulations and industry standards are subject to drastic changes that, particularly in the case of industry standards, may arrive with little or no notice, and these could either help or hurt the demand for our products. If we are unable to adapt our products and services to changing regulatory standards in a timely manner, or if our products fail to assist our customers with their compliance initiatives, our customers may lose confidence in our products and could switch to competing solutions. In addition, if regulations and standards related to cyber-security are changed in a manner that makes them less onerous, our customers may view government and industry regulatory compliance as less critical to their businesses, and our customers may purchase fewer of our products and services, or none at all. In either case, our sales and financial results would suffer.
15
Table of Contents
Real or perceived errors, failures or bugs in our products, particularly those that result in our customers experiencing security breaches, could adversely affect our reputation and business could be harmed.
Our products and services are very complex and have contained and may contain undetected defects or errors, especially when first introduced or when new versions are released. Defects in our products may impede or block network traffic or cause our products or services to fail to help secure business-critical data and applications. Defects in our products may lead to product returns and require us to implement design changes or software updates. Any defects or errors in our products, or the perception of such defects or errors, could result in:
| • | expenditure of significant financial and product development resources in efforts to analyze, correct, eliminate or work around errors or defects; |
| • | loss of existing or potential customers or channel partners; |
| • | delayed or lost revenue; |
| • | delay or failure to attain market acceptance; |
| • | delay in the development or release of new products or services; |
| • | negative publicity, which will harm our reputation; |
| • | warranty claims against us, which could result in an increase in our provision for doubtful accounts; |
| • | an increase in collection cycles for accounts receivable or the expense and risk of litigation; and |
| • | harm to our results of operations. |
Data thieves are sophisticated, often affiliated with organized crime and operate large scale and complex automated attacks. In addition, their techniques change frequently and generally are not recognized until launched against a target. If we fail to identify and respond to new and complex methods of attack and to update our products to detect or prevent such threats in time to protect our customers’ business-critical data and applications, our business and reputation will suffer.
In addition, many of our customers use our products in applications that are critical to their businesses and may have a greater sensitivity to defects in our products than to defects in other, less critical, software products. An actual or perceived security breach or theft of the business-critical data of one of our customers, regardless of whether the breach is attributable to the failure of our products or services, could adversely affect the market’s perception of our security products. Despite our best efforts, there is no guarantee that our products will be free of flaws or vulnerabilities, and, even if we discover these weaknesses, we may be unable to correct them promptly, if at all. Our customers may also misuse our products, which could result in a breach or theft of business-critical data.
Although we have limitation of liability provisions in our standard terms and conditions of sale, they may not fully or effectively protect us from claims as a result of federal, state or local laws or ordinances or unfavorable judicial decisions in the United States or other countries. The sale and support of our products also entail the risk of product liability claims. We maintain insurance to protect against certain claims associated with the use of our products, but our insurance coverage may not adequately cover all claims asserted against us. In addition, even claims that ultimately are unsuccessful could result in our expenditure of funds in litigation and divert management’s time and other resources.
False detection of security breaches or false identification of malicious sources could adversely affect our business.
Our cyber-security products may falsely detect threats that do not actually exist. For example, our ThreatRadar Reputation Services product relies on information on attack sources aggregated from third-party data providers who monitor global malicious activity originating from anonymous proxies, specific IP addresses, botnets and phishing sites. If the information from these data providers is inaccurate, the potential for false positives increases. These false positives, while typical in the industry, may affect the perceived reliability of our products and may therefore adversely impact market acceptance of our products. If our products and services restrict access to important databases, files or applications based on falsely identifying users or traffic as an attack or otherwise unauthorized, then our customers’ businesses could be adversely effected. Any such false identification of users or traffic could result in negative publicity, loss of customers and sales, increased costs to remedy any problem and costly litigation.
16
Table of Contents
Our success in acquiring and integrating other businesses, products or technologies could impact our financial position.
In order to remain competitive, we may seek to acquire additional businesses, products or technologies, any of which could be material to our business, operating results and financial condition. For example, we acquired assets from Tomium in January 2014, acquired Skyfence Networks Ltd. (“Skyfence”) in February 2014 and acquired the remaining portion of Incapsula that we did not already own in March 2014. The environment for acquisitions in the markets in which we operate is very competitive and acquisition candidate purchase prices will likely exceed what we would prefer to pay, but may be required to pay in order to make an acquisition. Furthermore, we may not find suitable acquisition candidates, and acquisitions we complete may be difficult to successfully integrate into our overall business. Achieving the anticipated benefits of future acquisitions will depend in part upon whether we can integrate acquired operations, products and technology in a timely and cost-effective manner.
Acquisitions involve many risks, including the following:
| • | an acquisition may negatively impact our results of operations because it: |
| • | may require us to incur charges and substantial debt or liabilities, |
| • | may cause adverse tax consequences, substantial depreciation or deferred compensation charges, |
| • | may result in acquired in-process research and development expenses or in the future may require the amortization, write-down or impairment of amounts related to deferred compensation, goodwill and other intangible assets, or |
| • | may not generate sufficient financial return to offset acquisition costs; |
| • | we may encounter difficulties or unforeseen expenditures in integrating the business, technologies, products, personnel or operations of any company that we acquire, particularly if key personnel of the acquired company decide not to work for us; |
| • | an acquisition and integration process is complex, expensive and time consuming, and may disrupt our ongoing business, divert resources, increase our expenses and distract our management; |
| • | an acquisition may result in a delay or reduction of customer purchases for both us and the company acquired due to customer uncertainty about continuity and effectiveness of service from either company; |
| • | we may encounter difficulties in, or may be unable to, successfully sell any acquired products; and |
| • | we may obtain unanticipated or unknown liabilities or become exposed to unanticipated risks in connection with any acquisition; |
| • | an acquisition may involve the entry into geographic or business markets in which we have little or no prior experience. |
If we are unable to effectively execute acquisitions, our business, financial condition and results of operations could be adversely affected.
Delays or interruptions in the manufacturing and delivery of SecureSphere appliances by our sole source manufacturer may harm our business.
Our hardware appliances are built by a single manufacturer. Our reliance on a sole manufacturer, particularly a foreign manufacturer, involves several risks, including a potential inability to obtain an adequate supply of appliances and limited control over pricing, quality and timely delivery of products. In addition, replacing this manufacturer may be difficult and could result in an inability or delay in obtaining products. As a result, we may be unable to fulfill customer orders and our operating results may fluctuate from period to period, particularly if a disruption occurs near the end of a fiscal period.
Our manufacturer’s ability to timely manufacture and ship our appliances in large quantities depends on a variety of factors. The manufacturer relies on a limited number of sources for the supply of functional components, such as semiconductors, printed circuit boards and hard disk drives. Functional component supply shortages or delays could prevent or delay the manufacture and shipment of our appliances and, in the event of shortages or delays, we may not be able to procure alternative components on similar pricing terms, if at all. In addition, contractual restrictions or claims for infringement of intellectual property rights may restrict our manufacturer’s use of certain components. These restrictions or claims may require our manufacturer to utilize alternative components or obtain additional licenses or technologies, and may
17
Table of Contents
impede its ability to manufacture and deliver appliances on a timely or cost-effective basis. If at some point, the manufacturer is no longer financially viable, we may lose our source of supply with little or no notice or recourse. Further, even if quality products are timely manufactured, delays in shipping may occur, resulting in delayed satisfaction of a primary revenue recognition criterion.
In the event of an interruption from this manufacturer or any quality control issues with this manufacturer, we may be unable to develop alternate or secondary sources in a timely manner. If we are unable to procure our appliances in quantities sufficient to meet our requirements, we will not be able to deliver products to our channel partners and customers, which would materially and adversely affect present and future sales.
A failure to manage excess inventories or inventory shortages could result in decreased revenue and gross margins and harm our business.
We purchase products from our manufacturing partner outside of, and in advance of, reseller or customer orders and hold our products in inventory. If we fail to accurately predict demand and as a result our manufacturer maintains insufficient hardware or component inventory or excess inventory, we may be unable to timely deliver products to our distributors or customers or may have substantial inventory expense. Because our channel partners do not purchase our products in advance of customer orders, our difficulty in accurately forecasting demand for our hardware products may be exacerbated. There is a risk we may incorrectly forecast demand and may be unable to sell excess products ordered from our manufacturing partner. Inventory levels in excess of customer demand may result in inventory write-downs, and the sale of excess inventory at discounted prices could significantly impair our brand image and have an adverse effect on our financial condition and results of operations.
Conversely, if we underestimate demand for our products or if our manufacturing partner fails to supply products we require in a timely manner, we may experience inventory shortages. Inventory shortages might delay shipments to resellers, distributors and customers or cause us to lose sales. Further, as the size of individual orders increases, the risk that we may be unable to deliver unforecasted orders also increases, particularly near the end of quarterly periods. These shortages may diminish the loyalty of our channel partners or customers.
The difficulty in forecasting demand also makes it difficult to estimate our future financial condition and results of operations from period to period. A failure to accurately predict the level of demand for our products could adversely affect our net revenues and net income, and we are unlikely to forecast such effects with any certainty in advance.
We have operations outside of the United States and a significant portion of our customers and suppliers are located outside of the United States, which subjects us to a number of risks associated with conducting international operations.
We market and sell our products throughout the world and have personnel in many parts of the world. In addition, we have sales offices and research and development facilities outside the United States and we conduct, and expect to continue to conduct, a significant amount of our business with companies that are located outside the United States, particularly in Israel, Asia and Europe. We also source our components for our products from various geographical regions and ship components from a foreign production facility. Therefore, we are subject to risks associated with having international sales and worldwide operations, including:
| • | challenges caused by distance, language, cultural differences and the competitive environment; |
| • | multiple and conflicting laws and regulations, including complications due to unexpected changes in these laws and regulations; |
| • | trade and foreign exchange restrictions; |
| • | foreign currency exchange fluctuations and foreign exchange controls; |
| • | economic, social or political instability in foreign markets; |
| • | greater difficulty in enforcing contracts, accounts receivable collection and longer collection periods; |
| • | changes in regulatory requirements; |
| • | difficulties and costs of staffing and managing foreign operations or relationships with channel partners; |
| • | the uncertainty and limitation of protection for intellectual property rights in some countries; |
| • | costs of complying with U.S. and foreign laws and regulations, including import and export control laws, tariffs, trade barriers, economic sanctions and other regulatory or contractual limitations on our ability to sell our products in certain foreign markets, and the risks and costs of non-compliance or complaints of non-compliance; |
18
Table of Contents
| • | heightened risks of unfair or corrupt business practices, actual or claimed, in certain geographies and of improper or fraudulent sales arrangements that may impact financial results and result in restatements of, and irregularities in, financial statements; |
| • | the potential that our operations in the U.S. may limit the acceptability of our products to some foreign governments, and vice versa; |
| • | the potential for acts of terrorism, hostilities or war; |
| • | management communication and integration problems resulting from cultural differences and geographic dispersion; and |
| • | multiple and possibly overlapping tax structures. |
Our product and service sales may be subject to foreign governmental regulations, which vary substantially from country to country and change from time to time. Failure to comply with these regulations could adversely affect our business. Violations of laws or key control policies by our employees, contractors, channel partners or agents could result in delays in revenue recognition, financial reporting misstatements, fines, penalties or the prohibition of the importation or exportation of our products and services and could have a material adverse effect on our business and results of operations.
A portion of our revenue is generated by sales to government entities and such sales are subject to a number of challenges and risks.
Sales to U.S. and foreign federal, state and local governmental agency customers have accounted for approximately 11% of our bookings for the year ended December 31, 2012, 13% of our bookings for the year ended December 31 2013 and 15% of our bookings for the year ended December 31, 2014, and we may in the future increase sales to government entities. Sales into government entities are subject to a number of risks. Selling to government entities can be highly competitive, expensive and time consuming, often requiring significant upfront time and expense without any assurance that we will complete a sale. Accordingly:
| • | changes in fiscal or contracting policies or decreases and uncertainties in available government funding; |
| • | changes in government programs or applicable requirements; |
| • | the adoption of new laws or regulations or changes to existing laws or regulations; |
| • | changes in political or social attitudes with respect to security issues; and |
| • | potential delays or changes in the government appropriations process, including actions such as spending freezes implemented to address political or fiscal policy concerns, |
could cause governments and governmental agencies to delay or refrain from purchasing our products and services in the future or otherwise have an adverse effect on our business, financial condition and results of operations.
Most of our sales to government entities have been made indirectly through our channel partners. Government entities may have contractual or other legal rights to terminate contracts with our distributors and resellers for convenience or due to a default, and any such termination may adversely impact our results of operations.
In addition, for purchases by the U.S. federal government, we must comply with laws and regulations relating to U.S. federal government contracting, which affect how we and our channel partners do business in connection with U.S. federal agencies. These laws and regulations may impose added costs on our business, and failure to comply with these or other applicable regulations and requirements, including non-compliance in the past, could lead to claims for damages from our channel partners, penalties, termination of contracts and suspension or debarment from government contracting for a period of time. Any such damages, penalties, disruption or limitation in our ability to do business with the U.S. federal government may adversely impact our results of operations.
Our business in countries with a history of corruption and transactions with foreign governments increase the risks associated with our international activities.
As we operate and sell internationally, we are subject to the U.S. Foreign Corrupt Practices Act, or the FCPA, and other laws that prohibit improper payments or offers of payments to foreign governments and their officials and political parties for the purpose of obtaining or retaining business. We have operations, deal with and make sales to governmental customers in countries known to experience corruption, particularly certain emerging countries in Africa, East Asia, Eastern
19
Table of Contents
Europe, South America and the Middle East. Our activities in these countries create the risk of unauthorized payments or offers of payments by one of our employees, consultants, sales agents or channel partners that could be in violation of various anti-corruption laws, even though these parties may not be under our control. While we have implemented safeguards to prevent these practices by our employees, consultants, sales agents and channel partners, our existing safeguards and any future improvements may prove to be less than effective, and our employees, consultants, sales agents or channel partners may engage in conduct for which we might be held responsible. Violations of the FCPA may result in severe criminal or civil sanctions, including suspension or debarment from U.S. government contracting, and we may be subject to other liabilities, which could negatively affect our business, operating results and financial condition.
We rely significantly on revenue from maintenance and support which may decline and, because we recognize revenue from such services over the term of the relevant service period, downturns or upturns in sales are not immediately reflected in full in our operating results.
Our maintenance and support revenue accounted for 32% of our total revenue for 2012, 32% of our total revenue for year ended December 31, 2013 and 33% of our total revenue for 2014. Sales of new maintenance and support contracts or renewal of such services contracts may decline or fluctuate as a result of a number of factors, including customers’ level of satisfaction with our products and services, the prices of our products and services, the prices of products and services offered by our competitors or reductions in our customers’ spending levels. If our sales of new or renewal services contracts decline, our revenue or revenue growth may decline and our business will suffer. In addition, we recognize service revenue ratably over the term of the relevant service period, which is typically one to three years but has been as long as five years. As a result, much of the revenue we report each quarter is the recognition of deferred revenue from services contracts entered into during previous quarters. Consequently, a decline in new or renewal services contracts in any one quarter will not be fully reflected in revenue in that quarter, but will negatively affect our revenue in future quarters. Accordingly, the effect of significant downturns in new or renewed sales of our services would not be reflected in full in our results of operations until future periods.
If we are unable to increase sales to larger customers, our results of operations may suffer.
We continuously seek to increase sales of our products to large enterprises, MSSPs, cloud hosting providers and government entities. Sales to large enterprises, MSSPs, cloud hosting providers and government entities involve risks that may not be present, or are present to a lesser extent, in sales to small to mid-sized entities. These risks include:
| • | preexisting relationships with larger, entrenched providers of security solutions who have access to key decision makers within the organization and who also have the ability to bundle competing products with a broader product offering; |
| • | increased purchasing power and leverage held by large customers in negotiating contractual arrangements with us; |
| • | more stringent requirements in our support service contracts, including stricter support response times, and increased penalties for any failure to meet support requirements; and |
| • | longer sales cycles, including lengthening of sales cycles due to competitive pressures or the evaluation by customers of both our cloud security solutions from Incapsula and our on-premise products as potential alternatives, and the associated risk that substantial time and resources may be spent on a potential customer who elects not to purchase our products and services. |
In addition, product purchases by enterprises, MSSPs, cloud hosting providers and government entities are frequently subject to budget constraints, multiple approvals, and unplanned administrative, processing and other delays. Further, large enterprises, MSSPs, cloud hosting providers and government entities typically have longer implementation cycles; require greater product functionality and scalability and a broader range of services; demand that vendors take on a larger share of risks; sometimes require acceptance provisions that can lead to a delay in revenue recognition; and expect greater payment flexibility from vendors. Additionally, the ongoing increase in the number of security vendors competing for these entities business, who in some cases use overlapping or confusing messaging, may combine with these factors to extend the sales cycles for our products and services. All these factors can add risk to doing business with these customers. If our sales expectations for large customers do not materialize in a particular quarter or at all, then our business, financial condition and results of operations could be materially and adversely affected.
20
Table of Contents
If our existing and potential customers migrate to hosted, cloud-based data centers that do not deploy our products, our revenues could suffer.
The majority of our current sales are made through a model in which our channel partners sell our cyber-security solutions to large enterprise customers that operate their own data centers and have the ability to choose the cyber-security solutions and configurations to fit their environment. If our large enterprise customers and potential customers choose to outsource the hosting of their data centers to large, multi-tenancy hosting providers like Rackspace Hosting, Inc., AWS and Savvis, Inc., they may not be able to choose what cyber-security solutions are deployed in these hosted environments, and our current sales model may not be effective. Although we work with large hosting services providers, like Rackspace Hosting, Inc., AWS and Savvis, Inc., to integrate our cyber-security solutions into their hosting environments so that our solutions may be offered to their hosting customers, we cannot guarantee that all such hosting service providers will adopt our solutions, offer them as a choice to their customers or promote our solutions over those of our competitors. Even if these large hosting services providers integrate our cyber-security solutions into their hosting environments and promote our solutions, they may be able to negotiate larger discounts than individual enterprise customers and, consequently, the average selling price of our products may decrease and our revenue would suffer. Alternatively, they may offer services based on our competitors’ products at lower cost or bundled with other services that we do not offer, and their customers may choose those services even if they would otherwise chose our products if making a decision on a stand-alone basis.
If our customers are not satisfied with our technical support or professional services, they may choose not to purchase our products and services or to renew maintenance contracts, either of which would adversely impact our business and results of operations.
Our business relies on our customers’ satisfaction with the technical support and professional consulting services we provide to support our products. If we fail to provide technical support services that are responsive, satisfy our customers’ expectations and resolve issues that they encounter with our products and services, then they may elect not to purchase or renew annual maintenance and support contracts and they may choose not to purchase additional products and services from us. Accordingly, our failure to provide satisfactory technical support or professional services could have a material and adverse effect on our business and results of operations.
We are exposed to fluctuations in currency exchange rates, which could negatively affect our financial condition and results of operations.
Our functional and reporting currency is the U.S. dollar and we generate a majority of our revenue in U.S. dollars. However, in 2012, 2013 and 2014, we incurred approximately 41%, 37% and 32%, respectively, of our expenses outside of the United States in foreign currencies, primarily the Israeli shekel, principally with respect to salaries and related personnel expenses associated with our Israeli operations. The exchange rate between the U.S. dollar and foreign currencies has fluctuated substantially in recent years and may continue to fluctuate substantially in the future. We expect that a majority of our revenues will continue to be generated in U.S. dollars for the foreseeable future and that a significant portion of our expenses, including personnel costs, as well as capital and operating expenditures, will continue to be denominated in Israeli shekels. Our results of operations may be adversely affected by foreign exchange fluctuations.
We use forward foreign exchange contracts to hedge or mitigate the effect of changes in foreign exchange rates on our operating expenses denominated in certain foreign currencies. However, this strategy cannot eliminate our exposure to foreign exchange rate fluctuations and involves costs and risks of its own, such as cash expenditures, ongoing management time and expertise, external costs to implement the strategy and potential accounting implications. Additionally, our hedging activities may contribute to increased losses as a result of volatility in foreign currency markets.
Our business and operations have experienced rapid growth, and if we do not appropriately manage any future growth, or are unable to improve our systems and processes, our operating results will be negatively affected.
We have experienced rapid growth over the last several years. For example, we grew from 474 employees as of December 31, 2012, to 580 employees as of December 31, 2013 and then to 723 employees as of December 31, 2014. This growth has placed, and will continue to place, a strain on our employees, management systems and other resources. Managing our growth has required, and will continue to require, significant expenditures and allocation of valuable management resources. We rely heavily on information technology systems to help manage critical functions, such as order processing, revenue recognition, financial forecasts and inventory and supply chain management. To manage any future growth effectively, we must continue to improve our information technology and financial infrastructure, operating and administrative systems and controls, and continue to manage headcount, capital and processes in an efficient manner. We may not be able to successfully implement improvements to these systems and processes in a timely manner.
21
Table of Contents
In addition, we rely heavily on hosted, SaaS technologies from third parties in order to operate critical functions of our business, including ERP services from NetSuite Inc. and customer relationship management (“CRM”) services from salesforce.com, inc. If these services become unavailable due to extended outages or interruptions or because they are no longer available on commercially reasonable terms or prices, our expenses could increase, our ability to manage our finances could be interrupted and our processes for managing sales of our products and services and supporting our customers could be impaired until equivalent services, if available, are identified, obtained and integrated; all of which could harm our business.
Also, our systems and processes may not prevent or detect all errors, omissions or fraud. Our failure to improve our systems and processes, or their failure to operate in the intended manner, may result in our inability to manage the growth of our business and to accurately forecast our revenue, expenses and earnings, or to prevent certain losses. Our productivity and the quality of our products and services may also be adversely affected if we do not integrate and train our new employees quickly and effectively. Any future growth would add complexity to our organization and require effective coordination across our organization. If we fail to achieve the necessary level of efficiency in our organization as it grows or otherwise fail to manage any future growth effectively, we could incur increased costs, and experience a loss of customer and investor confidence in our internal systems and processes, any of which could result in harm to our business, results of operations and financial condition.
Assertions by third parties of infringement or other violations by us of their intellectual property rights could result in significant costs and substantially harm our business and operating results.
Patent and other intellectual property disputes are common in the IT security industry. Some companies in the IT security industry, including some of our competitors, own large numbers of patents, copyrights, trademarks and trade secrets, which they may use to assert claims against us. This disparity between our patent portfolio and the patent portfolios of our most significant competitors may increase the risk that they may sue us for patent infringement and may limit our ability to counterclaim for patent infringement or settle through patent cross-licenses. In addition, there are also patent holding companies or other patent owners who are solely or primarily in the business of building portfolios of patents and asserting them against operating companies, often with little merit, and who have no relevant product revenues and against whom potential assertions our patents (and potential patents) may provide little or no deterrence. Third parties have asserted and may in the future assert claims of infringement, misappropriation or other violations of intellectual property rights against us. For example, in May 2010, F5 Networks, Inc., an IT infrastructure company that competes with us in the web application firewall market, filed a lawsuit against us alleging patent infringement. In June 2010, we filed a counterclaim alleging patent infringement by F5 Networks, Inc. In February 2011, we entered into a settlement and license agreement with F5 Networks, Inc., which dismissed the litigation. Third parties may also assert such claims against our customers or channel partners whom we typically indemnify against claims that our products infringe, misappropriate or otherwise violate the intellectual property rights of third parties. As the numbers of products and competitors in our market increase and overlaps occur, claims of infringement, misappropriation and other violations of intellectual property rights may increase. Also, to the extent we hire personnel from competitors, we may be subject to allegations that they have been improperly solicited or have divulged proprietary or other confidential information.
We cannot assure you that we are not infringing or otherwise violating any third-party intellectual property rights. Further, any claim of infringement, misappropriation or other violation of intellectual property rights by a third party, even those without merit, could be asserted against us, cause us to incur substantial costs defending against the claim and could distract our management from our business. An adverse outcome of a dispute may require us to pay substantial damages, including treble damages, if we are found to have willfully infringed a third party’s patents or copyrights; cease making, licensing or using solutions that are alleged to infringe or misappropriate the intellectual property of others; expend additional development resources to attempt to redesign our products or services or otherwise to develop non-infringing technology, which may not be successful; enter into potentially unfavorable royalty or license agreements in order to obtain the right to use necessary technologies or intellectual property rights; and indemnify our customers and partners. Royalty or licensing agreements, if required or desirable, may be unavailable on terms acceptable to us, or at all, or may require significant royalty payments and other expenditures. In addition, some licenses may be non-exclusive, and therefore our competitors may have access to the same technology licensed to us. Any of these events could seriously harm our business, financial condition and results of operations.
22
Table of Contents
We rely on the availability of licenses to third-party software and other intellectual property, the loss of which could increase our costs and delay software shipments.
Many of our products and services include software or other intellectual property licensed from third parties, and we also use software and other intellectual property licensed from third parties in our business. This exposes us to risks over which we may have little or no control. For example, a licensor may have errors or defects in its products that harm our business, may have difficulties keeping up with technological changes or may stop supporting the software or other intellectual property that it licenses to us. Also, it will be necessary in the future to renew licenses, expand the scope of existing licenses or seek new licenses, relating to various aspects of these products and services, or otherwise relating to our business, which may result in increased license fees. In addition, a direct or indirect licensor may assert that we or our customers are in breach of the terms of a license, which could, among other things, give such licensor the right to terminate a license or seek damages from us, or both. Moreover, the inclusion in our products and services of software or other intellectual property licensed from third parties on a nonexclusive basis could limit our ability to differentiate our products from those of our competitors.
Licensed software may not continue to be available on commercially reasonable terms, or at all. While we believe that there are currently adequate replacements for third-party software, any loss of the right to use any of this software could result in delays in producing or delivering our software until equivalent technology is identified and integrated, which delays could harm our business. Our business would be disrupted if any of the software we license from others or functional equivalents of this software were either no longer available to us or no longer offered to us on commercially reasonable terms. In either case, we would be required to either redesign our products to function with software available from other parties or to develop these components ourselves, which would result in increased costs and could result in delays in our product shipments and the release of new product offerings. Furthermore, we might be forced to limit the features available in our current or future products. If we fail to maintain or renegotiate any of these software licenses, we could face significant delays and diversion of resources in attempting to license and integrate a functional equivalent of the software. Any of these events could have a material adverse effect on our business, financial condition and results of operations.
Some of our products contain “open source” software, and any failure to comply with the terms of one or more of these open source licenses could negatively affect our business.
Certain of our products are distributed with software licensed under “open source” licenses. Some of these licenses contain requirements that we make available source code for modifications or derivative works we create based upon the open source software, and that we license these modifications or derivative works under the terms of a particular open source license or subject to certain license requirements. If we combine our proprietary software with open source software in a certain manner, we could, under certain provisions of the open source licenses, be required to release the source code of our proprietary software. In addition to risks related to license requirements, usage of open source software can subject us to greater risks than use of third-party commercial software, as licensors of open source software generally do not provide warranties or any indemnification for infringement of third party intellectual property rights. We have established processes to help alleviate these risks, including a review process for screening requests from our development organization for the use of open source software, but we cannot be sure that all open source software is submitted for approval prior to use in our products. In addition, open source license terms may be ambiguous and many of the risks associated with use of open source software cannot be eliminated, and could, if not properly addressed, negatively affect our business. If we were found to have inappropriately used open source software, we might be required to re-engineer our products, to release proprietary source code, to discontinue the sale of our products in the event re-engineering could not be accomplished on a timely basis or to take other remedial action that may divert resources away from our development efforts, any of which could adversely affect our business, operating results and financial condition. Disclosing the source code of our proprietary software could make it easier for malicious third parties to discover vulnerabilities in our cyber-security products and allow our competitors to create similar products with decreased development effort and time. Any of these events could have a material adverse effect on our reputation, business, financial condition and results of operations.
Failure to protect our proprietary technology and intellectual property rights could substantially harm our business and operating results.
Our success depends, in part, on our ability to protect proprietary methods and technologies that we develop under the intellectual property laws of the United States and other countries, so that we can prevent others from using our inventions and proprietary information. We attempt to protect our intellectual property under patent, trademark, copyright and trade secret laws, and through a combination of confidentiality procedures, contractual provisions and other methods, all of which offer only limited protection. If we fail to protect our intellectual property rights adequately, our competitors might gain
23
Table of Contents
access to our technology, and our business might be harmed. In addition, defending our intellectual property rights might entail significant expenses. Any of our patents, copyrights, trademarks or other intellectual property rights may be challenged by others or invalidated through administrative process or litigation. We have 15 issued patents and 11 patent applications pending as of December 31, 2014 in the United States. Our issued patents, which are limited in number compared to some of our competitors, may not provide us with any competitive advantages or may be challenged by third parties, and our patent applications may never be granted at all. Additionally, the process of obtaining patent protection is expensive and time-consuming, and we may not be able to prosecute all necessary or desirable patent applications at a reasonable cost or in a timely manner. Further, for strategic and other reasons we may choose not to seek patent protection for certain innovations and may choose not to pursue patent protection in certain jurisdictions. Even if issued, there can be no assurance that our patents will adequately protect our intellectual property, as the legal standards relating to the validity, enforceability and scope of protection of patent and other intellectual property rights are uncertain.
Any patents that are issued may subsequently be invalidated or otherwise limited, enabling other companies to better develop products that compete with ours, which could adversely affect our competitive business position, business prospects and financial condition. In addition, issuance of a patent does not guarantee that we have a right to practice the patented invention. Patent applications in the United States are typically not published until 18 months after filing, or in some cases not at all, and publications of discoveries in industry-related literature lag behind actual discoveries. We cannot be certain that we were the first to make the inventions claimed in our issued patents or pending patent applications or otherwise used in our products, that we were the first to file for protection in our patent applications, or that third parties do not have blocking patents that could be used to prevent us from marketing or practicing our patented products or technology. Effective patent, trademark, copyright and trade secret protection may not be available to us in every country in which our products and services are available. The laws of some foreign countries may not be as protective of intellectual property rights as those in the United States, and mechanisms for enforcement of intellectual property rights may be inadequate. Accordingly, despite our efforts, we may be unable to prevent third parties from infringing upon or misappropriating our intellectual property.
We might be required to spend significant resources to monitor and protect our intellectual property rights. We may initiate claims or litigation against third parties for infringement of our proprietary rights or to establish the validity of our proprietary rights. Any litigation, whether or not it is resolved in our favor, could result in significant expense to us and divert the efforts of our technical and management personnel, which may adversely affect our business, operating results and financial condition.
We may become subject to claims for remuneration or royalties for assigned service invention rights by our Israeli employees, which could result in litigation and adversely affect our business.
We have entered into assignment of invention agreements with our Israeli employees pursuant to which such individuals agree to assign to us all rights to any inventions created in the scope of their employment or engagement with us. A significant portion of our intellectual property has been developed by our Israeli employees in the course of their employment for us. Under the Israeli Patents Law, 5727-1967 (the “Patents Law”), inventions conceived by an employee during the scope of his or her employment with a company are regarded as “service inventions,” which belong to the employer, absent a specific agreement between the employee and employer giving the employee service invention rights. The Patents Law also provides that if there is no such agreement between an employer and an employee, the Israeli Compensation and Royalties Committee (the “Committee”), a body constituted under the Patents Law, shall determine whether the employee is entitled to remuneration for his or her inventions. Recent decisions by the Committee have created uncertainty in this area, as it held that employees may be entitled to remuneration for their service inventions despite having specifically waived any such rights. Further, the Committee has not yet determined the method for calculating this Committee-enforced remuneration. Although our Israeli employees have agreed to assign to us service invention rights, we may face claims demanding remuneration in consideration for assigned inventions. As a consequence of such claims, we could be required to pay additional remuneration or royalties to our current and/or former Israeli employees, or be forced to litigate such claims, which could negatively affect our business.
Confidentiality agreements with partners, employees, consultants and others may not adequately prevent disclosure of trade secrets and other proprietary information.
In order to protect our proprietary technology, processes and methods, we rely in part on confidentiality agreements and other restrictions with our customers, partners, employees, consultants and others. These agreements may not effectively prevent disclosure of confidential information and may not provide an adequate remedy in the event of unauthorized disclosure of confidential information. Despite our efforts to protect our proprietary technology, processes and methods, unauthorized parties may attempt to misappropriate, reverse engineer or otherwise obtain and use them. We may be unable to
24
Table of Contents
determine the extent of any unauthorized use or infringement of our products, technologies or intellectual property rights. In addition, others may independently develop identical or substantially similar technology and in these cases we would not be able to assert any trade secret rights against those parties. Moreover, policing unauthorized use of our technologies, products and intellectual property is difficult, expensive and time-consuming, particularly in foreign countries where the laws may not be as protective of intellectual property rights as those in the United States and where mechanisms for enforcement of intellectual property rights may be weak. Costly and time-consuming litigation could be necessary to enforce and determine the scope of our proprietary rights, and failure to obtain or maintain trade secret protection could adversely affect our competitive business position.
We are subject to governmental export and import controls that could subject us to liability or impair our ability to compete in international markets.
Our products incorporate encryption technology and may be exported outside the U.S. only if we obtain an export license or qualify for an export license exception. Compliance with applicable regulatory requirements regarding the export of our products may prevent our customers with international operations from deploying our products throughout their global systems or, in some cases, prevent the export of our products to some countries altogether. Further, various countries regulate the import of encryption technology and appliance-based products and have enacted laws that could limit our ability to distribute products, could create delays in the introduction of our products in those countries or could limit our customers’ ability to implement our products in those countries. Any new export or import restrictions, new legislation or shifting approaches in the enforcement or scope of existing regulations, or in the countries, persons or technologies targeted by such regulations, could result in decreased use of our products by existing customers with international operations, declining adoption of our products by new customers with international operations and decreased revenues. If we, or our channel partners, fail to comply with export and import regulations, we may be denied export privileges, be subjected to fines or other penalties, be unable to sell our products in certain countries and we may potentially suffer reputational harm.
Furthermore, U.S. export control laws and economic sanctions prohibit the shipment of certain products to U.S. embargoed or sanctioned countries, governments and persons. While we take precautions to prevent our product from being shipped to U.S. sanctions targets, our products could be shipped to those targets by our channel partners despite our efforts. Any such shipment could have negative consequences including government investigations, penalties and reputational harm. Any change in economic sanctions or related legislation, shift in the enforcement or scope of existing regulations, or change in the countries, governments, persons or technologies targeted by such regulations, could result in decreased use of our products by, or in our decreased ability to export or sell our products to, existing or potential customers with international operations. Any limitation on our ability to export or sell our products would likely adversely affect our business, financial condition and results of operations.
Conditions in Israel may limit our ability to develop and sell our products. This could result in a decline in revenues.
Our principal research and development facilities are located in Israel. Since the establishment of the State of Israel in 1948, a number of armed conflicts have taken place between Israel and its neighboring countries, as well as incidents of civil unrest, and a number of state and non-state actors have publicly committed to its destruction. Political, economic and military conditions in Israel could directly affect our operations. We could be adversely affected by any major hostilities involving Israel, including acts of terrorism or any other hostilities involving or threatening Israel, the interruption or curtailment of trade between Israel and its trading partners, a significant increase in inflation or a significant downturn in the economic or financial condition of Israel. Any on-going or future violence between Israel and the Palestinians, including a resumption of the recent conflict in Gaza, armed conflicts, terrorist activities, tension along the Israeli borders or with other countries in the region, including Iran, or political instability in the region could disrupt international trading activities in Israel and may materially and negatively affect our business and could harm our results of operations.
Certain countries, as well as certain companies and organizations, continue to participate in a boycott of Israeli firms, firms with large Israeli operations and others doing business with Israel and Israeli companies. In addition, such boycott, restrictive laws, policies or practices may change over time in unpredictable ways, and could, individually or in the aggregate, have a material adverse effect on our business in the future.
Some of our employees in Israel, including one of our executive officers, are obligated to perform annual military reserve duty in the Israel Defense Forces, depending on their age and position in the armed forces. Furthermore, they may be called to active reserve duty at any time under emergency circumstances for extended periods of time. For example, in 2013, approximately 57 of our employees in Israel were called for active reserve duty, each serving for an average of approximately two weeks. Our operations could be disrupted by the absence, for a significant period, of one or more of our executive officers or key employees due to military service, and any significant disruption in our operations could harm our business.
25
Table of Contents
If we are unable to hire, retain and motivate qualified personnel, our business would suffer.
We depend on the continued contributions of our senior management and other key employees to execute on our business plan, and to identify and pursue new opportunities and product innovations. The loss of services of senior management or other key employees, particularly Anthony Bettencourt, our President and Chief Executive Officer; and Amichai Shulman, one of our founders and our Chief Technology Officer, could significantly delay or prevent the achievement of our development and strategic objectives.
Our future success depends, in part, on our ability to continue to attract and retain highly skilled technical, managerial, finance and other personnel, particularly in our sales and marketing, research and development and professional service departments. Any of our employees may terminate their employment at any time. Competition for highly skilled personnel is frequently intense, globally for sales personnel, as well as in the San Francisco Bay Area and in Tel Aviv, Israel, the locations in which we have a substantial presence and need for highly-skilled personnel. We may be unable to attract and retain suitably qualified individuals who are capable of meeting our growing technical, operational and managerial requirements, on a timely basis or at all, and we may be required to pay increased compensation in order to do so. If we are unable to attract and retain the qualified personnel we need to succeed, our business will suffer.
Volatility or lack of performance in our stock price may also affect our ability to attract and retain our key employees. Employees may be more likely to leave us if the shares or restricted stock units (“RSUs”) they hold have declined in value or if the exercise prices of the options that they hold are below the market price of our common stock. If we are unable to retain our employees, our business, operating results and financial condition will be harmed.
Our internal network system and website may be subject to intentional disruption that could adversely impact our reputation and future sales.
Because we are a leading provider of cyber-security products, “hackers” and others may try to access our data or compromise our systems. Similarly, experienced computer programmers may attempt to penetrate our network security or the security of our website and cause interruptions of our services. Because the techniques used by such computer programmers to access or sabotage networks change frequently and may not be recognized until launched against a target, we may be unable to anticipate these techniques. The theft and/or unauthorized use or publication of our trade secrets and other confidential business information as a result of such an event could adversely affect our competitive position, reputation, brand and future sales of our products, and could impair our ability to operate our business, including our ability to provide subscription or maintenance and support services to our customers. We could suffer monetary and other losses and reputational harm in the event of such incidents.
Outages, interruptions or delays in hosting services could impair the delivery of our cloud-based security services and harm our business.
We operate infrastructure that supports our ThreatRadar and Security Operations Center (“SOC”) services and use third party hosting facilities for certain ThreatRadar services. Despite precautions taken within our own internal network and at these third party facilities, the occurrence of a natural disaster or an act of terrorism or other unanticipated problems could result in lengthy interruptions in our services.
The cloud-based security services that we provide through our majority-owned subsidiary, Incapsula, are operated from a network of third party facilities that host the software and systems that operate these security services. Any damage to, or failure of, our internal systems or systems at third party hosting facilities could result in outages or interruptions in our cloud-based services. Outages or interruptions in our cloud-based security services may cause our customers and potential customers to believe our cloud-based security services are unreliable, cause us to issue credits or pay penalties, cause customers to terminate their subscriptions and adversely affect our renewal rates and our ability to attract new customers, ultimately harming our business and revenue.
26
Table of Contents
Changes in our provision for income taxes or adverse outcomes resulting from examination of our income tax returns could adversely affect our results.
We are subject to income taxation in the United States and numerous foreign jurisdictions. Determining our provision for income taxes requires significant management judgment. In addition, our provision for income taxes is subject to volatility and could be adversely affected by many factors, including, among other things, changes to our operating or holding structure, changes in the amounts of earnings in jurisdictions with differing statutory tax rates, changes in the valuation of deferred tax assets and liabilities and changes in tax laws. We are subject to ongoing tax examinations in various jurisdictions. Tax authorities may disagree with our intercompany charges, cross-jurisdictional transfer pricing or other matters and assess additional taxes. While we regularly assess the likely outcomes of these examinations to determine the adequacy of our provision for income taxes, there can be no assurance that the outcomes of such examinations will not have a material impact on our operating results and cash flows.
Significant judgment is required to determine the recognition and measurement attributes prescribed in Accounting Standards Codification (“ASC”) 740-25 (formerly referred to as Financial Interpretation No. 48, “Accounting for Uncertainty in Income Taxes-an interpretation of FASB Statement No. 109”). In addition, ASC 740-25 applies to all income tax positions, including the potential recovery of previously paid taxes, which if settled unfavorably could adversely impact our provision for income taxes or additional paid-in capital. In addition, we are subject to the continuous examination of our income tax returns by the U.S. Internal Revenue Service and other tax authorities. We regularly assess the likelihood of adverse outcomes resulting from these examinations to determine the adequacy of our provision for income taxes. There can be no assurance that the outcomes from these continuous examinations will not have an adverse effect on our results of operations.
Our business is subject to the risks of earthquakes, fire, power outages, floods and other catastrophic events, and to interruption by manmade problems such as terrorism.
A significant natural disaster, such as an earthquake, fire or a flood, or a significant power outage could have a material adverse impact on our business, financial condition and results of operations. Our corporate headquarters are located in the San Francisco Bay Area, a region known for seismic activity, on land reclaimed from the bay that is susceptible to high liquefaction risk in the event of an earthquake. In addition, natural disasters could affect our manufacturing vendors or logistics providers’ ability to perform services such as manufacturing products on a timely basis and assisting with shipments on a timely basis. In the event our service providers’ information technology systems or manufacturing or logistics abilities are hindered by any of the events discussed above, shipments could be delayed, resulting in missing financial targets, such as revenue and shipment targets, for a particular quarter. Further, if a natural disaster occurs in a region from which we derive a significant portion of our revenue, customers in that region may delay or forego purchases of our products, which may materially and adversely impact our results of operations for a particular period. In addition, acts of terrorism could cause disruptions in our business or the business of our manufacturer, logistics providers, partners, customers or the economy as a whole. Given our typical concentration of sales at each quarter end, any disruption in the business of our manufacturer, logistics providers, partners or customers that impacts sales at the end of our quarter could have a significant adverse impact on our quarterly results. All of the aforementioned risks may be augmented if the business continuity plans for us and our suppliers prove to be inadequate. To the extent that any of the above results in delays or cancellations of customer orders, or the delay in the manufacture, deployment or shipment of our products, our business, financial condition and results of operations would be adversely affected.
Risks Related to Ownership of our Common Stock
Market volatility may affect our stock price and the value of your investment
The trading prices of the securities of technology companies generally, and of our stock in particular, have been highly volatile. The market price of our common stock may fluctuate significantly in response to a number of factors, most of which we cannot predict or control, including:
| • | announcements of new products, services or technologies, commercial relationships, acquisitions, strategic partnerships, joint ventures, capital commitments or other events by us or our competitors; |
| • | fluctuations in operating performance and in stock market prices and trading volumes of securities of other technology companies generally, or those in our industry in particular; |
| • | general market conditions and overall price and volume fluctuations in U.S. equity markets; |
| • | actual or anticipated variations in our operating results, or the operating results of our competitors; |
27
Table of Contents
| • | the financial and other projections we may provide to the public, any changes in these projections or our failure to meet these projections or changes in our financial guidance or securities analysts’ estimates of our financial performance; |
| • | failure of securities analysts to maintain coverage of us, changes in financial or other estimates by any securities analysts who follow us, or our failure to meet these estimates or the expectations of our investors; |
| • | ratings or other changes by any securities analysts who follow our company or our industry; |
| • | sales of large blocks of our common stock, including sales by our executive officers, directors and significant stockholders; |
| • | rumors and market speculation involving Imperva or other companies in our industry; and |
| • | lawsuits threatened or filed against us and changing legal or regulatory developments in the United States and other countries. |
In addition, the stock market in general, and the New York Stock Exchange in particular, have experienced substantial price and volume volatility that is often seemingly unrelated to the operating performance of particular companies. These broad market fluctuations or factors affecting us more specifically may cause the trading price of our common stock to decline. In the past, securities class action litigation has often been brought against a company after a period of volatility in the market price of its common stock.
We face risks related to securities litigation that could result in significant legal expenses and settlement or damage awards.
We are currently and may in the future become subject to claims and litigation alleging violations of the securities laws or similar claims, which could harm our business and require us to incur significant costs. For example, on April 11, 2014, a purported stockholder class action lawsuit was filed in the United States District Court for the Northern District of California against us and certain of our officers alleging that defendants made false and misleading statements and purporting to assert claims for violations of the federal securities laws, and seeking unspecified compensatory damages and other relief. In addition, on June 27, 2014, we (as a nominal defendant), along with certain of our directors and officers, were named in purported derivative litigation filed in the Court of Chancery in the State of Delaware. Regardless of the outcome, these matters or future litigation may require significant attention from management and could result in significant legal expenses, settlement costs or damage awards that could have a material impact on our financial position, results of operations and cash flows.
If we fail to maintain an effective system of disclosure controls and procedures and internal controls over financial reporting, our ability to produce accurate financial statements or comply with applicable regulations could be impaired.
As a public company, we are subject to the reporting requirements of the Exchange Act, the Sarbanes-Oxley Act of 2002 (the “Sarbanes-Oxley Act”), and the rules and regulations of the New York Stock Exchange. We expect that the requirements of these rules and regulations will continue to increase our legal, accounting and financial compliance costs, make some activities more difficult, time-consuming and costly and place strains on our personnel, systems and resources.
The Sarbanes-Oxley Act requires, among other things, that we maintain effective disclosure controls and procedures and internal control over financial reporting. We are continuing to develop and refine our disclosure controls and other procedures that are designed to ensure that information required to be disclosed by us in the reports that we file with the SEC is recorded, processed, summarized and reported within the time periods specified in SEC’s rules and forms. Our current controls and any new controls that we develop may become inadequate because of changes in conditions, and the degree of compliance with the policies or procedures may deteriorate. In addition, weaknesses in our internal controls over financial reporting may be discovered in the future. Our filings with the SEC are subject to periodic review by the SEC, and our auditors are subject to periodic inspection by the Public Company Accounting Oversight Board (PCAOB). Any failure to maintain effective controls over financial reporting, any difficulties encountered in the implementation of additional controls or the improvement of existing controls, or any issues that emerge as a result of regulatory review, could harm our operating results or cause us to fail to meet our reporting obligations and may result in a revision or restatement of our prior period financial statements. Any failure to maintain effective internal controls also could adversely affect the results of periodic management evaluations and annual independent registered public accounting firm attestation reports regarding the effectiveness of our internal control over financial reporting that we are required to include in our annual reports filed with the SEC under Section 404 of the Sarbanes-Oxley Act. Ineffective disclosure controls and procedures and internal control over financial reporting could also cause investors to lose confidence in our reported financial and other information, which would likely have a negative effect on the trading price of our common stock.
28
Table of Contents
For example, in connection with the review of our unaudited interim condensed consolidated financial statements in our Form 10-Q filed with the SEC on November 7, 2014, management, including our Chief Executive Officer and Chief Financial Officer, assessed the effectiveness of our disclosure controls and procedures as of September 30, 2014. Based on that assessment, management has concluded that our disclosure controls and procedures were not effective as of September 30, 2014 because of a material weakness in internal control over financial reporting related to insufficient oversight and review controls to ensure the proper determination of stock-based compensation expense for certain complex equity awards that were not issued in the ordinary course. While this control deficiency was remediated, we cannot assure you that additional material weaknesses in our internal control over financial reporting will not be identified in the future.
In order to maintain and improve the effectiveness of our disclosure controls and procedures and internal control over financial reporting, we have expended, and anticipate that we will continue to expend, significant resources and provide significant management oversight, which involve substantial accounting-related costs. Any failure to maintain the adequacy of our internal controls, or consequent inability to produce accurate financial statements on a timely basis, could increase our operating costs and could materially impair our ability to operate our business. In the event that we are not able to continue to demonstrate compliance with Section 404 of the Sarbanes-Oxley Act in a timely manner, that our internal controls are perceived as inadequate or that we are unable to produce timely or accurate financial statements, investors may lose confidence in our operating results and our stock price could decline. In addition, if we are unable to continue to meet these requirements, we may not be able to remain listed on the New York Stock Exchange.
We also have implemented elements of a disaster recovery/business continuity plan for our accounting and related information technology systems but we have not yet implemented a complete disaster recovery/business continuity plan. If the elements that we have developed and plan to develop in the future prove inadequate in the circumstances of a particular disaster or other business continuity event our ability to maintain timely accounting and reporting may be materially impaired.
If securities or industry analysts do not publish research or publish inaccurate or unfavorable research about our business, our stock price and trading volume could decline.
The trading market for our common stock will depend in part on the research and reports that securities or industry analysts publish about us or our industry. If we do not establish and maintain adequate research coverage or if one or more of the analysts who covers us downgrades our stock or publishes inaccurate or unfavorable research about our business, our stock price would likely decline. If one or more of these analysts ceases coverage of our company or fails to publish reports on us regularly, demand for our stock could decrease, which could cause our stock price and trading volume to decline.
We do not intend to pay dividends on our common stock so any returns will be limited to the value of our stock.
We have never declared or paid any cash dividend on our common stock. We currently anticipate that we will retain future earnings for the development, operation and expansion of our business and do not anticipate declaring or paying any cash dividends for the foreseeable future. Any return to stockholders will therefore be limited to the value of their stock.
Anti-takeover provisions in our charter documents and under Delaware law could make an acquisition of us, which may be beneficial to our stockholders, more difficult and may prevent attempts by our stockholders to replace or remove our current management.
29
Table of Contents
Provisions in our restated certificate of incorporation and amended and restated bylaws may delay or prevent an acquisition of us or a change in our management. These provisions include:
| • | authorizing “blank check” preferred stock, which could be issued by the board without stockholder approval and may contain voting, liquidation, dividend and other rights superior to our common stock, which would increase the number of outstanding shares and could thwart a takeover attempt; |
| • | a classified board of directors whose members can be dismissed only for cause; |
| • | the prohibition on actions by written consent of our stockholders; |
| • | the limitation on who may call a special meeting of stockholders; |
| • | the establishment of advance notice requirements for nominations for election to our board of directors or for proposing matters that can be acted upon at stockholder meetings; and |
| • | the requirement of at least 75% of the outstanding capital stock to amend any of the foregoing second through fifth provisions. |
In addition, because we are incorporated in Delaware, we are governed by the provisions of the anti-takeover provisions of the Delaware General Corporation Law, which may discourage, delay or prevent a change in control by prohibiting us from engaging in a business combination with an interested stockholder for a period of three years after the person becomes an interested stockholder, even if a change of control would be beneficial to our existing stockholders. Although we believe these provisions collectively provide for an opportunity to obtain greater value for stockholders by requiring potential acquirers to negotiate with our board of directors, they would apply even if an offer rejected by our board were considered beneficial by some stockholders. In addition, these provisions may frustrate or prevent any attempts by our stockholders to replace or remove our current management by making it more difficult for stockholders to replace members of our board of directors, which is responsible for appointing the members of our management.
Our ability to use our net operating loss carryforwards may be subject to limitations and may result in increased future tax liability to us.
Generally, a change of more than 50% in the ownership of a corporation’s stock, by value, over a three-year period constitutes an ownership change for U.S. federal income tax purposes. An ownership change may limit a company’s ability to use its net operating loss carryforwards attributable to the period prior to such change. We have not performed a detailed analysis to determine whether an ownership change under Section 382 of the Internal Revenue Code has occurred after each of our previous private placements of preferred stock or after the issuance of shares of common stock in connection with our initial public offering. In the event we have undergone an ownership change under Section 382, if we earn net taxable income, our ability to use our pre-change net operating loss carryforwards to offset U.S. federal taxable income may become subject to limitations, which could potentially result in increased future tax liability to us.
Item 1B. Unresolved Staff Comments
Not applicable.
Our corporate headquarters are located in Redwood Shores, California in an office consisting of approximately 50,500 square feet. The lease for this office expires in December 2017. Our office in Irving, Texas, where we employ sales, support and professional services employees, consists of approximately 7,500 square feet and the lease for this office expires in January 2018. Our office in Tel Aviv, Israel, where we employ our research and development team, consists of approximately 6,500 square meters (approximately 69,800 square feet), and we have agreed to lease an additional 2,000 square meters (approximately 21,500 square feet) which commenced in April 2014. The lease for this office begins to expire for portions of this office in December 2016. In October 2014, we signed a new lease agreement in Tel Aviv, Israel, for our Incapsula team. This lease consists of approximately 1,450 square meters (approximately 15,600 square feet) and expires May 2020 with the option to extend for another five years. We also lease sales offices in Japan, New York and Singapore. We believe that our facilities are suitable to meet our needs for the foreseeable future; however, we will continue to seek additional space as needed to accommodate our growth.
30
Table of Contents
From time to time, we may be subject to legal proceedings and claims in the ordinary course of business.
On April 11, 2014, a purported shareholder class action lawsuit was filed in the United States District Court for the Northern District of California against us and certain of our officers. On August 7, 2014, the Court entered an order appointing lead plaintiff and counsel for the purported class. The lead plaintiff filed an amended complaint on October 10, 2014. The lawsuit again names us and certain of our officers and purports to bring suit on behalf of those investors who purchased our publicly traded securities between May 2, 2013 and April 9, 2014. The plaintiff alleges that defendants made false and misleading statements about our operations and business and financial results and purports to assert claims for violations of the federal securities laws. The amended complaint seeks unspecified compensatory damages, interest thereon, costs incurred in the action and equitable/injunctive or other relief. On January 6, 2015, defendants filed a motion to dismiss the amended complaint.
On June 27, 2014, a purported shareholder derivative lawsuit was filed in the Court of Chancery for the State of Delaware against us (as a nominal defendant), and naming certain of our officers and directors as individual defendants. The lawsuit relates to the acquisition of Skyfence Networks, Ltd. and the complaint asserts claims for breach of fiduciary duty and unjust enrichment, and seeks to recover unspecified compensatory damages allegedly sustained by us, corporate reforms, the recovery of plaintiffs’ attorney’s fees and other relief. On September 23, 2014, we and the individual defendants moved to dismiss the action. Plaintiffs filed an amended complaint on November 6, 2014. Defendants filed a motion to dismiss the amended complaint on January 14, 2015.
In addition, we have received, and may in the future continue to receive, claims from third parties asserting, among other things, infringement of their intellectual property rights. Future litigation may be necessary to defend ourselves, our channel partners and our customers by determining the scope, enforceability and validity of third-party proprietary rights or to establish our proprietary rights.
Further, the ultimate outcome of any litigation is uncertain and, regardless of outcome, litigation can have an adverse impact on us because of defense costs, potential negative publicity, diversion of management resources and other factors. Accordingly, there can be no assurance that existing or future legal proceedings arising in the ordinary course of business or otherwise will not have a material adverse effect on our business, consolidated financial position, results of operations or cash flows.
Item 4. Mine Safety Disclosures
Not applicable.
31
Table of Contents
Item 5. Market for Registrant’s Common Equity, Related Stockholder Matters and Issuer Purchases of Equity Securities
Market Information for Common Stock
Our common stock has been listed on the New York Stock Exchange under the symbol “IMPV” since our IPO in November 2011. The following table sets forth, for the periods indicated, the high and low intra-day prices for our common stock as reported on the New York Stock Exchange.
| Fiscal 2013 |
High | Low | ||||||
| First Quarter |
$ | 39.48 | $ | 31.38 | ||||
| Second Quarter |
$ | 45.44 | $ | 36.12 | ||||
| Third Quarter |
$ | 52.60 | $ | 41.85 | ||||
| Fourth Quarter |
$ | 50.14 | $ | 36.52 | ||||
| Fiscal 2014 |
High | Low | ||||||
| First Quarter |
$ | 67.12 | $ | 47.03 | ||||
| Second Quarter |
$ | 57.45 | $ | 18.40 | ||||
| Third Quarter |
$ | 34.98 | $ | 21.59 | ||||
| Fourth Quarter |
$ | 53.35 | $ | 24.91 | ||||
| Fiscal 2015 |
High | Low | ||||||
| First Quarter (through February 15, 2015) |
$ | 51.19 | $ | 38.20 | ||||
Stockholders
As of February 17, 2015, we had approximately 38 record holders of our common stock.
Stock Price Performance Graph
The following graph shows a comparison from November 9, 2011 (the date our common stock commenced trading on the New York Stock Exchange) through December 31, 2014 of the cumulative total return for an investment of $100 (and the reinvestment of dividends) in our common stock, the NYSE Composite Index and the NYSE Computer and Data Processing Index. Such returns are based on historical results and are not intended to suggest future performance.
32
Table of Contents
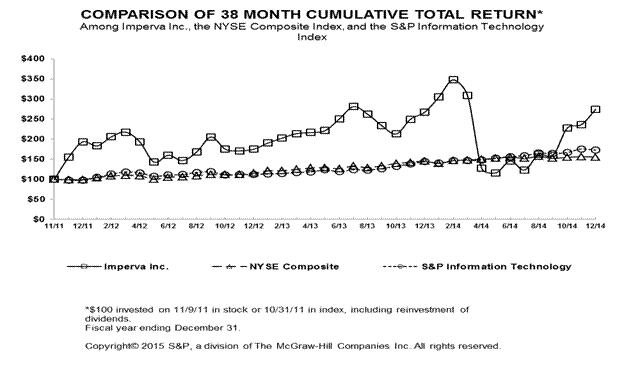
The above information under the heading “Stock Price Performance Graph” shall not be deemed to be “filed” for purposes of Section 18 of the Securities Exchange Act of 1934, as amended, or otherwise subject to the liabilities of that section or Sections 11 and 12(a)(2) of the Securities Act of 1933, as amended, and shall not be incorporated by reference into any registration statement or other document filed by us with the Securities and Exchange Commission, whether made before or after the date of this Annual Report on Form 10-K, regardless of any general incorporation language in such filing, except as shall be expressly set forth by specific reference in such filing.
Dividend Policy
We have never declared or paid cash dividends on our common stock. We currently intend to retain any future earnings and do not expect to pay any dividends in the foreseeable future. Any determination to pay dividends in the future will be at the discretion of our board of directors and will be dependent on a number of factors, including our earnings, capital requirements and overall financial conditions. The loan agreement for our credit facility contains a prohibition on the payment of cash dividends.
Equity Compensation Plan Information
The following table summarizes information about our equity compensation plans as of December 31, 2014. All outstanding awards relate to our common stock.
| Plan Category |
(a) Number of Securities to be Issued Upon Exercise of Outstanding Options, Warrants and Rights |
(b) Weighted-Average Exercise Price of Outstanding Options, Warrants and Rights1 |
(c) Number of Securities Remaining Available for Future Issuance Under Equity Compensation Plans (Excluding Securities Reflected in Column (a)) |
|||||||||
| Equity compensation plans approved by security holders2 |
1,979,363 | $ | 34.4425 | 2,062,010 | ||||||||
| Equity compensation plans not approved by security holders3 |
265,000 | $ | 29.2500 | — | ||||||||
| Total |
2,244,363 | 2,062,010 | ||||||||||
33
Table of Contents
| 1 | Based on the weighted-average exercise price of outstanding options only. There are outstanding, as of December 31, 2014, 1,815,256 RSUs issued and outstanding under our 2011 Stock Option and Incentive Plan (“2011 Plan”) that do not have an exercise price, each unit of which represents a contingent right to receive one share of our common stock upon vesting. In addition, there are outstanding, as of December 31, 2014, 178,492 performance RSUs assumed by us in connection with our acquisition of Incapsula, Inc. The performance RSUs do not have an exercise price, each unit of which represents a contingent right to receive one share of our common stock upon vesting and the achievement of certain performance metrics. |
| 2 | Prior to our initial public offering (our “IPO”) in November 2011, we issued securities under our 2003 Stock Plan, as amended. Following our IPO, we issued securities under our 2011 Plan and our 2011 Employee Stock Purchase Plan (“ESPP”). In February 2014, in connection with the closing of our acquisition of Skyfence Networks, Ltd., we assumed the outstanding options issued under the Skyfence Networks, Ltd. 2013 Share Incentive Plan. As of December 31, 2014, there were outstanding assumed Skyfence options to purchase 21,772 shares of our common stock (on an as-converted basis), with a weighted-average exercise price of $0.02. In March 2014, in connection with the closing of our acquisition of the remaining shares of Incapsula, Inc. that we did not own, we assumed the outstanding options and performance RSUs issued under the Incapsula, Inc. 2010 Stock Incentive Plan. As of December 31, 2014, there were outstanding assumed Incapsula options to purchase 39,928 shares of our common stock (on an as-converted basis), with a weighted-average exercise price of $19.3745. The information in the table above includes the assumed Skyfence and Incapsula options. See footnote 1 above for information regarding the Incapsula performance RSUs. |
| 3 | Represents options issued to Anthony Bettencourt, our President and Chief Executive Officer, pursuant to the Inducement Stock Option Plan and Agreement between Mr. Bettencourt us. In addition, we issued RSUs representing a total of 265,000 shares of our common stock to Mr. Bettencourt pursuant to the Inducement Restricted Stock Unit Plan and Agreement between Mr. Bettencourt and us (together with the Inducement Stock Option Plan and Agreement, the “Inducement Plans”). The RSUs do not have an exercise price and each unit represents a contingent right to receive one share of common stock upon vesting. We entered into the Inducement Plans with Mr. Bettencourt in connection with the commencement of his employment as our President and Chief Executive Officer. Excludes 210,954 shares issued to Mr. Kramer at a purchase price of $3.30 per share that are subject to a lapsing right of repurchase. See below for information regarding the restricted stock grants we made to Mr. Kramer. |
Under the 2011 Plan, we may issue stock awards, including but not limited to restricted stock awards, RSUs, stock bonus awards, stock appreciation rights and performance share awards. The 2011 Plan contains a provision that the number of shares available for grant and issuance will be increased on January 1 of each year from 2012 through 2015 by an amount equal to 4% of our shares outstanding on the immediately preceding December 31, unless our board of directors, in its discretion, determines to make a smaller increase. It is the current policy of our board of directors that each new non-employee director receives (1) a stock option grant when such director initially joins our board of directors with a Black-Scholes value of $130,000 based on the date of grant, and (2) RSUs with a number of shares equal to $130,000 divided by the closing price of the Company’s common stock on the New York Stock Exchange on the date of grant. In addition, on or about the date of the first board meeting following each annual stockholder meeting, each non-employee director will automatically be granted pursuant to that policy (1) a stock option grant with a Black-Scholes value of $65,000 based on the date of grant, and (2) RSUs with a number of shares equal to $65,000 divided by the closing price of the Company’s common stock on the New York Stock Exchange on the date of grant. The board may also make discretionary grants to purchase common stock to any non-employee director.
Under the 2011 ESPP, we may grant options for the purchase of our common stock. The 2011 ESPP contains a provision that the number of shares available for grant and issuance will be increased on January 1 of each of 2012 through 2019, by an amount equal to 1% of our shares outstanding on the immediately preceding December 31, unless our board of directors, in its discretion determines to make a smaller increase.
In September 2010, consistent with our practice in prior years, we sold Mr. Kramer shares of our common stock at its then-current fair market value in two separate restricted stock purchase transactions to secure his continued services as our President and Chief Executive Officer and to meet our retention objectives. In the first transaction, our board of directors agreed to sell and issue to Mr. Kramer 632,865 shares of our common stock at a purchase price of $3.30 per share, subject to a right of repurchase in favor of the company that expires periodically over four years. In the second transaction, our board of directors agreed to sell and issue to Mr. Kramer 210,954 shares of our common stock at a purchase price of $3.30 per share, subject to a right of repurchase in favor of the company that expires after five years. The shares of common stock sold in the restricted stock purchase transactions are subject to the Change in Control Plan, which is described in Current Report on Form 8-K filed by us with the SEC on February 9, 2012 and will be described in the Proxy Statement for our 2015 Annual Meeting of Stockholders to be filed with the SEC within 120 days after the end of our fiscal year ended December 31, 2014.
Recent Sales of Unregistered Securities
For the year ended December 31, 2014, we did not sell any unregistered securities that were not reported in a Current Report on Form 8-K or a Quarterly Report on Form 10-Q.
Use of Proceeds from Public Offering of Common Stock
The Form S-1 Registration Statement (Registration No. 333-175008) relating to our IPO was declared effective by the SEC on November 8, 2011, and the offering of our common stock commenced on November 9, 2011. J.P. Morgan Securities LLC and Deutsche Bank Securities Inc. acted as joint book-running managers for the offering, and RBC Capital Markets, LLC, Lazard Capital Markets LLC and Pacific Crest Securities, Inc. acted as co-managers of the offering. The offering of 5,000,000 shares of our common stock has been completed.
34
Table of Contents
The net proceeds to us of our IPO after deducting $6.9 million of underwriters’ discounts and $5.8 million of offering expenses were $86.2 million. In January 2012, we invested $3.5 million of the net proceeds to us resulting from our IPO in Incapsula, our majority owned subsidiary, and received in exchange an additional 4,375,000 shares of Incapsula’s Series A-1 Preferred Stock. In October 2013, we loaned $1.1 million of the net IPO proceeds to Incapsula at a rate of 2% per annum with a maturity date of December 31, 2014. In January 2014, we paid approximately $4.7 million in cash as part of the consideration in connection with our purchase of certain assets and liabilities of Tomium. In February 2014, we paid $8.6 million in cash, in addition to a holdback payment commitment due 24 months from the acquisition close valued at approximately $7.2 million, as part of the consideration in connection with the acquisition of Skyfence We expect to use remaining net IPO proceeds for working capital and general corporate purposes, including acquisitions. Although we may also use a portion of the net proceeds for acquisition of complementary businesses, technologies or other assets, we have no present understandings, commitments or agreements to enter into any acquisitions other than the acquisition of the outstanding securities of Incapsula not already owned by Imperva.
Our management will retain broad discretion in the allocation and use of the net proceeds of our IPO, and investors will be relying on the judgment of our management regarding the application of the net proceeds. Pending specific utilization of the net proceeds as described above, we have invested the net proceeds of the offering in short-term, interest-bearing obligations. The goal with respect to the investment of the net proceeds will be capital preservation and liquidity so that such funds are readily available to fund our operations.
Purchases of Equity Securities by the Issuer and Affiliated Purchasers
| Period |
Total Number of Shares of Common Stock |
Price Paid per Share |
Total Number of Shares Purchased as Part of Publicly Announced Plans or Programs |
Maximum Number (or Approximate Dollar Value) of Shares that May Yet Be Purchased Under the Plans or Programs |
||||||||||||
| July 1, 2014-July 30, 20141 |
14,583 | $ | 10.70 | — | — | |||||||||||
| 1 | Represents our repurchase of shares of common stock at the original purchase price from a former director. These shares were unvested at the effective time of the director’s departure from our board of directors, and were subject to our right of repurchase. |
35
Table of Contents
Item 6. Selected Financial Data
The following selected consolidated financial data should be read in conjunction with “Item 7. Management’s Discussion and Analysis of Financial Condition and Results of Operations” and our consolidated financial statements and related notes included elsewhere in this Annual Report on Form 10-K. The selected financial data in this section is not intended to replace the financial statements and is qualified in its entirety by the consolidated financial statements and related notes thereto included elsewhere in this Annual Report on Form 10-K. Our historical results of operations are not necessarily indicative of results to be expected for any future period.
| Years Ended December 31, | ||||||||||||||||||||
| 2014 | 2013 | 2012 | 2011 | 2010 | ||||||||||||||||
| (dollars in thousands, except per share amounts) | ||||||||||||||||||||
| Consolidated Statement of Operations Data: |
||||||||||||||||||||
| Net revenue: |
||||||||||||||||||||
| Products and license |
$ | 74,299 | $ | 72,153 | $ | 59,490 | $ | 47,600 | $ | 34,479 | ||||||||||
| Services |
89,711 | 65,606 | 44,745 | 30,702 | 20,903 | |||||||||||||||
|
|
|
|
|
|
|
|
|
|
|
|||||||||||
| Total net revenue |
164,010 | 137,759 | 104,235 | 78,302 | 55,382 | |||||||||||||||
| Cost of revenue: |
||||||||||||||||||||
| Products and license |
9,248 | 8,756 | 8,530 | 6,711 | 5,905 | |||||||||||||||
| Services |
27,335 | 20,940 | 13,374 | 9,510 | 6,428 | |||||||||||||||
|
|
|
|
|
|
|
|
|
|
|
|||||||||||
| Total cost of revenue1 |
36,583 | 29,696 | 21,904 | 16,221 | 12,333 | |||||||||||||||
|
|
|
|
|
|
|
|
|
|
|
|||||||||||
| Gross profit |
127,427 | 108,063 | 82,331 | 62,081 | 43,049 | |||||||||||||||
| Operating expenses: |
||||||||||||||||||||
| Research and development1 |
43,052 | 27,556 | 20,555 | 17,598 | 13,214 | |||||||||||||||
| Sales and marketing1 |
106,382 | 81,500 | 53,509 | 42,682 | 34,168 | |||||||||||||||
| General and administrative1 |
34,499 | 24,436 | 15,371 | 11,807 | 7,982 | |||||||||||||||
| Amortization of purchased intangibles |
1,269 | — | — | — | — | |||||||||||||||
|
|
|
|
|
|
|
|
|
|
|
|||||||||||
| Total operating expenses |
185,202 | 133,492 | 89,435 | 72,087 | 55,364 | |||||||||||||||
|
|
|
|
|
|
|
|
|
|
|
|||||||||||
| Loss from operations |
(57,775 | ) | (25,429 | ) | (7,104 | ) | (10,006 | ) | (12,315 | ) | ||||||||||
| Other income (expense), net |
(220 | ) | (125 | ) | (243 | ) | (190 | ) | 474 | |||||||||||
|
|
|
|
|
|
|
|
|
|
|
|||||||||||
| Loss before provision for income taxes |
(57,995 | ) | (25,554 | ) | (7,347 | ) | (10,196 | ) | (11,841 | ) | ||||||||||
| Provision for income taxes |
1,181 | 777 | 545 | 662 | 527 | |||||||||||||||
|
|
|
|
|
|
|
|
|
|
|
|||||||||||
| Net loss |
(59,176 | ) | (26,331 | ) | (7,892 | ) | (10,858 | ) | (12,368 | ) | ||||||||||
| Loss attributable to noncontrolling interest |
213 | 1,153 | 505 | 589 | 355 | |||||||||||||||
|
|
|
|
|
|
|
|
|
|
|
|||||||||||
| Net loss attributable to Imperva, Inc. stockholders |
$ | (58,963 | ) | $ | (25,178 | ) | $ | (7,387 | ) | $ | (10,269 | ) | $ | (12,013 | ) | |||||
|
|
|
|
|
|
|
|
|
|
|
|||||||||||
| Net loss per share of common stock attributable to Imperva, Inc. stockholders, basic and diluted2 |
$ | (2.28 | ) | $ | (1.04 | ) | $ | (0.32 | ) | $ | (1.34 | ) | $ | (2.46 | ) | |||||
|
|
|
|
|
|
|
|
|
|
|
|||||||||||
| Shares used in computing net loss per share of common stock, basis and diluted2 |
25,805,632 | 24,300,198 | 22,916,426 | 7,674,554 | 4,884,665 | |||||||||||||||
|
|
|
|
|
|
|
|
|
|
|
|||||||||||
36
Table of Contents
| 1 | Includes stock-based compensation as follows (in thousands): |
| Years Ended December 31, | ||||||||||||||||||||
| 2014 | 2013 | 2012 | 2011 | 2010 | ||||||||||||||||
| Cost of revenue |
$ | 2,058 | $ | 1,440 | $ | 469 | $ | 118 | $ | 44 | ||||||||||
| Research and development |
8,799 | 3,660 | 1,227 | 130 | 66 | |||||||||||||||
| Sales and marketing |
13,558 | 8,537 | 2,543 | 412 | 257 | |||||||||||||||
| General and administrative |
12,858 | 8,857 | 1,729 | 1,067 | 273 | |||||||||||||||
|
|
|
|
|
|
|
|
|
|
|
|||||||||||
| Total stock-based compensation expense |
$ | 37,273 | $ | 22,494 | $ | 5,968 | $ | 1,727 | $ | 640 | ||||||||||
|
|
|
|
|
|
|
|
|
|
|
|||||||||||
| 2 | Please see Note 16 to our audited consolidated financial statements for an explanation of the calculations of our basic and diluted net loss per share of common stock. |
| Years Ended December 31, | ||||||||||||||||||||
| 2014 | 2013 | 2012 | 2011 | 2010 | ||||||||||||||||
| (in thousands) | ||||||||||||||||||||
| Consolidated Balance Sheet Data: |
||||||||||||||||||||
| Cash and cash equivalents and short-term investments |
$ | 109,720 | $ | 115,085 | $ | 102,327 | $ | 97,612 | $ | 17,655 | ||||||||||
| Working capital |
$ | 78,244 | $ | 103,214 | $ | 92,796 | $ | 88,660 | $ | 6,841 | ||||||||||
| Total assets |
$ | 220,645 | $ | 176,491 | $ | 153,957 | $ | 133,542 | $ | 40,977 | ||||||||||
| Deferred revenue, current and long-term |
$ | 81,175 | $ | 63,052 | $ | 46,291 | $ | 33,925 | $ | 21,218 | ||||||||||
| Convertible preferred stock warrant liability |
$ | — | $ | — | $ | — | $ | — | $ | 69 | ||||||||||
| Convertible preferred stock |
$ | — | $ | — | $ | — | $ | — | $ | 53,442 | ||||||||||
| Noncontrolling interest |
$ | — | $ | (2,614 | ) | $ | (1,104 | ) | $ | (773 | ) | $ | (351 | ) | ||||||
| Total stockholders’ equity (deficit) |
$ | 97,243 | $ | 86,222 | $ | 84,231 | $ | 79,568 | $ | (52,419 | ) | |||||||||
37
Table of Contents
Item 7. MANAGEMENT’S DISCUSSION AND ANALYSIS OF FINANCIAL CONDITION AND RESULTS OF OPERATIONS
The following discussion and analysis of our financial condition and results of operations should be read in conjunction with our “Selected Consolidated Financial Data” and consolidated financial statements and notes thereto included elsewhere in this Annual Report on Form 10-K. This Annual Report on Form 10-K contains “forward-looking statements” within the meaning of Section 27A of the Securities Act of 1933, as amended (the “Securities Act”), and Section 21E of the Securities Exchange Act of 1934, as amended (the “Exchange Act”). These statements are often identified by the use of words such as “may,” “will,” “expect,” “believe,” “anticipate,” “intend,” “could,” “estimate,” or “continue,” and similar expressions or variations. These statements are based on the beliefs and assumptions of our management based on information currently available to management. Such forward-looking statements are subject to risks, uncertainties and other factors that could cause actual results and the timing of certain events to differ materially from future results expressed or implied by such forward-looking statements. Factors that could cause or contribute to such differences include, but are not limited to, those identified herein, and those discussed in the section titled “Risk Factors,” set forth in Item 1A of this Annual Report on Form 10-K and in our other SEC filings. You should review these risk factors for a more complete understanding of the risks associated with an investment in our securities. We disclaim any obligation to update any forward-looking statements to reflect events or circumstances after the date of such statements.
Overview
We are a leader in cyber-security solutions that protect business-critical data and applications whether in the cloud or on premises. Built to keep pace with the evolving threat landscape, our suite of cyber-security offerings are designed to enable organizations to discover data and application assets and vulnerabilities, to protect information wherever it lives and to comply with regulations. Our cyber-security solutions are also designed to fill the gaps left by existing endpoint and network or perimeter security solutions as organizations increasingly adopt “bring your own device” policies and move data and applications to the cloud.
Organizations are facing numerous challenges in providing the visibility and control required to protect business-critical applications and data from attack, theft and fraud from inside and outside the organization. Attacks, whether perpetrated by sophisticated hackers or malicious insiders, continue to increase in sophistication, scale and frequency. Additionally, organizations must comply with increasingly complex regulatory standards enacted to protect business-critical applications and data. Adoption of new technologies and architectures, such as mobile applications, web applications and big data, increases the complexity of, opens access to, and increases the vulnerability of business-critical data and applications. The increasing use of virtualization technologies and cloud delivery models, including unsanctioned, employee-adopted applications, known as “shadow IT,” is forcing organizations to operate outside of the traditional security model. We believe that these challenges are driving the need for cyber-security solutions that protect business-critical applications and data whether in the cloud or on premises.
Our Imperva SecureSphere product line provides database, file and web application security across various physical and virtual systems in data centers, including those in traditional on-premise data centers as well as in private, public and hybrid cloud computing environments. Our Imperva Incapsula product line provides cloud-based website security, denial of service protection and performance solutions that do not require software or hardware changes. Our Imperva Skyfence product line provides visibility into, and control over, cloud and Software-as-a-Service (“SaaS”) applications, including shadow IT, that are in growing use by enterprises of all sizes. In addition, all of our cloud offerings are designed to protect against the unique threats created as enterprises increasingly shift to deploying their applications and storing their data in the cloud to take advantage of the flexibility and cost-efficiency offered by cloud-based solutions.
We were incorporated as a Delaware corporation in 2002 with the vision of protecting high-value applications and data assets within the enterprise. Since that time we have been investing in our cyber-security solutions to meet the rapidly evolving demands of customers. We shipped our initial web application security and data security products in 2002; in 2006, we expanded our database security product to include compliance features. In 2010, we launched our file security offering. In addition, in 2010, we launched our cloud-based initiatives with ThreatRadar and, in 2011, we introduced our cloud-based offering for mid-market enterprises and small and medium-sized businesses (“SMB”) that we provide through Incapsula, Inc., which was majority owned by us until March 2014 when we acquired the remaining portion of Incapsula that we did not already own in order to more fully integrate their operations with ours. In January 2014, we acquired certain assets and liabilities of Tomium Software, LLC to accelerate our mainframe data security solutions. In February 2014, we acquired Skyfence Networks Ltd. to further our Software as a Service (“SaaS”) delivery models for internally facing corporate applications.
38
Table of Contents
Our research and development efforts are focused primarily on improving and enhancing our existing cyber-security solutions and services, as well as developing new products and services and conducting advanced security research. We conduct our research and development activities in Israel, and we believe this provides us with access to some of the best engineering talent in the security industry. As of December 31, 2014, we had 231 employees dedicated to research and development, including our advanced security research group, the Application Defense Center (“ADC”). Our research and development expense was $43.1 million, $27.6 million and $20.6 million for the years ended December 31, 2014, 2013 and 2012, respectively.
We derive our revenue from sales and licenses of our products and sales of our services. Products and license revenue is generated primarily from sales of perpetual software licenses installed on hardware appliances or virtual appliances for our SecureSphere product line. Services revenue consists of maintenance and support, professional services and training and subscriptions. A majority of our revenue is derived from customers in the Americas region. In 2014, 58% of our total revenue was generated from the Americas, 26% from Europe, Middle East and Africa (“EMEA”) and 16% from Asia Pacific (“APAC”).
We market and sell our products through a hybrid sales model, which combines a direct touch sales organization and an overlay channel sales team that actively assist our extensive network of channel partners throughout the sales process. We also provide our channel partners with marketing assistance, technical training and support. We primarily sell our products and services through our channel partners, including distributors and resellers, which sell to end-user customers, who we refer to in this Annual Report on Form 10-K as our customers. We have a network of over 360 channel partners worldwide, including both resellers and distributors. In 2014, our channel partners originated over 50%, and fulfilled almost 85%, of our sales. We work with many of the world’s leading security value-added resellers, and our partners include some of the largest hosting companies for cloud-based deployments.
As of December 31, 2014, we had over 3,700 customers in more than 90 countries. In addition, our solutions are used to protect thousands of organizations through cloud-based deployments with our Software-as-a-Service (“SaaS”) customers and our managed security service provider (“MSSP”) and hosting partners. Our customers include seven of the top ten telecommunications companies, three of the top five commercial banks in the United States, three of the top five global consumer financial services firms, three of the top five global computer hardware companies, over 300 government agencies around the world and more than 400 Global 2000 companies.
Our net revenue has increased in each of the last three years, growing from $104.2 million in 2012 to $137.8 million in 2013 to $164.0 million in 2014. We have incurred net losses attributable to our stockholders of $59.0 million, $25.2 million and $7.4 million in 2014, 2013 and 2012, respectively. As of December 31, 2014, we had an accumulated deficit of $157.7 million.
Opportunities, Challenges and Risks
We believe that the growth of our business and our future success are dependent upon many factors, including our ability to maintain our technology leadership, improve our sales and marketing, address the needs of smaller enterprises and compete effectively in the marketplace for cyber-security solutions. While each of these areas presents significant opportunities for us, they also pose important challenges and risks that we must successfully address in order to sustain the growth of our business and improve our results of operations.
Maintain Technology Leadership. As a result of the rise in sophisticated attacks by hackers and malicious insiders, the difficulty in complying with regulations governing business data and the growing complexity of, and open access to, data centers, we believe that enterprises are struggling to provide visibility and control over high-value business applications and data assets that they need to protect. In addition, organizations are increasingly taking advantage of cloud-based services and virtualization technologies, and these new technologies and architectures are increasing the complexity of, and accessibility to, the data center. We believe these challenges are driving the need for a new protection layer positioned closely around the applications and data assets in the data center. We expect that as enterprises recognize the growing risk to high-value business data and the need to comply with increasing regulatory compliance mandates, their spending will increase on solutions designed to control and protect such data. We believe that traditional security and compliance products do not address the evolving needs of enterprises or do not do so adequately, and that this presents us with a large market opportunity. To capitalize on this opportunity, we have introduced and expect that in the future we will need to continue to introduce innovations to our broad business security solutions, including solutions to address cyber-security opportunities that arise as enterprises pursue cloud computing initiatives. We cannot assure you that our products will achieve widespread market acceptance or that we will properly anticipate future customer needs. Moreover, if our products do not satisfy evolving customer requirements, we will not capture the increase in spending that we expect will result from enterprises seeking to secure data across various systems in the data center.
39
Table of Contents
Invest in Sales and Marketing. In order to capitalize on the anticipated increase in spending in the cyber-security market, we will need to continue to invest significant resources to further strengthen our existing relationships with channel partners, extend our global network by adding new channel partners and grow our sales and marketing team. Any investments that we make in our sales and marketing will occur in advance of our experiencing any benefits from such investments, and so it may be difficult for us to determine if we are efficiently allocating our resources in this area. We cannot assure you that the investments that we intend to make to strengthen our sales and marketing efforts will enable us to capitalize on the expected increase in spending in the cyber-security market or result in an increase in revenue or an improvement in our results of operations.
Address Needs of Smaller Enterprises. As market awareness of the benefits of a comprehensive cyber-security solution increases, we believe there is a significant opportunity to provide cyber-security solutions to smaller enterprises as they confront increasing security threats and compliance mandates. To capitalize on this opportunity, we intend to increase our business with mid-market enterprises and SMBs by expanding our cloud-based service offerings and our distribution channel. We have made, and may in the future continue to make, significant investments in our cloud-based security products to address the business security needs of mid-market enterprises and SMBs. If our cloud-based security products, which are relatively new, fail to gain broad acceptance with mid-market enterprises and SMBs, our revenue growth, results of operations and competitive position in our industry could suffer.
Compete Effectively. We operate in an intensely competitive market that has witnessed significant consolidation in recent years with large companies acquiring many of our competitors. We track our success rate in competitive sales opportunities against certain competitors, some of which generate higher revenues and have greater market capitalizations than we do, and many of which are more established or have greater name recognition within our industry. Based upon our internal tracking of the results of such competitive sales opportunities, we believe that we have historically competed favorably against our larger competitors, and that we have a proven track record of successfully competing against such larger competitors. Nonetheless, some of our larger competitors have numerous advantages, including, but not limited to, greater financial resources, broader product offerings and more established relationships with channel partners and customers. If we are unable to compete effectively for a share of the business security market, our business, results of operations and financial condition could be materially and adversely affected.
To date, we have incurred, and continue to incur, losses from operations and net losses. However, we believe that our existing cash, cash equivalents and short-term investments will be sufficient to meet our working capital and capital expenditure needs for at least the next 12 months. Further, we expect that, if we successfully execute our business plan and strategy, our loss from operations and our net losses will decline, and that we will reach profitability. Should we need additional cash in the future, we may utilize existing lines of credit, enter into additional lines of credit or raise funds through the sale of equity securities.
Key Metrics of Our Business
We monitor the key financial metrics discussed below to help us evaluate growth trends, establish budgets, measure the effectiveness of our sales and marketing efforts and assess operational efficiencies.
Net Revenue. We measure our net revenue to assess the acceptance of our products from our customers, our growth in the markets we serve and to help us establish our strategic and operating plans for future periods. We discuss the components of our net revenue in “—Financial Overview— Net Revenue” below.
Gross Margin. We monitor our gross margin to assess the impact on our current and forecasted financial results from any changes to the pricing and mix of products we are selling to our customers.
Loss from Operations. We track our loss from operations to assess how effectively we are planning and monitoring our operations as well as controlling our operational costs, which are primarily driven by headcount.
Cash, Cash Equivalents and Short-term Investments. We evaluate the level of our cash, cash equivalents and short-term investments to ensure we have sufficient liquidity to fund our operations, including the development of future products and product enhancements and the expansion into new sales channels and territories.
40
Table of Contents
Number of Customers. We believe our customer count is a key indicator of our market penetration, the productivity of our sales organization and the value that our products bring to our customer base. We also believe our existing customers represent significant future revenue opportunities for us.
We discuss for the periods presented revenue, gross margin, the components of loss from operations and number of customers further below under “—Segments” and “—Results of Operations”, as applicable, and we discuss our cash and cash equivalents under “—Liquidity and Capital Resources.”
We also believe that deferred revenue and cash flow from operations are key financial metrics for our business. The components of deferred revenue and cash flow from operations, as well as our rationale for monitoring these metrics, are discussed immediately below this table:
| Years ended (or as
of December 31) |
||||||||||||
| 2014 | 2013 | 2012 | ||||||||||
| (in thousands, except number of customers and percentages) | ||||||||||||
| Net revenue |
$ | 164,010 | $ | 137,759 | $ | 104,235 | ||||||
| Gross margin |
77.7 | % | 78.4 | % | 79.0 | % | ||||||
| Loss from operations |
$ | (57,775 | ) | $ | (25,429 | ) | $ | (7,104 | ) | |||
| Total deferred revenue |
$ | 81,175 | $ | 63,052 | $ | 46,291 | ||||||
| Cash, cash equivalents and short-term investments |
$ | 109,720 | $ | 115,085 | $ | 102,327 | ||||||
| Net cash provided by operations |
$ | 4,126 | $ | 9,797 | $ | 4,467 | ||||||
| Number of customers |
3,785 | 3,011 | 2,293 | |||||||||
Deferred Revenue
Our deferred revenue consists of amounts that have been invoiced but that have not yet been recognized as revenue. The majority of our deferred revenue balance consists of the unamortized portion of services revenue from maintenance and support, and subscription contracts. We monitor our deferred revenue balance because it represents a significant portion of revenue to be recognized in future periods. We also assess the increase in our deferred revenue balance plus revenue we recognized in a particular period as a measure of our sales activity for that period. While the change in our deferred revenue and revenue recognized in a given period comprise the majority of our sales activity during that period, they do not constitute the entire sales activity during the period. Our total sales activity also includes sales of products and services for which we have not yet met the criteria to recognize revenue or add such amounts to our deferred revenue balance. Revenue and deferred revenue from these transactions is recognized or recorded in future periods when we have met the required criteria. We discuss for the periods presented deferred revenue further below under “—Results of Operations.”
Net Cash Provided by Operations
We monitor cash flow from operations as a measure of our overall business performance. Our cash flow from operations is driven primarily by sales of our products and licenses and, to a lesser extent, from up-front payments from customers under maintenance and support contracts. Our primary uses of cash in operating activities are for personnel-related expenditures, costs of acquiring the hardware used for our appliances, marketing and promotional expenses and costs related to our facilities. Monitoring cash flow from operations enables us to analyze our financial performance without the non-cash effects of certain items such as depreciation and amortization and stock-based compensation expenses, thereby allowing us to better understand and manage the cash needs of our business.
Segments
Operating segments are components of an enterprise for which separate financial information is available and is evaluated regularly by our chief operating decision maker in deciding how to allocate resources and in assessing performance. Our chief operating decision maker is the Chief Executive Officer.
We had two operating segments which were both reportable business segments: (i) Imperva, which was comprised of Imperva’s and its wholly-owned subsidiaries’ financial position and results of operations; and (ii) Incapsula, which was comprised of Incapsula’s financial position and results from operations. In March 2014 when we acquired Incapsula, we revised our business segments based upon the acquisition of the remaining shares of Incapsula, Inc. that we did not already own. As a result, we no longer separately report the Incapsula segment and we now operate in one operating segment, and therefore, one reportable segment, in order to better align Incapsula with our strategic approach to the markets and customers we serve. During the three months ended March 31, 2014, the Company revised its business segments based upon the acquisition of the remaining shares of Incapsula, Inc. that the Company did not already own. As a result, the Company no longer separately reports the Incapsula segment and the Company now operates its business in one operating segment, which is the development, marketing, sales, service and support of cyber-security solutions that protect business critical data and applications whether in cloud or on premises.
41
Table of Contents
Financial Overview
Net Revenue
We derive our revenue from sales and licenses of our products and sales of our services. As discussed further in “—Critical Accounting Policies and Estimates—Revenue Recognition” below, revenue is recognized when persuasive evidence of an arrangement exists, delivery has occurred, the price is fixed or determinable and collection is probable.
Our net revenue is comprised of the following:
| • | Products and License Revenue—Product and license revenue is generated from sales of perpetual software licenses installed on hardware appliances or virtual appliances for our SecureSphere product line. Our SecureSphere product line consists of database security, file security and web application security. We offer multiple hardware appliance versions that accompany our software, each with different throughput capacities. Perpetual software license revenue is generated from sales of our appliances, licenses for additional users and add-on software modules. We also generate a small amount of hardware revenue from sales of spares or replacement appliances, demonstration units, third-party OEM units and accessories. |
| • | Services Revenue—Services revenue consists of maintenance and support, professional services and training and subscriptions. Maintenance and support revenue is generated from support services that are bundled with appliances and add-on software modules. There are three levels of maintenance and support—Standard, Enhanced and Premium—and these are offered through agreements for one to five-year terms. Maintenance and support includes major and minor when-and-if available software updates; customer care, which includes our designated support engineer and Imperva resident engineer programs; content updates from our advanced security research group, the ADC, and hardware replacement. Subscription revenue is generated from sales of our cloud-based services. Professional services revenue consists of fees we earn related to implementation and consulting services we provide our customers. Training services revenue consists of fees we earn related to training customers and partners on the use of our products. We expect that the services revenue from maintenance and support contracts will continue to grow along with the increase in the size of our installed base. |
A majority of our products and services are sold to customers in the Americas, primarily in the United States, however, a significant portion of our revenue is generated from international sales. See Note 15 of “Notes to Consolidated Financial Statements” for a discussion of our financial information by geographic region. Our revenue by geographic region is as follows (in thousands):
| Years Ended December 31, | ||||||||||||
| 2014 | 2013 | 2012 | ||||||||||
| Americas |
$ | 94,266 | $ | 83,736 | $ | 61,588 | ||||||
| EMEA |
43,111 | 33,183 | 24,958 | |||||||||
| APAC |
26,633 | 20,840 | 17,689 | |||||||||
|
|
|
|
|
|
|
|||||||
| Total net revenue |
$ | 164,010 | $ | 137,759 | $ | 104,235 | ||||||
|
|
|
|
|
|
|
|||||||
Cost of Revenue
Our total cost of revenue is comprised of the following:
| • | Cost of Products and License Revenue—Cost of products and license revenue is comprised primarily of third-party hardware costs and royalty fees. Our cost of products and license revenue also includes personnel costs related to our operations team, shipping costs and write-offs for excess and obsolete inventory. |
| • | Cost of Services Revenue—Cost of services revenue is primarily comprised of personnel costs of our technical support team, our professional consulting services and training teams and our Security Operations Center (“SOC”) team. Cost of services revenue also includes facilities costs, subscription fees and depreciation. We expect that our cost of services revenue will increase in absolute dollars as we increase our headcount. |
42
Table of Contents
Operating Expenses
Our operating expenses consist of research and development, sales and marketing, general and administrative expenses and amortization of acquired intangible assets. Personnel costs are the most significant component of our operating expenses and consist of wages, benefits and bonuses and, with regard to the sales and marketing expense, sales commissions. Personnel costs also include stock-based compensation. We expect personnel costs to continue to increase in absolute dollars as we hire new employees to continue to grow our business.
Research and Development
Our research and development is focused on maintaining and improving our existing products and on new product development. A majority of our research and development expenses are comprised of personnel costs and, to a lesser extent, facility costs, hardware prototype costs, laboratory expenses and depreciation. We expense research and development costs as incurred. We expect our research and development expenses to increase in absolute dollars as we continue to enhance our existing products and develop new products and services that address the emerging market for business security and regulatory compliance.
Sales and Marketing
Sales and marketing expense is the largest component of our operating expenses and consists primarily of personnel costs, including commissions and travel expenses. Sales and marketing expenses also include costs related to marketing and promotional activities, third-party referral fees and, to a lesser extent, facilities costs and depreciation. We expect our sales and marketing expenses to increase in absolute dollars as we expand our sales and marketing efforts worldwide.
General and Administrative
General and administrative expense consists primarily of personnel costs, including stock-based compensation, as well as professional fees, facilities costs and depreciation. General and administrative personnel costs include our executive, finance, purchasing, order entry, human resources, information technology and legal functions. Our professional fees consist primarily of accounting, external legal, information technology and other consulting costs.
Amortization of Acquired Intangible Assets
Amortization of acquired intangible assets consists of amortization of intangible assets from the acquisitions of Skyfence and Tomium that occurred in the first quarter of 2014.
Other Income (Expense), net
Other income (expense), net is comprised of the following items:
| • | Interest Income—Interest income consists of interest earned on our cash, cash equivalents and short-term investments. We expect interest income will vary each reporting period depending on our average investment balances during the period and market interest rates. |
| • | Interest Expense—Interest expense consists of interest accrued or paid on debt obligations. |
| • | Foreign Currency Forward Contract Gains (Losses)—Foreign currency forward contract gains and losses pertain to the ineffective portion of derivative instruments designated as hedges and changes in fair value of derivatives not designated as hedges that we have entered into primarily to manage our exposure to the variability in expected future expenses resulting from changes in foreign currency exchange rates. We do not use derivative financial instruments for speculative or trading purposes. We expect our foreign currency forward contract gains (losses) to continue to fluctuate in the future due to changes in foreign currency exchange rates for derivatives not designated as hedges. |
| • | Foreign Currency Exchange Gains (Losses)—Foreign currency exchange gains and losses relate to transactions denominated in currencies other than the U.S. Dollar. |
Provision for Income Taxes
We operate in several income tax jurisdictions and are subject to income taxes in each country or jurisdiction in which we conduct business including the United States and Israel. Earnings from our non-U.S. activities are subject to local country income tax and may be subject to U.S. income tax if such earnings are distributed to the U.S. To date, we have incurred net losses and have recorded insignificant U.S. federal income tax expense. Our income tax expense to date relates primarily to foreign income taxes, mainly from our Israeli and United Kingdom activities, and to a lesser extent, state income taxes.
43
Table of Contents
Results of Operations
The following table is a summary of our consolidated statements of operations in dollars and as a percentage of our total net revenue. We have derived the data for the years ended December 31, 2014, 2013 and 2012 from our audited consolidated financial statements included elsewhere in this Annual Report on Form 10-K.
| Years Ended December 31, | ||||||||||||||||||||||||
| 2014 | 2013 | 2012 | ||||||||||||||||||||||
| Amount | % of Net Revenue |
Amount | % of Net Revenue |
Amount | % of Net Revenue |
|||||||||||||||||||
| (dollars in thousands) | ||||||||||||||||||||||||
| Statement of Operations Data: |
||||||||||||||||||||||||
| Net revenue: |
||||||||||||||||||||||||
| Products and license |
$ | 74,299 | 45.3 | $ | 72,153 | 52.4 | $ | 59,490 | 57.1 | |||||||||||||||
| Services: |
||||||||||||||||||||||||
| Maintenance and support |
54,795 | 33.4 | 44,353 | 32.2 | 33,647 | 32.3 | ||||||||||||||||||
| Professional services and training |
11,414 | 7.0 | 9,890 | 7.2 | 6,428 | 6.1 | ||||||||||||||||||
| Subscriptions |
23,502 | 14.3 | 11,363 | 8.2 | 4,670 | 4.5 | ||||||||||||||||||
|
|
|
|
|
|
|
|
|
|
|
|
|
|||||||||||||
| Total services |
89,711 | 54.7 | 65,606 | 47.6 | 44,745 | 42.9 | ||||||||||||||||||
|
|
|
|
|
|
|
|
|
|
|
|
|
|||||||||||||
| Total net revenue |
164,010 | 100.0 | 137,759 | 100.0 | 104,235 | 100.0 | ||||||||||||||||||
|
|
|
|
|
|
|
|
|
|
|
|
|
|||||||||||||
| Cost of revenue: |
||||||||||||||||||||||||
| Products and license |
9,248 | 5.6 | 8,756 | 6.4 | 8,530 | 8.2 | ||||||||||||||||||
| Services |
27,335 | 16.7 | 20,940 | 15.2 | 13,374 | 12.8 | ||||||||||||||||||
|
|
|
|
|
|
|
|
|
|
|
|
|
|||||||||||||
| Total cost of revenue |
36,583 | 22.3 | 29,696 | 21.6 | 21,904 | 21.0 | ||||||||||||||||||
|
|
|
|
|
|
|
|
|
|
|
|
|
|||||||||||||
| Gross profit |
127,427 | 77.7 | 108,063 | 78.4 | 82,331 | 79.0 | ||||||||||||||||||
| Operating expenses: |
||||||||||||||||||||||||
| Research and development |
43,052 | 26.2 | 27,556 | 20.0 | 20,555 | 19.7 | ||||||||||||||||||
| Sales and marketing |
106,382 | 64.9 | 81,500 | 59.2 | 53,509 | 51.3 | ||||||||||||||||||
| General and administrative |
34,499 | 21.0 | 24,436 | 17.7 | 15,371 | 14.8 | ||||||||||||||||||
| Amortization of purchased intangibles |
1,269 | 0.8 | — | 0.0 | — | 0.0 | ||||||||||||||||||
|
|
|
|
|
|
|
|
|
|
|
|
|
|||||||||||||
| Total operating expenses |
185,202 | 112.9 | 133,492 | 96.9 | 89,435 | 85.8 | ||||||||||||||||||
|
|
|
|
|
|
|
|
|
|
|
|
|
|||||||||||||
| Loss from operations |
(57,775 | ) | (35.2 | ) | (25,429 | ) | (18.5 | ) | (7,104 | ) | (6.8 | ) | ||||||||||||
| Other income (expense), net |
(220 | ) | (0.1 | ) | (125 | ) | (0.1 | ) | (243 | ) | (0.2 | ) | ||||||||||||
|
|
|
|
|
|
|
|
|
|
|
|
|
|||||||||||||
| Loss before provision for income taxes |
(57,995 | ) | (35.3 | ) | (25,554 | ) | (18.6 | ) | (7,347 | ) | (7.0 | ) | ||||||||||||
| Provision for income taxes |
1,181 | 0.7 | 777 | 0.6 | 545 | 0.5 | ||||||||||||||||||
|
|
|
|
|
|
|
|
|
|
|
|
|
|||||||||||||
| Net loss |
(59,176 | ) | (36.0 | ) | (26,331 | ) | (19.2 | ) | (7,892 | ) | (7.5 | ) | ||||||||||||
| Loss attributable to noncontrolling interest |
213 | 0.1 | 1,153 | 0.8 | 505 | 0.5 | ||||||||||||||||||
|
|
|
|
|
|
|
|
|
|
|
|
|
|||||||||||||
| Net loss attributable to Imperva, Inc. stockholders |
$ | (58,963 | ) | (35.9 | ) | $ | (25,178 | ) | (18.4 | ) | $ | (7,387 | ) | (7.0 | ) | |||||||||
|
|
|
|
|
|
|
|
|
|
|
|
|
|||||||||||||
44
Table of Contents
Comparison of the Years Ended December 31, 2014 and 2013
Net Revenue
| Years Ended December 31, |
||||||||||||||||||||||||
| 2014 | 2013 | Change | ||||||||||||||||||||||
| Amount | % of Net Revenue |
Amount | % of Net Revenue |
Amount | % | |||||||||||||||||||
| (dollars in thousands) | ||||||||||||||||||||||||
| Net revenue: |
||||||||||||||||||||||||
| Products and license |
$ | 74,299 | 45.3 | $ | 72,153 | 52.4 | $ | 2,146 | 3.0 | % | ||||||||||||||
| Services: |
||||||||||||||||||||||||
| Maintenance and support |
54,795 | 33.4 | 44,353 | 32.2 | 10,442 | 23.5 | % | |||||||||||||||||
| Professional services and training |
11,414 | 7.0 | 9,890 | 7.2 | 1,524 | 15.4 | % | |||||||||||||||||
| Subscriptions |
23,502 | 14.3 | 11,363 | 8.2 | 12,139 | 106.8 | % | |||||||||||||||||
|
|
|
|
|
|
|
|
|
|
|
|||||||||||||||
| Total services |
89,711 | 54.7 | 65,606 | 47.6 | 24,105 | 36.7 | % | |||||||||||||||||
|
|
|
|
|
|
|
|
|
|
|
|||||||||||||||
| Total net revenue |
$ | 164,010 | 100.0 | $ | 137,759 | 100.0 | $ | 26,251 | 19.1 | % | ||||||||||||||
|
|
|
|
|
|
|
|
|
|
|
|||||||||||||||
| Americas |
$ | 94,266 | 57.5 | $ | 83,736 | 60.8 | $ | 10,530 | 12.6 | % | ||||||||||||||
| EMEA |
43,111 | 26.3 | 33,183 | 24.1 | 9,928 | 29.9 | % | |||||||||||||||||
| APAC |
26,633 | 16.2 | 20,840 | 15.1 | 5,793 | 27.8 | % | |||||||||||||||||
|
|
|
|
|
|
|
|
|
|
|
|||||||||||||||
| Total net revenue |
$ | 164,010 | 100.0 | $ | 137,759 | 100.0 | $ | 26,251 | 19.1 | % | ||||||||||||||
|
|
|
|
|
|
|
|
|
|
|
|||||||||||||||
Our net revenue increased by $26.3 million, or 19.1%, to $164.0 million during the year ended December 31, 2014 from $137.8 million during the year ended December 31, 2013 primarily due to growth in services revenue. This revenue growth reflects the increasing demand for our subscription service offerings as well as a broader installed base of product and licenses which generate higher maintenance and support revenues. The Americas region contributed the largest portion with a $10.5 million increase, or approximately a 12.6% change over the same period in 2013. In addition, an increase in our international sales personnel resulted in increases in revenue in EMEA and APAC of $9.9 million and $5.8 million, or approximately a 29.9% and 27.8% change, respectively, over the same period in 2013.
Services revenue increased by $24.1 million, or 36.7%, to $89.7 million during the year ended December 31, 2014 from $65.6 million during the year ended December 31, 2013. During the year ended December 31, 2014, our services revenue was comprised of $54.8 million of maintenance and support, $11.4 million of professional services and training and $23.5 million of subscriptions. The change in services revenue in the year ended December 31, 2014 from the year ended December 31, 2013 was primarily due to an increase of $12.1 million in subscriptions revenue resulting from our cloud-based security services and ThreatRadar, $10.4 million in maintenance and support revenue from our larger installed base, and $1.5 million in professional services and training revenues related to increases in headcount which allowed for completion of more service engagements.
Products and license revenue increased by $2.1 million, or 3.0%, to $74.3 million during the year ended December 31, 2014 from $72.2 million during the year ended December 31, 2013. The change in product and license revenue was primarily due to an increase of $2.4 million in the APAC region and an increase of $0.8 million in the EMEA region offset by a decrease of $1.0 million in the Americas region during the year ended December 31, 2014 compared to year ended December 31, 2013. The decrease in the Americas region product and license revenue was primarily due to extended sales cycles for orders resulting from a combination of sales execution challenges in the United States and intensifying competition for orders exceeding $100,000.
45
Table of Contents
Gross Profit
| Years Ended December 31, |
||||||||||||||||||||
| 2014 | 2013 | |||||||||||||||||||
| Amount | Gross Margin |
Amount | Gross Margin |
% Change | ||||||||||||||||
| (dollars in thousands) | ||||||||||||||||||||
| Products and license gross profit |
$ | 65,051 | 87.6 | % | $ | 63,397 | 87.9 | % | (0.3 | ) | ||||||||||
| Services gross profit |
62,376 | 69.5 | % | 44,666 | 68.1 | % | 1.4 | |||||||||||||
|
|
|
|
|
|||||||||||||||||
| Total gross profit |
$ | 127,427 | 77.7 | % | $ | 108,063 | 78.4 | % | (0.7 | ) | ||||||||||
|
|
|
|
|
|||||||||||||||||
Total gross profit decreased 0.7 percentage points from 78.4% during the year ended December 31, 2013 to 77.7% during the year ended December 31, 2014 primarily due to an increased proportion of services revenue to total revenues. Products and license gross profit declined 0.3% to 87.6% for the year ended December 31, 2014 compared to 87.9% for the same period in 2013. Services gross profit improved 1.4% to 69.5% for the year ended December 31, 2014 as compared to 68.1% for the same period in 2013, mostly due to higher maintenance and subscriptions revenue which better leveraged the internal cost structure to support these services. The product and licenses gross profit decline was primarily attributable to a higher proportion of stand-alone hardware product revenues to total products and licenses revenues.
Operating Expenses
| Years Ended December 31, | ||||||||||||||||||||||||
| 2014 | 2013 | Change | ||||||||||||||||||||||
| Amount | % of Net Revenue |
Amount | % of Net Revenue |
Amount | % | |||||||||||||||||||
| (dollars in thousands) | ||||||||||||||||||||||||
| Operating expenses: |
||||||||||||||||||||||||
| Research and development |
$ | 43,052 | 26.2 | $ | 27,556 | 20.0 | $ | 15,496 | 56.2 | % | ||||||||||||||
| Sales and marketing |
106,382 | 64.9 | 81,500 | 59.2 | 24,882 | 30.5 | % | |||||||||||||||||
| General and administrative |
34,499 | 21.0 | 24,436 | 17.7 | 10,063 | 41.2 | % | |||||||||||||||||
| Amortization of acquired intangible assets |
1,269 | 0.8 | — | — | 1,269 | n/a | ||||||||||||||||||
|
|
|
|
|
|
|
|
|
|
|
|||||||||||||||
| Total operating expenses |
$ | 185,202 | 112.9 | $ | 133,492 | 96.9 | $ | 51,710 | 38.7 | % | ||||||||||||||
|
|
|
|
|
|
|
|
|
|
|
|||||||||||||||
Results above include stock-based compensation expense of:
| Years Ended December 31, | ||||||||||||
| 2014 | 2013 | Change | ||||||||||
| (dollars in thousands) | ||||||||||||
| Research and development |
$ | 8,799 | $ | 3,660 | $ | 5,139 | ||||||
| Sales and marketing |
13,558 | 8,537 | 5,021 | |||||||||
| General and administrative |
12,858 | 8,857 | 4,001 | |||||||||
|
|
|
|
|
|
|
|||||||
| $ | 35,215 | $ | 21,054 | $ | 14,161 | |||||||
|
|
|
|
|
|
|
|||||||
Research and development expenses increased by $15.5 million, or 56.2%, to $43.1 million during the year ended December 31, 2014 from $27.6 million during the year ended December 31, 2013. The change was primarily attributable to an increase of $13.6 million in personnel costs, including stock-based compensation, due to additional research and development personnel being hired to support our ongoing product development efforts. In addition, facility and depreciation expenses increased by $0.5 million.
46
Table of Contents
Sales and marketing expenses increased by $24.9 million, or 30.5%, to $106.4 million during the year ended December 31, 2014 from $81.5 million during the year ended December 31, 2013. The change was due to an increase of $18.5 million in personnel costs, including stock-based compensation due to increased headcount worldwide in an effort to help drive our overall revenue growth, $1.3 million in travel expenses due to increased headcount, and a $2.9 million increase in trade show, corporate marketing and seminar costs.
General and administrative expenses increased by $10.1 million, or 41.2%, to $34.5 million during the year ended December 31, 2014 from $24.4 million during the year ended December 31, 2013. The change was primarily due to an increase of $6.8 million in personnel costs, including stock-based compensation, primarily related to increased headcount to support the growth and operations of our business and a $2.8 million increase in legal and accounting fees.
Amortization of purchased intangibles increased by $1.3 million during the year ended December 31, 2014 related to the acquisitions of Skyfence and Tomium completed during the first quarter of 2014. There was no such amortization in the prior year.
Loss from Operations
| Years Ended December 31, | Change | |||||||||||||
|
2014 |
2013 | Amount | % | |||||||||||
| (dollars in thousands) | ||||||||||||||
| $ | (57,775 | ) | $ | (25,429 | ) | $ | (32,346 | ) | -127.2 | % | ||||
Our loss from operations increased by $32.3 million, or 127.2%, from $25.4 million during the year ended December 31, 2013 to $57.8 million during the year ended December 31, 2014. Total operating expenses increased by $51.7 million for the year ended December 31, 2014 when compared to the prior year principally due to increases in personnel costs, including stock-based compensation expense, to support the increased scope and global reach of our business. The increase in operating expenses was comprised of increased sales and marketing costs of $24.9 million to expand our global sales efforts, and increased general and administrative costs of $10.1 million primarily related to increased headcount to support the growth and operations of our business. In addition, we had increased research and development costs of $15.5 million primarily from hiring to support our ongoing product development efforts. This increase in operating expenses was partially offset by an increase in our gross profit of $19.4 million during the year ended December 31, 2014 due to higher net revenues.
Other Income (Expense), Net
| Years Ended December 31, | Change | |||||||||||||
|
2014 |
2013 | Amount | % | |||||||||||
| (dollars in thousands) | ||||||||||||||
| $ | (220 | ) | $ | (125 | ) | $ | (95 | ) | -76.0 | % | ||||
Other income (expense), net, decreased approximately $95,000, or 76.0% during the year ended December 31, 2014 as compared to 2013. The change was primarily due to a decrease of $227,000 in other income primarily due to lower interest income and a decrease of $132,000 in other expense primarily due to foreign currency exchange losses, net.
47
Table of Contents
Provision for Income Taxes
| Years Ended December 31, |
Change | |||||||||||||||
| 2014 | 2013 | Amount | % | |||||||||||||
| (dollars in thousands) | ||||||||||||||||
| Provision for income taxes |
$ | 1,181 | $ | 777 | $ | 404 | 52.0 | % | ||||||||
| Effective tax rate |
-2.0 | % | -3.0 | % | ||||||||||||
The provision for income taxes for the years ended December 31, 2014 and 2013 was comprised primarily of foreign and state income taxes. The increase in the provision for income taxes in the year ended December 31, 2014 compared with the year ended December 31, 2013 was primarily attributable to an increase in foreign income tax.
Deferred Revenue
| Years Ended December 31, |
Change | |||||||||||||||
| 2014 | 2013 | Amount | % | |||||||||||||
| (dollars in thousands) | ||||||||||||||||
| Total deferred revenue |
$ | 81,175 | $ | 63,052 | $ | 18,123 | 28.7 | % | ||||||||
Deferred revenue increased by $18.1 million, or 28.7%, to $81.2 million as of December 31, 2014 from $63.1 million as of December 31, 2013. The growth in our deferred revenue was primarily attributable to an increase in our installed base of products and licenses worldwide and resulting renewals of maintenance and support agreements, as well as new sales of subscription and maintenance and support agreements.
Number of Customers
| As of December 31, | Change | |||||||||||||||
| 2014 | 2013 | Amount | % | |||||||||||||
| (in thousands) | ||||||||||||||||
| Number of customers |
3,785 | 3,011 | 774 | 25.7 | % | |||||||||||
Our number of customers increased by 774, or 25.7%, to 3,785 as of December 31, 2014 from 3,011 as of December 31, 2013. Our growth in customer count was driven by increasing market acceptance of our products as well as an increase in our global sales and services and support organizations from 296 people as of December 31, 2013 to 330 as of December 31, 2014. The growth in our sales and service and support organizations was consistent with our plans to continue expanding our global sales and support coverage, in particular our channel partner sales and support teams. The increases in our sales and support organizations allowed us to target new customers while continuing to support existing customers across all of our geographies.
48
Table of Contents
Comparison of the Years Ended December 31, 2013 and 2012
Net Revenue
| Years Ended December 31, | ||||||||||||||||||||||||
| 2013 | 2012 | Change | ||||||||||||||||||||||
| Amount | % of Net Revenue |
Amount | % of Net Revenue |
Amount | % | |||||||||||||||||||
| (dollars in thousands) | ||||||||||||||||||||||||
| Net revenue: |
||||||||||||||||||||||||
| Products and license |
$ | 72,153 | 52.4 | $ | 59,490 | 57.1 | $ | 12,663 | 21.3 | % | ||||||||||||||
| Services: |
||||||||||||||||||||||||
| Maintenance and support |
44,353 | 32.2 | 33,647 | 32.3 | 10,706 | 31.8 | % | |||||||||||||||||
| Professional services and training |
9,890 | 7.2 | 6,428 | 6.1 | 3,462 | 53.9 | % | |||||||||||||||||
| Subscriptions |
11,363 | 8.2 | 4,670 | 4.5 | 6,693 | 143.3 | % | |||||||||||||||||
|
|
|
|
|
|
|
|
|
|
|
|||||||||||||||
| Total Services |
65,606 | 47.6 | 44,745 | 42.9 | 20,861 | 46.6 | % | |||||||||||||||||
|
|
|
|
|
|
|
|
|
|
|
|||||||||||||||
| Total net revenue |
$ | 137,759 | 100.0 | $ | 104,235 | 100.0 | $ | 33,524 | 32.2 | % | ||||||||||||||
|
|
|
|
|
|
|
|
|
|
|
|||||||||||||||
| Americas |
$ | 83,736 | 60.8 | $ | 61,588 | 59.1 | $ | 22,148 | 36.0 | % | ||||||||||||||
| EMEA |
33,183 | 24.1 | 24,958 | 23.9 | 8,225 | 33.0 | % | |||||||||||||||||
| APAC |
20,840 | 15.1 | 17,689 | 17 | 3,151 | 17.8 | % | |||||||||||||||||
|
|
|
|
|
|
|
|
|
|
|
|||||||||||||||
| Total net revenue |
$ | 137,759 | 100.0 | $ | 104,235 | 100.0 | $ | 33,524 | 32.2 | % | ||||||||||||||
|
|
|
|
|
|
|
|
|
|
|
|||||||||||||||
Our net revenue increased by $33.5 million, or 32.2%, to $137.8 million during the year ended December 31, 2013 from $104.2 million during the year ended December 31, 2012 due to growth in products and license revenue and services revenue. This revenue growth reflects the increasing demand for our product and service offerings consistent with our business plan and expectations for growth. The Americas region contributed the largest portion with a $22.1 million increase, or approximately a 36.0% change over the same period in 2012. In addition, an increase in our international sales personnel resulted in increases in revenue in EMEA and APAC of $8.2 million and $3.2 million, or approximately a 33.0% and 17.8% change, respectively, over the same period in 2012.
Products and license revenue increased by $12.7 million, or 21.3%, to $72.2 million during the year ended December 31, 2013 from $59.5 million during the year ended December 31, 2012. The change in product and license revenue was driven by a significant increase in product sales, primarily in the Americas region in the year ended December 31, 2013 compared to the year ended December 31, 2012. This increase was due to increased sales volume of our products.
Services revenue increased by $20.9 million, or 46.6%, to $65.6 million during the year ended December 31, 2013 from $44.7 million during the year ended December 31, 2012. During the year ended December 31, 2013, our services revenue was comprised of $44.4 million of maintenance and support, $9.9 million of professional services and training and $11.4 million of subscriptions. The change in services revenue in the year ended December 31, 2013 from the year ended December 31, 2012 was primarily due to an increase of $10.7 million in maintenance and support revenue resulting from our larger installed base, $6.7 million in subscriptions revenue from our cloud-based security services, including our Incapsula offering, and $3.5 million in professional services and training revenues due primarily to an increase in the number of implementation projects.
Gross Profit
| Years Ended December 31, | ||||||||||||||||||||
| 2013 | 2012 | |||||||||||||||||||
| Amount | Gross Margin |
Amount | Gross Margin |
% Change | ||||||||||||||||
| (dollars in thousands) | ||||||||||||||||||||
| Products and license gross profit |
$ | 63,397 | 87.9 | % | $ | 50,960 | 85.7 | % | 2.2 | |||||||||||
| Services gross profit |
44,666 | 68.1 | % | 31,371 | 70.1 | % | (2.0 | ) | ||||||||||||
|
|
|
|
|
|||||||||||||||||
| Total gross profit |
$ | 108,063 | 78.4 | % | $ | 82,331 | 79.0 | % | (0.6 | ) | ||||||||||
|
|
|
|
|
|||||||||||||||||
49
Table of Contents
Total gross margin decreased 0.6 percentage points from 79.0% during the year ended December 31, 2012 to 78.4% during the year ended December 31, 2013 primarily due to a decrease in services gross margin of 2.0 percentage points in the year ended December 31, 2013 compared to the same period in 2012. In addition there was an increased proportion of services revenue to total revenue during the year ended December 31, 2013 as compared to the 2012 period. The decrease in services gross margin was primarily due to higher use of outside contractors, which tend to be more costly that our internal service personnel, in order to support the growth in services revenue for the year ended December 31, 2013. Products and license gross margins increased by 2.2 percentage points to 87.9% for the year ended December 31, 2013 as compared to 85.7% for the year ended December 31, 2012. The increase was mostly due to an increase in the proportion of virtual appliance sales in the year ended December 31, 2013 as compared to the 2012 period. Virtual appliance sales tend to have higher gross margin percentages than physical appliances.
Operating Expenses
| Years Ended December 31, | ||||||||||||||||||||||||
| 2013 | 2012 | Change | ||||||||||||||||||||||
| Amount | % of Net Revenue |
Amount | % of Net Revenue |
Amount | % | |||||||||||||||||||
| (dollars in thousands) | ||||||||||||||||||||||||
| Operating expenses: |
||||||||||||||||||||||||
| Research and development |
$ | 27,556 | 20.0 | $ | 20,555 | 19.7 | $ | 7,001 | 34.1 | % | ||||||||||||||
| Sales and marketing |
81,500 | 59.2 | 53,509 | 51.3 | 27,991 | 52.3 | % | |||||||||||||||||
| General and administrative |
24,436 | 17.7 | 15,371 | 14.8 | 9,065 | 59.0 | % | |||||||||||||||||
|
|
|
|
|
|
|
|
|
|
|
|||||||||||||||
| Total operating expenses |
$ | 133,492 | 96.9 | $ | 89,435 | 85.8 | $ | 44,057 | 49.3 | % | ||||||||||||||
|
|
|
|
|
|
|
|
|
|
|
|||||||||||||||
Results above include stock-based compensation expense of:
| Years Ended December 31, |
||||||||||||
| 2013 | 2012 | Change | ||||||||||
| (dollars in thousands) | ||||||||||||
| Research and development |
$ | 3,660 | $ | 1,227 | $ | 2,433 | ||||||
| Sales and marketing |
8,537 | 2,543 | 5,994 | |||||||||
| General and administrative |
8,857 | 1,729 | 7,128 | |||||||||
|
|
|
|
|
|
|
|||||||
| $ | 21,054 | $ | 5,499 | $ | 15,555 | |||||||
|
|
|
|
|
|
|
|||||||
Research and development expenses increased by $7.0 million, or 34.1%, to $27.6 million during the year ended December 31, 2013 from $20.6 million during the year ended December 31, 2012. The change was primarily attributable to an increase of $4.8 million in personnel costs, including stock-based compensation, due to additional research and development personnel being hired to support our ongoing product development efforts, and an increase of $1.4 million in Incapsula research and development costs, including stock-based compensation. In addition, facility and depreciation expenses increased by $0.6 million.
Sales and marketing expenses increased by $28.0 million, or 52.3%, to $81.5 million during the year ended December 31, 2013 from $53.5 million during the year ended December 31, 2012. The change was due to an increase of $21.1 million in personnel costs, including stock-based compensation due to increased headcount in all regions in an effort to help drive our overall revenue growth, and contractor costs, $2.0 million in travel expenses, and an increase in trade show, corporate marketing and seminar costs totaling $0.7 million. In addition, Incapsula marketing expenses increased by $2.5 million, including stock-based compensation, and facility expenses increased $0.9 million.
General and administrative expenses increased by $9.1 million, or 59.0%, to $24.4 million during the year ended December 31, 2013 from $15.4 million during the year ended December 31, 2012. The change was primarily due to an increase of $8.4 million in personnel costs, including stock-based compensation, primarily related to stock-based awards issued to Incapsula employees for retention purposes which will not recur in future periods, and increased headcount to support the growth and operations of our business. In addition, facility expenses increased by $0.5 million.
50
Table of Contents
Loss from Operations
| Years Ended December 31, | Change | |||||||||||||
|
2013 |
2012 | Amount | % | |||||||||||
| (dollars in thousands) | ||||||||||||||
| $ | (25,429 | ) | $ | (7,104 | ) | $ | (18,325 | ) | -258.0 | % | ||||
Our loss from operations increased by $18.3 million, or 258.0%, from $7.1 million during the year ended December 31, 2012 to $25.4 million during the year ended December 31, 2013. Total operating expenses increased by $44.1 million for the year ended December 31, 2013 when compared to the prior year principally due to increases in personnel costs, including stock-based compensation expense, to support the increased scope and global reach of our business. The increase in operating expenses was comprised of increased sales and marketing costs of $28.0 million to expand our global sales efforts, and increased general and administrative costs of $9.1 million primarily related to stock-based compensation for performance based RSUs with multiple performance and a market condition granted to Incapsula employees as part of a retention plan, and increased headcount to support the growth and operations of our business In addition, we had increased research and development costs of $7.0 million primarily from hiring to support our ongoing product development efforts. This increase in operating expenses was partially offset by an increase in our gross profit of $25.7 million during the year ended December 31, 2013 due to higher net revenues.
Other Income (Expense), Net
| Years Ended December 31, | Change | |||||||||||||
|
2013 |
2012 | Amount | % | |||||||||||
| (dollars in thousands) | ||||||||||||||
| $ | (125 | ) | $ | (243 | ) | $ | 118 | 48.6 | % | |||||
Other income (expense), net, increased approximately $0.1 million, or 48.6% during the year ended December 31, 2013 as compared to 2012. The change was primarily due to a decrease of $0.1 million in foreign currency exchange losses, net.
Provision for Income Taxes
| Years Ended December 31, | Change | |||||||||||||||
| 2013 | 2012 | Amount | % | |||||||||||||
| (dollars in thousands) | ||||||||||||||||
| Provision for income taxes |
$ | 777 | $ | 545 | $ | 232 | 42.6 | % | ||||||||
| Effective tax rate |
-3.0 | % | -7.4 | % | ||||||||||||
The provision for income taxes for the years ended December 31, 2013 and 2012 was comprised primarily of foreign and state income taxes. The increase in the provision for income taxes in the year ended December 31, 2013 compared with the year ended December 31, 2012 was primarily attributable to an increase in state income tax.
51
Table of Contents
Deferred Revenue
| As of December 31, | Change | |||||||||||||||
| 2013 | 2012 | Amount | % | |||||||||||||
| (dollars in thousands) | ||||||||||||||||
| Total deferred revenue |
$ | 63,052 | $ | 46,291 | $ | 16,761 | 36.2 | % | ||||||||
Deferred revenue increased by $16.8 million, or 36.2%, to $63.1 million as of December 31, 2013 from $46.3 million as of December 31, 2012. The growth in our deferred revenue was primarily attributable to an increase in our installed base of products and licenses worldwide and resulting renewals of maintenance and support agreements, as well as new sales of subscription and maintenance and support agreements.
Number of Customers
| As of December 31, | Change | |||||||||||||||
| 2013 | 2012 | Amount | % | |||||||||||||
| Number of customers |
3,011 | 2,293 | 718 | 31.3 | % | |||||||||||
Our number of customers increased by 718, or 31.3%, to 3,011 as of December 31, 2013 from 2,293 as of December 31, 2012. Our growth in customer count was driven by increasing market acceptance of our products as well as an increase in our global sales and services and support organizations from 238 people as of December 31, 2012 to 296 as of December 31, 2013. The growth in our sales and service and support organizations was consistent with our plans to continue expanding our global sales and support coverage, in particular our channel partner sales and support teams. The increases in our sales and support organizations allowed us to target new customers while continuing to support existing customers across all of our geographies.
Liquidity and Capital Resources
To date, we have satisfied our capital and liquidity needs through sales of our products and services, our initial public offering of common stock, and private placements of convertible preferred stock. We have incurred significant losses as we continue to expand our business. Our cash flow from operating activities will continue to be affected principally by the extent to which our revenue exceeds or does not exceed any increase in spending on personnel to support the growth of our business. Our largest source of operating cash flow is cash collections from our customers.
Capital Resources
As of December 31, 2014, we had $109.7 million of cash, cash equivalents and short-term investments, $6.3 million of which is held outside of the United States and not presently available to fund domestic operations and obligations. If we were to repatriate cash held outside of the United States, we could be subject to U.S. income taxes on such amounts, less any previously paid foreign income taxes. Our cash, cash equivalents and short-term investments have increased from $17.7 million as of December 31, 2010 to $109.7 million as of December 31, 2014. This increase is primarily the result of our initial public offering of common stock in November 2011 in which we raised $86.2 million, after deducting underwriters’ discounts and offering expenses. This amount was partially offset by our losses from operations as we continued to fund our investments in growth, including the development of future products and product enhancements, and expanded into new sales channels and geographies. In addition, during the first quarter of 2014, we increased our use of cash through the acquisitions of Skyfence Networks, Ltd. and certain assets of Tomium which included cash consideration totaling approximately $20.9 million. We believe our existing cash, cash equivalents and short-term investments will be sufficient to meet our working capital and capital expenditure needs for at least the next 12 months. Our future capital requirements may vary materially from those currently planned and will depend on many factors, including, among other things, market acceptance of our products, the cost of our research and development activities, the acquisition of other businesses and overall economic conditions.
As of December 31, 2014, we had no amounts outstanding under our credit facility agreement with a financial institution. The credit facility agreement, as amended, provides for borrowing capacity up to $6.0 million and contains a minimum cash and cash equivalents balance covenant of $3.0 million. The credit facility expires on May 1, 2015. As of December 31, 2014, we were compliant with the covenant under the credit facility.
52
Table of Contents
Cash Flows
The following summary of our cash flows for the periods indicated has been derived from our consolidated financial statements which are included elsewhere in this Annual Report on Form 10-K:
| Years Ended December 31, | ||||||||||||
| 2014 | 2013 | 2012 | ||||||||||
| (dollars in thousands) | ||||||||||||
| Net cash provided by operating activities |
$ | 4,126 | $ | 9,797 | $ | 4,467 | ||||||
| Net cash provided by (used in) investing activities |
$ | (21,591 | ) | $ | 1,597 | $ | (45,574 | ) | ||||
| Net cash provided by financing activities |
$ | 8,857 | $ | 6,316 | $ | 4,230 | ||||||
Cash Flows from Operating Activities
Our largest uses of cash from operating activities are for employee related expenditures. Our primary source of cash flow from operating activities is cash receipts from customers. Our cash flow from operations will continue to be affected principally by the extent to which we grow our revenues and increase our headcount, primarily in our sales and marketing and research and development functions, in order to grow our business.
Net cash provided by operating activities of $4.1 million for the year ended December 31, 2014 reflected a net loss of $59.2 million, adjusted for non-cash charges of $42.2 million primarily due to stock-based compensation expense, as well as a net change of $21.1 million in our net operating assets and liabilities. The net change in our operating assets and liabilities was primarily the result of a $18.1 million increase in our deferred revenue, which represents unearned amounts billed to our customers, resulting from our larger installed base combined with strong maintenance and support renewal rates from our existing customers, in addition to an increase of $4.5 million in accrued compensation and benefits and accrued and other liabilities. This change was partially offset by an increase in accounts receivable of $3.0 million.
Net cash provided by operating activities of $9.8 million for the year ended December 31, 2013 reflected a net loss of $26.3 million, adjusted for non-cash charges of $25.8 million, as well as a net change of $10.4 million in our net operating assets and liabilities. The net change in our operating assets and liabilities was primarily the result of a $16.8 million increase in our deferred revenue, which represents unearned amounts billed to our customers, resulting from our larger installed base combined with strong maintenance and support renewal rates from our existing customers, in addition to an increase of $3.7 million in accrued compensation and benefits. This change was partially offset by an increase in accounts receivable of $8.9 million and a decrease in prepaid expenses and other assets of $1.2 million.
Net cash provided by operating activities of $4.5 million for the year ended December 31, 2012 reflected a net loss of $7.9 million, adjusted for non-cash charges of $8.3 million, as well as a net change of $4.1 million in our net operating assets and liabilities. The net change in our operating assets and liabilities was primarily the result of a $13.4 million increase in our deferred revenue, which represents unearned amounts billed to our customers, resulting from our larger installed base combined with strong maintenance and support renewal rates from our existing customers. This change was partially offset by an increase in accounts receivable of $9.8 million.
Cash Flows from Investing Activities
Our investing activities consist primarily of cost of acquisitions, expenditures to purchase property and equipment and purchases and sales of short-term investments. During the year ended December 31, 2014, cash used in investing activities was $21.6 million, primarily as a result of $33.3 million in purchases of short-term investments, $12.1 million in acquisitions, and $5.6 million in net purchases of property and equipment partially offset by $29.8 million in proceeds from maturities of short-term investment activities.
53
Table of Contents
During the year ended December 31, 2013, cash provided by investing activities was $1.6 million, primarily as a result of $42.2 million in proceeds from maturities of short-term investment activities partially offset by $2.6 million in net purchases of property and equipment and $38.0 million in purchases of short-term investments.
During the year ended December 31, 2012, cash used in investing activities was $45.6 million, primarily as a result of $41.9 in net purchases of short-term investments in addition to $3.3 million in net purchases of property and equipment.
Cash Flows from Financing Activities
Net cash provided by financing activities was $8.9 million for the year ended December 31, 2014 primarily as a result of proceeds from the issuance of common stock, net of repurchases.
Net cash provided by financing activities was $6.3 million for the year ended December 31, 2013 as a result of proceeds from the issuance of common stock, net of repurchases.
Net cash provided by financing activities was $4.2 million for the year ended December 31, 2012 as a result of proceeds from the issuance of common stock.
Critical Accounting Policies and Estimates
Our consolidated financial statements have been prepared in conformity with U.S. generally accepted accounting principles (“GAAP”) and include our accounts and the accounts of our wholly-owned subsidiaries and Incapsula, our majority owned subsidiary. The preparation of our consolidated financial statements requires our management to make estimates, assumptions and judgments that affect the reported amounts of assets and liabilities and disclosure of contingent assets and liabilities at the date of the financial statements, and the reported amounts of revenue and expenses during the applicable periods. Management bases its estimates, assumptions and judgments on historical experience and on various other factors that they believe to be reasonable under the circumstances. Different assumptions and judgments would change the estimates used in the preparation of our consolidated financial statements, which, in turn, could change the results from those reported. Our management evaluates its estimates, assumptions and judgments on an ongoing basis.
The critical accounting policies requiring estimates, assumptions, and judgments that we believe have the most significant impact on our consolidated financial statements are described below.
Revenue Recognition
Our management must make significant judgments and estimates to determine revenue to be recognized in any accounting period. Material differences may result in the amount and timing of our revenue for any period if our management makes different judgments or utilizes different estimates.
We derive revenue from two sources: (i) products and license revenue, which includes hardware and perpetual software license revenue and (ii) services revenue, which includes maintenance, professional services, training and subscription arrangements. Substantially all of product and license sales have been sold in combination with maintenance services. Revenue is recognized when all of the following criteria are met: persuasive evidence of an arrangement exists; delivery or performance has occurred; the sales price is fixed or determinable; and collection is reasonably assured.
We define each of the four criteria above as follows:
| • | Persuasive evidence of an arrangement exists. Evidence of an arrangement consists of a purchase order issued pursuant to the terms and conditions of a distributor or value-added reseller agreement and, in limited cases, an end user agreement and/or purchase order. |
| • | Delivery or performance has occurred. We use shipping and related documents, or written evidence of customer acceptance, when applicable, to verify delivery or performance. We recognize product revenue upon transfer of title and risk of loss, which primarily is upon shipment to value-added resellers, distributors or end users. In most instances, we do not have significant obligations for future performance, such as customer acceptance provisions, rights of return or pricing credits, associated with our sales. In instances where final acceptance of the product or service is specified by the customer, revenue is deferred until all acceptance criteria have been met. |
54
Table of Contents
| • | The sales price is fixed or determinable. We assess whether the sales price is fixed or determinable based on payment terms and whether the sales price is subject to refund or adjustment. Standard payment terms to customers range from 30 to 90 days. In the event payment terms are provided that differ from our standard business practices, the fees are deemed to not be fixed or determinable and revenue is recognized when the payments become due, provided the remaining criteria for revenue recognition have been met. |
| • | Collection is reasonably assured. We assess probability of collection on a customer-by-customer basis. Our customers are subjected to a credit review process that evaluates their financial condition and ability to pay for products and services. If we conclude that collection is not reasonably assured based upon an initial review, we do not recognize revenue until payment is received. |
Maintenance and subscription revenue includes arrangements for software maintenance and technical support for our products and subscription services revenue primarily related to our cloud-based services. The terms of our subscription service arrangements do not provide customers the right to take possession of the related software. Maintenance is offered under renewable, fee-based contracts, which include technical support, hardware repair and replacement parts, bug fixes, patches and unspecified upgrades on a when-and-if-available basis. Maintenance and subscription revenue is initially deferred and recognized ratably over the life of the contract, with the related expenses recognized as incurred. Maintenance and subscription contracts usually have a term of one to five years. Unearned maintenance and subscription revenue is included in deferred revenue.
Professional service revenue primarily consists of the fees we earn related to installation and consulting services. We recognize revenue from professional services upon delivery or completion of performance. Professional service arrangements are typically short term in nature and are largely completed within 90 days from the start of service.
Training services are recognized upon delivery of the training.
Multiple Element Arrangements
Most of our products are hardware appliances containing software components that function together to provide the essential functionality of the product. Therefore, our hardware appliances are considered non-software deliverables and are not subject to industry-specific software revenue recognition guidance.
Our product revenue also includes revenue from the sale of stand-alone software products. Stand-alone software may operate on our hardware appliance, but is not considered essential to the functionality of the hardware and is, therefore, subject to the industry-specific software revenue recognition guidance. Additionally, we provide unspecified software upgrades for its products, on a when-and-if available basis, and hardware replacements through maintenance and support contracts. These support arrangements when sold on a stand-alone basis are subject to the industry-specific software revenue recognition guidance.
Under the software revenue recognition guidance, we use the residual method to recognize revenue when a product agreement includes one or more elements to be delivered at a future date and VSOE of the fair value of all undelivered elements exists. In the majority of our contracts, the only element that remains undelivered at the time of delivery of the product is maintenance and support services and subscriptions. Under the residual method, the VSOE of fair value of the undelivered elements is deferred and the remaining portion of the contract fee is recognized as product revenue. If evidence of the VSOE of fair value of one or more undelivered elements does not exist, all revenue is generally deferred and recognized when delivery of those elements occurs or when fair value can be established.
For certain arrangements with multiple deliverables, we allocate the arrangement fee to the non-software element based upon the relative selling price of such element and, if software and software-related elements (e.g., maintenance and support for the software element) are also included in the arrangement, we allocate the arrangement fee to each of those software and software-related elements as a group. After such allocations are made, the amount of the arrangement fee allocated to the software and software-related elements is accounted for using the residual method. When applying the relative selling price method, we determine the selling price for each element using VSOE of selling price, if it exists, or if not, TPE of selling price, if it exists. If neither VSOE nor TPE of selling price exist for an element, we use its BESP for that element. The revenue allocated to each element is then recognized when the basic revenue recognition criteria are met for that element. We limit the amount of revenue recognized for delivered elements to the amount that is not contingent on the future delivery of products or services, or subject to our future performance obligation.
VSOE of fair value for elements of an arrangement is based upon the normal pricing and discounting practices for those services when sold separately. In determining VSOE, we require that a substantial majority of the selling prices for a service fall within a reasonably narrow pricing range, evidenced by a substantial majority of such historical stand-alone transactions falling within a reasonably narrow range. In addition, we consider major service groups and geographies in determining VSOE.
55
Table of Contents
We are not able to determine TPE for its products or services. TPE is determined based on competitor prices for similar deliverables when sold separately. Generally, our go-to-market strategy differs from that of its peers and its offerings contain a significant level of differentiation such that the comparable pricing of products with similar functionality cannot be obtained. Furthermore, we are unable to reliably determine what similar competitor products’ selling prices are on a stand-alone basis.
When we are unable to establish the selling price of its non-software deliverables using VSOE or TPE, we use BESP in its allocation of arrangement consideration. The objective of BESP is to determine the price at which the Company would transact a sale if the product or service were sold on a stand-alone basis. We determine BESP for the purposes of allocating the arrangement by reviewing external and internal market factors including, but not limited to, pricing practices including discounting, the geographies in which we offer its products and services, the type of customer (i.e., distributor, value added reseller or direct end user) and competition. Additionally, we consider historical transactions, including transactions whereby the deliverable was sold on a stand-alone basis. The determination of BESP is made through consultation with and approval by our management. Selling prices are analyzed on a quarterly basis to identify if we have experienced significant changes in its selling prices.
For its non-software deliverables we allocate the arrangement consideration based on the relative selling price of the deliverables. For its hardware appliances we use BESP as its selling price. For its maintenance and support services, subscriptions and professional services and training, we primarily use VSOE as the selling price and when we are unable to establish a selling price using VSOE, it uses BESP.
Stock-Based Compensation
We recognize compensation costs related to stock option, employee stock purchase plan, restricted stock unit, or RSU, and shares of restricted stock grants to employees based on the estimated fair value of the awards on the date of grant, net of estimated forfeitures. For stock option and employee stock purchase plan grants, we estimate the grant date fair value, and the resulting stock-based compensation expense, using the Black-Scholes option-pricing model. The fair value of RSUs is determined using the closing price of our stock on the date of grant. The grant date fair value of the stock-based awards is generally recognized on a straight-line basis over the requisite service period, which is generally the vesting period of the respective awards.
For performance based RSUs granted to Incapsula employees which have multiple performance and a market condition we used a Monte Carlo simulation model to determine fair value of such awards. The key inputs used to determine the fair value of the awards were our stock price on the date of grant, the expected volatility, the risk free interest rate and revenues achieved. We update the estimated expense, net of forfeitures, at the end of each reporting period. The expense is recognized on an accelerated basis over the requisite service period, generally the vesting period of the respective awards.
56
Table of Contents
The fair value of the option and employee stock purchase plan awards during 2014, 2013 and 2012 were calculated using the Black-Scholes option pricing model with the following weighted-average assumptions:
| Years Ended December 31 | ||||||||||||
| 2014 | 2013 | 2012 | ||||||||||
| Stock option grants: |
||||||||||||
| Dividend rate |
0 | % | 0 | % | 0 | % | ||||||
| Risk-free interest rate |
1.8 | % | 1.2 | % | 1.0 | % | ||||||
| Expected term (in years) |
6.1 | 6.1 | 6.0 | |||||||||
| Expected volatility |
46 | % | 46 | % | 48 | % | ||||||
| ESPP grants: |
||||||||||||
| Dividend rate |
0 | % | 0 | % | 0 | % | ||||||
| Risk-free interest rate |
0.1 | % | 0.1 | % | 0.1 | % | ||||||
| Expected term (in years) |
0.5 | 0.5 | 0.5 | |||||||||
| Expected volatility |
45 | % | 27 | % | 39 | % | ||||||
The Black-Scholes options pricing model requires the use of highly subjective and complex assumptions which determine the fair value of share-based awards, including the grant’s expected term and the price volatility of the underlying stock. These assumptions include:
Expected Term. The expected term represents the period over which the stock-based awards are expected to be outstanding. For option grants that are considered to be “plain vanilla,” we used the simplified method to determine the expected term as set forth in the guidance provided by the U.S. Securities and Exchange Commission. The simplified method calculates the expected term as the average of the time-to-vesting and the contractual life of the options. For option grants that are not considered “plain vanilla,” the expected term is based on historical option exercise behavior and post-vesting cancellations of options by employees. For ESPP grants, the expected term is based on the length of the offering period, which is six months.
Risk-Free Interest Rate. The risk-free interest rate is based on the U.S. Treasury yield in effect at the time of grant for zero coupon U.S. Treasury notes with maturities approximately equal to each award’s expected term.
Expected Volatility. Since we do not have a sufficient trading history of our common stock, the expected volatility was derived from the average historic volatilities of several unrelated public companies within our industry that we considered to be comparable to our business over a period equivalent to the expected term of the stock option grants and the offering period for ESPP grants.
Expected Dividend. The expected dividend was assumed to be zero as we have never paid dividends and have no current plans to do so.
In addition to assumptions used in the Black-Scholes option pricing model, we must also estimate a forfeiture rate to calculate the stock-based compensation for expense related to our awards. Our forfeiture rate is based on an analysis of our actual forfeitures. We will continue to evaluate the appropriateness of the forfeiture rate based on actual forfeiture experience, analysis of employee turnover and other factors. Quarterly changes in the estimated forfeiture rate can have a significant impact on our stock-based compensation expense as the cumulative effect of adjusting the rate is recognized in the period the forfeiture estimate is changed. If a revised forfeiture rate is higher than the previously estimated forfeiture rate, an adjustment is made that will result in a decrease to the stock-based compensation expense recognized in the financial statements. If a revised forfeiture rate is lower than the previously estimated forfeiture rate, an adjustment is made that will result in an increase to the stock-based compensation expense recognized in the financial statements.
We will continue to use judgment in evaluating the expected term, expected volatility and forfeiture rate related to our own stock-based compensation on a prospective basis. As we continue to accumulate additional data related to our common stock, we may have refinements to the estimates of our expected volatility, expected terms and forfeiture rates, which could materially impact our future stock-based compensation expense.
57
Table of Contents
Business Combination
We account for our business acquisitions in accordance with Accounting Standards Codification (ASC) No. 805, Business Combinations. We use our best estimates and assumptions as part of the purchase price allocation process to value assets acquired and liabilities assumed at the business combination date. However, our estimates and assumptions are subject to refinement. We record adjustments to assets acquired or liabilities assumed subsequent to the purchase price allocation period in our operating results in the period in which the adjustments were determined.
The total purchase price allocated to the tangible assets acquired is assigned based on the fair values as of the date of the acquisition. The fair value assigned to identifiable intangible assets acquired is determined using the income approach which discounts expected future cash flows to present value using estimated assumptions determined by management. The identifiable intangible assets are subject to amortization on a straight-line basis as this best approximates the benefit period related to these assets.
Property and Equipment
Property and equipment, including leasehold improvements, are stated at cost less accumulated depreciation and amortization. Depreciation is computed using the straight-line method over the estimated useful lives of the related assets, generally two to seven years.
Leasehold improvements are amortized using the straight-line method over the shorter of the remaining lease term or the estimated useful lives of the assets. Upon the retirement or disposition of property and equipment, the related costs and accumulated depreciation is removed and any related gain or loss is recorded in the consolidated statements of operations. Repairs and maintenance that do not extend the life or improve an asset are expensed in the periods incurred.
Goodwill and Acquired Intangibles
Goodwill is not amortized and is reviewed at least annually or whenever events or changes in circumstances indicate that the carrying value may not be recoverable. In reviewing goodwill, we bypass the qualitative assessment and proceeds directly to performing the quantitative two step impairment test to test the reporting unit’s goodwill for impairment. The first step of the impairment test involves comparing the fair value of the reporting unit to its net book value, including goodwill and is used as a screening process for identifying a potential goodwill impairment loss. If the net book value exceeds its fair value, then we would perform the second step of the goodwill impairment test to determine the amount of the impairment loss. The impairment loss would be calculated by comparing the implied fair value of our goodwill to our net book value. In calculating the implied fair value of our goodwill, the fair value would be allocated to all of the other assets and liabilities based on their fair values. The excess of the fair value of the Company over the amount assigned to its other assets and liabilities is the implied fair value of goodwill. An impairment loss would be recognized when the carrying amount of goodwill exceeds its implied fair value.
We complete our annual impairment test during the fourth quarter of each fiscal year. There was no impairment of goodwill recorded for the fiscal year ended December 31, 2014.
Intangible assets consist of purchased technology which are amortized over the period of estimated benefit using the straight-line method, as the consumption pattern of the asset is not apparent, and estimated useful lives ranging from seven to 10 years. The weighted average remaining useful life of our acquired technology intangible assets is seven years as of December 31, 2014. No significant residual value is estimated for intangible assets.
Impairment of Long-Lived Assets
We evaluate our long-lived assets, which consist of property and equipment and acquired intangible assets, for indicators of possible impairment when events or changes in circumstances indicate the carrying amount of an asset may not be recoverable. Impairment exists if the carrying amounts of such assets exceed the estimates of future net undiscounted cash flows expected to be generated by such assets. Should impairment exist, the impairment loss would be measured based on the excess carrying value of the asset over the asset’s estimated fair value. As of December 31, 2014 and 2013, we have not written down any of its long-lived assets as a result of impairment.
Income Taxes
We make certain estimates and judgments in determining income tax expense for financial statement purposes. These estimates and judgments occur in the calculation of tax credits, tax benefits and deductions and in the calculation of certain tax assets and liabilities, which arise from differences in the timing of recognition of revenue and expense for tax and financial statement purposes. Significant changes to these estimates may result in an increase or decrease to our tax provision in the subsequent period when such a change in estimate occurs.
58
Table of Contents
We use the liability method for accounting of deferred income taxes, which requires recognition of deferred income tax assets and liabilities for the expected future tax consequences of events that have been recognized in our financial statements, but have not been reflected in our taxable income. Estimates and judgments occur in the calculation of certain tax liabilities and in the determination of the recoverability of certain deferred income tax assets, which arise from temporary differences and carry-forwards. Deferred income tax assets and liabilities are measured using the currently enacted tax rates that apply to taxable income in effect for the years in which those tax assets are expected to be realized or settled. We regularly assess the likelihood that our deferred income tax assets will be realized. To the extent that we believe any amounts are not more likely than not to be realized, we record a valuation allowance to reduce our deferred income tax assets. In the event we determine that all or part of the net deferred tax assets are not realizable in the future, an adjustment to the valuation allowance would be charged to earnings in the period such determination is made. Similarly, if we subsequently realize deferred income tax assets that were previously determined to be unrealizable, the respective valuation allowance would be reversed, resulting in an adjustment to earnings in the period such determination is made. In addition, the calculation of our tax liabilities involves dealing with uncertainties in the application of complex tax regulations. We recognize and measure potential liabilities based upon a more likely than not criteria. Based upon these criteria, we estimate whether, and the extent to which, additional taxes will be due. If payment of these amounts ultimately proves to be unnecessary, the reversal of the liabilities may result in tax benefits being recognized in the period when we determine the liabilities are no longer necessary. If our estimate of tax liabilities is less than the amount ultimately assessed, a further charge to expense would result.
Significant judgment is required in determining any valuation allowance recorded against deferred income tax assets. In assessing the need for a valuation allowance, we consider all available evidence, including past operating results, estimates of future taxable income, and the feasibility of tax planning strategies. In the event that we change our determination as to the amount of deferred income tax assets that could be realized, we will adjust our valuation allowance with a corresponding effect to the provision for income taxes in the period in which such determination is made.
Significant judgment is also required in evaluating our uncertain tax positions and determining our provision for income taxes. Although we believe our reserves for uncertain tax positions are reasonable, no assurance can be given that the final tax outcome of these matters will not be different from that which is reflected in our historical income tax provisions and accruals. We adjust these reserves in light of changing facts and circumstances, such as the closing of a tax audit or the refinement of an estimate. To the extent that the final tax outcome of these matters is different from the amounts recorded, such differences will affect the provision for income taxes in the period in which such determination is made. The provision for income taxes includes the effect of reserves for uncertain tax positions and any changes to the reserves that are considered appropriate, as well as the related net interest and penalties, if applicable.
Contractual Obligations
The following summarizes our contractual obligations as of December 31, 2014:
| Payments Due by Period | ||||||||||||||||||||||||||||
| Contractual Obligations: |
2015 | 2016 | 2017 | 2018 | 2019 | Thereafter | Total | |||||||||||||||||||||
| (in thousands) | ||||||||||||||||||||||||||||
| Operating lease obligations(1) |
$ | 4,811 | $ | 5,409 | $ | 5,117 | $ | 3,277 | $ | 420 | $ | 255 | $ | 19,289 | ||||||||||||||
| Severance Pay Fund(2) |
— | — | — | — | — | — | 4,318 | |||||||||||||||||||||
| Purchase commitments(3) |
— | — | — | — | — | — | 4,816 | |||||||||||||||||||||
|
|
|
|
|
|
|
|
|
|
|
|
|
|
|
|||||||||||||||
| Total |
$ | 4,811 | $ | 5,409 | $ | 5,117 | $ | 3,277 | $ | 420 | $ | 255 | $ | 28,423 | ||||||||||||||
|
|
|
|
|
|
|
|
|
|
|
|
|
|
|
|||||||||||||||
| 1 | Operating lease agreements represent our obligations to make payments under our non-cancelable lease agreements for our facilities. During the year ended December 31, 2014, we made regular lease payments of $4.4 million under the operating lease agreements. |
| 2 | Our consolidated balance sheet as of December 31, 2014 includes $4.3 million of non-current liabilities for our Israeli severance pay fund. The specific timing of any cash payments relating to this obligation cannot be projected with reasonable certainty and, therefore, no amounts for this obligation are included in the annual columns of the table set forth above. |
| 3 | Purchase commitments are contractual obligations to purchase hardware appliances and related component parts from our vendors in advance of anticipated sales. |
59
Table of Contents
Off-Balance Sheet Arrangements
Through December 31, 2014, we did not have any relationships with unconsolidated entities or financial partnerships, such as entities often referred to as structured finance or special purpose entities, which would have been established for the purpose of facilitating off-balance sheet arrangements or other contractually narrow or limited purposes.
Recent Accounting Pronouncements
In May 2014, the FASB issued ASU No. 2014-09, Revenue from Contracts with Customers, to clarify the principles used to recognize revenue for all entities. The new guidance is effective for annual and interim periods beginning after December 15, 2016 with no early adoption permitted and allows for both retrospective and prospective methods of adoption. We are currently evaluating the impact, if any, the adoption of this guidance will have on our financial position, results of operations or cash flows.
In June 2014, the FASB issued ASU No. 2014-12, Compensation—Stock Compensation, which provides guidance that a performance target that affects vesting of a share-based payment and that could be achieved after the requisite service period is a performance condition. As a result, the target is not reflected in the estimation of the award’s grant date fair value. Compensation cost for such an award would be recognized over the required service period, if it is probable that the performance condition will be achieved. The updated guidance is effective for annual reporting periods and interim periods within those annual periods beginning after December 15, 2015. Earlier adoption is permitted but we do not anticipate electing early adoption. We do not expect the adoption of this guidance to have a material impact on our consolidated financial statements.
In August 2014, the FASB issued ASU No. 2014-15, new guidance related to the disclosures around going concern. The new standard provides guidance around management’s responsibility to evaluate whether there is substantial doubt about an entity’s ability to continue as a going concern and to provide related footnote disclosures. The new standard is effective for fiscal years, and interim periods within those fiscal years, beginning after December 15, 2016. Early adoption is permitted. The adoption of this standard is not expected to have a material impact on our financial statements.
| Item 7A. | Quantitative and Qualitative Disclosures about Market Risk |
We are exposed to market risks in the ordinary course of our business. Market risk represents the risk of loss that may impact our financial position due to adverse changes in financial market prices and rates. Our market risk exposure is primarily a result of fluctuations in interest rates and foreign currency exchange rates. We do not hold or issue financial instruments for trading purposes.
Interest Rate Sensitivity
Our exposure to market risk for changes in interest rates relates primarily to our investment portfolio and outstanding debt obligations. Our cash, cash equivalents and short-term investment accounts as of December 31, 2014 and 2013 totaled $109.7 million and $115.1 million, respectively, and consist primarily of cash, cash equivalents and short-term investments with maturities of less than two years from the date of purchase. Our primary exposure to market risk is interest income sensitivity, which is affected by changes in the general level of the interest rates in the United States. However, because of the short-term nature of the instruments in our portfolio, a sudden change in market interest rates would not be expected to have a material impact on our financial condition or our results of operation.
As of December 31, 2014, we have no amounts outstanding under our credit facility agreement. To the extent in the future we enter into other long-term debt arrangements, we would be subject to fluctuations in interest rates which could have a material impact on our future financial condition and results of operation.
Foreign Currency Exchange Risk
Our consolidated results of operations and cash flow are subject to fluctuations due to changes in foreign currency exchange rates. Substantially all of our revenue is generated in U.S. dollars. Our expenses are generally denominated in the currencies in which our operations are located, which is primarily in the U.S. and Israel and to a lesser extent in EMEA and Asia Pacific. Our consolidated results of operations and cash flow are, therefore, subject to fluctuations due to changes in foreign currency exchange rates and may be adversely affected in the future due to changes in foreign exchange rates. The effect of a hypothetical 10% change in foreign currency exchanges rates applicable to our business would not have a material impact on our historical consolidated financial statements.
60
Table of Contents
To date, we have used derivative financial instruments, specifically foreign currency forward contracts, to manage exposure to foreign currency risks, by hedging a portion of our forecasted expenses denominated in Israeli shekels expected to occur within a year. The effect of exchange rate changes on foreign currency forward contracts is expected to offset the effect of exchange rate changes on the underlying hedged item. We do not use derivative financial instruments for speculative or trading purposes.
| Item 8. | Financial Statements and Supplementary Data |
Quarterly Results of Operations
The following table sets forth unaudited quarterly consolidated statements of operations data for each of the years in the two-year period ended December 31, 2014 (in thousands, except per share data). We derived this information from our unaudited consolidated financial statements, which we prepared on the same basis as our audited consolidated financial statements contained in this Annual Report on Form 10-K. In our opinion, these unaudited statements include all adjustments, consisting only of normal recurring adjustments that we consider necessary for a fair statement of that information when read in conjunction with the consolidated financial statements and related notes included elsewhere in this Annual Report on Form 10-K. The operating results for any quarter should not be considered indicative of results for any future period.
61
Table of Contents
| Three Months Ended | ||||||||||||||||||||||||||||||||
| Dec. 31, 2014 |
Sept. 30, 2014 |
June 30, 2014 |
March 31, 2014 |
Dec. 31, 2013 |
Sept. 30, 2013 |
June 30, 2013 |
March 31, 2013 |
|||||||||||||||||||||||||
| Net revenue: |
||||||||||||||||||||||||||||||||
| Products and license |
$ | 26,100 | $ | 19,642 | $ | 16,586 | $ | 11,971 | $ | 24,150 | $ | 18,178 | $ | 15,671 | $ | 14,154 | ||||||||||||||||
| Services: |
||||||||||||||||||||||||||||||||
| Maintenance and support |
14,731 | 13,879 | 13,522 | 12,663 | 12,427 | 11,139 | 10,673 | 10,114 | ||||||||||||||||||||||||
| Professional services and training |
3,260 | 2,774 | 3,081 | 2,299 | 2,395 | 2,724 | 2,496 | 2,275 | ||||||||||||||||||||||||
| Subscriptions |
7,286 | 6,380 | 5,253 | 4,583 | 3,761 | 3,061 | 2,499 | 2,042 | ||||||||||||||||||||||||
|
|
|
|
|
|
|
|
|
|
|
|
|
|
|
|
|
|||||||||||||||||
| Total services |
25,277 | 23,033 | 21,856 | 19,545 | 18,583 | 16,924 | 15,668 | 14,431 | ||||||||||||||||||||||||
|
|
|
|
|
|
|
|
|
|
|
|
|
|
|
|
|
|||||||||||||||||
| Total net revenue |
51,377 | 42,675 | 38,442 | 31,516 | 42,733 | 35,102 | 31,339 | 28,585 | ||||||||||||||||||||||||
| Cost of revenue: |
||||||||||||||||||||||||||||||||
| Products and license |
3,142 | 2,299 | 2,075 | 1,732 | 2,540 | 1,894 | 2,446 | 1,876 | ||||||||||||||||||||||||
| Services |
7,154 | 7,202 | 6,959 | 6,020 | 6,031 | 5,396 | 5,098 | 4,415 | ||||||||||||||||||||||||
|
|
|
|
|
|
|
|
|
|
|
|
|
|
|
|
|
|||||||||||||||||
| Total cost of revenue |
10,296 | 9,501 | 9,034 | 7,752 | 8,571 | 7,290 | 7,544 | 6,291 | ||||||||||||||||||||||||
|
|
|
|
|
|
|
|
|
|
|
|
|
|
|
|
|
|||||||||||||||||
| Gross profit |
41,081 | 33,174 | 29,408 | 23,764 | 34,162 | 27,812 | 23,795 | 22,294 | ||||||||||||||||||||||||
| Operating expenses: |
||||||||||||||||||||||||||||||||
| Research and development |
11,014 | 10,459 | 11,618 | 9,961 | 7,827 | 6,725 | 6,646 | 6,358 | ||||||||||||||||||||||||
| Sales and marketing |
31,429 | 26,853 | 25,065 | 23,035 | 25,537 | 20,135 | 18,281 | 17,547 | ||||||||||||||||||||||||
| General and administrative |
9,486 | 8,987 | 7,621 | 8,405 | 10,759 | 4,697 | 4,597 | 4,383 | ||||||||||||||||||||||||
| Amortization of acquired intangible assets |
352 | 351 | 362 | 204 | — | — | — | — | ||||||||||||||||||||||||
|
|
|
|
|
|
|
|
|
|
|
|
|
|
|
|
|
|||||||||||||||||
| Total operating expenses |
52,281 | 46,650 | 44,666 | 41,605 | 44,123 | 31,557 | 29,524 | 28,288 | ||||||||||||||||||||||||
|
|
|
|
|
|
|
|
|
|
|
|
|
|
|
|
|
|||||||||||||||||
| Loss from operations |
(11,200 | ) | (13,476 | ) | (15,258 | ) | (17,841 | ) | (9,961 | ) | (3,745 | ) | (5,729 | ) | (5,994 | ) | ||||||||||||||||
| Other income (expense), net |
101 | 48 | (215 | ) | (154 | ) | (136 | ) | 113 | (55 | ) | (47 | ) | |||||||||||||||||||
|
|
|
|
|
|
|
|
|
|
|
|
|
|
|
|
|
|||||||||||||||||
| Loss before provision for income taxes |
(11,099 | ) | (13,428 | ) | (15,473 | ) | (17,995 | ) | (10,097 | ) | (3,632 | ) | (5,784 | ) | (6,041 | ) | ||||||||||||||||
| Provision for income taxes |
1,397 | 190 | (35 | ) | (371 | ) | 74 | 288 | 261 | 154 | ||||||||||||||||||||||
|
|
|
|
|
|
|
|
|
|
|
|
|
|
|
|
|
|||||||||||||||||
| Net loss |
(12,496 | ) | (13,618 | ) | (15,438 | ) | (17,624 | ) | (10,171 | ) | (3,920 | ) | (6,045 | ) | (6,195 | ) | ||||||||||||||||
| Loss attributable to noncontrolling interest |
— | — | — | 213 | 742 | 145 | 130 | 136 | ||||||||||||||||||||||||
|
|
|
|
|
|
|
|
|
|
|
|
|
|
|
|
|
|||||||||||||||||
| Net loss attributable to Imperva, Inc. stockholders |
$ | (12,496 | ) | $ | (13,618 | ) | $ | (15,438 | ) | $ | (17,411 | ) | $ | (9,429 | ) | $ | (3,775 | ) | $ | (5,915 | ) | $ | (6,059 | ) | ||||||||
|
|
|
|
|
|
|
|
|
|
|
|
|
|
|
|
|
|||||||||||||||||
| Net loss per share attributable to Imperva, Inc. stockholders, basic and diluted |
$ | (0.48 | ) | $ | (0.52 | ) | $ | (0.60 | ) | $ | (0.69 | ) | $ | (0.38 | ) | $ | (0.15 | ) | $ | (0.24 | ) | $ | (0.25 | ) | ||||||||
|
|
|
|
|
|
|
|
|
|
|
|
|
|
|
|
|
|||||||||||||||||
| Weighted-average shares used to compute net loss per share attributable to Imperva, Inc. stockholders, basic and diluted |
26,177 | 25,967 | 25,782 | 25,255 | 24,722 | 24,453 | 24,171 | 23,905 | ||||||||||||||||||||||||
|
|
|
|
|
|
|
|
|
|
|
|
|
|
|
|
|
|||||||||||||||||
62
Table of Contents
INDEX TO CONSOLIDATED FINANCIAL STATEMENTS
IMPERVA, INC. AND SUBSIDIARIES
| Page | ||||
| 64 | ||||
| 66 | ||||
| 67 | ||||
| 68 | ||||
| 69 | ||||
| 70 | ||||
| 71 | ||||
63
Table of Contents
REPORT OF INDEPENDENT REGISTERED PUBLIC ACCOUNTING FIRM
The Board of Directors and Stockholders of
Imperva, Inc.
We have audited Imperva, Inc.’s internal control over financial reporting as of December 31, 2014, based on criteria established in Internal Control-Integrated Framework issued by the Committee of Sponsoring Organizations of the Treadway Commission (2013 Framework) (the COSO criteria). Imperva, Inc.’s management is responsible for maintaining effective internal control over financial reporting, and for its assessment of the effectiveness of internal control over financial reporting included in the accompanying Management’s Report on Internal Control Over Financial Reporting. Our responsibility is to express an opinion on the Company’s internal control over financial reporting based on our audit.
We conducted our audit in accordance with the standards of the Public Company Accounting Oversight Board (United States). Those standards require that we plan and perform the audit to obtain reasonable assurance about whether effective internal control over financial reporting was maintained in all material respects. Our audit included obtaining an understanding of internal control over financial reporting, assessing the risk that a material weakness exists, testing and evaluating the design and operating effectiveness of internal control based on the assessed risk, and performing such other procedures as we considered necessary in the circumstances. We believe that our audit provides a reasonable basis for our opinion.
A company’s internal control over financial reporting is a process designed to provide reasonable assurance regarding the reliability of financial reporting and the preparation of financial statements for external purposes in accordance with generally accepted accounting principles. A company’s internal control over financial reporting includes those policies and procedures that (1) pertain to the maintenance of records that, in reasonable detail, accurately and fairly reflect the transactions and dispositions of the assets of the company; (2) provide reasonable assurance that transactions are recorded as necessary to permit preparation of financial statements in accordance with generally accepted accounting principles, and that receipts and expenditures of the company are being made only in accordance with authorizations of management and directors of the company; and (3) provide reasonable assurance regarding prevention or timely detection of unauthorized acquisition, use or disposition of the company’s assets that could have a material effect on the financial statements.
Because of its inherent limitations, internal control over financial reporting may not prevent or detect misstatements. Also, projections of any evaluation of effectiveness to future periods are subject to the risk that controls may become inadequate because of changes in conditions, or that the degree of compliance with the policies or procedures may deteriorate.
In our opinion, Imperva, Inc. maintained, in all material respects, effective internal control over financial reporting as of December 31, 2014, based on the COSO criteria.
We also have audited, in accordance with the standards of the Public Company Accounting Oversight Board (United States), the consolidated balance sheets of Imperva, Inc. and subsidiaries as of December 31, 2014 and 2013, and the related consolidated statements of operations, comprehensive loss, stockholders’ equity, and cash flows for each of the three years in the period ended December 31, 2014 and our report dated March 2, 2015 expressed an unqualified opinion thereon.
/s/ Ernst & Young LLP
Redwood City, California
March 2, 2015
64
Table of Contents
REPORT OF INDEPENDENT REGISTERED PUBLIC ACCOUNTING FIRM
The Board of Directors and Stockholders of
Imperva, Inc.
We have audited the accompanying consolidated balance sheets of Imperva, Inc. and subsidiaries as of December 31, 2014 and 2013, and the related consolidated statements of operations, comprehensive loss, stockholders’ equity, and cash flows for each of the three years in the period ended December 31, 2014. These financial statements are the responsibility of the Company’s management. Our responsibility is to express an opinion on these financial statements based on our audits.
We conducted our audits in accordance with the standards of the Public Company Accounting Oversight Board (United States). Those standards require that we plan and perform the audit to obtain reasonable assurance about whether the financial statements are free of material misstatement. An audit includes examining, on a test basis, evidence supporting the amounts and disclosures in the financial statements. An audit also includes assessing the accounting principles used and significant estimates made by management, as well as evaluating the overall financial statement presentation. We believe that our audits provide a reasonable basis for our opinion.
In our opinion, the financial statements referred to above present fairly, in all material respects, the consolidated financial position of Imperva, Inc. and subsidiaries at December 31, 2014 and 2013, and the consolidated results of their operations and their cash flows for each of the three years in the period ended December 31, 2014, in conformity with U.S. generally accepted accounting principles.
We also have audited, in accordance with the standards of the Public Company Accounting Oversight Board (United States), Imperva, Inc.’s internal control over financial reporting as of December 31, 2014, based on criteria established in Internal Control-Integrated Framework issued by the Committee of Sponsoring Organizations of the Treadway Commission (2013 framework) and our report dated March 2, 2015 expressed an unqualified opinion thereon.
/s/ Ernst & Young LLP
Redwood City, California
March 2, 2015
65
Table of Contents
IMPERVA, INC. AND SUBSIDIARIES
(In thousands, except share and per share data)
| December 31, | ||||||||
| 2014 | 2013 | |||||||
| ASSETS |
||||||||
| CURRENT ASSETS: |
||||||||
| Cash and cash equivalents |
$ | 68,096 | $ | 76,704 | ||||
| Short-term investments |
41,624 | 38,381 | ||||||
| Restricted cash |
62 | 34 | ||||||
| Accounts receivable, net of allowance for doubtful accounts of $215 and $ 410 as of December 31, 2014 and 2013, respectively |
47,446 | 44,446 | ||||||
| Inventory |
259 | 512 | ||||||
| Deferred tax assets |
408 | 341 | ||||||
| Prepaid expenses and other current assets |
3,927 | 3,972 | ||||||
|
|
|
|
|
|||||
| Total current assets |
161,822 | 164,390 | ||||||
| Property and equipment, net |
7,618 | 5,475 | ||||||
| Goodwill |
34,972 | — | ||||||
| Acquired intangible assets, net |
9,399 | — | ||||||
| Severance pay fund |
3,980 | 4,140 | ||||||
| Restricted cash |
1,665 | 1,252 | ||||||
| Deferred tax assets |
329 | 42 | ||||||
| Other assets |
860 | 1,192 | ||||||
|
|
|
|
|
|||||
| TOTAL ASSETS |
$ | 220,645 | $ | 176,491 | ||||
|
|
|
|
|
|||||
| LIABILITIES AND STOCKHOLDERS’ EQUITY |
||||||||
| CURRENT LIABILITIES: |
||||||||
| Accounts payable |
$ | 5,376 | $ | 3,948 | ||||
| Accrued compensation and benefits |
15,749 | 12,930 | ||||||
| Accrued and other current liabilities |
6,376 | 3,961 | ||||||
| Deferred revenue |
56,077 | 40,337 | ||||||
|
|
|
|
|
|||||
| Total current liabilities |
83,578 | 61,176 | ||||||
| Other liabilities |
10,408 | 1,993 | ||||||
| Deferred revenue |
25,098 | 22,715 | ||||||
| Accrued severance pay |
4,318 | 4,385 | ||||||
|
|
|
|
|
|||||
| TOTAL LIABILITIES |
123,402 | 90,269 | ||||||
|
|
|
|
|
|||||
| Commitments and Contingencies (Note 11) |
||||||||
| STOCKHOLDERS’ EQUITY: |
||||||||
| Preferred stock, $0.0001 par value—5,000,000 shares authorized, no shares issued and outstanding as of December 31, 2014 and 2013, respectively |
— | — | ||||||
| Common stock, $0.0001 par value—145,000,000 shares authorized, 26,895,480 and 25,206,498 shares issued and outstanding as of December 31, 2014 and 2013, respectively |
2 | 2 | ||||||
| Additional paid-in capital |
256,388 | 187,957 | ||||||
| Accumulated deficit |
(157,658 | ) | (98,695 | ) | ||||
| Accumulated other comprehensive loss |
(1,489 | ) | (428 | ) | ||||
|
|
|
|
|
|||||
| TOTAL IMPERVA, INC. STOCKHOLDERS’ EQUITY |
97,243 | 88,836 | ||||||
| Noncontrolling interest |
— | (2,614 | ) | |||||
|
|
|
|
|
|||||
| TOTAL STOCKHOLDERS’ EQUITY |
97,243 | 86,222 | ||||||
|
|
|
|
|
|||||
| TOTAL LIABILITIES AND STOCKHOLDERS’ EQUITY |
$ | 220,645 | $ | 176,491 | ||||
|
|
|
|
|
|||||
The accompanying notes are an integral part of these consolidated financial statements
66
Table of Contents
IMPERVA, INC. AND SUBSIDIARIES
Consolidated Statements of Operations
(In thousands, except share and per share data)
| Years Ended December 31, | ||||||||||||
| 2014 | 2013 | 2012 | ||||||||||
| Net revenue: |
||||||||||||
| Products and license |
$ | 74,299 | $ | 72,153 | $ | 59,490 | ||||||
| Services |
89,711 | 65,606 | 44,745 | |||||||||
|
|
|
|
|
|
|
|||||||
| Total net revenue |
164,010 | 137,759 | 104,235 | |||||||||
| Cost of revenue: |
||||||||||||
| Products and license |
9,248 | 8,756 | 8,530 | |||||||||
| Services |
27,335 | 20,940 | 13,374 | |||||||||
|
|
|
|
|
|
|
|||||||
| Total cost of revenue |
36,583 | 29,696 | 21,904 | |||||||||
|
|
|
|
|
|
|
|||||||
| Gross profit |
127,427 | 108,063 | 82,331 | |||||||||
| Operating expenses: |
||||||||||||
| Research and development |
43,052 | 27,556 | 20,555 | |||||||||
| Sales and marketing |
106,382 | 81,500 | 53,509 | |||||||||
| General and administrative |
34,499 | 24,436 | 15,371 | |||||||||
| Amortization of acquired intangible assets |
1,269 | — | — | |||||||||
|
|
|
|
|
|
|
|||||||
| Total operating expenses |
185,202 | 133,492 | 89,435 | |||||||||
|
|
|
|
|
|
|
|||||||
| Loss from operations |
(57,775 | ) | (25,429 | ) | (7,104 | ) | ||||||
| Other income (expense), net |
(220 | ) | (125 | ) | (243 | ) | ||||||
|
|
|
|
|
|
|
|||||||
| Loss before provision for income taxes |
(57,995 | ) | (25,554 | ) | (7,347 | ) | ||||||
| Provision for income taxes |
1,181 | 777 | 545 | |||||||||
|
|
|
|
|
|
|
|||||||
| Net loss |
(59,176 | ) | (26,331 | ) | (7,892 | ) | ||||||
| Loss attributable to noncontrolling interest |
213 | 1,153 | 505 | |||||||||
|
|
|
|
|
|
|
|||||||
| Net loss attributable to Imperva, Inc. stockholders |
$ | (58,963 | ) | $ | (25,178 | ) | $ | (7,387 | ) | |||
|
|
|
|
|
|
|
|||||||
| Net loss per share of common stock attributable to Imperva, Inc. stockholders, basic and diluted |
$ | (2.28 | ) | $ | (1.04 | ) | $ | (0.32 | ) | |||
|
|
|
|
|
|
|
|||||||
| Shares used in computing net loss per share of common stock, basic and diluted |
25,805,632 | 24,300,198 | 22,916,426 | |||||||||
|
|
|
|
|
|
|
|||||||
The accompanying notes are an integral part of these consolidated financial statements.
67
Table of Contents
IMPERVA, INC. AND SUBSIDIARIES
Consolidated Statements of Comprehensive Loss
(in thousands)
| Years Ended December 31, | ||||||||||||
| 2014 | 2013 | 2012 | ||||||||||
| Net loss |
$ | (59,176 | ) | $ | (26,331 | ) | $ | (7,892 | ) | |||
| Other comprehensive loss (net of tax): |
||||||||||||
| Net change in net unrealized gain (loss) on investments |
(59 | ) | (172 | ) | 227 | |||||||
| Net change in unrealized gain (loss) on hedging instruments |
(1,002 | ) | (1,117 | ) | 1,250 | |||||||
|
|
|
|
|
|
|
|||||||
| (1,061 | ) | (1,289 | ) | 1,477 | ||||||||
|
|
|
|
|
|
|
|||||||
| Comprehensive loss |
(60,237 | ) | (27,620 | ) | (6,415 | ) | ||||||
| Comprehensive loss attributable to noncontrolling interest |
213 | 1,153 | 505 | |||||||||
|
|
|
|
|
|
|
|||||||
| Comprehensive loss attributable to Imperva, Inc. stockholders |
$ | (60,024 | ) | $ | (26,467 | ) | $ | (5,910 | ) | |||
|
|
|
|
|
|
|
|||||||
The accompanying notes are an integral part of these consolidated financial statements.
68
Table of Contents
IMPERVA, INC. AND SUBSIDIARIES
Consolidated Statements of Stockholders’ Equity
(in thousands)
| Common Stock | Additional Paid-in |
Accumulated | Accumulated Other Comprehensive |
Noncontrolling | Total Shareholders’ |
|||||||||||||||||||||||
| Shares | Amount | Capital | Deficit | Income (Loss) | Interest | Equity | ||||||||||||||||||||||
| Balance as at December 31, 2011 |
22,978,166 | $ | 2 | $ | 147,085 | $ | (66,130 | ) | $ | (616 | ) | $ | (773 | ) | $ | 79,568 | ||||||||||||
| Issuance of common stock upon exercise of stock options |
1,272,940 | — | 3,093 | — | — | — | 3,093 | |||||||||||||||||||||
| Vesting of restricted stock |
— | — | 881 | — | — | — | 881 | |||||||||||||||||||||
| Stock-based compensation |
— | — | 5,968 | — | — | — | 5,968 | |||||||||||||||||||||
| Issuance of common stock in connection with employee stock purchase plan |
44,970 | — | 1,117 | — | — | — | 1,117 | |||||||||||||||||||||
| Income tax benefit from employee stock option exercises |
— | — | 19 | — | — | — | 19 | |||||||||||||||||||||
| Purchase of additional ownership interest in Incapsula, Inc. |
— | — | (174 | ) | — | — | 174 | — | ||||||||||||||||||||
| Components of other comprehensive income (loss), net of tax |
||||||||||||||||||||||||||||
| Change in unrealized gain (loss) on investments |
— | — | — | — | 227 | — | 227 | |||||||||||||||||||||
| Change in unrealized gain (loss) on derivatives |
— | — | — | — | 1,250 | — | 1,250 | |||||||||||||||||||||
| Net loss |
— | — | — | (7,387 | ) | — | (505 | ) | (7,892 | ) | ||||||||||||||||||
|
|
|
|||||||||||||||||||||||||||
| Comprehensive loss |
(6,415 | ) | ||||||||||||||||||||||||||
|
|
|
|
|
|
|
|
|
|
|
|
|
|
|
|||||||||||||||
| Balance as at December 31, 2012 |
24,296,076 | 2 | 157,989 | (73,517 | ) | 861 | (1,104 | ) | 84,231 | |||||||||||||||||||
| Issuance of common stock, net of repurchases |
806,226 | — | 3,544 | — | — | — | 3,544 | |||||||||||||||||||||
| Vesting of restricted stock |
— | — | 801 | — | — | — | 801 | |||||||||||||||||||||
| Stock-based compensation |
— | — | 22,494 | — | — | — | 22,494 | |||||||||||||||||||||
| Issuance of common stock in connection with employee stock purchase plan |
96,502 | — | 2,772 | — | — | — | 2,772 | |||||||||||||||||||||
| Exercise of warrant |
7,694 | — | — | — | — | — | ||||||||||||||||||||||
| Sale of additional ownership interest in Incapsula, Inc. |
— | — | 357 | — | — | (357 | ) | — | ||||||||||||||||||||
| Components of other comprehensive income (loss), net of tax |
||||||||||||||||||||||||||||
| Change in unrealized gain (loss) on investments |
— | — | — | — | (172 | ) | — | (172 | ) | |||||||||||||||||||
| Change in unrealized gain (loss) on derivatives |
— | — | — | — | (1,117 | ) | — | (1,117 | ) | |||||||||||||||||||
| Net loss |
— | — | — | (25,178 | ) | — | (1,153 | ) | (26,331 | ) | ||||||||||||||||||
|
|
|
|||||||||||||||||||||||||||
| Comprehensive loss |
(27,620 | ) | ||||||||||||||||||||||||||
|
|
|
|
|
|
|
|
|
|
|
|
|
|
|
|||||||||||||||
| Balance as at December 31, 2013 |
25,206,498 | 2 | 187,957 | (98,695 | ) | (428 | ) | (2,614 | ) | 86,222 | ||||||||||||||||||
| Issuance of common stock related to acquisitions |
738,479 | — | 24,163 | 24,163 | ||||||||||||||||||||||||
| Issuance of common stock, net of repurchases |
672,832 | — | 5,297 | — | — | — | 5,297 | |||||||||||||||||||||
| Vesting of restricted stock |
— | — | 454 | — | — | — | 454 | |||||||||||||||||||||
| Stock-based compensation |
— | — | 37,273 | — | — | — | 37,273 | |||||||||||||||||||||
| Issuance of common stock in connection with employee stock purchase plan |
188,068 | — | 3,332 | — | — | — | 3,332 | |||||||||||||||||||||
| Income tax benefit from employee stock option exercises |
— | — | 385 | — | — | — | 385 | |||||||||||||||||||||
| Pre-combination service relating to acquired Skyfence option plan |
— | — | 354 | — | — | — | 354 | |||||||||||||||||||||
| Purchase of additional ownership interest in Incapsula, Inc. |
89,603 | — | (2,827 | ) | — | — | 2,827 | — | ||||||||||||||||||||
| Components of other comprehensive income (loss), net of tax |
||||||||||||||||||||||||||||
| Change in unrealized gain (loss) on investments |
— | — | — | — | (59 | ) | — | (59 | ) | |||||||||||||||||||
| Change in unrealized gain (loss) on derivatives |
— | — | — | — | (1,002 | ) | — | (1,002 | ) | |||||||||||||||||||
| Net loss |
— | — | — | (58,963 | ) | — | (213 | ) | (59,176 | ) | ||||||||||||||||||
|
|
|
|||||||||||||||||||||||||||
| Comprehensive loss |
(60,237 | ) | ||||||||||||||||||||||||||
|
|
|
|
|
|
|
|
|
|
|
|
|
|
|
|||||||||||||||
| Balance as at December 31, 2014 |
26,895,480 | $ | 2 | $ | 256,388 | $ | (157,658 | ) | $ | (1,489 | ) | $ | — | $ | 97,243 | |||||||||||||
|
|
|
|
|
|
|
|
|
|
|
|
|
|
|
|||||||||||||||
The accompanying notes are an integral part of these consolidated financial statements.
69
Table of Contents
IMPERVA, INC. AND SUBSIDIARIES
Consolidated Statements of Cash Flows
(In thousands)
| Years Ended December 31, |
||||||||||||
| 2014 | 2013 | 2012 | ||||||||||
| CASH FLOWS FROM OPERATING ACTIVITIES: |
||||||||||||
| Net loss |
$ | (59,176 | ) | $ | (26,331 | ) | $ | (7,892 | ) | |||
| Adjustments to reconcile net loss to net cash provided by operating activities: |
||||||||||||
| Depreciation and amortization |
3,578 | 2,642 | 1,841 | |||||||||
| Stock-based compensation |
37,273 | 22,494 | 5,968 | |||||||||
| Amortization of acquired intangibles |
1,269 | — | — | |||||||||
| Amortization of premiums/accretion of discounts on short-term investments |
416 | 639 | 496 | |||||||||
| Excess tax benefits from share-based compensation |
(385 | ) | — | (19 | ) | |||||||
| Changes in operating assets and liabilities: |
||||||||||||
| Accounts receivable, net |
(3,000 | ) | (8,870 | ) | (9,840 | ) | ||||||
| Inventory |
253 | (184 | ) | 114 | ||||||||
| Prepaid expenses and other assets |
409 | (1,161 | ) | (2,174 | ) | |||||||
| Accounts payable |
1,150 | 159 | 255 | |||||||||
| Accrued compensation and benefits |
2,630 | 3,672 | 1,767 | |||||||||
| Accrued and other liabilities |
1,847 | (206 | ) | 703 | ||||||||
| Severance pay (net) |
93 | (32 | ) | 169 | ||||||||
| Deferred revenue |
18,123 | 16,761 | 13,366 | |||||||||
| Deferred tax assets |
(354 | ) | 214 | (286 | ) | |||||||
| Other |
— | — | (1 | ) | ||||||||
|
|
|
|
|
|
|
|||||||
| Net cash provided by operating activities |
4,126 | 9,797 | 4,467 | |||||||||
|
|
|
|
|
|
|
|||||||
| CASH FLOWS FROM INVESTING ACTIVITIES: |
||||||||||||
| Purchase of short-term investments |
(33,267 | ) | (38,021 | ) | (58,158 | ) | ||||||
| Proceeds from sales/maturities of short-term investments |
29,821 | 42,162 | 16,305 | |||||||||
| Acquisitions, net of cash acquired |
(12,083 | ) | — | — | ||||||||
| Net purchases of property and equipment |
(5,621 | ) | (2,602 | ) | (3,330 | ) | ||||||
| Purchase of other assets |
— | — | (400 | ) | ||||||||
| Change in restricted cash |
(441 | ) | 58 | 9 | ||||||||
|
|
|
|
|
|
|
|||||||
| Net cash used provided by (used in) investing activities |
(21,591 | ) | 1,597 | (45,574 | ) | |||||||
|
|
|
|
|
|
|
|||||||
| CASH FLOWS FROM FINANCING ACTIVITIES: |
||||||||||||
| Proceeds from issuance of common stock, net of repurchases |
8,472 | 6,316 | 4,211 | |||||||||
| Excess tax benefits from share-based compensation |
385 | — | 19 | |||||||||
|
|
|
|
|
|
|
|||||||
| Net cash provided by financing activities |
8,857 | 6,316 | 4,230 | |||||||||
|
|
|
|
|
|
|
|||||||
| Effect of exchange rate changes on cash and cash equivalents |
— | (207 | ) | 53 | ||||||||
|
|
|
|
|
|
|
|||||||
| NET INCREASE (DECREASE) IN CASH AND CASH EQUIVALENTS |
(8,608 | ) | 17,503 | (36,824 | ) | |||||||
| CASH AND CASH EQUIVALENTS - Beginning of period |
76,704 | 59,201 | 96,025 | |||||||||
|
|
|
|
|
|
|
|||||||
| CASH AND CASH EQUIVALENTS - End of period |
$ | 68,096 | $ | 76,704 | $ | 59,201 | ||||||
|
|
|
|
|
|
|
|||||||
| SUPPLEMENTAL DISCLOSURES OF CASH FLOW INFORMATION: |
||||||||||||
| Cash paid for income taxes |
$ | 287 | $ | 835 | $ | 1,430 | ||||||
|
|
|
|
|
|
|
|||||||
| NONCASH INVESTING AND FINANCING ACTIVITIES: |
||||||||||||
| Fair value of shares issued related to acquisitions of businesses |
$ | 24,163 | $ | — | $ | — | ||||||
|
|
|
|
|
|
|
|||||||
| Property and equipment incurred but not yet paid |
$ | 820 | $ | — | $ | — | ||||||
|
|
|
|
|
|
|
|||||||
| Vesting of restricted and early exercised stock options |
$ | 454 | $ | 801 | $ | 881 | ||||||
|
|
|
|
|
|
|
|||||||
The accompanying notes are an integral part of the consolidated financial statements.
70
Table of Contents
IMPERVA, INC. AND SUBSIDIARIES
NOTES TO CONSOLIDATED FINANCIAL STATEMENTS
1. The Company and Summary of Significant Accounting Policies
Business
Imperva, Inc. (together with its subsidiaries, the “Company”) was incorporated in April 2002 in Delaware. The Company is headquartered in Redwood Shores, California and has subsidiaries located throughout the world including Israel, Asia and Europe. The Company is engaged in the development, marketing, sales, service and support of cyber-security solutions that protect business-critical data and applications whether in the cloud or on premises.
Basis of Presentation
The accompanying consolidated financial statements have been prepared in accordance with U.S. generally accepted accounting principles (“GAAP”) and include all adjustments necessary for the fair presentation of the Company’s consolidated financial position, results of operations and cash flows for the periods presented. The consolidated financial statements include the accounts of Imperva Inc., its wholly-owned and majority-owned subsidiaries. All intercompany accounts and transactions have been eliminated in consolidation.
Noncontrolling Interest
On March 20, 2014, the Company acquired the remaining interest it did not previously own in its majority-owned subsidiary, Incapsula, Inc. (“Incapsula”) (Refer to Note 2). The Company separately presented the non-controlling interest on its Consolidated Balance Sheets in Total Stockholders’ Equity, Consolidated Statements of Operations, Consolidated Statements of Comprehensive Loss and Consolidated Statements of Stockholders’ Equity for periods prior to such date. The Company has recorded a noncontrolling interest in these consolidated financial statements for the 19%, and 15% ownership interest of the minority owners of Incapsula as of December 31, 2013 and 2012, respectively. Changes to the ownership interest in Incapsula held by the minority owners were accounted for as equity transactions in the consolidated statements of stockholders’ equity as the Company obtained control of Incapsula on November 5, 2009.
Segment Information
Operating segments are components of an enterprise for which separate financial information is available and is evaluated regularly by the Company’s chief operating decision maker in deciding how to allocate resources and in assessing performance. The Company’s chief operating decision maker is the Chief Executive Officer.
The Company had two operating segments which were both reportable business segments: (i) Imperva, which was comprised of Imperva’s and its wholly-owned subsidiaries’ financial position and results of operations; and (ii) Incapsula, which was comprised of Incapsula’s financial position and results from operations. During the three months ended March 31, 2014, the Company revised its business segments based upon the acquisition of the remaining shares of Incapsula, Inc. that the Company did not already own. As a result, the Company no longer separately reports the Incapsula segment and the Company now operates its business in one operating segment, which is the development, marketing, sales, service and support of cyber-security solutions that protect business-critical data and applications whether in cloud or on premises. The reclassification of historical business segment information had no impact on the Company’s basic financial statements.
Use of Estimates
The preparation of the accompanying consolidated financial statements in conformity with GAAP requires management to make estimates and assumptions that affect the amounts reported in the consolidated financial statements and accompanying notes. Such management estimates include the fair value of accounts receivable, inventory intangible assets and goodwill, useful lives of intangible assets and property and equipment, and assumptions used in the calculation of income taxes and stock-based compensation, among others. These estimates and assumptions are based on management’s best estimates and judgment. Management evaluates its estimates and assumptions on an ongoing basis using historical experience and other factors and adjusts such estimates and assumptions when facts and circumstances dictate. As future events and their effects cannot be determined with precision, actual results could differ significantly from these estimates.
71
Table of Contents
Concentration of Supply Risk
The Company relies on a single third party to manufacture its hardware appliances, and purchases its hardware appliances through such third party’s value-added resellers. Quality or performance failures of the Company’s products or changes in the Company’s suppliers’ financial or business condition could disrupt the Company’s ability to supply quality products to its customers and thereby have a material adverse effect on its business and consolidated financial statements.
Concentration of Credit Risk
Financial instruments that potentially subject the Company to a concentration of credit risk consist primarily of cash, cash equivalents, short-term investments, restricted cash and derivative financial instruments. The Company’s cash, cash equivalents, short-term investments and restricted cash are invested in high-quality instruments with banks and financial institutions located in the United States and Israel. Such deposits may be in excess of insured limits provided on such deposits.
The Company uses derivative financial instruments to manage exposures to foreign currency risks. The Company’s derivatives expose it to credit risk to the extent that the counterparty may be unable to meet the terms of the agreement. The Company seeks to mitigate such risk by limiting its counterparties to those with high or investment-grade credit ratings. The Company does not require collateral under these agreements and has not historically experienced any losses due to credit risk or lack of performance by counterparties.
Derivative Financial Instruments
The Company uses forward foreign currency exchange contracts to reduce its exposure to foreign currency rate changes for operating expenses that are forecasted to be incurred in currencies other than U.S. dollars. The Company records all of its derivative instruments at their gross fair value on the consolidated balance sheets. The Company classifies its cash flows from derivative financial instruments as operating activities.
The accounting for changes in the fair value of a derivative instrument depends on whether the instrument has been designated and qualifies as a cash flow hedge for accounting purposes. For forward foreign currency exchange contracts that are designated and qualify as cash flow hedges, the effective portion of the gain or loss resulting from changes in the fair value of the derivative instruments is accounted for in accumulated other comprehensive income (loss) (“AOCI”) in the consolidated statements of stockholders’ equity and reclassified into operating expenses in the consolidated statements of operations in the period or periods during which the hedged transaction affects earnings. As of December 31, 2014, the Company estimated that $1.0 million of net derivative loss included in accumulated other comprehensive income (loss) will be reclassified into earnings within the next 12 months. The ineffective portion of the gain or loss resulting from the change in fair value is recognized in other income (expense), net in the consolidated statements of operations.
Cash, Cash Equivalents and Short-Term Investments
The Company considers all highly liquid investments with a maturity of three months or less when purchased to be cash equivalents. Cash and cash equivalents consist of cash on hand, highly liquid investments in money market funds and various deposit accounts.
The Company considers all high quality investments purchased with original maturities at the date of purchase greater than three months to be short-term investments. Investments are available to be used in current operations and are, therefore, classified as current assets even though maturities may extend beyond one year. Cash equivalents and short-term investments are classified as available-for-sale and are, therefore, recorded at fair value on the consolidated balance sheets, with any unrealized gains and losses reported in the consolidated statements of stockholders’ equity as a component of accumulated other comprehensive income (loss) until realized. The Company uses the specific-identification method to compute gains and losses on the investments. The amortized cost of securities is adjusted for amortization of premiums and accretion of discounts to maturity. Such amortization and accretion is included as a component of other income (expense), net in the consolidated statements of operations.
Restricted Cash
The Company has restricted cash pledged as collateral representing a security deposit required for facility leases. As of December 31, 2014 and 2013, the Company has classified $1.7 million and $1.3 million, respectively, of security deposit as non-current assets relating to its facility lease arrangements.
72
Table of Contents
Inventory
Inventory consists of finished goods hardware appliances and related component parts and is stated at the lower of cost or market value determined on an average cost basis. Inventory that is obsolete or in excess of forecasted demand is written down to its estimated realizable value. Inventory write-downs, once established, are not reversed as they establish a new cost basis for the inventory. For the years ended December 31, 2014, 2013 and 2012, the amount of inventory write-downs incurred by the Company were insignificant.
Business Combination
The Company accounts for its business acquisitions in accordance with Accounting Standards Codification (ASC) No. 805, Business Combinations. The Company uses its best estimates and assumptions as part of the purchase price allocation process to value assets acquired and liabilities assumed at the business combination date. However, the Company’s estimates and assumptions are subject to refinement. The Company records adjustments to assets acquired or liabilities assumed subsequent to the purchase price allocation period in our operating results in the period in which the adjustments were determined.
The total purchase price allocated to the tangible assets acquired is assigned based on the fair values as of the date of the acquisition. The fair value assigned to identifiable intangible assets acquired is determined using the income approach which discounts expected future cash flows to present value using estimated assumptions determined by management. The identifiable intangible assets are subject to amortization on a straight-line basis as this best approximates the benefit period related to these assets
Property and Equipment
Property and equipment, including leasehold improvements, are stated at cost less accumulated depreciation and amortization. Depreciation is computed using the straight-line method over the estimated useful lives of the related assets, generally two to seven years.
Leasehold improvements are amortized using the straight-line method over the shorter of the remaining lease term or the estimated useful lives of the assets. Upon the retirement or disposition of property and equipment, the related costs and accumulated depreciation is removed and any related gain or loss is recorded in the consolidated statements of operations. Repairs and maintenance that do not extend the life or improve an asset are expensed in the periods incurred.
Goodwill and Acquired Intangibles
Goodwill is not amortized and is reviewed at least annually or whenever events or changes in circumstances indicate that the carrying value may not be recoverable. In reviewing goodwill, the Company bypasses the qualitative assessment and proceeds directly to performing the quantitative two step impairment test to test the reporting unit’s goodwill for impairment. The first step of the impairment test involves comparing the fair value of the reporting unit to its net book value, including goodwill and is used as a screening process for identifying a potential goodwill impairment loss. If the net book value exceeds its fair value, then the Company would perform the second step of the goodwill impairment test to determine the amount of the impairment loss. The impairment loss would be calculated by comparing the implied fair value of goodwill of the Company to its net book value. In calculating the implied fair value of the Company’s goodwill, the fair value of the Company would be allocated to all of the other assets and liabilities based on their fair values. The excess of the fair value of the Company over the amount assigned to its other assets and liabilities is the implied fair value of goodwill. An impairment loss would be recognized when the carrying amount of goodwill exceeds its implied fair value.
The Company completes its annual impairment test during the fourth quarter of each fiscal year. There was no impairment of goodwill recorded for the fiscal year ended December 31, 2014.
Intangible assets consist of purchased technology which are amortized over the period of estimated benefit using the straight-line method, as the consumption pattern of the asset is not apparent, and estimated useful lives ranging from seven to 10 years. The weighted average remaining useful life of the Company’s acquired technology intangible assets is seven years as of December 31, 2014. No significant residual value is estimated for intangible assets.
73
Table of Contents
Impairment of Long-Lived Assets
The Company evaluates its long-lived assets, which consist of property and equipment and acquired intangible assets, for indicators of possible impairment when events or changes in circumstances indicate the carrying amount of an asset may not be recoverable. Impairment exists if the carrying amounts of such assets exceed the estimates of future net undiscounted cash flows expected to be generated by such assets. Should impairment exist, the impairment loss would be measured based on the excess carrying value of the asset over the asset’s estimated fair value. As of December 31, 2014 and 2013, the Company has not written down any of its long-lived assets as a result of impairment.
Revenue Recognition
The Company derives revenue from two sources: (i) products and license revenue, which includes hardware and perpetual software license revenue and (ii) services revenue, which includes maintenance and support, professional services, training and subscription arrangements. Substantially all of product and license sales have been sold in combination with maintenance and support services. Revenue is recognized when all of the following criteria are met: persuasive evidence of an arrangement exists; delivery or performance has occurred; the sales price is fixed or determinable; and collection is reasonably assured.
The Company defines each of the four criteria above as follows:
| • | Persuasive evidence of an arrangement exists. Evidence of an arrangement consists of a purchase order issued pursuant to the terms and conditions of a distributor or value-added reseller agreement and, in limited cases, an end user agreement and/or purchase order. |
| • | Delivery or performance has occurred. The Company uses shipping and related documents, or written evidence of customer acceptance, when applicable, to verify delivery or performance. The Company recognizes product revenue upon transfer of title and risk of loss, which primarily is upon shipment to value-added resellers, distributors or end users. In most instances, the Company does not have significant obligations for future performance, such as customer acceptance provisions, rights of return or pricing credits, associated with the Company’s sales. In instances where final acceptance of the product or service is specified by the customer, revenue is deferred until all acceptance criteria have been met. |
| • | The sales price is fixed or determinable. The Company assesses whether the sales price is fixed or determinable based on payment terms and whether the sales price is subject to refund or adjustment. Standard payment terms to customers range from 30 to 90 days. In the event payment terms are provided that differ from the Company’s standard business practices, the fees are deemed to not be fixed or determinable and revenue is recognized when the payments become due, provided the remaining criteria for revenue recognition have been met. |
| • | Collection is reasonably assured. The Company assesses probability of collection on a customer-by-customer basis. The Company’s customers are subjected to a credit review process that evaluates their financial condition and ability to pay for products and services. If the Company concludes that collection is not reasonably assured based upon an initial review, the Company does not recognize revenue until payment is received. |
Maintenance and support and subscription revenue includes arrangements for software maintenance and technical support for the Company’s products and subscription services revenue primarily related to the Company’s cloud-based services. The terms of the Company’s subscription service arrangements do not provide customers the right to take possession of the related software. Maintenance and support is offered under renewable, fee-based contracts, which include technical support, hardware repair and replacement parts, bug fixes, patches and unspecified upgrades on a when-and-if-available basis. Maintenance and support and subscription revenue is initially deferred and recognized ratably over the life of the contract, with the related expenses recognized as incurred. Maintenance and support and subscription contracts usually have a term of one to three years. Unearned maintenance and support and subscription revenue is included in deferred revenue.
Professional service revenue primarily consists of the fees the Company earns related to installation and consulting services. The Company recognizes revenue from professional services upon delivery or completion of performance. Professional service arrangements are typically short term in nature and are largely completed within 90 days from the start of service.
Training services are recognized upon delivery of the training.
Multiple Element Arrangements
Most of the Company’s products are hardware appliances containing software components that function together to provide the essential functionality of the product. Therefore, the Company’s hardware appliances are considered non-software deliverables and are not subject to industry-specific software revenue recognition guidance.
74
Table of Contents
The Company’s product revenue also includes revenue from the sale of stand-alone software products. Stand-alone software may operate on the Company’s hardware appliance, but is not considered essential to the functionality of the hardware and is, therefore, subject to the industry-specific software revenue recognition guidance. Additionally, the Company provides unspecified software upgrades for its products, on a when-and-if available basis, and hardware replacements through maintenance and support contracts. These support arrangements when sold on a stand-alone basis are subject to the industry-specific software revenue recognition guidance.
Under the software revenue recognition guidance, the Company uses the residual method to recognize revenue when a product agreement includes one or more elements to be delivered at a future date and VSOE of the fair value of all undelivered elements exists. In the majority of the Company’s contracts, the only element that remains undelivered at the time of delivery of the product is maintenance and support services and subscriptions. Under the residual method, the VSOE of fair value of the undelivered elements is deferred and the remaining portion of the contract fee is recognized as product revenue. If evidence of the VSOE of fair value of one or more undelivered elements does not exist, all revenue is generally deferred and recognized when delivery of those elements occurs or when fair value can be established.
For certain arrangements with multiple deliverables, the Company allocates the arrangement fee to the non-software element based upon the relative selling price of such element and, if software and software-related elements (e.g., maintenance and support for the software element) are also included in the arrangement, the Company allocates the arrangement fee to each of those software and software-related elements as a group. After such allocations are made, the amount of the arrangement fee allocated to the software and software-related elements is accounted for using the residual method. When applying the relative selling price method, the Company determines the selling price for each element using VSOE of selling price, if it exists, or if not, TPE of selling price, if it exists. If neither VSOE nor TPE of selling price exist for an element, the Company uses its BESP for that element. The revenue allocated to each element is then recognized when the basic revenue recognition criteria are met for that element. The Company limits the amount of revenue recognized for delivered elements to the amount that is not contingent on the future delivery of products or services, or subject to the Company’s future performance obligation.
VSOE of fair value for elements of an arrangement is based upon the normal pricing and discounting practices for those services when sold separately. In determining VSOE, the Company requires that a substantial majority of the selling prices for a service fall within a reasonably narrow pricing range, evidenced by a substantial majority of such historical stand-alone transactions falling within a reasonably narrow range. In addition, the Company considers major service groups and geographies in determining VSOE.
The Company is not able to determine TPE for its products or services. TPE is determined based on competitor prices for similar deliverables when sold separately. Generally, the Company’s go-to-market strategy differs from that of its peers and its offerings contain a significant level of differentiation such that the comparable pricing of products with similar functionality cannot be obtained. Furthermore, the Company is unable to reliably determine what similar competitor products’ selling prices are on a stand-alone basis.
When the Company is unable to establish the selling price of its non-software deliverables using VSOE or TPE, the Company uses BESP in its allocation of arrangement consideration. The objective of BESP is to determine the price at which the Company would transact a sale if the product or service were sold on a stand-alone basis. The Company determines BESP for the purposes of allocating the arrangement by reviewing external and internal market factors including, but not limited to, pricing practices including discounting, the geographies in which the Company offers its products and services, the type of customer (i.e., distributor, value added reseller or direct end user) and competition. Additionally, the Company considers historical transactions, including transactions whereby the deliverable was sold on a stand-alone basis. The determination of BESP is made through consultation with and approval by the Company’s management. Selling prices are analyzed on a quarterly basis to identify if the Company has experienced significant changes in its selling prices.
For its non-software deliverables the Company allocates the arrangement consideration based on the relative selling price of the deliverables. For its hardware appliances the Company uses BESP as its selling price. For its maintenance and support services, subscriptions and professional services and training, the Company primarily uses VSOE as the selling price and when the Company is unable to establish a selling price using VSOE, it uses BESP.
Deferred Revenue
Deferred revenue represents amounts invoiced to customers for which the related revenue has not been recognized because one or more of the revenue recognition criteria have not been met. The current portion of the deferred revenues represents the amount that is expected to be recognized as revenue within one year of the consolidated balance sheet date.
75
Table of Contents
Accounts Receivable and Allowance for Doubtful Accounts
Accounts receivable are recorded at invoiced amounts, net of allowances for doubtful accounts if applicable, and do not bear interest.
The Company generally does not require collateral from its customers; however, in certain circumstances, may require letters of credit, other collateral, additional guarantees or advance payments. The allowance for doubtful accounts is based on the Company’s assessment of the collectability of its customer accounts. The Company regularly reviews its accounts receivable that remain outstanding past their applicable payment terms and establishes allowance and potential write-offs by considering certain factors such as historical experience, industry data, credit quality, age of balances and current economic conditions that may affect a customers’ ability to pay.
Concentration of Revenue and Accounts Receivable
Significant customers are those which represent 10% or more of the Company’s total revenue or gross accounts receivable balance at each respective balance sheet date. For the year ended December 31, 2013 the Company had one customer that represented 10% of the Company’s total revenue. For the years ended December 31, 2014 and 2012, the Company did not have any customers that represented 10% or more of the Company’s total revenue. There were no customers who represented 10% or more of gross accounts receivable as of December 31, 2014 and 2013.
Shipping and Handling Costs
Costs related to shipping and handling are included in cost of revenue.
Research and Development Costs
Research and development costs, including direct and allocated expenses, are expensed as incurred.
Software Development Costs
The costs to develop software for sale have not been capitalized as the Company believes that the technological feasibility of the related software is not established until substantially all product development is complete.
Warranty Costs
The Company generally provides a 60-day warranty on hardware appliance products and software from the date of shipment to customers. To date, cost to repair or replace items sold to customers has been insignificant.
Advertising Costs
The Company expenses advertising costs as incurred. Advertising expense is included within sales and marketing expense in the consolidated statements of operations. For the years ended December 31, 2014, 2013 and 2012, advertising expenses were not material.
Retirement Savings Plan
The Company maintains a defined contribution 401(k) retirement savings plan for its U.S. employees. Each participant in the 401(k) retirement savings plan may elect to contribute a percentage of his or her annual compensation up to a specified maximum amount allowed under U.S. Internal Revenue Service regulations. There were no employer contributions to the 401(k) retirement savings plan for the years ended December 31, 2014, 2013 and 2012.
Severance Pay Asset and Liability
The Company has recorded a severance pay asset and liability on its consolidated balance sheets related to its employees located in Israel. The Company’s liability for severance pay is calculated pursuant to Israeli severance pay law based on the most recent salary for the employees multiplied by the number of years of employment, as of the respective balance sheet date. Employees are entitled to one month salary for each year of employment or a portion thereof. The Company’s liability at each respective balance sheet date for all of its Israeli employees is fully accrued in the accompanying consolidated financial statements and is mainly funded through monthly deposits to the employee’s pension and management insurance policies. The carrying value of these policies is recorded as a severance fund asset in the Company’s consolidated balance sheets.
76
Table of Contents
The deposited funds may be withdrawn only upon the fulfillment of the obligation pursuant to Israeli severance pay law. The carrying value of the deposited funds is based on the cash surrender value of these policies and includes profits accumulated through the respective balance sheet date. The Company recognized severance expense related to the Israeli severance pay law during the years ended December 31, 2014, 2013 and 2012 of $1.4 million, $1.2 million, and $1.0 million, respectively.
Income Taxes
The Company accounts for income taxes in accordance with the Financial Accounting Standards Board (“FASB”) Accounting Standards Codification No. 740 (“ASC 740”), Accounting for Income Taxes. The Company makes certain estimates and judgments in determining income tax expense for financial statement purposes. These estimates and judgments occur in the calculation of tax credits, tax benefits and deductions and in the calculation of certain tax assets and liabilities, which arise from differences in the timing of recognition of revenue and expense for tax and financial statement purposes. Significant changes to these estimates may result in an increase or decrease to the Company’s tax provision in the subsequent period when such a change in estimate occurs.
The Company uses the liability method for accounting for deferred income taxes, which requires recognition of deferred income tax assets and liabilities for the expected future tax consequences of events that have been recognized in its financial statements, but have not been reflected in its taxable income. Estimates and judgments occur in the calculation of certain tax liabilities and in the determination of the recoverability of certain deferred income tax assets, which arise from temporary differences and carryforwards. Deferred income tax assets and liabilities are measured using the currently enacted tax rates that apply to taxable income in effect for the years in which those tax assets and liabilities are expected to be realized or settled. The Company regularly assesses the likelihood that its deferred income tax assets will be realized from recoverable income taxes or recovered from future taxable income based on the realization criteria set forth in ASC 740. To the extent that the Company believes any amounts are more likely not to be realized, the Company records a valuation allowance to reduce the deferred income tax assets. In the event the Company determines that all or part of the net deferred tax assets are not realizable in the future, an adjustment to the valuation allowance would be charged to earnings in the period such determination is made. Similarly, if the Company subsequently realizes deferred income tax assets that were previously determined to be unrealizable, the respective valuation allowance would be reversed, resulting in an adjustment to earnings in the period such determination is made.
In addition, the calculation of the Company’s tax liabilities involves addressing uncertainties in the application of complex tax regulations. The Company recognizes and measures potential liabilities based upon criteria set forth in ASC 740. Based upon these criteria, the Company estimates whether, and the extent to which, additional taxes will be due. If payment of these amounts ultimately proves to be unnecessary, the reversal of the liabilities may result in tax benefits being recognized in the period when the Company determines the liabilities are no longer necessary. If the Company’s estimate of tax liabilities is less than the amount ultimately assessed, a further charge to expense would result.
Significant judgment is required in determining any valuation allowance recorded against deferred income tax assets. In assessing the need for a valuation allowance, the Company considers all available evidence, including past operating results, estimates of future taxable income, and the feasibility of tax planning strategies. In the event that the Company changes its determination as to the amount of deferred income tax assets that could be realized, it will adjust its valuation allowance with a corresponding effect to the provision for income taxes in the period in which such determination is made.
Significant judgment is also required in evaluating the Company’s uncertain tax positions under ASC 740 and determining its provision for income taxes. Although the Company believes its reserves for uncertain tax positions are reasonable, no assurance can be given that the final tax outcome of these matters will not be different from that which is reflected in the Company’s historical income tax provisions and accruals. The Company adjusts these reserves in light of changing facts and circumstances, such as the closing of a tax audit or the refinement of an estimate. To the extent that the final tax outcome of these matters is different from the amounts recorded, such differences will affect the provision for income taxes in the period in which such determination is made. The provision for income taxes includes the effect of reserves for uncertain tax positions and any changes to the reserves that are considered appropriate, as well as the related net interest and penalties, if applicable.
77
Table of Contents
Stock-Based Compensation
Compensation costs related to employee stock option grants are based on the fair value of the options on the date of grant, net of estimated forfeitures. The Company determines the grant date fair value of the options using the Black-Scholes option-pricing model and the related stock-based compensation expense is generally recognized on a straight-line basis over the period in which an employee is required to provide service in exchange for the options, or the vesting period of the respective options.
For performance based RSUs granted to Incapsula employees which have multiple performance conditions and a market condition the Company used a Monte Carlo simulation model to determine the fair value of such awards. The key inputs used were the Company’s stock price on the date of grant, the expected volatility, the risk free interest rate and revenues achieved. The Company updates the estimated expense, net of forfeitures, at the end of each reporting period. The expense is recognized on an accelerated basis over the requisite service period, which is generally the vesting period of the respective awards.
Foreign Currency
The functional currency of the Company’s foreign subsidiaries is the U.S. dollar. Transactions denominated in currencies other than the functional currency are remeasured to the functional currency at the average exchange rate in effect during the period. At the end of each reporting period, monetary assets and liabilities are re-measured to the functional currency using exchange rates in effect at the balance sheet date. Non-monetary assets and liabilities are re-measured at historical exchange rates. Gains and losses related to remeasurement are recorded in other income (expense) in the consolidated statements of operations.
Fair Value of Financial Instruments
The Company measures and reports its cash equivalents, short-term investments, derivative instruments, and the Israeli severance pay fund assets at fair value. Fair value is defined as the exchange price that would be received for an asset or an exit price paid to transfer a liability in the principal or most advantageous market for the asset or liability in an orderly transaction between market participants on the measurement date. Valuation techniques used to measure fair value must maximize the use of observable inputs and minimize the use of unobservable inputs. The fair value hierarchy defines a three-level valuation hierarchy for disclosure of fair value measurements as follows:
Level I—Unadjusted quoted prices in active markets for identical assets or liabilities;
Level II—Inputs other than quoted prices included within Level I that are observable, unadjusted quoted prices in markets that are not active, or other inputs that are observable or can be corroborated by observable market data for substantially the full term of the related assets or liabilities; and
Level III—Unobservable inputs that are supported by little or no market activity for the related assets or liabilities.
The categorization of a financial instrument within the valuation hierarchy is based upon the lowest level of input that is significant to the fair value measurement.
The Company’s financial instruments consist of Level I and Level II assets. Level I securities include highly liquid money market funds and mutual funds. Level II instruments include deposits maintained with financial institutions and derivative instruments.
Net Loss per Share of Common Stock
The Company’s basic net loss per share of common stock is calculated by dividing the net loss attributable to common stockholders by the weighted-average number of shares of common stock outstanding for the period. The weighted-average number of shares of common stock used to calculate the Company’s basic net loss per share of common stock excludes those shares subject to repurchase as these shares are not deemed to be issued for accounting purposes until they vest. The diluted net loss per share of common stock is computed by giving effect to all potential common stock equivalents outstanding for the period determined using the treasury-stock method. For purposes of this calculation, stock options to purchase common stock, common stock subject to repurchase, and warrants to purchase common stock are considered to be common stock equivalents. Basic and diluted net loss per share of common stock was the same for each period presented as the inclusion of all potential common shares outstanding was anti-dilutive.
78
Table of Contents
Recent Accounting Pronouncements
In May 2014, the FASB issued ASU No. 2014-09, Revenue from Contracts with Customers, to clarify the principles used to recognize revenue for all entities. The new guidance is effective for annual and interim periods beginning after December 15, 2016 with no early adoption permitted and allows for both retrospective and prospective methods of adoption. The Company is currently evaluating the impact, if any, the adoption of this guidance will have on its financial position, results of operations or cash flows.
In June 2014, the FASB issued ASU No. 2014-12, Compensation—Stock Compensation, which provides guidance that a performance target that affects vesting of a share-based payment and that could be achieved after the requisite service period is a performance condition. As a result, the target is not reflected in the estimation of the award’s grant date fair value. Compensation cost for such an award would be recognized over the required service period, if it is probable that the performance condition will be achieved. The updated guidance is effective for annual reporting periods and interim periods within those annual periods beginning after December 15, 2015. Earlier adoption is permitted but the Company does not anticipate electing early adoption. The Company does not expect the adoption of this guidance to have a material impact on its consolidated financial statements.
In August 2014, the FASB issued ASU No. 2014-15, new guidance related to the disclosures around going concern. The new standard provides guidance around management’s responsibility to evaluate whether there is substantial doubt about an entity’s ability to continue as a going concern and to provide related footnote disclosures. The new standard is effective for fiscal years, and interim periods within those fiscal years, beginning after December 15, 2016. Early adoption is permitted. The adoption of this standard is not expected to have a material impact on the Company’s financial statements.
2. Incapsula
On November 5, 2009, the Company entered into a license agreement for Incapsula to use certain developed technology of the Company. In lieu of any other fee or royalty under the license agreement, Incapsula issued to the Company 5,000,000 shares of its Series A Convertible Preferred Stock representing a 58% ownership interest at the date of issuance. The transaction was accounted for as a business combination. No value was assigned to the license on the acquisition date as the use of the license will stay within the control of the Company. Therefore, the Company’s historical carrying value of the developed technology immediately prior to the acquisition was used to determine the value of the purchase consideration exchanged in the transaction. As Incapsula was a newly-formed entity with no net assets on the acquisition date and the value of the license was determined to be zero, no goodwill was recorded by the Company on the acquisition.
In March 2010, the Company entered into a Series A and Series A-1 Purchase Agreement whereby Incapsula issued 6,666,666 shares of its Series A Convertible Preferred Stock to the Company in exchange for cash consideration of $3.0 million. As a result of this transaction, the Company increased its ownership interest in Incapsula to 76% at the date of issuance. The purchase of the additional ownership interest in Incapsula was treated as an equity transaction. Under the terms of the Series A and Series A-1 Purchase Agreement, the Company entered into a forward contract with Incapsula to purchase 8,750,000 shares of Incapsula’s Series A-1 Convertible Preferred Stock in exchange for $7.0 million in cash consideration if certain milestones were achieved no later than September 2011. On the transaction date, no value was assigned to the forward contract as the option did not meet the definition of a derivative instrument as it did not contain a net settlement feature. Specifically, the forward contract could only be gross physically settled as Incapsula is a non-publicly traded company whose stock was not readily convertible to cash.
In addition, during 2010, the board of directors of Incapsula adopted the Incapsula 2010 Share Incentive Plan pursuant to which Incapsula may grant to its employees options to purchase shares of Incapsula’s common stock or restricted shares.
In July 2011, Incapsula achieved the respective performance milestones. As a result, the Company purchased 4,375,000 shares of Incapsula’s Series A-1 Preferred Stock for $3.5 million thereby increasing its ownership interest to 82%. In January 2012, the Company purchased the remaining 4,375,000 shares of Incapsula’s Series A-1 Preferred Stock for $3.5 million thereby increasing its ownership interest in Incapsula to 85%.
Under the terms of the agreements between the Company and Incapsula, the Company had the right, but not the obligation, to purchase the remaining ownership interest in Incapsula commencing on November 5, 2013 and ending on November 5, 2018 (the “Purchase Right”). Exercise of the Purchase Right was solely within the Company’s control and the price for the remaining ownership interest was to be based on an Incapsula enterprise valuation calculated as the greater of (i) eight times Incapsula’s prior 12 months trailing revenues or (ii) seven times the aggregate amount Incapsula had raised in connection with its Series A Convertible Preferred Stock financings. On the acquisition date, no value was assigned to this Purchase Right as the option does not meet the definition of a derivative instrument as it does not contain a net settlement feature. Specifically, the Purchase Right could only be gross physically settled as Incapsula was a non-publicly traded company whose stock was not readily convertible to cash.
79
Table of Contents
In March 2014, the Company acquired the remaining outstanding capital stock in exchange for approximately 124,088 shares of Company common stock with an aggregate fair value of $7.7 million, of which 34,485 shares are subject to a 15-month holdback pursuant to the acquisition agreement, and assumed outstanding options to acquire capital stock of Incapsula not already owned by Imperva (the “Incapsula Acquisition”) which are equivalent to 48,359 shares of Company common stock on an as-converted basis. The aggregate consideration for the Incapsula Acquisition is substantially on the same terms of the Purchase Right less the outstanding principal and interest under the Incapsula Loan. In addition, during 2013, the Company issued RSUs for approximately 264,878 shares of Imperva common stock with performance-based vesting tied to 2014 revenue for Incapsula and Incapsula-related products and services (effectively valuing such revenues similarly to the Purchase Right) less the outstanding principal and interest under the Incapsula Loan. At the same time, Incapsula issued similar RSUs for approximately 198,825 shares on an as-converted to Imperva common stock-basis, which the Company assumed in connection with the Incapsula Acquisition, in addition to the consideration for the Incapsula Purchase. These performance-based RSUs granted by Imperva and Incapsula were issued to continuing employees of Incapsula. Pursuant to the Purchase Right option discussed above, awards under the Incapsula 2010 Share Incentive Plan were assumed by the Company, substituted with Company stock options and all outstanding awards and the Incapsula 2010 Share Incentive Plan was terminate.
As of the date of the acquisition, the remaining non-controlling interest on the Company’s balance sheet of $2.8 million was reclassified to additional paid-in capital given the Company’s complete ownership of Incapsula.
3. Acquisitions
Acquisitions during 2014 were accounted for in accordance with Accounting Standards Codification (ASC) No. 805, Business Combinations, and the results of operations of each acquisition have been included in the Company’s consolidated results of operations from the respective date of the acquisition. Each of the acquisitions was not material, either individually or in the aggregate to the Company’s results of operations in the period of acquisition.
While management uses its best estimates and assumptions as part of the purchase price allocation process to value assets acquired and liabilities assumed at the business combination date, its estimates and assumptions are subject to refinement. As a result, during the preliminary purchase price allocation period, which may be up to one year from the business combination date, the Company may record adjustments to the assets acquired and liabilities assumed, with the corresponding offset to goodwill. The Company record adjustments to assets acquired or liabilities assumed subsequent to the purchase price allocation period in its operating results in the period in which the adjustments were determined.
The total purchase price allocated to the tangible assets acquired is assigned based on the fair values as of the date of the acquisition. The fair value assigned to identifiable intangible assets acquired is determined using the income approach which discounts expected future cash flows to present value using estimated assumptions determined by management. The Company believes that these identified intangible assets will have no residual value after their estimated economic useful lives. The identifiable intangible assets are subject to amortization on a straight-line basis as this best approximates the benefit period related to these assets.
The excess of the purchase price over the identified tangible and intangible assets, less liabilities assumed, is recorded as goodwill and primarily reflects the value of the synergies expected to be generated from combining the Company’s and the acquired entities’ technology and operations.
Acquisition of Skyfence Networks Ltd.
On February 7, 2014, the Company acquired Skyfence, a private company based and incorporated in Israel. Skyfence is a developer of a solution which allows real time visibility and control over corporate use of Software-as-a-Service (“SaaS”) applications, which enforces security policy, protects sensitive data from external and inside threats, as well as ensures compliance with standards.
Per the terms of the acquisition agreement (as amended) with Skyfence and its security holders, the Company purchased all of the outstanding shares of capital stock of Skyfence in exchange for (a) approximately $8.6 million in cash, in addition to a holdback payment commitment due 24 months from the date the acquisition closes valued at approximately $7.2 million, and (b) 884,422 shares of Company common stock, of which 532,262 shares are subject to forfeiture based upon
80
Table of Contents
time-based vesting and continuing employment, and were therefore excluded from purchase consideration as such amounts will be recorded as compensation expense over the term of the corresponding four-year service period. In addition, 29,871 of the shares are subject to a holdback period of up to 24 months from the date of acquisition. The Company also assumed stock options outstanding in accordance with the terms of the applicable Skyfence stock option plan and Skyfence stock option agreement relating to that Skyfence stock option. Based on Skyfence’s stock options outstanding at February 7, 2014, Imperva converted options to purchase 164,000 shares of Skyfence stock into options to purchase 24,248 shares of Imperva common stock.
The fair value of Imperva’s shares issued is based on Imperva’s closing price per share of $59.08 as reported on the New York Stock Exchange at the closing of the Acquisition on February 7, 2014.
The fair values of the stock option awards assumed were estimated using a Black-Scholes option-pricing model. The estimated fair values of unvested equity awards of $1.1 million will be recorded as operating expense over the remaining requisite service periods as they relate to post-combination services, while the fair values of vested equity based awards of $0.3 million were included in total purchase price as they relate to pre-combination services. The total purchase consideration is as follows (in thousands):
| Cash |
$ | 8,558 | ||
| Cash holdback liability |
7,157 | |||
| Fair value of common stock |
20,855 | |||
| Estimated fair value of equity awards assumed and replaced |
354 | |||
|
|
|
|||
| $ | 36,924 | |||
|
|
|
The acquisition of Skyfence was accounted for in accordance with the acquisition method of accounting for business combinations with Imperva as the accounting acquirer. The Company expensed the related acquisition costs in the amount of $0.9 million in general and administrative expenses. In addition, stock-based compensation expense totaling $7.3 million was recognized from the date of acquisition through December 31, 2014.
The excess of the consideration for Skyfence over the fair values assigned to the assets acquired and liabilities assumed represents the goodwill resulting from the acquisition. The Company’s management believes that the goodwill represents the synergies expected from combining the products and technologies of Imperva with those of Skyfence, which will enhance the Company’s overall product portfolio. The purchased technology will be amortized straight-line over a seven-year preliminary estimated useful life. Also as part of the acquisition, the Company assumed deferred tax liabilities related to the fair value of the developed technology the Company obtained in the acquisition. Goodwill recorded in connection with the acquisition is not deductible for income tax purposes. The total purchase price was allocated using the information available at the business combination date. The following table summarizes the allocation of the consideration to the fair value of the tangible and intangible assets acquired and liabilities assumed as of the acquisition date (in thousands):
| Net tangible assets |
$ | 1,014 | ||
| Existing technology |
7,965 | |||
| Deferred tax liability assumed |
(1,528 | ) | ||
| Goodwill |
29,473 | |||
|
|
|
|||
| Total purchase price |
$ | 36,924 | ||
|
|
|
The results of operations of Skyfence described above have been included in Imperva’s consolidated financial statements from the date of acquisition. The following table presents pro forma results of operations of the Company and Skyfence as if the companies had been combined as of January 1, 2013, and includes pro forma adjustments related to the amortization of acquired intangible assets and share-based compensation expense and the related income tax effects. Direct transaction costs are excluded from the December 31, 2014 pro forma condensed combined financial information presented below. The pro forma condensed combined financial information is presented for informational purposes only. The unaudited pro forma results of operations are not necessarily indicative of results that would have occurred had the acquisition taken place at the beginning of the earliest period presented, or of future results. Included in the pro forma results are fair value adjustments based on the fair values of assets acquired and liabilities assumed as of the acquisition date. Supplemental information on an unaudited pro forma basis, as if the Skyfence acquisition had been consummated on January 1, 2013 is presented as follows (in thousands):
81
Table of Contents
| Year Ended December | ||||||||
| 2014 | 2013 | |||||||
| Pro forma revenue |
$ | 164,010 | $ | 137,759 | ||||
| Pro forma loss from operations |
$ | (58,491 | ) | $ | (36,629 | ) | ||
| Pro forma net loss |
$ | (59,740 | ) | $ | (37,414 | ) | ||
Acquisition of Certain Assets and Liabilities of Tomium Software, LLC.
On January 30, 2014, the Company acquired certain assets and liabilities of Tomium, a private company based in Texas. Tomium is a provider of real-time mainframe security auditing agents. The purchase price of approximately $8.3 million includes approximately $4.6 million in cash and assumption of a liability to pay cash of $0.3 million, and also the issuance of 60,556 shares of Company common stock valued at approximately $3.4 million based upon the closing price of the Company’s stock on the acquisition date of $55.45 per share. Imperva acquired certain tangible assets and also assumed a facility lease of Tomium.
The following table summarizes the preliminary allocation of the consideration to the fair value of the tangible and intangible assets acquired and liabilities assumed as of the acquisition date based on information available at the business combination date (in thousands):
| Intangible assets |
$ | 2,704 | ||
| Goodwill |
5,499 | |||
|
|
|
|||
| Total intangible assets acquired |
8,203 | |||
| Other acquired tangible assets |
60 | |||
|
|
|
|||
| Fair value of assets acquired |
$ | 8,263 | ||
|
|
|
The total purchase price was allocated using the information available at the business combination date. Goodwill recorded in connection with the acquisition is deductible for U.S. income tax purposes.
The acquisition of Tomium was accounted for in accordance with the acquisition method of accounting for business combinations with Imperva as the accounting acquirer. The Company expensed the related acquisition costs, consisting primarily of legal costs in the amount of $0.3 million in general and administrative expenses. The Company’s management believes that the goodwill represents the synergies expected from combining the acquired technology and operations with those of Imperva. The intangible assets acquired by Imperva in conjunction with the acquisition of Tomium are being amortized straight-line over a ten-year estimated useful life.
The results of operations related to the Tomium assets and liabilities have been included in the Company’s consolidated statements of operations from the acquisition date. Pro forma results of operations have not been presented because the acquisition was not material to the Company’s results of operations.
82
Table of Contents
4. Cash, Cash Equivalents and Short-Term Investments
Cash, cash equivalents and short-term investments consist of the following (in thousands):
| As of December 31, 2014 | ||||||||||||||||
| Amortized Cost |
Gross Unrealized Gains |
Gross Unrealized Losses |
Fair Value |
|||||||||||||
| Cash and cash equivalents: |
||||||||||||||||
| Cash |
$ | 26,284 | $ | — | $ | — | $ | 26,284 | ||||||||
| Bank deposits |
11,877 | — | — | 11,877 | ||||||||||||
| Commercial paper |
18,341 | — | 2 | 18,339 | ||||||||||||
| Money market funds |
11,596 | — | — | 11,596 | ||||||||||||
|
|
|
|
|
|
|
|
|
|||||||||
| Total |
$ | 68,098 | $ | — | $ | 2 | $ | 68,096 | ||||||||
|
|
|
|
|
|
|
|
|
|||||||||
| Short-term investments: |
||||||||||||||||
| Corporate debt obligations |
$ | 31,404 | $ | 3 | $ | 53 | $ | 31,354 | ||||||||
| Bank deposits |
10,270 | — | — | 10,270 | ||||||||||||
|
|
|
|
|
|
|
|
|
|||||||||
| Total |
$ | 41,674 | $ | 3 | $ | 53 | $ | 41,624 | ||||||||
|
|
|
|
|
|
|
|
|
|||||||||
| As of December 31, 2013 | ||||||||||||||||
| Amortized Cost |
Gross Unrealized Gains |
Gross Unrealized Losses |
Fair Value |
|||||||||||||
| Cash and cash equivalents: |
||||||||||||||||
| Cash |
$ | 41,973 | $ | — | $ | — | $ | 41,973 | ||||||||
| Bank deposits |
10,165 | — | — | 10,165 | ||||||||||||
| Commercial paper |
21,948 | — | 1 | 21,947 | ||||||||||||
| Money market funds |
2,619 | — | — | 2,619 | ||||||||||||
|
|
|
|
|
|
|
|
|
|||||||||
| Total |
$ | 76,705 | $ | — | $ | 1 | $ | 76,704 | ||||||||
|
|
|
|
|
|
|
|
|
|||||||||
| Short-term investments: |
||||||||||||||||
| Corporate debt obligations |
$ | 28,220 | $ | 22 | $ | 14 | $ | 28,228 | ||||||||
| Bank deposits |
10,153 | — | — | 10,153 | ||||||||||||
|
|
|
|
|
|
|
|
|
|||||||||
| Total |
$ | 38,373 | $ | 22 | $ | 14 | $ | 38,381 | ||||||||
|
|
|
|
|
|
|
|
|
|||||||||
The following table sets forth the cost and estimated fair value of short-term investments based on stated effective maturities as of December 31, 2014 (in thousands):
| As of December 31, 2014 | ||||||||
| Estimated | ||||||||
| Amortized | Fair | |||||||
| Cost | Value | |||||||
| Short-term investments: |
||||||||
| Due within one year |
$ | 28,891 | $ | 28,888 | ||||
| Due within two years |
12,783 | 12,736 | ||||||
|
|
|
|
|
|||||
| Total |
$ | 41,674 | $ | 41,624 | ||||
|
|
|
|
|
|||||
The Company reviews its short-term investments on a regular basis to evaluate whether or not any security has experienced an other-than-temporary decline in fair value. The Company considers factors such as the length of time and extent to which the market value has been less than the cost, the financial condition and near-term prospects of the issuer and
83
Table of Contents
its intent to sell, or whether it is more likely than not the Company will be required to sell, the investment before recovery of the investment’s amortized cost basis. If the Company believes that an other-than-temporary decline exists in one of these securities, the Company writes down these investments to fair value. For debt securities, the portion of the write-down related to credit loss would be recorded to other income (expense), net, in the Company’s condensed consolidated statements of operations. Any portion not related to credit loss would be recorded to accumulated other comprehensive income (loss), which is reflected as a separate component of stockholders’ equity in the Company’s condensed consolidated balance sheets. During the years ended December 31, 2014 and 2013, the Company did not consider any of its investments to be other-than-temporarily impaired.
The following tables show the short-term investments in an unrealized loss position and the related gross unrealized losses and fair value and length of time that the short-term investments have been in a continuous unrealized loss position (in thousands):
| As of December 31, 2014 | ||||||||||||||||||||||||
| Less than 12 Months | 12 Months or Greater | Total | ||||||||||||||||||||||
| Fair Value | Unrealized Losses |
Fair Value | Unrealized Losses |
Fair Value | Unrealized Losses |
|||||||||||||||||||
| Corporate debt obligations |
$ | 12,735 | $ | 47 | $ | 12,088 | $ | 6 | $ | 24,823 | $ | 53 | ||||||||||||
| As of December 31, 2013 | ||||||||||||||||||||||||
| Less than 12 Months | 12 Months or Greater | Total | ||||||||||||||||||||||
| Fair Value | Unrealized Losses |
Fair Value | Unrealized Losses |
Fair Value | Unrealized Losses |
|||||||||||||||||||
| Corporate debt obligations |
$ | 8,394 | $ | 14 | $ | — | $ | — | $ | 8,394 | $ | 14 | ||||||||||||
84
Table of Contents
5. Fair Value of Financial Instruments
The Company evaluates assets and liabilities subject to fair value measurements on a recurring basis to determine the appropriate level in which to classify them for each reporting period. The following table sets forth the Company’s assets and liabilities that were measured at fair value as of December 31, 2014 and 2013, by level within the fair value hierarchy (in thousands):
| As of December 31, 2014 | ||||||||||||||||
| Level I | Level II | Level III | Fair Value | |||||||||||||
| Financial Assets: |
||||||||||||||||
| Cash equivalents: |
||||||||||||||||
| Bank deposits |
$ | — | $ | 11,877 | $ | — | $ | 11,877 | ||||||||
| Commercial paper |
— | 18,339 | — | 18,339 | ||||||||||||
| Money market funds |
11,596 | — | — | 11,596 | ||||||||||||
| Short-term investments: |
||||||||||||||||
| Corporate debt obligations |
— | 31,354 | — | 31,354 | ||||||||||||
| Bank deposits |
— | 10,270 | — | 10,270 | ||||||||||||
|
|
|
|
|
|
|
|
|
|||||||||
| Total financial assets |
$ | 11,596 | $ | 71,840 | $ | — | $ | 83,436 | ||||||||
|
|
|
|
|
|
|
|
|
|||||||||
| Financial Liability: |
||||||||||||||||
| Accrued and other current liabilities—Forward foreign exchange contracts |
$ | — | $ | 1,002 | $ | — | $ | 1,002 | ||||||||
|
|
|
|
|
|
|
|
|
|||||||||
| As of December 31, 2013 | ||||||||||||||||
| Level I | Level II | Level III | Fair Value | |||||||||||||
| Financial Assets: |
||||||||||||||||
| Cash equivalents: |
||||||||||||||||
| Commercial paper |
$ | — | $ | 21,947 | $ | — | $ | 21,947 | ||||||||
| Bank deposits |
— | 10,165 | — | 10,165 | ||||||||||||
| Money market funds |
2,619 | — | — | 2,619 | ||||||||||||
| Short-term investments: |
||||||||||||||||
| Corporate debt obligations |
— | 28,228 | — | 28,228 | ||||||||||||
| Bank deposits |
— | 10,153 | — | 10,153 | ||||||||||||
|
|
|
|
|
|
|
|
|
|||||||||
| Total financial assets |
$ | 2,619 | $ | 70,493 | $ | — | $ | 73,112 | ||||||||
|
|
|
|
|
|
|
|
|
|||||||||
In addition to the amounts disclosed in the above table, the fair value of the Company’s Israeli severance pay assets, which were comprised of Level II assets, was $4.0 million and $4.1 million as of December 31, 2014 and 2013, respectively.
The Company’s cash equivalents and short-term investments are classified within Level 1 or Level 2 of the fair value hierarchy because they are valued using quoted market prices, broker or dealer quotations, or alternative pricing sources with reasonable levels of price transparency. The types of instruments valued based on quoted market prices in active markets include mutual funds and money market securities. Such instruments are generally classified within Level 1 of the fair value hierarchy. The types of instruments valued based on quoted prices in less active markets, or other inputs that are observable or can be corroborated by observable market data for substantially the full term of the asset or liability, include U.S. agency securities, investment-grade corporate bonds, term deposits and commercial paper. Such instruments are generally classified within Level 2 of the fair value hierarchy. There was no transfer between Level 1, Level 2 and Level 3 during the years ended December 31, 2014 and 2013.
6. Derivative Instruments
The Company’s primary objective for holding derivative instruments is to reduce its exposure to foreign currency rate changes. The Company reduces its exposure by entering into forward foreign exchange contracts with respect to operating expenses that are forecast to be incurred in currencies other than U.S. dollars. Substantially all of the Company’s revenue and capital purchasing activities and a majority of its operating expenditures are transacted in U.S. dollars. However, certain operating expenditures are incurred in or exposed to other currencies, primarily the Israeli shekel and the Euro.
85
Table of Contents
The Company has established forecasted transaction currency risk management programs to protect against fluctuations in fair value and the volatility of future cash flows caused by changes in exchange rates. The Company’s currency risk management program includes forward foreign exchange contracts designated as cash flow hedges. These forward foreign exchange contracts generally mature within 12 months. The Company does not enter into derivative financial instruments for trading purposes.
Derivative instruments measured at fair value and their classification on the consolidated balance sheets are presented in the following tables (in thousands):
| Liability as of December 31, | ||||||||||||||||
| 2014 | 2013 | |||||||||||||||
| Notional Amount |
Fair Value | Notional Amount |
Fair Value | |||||||||||||
| Foreign exchange forward contract derivatives in cash flow hedging relationships - included in accrued and other current liabilities |
$ | 25,990 | $ | (1,002 | ) | $ | — | $ | — | |||||||
Gains (losses) on derivative instruments accounted for as hedges and their classification on the consolidated statement of operations, are presented in the following tables (in thousands):
| Years Ended December 31, | ||||||||||||
| 2014 | 2013 | 2012 | ||||||||||
| Foreign Exchange Forward Contract Derivatives in cash flow hedging relationships: |
||||||||||||
| Gains recognized in OCI (a) |
$ | 191 | $ | 730 | $ | 1,304 | ||||||
| Losses recognized in OCI (a) |
$ | (1,846 | ) | $ | (18 | ) | $ | (225 | ) | |||
| Gains recognized from accumulated OCI into net loss (b) |
$ | 55 | $ | 1,829 | $ | — | ||||||
| Losses recognized from accumulated OCI into net loss (b) |
$ | (708 | ) | $ | — | $ | (598 | ) | ||||
| Losses recognized in net loss (c) |
$ | — | $ | — | $ | (5 | ) | |||||
| Foreign Exchange Forward Contract Derivatives not designated as hedging relationships: |
||||||||||||
| Gains recognized in net loss (d) |
$ | — | $ | 71 | $ | 181 | ||||||
| Losses recognized in net loss (d) |
$ | — | $ | (60 | ) | $ | (121 | ) | ||||
| (a) | Net change in the fair value of the effective portion classified in other comprehensive income (loss) (“OCI”). |
| (b) | Effective portion of cash flow hedges reclassified from accumulated other income (loss), into net loss, of which $(72), $117 and $(45) were recognized within cost of sales for the years ended December 31, 2014, 2013 and 2012, respectively, and $(581), $1,712, and $(553) were recognized within operating expenses for the year ended December 31, 2014, 2013 and 2012, respectively. All amounts are reflected with the respective consolidated statement of operations. |
| (c) | Ineffective portion and amount excluded from effectiveness testing classified in other income (expense), net. |
| (d) | Classified in other income (expense), net. |
86
Table of Contents
7. Consolidated Balance Sheet Components
Allowance for Doubtful Accounts
The allowance for doubtful accounts is comprised of the following activity (in thousands):
| Years Ended December 31, | ||||||||||||
| 2014 | 2013 | 2012 | ||||||||||
| Allowance for doubtful accounts, beginning balance |
$ | 410 | $ | 412 | $ | 225 | ||||||
| Charged to costs and expenses |
418 | 46 | 269 | |||||||||
| Deductions (write-offs) |
(613 | ) | (48 | ) | (82 | ) | ||||||
|
|
|
|
|
|
|
|||||||
| Allowance for doubtful accounts, ending balance |
$ | 215 | $ | 410 | $ | 412 | ||||||
|
|
|
|
|
|
|
|||||||
Prepaid Expenses and Other Current Assets
Prepaid expenses and other current assets consist of the following (in thousands):
| As of December 31, | ||||||||
| 2014 | 2013 | |||||||
| Prepaid expenses |
$ | 3,263 | $ | 2,632 | ||||
| Prepaid income taxes |
45 | 786 | ||||||
| Interest receivable |
230 | 268 | ||||||
| Other |
389 | 286 | ||||||
|
|
|
|
|
|||||
| Total prepaid expenses and other current assets |
$ | 3,927 | $ | 3,972 | ||||
|
|
|
|
|
|||||
Property and Equipment, net
Property and equipment, net consist of the following (in thousands):
| As of December 31, | ||||||||
| 2014 | 2013 | |||||||
| Computers and related equipment |
$ | 11,591 | $ | 8,989 | ||||
| Office furniture and equipment |
1,510 | 1,403 | ||||||
| Leasehold improvements |
3,751 | 2,773 | ||||||
|
|
|
|
|
|||||
| Total property and equipment |
16,852 | 13,165 | ||||||
| Less: accumulated depreciation and amortization |
(9,234 | ) | (7,690 | ) | ||||
|
|
|
|
|
|||||
| Total property and equipment, net |
$ | 7,618 | $ | 5,475 | ||||
|
|
|
|
|
|||||
Depreciation and amortization expense totaled $3.6 million, $2.6 million and $1.8 million, for the years ended December 31, 2014, 2013 and 2012, respectively.
Accrued Compensation and Benefits
Accrued compensation and benefits consist of the following (in thousands):
| As of December 31, | ||||||||
| 2014 | 2013 | |||||||
| Salary and related benefits |
$ | 5,291 | $ | 4,399 | ||||
| Accrued vacation |
3,849 | 4,122 | ||||||
| Accrued incentive payments |
6,609 | 4,409 | ||||||
|
|
|
|
|
|||||
| Total accrued compensation and benefits |
$ | 15,749 | $ | 12,930 | ||||
|
|
|
|
|
|||||
87
Table of Contents
Accrued and Other Current Liabilities
Accrued and other current liabilities consist of the following (in thousands):
| As of December 31, | ||||||||
| 2014 | 2013 | |||||||
| Accrued expenses |
$ | 3,352 | $ | 2,295 | ||||
| Derivative liability |
1,002 | — | ||||||
| Income tax payable |
317 | 325 | ||||||
| Short-term deferred rent |
297 | 226 | ||||||
| Short-term stock repurchase liability |
767 | 521 | ||||||
| Other |
641 | 594 | ||||||
|
|
|
|
|
|||||
| Total accrued and other current liabilities |
$ | 6,376 | $ | 3,961 | ||||
|
|
|
|
|
|||||
Other Liabilities
Other long-term liabilities consist of the following (in thousands):
| As of December 31, | ||||||||
| 2014 | 2013 | |||||||
| Skyfence holdback liability |
$ | 7,343 | $ | — | ||||
| Stock repurchase liability |
— | 857 | ||||||
| Long-term deferred rent |
841 | 725 | ||||||
| Deferred tax liability |
1,503 | 34 | ||||||
| Other |
721 | 377 | ||||||
|
|
|
|
|
|||||
| Total other liabilities |
$ | 10,408 | $ | 1,993 | ||||
|
|
|
|
|
|||||
8. Goodwill and Acquired Intangible Assets
During 2014, the Company completed two acquisitions of which $35.0 million was allocated to goodwill and $10.7 million to acquired intangible assets. The Company’s gross carrying amount of goodwill was $35.0 million as of December 31, 2014 and there was no goodwill as of December 31, 2013. The Company did not have any goodwill impairments during 2014, 2013 or 2012. Acquired technology intangible assets subject to amortization as of December 31, 2014 were as follows (in thousands):
| Accumulated | ||||||||||||
| Cost | Amortization | Net | ||||||||||
| Acquired Technology |
$ | 10,668 | $ | (1,269 | ) | $ | 9,399 | |||||
|
|
|
|
|
|
|
|||||||
Amortization expense related to acquired intangible assets was $1.3 million for the year ended December 31, 2014. Acquired intangible assets are amortized over their estimated useful lives of seven to 10 years. There were no acquired intangible assets prior to January 1, 2014. As of December 31, 2014, the Company expects amortization expense in future periods to be as follows (in thousands):
| Acquired | ||||
| Fiscal Year |
Technology | |||
| 2015 |
$ | 1,408 | ||
| 2016 |
1,408 | |||
| 2017 |
1,408 | |||
| 2018 |
1,408 | |||
| 2019 |
1,408 | |||
| Thereafter |
2,359 | |||
|
|
|
|||
| Total expected amortization expense |
$ | 9,399 | ||
|
|
|
|||
88
Table of Contents
9. Other Income (Expense), net
Other income (expense), net is comprised of the following (in thousands):
| Years Ended December 31, | ||||||||||||
| 2014 | 2013 | 2012 | ||||||||||
| Other Income: |
||||||||||||
| Interest income |
$ | 163 | $ | 386 | $ | 460 | ||||||
| Foreign currency forward contract gains, net |
— | 12 | — | |||||||||
| Foreign currency exchange gains, net |
8 | — | — | |||||||||
|
|
|
|
|
|
|
|||||||
| Total other income |
171 | 398 | 460 | |||||||||
| Other Expense: |
||||||||||||
| Skyfence holdback liability accretion |
(186 | ) | — | — | ||||||||
| Foreign currency forward contract losses, net |
— | — | (19 | ) | ||||||||
| Foreign currency exchange losses, net |
— | (373 | ) | (497 | ) | |||||||
| Other |
(205 | ) | (150 | ) | (187 | ) | ||||||
|
|
|
|
|
|
|
|||||||
| Total other expense |
(391 | ) | (523 | ) | (703 | ) | ||||||
|
|
|
|
|
|
|
|||||||
| Total other income (expense), net |
$ | (220 | ) | $ | (125 | ) | $ | (243 | ) | |||
|
|
|
|
|
|
|
|||||||
10. Revolving Credit Facility
In September 2010, the Company entered into a revolving credit facility with a financial institution. The agreement, as amended, provides for maximum borrowing capacity of up to $6.0 million as of December 31, 2014. As of December 31, 2014 and 2013, there was no balance outstanding on the credit facility.
The credit facility expires on May 1, 2015, is secured by the assets of the Company, and contains a restrictive covenant that requires the Company to maintain a minimum cash and cash equivalents balance of $3.0 million. The terms of this agreement requires payment of an unused line fee of 0.25% per quarter of the unused portion and bears interest at LIBOR plus 2.75%. As of December 31, 2014, the Company was compliant with the amended covenant of the credit facility.
89
Table of Contents
11. Commitments and Contingencies
(a) Operating Leases
The Company rents its facilities under operating leases with lease periods expiring from 2015 through 2022. Future minimum payments under these facility operating leases are as follows as of December 31, 2014 (in thousands):
| Operating Leases |
Estimated Sublease Income |
|||||||
| Year Ending December 31: |
||||||||
| 2015 |
$ | 4,811 | $ | 567 | ||||
| 2016 |
5,409 | 128 | ||||||
| 2017 |
5,117 | — | ||||||
| 2018 |
3,277 | — | ||||||
| 2019 |
420 | — | ||||||
| Thereafter |
255 | — | ||||||
|
|
|
|
|
|||||
| Total |
$ | 19,289 | $ | 695 | ||||
|
|
|
|
|
|||||
Rent expense for the Company’s operating leases is recognized on a straight-line basis over the lease term. Rent expense for the years ended December 31, 2014, 2013 and 2012 was $3.9 million, $3.3 million, and $2.1 million, respectively.
In connection with leases for office space, the Company received tenant improvement allowances of $336,000 and $639,000 during the years ended December 31, 2012 and 2010, respectively, from the lessor for certain improvements made to the leased property. The Company has recorded the tenant improvement allowances as a leasehold improvement within property and equipment, net and as deferred rent within other liabilities on the consolidated balance sheets. The deferred rent liability is amortized to rent expense over the term of the lease on a straight-line basis. The leasehold improvements are being amortized to expense over the period from when the improvements were placed into service until the end of their useful life, which is the end of the respective lease term.
In addition, certain of the Company’s operating lease agreements for office space also include rent holidays and scheduled rent escalations during the initial lease term. The Company has recorded the rent holidays as a deferred rent within other liabilities on the consolidated balance sheets. The Company recognizes the deferred rent liability and scheduled rent increase on a straight-line basis into rent expense over the lease term commencing on the date the Company takes possession of the lease space.
As of December 31, 2014 and 2013 the Company has $1.7 million and $1.3 million, respectively, in restricted deposits to secure bank guarantees provided to the lessor.
(b) Cancelable Lease Agreement
The Company leases motor vehicles under a cancelable operating lease agreement. The Company has an option to cancel the lease agreement, which may result in penalties in a maximum amount of $71,000 as of December 31, 2014. Motor vehicle lease expenses for the years ended December 31, 2014, 2013 and 2012 were $2.6 million, $2.4 million and $2.2 million, respectively.
(c) Purchase Commitments
As of both December 31, 2014 and 2013, the Company had purchase commitments of $4.8 million and $3.2 million, respectively, to purchase inventory, trial units, and research and development equipment from its vendors. The purchase commitments result from the Company’s contractual obligation to order or build inventory in advance of anticipated sales. According to the Company’s agreements with its vendors, the Company committed to purchase inventory within six months from the date the inventory arrived at the vendor’s warehouse.
(d) Litigation
From time to time, the Company may be subject to other legal proceedings and claims in the ordinary course of business.
90
Table of Contents
On April 11, 2014, a purported shareholder class action lawsuit was filed in the United States District Court for the Northern District of California against the Company and certain of its officers. On August 7, 2014, the Court entered an order appointing lead plaintiff and counsel for the purported class. The lead plaintiff filed an amended complaint on October 10, 2014. The lawsuit again names the Company and certain of its officers and purports to bring suit on behalf of those investors who purchased the Company’s publicly traded securities between May 2, 2013 and April 9, 2014. The plaintiff alleges that defendants made false and misleading statements about the Company’s operations and business and financial results and purports to assert claims for violations of the federal securities laws. The amended complaint seeks unspecified compensatory damages, interest thereon, costs incurred in the action and equitable/injunctive or other relief. On January 6, 2015, defendants filed a motion to dismiss the amended complaint.
On June 27, 2014, a purported shareholder derivative lawsuit was filed in the Court of Chancery for the State of Delaware against the Company (as a nominal defendant), and naming certain of the Company’s officers and directors as individual defendants. The lawsuit relates to the acquisition of Skyfence Networks, Ltd. and the complaint asserts claims for breach of fiduciary duty and unjust enrichment, and seeks to recover unspecified compensatory damages allegedly sustained by the Company, corporate reforms, the recovery of plaintiffs’ attorney’s fees and other relief. On September 23, 2014, the Company and the individual defendants moved to dismiss the action. Plaintiffs filed an amended complaint on November 6, 2014. Defendants filed a motion to dismiss the amended complaint on January 14, 2015.
In addition, the Company has received, and may in the future continue to receive, claims from third parties asserting, among other things, infringement of their intellectual property rights. Future litigation may be necessary to defend the Company, its channel partners and its customers by determining the scope, enforceability and validity of third-party proprietary rights or to establish its proprietary rights.
In the opinion of management, liabilities associated with these claims, while possible, are not probable at this time, and therefore we have not recorded any accrual for them as of December 31, 2014 and 2013. Further, any possible range of loss cannot be reasonably estimated at this time. The ultimate outcome of any litigation is uncertain and, regardless of outcome, litigation can have an adverse impact on us because of defense costs, potential negative publicity, diversion of management resources and other factors. Accordingly, there can be no assurance that existing or future legal proceedings arising in the ordinary course of business or otherwise will not have a material adverse effect on the Company’s business, consolidated financial position, results of operations or cash flows.
(e) Indemnification
Under the indemnification provisions of its standard sales contracts, the Company agrees to defend its channel partners and end customers against third-party claims asserting infringement of certain intellectual property rights, which may include patents, copyrights, trademarks, or trade secrets, and to pay judgments and settlements entered on such claims. The Company’s exposure under these indemnifications provisions is generally limited to the total amount paid under the agreement. However, certain agreements included indemnification provisions that could potentially expose the Company to losses in excess of the amount received under the agreement. To date, there have been no claims under such indemnification provisions. Accordingly, the Company has not recorded a liability on its consolidated balance sheets for these indemnification provisions.
In addition to the foregoing, the Company maintains director and officer insurance, which may cover certain liabilities arising from its obligation to indemnify its directors and officers.
91
Table of Contents
12. Capital Stock
Common Stock Reserved for Issuance
The Company had reserved shares of common stock, on an as if converted basis, for issuance as follows:
| As of December 31, | ||||||||
| 2014 | 2013 | |||||||
| Issuance in connection with outstanding stock options |
2,244,363 | 1,675,506 | ||||||
| Issuance in connection with restricted stock units outstanding |
2,279,081 | 1,044,651 | ||||||
| Reserved for future stock option and restricted stock unit grants |
1,166,742 | 1,847,752 | ||||||
| Reserved for future issuance under the employee stock purchase plan |
895,268 | 831,271 | ||||||
|
|
|
|
|
|||||
| 6,585,454 | 5,399,180 | |||||||
|
|
|
|
|
|||||
Preferred Stock
Our board of directors is authorized, subject to any limitations prescribed by law, without stockholder approval, to issue from time to time up to an aggregate of 5,000,000 shares of preferred stock, in one or more series, each series to have such rights and preferences, including voting rights, dividend rights, conversion rights, redemption privileges and liquidation preferences as the Company’s board of directors determines. The rights of the holders of common stock will be subject to, and may be adversely affected by, the rights of holders of any preferred stock that may be issued in the future. The Company currently has no shares of preferred stock outstanding and the Company has no present plans to issue any shares of preferred stock.
Stock Plans
(a) 2003 Stock Plan
During 2003, the Board of Directors adopted the 2003 Stock Plan (the “2003 Plan”), which allows for the granting of both incentive stock options and non-qualified stock options and the direct award or sale of shares of the Company’s common stock (including restricted common stock) to officers, employees, directors, consultants and other key persons. Incentive stock options may be granted to employees with exercise prices of no less than the fair value of the common stock on the grant date, and non-qualified options may be granted to employees, directors, or consultants at exercise prices of no less than 85% of the fair value of the common stock on the grant date, as determined by the Board of Directors. If, at the time the Company grants an option, the optionee directly or by attribution owns stock possessing more than 10% of the total combined voting power of all classes of stock of the Company, the option price shall be at least 110% of the fair value. Options granted under the Plan generally expire no later than ten years and in general vest four years from the date of grant.
(b) 2011 Stock Option and Incentive Plan
In September 2011, the Board of Directors adopted the 2011 Stock Option and Incentive Plan (the “2011 Plan”) which was subsequently approved by the Company’s stockholders. The 2011 Plan replaces the 2003 Plan as the Board has decided not to grant any additional awards under that plan. The Company has reserved a total of 1,000,000 shares of common stock for issuance under the 2011 Plan. In addition, any reserved but unissued shares under the 2003 Stock Plan will be added to the number of shares reserved for issuance under the 2011 Plan. The 2011 Plan also provides that the number of shares reserved and available for issuance under the plan will automatically increase each January 1, beginning in 2012 and ending in 2015, by 4% of the outstanding number of shares of common stock on the immediately preceding December 31. The Board of Directors or compensation committee may reduce the amount of the increase in any particular year. On January 1, 2015, the share reserve under the 2011 Plan was automatically increased by 1,075,819 shares. As of December 31, 2014, there were 1,166,742 shares available for grant under the 2011 Plan.
The 2011 Plan permits the granting of incentive stock options, non-qualified stock options, RSUs, stock appreciation rights, restricted shares of common stock and performance share awards. The exercise price of stock options may not be less than the 100% of the fair market value of the common stock on the date of grant. Options granted pursuant to the 2011 Plan generally expire no later than ten years. The Company began granting RSUs in February 2012, which generally vest either over a four-year period with 25% vesting at the end of one year and the remainder vesting quarterly thereafter or they
92
Table of Contents
completely vest at the end of a three-year period. Additionally, in conjunction with the Incapsula Acquisition, the Company granted performance-based RSUs to an employee of Incapsula for approximately 264,878 shares of Company common stock (Refer to Note 2).
(c) 2011 Employee Stock Purchase Plan
In September 2011, the Board of Directors adopted the 2011 Employee Stock Purchase Plan (the “ESPP”) which was subsequently approved by the Company’s stockholders. The ESPP took effect on the effective date of the registration statement for the Company’s IPO. The ESPP permits eligible employees to acquire shares of the Company’s common stock by accumulating funds through periodic payroll deductions of up to 15% of base salary. Each offering period may run for no more than 24 months and consist of no more than five purchase periods. The purchase price for shares of the Company’s common stock purchased under the ESPP will be 85% of the lesser of the fair market value of the Company’s common stock on the first day of the offering period or the last trading day of the applicable purchase period within that offering period.
The Company has initially reserved a total of 500,000 shares of common stock for future issuance under the ESPP. The number of shares reserved for issuance under the ESPP will increase automatically on January 1 of each of the first eight years commencing in 2012 by the number of shares equal to 1% of the Company’s total outstanding shares as of the immediately preceding December 31. The Board of Directors or compensation committee may reduce the amount of the increase in any particular year. No more than 20,000,000 shares of common stock may be issued under the ESPP and no other shares may be added to the ESPP without the approval of the Company’s stockholders. On January 1, 2015, the share reserve under the 2011 Employee Stock Purchase Plan was automatically increased by 268,955 shares.
(d) Inducement Stock Option Plan and Agreement and Inducement Restricted Stock Unit Plan and Agreement
In August 2014, the Board of Directors adopted the Inducement Stock Option Plan and Agreement (the “Inducement Option Plan”) and the Inducement Restricted Stock Unit Plan and Agreement (the “Inducement RSU Plan”) which were both created in connection with the appointment of the Company’s new Chief Executive Officer. In accordance with the terms of the Inducement Option Plan, the Company can issue an option to purchase up to 265,000 shares of the Company’s common stock at an exercise price equal to the fair market value of a share of the Company’s common stock on the date of grant of the option. The option, which will have a ten-year term, will vest at the rate of 25% of the shares on the first anniversary of the vesting commencement date with an additional 6.25% of the shares subject to the option vesting each quarter thereafter so long as the participant has not been terminated. In accordance with the terms of the Inducement RSU Plan, the Company can issue RSUs representing a total of 265,000 shares of the Company’s common stock (the RSUs”). The RSUs, which will expire following settlement, will vest at the rate of 25% of the shares on the first anniversary of the vesting commencement date with an additional 6.25% of the shares subject to the RSU vesting each quarter thereafter so long as participant has not been terminated.
(e) Incapsula 2010 Share Incentive Plan
In March 2010, Incapsula’s board of directors adopted the Incapsula 2010 Share Incentive Plan (the “Incapsula Plan”), pursuant to which Incapsula may grant to its employees and service providers options to purchase shares of its common stock, restricted shares, or RSUs. The total number of shares of common stock that may be granted under the Incapsula Plan shall not exceed 4,733,333 in the aggregate, subject to certain adjustments.
In November 2013, the board of directors of Incapsula approved the grant of RSUs for 7,095,461 shares of Incapsula’s common stock (“Incapsula RSUs”). As part of the Incapsula Acquisition, the Incapsula RSUs were assumed and replaced by RSUs for Company Common Stock issued to continuing employees of Incapsula . The Incapsula RSU’s vest according to performance-based vesting terms tied to 2014 revenue for Incapsula and Incapsula-related products and services, which were converted into approximately 198,825 shares of Company Common Stock at the same exchange ratio applicable to the Incapsula Acquisition. In addition to performance conditions, the awards are dependent on future market price of Imperva’s common stock, which is deemed a market condition under ASC 718.
93
Table of Contents
The following table summarizes option activity under the Incapsula Plan and related:
| Shares Available for Grant |
Number of Performance- based Restricted Stock Units Outstanding |
Number of Stock Options Outstanding |
Weighted Average Exercise Price of Stock Options Outstanding |
|||||||||||||
| Outstanding—December 31, 2011 |
2,921,833 | — | 1,774,000 | $ | 0.08 | |||||||||||
| Granted |
(232,500 | ) | — | 232,500 | $ | 0.25 | ||||||||||
| Exercised |
— | — | (105,625 | ) | $ | 0.15 | ||||||||||
| Forfeited |
64,375 | — | (64,375 | ) | $ | 0.18 | ||||||||||
|
|
|
|
|
|
|
|||||||||||
| Outstanding—December 31, 2012 |
2,753,708 | — | 1,836,500 | $ | 0.10 | |||||||||||
| Additional shares authorized |
5,529,878 | — | — | $ | — | |||||||||||
| Granted, performance RSUs |
(7,095,461 | ) | 7,095,461 | — | $ | — | ||||||||||
| Granted, stock options |
(1,240,000 | ) | — | 1,240,000 | $ | 0.58 | ||||||||||
| Exercised/Released |
— | — | (1,128,438 | ) | $ | 0.02 | ||||||||||
| Forfeited |
141,562 | — | (141,562 | ) | $ | 0.22 | ||||||||||
|
|
|
|
|
|
|
|||||||||||
| Outstanding—December 31, 2013 |
89,687 | 7,095,461 | 1,806,500 | $ | 0.47 | |||||||||||
| Granted |
(95,000 | ) | — | 95,000 | $ | 1.25 | ||||||||||
| Forfeited |
15,213 | (12,713 | ) | (2,500 | ) | $ | 1.25 | |||||||||
| Transferred to Imperva 2011 stock option plan |
(9,900 | ) | (7,082,748 | ) | (1,899,000 | ) | $ | 0.16 | ||||||||
|
|
|
|
|
|
|
|||||||||||
| Outstanding—December 31, 2014 |
— | — | — | $ | — | |||||||||||
|
|
|
|
|
|
|
|||||||||||
94
Table of Contents
The options outstanding and performance restricted share units under the Incapsula 2010 Share Incentive Plan were assumed as part of the Incapsula Acquisition and are equivalent to 247,184 shares of Company common stock on an as-converted basis. The Company does not intend to grant any additional shares under the Incapsula 2010 Share Incentive Plan.
The following table summarizes option activity under the Plans and related information:
| Options Outstanding | Weighted- Average Remaining Contractual Term (in years) |
Aggregate Intrinsic Value (in thousands) (1) |
||||||||||||||
| Number of Shares |
Weighted Average Exercise Price |
|||||||||||||||
| Outstanding—December 31, 2011 |
2,871,005 | $ | 4.15 | 7.86 | $ | 88,012 | ||||||||||
| Granted |
698,240 | $ | 31.80 | |||||||||||||
| Exercised or released |
(1,272,941 | ) | $ | 2.41 | ||||||||||||
| Cancelled or forfeited |
(307,067 | ) | $ | 9.98 | ||||||||||||
|
|
|
|||||||||||||||
| Outstanding—December 31, 2012 |
1,989,237 | $ | 14.08 | 8.09 | $ | 35,513 | ||||||||||
| Granted |
631,775 | $ | 36.55 | |||||||||||||
| Exercised or released |
(687,719 | ) | $ | 6.94 | ||||||||||||
| Cancelled or forfeited |
(257,787 | ) | $ | 25.11 | ||||||||||||
|
|
|
|||||||||||||||
| Balances—December 31, 2013 |
1,675,506 | $ | 23.78 | 8.01 | $ | 40,813 | ||||||||||
| Granted |
1,256,559 | $ | 41.39 | |||||||||||||
| Options assumed in acquisitions |
72,607 | $ | 13.30 | |||||||||||||
| Exercised or released |
(496,297 | ) | $ | 14.85 | ||||||||||||
| Cancelled or forfeited |
(264,012 | ) | $ | 35.85 | ||||||||||||
|
|
|
|||||||||||||||
| Balances—December 31, 2014 |
2,244,363 | $ | 33.83 | 8.27 | $ | 38,457 | ||||||||||
|
|
|
|
|
|
|
|
|
|||||||||
| Vested and expected to vest— December 31, 2014 |
2,006,285 | $ | 33.07 | 8.20 | $ | 35,688 | ||||||||||
|
|
|
|
|
|
|
|
|
|||||||||
| Exercisable—December 31, 2014 |
590,308 | $ | 21.66 | 6.56 | $ | 16,425 | ||||||||||
|
|
|
|
|
|
|
|
|
|||||||||
| (1) | The aggregate intrinsic value is calculated as the difference between the exercise price of the underlying awards and the closing stock price of $49.43 of the Company’s common stock on December 31, 2014 |
Additional information regarding the Company’s stock options outstanding and exercisable as of December 31, 2014 is summarized below:
| Options Outstanding | Options Exercisable | |||||||||||||||||||
| Exercise Prices |
Number of Stock Options Outstanding |
Weighted Average Remaining Contractual Life (Years) |
Weighted Average Exercise Price per Share |
Shares Subject to Stock Options |
Weighted Average Exercise Price per Share |
|||||||||||||||
| $0.02 to $10.70 |
300,189 | 5.48 | $ | 5.35 | 248,116 | $ | 5.06 | |||||||||||||
| $10.71 to $29.10 |
398,274 | 8.54 | $ | 24.96 | 72,112 | $ | 26.78 | |||||||||||||
| $29.11 to $32.54 |
332,275 | 9.37 | $ | 29.58 | 15,128 | $ | 31.43 | |||||||||||||
| $32.55 to $34.55 |
453,985 | 8.03 | $ | 33.80 | 174,008 | $ | 33.77 | |||||||||||||
| $34.56 to $54.48 |
258,030 | 8.44 | $ | 43.12 | 78,060 | $ | 39.42 | |||||||||||||
| $54.49 to $65.00 |
501,610 | 9.10 | $ | 55.99 | 2,884 | $ | 60.06 | |||||||||||||
|
|
|
|
|
|||||||||||||||||
| 2,244,363 | 8.27 | $ | 33.83 | 590,308 | $ | 21.66 | ||||||||||||||
|
|
|
|
|
|||||||||||||||||
(f) RSU Activity
95
Table of Contents
A summary of RSU activity for the year ended December 31, 2014, is as follows:
| Number of Restricted Stock Units Outstanding |
Weighted- Average Grant Date Fair Value |
|||||||
| Unvested—December 31, 2012 |
446,915 | $ | 31 | |||||
| Granted |
577,528 | $ | 36.94 | |||||
| Granted, performance RSUs |
264,878 | $ | 20.76 | |||||
| Released |
(149,531 | ) | $ | 30.64 | ||||
| Cancelled or expired |
(95,139 | ) | $ | 34.30 | ||||
|
|
|
|||||||
| Unvested—December 31, 2013 |
1,044,651 | $ | 31.64 | |||||
| Granted |
1,368,761 | $ | 41.66 | |||||
| Granted, performance RSUs |
131,143 | $ | 31.42 | |||||
| PRSUs assumed in acquisitions |
198,825 | $ | 61.14 | |||||
| Released |
(238,446 | ) | $ | 34.84 | ||||
| Cancelled or expired |
(225,853 | ) | $ | 39.83 | ||||
|
|
|
|||||||
| Unvested—December 31, 2014 |
2,279,081 | $ | 39.07 | |||||
|
|
|
|||||||
(g) Stock-Based Compensation Expense
The Company recognized stock-based compensation expense under the 2011 Stock Option and Incentive Plan, 2003 Stock Plan, Inducement Plans, 2011 Employee Stock Purchase Plan, and the Incapsula 2010 Share Incentive Plan in the consolidated statements of operations as follows (in thousands):
| Years Ended December 31, | ||||||||||||
| 2014 | 2013 | 2012 | ||||||||||
| Cost of revenue |
$ | 2,058 | $ | 1,440 | $ | 469 | ||||||
| Research and development |
8,799 | 3,660 | 1,227 | |||||||||
| Sales and marketing |
13,558 | 8,537 | 2,543 | |||||||||
| General and administrative |
12,858 | 8,857 | 1,729 | |||||||||
|
|
|
|
|
|
|
|||||||
| Total stock-based compensation expense |
$ | 37,273 | $ | 22,494 | $ | 5,968 | ||||||
|
|
|
|
|
|
|
|||||||
(h) Determining the Fair Value of RSUs, Performance RSUs, Stock Options, and ESPP
The fair value of RSUs is determined using the closing price of the Company’s stock on the date of grant. Compensation is recognized on a straight-line basis over the requisite service period of each grant adjusted for estimated forfeitures.
The fair value of RSUs granted to Incapsula employees which have multiple performance conditions and a market condition is determined by the Company using a Monte Carlo simulation model. The key inputs used were the Company’s stock price on the date of grant, the expected volatility, the risk free interest rate and a revenue forecast. The Company updates the estimated expense, net of forfeitures, at the end of each reporting period. The expense is recognized on an accelerated basis over the requisite service period, which is generally the vesting period of the respective awards.
The fair value of each stock option and ESPP grant to employees was determined by the Company and its board of directors using the Black-Scholes option-pricing model and assumptions discussed below. Each of these inputs is subjective and generally requires significant judgment to determine.
Expected Term—The expected term represents the period that the Company’s stock-based awards are expected to be outstanding. For option grants that are considered to be “plain vanilla,” the Company used the simplified method to determine the expected term as provided by the Securities and Exchange Commission. The simplified method is calculated as the average of the time-to-vesting and the contractual life of the options. For option grants that are not considered “plain vanilla”, the expected term is derived from historical data on employee exercises and post-vesting employment termination behavior taking into account the contractual life of the award. For ESPP grants, the expected term is based on the length of the offering period, which is six months.
96
Table of Contents
Expected Volatility—The expected volatility was based on the average historical stock volatilities of several of the Company’s publicly listed peers over a period equal to the expected terms of the stock option grants and the offering period for employee stock purchase plan grants as the Company did not have a sufficient trading history to use the volatility of its own common stock.
Risk-Free Interest Rate—The risk-free interest rate is based on the U.S. Treasury yield curve in effect at the time of grant for zero coupon U.S. Treasury notes with maturities approximately equal to the grant’s expected term.
Expected Dividend—The Company has never paid dividends and does not expect to pay dividends.
Forfeiture Rate—The Company estimates its forfeiture rate based on an analysis of its actual forfeitures and will continue to evaluate the adequacy of the forfeiture rate based on actual forfeiture experience, analysis of employee turnover behavior, and other factors. The impact from a forfeiture rate adjustment will be recognized in full in the period of adjustment, and if the actual number of future forfeitures differs from that estimated by the Company, the Company may be required to record adjustments to stock-based compensation expense in future periods.
A summary of the weighted-average assumptions is as follows:
| Years Ended December 31 | ||||||||||||
| 2014 | 2013 | 2012 | ||||||||||
| Stock option grants: |
||||||||||||
| Dividend rate |
0 | % | 0 | % | 0 | % | ||||||
| Risk-free interest rate |
1.8 | % | 1.2 | % | 1.0 | % | ||||||
| Expected term (in years) |
6.1 | 6.1 | 6.0 | |||||||||
| Expected volatility |
46 | % | 46 | % | 48 | % | ||||||
| ESPP grants: |
||||||||||||
| Dividend rate |
0 | % | 0 | % | 0 | % | ||||||
| Risk-free interest rate |
0.1 | % | 0.1 | % | 0.1 | % | ||||||
| Expected term (in years) |
0.5 | 0.5 | 0.5 | |||||||||
| Expected volatility |
45 | % | 27 | % | 39 | % | ||||||
The weighted-average grant date fair value of the Company’s stock options granted during the years ended December 31, 2014, 2013 and 2012 was $19.36, $16.48, and $14.54 per share, respectively. The aggregate grant date fair value of the Company’s stock options granted to employees during the years ended December 31, 2014, 2013 and 2012 was $24.3 million, $7.3 million, and $10.1 million, respectively. The aggregate grant date fair value of the Company’s stock options vested during the years ended December 31, 2014, 2013, and 2012 was $7.2 million, $4.6 million, and $2.1 million, respectively. The fair value of the Company’s RSUs vested during the year ended December 31, 2014 and 2013 was $8.3 million and $6.0 million, respectively. There were no restricted units that vested for the year ended December 31, 2012.
The aggregate intrinsic value of options exercised under the Plans was $14.7 million, $23.2 million, and $34.6 million for the years ended December 31, 2014, 2013 and 2012, respectively. The aggregate intrinsic value of options exercised is calculated as the difference between the fair market value of the Company’s common stock on the date of the exercise and the exercise price of each option.
As of December 31, 2014, total compensation cost related to unvested stock-based awards granted to employees under the Plans, but not yet recognized, was $91.7 million, net of estimated forfeitures. As of December 31, 2014, this cost will be amortized to expense over a weighted-average remaining period of 2.9 years, and will be adjusted for subsequent changes in estimated forfeitures. Future option grants will increase the amount of compensation expense to be recorded in these periods.
Net cash proceeds from the exercise of stock options and the issuance of common stock in connection with the employee stock purchase plan were $8.5 million, $6.3 million, and $4.2 million for the years ended December 31, 2014, 2013 and 2012, respectively. There was no capitalized stock-based compensation cost during the years ended December 31, 2014, 2013 and 2012. Recognized stock-based compensation tax benefits during the year ended December 31, 2014 and 2012 was $385,000 and $19,000, respectively. There was no recognized stock-based compensation tax benefit during the year ended December 31, 2013.
97
Table of Contents
(i) Common Stock Subject to Repurchase
Pursuant to restricted stock agreements with the Company’s former CEO, the Company has the right, but not the obligation, to repurchase the unvested shares of common stock upon termination of employment at the original purchase price per share. The repurchase rights with respect to the common stock lapse over the vesting period, which ranges from 48 months to 60 months. The amounts received in exchange for these shares have been included in other liabilities in the accompanying condensed consolidated balance sheet and are reclassified to equity as the shares vest. The Company granted 843,819 shares of restricted common stock with a weighted-average grant date fair value per share of $1.94 during the year ended December 31, 2010. There were no grants of shares of restricted common stock during years ended December 31, 2014 and 2013. As of December 31, 2014, 210,954 shares of restricted common stock held by the Company’s former CEO were unvested and subject to repurchase by the Company.
In connection with the acquisition of Skyfence in the first quarter of 2014, the Company issued 532,262 shares of the Company’s common stock with a fair value per share of $59.08 which are subject to forfeiture based upon time-based vesting and continuing employment over the term of the corresponding four-year service period. None of these shares were vested as of December 31, 2014.
(j) Early Exercise of Stock Options
In 2010 and 2011, the Company’s board of directors allowed for the early exercise of stock options granted to certain members of the Company’s board of directors. The amounts received in exchange for these shares have been included in accrued and other current liabilities and other liabilities in the accompanying condensed consolidated balance sheet and are reclassified to equity as the shares vest. As of December 31, 2014 and 2013, 6,667 shares and 45,000 shares were unvested amounting to $71,000 and $0.4 million, respectively.
(k) Equity Awards Issued in Acquisitions
In connection with the Skyfence and Incapsula acquisitions, the Company assumed stock options covering an aggregate of 72,607 shares of its common stock (in addition to the Incapsula RSUs discussed above). At the date of the acquisition, vested stock options and the associated fair value was recorded as part of the purchase consideration. The fair value related to the assumed unvested stock options are recognized as post-combination compensation costs and is being recorded as post-combination compensation expense ratably over the respective remaining service periods.
13. Accumulated Other Comprehensive Income (Loss)
The changes in the balances of accumulated other comprehensive income (loss) by component are as follows (in thousands):
| Years Ended December 31, | ||||||||||||||||||||||||||||||||||||
| 2014 | 2013 | 2012 | ||||||||||||||||||||||||||||||||||
| Unrealized gain (loss) on cash flow hedges |
Unrealized gain (loss) on investments |
Total | Unrealized gain (loss) on cash flow hedges |
Unrealized gain (loss) on investments |
Total | Unrealized gain (loss) on cash flow hedges |
Unrealized gain (loss) on investments |
Total | ||||||||||||||||||||||||||||
| Balance at January 1 |
$ | (426 | ) | $ | (2 | ) | $ | (428 | ) | $ | 691 | $ | 170 | $ | 861 | $ | (559 | ) | $ | (57 | ) | $ | (616 | ) | ||||||||||||
| Other comprehensive income (loss) before reclassifications |
(1,655 | ) | (59 | ) | (1,714 | ) | 712 | 34 | 746 | 652 | 284 | 936 | ||||||||||||||||||||||||
| Amounts reclassified to net loss |
653 | — | 653 | (1,829 | ) | (206 | ) | (2,035 | ) | 598 | (57 | ) | 541 | |||||||||||||||||||||||
|
|
|
|
|
|
|
|
|
|
|
|
|
|
|
|
|
|
|
|||||||||||||||||||
| Change in other comprehensive income (loss) |
(1,002 | ) | (59 | ) | (1,061 | ) | (1,117 | ) | (172 | ) | (1,289 | ) | 1,250 | 227 | 1,477 | |||||||||||||||||||||
|
|
|
|
|
|
|
|
|
|
|
|
|
|
|
|
|
|
|
|||||||||||||||||||
| Balance at December 31 |
$ | (1,428 | ) | $ | (61 | ) | $ | (1,489 | ) | $ | (426 | ) | $ | (2 | ) | $ | (428 | ) | $ | 691 | $ | 170 | $ | 861 | ||||||||||||
|
|
|
|
|
|
|
|
|
|
|
|
|
|
|
|
|
|
|
|||||||||||||||||||
98
Table of Contents
The following is a summary of reclassifications out of accumulated other comprehensive income (loss) for the years 2014, 2013, and 2012 (in thousands):
| Year Ended December 31, | ||||||||||||||||||||||||||||||||||||
| 2014 | 2013 | 2012 | ||||||||||||||||||||||||||||||||||
| Pre-Tax Amount |
Tax Expense (Benefit) |
After-Tax Amount |
Pre-Tax Amount |
Tax Expense (Benefit) |
After-Tax Amount |
Pre-Tax Amount |
Tax Expense (Benefit) |
After-Tax Amount |
||||||||||||||||||||||||||||
| Unrealized gains (losses) on cash flow hedges: |
||||||||||||||||||||||||||||||||||||
| Current period unrealized gain (loss) |
$ | (1,655 | ) | $ | — | $ | (1,655 | ) | $ | 712 | $ | — | $ | 712 | $ | 1,079 | $ | 427 | $ | 652 | ||||||||||||||||
| Reclassification adjustments 1 |
653 | — | 653 | (1,829 | ) | — | (1,829 | ) | 598 | — | $ | 598 | ||||||||||||||||||||||||
|
|
|
|
|
|
|
|
|
|
|
|
|
|
|
|
|
|
|
|||||||||||||||||||
| Unrealized gains (losses) on cash flow hedges, net |
(1,002 | ) | — | (1,002 | ) | (1,117 | ) | — | (1,117 | ) | 1,677 | 427 | 1,250 | |||||||||||||||||||||||
| Unrealized gains (losses) on investments: |
||||||||||||||||||||||||||||||||||||
| Current period unrealized gain (loss) |
(59 | ) | — | (59 | ) | 34 | — | 34 | 291 | 7 | 284 | |||||||||||||||||||||||||
| Reclassification adjustments 2 |
— | — | — | (206 | ) | — | (206 | ) | (57 | ) | — | (57 | ) | |||||||||||||||||||||||
|
|
|
|
|
|
|
|
|
|
|
|
|
|
|
|
|
|
|
|||||||||||||||||||
| Unrealized gains (losses) on investments: |
(59 | ) | — | (59 | ) | (172 | ) | — | (172 | ) | 234 | 7 | 227 | |||||||||||||||||||||||
|
|
|
|
|
|
|
|
|
|
|
|
|
|
|
|
|
|
|
|||||||||||||||||||
| Other comprehensive income (loss) |
$ | (1,061 | ) | $ | — | $ | (1,061 | ) | $ | (1,289 | ) | $ | — | $ | (1,289 | ) | $ | 1,911 | $ | 434 | $ | 1,477 | ||||||||||||||
|
|
|
|
|
|
|
|
|
|
|
|
|
|
|
|
|
|
|
|||||||||||||||||||
| 1 | Refer to Note 6 for the affected line items in the consolidated statement of operations |
| 2 | Amount included in other income (expense), net, in the consolidated statement of operations |
14. Income Taxes
The Company’s geographical breakdown of its loss before provision for income taxes is as follows (in thousands):
| Years Ended December 31, | ||||||||||||
| 2014 | 2013 | 2012 | ||||||||||
| Domestic |
$ | (55,330 | ) | $ | (28,831 | ) | $ | (9,373 | ) | |||
| Foreign |
(2,665 | ) | 3,277 | 2,026 | ||||||||
|
|
|
|
|
|
|
|||||||
| Loss before provision for taxes |
$ | (57,995 | ) | $ | (25,554 | ) | $ | (7,347 | ) | |||
|
|
|
|
|
|
|
|||||||
99
Table of Contents
The components of the provision for income taxes are as follows (in thousands):
| Years Ended December 31, | ||||||||||||
| 2014 | 2013 | 2012 | ||||||||||
| Current |
||||||||||||
| Federal |
$ | — | $ | — | $ | 51 | ||||||
| State |
66 | 127 | 47 | |||||||||
| Foreign |
1,523 | 700 | 889 | |||||||||
|
|
|
|
|
|
|
|||||||
| Total current provision |
1,589 | 827 | 987 | |||||||||
| Deferred |
||||||||||||
| Federal |
109 | — | (386 | ) | ||||||||
| State |
6 | — | (49 | ) | ||||||||
| Foreign |
(523 | ) | (50 | ) | (7 | ) | ||||||
|
|
|
|
|
|
|
|||||||
| Total deferred provision |
(408 | ) | (50 | ) | (442 | ) | ||||||
|
|
|
|
|
|
|
|||||||
| Total |
$ | 1,181 | $ | 777 | $ | 545 | ||||||
|
|
|
|
|
|
|
|||||||
Reconciliation of the provision for income taxes at the statutory rate to the Company’s provision for income tax is as follows (in thousands):
| Years Ended December 31, | ||||||||||||
| 2014 | 2013 | 2012 | ||||||||||
| Tax benefit at federal statutory tax rate |
$ | (19,718 | ) | $ | (8,688 | ) | $ | (2,497 | ) | |||
| Tax benefit at state statutory tax rate |
(1,169 | ) | (829 | ) | (282 | ) | ||||||
| Tax benefit resulting from “Beneficiary Enterprise” |
— | — | (95 | ) | ||||||||
| Foreign tax rate differential |
(526 | ) | (705 | ) | (232 | ) | ||||||
| Foreign repatriation |
— | — | 179 | |||||||||
| Unbenefited loss of consolidated investment |
2,366 | 2,402 | 1,193 | |||||||||
| Change in valuation allowance |
12,407 | 7,400 | 1,373 | |||||||||
| Meals and entertainment |
34 | 197 | 162 | |||||||||
| Stock-based compensation |
7,160 | 810 | 497 | |||||||||
| Nondeductible expenses and other |
627 | 190 | 247 | |||||||||
|
|
|
|
|
|
|
|||||||
| Provision for income taxes |
$ | 1,181 | $ | 777 | $ | 545 | ||||||
|
|
|
|
|
|
|
|||||||
100
Table of Contents
Significant components of the Company’s net deferred tax assets are as follows (in thousands):
| As of December 31, | ||||||||
| 2014 | 2013 | |||||||
| Deferred tax assets: |
||||||||
| Reserves and accruals |
$ | 1,387 | $ | 1,345 | ||||
| Deferred revenue |
8,429 | 4,297 | ||||||
| Stock-based compensation |
5,776 | 7,042 | ||||||
| Net operating loss carryforwards |
25,519 | 20,361 | ||||||
| Loss on OCI |
380 | — | ||||||
| Other |
41 | 194 | ||||||
|
|
|
|
|
|||||
| Gross deferred tax assets |
41,532 | 33,239 | ||||||
| Valuation allowance |
(40,488 | ) | (32,656 | ) | ||||
|
|
|
|
|
|||||
| Total deferred tax assets |
1,044 | 583 | ||||||
|
|
|
|
|
|||||
| Deferred tax liabilities: |
||||||||
| Stock-based compensation |
(53 | ) | (166 | ) | ||||
| Depreciation and amortization |
(1,757 | ) | (31 | ) | ||||
| Gain on OCI |
— | (3 | ) | |||||
|
|
|
|
|
|||||
| Total deferred tax liabilities |
(1,810 | ) | (200 | ) | ||||
|
|
|
|
|
|||||
| Net deferred tax assets |
$ | (766 | ) | $ | 383 | |||
|
|
|
|
|
|||||
Recognition of deferred tax assets is appropriate when realization of these assets is more likely than not. Based upon the weight of available evidence, which includes the Company’s historical operating performance and the recorded cumulative net losses in all prior fiscal periods, the Company has provided a full valuation allowance against its U.S. deferred tax assets. The Company’s valuation allowance increased by $7.8 million, $8.4 million, and $1.8 million in the years ended December 31, 2014, 2013 and 2012, respectively.
As of December 31, 2014, the Company had U.S. federal and state net operating loss carryforwards of approximately $101.5 million and $69.4 million, respectively. The U.S. federal net operating loss carryforwards will expire at various dates beginning in 2023 through 2034 if not utilized. Most state net operating loss carryforwards will expire at various dates beginning in 2018 through 2034.
The Company uses the “with-and-without” approach to determine the recognition and measurement of excess tax benefits. Accordingly, the Company has elected to recognize excess income tax benefits from stock option exercises in additional paid in capital only if an incremental income tax benefit would be realized after considering all other tax attributes presently available to the Company. As of December 31, 2014, the amount of such excess tax benefits from stock options included in deferred tax assets for federal and state net operating losses were $34.9 million and $20.7 million, respectively. In addition, the Company has elected to account for the indirect effects of stock-based awards on other tax attributes, such as the research and alternative minimum tax credits, through the statement of operations.
Net operating loss carryforwards reflected above may be subject to limitations due to ownership changes as provided in the Internal Revenue Code and similar state provisions.
The Company has not provided U.S. income tax on certain foreign earnings that are deemed to be indefinitely invested outside the U.S. For fiscal years 2014, 2013, and 2012 the amount of accumulated unremitted earnings from the Company’s foreign subsidiaries is approximately $12.9 million, $9.8 million and $7.2 million, respectively. Determination of the amount of unrecognized deferred U.S. income tax liability is not practical due to the complexities associated with the hypothetical calculation.
As of December 31, 2014 and 2013, the Company had gross unrecognized tax benefits of approximately $672,000 and $353,000, respectively, all of which would impact the effective tax rate if recognized. While it is often difficult to predict the final outcome of any particular uncertain tax position, the Company does not believe that the amount of unrecognized tax benefits will change significantly in the next twelve months.
The Company recognizes interest accrued and penalties related to unrecognized tax benefits in its income tax provision. For the years ended December 31, 2014 and 2013, the Company accrued interest of $43,000 and $22,000 in income tax expense, respectively.
101
Table of Contents
A reconciliation of the beginning and ending amount of unrecognized tax benefits is as follows (in thousands):
| 2014 | 2013 | 2012 | ||||||||||
| Balance at January 1 |
$ | 353 | $ | 239 | $ | 267 | ||||||
| Additions based on tax positions taken during the current period |
222 | 134 | 141 | |||||||||
| Reductions based on tax positions taken during the prior period |
(47 | ) | (20 | ) | (169 | ) | ||||||
| Additions based on tax positions taken during a prior period |
144 | — | — | |||||||||
|
|
|
|
|
|
|
|||||||
| Balance at December 31 |
$ | 672 | $ | 353 | $ | 239 | ||||||
|
|
|
|
|
|
|
|||||||
The Company’s material income tax jurisdictions are the United States (federal), California and Israel. The Israeli Tax Authorities have now settled the audit of income tax returns of the Israeli subsidiary for the tax years 2006 through 2010. As a result of net operating loss carryforwards, the Company is subject to audit for tax years 2002 and forward for federal purposes and 2004 and forward for California purposes. There are tax years which remain subject to examination in various other jurisdictions that are not material to the Company’s financial statements.
The Company’s Israeli subsidiary’s research and development intercompany services have a “Beneficiary Enterprise” status for a separate investment program that was elected by the Israel subsidiary under the Law for Encouragement of Capital Investments, 1959 (the “Investments Law”), which was amended on April 1, 2005. Undistributed Israeli income derived from its “Beneficiary Enterprise” program entitles the Israeli subsidiary to a tax exemption for a period of two years and to a reduced tax rate of 10%—25% for an additional period of five to eight years (depending on the level of non-Israeli investment in the Company). These tax benefits are subject to a limitation of 12 years from activation of the program.
The entitlement to the above benefits is conditional upon the Israeli subsidiary fulfilling the conditions stipulated by the Investments Law and regulations published there under.
Through December 31, 2012, the Israeli subsidiary had $2.4 million of tax exempt income attributed to its Beneficiary Enterprise program (“exempt profits”). If such exempt profits are distributed as dividends, in a merger or a regular distribution or upon complete liquidation of the Israeli subsidiary, it would be taxed at the corporate tax rate applicable to such profits and an income tax liability of up to $0.6 million would be incurred as of December 31, 2012.
According to a temporary provision of the Investment Law, the Israeli subsidiary paid a onetime payment in November 2013 of approximately $0.2 million to the Israeli Tax Authority for the purpose of “releasing” the exempt profits (10% of the exempt profits).
In December 2010 the “Knesset” (Israeli Parliament) passed the Law for Economic Policy for 2011 and 2012 (Amended Legislation), which prescribes, among others, amendments in the Investment Law (the “Amendment”). The Amendment became effective as of January 1, 2011. According to the Amendment, a flat tax rate applies to the Israeli subsidiary’s R&D activities as follows: 2011 and 2012—15%, 2013 and 2014—12.5% and in 2015 and thereafter—12%. The Israeli subsidiary fully adopted the provisions of the Amendment in 2012.
On July 30, 2013, the Knesset approved an amended Economic Plan for 2013-2014 (“Amended Budget Law”) to raise the Israeli corporate tax rate from 25% to 26.5%, in addition to increasing the flat tax rate applicable to the Israeli subsidiary’s R&D activities starting in 2014 to 16%. Activities other than R&D will be taxed at the rate of 26.5%.
15. Segment Information
During the three months ended March 31, 2014, the Company revised its business segments based upon the acquisition of the remaining shares of Incapsula, Inc. that the Company did not already own. As a result, the Company no longer separately reports the Incapsula segment and the Company now operates its business in one operating segment, which is the development, marketing, sales, service and support of cyber-security solutions that protect business-critical data and applications whether in cloud or on premises. Operating segments are defined as components of an enterprise that engage in business activities for which separate financial information is available and evaluated by the chief operating decision maker in deciding how to allocate resources and assessing performance. The chief operating decision maker is the Company’s Chief Executive Officer.
102
Table of Contents
The Company’s services revenue was comprised of the following (in thousands):
| Years Ended December 31, | ||||||||||||
| 2014 | 2013 | 2012 | ||||||||||
| Maintenance and support |
$ | 54,795 | $ | 44,353 | $ | 33,647 | ||||||
| Professional services and training |
11,414 | 9,890 | 6,428 | |||||||||
| Subscriptions |
23,502 | 11,363 | 4,670 | |||||||||
|
|
|
|
|
|
|
|||||||
| Total net services revenue |
$ | 89,711 | $ | 65,606 | $ | 44,745 | ||||||
|
|
|
|
|
|
|
|||||||
The Company’s revenue by geographic region, based on the customer’s location, is summarized as follows (in thousands):
| Years Ended December 31, | ||||||||||||
| 2014 | 2013 | 2012 | ||||||||||
| Americas |
$ | 94,266 | $ | 83,736 | $ | 61,588 | ||||||
| EMEA |
43,111 | 33,183 | 24,958 | |||||||||
| APAC |
26,633 | 20,840 | 17,689 | |||||||||
|
|
|
|
|
|
|
|||||||
| Total net revenue |
$ | 164,010 | $ | 137,759 | $ | 104,235 | ||||||
|
|
|
|
|
|
|
|||||||
The following table presents long-lived assets by location (in thousands):
| As of December 31, | ||||||||||||
| 2014 | 2013 | 2012 | ||||||||||
| United States |
$ | 6,761 | $ | 3,039 | $ | 2,851 | ||||||
| Israel |
10,221 | 2,422 | 2,642 | |||||||||
| Other |
35 | 14 | 22 | |||||||||
|
|
|
|
|
|
|
|||||||
| Total long-lived assets |
$ | 17,017 | $ | 5,475 | $ | 5,515 | ||||||
|
|
|
|
|
|
|
|||||||
103
Table of Contents
16. Net Loss per Share
The following table sets forth the computation of the Company’s basic and diluted net loss per share of common stock (in thousands, except for share and per share amounts):
| Years Ended December 31, | ||||||||||||
| 2014 | 2013 | 2012 | ||||||||||
| Net loss attributable to Imperva, Inc. stockholders |
$ | (58,963 | ) | $ | (25,178 | ) | $ | (7,387 | ) | |||
| Shares used in computing net loss per share of common stock, basic and diluted |
25,805,632 | 24,300,198 | 22,916,426 | |||||||||
| Net loss per share of common stock, basic and diluted |
$ | (2.28 | ) | $ | (1.04 | ) | $ | (0.32 | ) | |||
The following outstanding shares of common stock equivalents were excluded from the computation of diluted net loss per share of common stock for the periods presented because including them would have been antidilutive:
| Years Ended December 31, | ||||||||||||
| 2014 | 2013 | 2012 | ||||||||||
| Stock options to purchase common stock |
2,244,363 | 1,675,506 | 1,989,237 | |||||||||
| Restricted stock units for common stock |
2,279,081 | 1,044,651 | 446,915 | |||||||||
| Restricted shares of common stock subject to repurchase |
217,621 | 335,062 | 530,779 | |||||||||
| Restricted stock issued in connection with Skyfence acquisition |
355,499 | — | — | |||||||||
| Common stock warrants |
— | — | 8,333 | |||||||||
17. Related Party Transaction
The Company indirectly sells its products, licenses and services through a third party to Seagate Technology, a President of which is also director of the Company. Net revenues recorded from indirect sales to Seagate Technology were approximately $0.1 million, $0.1 million and $0.4 million for the years ended December 31, 2014, 2013 and 2012, respectively. As of December 31, 2014 the Company had no accounts receivable and as of December 31, 2013 had accounts receivable of $19,000 from the reseller for the indirect sales to Seagate.
Item 9. Changes in and Disagreements with Accountants on Accounting and Financial Disclosure
None.
Item 9A. Controls and Procedures
Evaluation of Disclosure Controls and Procedures
Our management, with the participation and supervision of our chief executive officer and chief financial officer, evaluated the effectiveness of our disclosure controls and procedures pursuant to Rule 13a-15 under the Exchange Act. In designing and evaluating the disclosure controls and procedures, management recognizes that any controls and procedures, no matter how well designed and operated, can provide only reasonable assurance of achieving the desired control objectives. In addition, the design of disclosure controls and procedures must reflect the fact that there are resource constraints and that management is required to apply its judgment in evaluating the benefits of possible controls and procedures relative to their costs.
104
Table of Contents
Based on the aforementioned evaluation, our chief executive officer and chief financial officer have concluded that as of December 31, 2014, our disclosure controls and procedures are designed at a reasonable assurance level and are effective to provide reasonable assurance that information we are required to disclose in reports that we file or submit under the Exchange Act is recorded, processed, summarized and reported within the time periods specified in SEC rules and forms, and that such information is accumulated and communicated to our management, including our chief executive officer and chief financial officer, as appropriate, to allow timely decisions regarding required disclosure.
Internal Control over Financial Reporting
Our management is responsible for establishing and maintaining adequate internal control over financial reporting, as such term is defined in Exchange Act Rules 13a-15(f) and 15d-15(f). Under the supervision and with the participation of our management, including our chief executive officer and chief financial officer, we conducted an evaluation of the effectiveness of our internal control over financial reporting as of December 31, 2014 based on the guidelines established in Internal Control — Integrated Framework issued by the Committee of Sponsoring Organizations of the Treadway Commission (2013 Framework) (COSO). Based on the results of this evaluation, our management has concluded that our internal control over financial reporting was effective as of December 31, 2014 to provide reasonable assurance regarding the reliability of financial reporting and the preparation of financial statements for external reporting purposes in accordance with accounting principles generally accepted in the United States. We reviewed the results of management’s assessment with the Audit Committee of our Board of Directors. The effectiveness of our internal control over financial reporting as of December 31, 2014 has been audited by Ernst & Young LLP, an independent registered public accounting firm, as stated in their report which is included in Part II, Item 8 of this Annual Report on Form 10-K.
Changes in Internal Control over Financial Reporting
As previously disclosed in our Quarterly Report on Form 10-Q for the quarter ended September 30, 2014, we have concluded that we had a material weakness related to insufficient oversight and review controls to ensure the proper determination of stock-based compensation expense for certain complex equity awards that were not issued in the ordinary course. A material weakness is a deficiency, or a combination of deficiencies, in internal control over financial reporting, such that there is a reasonable possibility that a material misstatement of the annual or interim financial statements will not be prevented or detected in a timely basis.
During the fourth quarter of the year ended December 31, 2014, we have remediated this material weakness by, among other things, implementing and modifying certain accounting processes and procedures, particularly those that involve our controls surrounding the oversight and review of complex stock-based compensation expense calculations for non-ordinary course awards, and augmenting our staff to provide capacity for additional levels of review of such calculations.
None.
105
Table of Contents
Item 10. Directors, Executive Officers and Corporate Governance
Directors
The following table lists the current members of the board of directors by class, their ages as of February 17, 2015 and current positions with Imperva. Biographical information for each nominee and/or director is provided below.
| Name |
Age |
Class1 |
Position | |||
| Anthony Bettencourt |
54 | II | President, Chief Executive Officer and Director | |||
| Gregory Clark3 |
50 | I | Director | |||
| Charles Giancarlo2, 4, 5 |
57 | I | Director | |||
| Theresia Gouw2, 4, 5 |
46 | II | Director | |||
| Shlomo Kramer2 |
48 | III | Director | |||
| Steven Krausz 2, 3, 4, 6 |
60 | I | Director | |||
| Albert Pimentel3 |
59 | III | Director | |||
| Frank Slootman2 |
56 | II | Director | |||
| Allan Tessler |
78 | I | Director | |||
| James Tolonen3,4 |
65 | III | Director |
| 1 | This year the terms of our Class I directors, currently consisting of Greg Clark, Charles Giancarlo and Steven Krausz, will expire at the annual meeting. At the annual meeting, holders of common stock will be asked to vote on the election of three directors as Class I directors. The board of directors has nominated each of Greg Clark, Charles Giancarlo and Allan Tessler to serve as a Class I director for a three year term that is expected to expire at our annual meeting in 2018 and until his or her successor is elected and qualified, or until his or her earlier death, resignation or removal. The terms of Class I directors (if elected at the 2015 annual meeting) will expire at the 2018 annual meeting. The terms of Class II directors will expire at the 2016 annual meeting. The terms of Class III directors will expire at the 2017 annual meeting. |
| 2 | Member of the Acquisitions Committee. |
| 3 | Member of the Audit Committee. |
| 4 | Member of the Nominating and Corporate Governance Committee. |
| 5 | Member of the Compensation Committee. |
| 6 | Mr. Krausz is not standing for re-election. |
Biographies
Anthony Bettencourt has served as our President, Chief Executive Officer and a member of our board of directors since August 2014. Mr. Bettencourt previously served as Chief Executive Officer of Coverity Inc., a privately held company that develops and markets development testing solutions that assist software developers in detecting and fixing quality and security problems from November 2010 to March 2014, following Coverity’s acquisition by Synopsys, Inc. From January 2006 to October 2009, Mr. Bettencourt served as Senior Vice President of Special Projects at Autonomy Corporation plc. From 2003 to 2005, Mr. Bettencourt served as the Chief Executive Officer of Verity Inc., an enterprise search company, and led the company through its acquisition by Autonomy in 2005. Mr. Bettencourt currently serves as a member of the board of directors of Proofpoint, Inc., a leading security-as-a-service provider, as a member of the board of directors of Formation Data Systems, a leader in providing storage as a service with the industry’s first Converged Data Platform, and as the Non-Executive Chairman of the board of directors of Blinkx, Inc., an Internet video search engine company. Mr. Bettencourt also previously served on the board of directors of Versant Corporation, a leading object database vendor. Mr. Bettencourt holds a B.A. in English from Santa Clara University.
The board of directors believes that Mr. Bettencourt possesses specific attributes that qualify him to serve as a director, including the perspective and experience he brings as our Chief Executive Officer, as well as his prior executive level leadership and his operational expertise.
106
Table of Contents
Greg Clark has served as a member of our board of directors since May 2014. Mr. Clark is currently the Chief Executive Officer and a member of the board of directors of Blue Coat Systems, Inc., a developer of products and services that secure and optimize the delivery of business applications, since September 2011. Mr. Clark served as Chief Executive Officer of Mincom, a leading global provider of software and services to asset-intensive industries, from May 2008 to June 2011. Prior to Mincom, he served as Chief Technology Officer and subsequently became President and Chief Executive Officer of E2open, a leader in ERP-agnostic global supply chain integration. Earlier in his career, Mr. Clark was the IBM Distinguished Engineer responsible for IBM’s security technology and served as a Vice President at IBM’s Tivoli Systems, Inc. Before joining IBM, he founded the security software firm, Dascom, Inc., which was sold to IBM in 1999. Mr. Clark previously held senior roles with AT&T, UNIX System Laboratories. Mr. Clark is also a member of the board of directors of the Global HealthCare Exchange (GHX) and Emulex Corporation, a network management company. Mr. Clark holds a BSc in physics from Griffith University.
The board of directors believes that Mr. Clark brings extensive industry and professional experience, including his specific professional experience running technology companies and his current role as Chief Executive Officer of Blue Coat Systems, to the board of directors.
Charles Giancarlo has served as a member of our board of directors since May 2013. Mr. Giancarlo is a Senior Advisor and had been a Managing Director of Silver Lake Partners from 2008 until 2013, a private investment firm that focuses on the technology, technology enabled and related growth industries. Prior to joining Silver Lake in 2008, he was employed by Cisco Systems, Inc., a provider of communications and networking products and services, which he joined in 1993 and where he was Executive Vice President and Chief Development Officer from 2004 to 2007. Mr. Giancarlo is also on the boards of directors of Accenture plc, a management consulting business, Avaya, Inc., a provider of business collaboration and communications solutions, ServiceNow, a provider of a comprehensive suite of cloud-based services for enterprise IT management, and various private companies. He served on the board of directors of Netflix, Inc., an online movie rental subscription service, from April 2007 until May 2012, and Skype, a provider of internet communications software, from 2009 to 2011. Mr. Giancarlo holds a B.S. in electrical engineering from Brown University, an M.S. in electrical engineering from the University of California at Berkeley and an M.B.A. from Harvard University.
The board of directors believes that Mr. Giancarlo brings extensive industry and professional experience, including his specific professional experience while at Cisco Systems, Inc., to the board of directors.
Theresia Gouw has served as a member of our board of directors since May 2002. Since February 2014, Ms. Gouw has been a Partner at Aspect Ventures, where she focuses on the new mobility space, focused primarily on consumer, social commerce, and security opportunities. From 1999 to 2014, Ms. Gouw was a Partner at Accel Partners. Ms. Gouw currently also serves as a member of the board of directors of Trulia, Inc. and various private software and technology companies. Ms. Gouw holds an Sc.B. in engineering from Brown University and an M.B.A. from Stanford University.
The board of directors believes that Ms. Gouw possesses specific attributes that qualify her to serve as a director, including her substantial experience in the software and technology industry as an investment professional, an executive and a member of the boards of directors of other companies in such industries.
Shlomo Kramer is our co-founder and has served as chairman of the board of directors since our inception in April 2002. From May 2002 to August 2014, Mr. Kramer served as our President and Chief Executive Officer, and from August 2014 to January 2015, Mr. Kramer served as our Chief Strategy Officer. Prior to founding Imperva, Mr. Kramer co-founded Check Point Software Technologies Ltd., an enterprise security software company, in 1993, where he held various executive roles through 1998 and served as a member of the board of directors through 2003. Mr. Kramer is also an active investor and current board member of a number of privately held companies in the security and enterprise software industries, and was previously a board member of Palo Alto Networks, Inc. from February 2006 to December 2012. Mr. Kramer holds a B.S. in mathematics and computer science from Tel Aviv University and an M.S. in computer science from Hebrew University of Jerusalem.
The board of directors believes that Mr. Kramer possesses specific attributes that qualify him to serve as a director, including the perspective and experience he brings as one of our founders, a large stockholder and our former Chief Executive Officer and Chief Strategy Officer. The board of directors also believes that Mr. Kramer brings historical knowledge, operational expertise and continuity to the board of directors.
Steven Krausz has served as a member of our board of directors since May 2003. Mr. Krausz has held various roles at U.S. Venture Partners, where he specializes in security, internet infrastructure, SAAS and enterprise software investments, and is currently a Managing Member. Prior to joining U.S. Venture Partners, he held various operating roles at BTI
107
Table of Contents
Computes, Inc., Daisy Systems Corporation, Direct Inc. and NASA Ames Research Center. Mr. Krausz currently serves on the board of directors of Box, Inc. and several portfolio companies of USVP, including Box. Mr. Krausz previously served on the board of directors of Guidewire Software, Inc., a provider of core system software to the global P&C insurance industry, from 2010 until December 2013, and Occam Networks, Inc., from 2000 until its acquisition by Calix, Inc. in February 2011. Mr. Krausz holds a B.S. in electrical engineering from Stanford University and an M.B.A. from the Stanford Graduate School of Business.
The board of directors believes that Mr. Krausz possesses specific attributes that qualify him to serve as a director, including his extensive experience as an investment professional and director of various companies in the industry, as well as his technical expertise.
Albert A. Pimentel has served as a member of our board of directors since June 2010. Currently, Mr. Pimentel is President, Global Markets & Customers for Seagate Technology PLC, one of the world’s largest manufacturers of storage devices. From March 2009 until April 2011, Mr. Pimentel served on Seagate Technology PLC’s board of directors, and he served as its Executive Vice President, Chief Sales and Marketing Officer from April 2011 until October 2013. Mr. Pimentel has served as a member of the board of directors of Xilinx Corporation since August 2010, and as a board member of Lifelock, Inc. since August 2011. From May 2008 to August 2010, Mr. Pimentel also served as the Chief Operating Officer and Chief Financial Officer for McAfee, Inc., a leading company in the field of consumer and enterprise digital security products. Mr. Pimentel holds a B.S. in commerce from Santa Clara University. He is a Certified Public Accountant, inactive, in the State of California.
The board of directors believes that Mr. Pimentel possesses specific attributes that qualify him to serve as a director, including his extensive industry experience and financial and operational expertise.
Frank Slootman has served as a member of our board of directors since August 2011. Mr. Slootman currently is, and has been since May 2011, the President, Chief Executive Officer and a member of the board of directors of ServiceNow, a provider of a comprehensive suite of cloud-based services for enterprise IT management. Mr. Slootman served as a Partner with Greylock Partners, a venture capital firm, from March 2011 to April 2011, and served as an advisor to EMC Corporation, an information technology company, from January 2011 to February 2012. From July 2009 to December 2010, Mr. Slootman served as President of the Backup Recovery Systems Division at EMC. From July 2003 to July 2009, Mr. Slootman served as President and Chief Executive Officer of Data Domain, Inc., an electronic storage solution company, which was acquired by EMC in 2009. Prior to joining Data Domain, Mr. Slootman served as an executive at Borland Software Corporation from June 2000 to June 2003, most recently as Senior Vice President of Products. From March 1993 to June 2000, Mr. Slootman held consecutive general management positions for two enterprise software divisions of Compuware Corporation. Mr. Slootman holds undergraduate and graduate degrees in Economics from the Netherlands School of Economics, Erasmus University Rotterdam.
The board of directors believes that Mr. Slootman possesses specific attributes that qualify him to serve as a director, including his specific professional experience with enterprise software technologies while at ServiceNow, EMC Corporation and Data Domain, Inc.
Allan Tessler has served as a member of our board of directors since February 2015. Mr. Tessler has been chairman of the board and Chief Executive Officer of International Financial Group, Inc., an international merchant banking firm, since 1987. He was Chairman of the board of Epoch Investment Partners, Inc., formerly J Net Enterprises. He has previously served as Chief Executive Officer of J Net Enterprises, Co-Chairman and Co-Chief Executive Officer of Data Broadcasting Corporation, now known as Interactive Data Corporation, chairman of Enhance Financial Services Group, Inc. and chairman and principal shareholder of Great Dane Holdings. Mr. Tessler is a director of online brokerage firm TD Ameritrade, and lead director and chair of the finance committee of L Brands, Inc., parent company to the Victoria’s Secret, PINK, Bath & Body Works, La Senza and Henri Bendel consumer brands. He serves as a director and chairman emeritus of the Hudson Institute and is a member of the board of governors of the Boys & Girls Clubs of America. Mr. Tessler holds a B.A. from Cornell University and an L.L.B. from Cornell University Law School.
The board of directors believes that Mr. Tessler brings extensive industry and professional experience to the board of directors, including his specific professional experience within the financial services industry.
James R. Tolonen has served as a member of our board of directors since July 2012. Mr. Tolonen served as the Senior Group Vice President and Chief Financial Officer of Business Objects, S.A., an enterprise software solutions provider, where he was responsible for its finance and administration functions commencing in January 2003 until its acquisition by SAP AG in January 2008. He remained with SAP AG until September 2008. Mr. Tolonen served as the Chief Financial Officer and
108
Table of Contents
Chief Operating Officer and a member of the board of directors of IGN Entertainment Inc., an Internet media and service provider focused on the videogame market, from October 1999 to December 2002. He served as President and Chief Financial Officer of Cybermedia, a PC end-user security and performance software provider, from April 1998 to September 1998, and as a member of its board of directors from August 1996 to September 1998. Mr. Tolonen served as Chief Financial Officer of Novell, Inc., an enterprise software provider, from June 1989 to April 1998. Mr. Tolonen currently serves as a member of the board of directors of MobileIron, Inc., an enterprise mobile solutions company. Mr. Tolonen also served on the board of directors of Blue Coat Systems, Inc. from May 2008 to February 2012, and Taleo Corporation from August 2010 to April 2012. Mr. Tolonen holds a B.S. in mechanical engineering and an M.B.A. from the University of Michigan.
The board of directors believes that Mr. Tolonen brings extensive financial, operational and accounting experience, including practical experience as a former chief financial officer of several security and software companies, to the board of directors and to the Audit Committee.
Executive Officers
Our executive officers as of February 17, 2015, and their positions and respective ages on that date, are:
| Name |
Age |
Position | ||
| Anthony Bettencourt |
54 | President, Chief Executive Officer and Director | ||
| Mark E. Kraynak |
41 | Chief Product Officer | ||
| Michael D. Mooney |
54 | Chief Revenue Officer | ||
| Sunil Nagdev |
51 | Senior Vice President, Worldwide Services and Support | ||
| Trâm T. Phi |
44 | Senior Vice President, General Counsel and Corporate Secretary | ||
| Terrence J. Schmid |
51 | Chief Financial Officer and Treasurer | ||
| Yaniv Shaya |
44 | Senior Vice President, Engineering | ||
| Amichai Shulman |
45 | Chief Technology Officer |
Our executive officers serve at the discretion of the board of directors, subject to rights, if any, under contracts of employment. See “Executive Compensation— Employment, Severance and Change of Control Arrangements.” Biographical information for Mr. Bettencourt is provided above. See “—Information Regarding Our Nominees and Directors.”
Mark E. Kraynak has served as our Chief Product Officer since October 2014. Prior to that, he served as our Senior Vice President, Worldwide Marketing from July 2012 to October 2014; Vice President, Worldwide Marketing from December 2008 to July 2012; Senior Director, Strategic Marketing from July 2007 to December 2008; Director, Product Marketing from September 2004 to July 2007 and Senior Product Marketing Manager from June 2004 to September 2004. Mr. Kraynak holds a B.Sc. in electrical engineering and a B.A. in English from Duke University and an M.F.A. in literature from American University.
Michael D. Mooney has served as our Chief Revenue Officer since October 2014. Prior to that, Mr. Mooney was Senior Vice President of Americas Field Operations from 2006 through 2012, following the acquisition of Autonomy by Hewlett-Packard Company. Thereafter, Mr. Mooney was responsible for Information Analytics and Big Data revenue, as well as for OEM and Federal revenue across all Autonomy divisions at Hewlett-Packard Company until August 2014. Prior to his roles at Autonomy, Mr. Mooney was Senior Vice President of Americas Field Operations with Verity from 2000 until Verity’s acquisition by Autonomy in 2005. Before Verity, Mr. Mooney was Vice President of Sales for Adaptive Media; Vice President of Western Sales for Versant; and held sales and sales management roles for Alantec and CMC.
Sunil Nagdev has served as our Senior Vice President, Worldwide Services and Support since December 2014, and also served as our Vice President, Worldwide Services from April 2008 to January 2011. From January 2011 to December 2014, Mr. Nagdev was Senior Vice President, Global Services and Support at Coverity Inc., a privately held company that develops and markets development testing solutions that assist software developers in detecting and fixing quality and security problems. Prior to Coverity, Mr. Nagdev was Vice President, Worldwide Professional Services and Technical Support at Tablus, Inc., and Senior Vice President, Worldwide Professional Services and Technical Support at Verity, Inc. Mr. Nagdev holds a B.S. in computer science from Chico State University.
109
Table of Contents
Trâm T. Phi has served as our Senior Vice President, General Counsel and Corporate Secretary since February 2012. From August 2011 to February 2012, she served as our Vice President, General Counsel and Corporate Secretary. Ms. Phi served as Vice President, General Counsel and Secretary of ArcSight, Inc., a provider of enterprise threat and risk management solutions, from January 2006 until the acquisition of ArcSight by Hewlett-Packard Company in October 2010, and then as general counsel of HP Software, Security until August 2011. From September 2002 to May 2005, Ms. Phi served in various positions at InVision Technologies, Inc., a manufacturer of explosives detection systems, most recently as Senior Vice President and General Counsel, including following the acquisition of InVision by General Electric Company in December 2004. Ms. Phi holds a B.A. in political science from San Jose State University and a J.D. from the University of California, Berkeley, School of Law (Boalt Hall).
Terrence J. Schmid has served as our Chief Financial Officer and Treasurer since November 2010. Prior to that, from April 2009 to November 2010, Mr. Schmid was the Chief Financial Officer for Coremetrics, Inc. (acquired by IBM), a provider of marketing optimization software. From November 2006 to April 2009, Mr. Schmid was the Executive Vice President and Chief Financial Officer for Enterasys Networks, Inc., a provider of wired and wireless infrastructure and security solutions. Mr. Schmid holds a B.A. in economics from the University of San Francisco and an M.B.A. from Duke University.
Yaniv Shaya has served as the Senior Vice President, Engineering of Imperva, Ltd., our Israeli subsidiary, since July 2012. From August 2009 to July 2012, he served as the Vice President, Engineering of Imperva, Ltd. Prior to that, from April 2005 to August 2009, Mr. Shaya was a Director of Research and Development for Mercury Interactive Corp. (acquired by Hewlett-Packard Company), an IT management software and services company. Mr. Shaya holds a B.Sc. in electrical engineering from Technion, Israel Institute of Technology and an M.B.A. from Tel Aviv University.
Amichai Shulman is our co-founder and has served as the Chief Technology Officer of Imperva Ltd., our Israeli subsidiary, since May 2002. Mr. Shulman has also served as our Secretary from May 2002 to October 2010. Prior to founding Imperva, from 2000 to 2002, Mr. Shulman was a founder and Chief Technology Officer of eDvice Security Services Ltd., an application and database security consulting group. Mr. Shulman holds a B.Sc. and an M.S. in computer science from Technion, Israel Institute of Technology where he currently serves as an adjunct faculty member in the computer science department.
Additional Information about our Directors and Executive Officers
There are no family relationships between any of our directors, nominees or executive officers. There are also no arrangements or understandings between any director, nominee or executive officer and any other person pursuant to which he or she has been or will be selected as a director and/or executive officer.
Section 16(a) Beneficial Ownership Reporting Compliance
Section 16 of the Securities Exchange Act of 1934, or the Exchange Act, requires our directors and executive officers, and persons who own more than 10% of our common stock, to file initial reports of ownership and reports of changes in ownership with the SEC. Such persons are required by SEC regulations to furnish us with copies of all Section 16(a) forms they file. Based solely on our review of the copies of such forms furnished to us and written representations from these officers and directors, we believe that all Section 16(a) filing requirements were met during 2014.
Corporate Governance Guidelines and Code of Business Conduct and Ethics
Our board of directors has adopted Corporate Governance Guidelines that set forth expectations for directors, director independence standards, board committee structure and functions, and other policies for the governance of the company. Our board of directors also has adopted a Code of Business Conduct and Ethics for directors, officers and employees that serves as a framework for our commitment to promoting high standards of honest and ethical business conduct and compliance with applicable laws. Our Corporate Governance Guidelines and Code of Business Conduct and Ethics are available on the Investors section of our website, which is located at http://www.imperva.com/company/investors_corporate-governance.html, by clicking on “Corporate Governance Guidelines” or “Code of Business Conduct and Ethics,” in each case under “Corporate Governance.” The Corporate Governance Guidelines and Code of Business Conduct and Ethics are reviewed at least annually by our nominating and corporate governance committee, and changes are recommended to our board of directors with respect to changes as warranted.
110
Table of Contents
Audit Committee
Our board of directors has established an audit committee, which operates pursuant to a separate charter adopted by our board of directors. The composition and functioning of our audit committee complies with all applicable requirements of the Sarbanes Oxley Act of 2002, the New York Stock Exchange and SEC rules and regulations. Members serve on the audit committee until their resignation or until otherwise determined by our board of directors.
Our audit committee is comprised of Mr. Tolonen, who is the chair of the committee, and Messrs. Krausz and Pimentel. Mr. David Strohm served as a member of our audit committee until his resignation from our board of directors in June 2014. The composition of our audit committee meets the requirements for independence under the current New York Stock Exchange and SEC rules and regulations. Each member of our audit committee is financially literate and is independent. In addition, our audit committee includes two financial experts within the meaning of Item 407(d)(5)(ii) of Regulation S-K promulgated under the Securities Act of 1933, as amended, or the Securities Act – Messrs. Pimentel and Tolonen.
Item 11. Executive Compensation
The following discussion and analysis of compensation arrangements of our named executive officers should be read together with the compensation tables and related disclosures set forth below. This discussion contains forward-looking statements that are based on our current plans, considerations, expectations and determinations regarding future compensation programs. The actual amount and form of compensation and the compensation programs that we adopt may differ materially from currently planned programs as summarized in this discussion.
This section discusses the principles underlying our executive compensation policies and decisions and the most important factors relevant to an analysis of these policies and decisions. It provides qualitative information regarding the manner and context in which compensation is awarded to and earned by the following executive officers and places in perspective the data presented in the tables and narrative that follow:
Anthony Bettencourt, our President and Chief Executive Officer;
Shlomo Kramer, our Chairman of the Board and former Chief Strategy Officer and Chief Executive Officer;
Mark E. Kraynak, our Chief Product Officer;
Michael D. Mooney, our Chief Revenue Officer;
Terrence J. Schmid, our Chief Financial Officer and Treasurer; and
Jason Forget, our former Senior Vice President, Worldwide Field Operations.
We refer to these executive officers collectively in this Compensation Discussion and Analysis and the related compensation tables as the “named executive officers.”
Compensation Philosophy and Objectives
Our compensation program for our named executive officers is designed to attract, as needed, individuals with the skills necessary for us to achieve our business plan, to motivate those individuals, to reward those individuals fairly over time, and to retain those individuals who continue to perform at or above the levels that we expect. It is also designed to link rewards to measurable corporate and individual performance. We believe that the most effective executive compensation program is one that is designed to reward the achievement of specific annual, long-term and strategic goals, and which aligns executives’ interests with those of the stockholders by rewarding performance of established goals, with the ultimate objective of improving stockholder value. A portion of the compensation should be at risk, provided such risk does not lead to excessive risk taking by the named executive officers and should vary based on our financial and operating performance as well as the named executive officers’ level of responsibility. We evaluate compensation to ensure that we maintain our ability to attract and retain talented employees in key positions and that compensation provided to key employees remains competitive relative to the compensation paid to similarly situated executives of our peer companies. To that end, we believe executive compensation packages provided by us to our executive officers should include both cash and stock-based compensation that reward performance as measured against established goals.
We work within the framework of our pay-for-performance philosophy to determine each component of an executive’s compensation package based on numerous factors, including:
| • | the individual’s particular background and circumstances, including training and prior relevant work experience, as well as historical compensation; |
| • | the individual’s role with us and the compensation paid to similar persons in the companies represented in the compensation data that we review; |
111
Table of Contents
| • | the individual’s performance and the performance of our business; |
| • | the demand for individuals with the individual’s specific expertise and experience at the time of hire and the retention risk for the individual; and |
| • | performance goals and other expectations for the position. |
Role of Executive Officers in Compensation Decisions
The compensation of our named executive officers is determined by our compensation committee. Our CEO typically provides annual recommendations to the compensation committee and discusses with the compensation committee the compensation and performance of all executive officers, other than himself, during the last quarter of the fiscal year and the first quarter of the new fiscal year. Our CEO bases his recommendations in part upon his review of the performance of our executive officers. Our compensation committee may exercise its discretion in modifying any recommended compensation adjustments or awards to executives. In addition, compensation committee meetings typically have included, for all or a portion of each meeting, not only the committee members and our CEO, but also Terrence Schmid, our CFO; Trâm Phi, our Senior Vice President and General Counsel; and a representative from our human resources department.
Components of Executive Compensation
Our executive officers’ compensation has had three primary components — base compensation or salary, initial equity awards and cash bonuses and equity awards under a performance-based bonus plan. We fix executive officer base compensation at a level we believe enables us to hire and retain individuals in a competitive environment and to reward satisfactory individual performance and a satisfactory level of contribution to our overall business goals. We also take into account the base compensation that is payable by public companies with which we believe we generally compete for executives. To this end, we review executive survey data and compensation data of peer companies annually when we review executive compensation. We utilize salary as the base amount necessary to match our competitors for executive talent. We designed our executive bonus plan to focus our management on achieving key corporate financial objectives, to motivate desired individual behaviors and to reward substantial achievement of these company financial objectives and individual goals. We utilize cash bonuses under our bonus plan to reward performance achievements with a time horizon of one year or less, and similarly, we utilize equity grants under our bonus plan to provide additional long-term rewards for short term performance achievements to encourage similar performance over a longer term. We utilize initial and refresh stock options and RSUs to reward long-term performance, with strong corporate performance and extended officer tenure producing potentially significant value for the officer.
We view these components of compensation as related but distinct. Although our compensation committee does review total compensation, we do not believe that significant compensation derived from one component of compensation should negate or reduce compensation from other components. We determine the appropriate level for each compensation component based in part, but not exclusively, on competitive benchmarking consistent with our recruiting and retention goals, our view of internal equity and consistency and other considerations we deem relevant, such as rewarding extraordinary performance. We believe that, as is common in the technology sector, equity awards are a significant compensation-related motivator in attracting and retaining employees.
Our compensation committee’s current intent is to perform at least once annually a strategic review of our executive officers’ compensation levels to determine whether they provide adequate incentives and motivation to our executive officers and whether they adequately compensate our executive officers relative to comparable officers in other companies with which we compete for executives.
In the fourth quarter of 2013, consistent with prior years, our compensation committee retained Compensia, a compensation consulting company, to provide us with market data on a peer group of companies in the technology sector, as well as advice in the review of compensation in connection with the completion of 2013 and review of compensation for 2014. We similarly retained Compensia during 2014 in connection with the hiring of Mr. Bettencourt, who joined in August 2014 as our President and Chief Executive Officer and transition of Mr. Kramer, our former President and Chief Executive Officer, to the newly created role of Chief Strategy Officer. We also utilized information from Compensia in connection with the hiring of other executive officers. The information provided by Compensia is benchmarked against the compensation we offer to ensure that our compensation program is competitive. Our compensation committee plans to retain a consultant to provide similar information and advice in future years for consideration in establishing annual salary increases and additional equity grants, and in structuring our executive bonus program. We do not believe the retention of, and the work performed by, Compensia creates any conflict of interest.
112
Table of Contents
Base Compensation
We seek to provide each named executive officer with a base salary that is appropriate for his roles and responsibilities, and that provides him with a level of income stability. Our compensation committee generally consults benchmark data to better inform its determination of the key elements of our compensation program in order to develop a compensation program that it believes will enable us to compete effectively for new employees and retain existing employees. In general, this benchmark data consists of compensation information from both broad-based third-party compensation surveys and peer groups. The compensation data consisted of salaries and other compensation paid by companies in these peer groups to executives in positions comparable to those held by our executive officers. Because publicly-filed compensation data is limited to the CEO, CFO and three to five most highly paid executive officers, the peer group comparisons for our named executive officers are limited to Messrs. Bettencourt, Kramer (only with respect to his role as our President and Chief Executive Officer), Mooney and Schmid. While we compete for executive talent to some degree with companies that have revenues significantly in excess of those represented in the surveys and peer groups, we believe that the companies represented in the surveys and peer groups similarly compete with such larger companies and hence are an appropriate comparison for our employment market. Our compensation committee realizes that using benchmark data may not always be appropriate, but believes that it is the best alternative at this point in the life cycle of our company. In addition to benchmarking studies, our compensation committee has historically taken into account input from other sources, including input from the members of the compensation committee and publicly available data relating to the compensation practices and policies of other companies within and outside of our industry.
For the review of compensation in connection with the completion of 2013 and determination of base and target bonus compensation for 2014, as well as the determination of the base and target bonus compensation in connection with the hiring of Messrs. Bettencourt and Mooney, our compensation committee utilized data from Compensia based on its proprietary high-tech industry executive compensation survey, the Zviran Salary Survey for Israel-based Executives and a single peer group of companies that reflect our industry, size and growth. The Compensia survey included companies nationally with revenues from approximately $50 million to approximately $250 million and the Zviran survey included cash compensation for public companies, across all size ranges. The peer group for our compensation review in connection with the determination of base and target bonus compensation for 2014 was selected based on the recommendations of Compensia after it consulted with the chairman of our compensation committee and Mr. Schmid. This peer group includes Accelrys, Bottomline Technologies, BroadSoft, Ellie Mae, FireEye, Gigamon, Guidance Software, Infoblox, Jive Software, NIC, Proofpoint, PROS Holdings, Qualys and Tangoe. Compensia initially proposed the makeup of the peer group based on the public company peer group utilized in the prior year, deleting ten companies (which companies were acquired, outside of our financial criteria range or considered to have a different business focus), adding nine companies and confirming that the remaining companies were within our criteria of systems infrastructure companies with revenues from approximately $100 million to approximately $250 million. We believe that collectively the peer groups used in 2013 were at the time representative of companies in our size range and industry that were a fair representation of the employment market in which we compete.
The peer group for our compensation review in connection with the determination of base and target bonus compensation for Messrs. Bettencourt and Mooney in connection with their hiring was selected based on the recommendations of Compensia after it consulted with the chairman of our compensation committee. This peer group includes Bottomline Technologies, BroadSoft, Ellie Mae, FireEye, Gigamon, Guidance Software, Infoblox, Jive Software, Marin Software, NIC, Proofpoint, PROS Holdings, Qualys and Tangoe. Compensia initially proposed the makeup of the peer group based on the public company peer group utilized in the prior year for other executive officers as described above, deleting one company (which had been acquired), adding one company and confirming that the remaining companies were within our criteria of systems infrastructure companies with revenues from approximately $100 million to approximately $250 million. We believe that collectively the peer groups used in connection with the determination of compensation for Messrs. Bettencourt and Mooney were at the time representative of companies in our size range and industry that were a fair representation of the employment market in which we compete.
Our compensation committee typically targets named executive officers’ salaries at a level that was near the median of salaries of executives with similar roles at comparable companies. Our compensation committee believes that the median for base salaries is the minimum cash compensation level that would allow us to attract and retain talented officers. Our compensation committee’s choice of the foregoing salary target to apply to the data in the compensation surveys reflected consideration of our stockholders’ interests in paying what was necessary, but not significantly more than necessary, to achieve our corporate goals, while conserving cash as much as practicable. We believe that, given the industry in which we operate and the corporate culture that we have created, base compensation at this level is generally sufficient to retain our existing executive officers and to hire new executive officers when and as required. The following table shows such percentage of median salary target for each of our named executive officers.
113
Table of Contents
| Named Executive Officer |
Base Salary as a Percentage of Median |
|||
| Anthony Bettencourt |
77% | |||
| Shlomo Kramer1 |
N/A | |||
| Mark E. Kraynak2 |
110% | |||
| Michael D. Mooney |
123% | |||
| Terrence J. Schmid |
97% | |||
| Jason Forget3 |
88% | |||
| 1 | This information relates to Mr. Kramer’s compensation in his role as our Chief Strategy Officer, and the compensation was mutually agreed to between Mr. Kramer and the compensation committee in connection with his transition to the role of Chief Strategy Officer following the hiring of Mr. Bettencourt as our President and Chief Executive Officer. With respect to his role as our President and Chief Executive Officer, his base salary was 87% of the median. |
| 2 | This information relates to Mr. Kraynak’s role as our SVP, Worldwide Marketing, which is the role that Mr. Kraynak had at the time that 2014 compensation was determined. Mr. Kraynak became our Chief Product Officer in May 2014, and he did not receive a compensation adjustment when he moved to the new role. |
| 3 | This information relates to Mr. Forget’s role as our SVP, Worldwide Field Operations, which commenced in April 2014. Mr. Forget’s base salary as a percentage of the median was 100% with respect to his former role as our SVP, Worldwide Business Operations, and he did not receive a compensation adjustment when he moved to the new role. |
As reflected in the table, the base salary for Mr. Bettencourt was significantly below the median, largely as a result of the compensation committee’s consideration of the total compensation for Mr. Bettencourt, in particular in light of the equity grants awarded to him. Mr. Kraynak’s base salary in excess of the median reflects his then-dual roles within Imperva with responsibilities over our marketing organization, as well as corporate and business development organizations, before moving to the role of Chief Product Officer in October 2014. Mr. Mooney’s base salary in excess of the median reflects his significant professional experience. The base salary for Mr. Forget was significantly below the median as he continued to be paid at his prior compensation level when he moved to the role of Senior Vice President, Worldwide Field Operations in April 2014 (in September 2014, Mr. Forget resigned as an employee of Imperva effective March 31, 2015, and no longer served as an executive officer following the announcement of his resignation).
We annually review our base salaries, and may adjust them from time to time based on market trends, including review of benchmark information, as well as the recognition that compensation levels are typically reviewed annually and survey information may not fully reflect changes in salary levels over time or particular acute geographic or market circumstances. We also review the applicable executive officer’s responsibilities, performance and experience. We do not provide formulaic base salary increases to our executive officers. If necessary, we also realign base salaries with market levels for the same positions in companies of similar size to us represented in the compensation data we review, if we identify significant market changes in our data analysis. Additionally, we may adjust base salaries as warranted throughout the year for promotions or other changes in the scope or breadth of an executive’s role or responsibilities.
Cash Bonuses under Our Bonus Plan
Our cash bonus incentive plan rewards our named executive officers for meeting and exceeding short-term goals, principally relating to the achievement of performance goals set by the compensation committee after consultation with our management and the board of directors. Under our bonus plan for 2014, we pay bonuses quarterly in order to reward achievement of our operating results targets from quarter to quarter. The compensation committee chose revenues and operating expenses as the financial metrics for bonuses because it believed that we should reward revenue growth, but only if that revenue growth is achieved cost effectively. Likewise, it believed a “profitable company” with little or no growth was not acceptable. Thus, the compensation committee considered the chosen metrics to be the best indicators of financial success and stockholder value creation. Payments of cash bonuses are contingent upon continued employment through the actual date of payment.
In addition, our compensation committee established separate individual performance objectives for Mr. Bettencourt related to accomplishment of strategic objectives, and the compensation committee currently utilizes those only as a factor when evaluating potential changes in Mr. Bettencourt’s base compensation and potential discretionary equity awards under the bonus plan, and not for determining his quarterly bonuses. With respect to the other executive officers, the individual performance objectives are determined by our CEO and might include such objectives as budgeting and cost controls, hiring and personnel development, strategic thinking and management, and those are utilized as a factor when evaluating potential changes in the base compensation and potential discretionary equity awards under the bonus plan for such executive officers,
114
Table of Contents
and not for determining quarterly bonuses. Our compensation committee believes that our executive officers have responsibility for the overall performance of Imperva as a company, with emphasis on achievement of targeted revenues and operating expenses, and quarterly bonuses may be decreased based on the company’s overall performance. For example, in the first quarter of 2014, because the company did not achieve its revenues target, our compensation committee determined not to pay quarterly bonuses to our named executive officers even though bonuses would otherwise have been payable under the bonus plan as a result of the company achieving its operating expense target.
Under our bonus plan for 2014, each named executive officer other than Messrs. Mooney and Forget is eligible to receive a quarterly bonus equal to the sum of the Quarterly Revenues Bonus and the Quarterly Operating Expenses Bonus, each as defined below. The 2014 Bonus Plan weights Imperva’s quarterly revenues performance and Imperva’s quarterly operating expense performance equally with respect to the total bonus amount payable to each named executive officer in each quarter. The maximum quarterly bonus amount for each eligible named executive officer is set forth in the table below:
| Named Executive Officer |
Quarterly Bonus Amount | |||
| Anthony Bettencourt |
$ | 93,750 | ||
| Shlomo Kramer1 |
$ | 36,145 | ||
| Mark Kraynak |
$ | 20,000 | ||
| Terrence Schmid |
$ | 40,000 | ||
| 1 | Mr. Kramer’s bonus in 2014 was paid in Israeli shekels and converted to U.S. dollars for the purposes of this column, using the average exchange rate for 2014 of US$1.00 to NIS 3.5779. The quarter amount listed relates to Mr. Kramer’s compensation in his role as our Chief Strategy Officer. In his role as our President and Chief Executive Officer, his quarter bonus amount was $84,337 based on the exchange rate specified in this first sentence of this footnote. |
The “Quarterly Revenues Bonus” is equal to the Quarterly Bonus Amount specified in the table above, multiplied by 50%, multiplied by the Quarterly Revenues Bonus Percentage determined as follows:
| Quarterly Revenues Bonus Percentage |
Percentage Achievement Relative to Quarterly Revenue Target (in accordance with the Company’s internal operating plan) | |
| 112.5% |
³ 105% | |
| 110% |
³ 104% and < 105% | |
| 107.5% |
³ 103% and < 104% | |
| 105% |
³ 102% and < 103% | |
| 102.5% |
³ 101% and < 102% | |
| 100% |
³ 100% and < 101% | |
| 97.5% |
³ 99% and < 100% | |
| 95% |
³ 98% and < 99% | |
| 92.5% |
³ 97% and < 98% | |
| 90% |
³ 96% and < 97% | |
| 87.5% |
³ 95% and < 96% | |
| 85% |
³ 94% and < 95% | |
| 82.5% |
³ 93% and < 94% | |
| 80% |
³ 92% and < 93% | |
| 77.5% |
³ 91% and < 92% | |
| 75% |
³ 90% and < 91% | |
| 70% |
³ 89% and < 90% | |
| 65% |
³ 88% and < 89% | |
| 60% |
³ 87% and < 88% | |
| 55% |
³ 86% and < 87% | |
| 50% |
³ 85% and < 86% | |
| 0% |
< 85% |
The “Quarterly Operating Expenses Bonus” is equal to the Quarterly Bonus Amount specified in the table above, multiplied by 50%, multiplied by the Quarterly Operating Expenses Bonus Percentage determined as follows:
115
Table of Contents
| Quarterly Operating Expenses |
Percentage of Expenses Relative to Quarterly Operating Expenses
Target (in accordance with the Company’s internal operating plan) | |
| 112.5% |
< 95% | |
| 110% |
³ 95% and < 96% | |
| 107.5% |
³ 96% and < 97% | |
| 105% |
³ 97% and < 98% | |
| 102.5% |
³ 98% and < 99% | |
| 100% |
³ 99% and < 100% | |
| 97.5% |
³ 100% and < 101% | |
| 95% |
³ 101% and < 102% | |
| 92.5% |
³ 102% and < 103% | |
| 90% |
³ 103% and < 104% | |
| 87.5% |
³ 104% and < 105% | |
| 85% |
³ 105% and < 106% | |
| 82.5% |
³ 106% and < 107% | |
| 80% |
³ 107% and < 108% | |
| 77.5% |
³ 108% and < 109% | |
| 75% |
³ 109% and < 110% | |
| 70% |
³ 110% | |
| 65% |
³ 111% and < 112% | |
| 60% |
³ 112% and < 113% | |
| 55% |
³ 113% and < 114% | |
| 50% |
³ 114% and < 115% | |
| 0% |
> 115% |
Further, to the extent that either the Quarterly Revenues Bonus Percentage or the Quarterly Operating Expenses Bonus Percentage as determined in accordance with the paragraphs above is less than 100%, then both the Quarterly Revenues Bonus and the Quarterly Operating Expenses Bonus will be paid as if each such percentage was achieved and paid at the average of the two percentages.
Based on our actual financial performance in 2014, we paid the following quarterly bonuses:
| • | In the first quarter of 2014, we achieved 82% of our revenue target of $38.3 million and had operating expenses of 92% of our operating expense target of $36.8 million. However, because the company did not achieve its revenues target, our compensation committee determined not to pay quarterly bonuses to our named executive officers even though bonuses would otherwise have been payable under the bonus plan as a result of the company achieving its operating expense target. |
| • | In the second quarter of 2014, we achieved 106% of our revenue target of $36.1 million and had operating expenses of 102% of our operating expense target of $35.0 million. As a result, we paid Messrs. Kramer, Schmid and Kraynak $87,500, $41,500 and $20,750, respectively. |
| • | In the third quarter of 2014, we achieved 97% of our revenue target of $43.8 million and had operating expenses of 100% of our operating expense target of $35.3 million. As a result, we paid Messrs. Bettencourt, Kramer, Schmid and Kraynak $45,117, $58,755, $38,500 and $19,250, respectively. Mr. Bettencourt’s employment with us commenced in August 2014, and his bonus was prorated for the portion of the quarter in which he was employed. |
| • | In the fourth quarter of 2014, we achieved 99% of our revenue target of $52.1 million and had operating expenses of 93% of our operating expense target of $41.1 million. As a result, we paid Messrs. Bettencourt, Schmid and Kraynak $97,266, $41,500 and $20,750, respectively. Mr. Kramer resigned as our Chief Strategy Officer on January 17, 2015 and, since he was not an employee at the time of payment of the fourth quarter bonus, he did not receive a bonus payment for that quarter. |
Under the sales compensation plan for 2014 with Mr. Mooney, 80% of his annual cash bonus opportunity of $275,000 is based on achieving a customer bookings target, and 20% is based on the company’s gross profit. For achievement of up to 100% of his customer bookings target, Mr. Mooney receives commissions of 0.09% of customer bookings, for achievement between 100% and 110% of target, Mr. Mooney receives commissions of 0.14% of customer bookings and for achievement greater than 110% of target, Mr. Mooney receives commissions of 0.19% of customer bookings.
116
Table of Contents
Based on our actual financial performance in the fourth quarter of 2014 (which is the quarter in which Mr. Mooney’s employment commenced), Mr. Mooney received commissions of $54,096 based on achievement of 94% of his bookings target of $62.3 million, and a bonus of $13,511 based on achievement of 98% of our gross profits target of $41.6 million.
Under the sales compensation plan for 2014 with Mr. Forget, 80% of his annual cash bonus opportunity of $250,000 is based on achieving a customer bookings target, and 20% is based on the company’s gross profit. For achievement of up to 100% of his customer bookings target, Mr. Forget receives commissions of 0.09% of customer bookings, for achievement between 100% and 110% of target, Mr. Forget receives commissions of 0.14% of customer bookings and for achievement greater than 110% of target, Mr. Forget receives commissions of 0.19% of customer bookings.
Based on our actual financial performance in 2014, we paid Mr. Forget the following quarterly bonuses (which includes the quarterly commissions to which he was entitled under his plan):
| • | In the first quarter of 2014, Mr. Forget achieved 15% of his bookings target of $28.5 million. As a result, Mr. Forget received commissions of $25,931. In addition, we achieved 82% of our gross profits target of $30.4 million and, as a result, we paid Mr. Forget $10,298. |
| • | In the second quarter of 2014, Mr. Forget achieved 37% of his bookings target of $70.2 million. As a result, Mr. Forget received commissions of $40,306. In addition, we achieved 100% of our gross profits target of $28.2 million and, as a result, we paid Mr. Forget $12,500. |
| • | In the third quarter of 2014, Mr. Forget achieved 61% of his bookings target of $115.1 million. As a result, Mr. Forget received commissions of $49,301. In addition, we achieved 97% of our gross profits target of $34.6 million and, as a result, we paid Mr. Forget $12,185. |
| • | In the fourth quarter of 2014, Mr. Forget achieved 94% of his bookings target of $177.3 million. As a result, Mr. Forget received commissions of $66,915. In addition, we achieved 98% of our gross profits target of $41.7 million and, as a result, we paid Mr. Forget $12,283. |
The “target” and “maximum” bonus amounts that could be earned by each named executive officer in 2014 are reflected in the “2014 Grants of Plan-Based Awards” table in “Executive Compensation.” The following table shows such percentage of median target level bonus for each of our named executive officers:
| Named Executive Officer |
Base Salary and Target Level Bonus as a Percentage of Median |
|||
| Anthony Bettencourt |
93% | |||
| Shlomo Kramer1 |
N/A | |||
| Mark Kraynak |
108% | |||
| Terrence J. Schmid |
101% | |||
| 1 | This information relates to Mr. Kramer’s compensation in his role as our Chief Strategy Officer, and the compensation was mutually agreed to between Mr. Kramer and the compensation committee in connection with his transition to the role of Chief Strategy Officer following the hiring of Mr. Bettencourt as our President and Chief Executive Officer. With respect to his role as our President and Chief Executive Officer, his base salary and target level bonus was 96% of the median. |
As reflected in the table, the aggregate of Mr. Kraynak’s base salary and target level bonus in excess of the median reflects his dual roles within Imperva with responsibilities over our marketing organization, as well as corporate and business development organizations.
Our quarterly cash bonuses, as opposed to our equity grants, are designed to more immediately reward our executive officers for their performance during the most recent fiscal quarter. We believe that the immediacy of these cash bonuses, in contrast to our equity grants which vest over a period of time, provides a significant incentive to our executives towards achieving their respective individual objectives, and thus our company-level objectives. Thus, we believe our cash bonuses are an important motivating factor for our named executive officers, in addition to being a significant factor in attracting and retaining our named executive officers.
117
Table of Contents
Equity Compensation
The goal of our long-term, equity-based incentive awards is to provide each named executive officer with an incentive to manage our company from the perspective of an owner with an equity stake in the business. Due to the stage of our business and our evolving industry, we believe that equity awards, principally stock options and RSUs, or RSUs, will incentivize our executive officers to achieve long-term performance goals because they provide greater opportunities for our executive officers to benefit from any future successes in our business. In addition, our compensation committee also believes that having a meaningful equity ownership in our company assists us in retaining our key employees. Consistent with this view, our compensation committee, which has authority to make equity-based awards to executive officers, chose to make equity grants based on input from members of the compensation committee, drawing on their experience as directors and executives at other companies within and outside of our industry and based on consideration of benchmarking information provided by Compensia, as well as recommendations from our CEO.
Each named executive officer is initially provided with an equity grant when they join our company based upon their position with us and their relevant prior experience. These initial grants generally vest over four years and no shares vest before the one year anniversary of the equity grant. We spread the vesting of our equity grants over four years to compensate executives for their contribution over a period of time. In addition, our compensation committee has discretion to make equity grants to executive officers and other employees from time to time separate from the equity awards under our bonus plan described below, generally in light of changes in the applicable executive officer’s responsibilities, performance and experience or material changes for comparable executives as reflected in benchmark data and not reflected in the refresh grants we award under our bonus plan.
The value of the shares subject to the 2014 equity grants to named executive officers are reflected in the “Summary Compensation Table” table and further information about these grants is reflected in the “2014 Grants of Plan-Based Awards” table below, each in the “Executive Compensation” section.
Equity grants to named executive officers other than Mr. Bettencourt are made pursuant to our 2011 Stock Option and Incentive Plan which permits our compensation committee flexibility in making a wide variety of equity awards. The initial grants to Mr. Bettencourt were made pursuant to an Inducement Stock Option Plan and Agreement and an Inducement Restricted Stock Unit Plan and Agreement, although we expect that any future grants to Mr. Bettencourt will be made pursuant to our 2011 Stock Option and Incentive Plan. Participation in the 2011 Employee Stock Purchase Plan is also available to all executive officers on the same basis as our other employees. However, any executive officers who are 5% stockholders, or would become 5% stockholders as a result of their participation in our 2011 Employee Stock Purchase Plan, are ineligible to participate in our 2011 Employee Stock Purchase Plan.
Equity Bonuses under Our Bonus Plan
Our compensation committee believes that granting additional stock options and RSUs on an annual basis to existing named executive officers provides an important incentive to retain executives and rewards them for short-term company performance while also creating long-term incentives to sustain that performance. Under our bonus plan for 2013, based on the recommendation of Mr. Kramer, who was serving as our CEO at that time, the compensation committee approved a pool of 252,000 shares of common stock to be granted during the first quarter of 2014 to our executive officers, other than our CEO, on the achievement of the targeted financial goals and individual performance objectives, for the reasons described above for cash bonuses. The individual grants to our executive officers under the equity bonus plan (to be granted under our 2011 Stock Option and Incentive Plan) are determined by our compensation committee after input from and consultation with our CEO. Our compensation committee may exercise its discretion in modifying any recommended adjustments or awards to executives. Following Mr. Kramer’s recommendations to our compensation committee regarding the awards made to our executive officers, our compensation committee ultimately determined and approved the specific equity awards. In addition, our compensation committee determined the amount of Mr. Kramer’s grant based on the level of our achievement of the targeted revenue and operating expense goals and its evaluation of Mr. Kramer’s contribution toward that achievement.
When making the recommendation and determining the amounts of the awards, consideration was given to the individual performance and median equity compensation of executives with similar roles at comparable companies according to the survey and peer group data described above. See footnote (2) to the “2014 Grants of Plan-Based Awards” table in the “Executive Compensation” section below for the specific amounts of these grants for our named executive officers. Equity grants made pursuant to the bonus plan vest over four years and no shares vest before the first day of the succeeding year (the year following the year in which the equity awards were actually granted), except that no shares of Mr. Schmid’s equity grants vest before the first day of the second year following the year in which the equity awards were actually granted. In addition to the annual awards pursuant to our bonus plan, grants of stock options may be made to executive officers following a significant change in job responsibility or in recognition of a significant achievement. The “shares underlying,” “exercise price” and “grant date fair value” of option awards made to each named executive officer in 2014 are also reflected in the “2014 Grants of Plan-Based Awards” table below.
118
Table of Contents
Severance and Change of Control Payments
In connection with the executive compensation review process conducted at the beginning of 2012 by our compensation committee, our compensation committee adopted a Change in Control Plan that provides for severance and accelerated vesting of all outstanding and unvested awards in the event of their termination of employment under specified circumstances following a change in control in order to harmonize the change of control provisions across all executive officers and to eliminate all single trigger acceleration provisions.
Our compensation committee determined to provide these severance and change of control arrangements in order to mitigate some of the risk that exists for executives working in a small, dynamic company, an environment where there is a meaningful likelihood that we may be acquired. These arrangements are intended to attract and retain qualified executives that have alternatives that may appear to them to be less risky absent these arrangements, and to mitigate a potential disincentive to consideration and execution of such an acquisition, particularly where the services of these executive officers may not be required by the acquirer. We also believe that entering into these arrangements will help these executive officers maintain continued focus and dedication to their responsibilities to help maximize stockholder value if there is a potential transaction that could involve a change in control of the company.
For quantification of and additional information regarding the Change in Control Plan, please see the discussion under “Executive Compensation—Potential Payments Upon Termination or Change in Control.”
Welfare and Other Benefits
We have established a tax-qualified Section 401(k) retirement plan for all employees who satisfy certain eligibility requirements, including requirements relating to age and length of service. Under this plan, employees may elect to defer a portion of their current compensation subject to certain statutory limits, and contribute to the plan. We currently do not match any contributions made by our employees, including executive officers. We intend for the plan to qualify under Section 401(a) of the Internal Revenue Code so that contributions by employees to the plan, and income earned on plan contributions, are not taxable to employees until withdrawn from the plan.
In addition, we provide other benefits to our executive officers, including the named executive officers, on the same basis as all of our full-time employees. These benefits include medical, dental, and vision benefits, medical and dependent care flexible spending accounts, short-term and long-term disability insurance, accidental death and dismemberment insurance and basic life insurance coverage. These benefits are provided to our executive officers on the same general terms as to all of our full-time employees in the country in which they are resident.
We believe that our employee benefits programs are affordable and competitive in relation to the market based on our understanding of the markets in which we compete for talent. We adjust our employee benefits programs as needed based upon regular monitoring of applicable laws and practices and the competitive market.
We do not provide perquisites to our executive officers, except in limited situations where we believe it is appropriate to assist an individual in the performance of his duties, to make our executive officers more efficient and effective, or for recruitment and retention purposes. Executive officers resident in Israel receive the customary benefits payable to Israeli employees, including managers’ insurance, contributions to an advanced study fund, vacation and sick leave, recreation pay and use of an automobile.
As described above, our named executive officers also are entitled to participate in our 2011 Employee Stock Purchase Plan on the same basis as our other employees.
In the future, we may provide perquisites or other personal benefits in limited circumstances, such as where we believe it is appropriate to assist an individual executive officer in the performance of his or her duties, to make our executive officers more efficient and effective, or for recruitment, motivation, or retention purposes. All future practices with respect to perquisites or other personal benefits will be approved and subject to periodic review by the compensation committee.
119
Table of Contents
Other Compensation Policies
Stock Ownership Guidelines
Other than the equity plans described in this section, we do not have any equity security ownership guidelines or requirements for our named executive officers (or board members) and we do not have any formal or informal policies or guidelines for allocating compensation between long-term and currently paid out compensation, between cash and non-cash compensation or among different forms of non-cash compensation. Other than Mr. Kramer, who has owned a substantial number of shares as a founder of Imperva, our equity compensation plans have provided the principal method for our executive officers to acquire equity or equity-linked interests in our company.
Compensation Recovery Policy
Currently, we have not implemented a policy regarding retroactive adjustments to any cash or equity-based incentive compensation paid to our executive officers and other employees where the payments were predicated upon the achievement of financial results that were subsequently the subject of a financial restatement or other adjustment in a manner that would reduce the size of the award or payment. Currently, under those circumstances, our board of directors or our compensation committee would evaluate whether adjustments or recoveries of awards were appropriate based upon the facts and circumstances surrounding the restatement or adjustment, including the terms of the relevant compensation plans. We intend to adopt a general compensation recovery (“clawback”) policy covering our annual and long-term incentive award plans and arrangements once the SEC adopts final rules implementing the requirement of Section 954 of the Dodd-Frank Wall Street Reform and Consumer Protection Act.
Derivatives Trading and Hedging Policy
Currently, we have not implemented a policy regarding the trading of derivatives or the hedging of our equity securities by our employees, including the named executive officers, and directors.
Policy Regarding the Pricing and Timing of Equity Awards
All equity awards to our employees, including executive officers, and to our directors have been granted and reflected in our consolidated financial statements, based upon the applicable accounting guidance, at the closing price of our stock on the New York Stock Exchange on the date of grant. We have no program, plan or practice pertaining to the timing of stock option grants to executive officers relative to the timing of the release of material nonpublic information. We do not, as of yet, have any plans to implement such a program, plan or practice.
Tax and Accounting Considerations
Deductibility of Executive Compensation
Section 162(m) of the Internal Revenue Code (the “Code”) generally disallows public companies a tax deduction for federal income tax purposes of remuneration in excess of $1 million paid to the chief executive officer and each of the three other most highly compensated executive officers (other than the chief financial officer) in any taxable year. Generally, remuneration in excess of $1 million may only be deducted if it is “performance-based compensation” within the meaning of the Code. In this regard, the compensation income realized upon the exercise of stock options granted under a stockholder-approved stock option plan generally will be deductible so long as the options are granted by a committee whose members are non-employee directors and certain other conditions are satisfied. On the other hand, annual cash bonuses will not be deductible unless paid on the basis of pre-established objective performance criteria, the satisfaction of which is certified after the end of the year and upon meeting certain other conditions.
We expect that, where reasonably practicable, we will seek to qualify the variable compensation paid to our executive officers for the “performance-based compensation” exemption from the deductibility limit. As such, in approving the amount and form of compensation for our executive officers, we consider all elements of the cost to us of providing such compensation, including the potential impact of Section 162(m). In the future, the compensation committee may, in its judgment, authorize compensation payments that do not comply with an exemption from the deductibility limit when it believes that such payments are appropriate to attract and retain executive talent.
Taxation of “Parachute” Payments
Sections 280G and 4999 of the Code provide that executive officers and directors who hold significant equity interests and certain other service providers may be subject to significant additional taxes if they receive payments or benefits in connection with a change in control of the company that exceed certain prescribed limits, and that the company (or a
120
Table of Contents
successor) may forfeit a deduction on the amounts subject to this additional tax. We did not provide any executive officer, including any named executive officer, with a “gross-up” or other reimbursement payment for any tax liability that the executive might owe as a result of the application of Sections 280G or 4999 during 2010 and we have not agreed and are not otherwise obligated to provide any executive officer with such a “gross-up” or other reimbursement.
Accounting for Stock-Based Compensation
We account for equity compensation paid to our employees under the rules of ASC 718, which requires us to estimate and record an expense over the service period of the award. Accounting rules also require us to record cash compensation as an expense at the time the obligation is accrued. We structure cash bonus compensation so that it is taxable to our executives at the time it is paid to them. We currently intend that all cash compensation paid will be tax deductible for us. However, with respect to equity compensation awards, while any gain recognized by employees from nonqualified options should be deductible, to the extent that an option constitutes an incentive stock option, gain recognized by the optionee will not be deductible if there is no disqualifying disposition by the optionee. In addition, if we grant restricted stock or restricted stock unit awards that are not subject to performance vesting, they may not be fully deductible by us at the time the award is otherwise taxable to the employee.
Compensation Committee Report
The compensation committee has reviewed and discussed the Compensation Disclosure and Analysis set forth above with our management. Based on its review and discussions, the compensation committee recommended to our board of directors that the Compensation Disclosure and Analysis be included in this proxy statement.
Submitted by the Compensation Committee of the Board of Directors,
Frank Slootman
Charles Giancarlo
Theresia Gouw
The information contained in the foregoing report of Imperva’s compensation committee is not considered to be “soliciting material,” “filed” or incorporated by reference in any past or future filing by Imperva under the Securities Exchange Act of 1934 or the Securities Act of 1933 unless and only to the extent that Imperva specifically incorporates it by reference.
121
Table of Contents
EXECUTIVE COMPENSATION
Summary Compensation Table
The following table sets forth certain information with respect to compensation awarded to, earned by or paid to each person who served as our Chief Executive Officer, our Chief Financial Officer, each of our three other most highly compensated executive officers whose compensation was more than $100,000 during the years ended December 31, 2014, 2013 and 2012, and one employee who served as an executive officer during 2014, but who was no longer serving as such on the last day of 2014. We refer to these executive officers as our “named executive officers” elsewhere in this proxy statement.
| Name and Principal Position |
Year | Salary ($) |
Stock Awards ($)1 |
Option Awards ($) 1 |
Non-Equity Incentive Compensation ($)2 |
All Other Compensation ($) |
Total ($) |
|||||||||||||||||||||
| Anthony Bettencourt3 |
2014 | $ | 140,625 | $ | 7,751,250 | $ | 3,895,685 | $ | 142,383 | $ | — | $ | 11,929,943 | |||||||||||||||
| President and Chief Executive Officer |
||||||||||||||||||||||||||||
| Shlomo Kramer |
2014 | $ | 318,631 | 4 | $ | 2,186,400 | $ | 991,352 | $ | 146,255 | 4 | $ | 79,100 | 5 | $ | 3,721,738 | ||||||||||||
| Chief Strategy Officer |
2013 | $ | 257,215 | 6 | $ | 1,382,000 | $ | 617,728 | $ | 63,750 | $ | 65,698 | 7 | $ | 2,386,391 | |||||||||||||
| 2012 | $ | 250,000 | — | — | $ | 100,000 | $ | 4,043 | 8 | $ | 354,043 | |||||||||||||||||
| Mark Kraynak |
2014 | $ | 280,000 | $ | 1,311,840 | $ | 594,811 | $ | 60,750 | — | $ | 2,247,401 | ||||||||||||||||
| Chief Product Officer |
2013 | $ | 265,000 | $ | 518,250 | $ | 231,461 | $ | 14,875 | — | $ | 1,029,586 | ||||||||||||||||
| 2012 | $ | 235,000 | $ | 776,337 | $ | 349,634 | $ | 33,000 | — | $ | 1,393,971 | |||||||||||||||||
| Michael D. Mooney9 |
2014 | $ | 81,250 | $ | 1,455,000 | $ | 729,450 | $ | 67,607 | — | $ | 2,333,307 | ||||||||||||||||
| Chief Revenue Officer |
||||||||||||||||||||||||||||
| Terrence J. Schmid |
2014 | $ | 290,000 | $ | 1,639,800 | $ | 753,936 | $ | 121,500 | — | $ | 2,805,236 | ||||||||||||||||
| Chief Financial Officer and Treasurer |
2013 | $ | 280,000 | $ | 518,250 | $ | 231,461 | $ | 23,906 | — | $ | 1,053,617 | ||||||||||||||||
| 2012 | $ | 250,000 | — | — | $ | 30,313 | — | $ | 280,313 | |||||||||||||||||||
| Jason Forget10 |
2014 | $ | 250,000 | $ | 1,311,840 | $ | 594,811 | $ | 229,719 | — | $ | 2,386,370 | ||||||||||||||||
| Former SVP, Worldwide Field Operations |
2013 | $ | 240,000 | $ | 518,250 | $ | 231,461 | $ | 47,833 | — | $ | 1,037,544 | ||||||||||||||||
| 2012 | $ | 210,000 | $ | 776,337 | $ | 349,480 | $ | 61,967 | — | $ | 1,397,784 | |||||||||||||||||
| 1 | This column reflects the aggregate grant date fair value of equity awards granted in the periods presented and calculated in accordance with FASB ASC 718, excluding the effect of estimated forfeitures. See Note 12 of “Notes to Consolidated Financial Statements” in this Annual Report on Form 10-K for a discussion of the assumptions made by us in determining the valuation of equity awards. All stock awards listed are RSUs. |
| 2 | Represents cash incentive payments paid for performance. |
| 3 | Mr. Bettencourt’s employment commenced in August 2014. |
| 4 | From January 2014 to August 2014, Mr. Kramer was our President and Chief Executive Officer, with a base salary of NIS 1,207,000 and annual bonus target of NIS 1,207,000. Since August 2014, Mr. Kramer has been our Chief Strategy Officer, with a base salary of NIS 1,034,571 and annual bonus target of NIS 517,286. Mr. Kramer’s base salary and bonus in 2014 were paid in Israeli shekels and converted to U.S. dollars for the purposes of this column, using the average exchange rate for 2014 of US$1.00 to NIS 3.5779. |
| 5 | Represents $42,474 related to pension payments, $23,897 related to payments to an education fund and payments related to statutory severance, vehicle-related expenses, meals, telephone expenses and a holiday present received by Mr. Kramer in the course of his employment with Imperva, which are customary benefits payable to our Israeli employees. See “Compensation Discussion and Analysis – Welfare and Other Benefits.” |
| 6 | $132,216 of Mr. Kramer’s base salary in 2013 were paid in Israeli shekels and converted to U.S. dollars for the purposes of this column, using the average exchange rate for 2013 of US$1.00 to NIS 3.609. |
| 7 | Represents payments of $34,615 related to a cashout of Mr. Kramer’s accrued vacation under U.S. law in connection with his relocation to Israel and $1,887 related to taxable fringe benefits for health insurance premiums while Mr. Kramer was located in the United States, as well as $17,624 related to pension payments, $9,916 related to payments to an education fund and payments related to statutory severance, a vehicle allowance, recreation funds, meals, telephone expenses, company events and a holiday present received by Mr. Kramer in the course of his employment with Imperva, which are customary benefits payable to our Israeli employees. See “Compensation Discussion and Analysis – Welfare and Other Benefits.” |
| 8 | Represents taxable fringe benefits related to health insurance premiums. |
| 9 | Mr. Mooney’s employment commenced in October 2014. |
122
Table of Contents
| 10 | Mr. Forget resigned in September 2014, effective March 31, 2015, and no longer served as an executive officer following the announcement of his resignation. |
Grants of Plan-Based Awards—2014
The following table sets forth certain information with respect to equity grants awarded to our named executive officers for the year ended December 31, 2014.
| Name |
Grant Date | Estimated Future Payouts Under Non- Equity Incentive Plan Awards |
All Other Stock Awards: Number of Shares of Stock or Units |
All Other Option Awards: Number of Securities Underlying Options |
Exercise or Base Price of Option Awards ($) |
Grant Date Fair Value of Stock and Option Awards ($)2 |
||||||||||||||||||||||
| Target ($)1 |
Maximum ($)1 |
|||||||||||||||||||||||||||
| Anthony Bettencourt3 |
— | $ | 375,000 | $ | 421,875 | — | — | — | — | |||||||||||||||||||
| 08/20/2014 | — | — | 265,000 | 4 | — | — | $ | 7,751,250 | ||||||||||||||||||||
| 08/20/2014 | — | — | — | 265,000 | 5 | $ | 29.25 | $ | 3,895,685 | |||||||||||||||||||
| Shlomo Kramer6 |
— | $ | 144,578 | $ | 162,650 | — | — | — | — | |||||||||||||||||||
| 02/04/2014 | — | — | 40,000 | 7 | — | — | $ | 2,186,400 | ||||||||||||||||||||
| 02/04/2014 | — | — | — | 40,000 | 8 | $ | 54.66 | $ | 991,352 | |||||||||||||||||||
| Mark E. Kraynak |
— | $ | 80,000 | $ | 90,000 | — | — | — | — | |||||||||||||||||||
| 02/04/2014 | — | — | 24,000 | 7 | — | — | $ | 1,311,840 | ||||||||||||||||||||
| 02/04/2014 | — | — | — | 24,000 | 8 | $ | 54.66 | $ | 594,811 | |||||||||||||||||||
| Michael D. Mooney9 |
— | $ | 275,000 | 10 | $ | 275,000 | 10 | — | — | — | — | |||||||||||||||||
| 10/08/2014 | — | — | 50,000 | 11 | — | — | $ | 1,455,000 | ||||||||||||||||||||
| 10/08/2014 | — | — | — | 50,000 | 12 | $ | 29.10 | $ | 729,450 | |||||||||||||||||||
| Terrence J. Schmid |
— | $ | 160,00 | $ | 180,000 | — | — | — | — | |||||||||||||||||||
| 02/04/2014 | — | — | 30,000 | 7 | — | — | $ | 1,639,800 | ||||||||||||||||||||
| 02/04/2014 | — | — | — | 30,000 | 8 | $ | 54.66 | $ | 753,936 | |||||||||||||||||||
| Jason Forget |
— | $ | 250,000 | 13 | $ | 250,000 | 13 | — | — | — | — | |||||||||||||||||
| 02/04/2014 | — | — | 24,000 | 7 | — | — | $ | 1,311,840 | ||||||||||||||||||||
| 02/04/2014 | — | — | — | 24,000 | 8 | $ | 54.66 | $ | 594,811 | |||||||||||||||||||
| 1 | With respect to Messrs. Bettencourt, Kramer, Kraynak and Schmid, represents the maximum annual aggregate of the quarterly bonuses. However, no quarterly bonuses are payable if (a) Imperva does not achieve at least 85% of its quarterly revenues target or (b) quarterly operating expenses are more than 115% of the quarterly operating expenses target (together, the “Threshold”). For further information regarding the quarterly bonuses, see “Compensation Discussion and Analysis—Cash Bonuses under Our Bonus Plan.” |
| 2 | The grant date fair value of each equity award is computed in accordance with FASB ASC 718. |
| 3 | Mr. Bettencourt’s employment commenced in August 2014, and the quarterly bonuses were prorated for the portion of 2014 that Mr. Bettencourt was employed by the company. |
| 4 | These RSUs vest over four years as follows: 25% of the RSUs vest one year following November 15, 2014, with the remaining 75% vesting in equal quarterly installments over the next three years. |
| 5 | These options vest over four years as follows: 25% of the shares vest one year following August 19, 2014, with the remaining 75% vesting in equal quarterly installments over the next three years. |
| 6 | From January 2014 to August 2014, Mr. Kramer was our President and Chief Executive Officer, with an annual bonus target of NIS 1,207,000 (or $337,348). Since August 2014, Mr. Kramer has been our Chief Strategy Officer, with an annual bonus target of NIS 517,286 (or $144,578). Mr. Kramer’s bonuses are paid in Israeli shekels and the target and maximum amounts have been converted to U.S. dollars for the purposes of the column and this footnote, using the average exchange rate for 2014 of US$1.00 to NIS 3.5779. |
123
Table of Contents
| 7 | These RSUs vest over four years as follows: 25% of the RSUs vest one year following February 15, 2014, with the remaining 75% vesting in equal quarterly installments over the next three years. |
| 8 | These options vest over four years as follows: 25% of the shares vest one year following January 1, 2014, with the remaining 75% vesting in equal quarterly installments over the next three years. |
| 9 | Mr. Mooney’s employment commenced in October 2014, and his commissions and bonus were determined on the company’s performance during his tenure. |
| 10 | Mr. Mooney participates in a sales compensation plan, 80% of which is commission-based and 20% of which is based on the company’s profitability. There is no maximum under his sales compensation plan. For further information regarding Mr. Mooney’s sales compensation plan, see “Compensation Discussion and Analysis—Cash Bonuses under Our Bonus Plan.” |
| 11 | These RSUs vest over four years as follows: 25% of the RSUs vest one year following November 15, 2014, with the remaining 75% vesting in equal quarterly installments over the next three years. |
| 12 | These options vest over four years as follows: 25% of the shares vest one year following October 1, 2014, with the remaining 75% vesting in equal quarterly installments over the next three years. |
| 13 | Mr. Forget participates in a sales compensation plan, 80% of which is commission-based and 20% of which is based on the company’s profitability. There is no maximum under his sales compensation plan. For further information regarding Mr. Forget’s sales compensation plan, see “Compensation Discussion and Analysis—Cash Bonuses under Our Bonus Plan.” |
Outstanding Equity Awards at Year End
The following table sets forth certain information with respect to outstanding equity awards as of December 31, 2014 with respect to our named executive officers.
| Option Awards | Stock Awards | |||||||||||||||||||||||
| Name |
Number of Securities Underlying Unexercised Options Exercisable (#) |
Number of Securities Underlying Unexercised Options Unexercisable (#) 1 |
Option Exercise Price ($) |
Option Expiration Date |
Number of Shares or Units of Stock That Have Not Vested |
Market Value of Shares or Units of Stock That Have Not Vested2 |
||||||||||||||||||
| Anthony Bettencourt |
— | 265,000 | 3 | $ | 29.25 | 08/19/2024 | — | — | ||||||||||||||||
| — | — | — | — | 265,000 | 4 | $ | 13,098,950 | |||||||||||||||||
| Shlomo Kramer |
— | — | — | — | 210,954 | 5 | $ | 10,427,456 | ||||||||||||||||
| — | 40,000 | 6 | $ | 34.55 | 02/04/2023 | — | — | |||||||||||||||||
| — | 40,000 | 7 | $ | 54.66 | 02/03/2024 | — | — | |||||||||||||||||
| — | — | — | — | 22,500 | 8 | $ | 1,112,175 | |||||||||||||||||
| — | — | — | — | 40,000 | 9 | $ | 1,977,200 | |||||||||||||||||
| Mark E. Kraynak |
5,000 | — | 10, 11 | $ | 5.42 | 03/02/2021 | — | — | ||||||||||||||||
| 4,688 | 1,562 | 11, 12 | $ | 32.79 | 02/07/2022 | — | — | |||||||||||||||||
| 6,250 | 8,750 | 13 | $ | 28.57 | 07/15/2022 | — | — | |||||||||||||||||
124
Table of Contents
| Option Awards | Stock Awards | |||||||||||||||||||||||
| Name |
Number of Securities Underlying Unexercised Options Exercisable (#) |
Number of Securities Underlying Unexercised Options Unexercisable (#) 1 |
Option Exercise Price ($) |
Option Expiration Date |
Number of Shares or Units of Stock That Have Not Vested |
Market Value of Shares or Units of Stock That Have Not Vested2 |
||||||||||||||||||
| 6,563 | 8,437 | 6 | $ | 34.55 | 02/04/2023 | — | — | |||||||||||||||||
| — | 24,000 | 7 | $ | 54.66 | 02/03/2024 | — | — | |||||||||||||||||
| — | — | — | — | 6,250 | 14 | $ | 308,938 | |||||||||||||||||
| — | — | — | — | 10,000 | 15 | $ | 494,300 | |||||||||||||||||
| — | — | — | — | 8,437 | 8 | $ | 417,041 | |||||||||||||||||
| — | — | — | — | 24,000 | 9 | $ | 1,186,320 | |||||||||||||||||
| Michael D. Mooney |
— | 50,000 | 16 | $ | 29.10 | 10/07/2024 | — | — | ||||||||||||||||
| — | — | — | — | 50,000 | 4 | $ | 2,471,500 | |||||||||||||||||
| Terrence J. Schmid |
6,437 | — | 17 | $ | 3.70 | 11/17/2020 | — | — | ||||||||||||||||
| 6,563 | 8,437 | 6 | $ | 34.55 | 02/04/2023 | — | — | |||||||||||||||||
| — | 30,000 | 18 | $ | 54.66 | 02/03/2024 | — | — | |||||||||||||||||
| — | — | — | — | 8,437 | 8 | $ | 417,041 | |||||||||||||||||
| — | — | — | — | 30,000 | 19 | $ | 1,482,900 | |||||||||||||||||
| Jason Forget |
— | 1,562 | 11, 12 | $ | 32.79 | 02/07/2022 | — | — | ||||||||||||||||
| — | 8,750 | 13 | $ | 28.57 | 07/15/2022 | — | — | |||||||||||||||||
| — | 8,437 | 6 | $ | 34.55 | 02/04/2023 | — | — | |||||||||||||||||
| — | 24,000 | 7 | $ | 54.66 | 02/03/2024 | — | — | |||||||||||||||||
| — | — | — | — | 6,250 | 14 | $ | 308,938 | |||||||||||||||||
| — | — | — | — | 10,000 | 15 | $ | 494,300 | |||||||||||||||||
| — | — | — | — | 8,437 | 8 | $ | 417,041 | |||||||||||||||||
| — | — | — | — | 24,000 | 9 | $ | 1,186,320 | |||||||||||||||||
| 1 | Unless otherwise indicated, these options vest over four years as follows: 25% of the shares vest one year following the vesting commencement date (as noted below), with the remaining 75% vesting in equal quarterly installments over the next three years. |
| 2 | The closing price of our common stock as of December 31, 2014 was $49.43 per share. |
| 3 | The vesting commencement date of this option is August 19, 2014. |
| 4 | The vesting commencement date of this restricted stock unit is November 15, 2014. |
| 5 | Our right of repurchase with respect to these shares lapses after 60 months of continuous service after the vesting commencement date of September 30, 2010. |
| 6 | The vesting commencement date of this option is January 1, 2013. |
| 7 | The vesting commencement date of this option is January 1, 2014. |
| 8 | The vesting commencement date of this restricted stock unit is February 15, 2013. |
| 9 | The vesting commencement date of this restricted stock unit is February 15, 2014. |
| 10 | The vesting commencement date of this option is January 1, 2011. |
| 11 | These options vest over three years as follows: 25% of the shares vest twenty seven months following the vesting commencement date (as noted), with the remaining 75% vesting in equal quarterly installments over the next three quarters. |
| 12 | The vesting commencement date of this option is January 1, 2012. |
| 13 | The vesting commencement date of this option is July 1, 2012. |
| 14 | These RSUs vest over three years as follows: 100% of the RSUs vest three years following the vesting commencement date of February 15, 2012. |
125
Table of Contents
| 15 | The vesting commencement date of this restricted stock unit is November 15, 2012. This restricted stock unit vests over four years as follows: 25% of the shares vest one year following the vesting commencement date, with the remaining 75% vesting in equal annual installments over the next three years. |
| 16 | The vesting commencement date of this option is October 1, 2014. |
| 17 | The vesting commencement date of this option is November 1, 2010. |
| 18 | The vesting commencement date of this option is January 1, 2014. This option vests over four years as follows: 50% of the shares vest two years following the vesting commencement date, with the remaining 50% vesting in equal quarterly installments over the next two years. |
| 19 | The vesting commencement date of this restricted stock unit is February 15, 2014. This restricted stock unit vests over four years as follows: 50% of the shares vest two years following the vesting commencement date, with the remaining 50% vesting in equal quarterly installments over the next two years. |
126
Table of Contents
Option Exercises and Stock Vested—2014
The following table sets forth certain information with respect to options that were exercised and stock that vested during the fiscal year ending December 31, 2014 with respect to our named executive officers.
| Option Awards | Stock Awards | |||||||||||||||
| Name |
Number of Shares Acquired on Exercise |
Value Realized on Exercise1 |
Number of Shares Acquired on Vesting |
Value Realized on Vesting |
||||||||||||
| Anthony Bettencourt |
— | — | — | — | ||||||||||||
| Shlomo Kramer |
— | — | 39,554 | $ | 2,175,470 | 2 | ||||||||||
| — | — | 39,554 | $ | 922,399 | 3 | |||||||||||
| — | — | 10,000 | $ | 626,800 | 4 | |||||||||||
| — | — | 2,500 | $ | 52,425 | 5 | |||||||||||
| — | — | 2,500 | $ | 68,425 | 6 | |||||||||||
| — | — | 2,500 | $ | 106,750 | 7 | |||||||||||
| Mark E. Kraynak |
— | — | 3,750 | $ | 224,288 | 8,9 | ||||||||||
| — | — | 938 | $ | 19,670 | 5,9 | |||||||||||
| — | — | 937 | $ | 25,646 | 6,9 | |||||||||||
| — | — | 5,938 | $ | 253,553 | 7,9 | |||||||||||
| Michael D. Mooney |
— | — | — | — | ||||||||||||
| Terrence J. Schmid |
46,563 | $ | 1,258,144 | — | — | |||||||||||
| — | — | 3,750 | $ | 224,288 | 8,9 | |||||||||||
| — | — | 938 | $ | 19,670 | 5,9 | |||||||||||
| — | — | 937 | $ | 25,646 | 6,9 | |||||||||||
| — | — | 938 | $ | 40,053 | 7,9 | |||||||||||
| Jason Forget |
20,313 | $ | 262,141 | — | — | |||||||||||
| — | — | 3,750 | $ | 224,288 | 8,9 | |||||||||||
| — | — | 938 | $ | 19,670 | 5,9 | |||||||||||
| — | — | 937 | $ | 25,646 | 6,9 | |||||||||||
| — | — | 5,938 | $ | 253,553 | 7,9 | |||||||||||
| 1 | Unless otherwise indicated, based on the difference between the same-day sale price of such shares and the exercise price of the option. |
| 2 | Based on the closing price of our common stock on January 31, 2014, the business day prior to when such shares vested. |
| 3 | Based on the closing price of our common stock on May 1, 2014 when such shares vested. |
| 4 | Based on the closing price of our common stock on February 27, 2014 when such shares settled. |
| 5 | Based on the closing price of our common stock on May 15, 2014 when such shares settled. |
| 6 | Based on the closing price of our common stock on August 15, 2014 when such shares settled. |
| 7 | Based on the closing price of our common stock on November 17, 2014 when such shares settled. |
| 8 | Based on the closing price of our common stock on February 18, 2014 when such shares settled. |
| 9 | A portion of the shares listed in this column was withheld to satisfy the named executive officer’s tax withholding obligations. |
127
Table of Contents
401(k) Savings Plan
We have established a 401(k) plan to allow our employees to save on a tax-favorable basis for their retirement. We do not match any contributions made by any employees, including our named executive officers, pursuant to the plan.
Pension Benefits
None of our named executive officers participate in or have account balances in pension benefit plans sponsored by us.
Non-Qualified Defined Contribution and Other Non-Qualified Defined Compensation Plans
None of our named executive officers participate in or have account balances in non-qualified defined contribution plans or other deferred compensation plans maintained by us.
Proprietary Information and Inventions Agreements
Each of our named executive officers has also entered into a standard form agreement with respect to proprietary information and inventions. Among other things, this agreement obligates each named executive officer to refrain from disclosing any of our proprietary information received during the course of employment and, with some exceptions, to assign to us any inventions conceived or developed during the course of employment.
Employment, Severance and Change in Control Agreements
We consider it essential to the best interests of our stockholders to foster the continuous employment of our key management personnel. In this regard, we recognize that the possibility of a change in control may exist and that the uncertainty and questions that it may raise among executives could result in the departure or distraction of executives to the detriment of the company and our stockholders. In order to reinforce and encourage the continued attention and dedication of certain key members of management, we previously entered into change in control agreements with certain of our named executive officers, some of which contained both single and double trigger acceleration. In connection with the executive compensation review process conducted at the beginning of 2012 by our compensation committee, our compensation committee adopted a Change in Control Plan in order to harmonize the change of control provisions across all executive officers and to eliminate all single trigger acceleration provisions.
Under the Change in Control Plan, in the event of a qualifying termination in connection with a Change in Control (as defined below) and contingent upon the participant’s execution of a binding severance and release agreement (which includes customary release, covenant not-to-sue, non-disparagement, non-solicitation and proprietary information provisions), the participant will be entitled to receive (1) a lump sum cash payment in an amount equal to such participant’s annual base salary as in effect immediately prior to the severance date, plus such participant’s target annual bonus or cash incentive opportunity for the year in which the severance date occurs, less applicable withholding taxes; (2) full acceleration of all outstanding equity awards (subject to certain restrictions noted in the Change in Control Plan); and (3) reimbursement of premiums paid for continuation coverage for twelve months pursuant to the Consolidated Omnibus Budget Reconciliation Act of 1985.
A qualifying termination will be deemed to have occurred if the executive officer is terminated within the three months prior to a potential Change in Control or twelve months following a Change in Control and such termination is by Imperva without Cause (as defined below) or by the executive officer for Good Reason (as defined below).
“Cause” will be deemed to exist upon the occurrence of any of the following:
| • | any willful, material violation by the executive officer of any law or regulation applicable to the business of Imperva, the executive officer’s conviction for, or guilty plea to, a felony or a crime involving moral turpitude, or any willful perpetration by the executive officer of a common law fraud; |
| • | the executive officer’s commission of an act of personal dishonesty which involves personal profit in connection with Imperva or any other entity having a business relationship with Imperva; |
| • | any material breach by the executive officer of any provision of any agreement or understanding between Imperva and the executive officer regarding the terms of the executive officer’s service as an employee, officer, director or consultant to Imperva, including without limitation the willful and continued failure or refusal of the executive officer to perform the material duties required of such executive officer as an employee, officer, director or |
128
Table of Contents
| consultant of Imperva, other than as a result of having a disability, or a breach of any applicable invention assignment and confidentiality agreement or similar agreement between Imperva and the executive officer; |
| • | the executive officer’s disregard of the policies of Imperva so as to cause loss, damage or injury to the property, reputation or employees of Imperva; |
| • | failure by the executive officer to substantially perform, or gross negligence in the performance of the executive officer’s duties after there has been delivered to the executive officer written demand for performance which describes the specific deficiencies in the executive officer’s performance and the specific manner in which performance must be improved, and which provides 30 days from the date of notice to remedy performance deficiencies subject to remedy; or |
| • | any other misconduct by the executive officer which is materially injurious to the financial condition or business reputation of, or is otherwise materially injurious to, Imperva. |
A “Change in Control” will be deemed to have occurred if any one of the following events shall have occurred:
| • | any “person” (as such term is used in Sections 13(d) and 14(d) of the Securities Exchange Act of 1934 (the “Exchange Act”)) or group becomes the “beneficial owner” (as defined in Rule 13d-3 of the Exchange Act), directly or indirectly, of securities of the company representing 50% or more of the total voting power represented by the company’s then-outstanding voting securities; |
| • | the consummation of the sale or disposition by the company of all or substantially all of the company’s assets; |
| • | the consummation of a merger, reorganization, consolidation or similar transaction or series of related transactions of the company with any other corporation, other than a merger or consolidation which would result in the voting securities of the company outstanding immediately prior thereto continuing to represent (either by remaining outstanding or by being converted into voting securities of the surviving entity or its parent) at least a majority of the total voting power represented by the voting securities of the company or such surviving entity or its parent outstanding immediately after such merger, reorganization, consolidation or similar transaction (or series of related transactions); or |
| • | any other transaction which qualifies as a “corporate transaction” under Section 424(a) of the Internal Revenue Code wherein the stockholders of the company give up all of their equity interest in the company (except for the acquisition, sale or transfer of all or substantially all of the outstanding shares of the company). |
“Good Reason” will be deemed to exist upon the occurrence, without the affected executive officer’s written consent, of any of the following:
| • | a material diminution in the executive officer’s authority, duties and responsibilities or, solely with respect to Imperva’s Chief Executive Officer, Chief Financial Officer and General Counsel, a change in the executive officer’s title; |
| • | a material diminution in the executive officer’s annual base salary, annual bonus opportunity, or long-term incentive opportunity; |
| • | any action or inaction that constitutes a material breach by Imperva of this Agreement; or |
| • | a material change (defined for this purpose to mean a change greater than 30 miles from the executive officer’s current principal place of employment) in the geographic location of the executive officer’s principal place of employment. |
The Change in Control Plan will terminate automatically one year and one day after the Change in Control, or if later, when all benefits payable under the Plan are paid.
In order to be eligible to participate in the Change in Control Plan, the participant must opt in to the Change in Control Plan and waive any existing severance arrangement that would be triggered by a Change in Control or similar transaction.
Potential Payments Upon Termination or Change in Control
The tables below reflect potential payments and benefits available for each of our named executive officers upon termination in connection with a change in control or termination, assuming the date of occurrence is December 31, 2014 and reflects payments and benefits that are provided in the Change in Control Plan. See section entitled “Executive Compensation—Employment, Severance and Change in Control Agreements.”
129
Table of Contents
Named Executive Officer Benefits and Payments Upon Termination 1
| Name |
Termination | Involuntary Termination within One Year of Change in Control 2 |
||||||
| Anthony Bettencourt |
— | $ | 774,701 | |||||
| Shlomo Kramer3 |
— | $ | 481,927 | |||||
| Mark E. Kraynak |
— | $ | 382,574 | |||||
| Michael D. Mooney |
— | $ | 472,574 | |||||
| Terrence J. Schmid |
— | $ | 624,701 | |||||
| Jason Forget4 |
— | — | ||||||
| 1 | Assumes triggering event effective as of December 31, 2014. Upon a voluntary termination or termination for cause, each named executive officer also would receive any earned but unpaid base salary and unpaid vacation accrued as of December 31, 2014. These payments would be available to all employees upon termination. |
| 2 | Includes continuation of base salary for twelve months, payment of cash bonus at target and, for all named executive officers other than Mr. Kramer, continuation of COBRA for twelve months. |
| 3 | Mr. Kramer’s base salary and annual bonus targets are NIS 1,034,571 and NIS 517,286, respectively. The dollar amount specified in this table is calculated using the average exchange rate for 2014 of US$1.00 to NIS 3.5779. |
| 4 | Mr. Forget resigned in September 2014, effective March 31, 2015, and no longer served as an executive officer following the announcement of his resignation. As a result, Mr. Forget is no longer eligible to participate in the Change in Control Plan. |
Acceleration of Vesting of Options and Restricted Stock upon Termination 1
| Name |
Number of Shares of Accelerated Stock and Value upon a Change in Control |
Number of Shares of Accelerated Stock and Value upon Involuntary Termination and in Connection with a Change in Control |
||||||
| Anthony Bettencourt |
— | $ | 18,446,650 | 2 | ||||
| Shlomo Kramer |
— | $ | 14,112,031 | 3 | ||||
| Mark Kraynak |
— | $ | 2,740,658 | 4 | ||||
| Michael D. Mooney |
— | $ | 3,488,000 | 5 | ||||
| Terrence J. Schmid |
— | $ | 2,025,483 | 6 | ||||
| Jason Forget7 |
— | — | ||||||
| 1 | Assumes triggering event effective as of December 31, 2014 and excludes vested stock held as of such date. The closing price of our common stock as of December 31, 2014 was $49.43 per share. |
| 2 | 265,000 of Mr. Bettencourt’s options and 265,000 of Mr. Bettencourt’s RSUs would accelerate upon an involuntary termination three months before or within 12 months following a change in control. The exercise price with respect to the options is $29.25 per share. |
| 3 | The company’s right of repurchase with respect to 210,954 shares would lapse upon involuntary termination three months prior to or 12 months following a change in control. In addition, 80,000 of Mr. Kramer’s options and 62,500 of Mr. Kramer’s RSUs would accelerate upon an involuntary termination three months before or within 12 months following a change in control. The exercise price with respect to 40,000 of such options is $34.55 per share. The exercise price with respect to 40,000 of Mr. Kramer’s options is $54.66 per share and, since the exercise price is higher than the closing price of our common stock as of December 31, 2014, such options have been ascribed a zero value for purposes of this table. |
| 4 | 42,749 of Mr. Kraynak’s options and 48,687 of Mr. Kraynak’s RSUs would accelerate upon an involuntary termination three months before or within 12 months following a change in control. The exercise price with respect to 1,562 of such options is $32.79 per share. The exercise price with respect to 8,750 of such options is $28.57 per share. The exercise price with respect to 8,437 of such options is $34.55 per share. The exercise price with respect to 24,000 of Mr. Kraynak’s options is $54.66 per share and, since the exercise price is higher than the closing price of our common stock as of December 31, 2014, such options have been ascribed a zero value for purposes of this table. |
| 5 | 50,000 of Mr. Mooney’s options and 50,000 of Mr. Mooney’s RSUs would accelerate upon an involuntary termination three months before or within 12 months following a change in control. The exercise price with respect to the options is $29.10 per share. |
130
Table of Contents
| 6 | 38,437 of Mr. Schmid’s options and 38,437 of Mr. Schmid’s RSUs would accelerate upon an involuntary termination three months before or within 12 months following a change in control. The exercise price with respect to 8,437 of such options is $34.55 per share. The exercise price with respect to 30,000 of Mr. Schmid’s options is $54.66 per share and, since the exercise price is higher than the closing price of our common stock as of December 31, 2014, such options have been ascribed a zero value for purposes of this table. |
| 7 | Mr. Forget resigned in September 2014, effective March 31, 2015, and no longer served as an executive officer following the announcement of his resignation. As a result, Mr. Forget is no longer eligible to participate in the Change in Control Plan. |
Limitation on Liability and Indemnification Matters
Our certificate of incorporation contains provisions that limit the liability of our directors for monetary damages to the fullest extent permitted by Delaware law. Consequently, our directors will not be personally liable to us or our stockholders for monetary damages for any breach of fiduciary duties as directors, except liability for:
| • | any breach of the director’s duty of loyalty to us or our stockholders; |
| • | any act or omission not in good faith or that involves intentional misconduct or a knowing violation of law; |
| • | unlawful payments of dividends or unlawful stock repurchases or redemptions as provided in Section 174 of the Delaware General Corporation Law; or |
| • | any transaction from which the director derived an improper personal benefit. |
Our certificate of incorporation provides that we are required to indemnify our directors and our bylaws provide that we are required to indemnify our directors and officers, in each case to the fullest extent permitted by Delaware law. Any repeal of or modification to our certificate of incorporation or bylaws may not adversely affect any right or protection of a director or officer for or with respect to any acts or omissions of such director or officer occurring prior to such amendment or repeal. Our bylaws also provide that we must advance expenses incurred by a director or officer in advance of the final disposition of any action or proceeding, and permit us to secure insurance on behalf of any officer, director, employee or other agent for any liability arising out of his or her actions in that capacity regardless of whether we would otherwise be permitted to indemnify him or her under the provisions of Delaware law. We have entered and expect to continue to enter into agreements to indemnify our directors, executive officers and other employees as determined by our board of directors. With certain exceptions, these agreements provide for indemnification for related expenses including, among other things, attorneys’ fees, judgments, fines and settlement amounts incurred by any of these individuals in any action or proceeding. We believe that these bylaw provisions and indemnification agreements are necessary to attract and retain qualified persons as directors and officers. We also maintain directors’ and officers’ liability insurance.
The limitation of liability and indemnification provisions in our certificate of incorporation and bylaws may discourage stockholders from bringing a lawsuit against our directors for breach of their fiduciary duty. They may also reduce the likelihood of derivative litigation against our directors and officers, even though an action, if successful, might benefit us and other stockholders. Further, a stockholder’s investment may be adversely affected to the extent that we pay the costs of settlement and damage awards against directors and officers as required by these indemnification provisions. For a description of material pending litigation or proceedings involving any of our directors, officers or employees for which indemnification is sought, see “Legal Proceedings” in Part I, Item 3 of this Annual Report on Form 10-K.
Director Compensation
The compensation committee, after considering the information, analysis and recommendation provided by Compensia, evaluates the appropriate level and form of compensation for non-employee directors and recommends changes to the board when appropriate.
The board of directors has adopted the following policies with respect to the compensation of non-employee directors:
Each non-employee director receives a $40,000 annual retainer as consideration for services on our board of directors. The non-employee chairman of the board of directors, if any, receives an additional $20,000 annual retainer. The chair of the audit committee receives an additional $16,000 annual retainer and the other members of the audit committee each receives an additional $8,000 annual retainer. The chair of the compensation committee receives an additional $12,000 annual retainer and the other members of the compensation committee each receives an additional $6,000 annual retainer. The chair of the nominating and corporate governance committee receives an additional $7,500 annual retainer and the other members of the nominating and corporate governance committee each receives an additional $3,750 annual retainer. All cash compensation to directors is paid in quarterly installments upon continuing service.
131
Table of Contents
In addition, each non-employee director is eligible to receive (on or around the date of our annual stockholders’ meeting) (1) a stock option grant with a Black-Scholes value of $65,000 based on the date of grant, and (2) RSUs with a number of shares equal to $65,000 divided by the closing price of the company’s common stock on the New York Stock Exchange on the date of grant, in each case vesting after one year. Further, each new non-employee director receives (1) a stock option grant when such director initially joins our board of directors with a Black-Scholes value of $130,000 based on the date of grant, and (2) RSUs with a number of shares equal to $130,000 divided by the closing price of the company’s common stock on the New York Stock Exchange on the date of grant, in each case vesting over three years in equal annual installments.
Director Compensation Table
The following table provides information for our year ended December 31, 2014 regarding all plan and non-plan compensation awarded to, earned by or paid to each person who served as a non-employee director in 2014. Other than as set forth in the table and the narrative that follows it, in 2014 we did not pay any fees to or reimburse any expenses of our non-employee directors, made any equity or non-equity awards to non-employee directors or paid any other compensation to non-employee directors. All compensation that we paid to Mr. Bettencourt, our only employee director, and Mr. Kramer, who was an employee director until January 2015, is set forth in the tables summarizing executive officer compensation below. No compensation was paid in 2014 to either Mr. Bettencourt or Mr. Kramer in his capacity as a director.
| Name |
Fees Earned or Paid in Cash1 |
Equity Awards2 |
Total |
|||||||||
| Gregory Clark3 |
$ | 23,626 | $ | 263,793 | $ | 287,419 | ||||||
| Charles Giancarlo |
$ | 49,750 | $ | 122,154 | $ | 171,904 | ||||||
| Theresia Gouw |
$ | 53,500 | $ | 122,154 | $ | 175,654 | ||||||
| Steven Krausz |
$ | 51,750 | $ | 122,154 | $ | 173,904 | ||||||
| Albert A. Pimentel |
$ | 48,000 | $ | 122,154 | $ | 170,154 | ||||||
| Frank Slootman |
$ | 52,000 | $ | 122,154 | $ | 174,154 | ||||||
| David N. Strohm4 |
$ | 24,000 | $ | 122,154 | $ | 146,154 | ||||||
| Allan Tessler5 |
— | — | — | |||||||||
| James Tolonen |
$ | 59,750 | $ | 122,154 | $ | 181,904 | ||||||
| 1 | These amounts reflect quarterly retainer fees in 2014for board and committee service. |
| 2 | Amounts shown in this column do not reflect dollar amounts actually received by the non-employee director. Instead, these amounts reflect the aggregate full grant date fair value calculated in accordance with Financial Accounting Standards Board Accounting Standards Codification Topic 718, Compensation–Stock Compensation, (formerly SFAS 123R), or ASC 718, for awards granted during 2014. See Note 12 of the Notes to our Consolidated Financial Statements in this Annual Report on Form 10-K for a discussion of all assumptions made in determining the grant date fair values. |
| 3 | Mr. Clark joined the board of directors in May 2014. His quarterly retainer fees were prorated from the commencement of his service as a director. |
| 4 | Mr. Strohm resigned from the board of directors effective June 2014. |
| 5 | Mr. Tessler joined the board of directors in February 2015 and, accordingly, did not receive compensation in 2014. |
Compensation Committee Interlocks and Insider Participation
During 2014, our compensation committee consisted of Messrs. Slootman and Giancarlo, and Ms. Gouw. None of them has at any time in the last year or previously been one of our officers or employees and none has had any relationships with our company of the type that is required to be disclosed under Item 404 of Regulation S-K. None of our executive officers has served as a member of the board of directors, or as a member of the compensation or similar committee, of any entity that has one or more executive officers who served on our board of directors or compensation committee during 2014.
132
Table of Contents
Item 12. Security Ownership of Certain Beneficial Owners and Management and Related Stockholder Matters
For the information required by this item with respect to Item 201(d) of Regulation S-K regarding securities authorized for issuance under equity compensation plans, see “Item 5. Market for Registrant’s Common Equity, Related Stockholder Matters and Issuer Purchases of Equity Securities—Equity Compensation Plan Information.”
Principal Stockholders
The following table sets forth certain information with respect to the beneficial ownership of our common stock as of February 17, 2015 for:
| • | each person who we know beneficially owns more than 5% of our common stock; |
| • | each of our directors; |
| • | each of our named executive officers; and |
| • | all of our directors and executive officers as a group. |
We have determined beneficial ownership in accordance with the rules of the SEC. Except as indicated by the footnotes below, we believe, based on the information furnished to us, that the persons and entities named in the table below have sole voting and investment power with respect to all shares of common stock that they beneficially own, subject to applicable community property laws.
Applicable percentage ownership is based on 27,130,846 shares of common stock outstanding at February 17, 2015. In computing the number of shares of common stock beneficially owned by a person and the percentage ownership of that person, we deemed to be outstanding all shares of common stock subject to options or other convertible securities held by that person or entity that are currently exercisable or exercisable within 60 days of February 17, 2015. We did not deem these shares outstanding, however, for the purpose of computing the percentage ownership of any other person. Unless otherwise indicated, the address of each beneficial owner listed in the table below is care of Imperva, Inc., 3400 Bridge Parkway, Suite 200, Redwood Shores, CA 94065.
| Name of Beneficial Owner |
Shares Beneficially Owned |
Percentage | ||||||
| Directors and Executive Officers: |
||||||||
| Anthony Bettencourt |
— | — | ||||||
| Shlomo Kramer1 |
3,714,957 | 13.7 | % | |||||
| Gregory Clark |
— | — | ||||||
| Charles Giancarlo2 |
6,994 | * | ||||||
| Theresia Gouw3 |
89,238 | * | ||||||
| Steven Krausz4 |
17,677 | * | ||||||
| Albert A. Pimentel5 |
62,770 | * | ||||||
| Frank Slootman6 |
32,770 | * | ||||||
| Allan Tessler7 |
20,000 | * | ||||||
| James Tolonen8 |
20,000 | * | ||||||
| Mark Kraynak9 |
17,564 | * | ||||||
| Michael D. Mooney |
— | — | ||||||
| Sunil Nagdev |
— | — | ||||||
| Trâm Phi10 |
62,304 | * | ||||||
| Terrence Schmid11 |
15,989 | * | ||||||
| Yaniv Shaya12 |
43,652 | * | ||||||
| Amichai Shulman13 |
155,005 | * | ||||||
| All executive officers and directors as a group (15 persons)14 |
4,290,018 | 15.7 | % | |||||
| Other 5% Stockholders: |
||||||||
| FMR LLC15 |
3,078,680 | 11.3 | % | |||||
| JPMorgan Chase & Co.16 |
1,637,299 | 6.0 | % | |||||
| Eagle Asset Management, Inc.17 |
1,381,959 | 5.4 | % | |||||
| The Vanguard Group18 |
1,381,959 | 5.1 | % | |||||
| Blackrock, Inc.19 |
1,365,639 | 5.0 | % | |||||
133
Table of Contents
| * | Represents beneficial ownership of less than 1% of the shares of common stock. |
| 1 | Includes (i) 1,249,521 shares of common stock owned of record by Mr. Kramer, of which 210,954 shares are subject to the company’s right of repurchase within 60 days of February 17, 2015, (ii) options exercisable for 35,000 shares of common stock within 60 days of February 17, 2015, and (iii) 2,430,436 shares of common stock owned of record by HAPRI LIMITED, an investment holding company. Mr. Kramer is one of two directors of HAPRI LIMITED, with Amir Rapoport, the Kramer family office Chief Financial Officer, being the other director. All of HAPRI LIMITED’s shares are ultimately controlled by a trust of which Mr. Kramer is the sole grantor and sole beneficiary during his life. The address for HAPRI LIMITED is PFD Corporate Services (BVI) Limited, Tropic Isle Building, P.O. Box 3331, Road Town, Tortola, British Virgin Islands VG 1110. |
| 2 | Includes (i) 2,197 shares of common stock owned of record by Mr. Giancarlo and (ii) options exercisable for 4,797 shares of common stock within 60 days of February 17, 2015. |
| 3 | Includes (i) 1,355 shares of common stock owned of record by Ms. Gouw, (ii) 76,468 shares of common stock owned of record by SGLG 2013 I GRAT dated 8/1/2013, of which Ms. Gouw is a trustee and shares voting and investment power over the Trust and (iii) options exercisable for 11,415 shares of common stock within 60 days of February 17, 2015. |
| 4 | Includes (i) 6,262 shares of common stock owned of record by Mr. Krausz and (ii) options exercisable for 11,415 shares of common stock within 60 days of February 17, 2015. |
| 5 | Includes (i) 51,355 shares of common stock owned of record by the Pimentel Family Trust U/D/T dated April 24, 1991 for which Albert A. Pimentel and Laurie Jean Pimentel serve as trustees and (ii) options exercisable for 11,415 shares of common stock within 60 days of February 17, 2015. |
| 6 | Includes (i) 21,355 shares of common stock owned of record by Mr. Slootman, of which 4,167 shares are subject to the company’s right of repurchase within 60 days of February 17, 2015 and (ii) options exercisable for 11,415 shares of common stock within 60 days of February 17, 2015. |
| 7 | Includes (i) 3,250 shares of common stock owned of record by International Financial GP of Nevada, of which Mr. Tessler is the sole owner and Chairman and Chief Executive Officer, (ii) 7,500 shares of common stock owned of record by the Allan R. Tessler Charitable Remainder Unitrust #1 U/A/D dated December 16, 1996, for which Mr. Tessler serves as trustee, (iii) 7,500 shares of common stock owned of record by the Allan R. Tessler Charitable Remainder Unitrust #2 U/A/D dated December 16, 1996, for which Mr. Tessler serves as trustee and (iv) 1,750 shares of common stock owned of record by Tessler Family Limited, of which Mr. Tessler is the Managing Partner. |
| 8 | Includes (i) 3,880 shares of common stock owned of record by Mr. Tolonen, (ii) 5,000 shares of common stock owned of record by James R. Tolonen & Ginger Tolonen as Trustees of the Tolonen Family Trust, dated September 26, 1996 and (iii) options exercisable for 8,684 shares of common stock within 60 days of March 13, 2015. |
| 9 | Includes (i) 15,160 shares of common stock owned of record by Mr. Kraynak, and (ii) options exercisable for 35,938 shares of common stock within 60 days of February 17, 2015. |
| 10 | Includes (i) 3,021 shares of common stock owned of record by Ms. Phi, and (ii) options exercisable for 59,283 shares of common stock within 60 days of February 17, 2015. |
| 11 | Includes (i) 1,114 shares of common stock owned of record by Mr. Schmid, and (ii) options exercisable for 14,875 shares of common stock within 60 days of February 17, 2015. |
| 12 | Includes (i) 26,152 shares of common stock owned of record by Mr. Shaya, and (ii) options exercisable for 17,500 shares of common stock within 60 days of February 17, 2015. |
| 13 | Includes (i) 80,927 shares of common stock owned of record by Mr. Shulman, of which 11,784 are currently being held in escrow and will be released no later than 24 months of February 7, 2014, subject to reduction as provided in the Share Exchange Agreement dated February 6, 2014, as amended on February 21, 2014 by and among Imperva, Skyfence Networks, Ltd., the shareholders of Skyfence Networks, Ltd. and Ofer Hendler, in his separate capacity as the Sellers’ Representative; (ii) 58,765 shares of common stock owned of record by Amichai Shulman Holdings 2000 Ltd., of which Mr. Shulman has voting and investment power; and (iii) options exercisable for 15,313 shares of common stock within 60 days of February 17, 2015. |
134
Table of Contents
| 14 | Includes (i) options exercisable for 237,050 shares of common stock within 60 days of February 17, 2015, (ii) 1,237,021 shares of common stock owned of record by Mr. Kramer, of which 210,954 shares are subject to the company’s right of repurchase within 60 days of February 17, 2015, (iii) 21,355 shares of common stock owned of record by Mr. Slootman, of which 4,167 shares are subject to the company’s right of repurchase within 60 days of February 17, 2015, and (iv) 11,784 shares held by Mr. Shulman that are currently being held in escrow as described in footnote 13. |
| 15 | Based on information set forth in a Schedule 13G filed with the SEC on February 13, 2015. The principal business office of FMR LLC 245 Summer Street, Boston, MA 02210. |
| 16 | Based on information set forth in a Schedule 13G filed with the SEC on January 15, 2015. The principal business office of JPMorgan Chase & Co. is 270 Park Avenue, New York, NY 10017. |
| 17 | Based on information set forth in a Schedule 13G filed with the SEC on January 8, 2015. The principal business office of Eagle Asset Management, Inc. is 880 Carillon Parkway, St. Petersburg, Florida 33716. |
| 18 | Based on information set forth in a Schedule 13G filed with the SEC on February 10, 2015. Includes 1,391,959 shares of common stock beneficially owned by The Vanguard Group. Vanguard Fiduciary Trust Company (“VFTC”), a wholly-owned subsidiary of The Vanguard Group, Inc., is the beneficial owner of 26,253 shares of common stock as a result of its serving as investment manager of collective trust accounts. Vanguard Investments Australia, Ltd. (“VIA”), a wholly-owned subsidiary of The Vanguard Group, Inc., is the beneficial owner of 1,500 shares of common stock as a result of its serving as investment manager of Australian investment offerings. The principal business office of The Vanguard Group is 100 Vanguard Blvd., Malvern, PA 19355. |
| 19 | Based on information set forth in a Schedule 13G filed with the SEC on February 3, 2015. The principal business office of Blackrock, Inc. is 55 East 52nd Street, New York, NY 10022. |
Item 13. Certain Relationships and Related Transactions, and Director Independence
Certain Relationships and Related Party Transactions
In addition to the director and executive officer compensation arrangements discussed above “Item 11. Executive Compensation,” the following is a description of transactions, or series of related transactions, since January 1, 2014, to which we were or will be a party in which the amount involved exceeded or will exceed $120,000 and in which the other parties included or will include our directors, executive officers, holders of 5% or more of our voting securities, each of whom we refer to as a Beneficial Owner, or any member of the immediate family of any of the foregoing persons.
Employment Arrangements and Indemnification Agreements
We have entered into employment arrangements with our executive officers. See “Item 11. Executive Compensation — Employment, Severance and Change of Control Arrangements” for information regarding these arrangements with our named executive officers.
We have entered into indemnification agreements with our directors and executive officers. The indemnification agreements and our certificate of incorporation and bylaws require us to indemnify our directors and executive officers to the fullest extent permitted by Delaware law. See “Item 11. Executive Compensation — Limitation on Liability and Indemnification Matters.”
Change in Control Plan
We have adopted a Change in Control Plan that covers our executive officers, which provides for severance benefits and acceleration of the vesting of awards in the event of a termination following a change in control. For more information regarding these agreements, see “Item 11. Executive Compensation—Employment, Severance and Change in Control Agreements” and “—Potential Payments Upon Termination or Change in Control.”
Restricted Stock, Restricted Stock Units and Stock Option Awards
For information regarding restricted stock, RSUs and stock option awards granted to our named executive officers and directors, see “ Item 11. Executive Compensation,” in particular, the sections “—Compensation Discussion and Analysis—Cash Bonuses under Our Bonus Plan,” “—Outstanding Equity Awards at Year End,” “—Employment, Severance and Change in Control Agreements” and “—Director Compensation.”
135
Table of Contents
Registration Rights
Mr. Kramer, our President, Chief Executive Officer and director, is party to an agreement providing for rights to register under the Securities Act an aggregate of 2,077,766 shares of our capital stock.
Transactions With Incapsula, Inc.
On November 5, 2009, we licensed certain intellectual property to Incapsula, Inc., a company formed by Gur Shatz, one of our former employees. The license agreement granted a worldwide, non-exclusive, irrevocable, non-transferable and non-sublicensable license to certain portions of our technology and know-how for Incapsula to use in developing its SaaS implementation of web application firewalls. Incapsula agreed to indemnify us against any claims related to Incapsula’s use of the licensed technology. As consideration for entering into this license agreement, we were issued 5,000,000 shares of Incapsula’s Series A Preferred Stock, representing a 58% ownership interest of Incapsula on a shares outstanding basis at the time of issuance. As of the date of our initial acquisition of shares of Incapsula, the remaining 42% ownership interest of Incapsula was owned by Mr. Shatz.
In connection with the issuance of the Incapsula Series A Preferred Stock to us on November 5, 2009, we entered into an investors’ rights agreement, a first refusal and co-sale agreement and a voting agreement with Incapsula and Mr. Shatz. Under the investors’ rights agreement, we have a right of first negotiation, which requires Incapsula to notify us of any acquisition proposal and provides us with an exclusive period to negotiate and make an alternative acquisition proposal. In addition, we have the right to acquire Incapsula during the five-year period beginning on November 5, 2013 in exchange for payment of Incapsula’s enterprise value, as calculated under the terms of the investors’ rights agreement (the “Purchase Right”).
On November 5, 2009, Shlomo Kramer, our President and Chief Executive Officer, was appointed to the Incapsula board of directors and on November 17, 2009, Mark Kraynak, our Vice President, Worldwide Marketing, was appointed to the Incapsula board of directors. On November 16, 2009, Mr. Kramer loaned $600,000 to Incapsula pursuant to a convertible promissory note with an interest rate of 6%. A total of $11,145.21 in interest accrued under the note prior to its repayment by Incapsula, which occurred on March 9, 2010. All interest due and the principal balance of the loan has been repaid. The convertible promissory note has been terminated and there are no longer any obligations thereunder or in connection with Mr. Kramer’s loan.
On March 9, 2010, we purchased an additional 6,666,666 shares of Incapsula’s Series A Preferred Stock for $2,999,999.70, increasing our ownership interest in Incapsula to 76% on a shares outstanding basis on the date we made this additional investment. We also agreed, subject to Incapsula achieving certain milestones with respect to its operations, customers and product development before September 9, 2011, to purchase $7,000,000 worth of Incapsula’s Series A-1 Preferred Stock. In July 2011, Incapsula achieved the performance milestones including:
| • | developing a system having at least 100 active customers; |
| • | engaging two channel partners; |
| • | meeting operational milestones with respect to research and development and marketing; |
| • | preparing a 24 month financial plan; and |
| • | reaching product development goals with respect to certain functioning components and a system capable of supporting multiple users and proxies. |
As a result of Incapsula’s achievement of such performance milestones, during the quarter ended September 30, 2011 we purchased 4,375,000 shares of Incapsula’s Series A-1 Preferred Stock for $3.5 million, increasing our ownership interest in Incapsula to 82% on a shares outstanding basis on the date of issuance. In addition, in January 2012, we purchased the remaining 4,375,000 shares of Incapsula’s Series A-1 Preferred Stock for $3.5 million thereby increasing our ownership interest in Incapsula to 85% at the date of issuance.
On December 31, 2010, we entered into a license agreement with Incapsula under which, subject to certain exceptions, we agreed to provide Incapsula with a worldwide, non-exclusive, royalty free, limited license to access our ThreatRadar feed of internet protocol addresses, attack patterns and other identification data and Incapsula agreed to provide us a worldwide, non-exclusive, royalty free, limited license to use its list of internet protocol addresses. The license agreement has an initial term of one year and automatically renews each year thereafter unless either party provides 30 days prior notice that it no longer wishes to renew the agreement.
136
Table of Contents
On March 2, 2011, we entered into an affiliate and resale agreement with Incapsula. Under this agreement, we market, promote and/or resell Incapsula’s services to our existing and potential partners and customers in exchange for a share of revenues. The agreement has an initial term of two years and automatically renews each year thereafter unless either party provides six months prior notice that it no longer wishes to renew the agreement. No material amounts have been earned to date under this agreement.
In October 2013, we loaned $1.1 million to Incapsula at a rate of 2% per annum with a maturity date of December 31, 2014 (the “Incapsula Loan”).
In November 2013, we reached an agreement in principle with the major stockholders of Incapsula (other than Imperva) to acquire the remaining outstanding capital stock and assume outstanding options to acquire capital stock of Incapsula not already owned by us (the “Incapsula Acquisition”). In February 2014, we entered into a definitive agreement with the stockholders of Incapsula (other than Imperva) to effect the Incapsula Acquisition, and completed the Incapsula Acquisition in March 2014. The aggregate consideration for the Incapsula Acquisition was substantially on the terms of the Purchase Right less the outstanding principal and interest under the Incapsula Loan, or approximately $8.1 million. In connection with the Incapsula Acquisition, in addition to the consideration for the Incapsula Acquisition, we also agreed to assume Incapsula RSUs for with performance-based vesting tied to 2014 revenue for Incapsula and Incapsula-related products and services (effectively valuing such revenues similarly to the Purchase Right), which converted into approximately 180,417 shares of our common stock at the same exchange ratio applicable to the Incapsula Acquisition. In connection with the November 2013 agreement in principle, we issued to an employee ineligible to participate in Incapsula’s equity compensation plan RSUs for approximately 264,878 shares of our common stock with substantially similar performance-based vesting and conditioned on completion of the Incapsula Acquisition. These performance-based RSUs granted and assumed by Incapsula and Imperva are held by continuing employees of Incapsula.
Acquisition of Skyfence
On February 6, 2014, we entered into a Share Exchange Agreement (the “Skyfence Exchange Agreement”) with Skyfence Networks, Ltd., (“Skyfence”), the shareholders of Skyfence (the “Skyfence Shareholders”) and Ofer Hendler, in his separate capacity as the Sellers’ Representative, which agreement was amended by the parties on February 19, 2014. Upon the completion of the transactions contemplated in the Skyfence Exchange Agreement, as amended, we acquired from the Skyfence Shareholders all of the outstanding capital stock of Skyfence (and all rights to acquire such stock) (such transaction, the “Skyfence Share Exchange” or the “Skyfence Acquisition”), and in exchange we (i) issued an aggregate of 884,422 shares of Imperva common stock and (ii) paid approximately $16.1 million in cash to the Skyfence Shareholders (together, the “Skyfence Consideration”). Pursuant to the Skyfence Exchange Agreement, the shares of our common stock issued in the transaction have an ascribed value of approximately $42.1 million based on a per share price equal to $47.64, which is which is the average closing stock price of Imperva common stock for the sixty (60) trading days ending on February 6, 2014. The Skyfence Consideration reflects working capital and other adjustments that were made prior to the closing of the Share Exchange and as are set forth in the Skyfence Exchange Agreement.
As a result of the Skyfence Share Exchange and pursuant to the Skyfence Exchange Agreement, as amended, at closing on February 7, 2014: (i) 956 shares of our Common Stock (having an aggregate value of approximately $46,000 at closing valued at the method described above) and approximately $34,000 in cash were deposited in an adjustment holdback fund for a period of up to 75 days as security for the accuracy of the working capital and other adjustments described above (the “Adjustment Holdback”); (ii) 206,499 shares of our common stock (having an aggregate value of approximately $9.8 million at closing valued at the method described above) and approximately $7.6 million in cash were deposited into an indemnity holdback fund for a period of 24 months (subject to certain exceptions) as security for the indemnification obligations of the Skyfence Shareholders for any of our losses related to breaches of representations or warranties and covenants (the “Indemnity Holdback”), among other things, subject to limits specified in and as otherwise set forth in the Skyfence Exchange Agreement, as amended; and (iii) all options to purchase Ordinary Shares of Skyfence that were outstanding as of the closing and held by Skyfence employees who were offered and accepted employment with us were assumed by us with the existing vesting schedules and converted into options to purchase an aggregate of 24,248 shares of our Common Stock, with the exercise price of the shares subject to such options proportionally adjusted by the exchange ratio applicable to the Skyfence Ordinary Shares.
Shlomo Kramer, our Chief Executive Officer and board member, was a member of the board of directors of Skyfence. In addition, Mr. Kramer and Amichai Shulman, our Chief Technology Officer, were Skyfence Shareholders, owning 42.67% and 3.16%, respectively, of the outstanding fully-diluted capital stock of Skyfence. In that capacity, valued at the method described above, Messrs. Kramer and Shulman received consideration of approximately $25.4 million and $1.9 million, respectively as a result of the Share Exchange. Specifically, Mr. Kramer received 252,669 shares of Imperva common stock
137
Table of Contents
and approximately $13.3 million in cash, of which cash approximately $34,000 is subject to the Adjustment Holdback and approximately $7.6 million is subject to the Indemnity Holdback, and Mr. Shulman received 39,427 shares of Imperva common stock (and no cash), of which 54 shares are subject to the Adjustment Holdback and 11,784 shares are subject to the Indemnity Holdback, each as described above. Neither of Messrs. Kramer or Shulman held any options to purchase Ordinary Shares of Skyfence prior to closing. Messrs. Kramer and Shulman were fully recused from management’s consideration and valuation of the Skyfence Acquisition. In addition, at the recommendation of the nominating and corporate governance committee in light of Imperva’s related party transactions approval policy, a special Acquisitions Committee (the “Acquisitions Committee”) of our board of directors, consisting solely of independent, disinterested directors, had oversight of management during the course of the consideration, valuation and approval of the transaction, which was ultimately approved by our board. Mr. Kramer was fully recused from all consideration, evaluation and discussion by the Acquisitions Committee and our board of the Skyfence Acquisition, including the amount and type of the consideration paid.
In connection with their approval of the Skyfence Acquisition, the Acquisitions Committee and the board of directors received the opinion of an investment bank addressed to the Board as to the fairness to Imperva and the stockholders of Imperva from a financial point of view of the aggregate Consideration, and in connection with the approval of the Amendment, the investment bank confirmed to the board of directors that if the terms of the Amendment had been set forth in the original Exchange Agreement, it did not believe that its ability to render the opinion, as of the date thereof, would have been adversely affected. Both the original opinion and the statement described above were based upon and subject to a number of qualifications and assumptions set forth in letters from the investment bank to the board of directors.
Transactions with Seagate Technology, LLC
We have entered into an End User License Agreement and related agreements with Seagate Technology, LLC and its affiliates (the “Seagate Agreements”). Seagate has ordered approximately $156,400 of products and services under the Seagate Agreements in 2014. Mr. Pimentel, a member of our board of directors, serves as President, Global Markets and Customers of Seagate Technology.
Review, Approval or Ratification of Transactions with Related Parties
Our policy and the charters of our nominating and corporate governance committee and our audit committee require that any transaction with a related party that must be reported under applicable rules of the SEC, other than compensation related matters, must be reviewed and approved or ratified by our nominating and corporate governance committee, unless the related party is, or is associated with, a member of that committee, in which event the transaction must be reviewed and approved by our audit committee.
Related-Party Transactions Policy
In November 2012, the board adopted a related-party transactions policy for the company requiring review of our general counsel or associate general counsel and approval of the nominating and corporate governance committee or its chair for any transaction involving a related party, considering the relevant and available facts and circumstances, including such facts as:
| • | the impact on a director’s independence in the event the Related party is a director, immediate family member of a director or an entity with which a director is affiliated, |
| • | the terms of the transaction, and |
| • | any other relevant information and considerations with respect to the proposed transaction, |
and approving only those transactions with related party that, in light of known circumstances, are in or are not inconsistent with, the best interests of Imperva and its stockholders, as such approval authority determines in the good faith. For the purposes of this policy, related parties include our executive officers, directors and board nominees (during the current or preceding calendar year) any security holder of Imperva known to us to be the beneficial owner of more than 5% of any class of our voting securities and any immediately family members of such related parties. Where the related party involved is, or is affiliated with, any member of the nominating and corporate governance committee, the approval authority is the audit committee or its chair, provided that if the related party involved is, or is affiliated with, the chair of the audit committee, the approval authority is any other member of the audit committee.
138
Table of Contents
The policy provides that for the purposes of the related-party transactions policy, in the absence of facts or circumstances indicating special or unusual benefits to the related party, the following transactions, arrangements or relationships need not be approved under the policy:
| • | any employment by Imperva of an executive officer of Imperva if: |
| • | the related compensation is required to be reported in our proxy statement under the SEC’s compensation disclosure requirements (generally applicable to “named executive officers”) under Item 402 of Regulation S-K; or |
| • | the executive officer is not an immediate family member of another Imperva executive officer or director, the related compensation would be reported in our proxy statement under Item 402 of Regulation S-K if the executive officer were a “named executive officer,” and our compensation committee approved (or recommended that the board approve) such compensation; |
| • | any compensation paid to a director (in such capacity) if the compensation is required to be reported in our proxy statement under Item 402 of Regulation S-K (or is excluded from disclosure pursuant thereto); |
| • | any transaction where the related party’s interest arises solely from the ownership of our common stock and all holders of our common stock received the same benefit on a pro rata basis (e.g., dividends); |
| • | any transaction with another company at which a related party’s only relationship is as an employee (other than an executive officer), director or beneficial owner of less than 10% of that company’s shares or as a limited partner holding interests of less than 10% in the limited partnership (or similar interests in an alternative form of entity); |
| • | any transaction with a related party: |
| • | where the rates or charges involved are determined by competitive bids, |
| • | involving the rendering of services as a common or contract carrier or public utility, at rates or charges fixed in conformity with law or governmental authority, or |
| • | involving services as a bank depositary of funds, transfer agent, registrar, trustee under a trust indenture or similar services; |
| • | any charitable contribution, grant or endowment to any charitable contribution, grant or endowment by us to a charitable organization, foundation or university at which a related party’s only relationship is as an employee (but not an executive officer), and any charitable contribution, grant or endowment by us to a charitable organization, foundation or university at which a related party is a trustee, director or executive officer, if the aggregate amount involved in a calendar year does not exceed $120,000, or any non-discretionary matching contribution, grant, or endowment made pursuant to a matching gift program; |
| • | ordinary course business travel and expenses, advances and reimbursements; and |
| • | indemnification payments and other payments made pursuant to: |
| • | directors and officers insurance policies, |
| • | our certificate of incorporation or bylaws, and/or |
| • | any policy, agreement or instrument approved by the board. |
Corporate Opportunities and Conflict of Interest Policy
In January 2014, at the recommendation of the nominating and corporate governance committee, the board of directors adopted a corporate opportunities and conflict of interest policy applicable to our executive officers and directors to supplement our code of business conduct and ethics and our related-party transactions policy, more specifically addressing these matters. The policy provides that any executive officers or director that is considering an investment in a security company must notify the chair of the nominating and corporate governance committee and establishes procedures for review of the potential investment, including when Imperva desires to pursue the investment opportunity (i.e., because it is in the potential strategic path of Imperva), as well situations in which an investee company subsequently becomes a competitor of Imperva. The policy provides that in the event that we acquire a company in which an executive officer (including any executive officer that is a member of the board of directors) has an investment, the executive officer will be recused from consideration and approval of the transaction (including as a board member), and if the investment was made after the adoption of the policy and the after-tax profit of such investment for the executive officer after giving effect to the acquisition exceeds $250,000, the executive officer will contribute such excess after-tax profits to charity. This requirement does not apply to shares of publicly held companies or shares acquired by an executive officer in the form of equity compensation while previously employed at the acquired company.
139
Table of Contents
Director Independence
Our board of directors has determined that all of our directors, other than Messrs. Bettencourt and Kramer, are independent, as determined under the rules of the New York Stock Exchange. Mr. Bettencourt is our President and Chief Executive Officer. Mr. Kramer is our co-founder and Chairman. Item 14. Principal Accounting Fees and Services
The information required by this item is incorporated by reference to our Proxy Statement for our 2015 Annual Meeting of Stockholders to be filed with the SEC within 120 days after the end of the year ended December 31, 2014.
Item 14. Principal Accountant Fees and Services
The following table sets forth the aggregate fees and related expenses for professional services provided by Ernst & Young LLP (“EY”) during 2014 and 2013. The audit committee considered the provision of the services corresponding to these fees, and the audit committee believes that the provision of these services is compatible with EY maintaining its independence.
| Years Ended December 31, | ||||||||
| 20141 | 20132 | |||||||
| Audit fees |
$ | 1,543,555 | $ | 1,142,991 | ||||
| Audit-related fees |
— | 1,995 | ||||||
| Tax fees |
94,762 | 79,870 | ||||||
| All other fees |
— | 28,355 | ||||||
|
|
|
|
|
|||||
| Total |
$ | 1,638,317 | $ | 1,253,211 | ||||
|
|
|
|
|
|||||
| 1 | $49,124 of the fees and related expenses paid to EY for during 2014 were paid in Israeli shekels and converted to U.S. dollars for the purposes of this column, using the average exchange rate for 2014 of US$1.00 to NIS 3.5779. |
| 2 | $123,014 of the fees and related expenses paid to EY for during 2013 were paid in Israeli shekels and converted to U.S. dollars for the purposes of this column, using the average exchange rate for 2013 of US$1.00 to NIS 3.609. |
Audit Fees
Fees for EY audit services include fees associated with the annual audit, quarterly reviews of financial statements, accounting consultations.
Audit-Related Fees
Fees for other services include fees associated with a subscription for accounting research.
Tax Fees
Fees for EY tax services include fees associated with international tax advice related to transfer pricing and international tax assistance related to tax filings.
All Other Fees
Fees for other services include fees associated with services related to information security and network penetration testing.
Representatives of EY are expected to be at the annual meeting. Representatives of EY will be given the opportunity to make a statement if they desire to do so, and they will be available to respond to appropriate questions.
Pre-Approval Policies and Procedures
The audit committee pre-approval policies and procedures require prior approval of each engagement of EY to perform services. We adopted these pre-approval policies in accordance with the requirements of the Sarbanes-Oxley Act and all of the professional services listed herein were approved in accordance with these policies.
140
Table of Contents
Item 15. Exhibits and Financial Statement Schedules
(a)(1) Financial Statements: The financial statements filed as part of this Annual Report on Form 10-K are listed on the index to financial statements on page 63.
(2) No Financial Statement Schedules were required to be filed as part of this report because the required information is not present or is not present in amounts sufficient to require submission of the schedules or because the information required is included in the Consolidated Financial Statements or Notes thereto.
(b) Exhibits. The exhibits listed on the Exhibit Index (following the Signatures section of this report) are included, or incorporated by reference, in this Annual Report on Form 10-K.
141
Table of Contents
Pursuant to the requirements of Section 13 or 15(d) of the Securities Exchange Act of 1934, on March 2, 2015, the Registrant has duly caused this Annual Report on Form 10-K to be signed on its behalf by the undersigned, thereunto duly authorized.
| IMPERVA, INC. | ||||||||
| By: | /s/ Anthony Bettencourt |
By: | /s/ Terrence J. Schmid | |||||
| Anthony Bettencourt | Terrence J. Schmid | |||||||
| President and Chief Executive Officer | Chief Financial Officer | |||||||
142
Table of Contents
POWER OF ATTORNEY
KNOW ALL PERSONS BY THESE PRESENTS, that each person whose signature appears below constitutes and appoints Anthony Bettencourt and Terrence J. Schmid as his attorneys-in-fact, with the power of substitution, for him in any and all capacities, to sign any amendments to this Annual Report on Form 10-K, and to file the same, with exhibits thereto and other documents in connection therewith with the Securities and Exchange Commission, hereby ratifying and confirming all that each said attorney-in-fact, or his substitute or substitutes, may do or cause to be done by virtue hereof.
Pursuant to the requirements of the Securities Exchange Act of 1934, this Report has been signed below by the following persons in the capacities and on the dates indicated.
| Signature |
Title |
Date | ||
| /s/ Anthony Bettencourt Anthony Bettencourt |
President, Chief Executive Officer and Director (Principal Executive Officer) |
March 2, 2015 | ||
| /s/ Terrence J. Schmid Terrence J. Schmid |
Chief Financial Officer (Principal Accounting and Financial Officer) |
March 2, 2015 | ||
| /s/ Shlomo Kramer Shlomo Kramer |
Chairman of the Board | March 2, 2015 | ||
| /s/ Gregory Clark Gregory Clark |
Director | March 2, 2015 | ||
| /s/ Charles Giancarlo Charles Giancarlo |
Director | March 2, 2015 | ||
| /s/ Theresia Gouw Theresia Gouw |
Director | March 2, 2015 | ||
| /s/ Steven Krausz Steven Krausz |
Director | March 2, 2015 | ||
| /s/ Albert A. Pimentel Albert A. Pimentel |
Director | March 2, 2015 | ||
| /s/ Frank Slootman Frank Slootman |
Director | March 2, 2015 | ||
| /s/ Allan Tessler Allan Tessler |
Director | March 2, 2015 | ||
| /s/ James Tolonen James Tolonen |
Director | March 2, 2015 | ||
143
Table of Contents
EXHIBIT INDEX
| Incorporated by Reference | ||||||||||||
| Exhibit Number |
Exhibit Description |
Form | File No. | Exhibit | Filing Date |
Provided Herewith | ||||||
| 2.1 | Share Exchange Agreement dated February 6, 2014, as amended on February 21, 2014 by and among Imperva, Inc., Skyfence Networks, Ltd., the shareholders of Skyfence Networks, Ltd. and Ofer Hendler, in his separate capacity as the Sellers’ Representative. | 8-K | 001-35338 | 2.1 | 2/21/14 | |||||||
| 2.2 | Share Exchange Agreement, dated as of February 11, 2014, by and among Imperva, Inc. Incapsula, Inc., Incapsula, Ltd., the stockholders of Incapsula, Inc. and Gur Shatz, in his separate capacity as the Sellers’ Representative. | 8-K | 001-35338 | 2.1 | 2/11/14 | |||||||
| 3.1 | Restated Certificate of Incorporation of Imperva, Inc., as currently in effect. | S-1/A | 333-175008 | 3.3 | 10/28/11 | |||||||
| 3.2 | Amended and Restated Bylaws of Imperva, Inc., as currently in effect. | 8-K | 001-35338 | 3.1 | 2/11/14 | |||||||
| 4.1 | Specimen Certificate Evidencing Shares of Imperva, Inc. common stock. | S-1/A | 333-175008 | 4.1 | 10/28/11 | |||||||
| 4.2 | Amended and Restated Investor Rights Agreement, dated November 1, 2011, by and among Imperva, Inc. and the investors party thereto. | S-1/A | 333-175008 | 4.4 | 11/7/11 | |||||||
| 10.1# | 2003 Stock Plan, as amended, including addendums and sub-plans. | S-1 | 333-175008 | 10.1 | 6/17/11 | |||||||
| 10.2# | Forms of agreements under the 2003 Stock Plan, as amended. | S-1 | 333-175008 | 10.2 | 6/17/11 | |||||||
| 10.3# | 2011 Stock Option and Incentive Plan and subplan and form agreements thereunder. | 10-K | 001-35338 | 10.3 | 2/27/14 | |||||||
| 10.4# | 2011 Employee Stock Purchase Plan. | S-1/A | 333-175008 | 10.19 | 10/28/11 | |||||||
| 10.5# | Incapsula, Inc. 2010 Stock Incentive Plan and form agreements thereunder. | S-8 | 333-194955 | 99.1 | 4/1/14 | |||||||
| 10.6# | Form of Imperva, Inc. Stock Option Assumption Agreement for Incapsula, Inc. 2010 Stock Incentive Plan. | S-8 | 333-194955 | 99.2 | 4/1/14 | |||||||
| 10.6# | Skyfence Networks Ltd. 2013 Share Incentive Plan and form agreements thereunder. | S-8 | 333-194955 | 99.3 | 4/1/14 | |||||||
| 10.7# | Form of Inducement Stock Option Plan and Agreement between Imperva, Inc. and Anthony Bettencourt. | 8-K | 001-35338 | 10.5 | 8/18/14 | |||||||
| 10.8# | Form of Inducement Restricted Stock Unit Plan and Agreement between Imperva, Inc. and Anthony J. Bettencourt. | 8-K | 001-35338 | 10.6 | 8/18/14 | |||||||
| 10.9# | Form of Amended and Restated Indemnification Agreement. | S-1/A | 333-175008 | 10.4 | 10/28/11 | |||||||
| 10.10# | Offer Letter, dated August 16, 2010, between Imperva, Inc. and Shlomo Kramer. | S-1/A | 333-175008 | 10.5 | 9/6/11 | |||||||
| 10.11# | Offer Letter, dated September 29, 2010, between Imperva, Inc. and Terrence J. Schmid. | S-1/A | 333-175008 | 10.6 | 9/6/11 | |||||||
| 10.12# | Offer Letter, dated May 9, 2006, between Imperva, Inc. and Jason Forget. | S-1/A | 333-175008 | 10.8 | 9/6/11 | |||||||
| 10.13# | Sales Compensation Plan, dated February 10, 2014, between Imperva, Inc. and Jason Forget. | 10-K | 001-35338 | 10.14 | 2/28/14 | |||||||
| 10.14# | Offer Letter, dated May 5, 2004, between Imperva, Inc. and Mark Kraynak. | 10-Q | 001-35338 | 10.01 | 5/9/13 | |||||||
| 10.15# | Offer Letter, dated August 13, 2014, between Imperva, Inc. and Anthony Bettencourt. | 8-K | 001-35338 | 10.1 | 8/18/14 | |||||||
144
Table of Contents
| Incorporated by Reference | ||||||||||||
| Exhibit Number |
Exhibit Description |
Form | File No. | Exhibit | Filing Date |
Provided Herewith | ||||||
| 10.16# | Offer Letter, dated July 20, 2011, between Imperva, Inc. and Frank Slootman. | S-1/A | 333-175008 | 10.21 | 10/28/11 | |||||||
| 10.17# | Imperva, Inc. Change in Control Plan and Form Notice of Participation. | 10-K | 001-35338 | 10.26 | 3/28/12 | |||||||
| 10.18# | Imperva, Inc. 2015 Senior Management Bonus Plan. | X | ||||||||||
| 10.19# | Stock Purchase Agreement, dated September 30, 2010, between Imperva, Inc. and Shlomo Kramer (210,954 shares of common stock purchased). | S-1 | 333-175008 | 10.10 | 6/17/11 | |||||||
| 10.20† | OEM Agreement, dated September 9, 2009, between Imperva, Inc., Imperva, Ltd. and American Portwell Technology Inc. | S-1 | 333-175008 | 10.11 | 6/17/11 | |||||||
| 10.21† | First Amendment to OEM Agreement dated as of June 14, 2012 among Imperva, Inc., Imperva, Ltd. and American Portwell Technology. | 10-Q | 001-35338 | 10.1 | 8/13/13 | |||||||
| 10.22† | Second Amendment to OEM Agreement dated as of January 23, 2013 among Imperva, Inc., Imperva, Ltd. and American Portwell Technology. | 10-K | 001-35338 | 10.17 | 3/15/13 | |||||||
| 10.23† | Third Amendment to OEM Agreement dated as of May 22, 2014 among Imperva, Inc., Imperva, Ltd. and American Portwell Technology. | 10-Q | 001-35338 | 10.1 | 8/8/14 | |||||||
| 10.24 | Lease Agreement, dated February 6, 2008, between Imperva, Inc. and Westport Office Park, LLC. | S-1 | 333-175008 | 10.13 | 6/17/11 | |||||||
| 10.25 | First Amendment to Lease, dated February 12, 2010, between Imperva, Inc. and Westport Office Park, LLC. | S-1 | 333-175008 | 10.14 | 6/17/11 | |||||||
| 10.26 | Second Amendment to Lease Agreement effective as of May 16, 2012 between Westport Office Park, LLC and Imperva, Inc. | 8-K | 001-35338 | 10.2 | 5/30/12 | |||||||
| 10.27 | Third Amendment to Lease Agreement effective as of August 22, 2012 between Westport Office Park, LLC and Imperva, Inc. | 10-Q | 001-35338 | 10.1 | 11/13/12 | |||||||
| 21.1 | Subsidiaries of Imperva, Inc. | X | ||||||||||
| 23.1 | Consent of Ernst & Young LLP, Independent Registered Public Accounting Firm. | X | ||||||||||
| 24.1 | Power of Attorney (included on the signature page). | |||||||||||
| 31.1 | Certification of Principal Executive Officer Pursuant to Securities Exchange Act Rule 13a-14(a). | X | ||||||||||
| 31.2 | Certification of Principal Financial Officer Pursuant to Securities Exchange Act Rule 13a-14(a). | X | ||||||||||
| 32.1* | Certification of Principal Executive Officer Pursuant to 18 U.S.C. Section 1350 and Securities Exchange Act Rule 13a-14(b). | X | ||||||||||
| 32.2* | Certification of Principal Financial Officer Pursuant to 18 U.S.C. Section 1350 and Securities Exchange Act Rule 13a-14(b). | X | ||||||||||
| 101.INS | XBRL Instance Document | X | ||||||||||
| 101.SCH | XBRL Taxonomy Extension Schema Document | X | ||||||||||
| 101.DEF | XBRL Taxonomy Extension Definition Linkbase Document | X | ||||||||||
| 101.CAL | XBRL Taxonomy Calculation Linkbase Document | X | ||||||||||
| 101.LAB | XBRL Taxonomy Label Linkbase Document | X | ||||||||||
| 101.PRE | XBRL Taxonomy Extension Presentation Linkbase Document | X | ||||||||||
| † | Certain portions of this exhibit have been omitted and have been filed separately with the SEC pursuant to a request for confidential treatment under Rule 24b-2 as promulgated under the Securities Exchange Act of 1934, as amended. |
| # | Indicates management contract or compensatory plan or arrangement. |
| * | This certification is not deemed “filed” for purposes of Section 18 of the Securities Exchange Act, or otherwise subject to the liability of that section. Such certification will not be deemed to be incorporated by reference into any filing under the Securities Act of 1933 or the Securities Exchange Act of 1934, except to the extent that Imperva, Inc. specifically incorporates it by reference. |
145