Attached files
| file | filename |
|---|---|
| 8-K - FORM 8-K - GOLDEN QUEEN MINING CO LTD | form8k.htm |
|
|
Soledad Mountain Project |
| Technical Report | |
| and | |
| Updated Feasibility Study | |
| Kern County, California | |
| February 25, 2015 |
![]()
| Submitted By: |
| Carl E. Defilippi, SME, Kappes, Cassiday & Associates |
| Michael Gustin, Ph.D, Mine Development Associates |
| Sean Ennis, P. Eng. P.E., Norwest Corporation |
| Peter Ronning, P. Eng. |
|
|
|
|
| IMPORTANT NOTICE |
|
This report was prepared as National Instrument 43-101 Technical Report for Golden Queen Mining Co. Ltd. by Kappes Cassiday & Associates (KCA), Mine Development Associates (MDA) and Norwest Corporation . |
|
The quality of information, conclusions, and estimates contained herein is consistent with the level of effort involved in Norwest’s, MDA’s and KCA’s services, based on i) information available at the time of preparation, ii) data supplied by outside sources, and iii) the assumptions, conditions, and qualifications set forth in this report. |
|
This report is intended for use by Golden Queen Mining Co. Ltd. and subject to terms and conditions of its respective contracts with KCA, MDA, and Norwest. Except for the purposes legislated under Canadian provincial and territorial securities law, any other uses of this report by any third party is at that party’s sole risk. |
 |
Soledad Mountain Project |
| Kern County, CA, USA | |
| Technical Report |
TABLE OF CONTENTS
| February 2015 | i |
|
|
|
Soledad Mountain Project |
| Kern County, CA, USA | |
| Technical Report |
| February 2015 | ii |
|
|
|
Soledad Mountain Project |
| Kern County, CA, USA | |
| Technical Report |
| February 2015 | iii |
|
|
|
Soledad Mountain Project |
| Kern County, CA, USA | |
| Technical Report |
| February 2015 | iv |
|
|
|
Soledad Mountain Project |
| Kern County, CA, USA | |
| Technical Report |
| February 2015 | v |
|
|
|
Soledad Mountain Project |
| Kern County, CA, USA | |
| Technical Report |
LIST OF TABLES
| February 2015 | vi |
|
|
|
Soledad Mountain Project |
| Kern County, CA, USA | |
| Technical Report |
LIST OF FIGURES
| February 2015 | vii |
|
|
|
Soledad Mountain Project |
| Kern County, CA, USA | |
| Technical Report |
| February 2015 | viii |
|
|
|
Soledad Mountain Project |
| Kern County, CA, USA | |
| Technical Report |
| February 2015 | ix |
|
|
|
Soledad Mountain Project |
| Kern County, CA, USA | |
| Technical Report |
| 1.0 |
SUMMARY |
Golden Queen Mining Company, LLC (“GQM LLC” or the “Company”) is engaged in the development of the Soledad Mountain Project (the “Project”), located in the Mojave Mining District, Kern County, California. The Company was formed in September 2014 as part of a Joint Venture (the “JV”) agreement between Golden Queen Mining Co., Ltd. (“GQM Ltd.”) and Gauss LLC (“Gauss”). The Company was originally Golden Queen Mining Co., Inc. (“GQM Inc.”), a wholly-owned subsidiary of GQM Ltd., before being converted into a limited liability company. Upon completion of the JV, both GQM Ltd. and Gauss each owned, and continue to own, 50% of GQM LLC.
Golden Queen Mining Co. Ltd. was formed in November 1985 to acquire Golden Queen Mining Co., Inc., a California corporation, which had secured, by agreement, a core group of claims on Soledad Mountain. Golden Queen Mining Co, Ltd. is a Canadian public company listed on the Toronto Stock Exchange and on the OTCQX and is registered with the U.S. Securities And Exchange Commission as a foreign, private issuer. GQM Inc., the wholly-owned subsidiary of GQM Ltd, was the mine operator from 1985 until September 2014. GQM LLC has been the mine operator only since September 2014. The Project has California Mine ID #91-15-0098.
The Company’s activities have included construction of infrastructure to support exploration activities, reconnaissance and geological mapping, aerial photography, rock chip and soil sampling, geophysical surveys, reverse-circulation and core drilling, underground channel sampling, condemnation drilling, metallurgical test work, geotechnical studies, baseline environmental and a range of other studies, mine design, community consultations and permit applications and a range of mineral resource and mineral reserve estimates. Feasibility studies were done in 1996 (Pincock Allen & Holt, 1996), 1998 (M3 Engineering & Technology Corp., 1998), 2000 (Golden Queen Mining Co., Inc., 2000), 2008 (Norwest Corporation, 2008), 2011 (Norwest Corporation, 2011), 2012 (Norwest and AMEC E&C Services, Inc., “AMEC”, 2012), with the current feasibility study update prepared as a NI 43-101 Technical Report.
Golden Queen Mining Co. Ltd. requested Kappes, Cassiday & Associates (“KCA”), Norwest Corporation (“Norwest”) and Mine Development Associates (“MDA”) to prepare a report (the “Report”) with results from updated mineral resource and mineral reserve estimates based on an updated feasibility study for the Project, in order to enable the Company to obtain further Project financing.
The Report has been submitted as a NI 43-101 Technical Report and this is available on SEDAR and on the Company’s website at www.goldenqueen.com.
| February 2015 | 1-1 |
|
|
|
Soledad Mountain Project |
| Kern County, CA, USA | |
| Technical Report |
| 1.1 |
Key Outcomes |
| • | Total Proven and Probable Mineral Reserve Estimates of 51.053 million tons (46.314 million tonnes) grading 0.0193 oz/ton (0.661 g/t) Au and 0.324 oz/ton (11.092 g/t) Ag. | |
| • | Life of mine average annual production of 74k oz of gold and 781k oz of silver during full production Years 2-11. | |
| • | Total production of 807k oz of gold and 8.3 M oz of silver. | |
| • | Stripping ratio of 3.41:1 (waste tons : ore tons). | |
| • | Pre-production capital costs of approximately $144 million in-line with the capital costs update provided in March 2014: $99.3 million in pre-production capital costs (of which $25.4 million was spent as of December 31, 2014), $15 million contingency, $10.5 million in working capital and financial assurance estimate and $19.2 million for the mobile mining equipment (of which $1.1 million was spent as of December 31, 2014). The mobile mining equipment is being financed through Komatsu. | |
| • | Base case after-tax net present value (5% discount rate) of $214 mm with a gold price of $1,250/oz and a silver price of $17/oz. | |
| • | Base case after-tax IRR of 28.3% with a gold price of $1,250/oz and a silver price of $17/oz. |
| 1.2 |
Location, Access and Climate |
The Project is located in Kern County in southern California, approximately 5 miles (8 km) south of the town of Mojave. The metropolitan areas of Rosamond and Lancaster lie approximately 9 miles (14 km) and 20 miles (32 km) to the south respectively. Los Angeles is about 70 miles (113 km) south of Mojave.
Access to site is from State Route 14 and Silver Queen Road, an existing paved County road. Silver Queen Road will be the primary access to site.
The Mojave region is generally characterized as arid, with a wet season from December through March. Rainfall events tend to be short lived and of high intensity. Mojave experiences high summer temperatures up to 113°F (45°C). The minimum temperature may reach 20°F (-7°C). Maximum wind speed is 90 mph (145 km/h) with Exposure C for design purposes. Mean recorded annual rainfall is 6.14 inches (15.6 cm) with a mean maximum month of 1.11 inches (2.82 cm).
| February 2015 | 1-2 |
|
|
|
Soledad Mountain Project |
| Kern County, CA, USA | |
| Technical Report |
| 1.3 |
Land Status |
The land status is described in Section 4.2.
GQM LLC acquired its initial property interests in 1985. GQM LLC purchased fee land or entered into mining lease agreements from the 1990’s onwards and is continuing to add to its land position in the area. GQM LLC only purchases and does not lease fee land in an ongoing effort to ensure a secure land position.
The land required for the Project, included within the Approved Project Boundary, has either been secured under one of the mining lease agreements referred to in Section 1.4 below or is held by GQM LLC through ownership of the land in fee or as patented and unpatented mining claims or millsites. Note in the mine plan as currently configured, the southern portion of the East Pit access haul road extends across the Approved Project Boundary and onto Section 8, which is BLM land. The Company however has control of the land with a series of unpatented lode mining claims.
The fee land surrounding the patented and unpatented mining claims in Section 6 and Section 5 and the millsites in Section 32 is required for the construction of the ancillary facilities for a mining operation, for the construction of the heap leach pads and for construction of a pad for the storage of quality waste rock and for the aggregate production facilities.
| 1.4 |
Mineral Tenure and Mining Lease Agreements |
Mineral tenure and mining lease agreements are described in Section 4.3.
GQM LLC holds directly or controls via mining lease agreements with landholders a total of 33 patented lode mining claims, 189 unpatented lode mining claims, one patented millsite, 17 unpatented millsites, and one unpatented placer claim and upwards of 980 acres (400 hectares) of fee land, collectively referred to as the Property.
| 1.5 |
Royalties |
Royalties are described in Section 4.4.
GQM LLC is required to pay advance, minimum royalties under the mining lease agreements. In some instances, the Company will receive a credit for the advance minimum royalty payments made on commencement of commercial production. Weighted average royalty rates on production will range from a low of 1.0% to a high of 5.0% depending upon the area being mined and gold and silver prices.
| February 2015 | 1-3 |
|
|
|
Soledad Mountain Project |
| Kern County, CA, USA | |
| Technical Report |
Royalty calculations from production will be complex. GQM LLC has developed a model for an accurate royalty calculation.
State fees for payable gold and silver are charged at the following rates:
| • | Gold fee = $5.00/oz gold (post-smelter) | |
| • | Silver fee = $0.10/oz silver (post-smelter) |
The mining lease agreements also typically provide for an additional royalty if non-mineral commodities, such as aggregates, are produced and sold.
| 1.6 |
Approvals and Permits |
| 1.6.1 |
Land Use - Conditional Use Permits |
Environmental issues were fully addressed in the Supplemental Environmental Impact Report (“SEIR”) and this is described in Section 20.1.
The Kern County Planning Commission formally considered the Project on April 8, 2010. At the meeting, the Planning Commission, consisting of a panel of three commissioners, unanimously approved the Project. The Planning Commission certified the SEIR and adopted a Mitigation Measures Monitoring Program and a set of Conditions of Approval for the Project. The Mitigation Measures Monitoring Program and Conditions of Approval for the Project were amended by Planning Commission Resolution No. 171-10 adopted on October 28, 2010 and are now final.
The Bureau of Land Management confirmed that its Record of Decision approving the Plan of Operations under NEPA in November 1997 remains valid.
| 1.6.2 |
Water Quality – Waste Discharge Requirements |
The Lahontan Regional Water Quality Control Board (the Board) unanimously approved Waste Discharge Requirements and a Monitoring and Reporting Program for the Project at a public hearing held in South Lake Tahoe on July 14, 2010. The Board order was subsequently signed by the Executive Officer of the Board and is now in effect.
| February 2015 | 1-4 |
|
|
|
Soledad Mountain Project |
| Kern County, CA, USA | |
| Technical Report |
| 1.6.3 |
Air Quality – Authority to Construct and Permit to Operate |
The Air Quality and Health Risk Assessments for the Project were completed and submitted to the Planning Department and the Eastern Kern Air Pollution Control District (“EKAPCD”) on July 21, 2009. This report was approved by the Planning Commission on April 8, 2010, as part of the certification of the SEIR.
Ten applications for Authority to Construct permits were submitted to the EKAPCD in February 2011. The EKAPCD confirmed that the information required to support the applications was complete. The draft Authority to Construct permits were received in September 2011. The Company’s consulting engineers and legal counsel completed their review of the draft Authority to Construct permits in January 2012. The Authority to Construct permits were issued by EKAPCD on February 8, 2012.
The Authority to Construct approvals will be converted to a Permit to Operate after construction has been completed and subject to inspection by EKAPCD.
| 1.7 |
Considerations of Social and Community Impacts |
The impact of the Project on Mojave and the surrounding areas is described in Section 21.3.
Mojave and the surrounding areas are areas of relatively high unemployment and employment has not recovered since the start of the financial downturn in 2008. The Project has therefore had a positive response from the local communities.
| 1.8 |
Geology and Mineralization |
Soledad Mountain is an erosional remnant of a Miocene-age rhyolitic volcanic center within the western part of the Mojave structural block, a triangular-shaped area bounded to the west by the northwest-trending right-lateral San Andreas Fault and to the north by the northeast-trending Garlock Fault. This volcanic center overlies a basement of Cretaceous Quartz Monzonite. The volcanic lithologies have been assigned to: 1) Quartz latite, present over most of the northeast portion of the deposit and in the subsurface of the center of the deposit; 2) Pyroclastic rocks, present in the subsurface of the north-central portion of the deposit beneath flow-banded rhyolite; 3) flow-banded rhyolite, which occurs at the surface in the north-central portion of the deposit and, as an intrusive, extending deep into the center of the deposit; and 4) porphyritic rhyolite (previously referred to as rhyolite porphyry), which extends from the surface to the depth of drilling over most of the southwest portion of the deposit.
| February 2015 | 1-5 |
|
|
|
Soledad Mountain Project |
| Kern County, CA, USA | |
| Technical Report |
Gold and silver mineralization at Soledad Mountain occurs in a swarm of mainly northwest-striking, subparallel to anastomosing, low-sulfidation, epithermal quartz veins that formed in faults and fractures within the Miocene rhyolitic volcanic units. Over 20 gold-silver veins and related vein splits have been identified and modeled as part of the project resources. Veins generally strike N40°W and dip at moderate to high angles to the northeast and to the southwest, and occur in parallel and, locally, en echelon patterns over a total strike-length of 7,000 ft and a total width of 4,500 ft. Vein “zones” consist of one or more central veins surrounded by either a stockwork or parallel zones of sheeted narrow quartz veins. Mineralization consists of fine-grained pyrite, covellite, chalcocite, tetrahedrite acanthite, native silver, pyrargyrite, polybasite, native gold and electrum within discrete quartz veins, veinlets, veinlet stockworks, and irregular zones of silicification. Gangue minerals include quartz, potassium feldspar (adularia), ferruginous kaolinitic clay, sericite, hematite, magnetite, goethite, and limonite.
| 1.9 |
Exploration |
Exploration conducted by GQM LLC began in earnest in 1988 and continued intermittently until 2011. GQM LLC geologists carried out surface geologic mapping of Soledad Mountain between 1986 and 1991, and surface geochemical surveys were conducted in the 1990s. Channel sampling of underground cross cuts was carried out in 1988 and 1997-1998. Much of the GQM LLC channel sampling was conducted to validate the pre-war assays of Gold Fields American Development Co. (“GFA”) for use in modeling and estimation of the remaining resources. Results from the GQM LLC channel samples were lower in gold than nearby and/or adjacent GFA channel samples, although the silver results compared well. The differences in grades have been the subject of considerable evaluation and assessment.
Drilling was a major component of the exploration work done by GQM LLC and totals 270,000 feet, including 30 diamond core holes drilled from the surface, 28 core holes drilled from underground stations, and 673 reverse-circulation (“RC”) rotary holes drilled from the surface.
An important study of the project geology, mineralized structures, and historical stoping by Vance Thornsberry, Boies Hall, and Stephen Bruff in 1997 included the construction of a set of detailed geologic cross sections. These cross sections serve as the foundation for GQM LLC’s work in 2014, which included updating of the geologic modeling and the resource estimation discussed herein.
| February 2015 | 1-6 |
|
|
|
Soledad Mountain Project |
| Kern County, CA, USA | |
| Technical Report |
| 1.10 |
Drilling |
A total of 895 holes drilled by six different companies at Soledad Mountain from 1935 through 2011 are included in the current project database. Surface RC drilling began in 1977 and totals 303,054 ft. Prior to 1977, 16,193 ft of drilling was completed by diamond-core methods from underground drill stations. Underground core drilling was also performed during the 1990s for a total of 14,106 ft. Surface diamond-core drilling included a total of 18,233 ft from 1988 through 1999.
From 1935 to 1942, underground core drilling was done primarily for the development of the Silver Queen, Golden Queen, Starlight, and Soledad veins, with lesser amounts of drilling on the Queen Esther vein. Rosario Exploration drilled eight RC holes in 1977 that targeted the northern portions of the Silver Queen and Golden Queen veins. Twenty-five RC holes were directed at the Karma-Ajax vein by Shell-Billiton in 1986-1987. During 1988 and 1989, CoCa Mines drilled 20 RC holes; the primary targets appear to have been the Excelsior, Bobtail, Hope, and McLaughlin veins in the northwestern part of the deposit. Glamis Gold drilled one RC hole in 1994 and 49 widely distributed RC holes in 1995 to test portions of the Queen Esther, Silver Queen, Golden Queen, Starlight, and Soledad veins.
The most extensive drilling at the project was completed by GQM LLC from 1988 through 2011. In the late 1980s and through the 1990s, GQM LLC’s drilling was directed at the Starlight, Golden Queen, Soledad, Number 1 Footwall, Silver Queen, Queen Esther, and Excelsior veins. The Black, Karma-Ajax and Patience veins in the northeastern part of the deposit were also drilled, and a number of holes attempted to identify a northern extension of the Karma-Ajax vein. In 2011, nine RC drill holes targeted the Echo vein, and an additional 11 were drilled at the north end of the Karma-Ajax vein.
MDA believes down-hole surveys were not performed prior to 1994. During the late 1990s, certain diamond drill holes were surveyed for dip and azimuth, while RC holes GQ-475 through GQ-632 were surveyed for dip only. Down-hole surveys were completed on three of the 2011 RC holes.
| 1.11 |
Sample Analysis and Security |
Samples have been generated through surface and underground diamond drilling, surface RC drilling, and channel sampling of underground cross cuts. The current database includes assays from at least 11 different laboratories. Descriptions of the sample preparation procedures and analytical methods used in the 1930s and 1970s are no longer available. It is reasonable to assume that gold concentrations were determined during those years by fire assay with gravimetric finish.
| February 2015 | 1-7 |
|
|
|
Soledad Mountain Project |
| Kern County, CA, USA | |
| Technical Report |
MDA has no information on drill sample preparation procedures used during most of the 1980s. Shell-Billiton’s RC drill samples were analyzed at GeoMonitor by cyanide-leach and atomic absorption (“AA”), with selected samples also analyzed by fire assay. MDA has no information on the laboratories, sample preparation, and analytical methods used by CoCa Mines for their RC drill samples, or for the GQM LLC underground cross-cut samples from this period.
From 1988 through 1990 GQM LLC’s core and RC samples were analyzed by fire assay with gravimetric finish at five different laboratories. Samples from the 1994-1995 Glamis RC drilling were mainly analyzed at American Assay Laboratories by fire assay, but it is not clear if these were done with AA or gravimetric finish.
GQM LLC’s RC and core drilling samples from 1994 through 1999 were assayed at Barringer Laboratories (“Barringer”) and Inspectorate-Rocky Mountain Geochemical (“Inspectorate”). At Barringer, gold was determined by fire assay with either AA or gravimetric finish; fire assay with gravimetric finish was used at Inspectorate.
All drill samples from the 2011 RC drill campaign were assayed for gold and silver by ALS Chemex. Gold was determined by fire assay and AA finish. Silver was assayed by aqua-regia digestion and AA. Those samples returning greater than 0.058 oz Au/ton (> 2.0 ppm Au) were re-run by fire assay with gravimetric finish.
No information is available to document sample-security procedures prior to 1994. Sample security measures have since included moving core from the drill site to a locked storage unit on the project site at the end of each drill shift. RC cuttings were allowed to dry at the drill site before being locked in a semi-trailer to be shipped to the laboratory. Drill samples remaining on site at the time of MDA’s visits were found to be adequately secured within GQM LLC’s facilities.
| 1.12 |
Data Verification and QA/QC |
Available laboratory analytical certificates provide evidence that Quality Assurance-Quality Control (“QA/QC”) samples, apparently having included standards and blanks, were periodically submitted with post-GFA and pre-2011 drill samples for assaying, but the details of any such QA/QC program are not known and the evidence for the submission of these QA/QC samples is sporadic.
| February 2015 | 1-8 |
|
|
|
Soledad Mountain Project |
| Kern County, CA, USA | |
| Technical Report |
Records were found for a large number of duplicate analyses of various types, including third-party check assays and field, preparation, and pulp duplicates, all assayed at various times after the original drill samples were analyzed. MDA compiled and evaluated these duplicate data, in addition to voluminous original-lab replicate analyses, in an effort to compensate for the lack of usable data from control samples such as standards and blanks.
The check assay data suggest that the gold values in the database may have a low bias, at least for those assays that are represented by the check analyses (the check assaying was done on drill samples derived from subsets of the 1988, 1996, and 1997 drilling programs). By contrast, silver database values for samples derived from the same subsets of holes appear to have a high bias, although it is important to note that silver has a much lower economic impact on the project than gold. Other duplicate data indicate that the variability of any single gold or silver analysis is high, especially at low grades. While a lack of precision at low grades is expected, it is nonetheless relevant due to the low grade of the cutoff used to define the project resources (0.004 oz Au-equivalent/ton).
A somewhat more modern QA/QC program was completed as part of the 2011drilling campaign. MDA has not seen the 2011 QA/QC data, but Ennis and Hertel (2012) report that no significant issues were identified.
| 1.13 |
Process Development |
Process development and the extensive metallurgical test work done between 1988 and 2007 are described in Section 13.
The primary ore types that will be mined are porphyritic rhyolite and flow-banded rhyolite, pyroclastics and quartz latite porphyry representing approximately 55%, 32% and 13% of the ore tonnage respectively. Minor quantities of siliceous vein material (0.1%) will also be mined.
Extensive test work and process development work done on the Project ore types from 1988 to 2007 show that these ores are readily amenable to heap leaching provided the material is crushed to relatively small sizes. The test work for a total of 45 column leach tests is well documented and the test results have been used in a number of feasibility studies. Parameters such as agglomerate strength, percolation rate, cyanide consumption and cement and/or lime required for pH control were also determined in numerous tests.
| February 2015 | 1-9 |
|
|
|
Soledad Mountain Project |
| Kern County, CA, USA | |
| Technical Report |
A series of tests using a high-pressure grinding roll (“HPGR”) and bottle roll and column leach tests was performed between 2003 and 2007 to confirm the flow sheet and to provide design criteria for the design of the crushing-screening plant.
The test work shows that the HPGR will have distinct advantages over conventional crushing and screening in preparing particles for heap leaching in this particular application.
Tests completed in 2006 were performed on a low-grade and a high-grade rhyolite sample to test the range of grades that is expected in the commercial operation. The test on rhyolite with a lower head grade in the 0.009 oz/ton (0.3 g/t) range is especially important to give an indication of the tail grade and thus the recovery that should be used when doing cut-off grade analyses. No new column leach tests have been done on Pyroclastic ore since the 1997-1999 tests.
Recoveries for gold and silver are based upon tails obtained in HPGR-based column leach tests. The recovery analysis for gold and the recovery analysis for silver are described in detail in Section 13.5 and Section 13.6 respectively. The final average recovery from the mine plan was 82%.
An extensive characterization program using bottle roll tests on reverse circulation drill cuttings was completed by an independent consulting engineer in 1995. The deposit was divided into six areas, four rock types and three vertical zones for this program and 46 standard bottle roll tests were performed. An analysis of the results showed that there was no discernible difference in metallurgical response for a particular rock type from area to area and from strata to strata.
The final product that will be produced in the refinery on site is a doré. There is no indication of deleterious elements in the doré. Allowance has been made for 1.5% of minor metals in the doré.
| 1.14 |
Mineral Resources |
The modeling and estimate of the mineral resources at the Soledad Mountain deposit were completed in July 2014 through December 2014 under the supervision of Michael M. Gustin, a qualified person with respect to mineral resource estimations under NI 43-101. The effective date of the resource estimate is December 31, 2014. The estimate was prepared in accordance with the disclosure and reporting requirements set forth in the Canadian Securities Administrators’ National Instrument 43-101 (“NI 43-101”), Companion Policy 43-101CP, and Form 43-101F1, as well as with the Canadian Institute of Mining, Metallurgy and Petroleum’s “CIM Definition Standards - For Mineral Resources and Reserves, Definitions and Guidelines” (“CIM Standards”) adopted by the CIM Council on May 10, 2014.
| February 2015 | 1-10 |
|
|
|
Soledad Mountain Project |
| Kern County, CA, USA | |
| Technical Report |
To complete the resource estimation, the drill data were evaluated statistically, gold and silver mineral domains were interpreted on cross sections spaced at 50- and 100-foot intervals that span the extents of the presently defined deposit, and the mineral domains were refined on level plans spaced at 20-foot intervals. The final modeled mineral domains were then coded into a 20 ft x 20 ft x 20 ft block model and used to constrain the gold and silver grade estimations.
The Soledad Mountain gold and silver resource estimates are summarized in Table 1-1. Soledad Mountain Project Gold and Silver Resource Estimates
Table 1-1. Soledad Mountain Project Gold and Silver Resource Estimates
| In-Situ Grade | Contained Metal | |||||||
| Gold | Silver | Gold | Silver | |||||
| Classification | Tonnes | Tons | g/t | oz/ton | g/t | oz/ton | oz | oz |
| Measured | 4,298,243 | 4,738,000 | 0.960 | 0.028 | 13.37 | 0.39 | 130,000 | 1,865,000 |
| Indicated | 79,237,167 | 87,344,000 | 0.549 | 0.016 | 9.26 | 0.27 | 1,415,000 | 23,733,000 |
| Measured & Indicated | 83,535,409 | 92,082,000 | 0.575 | 0.017 | 9.53 | 0.28 | 1,545,000 | 25,598,000 |
| Inferred | 21,392,329 | 23,581,000 | 0.343 | 0.010 | 7.20 | 0.21 | 245,000 | 4,965,000 |
| 1. |
Mineral Resources are inclusive of Mineral Reserves. |
| 2. |
Mineral Resources that are not Mineral Reserves do not have demonstrated economic viability. |
| 3. |
Mineral Resources are reported at a 0.004 oz/ton (0.137 g/t) AuEq cut-off in consideration of potential open-pit mining and heap-leach processing. |
| 4. |
Gold equivalent grades were calculated as follows: AuEq(oz/ton) = Au(oz/ton) + (Ag(oz/ton)/88, which reflect a long-term Au:Ag price ratio of 55 and a Au:Ag recovery ratio of 1.6. |
| 5. |
Rounding may result in apparent discrepancies between tons, grade and contained metal content. |
| 6. |
Tonnage and grade measurements are in U.S. and metric units. Grades are reported in troy ounces per short ton and in grams per tonne. |
| 7. |
The Effective Date of the mineral resource estimate is December 31, 2014. |
The Project gold and silver resource estimates in Table 1-1 are defined using a cutoff grade of 0.004 oz Au-equivalent/ton. This cutoff was chosen in consideration of potential open-pit extraction and heap-leach processing, as well as to match the cutoff used in previously reported (2012) resources. The gold-equivalent cutoff is calculated as follows:
Au-equivalent = Au grade + Ag grade/88
The gold-equivalent relationship is consistent with that used in the previously reported (2012) resource estimation, and is based on a long-term Au:Ag price ratio of 55 and Au:Ag recovery ratio of 1.6.
| February 2015 | 1-11 |
|
|
|
Soledad Mountain Project |
| Kern County, CA, USA | |
| Technical Report |
| 1.15 |
Mineral Reserves |
The mine design is described in Section 16.3.
Norwest accepted the geological and block model provided by MDA and relied upon these in the preparation of the mine plan for the Project. The mine plan was based upon a series of Lerchs Grossman pit optimization studies.
The MineSight 3D (Mintec©) software was used to carry out the detailed mine design.
| 1.16 |
Mineral Reserves Statement |
The QP for the Mineral Reserve Estimates is Sean Ennis, Vice President, Mining, P.Eng. APEGBC Registered Member, and an employee of Norwest. Mineral Reserve Estimates are reported in Table 1-2 and have an effective date of February 1, 2015. The estimate was prepared in compliance with the disclosure and reporting requirements set forth in the National Instrument 43-101, Companion Policy 43-101CP, and Form 43-101F1, as well as with the CIM Standards adopted by the CIM Council on May 10, 2014.
Table 1-2. Mineral Reserve Estimates
| In-Situ Grade | Contained Metal | |||||||
| Gold | Silver | Gold | Silver | |||||
| Reserve Category |
tonnes | tons | g/t | oz/ton | g/t | oz/ton | oz | oz |
| Proven | 3,357,000 | 3,701,000 | 0.948 | 0.028 | 14.056 | 0.410 | 102,300 | 1,517,100 |
| Probable | 42,957,000 | 47,352,000 | 0.638 | 0.019 | 10.860 | 0.317 | 881,300 | 14,999,100 |
| Total & Average | 46,314,000 | 51,053,000 | 0.661 | 0.019 | 11.092 | 0.324 | 983,600 | 16,516,200 |
1. The qualified person for the mineral reserve estimates is
Sean Ennis, Vice President, Mining, P.Eng., APEGBC Registered Member who is
employed by Norwest Corporation.
2. A gold equivalent cut-off grade of 0.005
oz/ton was used for quartz latite and a cut-off grade of 0.006 oz/ton was used
for all other rock types. Cut-off grade was varied to reflect differences in
estimated metal recoveries for the different rock types mined.
3. Gold
equivalent grades were calculated as follows: AuEq(oz/ton) = Au(oz/ton) +
(Ag(oz/ton)/88, which reflects a long-term Au:Ag price ratio of 55 and a Au:Ag
recovery ratio of 1.6. Gold equivalent grades were used for the pit
optimization.
4. Tonnage and grade measurements are in imperial and metric
units. Grades are reported in troy ounces per short ton and in grams per tonne.
| 1.17 |
Open Pit Operation |
The open pit operation is described in Section 16.
| February 2015 | 1-12 |
|
|
|
Soledad Mountain Project |
| Kern County, CA, USA | |
| Technical Report |
The operation will be an open pit operation. Wheel loaders, a hydraulic excavator and haul trucks with a capacity of 100 ton will be used as the primary mining equipment. Smaller equipment will be used for pioneering access roads, and mining narrower benches, and final ore extraction at the bottom of the various mining phases. Support equipment such as a grader, a water truck and tracked dozers and a wheel dozer will be used for road and bench maintenance, dust control and work in the waste rock disposal areas.
| 1.18 |
Recovery Methods |
Run-of-mine ore will be delivered to the crushing-screening plant located south of the Phase 1 heap leach pad. The crushing-screening plant consists of a three-stage crush and is sized to process 5.1 million tons (4.6 million tonnes) of ore per year.
The crushing-screening plant includes a primary and secondary cone crusher, primary screen, a HPGR as the key comminution device and the required ore chutes and conveyors.
The HPGR discharge will be conveyed to an agglomeration drum where cement and process solution are added, and then conveyed by overland conveyor and a series of grass-hopper conveyors to a stacker and placed on the heap leach pad.
Gold and silver will be recovered by dissolution in a dilute sodium cyanide solution and then by recovery in the Merrill-Crowe process, which includes the typical clarification, deaeration, precipitation with zinc dust, and filtration, drying (retorting), and smelting of the precious metal sludge into a doré product.
An assay laboratory is included on site and is sized to handle from 50 to 200 solid and 10 to 50 solution samples per day on one operating shift.
The heap leach pad is a multi-lift single-use pad. The design considered development in four stages to minimize initial capital costs and improve solution management. The ultimate pad capacity is approximately 51.6 million tons (46.8 million tonnes) and is designed for an ultimate height of 230 ft (70 m). Individual lifts have been designed for 33 ft (10 m) nominal in height.
An overflow pond has been designed based upon the water balance for the Project for a capacity of 28.5 million gallons (108,000 m3). This capacity is adequate to contain heap drain-down and runoff from storm events.
Once prepared, the heap surface will be irrigated with dilute cyanide solution by drip emitters, for a primary leaching cycle of 70 days. Additional underlying lifts will continue to leach to reach the ultimate recoveries for gold and silver. The leachate or pregnant solution and the recycle solution will be collected in a network of perforated pipes and will be directed to a pump box, and will then be pumped to the Merrill-Crowe plant.
| February 2015 | 1-13 |
|
|
|
Soledad Mountain Project |
| Kern County, CA, USA | |
| Technical Report |
The average water use for the heap leach operation is projected to be 425 gal/min (96.6 m3/h).
For closure, cyanide concentrations in the leach solutions must be reduced to the weak acid dissociable (WAD) standard of 0.2 ppm (0.2 mg/L) and a pH ranging from 6.0 to 8.5. To address this, a staged rinse with fresh water will be run, and natural degradation processes will contribute to removing residual cyanide. Solutions from each cell of the heap and from the lysimeters and leak detection monitoring points will be sampled regularly and taken to the assay laboratory on site for analysis.
The design, construction and operation of the crushing plant, recovery plant and heap leach facilities are described in Section 17.
| 1.19 |
Local Resources and Infrastructure |
Services such as a hospital, ambulance, fire-protection, garbage and hazardous waste disposal, schools, motels and housing, shopping, airport and recreation are available in Mojave and its surroundings. Telephone and internet service are available on site. Mojave is a railroad hub for the Burlington Northern/Santa Fe and Union Pacific/Southern Pacific railroad lines.
Infrastructure is described in Section 18 and this includes both on-site and off-site infrastructure.
Off-site infrastructure such as the availability of power and water supply are described in Sections 18.2 and 18.3.
| 1.20 |
Market Studies |
Doré will be produced in the refinery on site. It is expected that the doré will be shipped to the refinery owned by Johnson Matthey Inc. in Salt Lake City, Utah. The doré will be smelted and refined to produce saleable gold and silver. The gold and silver will be sold by Johnson Matthey Inc. at spot price on the day it is produced. That is the conventional and generally accepted procedure for dealing with gold and silver produced by a smaller heap leach operation such as the Project.
| February 2015 | 1-14 |
|
|
|
Soledad Mountain Project |
| Kern County, CA, USA | |
| Technical Report |
GQM LLC has therefore not entered into any agreement for selling refined gold and silver. Refer to Section 1.25 for a comment on the aggregate production component of the Project.
| 1.21 |
Capital Cost Estimates |
Capital costs are discussed in detail in Section 21.2. Construction has been underway since July 1, 2013 and significant progress has been made.
Engineering has been completed for all major components of the Project. The Company has signed contracts for all of the turn-key projects and this is now the basis for the Project capital cost estimates. The capital cost required forward of January 1, 2015 is estimated to be $117.5 million which includes a contingency of $15.0 million, working capital of $10.0 million, financial assurance of $0.5 million, and mobile mining equipment of $18.1 million. The mobile mining equipment is being financed through Komatsu Financial. Capital of $26.5 million ($25.4 million of pre-production capital plus $1.1 million in mobile equipment) has already been spent as of December 31, 2014 and this amount is excluded from the financial analysis.
The sustaining capital is estimated to be a further $25.6 million over the life of the Project with detail provided in Table 21-3. The bulk of the sustaining capital will be required for construction of the second, third and fourth stages of the heap leach pad and for major equipment replacement. The addition of mining equipment such as haul trucks and the replacement of mining equipment through the life of the mine are also included and total approximately $10.9 million.
| 1.22 |
Operating Cost Estimates |
Operating costs are described in detail in Section 21.4.
Detailed operating cost estimates have been prepared with information provided by independent consulting engineers and vendors of services and supplies such as diesel fuel and explosives, reagents such as cement and sodium cyanide and operating supplies and spare parts for both the major mining equipment and support equipment and equipment in the various processing facilities.
The all-inclusive average cash operating cost is projected at $9.06/ton ($9.99/tonne) of ore for the life of the gold and silver heap leach operation. There is no allowance for escalation or inflation in the operating cost estimates from January 1, 2015 onwards. Operating costs for the life of the mine are summarized in Table 21-2.
| February 2015 | 1-15 |
|
|
|
Soledad Mountain Project |
| Kern County, CA, USA | |
| Technical Report |
| 1.23 |
Financial Analysis |
The after-tax cash flow analysis is described in Section 22.5. This analysis includes detail on a number of items that make up the cash flow model.
The base cash flow analysis is done on a constant United States dollar, after-tax, stand-alone Project basis.
The Project has an indicated after-tax internal rate of return (IRR) on capital employed of 28.3% . The after-tax net present value (NPV) is $214 million with a discount rate of 5.0% and the undiscounted, cumulative net cash flow after tax is approximately $342 million. By comparison, at an 8.0% discount rate the after-tax NPV is $160 million. The indicated contribution of gold and silver to gross revenues is 88% and 12% respectively at current gold and silver prices with total cash costs per ounce of gold produced, net of silver credits, of $518/oz. Gold and silver prices used to model the cash flows were $1,250 and $17.00 respectively.
| 1.24 |
Sensitivity Analysis |
Sensitivity analyses are detailed in Section 22.5.2. The sensitivity of Project cash flows to increases in capital (initial capital, working capital and sustaining capital), site operating costs, and gold and silver prices was evaluated. The Project after-tax NPV is relatively insensitive to changes in either capital or operating costs but is quite sensitive to metals prices.
When trailing 36-month average gold and silver prices of $1,437/oz and $24.30/oz respectively (end of January 2015) are used to model the cash flows, the indicated IRR is 37.2% after taxes, and the NPV is $313 million with a discount rate of 5%. The total cash costs, net of silver credits, is $462/oz Au. The trailing 36-month average precious metals prices are accepted by the U.S. Securities And Exchange Commission when reporting mineral reserves.
| 1.25 |
Aggregate |
GQM LLC expects to develop a by-product aggregate and construction materials business once the heap leach operation is in full production, based on the location of the Project in southern California with close proximity to major highways and railway lines. The source of raw materials will be suitable quality waste rock specifically stockpiled for this purpose. The waste rock can be classified into a range of products such as riprap, crushed stone and sand with little further processing. Test work done in the 1990s confirmed the suitability of waste rock as aggregate and construction material. GQM LLC also plans to process and sell leached and rinsed residues from the heap leach operation for a range of uses to local and regional markets. It is intended that these products will be sold over an extended mine life beyond the current planned gold and silver production period but no contributions from the sale of such products will be included in the cash flow projections until long term contracts for the sales of these products are secured.
| February 2015 | 1-16 |
|
|
|
Soledad Mountain Project |
| Kern County, CA, USA | |
| Technical Report |
The processing and sale of waste rock and the leached and rinsed residues as aggregate and construction materials is an important component of the mine plan and closure and reclamation plans; see Section 1.28 for further details.
| 1.26 |
Project Schedule |
The Company estimates that construction can be completed in approximately nine months in 2015. The target for commissioning of the facilities is therefore the fourth quarter of 2015 with start of production late in 2015. Fourth quarter production will require commissioning of mining equipment and commencement of pre-development mining activities (haul road construction, initial bench development) by Q3 2015.
| 1.27 |
Interpretation and Conclusions |
| 1.27.1 |
MDA Interpretations, Conclusions and Recommendations |
MDA reviewed the Project data, constructed a resource database, analyzed available QA/QC data, and visited the Project site. MDA believes the project data reasonably represent the Project and are sufficient to support the estimation of resources described herein.
Although an extensive amount of drilling has been completed within the Project area, there is excellent potential to add to the project resources, and there are also substantial quantities of Inferred resources that could be converted to higher classifications with further drilling. GQM LLC is doing an infill drill program (February 2015) that targets areas lying immediately outside of the limits of the initial reserve pits. This drilling is warranted, as are future such programs outside of all of the reserve pits.
| 1.27.2 |
Interpretation and Conclusions by Norwest |
The Norwest QP finds the following:
| February 2015 | 1-17 |
|
|
|
Soledad Mountain Project |
| Kern County, CA, USA | |
| Technical Report |
| • | There is sufficient area within the Project for an open pit mining operation including the proposed open pits, waste rock storage pads, and heap leach pad. | |
| • | The current mine plan includes limited haul road construction (East Pit access) and waste rock removal (West Pit upper slope area) beyond areas currently within the Approved Project Boundary. Norwest understands that the Company holds or is in negotiations with landholders to secure access to all areas, however failure to do so would require minor changes to the current mine plan. | |
| • | The current pit configuration is constrained by economic strip ratio limits and backfill requirements. |
| 1.27.3 |
Interpretations and Conclusions by KCA |
| • | The Project utilizes standard mining and processing methods, which are well understood. | |
| • | The Project has a robust cash flow with a relatively low sensitivity to increases in the capital and operating costs. |
| 1.28 |
Cautionary Statement |
As noted in Section 1.6, the Project was approved by the Kern County Planning Commission. The Commission accepted the Project plan subject to a number of Conditions of Approval. A number of these conditions specifically address issues related to reclamation of the property including backfilling and restoration to approximate pre-mining topography.
The mine plan presented in this document represents best efforts by Norwest to develop a mine plan which maximizes in-pit backfill while not unduly penalizing the Project’s economic viability. The pit shells used as a basis for this feasibility were selected based on consideration of meeting ore production requirements with the goal of developing pit configurations which balanced ore tonnage against waste rock quantities.
| February 2015 | 1-18 |
|
|
|
Soledad Mountain Project |
| Kern County, CA, USA | |
| Technical Report |
The current mine plan assumes approximately 30 million tons (27 million tonnes) of waste rock will be sold as aggregate and removed from site prior to closure and closing reclamation. This mine plan also assumes that a portion of the leached and rinsed residues on the heap leach pad is either processed and sold as aggregate and removed, or else the Company is able to obtain a variation of an approval to allow a larger portion of the leached and rinsed residues to remain in place on the Phase 1 heap leach pad. If the Company cannot perform reclamation procedures according to these assumptions, the Company must re-handle a significant quantity of the residues either as backfill to the open pits or spread the residues on the property to meet the closure requirements, or a combination of both. The necessity of handling a portion of the residues as part of a closure and reclamation plan will affect the overall ore tonnage that can be mined, as the removal of waste rock and possibly a portion of the rinsed and leached residues is a component of the current mining and backfilling plan.
Norwest has worked with the Company to develop a mine plan which limits the effect of the aforementioned permitting risk on the mine life. The Company has had promising discussions with a number of aggregate users regarding the salability of the waste rock and leached and rinsed residues into local and regional markets. However, there is still a potential risk that an inability to meet the requirements of the Conditions of Approval could affect the overall mine life.
| February 2015 | 1-19 |
|
|
|
Soledad Mountain Project |
| Kern County, CA, USA | |
| Technical Report |
| 2.0 |
INTRODUCTION |
| 2.1 |
Terms of Reference |
Golden Queen Mining Co. Ltd. engaged Kappes, Cassiday & Associates (“KCA”), Mine Development Associates (“MDA”) and Norwest Corporation (“Norwest”) to prepare an updated NI 43-101 Technical Report to assess mineral reserves for the Project as part of an independent feasibility study based upon technical work and engineering designs completed up to December 31, 2014.
The geological model for the Project was developed by MDA. Norwest has used this model as a basis for pit optimization and the development of the mining plan in the feasibility study.
Detailed studies have been completed by the Company internally under the guidance of Lutz Klingmann, P.Eng., the Company’s President. KCA has incorporated the findings of many of the engineering and technical studies commissioned by the Company as these studies have been completed by qualified independent third parties. These studies are referenced in this Technical Report and a list of all references is included. Where revisions have been made to previous work they are noted (Example: capital and operating cost updates).
| 2.2 |
Qualified Persons |
The following people served as the QPs as defined in National Instrument 43-101, Standards of Disclosure for Mineral Projects, and in compliance with Form 43-101F1:
| • | Carl E. Defilippi, SME Registered Member, Engineering Manager, Kappes Cassiday & Associates, Reno NV. | |
| • | Michael M. Gustin, AIPG Certified Professional Geologist, MDA Senior Geologist. | |
| • | Sean Ennis, APEGBC Registered Member, Vice President, Mining, Norwest Corporation, Vancouver BC. | |
| • | Peter Ronning, P. Eng., APEGBC Registered Member, New Caledonian Geological Consulting, Gibsons, B.C. |
| February 2015 | 2-1 |
|
|
|
Soledad Mountain Project |
| Kern County, CA, USA | |
| Technical Report |
| 2.3 |
Site Visits and Scope of Personal Inspections |
QPs areas of responsibility are detailed in Table 2-1.
Table 2-1. QPs Areas of Report Responsibility and Site Visits
| Qualified Person | Site Visits | Report Sections of Responsibility
(or Shared Responsibility) |
| Carl E. Defilippi |
November 24-25, 2014 |
Sections 1.1-1.3, 1.5-1.7, 1.13, 1.18-1.26, |
| Sean Ennis |
Sections 1.15-1.17, 1.27.2, 1.28, 4.8, 15, | |
| Michael M. Gustin |
March 3-7, April 1-4, May |
Sections 1.8-1.12, 1.14, 1.27.1, 6, 7, 8, 9, |
| Peter Ronning |
Section 1.12 and 12.3 |
Carl Defilippi met with local management, toured the Project site, discussed the ore handling characteristics with the Project geologist, and examined chip trays and core intervals from numerous drill holes throughout the ore body.
Michael Gustin of MDA visited the Project site on the occasions listed in the table above. During these visits, he examined surface exposures of barren and altered and mineralized rocks typical of the resource area, noted the presence of numerous historical mine dumps and other surface expressions of historical underground mining, inspected mineralized drill core and RC cuttings, and reviewed numerous documents, reports, and maps in the possession of GQM LLC.
Jay Horton of Norwest conducted a site visit on behalf of his company on November 4 and 5, 2010. Mr. Horton observed the proposed pit, dump and leach pad areas. He reviewed the site configuration to confirm the reasonableness of planned development and mining assumptions.
| February 2015 | 2-2 |
|
|
|
Soledad Mountain Project |
| Kern County, CA, USA | |
| Technical Report |
| 2.4 |
Effective Dates |
The Report has a number of effective dates as follows:
| • | Effective date of the database closeout for Soledad Mountain for the purposes of estimating Mineral Resources: December 31, 2014 | |
| • | Effective date of the Mineral Resource Estimates: December 31, 2014 | |
| • | Effective date of the mineral tenure and surface rights data: December 31, 2014 | |
| • | Effective date of the Mineral Reserve Estimates: February 1, 2015 | |
| • | Effective date of the financial analysis: February 10, 2015 | |
| • | Effective date of the final report: February 25, 2015 |
There has been no material change to the scientific and technical information on the Project between the effective date of the Report and the signature date.
| 2.5 |
Information Sources and References |
Reports and documents listed in Section 3, Reliance on Other Experts and Section 28, References were also used to support preparation of the Report. Additional information was provided by Company personnel where required.
| 2.6 |
Previous Technical Reports |
The Company has previously filed the following Technical Reports:
| February 2015 | 2-3 |
|
|
|
Soledad Mountain Project |
| Kern County, CA, USA | |
| Technical Report |
Table 2-2. Previously Filed Technical Reports
| Date Filed on | Category Filed | ||
|
Name of Report |
Date of Report | SEDAR | on SEDAR |
|
Soledad Mountain Project |
|||
|
Technical Report |
Technical Report | ||
|
(Prepared by AMEC and Norwest Corporation) |
October 17, 2012 | October 25, 2012 | NI 43-101 |
|
Soledad Mountain Feasibility Study (Prepared |
|||
|
by Norwest Corporation) |
May 2, 2011 | May 17, 2011 | Other |
|
Technical Report |
|||
|
Soledad Mountain Project |
Technical Report | ||
|
(Prepared by Norwest Corporation) |
January 23, 2008 | January 31, 2008 | NI 43-101 |
|
NI 43-101 Technical Report |
|||
|
Soledad Mountain Project |
Technical Report | ||
|
(Prepared by SRK Consulting U.S., Inc.) |
March 1, 2006 | March 21, 2006 | NI 43-101 |
|
Soledad Mountain Project |
|||
|
Technical Report |
|||
|
(Prepared by John Barton Fairbairn) |
June 20, 1997 | August 26, 1997 | Other |
| 2.7 |
Units and Abbreviations |
The standard units of measure used in this Technical Report are imperial units. For consistency with certain supporting references and data, metric units may also be shown in parentheses.
Units of measure and abbreviations that may occur in this Technical Report are listed in Table 2-3.
Table 2-3. Units of Measure and Abbreviations
| Abbreviation | Description |
| AQ | Core diameter (usually ~ 2.7 cm diameter) |
| Au | Gold |
| AuEq / AuEqV | Gold equivalent |
| Ag | Silver |
| BWI | Bond ball mill work index |
| Ca(OH)2 | Calcium hydroxide, hydrated lime |
| Cdn$ | Canadian currency (dollars) |
| CIM | Canadian Institute of Mining, Metallurgy, and Petroleum |
| cm3 | Cubic centimeter |
| cm2/s | Centimeter per second |
| CV | Coefficient of variation |
| DDH | Diamond drill hole (core) |
| ft | Feet |
| ft2 or sq. ft. | Square feet |
| February 2015 | 2-4 |
|
|
|
Soledad Mountain Project |
| Kern County, CA, USA | |
| Technical Report |
| Abbreviation | Description |
| g or gms | Gram |
| gal | Gallons |
| gpm, gal/min | Gallons per minute |
| G&A | General and administrative |
| g/L | Grams per liter |
| g/t or g/mt | Grams per metric tonne |
| Ha | Hectare |
| HDPE | High-density polyethylene |
| HQ | Drill core diameter (~ 63.5 mm diameter) |
| ICP | Inductively coupled plasma analytical method |
| ICP-AES | Inductively coupled plasma analytical method |
| ID2 | Inverse distance squared |
| ID3 | Inverse distance cubed |
| in | Inches |
| kg/t or kg/mt | Kilogram per metric tonne |
| km | Kilometer |
| km2 | Square kilometers |
| km/h | Kilometers per hour |
| kW | Kilowatt |
| kN | Kilonewton |
| kWh | Kilowatt-hour |
| lb | Pounds |
| lbf | Pounds-force |
| LLDPE | Low-density polyethylene |
| LpHr/m2 | Liters per hour per square meter |
| L/t | Liters per metric tonne |
| m | Meter |
| M | Million |
| MPa | Megapascal |
| m | Micrometers or microns |
| m2 | Square meters |
| m3 | Cubic meters |
| m3/hr | Cubic meters per hour |
| masl | Mean elevation above sea level |
| mm | Millimeter |
| mg | Milligram |
| mg/L | Milligrams per liter |
| mph | Miles per hour |
| NaCN | Sodium cyanide |
| NQ | Drill core diameter (~ 47.6 mm diameter) |
| NSR | Net smelter return |
| oz | Troy ounce approximately (31.1035 grams) |
| oz/ton | Troy ounces per short ton |
| February 2015 | 2-5 |
|
|
|
Soledad Mountain Project |
| Kern County, CA, USA | |
| Technical Report |
| Abbreviation | Description |
| pcf or lb/ft3 | Pounds per cubic foot |
| PEA | Preliminary economic assessment |
| ppb | Parts per billion |
| ppm | Parts per million |
| PQ | Drill core diameter (~ 85.0 mm diameter) |
| QA/QC | Quality assurance/quality control |
| Quantile-quantile plot | |
| RC | Reverse circulation drilling method |
| RPD | Relative percent difference |
| RQD | Rock quality designation |
| SMU | Selective mining unit |
| t, mt, or MT | Metric tonne (1,000 kg) |
| t/d | Metric tonnes per day |
| t/h | Metric tonnes per hour |
| t/m3 | Metric tonnes per cubic meter |
| ton | Short ton (2,200 lbs) |
| ton/d | Short tons per day |
| ton/h | Short tons per hour |
| ton/yd3 | Short tons per cubic yard |
| US$ or USD | US currency (dollars) |
| UTM | Universal Transverse Mercator |
| % | Percent |
| February 2015 | 2-6 |
|
|
|
Soledad Mountain Project |
| Kern County, CA, USA | |
| Technical Report |
| 3.0 |
RELIANCE ON OTHER EXPERTS |
KCA, MDA and Norwest QPs have relied upon and disclaim responsibility for information derived from reports pertaining to mineral tenure, surface rights, water rights, and environmental approvals and permits.
| 3.1 |
Mineral Tenure and Royalties |
The KCA QP has not independently verified the legal status of ownership of land within the Approved Project Boundary. KCA has fully relied upon, and disclaims responsibility for information provided by Company staff and experts retained by the Company for information relating to mineral tenure, landholders’ title to properties, and mining lease agreements the Company has with landholders. The following document was referred to with respect to mineral ownership and royalty rights:
Letter from E.E. Riffenburgh, Gresham Savage, Attorneys at Law, October 10, 2012.
Detail is provided in Section 4.3 and 4.4. This information is used in Sections 4.3, 4.4, and 14.
| 3.2 |
Surface and Water Rights |
The KCA QP has fully relied upon and disclaims responsibility for information provided by Company staff and experts retained by the Company for information relating to surface rights and water rights in California. The following document was referred to with respect to current surface and water rights:
Independent California legal counsel, Paul Singarella, Esq., Latham & Watkins LLP, Costa Mesa, California, prepared a document titled “Memorandum, July 18, 2007, Initial Diligence Report and Potential Action Items – Golden Queen Mining’s Soledad Mountain Project”.
Kern County Board of Supervisors approved a water entitlement of 750 gal/min (170 m3/h) in the CUPs issued in 1997.
An assessment of surface rights and water rights is provided in
Sections 4.5, 4.6 and 5.5 of the Report. This information is used in Sections
4.5, 4.6, 5.5, 14.0 and 15.0.
| February 2015 | 3-1 |
|
|
|
Soledad Mountain Project |
| Kern County, CA, USA | |
| Technical Report |
| 3.3 |
Environmental Studies and Approvals and Permits |
The KCA QP has fully relied upon and disclaims responsibility for information provided by Company staff and experts retained by the Company for information relating to the environmental studies performed and approvals and permits obtained for the Project. The following documents were referred to with respect to environmental studies, approvals and permits.
“California Regional Water Quality Control Board, Lahontan Region, Board Order No. R6V-2012-0031, Waste Discharge Requirements, July 23, 2012.”
A Supplemental Environmental Impact Report (“SEIR”) was issued by Kern County Planning & Community Development Department as the Lead Agency in January 2010. The Kern County Planning Commission formally considered the Project at its regularly scheduled meeting in Bakersfield on April 8, 2010. The Planning Commission certified the SEIR, adopted a Mitigation Measures Monitoring Program and Conditions of Approval for the Project which define conditions and performance standards which the mining operation must meet. The Mitigation Measures Monitoring Program and Conditions of Approval for the Project were amended by Planning Commission Resolution No. 171-10 adopted on October 28, 2010
Detail is provided in Section 21 of the Report. This information was used in Section 14 of this report.
| 3.4 |
Mining Costs |
The KCA QP has relied upon Norwest and the Company for the detailed development of mining equipment selection and operating hours as they define the mining operating costs. The KCA QP performed a high-level review of the mining costs and found them
to be reasonable.
| February 2015 | 3-2 |
|
|
|
Soledad Mountain Project |
| Kern County, CA, USA | |
| Technical Report |
| 4.0 |
PROPERTY DESCRIPTION AND LOCATION |
| 4.1 |
Location |
The Project is located in Kern County in southern California as shown in Figure 4-1. The Project is located approximately 5 miles (8 km) south of the town of Mojave. The metropolitan areas of Rosamond and Lancaster lie approximately 9 miles (14 km) and 20 miles (32 km) to the south respectively. Los Angeles is about 70 miles (113 km) south of Mojave. California City lies approximately 10 miles (16 km) north-east of Mojave.
The project coordinates are N 39 59’ 20” and E 118 11’ 43”.
The Project is in the Mojave Mining District along with the former Cactus Gold Mine, Standard Hill Mine and Tropico Mine. These former operating mines are located within a radius of 5 miles (8 km) of the site.
A general site layout is shown in Figure 4-2.
| 4.2 |
Land Holdings |
The Company controls approximately 2,500 acres (1,000 hectares) of land in the area, consisting of private (fee land and patented lode mining claims and millsites) and federal lands (unpatented mining claims and millsites) administered by the BLM, collectively referred to as the Property. The total area required for the Project, which is surrounded by an Approved Project Boundary, is approximately 1,400 acres (600 hectares) in size. The actual area that will be disturbed by mining, waste rock disposal, the construction of the heap leach pads and the heap and the facilities will be approximately 1,013 acres (410 hectares) in size of which approximately 828 acres (325 hectares) will be reclaimed during and at the end of the mine life.
The Property is located west of California State Highway 14 and largely south of Silver Queen Road in Kern County, California, and covers all of Section 6 and portions of Sections 5, 7 and 8 in Township 10 North (T10N), Range 12 West (R12W), portions of Sections 1 and 12 in T10N, R13W, portions of Section 18 in T9N, R12W, and portions of Section 32 in T11N, R12W, all from the San Bernardino Baseline and Meridian. The Project facilities will be located in Section 6 of T10N, R12W. Two water production wells have been drilled in Section 32, T11N, R12W, on land controlled by GQM LLC. A third water production well was drilled in Section 1, T11N, R12W, on land controlled by GQM LLC in 2008.
| February 2015 | 4-1 |
|
|
|
Soledad Mountain Project |
| Kern County, CA, USA | |
| Technical Report |
Figure 4-1. Project Location Map

| February 2015 | 4-2 |
|
|
|
Soledad Mountain Project |
| Kern County, CA, USA | |
| Technical Report |
Figure 4-2. Site Layout
![]()
| February 2015 | 4-3 |
|
|
|
Soledad Mountain Project |
| Kern County, CA, USA | |
| Technical Report |
| 4.3 |
Mineral Tenure and Mining Lease Agreements |
The Company holds directly or controls via agreement a total of 33 patented lode mining claims, 189 unpatented lode mining claims, one patented millsite, 17 unpatented millsites, one unpatented placer claim and upwards of 980 acres (400 hectares) of fee land, which together make up the Property. As noted above, additional land is held by the Company which may be incorporated into the Project area in the future if required. The land status is shown in Figure 4-3.
GQM LLC holds or controls the properties under mining leases with 53 individual landholders, two groups of landholders and 2 incorporated entities. Contact information for the landholders is available on file in the offices in Vancouver. Length of the agreements varies and the current approach is to have agreements extend to the year 2045.
The Company believes that all the land required for the Project either has been secured under a mining lease or is held by the Company through ownership of the land in fee or via unpatented mining claims. The Company executed land purchases or entered into agreements from 1990 onwards, and is continuing to add to its land position in the area.
| 4.3.1 |
Title Review |
A formal title review was done by Gresham Savage Nolan & Tilden, a firm with experience in title matters. The report was dated September 6, 1996 and was updated to April 26, 1999. This title review was done to provide confirmation that titles remained valid. A formal title review was again done by an independent landman, Sylvia Good, in May 2004 and no particular title problems were identified.
Work on mining lease agreements and confirmation of titles is on-going and is being done by the Company’s legal counsel, Gresham, Savage, Nolan and Tilden, PC, San Bernardino.
| 4.3.2 |
Quiet Title Judgment |
The ownership history is typically complex in historical mining districts and title problems will exist. The Company obtained a Quiet Title Judgment on May 15, 1999 and this resolved a majority of title questions. The effect of the Judgment was to clear the title to the interests in the patented claims listed in the action and to cure the title defects of record, providing security of title and thus greatly enhancing the value of the Property.
| February 2015 | 4-4 |
|
|
|
Soledad Mountain Project |
| Kern County, CA, USA | |
| Technical Report |
The Company then determined that any remaining title questions would not present a threat to the Project.

Figure 4-3. Project Property Map
| 4.3.3 |
Record of Survey – Section 6 |
The California Business & Professions Code includes the Professional Land Surveyors Act, “Article 5. Surveying Practices” and specifically “8762. Records of survey”. Land surveyors must be aware of the requirements set out in Article 5 as these are essential to their surveying practice and govern their responsibilities to their clients and the state. The Company therefore decided to proceed with a Record of Survey and engaged James A. LaPuzza, PLS, MS (Jim LaPuzza) in July 2011 for this task.
A set of 14 maps based upon survey work done by Jim LaPuzza on
Soledad Mountain between 2007 and 2010, along with supporting information on the
history of staking and recording and ownership of mining claims and millsites
researched by Sylvia Good, RPL, Landman and legal counsel and staff of Gresham
Savage Nolan & Tilden from the early 1990s onwards, was submitted to the
Kern County Department of Engineering, Surveying and Permit Services in August
2010. The maps were checked in meticulous detail by County staff over a period
of 10 months. There were also numerous exchanges of information between Jim
LaPuzza and staff during this period. County staff gave the maps a “Final Check”
in May 2011. The recordable mylars were submitted to County staff in July 2011,
formally signed by the County Surveyor and forwarded to the Kern County Assessor
– Recorder as a Record of Survey.
| February 2015 | 4-5 |
|
|
|
Soledad Mountain Project |
| Kern County, CA, USA | |
| Technical Report |
The Record of Survey was recorded as follows:
| • | Recorded July 20, 2011; | |
| • | Document No. 211092035 and | |
| • | Book 0027, Page 66 |
The basis for the Company’s royalty map is now the Record of Survey and this has superseded all earlier versions of the royalty map.
A copy of this report was sent to all landholders of record on August 1, 2011.
| 4.3.4 |
Record of Survey – Section 8 |
This newest survey in effect became an extension of the Section 6 survey work utilizing the control network already established on the ground and on paper. All equipment, methods and personnel remained the same.
Unlike Section 6 with its masses of overlapping angular lode claims, Section 8, part of Soledad Mountain historically less active with actual mining, possessed a more grid-like appearance with fewer “visible” conflicts than found in Section 6. Complications arose only later with a closer examination of the title documents. The survey proved to be exceptionally complex and time consuming and took three years to complete.
The County approved a total of 14 maps and data sheets and the survey was recorded as Record of Survey No. 3318 in March 2014.
| February 2015 | 4-6 |
|
|
|
Soledad Mountain Project |
| Kern County, CA, USA | |
| Technical Report |
The Record of Survey was recorded as follows:
| • | Recorded March 31, 2014 | |
| • | Document No. 3318 | |
| • | Book 29, Page 30 |
| 4.3.5 |
Property Interests are in Good Standing |
While the Company is not in default of any current mining lease agreement, the Company is negotiating renewal terms for leases that are approaching expiry. Leases have expiry dates ranging from 2015 to 2045. All leases have an “evergreen” clause that becomes effective once production starts.
| 4.4 |
Royalties |
Royalties paid to third party landholders and the State are shown as line items in the Project cash flows in Table 22-1.
There are multiple third party landholders and the royalty formula applied to mine production varies with each property. This leads to a complex set of royalty calculations and these have been carefully assessed by GQM LLC management. A detailed set of royalty calculations has been included in the cash flow model for the Project. The estimated royalty payable over the Project’s life is approximately $30.3 million for the base case.
State fees for payable gold and silver have been applied at the following rates:
| • | Gold fee - $5.00/oz gold (post-smelter) | |
| • | Silver fee - $0.10/oz silver (post-smelter) |
The estimated combined gold and silver fee paid to the State over the Project’s life is $4.9 million for the base case.
| 4.5 |
Surface Rights |
About 45% of the land in California is controlled by the Federal Government; most of this land is administered by the US Bureau of Land Management (“BLM”), the US Forest Service, the National Park Service, or the US Department of Defense. Much of the land controlled by the BLM and Forest Service is open to prospecting and claim location. The distribution of public lands in California is shown on the BLM “Land Status Map of California” (1990) at scales of 1:500,000 and 1:1,000,000.
| February 2015 | 4-7 |
|
|
|
Soledad Mountain Project |
| Kern County, CA, USA | |
| Technical Report |
Bureau of Land Management regulations regarding surface disturbance and reclamation require that a notice be submitted to the appropriate Field Office of the Bureau of Land Management for exploration activities in which five acres (approximately two hectares) or fewer are proposed for disturbance (43 CFR 3809.1 -1 through 3809.1 -4). A Plan of Operations is needed for all mining and processing activities, plus all activities exceeding five acres (approximately two hectares) of proposed disturbance. A Plan of Operations is also needed for any bulk sampling in which 1,000 or more tons of presumed ore are proposed for removal (43 CFR 3802.1 through 3802.6, 3809.1 -4, 3809.1 -5). The BLM also requires the posting of bonds for reclamation for any surface disturbance caused by more than casual use (43 CFR 3809.500 through 3809.560) .
| 4.6 |
Water Rights |
Independent California legal counsel (“Memorandum, July 18, 2007, Initial Diligence Report and Potential Action Items – Golden Queen Mining’s Soledad Mountain Project”, Prepared by Paul Singarella, Esq., Latham & Watkins LLP, Costa Mesa, California.) did an analysis of water rights in California on a confidential basis. The following are key points:
| • | California does not regulate the use of groundwater under a state-wide administrative permit program; | |
| • | A land holder with land overlying groundwater does not need to have the right to pump water verified before the land holder can drill wells and pump water; | |
| • | Groundwater rights rules include a hierarchy of rights under which the rights of the overlying users are paramount; | |
| • | When a groundwater basin is in an overdraft condition, competing water uses will frequently initiate judicial proceedings to test the claims of competing rights; | |
| • | Groundwater rights can be determined, and pumping limited, through court adjudications; | |
| • | The Project will draw groundwater from the Fremont Valley groundwater basin and this basin is separated from other basins by significant geological features; | |
| • | Ongoing monitoring will be required to ensure that the groundwater immediately underlying the Project is not in an overdraft condition; |
| February 2015 | 4-8 |
|
|
|
Soledad Mountain Project |
| Kern County, CA, USA | |
| Technical Report |
| • | If the Project’s groundwater demands were to contribute to an overdraft condition, the Company would be bound by the correlative rights doctrine, which provides that as between overlying owners, all have equal rights to the water and must share in any water shortages; | |
| • | An adjudication of groundwater resources in the Antelope Valley is ongoing and this also needs ongoing monitoring to confirm that the Fremont Valley groundwater basin is not drawn into this adjudication; and | |
| • | Under Article X, Section 2 of the California Constitution, water must be put to “reasonable and beneficial use” and the California Code of Regulations expressly defines “beneficial uses” to include mining. |
The Kern County Board of Supervisors approved a water entitlement of 750 gal/min (170 m3/h) in the CUPs issued in 1997.
Water required for the Project and alternative water supplies are described in Section 18.2.
| 4.7 |
Reclamation and Reclamation Financial Assurance |
The Company will provide reclamation financial assurance in the form of an Irrevocable Standby Letter Of Credit backed by a Certificate Of Deposit with Union Bank, N.A. in the amount of US$624,142. This is the current estimate for reclamation of historical disturbances on the property and this is reassessed annually.
The Company prepared detailed cost estimates for ongoing reclamation and reclamation at the end of the life of the mine and these cost estimates were included in the Application for a revised Surface Mining Reclamation Plan. The Company will provide the necessary financial assurance as required by the regulatory authorities. Cost estimates for site reclamation are included in the discussion of the Project economics and operating costs.
Additional approvals and permits will be required as Project development proceeds, primarily Kern County building permits to include all applicable California codes. Conditions the Company must meet both before the start of construction, during operations and after operations have ended are set out in the Mitigation Measures Monitoring Program and Conditions of Approval.
| February 2015 | 4-9 |
|
|
|
Soledad Mountain Project |
| Kern County, CA, USA | |
| Technical Report |
| 4.8 |
Cautionary Statement |
As noted in Section 1.6, the Project has been approved by the Kern County Planning Commission. The Commission accepted the Project plan subject to a number of Conditions of Approval. A number of these conditions specifically address issues related to reclamation of the property including backfilling of mined-out phases of the open pits and restoration of other areas to approximate the pre-mining topography.
If the Company cannot perform closure and reclamation procedures as per its assumptions, the Company must re-handle a quantity waste rock and leached and rinsed residues to meet the closure and reclamation requirements. The removal of waste rock and possibly a portion of the leached and rinsed residues is an important component of the current mining and backfilling plan.
| February 2015 | 4-10 |
|
|
|
Soledad Mountain Project |
| Kern County, CA, USA | |
| Technical Report |
| 5.0 |
ACCESSIBILITY, CLIMATE, LOCAL RESOURCES, INFRASTRUCTURE AND PHYSIOGRAPHY |
| 5.1 |
Access |
Refer to Section 18.1 for a detailed description of access to site.
Access to site is from State Route 14 and Silver Queen Road, an existing paved county road. Access also exists from the south via Mojave Tropico Road, an existing paved county road. State Route 14 is the major highway, which connects Mojave, Rosamond, Lancaster and Palmdale to the greater Los Angeles area.
The Kern County Planning & Community Development Department assigned a street address for the Project – 2818 Silver Queen Road, Mojave, CA 93501.
| 5.2 |
Climate |
The Mojave region is generally characterized as arid, with a wet season from December through March. Rainfall events tend to be short-lived and of high intensity. Mojave experiences high summer temperatures up to 113F (45C). The minimum temperature may reach 20F (-7C). Maximum wind speed is 90 mph (145 km/h) with Exposure C for design purposes. Mean recorded annual rainfall is 6.14 inches (15.6 cm) with a mean maximum month of 1.11 inches (2.82 cm).
Exploration is possible year round, though snow in winter and wet conditions can make travel on unimproved dirt roads difficult. It is also expected that mining operations will be conducted year round.
| 5.3 |
Local Resources |
Services such as a hospital, ambulance, fire-protection, garbage and hazardous waste disposal, schools, motels and housing, shopping, airport and recreation are available in Mojave and its surroundings. Telephone and internet service are available on site.
Mojave is a railroad hub for the Burlington Northern/Santa Fe and Union Pacific/Southern Pacific railroad lines.
| February 2015 | 5-1 |
|
|
|
Soledad Mountain Project |
| Kern County, CA, USA | |
| Technical Report |
Off-site infrastructure such as the availability of power and a backup water supply is described in Section 18.0.
| 5.4 |
Physiography |
The Soledad Mountain gold-silver deposit is hosted in a volcanic sequence of rhyolite porphyries, quartz latites and bedded pyroclastics that form a large dome-shaped feature, called Soledad Mountain, along the margins of a collapsed caldera. The deposit is located on the central-northeast flank of Soledad Mountain. The mountain has a domal form that is a reflection of an original, dome-shaped volcanic center. Elevations range from 4,180 ft (1,270 m) above mean sea level at the highest point of Soledad Mountain to 2,840 ft (870 m) above mean sea level at the valley floor north of the mountain. The topographic relief ranges from moderate to steep.
Vegetation is typical of the Basin and Range physiographic province. The lower slopes of Soledad Mountain are covered by sagebrush, grass, and various desert shrubs. Fauna that have been observed in the Project area are typical of those of the Great Basin area.
| 5.5 |
Sufficiency of Surface Rights |
The Kern County Planning Commission formally considered the Project on April 8, 2010. At the meeting, the Commission, consisting of a panel of three commissioners, unanimously approved the Project. The Planning Commission certified the Supplemental Environmental Impact Report (SEIR) and adopted a Mitigation Measures Monitoring Program and a set of Conditions of Approval for the Project. The Mitigation Measures Monitoring Program and Conditions of Approval for the Project were amended by Commission Resolution No. 171-10 adopted on October 28, 2010 and are now final. The Approved Plan for the Project includes an Approved Project Boundary with a legal description checked and confirmed by the Kern County Engineering, Surveying & Permit Services Department.
The Company believes that the land required for the Project, which has been included within the Approved Project Boundary, has either been secured under a mining lease or is held by the Company through ownership of the land in fee or via patented and unpatented lode mining claims or millsites. Detail on the SEIR is provided in Section 20.1.1.
| February 2015 | 5-2 |
|
|
|
Soledad Mountain Project |
| Kern County, CA, USA | |
| Technical Report |
| 5.6 |
Comments on Section 5 |
In the opinion of the KCA QP:
The Project is located in an area with access and services that can support the development and operation of the configuration and scale that is currently under construction.
| February 2015 | 5-3 |
|
|
|
Soledad Mountain Project |
| Kern County, CA, USA | |
| Technical Report |
| 6.0 |
HISTORY |
The following information related to exploration history and past production is modified from reports by M3 Engineering (1998), Clark (2006), and with additional references as cited.
The first recorded mining activity in the Mojave Mining District occurred on March 8, 1894, when W.W. Bowers discovered gold on a promontory south of Mojave, then known as Little Buttes and subsequently named Bower’s Hill (which today is known as Standard Hill). This soon led to the discovery of the Exposed Treasure Mine on the same hill. Later that year gold was found on Soledad Mountain which led to the development of the following productive mines: Queen Esther, Karma, Elephant, Echo, and Grey Eagle.
The high cost of shipping ores led to the building of the first mill near Soledad Mountain in 1901, at the Exposed Treasure Mine. This mill consisted of 20 stamps and a cyanide plant. Construction of other mills followed rapidly, including the Echo in 1902 with 10 stamps, later increased to 20 stamps; the Queen Esther in 1903, with 75 ton per day of dry crushing capacity that was increased to 150 ton per day in the following year; and the Karma in 1904, with 20 stamps. Of these historical workings the Exposed Treasure, located north of the current property boundary, was the largest with production of 105,000 ounces of gold (calculated from the reported dollar value). The Queen Esther was second, with production equivalent to 62,000 ounces of gold, and Karma was third with production equivalent to 37,000 ounces of gold. By 1914 the ore for these mills was exhausted and the mills were closed.
In September 1933, George Holmes discovered a piece of float that led to the discovery of the Silver Queen vein on Soledad Mountain. The property was sold in January 1935 to a syndicate (Golden Queen Mining Co.) headed by Gold Fields American Development Co. (“GFA”), a subsidiary of Consolidated Gold Fields of South Africa. The syndicate included several of the larger American mining groups (Julihn and Horton, 1937). GFA conducted extensive exploration resulting in a large increase in ore reserves by October 1935, and went into production. During the exploration period, the Golden Queen vein was discovered.
GFA constructed a conventional 300 tons-per-day mill that began operating in October 1935. California Journal of Mines and Geology reports in 1938 and 1940 indicate that the mill was expanded to 400 tons per day by 1937 and again to 500 tons per day by 1939. The mill reportedly achieved 90 percent recovery through vat leaching of -200 mesh material. GFA mined portions of the Silver Queen, Golden Queen, Soledad, Queen Esther, and Karma veins, and received custom ore from other properties on Soledad Mountain and Standard Hill.
| February 2015 | 6-1 |
|
|
|
Soledad Mountain Project |
| Kern County, CA, USA | |
| Technical Report |
Records are incomplete, but by 1942, when GFA’s operations were shut down by order of the War Production Board, it is estimated that total production at Soledad Mountain since initial discovery was approximately 1,355,000 tons of ore mined, yielding approximately 367,000 ounces of gold and 8,521,400 ounces of silver (Perez, 1978, citing a 1976 confidential report from Rosario Exploration Co.). The estimate given by Perez indicates an average grade of 0.271 ounces of gold per ton and 6.3 ounces of silver per ton. Using the information supplied by Perez, the GFA portion of this production can be estimated at approximately 1,000,000 tons. MDA does not know if the average grades stated above are based on recovered metal, or refer to the average head grades processed.
The operations of GFA from 1935 to 1942 included significant underground core drilling and underground channel sampling for exploration, development and ore control. During this time a total of 61 underground diamond-core holes were drilled, for a total of approximately 16,200 ft of drilling. MDA’s current database also contains 4,465 channel samples from cross cuts taken by GFA, representing 15,947 linear feet. Channel samples varied from 0.1 ft to 38 ft in length, with a median length of 4 ft. Inspections of channel sites on the 200 level by Mineral Resources Development Inc. (“MRDI”) indicate the samples were neatly cut horizontally to a width of 6 in by either 1 in or 2 in depths, mainly to lengths of about 5 ft (Parker et al., 2000). No description of the exact channel sample procedures have been found, but MRDI inferred the samples were cut by hand chisels. GFA’s underground assay maps were plotted on linen and include numerous channel samples from drifts and cross cuts. It is notable, however, that none of the channel samples from drifts were digitized by later operators and they remain absent from the current assay database.
Production did not resume after the war due to increased costs of mining while the gold price remained at historical levels of $35.00 per ounce. GFA returned the property to the previous owners and Golden Queen Mining Co. was dissolved in 1953. During this period, an area south and west of the Golden Queen Vein was explored and a large vein was discovered on the Starlight claim. The Lodestar Mining Co obtained control of this area. The Soledad Extension Vein, west of the Starlight was discovered, developed, and production was shipped to GFA’s mill. During the 1950s, small-scale mining was carried out at Soledad Mountain by independent lessees and limited to about 8,000 tons of ore.
As stated by M3 Engineering (1998) “Previous underground mining has removed high grade shoots within portions of vein systems, leaving lower grade material in the hanging wall, and foot walls along strike and down dip. It is estimated that less than one third of the old mine workings had production, while the remaining two thirds of the openings represent exploration and development....”
| February 2015 | 6-2 |
|
|
|
Soledad Mountain Project |
| Kern County, CA, USA | |
| Technical Report |
Substantial investigation of the Project area did not resume again until the mid-1970s when Rosario Exploration Company conducted surface drilling and underground sampling of cross cuts. Rosario collected a total of 265 underground channel samples, representing 2,150 linear feet. Eight RC drill holes were drilled by Rosario in 1977. Surface and underground geologic mapping and alteration studies were carried out by Perez (1978), followed by broader surface mapping by McCusker (1982).
Initial appraisal of old underground assay maps impressed GQM LLC management with the horizontal and vertical extent of the deposit, and the significant precious metal values extending into the footwall and hanging wall of the major veins. At approximately the same time, during 1986-1987, Shell Oil’s Billiton division drilled 25 RC holes at Soledad Mountain for a total of 6,365 ft.
During 1988 and 1989, CoCa Mines Inc. carried out 3,260 ft of RC drilling in a total of 20 holes in the northwestern portion of the deposit.
Work completed by GQM LLC is summarized in subsequent sections of this report.
| February 2015 | 6-3 |
|
|
|
Soledad Mountain Project |
| Kern County, CA, USA | |
| Technical Report |
| 7.0 |
GEOLOGICAL SETTING AND MINERALIZATION |
A general, but still relevant description of the geologic setting and mineralization of the Soledad Mountain gold-silver deposit was presented by Diblee (1963), with more detailed geology provided by Perez (1978), McCusker (1982), and a later summary by Bruff (1998, July). Subsequent reports by M3 Engineering (1998), MRDI (2000), and Ennis and Hertel (2012) used text taken from McCusker (1982) and Bruff (1998, July). The following sections are modified from the above reports, and other sources as cited.
| 7.1 |
Geologic Setting |
| 7.1.1 |
Regional Geology |
Soledad Mountain is an erosional remnant of an early Miocene rhyolitic volcanic center situated within the western part of the Mojave structural block, a triangular-shaped area bounded to the west by the northwest-trending, right-lateral San Andreas Fault, and to the north by the northeast-trending Garlock Fault (Figure 7-1). Cretaceous quartz monzonite plutons of the Sierra Nevada batholith and roof pendants of meta-sedimentary and meta-volcanic rocks comprise a crystalline basement throughout the western part of the Mojave block. In this area, Tertiary age sedimentary and volcanic sequences, as well as Quaternary age sedimentary units, unconformably overlie the Cretaceous crystalline basement (Diblee, 1963). The Tertiary sedimentary and volcanic rocks were assigned to the Tropico Formation and further subdivided by Diblee (1963) to include the Gem Hill Formation, a sequence of calc-alkaline, largely rhyolitic flows, domes, tuffs and intercalated volcanic- and lacustrine sedimentary rocks exposed at Soledad Mountain and elsewhere in the region. According to Diblee (1963) the Gem Hill Formation dips generally to the south at low angles at Soledad Mountain.
Rocks of the Gem Hill Formation are now recognized to include separate, moderate-volume silicic volcanic centers exposed at Soledad Mountain, Willow Springs and Middle Buttes (e.g. McCusker, 1982, see below). GQM LLC geologists infer that these volcanic centers developed at the intersections of northeast and northwest-trending fracture systems; at Soledad Mountain this volcanism has been radiometrically dated at about 21.5 to 16.9 million years ago (“Ma”) (McCusker, 1982).
| February 2015 | 7-1 |
|
|
|
Soledad Mountain Project |
| Kern County, CA, USA | |
| Technical Report |
Figure 7-1. Geology of the Soledad Mountain Region, Western Mojave Structural Block
(from California Geological Survey (2010))

The Mojave block is broken into an orthogonal pattern of N50E to N65E and N40W to N50W faults and fracture systems (Figure 7-2). Although some of the faults may have originated during late Mesozoic through Oligocene regional compression, many geologists consider the faults and fracture systems to be largely due to wrench-style transpression and local extensional tectonics that took place between the San Andreas and Garlock faults during the Neogene and Quaternary Periods.
| February 2015 | 7-2 |
|
|
|
Soledad Mountain Project |
| Kern County, CA, USA | |
| Technical Report |
Figure 7-2. Regional Late Cenozoic Structural Setting of the
Mojave Block
modified from Diblee (1963)

| 7.1.2 |
Local Geology |
As noted by McCusker (1982), Soledad Mountain was first described as an eroded remnant of a rhyolite flow-dome and volcanic center by Williams (1932). McCusker (1982) mapped Soledad Mountain in detail as part of a masters thesis research project and defined the major stratigraphic and structural features of the volcanic complex present there. GQM LLC has modified McCusker’s nomenclature. Volcanic rocks at Soledad Mountain comprise individual and coalesced intrusive-extrusive domes, flows and near-vent pyroclastic deposits. This volcanic center overlies Cretaceous quartz monzonite and granodiorite, such as at the adjacent Standard Hill mine. McCusker obtained K-Ar ages of 21.5 ± 0.8 Ma to 16.9 ± 0.7 Ma from the lowermost and uppermost volcanic units, demonstrating that volcanism took place over as much as six million years during early Miocene time.
| February 2015 | 7-3 |
|
|
|
Soledad Mountain Project |
| Kern County, CA, USA | |
| Technical Report |
The lowermost Tertiary volcanic unit penetrated in drilling is an early Miocene, flow-banded quartz latite (low-silica rhyolite) lava flow that strikes northwest and dips at low angles to the northeast, and it probably correlates with the informally named “lower quartz latite” of McCusker (1982). This unit is distinctly rich in phenocrysts (25-35%), including embayed quartz as large as 1.5cm (McCusker, 1982).
Overlying the quartz latite is a sequence of coarse vent-proximal volcanic debris, breccias and lithic tuffs informally termed the “middle pyroclastic unit” by McCusker (1982) and referred to as the “lower pyroclastics” by Clarke (2006).
Flow-banded rhyolites with very sparse, small phenocrysts intrude and overly the “middle pyroclastic” unit of McCusker (lower pyroclastic unit - GQM LLC usage). The flow-banded rhyolites were termed the “aphyric rhyolite” unit by McCusker (1982) and the “AFBR” unit by Bruff (1998, July), and they appear to have flowed out along a northwest-trending, high-angle vent generally coinciding with the center of the deposit, and then north-eastward away from the vent.
Coarse-grained pyroclastic breccias occur locally overlying the flow-banded rhyolites along the axis of the inferred vents. GQM LLC geologists interpret these rocks as laterally discontinuous zones of vent eruption- and collapse-breccias that formed after the main pulse of flow-banded rhyolite extrusion. McCusker (1982) defined a sequence of near-vent breccias and pyroclastic deposits overlying the aphyric rhyolite unit, that he termed the “upper pyroclastic” unit. The content of flow-banded rhyolite fragments was observed to decrease upward, with increasing quantity of cognate fragments and becoming finer upward as well. McCusker (1982) interpreted this unit as the near-vent pyroclastic apron, or cone, formed by eruptions precursor to the intrusion and eruption of the succeeding unit of porphyritic rhyolite (see below).
The youngest volcanic unit at Soledad Mountain was originally mapped as the felsite phase of the Bobtail Quartz Latite member of the Gem Hill Formation (Diblee, 1963). It was later carefully mapped and well-described as flow-banded porphyritic rhyolite that forms a “series of partly eroded lava domes and and their co-extensive flows, masses of autobrecciated rubble, and dikes” (McCusker, 1982). At the surface the rock varies from devitrified in large part, to much smaller volumes of vitrophere and perlite. GQM LLC geologists refer to this unit as massive, “quartz-eye rhyolite porphyry”. This is not consistent with the petrography of McCusker (1982), and MDA geologists note that the distinctive, granophyric groundmass textures corresponding to the term “porphyry” are absent in this and all other units at Soledad Mountain. Because the term “porphyry” signifies felsic igneous rocks emplaced and crystallized at subvolcanic depths of 1-2 km or more below the surface, and the rhyolites at Soledad Mountain were demonstrably emplaced immediately below and at the paleosurface, MDA recommends discontinuing use of the name “rhyolite porphyry” and use porphyritic rhyolite in its place.
| February 2015 | 7-4 |
|
|
|
Soledad Mountain Project |
| Kern County, CA, USA | |
| Technical Report |
The late porphyritic rhyolite unit outcrops over most of the southwest portion of the property and has been intersected in drilling in other areas of the project as well. This unit forms the core of the volcanic complex, intruding and displacing previous volcanic units south of the deposit center. Emplacement of the late porphyritic rhyolite may have been controlled by a northwest fault that now coincides with the Soledad Extension Vein.
Within the deposit area GQM LLC has classified the volcanic lithologies into four map units as shown in Figure 7-3 and Figure 7-4: Quartz latite: present over most of the northeast portion of the deposit and in the subsurface of the center of the deposit; pyroclastics: present in the subsurface of the north- central portion of the deposit beneath flow-banded rhyolite (“middle pyroclastics” in GQM LLC drilling data); Flow-banded rhyolite: present at the surface in the north-central portion of the deposit and, as an intrusive, extending deep into the center of the deposit; and rhyolite porphyry (porphyritic rhyolite): present as a massive body extending from the surface to the bottom of drilling over most of the southwest portion of the deposit, as well as in numerous other locations in the deposit area, often related to the mineralized structural zones.
| February 2015 | 7-5 |
|
|
|
Soledad Mountain Project |
| Kern County, CA, USA | |
| Technical Report |
Figure 7-3. Highly Generalized Surface Geology of Soledad
Mountain
(from GQM LLC, 2000)

| February 2015 | 7-6 |
|
|
|
Soledad Mountain Project |
| Kern County, CA, USA | |
| Technical Report |
Figure 7-4. Geology Cross-section 2800, Looking North
(from GQM LLC, 2014)
![]()
Note: see Figure 10-1 for location of cross section
On the south flank of Soledad Mountain, south of the deposit, McCusker (1982) mapped a thin sequence of tuffaceous siltstone, volcanic sandstone and fresh-water limestone overlain by basaltic andesite lava containing quartz xenocrysts. These units were inferred to lie stratigraphically above nearby exposures of the middle pyroclastic sequence, and beneath the upper, porphyritic rhyolite (McCusker, 1982).
| 7.2 |
Mineralization |
A comprehensive summary of the precious metal mineralization at Soledad Mountain and the surrounding Mojave mining district is provided by Diblee (1963), in part based on descriptions from Gardner (1954). Gold and silver mineralization occurs in a swarm of mainly northwest-striking, subparallel to anastomosing, low-sulfidation, epithermal quartz veins that formed in faults and fractures within the Miocene rhyolitic volcanic units. Quite detailed descriptions of the host rocks, structural controls of the veins, and vein minerals were presented by Perez (1978). Veins occur in parallel and, locally, en echelon patterns over a total strike-length of 7,000 ft and a total width of 4,500 ft. The veins have been sheared and brecciated to varying degrees by post-mineral faulting. A mineralization age of 16.1 Ma is mentioned by Bruff (1998, July), but MDA is not aware of the source of this age date. The following information is taken from Bruff (1998, July), MRDI (2000), Ennis and Hertel (2012), and sources therein.
| February 2015 | 7-7 |
|
|
|
Soledad Mountain Project |
| Kern County, CA, USA | |
| Technical Report |
More than 20 gold-silver veins and related vein splits occur at Soledad Mountain (Figure 7-5). Veins generally strike N40W and dip at moderate to high angles to the northeast and to the southwest Figure 7-6).
Figure 7-5. Plan Map of Gold Domains Along Mineralized
Structures at 3485 ft Elevation
(MDA modeled domains – see Section
14.2.6)

| February 2015 | 7-8 |
|
|
|
Soledad Mountain Project |
| Kern County, CA, USA | |
| Technical Report |
Figure 7-6. Cross-section 2800, Looking Northwest
(MDA modeled Au data, 2014)

Note: see Figure 10-1 for location of cross section
Mineralization consists of fine-grained pyrite, covellite, chalcocite, tetrahedrite, acanthite, native silver, pyrargyrite, polybasite, native gold, and electrum within discrete quartz veins, veinlets, veinlet stockworks and irregular zones of silicification. Gangue minerals include quartz, potassium feldspar (adularia), ferruginous kaolinitic clay, sericite, hematite, magnetite, goethite, and limonite. As stated by Bruff (1998, July) “At least five generations of quartz veining have been identified in hand-specimens within the major fissure-fill veins.” Calcite has also been reported by Diblee (1963) and in GQM LLC logging, as well as calcite replacement textures in quartz. Rhythmically banded veins are quite likely to show alternating layers of quartz and adularia (Bruff, 1998, July).
The veins formed by intense alteration of volcanic rocks and by deposition of quartz and sericite-rich material in fault and fracture zones. The alteration and veins are generally low in sulfur, with total sulfide content generally being 1% or less. Vein “zones” consist of one or more central veins surrounded by either a stockwork or parallel zones of sheeted, narrow quartz veins. The effect is to have a core vein of 1 ft to 20 ft in width (with gold grades being generally greater than 0.1 oz/ton), surrounded by lower grade mineralization in the adjacent quartz-vein stockwork and sheeted vein zones. The widths of the stockwork and sheeted vein zones vary from 5 ft to 150 ft. The boundary between mineralized and non-mineralized material must be determined by assay.
| February 2015 | 7-9 |
|
|
|
Soledad Mountain Project |
| Kern County, CA, USA | |
| Technical Report |
Native gold and electrum are generally associated with siliceous gangue and occur as particles with diameters ranging from less than 10 m to as much as 150 m or more. Electrum contains about 25% silver. Gold grades greater than 0.1 oz/ton appear to occur where veins exhibit multiple generations of quartz, adularia and sericite. Sheeted veins and stockwork veinlets decrease in grade laterally outward from the core veins. Silver to gold ratios vary from 1:1 in shallow portions of veins in the south half of the deposit to greater than 35:1 at deeper levels (600 Level) in the north half of the deposit. Silver to gold ratios increase generally with depth, averaging about 10:1 at the surface of the Golden Queen vein, to about 35:1 at the 600 Level in the same vein. There is also a general horizontal zonation, from relatively silver-rich in the northeastern vein systems (e.g., Queen Esther – Independence), to gold-rich structures in the southwest (e.g., the Sheeted Vein system). The district silver-to-gold ratio average ranges from 15:1 to 18:1.
Alteration within mineralized zones consists of fracture-controlled and disseminated fine-grained silica, adularia, sericite, and minor pyrite. Intense quartz-feldspar-sericite alteration reportedly occurs in zones from about 10 ft to over 150 ft wide. Volcanic rocks are weakly silicified and argillically altered between and adjacent to zones of strong silicification. Weakly silicified and argillically altered rocks grade laterally into weakly to strongly propyllitized + illitized volcanic rocks. Propylitic alteration is best developed in the quartz latite flows.
Important vein systems, from the northeast to southwest, are the Black, Reymert, Karma-Ajax, Independent, Queen Esther, Silver Queen, No. 1 Footwall, Golden Queen - Starlight, Soledad, Alphason, Gypsy, Echo, Hope, Elephant, Bobtail, Excelsior, and McLaughlin. Post-mineral offset of about 300 ft on the east-dipping, apparently listric, Main Fault has displaced the Starlight vein in the footwall, from its upper continuation known as the Golden Queen vein in the hanging wall (Figure 7.6) . Portions of the Soledad and No. 1 Footwall veins are also displaced by offset on the Main Fault. Veins northeast of the Golden Queen vein dip from 40 to 70 northeast. Veins southwest of the Golden Queen Vein dip about 70 southwest (Figure 7-6).
| February 2015 | 7-10 |
|
|
|
Soledad Mountain Project |
| Kern County, CA, USA | |
| Technical Report |
A zone of “Flat Ore” is present between the Starlight and Silver Queen Vein, in the hanging wall of the Main Fault. Flat Ore is a complex zone of veins and stockwork mineralization that is from 100 ft to 125 ft thick and nearly horizontal that at least in part consists of blocks of the mineralized zones cut by the Main Fault. Individual, parallel and en-echelon vein systems are present over a total strike length of 7,000 ft trending northwest, and a total width of 4,500 ft. Veins and vein zones are from 5 ft to 150 ft in thickness, 325 ft to 3,000 ft long, and from 300 ft to 1,000 ft in extent along dip. The horizontal distance between individual veins is from 50 ft to greater than 400 ft.
| February 2015 | 7-11 |
|
|
|
Soledad Mountain Project |
| Kern County, CA, USA | |
| Technical Report |
| 8.0 |
DEPOSIT TYPES |
The Soledad Mountain gold-silver deposit is best interpreted as a volcanic rock-hosted, low sulfidation, epithermal vein system of the low base metal type. Individual major veins formed by episodic deposition of quartz, adularia, sericite, calcite, and sparse sulfide minerals in open faults and fractures, coeval with adjacent sheeted and quartz-vein stockwork zones and quartz ±adularia ±sericite alteration of nearby wall-rocks. Other examples of this deposit class include districts such as Oatman (Arizona), Bullfrog (Nevada), Bodie (California), and Tayoltita (Mexico). Soledad Mountain contains an unusually large number of individual veins within a relatively small area by comparison to the examples cited. Post-mineral faulting at Soledad Mountain has extensively sheared and brecciated the veins, most likely due to mid-Miocene to present-day wrench-fault tectonism between the nearby San Andreas and Garlock fault systems.
| February 2015 | 8-1 |
|
|
|
Soledad Mountain Project |
| Kern County, CA, USA | |
| Technical Report |
| 9.0 |
EXPLORATION |
| 9.1 |
Project Topography and Coordinate Systems |
Ennis and Hertel (2012), quoting the AMEC 2012 report of estimated resources, stated “A new topographic database was produced in 2004. DeWalt Corporation, Bakersfield set the control points around the perimeter of the area. Foto Flight Surveys Ltd., Calgary did the aerial photography in July 2004. Triathlon Ltd., Vancouver (a company that is no longer in business) scanned colour film, completed aerial triangulation, photogrammetric mapping and digital orthophotography. Project specifications were as follows:
| • | Control points eight targeted and surveyed control points. | |
| • | Photo scale 1:16,000. | |
| • | Mapping scale 1 inch = 200 ft. | |
| • | Contour interval 5 ft. | |
| • | Projection California State Plane Zone 5. | |
| • | Horizontal datum NAD83. | |
| • | Vertical datum NAV88.” |
Prior to the 2000s, a coordinate system based on a local mine grid established by GFA in the 1930s was used to define the locations of mine workings, samples, drill holes, topography, and infrastructure at Soledad Mountain. The project data were converted to California State Plane, Zone 5 coordinates using the NAD83 datum by AMEC on behalf of GQM LLC, possibly in the early 2000s.
| 9.2 |
Grids and Surveys |
Exploration conducted by the current operator, GQM LLC, began in earnest in 1988 with an initial program of 12 diamond-drill holes and underground check samples. With encouraging results, the next phase switched to RC drilling and more extensive underground check sampling that lasted through 1991. While records are inadequate to properly document the extent of its involvement, Noranda Exploration participated as a joint venture partner in this initial phase of exploration work. The project was placed on a care and maintenance basis from 1991 to 1994 due to low funding. At that time, the project data base contained 12 diamond drill holes, 332 RC drill holes, and 24,394 ft of underground assay data according to Clarke (2006).
| February 2015 | 9-1 |
|
|
|
Soledad Mountain Project |
| Kern County, CA, USA | |
| Technical Report |
In 1994, the project was reactivated with a new exploration and development staff. From 1994 to 1997, GQM LLC added 15 surface diamond-drill holes, 344 RC drill holes, and 14,105 ft of underground core drilling to the project database. GQM LLC collected additional underground cross-cut channel samples in 1998 according to Clarke (2006). During 1999, GQM LLC added approximately 32,100 ft of drilling, nearly all of it RC, as well as additional underground samples.
Exploration work was put on hold again in 2000 and did not resume until 2011. A total of 6,304 ft of RC drilling in 20 holes was done in 2011
| 9.3 |
Underground Channel Samples |
GQM LLC performed channel sampling of underground cross cuts as part of the exploration work carried out from 1988 to 2011. Channel samples were collected in multiple campaigns from cross-cuts, including areas sampled previously by GFA between 1933 and 1942. MDA’s resource database contains a total of 888 underground channel samples collected by GQM LLC, representing approximately 3,797 linear feet. Sample lengths vary from 0.1 ft to 22.2 ft, with a median sample length of 5 ft. It has been reported by Parker et al. (2000) that GQM LLC’s 1997-1998 channel samples were cut horizontally to “two to three inches wide and five feet long” with pneumatic hammers and “Rock chips were collected on a canvas sheet. Samples weighing about 14.5 kilograms were produced from [GQM LLC] channels”. MDA is not aware of more specific descriptions of the procedures used, such as the depth of the channels.
Much of the GQM LLC channel sampling was conducted to validate the pre-war assays posted by GFA to the linen underground maps, so as to be able to understand and utilize the GFA assays for modeling and estimation of the remaining resources. Results from the GQM LLC channel samples were markedly lower in gold than nearby and/or adjacent GFA channel sample assays, although the silver results compared well. The differences in grades were the subject of considerable evaluation, assessment, and controversy (e.g., M3 Engineering (1998), Parker et al. (MRDI 2000) and references therein). The comparisons were further complicated by the absence of information concerning the assay methods used by GFA, which were assumed to be fire assays. Prior to the current resource estimate, the approach was to reduce all of the GFA channel sample assays by a set numerical factor. M3 Engineering (1998) reduced all of the GFA cross cut assays by 21%, whereas the GFA assays were adjusted according to the formula “Adjusted value = 0.8571 x GFA - .0088” by Ennis and Hertel (2012). MDA’s approach to the use of the GFA channel sample assays is discussed in Section 14.2.6.
| February 2015 | 9-2 |
|
|
|
Soledad Mountain Project |
| Kern County, CA, USA | |
| Technical Report |
| 9.4 |
Geological Mapping |
According to Ennis and Hertel (2012), GQM LLC geologists completed surface geologic mapping of Soledad Mountain between 1986 and 1991. Additional surface mapping and cross sectional interpretations were completed in the 1990s, including significant work by Vance Thornsberry and Boies Hall (as cited by Bruff, 1998, July).
| 9.5 |
Pits and Trenches |
As stated by Ennis and Hertel (2012) quoting the AMEC 2012 report of estimated resources, “Several legacy trenches were noted on the southern extension of the Golden Queen vein. Channel samples indicate that anomalous gold mineralization is present.” Assay results from these surface trench samples have not been used by MDA in developing the current mineral resource estimate.
| 9.6 |
Geochemical Surveys |
As stated by Ennis and Hertel (2012) quoting the AMEC 2012 report of estimated resources, “Geochemical surveys were completed on the property over a number of years in the 1990s. [GQM LLC] found a map in the records but could not locate the supporting information. Golder Associates Inc., Lakewood created a Geochemical Survey Map from the historical map to provide a more permanent record (Project No. 043-2299C). The Geochemical Survey Map is shown in Figure 9.1. The information is available in the Norwest offices in Vancouver.”
The Geochemical Survey map (Figure 9-1) shows that a minimum of 438 soil and 101 rock-chip samples were collected and analyzed. MDA has no information regarding the procedures used to collect, process, or assay these samples. Analyses for gold, mercury, arsenic, and antimony were obtained for the soil and most of the rock-chip samples, and gold, mercury, and arsenic were determined for a small number of the rock-chip samples. Additional elements may have been determined, but MDA has no records of the assays other than the map shown in Figure 9-1. The surface geochemical map data are not in a digital format; MDA has not evaluated these data and cannot comment on any patterns or exploration significance that could be derived from it.
| February 2015 | 9-3 |
|
|
|
Soledad Mountain Project |
| Kern County, CA, USA | |
| Technical Report |
Figure 9-1. Surface Geochemical
Sample Map of Soledad Mountain
from Ennis and Hertel (2012)

| February 2015 | 9-4 |
|
|
|
Soledad Mountain Project |
| Kern County, CA, USA | |
| Technical Report |
| 9.7 |
Petrology, Mineralogy and Research Studies |
In 1989, Russell Honea examined polished sections from metallurgical test samples in order to enhance GQM LLC’s understanding of the mineralization. A suite of 11 additional metallurgical samples were examined by Pittsburgh Mineral and Environmental Technology, Inc., to determine gold and silver mineralogy and liberation characteristics.
| 9.8 |
Geologic Interpretation and Re-Logging by GQM LLC |
A GQM LLC study of mineralized structures by Vance Thornsberry and Boies Hall in 1997 included the construction of detailed geologic cross sections. The Bruff (1998, July) resource estimate used the geologic interpretations derived from the Thornsberry and Hall cross sections, and also completed modeling of the historical mine stopes.
Both GQM LLC and MDA determined that the Bruff (1998, July) mineralized envelopes were an excellent starting point from which to understand the numerous mineralized structures that act as the critical controls of the gold and silver mineralization at Soledad Mountain. However, it was recognized that no comprehensive sets of cross sections with interpreted alteration and mineralization existed in the project files. Compounding the problem was the fact that the only geologic data available in digital form in the project database were lithologic rock codes. In 2014, this situation led GQM LLC to carry out an extensive program of transcribing the existing geologic logging data into digital files and logging of core and RC holes for which no geologic logs were available. During this program, the GQM LLC geologic team found some of the existing drill logs to be inconsistent and lacking in sufficient detail. To resolve this, GQM LLC performed a significant program of re-logging of core and RC holes in 2014, during which GQM LLC geologists re-logged 785 holes and added original log data from 71 holes into the database. A total of 13 holes were not re-logged due to lack of chips/core and have lithologic codes only, which were derived from the 2012 AMEC database used for the NI 43-101 Technical Report of Ennis and Hertel (2012, October). There are 26 holes, all of which are GFA’s underground core holes, for which there are no geologic data.
| February 2015 | 9-5 |
|
|
|
Soledad Mountain Project |
| Kern County, CA, USA | |
| Technical Report |
| 10.0 |
DRILLING |
| 10.1 |
Summary |
A total of 895 holes drilled by six different companies at Soledad Mountain from 1935 through 2011 are included in the current resource database (Table 10-1) and shown in Figure 10-1. The majority of footage (303,054 ft) was drilled from the surface by RC methods, beginning in 1977. Prior to 1977, drilling was done by GFA using diamond-core methods from underground drill stations (16,193 ft). Underground core drilling was performed by GQM LLC as well during the 1990s for a total of 14,105.6 ft. Surface diamond-core drilling by GQM LLC included a total of 18,232.7 ft from 1988 through 1999. Drill holes varied from vertical to horizontal and were drilled at a number of azimuths. Details of the various company drill programs, drilling procedures and methods are presented in the following Sections.
Table 10-1. Summary of Drill-Hole Portion of Resource Database
| Year | Company/Operator | Number of Holes | Type | Footage |
| 1930's | Goldfields America | 61 | UG Core | 16,193 |
| 1977 | Rosario Exploration | 8 | RC | 2,308 |
| 1986-1987 | Shell Oil - Billiton | 25 | RC | 6,365 |
| 1988-1989 | CoCa Mines | 20 | RC | 3,260 |
| 1995 | Glamis Gold | 50 | RC | 21,115 |
| Subtotal | 164 | 49,241 | ||
| 1988-1990 | Golden Queen Mining Co. | 12 | Core | 7,117.5 |
| 282 | RC | 96,197 | ||
| 1994-1997 | Golden Queen Mining Co. | 15 | Core | 9,741.7 |
| 28 | UG Core | 14,105.6 | ||
| 297 | RC | 136,770 | ||
| 1999 | Golden Queen Mining Co. | 3 | Core | 1,373.5 |
| 74 | RC | 30,735 | ||
| 2011 | Golden Queen Mining Co. | 20 | RC | 6,304 |
| GQMC Subtotal | 731 | 302,344 | ||
| Grand Total | 895 | 351,585.3 |
Note: UG = underground; RC = reverse-circulation rotary
| February 2015 | 10-1 |
|
|
|
Soledad Mountain Project |
| Kern County, CA, USA | |
| Technical Report |
Figure 10-1. Drill Hole Map for the Soledad Mountain Project Area

Drill-hole orientations vary throughout the project, due primarily to the differing orientations of the mineralized structures and logistical challenges. While the majority of the holes have been drilled at angles that cut the variously dipping mineralized zones at relatively high angles, there are some holes that are poorly oriented with respect to the mineralization encountered, which leads to exaggerated lengths of the down-hole intercepts. This effect is entirely mitigated by the resource modeling techniques employed, however, which constrain all intercepts to lie within explicitly interpreted domains that appropriately reflect the geologic controls.
| February 2015 | 10-2 |
|
|
|
Soledad Mountain Project |
| Kern County, CA, USA | |
| Technical Report |
The resource database includes assay data from samples generated through surface and underground diamond drilling, RC drilling, and channel sampling of underground cross cuts. Sample lengths for the core drilling and underground cross cut samples were dependent on geological control and range from less than one foot to over 25 ft. RC samples were predominantly taken as 5 ft intervals from a slurry of water injected during drilling and cuttings. The average length of all sample intervals that contribute to composites used in the resource estimation is slightly less than five feet; MDA believes the sample lengths are appropriate for the style of mineralization at the Soledad Mountain project. Furthermore, MDA is not aware of any sampling or recovery issues that might materially impact the mineral resources discussed herein for those sample intervals allowed to contribute to the estimation (see Section 14.1 for a discussion of excluded samples).
| 10.2 |
Gold Fields America (1935 – 1942) |
GFA’s underground core drilling was primarily for development of the Silver Queen, Golden Queen, Starlight, and Soledad veins, with lesser amounts of drilling on the Queen Esther vein. Very little information is available on GFA’s underground diamond-core drilling methods. Bruff (1998, July) reported that GFA’s underground core drilling utilized EX (7/8 inch) and AX (1 3/16 inch) diameter core sizes. Core recovery was low, “usually less than 50% and sometimes less than 15% in mineralized zones” according to Bruff (1998, July). Records of how core samples were selected and prepared for assay have not been found, nor has MDA found any information on the assay methods and procedures used by GFA. No core is available from this period, and MDA is not aware of down-hole directional surveys for these holes. Drill-hole logs were recorded in field books and other written documents from this period and are available for some of the GFA underground drilling.
The resource database constructed by MDA contains 61 underground core holes drilled by GFA, for a total of 16,193 ft. This database includes lithology data captured from the GFA pre-war documents. MDA has not used the GFA underground core assays for estimation of resources due to the poor core recoveries.
| February 2015 | 10-3 |
|
|
|
Soledad Mountain Project |
| Kern County, CA, USA | |
| Technical Report |
| 10.3 |
Rosario Exploration (1977) |
MDA’s current database contains data from eight RC holes drilled by Rosario Exploration in 1977. The Rosario drilling targeted the northern parts of the Silver Queen and Golden Queen veins. Thomassen (1983) reported that the holes were drilled with a Becker rig using 4 ¼ inch tricone bits (4 1/8 inch in hard zones) that recovered 40 lb to 60 lb for each 5 ft interval. Descriptions of sampling methods are not available. In 2014, GQM LLC entered data from the geologic logs of the Rosario holes into the project database, as no RC cuttings are available for re-logging.
| 10.4 |
Shell Oil – Billiton (1986 - 1987) |
Twenty-five RC holes were drilled at Soledad Mountain in 1986-1987 by Billiton, a division of Royal Dutch Shell at the time (“Shell-Billiton”). This drilling was directed at the Karma-Ajax vein in the eastern part of the deposit. Descriptions of drilling and sampling methods are not available. Information on sample weights and sample recoveries is not available. In 2014, GQM LLC geologists entered the data from Billiton logs into the project database.
| 10.5 |
CoCa Mines (1988 - 1989) |
During 1988 and 1989, CoCa Mines completed 20 RC holes at Soledad Mountain. The primary targets appear to have been the Excelsior, Bobtail, Hope, and McLaughlin veins in the northwestern part of the deposit. Descriptions of drilling and sampling methods and information on sample weights and sample recoveries are not available. GQM LLC geologists re-logged preserved RC cuttings available from all but six of the CoCa Mines holes in 2014; the MDA database contains log data for the remaining six holes derived from the AMEC 2012 database.
| 10.6 |
Glamis Gold (1994 - 1995) |
Glamis Gold evaluated the Soledad Mountain project as a potential acquisition in the mid-1990s. As part of their evaluation, Glamis drilled one RC hole in 1994 and 49 RC holes in 1995. The Glamis drilling was widely distributed to test portions of the Queen Esther, Silver Queen, Golden Queen, Starlight, and Soledad veins. Information on sample weights and sample recoveries, and descriptions of drilling and sampling methods are not available. Glamis geologists recorded geologic logs for all of the holes. Data from 49 of the original paper logs was captured by AMEC in support of the 2012 NI 43-101 Technical Report of Ennis and Hertel (2012). Archived RC cuttings for one of the Glamis RC holes are available and were re-logged by GQM LLC geologists in 2014. Glamis also drilled four large-diameter core holes for the purposes of metallurgical testing; no assay data are available and these holes are not included in the resource database.
| February 2015 | 10-4 |
|
|
|
Soledad Mountain Project |
| Kern County, CA, USA | |
| Technical Report |
| 10.7 |
Golden Queen Mining Company (1988 - 2011) |
The most extensive and widely distributed drilling was done by GQM LLC from 1988 through 2011. In the late 1980s and through the 1990s, GQM LLC’s drilling was directed at the central corridor of the Starlight, Golden Queen, Soledad, Number 1 Footwall, Silver Queen, Queen Esther, and Excelsior veins. The Black, Karma-Ajax, and Patience veins in the northeastern part of the deposit were also drilled, and a number of holes unsuccessfully attempted to identify a northern extension of the Karma-Ajax vein, although some of these holes intersected mineralized alluvium. Noranda Exploration is reported to have participated as a joint venture partner in the early GQM LLC drilling programs.
As stated by Ennis and Hertel (2012), “Information given here was obtained from MRA’s description contained in the M3 feasibility study of March 1998. This information was checked during MRDI’s 2000 audit, where the information was available on drill logs. Twelve surface diamond drill holes were drilled from 1985 to 1991 by several contractors. Information is not available concerning drill-rigs utilized. From 1994 onwards, surface diamond drilling has been carried out by McFeron and Marcus Exploration, Inc., using a DMW-65 drill rig. All core was HQ (2.5 inch diameter). Underground core drilling was done, starting in 1994, by Boart Longyear Company using LM75 drill rigs. All core was HQ (2.5 inch diameter). Core from holes drilled by [GQM LLC] was inspected by MRDI in 2000 and SRK in 2005 at a storage warehouse on site. Core boxes are in good condition and stored in a secure, well-organized fashion on wooden shelves. Core sampling techniques were examined by MRDI for holes DDH 97-1 and DDH 97-5. The core was either split mechanically or sawed. Three quarters of the core was collected for assaying, and one quarter was retained for reference. Core logs were reviewed for all 59 holes to check core recovery through zones of mineralization. Recovery was not recorded for core holes 1-16. Only general comments regarding recovery were made for holes DDH 17-21 rather than recording actual measurements for each drill run. “100% recovery” was noted for most mineralized intervals except hole DDH 21, which experienced recoveries as low as 25% in mineralized intervals. The remainder of drill logs recorded measured recoveries for each core interval. The number of mineralized intervals with poor core recovery is relatively small for the 43 core holes for which recovery information is available.
| February 2015 | 10-5 |
|
|
|
Soledad Mountain Project |
| Kern County, CA, USA | |
| Technical Report |
MRDI reports that recovery appears to have been adequate to meet industry standards for holes 22 and onward.”
GQM LLC did not drill any core holes in 2011.
Ennis and Hertel (2012) further stated “MRDI reports that information on contractors and drill-rigs used for the first 332 RC holes drilled from 1985 to 1991 was not available. From 1994 to 1999, RC holes were drilled by Hackworth Drilling Company and P.C. Exploration Company using track-mounted MPDH 1000 drill-rigs. Drill bits ranging from 4.75 inch to 5.5 inch diameter were used. Samples reportedly were collected at the drill rig at 5 ft. intervals. According to [GQM LLC] staff, drilling was carried out with water injection to control dust emissions. This required use of a rotating wet splitter.”
GQM LLC drilled a total of 6,287 ft in 20 RC drill holes in 2011. Nine drill holes were collared in the northwestern-most portion of the deposit on the Echo vein, and the remaining 11 were drilled at the north end of the Karma-Ajax vein. This drill program was based on recommendations made by AMEC to increase the drill density in these two areas. Harris Drilling from Escondido, California did the drilling for the 2011 campaign using a Foremost Explorer 1500 Buggy-mounted drill with 4-inch diameter drill pipe and a 5½-inch diameter hammer drill bit. RC drilling was completed with water injection to control dust emissions.
| 10.8 |
Rotary and Reverse-Circulation Sample Contamination |
Due to the nature of conventional rotary and RC drilling, the possibility of contamination of drill cuttings from intervals higher in the hole is a concern, especially when groundwater is encountered or fluids are added during drilling. While the water table is reported to be at an elevation of 2,580 ft, and only 65 of the 22,494 coded gold samples lie below this elevation, the drillers reportedly injected water during drilling of all of the post-1985 GQM LLC RC holes.
Down-hole contamination can often be detected by careful inspection of the RC drill results in the context of the geology, by comparison with adjacent core holes, and by examining down-hole grade patterns. MDA used these methods to evaluate the RC drill results, but found no evidence of down-hole contamination in any modeled mineralized intervals used in the resource estimation. All comments about contamination or potential contamination were compiled from the project geologic drill logs. A total of 26 RC sample intervals from five Golden Queen holes and six Shell-Billiton holes had comments noting possible down-hole contamination; none of these intervals lie within the modeled mineral domains used to constrain the resource estimation.
| February 2015 | 10-6 |
|
|
|
Soledad Mountain Project |
| Kern County, CA, USA | |
| Technical Report |
| 10.9 |
Collar Surveys, Down-Hole Surveys, and Project Coordinates |
Information on collar surveys and down-hole directional surveys is taken from Ennis and Hertel (2012) and sources therein. MDA has no information on down-hole surveys prior to 1994. According to Ennis and Hertel (2012), down-hole surveys were not performed prior to 1994 during the Rosario, Shell-Billiton, CoCa Mines and Glamis Gold drilling.
GQM LLC Programs 1985 - 2000
According to Ennis and Hertel (2012), quoting Clarke (2006) “Drill-hole collar locations were surveyed relative to the historical mine grid by DeWalt Corporation, Bakersfield, California. Surveys were carried out using either a Total Station Wild TC-1610 theodolite or Trimble 4000 SSI RTK Global Positioning System. The accuracy of collar surveys for all drill holes was checked by MRDI by plotting drill-hole collar elevations on a digital topographic map (contour interval of 10 ft) and checking drill collar elevations against the topographic elevation. A total of 26 drill holes were found to have collar elevations greater than 10 ft above or below the topographic elevation. Local systematic errors, such as groups of drill holes with errors corresponding to the same direction in error relative to the topographic elevation, were found. Discrepancies in the horizontal location of collars range from 25 ft to as much as 100 ft. One group of 14 RC drill holes targeting the Queen Esther Vein had a systematic error in which drill collars were located from 20 ft to 50 ft southwest of the correct location. MRDI informed [GQM LLC] staff of the survey discrepancies and [GQM LLC] made corrections to the database while MRDI was on site.”
Ennis and Hertel (2012) further stated “The collar positions of GQ-88 and GQ-525 were checked in the field and were found to be reasonable relative to the portal of the 200 level. The collar for GQ-19 could not be found and most likely was destroyed by later road work.”
“RC holes GQ-1 to GQ-475 and core holes DDH-1 to DDH-16 were not surveyed. Diamond drill holes DDH-17 through DDH-42 and DDH 97-1 through DDH 97-10 were surveyed for dip and azimuth using a Baker Hughes/Inteq Magnetic Single Shot Survey Tool. RC holes GQ-475 through GQ-632 were surveyed for dip using a MD-Totco Special Operating Unit Deviation Tool. Inclined RC holes show a downward deviation of from 1.5 to 30 per 100 ft. The lateral deviations in azimuth are unknown.”
| February 2015 | 10-7 |
|
|
|
Soledad Mountain Project |
| Kern County, CA, USA | |
| Technical Report |
2011 GQM LLC Surveys
Collar locations for the 2011 RC holes drilled by GQM LLC were surveyed by Quality Surveying of Lancaster, California. GQM LLC hired Golder Associates Inc. (“Golder”) to survey down-hole directional deviation after the 2011 holes had been drilled, rather than having the down-hole surveys performed with drill pipe still in place as each hole was completed. Golder encountered blockages in 17 of the 2011 holes and completed down-hole surveys of only three of the holes using a Mount Sopris Instruments 2DVA-1000 borehole logging probe.
| February 2015 | 10-8 |
|
|
|
Soledad Mountain Project |
| Kern County, CA, USA | |
| Technical Report |
| 11.0 |
SAMPLE PREPARATION, ANALYSES, AND SECURITY |
The current database includes assays from at least 11 different laboratories as summarized in Table 11-1; details of sample preparation and analytical methods used by the various operators are discussed in the Sections below.
Table 11-1. Summary of Assay Labs and Methods for Soledad Mountain Assays
| Year | Company | Sample Type | Laboratory | Gold Assay Method | Silver Assay Method | Gold LDL |
| 1930's | Goldfields (GFA) | core, UG core; cross cuts |
mine lab(?) |
fire-assay(?) |
unknown |
oz/ton unknown |
| 1977 | Rosario | RC | unknown | fire-assay(?) | unknown | 0.01 |
| 1986 | Shell-Billiton | RC | GeoMonitor | cyan-leach AA; FA | cyan-leach AA; FA | 0.001 |
| 1988-1989 | CoCa Mines | RC | unknown | fire-assay(?) | unknown | 0.005 |
| 1980's | GQMC | cross cuts | unknown | fire-assay(?) | unknown | 0.001(?) |
| 1988 | GQMC | core | Jacobs | 2AT-FA | unknown | 0.001 |
1988 |
GQMC |
RC |
GSI | 1AT-FA Grav; 2AT-FA Grav | 1AT-FA Grav; 2AT-FA Grav | 0.0025 |
| Skyline | FA | unknown | 0.001 | |||
| MSRD | FA | FA | 0.001 | |||
| 1989-1990 | GQMC | RC, core | Bondar-Clegg | 1AT-FA Grav | FA | 0.002 |
| RC | Barringer; American | FA-Grav; 30g FA | ||||
| 1994-1995 |
Glamis |
Assay |
FA-Grav; AA |
0.001; 0.001 | ||
| 1994-1996 | GQMC | RC | Barringer | FA-Grav, FA-AA | FA-Grav | 0.001; 0.001 |
1997 |
GQMC |
core, UG core; cross cuts; RC |
||||
| Barringer | FA-Grav, FA-AA | AA | 0.001; 0.001 | |||
1999 |
GQMC |
core | Inspectorate-Rocky Mtn | FA-Grav | FA | 0.001 |
| RC |
Inspectorate-Rocky
Mtn; Barringer |
FA-Grav; FA |
FA |
0.001; 0.002 | ||
| 2011 | GQMC | RC | ALS Chemex | 30g FA-AA | AA | 0.00015 |
| FA-Grav = fire-assay with gravimetric finish | AA = atomic absorption | |||||
| FA-AA = fire-assay with atomic absorption (AA) finish | ||||||
| FA = fire-assay, unspecified finish | GSI = Geochemical Services Inc. | |||||
| 1AT-FA = 30g fire-assay, unspecified finish | MSRD = Mountain States Research and Development | |||||
| 2AT-FA = 50-60g fire-assay, unspecified finish | LDL = lower detection limit, oz gold/ton | |||||
| 11.1 |
Gold Fields America – 1930s |
Descriptions of the sample preparation procedures and analytical methods used by GFA in the 1930s are not available. Nothing is known of the sample preparation, but it is reasonable to assume that gold concentrations were determined by fire assay with gravimetric finish. MDA has no information on the use of assay standards, blanks, and duplicates by GFA.
| 11.2 |
Pre-GQM LLC - 1970s and 1980s |
Descriptions of sample preparation procedures and analytical methods used for drilling and underground cross-cut samples by Rosario Exploration in the 1970s are not available. Shell-Billiton’s RC drill samples were all analyzed at GeoMonitor for gold and silver by cyanide-leach and atomic absorption. Selected samples were also analyzed for gold and silver by fire assay, but MDA does not have details about sample preparation procedures or particular analytical methods. MDA has no information on the analytical laboratory and sample preparation and assay methods used by CoCa Mines for RC drilling samples. MDA has no information on quality assurance/quality control (“QA/QC”) programs, if any were employed, during this period.
| February 2015 | 11-1 |
|
|
|
Soledad Mountain Project |
| Kern County, CA, USA | |
| Technical Report |
| 11.3 |
GQM LLC 1988 - 1990 |
Core and RC samples from GQM LLC’s drilling during this period were analyzed by fire assay with gravimetric finish at five different laboratories (Table 11.1) . The lower limit of detection for gold ranged from 0.001 oz/ton to 0.0025 oz/ton. MDA has no information on sample preparation procedures and the insertion, if any, of assay standards or blanks into the sample streams during this period. Results of analyses of duplicate samples and replicated assays are discussed in Section 12.3.
| 11.4 |
Glamis 1994 - 1995 |
The majority of the Glamis RC drilling samples were analyzed at American Assay Laboratories by fire assay, but it is not clear if these were done with atomic absorption (“AA”) or gravimetric finish. Samples from one RC hole were analyzed at Barringer by fire assay with gravimetric finish. The lower limit of detection for gold was 0.001oz/ton. MDA has no records of the sample preparation procedures used at either lab or the implementation, if any, of a QA/QC program.
| 11.5 |
GQM LLC 1994 – 1999, 2011 |
During RC drilling in the 1990s, GQM LLC collected a “rig duplicate” sample that was left at the drill site. Clarke (2006) reported that MRDI inspected five drill sites near the 200 Level portal and found that the plastic bags in which rig duplicates were stored had decayed, ruining the sample, or that samples had been destroyed during subsequent road work. As a result, very few rig duplicates were preserved in a condition that would permit their analysis.
GQM LLC’s RC and core drilling samples from 1994 through 1999 were assayed at Barringer Laboratories (“Barringer”) and Inspectorate-Rocky Mountain Geochemical (“Inspectorate”).
| February 2015 | 11-2 |
|
|
|
Soledad Mountain Project |
| Kern County, CA, USA | |
| Technical Report |
Gold was determined at Barringer by fire assay with either AA or gravimetric finish; fire assay with gravimetric finish was used at Inspectorate. The lower limit of detection was 0.001oz/ton for gold and 0.01oz/ton for silver.
The procedure for preparation of drill samples at Barringer was drying, reduction to >90% passing 10 mesh using a jaw crusher followed by roll mill, then extracting a 250-300g subsample with a Jones splitter. The subsample was reduced to a <150 mesh pulp with a ring and puck pulverizer (Bruff, 1998, July). Gold was determined on 30g charges of sample pulp by fire assay, mainly with AA finish. For some cases in which samples assayed greater than 0.058 oz/ton gold (>2 g Au/t), a second fire assay was done with gravimetric finish. Silver was determined on a separate charge of pulp by aqua-regia digestion and AA. Descriptions of sample preparation procedures at Inspectorate are not available.
In reference to assays performed at Barringer, M3 Engineering stated in the 1998 Feasibility report “Every tenth sample was repeated and for every 20 samples analyzed, a known standard or blank was also analyzed.” MDA has found no evidence from the original assay certificates that GQM LLC submitted standards and blanks with samples assayed at Barringer during this period. MDA infers that the above may have been internal laboratory standards and blanks.
All drill samples from the 2011 GQM LLC RC drill campaign were assayed for gold and silver by ALS Chemex. Samples were weighed upon receipt at the laboratory, dried, crushed to 70% passing 2 mm, riffle split to obtain a nominal 250 g subsample, and this subsample was pulverized to 85% passing 200 mesh. Gold assays consisted of conventional fire assay of a 30 g split of pulverized material, finished by atomic absorption spectrometry (ALS Chemex code Au-AA23). Silver was assayed by aqua-regia digestion and atomic absorption spectrometry (code Ag-AA62). Those samples returning greater than two ppm gold (> 2.0 ppm Au) were reassayed by fire assay of a 30 g subsample with a gravimetric finish (code Au-GRA21).
A total of 20 pulverized blanks and 48 pulverized samples of three different standard reference materials, all obtained from Minerals Exploration and Environmental Geochemistry, were analyzed with the 2011 drilling samples (Ennis and Hertel, 2012). A discussion of results for the blanks and standards is presented in Section 12.3.
| 11.6 |
Sample Security |
No information is available to document sample security procedures prior to 1994. Sample security measures described here are taken from Ennis and Hertel (2012) as follows:
| February 2015 | 11-3 |
|
|
|
Soledad Mountain Project |
| Kern County, CA, USA | |
| Technical Report |
| • | Since 1994, sample security measures included moving core from the drill site to a locked storage warehouse on the project site at the end of each shift. | |
| • | RC cuttings were allowed to dry at the drill site before being locked in a semi- trailer to be shipped to the laboratory. | |
| • | Access roads into the project site were locked with either a gate across the road or padlocked with a heavy metal chain across the road. |
MDA visited the project on a number of occasions in 2014. A large number of GQM LLC drill samples (laboratory rejects and pulps) remain at the project site and are secured within GQM LLC’s locked storage facilities.
| 11.7 |
Summary Statement |
The commercial analytical laboratories used by all operators that contributed data to the project drill-hole database, as well as the analytical procedures used by the laboratories to obtain the gold assays for the Soledad Mountain project, are, or were at the time, well recognized and widely used in the minerals industry. It is presumed GFA, a successful and reputable mining company at the time, used a mine laboratory for all of their core drill holes and underground channel samples.
Records of drilling prior to that of GQM LLC have few details on sample preparation, QA/QC, or sample security. All of the historical operators were reputable, well-known mining and/or exploration companies, and there is ample evidence that these companies followed the accepted industry practices relating to sample-preparation and analytical techniques.
In consideration of these factors, in addition to other data examined in accompanying sections of this report, MDA believes the Soledad Mountain analytical data are sufficient for use in the resource estimation described herein.
| February 2015 | 11-4 |
|
|
|
Soledad Mountain Project |
| Kern County, CA, USA | |
| Technical Report |
| 12.0 |
DATA VERIFICATION |
| 12.1 |
Summary Statement |
In consideration of the Soledad Mountain data summarized below, as well as information provided elsewhere in this report, MDA believes the project data are acceptable for use in the resource estimation described in Section 14.0.
| 12.2 |
Database Auditing |
| 12.2.1 |
Audits Completed in 1998 - 2012 |
In April of 1998, Humboldt Mining Company completed what appears to have been a comprehensive audit of holes DDH-17 to 44, DDH97-1 to 10, GQ-001 to 632, and SHEL-01 to 26, as well as some of the holes in the series UD03-05 to 21 (Bruff, 1998, April). This well documented audit led to corrections of assay transcription errors and sample interval “from” and “to” errors, replaced capped assay values with original assay values, inserted “-1” for intervals of no sample recovery that had assay values derived from adjacent samples, replaced Ag values that were assigned to long intervals that were not assayed for Ag, and replaced cyanide-leach assays from the SHEL-series of holes with fire assay values where data were available. Missing intervals of assays, in a few cases for entire holes, were added to the database.
M3 Engineering reported in the 1998 feasibility study that gold and silver assays were checked by manual comparison to assay certificates and by computer techniques testing for from-to errors, and out-of-range assay values. The types, quantities and significance of any discrepancies were not reported, nor did M3 Engineering discuss if, or how, such discrepancies were corrected.
Following the release of the M3 Engineering Feasibility Study, GQM LLC engaged MRDI to audit and evaluate the data and methods used for the resource model in the 1998 feasibility study. As part of that work MRDI audited the assay database by checking 5% of the assays. Clarke (2006) reported that GQM LLC worked jointly with MRDI between 1998 and 2000 to resolve and correct most of the errors found during the audit.
For the 2006 NI 43-101Technical Report by SRK, a total of 1,600 assay entries from the 1999 drilling campaign were randomly selected and checked against assay certificates (Clarke, 2006). Two entries for gold were found to differ from values listed on assay certificates. SRK noted that less-than-detection-limit values for gold (<0.001oz/ton) and silver (<0.01 or <0.1 oz/ton) on the assay certificates were entered as 0.001oz/ton Au and 0.01 or 0.1 oz/ton Ag, respectively, in the database, but did not consider this to be a significant issue. SRK reported that no systematic errors were found that would influence resource estimates (Clarke, 2006).
| February 2015 | 12-1 |
|
|
|
Soledad Mountain Project |
| Kern County, CA, USA | |
| Technical Report |
Ennis and Hertel (2012) reported that AMEC audited the 2011 GQM LLC drilling data for the 2012 NI 43-101Technical Report as follows. This included checking: 390 (38%) of the 2011 gold and silver assay records against original assay certificates (no errors found); 160 (39%) of the lithology and oxidation codes (two errors found); and all 2011 collar coordinates, which were found to be acceptably accurate.
| 12.2.2 |
Construction of Current Resource Database |
MDA used the 2012 AMEC database as the starting point for the current resource database. As discussed in Section 9.8, the only geologic information included in the 2012 database consists of lithology. As the purpose of the current resource study was to incorporate more geology into the modeling of the project gold and silver mineralization, GQM LLC initiated a program of transcribing additional geologic data from existing paper drill-hole logs into the resource database, including various alteration, mineralization, structural, and oxidation information. Written comments on the logs regarding the intersection of voids/stopes/backfill, recovery, sample quality, and down-hole contamination were also compiled. Holes that lacked logs, or had logs judged to be incomplete, were re-logged. As this program progressed, GQM LLC geologists decided that comprehensive re-logging of all available drill core and RC cuttings was warranted, and this extensive work was then completed.
After cleaning the data, unifying logging codes, and assigning codes to various textural geologic descriptions, MDA incorporated the data compiled and logged by GQM LLC into a preliminary version of the resource database. The resource database was then finalized when all issues identified by auditing (discussed below) were resolved.
| 12.2.3 |
MDA Audit |
The resource database includes a total of 834 RC and core holes, including four holes added as a result of auditing, and excluding GFA underground holes that did not contribute data to the resource estimation. The results of auditing the drill-hole collar, down-hole survey, and assay tables are summarized below.
Collar Table. No survey data were found to audit the locations of the 53 holes in the database drilled by CoCa Mines (KNR-series), Rosario (R-series), and Shell-Billiton (SHEL-series). All holes in the KNR- and R-series have database coordinates in the original GFA mine grid that are whole numbers, and are therefore likely to be approximate (unsurveyed) locations. While most of the SHEL-series holes have coordinates that include decimals, many do not. Although Quality Surveying is reported to have surveyed the collar locations of the 20 holes drilled by GQM LLC in 2011, no records were found in the project files. Available audit materials for the remaining GQM LLC holes included DeWalt Corporation reports, which consist primarily of original faxes sent by Dewalt Survey to GQM LLC, and apparent original printouts from the survey equipment used by DeWalt Corporation; all DeWalt surveys are in GFA mine-grid coordinates. The final source of data is derived from 2014 California State Plane coordinate surveys by GQM LLC of various older GQ-series drill collars that could still be identified on the ground.
| February 2015 | 12-2 |
|
|
|
Soledad Mountain Project |
| Kern County, CA, USA | |
| Technical Report |
The collar locations of 204 holes were audited using the survey data described above; collar azimuths and dips were also audited if the information was available on drill logs. As part of this auditing, any significant vertical differences between drill-hole collar elevations and elevations of the project topography were identified, and any holes with improbable locations (with respect to access roads, drill pads, and steep topography) were also flagged for further investigation.
The auditing led to a total of 10 changes to hole locations in excess of one foot. Five of these involved changes to elevation values and three were cases where original database coordinates look approximated (no decimals) and DeWalt Corporation survey data were found to update the locations. One hole with an improbable location was assigned new coordinates derived from a GQM LLC 2014 survey, and another improbably located hole was moved by MDA to a nearby drill pad. In all cases, the edited locations were checked against the project topography, drill access roads, and drill-pad locations for reasonableness. Of the 10 modified hole locations, seven had changes to at least one of the x, y, and z coordinates of > 20 ft and are therefore considered material (in the context of resource model blocks with dimensions of 20 x 20 x 20 ft).
The coordinates of 33 drill-holes re-surveyed by GQM LLC in 2014, including holes in the range GQ-008 through GQ-691, were checked against the database locations. The GQM LLC surveys differed from the database values by up to 7.4 ft in easting, 8.2 ft in northing, and 4.9 ft in elevation, none of which are considered material.
Research related to a single, improbable hole location (a SHEL-series hole collared on a steep hillside a significant distance from access roads) led to the uncovering of several small plan maps in the project files. Each of these maps shows a portion of the SHEL-series holes plotted on topographic bases with the mine grid plotted. Careful review of the historical maps with the 2012 database coordinates led to the recognition of widespread problems with the SHEL-series hole locations. The database locations were clearly derived from these maps, but apparently an error in the location of one hole led to the propagation of additional mis-locations of adjacent holes. After careful review and consideration, MDA changed the locations of 12 of the Shell-Billiton holes using these maps, and added a SHEL-series hole to the database for which coordinates were not previously available.
| February 2015 | 12-3 |
|
|
|
Soledad Mountain Project |
| Kern County, CA, USA | |
| Technical Report |
The locations (and assays) of a number of cross-cut channel samples were also visually checked against the GFA linens for accuracy, and more broadly compared to the digitized level-plan workings developed by AMEC for consistency of locations.
Survey Table. During auditing of the down-hole survey table, MDA quickly realized that many of the survey intervals were not actually surveyed, but were instead assigned averaged dip deviations derived from a few select holes that had been surveyed. A total of five such unique averaged deviation sets were identified, with hole deviations becoming progressively steeper with depth in each case. Without considering these averaged intervals, there are 2,158 intervals with actual surveys, 203 of which were initially audited. The only discrepancy identified consisted of a dip that was off by one degree. However, depth issues were numerous. MDA believes the depth discrepancies were caused in the past by software during importing and/or exporting the survey data. The down-hole survey table was therefore completely reconstructed.
A decision needed to be made whether or not to continue to use averaged deviation data for holes that lacked surveys. MDA completed a detailed review of the existing averaged deviation sets, the manner in which they were applied, and the justification for the use of averaged deviations. In the end, MDA could not identify consistent trends in down-hole deviations using the actual survey data available. The data were examined by year and orientation (azimuth and dip) ranges. This inconsistency led MDA to refrain from applying averaged deviations to the unsurveyed intervals.
Assay Table. A total of 8,376 sample intervals from drill holes were audited out of a total of 65,654 such intervals. Material errors identified include apparent transcription errors for one gold value and one silver value, as well as one sequence error of 11 sample intervals involving both gold and silver values, and one sequence error of five intervals involving only gold analyses. Sequence errors consist of consecutive sample intervals in which the metal values are offset by one interval. In terms of materiality, the shift of analyses to the following sample intervals is not significant, as the sample intervals are 5 ft in length and the resource model blocks have 20 ft dimensions; it is the skipped values that are material.
| February 2015 | 12-4 |
|
|
|
Soledad Mountain Project |
| Kern County, CA, USA | |
| Technical Report |
During auditing of the assay table, the treatment of less-than-detection-limit assays in the database was found to be quite variable. While the assignment of some value lower than the detection limit is the most common, there are cases where “0” or the detection-limit value itself is applied.
When duplicate analyses are present on the same assay certificate, the first (original) value is usually assigned to the database, but the duplicate value was found in the database in 60 of the audited intervals (these were replaced with the original values). The database value represented an average of the two analyses in 94 of the audited intervals.
| 12.3 |
Quality Control-Quality Assurance Review Completed by MDA |
Records are not available for QA/QC programs that may have been in use by GFA in the 1930s. MDA’s audit of assay documents from exploration drilling and underground sampling during the 1970s, 1980s, and 1990s indicates that some unknown quantity of apparent QA/QC control samples were sporadically used by historical operators and GQM LLC. MDA has no information about the sources, metal concentrations or variability of what appear to have been standards and blanks submitted with some drill samples at various times to the various assay laboratories.
Because of the paucity of modern QA/QC data as mentioned above, MDA has undertaken an extensive compilation and study of duplicate analyses, for which large amounts of data exist, in order to gain insights into the quality of drill sample assays. In the late 1980s GQM LLC made considerable efforts to check the assays it was using by obtaining various forms of duplicate analyses, or analyses of duplicate samples. These duplicates are the only form of QA/QC information available to MDA. More modern QA/QC procedures, including the use of standards and blanks, have been applied to the latest (2011) drilling by GQM LLC as discussed by Ennis and Hertel (2012, see Section 12.4), but MDA does not have the data from this QA/QC program.
| 12.3.1 |
General Description of the Data |
In evaluating the various types of duplicate analyses from different labs, it is useful to know the extent to which any given lab’s quality of work affects the project database. A useful gauge is the number of assays originating from a given lab that are present in the database. Table 12-1 summarizes the known sources of analyses in the resource database. These sources were derived from original assay certificates or, in some cases, copies of the original certificates that were found in GQM LLC’s project files.
| February 2015 | 12-5 |
|
|
|
Soledad Mountain Project |
| Kern County, CA, USA | |
| Technical Report |
Table 12-1. Sources of Assays in Soledad Project Database
| Laboratory |
Count of Gold
Assays |
| Barringer | 26,222 |
| MSRD | 7,978 |
| Bondar Clegg | 7,769 |
| AAL | 4,139 |
| GSI | 2,388 |
| GeoMonitor | 1,267 |
| Inspectorate-Rocky Mountain | 834 |
| Skyline | 680 |
| ALS | 283 |
| Jacobs | 156 |
| Subtotal | 51,716 |
| not known | 19,134 |
The GeoMonitor assays listed in the table above are from Shell-Billiton holes, while all other analyses in the table are from GQM LLC drilling programs. MDA was able to use the certificates or copies to compile lists of duplicate samples and/or analyses. While these assay records are in generally good condition, MDA cannot in all cases be certain that it has correctly identified the types of duplicates in a given dataset.
In this discussion, the following terms are applied to the various types of duplicates found and identified by MDA:
| • | Check assays or analyses are re-analyses of pulps prepared and analyzed by one lab, at another lab. MDA considers the lab that prepared and first analyzed the pulps to be the primary lab, and any other labs which analyzed the same pulps to be external check labs. In most cases, the records available are not explicit as to whether the pulp supplied to the check lab was really the same pulp used by the primary lab, or just another pulp prepared by the primary lab. In most, but not necessarily all cases, it is the assay from the primary lab that is used in the project database. | |
| • | Duplicate assays or analyses are new analyses of material from the same sample intervals as the originals, done at the same labs. They could be: | |
| • | Field duplicates; other samples collected from the same intervals at the same or a later time as the original samples, or |
| February 2015 | 12-6 |
|
|
|
Soledad Mountain Project |
| Kern County, CA, USA | |
| Technical Report |
| • |
Preparation duplicates; second sub-samples taken by the lab from coarse crush material and subjected separately to all the subsequent particle and sample-size reduction and analytical steps as the original, or | |
| • |
Pulp duplicates; second splits taken from one larger quantity of pulp prepared by the lab. These may be difficult to differentiate from replicate analyses, but pulp duplicate analyses typically would have been done at a different time and would appear on separate certificates than the originals. | |
| • |
Replicate analyses; separate analyses of material taken from the same original pulps, done in the same laboratory run as the original analyses, not necessarily in exactly the same batch, and appearing on the same laboratory certificate as the original analyses. |
| 12.3.2 |
Methods of Evaluation |
MDA evaluated each of the several types of duplicates or replicates using similar types of graphs or charts, including scatterplots with reduced major axis linear regressions and relative difference charts. The several types of duplicates or replicates, and the multiple laboratories involved, led to the preparation of over 200 individual graphs or charts during MDA’s evaluation of the data. For the purpose of illustrating the methods used, Figure 12-1, Figure 12-2, and Figure 12-3 show examples of the principal types of charts, using data from check analyses of pulps with Chemex as the check laboratory.
| February 2015 | 12-7 |
|
|
|
Soledad Mountain Project |
| Kern County, CA, USA | |
| Technical Report |
Figure 12-1. Gold Chemex FA Check vs. Database Original
![]()
Figure 12-1 is a conventional scatterplot, which in this case shows a good correspondence between the Chemex check gold analyses and the original analyses found in the project database.
Figure 12-2. Gold Relative Percent Difference - Chemex Check vs. Database Original

MDA evaluated precision, or variability, using relative difference charts (Figure 12-2 and Figure 12-3), but for the record it should be noted that in this report MDA has used a method of calculating relative differences that does not conform to formal statistical definitions of precision. MDA’s calculation for relative difference, reported as percent, is:
| February 2015 | 12-8 |
|
|
|
Soledad Mountain Project |
| Kern County, CA, USA | |
| Technical Report |
| (dup – original) | ||
| 100 x | ||
| lesser of (dup, original) |
A more commonly-used calculation is:
| (dup – original) |
||
| 100 x | ||
| mean of pair |
MDA uses and charts both calculations, but this summary relies on the former calculation, which produces relative differences reflecting a “worst case” situation.
Figure 12-3. Gold Absolute Relative Percent Difference -
Chemex Check
vs. Database Original
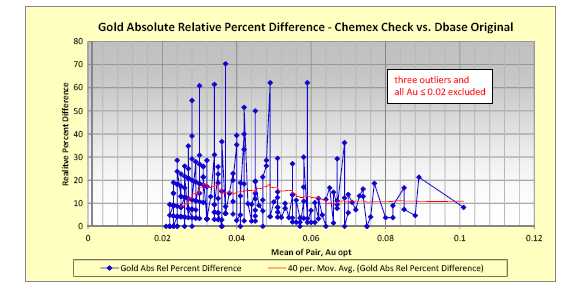
The absolute relative percent difference chart in Figure 12-3 illustrates the absolute values of the relative percent differences plotted in Figure 12-2.
MDA determined that the degree of scatter (variance) in the relative differences is considerably less above about 0.06 oz Au/ton than it is below that grade. The relative percent differences in the two grade ranges thus defined are shown in Table 12-2.
| February 2015 | 12-9 |
|
|
|
Soledad Mountain Project |
| Kern County, CA, USA | |
| Technical Report |
Table 12-2. Relative Percent Differences by Gold Grade
Ranges,
Chemex Pulp Checks vs. Database Originals
| Gold Grade Range (oz Au/ton mean of pair) |
Count |
Averages | |
| Rel Pct Difference | Abs Rel Pct Difference | ||
| Au ≤ 0.06 | 195 | 6.6 | 13.7 |
| 0.06 < Au | 36 | 1.8 | 10 |
MDA prepared the summary charts that appear in Figure 12-4 through Figure 12-8 to summarize the results of the evaluation of the many different sets of duplicate, replicate, and check pairs in the data set. These summary charts are considerable simplifications of complex data for the purpose of obtaining an overview. For example, the complex pattern of data that appears in Figure 12-3 is simplified by averaging to produce the two values that appear in the “Rel Pct Difference” column in Table 12-2.
Those two values are transferred to Figure 12-7, producing the two horizontal green bars (labelled “CMX_FA_Dbase” in the legend) as highly simplified representations.
| 12.3.3 |
Summary Evaluation of the Duplicate Samples |
| 12.3.3.1 |
Summary of Gold in Same-Lab Duplicates |
Preparation duplicates and pulp duplicates were analyzed at Mountain States Research and Development (“MSRD”). Another set is comprised of duplicates analyzed at Bondar Clegg (“BC”). It is not clear whether the latter set represents preparation duplicates or field duplicates. This lack of clarity reduces the utility of the Bondar Clegg data set.
Figure 12-4 illustrates the results of MDA’s evaluation of the relative differences in these duplicate data sets.
| February 2015 | 12-10 |
|
|
|
Soledad Mountain Project |
| Kern County, CA, USA | |
| Technical Report |
Figure 12-4. Summary of Relative Differences in Same-lab Duplicates, Gold

The relative difference summary chart in Figure 12-4 illustrates the average bias of the duplicates in each data set, relative to the original analyses, on the vertical axis. Each color on the chart represents one data set. The grade ranges, referenced to the horizontal axis, were selected from the detailed relative difference charts by looking for ranges within which the “patterns” on the relative differences charts, based on the degrees of difference and the directions of the biases, were similar.
Key points relating to Figure 12-4 are:
| • | Below about 0.01 oz Au/ton, differences between duplicates and originals, even in pulp duplicates, can have a large magnitude and significant biases. | |
| • | MSRD preparation duplicates showed negligible biases above about 0.01 oz Au/ton. | |
| • | MSRD pulp duplicates showed a strong negative bias (duplicate grade less than original grade) at grades above roughly 0.02 oz. Au/ton. However, with only seven sample pairs in this grade range, this observation has little significance; if the bias is real, it should also be exhibited by the preparation duplicates, which is not the case. |
| February 2015 | 12-11 |
|
|
|
Soledad Mountain Project |
| Kern County, CA, USA | |
| Technical Report |
| • | The Bondar Clegg duplicate analyses tend to be biased high, relative to the original analyses. This differs from results for Bondar Clegg replicate analyses, which are biased low, as described in section 12.2.4. |
The absolute values of the relative differences show expected relationships:
| • | At grades below roughly 0.01 oz Au/ton, the precision in all three duplicate sets is poor. | |
| • |
In higher grade ranges the precision of the pulp duplicates is best with relative differences averaging about 10%, that of the preparation duplicates is next with relative differences averaging about 30%, and that of the Bondar Clegg duplicates, which may or may not be field duplicates, is worst with relative differences averaging about 65%. These relationships between the different types is as expected. Note that there are only seven instances of MSRD pulp duplicates having grades exceeding 0.018 oz Au/ton. The 10% average relative difference in this set is rather high for pulp duplicates, but is supported by too few data points to be given great credence. |
| 12.3.3.2 |
Summary of Silver in Same-Lab Duplicates |
Figure 12-5 summarizes the relative differences for silver in the same-lab duplicate data.
| February 2015 | 12-12 |
|
|
|
Soledad Mountain Project |
| Kern County, CA, USA | |
| Technical Report |
Figure 12-5. Summary of Relative Differences in Same-Lab Duplicates, Silver, Overview

The relative differences for silver in the same-lab duplicates show that:
| • | At silver grades of less than approximately 0.5 oz Ag/ton, strong biases are present in the duplicates. | |
| • | The Bondar Clegg duplicates have low grades, and strong biases. Because of the low grades, and their uncertain nature, little significance can be given to the Bondar Clegg duplicates. | |
| • | As in the case of gold, the MSRD pulp duplicates have a negative bias in silver (duplicates less than originals). In the case of silver the bias is around -8%. The MSRD preparation duplicates exhibit negligible bias. |
The absolute relative differences for silver in the same-lab duplicates (not illustrated) are considerable at silver grades less than about 0.5 oz Ag/ton and:
| • | MSRD pulp duplicates have the best precision for silver, with average absolute relative differences of about 10% at grades above about 0.5 oz Ag/ton. |
| February 2015 | 12-13 |
|
|
|
Soledad Mountain Project |
| Kern County, CA, USA | |
| Technical Report |
| • | The MSRD preparation duplicates have reasonable precision for silver, showing an absolute relative difference of about 18% at grades above about 0.3 oz Ag/ton. |
| 12.3.4 |
Summary Evaluation of the Replicate Analyses |
Replicate analyses for gold are available from American Assay Labs (“AAL”), Barringer, and Bondar Clegg. For silver, MDA has found replicates only from Bondar Clegg. This single set of silver replicates did not exhibit material or statistically-meaningful differences from the original analyses and are not described further in this summary section.
Figure 12-6 illustrates the relative differences in the gold replicates. Note that the charts contain three sets of data from Barringer Labs, one labeled “FA” for fire assay, a second labeled “FAAA” for fire assay with an atomic absorption finish, and a third labelled “FAAAS”, also indicating a fire assay with an atomic absorption finish. The difference between “FAAA” and “FAAAS” is not known to MDA. However, previous workers appear to have treated these as two different data sets, so MDA has done the same.
| February 2015 | 12-14 |
|
|
|
Soledad Mountain Project |
| Kern County, CA, USA | |
| Technical Report |
Figure 12-6. Summary of Relative Differences in Gold Replicate Analyses

There are also two data sets containing replicate fire assays from Bondar Clegg, which MDA has termed Replicate 1 and Replicate 2. MDA has treated them as different data sets because they came from different sources and are replicates of different sets of samples. It is noteworthy that, in those parts of the project assay table that contain gold assays from Bondar Clegg, and for which replicate assays are available, the assay reported in the database is usually the average of the original and replicate analyses. This is important because, for reasons unknown to MDA, Bondar Clegg’s replicate gold assays are usually biased low relative to the originals. This can be seen for example in the bars for “BC_FA_Repl 1” in Figure 12-6.
The comparisons of greatest interest in Figure 12-6 are those of fire assay replicates to fire assay originals, since these have the greatest relevance to the database. It is apparent that:
| February 2015 | 12-15 |
|
|
|
Soledad Mountain Project |
| Kern County, CA, USA | |
| Technical Report |
| • | American Assay Labs and Barringer’s fire assay replicates show negligible biases relative to the original gold assays in the database, within the range of -1 to +2 %. | |
| • | With the exception of one small subset having a positive bias, and a larger subset with near-neutral bias, Bondar Clegg’s replicate analyses show persistent and surprisingly strong negative biases. Bondar Clegg gold values reported in the database are most often averages of the original and the replicate. In most cases, the result of the averaging is to lower the gold value that would have been reported, had the original assay been used without averaging. |
In terms of precision, the American Assay Labs and Barringer fire assay replicates have average absolute relative differences of less than 9% in the grade ranges available for comparison. Bondar Clegg is again an outlier, with much greater absolute relative differences in its fire assays.
| 12.3.5 |
Summary Evaluation of the External Lab Check Analyses |
In these comparisons between two laboratories, if one of the pair of analyses is found in the project database it is deemed to be the “original”, whereas the other member of the pair is deemed to be the “check” analysis.
The duplicate samples or analyses discussed in Section 12.3.3 and the replicate analyses discussed in Section 12.3.4 are primarily measurements of precision or repeatability of the results obtained from a single lab. The external lab check analyses discussed in this section begin to address the question of accuracy. If two labs analyzing the same samples independently get similar results, then it is assumed that there is a greater likelihood of those results being similar to the “real” gold or silver content of the samples. On the other hand, if the results from the two labs differ significantly, this could indicate a problem with at least one of the two labs. In the latter case, which of the two labs is more accurate can only be determined with additional testing, an option that is generally not available with archival data.
In considering the check analyses, the relative numbers of analyses from each lab in the database are important. Another issue is that available records are not explicit as to whether the pulp supplied to the check lab was the same pulp used by the primary lab, or a second pulp prepared by the primary lab.
| 12.3.5.1 |
Summary of Gold in External Lab Check Analyses |
Figure 12-7 illustrates the relative differences in the gold check analyses.
| February 2015 | 12-16 |
|
|
|
Soledad Mountain Project |
| Kern County, CA, USA | |
| Technical Report |
Figure 12-7 Summary of Relative Differences in Gold Check Analyses, Overview
![]()
In the legend, the first lab in the name is deemed to be the check lab and the second lab listed is deemed to be the original lab.
Some important points relating to Figure 12-7 are:
| • | With only minor exceptions, the gold check
analyses tend to have higher average grades than the gold analyses in the
database. A related observation is that in a data set including all of the
check assays, with no differentiation by laboratory, about 56% of the check assays have higher grades than the original assays. These facts suggest that the gold assays used in the database have, overall, a low bias compared to the other gold assays available for the same samples. MDA is not aware of the reason(s) for this.
|
| February 2015 | 12-17 |
|
|
|
Soledad Mountain Project |
| Kern County, CA, USA | |
| Technical Report |
| • | The “worst” comparison is between Jacobs and MSRD at grades below about 0.005 oz Au/ton, where the Jacobs grades, deemed to be the checks, average very much lower than the MSDR grades. The two labs compare well at higher grades. Only 156 Jacobs gold assays are known to be in the project database, but MSRD is the second-most important lab having 7,978 gold assays in the database. MSRD tended to have lower average grades compared to GDR, Bondar Clegg FAAA, and Skyline. | |
| • | Bondar Clegg’s gold results from FAAA analyses tend to be high, when compared with the corresponding gold results from other laboratories in the database. |
Using the afore-mentioned data set that includes all of the check assays, undifferentiated by laboratory, it can be determined that:
| • | In about 60% of the check/original assay pairs, the relative differences fall between -20% and +20%, | |
| • | In about 80% of the pairs, the relative differences fall between -40% and +40%, and | |
| • | The bulk of the relative differences that exceed +40% or are less than -40% are derived from samples whose mean-of-pair grade is less than about 0.01 oz Au/ton. |
Figure 12-8 illustrates the absolute relative differences obtained from the gold check analyses. It is apparent in this figure that some very high average absolute relative differences are present in the data set. It is evident that even excluding the more extreme comparison results, the absolute relative differences are considerable. Points to note are:
| • | The most extreme values are in grade ranges below about 0.01 oz Au/ton. | |
| • | The most extreme absolute relative differences involve labs whose contribution to the gold values in the database is minor (Jacobs, GSI, Skyline), or | |
| • | Some of the most extreme relative differences involve comparisons of different analytical methods (atomic absorption vs. gravimetric finish). |
| February 2015 | 12-18 |
|
|
|
Soledad Mountain Project |
| Kern County, CA, USA | |
| Technical Report |
Figure 12-8 Summary of Absolute Relative Differences in Gold Check Analyses, Overview
![]()
In the legend, the first lab in the name is deemed to be the check lab and the second lab listed is deemed to be the original lab.
| February 2015 | 12-19 |
|
|
|
Soledad Mountain Project |
| Kern County, CA, USA | |
| Technical Report |
| 12.3.5.2 |
Summary of Silver in External Lab Check Analyses |
Silver check assays were evaluated with the same type of summary charts used for evaluating the gold check assays. A significant difference between the relative differences for silver and the relative differences for gold is that the silver differences are spread over a range from negative to positive, with negative relative differences (original silver assay greater than the check assay) predominant. In the case of gold, check assays greater than the originals are very much predominant.
The most extreme relative differences for silver, as with gold, tend to be at lower grade ranges and involve labs that are relatively minor contributors to the database, such as Skyline (“Sky”), Jacobs and GDR. Nevertheless, the risk suggested by the check silver assays is considerable.
As expected, the average absolute relative differences in the silver check analyses show that generally the greatest differences are found in the lower grades. At higher grades, above about 0.1 oz Ag/ton, most of the comparisons clustered between about 6% and 30% relative percent difference. In modern check analyses MDA typically sees average relative differences of 10% or less.
| 12.3.6 |
Comments on QA/QC Results |
MDA’s evaluation of the various duplicate, replicate and check assay data sets is useful to provide a sense of the degree of uncertainty that should be attached to the assays on which the resource estimate is based. That degree of uncertainty is one contributor to the overall risk inherent in the resource estimate. MDA has evaluated the uncertainty of assays in terms of relative differences, expressed as percentages.
Check Assays. Two aspects of the uncertainty of grades are accuracy and precision. In the absence of any data from analytical standards, the only means available in the QA/QC data to gain some insight into the accuracy is the comparisons of assays of the same samples at two different labs.
The original pulps that were sent for check assaying are derived from samples from both core and RC holes drilled in 1996 and 1997, as well as RC holes drilled in 1988.
| February 2015 | 12-20 |
|
|
|
Soledad Mountain Project |
| Kern County, CA, USA | |
| Technical Report |
The evaluation described previously involved 622 gold check versus original assay pairs, each of which had assays from two laboratories out of a total of six labs involved in one or more of the check assay sets. Observations based on this data set are:
| • | With few exceptions, extreme absolute relative differences exceeding 40% are found only at mean gold grades below about 0.01 oz Au/ton. Relative differences of that magnitude involve about 20% of the check assay data set. | |
| • | In about 60% of the gold check vs. original assay pairs, the relative differences fall between -20% and +20%, | |
| • | In about 80% of the pairs, the relative differences fall between -40% and +40%, | |
| • | The gold assays in the database are, in aggregate, biased low compared to the gold check assays of the same samples. Thus, the portion of the database represented by the samples sent for check assaying is conservative in that it is biased on the side of lower gold values. This is evidenced by the consistency in bias among multiple check labs, and | |
| • | The accuracy of any single gold assay as implied by the check analyses ranges from good to only moderate for grades above 0.01 oz Au/ton. |
Silver check assays tend to be biased lower than the original assays in the database, unlike those for gold. General observations are:
| • | The most extreme relative differences for silver, as with gold, tend to be at lower grade ranges, in the case of silver below mean grades of about 0.1 oz Ag/ton, and involve labs that are relatively minor contributors to the database, such as Skyline, Jacobs and GDR. | |
| • | For labs that are significant contributors to the assay database, at mean grades above about 0.1 oz Ag/ton, the averaged relative differences are typically in the range +16% to -20%. |
Replicate Analyses. Sets of gold replicate analyses, which provide information as to analytical precision, include one set from American Assay Labs, three sets from Barringer and two sets from Bondar Clegg. At mean gold grades below about 0.01 oz Au/ton, some of the averaged relative differences are high for replicates, ranging from about +11% to -22%. At mean gold grades above 0.01 oz Au/ton, the averaged relative differences tend to fall in a reasonable range of about +4% to about -3%. One of the Bondar Clegg replicate data sets is an exception, with averaged relative differences of about -7% below 0.04 oz Au/ton and about -9.5% above 0.04 oz Au/ton. This is a peculiarity of the Bondar Clegg data set for gold, in which the replicates are persistently biased lower than the original assays, which is unexpected and not understood.
| February 2015 | 12-21 |
|
|
|
Soledad Mountain Project |
| Kern County, CA, USA | |
| Technical Report |
Same-Lab Duplicates. MDA has three sets of same-lab duplicates for gold; preparation duplicates and pulp duplicates from MSRD and a set from Bondar Clegg that may be preparation duplicates or field duplicates. These duplicate data provide information relevant to variability (precision) introduced by subsampling from the drill bit through to the assay pulps. Observations based on these data are:
| • | Averaged relative differences at mean grades below about 0.006 oz Au/ton can be extreme, in the range ±70%. | |
| • | At mean grades above about 0.006 oz Au/ton, averaged relative differences fall in a reasonable range of about +13% to -9%. The high bias, +13%, is found in the Bondar Clegg duplicates of uncertain type. The low bias, -9%, is found in the MSRD pulp duplicates. The bias in the MSRD preparation duplicates is negligible. |
For silver, MDA also has three sets of same-lab duplicates, of the same types, and from the same three labs. However, one of the three sets, from Bondar Clegg, contains only samples with low grades that yield high relative differences. The remaining duplicate sets, MSRD pulp duplicates and preparation duplicates, show that:
| • | At silver grades of less than approximately 0.5 oz Ag/ton, strong biases are present in the MSRD duplicates. | |
| • | As in the case of gold, the MSRD pulp duplicates have a negative bias in silver (duplicates less than originals). In the case of silver the bias is around -8%. | |
| • | The MSRD preparation duplicates exhibit negligible bias. |
Combined Uncertainty in the Assays. The check assay data suggest that the gold values in the database may have a low bias, at least for those assays that are represented by the check analyses. By contrast, database values for silver, which has a much lower economic impact on the project, appear to have a high bias.
In the opinion of MDA, the average relative differences in the various sets of duplicate assay data provide the best proxy for assessing the degree of uncertainty in the value of any individual assay in the database that lies within a specific grade range. Uncertainties of this type can be ascribed collectively to natural geological variability, sample collection, sample processing, and sample analyses. The available data suggest that variability in the low-grade gold and silver analyses is high, which is expected due to the low precision of analyses at low grades (this may be exacerbated by the age of the assays; modern assaying methods are generally more precise at these lower grades). This variability is relevant, however, due to the low level of the cutoffs used to define the resources (0.004 oz Au-equivalent/ton).
| February 2015 | 12-22 |
|
|
|
Soledad Mountain Project |
| Kern County, CA, USA | |
| Technical Report |
The significant degree of variability in the duplicate-assay data is likely due at least in part to natural heterogeneity related to the free gold and electrum particles that characterize the Soledad Mountain mineralization. In any case, the variability is a measure of the uncertainty in the accuracy of any single assay, but, in the absence of bias, the inaccuracies inherent in any assay in the project database does not extend to the database as a whole, due to the effects of averaging (for every sample that overstates the actual grade there is another that understates it). Further averaging of the highly variable data occurs in the resource modeling during compositing and grade interpolation.
| 12.4 |
Quality Control-Quality Assurance Reviews Completed by Others |
| 12.4.1 |
MRDI |
MRDI sent 50 pulps from 33 holes to Chemex for gold by fire assay. Fifty rig duplicates from 28 holes collected from drill sites were re-submitted to Barringer using new sample numbers. Both sets of data are from holes in the sequence GQ-497 to 603, but none of the sampled intervals are the same in the two sets. Rig duplicates averaged 0.0425 oz Au/ton versus a mean of 0.0406 oz Au/ton for the original assays. Pulp precision was lower than that of the rig duplicates, so it was concluded that overall precision is controlled by sub-sampling of pulp for fire assaying, a common observation in visible-gold deposits. Precision decreases with increasing grade, suggesting to MRDI that gold particles increase in size with increasing grade. There is more to this work summarized in the Technical Report of Ennis and Hertel (2012).
| 12.4.2 |
GQM LLC Drill Data - 2011 |
GQM LLC’s 2011 QA/QC program included the insertion of certified standard reference materials (standards) and pulverized quartz sand blanks with the drill samples shipped to ALS Chemex according to Ennis and Hertel (2012), who stated “A total of 48 standard reference materials (SRMs) and 20 fine blanks were submitted with a total of 1,232 project samples from the 2011 drilling. AMEC finds the insertion rates of the control samples to be low compared to best practice and recommends increasing the rate of SRMs and blanks to 5% each. AMEC also recommends that pulp duplicates be added to the Soledad Mountain QA/QC protocol at the rate of 5% of project samples. Duplicate samples are used to determine the precision of the assays.
GQM used three SRMs from Minerals, Exploration, and Environment Geochemistry (MEG) from Washoe Valley, Nevada. The SRMs have a range of gold grades consistent with what is expected from project samples at Soledad Mountain. Silver is not certified for these SRMs. All SRM results for gold except 5 (10%) were within 10% of the recommended value of the SRM. AMEC investigated the five SRMs with gold results greater than 10% different than the certified value and instructed ALS Chemex to reassay one batch of 20 samples surrounding a failed SRM for drill hole GQ-726. The reassayed values, though consistently slightly higher in grade, confirmed the original assays for the project samples.”
| February 2015 | 12-23 |
|
|
|
Soledad Mountain Project |
| Kern County, CA, USA | |
| Technical Report |
The 2012 NI 43-101 Technical Report went on to present a summary of the results of the above standards, as well as a discussion of standards inserted with pulps sent to Inspectorate for check assays. Ennis and Hertel stated “No significant bias was observed in the check assay data and thus AMEC concludes that the ALS Chemex gold and silver data are acceptably accurate.”
The blank samples reportedly were assayed with gold and silver less than five times the lower detection limit and “AMEC finds no significant carryover contamination in the ALS Chemex gold and silver assays” (Ennis and Hertel, 2012). MDA points out that already pulverized blank material provides no control for detecting “carry-over contamination” which, when it occurs, is typically due to the crushing and pulverizing stages.
| 12.5 |
Independent Sampling |
MDA visited the project site on a number of occasions. During these visits, surface exposures of altered and mineralized rocks were examined, many expressions of underground mining were seen, mineralization in drill core and RC cuttings was inspected, and numerous original maps documenting the historical mining activities were reviewed. MDA did not collect and assay samples from Soledad Mountain for the purposes of verifying the presence of gold and silver mineralization at the project due to its well-documented history of mining, as well as the consistency in the drill results generated by multiple respected exploration and mining companies over an extended period of time.
| February 2015 | 12-24 |
|
|
|
Soledad Mountain Project |
| Kern County, CA, USA | |
| Technical Report |
| 13.0 |
MINERAL PROCESSING & METALLURGICAL TESTING |
| 13.1 |
Occurrence of Gold and Silver |
Soledad Mountain is located within the Mojave structural block, a triangular-shaped area bounded to the east by the northwest-trending San Andreas Fault and to the north by the northeast-trending Garlock Fault. The Mojave block is broken into an orthogonal pattern of N50E to N60E and N40W to N50W fracture systems. These fracture zones likely developed as the result of Late Cretaceous compressional stresses that were present prior to formation of the Garlock and San Andreas Faults. Gold and silver mineralization at Soledad Mountain is hosted by northwest-trending, en-echelon faults and fracture systems. Cretaceous quartz monzonite forms the basement of stratigraphic sequences in the Mojave block. The quartz monzonite is overlain by Miocene-age, quartz latite and rhyolitic volcanic rocks. Volcanic centers appear to have formed at intersections of the northeast and northwest-trending fracture systems. Major volcanic centers are present at Soledad Mountain, Willow Springs and Middle Buttes. These volcanic centers consist generally of initial, widespread sheet flows and pyroclastics of quartz latite, followed by restricted centers of rhyolitic flows and porphyritic rhyolite intrusions. Rhyolitic flows and intrusions are elongated somewhat along northwest-trending vents and feeder zones. Gold deposits in the Mojave block include Soledad Mountain, Standard Hill, Cactus and Tropico. At Soledad Mountain gold mineralization occurs in low-sulfidation style, quartz-adularia veins and stockworks that strike northwest. Gold mineralization at Standard Hill, located 1 mile (1.6 km) northeast of Soledad, consists of north to northwest-striking quartz veins in Cretaceous quartz monzonite and Tertiary, quartz latite volcanic rocks. At the Cactus Gold Mine, 5 miles (8 km) west of Soledad, gold occurs in northwest and northeast-striking quartz veins, breccias and irregular zones of silicification in quartz latite, rhyolitic flows and rhyolitic intrusive breccias.
At least 14 separate veins and related vein splits occur at Soledad Mountain. Veins generally strike N40W and dip at high angles either to the northeast or to the southwest. Mineralization consists of fine-grained pyrite, covellite, chalcocite, tetrahedrite, acanthite, native silver, pyrargyrite, polybasite, native gold and electrum within discrete quartz veins, veinlets, stockworks and irregular zones of silicification. Electrum is about 25% silver. Gold is present as native gold and electrum (gold with silver greater than approximately 20%) ranging in size from less than 0.00039 inches (10 microns) to greater than 0.0059 inches (150 microns) with the silver content of the electrum as high as 25%. Silver is also present principally as the mineral acanthite (Ag2S), with some native silver, pyrargyrite (Ag3SbS3) and polybasite ((Ag,Cu)16Sb2S11). Minerals of potential environmental concern include pyrite (FeS2), galena (PbS) and chalcopyrite (CuFeS2), which are present in minor amounts.
| February 2015 | 13-1 |
|
|
|
Soledad Mountain Project |
| Kern County, CA, USA | |
| Technical Report |
| 13.2 |
Primary Ore Types |
The primary ore types that will be mined are porphyritic rhyolite and flow-banded rhyolite, pyroclastics and quartz latite porphyry representing approximately 55%, 32% and 13% of the ore tonnage respectively. Minor quantities of siliceous vein material (0.1%) will also be mined. The rock types will be found in different areas and at various stages of the mine life. The primary rock types are of extrusive volcanic origin and are quite similar in chemical composition and are high in silica with little or no clay.
The gold and silver mineralogy for rhyolite and quartz latite are essentially the same as determined by Amtel Ltd. in a number of reports from 2003 to 2007. Rhyolite is however typically more highly silicified than quartz latite and more gold and silver has consistently been extracted from quartz latite than from rhyolite in column leach tests.
The interpretation of the ore body composition has changed since the early 1990’s and a significant portion of the pyroclastics has been reclassified as rhyolite. Behavior of rhyolite and pyroclastics has been similar in column leach tests and gold recovery for pyroclastics is approximately the same as the gold recovery for rhyolite. Also, the leach curves for rhyolite and pyroclastics are indistinguishable from one another.
| 13.3 |
Process Development |
Extensive test work and process development work done on the Project ore types from 1988 to 2007 show that these ores are readily amenable to heap leaching provided the material is crushed to relatively small sizes. The test work for a total of 45 column leach tests is well documented and the test results have been used in a number of feasibility studies. Parameters such as agglomerate strength, percolation rate, cyanide consumption and cement and/or lime required for pH control were also determined in numerous tests.
An extensive characterization program using bottle roll tests on reverse circulation drill cuttings was completed by an independent consulting engineer in 1995. The deposit was divided into six areas, four rock types and three vertical zones for this program and 46 standard bottle roll tests were performed. The results are discussed in Section 13.7 below. Tests were done on bulk samples of rhyolite, pyroclastics, quartz latite and vein material obtained from surface and old underground workings between 1997 and 1999. The material was crushed in a vertical shaft impact crusher (“VSI”) and screened to produce samples sized to 100% minus 8 mesh (0.094 inches or 2.37 mm). McClelland Laboratories, Inc. completed both bottle roll and column leach test work on these samples and the final report was dated February 25, 1999. This was considered to be the definitive test program to provide detailed information required for both the design of a four-stage crushing-screening plant and to complete a feasibility study.
| February 2015 | 13-2 |
|
|
|
Soledad Mountain Project |
| Kern County, CA, USA | |
| Technical Report |
However, the four-stage crushing-screening plant, the design of which was based upon the results of the 1997 - 1999 test programs, would be exceptionally costly to design, build and operate and a more cost-effective solution had to be found for a viable Project. An alternative flow sheet was developed with a HPGR as the key comminution device in 2002. A series of HPGR and bottle roll and column leach tests was performed between 2003 and 2007 to confirm the flow sheet and to provide design criteria for the design of the crushing-screening plant.
The test work shows that the HPGR will have distinct advantages over conventional crushing and screening in preparing particles for heap leaching in this particular application.
| 13.4 |
Test Programs |
Column leach test data were reviewed for tests done from 2003 to 2007. Tests completed in 2006 were performed on a low-grade and a high-grade rhyolite sample to test the range of grades that is expected in the commercial operation. The test on rhyolite with a lower head grade in the 0.009 oz/ton (0.3 g/t) range is especially important to give an indication of the tail grade and thus the recovery that should be used when doing cut-off grade analyses. No new column leach tests have been done on Pyroclastic ore since the 1997-1999 tests.
The ‘actual’ data represent the results as of the last day of the column leach test. These data should not be used to estimate percentage extraction as gold and silver were still being extracted from the ore when the tests were ended. However, enough data had been collected by the end of the test to reliably perform a logarithmic regression analysis of the data and project what the extraction would be if the test had been continued for a total of 200 days. The regression analyses therefore put all of the column leach test results on a common 200-day basis.
The following conclusions can be drawn from an analysis of the tails obtained in the extended 1997-1999 tests for rhyolite, quartz latite and pyroclastics in which the samples were crushed with a VSI and the tails obtained in the series of HPGR-based tests done from 2003 to 2007:
| February 2015 | 13-3 |
|
|
|
Soledad Mountain Project |
| Kern County, CA, USA | |
| Technical Report |
| • | Extended Leach Time - Test results show that extended leach time is a factor in achieving low tails. The only long-term tests done were the 1997-1999 VSI tests. The tails obtained in these tests were however not as low as the tails obtained in the HPGR tests with shorter leach times. The conclusion is that extended leach time is a factor in achieving low tails but possibly of lesser importance when the HPGR is the comminution equipment. | |
| • | Particle Size Distribution - A particle size distribution is the direct result of the crushing technology used to prepare the sample for leaching. The analysis of test results shows that it is the particle size distribution for any particular test rather than a point value such as a P80 that is key to interpreting and understanding the results of the tests. Particle size distributions were therefore plotted and analyzed for all tests performed from 2003 to 2007. In general, the VSI products are finer than the HPGR products in all size ranges, yet the tails from the HPGR tests are consistently lower than those from the VSI tests. This indicates that another factor such as micro-cracking is important to achieve low tails grades. Understanding and monitoring of particle size distributions will be important in the commercial operation. | |
| • | Micro-cracking - An analysis of test results and microphotographs show that micro-cracks are developed in ore particles in the HPGR that allow relatively more gold and silver to be extracted than in the VSI tests. The conclusion is that the formation of micro-cracks increases recovery and lowers tails. | |
| • | Specific Press Force - An analysis of the tails obtained in the HPGR-based column leach tests shows that tails and thus recoveries are affected by specific press force. A higher specific press force gives a finer overall particle size distribution and leads to a greater density of micro-cracks and this directly affects tails and thus recoveries. The conclusion is that the specific press force is the determining operating parameter. | |
| • | In Summary - The analysis indicates that it is reasonable to limit the determination of recoveries to the HPGR-based column leach tests and this places the emphasis on tests performed between 2003 and 2007. |
| 13.5 |
KCA Recovery Analysis for Gold |
The recovery curves for gold are shown in Figure 13-1 and Figure 13-2. The column tests used as the basis for determining gold recoveries are summarized in Table 13-1. The gold recoveries presented in this Technical Report are based on KCA’s recommendation from a thorough review of historical test work and prior recovery analyses, using the following criteria:
| • | Each ore type is assigned a recovery curve; |
| February 2015 | 13-4 |
|
|
|
Soledad Mountain Project |
| Kern County, CA, USA | |
| Technical Report |
| • | HPGR crushing shows a recovery distinction (advantage) over other crushing methods (including VSI) even at coarser crush sizes, believed to be caused by “micro-cracking”. Therefore HPGR is the selected equipment and generally only HPGR tests are considered in the analysis; | |
| • | All HPGR column tests have been run on bulk samples collected from outcrops, road and channel cuts. The support of the representativeness of these surface samples on the orebody as a whole is established by the 1995 bottle roll campaign conducted on samples taken from several ore types, areas, and depths of the orebody. It was determined that minimal or no variability in recovery by area or depth occurs; | |
| • | To normalize recovery data, all column tests used in the analysis, which were generally run for 120 days or less, are projected out to a 200 day recovery, which is considered to be the ultimate recovery in the analysis; A full field leach time of 290 days was determined based on the 200 day projected ultimate recovery in the laboratory, and field leach curves were based on this relationship; | |
| • | A primary leach cycle of approximately 70 days was selected by GQM LLC, and a 290 day field ultimate recovery is achieved by indirect leaching of underlying lifts; A grade-recovery relationship for gold, where the recovery increases with increasing head grade in the ore, has been established for all ore types, based on data from the 2003-2007 HPGR column tests on rhyolite; | |
| • | For rhyolite, a linear regression of the heads-tails plot of 200-day projected tails was made (from six column tests); | |
| • | For pyroclastics, no recent HPGR column tests were available and so this curve was set equal to the rhyolite curve based on available column and bottle roll tests indicating very similar overall recoveries between the two ore types; | |
| • | For quartz latite, the heads-tails curve was made parallel to the rhyolite curve passing through the available HPGR column test result, the same approach taken in the 2012 feasibility study; | |
| • | A lab-to-field and risk-based recovery deduction of 3% was applied to all recovery curves. Section 24.1.2.1 discusses some of the risks supporting a deduction. |
| February 2015 | 13-5 |
|
|
|
Soledad Mountain Project |
| Kern County, CA, USA | |
| Technical Report |
Figure 13-1. Gold Recovery vs. Head Grade
![]()
Figure 13-2. Gold Tails vs. Head Grade
![]()
| February 2015 | 13-6 |
|
|
|
Soledad Mountain Project |
| Kern County, CA, USA | |
| Technical Report |
Table 13-1. HPGR Column Test Results
Sample ID |
Year Tested |
Crush Type |
Ore Type |
Head Grade |
Actual Tails |
Actual Recovery % |
Actual Days Leached |
200 Day Projected Tails |
200 Day Projected Recovery % | |||
| oz/ton Au | g/t Au | oz/ton Au | g/t Au | oz/ton Au | g/t Au | |||||||
| LG | 2006 | HPGR | Rhyolite | 0.010 | 0.340 | 0.003 | 0.100 | 70.6% | 74 | 0.003 | 0.096 | 71.8% |
| A5T | 2004 | HPGR | Rhyolite | 0.019 | 0.650 | 0.004 | 0.130 | 80.0% | 128 | 0.003 | 0.115 | 82.3% |
| A1/A2T | 2004 | HPGR | Rhyolite | 0.019 | 0.660 | 0.004 | 0.150 | 77.3% | 128 | 0.004 | 0.135 | 79.5% |
| A4C | 2004 | HPGR | Rhyolite | 0.020 | 0.680 | 0.004 | 0.130 | 80.9% | 140 | 0.003 | 0.116 | 82.9% |
| R4.1C | 2004 | HPGR | Rhyolite | 0.024 | 0.830 | 0.004 | 0.150 | 81.9% | 76 | 0.004 | 0.124 | 85.1% |
| (R3/R4)C* | 2004 | HPGR | Qz Latite | 0.035 | 1.210 | 0.004 | 0.130 | 89.3% | 71 | 0.003 | 0.111 | 90.8% |
| (R3/R4)E* | 2004 | HPGR | Qz Latite | 0.039 | 1.330 | 0.006 | 0.210 | 84.2% | 71 | 0.005 | 0.156 | 88.3% |
| (R3/R4) Calc'd | 2004 | HPGR | Qz Latite | 0.036 | 1.228 | 0.004 | 0.142 | 88.5% | 71 | 0.003 | 0.118 | 90.4% |
| HG | 2006 | HPGR | Rhyolite | 0.106 | 3.630 | 0.016 | 0.540 | 85.1% | 74 | 0.011 | 0.372 | 89.8% |
| P8** | 1990 | HPGR | Pyrocl | 0.044 | 1.496 | 0.011 | 0.367 | 75.5% | 127 | 0.010 | 0.344 | 77.0% |
| P7** | 1990 | HPGR | Rhyolite | 0.107 | 3.668 | 0.028 | 0.960 | 73.8% | 127 | 0.025 | 0.862 | 76.5% |
* “C” is center product and “E” is edge product. These test
results are combined as a weighted average based on expected ratios to be used
in commercial operation, to produce the “(R3/R4) Calc’d” sample. “(R3/R4)
Calc’d” sample values are used in the recovery analysis.
** Tests excluded
from recovery analysis.
KCA recommended the gold recoveries be estimated by ore type based on the following grade-recovery equations:
| • | Rhyolite: [Tail, g/t] = 0.1146 * [Head, g/t] + 0.063 | |
| • | Pyroclastics: [Tail, g/t] = 0.1146 * [Head, g/t] + 0.063 | |
| • | Quartz latite: [Tail, g/t] = 0.1146 * [Head, g/t] + 0.014 |
Based on the grades presented in the 2012 Feasibility Study (Figure 13-1) and the above equations, the recoveries were estimated to be:
| • | Rhyolite: 81% | |
| • | Pyroclastics: 82% | |
| • | Quartz latite: 87% |
However during the development of the mine plan it was agreed upon between GQM LLC and Norwest to simplify the recovery calculation and use a single “average” recovery value for each ore type. Norwest used average recovery values by ore type as presented above. However the final resulting average grades in the current 2015 mine plan were lower than the grades in the 2012 Technical Report that had been used to calculate recoveries. Therefore Norwest’s resulting final overall average recovery of 82% was slightly higher than the recovery recommended by KCA using the formulas at the final head grades.
| February 2015 | 13-7 |
|
|
|
Soledad Mountain Project |
| Kern County, CA, USA | |
| Technical Report |
Based on the direct column leach test data, excluding the 1990 HPGR and the “HG” (High-Grade) column tests and adjusting for the projected 200-day recovery, the overall average recovery is approximately 82% at an average head grade of 0.021 oz/ton (0.73 g/t) Au without any deduction. This approach ignores a grade recovery relationship, and the selected column leach test average head grade closely matches the 0.019 oz/ton (0.66 g/t) Au average head grade as determined in the 2015 mine plan. It is KCA’s opinion that the 82% overall recovery applied by Norwest is feasible. KCA however believes this projected overall recovery is somewhat aggressive and that there is a medium risk the actual overall recovery may be slightly lower.
| 13.6 |
Recovery Analysis For Silver |
Silver recovery was determined using only the HPGR column tests available for each ore type, averaging the 200-day projected recoveries for each ore type, and taking the weighted average of recoveries based on the 2012 mine plan ore proportions for each ore type, which resulted in an overall recovery of 54%. A 4% recovery deduction was applied based on general lab-to-field experience for silver, giving a final recovery of 50%.
Test work results show no clear silver grade-recovery relationship nor a clear distinction between recoveries by ore type, so a flat silver recovery of 50% was applied for all ore types.
| 13.7 |
Metallurgical Variability |
An extensive characterization program using bottle roll tests on reverse circulation drill cuttings was completed by an independent consulting engineer in 1995. The deposit was divided into six areas, four rock types and three vertical zones for this program and 46 standard bottle roll tests were performed.
An analysis of the results in 1995 concluded that there was no discernable difference in metallurgical response for a particular rock type from area to area and from strata to strata. This is of significance both in guiding sampling programs for leach test work and as it allows the use of the information provided by such leach test work to be applied to recovery analyses and to project production of gold and silver in a commercial operation with confidence for all areas that will be mined.
| February 2015 | 13-8 |
|
|
|
Soledad Mountain Project |
| Kern County, CA, USA | |
| Technical Report |
A subsequent review was conducted by KCA in preparation of this Technical Report and KCA generally agrees with the historical conclusion. KCA does note that there is a possible indication of reduced recovery for quartz latite at depth, but not enough samples were tested to conclude the results are statistically significant, so the risk is low.
| 13.8 |
Moisture Content, Specific Weight & Slump |
Moisture contents, column densities, slump, and drain down measurements for HPGR column tests were made to develop design parameters for the heap. The results are summarized in Table 13-2.
Table 13-2. Moisture Content, Density, and Drain Down for HPGR Column Tests
Ore Type |
Sample |
Moisture Content | Specific Weight | Slump
% |
Drain Down | ||||||
To Saturate % |
To Agglo- merate % |
Retained % |
|||||||||
| Before Leach | After Leach | ||||||||||
| Test | Test | Time - 120 h | |||||||||
| lb/ft3 | t/m3 | lb/ft3 | t/m3 | gal/ton | L/t | ||||||
| Rhyolite | P7 | 14.6 | 8.1 | 9.4 | 86.98 | 1.39 | 87.59 | 1.40 | <0.1 | --- | --- |
| Pyroclastics | P9 | 19.5 | 8.8 | 9.5 | 91.10 | 1.46 | 92.81 | 1.49 | <0.1 | --- | --- |
| Rhyolite | A5T | 16.6 | 11.1 | 13.5 | 80.5 | 1.29 | 80.5 | 1.29 | <0.1 | 5.35 | 22.26 |
| Rhyolite | A1/A2T | 16.2 | 11.5 | 13.9 | 83.6 | 1.34 | 84.9 | 1.36 | 1.5 | 5.07 | 21.09 |
| Rhyolite | A4C | 21.2 | 12.7 | 15.2 | 79.9 | 1.28 | 92.4 | 1.48 | 15.6 | 6.61 | 27.51 |
| Rhyolite | R4.1C | 20.3 | 6.9 | 15.6 | 88.0 | 1.41 | 88.6 | 1.42 | 0.7 | 8.23 | 34.26 |
| Quartz latite | R3/R4C | 18.2 | --- | 14.3 | 98.0 | 1.57 | 99.8 | 1.60 | 1.8 | 23.78 | 99.0 |
| Quartz latite | R3/R4E | 14.3 | --- | 7.4 | 99.2 | 1.59 | 99.2 | 1.59 | <0.1 | 18.73 | 78.0 |
| Quartz latite | Combined | 17.6 | --- | 11.6 | --- | --- | --- | --- | 1.5 | 28.10 | 95.9 |
| Rhyolite | LG | 13.8 | 12.8 | 10.7 | 77.4 | 1.24 | 78.0 | 1.25 | 0.8 | 6.91 | 28.8 |
| Rhyolite | HG | 14.0 | 10.6 | 11.9 | 88.0 | 1.41 | 89.3 | 1.43 | 1.4 | 4.92 | 20.5 |
| 13.9 |
Compacted Permeability Test Work |
Test work for percolation rates under loading was conducted on several HPGR column leach residues between 1990 and 2010, by Klohn Leonoff, Advanced Terra Testing and Golder Associates, to verify that ore under the designed ultimate heap height will percolate properly. The results are summarized in Table 13-3.
| February 2015 | 13-9 |
|
|
|
Soledad Mountain Project |
| Kern County, CA, USA | |
| Technical Report |
Table 13-3. Compacted Permeability Results for HPGR Column Leach Residues
Ore Type |
Sample |
Binder lb/ton (kg/t) |
Flow Regime |
Permeability
Heap Height 200 ft (60 m) | |
| gpm/ft2 | cm/s | ||||
| Rhyolite | P7 | 10+ (5+)* | Saturated | 0.51 | 3,490 x 10-5 |
| Pyroclastics | P9 | 10+ (5+)* | Saturated | 0.31 | 2,100 x 10-5 |
| Rhyolite | A5T | 8 (4) | Unsaturated | 0.001 | 10 x 10-5 |
| Rhyolite | A5T | 8 (4) | Saturated | <0.001 | 3 x 10⁻⁵ |
| Quartz latite | R3/R4C | 4 (2) | Saturated | 1.8 | 12,000 x 10-5 |
| Quartz latite | R3/R4E | 4 (2) | Saturated | 2.5 | 17,000 x 10-5 |
| Rhyolite | LG | 8 (4) | Unsaturated | 0.005 | > 34 x 10-5** |
| Rhyolite | HG | 8 (4) | Unsaturated | 0.003 | 18 x 10-5** |
* A second, unspecified quantity of
cement was added immediately before the test
**LG sample maintained a
minimum 0.005gpm/ft 2 percolation rate through 200 ft (60 m)
equivalent
load, HG sample applied solution had to be decreased to
0.003gpm/ft 2 at 200 ft (60 m) load to prevent
column flooding.
Note in tests with “saturated” flow regimes, the column is flooded with solution and the maximum percolation rate is noted, and in tests with “unsaturated” flow regimes, a specific percolation rate was applied (and so the maximum percolation rate is unknown). For reference, the design percolation rate for the Project is approximately 0.005 gpm/ft2 (12 L/h/m2), and generally KCA prefers to see the maximum percolation rate to be 10 times the design rate (in this case, 0.050 gpm/ft2 or 120 L/h/m2)
The results indicate excellent compacted permeability for quartz latite at a heap height of 200 ft (60 m), but KCA noted some percolation issues with rhyolite ores at lower cement levels of 8 lb/ton (4 kg/t). In one rhyolite sample (P7), excellent permeability was observed, but the amount of cement used was unknown (two cement dosages were applied, one at 10 lb/ton or 5 kg/t, the other unspecified). With two other rhyolite samples (A5T, HG), percolation at the design flow rate could not be achieved. To address this, cement usage for rhyolite and pyroclastics (the latter having limited supporting data) was increased to 9.5 lb/ton (4.8 kg/t) as discussed further in Section 17.8.4.
| 13.10 |
Wash and Neutralization Test Results |
McClelland conducted washing and neutralization tests on column leach residues in 1990 and 1996, to determine the effectiveness of cyanide removal for closure and reclamation purposes.
| February 2015 | 13-10 |
|
|
|
Soledad Mountain Project |
| Kern County, CA, USA | |
| Technical Report |
In 1990, wash tests with tap water were conducted on rhyolite and Siliceous Pyroclastic HPGR-crushed column leach test residues, applying water at the design irrigation rate. Residual weak-acid dissociable (WAD) cyanide was reduced from 111 ppm to 1.2 ppm and 113 ppm to 2.1 ppm for the respective residues in 20 days of leaching, near allowable discharge limits. Final pH values of the residues were 10.4 and 10.3 respectively at 20 days. Wash tests were stopped at 20 days. Residues were submitted for CAM-WET analyses for Total Threshold Limit Concentration (TTLC) values and Soluble Threshold Limit Concentration (STLC) values. Results indicated that both residues met allowable limits for all tested elements with the exception of TTLC Beryllium (80 ppm actual vs. 75 ppm limit) for the rhyolite residue. Neither residue showed any detectable STLC Beryllium.
In 1996, a master bulk composite column leach test residue (all ore types), which had been crushed to 80% passing 10 mesh (0.066 in or 1.7 mm), was subjected to a two-stage rinse in three columns in series (to simulate a multi-lift heap) – the first stage consisted of a solution recycled through fresh activated carbon for 30 days, followed by a fresh water rinse for an additional 27 days. WAD cyanide was reduced to less than 0.1 ppm (0.1 mg/L) in 57 days, equivalent to a total of 1.9 tons applied recycle plus rinse solution per ton of ore, and the final pH at 57 days was 9.5. The rinsed residue was submitted for a CAM-WET analysis for TTLC and it was determined the concentration of all analyzed constituents were well below the permitted TTLCs.
| February 2015 | 13-11 |
|
|
|
Soledad Mountain Project |
| Kern County, CA, USA | |
| Technical Report |
| 14.0 |
MINERAL RESOURCE ESTIMATES |
| 14.1 |
Introduction |
The mineral resource estimation for the Soledad Mountain project follows the guidelines of Canadian National Instrument 43-101 (“NI 43-101”). Modeling and estimation of the mineral resources of the Soledad Mountain project were completed in July 2014 through December 2014 under the supervision of Michael M. Gustin, a qualified person with respect to mineral resource estimations under NI 43-101. The effective date of the resource estimate is December 31, 2014. Mr. Gustin is independent of GQM LLC by the definitions and criteria set forth in NI 43-101; there is no affiliation between Mr. Gustin and GQM LLC except that of an independent consultant/client relationship.
Although MDA is not an expert with respect to any of the following aspects, MDA is not aware of any unusual environmental, permitting, legal, title, taxation, socio-economic, marketing, or political factors that are not discussed in this report that may materially affect the Soledad Mountain mineral resources as of the date of this report.
MDA classifies resources in order of increasing geological and quantitative confidence into Inferred, Indicated, and Measured categories in compliance with the “CIM Definition Standards - For Mineral Resources and Mineral Reserves” (2014) and therefore Canadian National Instrument 43-101. CIM mineral resource definitions are given below, with CIM’s explanatory text shown in italics:
Mineral Resource
Mineral Resources are sub-divided, in order of increasing geological confidence, into Inferred, Indicated and Measured categories. An Inferred Mineral Resource has a lower level of confidence than that applied to an Indicated Mineral Resource. An Indicated Mineral Resource has a higher level of confidence than an Inferred Mineral Resource but has a lower level of confidence than a Measured Mineral Resource.
A Mineral Resource is a concentration or occurrence of solid material of economic interest in or on the Earth’s crust in such form, grade or quality and quantity that there are reasonable prospects for eventual economic extraction.
| February 2015 | 14-1 |
|
|
|
Soledad Mountain Project |
| Kern County, CA, USA | |
| Technical Report |
The location, quantity, grade or quality, continuity and other geological characteristics of a Mineral Resource are known, estimated or interpreted from specific geological evidence and knowledge, including sampling.
Material of economic interest refers to diamonds, natural solid inorganic material, or natural solid fossilized organic material including base and precious metals, coal, and industrial minerals.
The term Mineral Resource covers mineralization and natural material of intrinsic economic interest which has been identified and estimated through exploration and sampling and within which Mineral Reserves may subsequently be defined by the consideration and application of Modifying Factors. The phrase ‘reasonable prospects for eventual economic extraction’ implies a judgment by the Qualified Person in respect of the technical and economic factors likely to influence the prospect of economic extraction. The Qualified Person should consider and clearly state the basis for determining that the material has reasonable prospects for eventual economic extraction. Assumptions should include estimates of cutoff grade and geological continuity at the selected cut-off, metallurgical recovery, smelter payments, commodity price or product value, mining and processing method and mining, processing and general and administrative costs. The Qualified Person should state if the assessment is based on any direct evidence and testing.
Interpretation of the word ‘eventual’ in this context may vary depending on the commodity or mineral involved. For example, for some coal, iron, potash deposits and other bulk minerals or commodities, it may be reasonable to envisage ‘eventual economic extraction’ as covering time periods in excess of 50 years. However, for many gold deposits, application of the concept would normally be restricted to perhaps 10 to 15 years, and frequently to much shorter periods of time.
Inferred Mineral Resource
An Inferred Mineral Resource is that part of a Mineral Resource for which quantity and grade or quality are estimated on the basis of limited geological evidence and sampling. Geological evidence is sufficient to imply but not verify geological and grade or quality continuity.
An Inferred Mineral Resource has a lower level of confidence than that applying to an Indicated Mineral Resource and must not be converted to a Mineral Reserve. It is reasonably expected that the majority of Inferred Mineral Resources could be upgraded to Indicated Mineral Resources with continued exploration.
| February 2015 | 14-2 |
|
|
|
Soledad Mountain Project |
| Kern County, CA, USA | |
| Technical Report |
An Inferred Mineral Resource is based on limited information and sampling gathered through appropriate sampling techniques from locations such as outcrops, trenches, pits, workings and drill holes. Inferred Mineral Resources must not be included in the economic analysis, production schedules, or estimated mine life in publicly disclosed Pre-Feasibility or Feasibility Studies, or in the Life of Mine plans and cash flow models of developed mines. Inferred Mineral Resources can only be used in economic studies as provided under NI 43-101.
There may be circumstances, where appropriate sampling, testing, and other measurements are sufficient to demonstrate data integrity, geological and grade/quality continuity of a Measured or Indicated Mineral Resource, however, quality assurance and quality control, or other information may not meet all industry norms for the disclosure of an Indicated or Measured Mineral Resource. Under these circumstances, it may be reasonable for the Qualified Person to report an Inferred Mineral Resource if the Qualified Person has taken steps to verify the information meets the requirements of an Inferred Mineral Resource.
Indicated Mineral Resource
An Indicated Mineral Resource is that part of a Mineral Resource for which quantity, grade or quality, densities, shape and physical characteristics are estimated with sufficient confidence to allow the application of Modifying Factors in sufficient detail to support mine planning and evaluation of the economic viability of the deposit.
Geological evidence is derived from adequately detailed and reliable exploration, sampling and testing and is sufficient to assume geological and grade or quality continuity between points of observation.
An Indicated Mineral Resource has a lower level of confidence than that applying to a Measured Mineral Resource and may only be converted to a Probable Mineral Reserve.
Mineralization may be classified as an Indicated Mineral Resource by the Qualified Person when the nature, quality, quantity and distribution of data are such as to allow confident interpretation of the geological framework and to reasonably assume the continuity of mineralization. The Qualified Person must recognize the importance of the Indicated Mineral Resource category to the advancement of the feasibility of the project. An Indicated Mineral Resource estimate is of sufficient quality to support a Pre-Feasibility Study which can serve as the basis for major development decisions.
| February 2015 | 14-3 |
|
|
|
Soledad Mountain Project |
| Kern County, CA, USA | |
| Technical Report |
Measured Mineral Resource
A Measured Mineral Resource is that part of a Mineral Resource for which quantity, grade or quality, densities, shape, and physical characteristics are estimated with confidence sufficient to allow the application of Modifying Factors to support detailed mine planning and final evaluation of the economic viability of the deposit.
Geological evidence is derived from detailed and reliable exploration, sampling and testing and is sufficient to confirm geological and grade or quality continuity between points of observation.
A Measured Mineral Resource has a higher level of confidence than that applying to either an Indicated Mineral Resource or an Inferred Mineral Resource. It may be converted to a Proven Mineral Reserve or to a Probable Mineral Reserve.
Mineralization or other natural material of economic interest may be classified as a Measured Mineral Resource by the Qualified Person when the nature, quality, quantity and distribution of data are such that the tonnage and grade or quality of the mineralization can be estimated to within close limits and that variation from the estimate would not significantly affect potential economic viability of the deposit. This category requires a high level of confidence in, and understanding of, the geology and controls of the mineral deposit.
Modifying Factors
Modifying Factors are considerations used to convert Mineral Resources to Mineral Reserves. These include, but are not restricted to, mining, processing, metallurgical, infrastructure, economic, marketing, legal, environmental, social and governmental factors.
MDA reports resources at cutoffs that are reasonable for deposits of this nature given anticipated mining methods and plant processing costs, while also considering economic conditions, to fulfill regulatory requirements that a resource exists “in such form, grade or quality and quantity that there are reasonable prospects for eventual economic extraction.”
| February 2015 | 14-4 |
|
|
|
Soledad Mountain Project |
| Kern County, CA, USA | |
| Technical Report |
| 14.2 |
Resource Modeling |
| 14.2.1 |
Data |
The Soledad Mountain gold and silver resources were estimated using data generated primarily by GFA and GQM LLC, including information derived from underground channel samples and RC and core drill holes; additional underground and RC drill samples derived from exploration programs completed by Rosario, Shell-Billiton, CoCa Mines, and Glamis were also incorporated into the modeling. These data, as well as digital topography of the project area, were provided to MDA by GQM LLC and incorporated into a digital database in State Plane coordinates expressed in US Survey feet, California Zone 5, using the NAD83 datum. All modeling of the Soledad Mountain project resources was performed using GEOVIA Surpac™ mining software.
| 14.2.2 |
Deposit Geology Pertinent to Resource Modeling |
The gold and silver mineralization at the Soledad Mountain deposit is directly controlled by a series of north to northwest-striking faults of variable dips that cut Tertiary volcanic units. Over 20 of these mineralized structures have been given formal names in the past, and most of these are accompanied by various splays and secondary structures that are also mineralized. MDA believes that essentially all of the Soledad Mountain gold and silver mineralization is directly related to structures that cut all rock types, although alteration and, to a lesser extent, mineralization styles may vary.
| 14.2.3 |
Modeling of Geology |
At the initiation of the resource study, the plan was for GQM LLC to provide MDA with a set of cross sections with up-to-date geologic interpretations, including lithology, structure, alteration, and mineralization (vein zones, stockwork haloes, etc.), which MDA would use as the basis for gold- and silver-grade modeling. However, MDA and the newly hired GQM LLC geologic staff quickly came to the realization that much of this information was either dated (e.g., a set of paper geologic sections completed in 1997, discussed further below), had never been compiled (mineralization and alteration), or had not survived to the present. It therefore became clear that new and updated interpretations needed to be completed by the GQM LLC geologic staff.
| February 2015 | 14-5 |
|
|
|
Soledad Mountain Project |
| Kern County, CA, USA | |
| Technical Report |
Due to project timelines, MDA’s resource modeling was required to proceed in simultaneously with the geologic work of the GQM LLC staff, instead of the more preferred situation whereby the resources are modeled after the geologic work has been completed. Fortunately, documentation of an internal, non-43-101-compliant estimate of the project gold and silver resources completed by Stephen Bruff in 1998 was uncovered (Bruff, 1998, July), including digital copies of the mineralized envelopes used by Bruff to constrain his estimate. Bruff incorporated surface and underground geologic interpretations by Vance Thornsberry and Bois Hall, which had culminated in hand-drawn geologic interpretations on a set of 100-foot-spaced cross sections across the full extents of the Soledad Mountain gold and silver mineralization. Bruff used these sectional interpretations, in combination with original GFA documentation of mine workings (cross sections, long sections, and level-plan maps) and existing digital modeling of underground drifts and crosscuts by AMEC, to model his cross-sectional mineralized envelopes. After careful review, MDA found Bruff’s work to be of high quality, and of particular use in assisting in the identification of individual mineralized structures and their orientations. MDA and GQM LLC geologists used the work of Bruff, Thornsberry, and Hall as the basis for updated modeling of the project resources, mined stopes, and geology. While MDA made many modifications and refinements to the interpretations of Bruff, partially due to new drill data, his work (which incorporates the work of Thornsberry and Hall) remains as the foundation of the structural model that serves as the primary control of the MDA gold and silver resource estimation.
Because the mineralization is fundamentally controlled by structures, the identification and correlation of specific mineralized structures from section to section is critical, especially due to the significant variations in the strikes and dips from one mineralized structure to another. MDA used the Bruff mineral polygons and various plan maps showing the mapped surface traces of the principal mineralized structures, along with drill-hole geologic data (e.g., presence and percentage of vein material and interpreted structural zones) and assay data, to explicitly model a total of 26 mineralized structures. These sectional interpretations were used to create a three-dimensional surface for each of the mineralized structures.
The GQM LLC geologic staff completed a series of cross sectional interpretations that have been used to code the resource model to lithology and alteration. These sections also include structural interpretations and representations of quartz veining and surrounding stockwork zones. All of this work was based on the newly updated geologic database, which is described in more detail in Section 12.0. Although some interchange occurred between the concomitant MDA modeling of the gold and silver mineralization and GQM LLC’s modeling of geology, the two sets of interpretations were largely completed independently. Only relatively minor modifications to GQM LLC’s structural and mineralization sections were necessary to make the two sets of interpretations consistent, which serves as a validation of all of the modeling.
| February 2015 | 14-6 |
|
|
|
Soledad Mountain Project |
| Kern County, CA, USA | |
| Technical Report |
After completion of the cross sectional geologic interpretations, the sectional lithologic polygons were sliced and re-interpreted on a set of 20-foot-spaced level plans that were used to code the block model, in the same manner as was done for the gold and silver domains (see Section 14.1) .
| 14.2.4 |
Alteration and Oxidation Modeling |
There is no evidence that modeling of oxidation or alteration had ever been completed prior to 2014. GQM LLC therefore has initiated cross-sectional interpretations of both oxidation and alteration, neither of which was completed before the resource model was finalized. While preliminary modeling of oxidation indicates that the some of the deeper portions of the mineralized structures are unoxidized, the reported resources are overwhelmingly oxidized to partially oxidized.
| 14.2.5 |
Modeling of Mining Voids |
As part of his polygonal estimate, Bruff (1998, July) completed an extensive review of mined areas documented on various historical cross sections, long sections, and mine-level maps included in GQM LLC’s map files. These archives include a full set of GFA linens from the 1930s, which provide excellent documentation of their mined stopes, primarily on long sections. Other maps of various types and origins that record significant stoping in areas not mined by GFA are also present in the archives. Bruff (1998, July) used these records, in concert with numerous plan maps that show the existing mining access levels, crosscuts, etc., to carefully model stope polygons on his interpretative cross sections.
MDA substantially relied on Bruff’s stope polygons for the modeling of mining voids. Individual polygon shapes were accepted on each 100-foot spaced section used by Bruff, but were frequently moved or edited to account for voids intersected by drill holes, which were comprehensively compiled from drill logs, and updated underground drift and crosscut locations. MDA used the AMEC planar polygons of drifts, crosscuts, and access tunnels to make seven-foot-high computer-generated solids. These solids were sliced to match the project cross sections and compared to Bruff’s sections, which included similar slices. Where appropriate, i.e. where AMEC’s present drift locations differed from those of Bruff, the stope locations were modified. Further modifications were made based on the presence of logged stopes/workings/etc. in drill holes, which also led to lengthening of the stope polygons in some cases. Finally, where drill data or GFA underground channel sampling indicate the presence of high-grade mineralization along the principal mineralized structures, the polygons were placed so as to encompass the high-grade samples (i.e., the stopes were assumed to ‘mine’ the high-grade zones as defined by the project database). In summary, the Bruff polygons were modified so as to be consistent with all presently available information in the project database.
| February 2015 | 14-7 |
|
|
|
Soledad Mountain Project |
| Kern County, CA, USA | |
| Technical Report |
After refining the Bruff polygons on the 100-foot-spaced sections, MDA used these shapes and the drill data to develop additional polygons on 50-foot sections used by MDA in the central, well-drilled portion of the deposit.
With the exception of the GFA drill holes, all holes postdate mining. It is not uncommon for RC holes to have assay data from samples taken in what is modeled as having been stoped. These samples are commonly, but not always, anomalously low grade compared to samples of the same high-grade structural zones that remain in solid rock beyond the limits of stoping. The assayed samples within the modeled stopes likely reflect the grade of backfilled or caved material. Irrespective of grade, all samples that lie within MDA’s modeled stopes were removed from the interpolation of resource gold and silver grades.
| 14.2.6 |
Gold and Silver Modeling |
The gold and silver mineral resources at Soledad Mountain were modeled and estimated by:
| • | evaluating the drill data statistically; | |
| • | interpreting gold and silver mineral domains independently on cross sections spaced at 100-foot intervals, with 50-foot-spaced sections added in the central area of the deposit (as dictated by the increased drill density); | |
| • | rectifying the cross-sectional mineral-domain interpretations on level plans spaced at 20-foot intervals; | |
| • | analyzing the modeled mineralization geostatistically to aid in the establishment of estimation and classification parameters; and | |
| • | interpolating grades into a three-dimensional block model using the level-plan gold and silver mineral domains to control the estimation. |
| February 2015 | 14-8 |
|
|
|
Soledad Mountain Project |
| Kern County, CA, USA | |
| Technical Report |
All modeling of the Soledad Mountain project resources was performed using GEOVIA Surpac™ mining software.
Mineral Domains. A mineral domain encompasses a volume of ground that ideally is characterized by a single, natural, grade population of a metal that occurs within a specific geologic environment.
MDA modeled the Soledad Mountain gold and silver mineralization by interpreting mineral-domain polygons on a set of vertical, northwest-looking (Az. 315) cross sections that span the extents of the deposit. The cross-section locations and orientations mimic the set of 100-foot-spaced sections created by GFA in the 1930s and used by GQM LLC through to at least the 1990s, although MDA added infill 50-foot sections in the central area of the deposit. The common section locations allowed MDA and GQM LLC to easily incorporate historical sectional interpretations into the updated geologic and grade modeling, including the sections of Bruff, Thornsberry, and Hall.
In order to define the mineral domains at Soledad Mountain, the natural gold populations were first identified on population-distribution graphs that plot the gold- and silver-grade distributions of all of the project drill-hole assays. This analysis led to the identification of low-, mid-, and high-grade populations for both gold and silver. Ideally, each of these populations can be correlated with specific geologic characteristics that are captured in the project database, which then can be used in conjunction with the grade populations to interpret the bounds of each of the gold and silver mineral domains. The approximate grade ranges of the low (domain 100), medium (domain 200), and high (domain 300) grade domains are listed in Table 14-1.
Table 14-1. Approximate Grade Ranges of Gold and Silver Domains
| Domain |
Gold (oz Au/ton) |
Silver (oz Ag/ton) |
| 100 | ~0.003 to ~0.01 | ~0.1 to ~0.5 |
| 200 | ~0.01 to ~0.1 | ~0.5 to ~5 |
| 300 | > ~0.1 | > ~5 |
Due to the preponderance of RC holes, geologic details that are important to the identification of Soledad Mountain mineral domains cannot always be discerned with certainty. For example, without knowledge gained at the drill site, the logging geologist may not be able to determine if the 25% quartz content of the RC chips being examined from a sample interval is derived from a single quartz vein or from a dense stockwork of many quartz veinlets. The characterization of argillic alteration can also be problematic if the drill chips are logged only after washing and screening of the chips. These are only two examples of geologic details that can be obscured by RC drilling, and to some extent this fact hindered the coupling of grade populations with unique geologic features in the mineral-domain modeling completed by MDA.
| February 2015 | 14-9 |
|
|
|
Soledad Mountain Project |
| Kern County, CA, USA | |
| Technical Report |
As stated previously, the gold and silver mineralization at Soledad Mountain is controlled by structures. Due to its close association with these structures, the following discussion of MDA’s mineral-domain modeling will begin with mid-grade (domain 200) gold. The mid-grade gold domains primarily encompass the highly tectonized core zones of the mineralized structures that are characterized by relatively high percentages of quartz vein and veinlet material. As such, the domain 200 shapes effectively define all of the principal, as well as a number of secondary, mineralized structures at the Soledad Mountain project. The domain is also commonly characterized by moderate argillization and weak to moderate silicification.
The high-grade gold domain (domain 300) models high-grade, + banded, + sulfidic quartz veins that occur within the structural core (domain 200) zones, primarily within the Soledad, Starlight-Golden Queen, No. 1 Footwall, Silver Queen, and Queen Esther vein structures. Slightly more than one-third of the modeled high-grade domains lie within modeled stopes, and therefore are removed from the resources. This fact notwithstanding, the high-grade domains contribute significant gold and silver ounces to the resources (there are approximately 200,000 ounces of gold and ~1.7 million ounces of silver within the resources at a gold-equivalent cutoff of 0.1 oz/ton).
Domain 100 (low-grade) gold mineralization is characterized by relatively low-density quartz-veinlet stockwork zones. These stockwork zones form envelopes of variable size that encompass the primary mineralized structural zones (domain 200). The low-grade gold domains therefore are usually not highly tectonized, but there are lower-grade portions in the highly tectonized zones that are low grade and incorporated into domain 100. The low-grade gold domain also encompasses weakly mineralized secondary structures within which higher-grade (domains 200 and 300) mineralization is lacking. Weak silicification and argillization typify domain-100 gold mineralization.
Mid-grade (domain 200) silver occurs primarily within the mid-grade gold domains, but with somewhat lesser extents than the gold. Exceptions to this general case are especially prevalent in the eastern, silver-rich portion of the deposit, where mid-grade silver domains also occur along structures modeled with only low-grade gold domains or, in some cases, where gold is completely absent.
| February 2015 | 14-10 |
|
|
|
Soledad Mountain Project |
| Kern County, CA, USA | |
| Technical Report |
There is far less high-grade (domain 300) silver mineralization than gold. Domain 300 silver occurs primarily in the Queen Esther, Silver Queen, and, to a lesser extent, Starlight structures, usually within high-grade gold domains.
Low-grade silver (domain 100) generally mimics that of gold, although it is commonly less extensive. The most prevalent exceptions to this occur in the eastern portion of the deposit, where silver low-grade mineralization is more extensive than gold in many areas, and in the western portion of the deposit (including the “Sheeted Vein” zone), where gold is not associated with silver mineralization in some areas.
Representative cross sections showing mineral-domain interpretations for gold are shown in Figure 14-1 and Figure 14-3, and for silver in Figure 14-2 and Figure 14-4 (section locations are shown on Figure 10-1).
In addition to the mineral domains in bedrock, a surficial alluvial/colluvial unit was modeled and assigned to domain 10. This domain includes mineralized material eroded from the Queen Esther and related structures.
The cross sectional mineral-domain envelopes were digitized, pressed three-dimensionally to reflect drill-hole projections off section centers, and then sliced horizontally at 20-foot intervals at each mid-bench in the model. These slices, along with slices of triangulated surfaces of the 26 mineralized structures modeled by MDA, were used to guide the final gold and silver mineral domains that were modeled on a set of 20-foot-spaced level plans.
| February 2015 | 14-11 |
|
|
|
Soledad Mountain Project |
| Kern County, CA, USA | |
| Technical Report |
Figure 14-1. Cross Section 2800 Showing Gold Mineral Domains
![]()
| February 2015 | 14-12 |
|
|
|
Soledad Mountain Project |
| Kern County, CA, USA | |
| Technical Report |
Figure 14-2. Cross Section 2800 Showing Silver Mineral Domains
![]()
| February 2015 | 14-13 |
|
|
|
Soledad Mountain Project |
| Kern County, CA, USA | |
| Technical Report |
Figure 14-3. Cross Section 3500 Showing Gold Mineral Domains
![]()
| February 2015 | 14-14 |
|
|
|
Soledad Mountain Project |
| Kern County, CA, USA | |
| Technical Report |
Figure 14-4. Cross Section 3500 Showing Silver Mineral Domains
![]()
| February 2015 | 14-15 |
|
|
|
Soledad Mountain Project |
| Kern County, CA, USA | |
| Technical Report |
Assay Coding, Capping, and Compositing. Drill-hole gold and silver assays were coded to the mineral domains using the cross-sectional envelopes. The following sample types were excluded from this coding:
| • | post-GFA samples lying within modeled stopes; | |
| • | RC samples logged as being derived from intervals of poor recovery, no recovery, or no sample; | |
| • | RC samples logged as “geosamp”; | |
| • | RC samples logged as having been, or suspected as having been, contaminated; | |
| • | samples from GFA underground drill core; and | |
| • | GFA channel samples lying within gold domain 100 (low-grade domain). |
The first sample type listed is excluded because these drill samples lie within modeled stopes and post-date the mining activity. While many of these intervals have no assay data, many others do and are presumed to represent samples of caved or fill material.
The second sample types listed are excluded due to questionable sample quality. These samples, of which there are 335 in the database, frequently occur immediately down-hole from mining-void intersections. In these cases, it would be expected that the RC rig would have difficulties in obtaining sample return to the surface. It is interesting to note that logged comments of “no recovery” are not infrequently accompanied by gold and silver assays. The “geosamp” designation is at times accompanied by notations of poor recovery, and MDA believes that it represents very small samples that were recognized to have a high likelihood of being unrepresentative, but were sent in by the logging geologist for assaying with no intent of the results being used in any meaningful manner. A total of 10 “geosamp” intervals were found in the RC drill logs.
The RC drill logs make mention of contamination or suspected contamination in 26 sample intervals, eight of which are logged as alluvial/colluvial material and lie within the first 20 feet of the drill-hole collar. Only four of the remaining such intervals have associated gold assays greater than 0.003 oz Au/ton.
The GFA underground core samples are also excluded due to questions concerning sample quality. Available data, which includes crude drill logging and sporadic assayed sample intervals, suggest core recoveries were generally poor to very poor (overall average is 45% recovery from 30 holes, excluding data from 0 to 10 feet).
| February 2015 | 14-16 |
|
|
|
Soledad Mountain Project |
| Kern County, CA, USA | |
| Technical Report |
GFA channel samples that lie within modeled low-grade gold domains were also excluded. Approximately 95% of the GFA channel samples as they exist in the project database are characterized by a precision of 0.01 oz Au/ton, i.e., they have values of 0.010, 0.020, …, 0.100, etc. This statistic does not include samples with values of 0 (one instance), 0.001, and 0.003 (five instances) oz Au/ton, which almost certainly represent database values for actual less-than-detection-limit analyses (this would be consistent with the treatment of detection-limit-values for many of the drill holes in the project database). Whether this lack of precision is an artifact of rounding as the values were transcribed onto the GFA linens (from which the database values are derived), or is a reflection of the actual assaying precision, is immaterial to this discussion. The fact is, the database values lack precision, which is especially significant for samples within the low-grade gold domain (this domain more-or-less encompasses values from 0.003 to 0.01 oz Au/ton). The GFA analyses are often anomalously high grade compared to post-GFA drill data within the low-grade domain, which is at least in part due to this precision problem. It is for these reasons that GFA channel samples are excluded from use in the interpolation of gold grades in domain 100 (i.e., they were not coded and composited). The impacts of the use of the GFA channel samples in the Soledad Mountain resource estimation are discussed in Section 14.2.10.
Descriptive statistics of the coded assays are provided in Table 14-2 and Table 14-3 for gold and silver, respectively.
Table 14-2. Descriptive Statistics of Coded Gold Assays
|
|
Assays |
Count |
Mean
(oz Au/ton) |
Median
(oz Au/ton) |
Std. Dev. |
CV |
Min.
(oz Au/ton) |
Max.
(oz Au/ton) |
| 100 | Au Au Cap |
12272 12272 |
0.006 0.006 |
0.004 0.004 |
0.009 0.008 |
1.51 1.33 |
0.000 0.000 |
0.356 0.130 |
| 200 | Au Au Cap |
8820 8820 |
0.030 0.029 |
0.020 0.020 |
0.058 0.036 |
1.93 1.22 |
0.000 0.000 |
3.260 0.400 |
| 300 | Au Au Cap |
1402 1402 |
0.209 0.204 |
0.130 0.130 |
0.309 0.258 |
1.48 1.26 |
0.001 0.001 |
4.729 2.000 |
| All | Au Au Cap |
22494 22494 |
0.026 0.025 |
0.007 0.007 |
0.090 0.076 |
3.54 3.05 |
0.000 0.000 |
4.729
2.000 |
| February 2015 | 14-17 |
|
|
|
Soledad Mountain Project |
| Kern County, CA, USA | |
| Technical Report |
Table 14-3. Descriptive Statistics of Coded Silver Assays
| Domain | Assays | Count | Mean
(oz Ag/ton) |
Median
(oz Ag/ton) |
Std. Dev. | CV | Min.
(oz Ag/ton) |
Max.
(oz Ag/ton) |
| 100 | Ag Ag Cap |
14974 14974 |
0.223 0.221 |
0.170 0.170 |
0.305 0.231 |
1.37 1.04 |
0.000 0.000 |
24.000 5.000 |
| 200 | Ag Ag Cap |
4137 4137 |
1.151 1.146 |
0.800 0.800 |
1.201 1.134 |
1.04 0.99 |
0.000 0.000 |
21.000 12.000 |
| 300 | Ag Ag Cap |
125 125 |
7.888 7.257 |
5.840 5.840 |
7.343 4.783 |
0.93 0.66 |
0.010 0.010 |
55.900 20.000 |
| All | Ag Ag Cap |
19236 19236 |
0.452 0.447 |
0.200 0.200 |
1.069 0.919 |
2.36 2.06 |
0.000 0.000 |
55.900
20.000 |
The process of determining assay caps (shown in Table 14-4) included inspection of population distribution plots of the coded assays by domain to identify high-grade outliers that might be appropriate for capping, as well as to determine if multiple populations exist within any single gold or silver domain. Descriptive statistics of the coded assays by domain and visual reviews of the spatial relationships of the possible outliers and their potential impacts during grade interpolation were also considered.
Table 14-4. Gold and Silver Assay Caps by Mineral Domain
Domain |
oz Au/ton |
Number Capped (% of samples) |
oz Ag/ton |
Number Capped (% of samples) |
| 100 | 0.13 | 6 (<<1%) | 5.0 | 5 (<<1%) |
| 200 | 0.40 | 19 (<1%) | 12.0 | 7 (<1%) |
| 300 | 2.00 | 9 (<1%) | 20.0 | 5 (4%) |
| 10 | 0.030 | 1 (<1%) | 0.5 | 6 (4%) |
The capped assays were composited at 10-foot down-hole intervals respecting the mineral domains. Descriptive statistics of Soledad Mountain composites are shown in Table 14-5 and Table 14-6, respectively.
Table 14-5. Descriptive Statistics of Gold Composites
| Domain | Count | Mean
(oz Au/ton) |
Median
(oz Au/ton) |
Std. Dev. | CV | Min.
(oz Au/ton) |
Max.
(oz Au/ton) | |
| 100 | 6912 | 0.006 | 0.005 | 0.006 | 1.03 | 0.000 | 0.130 | |
| 200 | 4895 | 0.029 | 0.021 | 0.029 | 1.00 | 0.000 | 0.400 | |
| 300 | 809 | 0.204 | 0.140 | 0.206 | 1.01 | 0.001 | 1.940 | |
| All | 12616 | 0.025 | 0.008 | 0.066 | 2.65 | 0.000 | 1.940 |
| February 2015 | 14-18 |
|
|
|
Soledad Mountain Project |
| Kern County, CA, USA | |
| Technical Report |
Table 14-6. Descriptive Statistics of Silver Composites
| Domain | Count | Mean
(oz Ag/ton) |
Median
(oz Ag/ton) |
Std. Dev. | CV | Min.
(oz Ag/ton) |
Max.
(oz Ag/ton) | |
| 100 | 8199 | 0.221 | 0.180 | 0.187 | 0.84 | 0.000 | 3.870 | |
| 200 | 2325 | 1.146 | 0.840 | 0.956 | 0.83 | 0.000 | 12.000 | |
| 300 | 92 | 7.257 | 6.260 | 4.099 | 0.56 | 0.200 | 20.000 | |
| All | 10616 | 0.447 | 0.215 | 0.848 | 1.90 | 0.000 | 20.000 |
Block Model Coding. The level-plan mineral-domain polygons were used to code a three-dimensional block model comprised of 20 foot (wide) x 20 foot (long) x 20 foot (high) blocks. The model is rotated to a bearing of 315° in order to match the approximate average strike of the project mineralization. The percentage volume of each mineral domain, for each metal, is stored within each block (the “partial percentages”) in order for the block models to better reflect the irregularly shaped limits of the various domains.
The partial percentages of stopes were also coded into the model using 20-foot-spaced level-plan stope polygons. These polygons were created using slices of the cross-sectional stope polygons with the high-grade level-plan gold and silver domains as guides. The level-plan stope polygons were defined to preferentially encompass the higher-grade domains as modeled on the plans, under the assumption that the stopes removed the highest grades within the particular structure that was mined.
Rock types were coded into the model using the level-plan lithologic polygons. This coding was completed on a block-in/block-out basis, so that each block is assigned a single lithology.
Tonnage factors were first assigned to each gold mineral domain, as well as to material lying outside of the gold domains (see Table 14-10). A tonnage factor was then applied to each block of the model on a volume-weighted basis using the values in Table 14-10 and the partial percentages of the gold domains stored in the block.
Finally, the percentage of each block that lies below the topographic surface is stored for use in the calculation of block tonnages.
Grade Interpolation. The wide variety of strikes and dips of the many mineralized structures presented challenges with variography. MDA decided to use a global average strike (315) and dip (-90) as a compromise to accommodate the southwest- and northeast-dipping structures. Using gold composites from all domains, variogram ranges of 120 to 170 feet were obtained in the strike and dip directions, while silver composites yielded ranges of 55 to 90 feet. If the composites were put into groups of similar orientations, it is expected that these ranges would be exceeded.
| February 2015 | 14-19 |
|
|
|
Soledad Mountain Project |
| Kern County, CA, USA | |
| Technical Report |
The presence of multiple mineral orientations necessitated the use of multiple search ellipses for the purposes of gold and silver grade interpolation. Ultimately, 28 estimation areas, each comprised of a unique strike and dip orientation, were coded into the block model and used to define 28 search ellipses for use in grade interpolation (Table 14-7).
Colluvial/alluvial-hosted resources at Soledad Mountain were estimated using inverse distance to the second power. Grades in the underlying bedrock were interpolated using inverse distance to the third power, ordinary krige, and nearest-neighbor methods. The mineral resources reported herein were estimated by inverse-distance interpolation, as this technique was judged to be more appropriate than those obtained by ordinary kriging. The nearest-neighbor estimation was also completed as a check on the other interpolations. The parameters applied to the gold-grade estimations at Soledad Mountain are summarized in Table 14-8.
| February 2015 | 14-20 |
|
|
|
Soledad Mountain Project |
| Kern County, CA, USA | |
| Technical Report |
Table 14-7. Search Ellipse Orientations
| Search Ellipse Orientations | |||
| Estimation Domain | Major
Bearing |
Plunge | Tilt |
| Starlight, Soledad, Starlight HW structures | 320 | 0 | 60 |
| Upper Silver Queen | 307 | 0 | -68 |
| Golden Queen and portions of Soledad, Starlight, Echo, Black, Reymert, and Elephant | 325 | 0 | 80 |
| Ladder veins between Starlight and Soledad | 315 | 0 | 15 |
| Upper Silver Queen, N. Patience, zone between Black-Reymert | 345 | 0 | -75 |
| Lower Queen Esther, Independence | 355 | 0 | -35 |
| Soledad, Echo, Karma/Ajax, Black, Reymert | 333 | 0 | 70 |
| Soledad FW and related zones, Starlight HW zones, Reymert branches | 311 | 0 | 47 |
| Upper Queen Esther, Excelsior, Excelsior HW,
Alphason, Patience HW, lower Independence |
334 | 0 | -52 |
| McLaughlin, Sheeted Veins, Bobcat, Hope,
Excelsior, Excelsior HW, structures parallel to Alphason, N extent of Silver Queen, FW zone to Silver Queen |
320 | 0 | -65 |
| Alphason | 305 | 0 | -55 |
| Northern Soledad HW structures | 320 | 0 | 30 |
| Bobcat, Hope, Excelsior, Excelsior HW, lower- to mid-Patience and HW structures | 344 | 0 | -65 |
| Steeply dipping Soledad, HW Starlight structures; Gypsy splay | 308 | 0 | 70 |
| Upper Queen Esther | 340 | 0 | -47 |
| Flat Zone, FW zones to Queen Esther | 315 | 0 | -6 |
| Karma/Ajax, Black and associated structures | 338 | 0 | -90 |
| Silver Queen splay, Gypsy, Bobcat, Soledad-Echo cross structure | 320 | 0 | -75 |
| Boundary, Starlight HW structures, southernmost Patience | 313 | 0 | -90 |
| Gypsy, southern Patience, unnamed Sheeted Veins | 322 | 0 | -80 |
| Silver Queen, Main Fault, Sheeted "S" | 309 | 0 | -43 |
| Soledad, Soledad HW, Echo | 340 | 0 | 62 |
| Silver Queen FW splays, upper SQ, No. 1 FW, GQ, Queen Esther HW splay | 328 | 0 | -90 |
| Upper Silver Queen, Soledad HW splays, Excelsior HW, Excelsior | 335 | 0 | -69 |
| Echo | 304 | 0 | 80 |
| Hope | 355 | 0 | -82 |
| Hope | 350 | 0 | 85 |
| Alluvium/colluvium | 0 | 0 | 0 |
| February 2015 | 14-21 |
|
|
|
Soledad Mountain Project |
| Kern County, CA, USA | |
| Technical Report |
Table 14-8. Summary of Soledad Mountain Estimation Parameters
All Au and Ag Domains
| Estimation | Search Ranges (ft) | Composite Constraints | ||||
| Pass | Major | S-Major | Minor | Min | Max | Max/hole |
| 1 | 200 | 200 | 40 | 1 | 12 | 3 |
| 2 | 500 | 500 | 100 | 1 | 12 | 3 |
| 3 | 1000 | 1000 | 1000 | 1 | 12 | 3 |
Ordinary Krige Parameters
| Model | Nugget | First Structure | Second Structure | ||||||
| C0 | C1 | Ranges
(ft) |
C2 | Ranges
(ft) | |||||
| SPH-Normal | 0.22 5 |
0.11 0 |
60 | 50 | 50 | 0.07 0 |
300 | 15 0 |
150 |
1 krige interpolation used as a check against the reported inverse-distance interpolation
Grade interpolation was completed using length-weighted composites. The estimation passes were performed independently for each of the mineral domains, so that only composites coded to a particular domain were used to estimate grade into blocks coded by that domain. The estimated grades were coupled with the partial percentages of the mineral domains to enable the calculation of weight-averaged gold and silver grades for each block. The final resource grades, and their associated resource tonnage, represent the portion of each block that lies within the combined volume of the modeled gold and silver domains.
| 14.2.7 |
Density Modeling |
MDA was provided with a total of 245 bulk specific-gravity determinations of drill core by McClelland Laboratories, Inc. (“McClelland”) and Kappes, Cassiday & Associates (“KCA”) (MDA chose not to include surface and hand-sample determinations). The 58 McClelland determinations were measured using the volume displacement method and were checked using the weight differentials. KCA determined the specific gravity of 187 drill samples using water-immersion method on waxed samples (ASTM Method C914). There are five cases where the sample intervals tested by each lab overlapped; MDA used the mean value of the two determinations in these cases.
MDA analyzed the specific-gravity data by gold domain. Descriptive statistics resulting from this analysis are summarized in Table 14-9.
| February 2015 | 14-22 |
|
|
|
Soledad Mountain Project |
| Kern County, CA, USA | |
| Technical Report |
Table 14-9. Specific Gravity Data Expressed as Tonnage Factors (ft3/ton)
| Gold Domain | Mean | Median | Min | Max | Count | Model |
| 100 | 13.93 | 13.63 | 20.28 | 12.37 | 48 | 13.9 |
| 200 | 13.57 | 13.46 | 18.74 | 11.16 | 73 | 13.7 |
| 300 | 13.24 | 13.02 | 18.00 | 11.24 | 21 | 13.3 |
| 10 | - | - | - | - | - | 18.0 |
| unmodeled | 13.93 | 13.81 | 18.74 | 10.75 | 98 | 13.9 |
The “model” tonnage factors are those actually used in the block model. These values are biased slightly to the high side in the case of the mineral domains to account for in situ open spaces that cannot be represented in samples of drill core and therefore cannot be accounted for in the specific-gravity determinations.
“Unmodeled” includes all determinations of samples that are not coded to one of the gold domains. A tonnage factor of 13.9 ft3/ton was assigned to all unmineralized materials, which is equal to the tonnage factor given to domain 100. This result is not surprising, as domain 100 encompasses weakly altered, low-grade mineralization that is often visually indistinguishable from barren rock, except for the presence of sparse quartz veinlets. A global value was assigned to unmineralized units because there are insufficient data to break out tonnage factors by lithology, alteration, etc.
A tonnage factor of 18 ft3/ton was assigned to alluvial/colluvial materials.
| 14.2.8 |
Soledad Mountain Project Mineral Resources |
The Soledad Mountain project gold and silver resources are listed in Table 14-10 using a cutoff grade of 0.004 oz Au-equivalent/ton. This cutoff is chosen to capture mineralization that is potentially available to open-pit extraction and heap-leach processing, as well as to match the cutoff used in previously reported (2012) resources. The gold-equivalent cutoff is calculated as follows:
Au-equivalent = Au grade + Ag grade/88
The gold-equivalent relationship is consistent with that used in the previously reported (2012) resource estimation, and is based on a long-term Ag:Au price ratio of 55 and Ag:Au recovery ratio of 0.625.
While the project database includes holes drilled outside of the Approved Project Boundary, and these holes were used in the modeling of the Soledad Mountain mineralization, the current mineral resources reported herein include only the modeled gold and silver mineralization that lies within the Approved Project Boundary.
| February 2015 | 14-23 |
|
|
|
Soledad Mountain Project |
| Kern County, CA, USA | |
| Technical Report |
Table 14-10. Soledad Mountain Project Gold and Silver Resources
| In-Situ Grade | Contained Metal | |||||||
| Gold | Silver | Gold | Silver | |||||
| Classification | Tonnes | Tons | g/t | oz/ton | g/t | oz/ton | oz | oz |
| Measured | 4,298,243 | 4,738,000 | 0.960 | 0.028 | 13.37 | 0.39 | 130,000 | 1,865,000 |
| Indicated | 79,237,167 | 87,344,000 | 0.549 | 0.016 | 9.26 | 0.27 | 1,415,000 | 23,733,000 |
| Measured & Indicated |
83,535,409 | 92,082,000 | 0.575 | 0.017 | 9.53 | 0.28 | 1,545,000 | 25,598,000 |
| Inferred | 21,392,329 | 23,581,000 | 0.343 | 0.010 | 7.20 | 0.21 | 245,000 | 4,965,000 |
| 1. |
Mineral Resources are inclusive of Mineral Reserves. |
| 2. |
Mineral Resources that are not Mineral Reserves do not have demonstrated economic viability. |
| 3. |
Mineral Resources are reported at a 0.004 oz/ton (0.137 g/t) AuEq cut-off in consideration of potential open-pit mining and heap-leach processing. |
| 4. |
Gold equivalent grades were calculated as follows: AuEq(oz/ton) = Au(oz/ton) + (Ag(oz/ton)/88, which reflect a long-term Au:Ag price ratio of 55 and a Au:Ag recovery ratio of 1.6. |
| 5. |
Rounding may result in apparent discrepancies between tons, grade and contained metal content. |
| 6. |
Tonnage and grade measurements are in U.S. and metric units. Grades are reported in troy ounces per short ton and in grams per tonne. |
| 7. |
The Effective Date of the mineral resource estimate is December 31, 2014. |
The Soledad Mountain resources are classified on the basis of the number and distance of composites used in the interpolation of a block, as well as the number of holes/underground channels that contributed composites (Table 14-11).
Table 14-11. Soledad Mountain Classification Parameters
| Class | Min. No.
of Comps |
Additional Constraints |
| Measured | 2 |
Minimum of 2 holes/underground channels lying within an average distance of 30 feet from block |
| Indicated | 2 |
Minimum of 2 holes/underground channels lying within an average distance of 125 feet from block |
| Inferred |
all other estimated blocks |
|
The modeled mineralization is tabulated at additional cutoffs shown in Table 14-12 for the Soledad Mountain deposits in order to provide grade-distribution information, as well as to provide sensitivities of the resources to economic conditions or mining scenarios other than those envisioned by the reportable cutoffs.
| February 2015 | 14-24 |
|
|
|
Soledad Mountain Project |
| Kern County, CA, USA | |
| Technical Report |
Table 14-12. Soledad Mountain Mineralization at Various Cutoffs
| Cutoff (oz Au-equiv/ton) |
Measured | ||||
| Tons | oz Au/ton | oz Au | oz Ag/ton | oz Ag | |
| 0.004 | 4,738,000 | 0.028 | 130,000 | 0.39 | 1,865,000 |
| 0.005 | 4,525,000 | 0.029 | 130,000 | 0.41 | 1,836,000 |
| 0.007 | 4,101,000 | 0.031 | 128,000 | 0.43 | 1,776,000 |
| 0.010 | 3,574,000 | 0.035 | 125,000 | 0.47 | 1,689,000 |
| 0.012 | 3,270,000 | 0.037 | 122,000 | 0.50 | 1,629,000 |
| 0.015 | 2,862,000 | 0.041 | 118,000 | 0.54 | 1,534,000 |
| 0.020 | 2,355,000 | 0.047 | 111,000 | 0.59 | 1,394,000 |
| 0.030 | 1,626,000 | 0.059 | 97,000 | 0.70 | 1,139,000 |
| 0.050 | 864,000 | 0.083 | 72,000 | 0.87 | 750,000 |
| 0.100 | 226,000 | 0.149 | 34,000 | 1.29 | 291,000 |
| Cutoff | Indicated | ||||
| (oz Au-equiv/ton) | Tons | oz Au/ton | oz Au | oz Ag/ton | oz Ag |
| 0.004 | 87,344,000 | 0.016 | 1,415,000 | 0.27 | 23,733,000 |
| 0.005 | 80,292,000 | 0.017 | 1,396,000 | 0.29 | 22,896,000 |
| 0.007 | 66,147,000 | 0.020 | 1,336,000 | 0.32 | 21,318,000 |
| 0.010 | 50,689,000 | 0.024 | 1,241,000 | 0.37 | 18,909,000 |
| 0.012 | 43,712,000 | 0.027 | 1,184,000 | 0.40 | 17,563,000 |
| 0.015 | 35,806,000 | 0.031 | 1,101,000 | 0.44 | 15,832,000 |
| 0.020 | 26,369,000 | 0.037 | 970,000 | 0.51 | 13,366,000 |
| 0.030 | 15,090,000 | 0.049 | 746,000 | 0.63 | 9,461,000 |
| 0.050 | 6,157,000 | 0.075 | 462,000 | 0.80 | 4,933,000 |
| 0.100 | 1,304,000 | 0.136 | 177,000 | 1.10 | 1,433,000 |
| Cutoff | Measured & Indicated | ||||
| (oz Au-equiv/ton) | Tons | oz Au/ton | oz Au | oz Ag/ton | oz Ag |
| 0.004 | 92,082,000 | 0.017 | 1,545,000 | 0.28 | 25,598,000 |
| 0.005 | 84,817,000 | 0.018 | 1,526,000 | 0.29 | 24,732,000 |
| 0.007 | 70,248,000 | 0.021 | 1,464,000 | 0.33 | 23,094,000 |
| 0.010 | 54,263,000 | 0.025 | 1,366,000 | 0.38 | 20,598,000 |
| 0.012 | 46,982,000 | 0.028 | 1,306,000 | 0.41 | 19,192,000 |
| 0.015 | 38,668,000 | 0.032 | 1,219,000 | 0.45 | 17,366,000 |
| 0.020 | 28,724,000 | 0.038 | 1,081,000 | 0.51 | 14,760,000 |
| 0.030 | 16,716,000 | 0.050 | 843,000 | 0.63 | 10,600,000 |
| 0.050 | 7,021,000 | 0.076 | 534,000 | 0.81 | 5,683,000 |
| 0.100 | 1,530,000 | 0.138 | 211,000 | 1.13 | 1,724,000 |
| Cutoff | Inferred | ||||
| (oz Au-equiv/ton) | Tons | oz Au/ton | oz Au | oz Ag/ton | oz Ag |
| 0.004 | 23,581,000 | 0.010 | 245,000 | 0.21 | 4,965,000 |
| 0.005 | 20,905,000 | 0.011 | 237,000 | 0.23 | 4,715,000 |
| 0.007 | 15,349,000 | 0.014 | 212,000 | 0.28 | 4,269,000 |
| 0.010 | 9,898,000 | 0.018 | 178,000 | 0.35 | 3,498,000 |
| 0.012 | 7,821,000 | 0.021 | 160,000 | 0.40 | 3,128,000 |
| 0.015 | 5,772,000 | 0.024 | 139,000 | 0.47 | 2,690,000 |
| 0.020 | 3,642,000 | 0.030 | 110,000 | 0.57 | 2,071,000 |
| 0.030 | 1,859,000 | 0.042 | 77,000 | 0.68 | 1,265,000 |
| 0.050 | 646,000 | 0.063 | 41,000 | 0.79 | 508,000 |
| 0.100 | 56,000 | 0.121 | 7,000 | 0.63 | 35,000 |
Note: Rounding may cause apparent discrepancies.
Figure 14-5, Figure 14-6, Figure 14-7, and Figure 14-8 show cross sections of the block model that correspond to the mineral-domain cross sections presented above.
| February 2015 | 14-25 |
|
|
|
Soledad Mountain Project |
| Kern County, CA, USA | |
| Technical Report |
Figure 14-5. Soledad Mountain Cross Section 2800 Showing Block Model Gold Grades
![]()
| February 2015 | 14-26 |
|
|
|
Soledad Mountain Project |
| Kern County, CA, USA | |
| Technical Report |
Figure 14-6. Soledad Mountain Cross Section 2800 Showing Block Model Silver Grades
![]()
| February 2015 | 14-27 |
|
|
|
Soledad Mountain Project |
| Kern County, CA, USA | |
| Technical Report |
Figure 14-7. Soledad Mountain Cross Section 3500 Showing Block Model Gold Grades
![]()
| February 2015 | 14-28 |
|
|
|
Soledad Mountain Project |
| Kern County, CA, USA | |
| Technical Report |
Figure 14-8. Soledad Mountain Cross Section 3500 Showing Block Model Silver Grades
![]()
| February 2015 | 14-29 |
|
|
|
Soledad Mountain Project |
| Kern County, CA, USA | |
| Technical Report |
| 14.2.9 |
Model Checks |
Volumes derived from the sectional mineral-domain modeling were compared to both the level-plan and coded block-model volumes to assure close agreement, and all block-model coding was checked visually on the computer. A polygonal estimate using the cross-sectional interpretations, as well as nearest-neighbor and ordinary-krige estimates of the modeled resources, was undertaken as a check on the inverse-distance-cubed estimation results; no unexpected relationships between the check estimates and the inverse-distance estimate were identified. Various grade-distribution plots of assays and composites vs. nearest-neighbor, ordinary-krige, and inverse-distance block grades were evaluated as a check on the both the global and local estimation results. Finally, the inverse-distance grades were visually compared to the drill-hole assay data to assure that reasonable results were obtained.
| 14.2.10 |
Comments on the Resource Modeling |
As discussed in Section 9.3, GFA underground channel-sample gold values have been significantly lowered by factoring in prior resource estimations, including the previous NI 43-101 estimate completed in 2012. MDA does not agree with such an approach. The acceptance of the GFA channel data are justified by the following: (1) there is no proof, statistical or otherwise, that the GFA channel-sample results are more or less accurate than any of the subsequent channel samples; (2) there is good evidence that GFA samples were extracted in a more systematic fashion than most (if not all) of the subsequent sampling programs; and (3) there is evidence that GFA samples were generally larger in volume, and therefore potentially more representative, than those from subsequent sampling programs. MDA has therefore utilized the GFA channel-sample data ‘as-is’ in the current resource estimation with the exception of the exclusion of sample intervals lying within the low-grade gold domain, for the reasons discussed in Section 14.1.
While MDA is comfortable with its decisions with respect to the channel-sample data, the use or exclusion of any or all of the Soledad Mountain channel-sample data in resource estimation is subject to risk. In order to quantify this risk in the current resource model, three additional estimates were completed. These estimations were run identically to the final resource estimation except in the use of the underground channel data. One of the risk-analysis runs used only the GFA channel samples in the estimation (in addition to the drill data), another used only the post-GFA (GQM LLC and Rosario) channel samples, and the third used no channel samples at all. If only the GFA channel data are excluded from the estimation, a total of 128,000 ounces of gold are removed from the resources (at the 0.004 oz AuEq/ton cutoff). If only the GFA channels are used, there is a gain of 3,000 ounces. Excluding all channel samples from the estimation of gold results in a loss of 140,000 ounces relative to the current resources.
| February 2015 | 14-30 |
|
|
|
Soledad Mountain Project |
| Kern County, CA, USA | |
| Technical Report |
The GFA channel samples included in the project database consist entirely of cross-cut samples; none of the numerous ‘drift’ samples (i.e., samples taken along the strike of the mineralized structures) were transcribed from the original GFA linens into the project database. The inclusion of the drift-sample data would increase the accuracy of the mineral-domain modeling, especially in the high-grade portions of the mineralized structures. For example, the almost total lack of pre-mining channel samples of high-grade zones in and near stopes, combined with the lower density of drilling at depth, could result in an underestimation of the gold and silver grades of high-grade shoots that extend beyond the limits of stopes due to the lack of representative samples. The full extents of the high-grade domains are also difficult to model in some areas due to the lack of data. The addition of the GFA drift samples could help mitigate these issues.
A total of 1.9 million tons is modeled as having been mined in stopes and is therefore excluded from the reported resources. Total historical production at Soledad Mountain has been estimated at 1.3 million tons (Section 6), although detailed production records are not available. The discrepancy between the mined material removed from the model and the estimated production is due to either inadequate production records, excessive volumes of modeled stopes, or some combination of the two. It is therefore possible that the model underestimates some amount of high-grade material that is additional to any understatement caused by the lack of data (as discussed in the previous paragraph).
Down-hole survey data are available for only 166 of the 834 drill holes in the project database (excluding GFA holes, which are not used in grade interpolation). These data indicate the holes tend to steepen with depth, which is not surprising for RC holes that dominate the drilling. The rates of steepening are not consistent, however, which precludes the confident application of factors to create deviation data for the unsurveyed holes. To the extent that the unsurveyed holes did in fact deviate to steeper angles with depth, the holes will yield intersections that are shallower than reality, causing an unwarranted flattening of the modeled mineralized structures.
A total of 845 sample intervals lying within the modeled gold domains and 566 in the silver domains have been analyzed by cyanide shake-leach methods only; no fire-assay data are available for these intervals. The cyanide analyses, which are exclusively from Shell-Billiton holes, represent about 4% of the coded gold assays and 3% of the coded silver assays used in the resource estimation. In addition to the cyanide analyses, silver was analyzed by aqua regia – atomic absorption methods in the 20-hole 2011 drilling program. A total of 202 of these silver analyses are included in the coded assays, representing an additional 1% of the coded silver assays. Because the cyanide and aqua regia analytical techniques may not fully extract the gold and/or silver during sample digestion, the inclusion of these data could result in some underestimation of the resource grades. While it is extremely unlikely that any such underestimation is material to the global resources, the relatively small areas in the northwestern-most portion of the resources that were tested by the 2011 drilling program might have underestimated silver values to a material extent.
| February 2015 | 14-31 |
|
|
|
Soledad Mountain Project |
| Kern County, CA, USA | |
| Technical Report |
A number of holes intersected mineralized alluvium downslope and to the north of the Queen Esther–Independence vein system. This material was modeled and estimated independently of the bedrock-hosted mineralization, but it is not included in the project resources due to uncertainties regarding the drilling and geologic controls of the alluvial materials. A total of 36,000 ounces of gold at an average grade of 0.006 oz/ton and 1.238 million ounces of silver at an average grade of 0.19 oz/ton were estimated at a cutoff of 0.004 oz AuEq/ton within this alluvial material.
The inherent heterogeneity that characterizes the project gold mineralization (see Section 12.3) will present grade-control challenges to a mining operation at Soledad Mountain, specifically with respect to the determination of ore versus waste. Among other factors, grade control protocols will need to address the representativity of the grade-control samples (how well they represent the sample’s associated mining-unit volume) and the variability/precision of the grade-control assays at the cutoff grade (the confidence of the assay value at or near the cutoff grade).
The current resource estimate has significantly fewer tons and ounces of gold and silver than the previous (2012) resources, which are summarized in Table 14-13 at the reported Au-equivalent cutoff of 0.004 oz/ton (the prior (2012) estimates are not current mineral resources and the Company is not treating them as current mineral resources. These estimates are superseded by the current resources presented in this section of this report).
Table 14-13. 2012 Estimate of Mineral Resources
| Tons | oz
Au/ton |
Au oz | oz
Ag/ton |
Ag oz |
| 175,300,000 | 0.015 | 2,573,000 | 0.27 | 47,385,000 |
The principal reason for this difference is related to the interpretations and procedures employed in the two estimations, as no additional drilling or channel sampling was undertaken after the 2012 resource modeling was completed.
| February 2015 | 14-32 |
|
|
|
Soledad Mountain Project |
| Kern County, CA, USA | |
| Technical Report |
The primary control of the Soledad Mountain mineralization is structural. The central portions of the numerous mineralized structural zones (“structural cores”) are generally characterized by medium-grade mineralization. High-grade quartz veins and breccias occur within portions of these structural cores, and low-grade stockwork mineralization envelopes the structural cores.
The current model attempts to explicitly define each of these three styles of mineralization: medium-grade structural cores with internal high-grade veins and enveloping low-grade stockwork. Gold and silver are modeled independently, as they have unique metal distributions, and the bounds of each of the three styles of mineralization are painstakingly modeled in detail using assays, quartz-vein percentages, and vein styles.
The previous model used a gold-equivalent cutoff value for defining the low-grade limits of the mineralization, which, due to the differing grade distributions of gold and silver, leads to excess volumes of modeled gold and silver mineralization relative to the current model. For example, due to the inclusion of silver in defining the estimation-controlling zones for gold in the previous model, gold was estimated into areas that drill data indicate are very low-grade to barren, and vice versa. In addition, the previous model estimated grades of the low-grade stockwork together with those from the medium-grade structural cores, which resulted in higher estimated grades within the stockwork zones relative to the current model, and relative to the drill data that penetrated these areas.
The end result of the procedures used in 2012 is that the 2012 model has mineralized widths that exceed those in the current model, with grades in the stockwork zone that are often significantly higher than the current model and underlying drill data.
The proportion of Measured gold and silver ounces relative to total resource ounces is also significantly less in the current model than in the 2012 resources. MDA believes that the existing QA/QC data, which are comprised primarily of a significant number of duplicate analyses (field, preparation, and pulp duplicates), are sufficient to support only a modest amount of Measured resources relative to the previous model.
| February 2015 | 14-33 |
|
|
|
Soledad Mountain Project |
| Kern County, CA, USA | |
| Technical Report |
| 15.0 |
MINERAL RESERVE ESTIMATES |
| 15.1 |
Conversion Factors from Mineral Resources to Mineral Reserves |
| 15.1.1 |
Pit Slopes |
A discussion of the pit slope parameters used in the development of the pit designs and supporting the mineral reserve estimates is included in Section 16.
| 15.1.2 |
Dilution and Mining Losses |
The current mineral reserve estimates include dilution of 6.8% of ore tonnage which is based on a 2 ft (0.6 m) contact width along the defined mining block contacts. No ore loss was assigned other than what is inherent in the model.
Good sampling techniques, in-pit geological control and a focus on ore-from-waste separation will be an essential part of the operation to minimize dilution and ore loss and to meet the selected dilution criteria.
| 15.1.3 |
Mining Inputs |
The feasibility level mine plan was developed for an open pit mining operation feeding approximately 5.1 million tons (4.6 million tonnes) of ore per year to a crushing-screening plant. The pit designs for the property were based upon the results of a series of Lerchs-Grossman pit optimization analyses. The mineral reserve estimates are summarized in Table 15.1.
The mine plan is based on a fleet which includes a hydraulic excavator, wheel loaders and 100 ton (91 t) capacity haul trucks for the primary mining supported by a smaller development fleet for pioneering access roads, smaller ore zones and upper pit benches. The primary mining fleet is supported by additional equipment for road maintenance, dump management operations, stockpile activities and feed to the crushing-screening plant. Refer to section 16.3 for additional information regarding pit design.
| 15.1.4 |
Processing Inputs |
The crushing-screening plant includes a primary and secondary crusher and a single screen. A HPGR is used as the key comminution device to prepare the run of mine ore for heap leaching.
| February 2015 | 15-1 |
|
|
|
Soledad Mountain Project |
| Kern County, CA, USA | |
| Technical Report |
The single leach pad is designed to have capacity for the total mine production which requires placement of approximately 51 million tons (46 million tonnes) of ore on the pad. Crushed and agglomerated ore is transported by a series of conveyors to the heap leach pad. Pregnant solution flows to a pump box and is pumped to a Merrill-Crowe plant where gold and silver are extracted from solution with a dorè as the final product. The dor will be transported to an off-site smelter and refinery for final production of saleable gold and silver.
| 15.2 |
Mineral Reserves Statement |
The reserve estimates are classified in accordance with the 2010 CIM Definition Standards for Mineral Resources and Mineral Reserves.
The Qualified Person for the Mineral Reserve Estimates is Sean Ennis, P.Eng, Vice President of Mining for Norwest Corporation.
The current Mineral Reserve Estimates are summarized in Table 15-1.
Table 15-1. Mineral Reserve Estimates
| In-Situ Grade | Contained Metal | |||||||
| Gold | Silver | Gold | Silver | |||||
| Reserve Category | Tonnes | Tons | g/t | oz/ton | g/t | oz/ton | oz | oz |
| Proven | 3,357,000 | 3,701,000 | 0.948 | 0.0276 | 14.056 | 0.410 | 102,300 | 1,517,100 |
| Probable | 42,957,000 | 47,352,000 | 0.638 | 0.0186 | 10.860 | 0.317 | 881,300 | 14,999,100 |
| Total & Average | 46,315,000 | 51,053,000 | 0.661 | 0.0193 | 11.092 | 0.324 | 983,600 | 16,516,200 |
1. The
qualified person for the mineral reserve estimates is Sean Ennis, Vice
President, Mining, P.Eng., APEGBC Registered Member who is employed by Norwest
Corporation.
2. A gold equivalent cut-off grade of
0.005 oz/ton was used for quartz latite and a cut-off grade of 0.006 oz/ton was
used for all other rock types. Cut-off grade was varied to reflect differences
in estimated metal recoveries for the different rock types mined.
3. Gold equivalent grades were calculated as
follows: AuEq(oz/ton) = Au(oz/ton) + (Ag(oz/ton)/88, which reflects a long-term
Au:Ag price ratio of 55 and a Au:Ag recovery ratio of 1.6. Gold equivalent
grades were used for the pit optimization.
4.
Tonnage and grade measurements are in imperial and metric units. Grades are
reported in troy ounces per short ton and in grams per tonne.
| February 2015 | 15-2 |
|
|
|
Soledad Mountain Project |
| Kern County, CA, USA | |
| Technical Report |
For the purposes of comparison, prior Mineral Reserve Estimates from 2012 is provided in Table 15-2.
Table 15-2. Summary of 2012 Mineral Reserve Estimates
(2012 reserve estimate is no longer current)
| In-Situ Grade | Contained Metal | |||||||
| Gold | Silver | Gold | Silver | |||||
| Reserve Category | Tonnes | Tons | g/t | oz/ton | g/t | oz/ton | oz | oz |
| Proven | 18,371,000 | 20,250,000 | 0.910 | 0.0266 | 14.49 | 0.423 | 537,700 | 8,558,500 |
| Probable | 42,237,000 | 46,558,000 | 0.529 | 0.0154 | 10.58 | 0.309 | 717,900 | 14,372,500 |
| Total & Average | 60,608,000 | 66,808,000 | 0.644 | 0.0188 | 11.77 | 0.343 | 1,255,600 | 22,931,000 |
These prior estimates are not current mineral reserves and the Company is not treating them as current mineral reserves. These estimates are superseded by the current reserves presented in Table 15-1 of this section.
| 15.3 |
Factors That May Affect the Mineral Reserve Estimates |
The following factors may affect the mineral reserve estimates:
| • |
Changes in the geotechnical design parameters based upon operating experience; | |
| • |
An inability to meet the annual ore and waste production rates; | |
| • |
Variance in the actual ore loss and dilution experienced during operations; | |
| • |
Differences in the planned heap leach pad capacity; | |
| • |
Operating cost experience; | |
| • |
Quality of waste rock suitable for sale as aggregate is key to materials management for the Project and either a higher or lower quality than expected could have an impact on closure and closing reclamation and mine life; | |
| • |
A change in the closure and closing reclamation requirements that would allow the Joint Venture to leave waste rock at greater than 25 ft (7.6 m) above original topography at the end of the mine life, would reduce operating costs and reclamation liabilities; and | |
| • |
Higher or lower future gold and silver prices than currently projected. |
| 15.4 |
Comments on Section 15 |
The mineral reserves estimates are based on the most current information available in 2015 and the need to meet the approval and permit requirements as set out in the Conditional Use Permits for the Project. The mineral reserve estimates have been prepared using industry best practices and meet the 2010 CIM Definition Standards for Mineral Resources and Mineral Reserves.
| February 2015 | 15-3 |
|
|
|
Soledad Mountain Project |
| Kern County, CA, USA | |
| Technical Report |
The design was constrained by the backfill requirements and constraints presented by the Approved Project Boundary in addition to economic factors. Additional ore is available at depth but the current strip ratio limits mining it. The West Pit area is specifically affected by this where pushbacks beyond the mountain peaks incur rapid increases in strip ratio. Pit optimization was done at the current mining and processing costs with gold and silver prices of $1200/Au oz and $12/oz respectively.
| February 2015 | 15-4 |
|
|
|
Soledad Mountain Project |
| Kern County, CA, USA | |
| Technical Report |
| 16.0 |
MINING METHODS |
| 16.1 |
Geotechnical Considerations |
| 16.1.1 |
Open Pit Slope Design |
Open pit slope designs used by Norwest for the Project incorporated design guidelines and constraints set forth in the report prepared by Seegmiller International (“Seegmiller”) in June 1997 and updated by Knight Piesold Ltd. (“Knight Piesold”) (2014). Typical rock strength parameters are shown in Table 16.1.
Table 16-1. Rock Strength Parameters
Rock Type |
Compressive
Strength |
Point Load
Strength |
Specific Weight
|
w% |
SG | |||
| psi | MPa | psi | MPa | lb/ft3 | kg/m3 | |||
| Flow-banded Rhyolite | 12,620 | 87 | 950 | 6.6 | 147.4 | 2,361.10 | 0.4 | 2.36 |
| Altered Flow-banded Rhyolite | 490 | 3.4 | 84 | 0.6 | 113.3 | 1,814.80 | 1.81 | |
| Porphyritic Rhyolite | 17,200 | 118.9 | 1,000 | 6.9 | 143.1 | 2,292.20 | 0.4 | 2.29 |
| Pyroclastics | 3,880 | 26.8 | 200 | 1.4 | 135.6 | 2,172.00 | 0.5 | 2.18 |
| Altered Pyroclastics | 320 | 2.2 | 50 | 0.3 | 88.1 | 1,411.20 | 1.41 | |
| Quartz Latite Porphyry | 13,200 | 91 | 1,010 | 7 | 146.2 | 2,341.80 | 0.6 | 2.34 |
| Altered Quartz Latite Porphyry | 3,160 | 21.8 | 581 | 4 | 133.8 | 2,143.20 | 2.15 | |
| Waste Rock (Average) | 143.6 | 2,300.00 | 0.5 | 2.30 | ||||
Pit slopes were designed based upon stability analyses done using rock mass properties for four main rock types found on Soledad Mountain. These are flow-banded rhyolite, porphyritic rhyolite, pyroclastics, and quartz latite porphyry. Other minor rock types, including brecciated zones, can be found in some areas. For simplification purposes, with the exception of two small brecciated zones, all rocks were included in one of the four main rock groups. For the slope stability analysis, the location of contacts between rock types was defined by GQM LLC in-house work supported by their geological consultants.
Norwest completed a site visit, identified the rock types discussed in the pit wall assessments, and found no rock types which were not consistent with this analysis.
The design constraints are provided in Section 16.1.3.
| February 2015 | 16-1 |
|
|
|
Soledad Mountain Project |
| Kern County, CA, USA | |
| Technical Report |
| 16.1.2 |
Open Pit Slope Design Evaluation |
Norwest reviewed the slope stability assessments completed to date by both Seegmiller and Knight Piesold. For this evaluation, Norwest examined the sources of information used, regional geology and geologic structures as they relate to slope stability, and confirmed rock mass parameters determined by geotechnical investigations and laboratory tests. Norwest also reviewed hydrogeological conditions relevant to slope stability.
Norwest recommends the following operational procedures to reduce the potential for slope failures and to support the pit slope design:
| • |
Employ blast damage reduction techniques. | |
|
| ||
| • |
Divert storm-water run-off away from open pits and do not allow run-off to enter cracks along the pit perimeters. | |
|
| ||
| • |
Do not undercut flow-banding and rock-bolting in certain areas may be necessary. | |
|
| ||
| • |
Use displacement monitoring and analyses and inspect pit slopes for signs of failure. | |
|
| ||
| • |
Construct a test slope on the slope with the lowest static factor of safety and monitor it by monthly surveys and visual observations. | |
|
| ||
| • |
Take care to prevent and eliminate rock fall hazard zones. | |
|
| ||
| • |
Continue bench face structure mapping as mining progresses to support and confirm the stability analyses. | |
|
| ||
| • |
Complete a follow-up study during the first year of operations and review slope stability on a regular basis throughout the mine life. | |
|
| ||
| • |
Develop appropriate safety and loss control measures for individuals and equipment working around pit slopes and include policies and procedures in a safety manual. |
Based upon Norwest’s evaluation of current pit slope stability assessments for the Project, Norwest accepts these assessments as appropriate for feasibility-level mine design. As mining proceeds, additional information (see above) is required to confirm the pit slope design parameters.
| February 2015 | 16-2 |
|
|
|
Soledad Mountain Project |
| Kern County, CA, USA | |
| Technical Report |
| 16.1.3 |
Open Pit Slope Design Criteria |
The open pit slope design criteria are provided in Table 16.2. Inter-ramp slope angles for the majority of pit walls are designed at 55 degrees for walls up to 500 feet (152 meters) in height. Pit walls higher than this have been designed for an overall slope of 45 degrees by incorporating step-outs and increased catch bench widths. During the 2014 review of the design guidelines, it was recommended that the pit wall angles in zones of adverse structure or lower quality rock mass associated with the central portion of the West Pit be designed with a lower overall slope and a value of 40 degrees was selected for this area only.
Table 16-2. Pit Slope Design Criteria
| Slope Characteristics | Parameters | ||
| Inter-Ramp Slope Angle | 40o | 45o | 55o |
| Maximum Bench Height | 60 ft | ||
| Minimum Catch Bench Width | 51ft | 40ft | 22ft |
| Maximum Bench face Angle | 71.6 degrees | ||
| Bench Development | 3 lifts, 20 ft each | ||
| 16.1.4 | Waste Rock Dump Design |
The most recent waste rock dump stability evaluation was carried out by Golder Associates Inc. (“Golder”) and documented in their report to the GQM LLC (May 13, 2010). Prior to this most recent work, Norwest had reviewed previous Golder waste rock dump stability reports and visited the site and identified no soft clays, adversely oriented major shear structures or other geotechnical anomalies which could contribute to waste rock dump foundation failure.
Waste rock dumps were designed using material strength parameters for foundation materials and waste rock. Strength parameters were determined by laboratory tests of rock samples for specific weight, friction angles, and cohesion. GQM LLC management suggested a waste rock internal friction angle of 37, which is in keeping with Norwest’s experience for hard rock, run-of-mine waste rock piles.
Design constraints are provided in Section 16.1.6.
| February 2015 | 16-3 |
|
|
|
Soledad Mountain Project |
| Kern County, CA, USA | |
| Technical Report |
| 16.1.5 |
Waste Rock Dump Design Evaluation |
Current waste rock dump stability analyses were carried out by Golder on the East Waste Rock Storage Pad. Previous feasibility level stability analysis was completed by Norwest on other dump areas as detailed in the 2008 Norwest feasibility study. Although the configuration of some dumping areas has been altered, the general dump designs follow the previous criteria and are therefore judged suitable for feasibility level planning.
Based upon waste rock dump stability and rock rollout analysis, Norwest recommends the following procedures to provide waste rock dump stability and minimize safety hazards:
| • |
Divert storm-water run-off away from waste rock dumps; | |
| • |
Inspect crests of waste rock dumps regularly for signs of settlement or failure and employ displacement monitoring and analyses where indicated; | |
| • |
Work to prevent rock rollout hazards; and | |
| • |
Develop safety and loss control measures for individuals and equipment working around waste rock dumps and include policies and procedures in a safety guide. |
Based upon Norwest’s evaluation of waste rock dump designs completed for the Project, Norwest believes that they are appropriate for use as feasibility level designs.
The West Dump is a new dumping area not included in the previous design work. Before dumping commences in this area, an updated geotechnical assessment of this area must be carried out.
As mining proceeds, additional information is required to confirm design parameters.
| 16.1.6 |
Waste Rock Dump Design Criteria |
Final dump design guidelines are based upon stability analyses carried out by Golder and Norwest. Waste dump design criteria are provided in Table 16.3. It should be noted that the East Waste Rock Storage Pad face height of 460 feet (140 meters) exceeds the previous maximum dump height criteria of 380 feet (116 meters). However, the East Waste Rock Storage Pad has been constructed in lifts with a lower overall slope angle and therefore the increased height is not expected to adversely affect dump stability performance.
| February 2015 | 16-4 |
|
|
|
Soledad Mountain Project |
| Kern County, CA, USA | |
| Technical Report |
Table 16-3. Waste Dump Design Criteria
| Dump Characteristic | Magnitude |
| Maximum Slope Angle | 37o
(1.3H:1V) |
| Maximum Reclaimed Slope Angle | 27o (2H:1V) |
| Maximum Dump Slope Height | 320 ft |
| Maximum Foundation Grade | 15o |
| Dump Face Height | 460 ft |
| * |
Maximum dump slope height is the maximum vertical
| |
| * |
Maximum dump face height is the maximum vertical distance
|
| 16.2 |
Pit Optimization |
| 16.2.1 |
Pit Optimization Studies |
The 3D block model prepared by MDA in 2014 was used for development and evaluation of the pit shells for the Project. This section reviews the work carried out to develop detailed pit designs starting with a discussion of the initial pit shell optimization process and the design parameters and constraints which were used. The MineSight 3D (Mintec©) software package was used for the optimization and pit design process.
| 16.2.2 |
Pit Shells – Design Parameters and Constraints |
For the purposes of this feasibility study the following material parameters have been assumed. Note that only imperial units are shown in this section as the geological model was constructed with parameters specified in Imperial Units.
| • | In situ ore and waste density of 1.95 ton/yd3 (2.55 t/m3); | |
| • | Waste swell factor of 30%; | |
| • | Loose density of 1.50 ton/yd3 (1.96 t/m3); | |
| • | Maximum tons of ore of 51 million tons (46 million tonnes) | |
| • | Mining constraints which left intact the two peaks of Soledad Mountain; and | |
| • | A series of pit shells was created using the pit optimization tools in MineSight© by varying parameters shown in Table 16.4. |
The range of parameters used in the 2014 optimization runs is summarized in Table 16.4.
| February 2015 | 16-5 |
|
|
|
Soledad Mountain Project |
| Kern County, CA, USA | |
| Technical Report |
Table 16-4. Pit Optimization Variables
| Parameter
|
Units |
Low
Range |
Upper
Range |
Comments |
| Gold Price | US$/oz | $500 | $1400 | $1200 base case |
| Silver Price | US$/oz | $5 | $13 | $12.00 base case |
| Ore Mining + Processing Cost |
$/ton |
$5.74 |
$5.74 |
$5.74 Based on 2012
Feasibility Study |
| Waste Cost | $/ton | $1.14 | $1.14 | $1.14 based on 2012
Feasibility Study |
| Overall Pit Slope Angle | degrees |
40 | 55 | Majority of the pit has a pit slope of 55 degrees. The areas with shallower angles are discussed in 16.1.3 |
| Process Cut-off Grade | oz/ton | 0.005 | 0.006 | The cut-off grades
vary depending on rock types |
Note – Feasibility costs from the 2012 study were reviewed and deemed to be still representative of mining costs and suitable for use in the 2014 pit optimization runs.
There are several constraints which affect the selection of a suitable pit shell as well as the mining sequence. These constraints are summarized as follows:
| • | Sufficient ore to fill the heap leach pad; | |
| • | Minimize waste rock quantities; | |
| • | Pit limits which fall within desired development boundaries; and |
The open pit designs completed for the updated feasibility seek to provide sufficient ore to fill the Phase 1 heap leach pad and provide opportunities for backfill and limited waste rock haul distances.
| 16.3 |
Pit Design |
Using the selected open pit shell limits, the final pit designs were created using the Pit Expansion tool in MineSight 3D following the pit slope guidelines discussed in Section 16.1.2. In addition to the geotechnical design parameters, operational parameters which were incorporated into the detailed open pit design are summarized in Table 16.5.
| February 2015 | 16-6 |
|
|
|
Soledad Mountain Project |
| Kern County, CA, USA | |
| Technical Report |
Table 16-5. Detailed Mine Design Parameters
| Design Parameter | Configuration | Comments |
| Haul road width - two way traffic | 80 ft | Includes berm + ditch / catch bench |
| Haul road width - one way traffic | 60 ft | Includes berm + ditch / catch bench |
| Bench height | 20 ft | Pit triple benched to 60 feet |
| Berm width | 22ft to 51ft | Vary by pit slope |
| Ramp grades | 10% maximum | |
| Berm heights | 4 ft | Based on 3/4 tire height |
| Ore and waste bank density | 1.95 ton/yd3 | |
| Waste loose density | 1.50 ton/yd3 | Based on 30% swell factor |
| 16.3.1 |
Haul Road Design |
The configuration of the Soledad Mountain project presents a particular challenge in terms of pit access due to the significant changes in elevation and steep slopes. Haul road designs have been based on a maximum truck dimension equivalent to a one hundred ton capacity rear dump haul truck (Komatsu HD785 or equivalent). Ramp grades have been specified at a maximum of 10%. Roads have been designed for two way haul truck traffic except for limited cases where road width is constrained by topography or at pit bottoms.
| 16.3.2 |
Ore / Waste Parameters |
Ore and waste rock bank density values were based on test work carried out on samples of rock from the site. Waste rock density was applied based on the tonnage factor included in the block model. A swell factor of 30% was selected as being typical for blasted and mined waste rock.
| 16.3.3 |
Dilution and Ore Loss |
Based on Norwest’s interpretation of the updated geology in discussion with MDA, it is deemed reasonable for purposes of assigning dilution to treat the ore zones as vein structures dominated by higher grade zones. There is a gradational boundary from high-grade to low-grade ore to waste rock but, in contrast with the previous (2012) geological model, this gradational zone or low-grade halo is much less pronounced. Given the open pit boundaries and more distinct ore body geometry, Norwest allowed for dilution in determining the ore reserve estimates.
| February 2015 | 16-7 |
|
|
|
Soledad Mountain Project |
| Kern County, CA, USA | |
| Technical Report |
The dilution quantity estimates were derived from a detailed review of the ore zones and adjacent blocks in discussion and agreement with the MDA QP. Based on the ore zone configuration and the equipment selected for mining, an average dilution of 2 ft (0.6 m) per contact was assumed. In addition, isolated blocks of ore where assumed to be mined as waste (ore loss) and isolated blocks of waste assumed to be mined as ore (dilution).
The dilution grade was determined by evaluating the average grades in the blocks adjacent to the ore zone.
An average dilution of 6.8% (approximately 3.4 million tons or 3.1 million tonnes) at a gold grade of 0.003 oz/ton (0.1 g/t), and a silver grade of 0.14 oz/ton (4.8 g/t) has been used. No additional ore loss is assumed beyond what is inherent in the model, assuming very good grade control and operational mine practices. As the Project evolves beyond the feasibility study, and operational experience is gained, these factors should be revisited and revised as necessary.
| 16.3.4 |
Ultimate Pit Boundaries |
The revised ultimate open pit boundaries are shown in Figure 16.1 with sections provided in Figure 16.2. These boundaries are based on the detailed pit shell limits selected which met the desired goal of finding sufficient ore to meet the capacity of the Phase 1 heap leach pad. The shell outlines have been adjusted to reflect mining constraints including access, geo-mining conditions, interaction between the various pit phases and the Approved Project Boundary. In general terms, the open pits are constrained mostly by the capacity of the Phase 1 heap leach pad, the Approved Project Boundary, the cut-off grade, back fill requirements and waste rock dump space. If any of those constraints were changed, the open pit designs could change significantly. In overall terms, the breakdown of waste placement in the current mine plan is as follows: 31% of waste remains in external storage (ex-pit), 52% is backfilled into the mined-out open pits, and 17% is projected to be moved off-site when sold as aggregate.
Table 16.6 provides the final open pit quantities. All of the ore within these open pits is classified as either Proven (7%) or Probable Reserves (93%). Further design optimizations contemplate additional in-pit ramp access in order to reduce haul distances which may result in minor increases to the waste quantities but will benefit the Project in terms of lower operating costs.
| February 2015 | 16-8 |
|
|
|
Soledad Mountain Project |
| Kern County, CA, USA | |
| Technical Report |
Table 16-6. Pit Quantities
| With Dilution Correction to match schedule ROUNDED | |||||||||
| Ore | Waste | Strip Ratio | |||||||
| YDS³ | Tons | Au Grade | Ag Grade | YDS | Tons | Tons/ | Total Au (oz) | Total Ag (oz) | |
| (oz/ton) | (oz/ton) | Tons | |||||||
| Northwest Pit | 966,000 | 1,888,000 | 0.0229 | 0.037 | 2,781,000 | 5,403,000 | 2.86 | 43,300 | 70,200 |
| East Pit | 9,113,000 | 17,812,000 | 0.0174 | 0.398 | 21,109,000 | 40,945,000 | 2.30 | 310,200 | 7,082,900 |
| Main Pit | 12,940,000 | 25,309,000 | 0.0216 | 0.325 | 52,196,000 | 101,394,000 | 4.01 | 547,200 | 8,231,600 |
| West Pit | 2,766,000 | 5,400,000 | 0.0133 | 0.171 | 11,878,000 | 23,075,000 | 4.27 | 71,600 | 921,700 |
| Mine totals | 25,785,000 | 50,409,000 | 0.0193 | 0.323 | 87,964,000 | 170,817,000 | 3.39 | 972,300 | 16,306,400 |
| Road Cuts | 330,000 | 644,000 | 0.0176 | 0.325 | 1,674,359 | 3,265,000 | 8.03 | 11,300 | 209,800 |
| Total | 26,115,000 | 51,053,000 | 0.0193 | 0.324 | 89,638,359 | 174,082,000 | 3.41 | 983,600 | 16,516,200 |
| 16.3.5 |
Discussion of Cut-off Grade Calculation |
A range of cut-off grades have been used in earlier feasibility studies as metal prices and modeling parameters were revised.
The relationship between these various values is explained as follows:
| • |
0.015 oz/ton (0.51 g/t) AuEq: Norwest used this grade for selected 2007 pit optimization runs in order to determine the sensitivity of the pit shells to a higher cut-off grade based on the 2007 metal prices, unit mining costs and recovery estimates. | |
| • |
0.007 oz/ton (0.24 g/t) AuEq: Norwest used this grade as the mining cut-off grade for the 2012 pit optimization runs including the pit shell that was selected for the base case. This cut-off value was calculated using the estimated cost inputs and mining inputs from the 2011 feasibility study. | |
| • |
0.004 oz/ton (0.14 g/t) AuEq: This cut-off value is used for the cut-off grade in the resource estimates (see MDA discussion). | |
| • |
The cut-off grades used for the reserve calculation vary by rock type as the different rock types have different recoveries. quartz latite ore has a cut-off grade of 0.005 oz/ton (0.17 g/t) AuEq while 0.006 oz/ton (0.21 g/t) AuEq is used for all other rock types. |
| 16.4 |
Production Schedule |
The mine production schedule developed for the Project is based on increasing ore output to full production levels at an achievable rate while also sequencing the open pits to allow for external waste placement and backfilling the mined-out phases of the open pits to limit the mine’s ultimate footprint.
| February 2015 | 16-9 |
|
|
|
Soledad Mountain Project |
| Kern County, CA, USA | |
| Technical Report |
A summary schedule of the ore and waste release for the Project life is shown in the Table 16.7. Figure 16.3 shows graphically the ore and waste tonnage on an annual basis over the 12 year life of the Project.
| February 2015 | 16-10 |
|
|
|
Soledad Mountain Project |
| Kern County, CA, USA | |
| Technical Report |
Table 16-7. Production Schedule
| Pre-
production |
Year 1 | Year 2 | Year 3 | Year 4 | Year 5 | Year 6 | Year 7 | Year 8 | Year 9 | Year 10 | Year 11 | Year 12 | Year 13 | Total
| |
| Ore tons | 39,883 | 2,752,563 | 3,954,497 | 5,119,001 | 5,097,549 | 4,658,489 | 4,231,549 | 4,067,451 | 4,334,898 | 4,783,631 | 4,782,542 | 4,915,127 | 2,316,038 | 0 | 51,053,219 |
| Waste tons | 710,117 | 8,247,437 | 14,295,503 | 14,733,481 | 16,902,451 | 19,341,511 | 19,768,451 | 18,397,846 | 15,665,102 | 15,102,115 | 14,195,206 | 12,654,488 | 4,068,161 | 0 | 174,081,868 |
| Au Contained in Ore (oz) | 711 | 57,096 | 83,466 | 102,943 | 97,716 | 71,507 | 83,178 | 108,799 | 120,957 | 81,565 | 72,398 | 76,597 | 26,689 | 0 | 983,624 |
| Ag Contained in Ore (oz | 4,254 | 480,754 | 965,689 | 1,958,280 | 2,708,452 | 1,415,149 | 1,313,610 | 1,367,479 | 1,644,606 | 1,834,658 | 1,594,153 | 959,760 | 269,381 | 0 | 16,516,225 |
| Total Au Produced (oz) | 0 | 37,070 | 63,364 | 81,037 | 83,127 | 63,964 | 67,221 | 84,650 | 96,782 | 73,358 | 60,574 | 61,592 | 30,175 | 4,537 | 807,451 |
| Total Ag Produced (oz) | 0 | 173,499 | 414,455 | 837,919 | 1,247,495 | 891,579 | 671,252 | 676,075 | 782,875 | 890,289 | 831,294 | 570,138 | 232,914 | 38,326 | 8,258,112 |
| Au Return (99.9%) | 0 | 37,033 | 63,300 | 80,956 | 83,044 | 63,900 | 67,154 | 84,565 | 96,685 | 73,285 | 60,513 | 61,531 | 30,145 | 4,533 | 806,644 |
| Ag Return (99.75%) | 0 | 173,066 | 413,419 | 835,824 | 1,244,377 | 889,350 | 669,573 | 674,385 | 780,918 | 888,064 | 829,216 | 568,713 | 232,332 | 38,230 | 8,237,467 |
| February 2015 | 16-11 |
|
|
|
Soledad Mountain Project |
| Kern County, CA, USA | |
| Technical Report |
| 16.4.1 |
Ore Release |
As shown in Table 16.7 and Figure 16.3, the ore production increases from approximately 2.7 million tons (2.5 million tonnes) during the first full year of production to the maximum production level of approximately 5.1 million tons (4.6 million tonnes) in Years 3 and 4. The production does not reach maximum capacity from Year 5 onwards and varies from a low of 4.1 million tons to a high of 4.9 million tons (4.4 million tonnes). Although ore production does not meet maximum capacity in some years, mining of higher grade ore in these periods with the resultant increase in contained metal ounces does somewhat offset the effect of the lower ore production.
The release of gold and silver over the Project life is shown in Table 16.7. The average gold produced over Years 2 to 11 is approximately 74,000 oz per year with maximum production of 99,000 oz in Year 8. The average silver produced is approximately 788,000 oz per year over this same period, with maximum production of 1.35 million oz of silver in Year 4.
| 16.4.2 |
Waste Rock Mining |
Table 16.7 shows the waste rock production schedule over the life of the mine. Waste rock mining ranges from a low of approximately 8.0 million tons (7.3 million tonnes) in Year 1 to a high of approximately 20 million tons (18 million tonnes) in Years 5 and 6.
The variation in the rate of waste rock mining is driven by a combination of factors. The current mine production schedule seeks to take advantage of the available ore processing capacity limit of approximately 5.1 million tons (4.6 million tonnes) per year especially during the initial five years of the Project. This results in a schedule with increasing waste rock stripping up to a peak combined ore and waste rock mining rate of 24 million tons (22 million tonnes) per year during the mid-years of the Project’s life followed by a gradual reduction in waste rock tonnages as the strip ratio in the final pits decreases. In addition the requirement to maximize backfill combined with the steep topography leads to a haulage distances that can vary dramatically from quarter to quarter. Taken together, these factors lead to a wide range of annual waste rock mining quantities and costs.
| 16.4.3 |
Pit Phasing and Backfilling |
The pit phasing has been developed with the intent of taking advantage of opportunities for pit backfill, shorter waste hauls and to allow for access to the various open pit phases. As noted previously, a focus of the mine plan was to maximize backfill opportunities in order to reduce future reclamation liabilities. Plans showing key points in the mining sequence are shown in Figures 16.4 through 16.16.
| February 2015 | 16-12 |
|
|
|
Soledad Mountain Project |
| Kern County, CA, USA | |
| Technical Report |
Pre-production mining is scheduled to start in the second quarter of 2015. There are three main types of schedule considerations: equipment, plant and access.
| • |
Equipment: Initially a development fleet is employed for road construction and preparation of the North-West pit area for pre-production mining starting in the second quarter of 2015. Two primary loader and truck fleets will be acquired sequentially at the end of the pre-production year and phased in to start work in Year 1. The hydraulic excavator and associated trucks are required in Year 3. | |
| • |
Plant: The crushing-screening plant and the Merrill-Crowe plant are scheduled to be commissioned in the fourth quarter of 2015 and to be available for full production at the start Year 1. Ore released from road construction and from the upper benches of the North-West open pit will therefore be stockpiled while the processing facilities are being constructed. This will entail rehandle of the stockpiled material once the processing facilities are commissioned. | |
| • |
Access: The steeply dipping topography and paired nature of the Main open pits provide scheduling constraints on open pit development. In the early years the open pits are mined simultaneously to simplify access as well as providing a shorter haul to the East Waste Rock Storage Pad and East open pit backfill. Open pit backfilling is a crucial component of the access to other open pits, since those backfills are often turned into haul roads. | |
| • |
Stockpile management: During periods of high ore production, throughput capacity of the crushing-screening plant presents a potential bottleneck in the ore handling system. Management of ore stockpiles during these periods will be required to ensure ore mining is not constrained and the equipment fleet can haul and feed ore to the crushing-plant efficiently. There is very limited area available to stockpile ore. |
| 16.5 |
Production Schedule |
The production schedule (Table 16.7) is developed from the mine phasing and other parameters as described above. The schedule includes the production from the access and haul road construction.
Year 0
During pre-production mining, the development fleet will be constructing pioneer roads and undertaking initial mining in the North-West open pit. The waste rock will go towards building a fill road to the East Pit area with the surplus waste dumped to the west of the North-West open pit.
| February 2015 | 16-13 |
|
|
|
Soledad Mountain Project |
| Kern County, CA, USA | |
| Technical Report |
Year 1
The development fleet begins constructing an access road to the top of Main and West open pits. During that time, the two primary fleets will be mining the North-West open pit, and the top of East open pit. The waste rock from the East open pit will all be hauled to build a pad for the aggregate handling facilities within the East Waste Rock Storage Pad footprint. Waste from North-West open pit, will be placed in the Phase 2 rock storage area. Mining in the North-West open pit is completed in Q3 and backfilling of the North-West open pit begins using initial waste from the Main open pit Phase 1.
Year 2
The two primary fleets will be mining in the East open pit and Main open pit Phase 1. Main open pit Phase 1 is completed in Year 2 and available for backfilling. The waste rock from the East Pit will be placed in the East Waste Rock Storage Pad and the waste rock from Main pit Phase 1 will be backfilled into North-West open pit and the West Dump. The development fleet will be used for construction of the Upper Main open pit and West open pit access
Year 3
The development fleet is used to construct the remaining part of the West open pit access and begin initial mining on the upper benches of the Main open pit. When the development fleet finishes constructing this access, it will switch over to general mining support. The hydraulic excavator and additional haul trucks arrive in Year 3 and with a loader fleet continue to mine the East open pit. The second loader fleet mines ore and waste rock in the Main open pit. The waste rock from East open pit is hauled to the East Waste Rock Storage Pad and the waste from Main open pit is backfilled into Main pit Phase 1 with the surplus placed in the West Dump. A south access linking the Main open pit to the East Waste Rock Pad is established. Planned aggregate production will begin this year, producing up to 351,000 tons (319,000 tonnes) annually of aggregate beyond the planned gold and silver production period.
| February 2015 | 16-14 |
|
|
|
Soledad Mountain Project |
| Kern County, CA, USA | |
| Technical Report |
Year 4
The mine fleets are ramping up to full production capacity by the end of Year 4. The primary fleets continue to mine at full capacity in East and Main open pits. All waste mined is placed externally in the East Waste Rock Storage Pad and the West dump. The development fleet is used for mine support.
Year 5
The peak production rate of 24 million tons (22 million tonnes) of ore and waste are achieved during Year 5. The primary fleet continues to mine in East open pit and Main open pit for most of the year. For the first half of the year, all the waste is placed either in the East Waste Rock Storage Pad or in the West dump. In the second half of the year, most of the waste rock is backfilled in the front portion of the East and Main open pits.
Year 6
The southern portion of the East open pit is mined using one of the loader fleets. The other loader and the excavator fleets continue to mine down the upper portions the Main open pit. The waste from the East and Main open pits is backfilled into the front portion of the mined out East pit. The extra material that cannot be backfilled will be placed into East Waste Rock Storage Pad. The East open pit is completed in Year 6, and the development fleet is used to mine the smaller benches in the bottom of the East open pit.
Year 7
The primary mining fleets are active in mining down the middle portion of the Main open pit. The waste mined in this year is backfilled into the back portion of the East open pit. Additional waste rock is placed in East Waste Rock Storage Pad. The development fleet is used for general mining support. The mining production tonnage for Year 7 is at 22.5 million tons (20.4 million tonnes) which is slightly lower than the peak mining rate in Year 5.
Year 8
The mining production decreases down to 20 million tons (18 million tonnes) in Year 8. The three primary fleets continue to mine down the middle portion of the Main open pit. Some waste produced in this year is backfilled into the East open pit; however, a majority of the waste rock is placed in the West dump and East Waste Rock Storage Pad.
| February 2015 | 16-15 |
|
|
|
Soledad Mountain Project |
| Kern County, CA, USA | |
| Technical Report |
Year 9
The primary mining fleets continue to mine down the middle portion of the Main open pit. The other primary loader fleet is used to mine down the West open pit. The majority of the waste rock is placed in the West Dump. A small amount of waste rock can be backfilled into the middle portion of the Main open pit when it is completely mined out.
Year 10
The annual production decreases to just under 19 million tons (17 million tonnes) of ore and waste rock in Year 10. One of the wheel loaders is decommissioned in this year, leaving only a single loader and the hydraulic excavator primary mining fleets. One primary mining fleet continues to mine down the West open pit, and the other fleet mines down Main open pit Phase 3 which is located on the east side of the West open pit. Waste rock from these two active pits is either backfilled into the Main open pit that is mined out in Year 9, or placed in the West Dump.
Year 11
The ore and waste rock mining rate is 17.6 million tons (16.0 million tonnes) in Year 11. The two primary mining fleets continue to mine the West open pit and Main open pit Phase 3. The Main open pit Phase 3 is mined out in Year 11. Once this pit is completed, the primary fleets mine down the southern part of the Main pit, which is the last mining phase. The waste rock mined in Year 11 is backfilled in the lower elevations of the front portion of the Main open pit. Only minor amounts of waste rock will be placed externally.
Year 12
The ore and waste mining rate is only 6.3 million tons (5.7 million tonnes) in Year 12 and this will be completed in six months. The remaining two primary mining fleets are used to mine out the southern part of the Main open pit. The waste rock mined in Year 12 is backfilled into Main open pit Phase 3 which was mined out in Year 11. The development fleet is used as a backup, and for sub-excavating ore from the final benches in the open pit.
| February 2015 | 16-16 |
|
|
|
Soledad Mountain Project |
| Kern County, CA, USA | |
| Technical Report |
| Post- | |
| operations |
Following the cessation of gold mining operations, the mine will move forward to a period where aggregate processing and sales will be the primary activity on site. As noted in the report, the current mine reclamation plan assumes the sale of processed waste rock and rinsed leach residues for a number of years. Rehandle of waste rock from the external waste rock storage pads will still be required to meet closure and reclamation requirements even if expected aggregate sales targets are met. It is expected that equipment from the primary fleet or of a similar capacity will be used to rehandle waste rock for backfill into the mined out open pits. |
| 16.6 |
Mining Equipment |
This section describes the mining equipment selected for the Project and reviews the operating parameters and assumptions which were used to estimate equipment productivities and unit requirements over the life of the mine. Equipment selection was based on Norwest’s current understanding of the pit geology and configuration, required production levels and mining constraints. The current production schedule and pit phasing requires the use of three primary equipment fleets with a smaller development fleet.
The primary fleets will be responsible for the main ore and waste rock mining and haulage once initial pit access and development work is completed. The smaller fleet for road building and initial bench development is required over most of the mine life as the multiple pit phases are developed.
| 16.6.1 |
Primary Mining Fleet |
The configuration and phasing of the pits requires that the primary loading equipment be mobile and flexible in terms of loading conditions. In addition, the equipment needs to have the capability to mine selectively in order to limit ore loss and dilution while still meeting production targets. With these considerations in mind, Norwest judged that front-end loaders (FEL) for flexibility combined with a hydraulic excavator in backhoe configuration for increased selectivity and production would best meet the Project requirements. A loader bucket capacity in the range of 14 cubic yards (11 cubic meters) would allow for sufficient production capacity and selectivity. In addition, a larger 16 cubic yard (12 cubic meter) bucket hydraulic excavator will be required to mine the large quantities of waste rock associated with a number of the larger open pit benches developed in the current mine plan. Based on this selection, the primary mining fleet has been configured as follows:
| February 2015 | 16-17 |
|
|
|
Soledad Mountain Project |
| Kern County, CA, USA | |
| Technical Report |
A fleet study was carried out by Komatsu and completed December 16, 2014. This study developed equipment productivity estimates for the primary mining fleets based on anticipated local mining conditions.
Primary Mining Fleet
| • | Loading: Front end loader 15 yd3 (11 m3) capacity (Komatsu WA800-3EO) | |
| • | Loading: Hydraulic excavator (Komatsu PC2000-8) 16 yd3 (12 m3) | |
| • | Haulage: 100 ton (90 t) capacity rear-dump truck (Komatsu HD785-7) | |
| • | Drilling: 6 ¾ inch (175 mm) diesel-powered (Atlas Copco DM45) |
The number of units required is shown in Table 16.8.
| 16.6.2 |
Development Fleet |
Initial mine production and development work is carried out solely by the smaller development fleet during Year 0 or the construction year. Once the primary fleet equipment is on site, the main role for the development fleet is the pioneering of access roads and mining of the smaller upper benches, and providing additional selective mining capacity in the smaller ore zones. The equipment for this fleet was selected based on its ability to work in tight conditions with limited digging room. In addition, the trucks would be required to operate on relatively narrow roads with higher gradients during initial development. However the development schedule also requires equipment which can achieve relatively high levels of production during some periods of the mine life. Based on these requirements, it was judged that a hydraulic excavator matched with articulated rear-dump haul trucks was suitable. The small drill would also be available for site utility work such as secondary blasting. The equipment fleet chosen to meet these requirements is shown below and the number of units shown in Table 16.8:
Development fleet
GQM LLC has purchased the following equipment for delivery in February and March 2015:
| February 2015 | 16-18 |
|
|
|
Soledad Mountain Project |
| Kern County, CA, USA | |
| Technical Report |
| • | Loading: Hydraulic excavator, 4.7 yd3 (3.5 m3) capacity (Komatsu PC800LC-8); | |
| • | Haulage: Articulated rear-dump truck, 40 ton (36 t) capacity (Komatsu HM400- 3); and | |
| • | Drilling: 4 ½ inch (11.4cm) dia. percussion drill (Atlas Copco FlexiROC 45T-10) |
| 16.6.3 |
Support Equipment |
Support equipment for the Project would be required for the following tasks:
| • | Clean-up and support for in-pit waste rock and ore loading; | |
| • | Movement of waste rock on dumps and resloping of dumps; | |
| • | Maintain haul roads; | |
| • | Work on benches; and | |
| • | Work on ore stockpiles |
The GQM LLC has purchased the following equipment for delivery in late 2014 and 2015:
| • | Track-type dozer (1) (Komatsu D275AX-5EO); | |
| • | Track-type dozer (1) (Komatsu D375A-6); | |
| • | Motor grader (1) (Komatsu GD655-5); | |
| • | Water wagon for dust control (1) (Komatsu HM400-2 with Mega tank); | |
| • | Wheel dozer (1) (Komatsu WD600-3); | |
| • | Front end loader/forklift (CAT 924K with bucket and forks); | |
| • | Backhoe/Loader (1) (Cat 420E); and | |
| • | A range of maintenance vehicles. |
Additional equipment will be added as the mine expands.
| February 2015 | 16-19 |
|
|
|
Soledad Mountain Project |
| Kern County, CA, USA | |
| Technical Report |
Table 16-8. List of Mining Equipment
| Equipment | Number of units | |
Primary Fleet |
Wheel Loaders (15 yd3)
Excavator (16 yd3) Trucks (100 tons) |
2 1 11 - 15 |
|
Development |
Excavator (5yd3)
Trucks (40 tons) |
1 3* |
Support Equipment |
Track-Type dozer (452 hp)
Track-Type dozer (610 hp) Wheeled Dozer (522 hp) Primary drill (9.75 inch) Percussion Drill (3-4 inch) |
1 1 1 2 1 |
| 16.7 |
Blasting and Explosives |
The new security requirements that were introduced to combat the threat of terrorist activities in the United States make contract blasting the preferred option and a contract blaster will be used. There are several suppliers in the region capable of meeting the requirements of the project. Alpha Explosives Inc. (“Alpha”), a Dyno Nobel distributor based in Mojave, and Maxam North America based in Salt Lake City have both made full-service proposals.
Based on the available groundwater data, blastholes are expected to be dry through the life of the mine and only ANFO will be used as a blasting agent. A powder factor of 0.36 lb/ton or 0.71 lb/yd3 (0.18 kg/t or 0.42 kg/m3) was used to estimate explosives consumption.
Alpha prices are effective January 2015. The full-service price on the basis of one blast every day is $0.175/ton ($0.159/tonne) of ore and waste rock. This assumes that Alpha provides labor for stemming blast holes and this could be done at a lower cost by the mine helpers.
Alpha provides service to a number of mines and quarries in the area and has a bulk storage facility for ammonium nitrate prill in Mojave. Alpha also receives prill by rail and this is a key consideration in dealing with a local supplier as moving freight by rail is more energy efficient than moving the same quantity of prill by truck on the highway. This is reflected in the above price.
| February 2015 | 16-20 |
|
|
|
Soledad Mountain Project |
| Kern County, CA, USA | |
| Technical Report |
| 16.8 |
Site Drainage |
Golder prepared a site drainage plan for the Project dated March 8, 2012 and this was included as Appendix 5 in the revised Report of Waste Discharge prepared for the Lahontan Regional Water Quality Control Board (GQM, 2012). This is the fourth update of the site drainage plan prepared by Golder for the Project and addresses site drainage as it applies to the open pit operation. The underlying engineering assumptions meet the requirements of the California State Water Resources Control Board and the Kern County Engineering, Surveying & Permit Services Department. A Stage I, Surface Water, Sediment and Erosion Control Plan has been prepared for the construction and early mining phases of the Project.
The site drainage plan can quickly be revised as open pit designs change and this will include detailed designs for sediment ponds and drainage channels as required.
Storm Water discharges will be regulated by the Water Board under the State’s NPDES General Construction Storm Water Permit during the initial construction phase of the Project and under the NPDES General Industrial Storm Water Permit during mine operations. Refer to Section 21.1.2 for additional information.
| February 2015 | 16-21 |
|
|
|
Soledad Mountain Project |
| Kern County, CA, USA | |
| Technical Report |
Figure 16-1. Ultimate Pit Limits
![]()
| February 2015 | 16-22 |
|
|
|
Soledad Mountain Project |
| Kern County, CA, USA | |
| Technical Report |
Figure 16-2. Ultimate Pit Sections
![]()
| February 2015 | 16-23 |
|
|
|
Soledad Mountain Project |
| Kern County, CA, USA | |
| Technical Report |
Figure 16-3. Production Schedule
![]()
| February 2015 | 16-24 |
|
|
|
Soledad Mountain Project |
| Kern County, CA, USA | |
| Technical Report |
Figure 16-4. Pit Layout, Year 0, 4th Quarter
![]()
| February 2015 | 16-25 |
|
|
|
Soledad Mountain Project |
| Kern County, CA, USA | |
| Technical Report |
Figure 16-5. Pit Layout, Year 1, 4th Quarter
![]()
| February 2015 | 16-26 |
|
|
|
Soledad Mountain Project |
| Kern County, CA, USA | |
| Technical Report |
Figure 16-6. Pit Layout, Year 2, 4th Quarter
![]()
| February 2015 | 16-27 |
|
|
|
Soledad Mountain Project |
| Kern County, CA, USA | |
| Technical Report |
Figure 16-7. Pit Layout, Year 3, 3rd Quarter
![]()
| February 2015 | 16-28 |
|
|
|
Soledad Mountain Project |
| Kern County, CA, USA | |
| Technical Report |
Figure 16-8. Pit Layout, Year 4, 2nd Quarter
![]()
| February 2015 | 16-29 |
|
|
|
Soledad Mountain Project |
| Kern County, CA, USA | |
| Technical Report |
Figure 16-9. Pit Layout, Year 5, 2nd Quarter
![]()
| February 2015 | 16-30 |
|
|
|
Soledad Mountain Project |
| Kern County, CA, USA | |
| Technical Report |
Figure 16-10. Pit Layout, Year 6, 3rd Quarter
![]()
| February 2015 | 16-31 |
|
|
|
Soledad Mountain Project |
| Kern County, CA, USA | |
| Technical Report |
Figure 16-11. Pit Layout, Year 7, 3rd Quarter
![]()
| February 2015 | 16-32 |
|
|
|
Soledad Mountain Project |
| Kern County, CA, USA | |
| Technical Report |
Figure 16-12. Pit Layout, Year 8, 3rd Quarter
![]()
| February 2015 | 16-33 |
|
|
|
Soledad Mountain Project |
| Kern County, CA, USA | |
| Technical Report |
Figure 16-13. Pit Layout, Year 9, 2nd Quarter
![]()
| February 2015 | 16-34 |
|
|
|
Soledad Mountain Project |
| Kern County, CA, USA | |
| Technical Report |
Figure 16-14. Pit Layout, Year 10, 4th Quarter
![]()
| February 2015 | 16-35 |
|
|
|
Soledad Mountain Project |
| Kern County, CA, USA | |
| Technical Report |
Figure 16-15. Pit Layout, Year 11, 3rd Quarter
![]()
| February 2015 | 16-36 |
|
|
|
Soledad Mountain Project |
| Kern County, CA, USA | |
| Technical Report |
Figure 16-16. Pit Layout, Year 12, 2nd Quarter
![]()
| February 2015 | 16-37 |
|
|
|
Soledad Mountain Project |
| Kern County, CA, USA | |
| Technical Report |
| 17.0 |
RECOVERY METHODS |
| 17.1 |
Ore Handling, Crushing and Screening |
| 17.1.1 |
Ore Handling Overview |
Run-of-mine ore will be delivered to the crushing-screening plant located south of the Phase 1 heap leach pad. The crushing-screening plant consists of a three-stage crush with an HPGR for the tertiary stage. A crushing-screening plant flow sheet is shown in Figure 17-1.
Ore will be fed directly to the primary crusher when possible; otherwise the ore will be stockpiled adjacent to the primary crusher or in temporary stockpiles within or adjacent to the open pits. When ore is not being mined, a front-end loader will reclaim ore from the stockpile and feed it to the primary crusher.
Crushed ore will be conveyed to a coarse ore stockpile. This will allow a more steady flow to the primary screen and secondary crusher and the HPGR. The HPGR discharge will be conveyed to an agglomeration drum and then conveyed by overland conveyor and a series of grass-hopper conveyors to a stacker and placed on the heap leach pad.
| 17.2 |
Crushing and Screening |
The crusher settings and screen openings may be adjusted from those given in the following paragraphs during operations depending upon the type of ore being crushed which will be confirmed by an ongoing metallurgical test program.
| 17.2.1 |
Crushing-Screening Plant |
Turn-Key Processing Solutions, LLC (“TPS”) and Management have completed a detailed design of the crushing-screening plant for construction and this is shown in plan view in Figure 17-2.
| February 2015 | 17-1 |
|
|
|
Soledad Mountain Project |
| Kern County, CA, USA | |
| Technical Report |
Figure 17-1. Crushing Plant Flowsheet
![]()
| February 2015 | 17-2 |
|
|
|
Soledad Mountain Project |
| Kern County, CA, USA | |
| Technical Report |
Figure 17-2. Crushing Plant Layout
![]()
| February 2015 | 17-3 |
|
|
|
Soledad Mountain Project |
| Kern County, CA, USA | |
| Technical Report |
Allowance has been made in the design of the crushing-screening plant for two seven-day shutdowns per year to replace the HPGR tires. This therefore allows for 351 operating days and 7,160 h/y. The mechanical availability of the HPGR is expected to be > 95%. The assumed overall availability for the crushing-screening plant is only 81.7% and this can be achieved with standard maintenance practices.
The primary crusher will not be operating once the coarse ore stockpile is full, e.g. when the crushing-screening plant is down for maintenance. The maximum feed rate to the primary crusher is 880 ton/h (800 t/h). The required feed rate to the primary crusher based upon a design throughput of 5,119,000 ton/year (4,654,000 t/year) and 18 hours of crushing per day for 351 d/year is 811 ton/h (737 t/h). The number of operating hours available for the primary crusher is 6,318 h/y.
Two hours will be required per crushing-screening plant operating day for heap conveyor and stacker moves - estimated at 597 h/year. Major conveyor and stacker moves will be scheduled to coincide with downtime in the crushing-screening plant for maintenance. The number of operating hours available for the heap conveyors and stacker is 6,563 h/year.
The following are the key design and operating parameters:
Table 17-1. Key Crushing Design and Operating Parameters
| Crushing Parameter | Unit | Value |
| Available hours in a full year of production | h | 8,760 |
| Operating time for the primary crusher and coarse ore conveyors | h/year | 6,318 |
| Overall availability of the primary crusher | % | 72.1 |
| Design feed rate to the process | ton/h | 715 |
| Operating time for the crushing-screening plant | h/year | 7,160 |
| Overall availability of the crushing-screening plant | % | 81.7 |
| Operating time for the conveyors and stacker | h/year | 6,563 |
| Overall availability of the conveyors and stacker | % | 74.9 |
The average ore mining rate based upon 351 days of mining per year is 14,600 ton/d (13,300 t/d) or 5.12 million tons (4.65 million tonnes) of ore per year and that is the rate used for the design and quote for construction by TPS.
In years of higher ore production, it should be possible to increase the throughput of the plant by adjusting the plant operating parameters.
The following sub-sections detail the key components of the plant.
| February 2015 | 17-4 |
|
|
|
Soledad Mountain Project |
| Kern County, CA, USA | |
| Technical Report |
| 17.2.1.1 |
Primary Crusher Station |
Run-of mine ore will be delivered to a dump hopper with a capacity of 220 ton (200 t). The dump hopper will be fitted with fine mist sprays to suppress dust. The dump hopper will also have a canopy sufficiently large to permit truck access and to contain dust when ore is dumped.
The ore will be withdrawn from the dump hopper by a variable speed, vibrating grizzly feeder. Oversize ore will be fed to a jaw crusher. Oversize rock will be broken with rock pick mounted on an excavator in the open pits. Any timber and/or miscellaneous steel will also be sorted out in the open pits prior to transport to the crusher.
Grizzly undersize and jaw crusher product will be conveyed to a coarse ore stockpile.
| 17.2.1.2 |
Coarse Ore Stockpile |
The coarse ore stockpile has a live capacity of 10,000 ton (9,072 t) which provides feed for three quarters of daily throughput.
| 17.2.1.3 |
Coarse Ore Feeders |
Ore will be fed to the primary screen by three Syntron-type vibratory feeders located in the reclaim tunnel. The number of feeders has been selected to ensure adequate live capacity in the coarse ore stockpile. Access to the feeders under the coarse ore stockpile is available from two directions for maintenance and cleanup.
| 17.2.1.4 |
Primary Screen |
The secondary crushing stage, which includes the primary screen and the cone crusher, has been specifically designed to prepare the feed for the HPGR. A single screen will be required and this will operate in closed circuit with the cone crusher. The screen undersize is minus 1 ¼ inch (32 mm) and this will be the HPGR feed.
The primary screen is being supplied by Linatex and the feed chute was designed to ensure good distribution of the feed across the width of the screen. The screen has also been specified with a dust enclosure. Consistent feed with no oversize is key to a long life of the HPGR tires.
| February 2015 | 17-5 |
|
|
|
Soledad Mountain Project |
| Kern County, CA, USA | |
| Technical Report |
| 17.2.1.5 |
Secondary Crusher |
A single cone crusher will be required as a secondary crusher. Analysis completed by Sandvik Mining (“Sandvik”) shows that the model CH660 cone crusher can do the duty and has therefore been selected for the Project.
| 17.2.1.6 |
Fine Ore Bin |
The screen undersize will be conveyed to a fine ore bin with a capacity of 400 ton (363 t). The fine ore bin has been increased in size from 220 ton (200 t) for optimum feed control to the HPGR. Ore will be drawn from the fine ore bin by a belt feeder that will convey the feed directly to the HPGR.
| 17.2.1.7 |
Binder Addition |
Normal Portland Type 2 cement will be added as a binder to the feed ahead of the agglomeration drum.
| 17.2.1.8 |
HPGR |
The layout considerations for the HPGR were an important element in the overall layout of the plant and this was done in extensive consultation with ThyssenKrupp Industrial Solutions (USA), Inc. (formerly “Polysius”), hereinafter called TKIS (USA). TKIS (USA) has designed and will provide the feed hopper for the HPGR to minimize the risk of segregation.
| 17.2.1.9 |
Weightometers |
A total of five weightometers will be installed throughout the system to provide maximum operating control and to record the total throughput.
| 17.2.1.10 |
Self-cleaning Magnets |
Self-cleaning magnets, stationary magnets, metal detectors and MARS systems will be installed to protect the entire system.
| February 2015 | 17-6 |
|
|
|
Soledad Mountain Project |
| Kern County, CA, USA | |
| Technical Report |
| 17.2.2 |
Description of the HPGR |
Assessments carried out by TKIS (USA) and a GQM LLC internal review has shown the indicated benefits of using the HPGR include:
| • | Higher gold and silver recoveries due to the formation of micro-cracks in ore particles; | |
| • | Faster gold and silver extraction rates; | |
| • | Stronger agglomerates due to a more favourable overall particle size distribution and this will also impact the flow rate of solutions through the heap; | |
| • | Substantially lower capital costs than a four-stage, conventional crushing- screening plant; | |
| • | Manageable dust control with fewer transfer points; | |
| • | Lower energy consumption and thus lower operating costs; and | |
| • | Circuit flexibility that will readily permit future upgrades such as a finer HPGR feed size or the recycle of edge product. |
The HPGR consists basically of two counter-rotating rolls – one a fixed roll and the other a ‘floating’ roll. The ‘floating’ roll is mounted on and can move freely on two slides and the grinding forces are applied by four hydraulic rams. Ore is choke-fed to the gap between the rolls and comminution takes place by inter-particle crushing in the bed of particles. The gap between the rolls is determined by the nip-in characteristics of the feed and the total grinding force applied, which in turn depends upon the pressures in the hydraulic system. Each roll is driven by an electric motor via a planetary gear reducer.
The total grinding force can range from 169k lbf to 4500k lbf (750 kN to 20,000 kN) and pressures in the gap can range from approximately 7,000 lb/in2 (50 MPa) to 36,000 lb/in2 (250 MPa). The unconfined compressive strengths of Soledad Mountain ores range from 320 lb/in2 to 17,200 lb/in2 (2.2 MPa to 118.9 MPa) by comparison.
Comminution in the HPGR is achieved without impact and essentially without attrition of the wear protection on the surface of the rolls.
The HPGR is an energy efficient comminution device and power consumption will be lower than power consumption projected in the 1990s.
The following are the HPGR technical specifications for the Project:
| February 2015 | 17-7 |
|
|
|
Soledad Mountain Project |
| Kern County, CA, USA | |
| Technical Report |
Table 17-2. HPGR Technical Specifications
| Parameter | Units | Polysius Value |
| Model No. | POLYCOM 17/12-5 | |
| Diameter of rolls (D) | in (mm) | 68.5 (1,740) |
| Width of rolls (W) | in (mm) | 47.2 (1,200) |
| Aspect Ratio | W/D | 0.67 |
| Required Throughput (dry) | ton/h (t/h) | 715 (650) |
| Design Throughput (wet) | ton/h (t/h) | 825 (750) |
| Maximum Recycle | % | 13 |
| Maximum Recycle (wet) | ton/h (t/h) | 110 (100) |
| Design Specific Press Force | psi (N/mm2) | 722 (4.98) |
| Operating Specific Press Force | psi (N/mm2) | 653 (4.5) |
| Specific Throughput (Wet Basis) | ts/hm3 | 230 |
| Specific Energy Input | kW.h/t | Maximum Available 2.67 |
| Product Size | 70% < 6mm | |
| Roll Speed | rpm | 20 |
| Circumferential Speed | ft/s (m/s) | 6.0 (1.82) |
| Feed Moisture Content | % | Range from 3% to 5% |
| Feed Size, 100% Passing | in (mm) | 1- 3/8 (35) |
| Drive Train | ||
| Motor Size (2 Required) | hp (kW) | 1,250 (933) |
| Motor Speed (Nominal) | rpm | 1,200 |
| Gear Reducer | Planetary Gear Reducer | |
| Roller Bearings | Self-aligning Roller Bearings | |
| Roller Bearing Lubrication | Grease-lubricated Bearings | |
| Tires | ||
| Wear Life of Tires | h | 5,000 |
Further details of the HPGR unit can be found in the documentation provided by TKIS (USA) (see reference section for further information).
| 17.2.3 |
Sampler |
A cross-belt sampler will be installed on the HPGR product conveyor. The HPGR product will be sampled on a frequent basis to provide ore grade information and the information required to monitor the performance of the HPGR:
| • | HPGR product particle size distribution; | |
| • | HPGR product moisture content; and | |
| • | Gold and silver head grades. |
| February 2015 | 17-8 |
|
|
|
Soledad Mountain Project |
| Kern County, CA, USA | |
| Technical Report |
| 17.2.4 |
Construction and Commissioning of the Crushing-Screening Plant |
TPS has provided a quotation for supply and construction of the crushing-screening plant as a turn-key project.
The crushing-screening plant is a relatively simple plant and it is expected that it can be commissioned by the operators with the assistance of TPS, equipment suppliers and specifically TKIS (USA). An allowance for this support has been included in the capital cost estimates.
| 17.2.5 |
Manpower Required |
Management will consist of one Manager – Plant Operations who will work 8 h/d for 5 d/week. The operating crew will consist of four plant operations foremen and four primary crusher operators, four crushing-screening plant operators and four helpers who will work a continuous shift schedule.
A shift crew of four heap leach operators will work a continuous shift schedule. The heap leach operator will control the operation of the stacker and conveyors on shift. The heap leach operator will be assisted on day shift by a utility loader/forklift/Hiab operator and a helper to move conveyors and pipe and drip emitters and generally manage the operation of the heap. These two operators per shift or a total of eight operators will work a continuous shift schedule.
| 17.2.6 |
HPGR Technical |
TKIS (USA) has done a detailed design of the commercial HPGR, which will have the ability to operate with a specific press force of 609 psi (4.2 N/mm2) as the key operating parameter. The projected recoveries are based on an operating Specific Press Force of 580 psi (4.0 N/mm2) for pyroclastics and quartz latite and 609 psi (4.2 N/mm2) for rhyolite.
The following are comments on operating parameters:
| 17.2.6.1 |
Specific Press Force |
A detailed analysis of the recoveries obtained in HPGR-based column leach tests shows that tails and recoveries are affected by specific press force. A higher specific press force gives a finer overall particle size distribution and leads to a greater density of micro-cracks and this will directly affect tails and thus recoveries. The conclusion is that the specific press force is the determining operating parameter in an application of the HPGR as the comminution equipment.
| February 2015 | 17-9 |
|
|
|
Soledad Mountain Project |
| Kern County, CA, USA | |
| Technical Report |
| 17.2.6.2 |
Particle Size Distribution |
The importance of particle size distribution and the proportion of fine material in the HPGR product must be emphasized and systematic sampling and screen analysis will be required to check this. It is expected that target particle size distributions will be developed for various ore types and this will be one way of controlling the commercial operation on a day-to-day basis. A tails target for gold can also be calculated from the tails analysis and this can be set as the key check on the overall performance of the system.
The actual plant throughput will be determined by the following:
| • | Fragmentation achieved in the open pit; | |
| • | Vibrating grizzly feeder bar spacing - tapered bar spacing 6 in to 4 in (150 mm to 100 mm) and this will determine the proportion of feed bypassing the jaw crusher; | |
| • | The closed side setting (CSS) of the primary jaw crusher – 6 in (150 mm); | |
| • | The CSS of the cone crusher – 7/8 inch (22 mm) for the CH660 crusher; | |
| • | The screen undersize – 100 % - 1 inch (32 mm); | |
| • | The HPGR settings such as the specific press force and | |
| • | The ‘Mine to Mill’ concept will be used. |
The crushing-screening circuit has considerable flexibility built into it and the settings may differ for the different ore types and this will yield better results than a traditional circuit with vertical shaft impact crushers and screens to size the ore. Adjustments can be made in various settings as required based upon operating experience for optimum leach performance.
| 17.2.6.3 |
Recycle Of Edge Product |
Indications are that finer particle size distributions and thus higher recoveries can be obtained for rhyolite if, for example, a specific press force of 653 psi (4.5 N/mm2) is combined with a 15% edge product recycle. The recycle of edge product has not been included in the plant as presently designed. Allowance has however been made for an edge recycle in the layout and design of the HPGR footings.
Considerations that were made relating to the decision to not include edge product recycle in the initial crushing-screening plant include:
| • | Simpler circuit layout and therefore lower construction and operating costs; |
| February 2015 | 17-10 |
|
|
|
Soledad Mountain Project |
| Kern County, CA, USA | |
| Technical Report |
| • | Less risk of particle segregation; | |
| • | Less risk of stray metal in the circuit; and | |
| • | Reduced requirement for dust control as two transfer points can be eliminated. |
The contribution an edge recycle can make to overall recoveries should, however, not be ignored and this will be more important at higher gold and silver prices and essentially fixed operating costs. External reviewers have also noted that the edge effect could be more pronounced in a commercial operation. It was therefore prudent to allow for an edge recycle in the layout and the design of the crushing-screening plant. The equipment will however not be purchased during the initial construction. The plant and the HPGR can be commissioned to gain some operating experience. Also, some very quick and early tests can be done to determine the particle size distribution produced by the commercial unit and this will give an indication of recoveries that can be expected. The decision can then be made on the edge recycle and with only limited lost benefits. A total retrofit could, on the other hand, be very expensive to develop and install.
| 17.2.6.4 |
HPGR Feed Size |
Indications are that a 15% edge recycle has the same effect as reducing the HPGR feed size from 100% - 1 inch (32 mm) to 100% - 1 inch (25 mm). Reducing the HPGR feed size may have a greater affect at the coarser particle sizes and this may be the preferred approach in a commercial operation rather than adding additional material at the finer particle sizes, as would be the case with an edge product recycle.
Discussions with Sandvik show that there is adequate capacity to reduce the particle size distribution of the cone crusher discharge by changing the closed side setting.
The decision to reduce the HPGR feed size can again be deferred until a detailed analysis can be made on the basis of actual performance after the start of production.
Both options described above can however be introduced with minimal changes in the crushing-screening plant configuration. These considerations must be balanced against the need for a stable heap and acceptable solution percolation rates.
| 17.2.6.5 |
Moisture Content |
It may be necessary to add moisture to achieve a minimum moisture content of greater than 3% to the HPGR feed to ensure that a competent autogeneous layer is formed and maintained between the studs on the rolls. A moisture content ranging from 4% to 5% is the likely optimum based upon recommendations made by TKIS (USA).
| February 2015 | 17-11 |
|
|
|
Soledad Mountain Project |
| Kern County, CA, USA | |
| Technical Report |
| 17.3 |
Merrill-Crowe Circuit |
| 17.3.1 |
The Merrill-Crowe Process |
Gold and silver are typically recovered by dissolution in a dilute sodium cyanide solution and then by precipitation with zinc or adsorption on activated carbon. The zinc precipitation process, referred to as the Merrill-Crowe process after its developers, is used to recover gold and silver when the silver to gold ratio is greater than 10:1. This ratio is expected to average 10:1 for the Project (range 5:1 to 15:1) and ratios greater than 30:1 were noted in test work. The Merrill-Crowe process is well established and the process is highly efficient.
In the Merrill-Crowe process, suspended solids and dissolved oxygen must first be removed from the pregnant solution. Clarifying filters are used to remove the suspended solids to less than 1 ppm. A vacuum tower is used to remove dissolved oxygen from the clarified solution. Zinc dust is metered into the deaerated solution and combines with the gold and silver cyanide complexes in a rapid, cementation-type reaction and precipitated as micron-sized particles of metallic gold and silver.
After precipitation, the solution is pumped to plate and frame filter presses where the gold and silver precipitates are removed. These filter presses are located in the refinery and this is where all subsequent processing takes place. As with gold and silver, any mercury present in the pregnant solution is also precipitated. The precipitate is removed manually from the filter presses, placed in retort pans and these are loaded in a mercury retort. The precipitate is heated to the point where any mercury that is present will be converted to mercury vapors. The mercury retort operates under a vacuum. Water and mercury vapors are drawn through a water-cooled condenser and a mercury trap and any mercury is finally collected in bottles for disposal.
The condensed mercury retort off gas stream requires additional cleaning before being discharged to the atmosphere. A carbon adsorber that uses sulfur-impregnated carbon can typically remove 99.99% of residual mercury from the condenser gas stream.
The dried precipitate is mixed with selected fluxes, typically silica, borax and soda ash, sodium nitrate and melted in an induction furnace. When melted, these fluxes form a slag. The slag is cooled and crushed and occluded particles of gold and silver are recovered by gravity for further processing. The molten mix of gold and silver, i.e. the doré, is poured into a series of cascading molds. Doré is cooled, cleaned and shipped to a commercial refinery where gold and silver bullion are produced for final sale.
| February 2015 | 17-12 |
|
|
|
Soledad Mountain Project |
| Kern County, CA, USA | |
| Technical Report |
The barren solution is pumped to the barren solution tank and is returned to the heap.
| 17.3.2 |
The Merrill-Crowe Plant |
Kappes, Cassiday & Associates (“KCA”) has completed detailed designs and prepared a construction cost proposal for the Merrill-Crowe plant.
The plant has been designed for a pregnant solution flow rate of 2,740 gpm (623 m3/h). The flow rate was increased from 1,980 gpm (450 m3/h) as recommended by KCA as part of a review of the process parameters by KCA in September 2013.
Provisions have been made in the design of the plant for containment of processing solutions.
The mercury retort in the Merrill-Crowe plant is required for environmental control and is required by the Conditional Use Permits issued by Kern County and the Authority to Construct Permits issued by the Eastern Kern Air Pollution Control District. The mercury retort off gas stream flows to a sulfur-impregnated carbon bed scrubber for final emissions control. The melting furnace off gas stream flows via a collection hood to a wet scrubber and then to a sulfur-impregnated carbon bed scrubber for final emissions control.
The plan view of the Merrill-Crowe plant is shown in Figure 17-3. Ready access for the bulk delivery of reagents is a key item and this has been allowed for in the layout of the site access road to the plant.
GQM LLC has made allowance for security on site 24 hours per day and seven days per week in the operating costs.
| 17.3.3 |
Construction of the Pump Box |
The detailed design of the pump box and the pump box liner system has been completed. Guinn Corporation provided a quote for the construction of the pump-box and is now proceeding with the construction. Construction will be completed in March 2015.
| February 2015 | 17-13 |
|
|
|
Soledad Mountain Project |
| Kern County, CA, USA | |
| Technical Report |
Figure 17-3. Merrill -Crowe Plant Layout
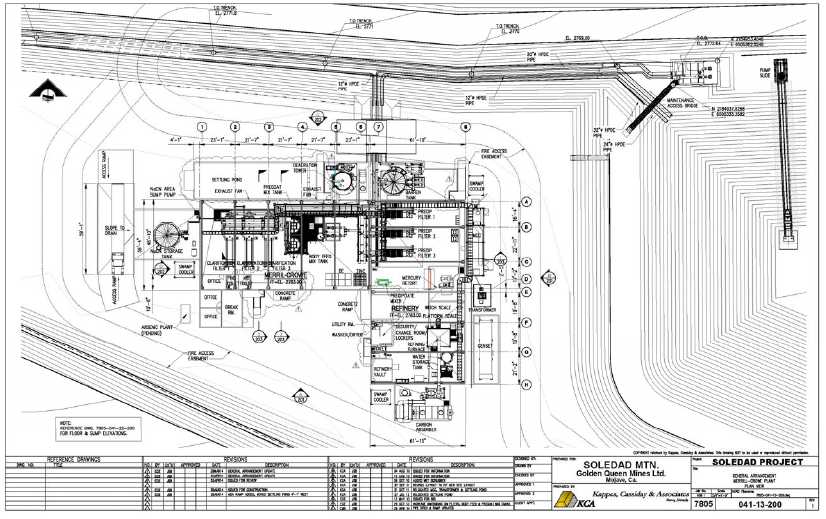
| February 2015 | 17-14 |
|
|
|
Soledad Mountain Project |
| Kern County, CA, USA | |
| Technical Report |
| 17.3.4 |
Construction of the Merrill-Crowe Plant |
Site preparation of the area where the Merrill-Crowe plant was completed in October 2014.
The Merrill-Crowe plant will be constructed by KCA on a turn-key basis.
KCA sub-contractors will erect the equipment and do the electrical installation. KCA will be responsible for the project and will provide all necessary on-site management support.
The Merrill-Crowe plant building, building foundations and building services will be constructed by Gary Little Construction, Inc. The Merrill-Crowe plant building will be constructed as a turnkey project and GQM LLC has entered into a contract with Gary Little Construction, Inc. for the construction of the building.
The schedule prepared by KCA shows that construction can be completed in nine months in 2015 with commissioning of the heap leach facility and the Merrill-Crowe plant in the fourth quarter of 2015. This timeline meets the overall Project schedule.
| 17.3.5 |
Delivery of Reagents and Use of Reagents |
The following is a list of the reagents that will be used with indicated rates of use:
Cyanide
The cyanide will be delivered as a 30% aqueous solution with a pH of 12.5 in a tanker truck directly from the producer’s plant in Nevada. The contained weight of sodium-cyanide (NaCN) in solution will be approximately 15,000 lb (6,800 kg) per load. The cyanide solution will be transferred to a 45,000 gal (175 m3) storage tank on site. The producer will supply and install a complete handling and storage system and this will include telemetry for a managed inventory.
The bulk of the cyanide will be added to the barren solution to adjust the cyanide concentration. Smaller quantities of cyanide will be added to the clarified pregnant solution to aid in zinc cementation as well as to the recycled intermediate solution on the heap. Estimated consumption is 0.39 lb/ton (0.195 kg/t) of ore on the heap.
| February 2015 | 17-15 |
|
|
|
Soledad Mountain Project |
| Kern County, CA, USA | |
| Technical Report |
Zinc Dust
Zinc dust in the form of Merrillite or equivalent will be added as a dry powder to the zinc cone just downstream of the deaeration tower. Estimated consumption is 1.0 oz zinc /oz of combined gold plus silver in the pregnant solution.
Lead Nitrate
Lead nitrate will be added to the leach solution only if required. If required, lead nitrate would be added to the pregnant solution tank to precipitate soluble sulfides ahead of the clarifiers and zinc precipitation or to the zinc cone to enhance the effectiveness of the zinc dust.
If needed, it is estimated that the quantity of lead nitrate would be in the range of 10% to 15% of the weight of zinc used.
Antiscalant
Carbonates and some sulfates will precipitate in pipes and pumps. Antiscalants will prevent or minimize the formation of such scale. The supplier of antiscalants will typically provide metering systems for adding the liquid antiscalant at a typical rate of 3 ppm to the various solution pump intakes.
Diatomaceous Earth
Diatomaceous earth (“DE”) will be used as a precoat on filters and as body feed. DE will be delivered in 50 lb (22 kg) bags on pallets. DE will be slurried and pumped to clarifiers, the precipitation presses or the zinc cone as required.
The estimated consumption is 2,283 lb/day (1,038 kg/day) at full production only.
Binder
Normal Portland cement will be used as a binder and to provide protective alkalinity in the heaped ore. Local suppliers exist and the cement will be delivered and stored on site.
Estimated consumption is 9.0 lb/ton (4.5 kg/t) of ore on the heap. The estimated consumption was increased from 8 lb/ton (4 kg/t), a recommendation by KCA as part of a review of the process parameters conducted by KCA in December 2014.
| February 2015 | 17-16 |
|
|
|
Soledad Mountain Project |
| Kern County, CA, USA | |
| Technical Report |
| 17.3.5.1 |
Cyanide Consumption |
The most recent estimate of cyanide consumption of 0.37 lb/ton (0.185 kg/t) of ore was made by Herb Osborne, independent metallurgical consultant, in 2005. The data collected since the 2005 work suggests that the consumption may be slightly higher than this estimate. Test work during the past three years was examined by Paul Chamberlin, independent metallurgical consultant. Bottle roll tests, as performed by McClelland Laboratories, give a fairly good estimate of cyanide consumption in commercial scale operations. Based on bottle roll tests during the past three years, the average consumption was 0.50 lb/ton (0.25 kg/t). The cyanide consumption in column tests is always much higher than in commercial operations, generally three to four times as high. Consumption is nearly proportional to the column leach time. Typically a 60-day column leach time is the norm. Reviewing the column tests from the past three years and reducing the consumption to that of a 60-day test indicates an average consumption of 0.39 lb/ton (0.195 kg/t).
For the feasibility study, the cyanide consumption is projected to be 0.39 lb/ton (0.195 kg/t) of ore crushed. Information provided by suppliers indicates that typical cyanide consumption in the industry ranges from 0.38 lb/ton (0.19 kg/t) to 0.40 lb/ton (0.20 kg/t) of ore on the heap.
McClelland Laboratories, Inc. indicated that the Soledad ores were clean and that there were no ‘red flags’ raised in any of the test work. Furthermore, the samples crushed in the HPGR had a lower proportion of fines than the samples crushed to 100% - 8 mesh (2.4 mm), which will lead to lower cyanide consumption than previously estimated.
KCA also reviewed the cyanide consumptions in late 2014 and found the basis for selecting the current cyanide consumption of 0.39 lb/ton (0.195 kg/t) to be reasonable.
| 17.3.6 |
Carbon Columns for Closure |
The Merrill-Crowe process requires a cyanide concentration of approximately 150 ppm for efficient precipitation of gold and silver and this is well above the environmental rinse limits. A set of carbon columns will therefore be required once the neutralization process starts to recover residual gold and silver, as carbon is not affected by low cyanide concentrations. Experience shows that gold will be leached until cyanide concentrations drop to approximately 1 ppm. The rate at which silver will be leached slows at cyanide concentrations of 50 ppm and stops at approximately 10 ppm. The Merrill-Crowe circuit will need to be shut down once cyanide concentration drops below 150 ppm and electro-winning cells will be brought in to recover gold and silver.
| February 2015 | 17-17 |
|
|
|
Soledad Mountain Project |
| Kern County, CA, USA | |
| Technical Report |
Allowance has been made for a carbon plant in Sustaining Capital in Year 12 of production.
| 17.3.7 |
The International Cyanide Management Code |
GQM LLC is a signatory to the International Cyanide Management Code (the Code). The Code was developed under the auspices of the United Nations Environment Program and the International Council on Metals and the Environment. The International Cyanide Management Institute, a non-profit organization, administers the Code. Signatories to the Code commit to follow the Principles set out in Code and to follow the Standards of Practice. Companies are expected to design, construct, operate and decommission their facilities consistent with the requirements of the Code and must have their operations audited by an independent third party. Audit results are made public.
GQM LLC has engaged an independent consulting engineer to complete its pre-operational certification.
| 17.4 |
Life Of Mine Production Summary |
The annual ore production and the production of gold and silver are summarized in Table 16-7.
A delay in the actual production of gold and silver is taken into account in the values shown in Table 16-7, in consideration of the actual field leach curves discussed in Section 17.8.1. It is estimated approximately 79% of the recoverable gold and 72% of the recoverable silver stacked on the heap in a given year is recovered in the same year, with the balance recovered in the following year.
| 17.5 |
Smelter Recovery |
The estimated quantity of gold and silver that will be produced each year is shown in Table 16-7.
The average silver to gold ratio in the doré will be 10:1 with a range from 5:1 to 15:1. Allowance has been made for 1.5% of minor metals in the doré as shown in Table 17-3.
| February 2015 | 17-18 |
|
|
|
Soledad Mountain Project
Kern County, CA, USA Technical Report |
Table 17-3. Minor Metals Present in Doré
| Element | % |
| Cu | 0.45 |
| Fe | 0.38 |
| Zn | 0.38 |
| Ni | 0.15 |
| Co | 0.11 |
| Pb | 0.04 |
| Total | 1.50 |
The minor metals content of the doré is based upon 33 element ICP scans of pregnant solution from column leach tests and CAM WET tests on ore samples. It is not expected that these concentrations of minor metals will interfere with zinc precipitation in the Merrill-Crowe process.
The doré will be cleaned and prepared for shipment by the operators on site. It is expected that shipments will be made every seven days.
Johnson Matthey Inc. (“JMI”) owns and operates a precious metals refinery in Salt Lake City, Utah. JMI has assessed the expected quality of the doré and sees the mine as a silver producer rather than a gold producer and the doré will be refined following the procedures for silver rather than gold.
JMI provided the following levels for minor metals in doré at which penalties would apply as shown in Table 17-4.
Table 17-4. Refinery Penalty Triggers for Doré
| Element | % |
| As | 0.200 |
| Bi | 0.005 |
| Cd | 0.050 |
| Hg | 0.010 |
| Se | 0.010 |
| Te | 0.010 |
| Sn | 0.500 |
| Be | 0.000 |
JMI proposed the following provisional terms for the doré in a proposal dated January 15, 2015:
| • | Treatment Charge | $0.35 per ounce received; | |
| • | Gold Return | 99.90% of the assayed gold content; |
| February 2015 | 17-19 | |
|
|
Soledad Mountain Project
Kern County, CA, USA Technical Report |
| • | Silver Return | 99.75% of the assayed silver content; | |
| • | Refining Charge | $1.00 per ounce of fine gold credited and | |
| • | Penalties | None |
JMI will normally settle 25 working days after the doré is received.
A knowledgeable person will be retained by GQM LLC as an on-site representative at the smelter to oversee the procedures in place for receiving the doré and ensuring proper QA/QC. The representative will oversee the processing of each shipment of doré and will submit a written report on each shipment.
| 17.6 |
Heap Leach Operation |
| 17.6.1 |
Design of the Facilities |
Golder has designed the Phase 1 heap leach pad, which is considered to contain the ultimate ore tonnage in the current feasibility study. In previous studies Golder generated a conceptual design of a Phase 2 pad which is now designated for additional storage of waste rock. The site layout with the Phase 1 pad is shown in Figure 4-2. A layout showing the details of the ultimate heap is provided in Figure 17-4.
Terra Nova Technologies, Inc. (“TNT”), San Diego, California has done stacking studies and designed the heap conveying and stacking system as described in Section 17.7.
The Phase 1, Stage 1 heap leach pad as designed in 2006 would require that a portion of the historical tailings would be handled twice. This would create possibly unmanageable dust that must be avoided. An alternative construction sequence was therefore selected as described below and a revised design report was prepared by Golder and submitted to GQM LLC in December 2010 to reflect this change and other changes, which had been made to the Project since 2007. The design was again revised by Golder and submitted to GQM LLC in April, 2012, after the decision was made to eliminate any and all encroachment on the floodplain in mid-2011.
The final Phase 1 heap leach pad area as shown in the Heap Leach Facility “(HLF”) Design Report dated April 16, 2012 has an area of approximately 7,575,000 ft2 (703,740 m2) and was planned for development in three stages. The Phase 1, Stage 1 heap leach pad based on an updated design by Golder dated June 30, 2014 considered development in four stages to minimize initial capital costs and improve solution management. The Phase 1 pad has further been subdivided based on the TNT stacking plan into cells for operational purposes, as shown in Figure 17-5.
| February 2015 | 17-20 | |
|
|
Soledad Mountain Project
Kern County, CA, USA Technical Report |
The base-case four-cell arrangement is used and meets the 70-day primary leach time requirement. The remaining stages are broken down as follows:
| • | Stage 1, four cells, 2,055,000 ft2 (191,000 m2); | |
| • | Stage 2, four cells, 2,120,000 ft2 (197,000 m2); | |
| • | Stage 3, four cells, 2,000,000 ft2 (186,000 m2); and | |
| • | Stage 4, five cells, 1,400,000 ft2 (130,000 m2). |
The liner system for the heap leach pad includes a composite liner system with a lower compacted soil liner and overlying 80-mil (2.0mm) linear low density polyethylene (“LLDPE”) geomembrane with a textured liner and 2% grades within the toe region for enhanced stability. The total lined area for the Phase 1 pad is approximately 7,575,000 ft2 (703,740 m2) and the total capacity of the pad is approximately 51.6 million tons (46.8 million tonnes) at an ore density of 100 lb/ft3 (1.6 t/m3).
A second pad area of approximately 4,000,000 ft2 (372,000 m2) was intended for use in the previous feasibility study issued in 2012, based on the conceptual design as provided in the original Report of Waste Discharge from 2007 (updated April 16, 2012) and also as documented in a September 30, 2011 Memorandum from Golder on the Phase 1 and Phase 2 HLF Capacity Estimate. This “Phase 2” pad area is now designated as an area of additional storage for waste rock. This area has the potential as an additional pad for an expansion of ore tonnage up to approximately 27 million tons (24.5 million tonnes) of ore (but would require an update to the mine plan).
Note that a specific weight of 85.0 lb/ft3 (1.36 t/m3) was used in the earlier capacity estimates for ore on the heap. This value included prior test work on VSI-crushed column test samples (which averaged only 78.1 lb/ft3 (1.25 t/m3) and are not representative of the current plant design) and also made no allowance for self-compaction of ore at maximum heap height. Note the average of HPGR-crushed column test samples after leaching was 90.6 lb/ft3 (1.45 t/m3). Information on the experience at the Coeur Rochester Mine shows an increase in specific weight of greater than 20% under self-compaction at a heap height of 200 ft (60 m) for the lower lifts. Test work done by Golder on leached residues of low-grade and high-grade rhyolite HPGR samples shows densities of approximately 97 lb/ft3 and 105 lb/ft3 (1.55 t/m3 and 1.68 t/m3) at a 200 ft (60 m) heap height, respectively. Densities of greater than 110 lb/ft3 (1.76 t/m3)were observed with Quartz latite HPGR-crushed samples above a 100 ft heap height. Based on a review by Golder of this and related consolidated density information, Golder determined a density of 100 lb/ft3
| February 2015 | 17-21 | |
|
|
Soledad Mountain Project
Kern County, CA, USA Technical Report |
(1.6 t/m3) was a reasonable value to use for the updated pad capacity estimate. In general considering the site-specific test data and regional experience, the expectation of this level of load induced compaction is deemed reasonable. Note that the area available on top of the Phase 1 heap is also large enough that some additional ore could be placed on the heap.
| February 2015 | 17-22 | |
|
|
Soledad Mountain Project
Kern County, CA, USA Technical Report |
Figure 17-4. Ultimate Heap

| February 2015 | 17-23 | |
|
|
Soledad Mountain Project
Kern County, CA, USA Technical Report |
Figure 17-5. Heap Leach Stages and Cells

| February 2015 | 17-24 | |
|
|
Soledad Mountain Project
Kern County, CA, USA Technical Report |
An ultimate heap height of 230 ft (70 m) nominal has been used for the design of the heap. Individual lifts have been designed for 33 ft (10 m) nominal in height. The lifts will be benched to create on overall slope of 2.5H:1V along the north, northwest and east sides and 2H:1V on the south and southwest sides of the pad.
Note the prior 2012 Feasibility Study and Waste Discharge Requirements specified an ultimate heap height of 200 ft (60 m) but to contain the current design tonnage on the Phase 1 pad area the ultimate heap height was increased to 230 ft (70 m). A minor amendment to the Waste Discharge Requirements or notification of the change to the Lahontan Regional Water Quality Control Board (Water Board) may be required prior to operating at a higher heap height. Based on Golder’s experience working with the Water Board it is Golder’s opinion this is not expected to be a significant issue. Additional laboratory testing to evaluate the permeability and staged density of the ore under the planned design heights is recommended once agglomerated ore is available during operations. Factors such as heap and liner stability should be reviewed with the stability inputs updated to account for updated strength properties based upon the actual materials used during construction and operations (e.g., soil liner, geomembrane, and overliner), but in Golder’s opinion the current stability analysis included in the design report (Golder 2012) is acceptable for the heap with one additional lift to 230 feet (70 m).
Phase 1, Stage 1 will initially be stacked four cells wide and four full lifts high for a total of approximately 7.3 million tons (6.6 million tonnes) based upon the stacking system design. The primary leach cycle time necessitates the pad expansion into Stage 2 before stacking to the ultimate heap height in Stage 1.
The layout of the Phase 1 heap permits stacking in rectangular panels and this will lend itself to a straightforward conveyor stacking system. The lifts will be benched to achieve the overall design slopes.
A perimeter access road is included and this is 20 ft (6 m) wide with safety berms. The road width allows for the near-pad side offset for the liner system anchor trench.
Stage 1 of the Phase 1 heap leach pad and the events pond and other supporting features will be constructed in Year 0. Stage 2 will be constructed in Year 2 of production. Stage 3 will be constructed in Year 5 and Stage 4 will be constructed in Year 8 depending upon the actual ore mining rate and the overall performance of the heap. The cost of constructing Stage 1 has been included in the Project capital cost while the cost of constructing Stage 2, Stage 3 and Stage 4 has been included in the Sustaining Capital.
| February 2015 | 17-25 | |
|
|
Soledad Mountain Project
Kern County, CA, USA Technical Report |
Stages 1, 2, 3 and 4 of the Phase 1 pad are divided into hydraulically isolated zones in order to allow for proper sequencing of construction and leaching activities.
The pump box has been set below grade and the inlet of the pump box mirrors the cross-section of the solution conveyance channel.
The pump box overflows to the events pond. Solutions will be returned from the events pond to the pump box with a sump pump.
Two pumps will initially be required to pump the pregnant solution to the Merrill-Crowe plant. Only one of the pumps will be in use at any one time and the second pump will be a backup pump. Vertical turbine pumps have been selected.
The layout for Stage 1 of the Phase 1 heap leach pad has been designed to be compact and this allows for the short length of the lined channel to route solutions to the pump box.
Golder designed the overflow pond based upon the water balance for the Project for a capacity of 28.5 million gallons (108,000 m3). This capacity is adequate to contain heap drain-down and runoff from storm events and includes 1 ft (0.3 m) of freeboard. The pond is double-lined and includes a leak detection and leakage recovery system. The overflow pond is divided into two ponds with a center berm to provide a smaller operational pond closest to the pump box where water can initially be stored and to provide a reserve of water required for irrigating the heap during the start-up of the operation. The layout ensures that the pond will receive all spills from processing operations and overflows from the pump box. The overflow pond is not expected to discharge; however an emergency overflow has been included on the north side of the pond.
| 17.6.2 |
Construction of the Heap Leach Facilities |
Guinn Corporation, Bakersfield has provided a firm proposal for the construction of the Phase 1, Stage 1 heap leach pad. A contract has been signed for the construction of the Phase 1, Stage 1 pad and construction is under way (February 2015).
| 17.6.3 |
Backup Systems |
An allowance has been made for a diesel-powered generator to provide standby power and this will be located beside the Merrill-Crowe plant. The standby generator will power the pregnant and barren solution pumps in case of a power outage.
| February 2015 | 17-26 | |
|
|
Soledad Mountain Project
Kern County, CA, USA Technical Report |
GQM LLC will also purchase a diesel-powered pump to be installed at the pump box to provide a secondary backup. Diesel powered pumps are also available for rent/lease from suppliers in Bakersfield in the event of an emergency. Pumps with the capacity to handle barren and recycle solution flows can be brought to site in a matter of hours if required.
| 17.7 |
Conveying and Stacking |
A conveying and stacking system is required for the Project. Terra Nova Technologies, Inc. (“TNT”) was selected by GQM LLC for the detailed design and construction of the conveying and stacking system.
Individual cells are rectangular and this layout allows for a simple and efficient stacking system. Ore will be stacked in lifts of 33 ft (10 m) in height, 262 ft (80 m) in width for a total of seven lifts to the ultimate heap height allowed for in the design of 230 ft (70 m). The size of each cell and lift has been made as large as possible to limit the total number of cells and lifts and thus the cumulative activity on the heap. This is being done to limit the inevitable traffic induced compaction that will be experienced prior to leaching.
| 17.7.1 |
Conveying and Stacking System Design |
TNT has designed the conveyors and the stacker to convey up to 1,070 ton/h (970 t/h) and retreat stacking will be performed. The conveying and stacking system is a traditional fixed pad, multiple lift, and portable system.
The HPGR discharge will be fed to the agglomeration drum. The agglomeration drum discharge will be fed to the overland conveyor. Ore on the overland conveyor will be dumped on the tail end of a series of portable ramp conveyors via a rubber-tired tripper. The ore will then be conveyed to the top of the heap and dumped on the tail end of a string of standard portable conveyors, which will in turn convey the ore to the horizontal feed conveyor system, and ultimately the radial stacker. The overland conveyor will be approximately 2,400 ft (732 m) long and run along the overland conveyor corridor.
TNT presented a revised stacking plan and did extensive work with management to arrive at the best design considering the geotechnical requirements, production needs and a pad that can be stacked without damaging equipment. TNT recommended the use of tracks on the radial stacker and horizontal conveyors, widening the stance of the horizontal feed conveyor, and providing the ability to level the horizontal feed conveyor with hydraulic leveling jacks for level operation on side slopes when operating on steeper slopes. Also, with a heap leach pad with a steep slope at the upper or southern end, TNT recommended motor brakes on all equipment in the case of a trip or loss of power. These recommendations were accepted by management and have now been incorporated in the designs and included as a cost in the package.
| February 2015 | 17-27 | |
|
|
Soledad Mountain Project
Kern County, CA, USA Technical Report |
The current design of the conveying and stacking system has evolved substantially over the past few years to a fully-automated system with a significant increase in the reliability of the overall system. Especially the power distribution along the system has evolved with a separate transformer and motor control package for each unit of the system. Each of the grass hopper conveyors now includes dust control covers over the conveyors and all functions of the stacker are now controlled by radio remote control.
TNT and management discussed opportunities to standardize some of the conveyor components between TPS and TNT. TNT agreed to standardize the motors, gear reducers and idlers to match TPS. By doing this the GQM LLC will realize reductions in inventory volumes, inventory costs and maintenance personnel training.
TNT submitted an updated proposal for the design, supply and erection of the heap leach conveying and stacking system as a turn-key proposal dated September 5, 2014. This proposal is Revision 4 and reflects GQM LLC ongoing discussions on technical aspects of the design and the ongoing efforts to reduce the costs of large turn-key projects.
The TNT proposal includes the agglomeration drum and that has been integrated into the conveying and stacking system.
| 17.7.2 |
Conveying and Stacking System Construction |
GQM LLC decided to proceed with initial engineering to secure a schedule that met the overall construction schedule at a meeting held in Mojave in July 2014.
TNT provided a construction schedule and schedule of values and this schedule shows that construction can be completed in September 2015 with initial no-load commissioning of the complete system beginning in October 2015. This timeline meets the current overall Project schedule.
A TNT sub-contractor will erect the equipment. TNT will be responsible for the project and will provide all necessary on-site management support.
| February 2015 | 17-28 | |
|
|
Soledad Mountain Project
Kern County, CA, USA Technical Report |
| 17.7.3 |
Conveying and Stacking System Operation |
Cement will be added to the feed to the agglomeration drum. Water will be used to wet the ore and the addition rate will be controlled with a valve and linked to a weightometer. The target moisture content for the wetted ore to be stacked on the heap is 8%.
An operator will be required to operate the stacker. TNT experience shows that this will give better operating results than an automated system.
| 17.7.4 |
Support Equipment |
The following support equipment will be provided for work on the heap:
A Komatsu D65PX-17 track-type dozer (or equivalent) – The dozer will be used to level the surface before placing drip lines and scarifying the surface before stacking additional lifts.
No specialized belt handling equipment will be required.
| 17.8 |
Solution Management |
| 17.8.1 |
Distribution of Solutions on the Heap |
Provisions have been made in the design of the system for barren solution to primary leach and pregnant solution to the Merrill-Crowe plant. A counter-current solution flow may be introduced later in the life of the mine and only if indicated by solution grades.
Primary solution application rate is 0.004 gal/min/ft2 (9.77 L/h/m2) with pregnant solution flow rate of 2,740 gal/min (623 m3/h) and barren solution flow rate of 2,880 gal/min (654 m3/h) (after allowing for 5% evaporation makeup).
The primary leach area (top) will be approximately 691,000 ft2 (64,200 m2). This area can be irrigated for 70 days on average at the design flow rates and this will be the primary leach period.
Time for solution “breakthrough” will depend upon the number of lifts on the heap and this could range from one day to 10 days. It is further expected that a total of seven days will be required to prepare the heap for a new lift and both will be determined by operating experience.
| February 2015 | 17-29 | |
|
|
Soledad Mountain Project
Kern County, CA, USA Technical Report |
The leachate or pregnant solution and the recycle solution will be collected in a network of perforated pipes and will be directed to pipes in the lined solution conveyance channel. The solutions then flow to the pump box and are pumped to the Merrill-Crowe plant.
At any one time there will be enough solution to irrigate (actively leach) 70 days worth of primary ore (higher grade). In addition to leaching the top lift, the leach solution that is applied to the top lift also percolates down through the underlying lifts, thus giving them more leach time. This means that the ore on say lift #7 will receive at least 70 days of active leaching (probably more if the pregnant solution grade is high enough to warrant longer leaching) and the underlying lifts will get:
| • | Lift #7 | at least 70 days | |
| • | Lift #6 | at least 140 days | |
| • | Lift #5 | at least 210 days | |
| • | Lift #4 | at least 280 days | |
| • | Lift #3 | at least 350 days | |
| • | Lift #2 | at least 420 days | |
| • | Lift #1 | at least 490 days |
Note the quality of solution distribution and ore wetting decreases as the number of lifts increases, as discussed further in Section 17.8.5.
All of the ore will be leached long enough to obtain the gold and silver extractions that were achieved in the column leach tests, even the seventh lift if it is irrigated for 290 days (see below). The column leach extractions are based on 200 days of active column leaching. There is a rule of thumb in gold heap leaching, based on experience, which relates column leach time to commercial scale heap leach time.
| • | First 30 column days | = 90 days commercial scale | |
| • | Second 30 column days | = 60 days commercial scale | |
| • | Remaining column days @ 1:1 (i.e. 140 days) | = 140 days commercial scale | |
| • | Totalling approximately 200 column days | = 290 days commercial scale |
This means that extractions based on a 200-day column test, such as those obtained from the logarithmic regression analyses, will require 290 days (say 300 days), to achieve the same extraction in commercial scale practice.
| February 2015 | 17-30 | |
|
|
Soledad Mountain Project
Kern County, CA, USA Technical Report |
Operating experience may show that it will be advantageous to reduce the primary solution application rate and increase the total area under irrigation to allow diffusion-controlled leaching to take place for an extended period of time. The ore in a particular lift will require as much leaching as possible before it is covered with another lift or overall recoveries may be reduced because of the channeling of flow that invariably occurs.
Frequent sampling of the various solution streams will be required to ensure that barren solution and the recycle solution are applied to the heap most effectively. Operating experience will ultimately be required to develop an effective solution management system.
| 17.8.2 |
Netafim USA Design Elements |
Drip emitters will be used to irrigate the ore on the heap. Drip emitters will be placed (buried) over new ore as quickly as possible to ensure rapid solution breakthrough.
Netafim USA (“Netafim”) is the key supplier of components used extensively in agriculture for irrigation. Netafim provided the design and cost estimates for the solution distribution system.
The Netafim system is suitable for irrigating large level areas and slopes. Layouts can be changed and refined and this will depend upon operating experience. The spacing of the driplines will be approximately 36 inches (1 m) apart and the recommended length of driplines is 200 ft (60 m).
The following general comments apply to the system:
| • | An automatic filter must be used, either on each mainline or on the supply header; | |
| • | One header will be used to supply solution to two cells; | |
| • | A 6 inch (15 cm) diameter sub-main will be used; | |
| • | Drip emitters will be set out on both sides of the sub-main; | |
| • | Return lines will be eliminated from the system; | |
| • | An antiscalant must be used to ensure a smooth operation; | |
| • | All the components except the driplines are reusable; | |
| • | All components are readily available in Bakersfield;. | |
| • | Equipment to assemble the components can be supplied by Netafim; | |
| • | Manuals for the operation/maintenance of the system are available at no charge; and |
| February 2015 | 17-31 | |
| Soledad Mountain Project |
| Kern County, CA, USA |
| Technical Report |
| • | A number of smaller contractors do installation work in the Bakersfield area. |
A contractor will assist with the first installation of the system and to train the operators.
| 17.8.3 |
Moisture Content, Specific Weight & Slump |
The averaged moisture content, specific weight and ‘slump’ for all tests done since 1990 are shown in Table 17-5. A comparison of moisture contents from two different test programs is illustrative in showing the difference in moisture contents between the VSI crusher and the HPGR-based approach.
Table 17-5. Moisture Content Test Results
| 1997-1999 VSI Crusher Tests, 100 % - 8 mesh Moisture Content % | HPGR Tests, Low- and High-Grade Moisture Content % | ||
| To agglomerate the ore | 11.5 | 12.8 | 10.6 |
| To saturate the ore | 37.2 | 13.8 | 14.0 |
| Retained moisture | 21.1 | 10.7 | 11.9 |
The lower moisture contents required to saturate the ore and the lower retained moisture contents obtained in the HPGR-based test programs will have a significant and positive impact on the ability to construct a heap to an ultimate height of 230 ft (70 m).
No difficulties with solution percolation, solution channeling or fines migration were observed in any of the HPGR-based column leach tests done between 2003 and 2007.
| 17.8.4 |
Percolation Rates Under Load |
Test work for percolation rates under loading was conducted on several samples between 1990 and 2010, as discussed in Section 13.9. KCA reviewed this information and indications are that Quartz latite shows excellent percolation, but KCA noted some percolation issues in the data with rhyolite ores at lower cement levels (8 lb/ton or 4 kg/t). To address this, cement usage for rhyolite and pyroclastics (the latter having limited supporting data) was increased to 9.5 lb/ton (4.8 kg/t), with the plant design allowing for further increases if required.
Additional perforated pipe can be installed between lifts if required to direct solution away from lower lifts if difficulties are experienced in the commercial scale operation. This is a decision to be made by the operators once experience has been obtained with particular ore types.
| February 2015 | 17-32 | |
|
|
Soledad Mountain Project
Kern County, CA, USA Technical Report |
Solution application rates may also have to be reduced if ponding is observed on the heap.
| 17.8.5 |
Problems with Multiple Lifts |
It is known that solutions percolating through a heap find the easiest channels to follow (preferential flow) and that perfect wetting of all ore particles is not achievable in practice. This problem usually increases as the number of lifts increases, however this issue can be overcome to some extent by deep ripping a lift that has been leached before a new lift is stacked on top of it. Ripping the upper 6 ft (1.8 m) of an exhausted lift will redistribute the flow channels. A Komatsu (or equivalent) dozer with a long ripper will be available for deep ripping if the need for this activity is indicated by operating experience. It is however possible that deep ripping will destroy the agglomerates and scarifying the surface may be all that is required to ensure good solution flows from lift to lift. Operating experience and test trials will help the operation to select the suitable method. There is a low to medium risk that a slight reduction in gold and silver recoveries could occur due to the multiple lift leaching requirement.
| 17.8.6 |
Water Required |
The average water use for the heap leach operation is projected to be 425 gal/min (96.6 m3/h) and this includes an allowance for evaporation losses.
| 17.8.7 |
Neutralization of the Heap |
Cyanide concentrations in the leach solutions must be reduced to the weak acid dissociable (WAD) standard of 0.2 ppm and a pH ranging from 6.0 to 8.5 for closure. Cyanide concentrations in the leached residue must be reduced to the WAD standard of 0.5 ppm for closure. Also, contaminants in any effluent from the leached residue will not be permitted to degrade surface run-off or groundwater. The basic approach to reducing the cyanide concentrations is to allow natural processes to occur and to carry out a staged rinse with fresh water. A 90-day rinse cycle has been used successfully at other heap leach operations in the California desert environment. Hydrogen peroxide or an equivalent oxidizing agent can be used to speed up the neutralization process as required. The hydrogen peroxide can be injected into any of the solution distribution lines with a chemical feed pump. The rinse water will be applied to the heaps using drip emitters.
Solutions from each cell of the heap and from the lysimeters and leak detection monitoring points will be sampled regularly and taken to the assay laboratory on site for analysis. The samples will be analyzed for gold, silver, pH and free cyanide and the analyses will be used to control and direct the rinse solution to various parts of the heaps. Analyses may occasionally be required for other metals such as copper, selenium and chromium.
| February 2015 | 17-33 | |
|
|
Soledad Mountain Project
Kern County, CA, USA Technical Report |
Adding fresh water to rinse the heap must be balanced by losses due to evaporation. Estimated total (mean) annual evaporation is 79.8 inches (2,027 mm) versus a mean annual rainfall of approximately 6 in (152 mm) in the greater Mojave area. Snow making equipment (sprayer systems) has been successfully used at other heap leach operations to speed evaporation.
Experience at other heap leach operations in the California deserts shows that standards set by the California State Water Resources Control Board can be met successfully.
| 17.9 |
Comments on Section 17 |
KCA has relied upon the detailed heap leach designs prepared by Golder for the completion of corresponding sub-sections of Section 17 of the report. Golder is a qualified consulting engineering firm with extensive experience in the design of leach pad facilities and KCA accepts the Golder designs and recommendations that have been provided by GQM LLC. KCA has reviewed the provided information and with KCA’s experience, finds it to be reasonable.
| February 2015 | 17-34 | |
|
|
Soledad Mountain Project
Kern County, CA, USA Technical Report |
| 18.0 |
PROJECT INFRASTRUCTURE |
| 18.1 |
Site Access |
Good access exists from the north via Silver Queen Road and from the south via Mojave Tropico Road. Both roads are paved and are in excellent condition. Silver Queen Road intersects State Route 14 two miles (3.2 km) east of the site. State Route 14 is the major highway, which connects Mojave, Rosamond, Lancaster and Palmdale to the greater Los Angeles area.
Access to site is from Silver Queen Road, which borders the site on the north as shown in Figure 4-2. The two existing roads, the dirt road to the laydown area used by Guinn Corporation, GQM LLC’s general contractor, and the paved road to the 3,025 ft (920 m) level are also being used for immediate access during the construction period.
A turn-off from Silver Queen Road with passing lanes was constructed approximately 1,000 ft (305 m) east of Holt Street in 2013.
Fielden Engineering Group, a local engineering firm based in Lancaster, prepared the detailed site grading plan with provision for site drainage for the area immediately adjoining the turn-off from Silver Queen Road. The site grading plan includes a dip-crossing for the natural drainage that runs from west to east along Silver Queen Road. Construction of the Phase 1 site grading plan was completed in 2013.
The site was fenced in areas of immediate concern along Silver Queen Road and along the eastern portion of the Approved Project Boundary. The fence is currently being extended along the western portion of the Approved Project Boundary (February 2015).
An independent contractor is providing security on site 24 hours per day and seven days per week and the costs for this service are allowed for in both the capital and operating cost estimates.
Good local infrastructure and the ready access to site at all times of the year will have a significant positive impact on both the construction capital costs and the operating costs.
| February 2015 | 18-1 | |
|
|
Soledad Mountain Project
Kern County, CA, USA Technical Report |
| 18.2 |
Water Required and Water Supply |
| 18.2.1 |
Water Required for the Project |
Water is required for dust control during construction, generally for compaction for a number of infrastructure projects and also for compaction of the lower liner of the Phase 1, Stage 1 heap leach pad. Water is being drawn from production well PW-1 and pumped to four temporary water storage tanks located on site.
The estimated average rate at which water will be required once the mine is in full production was previously estimated at 650 gal/min (147.6 m3/h) This water use is now unlikely as the Project has been designed to use buried drip emitters and there are no open solution ponds. The water use at C.R. Briggs Corporation, to some extent a comparable operation, is approximately 350 gal/min (79 m3/h) based upon information provided by C.R. Briggs Corporation. GQM LLC now expects that the average rate at which water will be required will range from 425 gal/min (97 m3/h) to 450 gal/min (102 m3/h).
Both the average saturation moisture content and drain down moisture content are significantly lower due to use of the HPGR as the primary comminution equipment with a projected lower total process water use.
The water balance for the Project was done by Golder. The Golder analysis indicates that a small portion of the water required will be made up by precipitation that will accumulate in the events pond, although this has not been allowed for in the estimates.
Note that the Kern County Board of Supervisors approved a water entitlement of 750 gal/min (170 m3/h) in the Conditional Use Permits issued in 1997.
| 18.2.2 |
Production Wells |
Three water production wells have been drilled on site. Production well PW-1 was drilled and capped in September 1996. The well was tested to yield 750 gal/min (170 m3/h).
Production well PW-2, located approximately 1,000 ft (305 m) north of PW-1, was originally intended as the second ground water production well. The well was drilled in 2005 and was developed and tested to yield from 200 gal/min (45 m3/h) to 300 gal/min (68 m3/h). PW-2 was re-tested with a pump test in 2013 and was found to have a lower yield than originally tested when the well was first drilled and equipped and is therefore not being connected to the system for the time being.
| February 2015 | 18-2 | |
|
|
Soledad Mountain Project
Kern County, CA, USA Technical Report |
A third production well, PW-3, was drilled west of Soledad Mountain to a depth of 600 ft (183 m) in October 2008. The well was developed and tested to yield only approximately 50 gal/min (11 m3/h). The well may still provide smaller quantities of water required for an aggregate operation.
Security of water supply for the Project is critical and GQM LLC is actively pursuing additional options as set out in Sections 18.2.4, 18.2.7 and 18.2.8 below.
| 18.2.3 |
Water System Design |
The Project includes a total of five characterization/monitoring wells and three production wells. One monitoring well that fell inside the Phase 1 heap leach pad footprint was closed in 2013.
Water will be pumped from the production wells or the Antelope Valley-East Kern Water Agency “AVEK” supply point to the main water storage tank and two fire water tanks. The main water storage tank will have a capacity of 23,000 gal (87 m3) and will be set at an elevation of 2,930 ft (893 m). The firewater tanks will have a capacity of 60,000 gal each (227 m3) and will also be set at an elevation of 2,930 ft (893 m). A pump station will be located beside the main water storage tank to supply the crushing-screening plant, the workshop-warehouse, the Merrill-Crowe plant and dust control water storage tanks.
The construction of the Phase 1 water supply system has been completed. This includes the submersible pump and piping and valves at PW-1 and the water line from PW-1 through a bored crossing of Silver Queen Road to the pad where the water storage tanks will be located. An order has been placed for five water storage tanks and delivery is expected by April 1, 2015. This project is being done as a turn-key project by Guinn Corporation. Southern California Edison (“SCE”), the regional utility, is supplying power to operate the pump at PW-1.
Fielden Engineering Group prepared a detailed design for the fire protection system for the workshop-warehouse. This includes a fire pump, fire water line and fire hydrant and has been approved by the Kern County Fire Marshall. Guinn Corporation has provided a cost estimate for construction of the water supply to the workshop-warehouse as a turn-key project. GQM LLC accepted the proposal. Construction started in January 2015 and is now well under way.
| February 2015 | 18-3 | |
|
|
Soledad Mountain Project
Kern County, CA, USA Technical Report |
| 18.2.4 |
Production Well PW-4 |
The GQM LLC has identified an area to the west of PW-1 and west of Holt Road that has historically had a number of production wells that have yielded upwards of 600 gal/min (136 m3/h). GQM LLC has purchased a property in the area and GQM LLC can now drill and equip a water well on the property. GQM LLC has signed a contract with a contractor based in Bakersfield for drilling, equipping, developing and testing the well. It is expected that the well will be drilled in April 2015.
The cost of this project has been included in the Project capital cost estimates.
| 18.2.5 |
Monitoring Programs Required by the Conditional Use Permits |
It is a condition set in the Conditional Use Permits issued by Kern County for the Project {(20) 1997 FEIR/EIS MM #17 of the Conditions of Approval} that GQM LLC will monitor groundwater levels in the production wells on a monthly basis and compare water levels to those predicted by the groundwater drawdown model. If the actual drawdown exceeds the predicted levels for six consecutive months, GQM LLC must supplement the water drawn from the production wells with up to 300 gal/min (68 m3/h) of water purchased from AVEK.
| 18.2.6 |
Domestic Water Supply |
Note the following condition included in the Conditions of Approval:
“(110) The project proponent shall provide water for drinking and sanitation subject to approval by the Kern County Environmental Health Services Department. At such time as 25 individuals are employed on the site, the project proponent shall demonstrate a source of water supply (e.g., existing on site water wells) meeting Title 22 source-water criteria for a place of employment and shall obtain a permit from the California Department of Public Health.”
The California Department of Public Health has determined that, based upon the number of employees involved in the Project, a public water system will be required. GQM LLC therefore needs to apply for a permit for a nontransient, noncommunity (“NTNC”) water system. GQM LLC may choose to provide bottled water but the domestic water supplied must still meet all applicable drinking water standards of an NTNC water system. The Department of Public Health no longer issues hand washing exemptions as this is no longer permitted under federal standards.
| February 2015 | 18-4 | |
|
|
Soledad Mountain Project
Kern County, CA, USA Technical Report |
Tests on well water have confirmed that it is the arsenic level that must be reduced to the California maximum contaminate level of 10 ppb (10 micrograms per liter). Dee Jaspar & Associates, Inc., the Company’s consulting engineers, have obtained prices for a self-contained arsenic removal system and the cost of three treatment systems has been included in the Project capital cost estimates.
| 18.2.7 |
Antelope Valley-East Kern Water Agency Water Supply |
GQM LLC has engaged Dee Jaspar & Associates, Inc. to design and provide a cost estimate for a pump and pipeline to link a supply point provided by AVEK to site.
Management met with AVEK in Mojave in August 2014 to discuss details of an interconnection of the two systems. AVEK is ready to provide water for the Project, and could most likely provide the full requirement. AVEK submitted a proposal for detailed engineering and for preparation of contract documents in September 2014. GQM LLC approved the cost estimate and this engineering project is now under way.
The pipeline and pump station designed by Dee Jaspar & Associates, Inc. has been designed for a flow of 650 gal/min (2,461 L/min). The cost of this project has been included in the Project capital cost estimates.
| 18.2.8 |
Recycled Water Supply |
GQM LLC is evaluating the use of recycled water or Title 22 water for the Project with the Rosamond Community Services District. A suitable route for a pipeline is available and this option will be pursued once the mine is in production. The use of Title 22 water would be an environmental plus for the Project. This supply will be of interest only once the Project is running smoothly with a positive cash flow and an assured long life.
| 18.3 |
Power Required and Power Supply |
| 18.3.1 |
Power Required |
The detailed electrical design, construction cost estimates and power consumption estimates were prepared by A-C Electric Company, a company based in Bakersfield, and Project Management. The estimated annual power consumption at maximum planned ore production of 5.12 million tons (4.65 million tonnes) per year and the allocation to the various cost centers is shown in Table 18-1. Annual power consumption ranges from 26.8 to 34.1 million kWh depending upon ore production. GQM LLC has let a turn-key contract with A-C Electric Company for the site wide power distribution. Construction is underway (February 2015).
| February 2015 | 18-5 | |
|
|
Soledad Mountain Project
Kern County, CA, USA Technical Report |
Table 18-1. Power Consumption at Full Production
Project Area |
Annual
Maximum Power Consumption 000’s kWh |
| Ore Supply | 2,480 |
| Crushing and Screening | 3,620 |
| HPGR | 12,970 |
| Agglomeration | 1,062 |
| Heap Leach Conveying and Stacking | 3,681 |
| General Plant Services | 158 |
| Merrill-Crowe Plant | 6,845 |
| Laboratory | 968 |
| Solution Management and Water Supply | 1,995 |
| Workshop and Warehouse | 321 |
| Fuel Storage and General Services | 44 |
| Total | 34,144 |
An allowance has been made for a diesel-powered generator (1,250 kW, 480V) to provide standby power and the standby generator will be located beside the Merrill-Crowe plant. The standby generator has been sized to provide enough power to operate the Merrill-Crowe plant and solution pumps.
| 18.3.2 |
Power Supply |
SCE will supply power. A main power line with three sets of conductors crosses the property boundary. The top two sets of conductors carry 66 kV while the bottom set of conductors carries 12.5 kV. These are the common primary voltages in this part of the SCE territory.
GQM LLC will install and own the substation that will receive power from the 12.5 kV line, and this will be the mine distribution voltage. Overhead transmission lines will distribute power from the substation to the areas where power is required.
SCE provided a rate for power. The rate structure is complex and a mix of consumption and demand charges applies to peak, mid-peak and off-peak periods. The rate for power of $0.135/kWh was provided by SCE in October 2014 and this is the rate for power used in the feasibility study.
| February 2015 | 18-6 | |
|
|
Soledad Mountain Project
Kern County, CA, USA Technical Report |
SCE indicates that the power factor is an absolutely critical item in SCE territory. SCE may limit the number of starts permitted for the major motors per day which could place some constraints on plant operations during full production periods.
| 18.4 |
Workshop-Warehouse, Offices and Wash Slab |
The location of the workshop-warehouse is shown in Figure 4-2.
Fielden Engineering Group, a local engineering firm based in Lancaster, did the detailed design for the workshop-warehouse, the equipment wash slab and the septic system and leach field for the workshop-warehouse. The designs were approved for construction by the Kern County Building Department. Gary Little Construction, Inc., a local contractor based in Lancaster, completed the construction of the workshop-warehouse as a turn-key project in 2014.
The workshop-warehouse will serve both the mine and the crushing-screening plant and other processing facilities as a maintenance facility. The workshop includes three service bays, which have been sized large enough to service mobile equipment such as the 15 yd3 (11 m3) wheel loader, 100 ton (91 t) off-highway haul trucks, the large track-type tractor, the water truck and grader as well as for plant maintenance. Extensive provision has been made for heating and ventilation in all areas.
A gantry crane with a capacity of 15 tons (13 t) has been provided for lifting large loads (such as loader buckets and dozer blades) in and out of the welding bay.
A light vehicle service bay shares the third bay. A vehicle hoist has been provided so that light vehicles can be serviced effectively.
A compressor will be set on a concrete slab against an outside wall of the workshop-warehouse. A set of lube reels will be set between two service bays and on the wall of the light vehicle service bay. Lubricants will be dispensed from lube cubes. A waste oil storage tank will be required and this tank will be set within a small containment clear of the workshop-warehouse. All of this equipment has been purchased and the workshop-warehouse will be fully equipped in February 2015.
The warehouse has two floors. The upper floor has a large open plan area which will serve as the site offices. Four individual offices have been designed and will be constructed on the upper floor in March 2015.
| February 2015 | 18-7 | |
|
|
Soledad Mountain Project
Kern County, CA, USA Technical Report |
Waste oil, solvents, grease and other such wastes will be collected in a waste oil storage tank located beside the workshop-warehouse. A commercial recycling firm based in Mojave will collect waste oil periodically.
The equipment wash slab has an area of approximately 2,000 ft2 (186 m2). The wash slab includes primary and secondary settling basins and an oil-water separator. Sediments will be removed as required and disposed of in an approved location. A hot water pressure washer has been ordered and will be installed in March 2015.
| 18.5 |
Fuel Consumption, Supply and Storage |
| 18.5.1 |
Fuel Consumption |
The estimated annual consumption of diesel fuel and gasoline is approximately 1.4 million gallons (5,300 m3) and 22,000 gallons (83 m3) respectively. Diesel fuel consumption will vary from year to year depending upon the rate of mining ore and waste rock.
| 18.5.2 |
Fuel Delivery |
There are three fuel suppliers within close proximity to the Project site. They are Schwebel Petroleum Co. (Shell dealer) from Bakersfield, The Jankovich Company (Mobil/Exxon) from Paramount, and Ramos/Strong, Inc. (Chevron) from Mojave.
| 18.5.3 |
Fuel Storage on Site |
A contractor erected a 20,000 gallon (83 m3) diesel fuel tank and a 1,000 gallon (3.8 m3) gasoline storage tank on site in 2014. The fuel storage facility is a self-contained facility that was designed to meet all California codes.
| 18.6 |
Security |
Maxam prepared a note on security requirements in California and provided a model Security Plan that can serve as a basis for a site-specific security plan.
| February 2015 | 18-8 | |
|
|
Soledad Mountain Project
Kern County, CA, USA Technical Report |
| 18.7 |
Assay Laboratory |
The laboratory has been designed to cope with the planned workload including the required sample preparation and solid and solution analyses for gold and silver as well as analyses required to manage the heap leach operation (CNfree, CNwad, CNt, protective alkalinity and pH). Environmental control analyses will be performed for low level NaCN and metals (Hg, Ag, As, Cu, Fe, Zn, Mo, Cd, Ni, Co, Cr, Mn, Pb).
Fire assays will be the key assay and the laboratory will initially have capacity to do 60 fire assays per day with 70% efficiency. The laboratory has been designed to handle increased sample load if required.
Mr. Jack Stanley, Analytical Laboratory Consultants Ltd, Vernon, British Columbia developed the concepts for the laboratory. The decision was made to change this to a laboratory built on site and the design and cost estimates were refined over a period of four months in 2014 and this was a joint effort between GQM LLC management, Fielden Engineering Group, Lancaster and Gary Little Construction, Inc., Lancaster and subcontractors for Gary Little Construction, Inc. The laboratory includes areas for sample preparation, fire assays and related wet chemistry and metallurgical test work such as bottle roll tests and column leach tests.
Extensive provision has been made for dust control. All lead waste and dust containing heavy metals will be shipped to a designated disposal site. Rock dust and rejects from sample preparation will be returned to the process. Scrubbers will be fitted to fume hoods.
The laboratory has been designed to meet all state and federal codes.
The laboratory is being constructed on a turn-key basis by Gary Little Construction, Inc. and the target for completion is March 2015.
There is a list of hundreds of larger and smaller items that are required to outfit the laboratory. The list and cost estimates were provided by Jack Stanley. GQM LLC has engaged a Laboratory Supervisor who will be instrumental in setup and commissioning of the assay laboratory. GQM LLC expects to purchase these items starting mid-February, 2015 and it is expected that the Purchasing Manager, under the guidance of the Manager – Plant Operations and the Laboratory Supervisor, will be able to negotiate prices that in total will be lower than the feasibility study cost estimates.
The laboratory has been sized to handle from 50 to 200 solid and from 10 to 50 solution samples per day depending upon requirements. The laboratory will be staffed by a laboratory supervisor, two assayers and four sample preparation technicians. The two assayers and the four sample preparation technicians will work a continuous shift schedule. This will ensure that a sample preparation technician is on duty for 24 hours per day and seven days per week. The analytical capacity of the laboratory can be doubled by adding a second shift per day.
| February 2015 | 18-9 | |
|
|
Soledad Mountain Project
Kern County, CA, USA Technical Report |
In addition to the test work done on site, a quality assurance and quality control program using an outside laboratory will be implemented for the following reasons:
| • | Independent repeat analyses to gain statistical confidence in the in-house analyses; | |
| • | Confirmation analyses to satisfy permit and approval requirements; | |
| • | Geochemical analyses that may be in the ppb range and that cannot be performed in-house; | |
| • | Unexpected laboratory load due to exploration drill programs; and | |
| • | ICP scans of solutions to develop historical trends. |
| February 2015 | 18-10 | |
|
|
Soledad Mountain Project
Kern County, CA, USA Technical Report |
| 19.0 |
MARKET STUDIES AND CONTRACTS |
| 19.1 |
Marketing Agreements |
GQM LLC has not entered into any agreement for selling refined gold and silver. GQM LLC has also stated in its public documents such as the Form 10-K dated March 17, 2014 that it is not expected that GQM LLC will hedge any of its gold or silver production.
It is expected that a by-product aggregate and construction materials business can be developed once the heap leach operation is in full production, based on the location of the Project in southern California with close proximity to major highways and railway lines. The source of raw materials will be suitable quality waste rock specifically stockpiled for this purpose. The waste rock can be classified into a range of products such as riprap, crushed stone and sand with little further processing. Test work done in the 1990s confirmed the suitability of waste rock as aggregate and construction material. GQM LLC also plans to process and sell leached and rinsed residues from the heap leach operation for a range of uses to local and regional markets. It is intended that these products will be sold over a period that extends beyond the planned gold and silver production period, but no contributions from the sale of such products will be included in the cash flow projections until long term contracts for the sales of these products are secured.
| 19.2 |
Gold and Silver Sales |
The Project will produce a doré in the refinery on site. It is expected that the doré will be shipped to a refinery located in the United States. The doré will be smelted and refined to produce saleable gold and silver. The gold and silver will be sold by the refinery at spot on the day it is produced. That is the conventional and generally accepted procedure for dealing with gold and silver produced by a smaller heap leach operation such as the Project. Smelting and refining charges were confirmed by Johnson Matthey Inc. in proposal dated January 15, 2015.
Kappes Cassiday & Associates’s QP has reviewed and accepts these documents as supporting the assumptions in the feasibility study and technical report.
| February 2015 | 19-1 | |
|
|
Soledad Mountain Project
Kern County, CA, USA Technical Report |
| 20.0 |
ENVIRONMENTAL STUDIES, PERMITTING AND COMMUNITY IMPACT |
| 20.1 |
Approvals and Permits |
The Project is subject to federal, state and county acts and regulations governing precious metal cyanide heap leach operations.
| 20.1.1 |
Land Use - Conditional Use Permits |
The environmental setting of the Project was documented in a number of baseline studies completed from 1990 onwards and in the final Environmental Impact Report (the EIR) and Environmental Impact Statement (the “EIS”) completed in 1997. The Kern County Board of Supervisors unanimously approved two Conditional Use Permits (“CUP”) for the Project in September 1997 (i.e. CUP Case No. 41, Map No. 213 and CUP Case No. 22, Map No. 214). The Bureau of Land Management subsequently issued its Record of Decision approving the Plan of Operations under NEPA in November 1997. GQM LLC completed a number of studies and did significant work on site in 2005 and 2006 to document that the environmental setting for the Project has not changed since 1997.
The State of California introduced backfilling requirements for certain types of open pit, metal mines in December 2002. GQM LLC contended that these regulations did not apply to the Project under a grandfathering provision included in the regulation. GQM LLC therefore pursued both a favorable interpretation under the regulation and subsequently an amendment of the regulation with the State Mining and Geology Board (the “Board”) in 2006. These efforts were supported by Kern County officials. Both approaches were rejected by the Board and the decision was duly recorded by the Board in January 2007.
Norwest’s current mine plan incorporates sequential and partial backfilling of mined-out phases of the open pits with the expectation of rehandle of waste rock and leached and rinsed residues at the end of the mine life in order to meet backfill requirements. A life of mine waste rock management plan is still being prepared and will be dependent upon projected aggregate sales.
The Kern County Planning Department completed its review of the Application as set out in a letter dated July 24, 2007. The Planning Department noted that changes proposed for the Project constituted new information that required evaluation of potential impacts and mitigation in a SEIR.
| February 2015 | 20-1 | |
|
|
Soledad Mountain Project
Kern County, CA, USA Technical Report |
The draft SEIR was completed and distributed in January 2010. The Kern County Planning Commission formally considered the Project at its regularly scheduled meeting in Bakersfield on April 8, 2010. At the meeting, the Planning Commission, consisting of a panel of three commissioners, unanimously approved the Project. All appeals that were subsequently filed against the Planning Commission’s decision have been withdrawn and the decision made by the Planning Commission is now final. The Planning Commission certified the SEIR, adopted a Mitigation Measures Monitoring Program and Conditions of Approval for the Project which define conditions and performance standards which the mining operation must meet. The Mitigation Measures Monitoring Program and Conditions of Approval for the Project were amended by Planning Commission Resolution No. 171-10 adopted on October 28, 2010 and are now final. Record of the certification is available in the office in Vancouver and at the offices of the Kern County Planning Department in Bakersfield.
The Bureau of Land Management confirmed that its Record of Decision approving the Plan of Operations under NEPA in November 1997 remains valid.
The following is specific information on the CUPs:
Conditional Use Permit Case No. 27, Map No. 196; Conditional Use Permit Case No. 41, Map No. 213; Conditional Use Permit Case No. 22, Map No. 214 (Resolution Numbers 51-10, 52-10 and 53-10 respectively; Approved April 8, 2010.
There are 114 conditions of approval and mitigation measures in the CUPs and this includes a requirement to reclaim historical disturbances on the Property. Site inspections are conducted annually to verify that the GQM LLC is in compliance with the conditions of approval.
The non-summary vacation of New Eagle Road was approved by the Kern County Board of Supervisors at a general public meeting held in Bakersfield on March 20, 2012. This in effect means that the last public access to the property was removed.
Under Condition 107 of the Conditional Use Permits, the Company was required to submit, prior to the commencement of mining, additional information relating to closure and closing reclamation. The Company submitted the required information to Kern County on November 28, 2011 and June 8, 2012. In accordance with the Surface Mining and Reclamation Act of 1975, Kern County consulted the State Department of Conservation/Office of Mine Reclamation. The Office of Mine Reclamation confirmed in a letter to Kern County dated June 29, 2012 that the additional information provided by GQM LLC adequately demonstrated compliance with Condition 107 and this was confirmed by Kern County in a letter dated July 10, 2012.
| February 2015 | 20-2 | |
|
|
Soledad Mountain Project
Kern County, CA, USA Technical Report |
Kern County also reviewed Resolutions 169-10, 170-10 AND 171-10, (i.e. the Conditional Use Permits which were approved by the Kern County Planning Commission in April 2010), to determine if any conditions remained outstanding that would preclude GQM LLC from initiating mining activities under the approved surface mining and reclamation plan. County staff determined that the remaining conditions related to construction of an access to site and building permits. GQM LLC addressed these conditions as it proceeded with construction planning and implementation.
| 20.1.2 |
Water Quality – Report of Waste Discharge and Waste Discharge Requirements |
The Lahontan Regional Water Quality Control Board (the “Regional Board”) is responsible for ensuring compliance with the federal Clean Water Act and California’s Porter-Cologne Water Quality Act.
GQM LLC submitted a Report of Waste Discharge (“ROWD”), prepared by WZI Inc., Bakersfield, to the Regional Board in June 1997. The Regional Board adopted Board Order No. 6-98-9 on March 5, 1998 at a meeting held in Lancaster and this set the Waste Discharge Requirements (“WDR”) for the Project.
GQM LLC and its consulting engineers prepared and submitted a revised ROWD to the Regional Board on March 8, 2007. The revised ROWD was prepared at the request of the Regional Board to document changes in the layout and design of the heap leach facility plus other changes proposed for the Project.
The Regional Board unanimously approved WDRs and a Monitoring and Reporting Program for the Project at a public hearing held in South Lake Tahoe on July 14, 2010 (reference Board Order No. R6V-2010-0031). The Board Order was subsequently signed by the Executive Officer of the Board and is now in effect.
The order approving the WDRs is a critical authorization for the construction and operation of, and establishes the discharge and monitoring standards for, the heap leach pads, rock stockpiles and other activities that have the potential to affect surface and ground waters.
A Stage I, Surface Water, Sediment and Erosion Control Plan was prepared for the construction and early mining phases of the Project. This design applied to both the Approved Plan and the “What If Scenario”. Storm Water discharges will be regulated by the Water Board under the State’s NPDES General Construction Storm Water Permit during the initial construction phase of the Project and under the NPDES General Industrial Storm Water Permit during mine operations.
| February 2015 | 20-3 | |
|
|
Soledad Mountain Project
Kern County, CA, USA Technical Report |
ARCADIS U.S., Inc., a Qualified SWPPP Developer in California, therefore prepared the designs and GQM LLC filed Permit Registration Documents electronically through the Storm Water Multiple Application and Report Tracking System (SMARTS). The Documents included a Notice of Intent, Storm Water Pollution Prevention Plan (SWPPP), Risk Assessment, a Site Map and a signed certification statement by the Legally Responsible Person. GQM also paid the first annual fee. Note that the SWPPP alone is a 200-page document. Note further that the Documents filed through SMARTS meet applicable NPDES Storm Water Program requirements of the Kern County Engineering, Surveying & Permit Services Department. The Notice of Intent is now active.
GQM LLC and its consulting engineers prepared and submitted a second, revised ROWD to the Regional Board on April 16, 2012. The revised ROWD was prepared at the request of the Regional Board bring current all of the information that had been developed for the Project since 2007. The revised ROWD also includes an updated Closure Plan.
The Company has submitted quarterly and annual reports in compliance with the WDRs.
Groundwater monitoring consists of sampling groundwater in four wells once per quarter. The historical sampling method for these wells involved conventional large-volume purging with high-capacity pumps. An alternative sampling methods comparison was conducted on one well in 2011 and 2012. Based upon this evaluation, ARCADIS U.S., Inc. recommended installing dedicated low-flow bladder pumps in four wells and this was approved by the Water Board in May 2012. The low-flow bladder pumps and associated tubing were installed during the week of August 13, 2012. The Water Quality Monitoring and Data Management Procedures Manual was updated to reflect the changes.
Rinsing and neutralization of the leached residues on the heap are described in Section 17.8.7 of the Technical Report.
| 20.1.3 |
Air Quality – Authority to Construct and Permit to Operate |
GQM LLC had obtained seven Authority to Construct (“ATC”) permits dated March 16, 2002. These permits expired on March 16, 2004 and were not renewed due to changes anticipated in the Project.
A revised and updated Air Quality and Health Risk Assessment for the Project was completed and submitted to the Planning Department and the Eastern Kern Air Pollution Control District (“EKAPCD”) on July 21, 2009. All concerns about possible emissions were fully addressed in the SEIR. Feasible mitigation measures to reduce potential impacts from the Project to levels that are less than significant were recommended in the SEIR and included in the Mitigation Measures Monitoring Program or Conditions of Approval.
| February 2015 | 20-4 | |
|
|
Soledad Mountain Project
Kern County, CA, USA Technical Report |
Ten applications for ATC permits were submitted to the EKAPCD in February 2011. The EKAPCD confirmed that the information required to support the applications was complete. The draft ATC permits were received in September 2011. The Company’s consulting engineers and legal counsel completed their review of the draft ATC permits in January 2012. The ATC permits were issued by EKAPCD on February 8, 2012.
The ATC permits will be converted to a Permit to Operate after construction has been completed and subject to inspection by EKAPCD.
EKAPCD transferred an Emission Reduction Credit Certificate from Cactus Gold Mines Company to the Project in February 1999 and this remains valid.
Meteorological Monitoring Station
GQM LLC was required to install both upwind and downwind meteorological monitoring stations before the start of production and decided to proceed with the upwind monitoring station in May 2006 to add to the background database. The station was designed by Air Sciences Inc., Golden, Colorado and commissioned in September 2006. EKAPCD approved the design of the station in October 2006. Data are being recorded on a continuous basis and quarterly reports are being issued to EKAPCD.
The information generated by the station since 2006 provided the background information for the Air Quality and Health Risk Assessment that was completed in July 2009.
The downwind meteorological monitoring station was constructed in 2014 and is now in operation.
| 20.1.4 |
Closure, Reclamation and Reclamation Financial Assurance |
GQM LLC will prepare an updated closure and closing reclamation plan based on the new mine plan and sequence of mining the various open pit phases.
Cost estimates for site reclamation are described in Section 21.6. GQM LLC will provide reclamation financial assurance as required by the regulatory authorities.
| February 2015 | 20-5 | |
|
|
Soledad Mountain Project
Kern County, CA, USA Technical Report |
| 20.1.5 |
Additional Approvals and Permits |
As project development proceeds, GQM LLC will be required to obtain Kern County building permits to include all applicable California codes.
| 20.1.6 |
Environmental Management System |
GQM LLC is implementing an Environmental Management System (“EMS”) for its Project to manage the compliance obligations of its approvals and permits and applicable regulations. Basic elements of the system include:
| • | Define and review legal requirements; | |
| • | Develop a set of objectives and set targets to ensure compliance; | |
| • | Establish programs to meet these objectives and targets; | |
| • | Monitor and measure progress in achieving the objectives; | |
| • | Track regulatory citations and permit terms and stipulations; | |
| • | Schedule compliance obligations tasks with email reminders; | |
| • | Document incident details as required by federal, state and local agencies; | |
| • | Schedule and record employees' environmental training; | |
| • | Generate the information necessary for agency-required reports; and | |
| • | Periodically review the effectiveness of the EMS and make improvements. |
The EMS will assist the Company in addressing its regulatory requirements in a systematic and cost-effective manner. This proactive approach reflects the Company’s commitment to reduce the risk of non-compliance. The EMS will also help manage non-regulated opportunities, such as energy conservation, and can promote stronger operational control and employee stewardship.
| 20.2 |
Environmental Issues |
Environmental issues were fully addressed in the SEIR, which is described in Section 21.1.1. The Kern County Planning Commission certified the SEIR, adopted a Mitigation Measures Monitoring Program and Conditions of Approval for the Project which define conditions and performance standards which the mining operation must meet. The Mitigation Measures Monitoring Program and Conditions of Approval for the Project were amended by Planning Commission Resolution No. 171-10 adopted on October 28, 2010 and are now final.
| February 2015 | 20-6 | |
|
|
Soledad Mountain Project
Kern County, CA, USA Technical Report |
| 20.3 |
Considerations of Social and Community Impacts |
Mojave and the surrounding areas are areas of relatively high unemployment and employment has not recovered since the start of the financial downturn in 2008. The Project has therefore had a positive response from the local communities.
The Project is expected generate 200 jobs for an estimated total of 142 man-years of employment during construction. The Project will further have between 150 and 165 employees for the gold and silver heap leach operation once the mine is in full production and a further 15 employees during the period when aggregate is being produced from the site.
Jobs in the mining industry tend to be high-paying jobs when compared to the service industry.
GQM LLC plans to hire personnel mainly from the local area. The Kern County career-development office in Mojave had received upwards of 1,500 applications for employment specifically targeted at the Project at last count on January 1, 2015. These include applications from a significant number of experienced equipment operators and persons with a range of skills in the maintenance area.
Training of personnel for the operation will be required and will be done on an ongoing basis.
GQM LLC is active in the local community, with membership in the Mojave Chamber of Commerce (and a seat on the Board of Directors), various donations locally, presentations to local clubs and schools, and tours of the site for various organizations.
| February 2015 | 20-7 | |
|
|
Soledad Mountain Project
Kern County, CA, USA Technical Report |
| 21.0 |
CAPITAL AND OPERATING COSTS |
| 21.1 |
Manpower Estimates |
| 21.1.1 |
Salaried Personnel |
GQM LLC salaried employees will be responsible for the management and technical aspects of the operation. Responsibilities handled by salaried employees cover the areas of mining, processing, maintenance, purchasing/accounting/payroll and environmental management. During full production, the number of salaried employees on site will typically be 30.
The shift schedule of the salaried employees is dependent upon their position. Mine operations, plant operations and maintenance supervisors will work with the production crew they are responsible for on a 10-hour shift. The managers, most of the engineers and administrative/clerical employees will work an 8-hour shift for five days per week.
A number of salaried employees have been engaged to work on the Project during the construction year. As of January 31, 2015, the Company has hired 10 salaried employees.
| 21.1.2 |
Hourly-Paid Personnel |
GQM LLC hourly-paid personnel will be responsible for direct mining and processing operations, maintenance and support.
The Company plans to hire personnel mainly from the surrounding communities. Unemployment in the area is relatively high. However, given the limited amount of mining activity in the area, training of personnel for the operation will be required on an ongoing basis.
The schedule and method of calculating earnings for the hourly-paid employees is based on the following assumptions:
| • | The processing operations will operate 24 hours per day, seven days per week and 365 days per year. | |
| • | Employees working a continuous shift schedule will work a four days on and four days off schedule and the shift will be 10.5 hours long. | |
| • | The working year for hourly-paid employees is based upon 351 days per year and 10 working days of paid vacation. The number of hours worked by an employee is therefore 2,106 hours. |
| February 2015 | 21-8 | |
|
|
Soledad Mountain Project
Kern County, CA, USA Technical Report |
| • | Number of shifts worked by an hourly-paid employee is 175.5 shifts. |
Straight time is paid for 10 hours per shift with a half hour for a lunch break for a total of 10.5 hours on site per shift. These assumptions have been used to calculate the number of hourly-paid employees required and employee pay per year.
The estimated number of hourly-paid employees required over the Project’s life varies from a low of 138 to a high of 172 employees depending upon the ore and waste rock mining rates over the Project life. In order to reduce the variation in the number of hourly-paid employees from year to year, the feasibility of using increased overtime to cover peak production periods will be examined.
| 21.1.3 |
Salary and Benefits |
Every effort has been made to obtain realistic estimates for salaries, rates of pay for hourly-paid employees and benefits. This will require regular monitoring and updates as economic conditions change in the greater Mojave area. The cost of labor, including salaries, benefits and worker’s compensation is expected to amount between $12 million and $15 million per year.
| 21.2 |
Capital Cost Estimates |
| 21.2.1 |
Estimating Methods |
In order to generate an estimate with an accuracy of +/- 10%, engineering designs were completed for all of the facilities required for the Project in 2014. Drawings range from basic topographical maps of the site to process flow sheets, P&IDs and detailed general arrangement drawings.
Bids were solicited from equipment manufacturers and from contractors that can construct the facilities with a focus on acquiring bids from contractors located in the region, most of whom are familiar with conditions in the area.
Construction manpower and equipment required and bulk material quantity costs were estimated using current Project data and take-offs from the engineering drawings.
Final construction cost estimates for major components were received during 2014. GQM LLC has secured contracts for the construction of all turn-key projects.
| February 2015 | 21-9 | |
|
|
Soledad Mountain Project
Kern County, CA, USA Technical Report |
The Company projects that construction will take another nine months to complete and expects the start of commissioning in the fourth quarter of 2015.
| 21.2.2 | Basis of Estimate |
The following criteria were used to develop the capital and operating cost estimates:
| • | Project location and classification – approximately 5 miles (8 km) south of Mojave, California; new open pit mine development; includes upgrade of existing access to site which was completed in 2013. | |
| • | Power supply – power to be supplied by Southern California Edison from a 12.5 kV line that runs along the property boundary. | |
| • | Water supply – initial water supply from groundwater with possible backup supply of water from AVEK. | |
| • | Design and construction dates – detailed engineering design for construction began in 2009 to support construction that formally began on July 1, 2013. Final construction engineering designs were completed in 2014. | |
| • | Current mine life/life of facilities – approximately nine months remaining for construction, 12 years of mining with two years of neutralizing and rinsing. The potential for aggregate production using suitable waste rock and the sale of leached and rinsed residues is being actively pursued and could be carried on for an extended period. | |
| • | Facility usage level – 351 days/year, 20 hours/day (two 10-hour shifts) mining and operation of the crushing-screening plant and conveying and stacking system and 365 days/year, 24 hours/day (two 12-hour shifts) for the processing facilities such as solution management and the Merrill-Crowe plant. | |
| • | Design ore processing capacity – 5.1 million tons (4.6 million tonnes) per year. | |
| • | Regulatory requirements – detailed designs require approval and sign-off by a number of federal, state and county agencies and these are being secured on an as- required basis. | |
| • | Equipment – only new equipment is being used for the Project. | |
| • | Personnel availability – excellent manpower availability in the greater Mojave area; travel to/from Mojave and the surrounding communities during construction; no construction camp is required. | |
| • | Waste rock management – one waste rock storage pad east of the open pits, a second waste rock storage area in the area where the Phase 2 heap leach was located. Backfilling in mined-out phases of the open pits and suitable waste rock sold as aggregate. |
| February 2015 | 21-10 | |
|
|
Soledad Mountain Project
Kern County, CA, USA Technical Report |
| 21.2.3 |
Construction Field Coordination |
GQM LLC management is maintaining oversight of all construction activities with a number of contractors managing construction of the turn-key projects. The construction management team consists of the Manager – Plant Operations and support personnel.
The start-up commissioning team will also consist of the Manager – Plant Operations and support personnel. GQM LLC management is currently preparing a detailed commissioning plan.
Key project components are set out below. The construction status is as of January 31, 2015.
| • | Site preparation – site preparation has been completed; | |
| • | Access road – completed; | |
| • | Crushing-screening plant – the final engineering work and site preparation have been completed. The HPGR was ordered in July 2014. The construction of the Hilfiker wall is completed. Management expects completion of the crushing- screening plant in September 2015; | |
| • | Construction of leach pad Phase 1, Stage 1 – construction underway and completion expected in July 2015; | |
| • | Conveying and stacking - the final engineering work has been completed and construction on site is expected to start after March 1, 2015; | |
| • | Merrill-Crowe plant - the final engineering work has been completed and site preparation is completed; | |
| • | Laboratory – the construction is underway and we expect completion in March 2015; | |
| • | Workshop and warehouse – the construction has been completed. The equipment will be delivered in February 2015; | |
| • | Water supply and water storage – the Phase 1 project has been completed and the first production well (PW-1) is now connected to site. Phases 2, 3 and 4 are underway and completion is expected in May 2015. GQM LLC also expects to drill an additional production well (PW-4) in the second quarter of 2015 and complete the connection in August 2015; |
| February 2015 | 21-11 | |
|
|
Soledad Mountain Project
Kern County, CA, USA Technical Report |
| • | Power supply and distribution – currently underway and completion is expected in May 2015; | |
| • | Pre-production mining – expected to start in April 2015 |
| 21.2.4 |
Allowances |
Specific allowances have been included in the capital cost estimates:
| • | Construction equipment requirements determined by contractors; | |
| • | QA/QC during construction; | |
| • | Vendor representatives on site during construction and commissioning; | |
| • | Commissioning operating supplies and spare parts; | |
| • | Initial fills; | |
| • | Operating and maintenance manuals; and | |
| • | Owner’s insurance included in the pre-production overhead |
| 21.2.5 |
Pre-production Development of the North-West Open Pit |
Initial waste rock and ore mining and road construction have been included in the development capital. The geology of the North-West open pit is such that ore is released early in mining without the need for significant pre-stripping of waste rock. A portion of the ore mined during Year 0 will be stockpiled and then crushed and placed on the Phase 1, Stage 1 heap leach pad as the drainage layer.
| 21.2.6 |
Contingency |
Allowance has been made for a contingency of $15.0 million or approximately 15% of the estimated capital costs. This is judged to be a reasonable allowance in light of the detailed engineering that has been completed, cost estimates that have been obtained from vendors and purchase orders that have been issued, and contracts, especially contracts for the major turn-key projects that have been signed and where construction is now under way. Note approximately 70% of the remaining capital costs are represented by these turn-key and other contracts.
| February 2015 | 21-12 | |
|
|
Soledad Mountain Project
Kern County, CA, USA Technical Report |
| 21.2.7 |
Working Capital |
The estimated working capital required is $10 million. This is an estimate of the cash required from the initial commissioning of the facilities until positive cash flow is achieved. This estimate is approximately equal to three months of operating costs.
| 21.2.8 |
Capital Cost Summary |
The total estimated capital cost including owner’s cost, contingency, working capital and mobile mining equipment is $144.0 million. Please refer to Section 21.5 for details on mobile mining equipment. As of December 31, 2014, the Company had paid $25.4 million in construction capital cost and $1.1 million in mobile mining equipment.
Costs are shown in million US$ and are inclusive of sales tax.
Table 21-1. Capital Cost Summary
| Capital Costs Breakdown | Total Cost | Paid to Dec
31, 2014 |
Remaining
Cost |
| Site Preparation/Initial Site Support | $4.1 | $3.1 | $1.0 |
| Support Equipment | $2.0 | $0.3 | $1.7 |
| General Site Support | $1.6 | $0.9 | $0.7 |
| Approvals & Permits | $0.9 | $0.3 | $0.5 |
| EPCM | $7.9 | $3.5 | $4.4 |
| Operating Supplies & Spare Parts | $1.6 | $0.0 | $1.6 |
| Construction Indirect Costs / Freight | $1.4 | $0.1 | $1.3 |
| Pre-production Overhead | $4.0 | $1.8 | $2.1 |
| Pre-production Operations | $6.9 | $0.3 | $6.6 |
| Workshop & Warehouse / Fuel Storage | $3.2 | $2.8 | $0.4 |
| Laboratory and Primary & Blast Hole Samplers | $2.2 | $0.2 | $2.0 |
| Merrill-Crowe Plant & Solution Management | $10.7 | $0.8 | $9.9 |
| Crushing-Screening Plant | $25.2 | $6.7 | $18.5 |
| Construction of Leach Pad Phase 1/Stage 1 | $8.7 | $0.8 | $8.0 |
| Conveying & Stacking | $7.6 | $1.7 | $5.9 |
| Water Supply | $5.5 | $0.8 | $4.7 |
| Power Supply | $5.8 | $1.2 | $4.7 |
| Sub - Total | $99.3 | $25.4 | $73.9 |
| Contingency | $15.0 | $0.0 | $15.0 |
| Working Capital | $10.0 | $0.0 | $10.0 |
| Financial Assurance Estimate | $0.5 | $0.0 | $0.5 |
| Mobile Mining Equipment | $19.2 | $1.1 | $18.1 |
| Total | $144.0 | $26.5 | $117.5 |
| February 2015 | 21-13 | |
|
|
Soledad Mountain Project
Kern County, CA, USA Technical Report |
| 21.3 |
Sustaining Capital Cost Estimates |
The estimated sustaining capital cost for the Project is approximately $25.6 million. The sustaining capital includes the leach pad expansion, support equipment replacements, future capital spares in the plant area, and the purchase of a carbon plant for short-term use during the neutralizing and rinsing phase of the operation. The addition of mining equipment such as haul trucks and the replacement of mining equipment through the life of the mine are also included and total approximately $10.9 million.
A state sales tax of 7.5% has been applied to all applicable capital and operating costs (see also Section 21.4.5) .
| 21.4 |
Operating Cost Estimates |
| 21.4.1 |
Estimating Methods |
The tables in Section 21.4 and Section 21.5 have been taken directly from the cash flow model developed for the Project. Life of mine operating costs are summarized in Table 21-2 and annual operating costs are summarized in Table 21-3.
The operating costs are developed from zero-base budgeting using labor rates, equipment productivities and supply costs (for example diesel fuel, explosives, reagents and a range of operating supplies).
The operating cost estimates include all mining and process related activities from the start of production to the production of gold and silver doré. Downstream smelting and refining charges and royalties are included as stand-alone items in the cash flow model.
| 21.4.2 |
Basis of Estimate |
The operating costs have been developed based on a number of specific operating cost centers as set out below.
| • | Mining (Drilling, Blasting, Loading, Hauling, Surface Crew, Overhauls) | |
| • | Services | |
| • | Ore Supply | |
| • | Crushing & Screening |
| February 2015 | 21-14 | |
|
|
Soledad Mountain Project
Kern County, CA, USA Technical Report |
| • | Conveying & Stacking | |
| • | Solution Management | |
| • | Merrill-Crowe Plant | |
| • | Laboratory | |
| • | Maintenance | |
| • | Administration | |
| • | General Site Support | |
| • | Power Allocation and Power Costs | |
| • | Diesel Fuel Contingency |
A detailed, life of mine operating cost estimate has been prepared for each of the operating cost centers set out above.
The Project will be an owner-operated mining operation, which is the basis for the cost estimates.
| 21.4.3 |
Operating Costs for Mining and Support Equipment |
Detailed cost estimates per operating hour were prepared for the mining and support equipment based on annual hours of usage provided by Norwest based upon the mine plan and schedules. The estimated hourly operating costs are an important set of cost estimates for the Project. Road Machinery LLC and Komatsu America Corporation engineers have provided recommendations for periods between major overhauls based upon the hours of use and recommended useful life of the equipment. These suppliers have also provided maintenance, overhaul and equipment replacement costs.
| 21.4.4 |
Diesel Fuel Contingency |
Diesel fuel consumption has been estimated for the mining and support equipment, which ranges from approximately 0.75 to 1.4 million gallons (2.8 to 5.3 million liters) of dyed diesel fuel per year. Note that GQM LLC management has had extensive discussions on fuel consumption for the major mining equipment with Road Machinery LLC and Komatsu America Corporation engineers, who have confirmed the fuel consumption estimates.
The base cost for dyed diesel fuel delivered to site, including all taxes, was $1.80 per gallon ($0.48 per liter) on January 18, 2015 and this was provided by a fuel vendor based in Mojave.
| February 2015 | 21-15 | |
|
|
Soledad Mountain Project
Kern County, CA, USA Technical Report |
This base cost has been allowed for in the operating costs estimates for each of the operating cost centers listed in Section 22.4.2.
| 21.4.5 |
Sales Tax |
A state sales tax of 7.5% has been applied to all applicable capital and operating costs. Sales taxes have been explicitly broken out for materials with the exception of fuel, lubricants, explosives and power where it is already included in the quoted prices. Details are provided in each of the operating cost centers.
| 21.4.6 |
Operating Cost Summary |
Operating costs are based on fourth quarter 2014 and first quarter 2015 estimates. No escalation or allowance for inflation is included in any of the operating cost estimates. The life of mine site operating costs are estimated at $462.7 million or $9.06 per ton processed ($9.99 per tonne processed), as shown in the table below. Please refer to Table 21-3 for the operating costs per year of production.
Table 21-2. Operating Costs, LOM Summary
| Site Operating Costs
|
Total
LOM $ Million |
LOM
per Tonne Processed |
LOM
per Ton Processed |
| Mine | $205.7 | $4.44 | $4.03 |
| Maintenance - Mining | $19.5 | $0.42 | $0.38 |
| Services | $14.5 | $0.31 | $0.28 |
| Sub-Total Mining | $239.7 | $5.18 | $4.70 |
| Ore Supply | $5.2 | $0.11 | $0.10 |
| Crushing & Screening | $22.2 | $0.48 | $0.44 |
| Conveying & Stacking | $26.4 | $0.57 | $0.52 |
| Solution Management | $5.2 | $0.11 | $0.10 |
| Merrill-Crowe Plant | $45.8 | $0.99 | $0.90 |
| Laboratory | $6.7 | $0.15 | $0.13 |
| Maintenance - Processing | $19.5 | $0.42 | $0.38 |
| Power | $47.6 | $1.03 | $0.93 |
| Sales taxes on operating supplies | $11.0 | $0.24 | $0.22 |
| Sub-Total Processing | $189.7 | $4.10 | $3.72 |
| Administration | $31.7 | $0.68 | $0.62 |
| General Site Support | $1.6 | $0.03 | $0.03 |
| Sub-Total G&A | $33.3 | $0.72 | $0.65 |
| Total Site Operating costs | $462.7 | $9.99 | $9.06 |
| February 2015 | 21-16 | |
|
|
Soledad Mountain Project Kern County, CA, USA Technical Report |
Table 21-3. Annual Operating Costs Summary
| Site Operating Costs | Year 1 | Year 2 | Year 3 | Year 4 | Year 5 | Year 6 | Year 7 | Year 8 | Year 9 | Year 10 | Year 11 | Year 12 | Year 13 | Total |
| Mine | $10.1 | $15.7 | $19.2 | $22.8 | $23.2 | $20.6 | $19.6 | $21.2 | $17.6 | $16.4 | $13.3 | $6.0 | $0.0 | $205.7 |
| Maintenance - Mining | $1.4 | $1.6 | $1.8 | $1.8 | $1.8 | $1.8 | $1.8 | $1.8 | $1.8 | $1.6 | $1.6 | $0.8 | $0.0 | $19.5 |
| Services | $1.3 | $1.3 | $1.3 | $1.3 | $1.3 | $1.3 | $1.3 | $1.3 | $1.2 | $1.2 | $1.2 | $0.5 | $0.0 | $14.5 |
| Sub-Total Mining | $12.8 | $18.6 | $22.3 | $25.9 | $26.3 | $23.7 | $22.7 | $24.2 | $20.7 | $19.2 | $16.1 | $7.3 | $0.0 | $239.7 |
| Ore Supply | $0.4 | $0.4 | $0.5 | $0.5 | $0.5 | $0.4 | $0.4 | $0.5 | $0.5 | $0.5 | $0.5 | $0.2 | $0.0 | $5.2 |
| Crushing & Screening | $1.5 | $1.8 | $2.1 | $2.1 | $2.0 | $1.9 | $1.9 | $1.9 | $2.0 | $2.0 | $2.1 | $1.0 | $0.0 | $22.2 |
| Conveying & Stacking | $1.6 | $2.1 | $2.6 | $2.6 | $2.4 | $2.2 | $2.1 | $2.3 | $2.4 | $2.4 | $2.5 | $1.2 | $0.0 | $26.4 |
| Solution Management | $0.4 | $0.4 | $0.5 | $0.5 | $0.5 | $0.4 | $0.4 | $0.4 | $0.5 | $0.5 | $0.5 | $0.2 | $0.0 | $5.2 |
| Merrill-Crowe Plant | $2.7 | $3.6 | $4.5 | $4.5 | $4.2 | $3.8 | $3.7 | $3.9 | $4.3 | $4.2 | $4.3 | $2.0 | $0.1 | $45.8 |
| Laboratory | $0.5 | $0.6 | $0.6 | $0.6 | $0.6 | $0.6 | $0.6 | $0.6 | $0.6 | $0.6 | $0.6 | $0.2 | $0.0 | $6.7 |
| Maintenance - Processing | $1.7 | $1.7 | $1.7 | $1.7 | $1.7 | $1.7 | $1.7 | $1.7 | $1.7 | $1.7 | $1.6 | $0.7 | $0.0 | $19.5 |
| Power | $3.1 | $3.9 | $4.6 | $4.6 | $4.3 | $4.0 | $3.9 | $4.1 | $4.4 | $4.4 | $4.4 | $1.8 | $0.0 | $47.6 |
| Sales taxes on operating supplies | $0.5 | $0.7 | $1.0 | $1.2 | $1.2 | $1.0 | $1.0 | $1.1 | $1.0 | $1.0 | $0.8 | $0.4 | $0.0 | $11.0 |
| Sub-Total Processing | $12.4 | $15.2 | $18.1 | $18.4 | $17.3 | $16.2 | $15.8 | $16.5 | $17.4 | $17.4 | $17.2 | $7.7 | $0.1 | $189.7 |
| Administration | $2.9 | $2.9 | $2.9 | $2.8 | $2.8 | $2.8 | $2.8 | $2.8 | $2.8 | $2.8 | $2.7 | $0.8 | $0.0 | $31.7 |
| General Site Support | $0.1 | $0.1 | $0.2 | $0.2 | $0.1 | $0.1 | $0.1 | $0.1 | $0.2 | $0.2 | $0.2 | $0.0 | $0.0 | $1.6 |
| Sub-Total G&A | $3.0 | $3.0 | $3.0 | $3.0 | $3.0 | $2.9 | $2.9 | $2.9 | $3.0 | $2.9 | $2.9 | $0.8 | $0.0 | $33.3 |
| Total Site Operating Costs $ Million | $28.1 | $36.8 | $43.4 | $47.2 | $46.6 | $42.8 | $41.4 | $43.7 | $41.0 | $39.5 | $36.2 | $15.8 | $0.1 | $462.7 |
| Tons Processed (in Million) | 2.8 | 4.0 | 5.1 | 5.1 | 4.7 | 4.2 | 4.1 | 4.3 | 4.8 | 4.8 | 4.9 | 2.3 | 0.0 | 51.1 |
| Total Site Operating Costs per ton Processed | $10.06 | $9.31 | $8.49 | $9.27 | $10.00 | $10.12 | $10.19 | $10.08 | $8.57 | $8.26 | $7.37 | $6.83 | $9.06 |
| Other Operating Costs | ||||||||||||||
| Offsite charges | $0.1 | $0.3 | $0.5 | $0.6 | $0.5 | $0.4 | $0.4 | $0.5 | $0.5 | $0.4 | $0.3 | $0.1 | $0.0 | $4.6 |
| Property taxes | $0.8 | $2.2 | $2.5 | $2.6 | $2.4 | $2.1 | $2.1 | $2.1 | $1.7 | $1.3 | $0.9 | $0.6 | $0.0 | $21.2 |
| State of California Fee | $0.2 | $0.4 | $0.5 | $0.5 | $0.4 | $0.4 | $0.5 | $0.6 | $0.5 | $0.4 | $0.4 | $0.2 | $0.0 | $4.9 |
| Royalties | $0.1 | $2.6 | $3.0 | $3.7 | $1.9 | $2.8 | $3.0 | $3.2 | $3.2 | $3.0 | $2.6 | $1.0 | $0.0 | $30.1 |
| Reclamation Financial Assurance | $1.7 | $2.7 | $3.0 | $3.3 | $3.6 | $3.6 | $3.4 | $3.0 | $3.0 | $2.8 | $2.6 | $1.0 | $0.0 | $33.7 |
| Total Other Operating Costs | $2.8 | $8.2 | $9.4 | $10.8 | $8.7 | $9.2 | $9.4 | $9.3 | $8.8 | $7.9 | $6.8 | $2.9 | $0.0 | $94.3 |
| Total Operating Costs | $30.9 | $45.0 | $52.9 | $58.0 | $55.3 | $52.1 | $50.8 | $53.0 | $49.8 | $47.4 | $43.0 | $18.7 | $0.1 | $557.1 |
| Total Operating Costs per ton Processed | $11.08 | $11.39 | $10.33 | $11.38 | $11.87 | $12.31 | $12.50 | $12.22 | $10.42 | $9.91 | $8.75 | $8.07 | $10.91 |
| Operating Costs / Au Oz | ||||||||||||||
| Au Produced (post smelter) - k | 37.0 | 63.3 | 81.0 | 83.0 | 63.9 | 67.2 | 84.6 | 96.7 | 73.3 | 60.5 | 61.5 | 30.1 | 4.5 | 806.6 |
| Ag Produced (post smelter) - k | 172.2 | 411.4 | 831.6 | 1,238.2 | 884.9 | 666.2 | 671.0 | 777.0 | 883.6 | 825.1 | 565.9 | 231.2 | 38.0 | 8,196.3 |
| Operating Costs / Au Oz | $836 | $711 | $653 | $699 | $865 | $775 | $601 | $548 | $680 | $784 | $699 | $620 | $25 | $691 |
| Silver Credit per Oz of Au | ($79) | ($110) | ($175) | ($253) | ($235) | ($169) | ($135) | ($137) | ($205) | ($232) | ($156) | ($130) | ($143) | ($173) |
| Operating Costs / Au Oz Net of Silver Credit | $757 | $601 | $478 | $445 | $630 | $607 | $466 | $411 | $475 | $552 | $543 | $489 | ($117) | $518 |
| Sustaining Capex and Additional Mobile Equipment, per Oz of Au | $31.3 | $175.3 | $94.9 | $9.2 | $101.4 | $4.0 | $2.1 | $59.3 | $16.6 | $4.8 | $0.0 | ($69) | ($229) | $39.4 |
| Operating Costs / Au Oz Net of Silver Credit + Sustaining Capex | $788 | $776 | $573 | $454 | $731 | $611 | $468 | $470 | $492 | $557 | $543 | $420 | ($346) | $558 |
| February 2015 | 21-17 | |
|
|
Soledad Mountain Project
Kern County, CA, USA Technical Report |
| 21.5 |
Mobile Mining Equipment |
GQM LLC selected Komatsu equipment for the major mining equipment required for the Project. The Komatsu equipment is being purchased through Road Machinery LLC, which will also provide support services for the equipment. Komatsu Financial has provided GQM LLC with a $17 million line of credit to finance the equipment. This line of credit will cover the cost of the initial mobile mining equipment, net of sales tax and 10% cash deposit. The financing terms will vary per equipment type. The initial mining equipment required is summarized in the table below:
Table 21-4. List of Initial Mining Equipment
| Equipment | Quantity |
| Wheel Loader | 2 |
| Excavator (Large) | 1 |
| 100 ton Truck | 6 |
| Articulated Truck | 2 |
| Dozer (Large) | 1 |
| Dozer | 1 |
| Water Wagon | 1 |
| Wheel Dozer | 1 |
| Excavator (Small) | 1 |
| Grader | 1 |
| Small Dozer | 1 |
The Company received the water truck and the grader in 2014. One articulated truck was received in January 2015 and a second articulated truck and a dozer were received in February.
The Company expects to purchase more mobile mining equipment in Year 2, 3, 4, and 10 including five 100 ton (91 t) trucks, one large excavator, one dozer, and one grader (replacement).
The decision to proceed with the purchase of Komatsu equipment was a significant step toward production. The choice of Komatsu equipment and Road Machinery LLC to provide the support is well matched to Project needs.
Komatsu’s equipment price and quality as well as favorable financing terms, availability of spare parts and technical expertise, training and support to be provided by Road Machinery LLC were all critical factors in the process of selecting the major mining equipment.
| February 2015 | 21-18 | |
|
|
Soledad Mountain Project
Kern County, CA, USA Technical Report |
The Komatsu equipment will comprise the primary mining equipment fleet, including front-end loaders and an excavator, 100 ton (91 t) haul trucks and support equipment consisting of a smaller excavator, dozers, wheel dozer, motor grader, water truck and smaller 40 ton (36 t) articulated haul trucks.
The initial delivery of equipment started in November 2014 and will continue through early 2015 in preparation for pre-production mining, which is scheduled for April 2015.
Road Machinery LLC has committed to build a maintenance facility in Mojave to support the Komatsu equipment in use by a number of mining operations and quarries in the region. The decision to build such a facility was triggered by the decision to purchase Komatsu equipment for the Project. Road Machinery LLC also has extensive experience with equipment maintenance and will support maintenance of the equipment by providing a serviceman with a fully-equipped service truck. These costs have been included in the cash flow model for the life of the mine. A maintenance facility built in Mojave will be a significant boost for Mojave.
| 21.6 |
Financial Assurance Cost Estimates for Closure and Reclamation |
| 21.6.1 |
Background Information |
Financial assurance cost estimates are reviewed annually and financial assurances adjusted in accordance with the requirements the Surface Mining and Reclamation Act of 1975 (SMARA) to ensure that adequate funds are provided for reclamation of the disturbed areas.
Financial assurance is required in three forms:
| • | Reclamation financial assurance required by Kern County under SMARA; | |
| • | Neutralization and Closure financial assurance required by the Board Order and | |
| • | Reasonably Foreseeable Release financial assurance required by the Board Order. |
The following provision was included in CUP #27, Map #196, October 28, 2010:
(57) Prior to commencement of mining operations, the applicant shall post or establish and maintain with the Director of the Kern County Engineering, Surveying, and Permit Services Department and the California Department of Conservation/Office of Mine Reclamation one of the following:
| a. |
An irrevocable letter of credit; |
| February 2015 | 21-19 | |
|
|
Soledad Mountain Project
Kern County, CA, USA Technical Report |
| b. |
A surety bond or | |
| c. |
A trust fund in accordance with the approved financial assurances to guarantee the reclamation work will be completed in accordance with the approved reclamation plan. |
“The financial institution or surety company shall give the County at least 120 days’ notice of intent to terminate the letter of credit or bond. Financial assurances shall be reviewed annually and adjusted in accordance with the Surface Mining and Reclamation Act of 1975 (SMARA) requirements to substantiate that adequate funds exist to ensure reclamation of all existing disturbed acreage and the maximum amount of acreage expected to be disturbed during each coming calendar year. In addition, the financial assurances shall be adjusted annually to guarantee reclamation of excavated materials placed on site that exceed 25 feet of original surface contours pursuant to California Code of Regulations Section 3704.1. Prior to the approval of revised financial assurance, the Lead Agency shall submit all documentation to the California Department of Conservation/Office of Mine Reclamation for a 45 day review and comment period, pursuant to SMARA Section 2774.”
| 21.6.2 |
Form of Financial Assurance |
Kern County has various forms in which the financial assurance can be provided as set out above and information is available on the County web site at www.co.kern.ca.us/planning.
| 21.6.3 |
SMARA Financial Assurance - 2015 |
The estimate for reclamation of historical disturbances on the property and for reclamation of the disturbances to the end of 2015 is $624,142. This estimate was prepared by an independent consulting engineering firm based in Ventura, California. The estimate has been submitted to the Kern County Engineering, Surveying & Permit Services Department for comment which is normally received in the first quarter of any year. The estimate is then submitted to the State Office of Mine Reclamation for approval, which is typically received mid-year of any year.
GQM LLC provides the financial assurance in the form of an Irrevocable Standby Letter of Credit and the amount is placed on deposit with a branch of Union Bank, N.A., Bakersfield.
| February 2015 | 21-20 | |
|
|
Soledad Mountain Project
Kern County, CA, USA Technical Report |
| 21.6.4 |
Closure and Reclamation Cost Estimates – 2007 and 2009 |
Closure and reclamation cost estimates were prepared by Golder for the Application for a revised Surface Mining and Reclamation Plan prepared by GQM LLC and submitted to the Kern County Planning and Community Development Department in April 2007 (Revised May 25, 2009).
The following closure and reclamation cost estimates were prepared by Golder Associates:
| • | SMARA - The estimate was to $8,052,703 or $0.0505/ton ($0.0555/t) | |
| • | Neutralization & Closure - The estimate was $1,314,937 or $0.0255/ton ($0.0280/t). | |
| • | Reasonably Foreseeable Release - The estimate was $464,250 or 0.0291/ton ($0.0320/t). |
The total reclamation accrual in the 2012 Feasibility Study was $0.1050/ton ($0.1155/t) of ore and waste mined.
| 21.6.5 |
Reclamation and Closure Cost Estimates - 2015 |
There is a requirement in the approvals received for the Project that the closure and reclamation cost estimates be revised every year and be submitted for approval as set out in Section 22.6.3.
The reclamation accrual allowed for in the cash flow model is $0.1500/ton ($0.1650/t) of ore and waste rock mined for the life of the mine which is accumulated in a reclamation fund. The total accrual is approximately $34 million over the 12 year period. Closure and reclamation can be done from Year 15 onwards.
The reclamation accrual and the actual reclamation costs incurred from Year 15 onwards are only indicative at best at this point in time. Note that sequential backfilling and concurrent reclamation will be done through the life of the mine and any costs incurred during the life of the mine will be absorbed as an operating cost. The reclamation accrual will therefore provide the funds for closure and closing reclamation. Note further that the Project approvals are good for 30 years and that final closure and closing reclamation can be deferred as long as there is viable and ongoing processing of waste rock or leached and rinsed residues as aggregate on the property.
| February 2015 | 21-21 | |
|
|
Soledad Mountain Project
Kern County, CA, USA Technical Report |
The financial assurance will be released as reclamation work is completed and this procedure is well-established in Kern County.
GQM LLC management will prepare a Reasonably Foreseeable Release cost estimate in the first quarter of 2015 and submit the cost estimate to the Regional Board for review and approval.
| February 2015 | 21-22 | |
|
|
Soledad Mountain Project |
| Kern County, CA, USA | |
| Technical Report |
| 22.0 |
ECONOMIC ANALYSIS |
| 22.1 |
Methodology |
Tables referred to in Section 22 have been taken directly from the Project cash flow model.
The financial model is based upon net present values and internal rates of return using a discounted cash flow approach.
Project cash flows from year zero to Year 13 or from Project start-up to closure and reclamation of the heap leach facilities are shown in Table 22-1.
Capital expenditures up to December 31, 2014 have been excluded from the economic analysis.
The after-tax cash flow analyses are presented in Section 22.5.
| 22.2 |
Financial Model Parameters |
| 22.2.1 |
Basic Parameters |
The base case cash flow analysis is done on a constant United States dollar, after-tax, stand-alone Project basis. The capital cost is estimated to be $73.7 million ($99.1 million less the $25.4 million in expenditures up to December 31, 2014). The contingency estimate is $15.0 million and it is estimated that a further $10.5 million will be required as working capital plus the financial assurance cost estimate. The remaining mobile mining equipment will total $18.1 million. Total estimated capital costs are therefore $117.5 million. Refer to Section 21.2.8 for detailed breakdown of the capital costs.
Capital cost estimates are current to January 31, 2015 and exclude capital expenditures up to December 31, 2014.
| February 2015 | 22-1 |
|
|
|
Soledad Mountain Project |
| Kern County, CA, USA | |
| Technical Report |
| 22.2.2 |
Gold and Silver Prices |
Operating costs are described in Section 21.4. Operating costs are based on fourth quarter 2014 and first quarter 2015 estimates. No escalation or inflation is included in the operating cost estimates.
The cash flows have been discounted to December 31, 2014 and assume a mid-year convention.
Gold and silver prices used to model the base case cash flows are $1,250.00/oz and $17.00/oz respectively. Prices are fixed for the life of the mine.
| February 2015 | 22-2 |
|
|
|
Soledad Mountain Project |
| Kern County, CA, USA | |
| Technical Report |
Table 22-1. Cash Flow Analysis
| Year 0 | Year 1 | Year 2 | Year 3 | Year 4 | Year 5 | Year 6 | Year 7 | Year 8 | Year 9 | Year 10 | Year 11 | Year 12 | Year 13 | Total | ||
| 2015 | 2016 | 2017 | 2018 | 2019 | 2020 | 2021 | 2022 | 2023 | 2024 | 2025 | 2026 | 2027 | 2028 | |||
| PRODUCTION SCHEDULE | ||||||||||||||||
| Mining | ||||||||||||||||
| Ore mined | Million ton | 0.0 | 2.8 | 4.0 | 5.1 | 5.1 | 4.7 | 4.2 | 4.1 | 4.3 | 4.8 | 4.8 | 4.9 | 2.3 | 0.0 | 51.1 |
| Waste mined | Million ton | 0.7 | 8.2 | 14.3 | 14.7 | 16.9 | 19.3 | 19.8 | 18.4 | 15.7 | 15.1 | 14.2 | 12.7 | 4.1 | 0.0 | 174.1 |
| Total ore plus waste mined | Million ton | 0.8 | 11.0 | 18.3 | 19.9 | 22.0 | 24.0 | 24.0 | 22.5 | 20.0 | 19.9 | 19.0 | 17.6 | 6.4 | 0.0 | 225.1 |
| Strip Ratio | 17.80 | 3.00 | 3.61 | 2.88 | 3.32 | 4.15 | 4.67 | 4.52 | 3.61 | 3.16 | 2.97 | 2.57 | 1.76 | 3.41 | ||
| Contained Metals | ||||||||||||||||
| Au contained in ore | k oz | 1 | 57 | 83 | 103 | 98 | 72 | 83 | 109 | 121 | 82 | 72 | 77 | 27 | 0 | 984 |
| Ag contained in ore | k oz | 4 | 481 | 966 | 1,958 | 2,708 | 1,415 | 1,314 | 1,367 | 1,645 | 1,835 | 1,594 | 960 | 269 | 0 | 16,516 |
| Recovered Metals | ||||||||||||||||
| Gold produced and shipped in dorè | k oz | 0 | 37 | 63 | 81 | 83 | 64 | 67 | 85 | 97 | 73 | 61 | 62 | 30 | 5 | 807 |
| Silver produced and shipped in dorè | k oz | 0 | 173 | 414 | 838 | 1247 | 892 | 671 | 676 | 783 | 890 | 831 | 570 | 233 | 38 | 8,258 |
| Gold return (99.90 %) | k oz | 0 | 37 | 63 | 81 | 83 | 64 | 67 | 85 | 97 | 73 | 61 | 62 | 30 | 5 | 807 |
| Silver return (99.75 % ) after silver loss | k oz | 0 | 172 | 411 | 832 | 1238 | 885 | 666 | 671 | 777 | 884 | 825 | 566 | 231 | 38 | 8,196 |
| Gold Equivalent return | k oz | 0 | 39 | 69 | 92 | 100 | 76 | 76 | 94 | 107 | 85 | 72 | 69 | 33 | 5 | 918 |
| REVENUE | ||||||||||||||||
| Revenue from gold | $ Million | $0.0 | $46.3 | $79.1 | $101.2 | $103.8 | $79.9 | $83.9 | $105.7 | $120.9 | $91.6 | $75.6 | $76.9 | $37.7 | $5.7 | $1,008 |
| Revenue from silver | $ Million | $0.0 | $2.9 | $7.0 | $14.1 | $21.0 | $15.0 | $11.3 | $11.4 | $13.2 | $15.0 | $14.0 | $9.6 | $3.9 | $0.6 | $139 |
| TOTAL REVENUE | $ Million | $0.0 | $49.2 | $86.1 | $115.3 | $124.9 | $94.9 | $95.3 | $117.1 | $134.1 | $106.6 | $89.7 | $86.5 | $41.6 | $6.3 | $1,147.6 |
| COSTS | ||||||||||||||||
| Mining Costs | $ Million | $0.0 | $12.8 | $18.6 | $22.3 | $25.9 | $26.3 | $23.7 | $22.7 | $24.2 | $20.7 | $19.2 | $16.1 | $7.3 | $0.0 | $239.7 |
| Processing Costs | $ Million | $0.0 | $12.4 | $15.2 | $18.1 | $18.4 | $17.3 | $16.2 | $15.8 | $16.5 | $17.4 | $17.4 | $17.2 | $7.7 | $0.1 | $189.7 |
| G&A Costs | $ Million | $0.0 | $3.0 | $3.0 | $3.0 | $3.0 | $3.0 | $2.9 | $2.9 | $2.9 | $3.0 | $2.9 | $2.9 | $0.8 | $0.0 | $33.3 |
| Total operating costs | $ Million | $0.0 | $28.1 | $36.8 | $43.4 | $47.2 | $46.6 | $42.8 | $41.4 | $43.7 | $41.0 | $39.5 | $36.2 | $15.8 | $0.1 | $462.7 |
| Offsite charges | $ Million | $0.0 | $0.1 | $0.3 | $0.5 | $0.6 | $0.5 | $0.4 | $0.4 | $0.5 | $0.5 | $0.4 | $0.3 | $0.1 | $0.0 | $4.6 |
| Property taxes | $ Million | $0.0 | $0.8 | $2.2 | $2.5 | $2.6 | $2.4 | $2.1 | $2.1 | $2.1 | $1.7 | $1.3 | $0.9 | $0.6 | $0.0 | $21.2 |
| State of California fee | $ Million | $0.0 | $0.2 | $0.3 | $0.4 | $0.4 | $0.3 | $0.3 | $0.4 | $0.5 | $0.4 | $0.3 | $0.3 | $0.2 | $0.0 | $4.0 |
| State of California fee | $ Million | $0.0 | $0.0 | $0.0 | $0.1 | $0.1 | $0.1 | $0.1 | $0.1 | $0.1 | $0.1 | $0.1 | $0.1 | $0.0 | $0.0 | $0.8 |
| Total of State of California fees for gold and silver | $ Million | $0.0 | $0.2 | $0.4 | $0.5 | $0.5 | $0.4 | $0.4 | $0.5 | $0.6 | $0.5 | $0.4 | $0.4 | $0.2 | $0.0 | $4.9 |
| Cash payment for Reclamation Financial Assurance | $ Million | $0.1 | $1.7 | $2.7 | $3.0 | $3.3 | $3.6 | $3.6 | $3.4 | $3.0 | $3.0 | $2.8 | $2.6 | $1.0 | $0.0 | $33.8 |
| Royalty payable net minimums | $ Million | $0.2 | $0.1 | $2.6 | $3.0 | $3.7 | $1.9 | $2.8 | $3.0 | $3.2 | $3.2 | $3.0 | $2.6 | $1.0 | $0.0 | $30.3 |
| TOTAL COSTS | $ Million | $0.3 | $30.9 | $45.0 | $52.9 | $58.0 | $55.3 | $52.1 | $50.8 | $53.0 | $49.8 | $47.4 | $43.0 | $18.7 | $0.1 | $557.4 |
| CASH FLOW FROM OPERATIONS BEFORECAPEX AND TAX | $ Million | ($0.3) | $18.3 | $41.1 | $62.5 | $66.8 | $39.6 | $43.2 | $66.3 | $81.1 | $56.8 | $42.3 | $43.5 | $22.9 | $6.2 | $590.3 |
| CAPITAL COSTS | ||||||||||||||||
| Initial capex and residual value recovery (Including taxes) | $ Million | $88.9 | ($15.8) | $73.1 | ||||||||||||
| Working capital after startup | $ Million | $10.00 | $10.0 | |||||||||||||
| Financial assurance | $ Million | $0.5 | $0.5 | |||||||||||||
| Sustaining capital expenditures (Including taxes) | $ Million | $1.2 | $8.1 | $0.2 | $0.6 | $6.5 | $0.3 | $0.2 | $5.7 | $1.2 | $0.0 | $0.0 | $1.6 | ($1.0) | $24.6 | |
| Mining equipment (Including taxes) | $ Million | $18.1 | $0.0 | $2.9 | $7.5 | $0.1 | $0.0 | $0.0 | $0.0 | $0.0 | $0.0 | $0.3 | ($3.7) | $25.3 | ||
| Capex plus working capital to startup and residual value | $ Million | $117.5 | $1.2 | $11.1 | $7.7 | $0.8 | $6.5 | $0.3 | $0.2 | $5.7 | $1.2 | $0.3 | $0.0 | ($2.1) | ($16.8) | $133.4 |
| CASH FLOW FROM OPERATIONS BEFORETAX | $ Million | ($117.8) | $17.1 | $30.0 | $54.8 | $66.1 | $33.1 | $42.9 | $66.1 | $75.4 | $55.6 | $42.0 | $43.5 | $25.0 | $23.0 | $456.9 |
| INCOMETAXES | ||||||||||||||||
| US federal corporate tax liability net AMT tax credit | $ Million | $0.0 | $0.0 | $0.0 | $6.9 | $5.6 | $4.1 | $4.0 | $8.7 | $15.2 | $11.6 | $8.6 | $9.2 | $5.4 | $6.9 | $86.2 |
| California State Corporate Income Tax | $ Million | $0.0 | $0.0 | $0.8 | $2.3 | $2.9 | $1.0 | $1.2 | $2.9 | $4.6 | $3.5 | $2.6 | $2.8 | $1.6 | $1.9 | $28.2 |
| Total Tax | $ Million | $0.0 | $0.0 | $0.8 | $9.2 | $8.5 | $5.1 | $5.2 | $11.6 | $19.8 | $15.2 | $11.2 | $12.0 | $7.0 | $8.8 | $114.4 |
| CASH FLOW FROM OPERATIONS AFTER TAX | $ Million | ($117.8) | $17.1 | $29.2 | $45.6 | $57.6 | $28.0 | $37.8 | $54.5 | $55.6 | $40.4 | $30.7 | $31.5 | $18.0 | $14.3 | $342.5 |
| February 2015 | 22-3 |
|
|
|
Soledad Mountain Project |
| Kern County, CA, USA | |
| Technical Report |
| 22.2.3 |
Net Smelter Returns |
The Project will produce a doré in the refinery on site. The quantity and quality of the doré produced on site are described in Section 17.4 and Section 17.5 respectively. It is expected that the doré will be shipped to a refinery located in the United States and that is the assumption that has been made for the cash flow analysis. The smelting and refining charges provided by Johnson Matthey Inc. are described in Section 17.5. The smelting and refining charges are shown as a line item in the cash flow table.
| 22.2.4 |
Sales Taxes |
A state sales tax of 7.5% has been applied to all applicable capital and operating costs. Sales taxes on operating supplies are shown as a line item in the cash flow table.
| 22.2.5 |
Property Taxes |
Kern County property taxes are treated as an operating cost in the cash flow model. Property taxes for industrial projects in Kern County are calculated based on 1.0% of the calculated annual remaining net present value for the Project. The net present value is calculated on net cash flow after subtracting cost to produce saleable gold and silver, operating costs, accrual for reclamation, and all capital expenditures. The discount rate used for calculation of the annual NPV is negotiated with the County. The County has indicated that a discount rate in the range of 19.0% is reasonable. A discount rate of 19.0% has been used for the calculation of property taxes. Property taxes are shown as a line item in the cash flow table.
| 22.2.6 |
Reclamation and Closure Costs |
Reclamation and closure cost estimates are described in Section 21.6. The reclamation accrual is shown as a line item in the cash flow table.
| 22.2.7 |
Royalties and State Fees |
There are multiple third party landholders and the royalty formula applied to mine production varies with each landholder. This leads to a complex set of royalty calculations. GQM LLC has developed a model for a detailed royalty calculation and this is shown in a separate tab in the cash flow model.
| February 2015 | 22-4 |
|
|
|
Soledad Mountain Project |
| Kern County, CA, USA | |
| Technical Report |
State fees for payable gold and silver have been applied at the following rates:
| • | Gold fee = $5.00/oz gold (post-smelter) and | |
| • | Silver fee = $0.10/oz silver (post-smelter) |
Royalties paid to third party landholders and fees paid to the state are shown as line items in the cash flow table.
| 22.2.8 |
Residual Values |
The financial model assumes there is a residual value of $3.7 million estimated and allowed for in Year 12 for the mobile mining and support equipment. The residual value has been estimated by prorating the original equipment cost by the remaining useful life of the equipment and then applying a discount factor. The financial model also assumes there is a residual value of $15.8 million in Year 13 for the processing equipment and a residual value of $1.0 million in Year 13 for the sustaining capital (primarily for the carbon plant).
| 22.2.9 |
Federal and State Taxes |
The taxes are calculated on the assumption that the Company is a stand-alone entity with the Project its only asset. The tax calculation also allows for the tax loss carry-forward of $26 million. Federal and state taxes are shown as a line item in the cash flow table. The federal tax rate is 35% and the state tax rate is 8.84% .
| 22.3 |
Capital Cost Estimates |
Initial capital cost estimates are described in Section 21.2.
| 22.4 |
Mobile Mining Equipment Financing |
Mobile mining equipment is described in Section 21.5.
| February 2015 | 22-5 |
|
|
|
Soledad Mountain Project |
| Kern County, CA, USA | |
| Technical Report |
| 22.5 |
Cash Flow Analysis |
| 22.5.1 |
After-tax Cash Flow Analysis |
The base case cash flow analysis is done on a constant United States dollar, after-tax, stand-alone Project basis.
The Project has an indicated after-tax internal rate of return (IRR) on capital employed of 28.3% . The after-tax net present value (NPV) is $214 million with a discount rate of 5.0% and the undiscounted, cumulative net cash flow after tax is approximately $342 million. A 5.0% discount rate is reasonable for a project at this stage and is in-line with standard industry practices. By comparison, at an 8.0% discount rate, the after-tax NPV is $160 million. The indicated contribution of gold and silver to gross revenues is 88% and 12% respectively at current gold and silver prices, with a total cash cost per ounce of gold produced, net of silver credits, of $518/oz. The total cash costs including sustaining capital is $558/oz. Gold and silver prices used to model the cash flows were $1,250 and $17.00, respectively.
The Project generates positive cash flow in the first year of production and reaches cumulative positive cash flow in the fourth year of production. Cash flows remain positive each year thereafter through the mine life.
| 22.5.2 |
Sensitivity Analysis |
The sensitivity of Project cash flows to increases in capital costs (initial capital, working capital and sustaining capital) and site operating costs was evaluated using the base case gold and silver prices. The Project after-tax NPV (5% discount rate) is relatively insensitive to increases in either of these costs as shown in the table below.
| February 2015 | 22-6 |
|
|
|
Soledad Mountain Project |
| Kern County, CA, USA | |
| Technical Report |
Table 22-2. Project After-Tax NPV with Changes in Capital and Operating Costs
| Increase / (Decrease) Site Operating Costs | ||||||||
| (15%) | (10%) | (5%) | 0.0% | 5.0% | 10.0% | 15.0% | ||
| Increase / (Decrease) Capital | (15%) | $262.3 | $251.8 | $241.1 | $230.2 | $219.2 | $207.9 | $196.7 |
| (10%) | $257.2 | $246.5 | $235.8 | $224.8 | $213.7 | $202.4 | $191.2 | |
| (5%) | $251.9 | $241.3 | $230.4 | $219.4 | $208.2 | $196.9 | $185.7 | |
| 0.0% | $246.6 | $236.0 | $225.0 | $213.9 | $202.7 | $191.4 | $180.2 | |
| 5.0% | $241.4 | $230.6 | $219.7 | $208.4 | $197.2 | $185.9 | $174.7 | |
| 10.0% | $236.1 | $225.2 | $214.2 | $202.9 | $191.7 | $180.4 | $169.1 | |
| 15.0% | $230.8 | $219.9 | $208.7 | $197.4 | $186.2 | $174.9 | $163.6 | |
Table 22-3. Project After-Tax IRR with Changes in Capital and Operating Costs
| Increase / (Decrease) Site Operating Costs | ||||||||
| (15%) | (10%) | (5%) | 0.0% | 5.0% | 10.0% | 15.0% | ||
| Increase / (Decrease) Capital | (15%) | 37.0% | 35.8% | 34.6% | 33.3% | 32.1% | 30.8% | 29.5% |
| (10%) | 35.0% | 33.9% | 32.7% | 31.5% | 30.3% | 29.1% | 27.8% | |
| (5%) | 33.2% | 32.1% | 31.0% | 29.9% | 28.7% | 27.5% | 26.3% | |
| 0.0% | 31.6% | 30.5% | 29.4% | 28.3% | 27.2% | 26.1% | 24.9% | |
| 5.0% | 30.1% | 29.1% | 28.0% | 26.9% | 25.8% | 24.7% | 23.6% | |
| 10.0% | 28.7% | 27.7% | 26.7% | 25.6% | 24.6% | 23.5% | 22.4% | |
| 15.0% | 27.4% | 26.4% | 25.4% | 24.4% | 23.4% | 22.4% | 21.3% | |
The sensitivity of the Project cash flows to changes in gold and silver prices was further examined. The after-tax NPV for a range of silver and gold price variances from the base case are shown in the table below.
| February 2015 | 22-7 |
|
|
|
Soledad Mountain Project |
| Kern County, CA, USA | |
| Technical Report |
Table 22-4. Project After-Tax NPV with Changing Metal Prices
| Gold Price US$/oz | |||||||
| $1,100 | $1,200 | $1,250 | $1,300 | $1,400 | $1,500 | ||
| Silver Price US$ /oz | $14.00 | $143.1 | $182.5 | $202.1 | $221.7 | $260.3 | $298.1 |
| $15.50 | $149.0 | $188.4 | $208.0 | $227.5 | $266.0 | $303.7 | |
| $17.00 | $155.0 | $194.3 | $213.9 | $233.3 | $271.6 | $309.3 | |
| $18.50 | $160.9 | $200.1 | $219.7 | $239.1 | $277.3 | $314.9 | |
| $20.00 | $166.8 | $206.0 | $225.6 | $244.9 | $283.0 | $320.5 | |
| $21.50 | $172.7 | $211.9 | $231.4 | $250.6 | $288.6 | $326.1 | |
Table 22-5. Project After-Tax IRR with Changing Metal Prices
| Gold Price US$/oz | |||||||
| $1,100 | $1,200 | $1,250 | $1,300 | $1,400 | $1,500 | ||
| Silver Price US$ /oz | $14.00 | 21.4% | 25.4% | 27.3% | 29.1% | 32.7% | 36.2% |
| $15.50 | 22.0% | 25.9% | 27.8% | 29.6% | 33.2% | 36.6% | |
| $17.00 | 22.5% | 26.4% | 28.3% | 30.1% | 33.7% | 37.1% | |
| $18.50 | 23.1% | 27.0% | 28.8% | 30.6% | 34.2% | 37.5% | |
| $20.00 | 23.7% | 27.5% | 29.3% | 31.1% | 34.6% | 38.0% | |
| $21.50 | 24.2% | 28.0% | 29.8% | 31.6% | 35.1% | 38.4% | |
| February 2015 | 22-8 |
|
|
|
Soledad Mountain Project |
| Kern County, CA, USA | |
| Technical Report |
| 23.0 |
ADJACENT PROPERTIES |
This section is not relevant to the Report.
| February 2015 | 23-1 |
|
|
|
Soledad Mountain Project |
| Kern County, CA, USA | |
| Technical Report |
| 24.0 |
OTHER RELEVANT DATA AND INFORMATION |
| 24.1 |
Risks |
| 24.1.1 |
Mining Risk |
It will be important to implement effective grade control procedures, as otherwise dilution and/or ore losses may be higher than the estimates used in this study.
Project ore grades may be higher than currently modeled which could increase the size of the open pits. It will be important to identify this as early as possible in the life of the mine so that a different pit phasing can be followed to mine the larger pit limits. Should additional ore be mined, leach pad capacity will be critical and strategies for optimizing the ore crushed and stacked on the pad or developing additional leach pad capacity will be necessary.
Note an allocation of $0.10 per ton ($0.11 per tonne) mined was added to the economic analysis to account for selective mining.
| 24.1.2 |
Processing Risk |
| 24.1.2.1 |
Gold Recovery Risks |
As discussed in Section 13.5, the methodology for applying recoveries in the mine plan differed from that recommended by KCA, resulting in a slightly higher recovery than was recommended by KCA. It is KCA’s opinion that there is a medium level risk that the final recoveries are slightly aggressive and that the actual recovery achieved in operations may be lower.
There are other risks that could have an impact on the overall recovery, as indicated below:
| • |
There is a lack of samples for HPGR column tests throughout the ore body, particularly for quartz latite and pyroclastics ore types. The consistent results from the 1995 bottle roll campaign partially offset this to a low-to-medium risk. | |
| • |
There is a risk that the older 1990 HPGR tests for rhyolite and pyroclastics are actually a valid representation of recovery, which if taken into account would reduce the proposed average recoveries for both ore types and possibly also the upside potential of high grade ore recoveries. This is a low to medium risk. |
| February 2015 | 24-1 |
|
|
|
Soledad Mountain Project |
| Kern County, CA, USA | |
| Technical Report |
| • |
The design primary irrigation cycle is short (70 days) and the field leach time is long (estimated 290 days). Up to three overlying lifts worth of indirect leaching is therefore required to reach the ultimate recovery. This is a medium risk. | |
| • |
Assumptions were made about the grade recovery relationships for pyroclastics and quartz latite based only on the rhyolite grade recovery relationship, with minimal or no direct supporting data. This is a low-to-medium risk. |
| 24.1.2.2 |
Cement Usage |
Compacted permeability test work on certain samples of rhyolite ore indicated potentially low permeability at the ultimate heap height and design irrigation rates. Cement levels have been elevated to address this, however the available test work does not clearly define the minimum cement requirement for consistent adequate permeability. If the requirement ends up exceeding the actual usage, problems with heap permeability may be encountered. Additional costs may be incurred to install additional drainage in the heap, along with a possible decrease in overall recovery. This is a low to medium risk.
It is recommended that further test work be conducted before the start of operations (or very early into operations, using actual plant-agglomerated ore) to better establish the minimum cement dosage for adequate permeability at the design ultimate heap height.
| 24.1.2.3 |
Heap Capacity |
The design tonnage from the mine plan is proposed to be contained in the Phase 1 heap leach pad at a density of 100 lb/ft3 (1.6 t/m3). Uncompacted densities for HPGR column leach tests averaged 90.6 lb/ft3(1.45 t/m3). Although some compacted permeability tests indicated that a density of 100 lb/ft3 (1.6 t/m3) might be achieved, there is a low risk that true compacted densities in operation may not reach this density, in which case the pad will not contain the design tonnage. If this occurs GQM LLC will have to increase heap leach pad capacity or else consider stacking an additional lift over the existing lined area.
| 24.1.2.4 |
Other Processing Risks |
Heap leach operations will need to be optimized with operational experience. The leaching properties and timelines may be different on a large scale than indicated by laboratory test work.
| February 2015 | 24-2 |
|
|
|
Soledad Mountain Project |
| Kern County, CA, USA | |
| Technical Report |
| 24.1.3 |
Environmental Risk |
Dust control may require additional efforts. This may include amending the surfaces of the haul roads to keep down dust. GQM LLC has made allowance for the use of a lignin-based dust control product in its operating cost estimates. The product is a binder specifically formulated to control fugitive dust from haul roads and stockpiles.
| 24.1.4 |
Capital Cost Risk |
Costs for contractors, personnel, materials and equipment are volatile throughout North America. There could be significant changes in the construction costs depending upon the construction timeline for the Project. However, the GQM LLC has locked approximately 70% of its remaining capital costs with turn-key contracts and other contracts, which protects against capital cost increases.
| 24.1.5 |
Operating Cost Risk |
There could be significant changes in the actual prices paid for operating supplies during the life of the mine as compared to the current cost estimates. Additionally, if equipment productivities turn out to be different than current estimates, this can have a significant impact on the Project cash flows.
The Project cash flows are sensitive to changes in the price of dyed diesel fuel. A diesel fuel contingency has been included as an operating cost item and this allows rapid adjustment of the operating cost estimates as diesel fuel prices fluctuate.
Process operating costs are based on samples tested in a number of laboratories and the accuracy of the methods used to calculate reagent consumptions must be confirmed once the mine is in production. To mitigate this risk and fully take advantage of any opportunities, an experienced and stable processing crew is required.
| 24.1.6 |
Aggregate Sales Risk |
The current mine plan assumes the Company is able to sell approximately 30 million tons (27 million tonnes) of waste rock as aggregates for a range of purposes to local and regional markets, and a significant quantity of leached ore residues to local markets. Although no revenues are shown in the cash flow analyses for aggregate sales, the backfilling and reclamation requirements imposed on the Project limit the life of the mine if no aggregate sales can be completed. The life of mine could be reduced if confirmation of aggregate sales is not achieved during the initial five years or so of mining. See Section 1.28 for further details.
| February 2015 | 24-3 |
|
|
|
Soledad Mountain Project |
| Kern County, CA, USA | |
| Technical Report |
| 24.1.7 |
Legal/Permitting Risk |
In the mine plan as currently configured, the southern portion of the East Pit access haul road extends across the Approved Project Boundary and onto Section 8, which is BLM land. The Company however has control of the land with a series of unpatented lode mining claims. If access is not secured, reconfiguration of the haul road could marginally increase haul cycle times.
| 24.2 |
Opportunities |
| 24.2.1 |
Mineral Resource Opportunity |
Mineral resource opportunities and risks are discussed in Section 14.2.10.
| 24.2.2 |
Processing Opportunity |
The recovery figures obtained from laboratory testing were used as recommended in the recovery estimates used for this feasibility study. There are numerous projects that have failed to achieve the recoveries anticipated from test work but there are also numerous projects that were able to achieve higher recoveries than would have been anticipated. Higher recoveries would lead to higher overall gold and silver production with the resulting benefit to Project cash flows.
Note specifically that the current silver recovery is estimated at only 50.0% . Silver recoveries of 65.0% and higher were projected in a number of feasibility studies done by independent consulting engineers before 2000.
| 24.2.3 |
Aggregate Production |
GQM is actively investigating the potential for developing a by-product aggregate and construction materials business once the heap leach operation is in full production. The source of raw materials will be suitable quality waste rock specifically stockpiled for this purpose. Test work done in the 1990s confirmed the suitability of waste rock as aggregate and construction material. There is also the potential to market the rinsed leach material when mine operations cease. Based on currently projected mine plans, there may be sufficient material to allow aggregate for production for an extended period beyond the gold and silver production period. However, no contributions from the sale of such products will be included in the cash flow projections until long term contracts for the sales of these products are secured. In addition to the benefit of aggregate sales revenue, if additional waste dump volume can be achieved through selling the waste rock as aggregate, the potential for increasing the mineable ore quantity exists as the current mine plan is constrained by backfill and the requirement that all activities take place within the Approved Project Boundary.
| February 2015 | 24-4 |
|
|
|
Soledad Mountain Project |
| Kern County, CA, USA | |
| Technical Report |
| 24.3 |
Project Schedule |
Construction started formally on July 1, 2013. Construction continued through the remainder of 2013 and 2014 as funds became available. GQM LLC management now projects that construction will take approximately nine months to complete, after which commissioning is expected to begin in the fourth quarter of 2015.
| February 2015 | 24-5 |
|
|
|
Soledad Mountain Project |
| Kern County, CA, USA | |
| Technical Report |
| 25.0 |
INTERPRETATION AND CONCLUSIONS |
| 25.1 |
MDA Interpretations and Conclusions |
MDA reviewed the Project drill-hole and channel-sample data, constructed a resource database, compiled and analyzed available QA/QC data, reviewed numerous reports that describe the geology, exploration, development, and mining history of Soledad Mountain, and visited the Project site on several occasions. MDA believes the Project data reasonably represent the Project and are sufficient to support the estimation of resources described herein.
A review of available QA/QC data leads to two observations: (1) the variability in duplicate analyses at grades in the range of the resource cutoff grade is high, but not unexpectedly so; and (2) check assay data from multiple third-party labs indicate the database gold values for the holes represented by the check assays may be low and the silver values may be high (the check assays represent subsets of holes drilled by GQM LLC in 1988, 1996, and 1997). While the variability of the gold and silver analyses should not materially impact the resources, there could be implications with respect to the categorization of ore vs. waste in a mining operation. If the biases in the gold and silver analyses evidenced by the check-assay data are indeed real, they would lead to some unquantifiable underrepresentation of gold grades (and therefore ounces) and overrepresentation of silver grades (and ounces) in portions of the resource model relative to the actual in situ mineralization.
The GFA channel samples are used as-is in the estimation of the project resources (gold grades are not factored to lower values as has been done in previous estimations); channel samples by GQM LLC and other companies were also used. To quantify the risk imparted by the channel-sample data, separate gold estimations were completed using none of the channels, GFA channels only, and non-GFA channels only. The only material impact to the project resources caused by these test runs occurs when the GFA channel samples are excluded from the estimation, which results in loss of 128,000 ounces at the resource cutoff grade.
The Project resources are based on modeling of over 20 gold- and silver-bearing structures and their related subordinate splits and subparallel zones. These mineralized structures occur over a total strike-length of 7,000 ft (2,100 m) and a width of 4,500 ft (1,400 m). While the resource database includes almost 900 surface and underground drill holes and hundreds of underground channel samples, some of the mineralized structures are not fully defined, partly due to the large footprint of the Soledad Mountain mineralization and partly due to logistical challenges (steep slopes). The potential to convert Inferred resources to higher categories in sparsely drilled areas, as well as to define additional resources, is excellent.
| February 2015 | 25-1 |
|
|
|
Soledad Mountain Project |
| Kern County, CA, USA | |
| Technical Report |
| 25.2 |
Metallurgical Test Work |
The primary ore types that will be mined are porphyritic rhyolite and Flow-banded rhyolite, pyroclastics and quartz latite porphyry representing approximately 55%, 32% and 13% of the ore quantities respectively.
Extensive test work and process development work done on the Project ore types from 1988 to 2007 show that these ores are readily amenable to heap leaching provided the material is crushed to relatively small sizes. A series of tests using a HPGR and bottle roll and column leach tests was performed to confirm the flow sheet and to provide design criteria for the design of the crushing-screening plant. The test work shows that the HPGR will have distinct advantages over conventional crushing and screening in preparing particles for heap leaching in this particular application. Recoveries for gold and silver are based upon tails obtained in HPGR-based column leach tests. The work completed during the various metallurgical test programs supports the assumptions and designs discussed in this feasibility study.
| 25.3 |
Mineral Resource Estimates |
The mineral resource estimation for the Project follows the guidelines of Canadian National Instrument 43-101 and meets the requirements of CIM (2014).
Measured and Indicated Mineral Resource Estimates total 92.1 M tons (83.5 M tonnes) grading 0.017 oz/ton (0.575 g/t) Au, and 0.28 oz/ton (9.53 g/t) Ag and are inclusive of Mineral Reserve Estimates. Inferred Mineral Resource Estimates total 23.6 M tons (21.4 M tonnes) grading 0.010 oz/ton (0.343 g/t) Au and 0.21 oz/ton (7.2 g/t) Ag. Mineral Resources that are not Mineral Reserves do not have demonstrated economic viability. Mineral Resource Estimates are tabulated using a AuEq cut-off grade of 0.004 oz/ton (0.137 g/t) calculated using gold:silver price ratio of 55 and a gold:silver recovery ratio of 1.6.
| 25.4 |
Mineral Reserve Estimates |
The feasibility level mine plan was developed for an open pit mining operation feeding approximately 5.1 million tons per year of ore to a crushing-screening plant for stacking on a heap leach pad. Gold and silver would be recovered from the leach solution in the form of dorè.
| February 2015 | 25-2 |
|
|
|
Soledad Mountain Project |
| Kern County, CA, USA | |
| Technical Report |
The open pit designs were based upon the results of a series of Lerchs-Grossman pit optimization analyses.
The mine plan is based on utilizing wheel loaders, and a hydraulic excavator and rear-dump haul trucks for the primary mining supported by a smaller development fleet for pioneering access roads, upper pit benches and final ore mining at the bottom of the various mining phases.
The crushing-screening plant includes a primary and secondary crusher and screen. An HPGR is used in the crushing-screening circuit to prepare the ore for stacking on one heap leach pad. Pregnant solution will be pumped to the Merrill-Crowe plant where gold and silver will be extracted from solution for the production of dorè. The dorè will be transported to an off-site smelter and refinery for final production of saleable gold and silver.
Mineral Reserve Estimates have been modified from Mineral Resource Estimates by including geological, mining, processing, and economic factors. The reserve estimates are classified in accordance with the 2010 CIM Definition Standards for Mineral Resources and Mineral Reserves.
The Mineral Reserve Estimates are summarized below:
Table 25-1. Mineral Reserves
| In-Situ Grade | Contained Metal | |||||||
| Gold | Silver | Gold | Silver | |||||
| Reserve Category | tonnes | tons | g/t | oz/ton | g/t | oz/ton | oz | oz |
| Proven | 3,357,000 | 3,701,000 | 0.948 | 0.0276 | 14.056 | 0.410 | 102,300 | 1,517,100 |
| Probable | 42,957,000 | 47,352,000 | 0.638 | 0.0186 | 10.860 | 0.317 | 881,300 | 14,999,100 |
| Total & Average | 46,315,000 | 51,053,000 | 0.661 | 0.0193 | 11.092 | 0.324 | 983,600 | 16,516,200 |
Note - A gold equivalent cut-off grade of 0.005 oz/ton was used for quartz latite and a cut-off grade of 0.006 oz/ton was used for all other rock types. Cut-off grade was varied to reflect differences in estimated metal recoveries for the different rock types mined.
Section 15.3 lists factors that could affect the Mineral Reserves estimates.
The mineral reserves estimates are based on current knowledge, permit conditions, and Project constraints. The mineral reserve estimates have been prepared using industry best practices and conform to CIM requirements.
| February 2015 | 25-3 |
|
|
|
Soledad Mountain Project |
| Kern County, CA, USA | |
| Technical Report |
| 26.0 |
RECOMMENDATIONS |
| 26.1 |
Resources |
Additional drilling is warranted to both convert Inferred resources to higher categories and to define additional resources in sparsely drilled portions of the mineralized structures. Highest priority should be given to areas immediately adjacent to the reserve pit walls in order to define ultimate pit limits prior to mining. GQM LLC is presently completing such an infill drill program with a budget of $500,000. This program is targeting the initial reserve pits of the present mine plan.
Further density data are needed to adequately define all density units in the Project area. Additional samples for density determinations should be collected at every opportunity (e.g., from drill core derived from any future exploration, geotechnical, and/or metallurgical drilling programs).
As discussed in Section 14.2.10, the Project database does not have the GFA channel samples that were taken along mine drifts (only cross-cut samples are included). All drift samples documented on the GFA linens are being added to the Project database and will be used in any subsequent resource estimations.
The ongoing efforts by GQM LLC geologists to complete cross-sectional modeling of oxidation and alteration should continue. Oxidation modeling may be pertinent to metal recoveries, cyanide consumption, leaching times, and acid-generation potential of both ore and waste rock. Alteration types may be pertinent to leach-pad dynamics and pit-wall stabilities. When finalized, the sectional interpretations should be three-dimensionally rectified and used to code the Project block model.
| 26.2 |
Mine Development |
Norwest recommends that the Company continue to secure control of land adjacent to the Approved Project Boundary in order to address the risks related to access and development of portions of the planned mine development. In addition, if aggregate sales do not meet expected levels, access to additional areas for external waste placement could maintain the mine’s operating life with the accompanying benefit to the overall Project cash flows.
| February 2015 | 26-1 |
|
|
|
Soledad Mountain Project |
| Kern County, CA, USA | |
| Technical Report |
Norwest also recommends that the Company develop a detailed closure and closing reclamation mine plan in order to increase their understanding of the sequence of rehandle activities and timing of aggregate production activities. This would allow for more accurate assessment of reclamation liabilities and may allow for a more cost-effective reclamation plan to be developed which takes advantage of the remaining life of the primary mining fleet. Sensitivity of the reclamation costs to limited or partial sales of aggregate and leached residue volumes should also be examined.
| 26.3 |
Aggregate Sales Contracts |
KCA recommends that the Company seek out opportunities to formalize sales contracts for aggregate materials as soon into the Project life as possible. The early confirmation of the feasibility of aggregate sales from the site could have significant upside potential in terms of revision of permitting constraints which would in turn have the potential to increase mine life.
| 26.4 |
Test Work |
KCA recommends that further compacted permeability test work be conducted before the start of operations (or very early into operations, using actual plant-agglomerated ore), in particular for the rhyolite ore types, to more confidently establish the minimum cement dosage for adequate permeability at the design ultimate heap height. The estimated cost of the test work would be approximately $15,000.
| 26.5 |
Recommendation for Reclamation Liability Mitigation |
The Project as described in this report includes assumptions related to the sale of aggregates and their removal from site in order to meet closure requirements for the site. The inability to sell and/or remove these volumes of material from the site has implications to the ultimate cost of reclamation and potentially the mine plan. In order to better define and understand the potential reclamation liability for the Project, Norwest recommends that the GQM LLC develop a strategy to characterize the materials being considered for sale in order to determine if the proposed volumes of material designated for removal are achievable. This strategy should be developed in the near-term in order for the GQM LLC to determine if its estimated annual reclamation liability allocation is sufficient to cover future work. As well, if alterations to the mine plan were required to meet closure and closing reclamation conditions, a decision would be needed by Years 4 – 5 based on Norwest’s current understanding of the mine development sequence.
| February 2015 | 26-2 |
|
|
|
Soledad Mountain Project |
| Kern County, CA, USA | |
| Technical Report |
| 27.0 |
REFERENCES |
Agterberg (1974). Geomathematics - Mathematical Background and Geo-Science Applications: Elsevier, Amsterdam, p596.
AMEC, 2007: Soledad Mountain Resource Estimate, Unpublished report prepared for Golden Queen Mining Co., Ltd. by AMEC E&C Services, 31 August 2007.
AMEC Americas Limited, 2011. “Study and Capital Cost Estimate for Crushing-Screening Plant”, Submitted to Golden Queen Mining Co. Ltd., January 2011, AMEC Project No. 168716.
ARCADIS U.S., Inc., 2012. “Soledad Mountain Project – Hydrogeology Study (Update)”, Submitted to Golden Queen Mining Co., Ltd., Highlands Ranch, CO, February 27, 2012.
Bruff, S.R., 1998 (April), Summary of Corrections Made to GQM LLC Drill Hole Database, unpublished report by Humboldt Mining Services for Golden Queen Mining Company, 12 p.
Bruff, S.R., 1998 (July), Cross section polygonal resource estimate, Soledad Mountain Project, unpublished report by Humboldt Mining Services for Golden Queen Mining Company, 70 p.
Clarke, P.I., 2006 (March), Golden Queen Mining Co. Ltd., NI 43-101 Technical Report, Soledad Mountain Project, Mojave, California, report by SRK Consulting for Golden Queen Mining Company, 94 p.
Dibblee, T. W. 1963, Geology of the Willow Springs and Rosamond Quadrangles California, U. S. Geological Survey Bulletin 1089-C, p. 141-243.
Davis, J. C., 1986, Statistics and Data Analysis in Geology, John Wiley and Sons, New York, p646.
Ennis, S., and Hertel, M., 2012 (October), Soledad Mountain Project NI 43-101 Technical Report, report by Norwest-AMEC to Golden Queen Mining Company, 235 p.
Fahringer, P., and Benson, M.A., 2011: Geophysical Borehole Investigation, Unpublished report prepared for Golden Queen Mining Co., Ltd. by Golder Associates, 30 June 2011.
| February 2015 | 27-1 |
|
|
|
Soledad Mountain Project |
| Kern County, CA, USA | |
| Technical Report |
Gardner, D.L., 1954, Gold and silver mining districts in the Mojave Desert region of southern California, in Jahns, R.H., ed., Geology of southern California, California Division of Mines Bulletin 170, p. 5-20.
Golden Queen Mining Co., Inc., 2007. “Report Of Waste Discharge For The Soledad Mountain Project”, Two Volumes, Revised March 8 and May 2, 2007, Updated April 16, 2012, Submitted to the Lahontan Regional Water Quality Control Board.
Golder Associates Inc., 2012. “Heap Leach Facility, Revised Geotechnical Design Report”, 043-2299D, Revised April 16, 2012.
Gutierrez, C., Bryant, W., Saucedo, G., and Wills, C., 2010, Geologic Map of California, California Geological Survey, Geologic Data Map No. 2, http://www.quake.ca.gov/gmaps/GMC/stategeologicmap.html#
Hall, B. And Thornsberry, V. 1999, personal communications
Journel and Huijbregts, 1978, Mining Geostatistics, Academic Press, 1978
Julihn, C.E., and Horton, F.W., 1937, Mineral Industries Survey of the United States, California, Kern County, Mojave District, The Golden Queen and other Mines of the Mojave District, California, United States Bureau of Mines, Information Circular,42 p. plus maps.
Kappes, Cassiday & Associates, 2010. “Soledad Mountain Project, Merrill-Crowe Plant, Engineering And Cost Estimate Study”, Prepared for Golden Queen Mining Co., Inc., (Project No. 456H, File No. 7805), October 25, 2010.
Klingmann, H. L., 2007. “Tails Analysis”. In-house report, September 14, 2007.
Lowry, D., and Kiel, R., 2011: Orientation Survey of Boreholes P-1 through P-9, Unpublished report prepared for Golden Queen Mining by Golder Associates, 20 July 2011.
McCusker, R, 1982. Geology of the Soledad Mountain Volcanic Complex, Mojave Desert, California, Master Thesis, San Jose State University, p113
MRA, 1998. Soledad Mountain Project Feasibility Report, Golden Queen Mining Company, Incorporated, Mojave California, M3 Engineering & Technology Corp, March 1998.
M3 Engineering and Technology Corporation, 1998 (March), Soledad Mountain project feasibility report, unpublished report for Golden Queen Mining Company, 484 p.
| February 2015 | 27-2 |
|
|
|
Soledad Mountain Project |
| Kern County, CA, USA | |
| Technical Report |
Norwest Corporation, 2008. “43-101 Technical Report, Soledad Mountain Project”. Report prepared for Golden Queen Mining Co. Inc.
Norwest Corporation, 2011. “Soledad Mountain Feasibility Study”. Report prepared for Golden Queen Mining Co. Inc.
Perez, H.R., 1978, Geology and geochemical exploration of the gold-silver deposits at Soledad Mountain, Mojave, Kern County, California, unpublished MSc thesis, University of California-Los Angeles, 146 p.
Parker, H.M., Smith, L.B., Long, S.D., François-Bongarçon, D., Guardiano, F.B., and Meister, S.N., 2000, Review of geological models, assays & resource models, Final Report, Soledad Mountain gold project, unpublished report from Mineral Resources Development, Inc. to Golden Queen Mining Co.
Parker, H. M., 2000. “Final Report – Review of Resource Model and Assays, Soledad Mountain Project, California”. Mineral Resources Development, Inc., May 10, 2000.
Singarella, Paul, 2007. “Initial Diligence Report and Potential Action Items – Golden Queen Mining’s Soledad Mountain Project”, Memorandum prepared by Latham & Watkins LLP, July 18, 2007.
Singarella, Paul, 2007. “Memorandum, July 18, 2007, Initial Diligence Report and Potential Action Items – Golden Queen Mining’s Soledad Mountain Project”, Latham & Watkins LLP, Costa Mesa, California.
Thomassen, R. W., 1983, Report on Evaluation of Gold Queen Mine, Kern County, California, internal report prepared for Meridian Land & Mineral Company, 18 p. plus appendices.
The ROWD was updated at the request of the Regional Board. The ROWD was posted on the Water Board’s website, geotracker, as well.
The ROWD was prepared by Golden Queen Mining Co., Inc. and a team of consulting engineers.
Williams, H., 1932, The history and character of volcanic domes, University of California Department of Geological Sciences Bulletin, v. 21, no. 5, p. 51-146.
| February 2015 | 27-3 |
|
|
|
Soledad Mountain Project |
| Kern County, CA, USA | |
| Technical Report |
| 28.0 |
STATEMENT OF QUALIFICATIONS |
| February 2015 | 28-1 |
|
|
|
Soledad Mountain Project |
| Kern County, CA, USA | |
| Technical Report |
CERTIFICATE OF QUALIFICATIONS
I, Carl E. Defilippi, M.Sc., C.E.M., do hereby certify that I am currently employed as Senior Engineer for Kappes, Cassiday & Associates located at 7950 Security Circle, Reno, Nevada 89506 and:
| 1. |
I graduated with a Bachelor of Science degree in Chemical Engineering from the University of Nevada in 1978 and a Master of Science degree in Metallurgical Engineering from the University of Nevada in 1981; |
| 2. |
I am a Registered Member of the Society for Mining, Metallurgy and Exploration (775870RM); |
| 3. |
I have worked as a Metallurgical Engineer for 36 years; |
| 4. |
I have read the definition of “qualified person” set out in National Instrument 43-101 (“NI 43-101”) and certify that by reason of my education, affiliation with a professional association (as defined in NI 43-101) and past relevant work experience, I fulfill the requirements to be a “qualified person” for the purposes of NI 43-101. I am independent of Golden Queen Mining Co. Ltd. and related companies applying all of the tests in section 1.5 of National Instrument 43-101. I have had no prior involvement with the Soledad Mountain property; |
| 5. |
I am one of the authors of this Technical Report entitled “Soledad Mountain Project Technical Report and Revised Feasibility Study”, effective February 25, 2015. I am responsible for Sections 1.1 through 1.3, 1.5 through 1.7, 1.13, 1.18 through 1.26, 1.27.3, 1.28, 2, 3, 4.1 through 4.8, 5, 13, 17, 18, 19, 20, 21, 22, 23, 24.1.2 through 24.1.7, 24.2.2, 24.3, 25.2, 26.3, 26.4, and 27 of the Technical Report; |
| 6. |
I visited the Soledad Mountain Project site on November 24-25, 2014; |
| 7. |
As of the effective date of this Technical Report, to the best of my knowledge, information and belief, the part of the Technical Report for which I am responsible contains all scientific and technical information that is required to be disclosed to make the Technical Report not misleading; |
| 8. |
I have read National Instrument 43-101 and Form 43-101F1, and the Technical Report has been prepared in compliance with that Instrument and Form; |
Dated February 25, 2015.
| “Carl E. Defilippi" | |
| Carl E. Defilippi |
| February 2015 | 28-2 |
|
|
|
Soledad Mountain Project |
| Kern County, CA, USA | |
| Technical Report |
CERTIFICATE OF QUALIFICATIONS
I, Sean Ennis, P.Eng., P.E., do hereby certify that:
| 1. |
I am currently employed as Vice President, Mining by: |
|
|
| 2. |
I graduated with a Bachelor of Science degree in Mining Engineering from the University of Alberta in 1991 and with a Master’s of Engineering Degree in Geo-environmental Engineering from the University of Alberta in 1997. |
| 3. |
I am a member of the Association of Professional Engineers and Geoscientists of British Columbia, (Member #24279) and the Association of Professional Engineers and Geoscientists of Alberta, (Member #M52576). I am also registered as a P.E. in the United States (Washington, New Mexico). |
| 4. |
I have worked as a mining engineer for 21 years. My experience has included working at coal, gold, and oil sands operations. I have been involved in the evaluation of open pit projects, including precious metal projects, from the preliminary economic assessment through to feasibility level and provided operations support to projects. I have worked both within Canada and on international projects. My experience has included work on heap leach gold projects in North and South America and Asia. |
| 5. |
I have read the definition of “qualified person” set out in National Instrument 43-101 (“NI 43- 101”) and certify that by reason of my education, affiliation with a professional associations (as defined in NI 43-101) and past relevant work experience, I fulfill the requirements to be a “qualified person” for the purposes of NI 43-101. |
| 6. |
I am responsible for the preparation of Sections 1.15-1.17, 1.27.2, 1.28, 4.8, Sections 15 and 16, 24.1.1, 25.4, 26.2 and 26.5 as well as portions of Sections 1.13, 4.2, 20.1.1, 21.2.2 and 27 of the report titled “Soledad Mountain Project Technical Report and Revised Feasibility Study” dated February 25, 2015. |
| 7 |
I have read National Instrument 43-101 and the portions of the Technical Report that I am responsible for and I confirm that these portions of the report have been prepared in compliance with NI 43-101. |
| 8. |
As of February 25, 2015, the Technical Report, to the best of my knowledge, information and belief, the portions of the Technical Report for which I am responsible, contain all the scientific and technical information that is required to be disclosed to make the Technical Report not misleading. |
| 9. |
I am independent of the issuer applying all of the tests in Section 1.5 of National Instrument 43- 101. |
Dated this 25th day of February, 2015.
| “Signed and sealed hardcopy on file” | |
| Vice President, Mining |
| February 2015 | 28-3 |
|
|
|
Soledad Mountain Project |
| Kern County, CA, USA | |
| Technical Report |
CERTIFICATE OF QUALIFICATIONS
I, Michael M. Gustin, C.P.G., do hereby certify that I am currently employed as Senior Geologist by Mine Development Associates, Inc., 210 South Rock Blvd., Reno, Nevada 89502, and:
| 1. |
I graduated with a Bachelor of Science degree in Geology from Northeastern University in 1979 and a Doctor of Philosophy degree in Economic Geology from the University of Arizona in 1990. I have worked as a geologist in the mining industry for more than 30 years. I am a Licensed Professional Geologist in the state of Utah (#5541396-2250), a Licensed Geologist in the state of Washington (# 2297), a Registered Member of the Society of Mining Engineers (#4037854RM), and a Certified Professional Geologist of the American Institute of Professional Geologists (#CPG-11462). |
| 2. |
I have read the definition of “qualified person” set out in National Instrument 43-101 (“NI 43- 101”). I have previously explored, drilled, evaluated and modeled similar gold-silver deposits in volcanic rocks in the United States and elsewhere. I certify that by reason of my education, affiliation with certified professional associations, and past relevant work experience, I fulfill the requirements to be a “qualified person” for the purposes of NI 43-101. |
| 3. |
I visited the Soledad Mountain project site most recently on September 22 and 23, 2014. |
| 4. |
I am responsible for Sub Sections 1.8, 1.9, 1.10, 1.11, 1.12, 1.14, 1.27.1, Sections 6, 7, 8, 9, 10, 11, Sub Sections 12.1, 12.2, 12.4, 12.5, Section 14, and Sub Sections 24.2.1, 25.1, 25.3, 26.1, and 27 of this report titled, “Soledad Mountain Project Technical Report and Revised Feasibility Study” and dated February 25, 2015 (the “Technical Report”). |
| 5. |
I have had no prior involvement with the Soledad Mountain property or project that is the subject of this Technical Report, and I am independent of Golden Queen Mining Co. Ltd. and all of its affiliates and subsidiaries as defined in Section 1.5 of NI 43-101 and in Section 1.5 of the Companion Policy to NI 43-101. |
| 6. |
As of the Effective Date of this Technical Report, to the best of my knowledge, information, and belief, this Technical Report contains all the scientific and technical information that is required to be disclosed to make those parts of this Technical Report for which I am responsible for not misleading. |
| 7. |
I have read NI 43-101 and Form 43-101F1, and the Technical Report has been prepared in compliance with that instrument and form. |
Dated this 25th day of February, 2015.
| “Michael M. Gustin” | |
| Michael M. Gustin, C.P.G. |
| February 2015 | 28-4 |
|
|
|
Soledad Mountain Project |
| Kern County, CA, USA | |
| Technical Report |
CERTIFICATE OF QUALIFICATIONS
PETER RONNING, P.
ENG.
I, Peter Arthur Ronning, P.Eng. of 1450 Davidson Road, Gibsons, B.C., Canada, V0N 1V6, hereby certify that:
| 1. |
I am a consulting geological engineer, doing business under the registered name New Caledonian Geological Consulting, at the address set out above. |
| 2. |
I am one of the authors of the report entitled “Soledad Mountain Project Technical Report and Revised Feasibility Study” prepared for Golden Queen Mining Co. Ltd. (“Golden Queen”) and with an Effective Date of February 25, 2015. I take responsibility for Sections 1.12 and 12.3. |
| 3. |
I am a graduate of the University of British Columbia in geological engineering, with the degree of B.A.Sc. granted in 1973. I also hold the degree of M.Sc. (applied) in geology, granted by Queen’s University in Kingston, Ontario, in 1983. I am a member in good standing of the Association of Professional Engineers and Geoscientists of British Columbia, Registration Number 16,883. |
| 4. |
I have worked as a geologist and latterly as a Professional Engineer in the field of mineral exploration since 1973, in many parts of the world. Since 2006 I have participated in or conducted numerous audits, reviews and evaluations of mining and mineral exploration project quality control and quality assurance (“QA/QC”) data, including volcanic-rock hosted precious-metals deposits in North and South America. I have studied QA/QC topics relating to the sampling and analysis of mineralized material independently and in formal continuing education sessions. |
| 5. |
I have read the definition of “qualified person” set out in National Instrument 43-101 and certify that by reason of my education, affiliation with a professional association as defined in NI 43-101 and past relevant work experience, I fulfill the requirements to be a “qualified person” for the purposes of NI 43-101 with respect to the contents of those parts of the Technical Report for which I take responsibility. |
| 6. |
I have not done a field examination of the Soledad Mountain project site. |
| 7 |
I have not had prior involvement with Golden Queen, nor with the Soledad Mountain project. |
| 8. |
I am independent of Golden Queen and all its subsidiaries as defined in Section 1.5 of NI 43- 101 and in Section 1.5 of the Companion Policy to NI 43-101. I may inadvertently be the beneficial owner of an interest in any publicly traded company through participation in mutual funds over whose portfolios I have no control. |
| 9. |
As of the Effective Date of this Technical Report, to the best of my knowledge, information and belief, this Technical Report contains all the scientific and technical information that is required to be disclosed to make those parts of the Technical Report for which I take responsibility not misleading. |
| 10. |
I have read National Instrument 43-101 and Form 43-101F1, and the Technical Report has been prepared in compliance with those documents. |
| “Peter Ronning” | |
| Peter A. Ronning, P.Eng. | |
| February 25, 2015 |
| February 2015 | 28-5 |
|