Attached files
| file | filename |
|---|---|
| EXCEL - IDEA: XBRL DOCUMENT - EPIQ SYSTEMS INC | Financial_Report.xls |
| EX-31.1 - EX-31.1 - EPIQ SYSTEMS INC | a2223052zex-31_1.htm |
| EX-32.1 - EX-32.1 - EPIQ SYSTEMS INC | a2223052zex-32_1.htm |
| EX-21.1 - EX-21.1 - EPIQ SYSTEMS INC | a2223052zex-21_1.htm |
| EX-23.1 - EX-23.1 - EPIQ SYSTEMS INC | a2223052zex-23_1.htm |
| EX-31.2 - EX-31.2 - EPIQ SYSTEMS INC | a2223052zex-31_2.htm |
| XML - IDEA: XBRL DOCUMENT - EPIQ SYSTEMS INC | R9999.htm |
Use these links to rapidly review the document
TABLE OF CONTENTS
ITEM 15. EXHIBITS, FINANCIAL STATEMENT SCHEDULES
UNITED STATES
SECURITIES AND EXCHANGE COMMISSION
WASHINGTON, D. C. 20549
FORM 10-K
| (Mark One) | ||
ý |
ANNUAL REPORT PURSUANT TO SECTION 13 OR 15(d) OF THE SECURITIES EXCHANGE ACT OF 1934 |
|
For the fiscal year ended December 31, 2014 |
||
or |
||
o |
TRANSITION REPORT PURSUANT TO SECTION 13 OR 15(d) OF THE SECURITIES EXCHANGE ACT OF 1934 |
|
For the transition period from to |
||
Commission File Number 001-36633
EPIQ SYSTEMS, INC.
(Exact name of registrant as specified in its charter)
| Missouri | 48-1056429 | |
| (State or other jurisdiction of incorporation or organization) |
(I.R.S. Employer Identification No.) |
|
501 Kansas Avenue, Kansas City, Kansas |
66105-1300 |
|
| (Address of principal executive offices) | (Zip Code) |
913-621-9500
(Registrant's telephone number, including area code)
Securities registered pursuant to Section 12(b) of the Act
| Title of each class | Name of exchange on which registered | |
|---|---|---|
| Common Stock, $0.01 par value | The NASDAQ Stock Market, LLC | |
| Preferred Stock Purchase Rights | The NASDAQ Stock Market, LLC |
Securities
registered pursuant to Section 12(g) of the Act:
None
Indicate by check mark if the registrant is a well-known seasoned issuer, as defined in Rule 405 of the Securities Act. Yes o No ý
Indicate by check mark if the registrant is not required to file reports pursuant to Section 13 or Section 15(d) of the Act. Yes o No ý
Indicate by check mark whether the registrant (1) has filed all reports required to be filed by Section 13 or 15(d) of the Securities Exchange Act of 1934 during the preceding 12 months (or for such shorter period that the registrant was required to file such reports), and (2) has been subject to such filing requirements for the past 90 days. Yes ý No o
Indicate by check mark whether the registrant has submitted electronically and posted on its corporate Web site, if any, every Interactive Data File required to be submitted and posted pursuant to Rule 405 of Regulation S-T (§232.405 of this chapter) during the preceding 12 months (or for such shorter period that the registrant was required to submit and post such files). Yes ý No o
Indicate by check mark if disclosure of delinquent filers pursuant to Item 405 of Regulation S-K (§229.405 of this chapter) is not contained herein, and will not be contained, to the best of registrant's knowledge, in definitive proxy or information statements incorporated by reference in Part III of this Form 10-K or any amendment to this Form 10-K. ý
Indicate by check mark whether the registrant is a large accelerated filer, an accelerated filer, a non-accelerated filer, or a smaller reporting company. See the definitions of "large accelerated filer," "accelerated filer" and "smaller reporting company" in Rule 12b-2 of the Exchange Act.
| Large accelerated filer o | Accelerated filer ý | Non-accelerated filer o (Do not check if a smaller reporting company) |
Smaller reporting company o |
Indicate by check mark whether the registrant is a shell company (as defined in Rule 12b-2 of the Act). Yes o No ý
The aggregate market value of voting common stock held by non-affiliates of the registrant based upon the last reported sale price on June 30, 2014, was $438 million. There were 37,041,224 shares of common stock, $0.01 par value, outstanding at February 23, 2015.
DOCUMENTS INCORPORATED BY REFERENCE
The information required by Part III of Form 10-K is incorporated herein by reference to the registrant's definitive Proxy Statement relating to its 2015 Annual Meeting of Shareholders, which will be filed with the Commission within 120 days after the end of the registrant's fiscal year.
This report contains statements that relate to future events and expectations and, as such, constitute forward-looking statements within the meaning of the Private Securities Litigation Reform Act of 1995. These forward-looking statements include, but are not limited to, any projection or expectation of earnings, revenue or other financial items; the plans, strategies and objectives of management for future operations; factors that may affect our operating results; effects of current or future economic conditions or performance; industry trends; expectations regarding the current review process of strategic and financial alternatives; and other matters that do not relate strictly to historical facts or statements of assumptions underlying any of the foregoing. Forward-looking statements are subject to a number of known and unknown risks, uncertainties and other factors and are not guarantees of future performance. Actual results, performance or outcomes may differ materially from those expressed in or implied by those forward-looking statements. Many of these statements are found in the "Business" and "Management's Discussion and Analysis of Financial Condition and Results of Operations" sections of this report.
Forward-looking statements may be identified by words or phrases such as "believe," "expect," "anticipate," "should," "planned," "projected," "forecasted," "may," "estimated," "goal," "objective," "seeks," and "potential," and variations of these words and similar expressions or negatives of these words. Section 27A of the Securities Act of 1933, as amended, and Section 21E of the Securities Exchange Act of 1934, as amended, provide a "safe harbor" for forward-looking statements. In order to comply with the terms of the safe harbor, and because forward-looking statements involve future risks and uncertainties, Item 1A, "Risk Factors" of this report lists a variety of factors that could cause actual results and experience to differ materially from the anticipated results or other expectations expressed in our forward-looking statements. Such forward-looking statements speak only as of the date of this Form 10-K. We undertake no obligation to update publicly or revise any forward-looking statements contained in this report or in future communications to reflect future events or developments, except as required by law.
Unless expressly indicated or the context requires otherwise, the terms "Epiq," "Company," "we," "us," and "our" in this report refer to Epiq Systems, Inc., and where appropriate, to one or more of our wholly owned subsidiaries.
Company Overview
Epiq is a leading global provider of integrated technology solutions for the legal profession. We combine proprietary software, deep subject matter expertise, highly responsive customer service and a global infrastructure to assist our clients with the technology requirements for complex matters. We offer these capabilities across a variety of practice areas including bankruptcy, litigation, class action, antitrust, investigations and regulatory compliance. Our solutions are designed to streamline the administration of bankruptcy, litigation, investigations, financial transactions and regulatory compliance matters. We offer innovative managed technology solutions for eDiscovery, document review, legal notification, claims administration and controlled disbursement of funds.
Our team includes former practicing litigators, bankruptcy attorneys, plaintiff's counsel, defense counsel, eDiscovery counsel and other professionals who are leaders in their areas of expertise. While we do not offer clients legal advice (because we are not a law firm), we draw heavily from our subject matter expertise in the legal profession to assist clients in achieving the best outcome on each project on which we are retained.
Our clients include top tier law firms, the in-house legal departments of major corporations, trustees, specialty fiduciaries and other professionals. Among law firms, we work extensively with Am Law 100 firms in the U.S., Magic Circle firms in the U.K. and leading boutique or specialty law firms in most geographies. Among corporate clients, we have substantial relationships with large, multinational companies in a variety of industries, including financial services, pharmaceuticals, insurance, technology and others. The global nature of our business continues to grow. With full-service offices (i.e., locations having a data center, on-site technical staff, on-site project management capabilities and local consulting capacities) around the world, Epiq offers a geographic reach to support client relationships wherever we are needed.
We were incorporated in the State of Missouri on July 13, 1988, and on July 15, 1988 acquired all of the assets of an unrelated predecessor corporation.
Additional information is incorporated herein by reference to Part II, Item 7. Management's Discussion and Analysis.
Financial Information About Segments
Our operating business is organized into two reportable segments: the Technology segment ("Technology") and the Bankruptcy and Settlement Administration segment ("Bankruptcy and Settlement Administration").
Segment revenue, a performance measure of profit and additional financial data, and commentary on recent financial results for reportable segments are provided in the Results of Operation in Part II, Item 7. "Management's Discussion and Analysis of Financial Condition and Results of Operations" and in Note 14 to the Consolidated Financial Statements.
IT Capabilities
Our software and IT capabilities include significant in-house fulfillment capabilities. Our office locations in New York, Kansas City and Portland have internal abilities for high-speed printing and
1
mailing, call center operations, and disbursement and tax records preparation. The combination of software, IT and fulfillment resources enables Epiq to act as a single-source solution for even the largest, most complex matters in the markets where we compete.
Network infrastructure is an essential component of our technology strategy because most of our software is utilized by our customers within a hosted environment and we manage a high volume of client data. A single large client engagement may entail over 100 million documents or 100 terabytes of information and may include complex structured data (i.e., databases) and unstructured data (e.g., email archives). We operate eDiscovery data centers in the United States, Canada, China, Hong Kong, Japan and the United Kingdom. Our data centers provide reliable, secure access to our software environments and to customer databases. Information security is of paramount importance in any managed technology business, and Epiq incorporates best practices designed to protect sensitive customer data.
Trademarks and Patents
Our trademarks, service marks, and registered marks include, without limitation, AACER®, MY AACER®, AACER EXTRA EDITION®, Extra Edition®, Epiq AnalyticsSM, Epiq Access™, Epiq®, EPIQ LOGO®, Epiq Mailing CenterSM, Epiq Noticing CenterSM, Epiq Systems®, EPIQ SYSTEMS LOGO®, Bankruptcy Link®, Case Power®, CasefilePRO®, ClaimsMatrix®, CreditorMatrix®, Claims FacilitatorSM, Digital Practice®, DebtorMatrix®, DocuMatrix®, DMX™, DMXSM, DMX Mobile™, DMX MobileSM, DocuMatrix MobileSM, DocuMatrix Mobile™, Documatrix MobileSM, eDataMatrix®, eDataMatrixSM, eMax®, Encore Discovery Solutions®, Encore Discovery Solutions Knowledge. Innovation. Results LOGO®, Encore Legal Solutions®, Encore Lex Solutio®, IQ Review®, LegalMatrix®, LoanMatrix®, Q™, Q LOGO™, MINUS –10 0X SOFTWARE LOGO®, TCMS®, and TCMSWeb®. The trademarks and service marks (denoted by ™ and SM) have been filed but are not yet registered and do not include common law marks; the registered marks (denoted by ®) have remaining durations ranging from 2015 through 2024. Our patents include Epiq eDiscovery Solutions, Inc.: U.S. Patent No. 7,496,556 and Epiq eDiscovery Solutions, Inc., U.S. Patent Application Number 13/528,049, filed June 20, 2012, patent pending.
Narrative Description of Business
Technology
Our Technology segment provides eDiscovery managed services and technology solutions comprised of consulting, collections and forensics, processing, search and review, production of documents and document review services to companies and law firms. Our eDataMatrix® and third-party software analyzes, filters, removes duplicates and produces documents for review. Documents are made available primarily through a hosted environment, and our DocuMatrix® and third-party software allow for efficient attorney review and data requests. Our customers are typically large corporations that use our products and services cooperatively with their legal counsel to manage the eDiscovery process for litigation, investigations, anti-trust filings and regulatory matters, and data requests.
The substantial volume of electronic documents and other data used by businesses has changed the dynamics of how attorneys support discovery in complex litigation, investigations and data requests. Due to the complexity of matters, the volume of data that is maintained electronically, and the volume of documents that is produced, law firms have become increasingly reliant on electronic evidence management systems to organize and manage the litigation discovery process.
Following is a description of the significant sources of revenue in our Technology segment.
- •
- Consulting, forensics and collection service fees based on the number of hours that services are provided.
2
- •
- Fees related to the conversion of data into an organized, searchable electronic database. The amount earned varies primarily on the
number of documents produced or volume of data processed.
- •
- Hosting fees based on the amount of data stored.
- •
- Document review fees based on the number of hours spent reviewing documents, the number of pages reviewed, or the amount of data reviewed.
Bankruptcy and Settlement Administration
Our Bankruptcy and Settlement Administration segment provides managed services and technology solutions that address the needs of our customers with respect to litigation, claims and project administration, compliance matters, controlled disbursements, corporate restructuring, bankruptcy, class action and mass tort proceedings.
Bankruptcy is an integral part of the United States' economy. As of the most recently reported data by the Administrative Office of the U.S. Courts for the fiscal years ended December 31, 2014, 2013 and 2012 there were approximately 0.94 million, 1.07 million and 1.22 million new bankruptcy filings, respectively.
- •
- Total bankruptcy filings for the year ended December 31, 2014 decreased 12% versus the year ended December 31, 2013.
During the year ended December 31, 2014, Chapter 7 filings decreased 15%, Chapter 11 filings decreased 19% and Chapter 13 filings decreased 7%.
- •
- Total bankruptcy filings for the year ended December 31, 2013 decreased 12% versus the year ended December 31, 2012. During the year ended December 31, 2013, Chapter 7 filings decreased 14%, Chapter 11 filings fell 13% and Chapter 13 filings decreased 9%.
This segment provides solutions that address the needs of Chapter 7, Chapter 11 and Chapter 13 bankruptcy trustees to administer bankruptcy proceedings and of debtor corporations that file a plan of reorganization.
- •
- Chapter 7 is a liquidation bankruptcy for individuals or businesses that, as measured by the number of new cases filed in the
year ended December 31, 2014, accounted for approximately 66% of all bankruptcy filings. In a Chapter 7 case, the debtor's assets are liquidated and the resulting cash proceeds
are used by the Chapter 7 bankruptcy trustee to pay creditors. Chapter 7 cases typically last several years.
- •
- Chapter 11 is a reorganization model of bankruptcy for corporations that, as measured by the number of new cases filed in the
year ended December 31, 2014, accounted for less than 1% of all bankruptcy filings. Chapter 11 generally allows a company, often referred to as the debtor-in-possession, to continue
operating under a plan of reorganization to restructure its business and to modify payment terms of both secured and unsecured obligations. Chapter 11 bankruptcy engagements are generally
long-term, multi-year assignments that provide revenue visibility into future periods.
- •
- Chapter 13 is a reorganization model of bankruptcy for individuals that, as measured by the number of new cases filed in the year ended December 31, 2014, accounted for approximately 33% of all bankruptcy filings. In a Chapter 13 case, debtors make periodic cash payments into a reorganization plan and a Chapter 13 bankruptcy trustee uses these cash payments to make monthly distributions to creditors. Chapter 13 cases typically last between three and five years.
We provide our Chapter 7 products and services to our trustee customers at no direct charge, and they maintain deposit accounts for bankruptcy cases under their administration at a designated banking
3
institution. We have arrangements with various banks under which we provide the bankruptcy trustee case management software and related services, and the bank provides the bankruptcy trustee with deposit-related banking services.
Our trustee services deposit portfolio averaged approximately $1.7 billion for both 2014 and 2013, and our interest-based deposit fees continued at low pricing levels under our agreements due to the low short-term interest rate environment.
The key participants in a bankruptcy proceeding include the debtor-in-possession, the debtor's legal counsel, the creditors, the creditors' legal counsel, and the bankruptcy judge. Chapter 7 and Chapter 13 cases also include a professional bankruptcy trustee, who is responsible for administering the bankruptcy case. The end-user customers of our Chapter 7 and Chapter 13 bankruptcy services and products, including TCMS ® and Case Power ® case management solutions, are professional bankruptcy trustees, and of our Chapter 11 services and products, including DebtorMatrix®, are debtor corporations that file a plan of reorganization. The Executive Office for United States Trustees, a division of the United States Department of Justice, appoints all bankruptcy trustees. A United States trustee is appointed in most federal court districts and generally has responsibility for overseeing the integrity of the bankruptcy system. The bankruptcy trustee's primary responsibilities include liquidating the debtor's assets or collecting funds from the debtor, distributing the collected funds to creditors pursuant to the orders of the bankruptcy court and preparing regular status reports for the Executive Office for United States Trustees and for the bankruptcy court. Trustees manage an entire caseload of bankruptcy cases simultaneously.
Our proprietary software product, AACER® (Automated Access to Court Electronic Records) ("AACER®"), assists creditors including banks, mortgage processors and their administrative services professionals to streamline processing of their portfolios of loans in bankruptcy cases. AACER® electronically monitors developments in all United States bankruptcy courts and applies sophisticated algorithms to classify docket filings automatically in each case to facilitate the management of large bankruptcy claims operations. By implementing AACER®, clients achieve greater accuracy in faster timeframes, with significant cost savings compared to manual attorney review of each case in the portfolio. Banking PortalTM, a centralized hub for processing online banking transactions across Epiq's family of Chapter 7 products, facilitates the rapid on-boarding of new banks and provides e-banking capabilities.
Class action refers to litigation in which class representatives bring a lawsuit against a defendant company or other persons on behalf of a large group of similarly affected persons. Mass tort refers to class action cases that are particularly large or prominent. Class action and mass tort litigation is often complex and the cases, including administration of any settlement, may last several years. Key participants in this marketplace include law firms that specialize in representing class action and mass tort plaintiffs and other law firms that specialize in representing defendants.
Following is a description of the significant sources of revenue in our Bankruptcy and Settlement Administration segment.
- •
- Professional service fees and other support service fees contingent upon the month-to-month delivery of services such as data
conversion, claims processing, claims reconciliation, project management, professional services, call center support, website development and administration, and controlled disbursements. The amount
we earn varies primarily on the size and complexity of the engagement.
- •
- Deposit-based fees earned on a percentage of Chapter 7 assets placed on deposit with a designated financial institution by our trustee clients, to whom we provide, at no charge, software licenses, limited hardware and hardware maintenance, and post-contract customer support services. Service fees earned that are based on assets placed on deposit by our trustee
4
- •
- Legal noticing fees for services to parties of interest in bankruptcy, class action, and other administrative matters, including
direct notification and media campaign and advertising management in which we coordinate notification, primarily through print media outlets, to potential parties of interest for a particular client
engagement.
- •
- Data hosting fees and volume-based fees.
- •
- Monitoring and noticing fees earned based on monthly or on-demand requests for information provided through our AACER®
software product.
- •
- Reimbursed expenses, primarily related to postage on mailing services and other pass-through expenses.
clients may vary based on fluctuations in short-term interest rates and changes in service fees assessed on such deposits.
Competition
Technology
The eDiscovery market is highly fragmented, extremely competitive and continuously evolving. Competitors include Kroll Ontrack (Altegrity Inc.), FTI Consulting, Inc., Huron Consulting Group Inc., The Dolan Company, Symantec Corporation, Recommind, Inc., Xerox, Autonomy (Hewlett-Packard), DTI, Inc., and Navigant Consulting, Inc. Competition is primarily based on the quality of service, technology innovations, and price.
Bankruptcy and Settlement Administration
Our bankruptcy services compete in a more mature market. We are one of two primary providers in the Chapter 7 bankruptcy market, along with Bankruptcy Management Solutions, Inc. In the Chapter 11 bankruptcy market, our primary competitors include Kurtzman Carson Consultants LLC (Computershare), Prime Clerk, The Garden City Group, Inc. (Crawford & Company), Donlin Recano & Co., and AlixPartners LLP. In both the Chapter 7 and Chapter 11 markets there are also several smaller competitors. In the Chapter 13 market, our primary competitor is Bankruptcy Software Specialists, LLC. Competition is primarily based on quality of service and technology solutions. Competitors for our AACER® product include American InfoSource and LexisNexis® Banko® Solutions.
The primary competitors with our settlement administration business are The Garden City Group, Inc., Rust Consulting, Inc., Kurtzman Carson Consultants LLC (Computershare), and Gilardi & Co LLC, as well as several smaller competitors. Competition is primarily based on the quality of service, technology solutions, and price.
In addition to the competitors mentioned above, certain law firms, accounting firms, management consultant firms, turnaround specialists, and crisis management firms offer products and services that compete with our products and services in each of our segments.
Key competitive factors and the relative strength of our products and services versus our competitors are directly and indirectly affected by our technology solutions, the quality of our services, price, ease of use of our technology solutions, data security, quality of our technical support, reliability, and our domain expertise. Our ability to continually innovate and differentiate our product and service offerings has enabled us to achieve and maintain leadership positions in the various markets that we serve.
5
Sales and Marketing
Our sales executives market our products and services directly to prospective customers and referral law firms through direct sales and longstanding relationships. We focus on attracting and retaining customers by providing exceptional integrated technology solutions and superior customer service. Our client support specialists are responsible for providing ongoing support services for our clients. Our employees attend industry trade shows, speak on panels and participate and conduct educational programs, publish articles and papers, and conduct direct mail campaigns and advertise in trade journals. We maintain a website that clients and potential clients may access to obtain additional information related to solutions we offer.
Government Regulation
Our products and services are not directly regulated by the government. However, our bankruptcy customers are subject to significant regulation under the United States Bankruptcy Code, the Federal Rules of Bankruptcy Procedure and local rules and procedures established by bankruptcy courts. The Executive Office for United States Trustees, a division of the United States Department of Justice, oversees the federal bankruptcy system and establishes administrative rules governing our clients' activities. Class action and mass tort cases, as well as eDiscovery requirements related to litigation, are subject to various federal and state laws, as well as rules of evidence and rules of procedure established by the courts.
The United States Supreme Court approved certain regulations within the Federal Rules of Civil Procedure regarding the discovery in litigation of certain electronically stored information. These regulations have been effective since December 1, 2006. Among other things, these regulations (i) require early attention by parties in litigation to meet and confer regarding discovery issues and to develop a discovery plan that identifies and addresses the parties' electronically stored information, (ii) expand the reach of federal court subpoenas to include electronically stored information, (iii) allow for parties to object to production of electronically stored information that is not reasonably accessible due to the undue burden or cost associated with such retrieval, and (iv) provide a "safe harbor" to parties unable to provide electronically stored information lost or destroyed as a result of the routine, good-faith operation of an electronic information system. While these federal rules do not apply in state court proceedings, the civil procedure rules of many states have been closely modeled on these provisions. We anticipate the federal and state court discovery rules relating to electronic documents and information will continue to evolve and affect the way we develop and implement technology and service solutions to those changing discovery rules.
Employees
As of December 31, 2014, we employed approximately 1,100 full-time employees, none of whom is covered by a collective bargaining agreement. We believe the relationship with our employees is good.
Financial Information About Geographic Areas
For the years ended December 31, 2014, 2013 and 2012, approximately 87%, 89% and 93%, respectively, of our consolidated revenues were generated from services provided within the United States. For each of the years ended December 31, 2014 and 2013, approximately 93% and 96% of our long-lived assets were located within the United States, respectively.
Available Information
Our internet address is www.epiqsystems.com. We make a variety of information available, free of charge, at our Investor Relations website, www.epiqsystems.com/investors.php. This information includes our Annual Reports on Form 10-K, our Quarterly Reports on Form 10-Q, our Current
6
Reports on Form 8-K, and any amendments to those reports as soon as reasonably practicable after we electronically file those reports with or furnish them to the SEC, as well as our code of ethics and other governance documents.
The public may read and copy materials filed by us with the SEC at the SEC's Public Reference Room at 100 F Street, NE, Washington, DC 20549. The public may obtain information on the operation of the Public Reference Room by calling the SEC at 1-800-SEC-0330. The SEC maintains an internet site that contains reports, proxy and information statements and other information regarding issuers that file documents electronically with the SEC at www.sec.gov.
The contents of these websites, or the information connected to those websites, are not incorporated into this report. References to websites in this report are provided as a convenience and do not constitute, and should not be viewed as, incorporation by reference of the information contained on, or available through, the website.
7
Certain factors may have a material adverse effect on our business, financial condition, and results of operations. You should consider carefully the risks and uncertainties described below, in addition to other information contained in this Annual Report on Form 10-K, including our consolidated financial statements and related notes. The risks and uncertainties described below are not the only ones we face. Additional risks and uncertainties that we are unaware of, or that we currently believe are not material, may also become important factors that adversely affect our business. If any of the following risks actually occurs, our business, financial condition, results of operations, and future prospects could be materially and adversely affected.
We compete with other third-party providers on the basis of the technological features, capabilities and price of our products and services, and we could lose existing customers and fail to attract new business if we do not keep pace with technological changes and offer competitive pricing for our products and services.
The markets for our products and services are competitive, continually evolving and subject to technological change. We believe that key competitive factors in the markets we serve include the breadth and quality of system and software solution offerings, the stability of our information systems, the features and capabilities of the product and service offerings, the pricing of our products and services, and the potential for future product and service enhancements. Our success depends upon our ability to keep pace with technological change and to introduce, on a timely and cost-effective basis, new and enhanced software solutions and services that satisfy changing client requirements. If we do not keep pace with technological changes, we could lose existing customers and fail to attract new business. Likewise, technology products and services can become more price sensitive over time, and if we are not able to maintain price competitive products and services, we could lose existing customers and fail to attract new customers. The impact of not keeping pace with technological changes or maintaining competitive pricing could adversely affect our results of operations.
Security problems with our systems, software products or services, including the improper disclosure of personal or corporate data, could harm our reputation and cause us to lose existing customers and fail to attract new customers, cause increased cybersecurity protection costs and general service costs, and result in liability and increased expense for litigation and diversion of management time.
We store and process large amounts of our customers' confidential information and personally identifiable information. Our software products enable our customers to store and process personal data and confidential information. We have included security features in our products and processes that are intended to protect the privacy and integrity of data, including confidential client or consumer data. Security is critical given the confidential nature of the information contained in our systems. It is possible that our security controls, our selection and training of employees, and other practices we follow may not prevent the improper disclosure of confidential or personally identifiable information. Such disclosure could harm our reputation and cause us to lose existing customers or fail to attract new customers and subject us to liability in regulatory proceedings and private litigation under laws that protect personal data, resulting in loss of revenue or increased costs. Improper disclosure of personal or corporate data could result in lawsuits or regulatory proceedings alleging damages, and the perception that our products and services do not adequately protect the privacy of personal information and could inhibit sales of our products and services. Defending these types of claims could result in increased expenses for litigation and claims settlement and a significant diversion of our management's attention. Additionally, our software products, the systems on which the products are used, and our processes may not be impervious to intentional break-ins ("hacking"), cyber-attacks or other disruptive disclosures or problems, whether as a result of inadvertent third-party action, employee action, malfeasance, or otherwise. Hacking, cyber-attacks or other disruptive problems could result in the diversion of our development resources, damage to our reputation, increased cybersecurity protection
8
costs and general service costs and impaired market acceptance of our products and services, any of which could result in lower revenues or higher expenses.
Errors or fraud related to our business processes could cause increased expense for litigation and diversion of management attention.
We administer claims, disburse funds, generate and distribute legal notices, provide data productions and provide professional services for third parties. Errors or fraud could occur, for example, in the payment of bankruptcy or settlement claims in a case we are administering. Errors or fraud related to the processing or payment of these claims or errors related to the delivery of professional services could result in the diversion of management resources, damage to our reputation, increased service costs or impaired market acceptance of our services, any of which could result in higher expenses and lower revenues. Additionally, these types of errors or fraud could result in lawsuits alleging damages. Defending these types of claims could result in increased expenses for litigation and claims settlement and a significant diversion of our management's attention.
Interruptions or delays in service at the data centers we utilize could impair the delivery of our service and harm our business.
We provide services through computer hardware that is located in data centers operated by unrelated third parties. We do not control the operation of these facilities, which increases our vulnerability to problems with the services they provide, and they are subject to damage or interruption from earthquakes, floods, fires, power loss, terrorist attacks, telecommunications failures and similar events. These facilities are also subject to break-ins, sabotage, intentional acts of vandalism and similar misconduct. The occurrence of any of these events, a decision to close a facility without adequate notice, or other unanticipated problems at a facility could result in interruptions in certain of our services. In addition, the failure by our vendor to provide our required data communications capacity could result in poor service or interruptions in our service. Any damage to, or failure of, our systems or services could reduce our revenue, cause us to issue credits or pay penalties, cause customers to terminate their agreements with us and adversely affect our ability to secure business in the future. Our business will be harmed if our customers and potential customers believe our services are unreliable.
Releases of new software products or upgrades to our existing software products or licensed third-party software may have undetected errors, or may not operate as intended or achieve our customer's desired objectives, which could cause litigation claims against us, damage to our reputation, or loss of business.
Certain of our services utilize software solutions developed by us or third parties for the needs of our customers. New releases of software products are issued to our customers periodically. Complex software products, such as those we offer, can contain undetected errors when first introduced or as new versions are released, or may fail to operate as intended or achieve the customer's desired objectives. Any introduction of new software products or upgrade to existing software products has a risk of undetected errors. These undetected errors may be discovered only after a product has been installed and used either in our internal processing or by our customers. Likewise, the software products we acquire in business acquisitions have a risk of undetected errors.
Any undetected errors, difficulties in installing and maintaining our software products or upgrade releases, difficulties training customers and their staffs on the utilization of new software products or upgrade releases, or the failure to achieve the customer's desired objectives, may result in a delay or loss of revenue, diversion of development resources, damage to our reputation, the loss of that customer, loss of future business, increased service costs, potential litigation claims against us, or impaired market acceptance of our products.
9
We rely on third-party hardware and software, which could cause errors or failures of our software or services.
We rely on hardware purchased or leased and software licensed from third parties for our service offerings. The hardware is typically standardized hardware from national vendors. The software licenses are generally standardized, commercial software licenses from national software vendors. We are generally able to select from a number of competing hardware and software applications, and, from time to time, we have changed the hardware and software technologies incorporated into our software products and solutions. Any errors or defects in third-party hardware or software incorporated into our products could result in a failure of our service or errors in our software, which in turn could adversely affect our customer relationships and result in the loss of customers, the loss of future business, potential litigation claims against us, and damage to our reputation.
Upgrades and implementation of the Company's financial, operating and information systems may adversely affect our business or the results of operations or the effectiveness of internal control over financial reporting.
If the Company's systems do not operate as intended, it could adversely affect financial, operating and information systems, our ability to produce financial and operational reports, and/or the effectiveness of internal control over financial reporting. In addition, in the ordinary course of business, our information systems will continue to require modification and refinements to address growth and changing business requirements, including requirements related to our international operations. In addition, our systems may require modification to enable us to comply with changing regulatory requirements, which could be expensive to implement and may divert management's attention from other key initiatives. In addition, our operations could be adversely affected, if we are unable to timely or effectively modify our systems as necessary.
We depend upon our key personnel, and we may not be able to retain them or to attract, assimilate and retain highly qualified employees in the future.
Our future success may depend upon the continued service of our senior management and certain of our key technical and sales personnel and our continuing ability to attract, assimilate and retain highly qualified technical, managerial, and sales and marketing personnel. The loss of services from any of these persons may significantly delay or prevent the achievement of our business objectives. We maintain key-man life insurance policies on our Chief Executive Officer and our President and Chief Operating Officer but we do not carry key-man life insurance on any other key personnel. We have entered into employment agreements with our executive officers that contain restrictive covenants relating to non-competition and non-solicitation of our customers and employees. Nevertheless, each executive officer may terminate his or her employment at any time without cause or good reason, and so as a practical matter these agreements do not guarantee the continued service of these executives. The loss of the services of any executive officer or other key personnel, including key technical and sales professionals, or the inability to hire or retain qualified personnel in the future could have a material adverse impact on our results of operations.
The integration of acquired businesses is time consuming, may distract our management from our other operations, may not be effective, and can be expensive, all of which could reduce or eliminate our expected earnings.
We have acquired businesses in the past and we may consider opportunities in the future to acquire other companies, assets or product lines that complement or expand our business. If we are unsuccessful in integrating these companies or product lines with our existing operations, or if integration is more difficult than anticipated, we may experience disruptions to our operations. A difficult or unsuccessful integration of an acquired business could have an adverse effect on our results of operations.
10
Some of the risks that may affect our ability to integrate or realize any anticipated benefits from companies or businesses we acquire include those associated with:
- •
- unexpected losses of key employees or customers of the acquired business;
- •
- conforming standards, processes, systems, procedures and controls of the acquired business with our operations;
- •
- increasing the scope, geographic diversity and complexity of our operations;
- •
- difficulties in transferring processes and know-how;
- •
- difficulties in the assimilation of acquired operations, technologies or products;
- •
- diversion of management's attention from other business concerns to the acquired business; and
- •
- adverse effects on existing business relationships with customers.
We have international business operations, which subjects us to additional risks associated with these international operations.
We have international operations with offices and data centers in Canada, Hong Kong, Japan and the United Kingdom, and another data center in China, all primarily related to our eDiscovery business. We could continue to expand internationally by entering into other world markets, including the recent formation of Epiq Systems Germany GmbH. It requires management attention and financial resources to develop successful global operations. In addition, new operations in geographies we may enter may not be immune from possible government monitoring or intrusion.
Global operations are subject to additional inherent risks, including certain risks that are not present with our domestic operations, and our future results could be adversely affected by a variety of uncontrollable and changing factors. These include:
- •
- difficulties and costs in recruiting effective management for international operations;
- •
- foreign certification, licensing and regulatory requirements, which may be substantially more complex or burdensome than our domestic
requirements;
- •
- unexpected changes in foreign regulatory requirements;
- •
- risk associated with selecting or terminating partners for foreign expansions, including marketing agents, distributors or other
strategic partners for particular markets;
- •
- changes to or reduced protection of intellectual property rights in some countries;
- •
- risk associated with fluctuations in currency exchange rates;
- •
- consequences from changes in applicable international tax laws;
- •
- risk associated with local ownership and/or investment requirements, as well as difficulties in obtaining financing in foreign
countries for local operations;
- •
- political and economic instability, national calamities, war, and terrorism;
- •
- reduced protection of confidential consumer information in some countries; and
- •
- different or additional functionality requirements for our software and services.
If we are not able to quickly adapt to or effectively manage our geographic markets outside of the U.S., our business prospects and results of operations could be negatively impacted.
11
We may be sued by third parties for alleged infringement of their proprietary rights.
The software and internet industries are characterized by the existence of a large number of patents, trademarks, and copyrights and by frequent litigation based on allegations of infringement or other violations of intellectual property rights. We have received in the past, and may receive in the future, communications from third parties alleging that we have infringed on the intellectual property rights of others. Our technologies may not be able to withstand any third-party claims or rights against their use. Any intellectual property claims, with or without merit, could be time-consuming and expensive to resolve, could divert management attention from executing our business plan, and could require us to pay monetary damages or enter into royalty or licensing agreements. In addition, certain customer agreements require us to indemnify our customers for third-party intellectual property infringement claims, which would increase the cost to us of an adverse ruling on such a claim. An adverse determination could also prevent us from offering our service to others, which could result in a loss of revenues and profits.
Future government legislation or changes in court rules could adversely affect our operating results.
Our products and services are not directly regulated by the government. Both of our reportable segments and the customers served by those segments are, however, directly or indirectly affected by federal and state laws and regulations and court rules. For example, bankruptcy reform legislation, class action and tort reform legislation and amendments to the Federal Rules of Civil Procedure regarding discovery of "electronically stored information" have all affected our customers, and indirectly, our business. Future federal or state legislation or court rules, or court interpretations of those laws and rules, could adversely affect the markets we serve and thus could have an adverse impact on our revenues and results of operations.
Goodwill and intangible assets comprise a significant portion of our total assets. We assess goodwill for impairment at least annually, which could result in a material, non-cash write-down and could have an adverse effect on our results of operations and financial condition.
The carrying value of our goodwill was approximately $404.2 million, or approximately 55% of our total assets, as of December 31, 2014. We assess goodwill for impairment on an annual basis at a reporting unit level. Goodwill is assessed between annual tests if an event occurs or circumstances change that would more likely than not reduce the fair value of a reporting unit below its carrying value. Our impairment reviews require extensive use of accounting judgment and financial estimates. Application of alternative assumptions and definitions, such as reviewing goodwill for impairment at a different organization level, could produce significantly different results. We may be required to recognize impairment of goodwill based on future economic factors such as unfavorable changes in our stock price and market capitalization or unfavorable changes in the estimated future discounted cash flows of our reporting units. Impairment of goodwill could result in material charges that could, in the future, result in a material, non-cash write-down of goodwill, which could have an adverse effect on our results of operations and financial condition.
Due to uncertainties regarding the economic environment, there can be no assurances that our estimates and assumptions made for purposes of our annual goodwill impairment test will prove to be accurate predictions of the future. If our assumptions regarding forecasted revenues or margins of certain of our reporting units are not achieved, we may be required to record goodwill impairment losses in future periods. It is not possible at this time to determine if any such future impairment loss would occur, and if it does occur, whether such charge would be material.
12
Our quarterly results have fluctuated in the past and may fluctuate in the future. If they do, our operating results may not meet the expectations of securities analysts or investors. This could cause fluctuations in the market price of our common stock.
Our quarterly results have fluctuated in the past and may fluctuate in the future. Our quarterly revenues and operating results can be difficult to forecast. Our business will continue to be affected by a number of factors, any one of which could substantially affect our results of operations for a particular fiscal quarter. Specifically, our quarterly results from operations can vary due to:
- •
- the initiation or termination of a large engagement;
- •
- the timing, size, cancellation or rescheduling of customer orders;
- •
- fluctuations in short-term interest rates;
- •
- unanticipated technology or other expenses;
- •
- changes in financial accounting and reporting standards, interpretations or positions that govern the preparation of our financial
statements;
- •
- unexpected legal or regulatory expenses;
- •
- fluctuations in the trustee services deposit portfolio; and
- •
- fluctuations in number of bankruptcy filings.
It is possible that our future quarterly results from operations from time to time will not meet the expectations of securities analysts or investors. This could cause a material decrease in the market price of our common stock.
The market price of our common stock may be volatile even if our quarterly results do not fluctuate significantly.
Even if we report stable or increased earnings, the market price of our common stock may be volatile. There are a number of factors, beyond earnings fluctuations, that can affect the market price of our common stock, including the following:
- •
- the average daily trading volume of our stock is low compared to total outstanding shares;
- •
- a decrease in market demand for our stock;
- •
- downward revisions in securities analysts' estimates;
- •
- announcements of technological innovations or new product or services offerings developed by us or our competitors;
- •
- announcements pertaining to the Company's review of strategic and financial alternatives;
- •
- receipt of unsolicited letters expressing interest in acquiring the Company;
- •
- legal proceedings;
- •
- the degree of customer acceptance of new products or enhancements offered by us; and
- •
- general market conditions and other economic factors.
In addition, the stock market has experienced significant price and volume fluctuations that have often been unrelated to the operating performance of particular companies. The market price of our common stock has been volatile and this is likely to continue.
13
We are in the process of conducting a review of strategic and financial alternatives that could adversely impact our business or our stock price.
In September 2014, we announced that our Board commenced a process to explore a full range of strategic and financial alternatives, which may include among other things, acquisitions, divestitures, or a going-private or recapitalization transaction, in order to determine a course of action that is in the best interest of all shareholders. We have also received unsolicited letters expressing interest in acquiring the Company and in conducting a proxy contest. The strategic review process, as well as the unsolicited letters, could expose us to a number of risks, including fluctuations in our stock price in response to developments or speculation regarding any developments related to the review of strategic and financial alternatives and/or expressed interests; distraction of management; difficulties in hiring, retaining and motivating key personnel as a result of uncertainty generated by the strategic review and/or expressed interests or any related developments; difficulties in maintaining relationships or arrangements with customers, suppliers and other third parties; substantial increases in general and administrative expenses associated with the need to retain and compensate legal, financial, and other advisors as a result of the strategic review and/or expressed interests; and litigation in connection with the strategic review and/or expressed interests or any related developments or actions. There can be no assurance that the strategic review and/or expressed interests will result in consummation of any transaction. The occurrence of any one or more of the above risks could have an adverse impact on our business, stock price, financial results, liquidity, and financial condition.
We may not pay cash dividends on our common stock in the future and our common stock may not appreciate in value or even maintain the price at which it was purchased.
There is no assurance that we will continue to pay cash dividends on our common stock in the future. Certain provisions in our credit agreement dated August 27, 2013 as subsequently amended on March 26, 2014 and January 26, 2015 (the "Credit Agreement"), governing our senior secured credit facility may restrict our ability to pay dividends in the future. Subject to any financial covenants in current or future financing agreements that directly or indirectly restrict the payment of dividends, the payment of dividends is within the discretion of our Board of Directors (the "Board") and will depend upon our future earnings and cash flow from operations, our capital requirements, our financial condition and any other factors that the Board may consider. Unless we continue to pay cash dividends on our common stock in the future, the success of an investment in our common stock will depend entirely upon its future appreciation. Our common stock may not appreciate in value or even maintain the price at which it was purchased.
Debt covenants in the Credit Agreement governing our credit facility require us to maintain compliance with certain financial ratios and other requirements. If we are not able to maintain compliance with these requirements, all of our then-outstanding debt could become immediately due and payable.
Our $400.0 million credit facility consists of a senior revolving loan and a senior secured term loan. The Credit Agreement contains a financial covenant related to a net leverage ratio (as defined in the Credit Agreement) which is not permitted to exceed 4.50 to 1.00 as well as other customary covenants related to limitations on (i) creating liens, debt, guarantees or other contingent obligations, (ii) engaging in mergers, acquisitions and consolidations, (iii) paying dividends or other distributions to, and redeeming and repurchasing securities from, equity holders, (iv) prepaying, redeeming or repurchasing subordinated or junior debt, and (v) engaging in certain transactions with affiliates, in each case, subject to customary exceptions. The amounts outstanding under the credit facility may be accelerated upon the occurrence of an event of default under the Credit Agreement. While we do not presently expect to be in violation of any of these requirements, no assurances can be given that we will be able to remain in compliance. There can be no assurance that our actual financial results will match our projected results or that we will not violate such covenants. Any failure to continue to comply with
14
such requirements could materially adversely affect our borrowing ability and access to liquidity, and thus our overall financial condition.
If interest rates increase, our net income could be negatively affected.
The variable interest rates applicable to borrowings under our credit facility would expose us to adverse changes in interest rates in a rising interest rate environment. When and to the extent appropriate, we use derivative financial instruments as part of our financial risk management strategy to reduce our exposure to interest rate risks. In November 2013, we entered into a two-year 3% interest rate cap agreement for a notional amount of $150.0 million equal to the portion of the senior secured term loan being hedged. As of December 31, 2014, the hedge was determined to be highly effective and is expected to continue to be highly effective in mitigating the risks of rising interest rates. In April 2014 we entered into a forward interest rate swap effective from August 31, 2015 through August 27, 2020, with a notional amount of approximately $73.7 million equal to the portion of the outstanding amortized principal amount of the senior secured term loan being hedged as of the effective date of the forward interest rate swap. Under the swap we will pay a fixed amount of interest of 2.81% on the notional amount and the swap counterparty will pay a floating amount of interest based on LIBOR with a one-month designated maturity subject to a floor of 0.75% which is consistent with the Company's obligation under the term loan. The interest rate swap contains a floor of 0.75% to ensure that the one-month LIBOR received on each settlement of the interest rate swap cannot go below 0.75%.
There is no assurance that our financial risk management strategy will be successful in reducing the risks inherent in exposures to interest rate fluctuations.
We may issue additional shares of our common stock and/or preferred stock, which may materially and adversely affect the market price of our common stock.
We are authorized to issue up to 100,000,000 shares of common stock and 2,000,000 shares of preferred stock. We may conduct future offerings of our common stock or preferred stock to fund acquisitions, finance operations or for general corporate purposes. In addition, we may also issue common stock under our equity awards programs. Any issuance of additional common stock will dilute the ownership interest of our existing common stockholders, and may cause the trading price of our common stock to decline. As of February 23, 2015, there were 37,041,224 shares of common stock outstanding and no shares of preferred stock outstanding.
Our articles of incorporation (as amended), our amended and restated bylaws and Missouri law contain provisions that could be used by us to discourage or prevent a takeover of our Company.
Some provisions of our articles of incorporation (as amended) and our amended and restated bylaws could make it more difficult for a third party to acquire control of our Company or to remove our current Board and management, even if the change of control or removal of our Board and management would be beneficial to certain shareholders. For example, our articles of incorporation include "blank check" preferred stock provisions, which permit our Board to issue one or more series of preferred stock without shareholder approval. In conjunction with the issuance of a series of preferred stock, the Board is authorized to fix the rights of that series, including voting rights, liquidation preferences, conversion rights and redemption privileges. The Board could issue a series of preferred stock to a friendly investor and use one or more of these features of the preferred stock to discourage or prevent a takeover of the Company. Additionally, our articles of incorporation do not permit cumulative voting in the election of directors. Cumulative voting, if available, would enable minority shareholders to elect one or more representatives to the Board in certain circumstances, which could be used by third parties to facilitate a takeover of our Company that was opposed by our Board or management. Our amended and restated bylaws impose advance notice requirements for stockholder
15
proposals and nominations of directors to be considered at stockholders' meetings. A third party attempting to acquire us may have difficulty in complying with those requirements.
In addition, the General and Business Corporation Law of Missouri, under which we are incorporated, provides that any merger involving the Company must be approved by the holders of not less than two-thirds of the outstanding shares of capital stock entitled to vote on the merger. Presently, our only outstanding voting securities are our shares of common stock. Accordingly, shareholders with voting power over as little as one-third of our outstanding common stock could block a merger proposal, even if that merger proposal was supported by our Board or shareholders holding a majority of our then outstanding shares of common stock.
Our Shareholders Rights Plan could make it more difficult for a third party to acquire control of the Company, which could have a negative effect on the price of our common stock.
In September 2014, we adopted a Shareholders Rights Plan (the "Rights Plan"), which could discourage potential acquisition proposals and could delay or prevent a change in control of the Company or a change in our management or Board, even in situations that may be considered beneficial by some of our shareholders. The Rights Plan may substantially dilute the stock ownership of a person or group that attempts to acquire a large interest without first negotiating with our Board. This and other anti-takeover measures could also adversely affect the price of our common stock.
General economic conditions and the cyclical nature of certain markets we serve may adversely affect our results of operations and financial condition.
Our financial performance depends, in large part, on conditions in the markets we serve and on the general condition of the global economy, which impacts these markets. Any sustained weakness in demand for our products and services resulting from a downturn of or uncertainty in the global economy or in any specific market we serve may adversely affect our results of operations and financial condition. For example, any decrease in litigation filings, class action proceedings and settlement administrations or bankruptcy filings may reduce the demand for our products and services in our Bankruptcy and Settlement Administration segment and Technology segment. Specifically, our Bankruptcy and Settlement Administration segment has experienced decreased operating revenues as a result of declines in the number of new bankruptcy cases. We expect the trend of decreased bankruptcy filings to continue into 2015, which may adversely affect our results of operations and financial condition.
ITEM 1B. UNRESOLVED STAFF COMMENTS
None.
Our corporate headquarters are located in a 69,000-square-foot facility in Kansas City, Kansas which includes a 20,000 square foot expansion completed in 2013. This property serves as collateral under our credit facility. We also have significant leased offices in: New York, New York; Phoenix, Arizona; and Portland, Oregon; in addition to smaller leased offices in Chicago, Illinois; Dallas, Texas; Hartford, Connecticut; Los Angeles, California; Miami, Florida; Washington, D.C.; and Wilmington, Delaware. Our international offices are located in: Hong Kong; London, United Kingdom; Tokyo, Japan; and Toronto, Canada.
We operate data centers in the United States, Canada, China, Hong Kong, Japan, and the United Kingdom. Our data centers provide reliable, secure access to our software environments and to customer databases.
16
We are at times involved in litigation and other legal claims in the ordinary course of business. When appropriate in management's estimation, we may record reserves in our financial statements for pending litigation and other claims. Although it is not possible to predict with certainty the outcome of litigation, we do not believe that any of the current pending legal proceedings to which we are a party will have a material impact on our results of operations, financial condition or cash flows.
ITEM 4. MINE SAFETY DISCLOSURES
Not applicable.
17
ITEM 5. MARKET FOR THE REGISTRANT'S COMMON EQUITY, RELATED STOCKHOLDER MATTERS AND ISSUER PURCHASES OF EQUITY SECURITIES
Market Information
Our common stock is traded under the symbol "EPIQ" on the NASDAQ Global Market. The following table shows the reported high and low sales prices for our common stock as reported by NASDAQ and dividend information for the calendar quarters of 2014 and 2013.
| |
Common Stock Market Prices |
|
||||||||
|---|---|---|---|---|---|---|---|---|---|---|
| |
Dividends Declared (per share) |
|||||||||
| |
High | Low | ||||||||
2014 |
||||||||||
First Quarter |
$ | 16.15 | $ | 13.05 | $ | 0.09 | ||||
Second Quarter |
14.46 | 11.68 | $ | 0.09 | ||||||
Third Quarter |
19.59 | 13.21 | $ | 0.09 | ||||||
Fourth Quarter |
19.95 | 15.16 | $ | 0.09 | ||||||
2013 |
||||||||||
First Quarter |
$ | 14.07 | $ | 12.17 | $ | 0.09 | ||||
Second Quarter |
14.22 | 11.56 | $ | 0.09 | ||||||
Third Quarter |
13.90 | 11.99 | $ | 0.09 | ||||||
Fourth Quarter |
16.73 | 13.17 | $ | 0.09 | ||||||
Dividend Policy
We do not have a formal dividend policy. Any declarations and payments of dividends to holders of our common stock are at the discretion of the Board of Directors, which depends on many factors, including our financial condition, earnings, capital requirements and other factors that the Board deems relevant. There is no assurance that we will continue to pay cash dividends on our common stock in the future, or that any such dividends will be comparable to those previously declared. Any future declarations of dividends and the establishment of future record and payment dates are subject to the final determination of our Board.
Under our Credit Agreement, our ability to declare and pay dividends and repurchase securities from equity holders is limited by a requirement that such payments are not to exceed, in the aggregate, 50% of net income, as adjusted, on a cumulative basis for all quarterly periods from the closing date of the credit facility and ending prior to the date of payment or repurchase. Adjustments to Consolidated Net Income (as defined in the Credit Agreement) include among other items, the exclusion of extraordinary items, specified severance costs, cumulative effect of a change in accounting principle, intangible asset amortization and impairment charges, non-cash compensation expense, cumulative effect of foreign currency translations, and gains or losses from discontinued operations. Further, we are unable to declare and pay dividends and repurchase securities from equity holders if our net leverage ratio (as defined in the Credit Agreement) would exceed 4.25 to 1.0.
Holders
As of February 23, 2015, there were 99 stockholders of record of our common stock. Holders of record do not include an indeterminate number of beneficial holders whose shares may be held through brokerage accounts and clearing agencies.
18
Purchases of Equity Securities by the Issuer and Affiliated Purchasers
On November 6, 2013, our Board approved and authorized the repurchase, on or prior to December 31, 2015, of outstanding shares of our common stock up to an aggregate of $35.0 million (the "2014 Share Repurchase Program"). The 2014 Share Repurchase Program became effective on January 1, 2014. There were no repurchases of shares of common stock under the 2014 Share Repurchase Program during the year ended December 31, 2014.
We also have a policy that requires us to repurchase shares of our common stock to satisfy employee tax withholding obligations upon the vesting of restricted stock awards or the exercise of stock options and, at the participant's election, shares of common stock surrendered to the Company as payment of the exercise price of stock options exercised under the amended and restated Epiq Systems, Inc. 2004 Equity Incentive Plan (the "Current Plan"). During the year ended December 31, 2014, we repurchased an aggregate 323,090 shares for approximately $4.0 million to satisfy employee tax withholding and exercise price obligations upon the vesting of restricted stock awards and stock option exercises under the Current Plan. There were no such repurchases of shares of common stock under the Current Plan in the three months ended December 31, 2014. Shares of common stock surrendered by participants to the Company as payment of the exercise price arising from the exercise of stock options are included in "Stock option exercises" in the Consolidated Statements of Changes in Equity.
Recent Sales of Unregistered Securities
None.
Stock Performance Graph
The following graphs show the total shareholder return of an investment of $100 in cash for (i) Epiq's common stock, (ii) the NASDAQ Stock Market Computer & Data Processing Index(1), (iii) the Standard & Poor's 500 Total Return Index and (iv) the NASDAQ US Benchmark Computer Services TR Index for our last five fiscal years (December 31, 2009 through December 31, 2014). All values assume reinvestment of the full amount of any dividends. The information below shall not be deemed "soliciting material" or "filed" with the SEC, nor shall such information be incorporated by reference into any future filing under the Securities Act of 1933 or the Exchange Act of 1934, each as amended, except to the extent that we specifically incorporate it by reference into such filing.
19
Comparison of Five-Year Cumulative Total Return Among
Epiq Systems, Inc., NASDAQ Computer & Data Processing Index(1), S&P 500
Total Return Index and NASDAQ US Benchmark Computer Services
TR Index
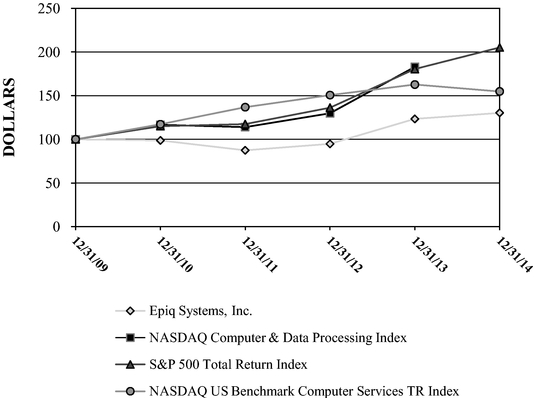
- (1)
- Prior to December 31, 2014, NASDAQ Global Markets discontinued the reporting of the NASDAQ Computer & Data Processing Index to external users and, therefore, we are unable to report data for such index as of December 31, 2014 without unreasonable effort. As a result, we replaced this index with the NASDAQ US Benchmark Computer Services Total Return Index, which we believe includes investments that are similar to the NASDAQ Computer & Data Processing Index.
ITEM 6. SELECTED FINANCIAL DATA
The following table presents selected historical financial data for the five years ended December 31, 2010 through December 31, 2014.
| |
Year Ended December 31, | |||||||||||||||
|---|---|---|---|---|---|---|---|---|---|---|---|---|---|---|---|---|
| |
2014 | 2013 | 2012 | 2011(1) | 2010(2) | |||||||||||
| |
(in thousands, except per share data) |
|||||||||||||||
Income Statement Data: |
||||||||||||||||
Operating revenue |
$ | 444,118 | $ | 438,690 | $ | 344,750 | $ | 261,265 | $ | 217,595 | ||||||
Reimbursable expenses |
30,352 | 43,393 | 28,335 | 22,061 | 29,571 | |||||||||||
Total revenue |
474,470 | 482,083 | 373,085 | 283,326 | 247,166 | |||||||||||
Income from operations |
10,801 | 29,220 | 44,651 | 26,623 | 28,469 | |||||||||||
Net income (loss) |
(1,337 | ) | 11,110 | 22,427 | 12,080 | 13,929 | ||||||||||
Basic net income (loss) per share |
(0.04 | ) | 0.31 | 0.62 | 0.34 | 0.38 | ||||||||||
Diluted net income (loss) per share |
(0.04 | ) | 0.30 | 0.61 | 0.33 | 0.36 | ||||||||||
Cash dividends declared per common share |
0.36 | 0.36 | 0.385 | 0.205 | 0.07 | |||||||||||
Balance Sheet Data: |
||||||||||||||||
Total assets |
$ | 738,252 | $ | 747,781 | $ | 654,716 | $ | 678,664 | $ | 478,218 | ||||||
Long-term obligations (excluding current maturities) |
302,522 | 299,108 | 203,288 | 247,994 | 86,860 | |||||||||||
- (1)
- Reflects
the acquisitions of Encore Intermediate Holdco, Inc. on April 4, 2011 ("Encore") and De Novo Legal LLC on
December 28, 2011.
- (2)
- Reflects the acquisition of Jupiter eSources LLC on October 1, 2010.
20
ITEM 7. MANAGEMENT'S DISCUSSION AND ANALYSIS OF FINANCIAL CONDITION AND RESULTS OF OPERATIONS
The following discussion and analysis of our financial condition and results of operations should be read in conjunction with the sections entitled "Forward-Looking Statements," "Risk Factors," "Selected Financial Data," and "Financial Statements and Supplementary Data" included in this report.
Executive Summary
Epiq is a leading global provider of integrated technology solutions for the legal profession. We combine proprietary software, deep subject matter expertise, highly responsive customer service delivery and a global infrastructure to assist our customers with the technology requirements for complex matters. We offer these capabilities across a variety of practice areas including bankruptcy, litigation, class action, antitrust, investigations and regulatory compliance.
Our two reportable segments are Technology and Bankruptcy and Settlement Administration.
Technology provides eDiscovery managed services and technology solutions comprised of consulting, collections and forensics, processing, search and review, production of documents and document review services to companies and law firms.
Bankruptcy and Settlement Administration provides managed services and technology solutions that address the needs of our customers with respect to litigation, claims and project administration, compliance matters, controlled disbursements, corporate restructuring, bankruptcy and class action proceedings.
Investing in proprietary software development maximizes our competitiveness in the marketplace and distinguishes us from our competitors. Beyond our proprietary software we also incorporate various licensed third-party software products in our solution set allowing us to expand our solutions.
Network infrastructure is an essential component of our technology strategy because most of our software is utilized by our customers within a hosted environment and we manage a high volume of client data. A single large client engagement may entail over 100 million documents or 100 terabytes of information and may include complex structured data (i.e., databases) and unstructured data (e.g., email archives). We operate eDiscovery data centers in the United States, Canada, China, Japan and the United Kingdom. Our data centers provide reliable, secure access to our software environments and to customer databases. Information security is paramount in any managed technology business, and Epiq incorporates best practices designed to protect sensitive customer data.
Our software and IT capabilities include significant in-house fulfillment capabilities. Our office locations in New York, Kansas City and Portland have internal abilities for high-speed printing and mailing, call center operations, and disbursement and tax records preparation. The combination of software, IT and fulfillment resources enables Epiq to act as a single-source solution for even the largest, most complex matters in the markets where we compete.
We work in niche, specialty areas which require deep subject matter expertise—such as litigation, investigations, bankruptcy, mergers and acquisitions, mass tort, settlements and class action—which have distinctive practices and requirements. Technology alone is insufficient to bring about a successful outcome on a sophisticated client matter; it is often the application of the technology and the expertise of our staff that create the most value for our client. We have a worldwide team of executives, client services specialists and technical consultants on whom clients rely for expert advice—whether delivered at the client's site or from one of our office locations. Our team includes former practicing litigators, bankruptcy attorneys, plaintiff's counsel, defense counsel, eDiscovery counsel and other professionals who are leaders in their areas of expertise. While we do not offer clients legal advice (because we are
21
not a law firm), we draw heavily from our subject matter expertise in the legal profession to assist clients in achieving the best outcome on each project for which we are retained.
Our clients include top tier law firms, the in-house legal departments of major corporations, trustees, specialty fiduciaries and other professionals. Among law firms, we work extensively with Am Law 100 firms in the U.S., Magic Circle firms in the U.K. and leading boutique or specialty law firms in all geographies. Among corporate clients, we have substantial relationships with large, multinational companies in a variety of industries, including financial services, pharmaceuticals, insurance, technology and others. The global nature of our business continues to grow. With full-service offices (i.e., locations having a data center, on-site technical staff, on-site project management capabilities and local consulting capacities) around the world, Epiq offers a geographic reach to support client relationships wherever we are needed.
Our financial results are primarily driven by the following facts, among others:
- •
- the number, size and complexity of customer engagements attained;
- •
- the number of documents or volume of data we processed, hosted or reviewed;
- •
- the number of hours professional services are provided;
- •
- the balance of assets placed with our designated financial institutions by bankruptcy trustees with respect to the deposit-based fees
we earn; and
- •
- the geographic locations of our clients or locations where services are rendered.
Financial and Industry Trends
Financial Overview
Our pre-tax loss for 2014 was $5.9 million, a decrease of $23.0 million compared to 2013. The decrease was primarily the result of the following:
- •
- Increased reorganization expenses: Reorganization expense increased by $11.4 million. The increase was primarily related to
post-employment benefits in connection with executive resignation agreements. We do not anticipate these expenses to recur in 2015.
- •
- Increased depreciation and software and leasehold amortization: Depreciation and software and leasehold amortization expense increased
by $5.1 million. Over the past several years, we have invested significantly in the expansion of our global data centers and in upgrades to our network infrastructure both in the United States
and internationally in order to grow our operating revenue and enhance data security. In 2015, we expect to continue to invest in our operations through capital expenditures and potential acquisition
opportunities.
- •
- Increased net interest expense: Net interest expense increased by $4.6 million due to higher principal amount of debt
outstanding during 2014 and higher interest rate for our term loan. We entered into a new Credit Agreement in August 2013, to fund our higher level of capital expenditures and to provide for enhanced
financial flexibility to pay cash dividends and consider acquisition opportunities. The financial covenants in the new Credit Agreement are less restrictive than the ones contained in our former
credit facility. Our new Credit Agreement provided incremental liquidity and a $200 million uncommitted accordion for access to incremental capital.
- •
- Incurrence of strategic and financial review expenses: We incurred $1.9 million of strategic and financial review expenses. See the section entitled "Strategic and Financial Review" for additional information about the continuing review.
22
Technology Trends
Our Technology segment continues to be a leader in the highly fragmented global eDiscovery market. The growth of our international eDiscovery operations was one of the two drivers of the increase in operating revenue in the Technology segment over the last three years. Operating revenue from our international eDiscovery operations increased 22% in 2014 and 90% in 2013 due to organic growth from both new and existing clients and represented 21% percent of total Technology segment operating revenue in 2014 compared to approximately 18% in 2013 and 13% in 2012. North American eDiscovery operating revenue growth was flat in 2014 compared to a 38% increase in 2013 due primarily to increases in document review services. The 2014 North America revenue result was the product of continued pricing pressures in our ESI service offerings and lower document volumes in 2014 derived from a large document review engagement, which commenced in the second half of 2013. We expect the recent pricing pressures related to our ESI services to continue into 2015, which could impact gross margins.
Global ESI solutions continued as the primary Technology segment service offering, representing approximately 59%, 58% and 73% of the total Technology segment operating revenue in 2014, 2013 and 2012, respectively, while global document review services represented approximately 41%, 42% and 27% of the total Technology segment operating revenue in the same periods, respectively.
Bankruptcy and Settlement Administration Trends
The operating results of our Bankruptcy and Settlement Administration segment largely depends on the number, size and complexity of bankruptcy filings and of class action, mass tort, federal regulatory actions and litigation activity within the United States. According to the most recently reported data published by the Administrative Office of the U.S. Courts, bankruptcy filings decreased approximately 12% in both 2014 and 2013. Operating revenue from bankruptcy services represented 57%, 52% and 60% of the total operating revenue of the Bankruptcy and Settlement Administration segment in 2014, 2013 and 2012, respectively. Settlement administrative services were 43%, 48% and 40% of total segment operating revenue in the same periods, respectively. We expect the current decline in bankruptcy filings to continue into 2015, which could negatively impact our revenue and income from operations. In our settlement administration business, we expect to complete two large class action matters in 2015. Given the limited visibility on future projects, we anticipate modest growth in our settlement administration revenues in 2015, driven by an increase in demand for mass tort, federal regulatory action and data breach related services.
Strategic and Financial Review
On September 18, 2014, the Board announced that it commenced a process to explore a full range of strategic and financial alternatives, which may include among other things, acquisitions, divestitures, or a going-private or recapitalization transaction, in order to determine a course of action that is in the best interest of all shareholders. In addition to the strategic review, on September 18, 2014, we entered into a rights plan pursuant to which the Board declared a dividend of one preferred stock purchase right (a "Right") for each outstanding share of our common stock. The dividend was paid on September 29, 2014 to holders of record as of the close of business on that date. The Board has adopted the Rights Plan to protect shareholders from coercive or otherwise unfair takeover tactics during the time the Board considers a full range of strategic and financial alternatives.
23
Results of Operations for the Year Ended December 31, 2014 Compared with the Year Ended December 31, 2013
The following provides information relevant to understanding our consolidated results of operations. Also see discussion of segment results in Results of Operations by Segment section below.
Consolidated Results of Operations
| |
Year Ended December 31, | ||||||||||||
|---|---|---|---|---|---|---|---|---|---|---|---|---|---|
| Amounts in thousands |
2014 | 2013 | $ Change Increase / (Decrease) |
% Change Increase / (Decrease) |
|||||||||
Operating revenue |
$ | 444,118 | $ | 438,690 | $ | 5,428 | 1 | % | |||||
Reimbursable expenses |
30,352 | 43,393 | (13,041 | ) | (30 | )% | |||||||
| | | | | | | | | | | | | | |
Total Revenue |
474,470 | 482,083 | (7,613 | ) | (2 | )% | |||||||
| | | | | | | | | | | | | | |
Direct costs of operating revenue (exclusive of depreciation and amortization shown separately below) |
216,317 | 210,458 | 5,859 | 3 | % | ||||||||
Reimbursable expenses |
29,592 | 41,766 | (12,174 | ) | (29 | )% | |||||||
Selling, general and administrative expense |
167,041 | 149,045 | 17,996 | 12 | % | ||||||||
Depreciation and software and leasehold amortization |
36,042 | 30,971 | 5,071 | 16 | % | ||||||||
Amortization of identifiable intangible assets |
12,655 | 18,834 | (6,179 | ) | (33 | )% | |||||||
Fair value adjustment to contingent consideration |
1,142 | 2,580 | (1,438 | ) | (56 | )% | |||||||
Other operating (income) expense |
880 | (791 | ) | 1,671 | N/M | ||||||||
| | | | | | | | | | | | | | |
Total Operating Expense |
463,669 | 452,863 | 10,806 | 2 | % | ||||||||
| | | | | | | | | | | | | | |
Income From Operations |
10,801 | 29,220 | (18,419 | ) | (63 | )% | |||||||
| | | | | | | | | | | | | | |
Interest Expense (Income) |
|||||||||||||
Interest expense |
16,674 | 12,130 | 4,544 | 37 | % | ||||||||
Interest income |
(21 | ) | (15 | ) | (6 | ) | 40 | % | |||||
| | | | | | | | | | | | | | |
Net Interest Expense |
16,653 | 12,115 | 4,538 | 37 | % | ||||||||
| | | | | | | | | | | | | | |
Income (Loss) Before Income Taxes |
(5,852 | ) | 17,105 | (22,957 | ) | (134 | )% | ||||||
Provision for (Benefit from) Income Taxes |
(4,515 | ) | 5,995 | (10,510 | ) | (175 | )% | ||||||
| | | | | | | | | | | | | | |
Net Income (Loss) |
$ | (1,337 | ) | $ | 11,110 | $ | (12,447 | ) | (112 | )% | |||
| | | | | | | | | | | | | | |
| | | | | | | | | | | | | | |
| | | | | | | | | | | | | | |
N/M—not meaningful
Revenue
For the year ended December 31, 2014, Operating revenue increased $5.4 million, or 1%, to $444.1 million from $438.7 million during the year ended December 31, 2013. The increase was driven by a $12.8 million increase in the Technology segment, offset by a $7.4 million decrease in operating revenues for the Bankruptcy and Settlement Administration segment. Refer to the subsequent Results of Operations by Segment for additional information.
Total Revenue includes reimbursable expenses, such as postage related to notification services. We reflect these reimbursed expenses as a separate line item on our accompanying Consolidated Statements of Income. Although Reimbursable expenses may fluctuate significantly from period to period, these fluctuations have a minimal effect on our period to period income from operations as we realize little or no margin from this revenue.
Operating Expense
For the year ended December 31, 2014, Direct cost of operating revenue, exclusive of depreciation and amortization expense, increased $5.8 million, or 3%, to $216.3 million from $210.5 million during the year ended December 31, 2013. The increase reflects the increase in and the mix of operating
24
revenue and includes a $15.6 million increase in direct compensation costs primarily in our Technology segment. This increase was partially offset by a $9.3 million decrease in costs for legal notification and advertising services.
For the year ended December 31, 2014, Reimbursable expenses decreased $12.2 million, or 29% to $29.6 million from $41.8 million during the year ended December 31, 2013. The decrease corresponds to the percentage decline in Reimbursable expenses revenue and is primarily due to lower postage costs.
For the year ended December 31, 2014, Selling, general and administrative expense increased $18.0 million, or 12% to $167.0 million from $149.0 million during the year ended December 31, 2013. This included an increase of $11.4 million of reorganization expenses that are primarily post-employment benefits related to executive resignation agreements. It also included an increase of $5.6 million in office-related expenses such as lease expense, maintenance, utilities and supplies primarily related to the expansion of our document review centers' capacity, and an increase of $1.9 million related to our strategic and financial review process.
For the year ended December 31, 2014, Depreciation and software and leasehold amortization increased $5.0 million, or 16%, to $36.0 million from $31.0 million during the year ended December 31, 2013, as a result of increased depreciation on equipment and software related to capital expenditures.
For the year ended December 31, 2014, Amortization of identifiable intangible assets decreased $6.1 million, or 33% to $12.7 million from $18.8 million during the year ended December 31, 2013. The decrease was the result of applying an accelerated amortization method to certain of our intangible assets that are at later stages of their estimated useful lives.
During the years ended December 31, 2014 and 2013, Fair value adjustment to contingent consideration of $1.1 million and $2.6 million, respectively, were recorded related to our acquisition of De Novo Legal LLC in 2011. See Note 5 to the Consolidated Financial Statements for further discussion of the contingent consideration.
Net Interest Expense
For the year ended December 31, 2014, Net interest expense increased $4.6 million, or 37%, to $16.7 million from $12.1 million during the year ended December 31, 2013. The increase reflects the higher principal amount of debt outstanding during the year ended December 31, 2014 as compared to the prior year and the higher rate of interest for our term loan under the credit facility as compared to the interest rate under the former credit facility. Interest expense for the year ended December 31, 2014 included $0.8 million related to fees incurred and expensed in conjunction with the amendment to our credit facility. Interest expense for the year ended December 31, 2013 included $1.0 million for the write-off of fees related to the early termination of the former credit facility. See Note 5 to the Consolidated Financial Statements for further discussion of the credit facility.
Income Taxes
Our effective tax rate for the year ended December 31, 2014 was 77.2% and was 35.0% for the prior year period. Our 2014 tax benefit is higher than the U.S. statutory rate primarily because of the relative mix of income earned in international jurisdictions compared to the pre-tax loss in the United States. See Note 10 to the Consolidated Financial Statements for further details relating to the mix of foreign and U.S. domestic income (or loss) and corresponding income tax provisions.
25
Results of Operations by Segment
The following segment discussion is presented on a basis consistent with our segment disclosure contained in Note 14 to the Consolidated Financial Statements. The table below presents operating revenue, direct costs and selling, general and administrative expenses (including reimbursable expenses) and segment performance measure for each of our reportable segments and a reconciliation of the segment performance measure to consolidated income before income taxes.
| |
Year Ended December 31, |
|
|
||||||||||
|---|---|---|---|---|---|---|---|---|---|---|---|---|---|
| |
$ Change Increase / (Decrease) |
% Change Increase / (Decrease) |
|||||||||||
| Amounts in thousands |
2014 | 2013 | |||||||||||
Operating revenue |
|||||||||||||
Technology |
$ | 297,679 | $ | 284,929 | $ | 12,750 | 4 | % | |||||
Bankruptcy and Settlement Administration |
146,439 | 153,761 | (7,322 | ) | (5 | )% | |||||||
| | | | | | | | | | | | | | |
Total operating revenue |
$ | 444,118 | $ | 438,690 | $ | 5,428 | 1 | % | |||||
| | | | | | | | | | | | | | |
| | | | | | | | | | | | | | |
| | | | | | | | | | | | | | |
Reimbursable expenses |
|||||||||||||
Technology |
$ | 2,540 | $ | 2,488 | $ | 52 | 2 | % | |||||
Bankruptcy and Settlement Administration |
27,812 | 40,905 | (13,093 | ) | (32 | )% | |||||||
| | | | | | | | | | | | | | |
Total reimbursable expenses |
$ | 30,352 | $ | 43,393 | $ | (13,041 | ) | (30 | )% | ||||
| | | | | | | | | | | | | | |
| | | | | | | | | | | | | | |
| | | | | | | | | | | | | | |
Direct costs, selling, general and administrative expenses |
|||||||||||||
Technology |
$ | 218,255 | $ | 198,462 | $ | 19,793 | 10 | % | |||||
Bankruptcy and Settlement Administration |
121,085 | 145,596 | (24,511 | ) | (17 | )% | |||||||
Intercompany eliminations |
(2,045 | ) | (384 | ) | (1,661 | ) | 433 | % | |||||
| | | | | | | | | | | | | | |
Total direct costs, selling, general and administrative expenses |
$ | 337,295 | $ | 343,674 | $ | (6,379 | ) | (2 | )% | ||||
| | | | | | | | | | | | | | |
| | | | | | | | | | | | | | |
| | | | | | | | | | | | | | |
Segment performance measure |
|||||||||||||
Technology |
$ | 84,009 | $ | 89,339 | $ | (5,330 | ) | (6 | )% | ||||
Bankruptcy and Settlement Administration |
53,166 | 49,070 | 4,096 | 8 | % | ||||||||
| | | | | | | | | | | | | | |
Total segment performance measure |
$ | 137,175 | $ | 138,409 | $ | (1,234 | ) | (1 | )% | ||||
| | | | | | | | | | | | | | |
| | | | | | | | | | | | | | |
| | | | | | | | | | | | | | |
Segment performance measure as a percentage of Operating revenue |
|||||||||||||
Technology |
28 | % | 31 | % | |||||||||
Bankruptcy and Settlement Administration |
36 | % | 32 | % | |||||||||
Total |
31 | % | 32 | % | |||||||||
Reconciliation of Segment Performance Measure to Consolidated Income Before Income Taxes |
|||||||||||||
Segment performance measure |
$ | 137,175 | $ | 138,409 | $ | (1,234 | ) | (1 | )% | ||||
Unallocated corporate expenses |
(62,557 | ) | (47,587 | ) | (14,970 | ) | 31 | % | |||||
Share-based compensation expense |
(13,098 | ) | (10,008 | ) | (3,090 | ) | 31 | % | |||||
Depreciation and software and leasehold amortization |
(36,042 | ) | (30,971 | ) | (5,071 | ) | 16 | % | |||||
Amortization of intangible assets |
(12,655 | ) | (18,834 | ) | 6,179 | (33 | )% | ||||||
Fair value adjustment to contingent consideration |
(1,142 | ) | (2,580 | ) | 1,438 | (56 | )% | ||||||
Other operating income (expense) |
(880 | ) | 791 | (1,671 | ) | N/M | |||||||
| | | | | | | | | | | | | | |
Income from operations |
10,801 | 29,220 | (18,419 | ) | (63 | )% | |||||||
Interest expense, net |
(16,653 | ) | (12,115 | ) | (4,538 | ) | 37 | % | |||||
| | | | | | | | | | | | | | |
Income (loss) before income taxes |
$ | (5,852 | ) | $ | 17,105 | $ | (22,957 | ) | (134 | )% | |||
| | | | | | | | | | | | | | |
| | | | | | | | | | | | | | |
| | | | | | | | | | | | | | |
N/M—not meaningful
26
Technology Segment
For the year ended December 31, 2014, Operating revenue increased $12.8 million, or 4%, to $297.7 million from $284.9 million during the year ended December 31, 2013. The increased revenue was primarily the result of growth in our Europe and Asia operations, which increased $11.0 million or 22% as compared to 2013, including an increase of $5.4 million related to electronically stored information ("ESI"). In addition, ESI revenue increased by $3.2 million in our North America operations, offset by a decrease in document review services of $1.4 million.
For the year ended December 31, 2014, Direct costs, selling, general and administrative expenses increased $19.8 million, or 10%, to $218.3 million from $198.5 million during the year ended December 31, 2013. This included an $11.2 million increase in direct compensation expenses for employees, project-based attorneys and contractor labor. This direct compensation increase was partially offset by a $6.7 million decrease in general and administrative employee compensation. The change in Direct costs, selling, general and administrative expenses also included a $7.9 million increase in information technology-related costs, a $3.8 million increase in other production related costs, and a $3.3 million increase in office-related expenses such as lease expense, maintenance, utilities and supplies primarily related to the expansion of our document review centers' capacity.
Bankruptcy and Settlement Administration Segment
For the year ended December 31, 2014, Operating revenue decreased $7.4 million, or 5%, to $146.4 million from $153.8 million during the year ended December 31, 2013. The decrease was primarily due to a $10.6 million decrease in settlement administration revenues driven by a large private anti-trust engagement in the prior year which was principally completed in the first quarter of 2013 that increased legal notification and advertising services for that period. Settlement administration continues to be dependent on the timing and size of contracts awarded. This decrease was offset by a $3.2 million increase in bankruptcy related revenues in 2014.
For the year ended December 31, 2014, Direct costs, selling, general and administrative expenses decreased $24.5 million, or 17%, to $121.1 million from $145.6 million during the year ended December 31, 2013. The decrease was primarily the result of a $20.7 million decrease in direct cost of services which was related to the large private anti-trust engagement which was active during the first quarter of 2013. In addition, there was a $3.1 million decrease in general and administrative employee compensation costs.
27
Results of Operations for the Year Ended December 31, 2013 Compared with the Year Ended December 31, 2012
The following provides information relevant to our consolidated results of operations. Also see discussion of segment results in Results of Operations by Segment section below.
Consolidated Results of Operations
| |
Year Ended December 31, | ||||||||||||
|---|---|---|---|---|---|---|---|---|---|---|---|---|---|
| Amounts in thousands |
2013 | 2012 | $ Change Increase / (Decrease) |
% Change Increase / (Decrease) |
|||||||||
Operating revenue |
$ | 438,690 | $ | 344,750 | $ | 93,940 | 27 | % | |||||
Reimbursable expenses |
43,393 | 28,335 | 15,058 | 53 | % | ||||||||
| | | | | | | | | | | | | | |
Total Revenue |
482,083 | 373,085 | 108,998 | 29 | % | ||||||||
| | | | | | | | | | | | | | |
Direct costs of operating revenue (exclusive of depreciation and amortization shown separately below) |
210,458 | 145,629 | 64,829 | 45 | % | ||||||||
Reimbursable expenses |
41,766 | 27,426 | 14,340 | 52 | % | ||||||||
Selling, general and administrative expense |
149,045 | 117,023 | 32,022 | 27 | % | ||||||||
Depreciation and software and leasehold amortization |
30,971 | 27,399 | 3,572 | 13 | % | ||||||||
Amortization of identifiable intangible assets |
18,834 | 26,588 | (7,754 | ) | (29 | )% | |||||||
Fair value adjustment to contingent consideration |
2,580 | (17,188 | ) | 19,768 | N/M | ||||||||
Intangible asset impairment expense |
— | 1,777 | (1,777 | ) | (100 | )% | |||||||
Other operating income |
(791 | ) | (220 | ) | (571 | ) | N/M | ||||||
| | | | | | | | | | | | | | |
Total Operating Expense |
452,863 | 328,434 | 124,429 | 38 | % | ||||||||
| | | | | | | | | | | | | | |
Income From Operations |
29,220 | 44,651 | (15,431 | ) | (35 | )% | |||||||
| | | | | | | | | | | | | | |
Interest Expense (Income) |
|||||||||||||
Interest expense |
12,130 | 9,263 | 2,867 | 31 | % | ||||||||
Interest income |
(15 | ) | (18 | ) | 3 | (17 | )% | ||||||
| | | | | | | | | | | | | | |
Net Interest Expense |
12,115 | 9,245 | 2,870 | 31 | % | ||||||||
| | | | | | | | | | | | | | |
Income Before Income Taxes |
17,105 | 35,406 | (18,301 | ) | (52 | )% | |||||||
Provision for Income Taxes |
5,995 | 12,979 | (6,984 | ) | (54 | )% | |||||||
| | | | | | | | | | | | | | |
Net Income |
$ | 11,110 | $ | 22,427 | $ | (11,317 | ) | (50 | )% | ||||
| | | | | | | | | | | | | | |
| | | | | | | | | | | | | | |
| | | | | | | | | | | | | | |
N/M—not meaningful
Revenue
For the year ended December 31, 2013, Operating revenue increased $93.9 million, or 27%, to $438.7 million from $344.8 million during the year ended December 31, 2012. The increase was driven by an $88.0 million increase in the Technology segment and a $6.0 million increase in the Bankruptcy and Settlement Administration segment. Refer to the subsequent Results of Operations by Segment for additional information.
Our total revenue includes reimbursed expenses, such as postage related to notification services. Although reimbursed expenses may fluctuate significantly from period to period, these fluctuations have a minimal effect on our income from operations as we realize little or no margin from this revenue.
28
Operating Expenses
For the year ended December 31, 2013, Direct cost of operating revenue, exclusive of depreciation and amortization expense, increased $64.9 million, or 45%, to $210.5 million from $145.6 million during the year ended December 31, 2012. The increase was due primarily to increased costs in support of revenue growth and included a $54.0 million increase in direct compensation related expenses primarily in support of growth in our eDiscovery document review services, a $4.6 million increase in direct contract labor, and a $6.8 million increase in outside production costs, partially offset by a $6.3 million decrease in legal notification and advertising services.
For the year ended December 31, 2013, Reimbursable expenses increased $14.4 million, or 52%, to $41.8 million from $27.4 million during the year ended December 31, 2012. The decrease corresponds to the decline in Reimbursable expenses revenue.
For the year ended December 31, 2013, Selling, general and administrative expenses increased $32.0 million, or 27%, to $149.0 million from $117.0 million during the year ended December 31, 2012. The increase was primarily due to our operating revenue growth and an increase in the number of employees to support the increased revenues, primarily in the Technology segment and to a lesser extent, incremental costs related to our data center consolidation project. The $32.0 million increase in selling, general and administrative expenses included a $21.9 million increase in compensation related expenses, a $3.7 million increase in outside professional services, a $3.3 million increase in office related expense and an increase of $2.9 million in travel related expenses.
For the year ended December 31, 2013, Depreciation and software and leasehold amortization increased $3.6 million, or 13%, to $31.0 million from $27.4 million during the year ended December 31, 2012, as a result of increased depreciation on equipment and software related to segment investments.
For the year ended December 31, 2013, Amortization of identifiable intangible assets decreased $7.8 million, or 29%, to $18.8 million from $26.6 million during the year ended December 31, 2012. The decrease was the result of applying an accelerated amortization method to certain of our intangible assets, which are at lower amortization stages of their estimated useful lives.
The $2.6 million expense related to the fair value adjustment to contingent consideration for the year ended December 31, 2013 is related to the De Novo Legal LLC acquisition. For the year ended December 31, 2012, the income of $17.2 million from the fair value adjustment to contingent consideration is also related to the De Novo Legal LLC acquisition. See Notes 5 and 13 to the Consolidated Financial Statements for further detail.
Net Interest Expense
For the year ended December 31, 2013, Net interest expense increased $2.9 million, or 31%, to $12.1 million from $9.2 million during the year ended December 31, 2012. The $2.9 million increase in net interest expense was primarily due to increased borrowings during 2013 as compared to the prior year period in addition to the partial write-off of deferred loan fees in the amount of $1.0 million associated with the replacement of our former credit facility. See Note 5 to the Consolidated Financial Statements for further information.
Income Taxes
Our effective tax rate for 2013 decreased slightly to 35.0% from 36.7% for 2012. In both years, we recognized tax benefits associated with discrete events unique to each year. Our tax rate was reduced in 2013 due to recognizing $0.5 million of 2012 research credits as the legislation to extend the 2012 credit was passed in 2013. Our 2012 tax rate was reduced due to recognizing a $0.5 million benefit due to effectively settling a state income tax audit claim.
29
Results of Operations by Segment
| |
Year Ended December 31, |
|
|
||||||||||
|---|---|---|---|---|---|---|---|---|---|---|---|---|---|
| |
$ Change Increase / (Decrease) |
% Change Increase / (Decrease) |
|||||||||||
| Amounts in thousands |
2013 | 2012 | |||||||||||
Operating revenue |
|||||||||||||
Technology |
$ | 284,929 | $ | 196,959 | $ | 87,970 | 45 | % | |||||
Bankruptcy and Settlement Administration |
153,761 | 147,791 | 5,970 | 4 | % | ||||||||
| | | | | | | | | | | | | | |
Total operating revenue |
$ | 438,690 | $ | 344,750 | $ | 93,940 | 27 | % | |||||
| | | | | | | | | | | | | | |
| | | | | | | | | | | | | | |
| | | | | | | | | | | | | | |
Reimbursable expenses |
|||||||||||||
Technology |
$ | 2,488 | $ | 1,546 | $ | 942 | 61 | % | |||||
Bankruptcy and Settlement Administration |
40,905 | 26,789 | 14,116 | 53 | % | ||||||||
| | | | | | | | | | | | | | |
Total reimbursable expenses |
$ | 43,393 | $ | 28,335 | $ | 15,058 | 53 | % | |||||
| | | | | | | | | | | | | | |
| | | | | | | | | | | | | | |
| | | | | | | | | | | | | | |
Direct costs, selling, general and administrative expenses |
|||||||||||||
Technology |
$ | 198,462 | $ | 125,182 | $ | 73,280 | 59 | % | |||||
Bankruptcy and Settlement Administration |
145,596 | 122,359 | 23,237 | 19 | % | ||||||||
Intercompany eliminations |
(384 | ) | (203 | ) | (181 | ) | 89 | % | |||||
| | | | | | | | | | | | | | |
Total direct costs, selling, general and administrative expenses |
$ | 343,674 | $ | 247,338 | $ | 96,336 | 39 | % | |||||
| | | | | | | | | | | | | | |
| | | | | | | | | | | | | | |
| | | | | | | | | | | | | | |
Segment performance measure |
|||||||||||||
Technology |
$ | 89,339 | $ | 73,526 | $ | 15,813 | 22 | % | |||||
Bankruptcy and Settlement Administration |
49,070 | 52,221 | (3,151 | ) | (6 | )% | |||||||
| | | | | | | | | | | | | | |
Total segment performance measure |
$ | 138,409 | $ | 125,747 | $ | 12,662 | 10 | % | |||||
| | | | | | | | | | | | | | |
| | | | | | | | | | | | | | |
| | | | | | | | | | | | | | |
Segment performance measure as a percentage of Operating revenue |
|||||||||||||
Technology |
31 | % | 37 | % | |||||||||
Bankruptcy and Settlement Administration |
32 | % | 35 | % | |||||||||
Total |
32 | % | 36 | % | |||||||||
Reconciliation of Segment Performance Measure to Consolidated Income Before Income Taxes |
|||||||||||||
Segment performance measure |
$ | 138,409 | $ | 125,747 | $ | 12,662 | 10 | % | |||||
Unallocated corporate expenses |
(47,587 | ) | (36,021 | ) | (11,566 | ) | 32 | % | |||||
Share-based compensation expense |
(10,008 | ) | (6,719 | ) | (3,289 | ) | 49 | % | |||||
Depreciation and software and leasehold amortization |
(30,971 | ) | (27,399 | ) | (3,572 | ) | 13 | % | |||||
Amortization of intangible assets |
(18,834 | ) | (26,588 | ) | 7,754 | (29 | )% | ||||||
Fair value adjustment to contingent consideration |
(2,580 | ) | 17,188 | (19,768 | ) | N/M | |||||||
Intangible asset impairment expense |
— | (1,777 | ) | 1,777 | (100 | )% | |||||||
Other operating income |
791 | 220 | 571 | N/M | |||||||||
| | | | | | | | | | | | | | |
Income from operations |
29,220 | 44,651 | (15,431 | ) | (35 | )% | |||||||
Interest expense, net |
(12,115 | ) | (9,245 | ) | (2,870 | ) | (31 | )% | |||||
| | | | | | | | | | | | | | |
Income before income taxes |
$ | 17,105 | $ | 35,406 | $ | (18,301 | ) | (52 | )% | ||||
| | | | | | | | | | | | | | |
| | | | | | | | | | | | | | |
| | | | | | | | | | | | | | |
N/M—not meaningful
30
Technology Segment
For the year ended December 31, 2013, Operating revenue increased $87.9 million, or 45%, to $284.9 million from $197.0 million during the year ended December 31, 2012. The increased revenue was primarily the result of an increase in eDiscovery engagements as compared to the prior year. During 2013 we continued to expand internationally with eDiscovery offices and data centers in Tokyo (office and data center), Shanghai (data center only) and Toronto (office and data center). International operating revenue grew 90% in 2013 to $50.3 million from $26.5 million in 2012.
For the year ended December 31, 2013, Direct, selling, general and administrative costs increased $73.3 million, or 59%, to $198.5 million from $125.2 million during the year ended December 31, 2012. The increase was primarily in support of revenue growth and included an increase of $56.5 million in compensation related expense, a $6.0 million increase in information technology related costs, a $2.6 million increase in outside production costs, a $2.5 million increase in direct contract labor, a $2.4 million increase in office related expense, and a $1.1 million increase in travel related expense.
Bankruptcy and Settlement Administration Segment
For the year ended December 31, 2013, Operating revenue increased $6.0 million, or 4%, to $153.8 million from $147.8 million during the year ended December 31, 2012. The increase was primarily due to a large private anti-trust settlement administration engagement which was principally completed in the first quarter of 2013 that increased legal notification and advertising services as compared to 2012. This increase was partially offset by decreases in revenues resulting from a cyclical downturn in bankruptcy filings.
For the year ended December 31, 2013, Direct, selling, general and administrative expenses increased $23.2 million, or 19%, to $145.6 million from $122.4 million during the year ended December 31, 2012. The decrease was primarily the result of a $5.6 million increase in compensation related expense, a $13.1 million increase in reimbursed direct costs related to a large settlement administration engagement which was active during the entirety of 2013, a $4.1 million increase in other production costs, a $5.1 million increase in outside production costs, offset by a $6.3 million decrease in legal notification costs.
Liquidity and Capital Resources
Overview
As of December 31, 2014, we had $54.2 million in cash and cash equivalents on hand, of which $14.3 million is held with financial institutions outside of the United States. We consider the earnings of our foreign subsidiaries to be indefinitely invested outside the United States on the basis of estimates that future domestic cash generation will be sufficient to meet future domestic cash needs. In the event that we decide to repatriate foreign earnings, we would have to adjust the income tax provision in the period when we determine that the earnings will no longer be indefinitely invested outside the United States.
We have historically funded our operations primarily through cash flows from operations, borrowings under our credit facility and the issuance of debt. Furthermore, we have historically used cash to develop and enhance our proprietary software products, enhance the operating efficiency of our data centers, repurchase shares of our common stock and pay dividends. We have also used cash flows from operations to pay interest and principal amounts outstanding under our credit facility.
We believe that existing cash balances and other current assets, together with cash provided by operating activities and, as necessary, borrowing capacity under our credit facility, will suffice to meet our operating and debt service requirements and other current liabilities for at least the next
31
12 months. As we expect to continue to generate positive free cash flow in 2015 and beyond, we expect to continue to repay the amounts outstanding under our credit facility.
Operating Activities
During the year ended December 31, 2014, our operating activities provided net cash of $69.7 million. Included in net cash provided by operating activities was a net loss of $1.3 million, which included $67.3 million of non-cash expenses for a total contribution to operating cash flows of $66.0 million related to net income adjusted to exclude non-cash expenses. Cash provided by operating activities also included a $3.7 million net increase in cash resulting from changes in operating assets and liabilities, primarily from a $22.5 million decrease in trade accounts receivable, offset by an increase in income taxes receivable of $11.7 million and a decrease in accounts payable and other liabilities of $3.9 million. Trade accounts receivable fluctuate from period to period depending on the period to period change in revenue and the timing of revenue and collections. Accounts payable fluctuate from period to period depending on the timing of purchases and payments.
During the year ended December 31, 2013, our operating activities provided net cash of $32.6 million. Included in net cash provided by operating activities was net income of $11.1 million and $58.1 million of non-cash expenses, for a total of $69.2 million. Cash provided by operating activities also included a $36.6 million net use of cash resulting from changes in operating assets and liabilities, primarily from a $43.4 million increase in trade accounts receivable including a $32.7 million increase in fourth quarter total revenue as compared to the same period in the prior year. Cash provided by operating activities also included the use of cash for customer deposits primarily related to the fourth quarter 2012 receipt of a $14.3 million customer deposit for a large settlement administration engagement and other expenditures for that matter. These uses of cash were partially offset by a $16.1 million increase in accounts payable and other liabilities and a $5.9 million increase in income tax liabilities.
During the year ended December 31, 2012, our operating activities provided net cash of $73.7 million. Included in net cash provided by operating activities was net income of $22.4 million and non-cash expenses of $50.8 million for a total of $73.2 million. The net use of cash resulting from changes in operating assets and liabilities included a $17.1 million increase in trade accounts receivable primarily due to revenue growth offset by a $14.1 million increase in customer deposits, offset by a $2.2 million decrease in income tax liabilities and a $2.8 million decrease in prepaid expenses and other assets.
Investing Activities
During the years ended December 31, 2014, 2013 and 2012, we used cash of $28.9 million, $34.6 million and $16.0 million, respectively, including, for the purchase of computer hardware mainly for the expansion and enhancement of our network infrastructure, in support of the data growth of our Technology segment, purchased software licenses primarily for our Technology segment and $7.9 million related to the expansion of our Kansas City corporate headquarters which was completed in the third quarter of 2013. Software development is essential to our continued growth and during the years ended December 31, 2014, 2013, and 2012, we used cash of $7.2 million, $6.1 million and $6.5 million, respectively, to fund internal costs related to the development of software. Additionally, in 2014 we used cash of $0.3 million in connection with the acquisition of Minus–10 Software, LLC ("Minus 10").
Financing Activities
During the year ended December 31, 2014, we repaid $10.8 million of long-term debt obligations, including $3.0 million under the credit facility, $4.1 million related to the repayment of a note payable and $3.7 million related to other long-term debt obligations. We also paid $5.0 million of contingent
32
acquisition consideration related to the December 28, 2011 acquisition of De Novo Legal LLC based upon achievement of 2013 revenue-based performance measures, $12.8 million in dividends and we used $4.0 million to repurchase shares we were required to repurchase to satisfy employee tax withholding obligations upon the vesting of restricted stock awards and the net share settlement of certain stock option exercises. Additionally, we used $0.8 million related to debt issuance costs. Cash proceeds from the exercise of stock options were $12.5 million.
During the year ended December 31, 2013, we borrowed $88.0 million and repaid $287.0 million under our former credit facility, inclusive of the payment of the outstanding revolving loan balance on August 27, 2013, the proceeds of which were used primarily to fund working capital requirements associated with sequential revenue growth and capital expenditures including the Kansas City corporate headquarters expansion and the data center consolidation project. During the year ended December 31, 2013, we paid $3.1 million of deferred acquisition consideration related to the December 28, 2011 acquisition of De Novo Legal LLC, $7.9 million of principal payments related to other debt, and $12.9 million of dividends. During the year ended December 31, 2013, we used $29.4 million to repurchase shares under our share repurchase program and shares required to be repurchased by the Company to satisfy employee tax withholding obligations upon the vesting of restricted stock awards and the net share settlement of certain stock option exercises.
During the year ended December 31, 2012, we borrowed $65.0 million and repaid $83.0 million under our former credit facility along with $7.2 million of principal payments related to other debt for total debt reduction of $25.2 million. In addition, we paid $12.4 million in dividends and used $6.0 million to repurchase shares under our share repurchase program and shares required to be repurchased by the Company to satisfy employee tax withholding obligations upon the vesting of restricted stock awards and the net share settlement of certain stock option exercises. In addition, during the year ended December 31, 2012, we paid $8.4 million related to deferred purchase consideration in connection with the October 1, 2010 acquisition of Jupiter eSources LLC. See Note 5 to Consolidated Financial Statements for further information.
Credit Agreement
On August 27, 2013, we entered into a $400 million senior secured credit facility consisting of a $100 million senior revolving loan commitment, maturing in August 2018, and a $300 million senior secured term loan, maturing in August 2020 (the "Credit Agreement").
During the term of the Credit Agreement, we have the right, subject to compliance with the covenants specified in the Credit Agreement, to increase the amounts available under the credit facility up to a maximum of $600 million in one or more tranches including increasing the term loan from $300 million to $500 million and total capacity under the senior revolving loan commitment from its original $100 million up to a maximum of $200 million. The credit facility is secured by liens on our real property and a significant portion of our personal property.
On March 26, 2014, we entered into the First Amendment to the Credit Agreement ("First Amendment"), which reduced the interest rate options for our senior secured term loan and reduced the LIBOR floor. Effective with the date of the First Amendment, the senior secured term loan bore interest as follows: (1) 2.50% plus prime rate subject to a 1.75% floor; or (2) 3.50% plus one, two, three or six month LIBOR subject to a 0.75% LIBOR floor. As of December 31, 2014, all outstanding borrowings under the senior secured term loan were based on the 0.75% LIBOR floor and the applicable margin was 3.50% for an aggregate floating rate of 4.25%.
The term loan facility under our credit facility requires scheduled quarterly principal payments of $750,000, and a final installment equal to the remaining principal balance in August 2020. In addition, the Credit Agreement contains certain annual mandatory pre-payment terms based on a percentage of excess cash flow, commencing with measurement for the fiscal year ended December 31, 2014, and
33
initial payment, if any, in fiscal year 2015. Excess cash flow, as defined in the Credit Agreement includes Consolidated EBITDA (as defined in the Credit Agreement) adjusted for capital expenditures, changes in working capital, interest paid, income taxes paid, principal payments, dividends and certain acquisition-related obligations. Such annual mandatory prepayments are only required when the net leverage ratio exceeds (as defined in the Credit Agreement) 2.75 to 1.00. As of December 31, 2014, mandatory prepayments outstanding under the credit facility were $0.6 million, which are included in Current maturities of long-term obligations in the Consolidated Balance Sheet.
Pursuant to the Credit Agreement our net leverage ratio is not permitted to exceed 4.50 to 1.00. In addition, our Credit Agreement contains other customary covenants including limitations on (i) creating liens, debt, guarantees or other contingent obligations, (ii) engaging in mergers, acquisitions and consolidations, (iii) paying dividends or other distributions to, and redeeming and repurchasing securities from, equity holders, (iv) prepaying, redeeming or repurchasing subordinated or junior debt, and (v) engaging in certain transactions with affiliates, in each case, subject to customary exceptions. Under our Credit Agreement, our ability to declare and pay dividends and repurchase securities from equity holders is limited by a requirement that such payments are not to exceed, in the aggregate, 50% of net income, as adjusted, on a cumulative basis for all quarterly periods from the closing date of the credit facility and ending prior to the date of payment or repurchase. Adjustments to Consolidated Net Income (as defined in the Credit Agreement) include among other items, the exclusion of extraordinary items, specified severance costs, cumulative effect of a change in accounting principle, intangible asset amortization and impairment charges, non-cash compensation expense, cumulative effect of foreign currency translations, and gains or losses from discontinued operations. Further, we are unable to declare and pay dividends and repurchase securities from equity holders if our net leverage ratio (as defined in the Credit Agreement) would exceed 4.25 to 1.0.
On January 26, 2015, we entered into the Second Amendment to the Credit Agreement (the "Second Amendment"), which increased the interest rate options for the senior secured term loan. Effective on January 26, 2015, the senior secured term loan bears interest as follows (1) 2.75% plus prime rate subject to a 1.75% floor; or (2) 3.75% plus one, two, three or six month LIBOR subject to a 0.75% LIBOR floor. The Second Amendment also amended the definition of "Applicable Margin" increasing the margin determined by reference to our consolidated net leverage ratio (as defined in the Credit Agreement) for purposes of calculating the interest rate for base rate loans, Eurodollar loans and the fee applicable to letters of credit as specified therein. In addition, the Second Amendment amended the definitions of "Consolidated EBITDA", "Consolidated Net Income" and "Excess Cash Flow" to permit us to add back the following charges: (1) severance and reorganization costs and expenses incurred during any trailing twelve month period that includes a fiscal quarter ending on or after January 1, 2014 and on or prior to December 31, 2014; and (2) certain fees, costs and expenses incurred by us in connection with our previously announced review of certain strategic and financial alternatives, including potential proxy contests.
As of December 31, 2014, we were in compliance with all financial covenants as amended on January 26, 2015.
As of December 31, 2014, our outstanding borrowings under the term loan were $296 million and there were no borrowings outstanding under the revolving credit facility. See Note 5 to the Consolidated Financial Statements for additional information related to the credit facility.
Business Acquisitions
On April 1, 2014, we completed the acquisition of Minus 10, a company that develops and maintains software products and provides related services to its customers with respect to web-enabled bankruptcy preparation and case management and expanded our Chapter 11 restructuring service offerings. The combined purchase consideration of $1.3 million included $0.3 million in cash
34
consideration, $0.1 million of deferred purchase price and contingent consideration with an acquisition date fair value of $0.9 million. The sellers of Minus 10 have the right to receive contingent consideration based on a percentage of future qualifying profit and other measures, as defined in the purchase agreement. This contingent consideration would be payable, if earned, over seven discrete measurement periods beginning with the period from April 1, 2014 through December 31, 2014 and each annual period ending December 31, 2015 through December 31, 2020. The fair value of the contingent consideration was determined by a present value calculation of the potential payouts based on financial projections over the earn-out period. Subsequent changes in fair value, which will be measured quarterly, will be recognized in earnings. As of December 31, 2014, the estimated fair value of the contingent consideration was $1.1 million.
Dividends
During 2014, total cash dividends declared were $13.0 million or $0.36 per share of common stock, and total dividends paid totaled $12.8 million, or $0.36 per share of common stock. Total cash dividends declared in 2013 were $12.8 million or $0.36 per share of common stock, and total dividends paid in 2013 totaled $12.9 million, or $0.36 per share of common stock.
We do not have a formal dividend policy. We will determine if we will pay cash dividends on a quarterly basis and dividends may be declared at the discretion of our Board. There is no assurance that we will continue to pay cash dividends on our common stock in the future, or that any such dividends will be comparable to those previously declared. Any future declarations of dividends and the establishment of future record and payment dates are subject to the final determination of our Board.
Share Repurchase Program
On November 6, 2013, our Board approved and authorized the 2014 Share Repurchase Program, which consists of the repurchase, on or prior to December 31, 2015, of our outstanding shares of common stock up to an aggregate of $35.0 million. The 2014 Share Repurchase Program became effective on January 1, 2014. There were no repurchases of shares of common stock under the 2014 Share Repurchase Program during the year ended December 31, 2014.
Off-balance Sheet Arrangements
We do not utilize off-balance sheet arrangements in our operations; however, we enter into operating leases in the ordinary course of business. Our operating lease obligations are disclosed below under "Contractual Obligations" and also in Note 6 to the Consolidated Financial Statements.
Contractual Obligations
Contractual obligations for purchases of goods or services include agreements that are enforceable and legally binding on the Company and that specify all significant terms, including fixed or minimum quantities to be purchased; fixed, minimum, or variable price provisions; and the approximate timing of the transaction. For obligations with cancellation provisions, the amounts included in the following table were limited to the non-cancelable portion of the agreement terms or the minimum cancellation fee.
The expected timing of payments of the obligations below is estimated based on current information. Timing of payments and actual amounts paid may be different, depending on the time of receipt of goods or services, or changes to agreed-upon amounts for some obligations.
35
The following table summarizes our significant contractual obligations and commitments as of December 31, 2014.
| |
Payments Due By Period (in thousands) |
|||||||||||||||||||||
|---|---|---|---|---|---|---|---|---|---|---|---|---|---|---|---|---|---|---|---|---|---|---|
Contractual Obligation(1)
|
2015 | 2016 | 2017 | 2018 | 2019 | 2020 & After |
Total | |||||||||||||||
Long-term obligations(2) |
$ | 16,099 | $ | 15,391 | $ | 15,263 | $ | 15,136 | $ | 15,008 | $ | 287,621 | $ | 364,518 | ||||||||
Capital lease obligations(3) |
2,749 | 185 | 172 | 71 | — | — | 3,177 | |||||||||||||||
Operating leases |
9,666 | 7,226 | 5,402 | 5,238 | 5,265 | 24,958 | 57,755 | |||||||||||||||
Note payable(4) |
4,832 | 4,848 | 3,636 | — | — | — | 13,316 | |||||||||||||||
Purchase commitments(5) |
3,961 | 3,330 | 2,652 | 1,455 | — | — | 11,398 | |||||||||||||||
Executive resignation agreement(6) |
3,985 | 1,021 | — | — | — | — | 5,006 | |||||||||||||||
Other obligations |
116 | — | 510 | 864 | 963 | 1,231 | 3,684 | |||||||||||||||
| | | | | | | | | | | | | | | | | | | | | | | |
Total(7) |
$ | 41,408 | $ | 32,001 | $ | 27,635 | $ | 22,764 | $ | 21,236 | $ | 313,810 | $ | 458,854 | ||||||||
| | | | | | | | | | | | | | | | | | | | | | | |
| | | | | | | | | | | | | | | | | | | | | | | |
| | | | | | | | | | | | | | | | | | | | | | | |
- (1)
- Approximately
$5.1 million of unrecognized tax benefits are not included in this contractual obligations table due to the uncertainty
related to the timing of any payments.
- (2)
- Includes
scheduled principal and interest payments on our credit facility which matures in August 2020, assuming interest rates in effect as
of December 31, 2014.
- (3)
- Includes
scheduled principal and interest payments on our capital leases which mature in periods through 2018.
- (4)
- Includes
scheduled principal and interest payments on our note payable related to a software license agreement.
- (5)
- Includes
payments due under various types of licenses and agreements to purchase goods and services and also includes capital purchase
obligations related to the construction or purchase of property, plant and equipment. These amounts were not recorded as liabilities on our consolidated balance sheet as of December 31, 2014,
as we had not yet received the related goods or services.
- (6)
- Includes
payments due to Christopher E. Olofson, our former President, Chief Operating Officer and director, pursuant to a resignation
agreement between the Company and Mr. Olofson.
- (7)
- Total excludes contractual obligations already recorded on our consolidated balance sheet as current liabilities except for the short-term portions of long-term obligations and capital lease obligations.
Critical Accounting Policies and Estimates
Our consolidated financial statements are prepared in accordance with U.S. generally accepted accounting principles ("U.S. GAAP"), which require management to make estimates, judgments and assumptions that affect the amounts reported in our consolidated financial statements and accompanying notes. We believe our most critical accounting policies and estimates relate to the following:
- •
- Revenue recognition
- •
- Recoverability of goodwill
- •
- Recoverability of long-lived assets
- •
- Income taxes
Management has discussed the development, selection and disclosure of critical accounting policies and estimates with the Audit Committee of the Board. While our estimates and assumptions are based on our knowledge of current events and actions we may undertake in the future, actual results may ultimately differ from these estimates and assumptions. For a discussion of the Company's significant accounting policies, refer to Note 1 of Notes to Consolidated Financial Statements.
36
Revenue Recognition
Non-Software Arrangements—Certain of our services, such as data hosting, processing and professional services are billed based on unit prices and volumes for which we have identified each deliverable service element. Based on our evaluation of each element, we have determined that each element delivered has standalone value to our customers because we or other vendors sell such services separately from any other services and deliverables. For certain of these services we have obtained objective and reliable evidence of the fair value of each element based either on the price we charge when we sell an element on a standalone basis or on third-party evidence of fair value of such similar services. For elements where evidence cannot be established, the best estimate of sales price has been used. Our arrangements do not include general rights of return. Accordingly, each of the service elements in our multiple element case and document management arrangements qualifies as a separate unit of accounting. We allocate revenue to the various units of accounting in our arrangements based on the fair value or best estimated selling price of each unit of accounting, which is generally consistent with the stated prices in our arrangements. In instances when revenue recognition is deferred, we utilize the relative selling price method to calculate the revenue recognized for each period. When we have evidence of an arrangement, revenue for each separate unit of accounting is recognized each period. Revenue is recognized as the services are rendered, our fee becomes fixed and determinable, and collectability is reasonably assured. Payments received in advance of satisfaction of the related revenue recognition criteria are recognized as a customer deposit until all revenue recognition criteria have been satisfied.
Software Arrangements—For our Chapter 7 bankruptcy trustee arrangements, we provide our trustee clients with a software license, hardware lease, hardware maintenance, and post-contract customer support services at no charge to the trustee. The trustees place their liquidated estate deposits with a financial institution with which we have an arrangement. We earn contingent monthly fees from the financial institutions for the software license, hardware lease, hardware maintenance, and post-contract customer support services provided to our trustee clients based on the average dollar amount of deposits held by the trustees with that financial institution. The monthly deposit fees have two components consisting of an interest-based component and a non-interest based service fee. Since we have not established vendor specific objective evidence of the fair value of the software license, we do not recognize any revenue on delivery of the software. The software element is deferred and included with the remaining undelivered elements, which are post-contract customer support services. Revenue related to post-contract customer support is entirely contingent on the future placement of liquidated estate deposits by the trustee with the financial institution. Accordingly, we recognize this contingent usage based revenue as the fee becomes fixed or determinable at the time actual usage occurs and collectability is probable. This occurs monthly as a result of the computation, billing and collection of monthly deposit fees contractually agreed. At that time, we have also satisfied the other revenue recognition criteria since we have persuasive evidence that an arrangement exists, services have been rendered, the price is fixed and determinable, and collectability is reasonably assured.
We also provide our trustee clients with certain hardware, such as desktop computers, monitors, and printers as well as hardware maintenance. We retain ownership of all hardware provided and we account for this hardware as a lease. As the hardware maintenance arrangement is an executory contract similar to an operating lease, we use guidance related to contingent rentals in operating lease arrangements for hardware maintenance as well as for the hardware lease. Since the payments under all of our arrangements are contingent upon the level of trustee deposits and the delivery of upgrades and other services, and there remain important uncertainties regarding the amount of unreimbursable costs yet to be incurred by us, we account for the hardware lease as an operating lease. Therefore, all lease payments, based on the estimated fair value of hardware provided, are accounted for as contingent rentals, which require that we recognize rental income when the changes in the factor on which the contingent lease payment is based actually occur. This occurs at the end of each period as we
37
achieve our target when deposits are held at the financial institution as, at that time, evidence of an arrangement exists, delivery has occurred, the amount has become fixed and determinable, and collection is reasonably assured. This revenue, which was substantially less than ten percent of our total revenue for the years ended December 31, 2014, 2013 and 2012, is included in the Consolidated Statements of Income as a component of "Operating revenue."
Recoverability of Goodwill
Goodwill consists of the excess of cost of acquired enterprises over the sum of the amounts assigned to identifiable assets acquired less liabilities assumed. We assess goodwill for impairment on at least an annual basis at a reporting unit level and have identified our operating segments (Technology and Bankruptcy and Settlement Administration) as our reporting units for purposes of testing for goodwill impairment.
The goodwill impairment test consists of a two-step process, if necessary. The first step is to compare the fair value of a reporting unit to its carrying value, including goodwill. We considered both a market approach and an income approach in order to develop an estimate of the fair value of each reporting unit for purposes of our annual impairment test. When available, and as appropriate, we use market multiples derived from a set of competitors or companies with comparable market characteristics to establish fair values for a particular reporting unit (market approach). We also estimate fair value using discounted projected cash flow analysis (income approach). Potential impairment is indicated when the carrying value of a reporting unit, including goodwill, exceeds its estimated fair value. This analysis requires significant judgments, including estimation of future cash flows, which is dependent on internal forecasts, estimation of the long-term rate of growth for our business, estimation of the useful life over which cash flows will occur, and determination of our weighted average cost of capital. Changes in these estimates and assumptions could materially affect the determination of fair value and goodwill impairment for each reporting unit. In addition, financial and credit market volatility directly impacts our fair value measurement through our weighted average cost of capital, used to determine our discount rate, and through our stock price, used to determine our market capitalization.
The second step compares the implied fair value of the reporting unit's goodwill with the carrying amount of that goodwill. If the carrying amount of the reporting unit's goodwill exceeds its implied fair value, an impairment charge is recognized in an amount equal to that excess. The loss recognized cannot exceed the carrying amount of goodwill. As of July 31, 2014, which is the date of our most recent impairment test, the fair value of each of our reporting units was in excess of the carrying value of the reporting unit.
Our annual test is performed as of July 31 each year. As of December 31, 2014, there have been no events since our last annual test to indicate that it is more likely than not that the recorded goodwill balance had become impaired. Our consolidated goodwill totaled $404.2 million as of December 31, 2014.
The following table illustrates the percentages by which each reporting unit's fair value and our aggregate fair value exceeded its carrying value as of July 31, 2014. In addition the table includes sensitivity analyses related to changes in certain key assumptions for each reporting unit. The impact of
38
each assumption change within the sensitivity analyses was calculated independently and excludes the impact of the other assumed changes.
| |
Technology | Bankruptcy and Settlement Administration |
Total(2) | |||||||
|---|---|---|---|---|---|---|---|---|---|---|
Fair Values in Excess of Carrying Values |
||||||||||
Percentage by which fair value exceeds carrying value as of July 31, 2014 |
60 | % | 32 | % | 55 | % | ||||
Sensitivity Analysis—Change in Certain Key Assumptions |
||||||||||
Percentage by which fair value would exceed carrying value: |
||||||||||
• 25 basis points increase in discount rate(1) |
55 | % | 29 | % | n/a | |||||
• 25 basis points decrease in long-term growth rate(1) |
57 | % | 30 | % | n/a | |||||
- (1)
- Assumes
all other inputs remain the same; the impact of each assumption change within the sensitivity analyses above was calculated
independently and excludes the impact of the other assumed changes.
- (2)
- Total fair value of the Company was determined using the NASDAQ stock price as of the measurement date adjusted by an assumed control premium. Changes in the discount rate or growth rates of individual reporting units would therefore not impact the total fair value of the Company in any of the sensitivity analyses presented above.
Recoverability of Long-lived Assets
We amortize long-lived assets over their estimated useful lives. Identifiable long-lived assets are reviewed for impairment whenever events or changes in circumstances indicate that the carrying value may not be recoverable. Determination of recoverability is based on the lowest level of identifiable estimated undiscounted future cash flows resulting from use of the asset and its eventual disposition. Measurement of any impairment loss is based on the excess of the carrying value of the asset over its fair value. Fair value is determined based on the lowest level of identifiable estimated future cash flows using discount rates determined by our management to be commensurate with the risk inherent in our business model. Our estimates of future cash flows attributable to our long-lived assets require significant judgment based on our historical and anticipated results and are subject to many factors. Different assumptions and judgments could materially affect estimated future cash flows relating to our long-lived assets which could trigger impairment.
Income Taxes
Our annual income tax expense or benefit is impacted by our income and the statutory tax rates and tax planning opportunities available to us in the various jurisdictions in which we operate. Significant judgment is required in determining our annual tax expense and in evaluating our tax positions. We establish reserves to remove some or all of the tax benefit of any of our tax positions at the time we determine that the positions become uncertain based upon one of the following: (1) the tax position is not "more likely than not" to be sustained, (2) the tax position is "more likely than not" to be sustained, but for a lesser amount, or (3) the tax position is "more likely than not" to be sustained, but not in the financial period in which the tax position was originally taken. For purposes of evaluating whether or not a tax position is uncertain, (1) we presume the tax position will be examined by the relevant taxing authority that has full knowledge of all relevant information, (2) the technical merits of a tax position are derived from authorities such as legislation and statutes, legislative intent, regulations, rulings and case law and their applicability to the facts and circumstances of the tax position, and (3) each tax position is evaluated without considerations of the possibility of offset or aggregation with other tax positions taken.
39
Tax law requires items to be included in the tax return that are different than when these items are reflected in the consolidated financial statements. As a result, the annual tax rate reflected in our consolidated financial statements is different from that reported in our tax return (our cash tax rate). Some of these differences are permanent, such as expenses that are not deductible in our tax return, and some differences reverse over time, such as depreciation expense. These timing differences create deferred tax assets and liabilities. Deferred tax assets and liabilities are determined based on temporary differences between the financial reporting and tax bases of assets and liabilities. The tax rates used to determine deferred tax assets or liabilities are the enacted tax rates in effect for the year and manner in which the differences are expected to reverse. Based on the evaluation of all available information, the Company recognizes future tax benefits, such as net operating loss carryforwards, to the extent that realizing these benefits is considered more likely than not.
40
ITEM 7A. QUANTITATIVE AND QUALITATIVE DISCLOSURES ABOUT MARKET RISK
The principal market risks to which we are exposed include interest rates under our credit facility, fluctuations in short-term interest rates on a portion of our bankruptcy trustee revenue, and foreign exchange rates giving rise to translation.
Interest Rate Risk
The senior secured term loan under our credit facility bears interest as follows: (1) 2.50% plus prime rate subject to a 1.75% floor; or (2) 3.50% plus one, two, three or six month LIBOR rate subject to a 0.75% LIBOR floor. As of December 31, 2014, all outstanding borrowings under the term loan were based on LIBOR subject to a 0.75% LIBOR floor and the applicable margin was 3.50%.
In November 2013 we entered into a two-year 3% interest rate cap agreement for a notional amount of $150 million equal to the portion of the senior secured term loan being hedged. As of December 31, 2014, the hedge was determined to be highly effective and is expected to continue to be highly effective in mitigating the risks of rising interest rates.
In April 2014 we entered into a forward interest rate swap effective from August 31, 2015 through August 27, 2020, with a notional amount of approximately $73.7 million equal to the portion of the outstanding amortized principal amount of the senior secured term loan being hedged as of the effective date of the forward interest rate swap. Under the swap we will pay a fixed amount of interest of 2.81% on the notional amount and the swap counterparty will pay a floating amount of interest based on LIBOR with a one-month designated maturity subject to a floor of 0.75% which is consistent with the Company's obligation under the term loan. The interest rate swap contains a floor of 0.75% to ensure that the one-month LIBOR received on each settlement of the interest rate swap will not be less than our LIBOR floor obligation to lenders of 0.75%.
The objective of entering into this interest rate swap is to eliminate the variability of the cash flows in interest payments related to the portion of the debt being hedged. The interest rate swap qualifies as a cash flow hedge and, as such, is being accounted for at estimated fair value with changes in estimated fair value being deferred in accumulated other comprehensive income until such time as the hedged transaction is recognized in earnings. As of December 31, 2014, the hedge was determined to be highly effective and is expected to continue to be highly effective in mitigating the risks of rising interest rates.
We earn deposit-based and service fees from our Chapter 7 bankruptcy services. Deposit-based fees are earned on a percentage of Chapter 7 assets placed on deposit with a designated financial institution by our trustee clients. The fees we earn are based on assets placed on deposit by our trustee clients and may vary based on fluctuations in short-term interest rates.
Based on sensitivity analysis we performed for the year ended December 31, 2014, a hypothetical 1% movement in interest rates would not have had a material effect on our consolidated financial position, results from operations or cash flows.
Foreign Currency Risk
We have operations outside of the United States and therefore, a portion of our revenues and expenses are incurred in a currency other than United States dollars. We do not utilize hedge instruments to manage the exposures associated with fluctuating currency exchange rates. Our operating results are exposed to changes in exchange rates between the United States dollar and the functional currency of the countries where we have operations. When the United States dollar weakens against foreign currencies, the dollar value of revenues and expenses denominated in foreign currencies increases. When the United States dollar strengthens, the opposite situation occurs.
41
We performed a sensitivity analysis assuming a hypothetical 1% increase in foreign exchange rates applied to our historical 2014 results of operations which indicated that such a movement would not have had a material effect on our total revenues or net income for the year ended December 31, 2014.
ITEM 8. FINANCIAL STATEMENTS AND SUPPLEMENTARY DATA
The financial statements and supplementary financial information required to be filed under this Item 8 are presented on pages F-1 through F-43 in Part IV, Item 15 of this Form 10-K and are incorporated herein by reference.
ITEM 9. CHANGES IN AND DISAGREEMENTS WITH ACCOUNTANTS ON ACCOUNTING AND FINANCIAL DISCLOSURE
None.
ITEM 9A. CONTROLS AND PROCEDURES
Evaluation of Disclosure Controls and Procedures
Under the supervision and with the participation of our management, including our principal executive officer and principal financial officer, we conducted an evaluation of the effectiveness of the design and operation of our disclosure controls and procedures, as defined in Rules 13a-15(e) and 15d-15(e) of the Securities Exchange Act of 1934, as amended. Based on their evaluation as of December 31, 2014, the end of the period covered by this Annual Report on Form 10-K, our principal executive officer and principal financial officer concluded that our disclosure controls and procedures were effective at a reasonable assurance level to ensure that the information required to be disclosed in reports filed or submitted under the Securities Exchange Act of 1934, as amended, including this Annual Report on Form 10-K, were recorded, processed, summarized and reported within the time periods specified in the SEC's rules and forms, and was accumulated and communicated to management, including our principal executive officer and principal financial officer, as appropriate to allow timely decisions regarding required disclosure.
Management's Report on Internal Control Over Financial Reporting
Our management is responsible for establishing and maintaining adequate internal control over financial reporting as defined in Rule 13a-15(f) and 15-(f) under the Securities Exchange Act of 1934, as amended. Management conducted an assessment of the effectiveness of our internal control over financial reporting based on the criteria set forth in Internal Control—Integrated Framework issued by the Committee of Sponsoring Organizations of the Treadway Commission (2013 framework). Based on the assessment, management has concluded that its internal control over financial reporting was effective as of December 31, 2014. Our independent registered public accounting firm, Deloitte & Touche LLP, has issued an audit report with respect to our internal control over financial reporting, which appears in Part II, Item 9A of this report on Form 10-K.
Changes in Internal Control Over Financial Reporting
Management, together with our principal executive officer and our principal financial officer, evaluated the changes in our internal control over financial reporting during the quarter ended December 31, 2014. We determined that there were no changes in our internal control over financial reporting during the quarter ended December 31, 2014 that have materially affected, or are reasonably likely to materially affect, our internal control over financial reporting.
42
REPORT OF INDEPENDENT REGISTERED PUBLIC ACCOUNTING FIRM
To
the Board of Directors and Shareholders of
Epiq Systems, Inc.
Kansas City, Kansas
We have audited the internal control over financial reporting of Epiq Systems, Inc. and subsidiaries (the "Company") as of December 31, 2014, based on criteria established in Internal Control—Integrated Framework (2013) issued by the Committee of Sponsoring Organizations of the Treadway Commission. The Company's management is responsible for maintaining effective internal control over financial reporting and for its assessment of the effectiveness of internal control over financial reporting, included in the accompanying Management's Report on Internal Control over Financial Reporting. Our responsibility is to express an opinion on the Company's internal control over financial reporting based on our audit.
We conducted our audit in accordance with the standards of the Public Company Accounting Oversight Board (United States). Those standards require that we plan and perform the audit to obtain reasonable assurance about whether effective internal control over financial reporting was maintained in all material respects. Our audit included obtaining an understanding of internal control over financial reporting, assessing the risk that a material weakness exists, testing and evaluating the design and operating effectiveness of internal control based on the assessed risk, and performing such other procedures as we considered necessary in the circumstances. We believe that our audit provides a reasonable basis for our opinion.
A company's internal control over financial reporting is a process designed by, or under the supervision of, the company's principal executive and principal financial officers, or persons performing similar functions, and effected by the company's board of directors, management, and other personnel to provide reasonable assurance regarding the reliability of financial reporting and the preparation of financial statements for external purposes in accordance with generally accepted accounting principles. A company's internal control over financial reporting includes those policies and procedures that (1) pertain to the maintenance of records that, in reasonable detail, accurately and fairly reflect the transactions and dispositions of the assets of the company; (2) provide reasonable assurance that transactions are recorded as necessary to permit preparation of financial statements in accordance with generally accepted accounting principles, and that receipts and expenditures of the company are being made only in accordance with authorizations of management and directors of the company; and (3) provide reasonable assurance regarding prevention or timely detection of unauthorized acquisition, use, or disposition of the company's assets that could have a material effect on the financial statements.
Because of the inherent limitations of internal control over financial reporting, including the possibility of collusion or improper management override of controls, material misstatements due to error or fraud may not be prevented or detected on a timely basis. Also, projections of any evaluation of the effectiveness of the internal control over financial reporting to future periods are subject to the risk that the controls may become inadequate because of changes in conditions, or that the degree of compliance with the policies or procedures may deteriorate.
In our opinion, the Company maintained, in all material respects, effective internal control over financial reporting as of December 31, 2014, based on the criteria established in Internal Control—Integrated Framework (2013) issued by the Committee of Sponsoring Organizations of the Treadway Commission.
We have also audited, in accordance with the standards of the Public Company Accounting Oversight Board (United States), the consolidated financial statements and financial statement schedule as of and for the year ended December 31, 2014 of the Company and our report dated March 2, 2015 expressed an unqualified opinion on those financial statements and financial statement schedule.
/s/
DELOITTE & TOUCHE LLP
Kansas City, Missouri
March 2, 2015
43
None.
ITEM 10. DIRECTORS, EXECUTIVE OFFICERS AND CORPORATE GOVERNANCE
Incorporated by reference to the sections entitled "Election of Directors (Proposal No. 1)", "Executive Officers", "Corporate Governance" and "Stock Ownership Information—Section 16(a) Beneficial Ownership Reporting Compliance" of our Proxy Statement for our 2015 Annual Meeting of Shareholders to be filed with the Securities and Exchange Commission within 120 days after the close of the year ended December 31, 2014.
ITEM 11. EXECUTIVE COMPENSATION
Incorporated by reference to the sections entitled "Executive Compensation", "Corporate Governance—Director Compensation", "Corporate Governance—Compensation Committee Interlocks and Insider Participation" and "Executive Compensation—Report of the Compensation Committee" of our Proxy Statement for our 2015 Annual Meeting of Shareholders to be filed with the Securities and Exchange Commission within 120 days after the close of the year ended December 31, 2014.
ITEM 12. SECURITY OWNERSHIP OF CERTAIN BENEFICIAL OWNERS AND MANAGEMENT AND RELATED STOCKHOLDER MATTERS
Incorporated by reference to the sections entitled "Stock Ownership Information" of our Proxy Statement for our 2015 Annual Meeting of Shareholders to be filed with the Securities and Exchange Commission within 120 days after the close of the year ended December 31, 2014.
Equity Compensation Plan Information
The following table sets forth as of December 31, 2014 (a) the number of securities to be issued upon exercise of outstanding options, warrants and rights, (b) the weighted average exercise price of outstanding options, warrants and rights and (c) the number of securities remaining available for future issuance under equity compensation plans (excluding securities reflected in column (a)).
| |
(a) | (b) | (c) | |||||||
|---|---|---|---|---|---|---|---|---|---|---|
Plan Category
|
Number of securities to be issued upon exercise of outstanding options, warrants and rights |
Weighted-average exercise price of outstanding options, warrants and rights |
Number of securities remaining available for future issuance under equity compensation plans (excluding securities reflected in column (a))(1) |
|||||||
Equity compensation plans: |
||||||||||
Approved by security holders(2) |
2,493,967 | $ | 11.05 | 1,065,693 | ||||||
Not approved by security holders(3) |
435,000 | $ | 10.55 | — | ||||||
| | | | | | | | | | | |
Total |
2,928,967 | $ | 10.98 | 1,065,693 | ||||||
| | | | | | | | | | | |
| | | | | | | | | | | |
| | | | | | | | | | | |
- (1)
- Includes
shares available for issuance under the Current Plan, as awards in the form of nonvested shares or issued upon the exercise of
options (including ISOs).
- (2)
- Additional
information related to the equity compensation plans approved by security holders is contained in Note 12 to the
Consolidated Financial Statements.
- (3)
- As part of certain acquisitions and as an inducement in hiring of certain new key executives, stock options are issued outside of the Current Plan from time to time. These options are granted at an option exercise price equal to fair market
44
value of the common stock on the date of grant, are non-qualified options, are exercisable for up to 10 years from the date of grant, and generally vest 25% on the second anniversary of the grant date and continue to vest 25% per year on each anniversary of the grant date until fully vested.
ITEM 13. CERTAIN RELATIONSHIPS AND RELATED TRANSACTIONS AND DIRECTOR INDEPENDENCE
Incorporated by reference to the sections entitled "Related Person Transactions" and "Corporate Governance—Director Independence" of our Proxy Statement for our 2015 Annual Meeting of Shareholders to be filed with the Securities and Exchange Commission within 120 days after the close of the year ended December 31, 2014.
ITEM 14. PRINCIPAL ACCOUNTING FEES AND SERVICES
Incorporated by reference to the sections entitled "Audit Committee—Principal Accountant Fees and Services" of our Proxy Statement for our 2015 Annual Meeting of Shareholders to be filed with the Securities and Exchange Commission within 120 days after the close of the year ended December 31, 2014.
45
ITEM 15. EXHIBITS, FINANCIAL STATEMENT SCHEDULES
- (a)
- The following documents are filed as a part of this report:
- (1)
- Financial Statements.
- (2)
- Financial Statement Schedules.
| Epiq Systems, Inc. and subsidiaries for each of the years in the three-year period ended December 31, 2014 | ||||
Schedule II—Valuation and Qualifying Accounts |
- (3)
- Exhibits. Exhibits are listed on the Exhibit Index at the end of this report.
46
Pursuant to the requirements of Section 13 or 15(d) of the Securities Exchange Act of 1934, the registrant has duly caused this report to be signed on its behalf by the undersigned, thereunto duly authorized.
Dated: March 2, 2015 |
EPIQ SYSTEMS, INC. | |||
|
By: |
/s/ TOM W. OLOFSON |
||
Pursuant to the requirements of the Securities Exchange Act of 1934, this report has been signed below by the following persons on behalf of the registrant and in the capacities and on the dates indicated.
Signature
|
Name and Title
|
Date
|
||
|---|---|---|---|---|
| /s/ TOM W. OLOFSON Tom W. Olofson |
Chairman of the Board, Chief Executive Officer and Director (Principal Executive Officer) | March 2, 2015 | ||
/s/ KARIN-JOYCE TJON SIEN FAT Karin-Joyce Tjon Sien Fat |
Executive Vice President, Chief Financial Officer (Principal Financial Officer and Principal Accounting Officer) |
March 2, 2015 |
||
/s/ JAMES A. BYRNES James A. Byrnes |
Director |
March 2, 2015 |
||
/s/ CHARLES C. CONNELY, IV Charles C. Connely, IV |
Director |
March 2, 2015 |
||
/s/ EDWARD M. CONNOLLY, JR. Edward M. Connolly, Jr. |
Director |
March 2, 2015 |
||
/s/ DOUGLAS M. GASTON Douglas M. Gaston |
Director |
March 2, 2015 |
||
/s/ JOEL PELOFSKY Joel Pelofsky |
Director |
March 2, 2015 |
||
/s/ KEVIN L. ROBERT Kevin L. Robert |
Director |
March 2, 2015 |
47
Signature
|
Name and Title
|
Date
|
||
|---|---|---|---|---|
| /s/ W. BRYAN SATTERLEE W. Bryan Satterlee |
Director | March 2, 2015 | ||
/s/ BRAD D. SCOTT Brad D. Scott |
Director |
March 2, 2015 |
48
REPORT OF INDEPENDENT REGISTERED PUBLIC ACCOUNTING FIRM
To
the Board of Directors and Shareholders of
Epiq Systems, Inc.
Kansas City, Kansas
We have audited the accompanying consolidated balance sheets of Epiq Systems, Inc. and subsidiaries (the "Company") as of December 31, 2014 and 2013, and the related consolidated statements of income (loss), comprehensive income (loss), changes in equity, and cash flows for each of the three years in the period ended December 31, 2014. Our audits also included the financial statement schedule listed in the Index at Item 15(a)(2). These financial statements and financial statement schedule are the responsibility of the Company's management. Our responsibility is to express an opinion on the financial statements and financial statement schedule based on our audits.
We conducted our audits in accordance with the standards of the Public Company Accounting Oversight Board (United States). Those standards require that we plan and perform the audit to obtain reasonable assurance about whether the financial statements are free of material misstatement. An audit includes examining, on a test basis, evidence supporting the amounts and disclosures in the financial statements. An audit also includes assessing the accounting principles used and significant estimates made by management, as well as evaluating the overall financial statement presentation. We believe that our audits provide a reasonable basis for our opinion.
In our opinion, such consolidated financial statements present fairly, in all material respects, the financial position of Epiq Systems, Inc. and subsidiaries as of December 31, 2014 and 2013, and the results of their operations and their cash flows for each of the three years in the period ended December 31, 2014, in conformity with accounting principles generally accepted in the United States of America. Also, in our opinion, such financial statement schedule, when considered in relation to the basic consolidated financial statements taken as a whole, presents fairly, in all material respects, the information set forth therein.
We have also audited, in accordance with the standards of the Public Company Accounting Oversight Board (United States), the Company's internal control over financial reporting as of December 31, 2014, based on the criteria established in Internal Control—Integrated Framework (2013) issued by the Committee of Sponsoring Organizations of the Treadway Commission and our report dated March 2, 2015 expressed an unqualified opinion on the Company's internal control over financial reporting.
/s/
DELOITTE & TOUCHE LLP
Kansas City, Missouri
March 2, 2015
F-1
EPIQ SYSTEMS, INC.
CONSOLIDATED BALANCE SHEETS
(In thousands, except share data)
| |
As of December 31, | ||||||
|---|---|---|---|---|---|---|---|
| |
2014 | 2013 | |||||
ASSETS |
|||||||
CURRENT ASSETS: |
|||||||
Cash and cash equivalents |
$ | 54,226 | $ | 40,336 | |||
Trade accounts receivable, less allowance for doubtful accounts of $3,986 and $4,379, respectively |
117,854 | 145,134 | |||||
Prepaid expenses |
12,934 | 10,617 | |||||
Income tax receivable |
9,437 | — | |||||
Deferred income taxes |
4,625 | 3,824 | |||||
Other current assets |
71 | 58 | |||||
| | | | | | | | |
Total Current Assets |
199,147 | 199,969 | |||||
| | | | | | | | |
LONG-TERM ASSETS: |
|||||||
Property and equipment, net |
70,579 | 72,118 | |||||
Internally developed software, net |
14,713 | 16,201 | |||||
Goodwill |
404,187 | 404,302 | |||||
Other intangibles, net |
29,605 | 41,117 | |||||
Other long-term assets |
20,021 | 14,074 | |||||
| | | | | | | | |
Total Long-term Assets |
539,105 | 547,812 | |||||
| | | | | | | | |
Total Assets |
$ | 738,252 | $ | 747,781 | |||
| | | | | | | | |
| | | | | | | | |
| | | | | | | | |
LIABILITIES AND EQUITY |
|||||||
CURRENT LIABILITIES: |
|||||||
Accounts payable |
$ | 18,548 | $ | 30,419 | |||
Current maturities of long-term obligations |
10,959 | 13,349 | |||||
Accrued compensation |
18,673 | 17,932 | |||||
Customer deposits |
2,534 | 2,717 | |||||
Deferred revenue |
2,276 | 4,020 | |||||
Dividends payable |
3,376 | 3,142 | |||||
Other accrued expenses |
7,988 | 6,985 | |||||
| | | | | | | | |
Total Current Liabilities |
64,354 | 78,564 | |||||
| | | | | | | | |
LONG-TERM LIABILITIES: |
|||||||
Deferred income taxes |
34,650 | 35,558 | |||||
Other long-term liabilities |
11,789 | 8,537 | |||||
Long-term obligations (excluding current maturities) |
302,522 | 299,108 | |||||
| | | | | | | | |
Total Long-term Liabilities |
348,961 | 343,203 | |||||
| | | | | | | | |
COMMITMENTS AND CONTINGENCIES |
|||||||
EQUITY: |
|||||||
Preferred stock—$1 par value; 2,000,000 shares authorized; none issued and outstanding |
— | — | |||||
Participating preferred stock, series A—$1 par value; 100,000 shares authorized; none issued and outstanding |
— | — | |||||
Common stock—$0.01 par value; Authorized 100,000,000 shares; Issued and outstanding 2014—40,835,651 and 36,680,469 shares, respectively; Issued and outstanding 2013—40,298,852 and 34,991,629 shares, respectively |
408 | 403 | |||||
Additional paid-in capital |
294,054 | 291,414 | |||||
Accumulated other comprehensive loss |
(4,362 | ) | (541 | ) | |||
Retained earnings |
88,391 | 102,754 | |||||
Treasury stock, at cost—4,155,182 shares and 5,307,223 shares, respectively |
(53,554 | ) | (68,016 | ) | |||
| | | | | | | | |
Total Equity |
324,937 | 326,014 | |||||
| | | | | | | | |
Total Liabilities and Equity |
$ | 738,252 | $ | 747,781 | |||
| | | | | | | | |
| | | | | | | | |
| | | | | | | | |
See accompanying Notes to Consolidated Financial Statements.
F-2
EPIQ SYSTEMS, INC.
CONSOLIDATED STATEMENTS OF INCOME (LOSS)
(In thousands, except per share data)
| |
Year Ended December 31, | |||||||||
|---|---|---|---|---|---|---|---|---|---|---|
| |
2014 | 2013 | 2012 | |||||||
REVENUE: |
||||||||||
Operating revenue |
$ | 444,118 | $ | 438,690 | $ | 344,750 | ||||
Reimbursable expenses |
30,352 | 43,393 | 28,335 | |||||||
| | | | | | | | | | | |
Total Revenue |
474,470 | 482,083 | 373,085 | |||||||
| | | | | | | | | | | |
OPERATING EXPENSE: |
||||||||||
Direct cost of operating revenue (exclusive of depreciation and amortization shown separately below) |
216,317 | 210,458 | 145,629 | |||||||
Reimbursable expenses |
29,592 | 41,766 | 27,426 | |||||||
Selling, general and administrative expense |
167,041 | 149,045 | 117,023 | |||||||
Depreciation and software and leasehold amortization |
36,042 | 30,971 | 27,399 | |||||||
Amortization of identifiable intangible assets |
12,655 | 18,834 | 26,588 | |||||||
Fair value adjustment to contingent consideration |
1,142 | 2,580 | (17,188 | ) | ||||||
Intangible asset impairment expense |
— | — | 1,777 | |||||||
Other operating (income) expense |
880 | (791 | ) | (220 | ) | |||||
| | | | | | | | | | | |
Total Operating Expense |
463,669 | 452,863 | 328,434 | |||||||
| | | | | | | | | | | |
INCOME FROM OPERATIONS |
10,801 | 29,220 | 44,651 | |||||||
| | | | | | | | | | | |
INTEREST EXPENSE (INCOME): |
||||||||||
Interest expense |
16,674 | 12,130 | 9,263 | |||||||
Interest income |
(21 | ) | (15 | ) | (18 | ) | ||||
| | | | | | | | | | | |
Net Interest Expense |
16,653 | 12,115 | 9,245 | |||||||
| | | | | | | | | | | |
INCOME (LOSS) BEFORE INCOME TAXES |
(5,852 | ) | 17,105 | 35,406 | ||||||
PROVISION FOR (BENEFIT FROM) INCOME TAXES |
(4,515 |
) |
5,995 |
12,979 |
||||||
| | | | | | | | | | | |
NET INCOME (LOSS) |
$ | (1,337 | ) | $ | 11,110 | $ | 22,427 | |||
| | | | | | | | | | | |
| | | | | | | | | | | |
| | | | | | | | | | | |
NET INCOME (LOSS) PER SHARE INFORMATION: |
||||||||||
Basic |
$ | (0.04 | ) | $ | 0.31 | $ | 0.62 | |||
Diluted |
$ | (0.04 | ) | $ | 0.30 | $ | 0.61 | |||
WEIGHTED AVERAGE COMMON SHARES OUTSTANDING: |
||||||||||
Basic |
35,512 | 35,434 | 35,497 | |||||||
Diluted |
35,512 | 36,302 | 36,373 | |||||||
See accompanying Notes to Consolidated Financial Statements.
F-3
EPIQ SYSTEMS, INC.
CONSOLIDATED STATEMENTS OF COMPREHENSIVE INCOME (LOSS)
(In thousands)
| |
Year Ended December 31, | |||||||||
|---|---|---|---|---|---|---|---|---|---|---|
| |
2014 | 2013 | 2012 | |||||||
NET INCOME (LOSS) |
$ | (1,337 | ) | $ | 11,110 | $ | 22,427 | |||
Other comprehensive income: |
||||||||||
Foreign currency translation adjustment, net of $0 tax in all years |
(2,411 | ) | 891 | 555 | ||||||
Unrealized losses on derivatives, net of tax benefit of $1,067, $0 and $0, respectively |
(1,410 | ) | — | — | ||||||
| | | | | | | | | | | |
COMPREHENSIVE INCOME (LOSS) |
$ | (5,158 | ) | $ | 12,001 | $ | 22,982 | |||
| | | | | | | | | | | |
| | | | | | | | | | | |
| | | | | | | | | | | |
See accompanying Notes to Consolidated Financial Statements.
F-4
EPIQ SYSTEMS, INC.
CONSOLIDATED STATEMENTS OF CHANGES IN EQUITY
(In thousands)
| |
|
Common Stock |
Treasury Stock |
|
Common Stock |
Additional Paid-In Capital |
AOCI(1) |
Retained Earnings |
Treasury Stock |
Total |
|||||||||||||||||||
|---|---|---|---|---|---|---|---|---|---|---|---|---|---|---|---|---|---|---|---|---|---|---|---|---|---|---|---|---|---|
Balance at January 1, 2012 |
39,494 | (3,740 | ) | $ | 395 | $ | 286,869 | $ | (1,987 | ) | $ | 95,849 | $ | (48,207 | ) | $ | 332,919 | ||||||||||||
Net income |
— | — | — | — | — | 22,427 | — | 22,427 | |||||||||||||||||||||
Foreign currency translation adjustment |
— | — | — | — | 555 | — | — | 555 | |||||||||||||||||||||
Tax deficiency from share-based compensation |
— | — | — | (315 | ) | — | — | — | (315 | ) | |||||||||||||||||||
Restricted common stock issued under share-based compensation plans |
430 | — | 4 | — | — | — | — | 4 | |||||||||||||||||||||
Stock option exercises |
— | 240 | — | (2,208 | ) | — | — | 3,088 | 880 | ||||||||||||||||||||
Common stock repurchased under share-based compensation plans |
— | (217 | ) | — | — | — | — | (2,689 | ) | (2,689 | ) | ||||||||||||||||||
Share repurchases (Note 7) |
— | (284 | ) | — | — | — | — | (3,299 | ) | (3,299 | ) | ||||||||||||||||||
Dividends declared ($0.385 per share) (Note 7) |
— | — | — | — | — | (13,831 | ) | — | (13,831 | ) | |||||||||||||||||||
Share-based compensation expense |
— | — | — | 6,719 | — | — | — | 6,719 | |||||||||||||||||||||
Balance at December 31, 2012 |
39,924 | (4,001 | ) | $ | 399 | $ | 291,065 | $ | (1,432 | ) | $ | 104,445 | $ | (51,107 | ) | $ | 343,370 | ||||||||||||
Net income |
— | — | — | — | — | 11,110 | — | 11,110 | |||||||||||||||||||||
Foreign currency translation adjustment |
— | — | — | — | 891 | — | — | 891 | |||||||||||||||||||||
Tax benefit from share-based compensation |
— | — | — | 2,828 | — | — | — | 2,828 | |||||||||||||||||||||
Restricted common stock issued under share-based compensation plans |
375 | 153 | 4 | (2,020 | ) | — | — | 2,020 | 4 | ||||||||||||||||||||
Stock option exercises |
— | 780 | — | (7,466 | ) | — | — | 10,467 | 3,001 | ||||||||||||||||||||
Common stock repurchased under share-based compensation plans |
— | (471 | ) | — | — | — | — | (6,515 | ) | (6,515 | ) | ||||||||||||||||||
Share repurchases (Note 7) |
— | (1,768 | ) | — | — | — | — | (22,881 | ) | (22,881 | ) | ||||||||||||||||||
Dividends declared ($0.36 per share) (Note 7) |
— | — | — | — | — | (12,801 | ) | — | (12,801 | ) | |||||||||||||||||||
Share-based compensation expense (Note 12) |
— | — | — | 7,007 | — | — | — | 7,007 | |||||||||||||||||||||
Balance at December 31, 2013 |
40,299 | (5,307 | ) | $ | 403 | $ | 291,414 | $ | (541 | ) | $ | 102,754 | $ | (68,016 | ) | $ | 326,014 | ||||||||||||
Net loss |
— | — | — | — | — | (1,337 | ) | — | (1,337 | ) | |||||||||||||||||||
Foreign currency translation adjustment |
— | — | — | — | (2,411 | ) | — | — | (2,411 | ) | |||||||||||||||||||
Unrealized losses on cash flow hedges |
— | — | — | — | (1,410 | ) | — | — | (1,410 | ) | |||||||||||||||||||
Tax deficiency from share-based compensation |
— | — | — | (966 | ) | — | — | — | (966 | ) | |||||||||||||||||||
Restricted common stock issued under share-based compensation plans |
537 | 347 | 5 | (1,478 | ) | — | — | 4,479 | 3,006 | ||||||||||||||||||||
Stock option exercises |
— | 1,081 | — | (1,467 | ) | — | — | 13,965 | 12,498 | ||||||||||||||||||||
Common stock repurchased under share-based compensation plans |
— | (276 | ) | — | — | — | — | (3,982 | ) | (3,982 | ) | ||||||||||||||||||
Dividends declared ($0.36 per share) (Note 7) |
— | — | — | — | — | (13,026 | ) | — | (13,026 | ) | |||||||||||||||||||
Share-based compensation expense (Note 12) |
— | — | — | 6,551 | — | — | — | 6,551 | |||||||||||||||||||||
Balance at December 31, 2014 |
40,836 | (4,155 | ) | $ | 408 | $ | 294,054 | $ | (4,362 | ) | $ | 88,391 | $ | (53,554 | ) | $ | 324,937 | ||||||||||||
- (1)
- AOCI—Accumulated Other Comprehensive Income (Loss)
See accompanying Notes to Consolidated Financial Statements.
F-5
EPIQ SYSTEMS, INC.
CONSOLIDATED STATEMENTS OF CASH FLOWS
(In thousands)
| |
Year Ended December 31, | |||||||||
|---|---|---|---|---|---|---|---|---|---|---|
| |
2014 | 2013 | 2012 | |||||||
CASH FLOWS FROM OPERATING ACTIVITIES: |
||||||||||
Net income (loss) |
$ | (1,337 | ) | $ | 11,110 | $ | 22,427 | |||
Adjustments to reconcile net income to net cash provided by operating activities: |
||||||||||
Depreciation and software and leasehold amortization |
36,042 | 30,971 | 27,399 | |||||||
Amortization of intangible assets |
12,655 | 18,834 | 26,588 | |||||||
Share-based compensation expense |
13,098 | 10,008 | 6,719 | |||||||
Fair value adjustment to contingent consideration |
1,142 | 2,580 | (17,188 | ) | ||||||
Loan fee amortization and write-off |
2,153 | 1,903 | 716 | |||||||
Provision for doubtful accounts |
3,552 | 2,411 | 2,223 | |||||||
Deferred income taxes |
(538 | ) | (6,517 | ) | 1,473 | |||||
Excess tax benefit related to share-based compensation |
(1,142 | ) | (1,328 | ) | — | |||||
Intangible asset impairment expense |
— | — | 1,777 | |||||||
Accretion of discount |
— | — | 1,162 | |||||||
Other, net |
364 | (803 | ) | (105 | ) | |||||
Changes in operating assets and liabilities: |
||||||||||
Trade accounts receivable |
22,513 | (43,392 | ) | (17,123 | ) | |||||
Prepaid expenses and other assets |
(1,180 | ) | (2,281 | ) | 2,833 | |||||
Accounts payable and other liabilities |
(3,882 | ) | 16,063 | (693 | ) | |||||
Customer deposits |
(182 | ) | (13,377 | ) | 14,122 | |||||
Deferred revenue |
(1,748 | ) | 877 | (85 | ) | |||||
Income taxes |
(11,700 | ) | 5,858 | 2,240 | ||||||
Other |
(88 | ) | (319 | ) | (750 | ) | ||||
| | | | | | | | | | | |
Net cash provided by operating activities |
69,722 | 32,598 | 73,735 | |||||||
| | | | | | | | | | | |
CASH FLOWS FROM INVESTING ACTIVITIES: |
||||||||||
Purchase of property and equipment |
(28,885 | ) | (34,646 | ) | (16,025 | ) | ||||
Internally developed software costs |
(7,154 | ) | (6,061 | ) | (6,467 | ) | ||||
Cash paid for business acquisitions, net of cash acquired |
(302 | ) | — | — | ||||||
Cash proceeds from sale of assets |
924 | 5 | 499 | |||||||
Other investing activities, net |
— | — | 186 | |||||||
| | | | | | | | | | | |
Net cash used in investing activities |
(35,417 | ) | (40,702 | ) | (21,807 | ) | ||||
| | | | | | | | | | | |
CASH FLOWS FROM FINANCING ACTIVITIES: |
||||||||||
Proceeds from issuance of long-term debt |
— | 300,000 | — | |||||||
Proceeds from revolver borrowings |
— | 88,000 | 65,000 | |||||||
Payments to reduce revolver borrowings |
— | (287,000 | ) | (83,000 | ) | |||||
Debt issuance costs |
(837 | ) | (8,141 | ) | — | |||||
Payments under long-term obligations |
(10,821 | ) | (7,903 | ) | (7,163 | ) | ||||
Payment of acquisition-related liabilities |
(4,962 | ) | (3,139 | ) | (8,400 | ) | ||||
Excess tax benefit related to share-based compensation |
1,142 | 1,328 | — | |||||||
Common stock repurchases (Note 7) |
(3,982 | ) | (29,396 | ) | (5,988 | ) | ||||
Cash dividends paid (Note 7) |
(12,793 | ) | (12,891 | ) | (12,386 | ) | ||||
Proceeds from exercise of stock options |
12,503 | 3,005 | 884 | |||||||
| | | | | | | | | | | |
Net cash provided by (used in) financing activities |
(19,750 | ) | 43,863 | (51,053 | ) | |||||
| | | | | | | | | | | |
Effect of exchange rate changes on cash |
(665 | ) | 769 | 95 | ||||||
NET INCREASE IN CASH AND CASH EQUIVALENTS |
13,890 |
36,528 |
970 |
|||||||
CASH AND CASH EQUIVALENTS, BEGINNING OF YEAR |
40,336 | 3,808 | 2,838 | |||||||
| | | | | | | | | | | |
CASH AND CASH EQUIVALENTS, END OF YEAR |
$ | 54,226 | $ | 40,336 | $ | 3,808 | ||||
| | | | | | | | | | | |
| | | | | | | | | | | |
| | | | | | | | | | | |
Cash paid for: |
||||||||||
Interest |
$ | 14,056 | $ | 10,381 | $ | 7,630 | ||||
Income taxes paid, net |
8,324 | 7,488 | 8,843 | |||||||
Non-cash investing and financing transactions: |
||||||||||
Property, equipment, and leasehold improvements accrued in accounts payable and other long-term liabilities |
2,413 | 10,261 | 3,076 | |||||||
Capitalized lease obligations |
446 | 7,902 | 176 | |||||||
Dividends declared but not yet paid (Note 7) |
3,376 | 3,142 | 3,231 | |||||||
Notes payable (Note 5) |
12,895 | — | — | |||||||
Contingent consideration incurred in business acquisition (Note 13) |
976 | — | — | |||||||
See accompanying Notes to Consolidated Financial Statements.
F-6
EPIQ SYSTEMS, INC.
NOTES TO CONSOLIDATED FINANCIAL STATEMENTS
DECEMBER 31, 2014, 2013 AND 2012
NOTE 1: NATURE OF OPERATIONS AND SUMMARY OF SIGNIFICANT ACCOUNTING POLICIES
Principles of Consolidation
The Consolidated Financial Statements include the accounts of Epiq Systems, Inc. ("Epiq," "the Company," "we," "us," or "our") and its wholly-owned subsidiaries. Intercompany transactions and balances have been eliminated in consolidation. Certain prior year amounts have been reclassified to conform to the current year presentation.
Description of Business
We provide integrated technology solutions for the legal profession. Our solutions are designed to streamline the administration of bankruptcy, litigation, investigations, financial transactions and regulatory compliance matters. We offer innovative managed technology solutions for eDiscovery, document review, legal notification, claims administration and controlled disbursement of funds. Our clients include leading law firms, corporate legal departments, bankruptcy trustees, government agencies, mortgage processors, and financial institutions.
Use of Estimates
The preparation of the consolidated financial statements in conformity with accounting principles generally accepted in the United States of America requires management to make estimates and assumptions that affect the reported amounts of assets and liabilities and disclosure of contingent assets and liabilities at the date of the financial statements, and the reported amounts of revenues and expenses during the reporting period. Significant items subject to such estimates include the carrying amount of intangibles, goodwill, and valuation allowances for receivables, contingencies and deferred income tax assets. Actual results can, and often do, differ from those assumed in our estimates.
Cash and Cash Equivalents
Cash and cash equivalents include cash on hand and in banks and all liquid investments with original maturities of three months or less at the time of purchase.
Accounts Receivable
Accounts receivable are recorded at the invoiced amount and are non-interest bearing. We maintain an allowance for doubtful accounts to reserve for potentially uncollectible receivables. We review accounts receivable to identify amounts due from customers which are past due to identify specific customers with known disputes or collectability issues. In determining the amount of the reserve, we make judgments about the creditworthiness of significant customers based on ongoing credit evaluations.
Property and Equipment, Software and Leasehold Improvements
Property and equipment, including leasehold improvements and purchased software, are stated at cost and depreciated or amortized on a straight-line basis over the estimated useful life of each asset or, for leasehold improvements, the lesser of the lease term or useful life. Property and equipment are reviewed for impairment whenever events or changes in circumstances indicate that the carrying
F-7
EPIQ SYSTEMS, INC.
NOTES TO CONSOLIDATED FINANCIAL STATEMENTS (Continued)
DECEMBER 31, 2014, 2013 AND 2012
NOTE 1: NATURE OF OPERATIONS AND SUMMARY OF SIGNIFICANT ACCOUNTING POLICIES (Continued)
amounts of assets may not be recoverable. We first evaluate recoverability of assets to be held and used by comparing the carrying amount of the asset to undiscounted expected future cash flows to be generated by the assets. If such assets are considered to be impaired, the impairment loss recognized is the amount by which the carrying amount exceeds the fair value.
Depreciation and software and leasehold amortization for the years ended December 31, 2014, 2013 and 2012, was $36.0 million, $31.0 million and $27.4 million, respectively. The caption "Depreciation and software and leasehold amortization" in the accompanying Consolidated Statements of Income (Loss) includes costs that are directly related to services of approximately $23.1 million, $16.0 million and $12.8 million for the years ended December 31, 2014, 2013 and 2012, respectively.
Internally Developed Software
Certain internal software development costs incurred in the creation of computer software products for sale, lease or otherwise to be marketed are capitalized once technological feasibility has been established. Capitalized costs are amortized; beginning in the period the product is available for general release, based on the ratio of current revenue to current and estimated future revenue for each product with minimum annual amortization equal to the straight-line amortization over the remaining estimated economic life of the product. Certain internal software development costs incurred in the creation of computer software products for internal use are capitalized when the preliminary project phase is complete and when management, with the relevant authority, authorizes and commits funding to the project and it is probable the project will be completed and the software will be used to perform the function intended. Capitalized costs are amortized, beginning in the period each module or component of the product is ready for its intended use, on a straight-line basis over the estimated economic life of the product. Internally developed software is tested annually for impairment, or more often if an event occurs or circumstances change that would more likely than not reduce the net realizable value to less than its unamortized capitalized cost.
Purchase Price Allocation
We have acquired a number of businesses in past years, and we may acquire additional businesses in the future. Accounting for the acquisition of a business requires us to determine the fair value of all assets acquired, including identifiable intangible assets, liabilities assumed, and contingent consideration obligations. The cost of the acquisition is allocated to these assets and liabilities in amounts equal to the estimated fair value of each asset and liability, and any remaining acquisition cost is classified as goodwill. This allocation process requires the use of estimates and assumptions, including quoted market prices and estimates of future cash flows to be generated by the acquired assets. Acquisition-related costs for potential and completed acquisitions are expensed, as incurred, and are included in "Other operating expense" in our Consolidated Statements of Income (Loss). Accordingly, the acquisition cost allocation has had, and will continue to have, a significant impact on our current operating results.
Determining the fair value of contingent consideration requires an assessment of the projected revenue over the measurement period and applying an appropriate discount rate based upon the weighted average cost of capital. This fair value assessment is also required in periods subsequent to a
F-8
EPIQ SYSTEMS, INC.
NOTES TO CONSOLIDATED FINANCIAL STATEMENTS (Continued)
DECEMBER 31, 2014, 2013 AND 2012
NOTE 1: NATURE OF OPERATIONS AND SUMMARY OF SIGNIFICANT ACCOUNTING POLICIES (Continued)
business combination. Such estimates are inherently difficult and subjective and variances from such estimates could have a material impact on our Consolidated Financial Statements.
Although we believe the assumptions and estimates we have made are reasonable, because they are based on estimates and judgment, they are inherently uncertain. Examples of critical estimates included in business combination accounting may include but are not limited to: future expected cash flows from projected revenues; the acquired company's trade name and trademarks as well as assumptions about the period of time the acquired trade name and trademarks will continue to be used in the combined company's product portfolio; customer attrition rates, new client acquisition rates, effectiveness of sales and marketing programs, pricing for products and services, long-term growth rates and discount rates.
Goodwill
Goodwill consists of the excess of cost of acquired enterprises over the sum of the amounts assigned to identifiable assets acquired less liabilities assumed. We assess goodwill for impairment on at least an annual basis at a reporting unit level and have identified our operating segments (Technology and Bankruptcy and Settlement Administration) as our reporting units for purposes of testing for goodwill impairment.
The goodwill impairment test consists of a two-step process, if necessary. The first step is to compare the fair value of a reporting unit to its carrying value, including goodwill. We considered both a market approach and an income approach in order to develop an estimate of the fair value of each reporting unit for purposes of our annual impairment test. When available, and as appropriate, we use market multiples derived from a set of competitors or companies with comparable market characteristics to establish fair values for a particular reporting unit (market approach). We also estimate fair value using discounted projected cash flow analysis (income approach). Potential impairment is indicated when the carrying value of a reporting unit, including goodwill, exceeds its estimated fair value. This analysis requires significant judgments, including estimation of future cash flows, which is dependent on internal forecasts, estimation of the long-term rate of growth for our business, estimation of the useful life over which cash flows will occur, and determination of our weighted average cost of capital. Changes in these estimates and assumptions could materially affect the determination of fair value and goodwill impairment for each reporting unit. In addition, financial and credit market volatility directly impacts our fair value measurement through our weighted average cost of capital, used to determine our discount rate, and through our stock price, used to determine our market capitalization.
The second step compares the implied fair value of the reporting unit's goodwill with the carrying amount of that goodwill. If the carrying amount of the reporting unit's goodwill exceeds its implied fair value, an impairment charge is recognized in an amount equal to that excess. The loss recognized cannot exceed the carrying amount of goodwill. As of July 31, 2014, which is the date of our most recent impairment test, the fair value of each of our reporting units was in excess of the carrying value of the reporting unit.
F-9
EPIQ SYSTEMS, INC.
NOTES TO CONSOLIDATED FINANCIAL STATEMENTS (Continued)
DECEMBER 31, 2014, 2013 AND 2012
NOTE 1: NATURE OF OPERATIONS AND SUMMARY OF SIGNIFICANT ACCOUNTING POLICIES (Continued)
Goodwill is assessed between annual tests if an event occurs or circumstances change that would more likely than not reduce the fair value of a reporting unit below its carrying value. These events or circumstances could include a significant change in the business climate, a change in strategic direction, legal factors, operating performance indicators, a change in the competitive environment, the sale or disposition of a significant portion of a reporting unit, or future economic factors such as unfavorable changes in our stock price and market capitalization or unfavorable changes in the estimated future discounted cash flows of our reporting units. Our annual test is performed as of July 31 each year. As of December 31, 2014, there have been no events since our last annual test to indicate that it is more likely than not that the recorded goodwill balance had become impaired. Our consolidated goodwill totaled $404.2 million as of December 31, 2014.
Intangible Assets
Identifiable intangible assets, resulting from various business acquisitions, consist of customer relationships, agreements not to compete, technology, and trade names. We amortize the identifiable intangible assets over their estimated economic benefit period, generally from five to ten years. These definite-lived intangible assets are reviewed for impairment whenever events or changes in circumstances have indicated that the carrying amount of these assets might not be recoverable. If we were to determine that events and circumstances warrant a change to the estimate of an identifiable intangible asset's remaining useful life, then the remaining carrying amount of the identifiable intangible asset would be amortized prospectively over that revised remaining useful life. Additionally, information resulting from other events and circumstances may indicate that the carrying value of one or more identifiable intangible assets is not recoverable which would result in recognition of an impairment charge. See Note 4 to the Consolidated Financial Statements for further detail.
Deferred Loan Fees
Incremental, third-party costs related to establishing credit facilities are capitalized and amortized based on the terms of the related debt. The unamortized costs are included as a component of other long-term assets on our Consolidated Balance Sheets. Amortization costs are included as a component of interest expense on our Consolidated Statements of Income (Loss).
Share-Based Compensation
We measure the cost of employee services received in exchange for an award of equity instruments based on the grant-date fair value of the award. The fair value of our stock option grants is estimated on the grant date using a Black-Scholes option-pricing model. We recognize compensation expense related to stock option grants on a straight-line basis over the period the grant is earned by the employee.
The fair value of our restricted stock awards is the quoted market value of Epiq's stock on the grant date. In the period it becomes probable that the minimum performance criteria specified in the restricted stock award agreement will be achieved, we recognize expense for the proportionate share of the total fair value of the award related to the vesting period that has already lapsed. The remaining cost of the award is expensed on a straight-line basis over the balance of the vesting period. In the
F-10
EPIQ SYSTEMS, INC.
NOTES TO CONSOLIDATED FINANCIAL STATEMENTS (Continued)
DECEMBER 31, 2014, 2013 AND 2012
NOTE 1: NATURE OF OPERATIONS AND SUMMARY OF SIGNIFICANT ACCOUNTING POLICIES (Continued)
event we determine it is no longer probable that we will achieve the minimum performance criteria specified in the restricted stock award agreement, we reverse all of the previously recognized compensation expense in the period such a determination is made.
Income Taxes
A deferred tax asset or liability is recognized for the anticipated future tax consequences of temporary differences between the tax basis of assets or liabilities and their reported amounts in the financial statements and for operating loss and tax credit carryforwards. A valuation allowance is provided when, in the opinion of management, it is more likely than not that some portion or all of a deferred tax asset will not be realized. Realization of the deferred tax assets is dependent on our ability to generate sufficient future taxable income and, if necessary, execution of our tax planning strategies. In the event we determine that sufficient future taxable income, taking into consideration tax planning strategies, may not generate sufficient taxable income to fully realize net deferred tax assets, we may be required to establish or increase valuation allowances by a charge to income tax expense in the period such a determination is made. This charge may have a material impact on recognized income tax expense on our Consolidated Statements of Income (Loss). Deferred tax assets and liabilities are measured using enacted tax rates expected to apply to taxable income in the years in which those temporary differences are expected to be recovered or settled. The effect on deferred tax assets and liabilities of a change in tax rates is recognized in income in the period that includes the enactment date. The recognition of a change in enacted tax rates may have a material impact on recognized income tax expense and on our Consolidated Statements of Income (Loss).
We follow accounting guidance which prescribes a comprehensive model for how companies should recognize, measure, present, and disclose in their financial statements uncertain tax positions taken or expected to be taken on a tax return. Under this guidance, tax positions are initially recognized in the financial statements when it is more likely than not the position will be sustained upon examination by the tax authorities. Such tax positions are initially and subsequently measured as the largest amount of tax benefit that is greater than 50% likely of being realized upon ultimate settlement with the tax authority assuming full knowledge of the position and all relevant facts. Application of this guidance requires numerous estimates based on available information. We consider many factors when evaluating and estimating our tax positions and tax benefits, and our recognized tax positions and tax benefits may not accurately anticipate actual outcomes. As we obtain additional information, we may need to periodically adjust our recognized tax positions and tax benefits. These periodic adjustments may have a material impact on our Consolidated Statements of Income. For additional information related to uncertain tax positions see Note 10 to the Consolidated Financial Statements.
Derivative Instruments
We may use derivative financial instruments as part of our risk management strategy to reduce our interest rate exposure. We do not enter into derivative financial instruments for speculative or trading purposes. The fair value of derivative instruments is recognized as assets and/or liabilities at the balance sheet date. Changes in the fair value of derivative instruments are recognized in operating results or included in accumulated other comprehensive income (loss), depending on whether the
F-11
EPIQ SYSTEMS, INC.
NOTES TO CONSOLIDATED FINANCIAL STATEMENTS (Continued)
DECEMBER 31, 2014, 2013 AND 2012
NOTE 1: NATURE OF OPERATIONS AND SUMMARY OF SIGNIFICANT ACCOUNTING POLICIES (Continued)
derivative instrument is accounted for as a derivative under Accounting Standards Codification ("ASC") 815 "Derivatives and Hedging" or we elect, and the relationship between the hedged item and hedging instrument qualifies for, hedge accounting treatment and whether it is considered a fair value or cash flow hedge. See Note 5 to the Consolidated Financial Statements for more information on our hedging activities.
Revenue Recognition
We have agreements with clients pursuant to which we deliver various services. Our significant sources of revenue are:
- •
- Fees contingent upon the month-to-month delivery of services defined by client contracts, such as claims processing, claims
reconciliation, professional services, call center support, disbursement services, project management, collection and forensic services, consulting services, document review services and conversion of
data into an organized, searchable electronic database. The amount we earn varies based primarily on the size and complexity of the engagement, the number of hours of professional services provided
and the number of documents or volume of data processed or reviewed.
- •
- Deposit-based fees earned for the provision of software licenses, limited hardware and hardware maintenance, and post-contract
customer support services to our trustee clients are based on a percentage of Chapter 7 assets placed on deposit with designated financial institutions by our trustee clients. Our trustee
clients do not directly pay fees in connection with these services. The fees earned based on assets placed on deposit by our trustee clients may vary based on fluctuations in short-term interest rates
and changes in service fees assessed on such deposits.
- •
- Legal noticing services to parties of interest in bankruptcy, class action and other administrative matters including direct
notification and media campaign and advertising management in which we coordinate notification, primarily through print media outlets to potential parties of interest for a particular client
engagement.
- •
- Data hosting fees and volume-based fees.
- •
- Monitoring and noticing fees earned based on monthly or on-demand requests for information provided through our AACER®
software product.
- •
- Reimbursed expenses, primarily related to postage on mailing services and other pass-through expenses.
Non-Software Arrangements
Certain of our services, such as data hosting, processing and professional services are billed based on unit prices and volumes for which we have identified each deliverable service element. Based on our evaluation of each element, we have determined that each element delivered has standalone value to our customers because we or other vendors sell such services separately from any other services and deliverables. For certain of these services we have obtained objective and reliable evidence of the fair value of each element based either on the price we charge when we sell an element on a standalone
F-12
EPIQ SYSTEMS, INC.
NOTES TO CONSOLIDATED FINANCIAL STATEMENTS (Continued)
DECEMBER 31, 2014, 2013 AND 2012
NOTE 1: NATURE OF OPERATIONS AND SUMMARY OF SIGNIFICANT ACCOUNTING POLICIES (Continued)
basis or on third-party evidence of fair value of such similar services. For elements where evidence cannot be established, the best estimate of sales price has been used. Our arrangements do not include general rights of return. Accordingly, each of the service elements in our multiple element case and document management arrangements qualifies as a separate unit of accounting. We allocate revenue to the various units of accounting in our arrangements based on the fair value or best estimated selling price of each unit of accounting, which is generally consistent with the stated prices in our arrangements. In instances when revenue recognition is deferred, we utilize the relative selling price method to calculate the revenue recognized for each period. As we have evidence of an arrangement, revenue for each separate unit of accounting is recognized each period. Revenue is recognized as the services are rendered, our fee becomes fixed and determinable, and collectability is reasonably assured. Payments received in advance of satisfaction of the related revenue recognition criteria are recognized as a customer deposit until all revenue recognition criteria have been satisfied.
Software Arrangements
For our Chapter 7 bankruptcy trustee arrangements, we provide our trustee clients with a software license, hardware lease, hardware maintenance, and post-contract customer support services at no charge to the trustee. The trustees place their liquidated estate deposits with a financial institution with which we have an arrangement. We earn contingent monthly fees from the financial institutions for the software license, hardware lease, hardware maintenance, and post-contract customer support services provided to our trustee clients based on the average dollar amount of deposits held by the trustees with that financial institution. The monthly deposit fees have two components consisting of an interest-based component and a non-interest based service fee. Since we have not established vendor specific objective evidence of the fair value of the software license, we do not recognize any revenue on delivery of the software. The software element is deferred and included with the remaining undelivered elements, which are post-contract customer support services. Revenue related to post-contract customer support is entirely contingent on the future placement of liquidated estate deposits by the trustee with the financial institution. Accordingly, we recognize this contingent usage based revenue as the fee becomes fixed or determinable at the time actual usage occurs and collectability is probable. This occurs monthly as a result of the computation, billing and collection of monthly deposit fees contractually agreed. At that time, we have also satisfied the other revenue recognition criteria since we have persuasive evidence that an arrangement exists, services have been rendered, the price is fixed and determinable, and collectability is reasonably assured.
We also provide our trustee clients with certain hardware, such as desktop computers, monitors, and printers as well as hardware maintenance. We retain ownership of all hardware provided and we account for this hardware as a lease. As the hardware maintenance arrangement is an executory contract similar to an operating lease, we use guidance related to contingent rentals in operating lease arrangements for hardware maintenance as well as for the hardware lease. Since the payments under all of our arrangements are contingent upon the level of trustee deposits and the delivery of upgrades and other services, and there remain important uncertainties regarding the amount of unreimbursable costs yet to be incurred by us, we account for the hardware lease as an operating lease. Therefore, all lease payments, based on the estimated fair value of hardware provided, are accounted for as contingent rentals, which require that we recognize rental income when the changes in the factor on
F-13
EPIQ SYSTEMS, INC.
NOTES TO CONSOLIDATED FINANCIAL STATEMENTS (Continued)
DECEMBER 31, 2014, 2013 AND 2012
NOTE 1: NATURE OF OPERATIONS AND SUMMARY OF SIGNIFICANT ACCOUNTING POLICIES (Continued)
which the contingent lease payment is based actually occur. This occurs at the end of each period as we achieve our target when deposits are held at the financial institution as, at that time, evidence of an arrangement exists, delivery has occurred, the amount has become fixed and determinable, and collection is reasonably assured. This revenue, which represents less than ten percent of our total revenue for the years ended December 31, 2014, 2013 and 2012, is included in the Consolidated Statements of Income (Loss) as a component of "Operating revenue."
Reimbursements
We have revenue related to reimbursable expenses, primarily postage. Reimbursable postage and other reimbursable expenses are recorded gross in the Consolidated Statements of Income (Loss) as "Reimbursable expenses" in the revenue and operating expenses sections.
Costs Related to Contract Acquisition, Origination, and Set-up
We expense customer contract acquisition, origination, and set-up costs as incurred.
Foreign Currency Translation
Local currencies are the functional currencies for our operating subsidiaries. Accordingly, assets and liabilities of these subsidiaries are translated at the rate of exchange at the balance sheet date. Adjustments from the translation process are part of accumulated other comprehensive loss and are included as a separate component of equity. The changes in foreign currency translation adjustments were not adjusted for income taxes since they relate to indefinite term investments in non-United States subsidiaries. Income and expense items of significant value are translated as of the date of the transactions for these subsidiaries; however, day to day operational transactions are translated at average rates of exchange. As of December 31, 2014, 2013, and 2012, cumulative translation adjustments included in accumulated other comprehensive loss were $3.0 million, $0.5 million and $1.4 million, respectively.
Contingencies
We may be involved in various legal proceedings from time to time in the ordinary course of business. Except for income tax contingencies, we record accruals for contingencies to the extent that we conclude their occurrence is probable and that the related liabilities are reasonably estimable. We record anticipated recoveries under existing insurance contracts when we are assured of recovery. Many factors are considered when making these assessments, including the progress of the case, opinions or views of legal counsel, prior case law, our experience or the experience of other companies with similar cases, and our intent on how to respond. Litigation and other contingencies are inherently unpredictable and excessive damage awards do occur. As such, these assessments can involve a series of complex judgments about future events and can rely heavily on estimates and assumptions.
F-14
EPIQ SYSTEMS, INC.
NOTES TO CONSOLIDATED FINANCIAL STATEMENTS (Continued)
DECEMBER 31, 2014, 2013 AND 2012
NOTE 1: NATURE OF OPERATIONS AND SUMMARY OF SIGNIFICANT ACCOUNTING POLICIES (Continued)
Recently Issued Accounting Pronouncements
In August 2014, the Financial Accounting Standards Board (the "FASB") issued new guidance on determining when and how reporting entities must disclose going-concern uncertainties in their financial statements which is intended to enhance the timeliness, clarity and consistency of disclosure concerning such uncertainties. The new guidance requires management to perform assessments, on an interim and annual basis, of an entity's ability to continue as a going concern within one year of the date of issuance of the entity's interim or annual financial statements, as applicable. In addition, entities must provide certain disclosures if there is substantial doubt about the entity's ability to continue as a going concern. The guidance is effective for us beginning January 1, 2017. We do not expect this new guidance to have a material effect on our consolidated financial position, results of operations or cash flows.
In June 2014, the FASB issued new guidance related to share-based payment awards with performance targets attainable after the requisite service period. The new guidance clarifies that companies should treat performance targets that can be met after the requisite service period of a share-based payment award as performance conditions that affect vesting. Therefore, no compensation expense should be recorded related to an award for which the transfer to the employee is contingent on the attainment of a performance target until it becomes probable that the performance target will be met. The new guidance does not require any new or additional disclosures. This guidance will be effective for us beginning January 1, 2016. We do not expect this new guidance to have a material effect on our consolidated financial position, results of operations or cash flows.
In May 2014, the FASB and the International Accounting Standards Board issued their final standard on revenue from contracts with customers. This standard outlines a single comprehensive model for companies to use in accounting for revenue arising from contracts with customers and supersedes most of the current revenue recognition guidance. The new guidance requires that an entity should recognize revenue to depict the transfer of promised goods or services to customers in an amount that reflects the consideration to which the entity expects to be entitled in exchange for those goods or services. To achieve this core principle, an entity should apply the following steps: (1) identify the contract with a customer, (2) identify the performance obligations under the contract, (3) determine the transaction price, (4) allocate the transaction price to the performance obligations under the contract and (5) recognize revenue when (or as) the entity satisfies a performance obligation. The new guidance also provides for additional disclosures with respect to revenues and cash flows arising from contracts with customers. This new revenue guidance will be effective for us beginning in the first quarter of fiscal 2017 and early adoption is not permitted. Entities have the option of using either a full retrospective or a modified approach (cumulative effect adjustment in period of adoption) to adopt the new guidance. We are currently assessing the impact of this new revenue guidance on our consolidated financial position, results of operations and cash flows.
F-15
EPIQ SYSTEMS, INC.
NOTES TO CONSOLIDATED FINANCIAL STATEMENTS (Continued)
DECEMBER 31, 2014, 2013 AND 2012
NOTE 2: PROPERTY AND EQUIPMENT
The classification of property and equipment and the related estimated useful lives is as follows:
| |
December 31, | |
||||||
|---|---|---|---|---|---|---|---|---|
| |
Estimated Useful Life |
|||||||
| |
2014 | 2013 | ||||||
| |
(in thousands) |
|
||||||
Land |
$ | 1,247 | $ | 1,247 | ||||
Building and building and leasehold improvements |
23,428 | 22,127 | 3 - 30 years | |||||
Furniture and fixtures |
8,796 | 7,712 | 5 years | |||||
Computer equipment and purchased software |
131,229 | 110,449 | 2 - 5 years | |||||
Transportation equipment |
5,027 | 7,522 | 3 - 5 years | |||||
Operations equipment |
6,267 | 6,122 | 3 - 5 years | |||||
Construction in progress |
4,402 | 18,295 | ||||||
| | | | | | | | | |
|
180,396 | 173,474 | ||||||
Accumulated depreciation and amortization |
(109,817 | ) | (101,356 | ) | ||||
| | | | | | | | | |
Property and equipment, net |
$ | 70,579 | $ | 72,118 | ||||
| | | | | | | | | |
| | | | | | | | | |
| | | | | | | | | |
Computer equipment and purchased software includes property acquired under capital leases. At December 31, 2014 and 2013, there was $4.4 million and $8.2 million, respectively, of assets under capital lease, inclusive of accumulated depreciation of $4.0 million and $5.7 million, respectively, included in the above table.
NOTE 3: INTERNALLY DEVELOPED SOFTWARE
The following is a summary of internally developed software:
| |
Year Ended December 31, |
||||||
|---|---|---|---|---|---|---|---|
| |
2014 | 2013 | |||||
| |
(in thousands) |
||||||
Amounts capitalized, beginning of year |
$ | 68,862 | $ | 62,962 | |||
Development costs capitalized |
7,154 | 6,061 | |||||
Dispositions |
(44 | ) | (161 | ) | |||
| | | | | | | | |
Amounts capitalized, end of year |
75,972 | 68,862 | |||||
Accumulated amortization, end of year |
(61,259 | ) | (52,661 | ) | |||
| | | | | | | | |
Internally developed software, net |
$ | 14,713 | $ | 16,201 | |||
| | | | | | | | |
| | | | | | | | |
| | | | | | | | |
Included in the above are capitalized software development costs for projects in progress of $1.0 million and $3.7 million at December 31, 2014 and 2013, respectively. During the years ended December 31, 2014, 2013 and 2012, we recognized amortization expense related to capitalized software development costs of $8.6 million, $8.8 million and $8.6 million, respectively.
F-16
EPIQ SYSTEMS, INC.
NOTES TO CONSOLIDATED FINANCIAL STATEMENTS (Continued)
DECEMBER 31, 2014, 2013 AND 2012
NOTE 4: GOODWILL AND INTANGIBLE ASSETS
The change in the carrying amount of goodwill for the years ended December 31, 2014 and 2013 was as follows:
| |
Technology | Bankruptcy and Settlement Administration |
Total | |||||||
|---|---|---|---|---|---|---|---|---|---|---|
| |
(in thousands) |
|||||||||
Balance as of January 1, 2013 |
$ | 189,248 | $ | 214,963 | $ | 404,211 | ||||
Foreign currency translation and other |
91 | — | 91 | |||||||
| | | | | | | | | | | |
Balance as of December 31, 2013 |
$ | 189,339 | $ | 214,963 | $ | 404,302 | ||||
Acquisition |
— | 153 | 153 | |||||||
Foreign currency translation and other |
(268 | ) | — | (268 | ) | |||||
| | | | | | | | | | | |
Balance as of December 31, 2014 |
$ | 189,071 | $ | 215,116 | $ | 404,187 | ||||
| | | | | | | | | | | |
| | | | | | | | | | | |
| | | | | | | | | | | |
Identifiable intangible assets as of December 31, 2014 and 2013 consisted of the following:
| |
December 31, 2014 | December 31, 2013 | |||||||||||
|---|---|---|---|---|---|---|---|---|---|---|---|---|---|
| |
Gross Carrying Amount |
Accumulated Amortization |
Gross Carrying Amount |
Accumulated Amortization |
|||||||||
| |
(in thousands) |
||||||||||||
Amortizing intangible assets: |
|||||||||||||
Customer relationships |
$ | 124,512 | $ | 100,840 | $ | 124,512 | $ | 90,274 | |||||
Trade names |
6,591 | 3,312 | 6,591 | 2,481 | |||||||||
Technology |
1,142 | 86 | — | — | |||||||||
Non-compete agreements |
18,947 | 17,349 | 18,947 | 16,178 | |||||||||
| | | | | | | | | | | | | | |
Total |
$ | 151,192 | $ | 121,587 | $ | 150,050 | $ | 108,933 | |||||
| | | | | | | | | | | | | | |
| | | | | | | | | | | | | | |
| | | | | | | | | | | | | | |
Customer relationships, trade names, technology and non-compete agreements carry a weighted average life of 6.9 years, 7.9 years, 10 years and 5 years, respectively.
Aggregate amortization expense related to amortizing intangible assets was $12.7 million, $18.8 million and $26.6 million for the years ended December 31, 2014, 2013, and 2012, respectively.
The following table outlines the estimated future amortization expense related to amortizing intangible assets held at December 31, 2014:
Year Ending December 31,
|
(in thousands) | |||
|---|---|---|---|---|
2015 |
$ | 10,007 | ||
2016 |
6,346 | |||
2017 |
5,504 | |||
2018 |
3,548 | |||
2019 |
2,870 | |||
2020 and thereafter |
1,330 | |||
| | | | | |
Total |
$ | 29,605 | ||
| | | | | |
| | | | | |
| | | | | |
F-17
EPIQ SYSTEMS, INC.
NOTES TO CONSOLIDATED FINANCIAL STATEMENTS (Continued)
DECEMBER 31, 2014, 2013 AND 2012
NOTE 5: LONG-TERM OBLIGATIONS
The following is a summary of long-term obligations outstanding:
| |
Final Maturity Date |
Weighted-Average Interest Rate(1) |
December 31, 2014 |
December 31, 2013 |
||||||||
|---|---|---|---|---|---|---|---|---|---|---|---|---|
| |
|
|
(in thousands) |
|||||||||
Senior secured term loan |
August 2020 | 4.25 | % | $ | 296,250 | $ | 299,250 | |||||
Senior revolving loan |
August 2018 | n/a | — | — | ||||||||
Capital leases |
January 2019 | 3.1 | % | 3,177 | 6,548 | |||||||
Notes payable |
September 2017 | 2.2 | % | 12,895 | 4,079 | |||||||
Acquisition-related liabilities |
May 2021 | n/a | 1,159 | 2,580 | ||||||||
| | | | | | | | | | | | | |
Total long-term obligations, including current portion |
313,481 | 312,457 | ||||||||||
| | | | | | | | | | | | | |
Current maturities of long-term obligations |
||||||||||||
Senior secured term loan |
(3,574 | ) | (3,000 | ) | ||||||||
Capital leases |
(2,749 | ) | (3,690 | ) | ||||||||
Notes payable |
(4,593 | ) | (4,079 | ) | ||||||||
Acquisition-related liabilities |
(43 | ) | (2,580 | ) | ||||||||
| | | | | | | | | | | | | |
Total current maturities of long-term obligations |
(10,959 | ) | (13,349 | ) | ||||||||
| | | | | | | | | | | | | |
Total Long-term obligations |
$ | 302,522 | $ | 299,108 | ||||||||
| | | | | | | | | | | | | |
| | | | | | | | | | | | | |
| | | | | | | | | | | | | |
- (1)
- Weighted average interest rate as of December 31, 2014.
Credit Agreement
On August 27, 2013, we entered into a $400 million senior secured credit facility consisting of a $100 million senior revolving loan commitment, maturing in August 2018, and a $300 million senior secured term loan, maturing in August 2020 (the "Credit Agreement").
During the term of the Credit Agreement, we have the right, subject to compliance with the covenants specified in the Credit Agreement, to increase the credit facility from $400 million up to a maximum of $600 million in one or more tranches. Such rights include increasing the term loan from $300 million up to $500 million and total capacity under the senior revolving loan commitment from its original $100 million up to a maximum of $200 million and the aggregate total increase not to exceed $200 million. The credit facility is secured by liens on our real property and a significant portion of our personal property.
On March 26, 2014, we entered into the First Amendment to the Credit Agreement ("First Amendment") which reduced the interest rate options for our senior secured term loan and reduced the LIBOR floor resulting in a total interest rate reduction of 50 basis points as described below.
Prior to the First Amendment, the senior secured term loan bore interest as follows: (1) 2.75% plus prime rate subject to a 2% floor; or (2) 3.75% plus one, two, three or six month LIBOR subject to a 1% LIBOR floor. Effective with the date of the First Amendment, the senior secured loan bears interest as follows: (1) 2.50% plus prime rate subject to a 1.75% floor; or (2) 3.50% plus one, two,
F-18
EPIQ SYSTEMS, INC.
NOTES TO CONSOLIDATED FINANCIAL STATEMENTS (Continued)
DECEMBER 31, 2014, 2013 AND 2012
NOTE 5: LONG-TERM OBLIGATIONS (Continued)
three or six month LIBOR subject to a 0.75% LIBOR floor. As of December 31, 2014, all outstanding borrowings under the senior secured term loan were based on the 0.75% LIBOR floor and the applicable margin was 3.50% for an aggregate floating rate of 4.25%.
Borrowings under the senior revolving loan bear interest at various rates based on our total net leverage ratio with two rate options as follows: (1) for base rate advances, borrowings bear interest at prime rate plus 200 to 300 basis points; and (2) for LIBOR advances, borrowings bear interest at LIBOR plus 300 to 400 basis points. As of December 31, 2014, there were no borrowings outstanding under the senior revolving loan and outstanding letters of credit were $1.0 million.
The term loan facility under our credit facility requires scheduled quarterly principal payments of $750,000, and a final installment equal to the remaining principal balance in August 2020. In addition, the Credit Agreement contains certain annual mandatory prepayment terms based on a percentage of excess cash flow, commencing with measurement for the fiscal year ending December 31, 2014. Excess cash flow, as defined in the Credit Agreement includes Consolidated EBITDA (as defined in the Credit Agreement) adjusted for capital expenditures, changes in working capital, interest paid, income taxes paid, principal payments, dividends and certain acquisition-related obligations. Such annual mandatory prepayments are only required when the net leverage ratio exceeds 2.75 to 1.00. As of December 31, 2014, mandatory prepayments outstanding under the credit facility were $0.6 million, which are included in Current maturities of long-term debt in the Consolidated Balance Sheet.
As of December 31, 2014, the Credit Agreement contained financial covenants related to a net leverage ratio (as defined in the Credit Agreement) which is not permitted to exceed 4.50 to 1.00 as well as other customary covenants related to limitations on (i) creating liens, debt, guarantees or other contingent obligations, (ii) engaging in mergers, acquisitions and consolidations, (iii) paying dividends or other distributions to, and redeeming and repurchasing securities from, equity holders, (iv) prepaying, redeeming or repurchasing subordinated or junior debt, and (v) engaging in certain transactions with affiliates, in each case, subject to customary exceptions. Under our Credit Agreement, our ability to declare and pay dividends and repurchase securities from equity holders is limited by a requirement that such payments are not to exceed, in the aggregate, 50% of net income, as adjusted, on a cumulative basis for all quarterly periods from the closing date and ending prior to the date of payment or repurchase. Adjustments to Consolidated Net Income, as defined in the Credit Agreement include, among other items, the exclusion of extraordinary items, specified severance costs, cumulative effect of a change in accounting principle, intangible asset amortization and impairment charges, non-cash compensation expense, cumulative effect of foreign currency translations, and gains or losses from discontinued operations. Further, we are unable to declare and pay dividends and repurchase securities from equity holders if our net leverage ratio (as defined in the Credit Agreement) would exceed 4.25 to 1.0. Financing costs of $9.7 million have been deferred and are being amortized over the terms of the Credit Agreement.
On January 26, 2015, we entered into the Second Amendment to the Credit Agreement (the "Second Amendment"), which increased the interest rate options for the senior secured term loan. Effective with the date of the Second Amendment, the senior secured term loan bears interest as follows (1) 2.75% plus prime rate subject to a 1.75% floor; or (2) 3.75% plus one, two, three or six month LIBOR subject to a 0.75% LIBOR floor. The Second Amendment also amended the definition of "Applicable Margin" increasing by 0.25% the margin determined by reference to our consolidated
F-19
EPIQ SYSTEMS, INC.
NOTES TO CONSOLIDATED FINANCIAL STATEMENTS (Continued)
DECEMBER 31, 2014, 2013 AND 2012
NOTE 5: LONG-TERM OBLIGATIONS (Continued)
net leverage ratio (as defined in the Credit Agreement) for purposes of calculating the interest rate for base rate loans, Eurodollar loans and the fee applicable to letters of credit as specified therein. In addition, the Second Amendment amended the definitions of "Consolidated EBITDA", "Consolidated Net Income" and "Excess Cash Flow" to permit us to add back the following charges: (1) severance and reorganization costs and expenses incurred during any trailing twelve month period that includes a fiscal quarter ending on or after January 1, 2014 and on or prior to December 31, 2014; and (2) certain fees, costs and expenses incurred by us in connection with our previously announced review of certain strategic and financial alternatives, including potential proxy contests. Financing costs related to the Second Amendment were $0.6 million have been deferred and are being amortized over the terms of the Credit Agreement.
As of December 31, 2014, we were in compliance with all financial covenants as amended on January 26, 2015.
Derivative Instruments
Interest rate cap
In November 2013 we entered into a two-year 3% interest rate cap agreement for a notional amount of $150.0 million equal to the portion of the senior secured term loan being hedged. The interest rate cap agreement settles monthly and expires on August 31, 2015. It bears a strike rate of 3% with an underlying rate equal to one month USD LIBOR, which is consistent with the variable rate on our senior secured term loan. As the strike rate of 3% was greater than the underlying rate, the caplets for the years ended December 31, 2014 and 2013 expired with a $0 value. As of December 31, 2014, the hedge was determined to be highly effective and is expected to continue to be highly effective in mitigating the risk of increases in the Company's expected interest expense payments related to its senior secured term loan consistent with LIBOR rising above 3%.
All changes in the estimated fair value of the interest rate cap were included in accumulated other comprehensive income and represented a de minimis amount as of December 31, 2014 and 2013. The hedge was determined to be perfectly effective during the period from inception of the cash flow hedge through December 31, 2014 with no ineffectiveness recognized in earnings. The fair value of the interest rate cap as of December 31, 2014 was less than $1,000 and as of December 31, 2013 was $27,000 and was included in "Other noncurrent assets" on the Consolidated Balance Sheets.
Interest rate swap
In April 2014 we entered into a forward interest rate swap effective from August 31, 2015 through August 27, 2020, with a notional amount of approximately $73.7 million equal to the portion of the outstanding amortized principal amount of the senior secured term loan being hedged as of the effective date of the forward interest rate swap. Under the swap we will pay a fixed amount of interest of 2.81% on the notional amount and the swap counterparty will pay a floating amount of interest based on LIBOR with a one-month designated maturity subject to a floor of 0.75% which is consistent with the Company's obligation under the term loan. The interest rate swap contains a floor of 0.75% to ensure that the one-month LIBOR received on each settlement of the interest rate swap cannot go below 0.75%.
F-20
EPIQ SYSTEMS, INC.
NOTES TO CONSOLIDATED FINANCIAL STATEMENTS (Continued)
DECEMBER 31, 2014, 2013 AND 2012
NOTE 5: LONG-TERM OBLIGATIONS (Continued)
The objective of entering into this interest rate swap is to eliminate the variability of the cash flows in interest payments related to the portion of the debt being hedged. The interest rate swap qualifies as a cash flow hedge and, as such, is being accounted for at estimated fair value with changes in estimated fair value being deferred in accumulated other comprehensive income until such time as the hedged transaction is recognized in earnings. This cash flow hedge is expected to be highly effective and any ineffectiveness will be immediately recognized in earnings.
The fair value of the interest rate swap liability increased by $2.5 million for the period from the inception date in 2014 to December 31, 2014. Changes in the fair value of the interest rate swap are included in accumulated other comprehensive income. As the derivative will not begin settling until August 2015, there were no cash settlements during the period from inception of the swap to December 31, 2014. The hedge was determined to be highly effective during the period from inception of the cash flow hedge through December 31, 2014 with any ineffectiveness considered as de minimis. The fair value of the interest rate swap as of December 31, 2014 was a liability of $2.5 million and was included in "Other long-term liabilities" on the Consolidated Balance Sheets.
We manage exposure to counter-party credit risk related to our derivative positions by entering into contracts with various major financial institutions that can be expected to fully perform under the terms of such instruments.
Capital Leases
We lease certain equipment under capital leases that generally require monthly payments with final maturity dates during various periods through 2019. As of December 31, 2014, our capital leases had a weighted-average interest rate of approximately 3.1%. See Note 2 to the Consolidated Financial Statements for further discussion of assets acquired under capital leases.
Notes Payable
In November 2014 we entered into a note payable related to a software license and maintenance agreement that bears interest of approximately 3.85% and is payable quarterly through the third quarter of 2017, which comprises our outstanding balance at December 31, 2014. The note payable balance outstanding as of December 31, 2013 was repaid during 2014.
Acquisition-related Liabilities
Amounts recorded in connection with acquisition-related liabilities as of December 31, 2014 and 2013 are as follows:
| |
December 31, 2014 |
December 31, 2013 |
|||||
|---|---|---|---|---|---|---|---|
| |
(in thousands) |
||||||
Minus 10 deferred acquisition price |
$ | 43 | $ | — | |||
Minus 10 contingent consideration |
1,116 | — | |||||
De Novo contingent consideration |
— | 2,580 | |||||
| | | | | | | | |
Total acquisition-related liabilities |
$ | 1,159 | $ | 2,580 | |||
| | | | | | | | |
| | | | | | | | |
| | | | | | | | |
F-21
EPIQ SYSTEMS, INC.
NOTES TO CONSOLIDATED FINANCIAL STATEMENTS (Continued)
DECEMBER 31, 2014, 2013 AND 2012
NOTE 5: LONG-TERM OBLIGATIONS (Continued)
Jupiter eSources LLC
In October 2010, we acquired Jupiter eSources LLC ("Jupiter eSources"). In connection with the acquisition, contingent consideration was potentially payable to the Jupiter eSources sellers based on revenue thresholds as defined in the purchase agreement from October 1, 2010 through December 31, 2014. The undiscounted amount of all potential future payments that could be required under the Jupiter eSources contingent consideration was between $0 and $10.0 million over the measurement period ending December 31, 2014. The revenue thresholds were not met and as of December 31, 2014, no additional purchase price consideration is owed to the sellers under this agreement.
De Novo Legal LLC
In December 2011, we acquired De Novo Legal LLC and its affiliated companies ("De Novo Legal"). In connection with the acquisition, contingent consideration was payable to the De Novo Legal sellers based on revenue-related thresholds related to our Technology segment for period beginning on January 1, 2013 through December 31, 2013. Therefore, in the first quarter of 2014, we provided an earn-out statement and paid the sellers $3.5 million as a result of our calculation of the performance measure for the earn-out period. The sellers disputed our calculation of the earn-out amount and alleged that the performance measure was higher, thereby triggering the next tier of contingent consideration. The Company and the sellers participated in the agreed dispute resolution process as specified under the acquisition agreement and in April 2014 agreed to settle this matter for a cash payment to the sellers of $1.5 million which was paid to the sellers in April 2014. As a result, we recorded a total adjustment of $1.5 million to the contingent consideration obligation as of March 31, 2014, of which $1.1 million is included in "Fair value adjustment to contingent consideration" and $0.4 million is included in "Selling, general and administrative expense" in the Consolidated Statements of Income (Loss). There are no further payments remaining under the contingent consideration obligation with respect to De Novo Legal.
Minus–10 Software, LLC
In connection with the April 2014 acquisition of Minus–10 Software, LLC ("Minus 10") we withheld approximately $43,000 of the purchase price as security for potential indemnification claims payable approximately 14 months following the closing date of the acquisition. Also, in connection with the acquisition of Minus 10, we incurred an obligation to pay certain contingent consideration which may be payable to the sellers based on future levels of qualifying profit and other measures as defined in the purchase agreement. This contingent consideration for the sellers would be payable, if earned, over seven discrete measurement periods through December 31, 2020. The Minus 10 contingent consideration obligation has been measured and recognized at a fair value of approximately $1.1 million as of December 31, 2014 which is included in "Long-term obligations" on the Consolidated Balance Sheets. A discount rate of 25.0% was applied to the contingent consideration liability which is reflective of the inherent risk attributable to this new product line given its status as an early-stage venture. Subsequent fair value changes, measured quarterly, up to the ultimate amount paid, will be recognized in earnings. See Note 13 of our Notes to Consolidated Financial Statements for further discussion of the Minus 10 acquisition.
F-22
EPIQ SYSTEMS, INC.
NOTES TO CONSOLIDATED FINANCIAL STATEMENTS (Continued)
DECEMBER 31, 2014, 2013 AND 2012
NOTE 5: LONG-TERM OBLIGATIONS (Continued)
Maturities of Long-Term Obligations
The annual maturities of long-term obligations for the next five fiscal years and thereafter are as follows:
Year Ending December 31,
|
(in thousands) | |||
|---|---|---|---|---|
2015 |
$ | 10,959 | ||
2016 |
7,892 | |||
2017 |
6,770 | |||
2018 |
3,071 | |||
2019 |
3,000 | |||
Thereafter |
281,789 | |||
| | | | | |
Total |
$ | 313,481 | ||
| | | | | |
| | | | | |
| | | | | |
NOTE 6: OPERATING LEASES
We have non-cancelable operating leases for office space at various locations expiring at various times through 2026. Each of the leases requires us to pay all executory costs (property taxes, maintenance and insurance). Certain of our lease agreements provide for scheduled rent increases during the lease term. Rent expense is recognized on a straight-line basis over the lease term. Landlord-provided tenant improvement allowances are recorded as a liability and amortized as a reduction to rent expense over the lease term. Additionally, we have non-cancelable operating leases for office equipment and automobiles expiring through 2017.
Future minimum lease payments during the years ending December 31 are as follows:
| |
Total Future Minimum Lease Payments |
|||
|---|---|---|---|---|
| |
(in thousands) |
|||
2015 |
$ | 9,666 | ||
2016 |
7,226 | |||
2017 |
5,402 | |||
2018 |
5,238 | |||
2019 |
5,265 | |||
Thereafter |
24,958 | |||
| | | | | |
Total minimum lease payments |
$ | 57,755 | ||
| | | | | |
| | | | | |
| | | | | |
Expense related to operating leases for the years ended December 31, 2014, 2013 and 2012 was approximately $11.4 million, $12.6 million and $11.5 million, respectively and is included in "Selling, general and administrative expense" in the Consolidated Statements of Income (Loss).
F-23
EPIQ SYSTEMS, INC.
NOTES TO CONSOLIDATED FINANCIAL STATEMENTS (Continued)
DECEMBER 31, 2014, 2013 AND 2012
NOTE 7: EQUITY
Share Repurchases
On June 1, 2012, our Board authorized the repurchase, through December 31, 2013, of up to an aggregate of $35.0 million of our outstanding shares of common stock (the "2012 Program"). Repurchases were permitted to be made pursuant to the 2012 Program from time to time at prevailing market prices in the open market, in block trades or in privately negotiated purchases, or any combination thereof. During the year ended December 31, 2013, we purchased 1,768,296 shares of common stock under the 2012 Program for approximately $22.9 million, at an average cost of $12.94 per share. During the year ended December 31, 2012, we purchased 283,980 shares of common stock under the 2012 Program for approximately $3.3 million, at an average cost of $11.62 per share.
On November 6, 2013, our Board approved and authorized the repurchase, on or prior to December 31, 2015, of our outstanding shares of common stock up to an aggregate of $35.0 million (the "2014 Share Repurchase Program"). The 2014 Share Repurchase Program became effective on January 1, 2014, upon the expiration of the 2012 Program. Repurchases may be made pursuant to the 2014 Share Repurchase Program from time to time at prevailing market prices in the open market, in block trades or in privately negotiated purchases, or any combination thereof. We may utilize one or more plans with our brokers or banks for pre-authorized purchases within defined limits pursuant to applicable laws to effect all or a portion of the repurchases. The timing, manner, price and amount of any share repurchases under the 2014 Share Repurchase Program will be determined by the Company in its discretion and will be subject to market and economic conditions, prevailing stock prices, loan covenants, leverage objectives, applicable legal and regulatory requirements, and other factors. There were no repurchases of shares under the 2014 Share Repurchase Program during the year ended December 31, 2014.
We also have a policy that requires shares to be repurchased by us to satisfy employee tax withholding obligations upon the vesting of restricted stock awards or the exercise of stock options. During the years ended December 31, 2014, 2013, and 2012 we repurchased 323,090 shares for $4.0 million, 471,248 shares for $6.5 million, and 217,713 shares for $2.7 million, respectively, to satisfy employee tax withholding obligations upon the vesting of restricted stock awards and the net share settlement of certain stock options exercises. Shares of common stock surrendered to the Company as payment of the exercise price arising from the exercise of stock options are included in "Stock option exercises" in the Consolidated Statements of Changes in Equity.
Dividends
Total dividends declared in 2014 were $13.0 million or $0.36 per share of common stock and total dividends paid in 2014 totaled $12.8 million, or $0.36 per share of common stock. Total dividends declared in 2013 were $12.8 million or $0.36 per share of common stock and total dividends paid in 2013 totaled $12.9 million, or $0.36 per share of common stock. Total dividends declared in 2012 were $13.8 million or $0.385 per share of common stock and total dividends paid in 2012 totaled $12.4 million, or $0.345 per share of common stock. Dividends payable were approximately $3.4 million and $3.1 million at December 31, 2014 and 2013, respectively.
Under our Credit Agreement, our ability to pay dividends and repurchase securities from equity holders is limited by a requirement that such payments are not to exceed, in the aggregate, 50% of net income, as adjusted, on a cumulative basis for all quarterly periods from the closing date of the Credit
F-24
EPIQ SYSTEMS, INC.
NOTES TO CONSOLIDATED FINANCIAL STATEMENTS (Continued)
DECEMBER 31, 2014, 2013 AND 2012
NOTE 7: EQUITY (Continued)
Facility and ending prior to the date of payment or repurchase. Adjustments to Consolidated Net Income (as defined in the Credit Agreement) include among other items, the exclusion of extraordinary items, cumulative effect of a change in accounting principle, intangible asset amortization and impairment charges, non-cash compensation expense, certain severance amounts incurred prior to December 31, 2014, cumulative effect of foreign currency translations, and gains or losses from discontinued operations. Further, we are unable to declare and pay dividends and repurchase securities from equity holders if our net leverage ratio (as defined in the Credit Agreement) would exceed 4.25 to 1.0.
Accumulated Other Comprehensive Loss, Net
Accumulated other comprehensive loss, net, is displayed as a separate component of Stockholders' equity in the accompanying Consolidated Balance Sheets. The following table presents the changes in the after-tax balances of each component of Accumulated other comprehensive income (loss), net for the years ended December 31, 2014, 2013, and 2012:
| |
Foreign Currency Translation |
Unrealized Loss on Cash Flow Hedges |
Accumulated Other Comprehensive Loss |
|||||||
|---|---|---|---|---|---|---|---|---|---|---|
Balance at January 1, 2012 |
$ | (1,987 | ) | — | $ | (1,987 | ) | |||
Other comprehensive income |
555 | — | 555 | |||||||
| | | | | | | | | | | |
Balance at December 31, 2012 |
(1,432 | ) | — | (1,432 | ) | |||||
Other comprehensive income |
891 | — | 891 | |||||||
| | | | | | | | | | | |
Balance at December 31, 2013 |
(541 | ) | — | (541 | ) | |||||
Other comprehensive loss |
(2,411 | ) | (1,410 | ) | (3,821 | ) | ||||
| | | | | | | | | | | |
Balance at December 31, 2014 |
$ | (2,952 | ) | $ | (1,410 | ) | $ | (4,362 | ) | |
| | | | | | | | | | | |
| | | | | | | | | | | |
| | | | | | | | | | | |
There were no reclassifications of amounts from Accumulated other comprehensive income (loss) into the Consolidated Statement of Income (Loss) during the years ended December 31, 2014, 2013 and 2012.
Shareholder Rights Agreement and Rights Dividend
On September 18, 2014, we entered into a Rights Agreement (the "Rights Agreement") pursuant to which the Board declared a dividend of one preferred stock purchase right (a "Right") for each outstanding share of common stock of the Company. The dividend was paid on September 29, 2014, to holders of record as of the close of business on that date. The Rights will initially trade with, and will be inseparable from, the common stock. Each Right will allow its holder to receive from the Company one one-thousandth of a preferred share for $40.00 (or, in certain circumstances, alternative consideration which may include cash, property or other securities of the Company), subject to adjustment in accordance with the terms of the Rights Agreement, once the Rights become exercisable. This fraction of a preferred share will give the shareholder approximately the same dividend, voting, and liquidation rights as would one common share.
F-25
EPIQ SYSTEMS, INC.
NOTES TO CONSOLIDATED FINANCIAL STATEMENTS (Continued)
DECEMBER 31, 2014, 2013 AND 2012
NOTE 7: EQUITY (Continued)
Subject to certain exceptions, the Rights will separate from the common stock and become exercisable at the earlier to occur of the following dates (or such later date as the Board may determine under certain circumstances): (i) the tenth business day after the date of a public announcement, or public announcement of facts indicating, that a person or group has become a beneficial owner of 10% or more of the Company's outstanding common stock; or (ii) the tenth business day after the date that any person or group commences or announces an intention to commence a tender or exchange offer that, if consummated, would result in that person or group becoming beneficial owner of 10% or more of the Company's outstanding common stock. The Rights will expire on May 15, 2015, unless earlier redeemed or terminated by the Company as provided in the Rights Agreement. The Board may redeem the Rights for $0.001 per Right at any time prior to such time as any person or group triggers the Rights. The Rights have no voting or dividend privileges, and, unless and until they become exercisable, have no dilutive effect on the earnings of the Company.
NOTE 8: EMPLOYEE BENEFIT PLANS
Stock Purchase Plan
We have an employee stock purchase plan that allows employees to purchase shares of our common stock through payroll deduction. The purchase price for all employee participants is based on the closing bid price on the last business day of the month.
Defined Contribution Plan
We have a defined contribution 401(k) plan that covers substantially all employees. We match 60% of the first 10% of employee contributions and have the option of making additional discretionary contributions. We also sponsor a 401(k) plan covering eligible employees of one of our subsidiaries for which we do not match employee contributions. Our plan expense was approximately $3.0 million, $2.5 million and $2.0 million for the years ended December 31, 2014, 2013 and 2012, respectively.
NOTE 9: FAIR VALUE MEASUREMENTS
Accounting standards establish a three-level fair value hierarchy based upon the assumptions (inputs) used to price assets or liabilities. The hierarchy requires us to maximize the use of observable inputs and minimize the use of unobservable inputs. The three levels of inputs used to measure fair value are listed below:
Level 1—Unadjusted quoted prices in active markets for identical assets or liabilities.
Level 2—Observable inputs other than those included in Level 1, such as quoted market prices for similar assets and liabilities in active markets or quoted prices for identical assets in inactive markets.
Level 3—Unobservable inputs reflecting our own assumptions and best estimate of what inputs market participants would use in pricing an asset or liability.
F-26
EPIQ SYSTEMS, INC.
NOTES TO CONSOLIDATED FINANCIAL STATEMENTS (Continued)
DECEMBER 31, 2014, 2013 AND 2012
NOTE 9: FAIR VALUE MEASUREMENTS (Continued)
Recurring Fair Value Measurements
Derivatives Instruments
The estimated fair values of the Company's option based derivative instruments (as described in Note 5 to the Consolidated Financial Statements) were determined via the Black option pricing model, which utilizes certain observable inputs including the forward and spot curves for the underlying 1 month LIBOR and the estimated volatility for the 1 month LIBOR over the remaining terms of the agreements. The estimated fair value of the Company's interest rate swap, a derivative financial instrument, was determined via the income and market approaches utilizing certain observable inputs including the forward and spot curves for the underlying 1 month LIBOR over the remaining term of the agreement. Based on these characteristics these derivative instruments are classified as Level 2. The fair values of the derivative instruments are subject to material changes based upon changes in the forward curve for 1 month LIBOR and the volatility thereof.
Contingent Consideration
In connection with the acquisition of Minus 10 (as described in Notes 5 and 13 to the Consolidated Financial Statements) we established a contingent consideration liability that is considered to be a Level 3 liability. The estimated fair value of the Minus 10 contingent consideration was based on management's estimate of projected profit and loss over the measurement period and an applied discount rate of 25% which is reflective of the inherent risk attributable to this new product line given its status as an early-stage venture. Such unobservable inputs include financial forecasts prepared by management which include estimates of future cash flows, projected profit and loss information, and discount rates.
In connection with the acquisition of De Novo Legal (as described in Note 5 to the Consolidated Financial Statements), contingent consideration was payable to the De Novo sellers based on revenue-related thresholds related to our Technology segment for the period beginning on January 1, 2013 through December 31, 2013. In the first quarter of 2014, we provided an earn-out statement and paid the sellers $3.5 million as a result of the Company's calculation of the performance measure for the earn-out period. The sellers disputed the Company's calculation of the earn-out amount and alleged that the performance measure was higher, thereby triggering the next tier of contingent consideration. The Company and the sellers participated in the agreed dispute resolution process as specified under the acquisition agreement and in April 2014 agreed to settle this matter for a cash payment to the sellers of $1.5 million which was paid to the sellers in April 2014.
F-27
EPIQ SYSTEMS, INC.
NOTES TO CONSOLIDATED FINANCIAL STATEMENTS (Continued)
DECEMBER 31, 2014, 2013 AND 2012
NOTE 9: FAIR VALUE MEASUREMENTS (Continued)
As of December 31, 2014 and 2013, our assets and liabilities that are measured and recorded at fair value on a recurring basis were as follows:
| |
|
Estimated Fair Value Measurements | |||||||||||
|---|---|---|---|---|---|---|---|---|---|---|---|---|---|
| |
|
|
Significant Other Observable Inputs |
|
|||||||||
| |
|
Quoted Prices in Active Markets |
Significant Unobservable Inputs |
||||||||||
| |
Carrying Value |
||||||||||||
Items Measured at Fair Value on a Recurring Basis |
(Level 1) | (Level 2) | (Level 3) | ||||||||||
| |
(in thousands) |
||||||||||||
December 31, 2014: |
|||||||||||||
Assets: |
|||||||||||||
Interest rate cap |
$ | 1 | $ | — | $ | 1 | $ | — | |||||
| | | | | | | | | | | | | | |
| | | | | | | | | | | | | | |
| | | | | | | | | | | | | | |
Liabilities: |
|||||||||||||
Interest rate swap |
$ | 2,451 | $ | — | $ | 2,451 | $ | — | |||||
Acquisition-related contingent consideration |
1,116 | — | — | 1,116 | |||||||||
| | | | | | | | | | | | | | |
Total Liabilities |
$ | 3,567 | $ | — | $ | 2,451 | $ | 1,116 | |||||
| | | | | | | | | | | | | | |
| | | | | | | | | | | | | | |
| | | | | | | | | | | | | | |
December 31, 2013: |
|||||||||||||
Assets: |
|||||||||||||
Interest rate cap |
$ | 27 | $ | — | $ | 27 | $ | — | |||||
| | | | | | | | | | | | | | |
| | | | | | | | | | | | | | |
| | | | | | | | | | | | | | |
Liabilities: |
|||||||||||||
Acquisition-related contingent consideration |
$ | 2,580 | $ | — | $ | — | $ | 2,580 | |||||
| | | | | | | | | | | | | | |
| | | | | | | | | | | | | | |
| | | | | | | | | | | | | | |
The following table represents the change in the acquisition-related contingent consideration obligation during the year ended December 31, 2014:
| |
Fair Value Measurements Using Significant Unobservable Inputs (Level 3) (in thousands) |
|||
|---|---|---|---|---|
| |
Total | |||
Beginning balance December 31, 2013 |
$ | 2,580 | ||
Fair value related adjustments |
2,075 | |||
Present value accretion |
189 | |||
Payments |
(3,728 | ) | ||
| | | | | |
Ending balance December 31, 2014 |
$ | 1,116 | ||
| | | | | |
| | | | | |
| | | | | |
F-28
EPIQ SYSTEMS, INC.
NOTES TO CONSOLIDATED FINANCIAL STATEMENTS (Continued)
DECEMBER 31, 2014, 2013 AND 2012
NOTE 9: FAIR VALUE MEASUREMENTS (Continued)
Other Fair Value Disclosures
The carrying amounts of cash and cash equivalents, short-term investments, receivables, accounts payable and accrued expenses approximate their fair values because of the relatively short-term maturities of these financial instruments. As of December 31, 2014 and 2013, the amounts outstanding under both our credit facility and notes payable approximated fair value due to the borrowing rates currently available to us for debt with similar terms and are classified as Level 2.
NOTE 10: INCOME TAXES
Income (loss) before income taxes consisted of the following:
| |
Year Ended December 31, | |||||||||
|---|---|---|---|---|---|---|---|---|---|---|
| |
2014 | 2013 | 2012 | |||||||
| |
(in thousands) |
|||||||||
Income (loss) before income taxes |
||||||||||
United States |
$ | (20,892 | ) | $ | 12,273 | $ | 32,148 | |||
Foreign |
15,040 | 4,832 | 3,258 | |||||||
| | | | | | | | | | | |
Total |
$ | (5,852 | ) | $ | 17,105 | $ | 35,406 | |||
| | | | | | | | | | | |
| | | | | | | | | | | |
| | | | | | | | | | | |
Income tax expense (benefit) for 2014, 2013 and 2012 consists of the following:
| |
Year Ended December 31, | |||||||||
|---|---|---|---|---|---|---|---|---|---|---|
| |
2014 | 2013 | 2012 | |||||||
| |
(in thousands) |
|||||||||
Current: |
||||||||||
Federal |
$ | (6,735 | ) | $ | 9,121 | $ | 9,447 | |||
State |
(362 | ) | 1,849 | 1,221 | ||||||
Foreign |
3,120 | 1,542 | 838 | |||||||
| | | | | | | | | | | |
Total current |
(3,977 | ) | 12,512 | 11,506 | ||||||
| | | | | | | | | | | |
Deferred: |
||||||||||
Federal |
2,599 | (4,687 | ) | 946 | ||||||
State |
(3,270 | ) | (1,724 | ) | 619 | |||||
Foreign |
133 | (106 | ) | (92 | ) | |||||
| | | | | | | | | | | |
Total deferred |
(538 | ) | (6,517 | ) | 1,473 | |||||
| | | | | | | | | | | |
Total income tax expense (benefit) |
$ | (4,515 | ) | $ | 5,995 | $ | 12,979 | |||
| | | | | | | | | | | |
| | | | | | | | | | | |
| | | | | | | | | | | |
The jurisdictions where we generate income (or loss) before income taxes have a significant effect on our effective tax rate. In 2014, we incurred a pre-tax loss in the U.S. and pre-tax income in our primary foreign jurisdictions. The income (or loss) earned in the United States will be subject to an approximate 42% combined statutory federal and state tax rate. Our foreign-sourced income (or loss), which is earned primarily in the United Kingdom, will be subject to a statutory rate of approximately 22%. In 2014, the significantly higher tax rate in computing the tax benefit on the U.S. losses than the
F-29
EPIQ SYSTEMS, INC.
NOTES TO CONSOLIDATED FINANCIAL STATEMENTS (Continued)
DECEMBER 31, 2014, 2013 AND 2012
NOTE 10: INCOME TAXES (Continued)
tax rate used in computing the tax expense on the foreign income results in an overall effective tax rate that is not customary.
The following is a summary of our income tax expense (benefit) and resulting effective tax rate by jurisdiction:
| |
Year Ended December 31, | |||||||||
|---|---|---|---|---|---|---|---|---|---|---|
| |
2014 | 2013 | 2012 | |||||||
| |
(in thousands) |
|||||||||
Income tax expense (benefit) by jurisdiction: |
||||||||||
United States |
$ | (7,768 | ) | $ | 4,559 | $ | 12,233 | |||
Foreign |
3,253 | 1,436 | 746 | |||||||
| | | | | | | | | | | |
Consolidated income tax expense (benefit) |
$ | (4,515 | ) | $ | 5,995 | $ | 12,979 | |||
| | | | | | | | | | | |
Effective income tax rate by jurisdiction: |
||||||||||
United States |
37.2 | % | 37.1 | % | 38.1 | % | ||||
Foreign |
21.6 | % | 29.7 | % | 22.9 | % | ||||
Consolidated effective tax rate |
77.2 | % | 35.0 | % | 36.7 | % | ||||
A reconciliation of the provision for income taxes at the statutory rate of 35% to the provision for income taxes at our effective rate is shown below:
| |
Year Ended December 31, | |||||||||
|---|---|---|---|---|---|---|---|---|---|---|
| |
2014 | 2013 | 2012 | |||||||
| |
(in thousands) |
|||||||||
Income tax expense (benefit) at the statutory rate |
$ | (2,048 | ) | $ | 5,987 | $ | 12,392 | |||
Change in taxes resulting from: |
||||||||||
State income taxes, net of federal tax effect |
(1,922 | ) | 81 | 1,136 | ||||||
Foreign tax and change in foreign valuation allowance |
(2,032 | ) | (322 | ) | (394 | ) | ||||
Permanent differences |
1,189 | 797 | 578 | |||||||
Uncertain tax positions |
(112 | ) | 447 | — | ||||||
Research and development credits |
(513 | ) | (676 | ) | (239 | ) | ||||
Nondeductible compensation |
411 | — | — | |||||||
Share-based compensation |
469 | — | — | |||||||
Domestic production activities deduction |
(5 | ) | (422 | ) | (568 | ) | ||||
Other |
48 | 103 | 74 | |||||||
| | | | | | | | | | | |
Total income tax expense (benefit) |
$ | (4,515 | ) | $ | 5,995 | $ | 12,979 | |||
| | | | | | | | | | | |
| | | | | | | | | | | |
| | | | | | | | | | | |
F-30
EPIQ SYSTEMS, INC.
NOTES TO CONSOLIDATED FINANCIAL STATEMENTS (Continued)
DECEMBER 31, 2014, 2013 AND 2012
NOTE 10: INCOME TAXES (Continued)
The tax effects of temporary differences that give rise to significant portions of deferred tax assets and deferred tax liabilities on the accompanying Consolidated Balance Sheets are as follows:
| |
December 31, | ||||||
|---|---|---|---|---|---|---|---|
| |
2014 | 2013 | |||||
| |
(in thousands) |
||||||
Deferred tax assets: |
|||||||
Allowance for doubtful accounts |
$ | 1,379 | $ | 1,661 | |||
Share-based compensation |
6,206 | 10,474 | |||||
Intangible assets |
2,408 | 2,653 | |||||
Deferred rent |
426 | 527 | |||||
Accrued liabilities |
4,765 | 2,094 | |||||
Cash flow hedges |
1,067 | — | |||||
Other |
195 | — | |||||
Foreign loss carryforwards |
831 | 639 | |||||
State net operating loss carryforwards |
3,579 | 838 | |||||
Valuation allowances |
(1,903 | ) | (808 | ) | |||
| | | | | | | | |
Total deferred tax assets |
18,953 | 18,078 | |||||
| | | | | | | | |
Deferred tax liabilities: |
|||||||
Prepaid expenses |
(1,875 | ) | (2,199 | ) | |||
Intangible assets |
(33,655 | ) | (33,300 | ) | |||
Property and equipment and software development costs |
(11,324 | ) | (11,321 | ) | |||
Deferred debt discharge income |
(1,985 | ) | (2,649 | ) | |||
Other |
— | (100 | ) | ||||
| | | | | | | | |
Total deferred tax liabilities |
(48,839 | ) | (49,569 | ) | |||
| | | | | | | | |
Net deferred tax liability |
$ | (29,886 | ) | $ | (31,491 | ) | |
| | | | | | | | |
| | | | | | | | |
| | | | | | | | |
Prior to our acquisition of Encore, as part of a debt restructuring in 2009, Encore elected to defer recognition of approximately $8.9 million of debt discharge income pursuant to Section 108(i) of the Internal Revenue Code of 1986, as amended. For each year 2013 through 2017, we will include approximately $1.8 million of deferred debt discharge income in taxable income.
In 2014, we generated a federal net operating loss of approximately $15.0 million, which we will carry back to our 2012 tax year. We have recorded a corresponding $5.0 million current federal income tax receivable. In February 2015, we filed for a $2.9 million refund for taxes which had been credited to our 2014 tax year. As of December 31, 2014, we have generated state operating loss carryforwards totaling $44.9 million which generated a deferred tax asset included above of $3.6 million. These carryforwards expire in varying amounts in years 2015 through 2034. Of these carryforwards, $4.7 million was generated in states in which management believes it is unlikely that we will be able to utilize these carry forwards. A $0.2 million valuation allowance was recorded relating to these losses.
In 2014, we have recorded a $0.5 million tax expense relating to tax detriments which exceeded our available tax benefit pool. As a result of the realization requirements of ASC 718 "Compensation—Stock Compensation" for tax benefits relating to the exercise of stock options, the state net operating
F-31
EPIQ SYSTEMS, INC.
NOTES TO CONSOLIDATED FINANCIAL STATEMENTS (Continued)
DECEMBER 31, 2014, 2013 AND 2012
NOTE 10: INCOME TAXES (Continued)
loss carryforward deferred tax asset presented in the table above excludes certain deferred tax assets relating to state net operating losses generated in 2014. These losses arose directly from tax deductions related to equity compensation in excess of compensation recognized for financial reporting. Equity will be increased by $0.2 million if and when such deferred tax assets are ultimately realized. We use tax law ordering for the purpose of determining when excess tax benefits have been realized.
As of December 31, 2014, we have recorded a $0.8 million valuation allowance relating to approximately $2.3 million of net operating losses generated in international jurisdictions. This valuation allowance will be released when management believes it is more likely than not that based on the available positive and negative evidence the losses will be utilized.
We have received certification for the Kansas High Performance Incentive Program ("HPIP") tax credit in conjunction with investments made in our Kansas facilities. As of December 31, 2014, $1.8 million of HPIP credits were available to offset our 2015 and future Kansas income tax. The credit may be carried forward for a period of sixteen years provided we continue to meet the HPIP certification requirements. Due to this uncertainty, we have recorded a $0.9 million valuation allowance against these credits.
On December 19, 2014, the Tax Increase Prevention Act of 2014 was passed and is effective for the tax year ending December 31, 2014. Accordingly, a research tax benefit of approximately $0.5 million is reflected our 2014 results. The research credit was not extended beyond 2014 and if not extended, this would increase our effective tax rate in future tax periods.
In March 2014, New York State passed comprehensive corporate income tax reform with most changes effective for years 2015 and beyond. We have substantial business presence within the state, but we do not expect the new law to have a material impact on our overall expected future tax expense.
The net deferred tax liability is presented on the Consolidated Balance Sheets as follows:
| |
December 31, | ||||||
|---|---|---|---|---|---|---|---|
| |
2014 | 2013 | |||||
| |
(in thousands) |
||||||
Current deferred income taxes |
$ | 4,625 | $ | 3,824 | |||
Other long-term assets |
139 | 243 | |||||
Long-term deferred income tax liability |
(34,650 | ) | (35,558 | ) | |||
| | | | | | | | |
Net deferred tax liability |
$ | (29,886 | ) | $ | (31,491 | ) | |
| | | | | | | | |
| | | | | | | | |
| | | | | | | | |
United States income and foreign withholding taxes have not been recognized on the excess of earnings for financial reporting over the tax basis of investments in foreign subsidiaries that are essentially permanent in duration. Generally, such earnings become subject to United States taxation upon the remittance of dividends or a sale or liquidation of the foreign subsidiary. The amount of such excess totaled approximately $23.9 million at December 31, 2014. It is not practicable to estimate the amount of any deferred tax liability related to this amount.
As of December 31, 2014, 2013 and 2012, the gross amount of unrecognized tax benefits, including penalty and interest, was approximately $6.3 million, $6.4 million and $5.4 million, respectively. If
F-32
EPIQ SYSTEMS, INC.
NOTES TO CONSOLIDATED FINANCIAL STATEMENTS (Continued)
DECEMBER 31, 2014, 2013 AND 2012
NOTE 10: INCOME TAXES (Continued)
recognized, approximately $5.1 million, $5.2 million and $4.4 million would have affected our effective tax rate in 2014, 2013, and 2012, respectively.
The following table summarizes the activity related to our gross unrecognized tax benefits excluding interest and penalties (in thousands):
| |
2014 | 2013 | 2012 | |||||||
|---|---|---|---|---|---|---|---|---|---|---|
Unrecognized tax benefits as of January 1 |
$ | 5,326 | $ | 4,639 | $ | 4,164 | ||||
Gross increases for prior year tax positions |
190 | 243 | 1,266 | |||||||
Gross decreases for prior year tax positions |
(60 | ) | (53 | ) | — | |||||
Gross increase for current year tax positions |
197 | 530 | 323 | |||||||
Settlements |
— | (33 | ) | (755 | ) | |||||
Lapse of statute of limitations |
(533 | ) | — | (359 | ) | |||||
| | | | | | | | | | | |
Unrecognized tax benefits at December 31 |
$ | 5,120 | $ | 5,326 | $ | 4,639 | ||||
| | | | | | | | | | | |
| | | | | | | | | | | |
| | | | | | | | | | | |
We file income tax returns in the United States federal jurisdiction, the United Kingdom, Hong Kong, Japan, Canada and various state jurisdictions. We have also made an evaluation of the potential impact of assessments by state and foreign jurisdictions in which we have not filed tax returns.
As of December 31, 2014, the 2011 and subsequent federal, state and foreign tax returns are subject to examination. In addition, the 2010 statute of limitations remains open in certain state and foreign jurisdictions. It is reasonably possible that approximately $0.8 million of unrecognized tax benefits will be recognized in the next twelve months due to statute closings of which $0.6 million will affect our effective tax rate.
During 2013, we were informed that our income tax returns for the years ended December 31, 2009, 2010 and 2011 would be audited by the State of New York. In addition, in January 2014, we were informed that our income tax returns for 2010 and 2011 would be audited by New York City. During 2014, we settled both the New York State and City audits for immaterial amounts.
In 2012, we increased our unrecognized tax benefits for prior year tax positions by $1.3 million. This increase is due to filing amended state returns to claim refunds and to claim credits that will be carried forward to future years. Also, during 2012, the Internal Revenue Service concluded their examination of our 2009 federal return and determined that no additional taxes were owed. As a result, we considered 2009 to be effectively settled and recognized $0.2 million of unrecognized tax benefits which affected our effective tax rate.
We have classified interest and penalties as a component of income tax expense. Estimated interest and penalties classified as a component of income tax expense during 2014, 2013, and 2012 totaled $0.2 million, $0.2 million and $0.1 million, respectively. Accrued interest and penalties, included as a component of "Other long-term liabilities" on the accompanying Consolidated Balance Sheets, totaled $1.0 million and $0.2 million, respectively, as of December 31, 2014. As of December 31, 2013, the accrued interest and penalties were $0.8 million and $0.2 million, respectively.
F-33
EPIQ SYSTEMS, INC.
NOTES TO CONSOLIDATED FINANCIAL STATEMENTS (Continued)
DECEMBER 31, 2014, 2013 AND 2012
NOTE 11: EARNINGS PER SHARE
Basic net income per share is computed on the basis of weighted average outstanding common shares. Diluted net income per share is computed on the basis of basic weighted average outstanding common shares adjusted for the dilutive effect, if any, of outstanding stock options.
On June 11, 2014, our shareholders approved an amendment and restatement of the Epiq Systems, Inc. 2004 Equity Incentive Plan (the "Current Plan"), effective January 1, 2014. One of the amendments included in the Current Plan is to specify that dividends are no longer payable on nonvested share awards during the vesting period. Such dividends declared during the vesting period will be accrued and are payable only if and when the nonvested share awards vest. As a result of this amendment, nonvested share awards (also referred to as restricted stock awards) issued by the Company are no longer considered to be participating securities because they do not have non-forfeitable rights to dividends. Accordingly, for the year ended December 31, 2014 basic and diluted net income per share are calculated using the treasury stock method which does not require the allocation of net income to nonvested shares.
For the years ended December 31, 2014 and 2013, in determining diluted earnings per share, we use the more dilutive earnings per share result between two-class method calculation and the treasury stock method calculation applied to our outstanding nonvested share awards.
The computation of basic and diluted net income per common share for the years ended December 31, 2014, 2013 and 2012 is as follows:
| |
2014 | 2013 | 2012 | |||||||
|---|---|---|---|---|---|---|---|---|---|---|
| |
(In thousands, except per share data) |
|||||||||
Net income (loss) |
$ | (1,337 | ) | $ | 11,110 | $ | 22,427 | |||
Less: amounts allocated to nonvested shares |
— | (113 | ) | (268 | ) | |||||
| | | | | | | | | | | |
Income available to common stockholders |
$ | (1,337 | ) | $ | 10,997 | $ | 22,159 | |||
Weighted average common shares outstanding—basic |
35,512 |
35,434 |
35,497 |
|||||||
Effect of dilutive securities |
— | 868 | 876 | |||||||
| | | | | | | | | | | |
Weighted average common shares outstanding—diluted |
35,512 | 36,302 | 36,373 | |||||||
| | | | | | | | | | | |
| | | | | | | | | | | |
| | | | | | | | | | | |
Basic income (loss) per common share |
$ | (0.04 | ) | $ | 0.31 | $ | 0.62 | |||
| | | | | | | | | | | |
| | | | | | | | | | | |
| | | | | | | | | | | |
Diluted income (loss) per common share |
$ | (0.04 | ) | $ | 0.30 | $ | 0.61 | |||
| | | | | | | | | | | |
| | | | | | | | | | | |
| | | | | | | | | | | |
For the years ended December 31, 2014, 2013, and 2012 weighted average outstanding stock options totaling approximately 3.4 million, 2.0 million and 3.1 million shares of common stock, respectively, were antidilutive and therefore not included in the computation of diluted net income per share.
F-34
EPIQ SYSTEMS, INC.
NOTES TO CONSOLIDATED FINANCIAL STATEMENTS (Continued)
DECEMBER 31, 2014, 2013 AND 2012
NOTE 12: SHARE-BASED COMPENSATION
The Company accounts for its share-based compensation by recognizing the grant date fair value of share-based awards, net of estimated forfeitures, as compensation expense over the underlying requisite service periods of the related awards. The following table presents total share-based compensation expense, which is a non-cash charge, included in the Consolidated Statements of Income (Loss):
| |
Year Ended December 31, | |||||||||
|---|---|---|---|---|---|---|---|---|---|---|
| |
2014 | 2013 | 2012 | |||||||
| |
(in thousands) |
|||||||||
Direct cost of operating revenue |
$ | 2,359 | $ | 660 | $ | 201 | ||||
Selling, general and administrative |
10,739 | 9,348 | 6,518 | |||||||
| | | | | | | | | | | |
Pre-tax share-based compensation expense |
13,098 | 10,008 | 6,719 | |||||||
Income tax benefit |
(5,508 | ) | (4,135 | ) | (2,908 | ) | ||||
| | | | | | | | | | | |
Total share-based compensation expense, net of tax |
$ | 7,590 | $ | 5,873 | $ | 3,811 | ||||
| | | | | | | | | | | |
| | | | | | | | | | | |
| | | | | | | | | | | |
As of December 31, 2014, there was $5.3 million and $1.8 million of total unrecognized compensation cost related to outstanding, unvested restricted stock and stock options, respectively, which will be recognized over a weighted-average period of approximately 2.5 years and 3.0 years.
Included in share-based compensation expense for the year ended December 31, 2014 is $6.5 million of expense recognized with respect to executive officer and employee incentive compensation awards which, based on the closing share price as of December 31, 2014 of $17.08 (as reported by NASDAQ Global Markets), is equal to approximately 381,000 shares of common stock. The $6.5 million includes executive officer awards of $1.4 million which were approved by the Compensation Committee of the Company's Board of Directors on February 20, 2015. The accrual is recorded in "Accrued compensation" on the accompanying Consolidated Balance Sheets as of December 31, 2014.
The Current Plan limits the combined grant of options to acquire shares of common stock, stock appreciation rights, and nonvested share (commonly referred to as restricted stock) awards to 7,500,000 shares. Any grant under the Current Plan that expires or terminates unexercised, becomes unexercisable or is forfeited will be available for further grants. At December 31, 2014, there were approximately 1.1 million shares of common stock available for future equity-related grants under the Current Plan. The purpose of the Current Plan is to provide employees of the Company and members of our Board of Directors additional incentive and reward opportunities designed to enhance the profitable growth of the Company. Equity grants awarded under the Current Plan generally vest over four years based on continued employment.
As part of certain acquisitions and as an inducement in hiring of certain new key executives, stock options are issued outside of the Current Plan from time to time. These options are granted at an option exercise price equal to fair market value of the common stock on the date of grant, are non-qualified options, are exercisable for up to 10 years from the date of grant, and generally vest 25% on the second anniversary of the grant date and continue to vest 25% per year on each anniversary of the grant date until fully vested.
Although various forms of equity instruments may be issued under the Current Plan, through December 31, 2014, we have only issued incentive stock options, nonqualified stock options, and nonvested share awards.
F-35
EPIQ SYSTEMS, INC.
NOTES TO CONSOLIDATED FINANCIAL STATEMENTS (Continued)
DECEMBER 31, 2014, 2013 AND 2012
NOTE 12: SHARE-BASED COMPENSATION (Continued)
Stock Options
Stock options are issued with an exercise price equal to the grant date closing market price of our common stock. Stock options become exercisable under various vesting schedules, ranging from immediate vesting to a seven year vesting period, and expire ten years from the date of grant.
The estimated fair value of stock options is determined using the Black-Scholes valuation model. Key inputs and assumptions to estimate the fair value of stock options include the grant price of the award, the expected option term, the volatility of the Company's stock, the risk-free interest rate, and the company's dividend yield. Estimates of fair value are not intended to predict actual future events or the value ultimately realized by individuals who receive equity awards, and subsequent events are not indicative of the reasonableness of the original estimates of fair value made by the Company.
The following table presents the weighted-average assumptions used and the weighted-average fair value per option granted. No stock options were granted during the year ended December 31, 2013.
| |
Year Ended December 31, |
||||||
|---|---|---|---|---|---|---|---|
| |
2014 | 2012 | |||||
Expected life of stock option in years |
7.0 | 6.8 | |||||
Expected volatility |
36 | % | 39 | % | |||
Risk-free interest rate |
2.1 | % | 1.1 | % | |||
Dividend yield |
2.5 | % | 2.3 | % | |||
Weighted average grant-date fair value |
$ | 4.33 | $ | 3.51 | |||
We estimate the expected term of our stock options based on the historical exercise pattern of groups of employees that have similar historical exercise behavior. The expected volatility is estimated based upon implied volatilities from traded stock options on our stock and on our stock's historical volatility, based on daily stock prices. The expected risk-free interest rate is based on the United States Treasury yield curve in effect at the time of the grant. We calculate the expected dividend yield based on an average of historical stock prices and on our estimate of dividends expected to be paid.
A summary of option activity during the year ended December 31, 2014 is presented below (shares and aggregate intrinsic value in thousands):
| |
Shares | Weighted Average Exercise Price |
Weighted Average Contractual Term |
Aggregate Intrinsic Value |
|||||||||
|---|---|---|---|---|---|---|---|---|---|---|---|---|---|
Outstanding, beginning of period |
3,825 | $ | 13.32 | ||||||||||
Granted |
143 | 14.38 | |||||||||||
Exercised |
(1,128 | ) | 11.70 | ||||||||||
Forfeited and expired |
(489 | ) | 15.67 | ||||||||||
| | | | | | | | | | | | | | |
Outstanding, end of period |
2,351 | $ | 13.66 | 3.68 | $ | 8,117 | |||||||
| | | | | | | | | | | | | | |
| | | | | | | | | | | | | | |
| | | | | | | | | | | | | | |
Options vested and expected to vest, end of period |
2,304 | $ | 13.67 | 3.58 | $ | 7,937 | |||||||
| | | | | | | | | | | | | | |
| | | | | | | | | | | | | | |
| | | | | | | | | | | | | | |
Options exercisable, end of period |
1,888 | $ | 13.76 | 2.74 | $ | 6,346 | |||||||
| | | | | | | | | | | | | | |
| | | | | | | | | | | | | | |
| | | | | | | | | | | | | | |
F-36
EPIQ SYSTEMS, INC.
NOTES TO CONSOLIDATED FINANCIAL STATEMENTS (Continued)
DECEMBER 31, 2014, 2013 AND 2012
NOTE 12: SHARE-BASED COMPENSATION (Continued)
Additional information regarding stock option exercises appears in the table below (in millions):
| |
As of December 31, | |||||||||
|---|---|---|---|---|---|---|---|---|---|---|
| |
2014 | 2013 | 2012 | |||||||
Intrinsic value of stock options exercised |
$ | 3.7 | $ | 8.7 | $ | 2.2 | ||||
Cash received from option exercises |
$ | 12.5 | $ | 3.0 | $ | 0.9 | ||||
Tax benefit realized from options exercised during the annual period |
$ | 1.6 | $ | 6.7 | $ | 2.6 | ||||
Nonvested Share Awards
Summary restricted stock activity is presented in the table below (shares in thousands):
| |
Shares | Weighted Average Grant Date Fair Value |
|||||
|---|---|---|---|---|---|---|---|
Non-vested at December 31, 2013 |
364 | $ | 12.48 | ||||
Granted |
1,109 | 15.05 | |||||
Vested |
(670 | ) | 13.49 | ||||
Forfeited/Canceled |
(225 | ) | 15.01 | ||||
| | | | | | | | |
Non-vested at December 31, 2014 |
578 | $ | 15.23 | ||||
| | | | | | | | |
| | | | | | | | |
| | | | | | | | |
The fair value of nonvested share awards is based on the closing market price of our common stock on the date of grant. Nonvested share awards entitle the holder to shares of common stock when the award vests.
During the year ended December 31, 2014, we granted 450,000 nonvested stock awards which can only vest upon certification by the compensation committee of the Company's Board of the achievement of certain Company financial performance criteria for the calendar year ending December 31, 2014 (the "2014 Performance-Based Share Award"). During the year ended December 31, 2014, 225,000 shares of the 2014 Performance-Based Share Awards were forfeited by two former executives in conjunction with their resignation from the Company in March 2014 and June 2014, respectively. The Company did not recognize any expense during 2014 for these forfeited awards. On February 20, 2015, the Compensation Committee of the Company's Board of Directors certified that the performance condition with respect to the remaining 225,000 shares was achieved and the restricted stock awards vested as of that date.
Also granted during 2014 were 62,069 shares which vested in April 2014 upon the achievement of financial performance criteria. An additional 219,730 shares were granted in connection with the achievement of certain financial performance criteria for the year 2013 for executive performance-based annual incentive compensation awards, which vested upon issuance and the related expense was recognized in the Consolidated Statements of Income for the year ended December 31, 2013. In connection with the appointment of an executive officer, 100,000 shares were granted, of which 25,000 shares vested upon issuance and the remaining 75,000 shares vest over three years. The remaining 277,500 nonvested stock awards granted will vest one to three years from the grant date.
During the year ended December 31, 2013, we granted 527,600 nonvested share awards of which 330,000 shares vested 12 months after the date of grant upon achievement of a performance condition
F-37
EPIQ SYSTEMS, INC.
NOTES TO CONSOLIDATED FINANCIAL STATEMENTS (Continued)
DECEMBER 31, 2014, 2013 AND 2012
NOTE 12: SHARE-BASED COMPENSATION (Continued)
for the calendar year ended December 31, 2013, 164,100 shares vested upon issuance and the remaining 33,500 nonvested stock awards vested one year from the grant date.
During the year ended December 31, 2012, we granted 430,000 nonvested share awards. These awards vested 12 months after the date of grant upon achievement of a performance condition for the calendar year ended December 31, 2012.
The weighted-average grant date fair value of nonvested share awards granted during 2014, 2013 and 2012 was $15.05, $12.90 and $11.85, respectively.
NOTE 13: ACQUISITIONS
On April 1, 2014, we completed the acquisition of Minus 10, a company that develops and maintains software products and provides related services to its customers with respect to web-enabled bankruptcy preparation and case management and expanded our Chapter 11 restructuring service offerings. Minus 10 is included in our Bankruptcy and Settlement Administration segment.
The preliminary purchase price of Minus 10 was comprised of the following:
| |
(in thousands) | |||
|---|---|---|---|---|
Cash paid at closing |
$ | 302 | ||
Net working capital liability |
17 | |||
Deferred cash consideration |
43 | |||
Fair value of contingent consideration |
933 | |||
| | | | | |
Total purchase price |
$ | 1,295 | ||
| | | | | |
| | | | | |
| | | | | |
The cash consideration paid at closing was funded from our cash balances.
As a result of an earn-out opportunity the sellers of Minus 10 have the opportunity to receive contingent consideration based on a percentage of future qualifying profit and other measures, as defined in the purchase agreement. This contingent consideration opportunity for the sellers would be payable, if earned, over seven discrete measurement periods beginning with April 1, 2014 through December 31, 2014 and each annual period ending December 31, 2015 through December 31, 2020.
The fair value of the contingent consideration was determined by a present value calculation of the potential payouts based on financial projections over the earn-out period. Subsequent changes in fair value, which will be measured quarterly, will be recognized in earnings. We recognized fair value of approximately $1.1 million of the contingent consideration in "Long-term obligations" on the Consolidated Balance Sheet at December 31, 2014.
Transaction related costs, which were expensed during the period in which they were incurred, were not material related to this acquisition.
F-38
EPIQ SYSTEMS, INC.
NOTES TO CONSOLIDATED FINANCIAL STATEMENTS (Continued)
DECEMBER 31, 2014, 2013 AND 2012
NOTE 13: ACQUISITIONS (Continued)
Total purchase consideration has been allocated to the identifiable intangible assets based on their respective fair values on the acquisition date. The preliminary purchase price allocations are summarized in the following table:
| |
(in thousands) | |||
|---|---|---|---|---|
Intangible assets: |
||||
Acquired technology |
$ | 1,142 | ||
Goodwill |
153 | |||
| | | | | |
Net assets acquired |
$ | 1,295 | ||
| | | | | |
| | | | | |
| | | | | |
We allocated approximately $1.1 million of the purchase price to acquired technology which is included in "Intangible assets" on the Consolidated Balance Sheets as of December 31, 2014. This intangible asset will be amortized on a straight-line basis over an amortization period of 10 years. The entire balances of goodwill and acquired technology related to this acquisition are amortizable for tax purposes.
The operating results of Minus 10 from the date of acquisition through December 31, 2014 were immaterial to our operating results. Pro-forma results of operations, assuming the Minus 10 acquisition was made at the beginning of the earliest period presented, have not been presented because the effect of this acquisition was not material to our operating results.
NOTE 14: SEGMENT REPORTING
We report our financial performance based on the following two reportable segments: the Technology segment and the Bankruptcy and Settlement Administration segment.
Our Technology segment provides eDiscovery managed services and technology solutions comprised of consulting, collections and forensics, processing, search and review, and document review to companies and law firms. Produced documents are made available primarily through a hosted environment utilizing our proprietary software DocuMatrix®, and third-party software which allows for efficient attorney review and data requests. Our Bankruptcy and Settlement Administration segment provides managed services and technology solutions that address the needs of our customers with respect to litigation, claims and project administration, compliance matters, controlled disbursements, corporate restructuring, bankruptcy and class action proceedings.
The segment performance measure is based on earnings before interest, taxes, depreciation and amortization, other operating expense, and share-based compensation expense. In management's evaluation of performance, certain costs, such as compensation for administrative staff and executive management, are not allocated by segment and, accordingly, the following reporting segment results do not include such unallocated costs.
Assets reported within a segment are those assets that can be identified to a segment and primarily consist of trade receivables, property, equipment and leasehold improvements, software, identifiable intangible assets and goodwill. Cash, certain tax-related assets, and certain prepaid assets and other assets are not allocated to our segments. Although we can and do identify long-lived assets such as property, equipment and leasehold improvements, software, and identifiable intangible assets to
F-39
EPIQ SYSTEMS, INC.
NOTES TO CONSOLIDATED FINANCIAL STATEMENTS (Continued)
DECEMBER 31, 2014, 2013 AND 2012
NOTE 14: SEGMENT REPORTING (Continued)
reporting segments, we do not allocate the related depreciation and amortization to the segment as management evaluates segment performance exclusive of these non-cash charges.
Following is a summary of segment information for the years ended December 31, 2014, 2013 and 2012.
| |
Year Ended December 31, 2014 | ||||||||||||
|---|---|---|---|---|---|---|---|---|---|---|---|---|---|
| |
Technology | Bankruptcy and Settlement Administration |
Eliminations | Total | |||||||||
| |
(in thousands) |
||||||||||||
Operating revenues |
$ | 297,679 | $ | 146,439 | $ | — | $ | 444,118 | |||||
Intersegment revenue |
2,045 | — | (2,045 | ) | — | ||||||||
| | | | | | | | | | | | | | |
Operating revenues including intersegment revenue |
299,724 | 146,439 | (2,045 | ) | 444,118 | ||||||||
Reimbursable expenses |
2,540 | 27,812 | — | 30,352 | |||||||||
| | | | | | | | | | | | | | |
Total revenues |
302,264 | 174,251 | (2,045 | ) | 474,470 | ||||||||
Direct costs, selling, general and administrative expenses |
218,255 | 121,085 | (2,045 | ) | 337,295 | ||||||||
| | | | | | | | | | | | | | |
Segment performance measure |
$ | 84,009 | $ | 53,166 | $ | — | $ | 137,175 | |||||
| | | | | | | | | | | | | | |
| | | | | | | | | | | | | | |
| | | | | | | | | | | | | | |
| |
Year Ended December 31, 2013 | ||||||||||||
|---|---|---|---|---|---|---|---|---|---|---|---|---|---|
| |
Technology | Bankruptcy and Settlement Administration |
Eliminations | Total | |||||||||
| |
(in thousands) |
||||||||||||
Operating revenues |
$ | 284,929 | $ | 153,761 | $ | — | $ | 438,690 | |||||
Intersegment revenue |
384 | — | (384 | ) | — | ||||||||
| | | | | | | | | | | | | | |
Operating revenues including intersegment revenue |
285,313 | 153,761 | (384 | ) | 438,690 | ||||||||
Reimbursable expenses |
2,488 | 40,905 | — | 43,393 | |||||||||
| | | | | | | | | | | | | | |
Total revenues |
287,801 | 194,666 | (384 | ) | 482,083 | ||||||||
Direct costs, selling, general and administrative expenses |
198,462 | 145,596 | (384 | ) | 343,674 | ||||||||
| | | | | | | | | | | | | | |
Segment performance measure |
$ | 89,339 | $ | 49,070 | $ | — | $ | 138,409 | |||||
| | | | | | | | | | | | | | |
| | | | | | | | | | | | | | |
| | | | | | | | | | | | | | |
F-40
EPIQ SYSTEMS, INC.
NOTES TO CONSOLIDATED FINANCIAL STATEMENTS (Continued)
DECEMBER 31, 2014, 2013 AND 2012
NOTE 14: SEGMENT REPORTING (Continued)
| |
Year Ended December 31, 2012 | ||||||||||||
|---|---|---|---|---|---|---|---|---|---|---|---|---|---|
| |
Technology | Bankruptcy and Settlement Administration |
Eliminations | Total | |||||||||
| |
(in thousands) |
||||||||||||
Operating revenues |
$ | 196,959 | $ | 147,791 | $ | — | $ | 344,750 | |||||
Intersegment revenue |
203 | — | (203 | ) | — | ||||||||
| | | | | | | | | | | | | | |
Operating revenues including intersegment revenue |
197,162 | 147,791 | (203 | ) | 344,750 | ||||||||
Reimbursable expenses |
1,546 | 26,789 | — | 28,335 | |||||||||
| | | | | | | | | | | | | | |
Total revenues |
198,708 | 174,580 | (203 | ) | 373,085 | ||||||||
Direct costs, selling, general and administrative expenses |
125,182 | 122,359 | (203 | ) | 247,338 | ||||||||
| | | | | | | | | | | | | | |
Segment performance measure |
$ | 73,526 | $ | 52,221 | $ | — | $ | 125,747 | |||||
| | | | | | | | | | | | | | |
| | | | | | | | | | | | | | |
| | | | | | | | | | | | | | |
Following is a reconciliation of our segment performance measure to consolidated income (loss) before income taxes:
| |
Year Ended December 31, | |||||||||
|---|---|---|---|---|---|---|---|---|---|---|
| |
2014 | 2013 | 2012 | |||||||
| |
(in thousands) |
|||||||||
Segment performance measure |
$ | 137,175 | $ | 138,409 | $ | 125,747 | ||||
Corporate and unallocated expenses |
(62,557 | ) | (47,587 | ) | (36,021 | ) | ||||
Share-based compensation expense |
(13,098 | ) | (10,008 | ) | (6,719 | ) | ||||
Depreciation and software and leasehold amortization |
(36,042 | ) | (30,971 | ) | (27,399 | ) | ||||
Amortization of identifiable intangible assets |
(12,655 | ) | (18,834 | ) | (26,588 | ) | ||||
Fair value adjustment to contingent consideration |
(1,142 | ) | (2,580 | ) | 17,188 | |||||
Intangible asset impairment expense |
— | — | (1,777 | ) | ||||||
Other operating income (expense) |
(880 | ) | 791 | 220 | ||||||
| | | | | | | | | | | |
Consolidated income from operations |
10,801 | 29,220 | 44,651 | |||||||
Interest expense, net |
(16,653 | ) | (12,115 | ) | (9,245 | ) | ||||
| | | | | | | | | | | |
Income (loss) before income taxes |
$ | (5,852 | ) | $ | 17,105 | $ | 35,406 | |||
| | | | | | | | | | | |
| | | | | | | | | | | |
| | | | | | | | | | | |
Following are assets by segment:
| |
December 31, 2014 |
December 31, 2013 |
|||||
|---|---|---|---|---|---|---|---|
| |
(in thousands) |
||||||
Assets |
|||||||
Technology |
$ | 342,596 | $ | 369,135 | |||
Bankruptcy and Settlement Administration |
286,889 | 281,073 | |||||
Corporate and unallocated |
108,767 | 97,573 | |||||
| | | | | | | | |
Total assets |
$ | 738,252 | $ | 747,781 | |||
| | | | | | | | |
| | | | | | | | |
| | | | | | | | |
F-41
EPIQ SYSTEMS, INC.
NOTES TO CONSOLIDATED FINANCIAL STATEMENTS (Continued)
DECEMBER 31, 2014, 2013 AND 2012
NOTE 14: SEGMENT REPORTING (Continued)
Following are capital expenditures (including software development costs) by segment:
| |
Year Ended December 31, | |||||||||
|---|---|---|---|---|---|---|---|---|---|---|
| |
2014 | 2013 | 2012 | |||||||
| |
(in thousands) |
|||||||||
Capital Expenditures |
||||||||||
Technology |
$ | 15,477 | $ | 22,234 | $ | 14,153 | ||||
Bankruptcy and Settlement Administration |
2,596 | 3,161 | 4,010 | |||||||
Corporate and unallocated |
17,966 | 15,312 | 4,391 | |||||||
| | | | | | | | | | | |
Total capital expenditures |
$ | 36,039 | $ | 40,707 | $ | 22,554 | ||||
| | | | | | | | | | | |
| | | | | | | | | | | |
| | | | | | | | | | | |
Following is revenue, determined by the location providing the services, by geographical area:
| |
Year Ended December 31, | |||||||||
|---|---|---|---|---|---|---|---|---|---|---|
| |
2014 | 2013 | 2012 | |||||||
| |
(in thousands) |
|||||||||
Revenue |
||||||||||
United States |
$ | 410,768 | $ | 431,615 | $ | 346,454 | ||||
United Kingdom |
49,710 | 45,962 | 23,356 | |||||||
Other countries |
13,992 | 4,506 | 3,275 | |||||||
| | | | | | | | | | | |
Total revenue |
$ | 474,470 | $ | 482,083 | $ | 373,085 | ||||
| | | | | | | | | | | |
| | | | | | | | | | | |
| | | | | | | | | | | |
Following are long-lived assets, excluding intangible assets, by geographical area:
| |
Year Ended December 31, |
||||||
|---|---|---|---|---|---|---|---|
| |
2014 | 2013 | |||||
| |
(in thousands) |
||||||
Long-lived assets |
|||||||
United States |
$ | 78,921 | $ | 84,384 | |||
Other countries |
6,371 | 3,935 | |||||
| | | | | | | | |
Total long-lived assets |
$ | 85,292 | $ | 88,319 | |||
| | | | | | | | |
| | | | | | | | |
| | | | | | | | |
Significant Customer and Concentration of Credit Risk
For the years ended December 31, 2014, 2013 and 2012, we had no customers which accounted for more than 10% of our consolidated revenue or consolidated accounts receivable as of December 31, 2014 and 2013.
NOTE 15: LEGAL PROCEEDINGS
We are at times involved in litigation and other legal claims in the ordinary course of business. When appropriate in management's estimation, we may record reserves in our financial statements for pending litigation and other claims. Although it is not possible to predict with certainty the outcome of
F-42
EPIQ SYSTEMS, INC.
NOTES TO CONSOLIDATED FINANCIAL STATEMENTS (Continued)
DECEMBER 31, 2014, 2013 AND 2012
NOTE 15: LEGAL PROCEEDINGS (Continued)
litigation, we do not believe that any of the current pending legal proceedings to which we are a party will have a material impact on our results of operations, financial condition or cash flows.
NOTE 16: RELATED PARTY TRANSACTIONS
On November 1, 2014, we entered into a Director Appointment Agreement (the "Agreement") with St. Denis J. Villere & Company, L.L.C. ("Villere"), a beneficial shareholder of Company and Kevin L. Robert. As a result, we created a new directorship and appointed Mr. Robert as a new independent director to the board of directors of the Company, effective November 3, 2014, with a term expiring at our Annual Meeting of shareholders held in the year 2015. The Company has agreed to reimburse Villere's documented out-of-pocket expenses in connection with the nomination of Mr. Robert incurred prior to the execution of the Agreement up to an aggregate of $300,000.
Scott W. Olofson, the son of Tom W. Olofson, is the Company's Senior Vice-President, Corporate Relations and Business Development. The compensation committee of the Board approves all salary, bonus, equity incentive awards and perquisites for Scott W. Olofson. For 2014, Scott W. Olofson's compensation was $0.9 million. In February 2015, Scott W. Olofson was appointed head of the Company's corporate restructuring group.
NOTE 17: SUPPLEMENTAL QUARTERLY FINANCIAL DATA (Unaudited)
The following table sets forth the quarterly financial data for the quarters of the years ended December 31, 2014 and 2013.
| |
First | Second | Third | Fourth | Total | |||||||||||
|---|---|---|---|---|---|---|---|---|---|---|---|---|---|---|---|---|
| |
(in thousands, except per share data) |
|
||||||||||||||
Year ended December 31, 2014 |
||||||||||||||||
Operating revenue |
$ | 116,220 | $ | 115,451 | $ | 103,955 | $ | 108,492 | $ | 444,118 | ||||||
Total revenue |
$ | 123,271 | $ | 125,056 | $ | 111,006 | $ | 115,137 | $ | 474,470 | ||||||
Gross profit(1) |
$ | 53,240 | $ | 51,970 | $ | 49,725 | $ | 50,546 | $ | 205,481 | ||||||
Net income (loss) |
$ | (2,298 | ) | $ | (3,419 | ) | $ | 5,010 | $ | (630 | ) | $ | (1,337 | ) | ||
Net income (loss) per share—Basic(2) |
$ | (0.07 | ) | $ | (0.10 | ) | $ | 0.14 | $ | (0.02 | ) | $ | (0.04 | ) | ||
Net income (loss) per share—Diluted(2) |
$ | (0.07 | ) | $ | (0.10 | ) | $ | 0.14 | $ | (0.02 | ) | $ | (0.04 | ) | ||
Year ended December 31, 2013 |
||||||||||||||||
Operating revenue |
$ | 102,908 | $ | 104,976 | $ | 109,837 | $ | 120,969 | $ | 438,690 | ||||||
Total revenue |
$ | 123,590 | $ | 113,372 | $ | 115,684 | $ | 129,437 | $ | 482,083 | ||||||
Gross profit(1) |
$ | 47,743 | $ | 51,933 | $ | 53,958 | $ | 60,208 | $ | 213,842 | ||||||
Net income |
$ | 3,937 | $ | 2,842 | $ | 4,235 | $ | 96 | $ | 11,110 | ||||||
Net income per share—Basic(2) |
$ | 0.11 | $ | 0.08 | $ | 0.12 | $ | 0.00 | $ | 0.31 | ||||||
Net income per share—Diluted(2) |
$ | 0.11 | $ | 0.08 | $ | 0.11 | $ | 0.00 | $ | 0.30 | ||||||
- (1)
- Gross
profit is calculated as total revenue less direct cost of operating revenue, reimbursed direct costs, and the portion of depreciation
and software amortization attributable to direct costs of services.
- (2)
- The sum of the quarters' net income per share may not equal the total of the respective year's net income per share as each quarter is calculated independently.
F-43
EPIQ SYSTEMS, INC.
VALUATION AND QUALIFYING ACCOUNTS
| |
|
Additions | |
|
||||||||||||
|---|---|---|---|---|---|---|---|---|---|---|---|---|---|---|---|---|
Description
|
Balance at beginning of year |
Charged to costs and expenses |
Charged to other accounts |
Deductions from reserves |
Balance at end of year |
|||||||||||
Allowance for doubtful receivables: |
||||||||||||||||
For the year ended December 31, 2014 |
$ |
4,379 |
$ |
3,552 |
$ |
— |
$ |
(3,945 |
) |
$ |
3,986 |
|||||
For the year ended December 31, 2013 |
$ |
4,825 |
$ |
2,411 |
$ |
— |
$ |
(2,857 |
) |
$ |
4,379 |
|||||
For the year ended December 31, 2012 |
$ |
4,514 |
$ |
2,223 |
$ |
— |
$ |
(1,912 |
) |
$ |
4,825 |
|||||
| |
|
Additions | |
|
||||||||||||
|---|---|---|---|---|---|---|---|---|---|---|---|---|---|---|---|---|
Description
|
Balance at beginning of year |
Charged to costs and expenses |
Charged to other accounts |
Deductions from reserves |
Balance at end of year |
|||||||||||
Deferred tax valuation allowance: |
||||||||||||||||
For the year ended December 31, 2014 |
$ |
808 |
$ |
1,127 |
$ |
— |
$ |
(32 |
) |
$ |
1,903 |
|||||
For the year ended December 31, 2013 |
$ |
101 |
$ |
776 |
$ |
— |
$ |
(69 |
) |
$ |
808 |
|||||
For the year ended December 31, 2012 |
$ |
172 |
$ |
— |
$ |
— |
$ |
(71 |
) |
$ |
101 |
|||||
The following exhibits are filed with this Form 10-K or are incorporated herein by reference:
| Exhibit Number |
Description | ||
|---|---|---|---|
| 2.1 | Stock Purchase Agreement, dated April 4, 2011, by and among the Company, Epiq Systems Holding Company, ELS Holdings LLC and Encore Intermediate Holdco, Inc. Incorporated by reference and previously filed as Exhibit 2.1 to the registrant's (File No. 000-22081) (the "Registrant") current report on Form 8-K, filed with the Securities and Exchange Commission on April 4, 2011. | ||
2.2 |
Membership Interest Purchase Agreement, dated December 28, 2011, by and among Epiq Systems Holding Company, Epiq Systems, Inc. (for the limited purposes as set forth therein), De Novo Legal LLC, and the Sellers, Seller Guarantors, and the Seller Representative, each as defined therein. Incorporated by reference and previously filed as Exhibit 2.1 to the Registrant's current report on Form 8-K, filed with the Securities and Exchange Commission on December 29, 2011. |
||
3.1 |
Articles of Incorporation, as amended through February 28, 2008. Incorporated by reference and previously filed as Exhibit 3.1 to the Registrant's annual report on Form 10-K for the year ended December 31, 2007, filed with the Securities and Exchange Commission on March 4, 2008. |
||
3.2 |
Amended and Restated Bylaws of Epiq Systems, Inc. Incorporated by reference and previously filed as Exhibit 3.1 to the Registrant's current report on Form 8-K with the Securities and Exchange Commission on October 9, 2014. |
||
3.3 |
Form of Certificate of Designation of Participating Preferred Stock, Series A, of Epiq Systems, Inc. Incorporated by reference and previously filed as Exhibit 3.1 to the Registrant's Current Report on Form 8-K with the Securities and Exchange Commission on September 19, 2014. |
||
3.4 |
Statement of Correction for Certificate of Designation. Incorporated by reference and previously filed as Exhibit 3.2 to the Registrant's quarterly report on Form 10-Q with the Securities and Exchange Commission on October 28, 2014. |
||
4.1 |
Rights Agreement, dated September 18, 2014, between Epiq Systems, Inc. and Wells Fargo Bank, National Association, with Exhibits A, B and C thereto. Incorporated by reference and previously filed as Exhibit 4.1 to the Registrant's Current Report on Form 8-K with the Securities and Exchange Commission on September 19, 2014. |
||
4.2 |
Director Appointment Agreement, dated as of November 1, 2014, by and among Epiq Systems, Inc., St. Denis J. Villere & Company, L.L.C. and Kevin L. Robert. Incorporated by reference and previously filed as Exhibit 10.1 to the Registrant's current report on Form 8-K with the Securities and Exchange Commission on November 4, 2014. |
||
10.1 |
1995 Stock Option Plan, as amended. Incorporated by reference and previously filed as Exhibit 10.1 to the Registrant's current report on Form 8-K filed with the Securities and Exchange Commission on June 4, 2010. |
||
10.2 |
2004 Equity Incentive Plan, as amended and restated effective January 1, 2014. Incorporated by reference and previously filed as Exhibit 10.1 to the Registrant's current report on Form 8-K with the Securities and Exchange Commission on June 12, 2014. |
||
10.3 |
Form of Non-qualified Stock Option Agreement under the 2004 Equity Incentive Plan. Incorporated by reference and previously filed as Exhibit 10.15 to the Registrant's annual report on Form 10-K for the year ended December 31, 2005, filed with the Securities and Exchange Commission on March 8, 2006. |
||
| Exhibit Number |
Description | ||
|---|---|---|---|
| 10.4 | Letter Agreement dated February 7, 2006, between Epiq Systems, Inc. and Bank of America, N.A. (portions of this exhibit have been omitted pursuant to grant of confidential treatment pursuant to Rule 24b-2 under the Securities Exchange Act of 1934). Incorporated by reference and previously filed as Exhibit 10.13 to the Registrant's annual report on Form 10-K for the year ended December 31, 2006, filed with the Securities and Exchange Commission on March 9, 2007. | ||
10.5 |
The Qualified Executive Performance Plan, dated as of March 29, 2007. Incorporated by reference and previously filed as Exhibit 10.1 to the Registrant's current report on Form 8-K filed with the Securities and Exchange Commission on April 4, 2007. |
||
10.6 |
The Strategic Executive Incentive Plan, dated as of March 29, 2007. Incorporated by reference and previously filed as Exhibit 10.2 to the Registrant's current report on Form 8-K filed with the Securities and Exchange Commission on April 4, 2007. |
||
10.7 |
Form of Subscription Agreement dated as of November 15, 2007, between Epiq Systems, Inc. and the purchasers named therein. Incorporated by reference and previously filed as Exhibit 10.1 to the Registrant's current report on Form 8-K filed with the Securities and Exchange Commission on November 16, 2007. |
||
10.8 |
Form of Restricted Stock Award Agreement under the 2004 Equity Incentive Plan. Incorporated by reference and previously filed as Exhibit 10.1 to the Registrant's current report on Form 8-K filed with the Securities and Exchange Commission on February 27, 2009. |
||
10.9 |
Credit Agreement, dated as of August 27, 2013, among Epiq Systems, Inc. and the domestic subsidiaries named therein as guarantors, a syndicate of banks and institutional investors as lenders, KeyBank National Association as the LC issuer, swing line lender and administrative agent. Incorporated by reference and previously filed as Exhibit 10.1 to the Registrant's current report on Form 8-K, filed with the Securities and Exchange Commission on August 30, 2013. |
||
10.10 |
Executive Resignation Agreement and General Release of Claims, dated March 14, 2014, among Epiq Systems, Inc. and Elizabeth M. Braham. Incorporated by reference and previously filed as Exhibit 10.1 to the Registrant's quarterly report on Form 10-Q/A, filed with the Securities and Exchange Commission on June 13, 2014. |
||
10.11 |
Executive Consulting Advisory Agreement, dated March 14, 2014, among Epiq Systems, Inc. and Elizabeth M. Braham. Incorporated by reference and previously filed as Exhibit 10.2 to the Registrant's quarterly report on Form 10-Q/A, filed with the Securities and Exchange Commission on June 13, 2014. |
||
10.12 |
First Amendment, dated March 26, 2014, to the Credit Agreement dated as of August 27, 2013, among Epiq Systems, Inc. and the domestic subsidiaries named therein as guarantors, a syndicate of banks and institutional investors as lenders, KeyBank National Association as the LC issuer, swing line lender, administrative agent. Incorporated by reference and previously filed as Exhibit 10.1 to the Registrant's current report on Form 8-K, filed with the Securities and Exchange Commission on March 27, 2014. |
||
10.13 |
Executive Resignation Agreement and General Release of Claims dated June 6, 2014, among Epiq Systems, Inc. and Christopher E. Olofson and is filed herewith. Incorporated by reference and previously filed as Exhibit 10.5 to the Registrant's quarterly report on Form 10-Q/A with the Securities and Exchange Commission on August 15, 2014. |
||
| Exhibit Number |
Description | ||
|---|---|---|---|
| 10.14 | Executive Consulting Advisory Agreement, dated June 6, 2014, among Epiq Systems, Inc. and Christopher E. Olofson and is filed herewith. Incorporated by reference and previously filed as Exhibit 10.6 to the Registrant's quarterly report on Form 10-Q/A with the Securities and Exchange Commission on August 15, 2014. | ||
10.15 |
Executive Employment Agreement, dated December 15, 2014 among Epiq Systems, Inc. and Tom W. Olofson. Incorporated by reference and previously filed as Exhibit 10.1 to the Registrant's current report on Form 8-K with the Securities and Exchange Commission on December 19, 2014. |
||
10.16 |
Executive Employment Agreement, dated December 15, 2014 among Epiq Systems, Inc. and Brad D. Scott. Incorporated by reference and previously filed as Exhibit 10.3 to the Registrant's current report on Form 8-K with the Securities and Exchange Commission on December 19, 2014. |
||
10.17 |
Karin-Joyce Tjon Employment Offer letter, dated June 17, 2014 among Epiq Systems, Inc. and Karin-Joyce Tjon. Incorporated by reference and previously filed as Exhibit 10.1 to the Registrant's current report on Form 8-K with the Securities and Exchange Commission on June 20, 2014. |
||
10.18 |
Amended and Restated Executive Employment Agreement, dated December 15, 2014 among Epiq Systems, Inc. and Karin-Joyce Tjon Sien Fat. Incorporated by reference and previously filed as Exhibit 10.2 to the Registrant's current report on Form 8-K with the Securities and Exchange Commission on December 19, 2014. |
||
10.19 |
Second Amendment, dated January 26, 2015, to the Credit Agreement dated as of August 27, 2013 (as amended by that certain First Amendment to Credit Agreement dated as of March 26, 2014), among Epiq Systems, Inc., the domestic subsidiaries named therein as guarantors, the lenders party thereto, and KeyBank National Association as administrative agent. Incorporated by reference and previously filed as Exhibit 10.1 to the Registrant's current report on Form 8-K, filed with the Securities and Exchange Commission on January 27, 2015. |
||
21.1 |
List of Subsidiaries.* |
||
23.1 |
Consent of Deloitte & Touche LLP, Independent Registered Public Accounting Firm.* |
||
31.1 |
Certifications of Chief Executive Officer of the Company under Rule 13a-14(a) of the Securities Exchange Act of 1934, as amended, as adopted pursuant to Section 302 of the Sarbanes-Oxley Act of 2002.* |
||
31.2 |
Certifications of Chief Financial Officer of the Company under Rule 13a-14(a) of the Securities Exchange Act of 1934, as amended, as adopted pursuant to Section 302 of the Sarbanes-Oxley Act of 2002.* |
||
32.1 |
Certifications of Chief Executive Officer and Chief Financial Officer pursuant to 18 U.S.C. Section 1350, as adopted pursuant to Section 906 of the Sarbanes-Oxley Act of 2002. This certification accompanies this report and shall not, except to the extent required by the Sarbanes-Oxley Act of 2002, be deemed filed for purposes of §18 of the Securities Exchange Act of 1934, as amended.** |
||
101.INS† |
XBRL Instance Document. |
||
101.SCH† |
XBRL Taxonomy Extension Schema Document. |
||
101.CAL† |
XBRL Taxonomy Extension Calculation Linkbase Document. |
||
101.DEF† |
XBRL Taxonomy Definition Linkbase Document. |
||
101.LAB† |
XBRL Taxonomy Extension Label Linkbase Document. |
||
| Exhibit Number |
Description | ||
|---|---|---|---|
| 101.PRE† | XBRL Taxonomy Extension Presentation Linkbase Document. | ||
- *
- Filed
herewith.
- **
- Furnished
herewith.
- †
- Attached as Exhibit 101 to this report are the following documents formatted in XBRL (Extensible Business Reporting Language). (i) Consolidated Statements of Income (Loss) for the years ended December 31, 2014, 2013, and 2012 (ii) Consolidated Statements of Comprehensive Income (Loss) for the years ended December 31, 2014, 2013 and 2012 (iii) Consolidated Balance Sheets as of December 31, 2014 and December 31, 2013, (iv) Consolidated Statements of Cash Flows for the years ended December 31, 2014, 2013, and 2012, and (v) Notes to Consolidated Financial Statements.