Attached files
| file | filename |
|---|---|
| EX-32 - EXHIBIT 32 - AMERICAN CAPITAL, LTD | acas10k123114ex32.htm |
| EX-24 - EXHIBIT 24 - AMERICAN CAPITAL, LTD | acas10k123114ex24.htm |
| EX-23.3 - EXHIBIT 23.3 - AMERICAN CAPITAL, LTD | acas10k123114ex233.htm |
| EX-23.2 - EXHIBIT 23.2 - AMERICAN CAPITAL, LTD | acas10k123114ex232.htm |
| EX-12.1 - EXHIBIT 12.1 - AMERICAN CAPITAL, LTD | acas10k123114ex121.htm |
| EX-99.2 - EXHIBIT 99.2 - AMERICAN CAPITAL, LTD | acas10k123114ex992.htm |
| EX-99.1 - EXHIBIT 99.1 - AMERICAN CAPITAL, LTD | acas10k123114ex991.htm |
| EX-23.1 - EXHIBIT 23.1 - AMERICAN CAPITAL, LTD | acas10k123114ex231.htm |
| EX-31.2 - EXHIBIT 31.2 - AMERICAN CAPITAL, LTD | acas10k123114ex312.htm |
| EX-31.1 - EXHIBIT 31.1 - AMERICAN CAPITAL, LTD | acas10k123114ex311.htm |
| EX-10.12 - EXHIBIT 10.12 - AMERICAN CAPITAL, LTD | acas10k123114ex1012.htm |
| EX-10.14 - EXHIBIT 10.14 - AMERICAN CAPITAL, LTD | acas10k123114ex1014.htm |
| EX-10.13 - EXHIBIT 10.13 - AMERICAN CAPITAL, LTD | acas10k123114ex1013.htm |
| EX-10.11 - EXHIBIT 10.11 - AMERICAN CAPITAL, LTD | acas10k123114ex1011.htm |
UNITED STATES
SECURITIES AND EXCHANGE COMMISSION
Washington, D.C. 20549
FORM 10-K
(Mark One)
x | ANNUAL REPORT PURSUANT TO SECTION 13 OR 15(D) OF THE SECURITIES EXCHANGE ACT OF 1934 | |
For the fiscal year ended December 31, 2014
OR
o | TRANSITION REPORT PURSUANT TO SECTION 13 OR 15(D) OF THE SECURITIES EXCHANGE ACT OF 1934 | |
Commission file number 814-00149

AMERICAN CAPITAL, LTD.
(Exact name of registrant as specified in its charter)
Delaware | 52-1451377 | |
(State or Other Jurisdiction of Incorporation or Organization) | (I.R.S. Employer Identification No.) | |
2 Bethesda Metro Center
14th Floor
Bethesda, Maryland 20814
(Address of principal executive offices)
(301) 951-6122
(Registrant’s telephone number, including area code)
Securities registered pursuant to Section 12(b) of the Act:
Title of each class | Name of each exchange on which registered | |
Common Stock, $0.01 par value per share | The NASDAQ Stock Market LLC (NASDAQ Global Select Market) | |
Securities registered pursuant to section 12(g) of the Act: NONE
Indicate by check mark if the registrant is a well-known seasoned issuer, as defined in Rule 405 of the Securities Act. Yes o No x.
Indicate by check mark if the registrant is not required to file reports pursuant to Section 13 or 15(d) of the Act. Yes o No x.
Indicate by check mark whether the registrant (1) has filed all reports required to be filed by Section 13 or 15(d) of the Securities Exchange Act of 1934 during the preceding 12 months (or for such shorter period that the registrant was required to file such reports), and (2) has been subject to such filing requirements for the past 90 days. Yes x No o
Indicate by check mark whether the registrant has submitted electronically and posted on its corporate Web site, if any, every Interactive Data File required to be submitted and posted pursuant to Rule 405 of Regulation S-T (§232.405 of this chapter) during the preceding 12 months (or for such shorter period that the registrant was required to submit and post such files). Yes o No o
Indicate by check mark if disclosure of delinquent filers pursuant to Item 405 of Regulation S-K is not contained herein, and will not be contained, to the best of registrant’s knowledge, in definitive proxy or information statements incorporated by reference in Part III of this Form 10-K or any amendment to this Form 10-K. o
Indicate by check mark whether the registrant is a large accelerated filer, an accelerated filer, a non-accelerated filer, or a smaller reporting company. See definition of “large accelerated filer,” “accelerated filer” and “smaller reporting company” in Rule 12b-2 of the Act.
Large accelerated filer x | Accelerated filer o | |||
Non-accelerated filer o | (Do not check if a smaller reporting company) | Smaller Reporting Company o | ||
Indicate by check mark whether the registrant is a shell company (as defined in Rule 12b-2 of the Exchange Act). Yes o No. x
As of June 30, 2014, the aggregate market value of the Registrant’s common stock held by non-affiliates of the Registrant was approximately $4.0 billion based upon a closing price of the Registrant’s common stock of $15.29 per share as reported on The NASDAQ Global Select Market on that date. (For this computation, the registrant has excluded the market value of all shares of its common stock reported as beneficially owned by executive officers and directors of the registrant and certain other shareholders; such an exclusion shall not be deemed to constitute an admission that any such person is an “affiliate” of the registrant.)
As of February 2, 2015, there were 271,919,468 shares of the Registrant’s common stock legally outstanding.
DOCUMENTS INCORPORATED BY REFERENCE. The Registrant’s definitive proxy statement for the 2015 Annual Meeting of Stockholders is incorporated by reference into certain sections of Part III herein.
Certain exhibits previously filed with the Securities and Exchange Commission are incorporated by reference into Part IV of this report.
________________________________________________________________________________________________________________________
AMERICAN CAPITAL, LTD. TABLE OF CONTENTS | ||
PART I. FINANCIAL INFORMATION | ||
Item 1. | ||
Item 1A. | ||
Item 1B. | ||
Item 2. | ||
Item 3. | ||
Item 4. | ||
PART II. | ||
Item 5. | ||
Item 6. | ||
Item 7. | ||
Item 7A. | ||
Item 8. | ||
Item 9. | ||
Item 9A. | ||
Item 9B. | ||
PART III. | ||
Item 10. | ||
Item 11. | ||
Item 12. | ||
Item 13. | ||
Item 14. | ||
PART IV. | ||
Item 15. | ||
2
PART I.
Item 1. | Business |
General
American Capital, Ltd. (which is referred to throughout this report as “American Capital”, “we”, “our” and “us”) is a publicly traded global asset manager and private equity firm. American Capital, both directly and through its asset management business, originates, underwrites and manages investments in middle market private equity, leveraged finance, real estate, energy and structured products. It is our practice to sell some of the assets that we originate as an investor into funds that we manage. On August 29, 1997, we completed an initial public offering (“IPO”) and became a non-diversified closed end investment company that has elected to be regulated as a business development company (“BDC”) under the Investment Company Act of 1940, as amended (“1940 Act”). As a BDC, we primarily invest in senior and mezzanine debt and equity in buyouts of private companies sponsored by us (“American Capital One Stop Buyouts®”) or sponsored by other private equity funds and provide capital directly to early stage and mature private and small public companies (“Sponsor Finance Investments”). We also invest in first and second lien floating rate loans to large-market U.S. based companies (“Senior Floating Rate Loans” or “SFRL”) and structured finance investments (“Structured Products”), including collateralized loan obligation (“CLO”) securities, collateralized debt obligation (“CDO”) securities and commercial mortgages and commercial mortgage backed securities (“CMBS”). Our primary business objectives are to increase our net earnings and net asset value (“NAV”) by making investments with attractive current yields and/or potential for equity appreciation and realized gains and by growing our fee earning assets under management.
We manage $22 billion of assets, including assets on our balance sheet and fee earning assets under management by affiliated managers, with $86 billion of total assets under management (including levered assets). Our asset management business is conducted through our wholly-owned portfolio company, American Capital Asset Management, LLC (“ACAM”), a registered investment advisor under the Investment Advisors Act of 1940. ACAM manages the following funds:
• | American Capital Agency Corp. (“AGNC”) |
• | American Capital Mortgage Investment Corp. (“MTGE”) |
• | American Capital Senior Floating, Ltd. (“ACSF”) |
• | American Capital Equity I, LLC (“ACE I”) |
• | American Capital Equity II, LP (“ACE II”) |
• | American Capital Equity III, LP (“ACE III”) |
• | European Capital UK SME Debt Limited (“ECAS UK SME Debt”) |
• | ACAS CLO 2007-1, Ltd. (“ACAS CLO 2007-1”) |
• | ACAS CLO 2012-1, Ltd. (“ACAS CLO 2012-1”) |
• | ACAS CLO 2013-1, Ltd. (“ACAS CLO 2013-1”) |
• | ACAS CLO 2013-2, Ltd. (“ACAS CLO 2013-2”) |
• | ACAS CLO 2014-1, Ltd. (“ACAS CLO 2014-1”) |
• | ACAS CLO 2014-2, Ltd. (“ACAS CLO 2014-2”) |
We are taxed as a corporation and pay federal and applicable state corporate taxes on our taxable income. From 1997 through the tax year ended September 30, 2010, we were taxed as a regulated investment company (“RIC”), as defined in Subchapter M of the Internal Revenue Code of 1986, as amended (the “Code”). As a RIC, we were not subject to federal income tax on the portion of our taxable income and capital gains we distributed to our shareholders, but we were also not able to carry forward net operating losses (“NOL”) from year to year. Beginning with our tax year ended September 30, 2011, our status changed from a RIC subject to taxation under Subchapter M to a corporation subject to taxation under Subchapter C. Under Subchapter C, we are able to carry forward any NOLs historically incurred to succeeding years, which we would not be able to do if we were subject to taxation as a RIC under Subchapter M. This change in tax status does not affect our status as a BDC under the 1940 Act or our compliance with the portfolio composition requirements of that statute.
3
In October 2014, the Securities and Exchange Commission (“SEC”) Division of Investment Management issued SEC IM Guidance Update No. 2014-11, Investment Company Consolidation (“IM Update 2014-11”), which recommends that BDC’s consolidate wholly-owned subsidiaries when the intent of the subsidiary is to act as an extension of the BDC’s investment operations and to facilitate the execution of the BDC’s investment strategy. In October 2014, our Board of Directors approved the spin-off of two new publicly traded BDCs to our shareholders, separating the majority of our investment assets from our asset management business. The approval also marked a change in our intent with respect to European Capital Limited (“European Capital”), which we no longer consider a vehicle for third-party capital but rather is viewed as an extension of our investment operations. In accordance with IM Update 2014-11, European Capital’s financial results as of and for the three months ended December 31, 2014 have been consolidated with our financial results for the same periods.
Recent Developments
On November 5, 2014, we announced our intention to transfer most of our investment assets to two newly established BDCs and to distribute those BDCs to our shareholders, leaving the Company to operate primarily in the asset management business. We previously noted that we may need regulatory relief from the SEC to complete the transaction. We have now concluded that regulatory relief will not likely be needed. We will, however, still need to file proxy and registration statements with the SEC, which we expect to file in the third calendar quarter of 2015. These documents will be subject to review and comment by the SEC, which may affect the time frame in which the transaction can be completed. No assurance can be given as to if or when the transaction will be completed.
Investment Portfolio
As an investor, we primarily invest in senior and mezzanine debt and equity of middle and large market companies. We and ACAM also invest in assets that can be sold or contributed to public or private funds that ACAM could manage, as a means of “incubating” such funds. We also have investments in Structured Products and in funds managed by us.
Over the last three years, we have committed $5,436 million of capital to new investments, composed of $3,725 million of debt securities, $1,038 million of equity securities and $673 million of Structured Products investments. Of the $5,436 million of new investment commitments over the last three years, $1,891 million was committed to Senior Floating Rate Loans, $831 million was committed to new Sponsor Finance Investments, $328 million was committed to new American Capital One Stop Buyouts®, $591 million was committed to new Structured Products, $877 million was committed to add-on investments in our existing portfolio companies, $89 million was committed to European Capital’s investment portfolio and $829 million was committed to ACAM, primarily for fund development. Over the last three years, we received $5.5 billion of cash realizations, composed of $2.9 billion of debt realizations and $2.6 billion of equity realizations. In addition, over the last three years, our investment portfolio has generated operating revenue, net operating income before income taxes and net earnings of $1.6 billion, $798 million and $1.8 billion, respectively. Over the last three years, our weighted average net earnings return on shareholders’ equity was 11.0%.
Since our IPO, we have committed capital of $6.7 billion in equity securities, $21.2 billion in debt securities and $2.3 billion in Structured Products. Since our IPO, we have had over 420 exits and repayments of $23.0 billion, representing 76% of our total capital committed since our IPO, earning a 10% compounded annual return on these investments. Since our IPO, our weighted average net earnings return on shareholders’ equity was 4.7%.
Portfolio Composition
Our investments can be divided into the following six business lines: (i) American Capital One Stop Buyouts®, (ii) Sponsor Finance Investments, (iii) European Capital, (iv) American Capital Asset Management, (v) Structured Products and (vi) Senior Floating Rate Loans.
4
As of December 31, 2014, we had investments totaling $6.4 billion and $6.3 billion at cost basis and fair value, respectively. As of December 31, 2014, our ten largest investments had a cost basis and fair value totaling $1.8 billion and $2.4 billion, respectively, or 31% of total assets at fair value, and are as follows (in millions):
Company | Business Line | Industry | Cost Basis | Fair Value | ||||||||
American Capital Asset Management, LLC | American Capital Asset Management | Capital Markets | $ | 429 | $ | 1,164 | ||||||
CML Pharmaceuticals, Inc. | American Capital One Stop Buyouts® | Life Sciences Tools & Services | 458 | 290 | ||||||||
WRH, Inc.(1) | American Capital One Stop Buyouts® | Life Sciences Tools & Services | 346 | 189 | ||||||||
Bellotto Holdings Limited | European Capital | Household Durables | 135 | 140 | ||||||||
Soil Safe Acquisition Corp. | Sponsor Finance Investments | Professional Services | 112 | 113 | ||||||||
SEHAC Holding Corporation | American Capital One Stop Buyouts® | Diversified Consumer Services | 15 | 105 | ||||||||
Delsey Holdings S.A.S. | Sponsor Finance Investments and European Capital | Textiles, Apparel & Luxury Goods | 117 | 101 | ||||||||
WIS Holding Company, Inc. | American Capital One Stop Buyouts® | Commercial Services & Supplies | 69 | 100 | ||||||||
Orchard Brands Corporation | Sponsor Finance Investments | Internet & Catalog Retail | 55 | 88 | ||||||||
Convergint Technologies, LLC | Sponsor Finance Investments | Commercial Services & Supplies | 75 | 75 | ||||||||
Total | $ | 1,811 | $ | 2,365 | ||||||||
——————————
(1) | ACE III holds an option to acquire our equity investment in WRH, Inc. (fair value of $96.9 million as of December 31, 2014) for an exercise price of $24 million. The option expires on April 22, 2015. See Note 14 to our audited consolidated financial statements included in this Annual Report on Form 10-K. |
(2) | Unwired Holdings, Inc. was exited on October 13, 2014. |
The following tables show the composition of our investment portfolio by business line at cost basis and fair value, as a percentage of total investments, as of December 31, 2014 and 2013:
2014 | 2013 | ||||
Cost | |||||
American Capital One Stop Buyouts® | 26.9 | % | 50.4 | % | |
Sponsor Finance Investments | 17.2 | % | 17.1 | % | |
European Capital | 13.1 | % | 19.7 | % | |
American Capital Asset Management | 6.7 | % | 6.4 | % | |
Structured Products | 9.7 | % | 6.4 | % | |
Senior Floating Rate Loans | 26.4 | % | — | % | |
Total | 100.0 | % | 100.0 | % | |
Fair Value | |||||
American Capital One Stop Buyouts® | 19.3 | % | 45.0 | % | |
Sponsor Finance Investments | 17.3 | % | 15.8 | % | |
European Capital | 9.4 | % | 16.6 | % | |
American Capital Asset Management | 18.5 | % | 17.2 | % | |
Structured Products | 8.9 | % | 5.4 | % | |
Senior Floating Rate Loans | 26.6 | % | — | % | |
Total | 100.0 | % | 100.0 | % | |
5
The following tables show the composition summaries of our investment portfolio by security type at cost basis and fair value, excluding derivative agreements, as a percentage of total investments as of December 31, 2014 and 2013:
2014 | 2013 | ||||
Cost | |||||
First Lien Senior Debt | 40.5 | % | 7.0 | % | |
Second Lien Senior Debt | 11.2 | % | 12.9 | % | |
Mezzanine Debt | 10.0 | % | 10.6 | % | |
Preferred Equity | 13.4 | % | 24.5 | % | |
Common Equity | 15.0 | % | 38.6 | % | |
Structured Products | 9.9 | % | 6.4 | % | |
Total | 100.0 | % | 100.0 | % | |
Fair Value | |||||
First Lien Senior Debt | 40.0 | % | 7.0 | % | |
Second Lien Senior Debt | 10.9 | % | 13.9 | % | |
Mezzanine Debt | 7.5 | % | 10.3 | % | |
Preferred Equity | 7.4 | % | 22.2 | % | |
Common Equity | 24.9 | % | 41.2 | % | |
Structured Products | 9.3 | % | 5.4 | % | |
Total | 100.0 | % | 100.0 | % | |
6
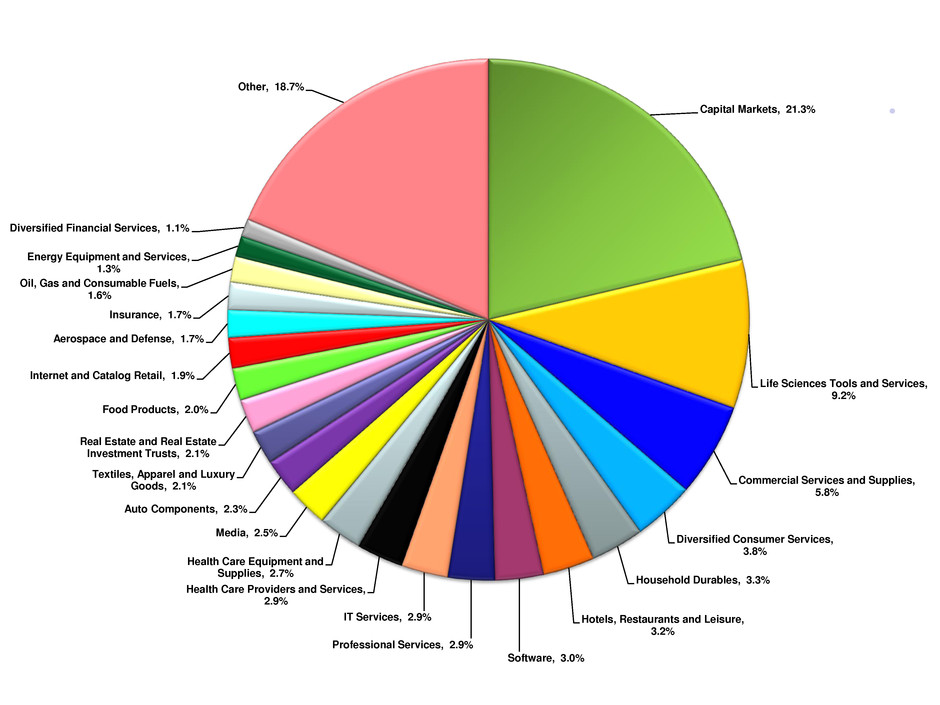
Our investments are primarily in portfolio companies located in the United States. We have a diversified investment portfolio and do not concentrate in any one or two industry sectors, apart from Asset Management. We use the Global Industry Classification Standards (“GICS®”) for classifying the industry groupings of our portfolio companies. The GICS® was developed by MSCI, an independent provider of global indexes and benchmark-related products and services, and Standard & Poor’s (“S&P”), an independent international financial data and investment services company and provider of global equity indexes. The following chart shows the portfolio composition by industry grouping at fair value as a percentage of total investments as of December 31, 2014. Our investments in CLO and CDO securities and derivative agreements are excluded from the table below. Our investments in CMBS are classified in the Real Estate and Real Estate Investment Trusts category below.
American Capital One Stop Buyouts®
In an American Capital One Stop Buyout®, we lend senior and mezzanine debt and make majority equity investments to finance our acquisition of an operating company through a change in control. A change in control transaction could be the result of a corporate divestiture, a sale by a private equity firm, a sale by a family-owned closely held business, going private transactions or ownership transitions. In addition, we may make additional add-on investments in our American Capital One Stop Buyouts® to finance strategic acquisitions, growth or for working capital.
Our ability to fund the entire capital structure is a competitive advantage in completing many middle market transactions. We sponsor American Capital One Stop Buyouts® in which we provide most, if not all, of the senior and mezzanine debt and equity financing in the transaction. For our American Capital One Stop Buyouts®, we typically fund all of the senior debt at closing and syndicate the senior debt at or subsequent to closing, but only to the extent the senior lender will allow for the payment of cash dividends. If the senior lender is unwilling, we will hold the senior debt of these controlled portfolio companies which will allow for the payment of cash dividends to their shareholders, including us. We will generally invest up to $600 million in a single American Capital One Stop Buyout®.
As of December 31, 2014, there were 26 companies in our American Capital One Stop Buyouts® portfolio with a cost basis and fair value of $1,727 million and $1,213 million, respectively, with an average investment size of $47 million at fair value. As
7
of December 31, 2014, our American Capital One Stop Buyouts® portfolio consisted of $742 million and $472 million of debt and equity investments at fair value, respectively. As of December 31, 2014, the weighted average effective interest rate on the debt investments in this portfolio was 9.5%, which includes the impact of non-accruing loans, and our fully-diluted weighted average ownership interest in the equity investments in this portfolio was 71%. During the year ended December 31, 2014, we recognized operating revenues from our American Capital One Stop Buyouts® portfolio totaling $194 million.
As a BDC, we are required by law to make significant managerial assistance available to most of our portfolio companies. Such assistance typically involves providing guidance and counsel concerning the management, operations and business objectives and policies of the portfolio company to its management and board of directors, including participating on the company’s board of directors. We have an operations team with significant turnaround and bankruptcy experience that assists our investment professionals in providing intensive operational and managerial assistance to our portfolio companies. As of December 31, 2014, we had board seats at 24 companies in our American Capital One Stop Buyouts® and had board observation rights at certain other companies. Providing assistance to the companies in our investment portfolio serves as an opportunity for us to maximize their value.
Sponsor Finance Investments
The majority of the investments in our Sponsor Finance Investment portfolio were originated either to assist in the funding of change of control buyouts of privately-held middle and large market companies sponsored by other private equity firms or to support the growth or recapitalization of an existing portfolio company. In these transactions, we generally lend senior, mezzanine and unitranche debt and make minority equity co-investments. We will generally invest between $10 million and $150 million in a single Sponsor Finance Investment transaction. Generally, we make investments in companies that have a minimum earnings before interest, taxes, depreciation and amortization (“EBITDA”) of $10 million.
Our senior loans may consist of first lien secured revolving credit facilities, first and second lien secured term loans and unitranche loans. Our mezzanine loans may consist of secured and unsecured loans. Our loans typically mature in five to ten years and require monthly or quarterly interest payments at fixed rates or variable rates generally based on London Interbank Offered Rate (“LIBOR”), plus a margin. Certain of our loans permit the interest to be paid-in-kind by adding it to the outstanding loan balance and paid at maturity.
As of December 31, 2014, there were 51 companies in our Sponsor Finance Investment portfolio with a cost basis and fair value of $1,106 million and $1,088 million, respectively, with an average investment size of $21 million at fair value. As of December 31, 2014, our Sponsor Finance Investment portfolio consisted of $870 million and $218 million of debt and equity investments at fair value, respectively. As of December 31, 2014, the weighted average effective interest rate on the debt investments in this portfolio was 9.0%, which includes the impact of non-accruing loans, and our fully-diluted weighted average ownership interest in the equity investments in this portfolio was 40%. During the year ended December 31, 2014, we recognized operating revenues from our Sponsor Finance Investment portfolio totaling $56 million.
American Capital Asset Management Investment
Our fund management business is conducted through our wholly-owned portfolio company, ACAM, and its consolidated subsidiaries. In general, subsidiaries of ACAM enter into management agreements with each of its managed funds. As of December 31, 2014, the cost basis and fair value of our investment in ACAM was $429 million and $1,164 million, respectively, or 19% of our total investments at fair value. As of December 31, 2014, ACAM’s earning assets under management totaled $14.5 billion. As of December 31, 2014, ACAM had $79 billion of total assets under management (including levered assets), including $68 billion of total assets under management for American Capital Agency Corp. (NASDAQ: AGNC) and $7 billion of total assets under management for American Capital Mortgage Investment Corp. (NASDAQ: MTGE), which are publicly traded mortgage real estate investment trusts (“REITs”) and $0.3 billion of total assets under management for American Capital Senior Floating, Ltd. (NASDAQ: ACSF).
ACAM had over 130 employees as of December 31, 2014, including ten Investment Teams with over 70 investment professionals located in Bethesda (Maryland), New York, Annapolis (Maryland), London and Paris. We have entered into service agreements with ACAM to provide it with additional asset management and administrative services support. Through these agreements, we provide investment advisory and oversight services to ACAM, as well as access to our employees, infrastructure, business relationships, management expertise and capital raising capabilities. During the year ended December 31, 2014, American Capital earned $27 million from ACAM for these services. ACAM generally earns base management fees based on the shareholders’ equity or the net cost basis of the assets of the funds under management and may earn incentive income, or a carried interest, based on the performance of the funds. In addition, American Capital or ACAM may invest directly into these funds and earn investment income from its investments in those funds.
8
The following table sets forth certain information with respect to ACAM’s funds under management as of December 31, 2014:
Fund | Fund Type | Established | Assets Under Management | Investment Types | Capital Type | |||||
AGNC | Publicly Traded REIT - NASDAQ (AGNC) | 2008 | $67.8 Billion | Agency Securities | Permanent | |||||
MTGE | Publicly Traded REIT - NASDAQ (MTGE) | 2011 | $7.0 Billion | Mortgage Investments | Permanent | |||||
ACSF | Publicly Traded BDC - NASDAQ (ACSF) | 2014 | $282 Million | Senior Floating Rate Loans | Permanent | |||||
ACE I | Private Equity Fund | 2006 | $424 Million | Equity | Finite Life | |||||
ACE II | Private Equity Fund | 2007 | $190 Million | Equity | Finite Life | |||||
ACE III | Private Equity Fund | 2014 | $730 Million | Equity | Finite Life | |||||
ECAS UK SME Debt | Private Equity Fund | 2014 | $0 Million(1) | Senior and Mezzanine Debt | Finite Life | |||||
ACAS CLO 2007-1 | CLO | 2006 | $335 Million | Senior Debt | Finite Life | |||||
ACAS CLO 2012-1 | CLO | 2012 | $352 Million | Senior Debt | Finite Life | |||||
ACAS CLO 2013-1 | CLO | 2013 | $403 Million | Senior Debt | Finite Life | |||||
ACAS CLO 2013-2 | CLO | 2013 | $401 Million | Senior Debt | Finite Life | |||||
ACAS CLO 2014-1 | CLO | 2014 | $600 Million | Senior Debt | Finite Life | |||||
ACAS CLO 2014-2 | CLO | 2014 | $400 Million | Senior Debt | Finite Life | |||||
——————————
(1) | $165 million in committed capital in ECAS UK SME Debt fund, which remains unfunded as of December 31, 2014. |
AGNC is a publicly traded REIT, which invests on a leveraged basis primarily in residential mortgage pass-through securities and collateralized mortgage obligations, for which the interest and principal payments are guaranteed by a U.S. government agency or U.S. government-sponsored entity. Its shares are traded on The NASDAQ Global Select Market under the symbol “AGNC.” ACAM earns a base management fee of 1.25% of AGNC’s shareholders’ equity, as defined in the management agreement. The management contract is renewable annually and if AGNC were not to renew the management agreement without cause, it would have to pay a termination fee equal to three times the average annual management fee earned by ACAM during the 24-month period immediately preceding the most recently completed month prior to the effective date of termination. If the termination fee were calculated for the period ending December 31, 2014, it would have been $381 million. As of December 31, 2014, AGNC’s total shareholders’ equity was $9.4 billion.
MTGE is also a publicly traded REIT, which invests in and manages a leveraged portfolio of agency mortgage investments, non-agency mortgage investments and other mortgage-related investments. Its shares are traded on The NASDAQ Global Select Market under the symbol “MTGE.” ACAM earns a base management fee of 1.50% of MTGE’s shareholders’ equity, as defined in the management agreement. The management contract is renewable annually and if MTGE were not to renew the management agreement without cause, it would have to pay a termination fee equal to three times the average annual management fee earned by ACAM during the 24-month period immediately preceding the most recently completed month prior to the effective date of termination. If the termination fee were calculated for the period ending December 31, 2014, it would have been $54 million. As of December 31, 2014, MTGE’s total shareholders’ equity was $1.2 billion.
ACSF is a BDC that invests primarily in first and second lien floating rate loans to large market, U.S. based companies and invests opportunistically in equity tranches of CLOs collateralized primarily by Senior Floating Rate Loans. On January 15, 2014, ACSF successfully completed its IPO of ten million shares of common stock for proceeds of $150 million. Its shares are traded on The NASDAQ Global Select Market under the symbol “ACSF.” ACAM earns a base management fee of 0.80% of ACSF’s assets, as defined in ACSF’s management agreement. For the first full 24 months after the date of ACSF’s IPO, ACAM has agreed to be responsible for certain of ACSF’s operating expenses in excess of 0.75% of their consolidated net assets, less net unrealized appreciation or depreciation, each as determined in accordance with accounting principles generally accepted in the United States (“U.S. GAAP”) at the end of the most recently completed fiscal quarter. In addition, ACAM also purchased 3% of the common stock of ACSF for $4.5 million.
ACE I is a private equity fund, which was established in 2006 with $1 billion of equity commitments from third-party investors. At the closing of the fund, ACE I used the majority of its committed capital to purchase 30% of our equity investments in 96 portfolio companies for an aggregate purchase price of $671 million. Also, ACE I co-invested with American Capital in an amount equal to 30% of equity investments made by us between October 2006 and November 2007 until the $329 million remaining
9
equity commitment was exhausted. In addition, 10%, or $100 million, of the $1 billion of distributions to the ACE I investors is recallable for add-on investments. As of December 31, 2014, ACE I investors had invested $1,070 million, received distributions of $1,195 million, had $405 million in total investments at fair value and had $30 million of recallable distributions available for add-on investments. ACAM manages ACE I for a 2% base management fee on the net cost basis of ACE I’s assets (as of December 31, 2014 the cost basis of ACE I’s assets was $353 million) and 10% to 30% of the net profits of ACE I, subject to certain hurdles (“Carried Interest”). As of December 31, 2014, the Carried Interest allocation to ACAM was $48 million, subject to certain clawback obligations, as defined in ACE I’s operating agreement. Pursuant to the operating agreement, ACE I was to be dissolved on October 1, 2014, unless extended. The term of the fund can be extended by us for up to two additional years to allow for an orderly dissolution and liquidation of the fund’s investments in accordance with the operating agreement. During the third quarter of 2014, the term of the fund was extended to October 1, 2015.
ACE II is a private equity fund, which was established in 2007 with $585 million of equity commitments from third-party investors. At the closing of the fund, ACE II used the majority of its committed capital to purchase 17% of our equity investments in 80 portfolio companies for an aggregate purchase price of $488 million. The remaining $97 million equity commitment is being used to fund add-on investments in the 80 portfolio companies. As of December 31, 2014, ACE II investors had invested $515 million, received distributions of $435 million, had $182 million in total investments at fair value and had $70 million of remaining equity commitments available for future add-on investments or cost contributions. ACAM manages ACE II for a 2% base management fee on the net cost basis of ACE II’s assets (as of December 31, 2014, the cost basis of ACE II’s assets was $197 million) and a 10% to 35% Carried Interest, subject to certain hurdles. As of December 31, 2014, ACAM has not recorded an accrual related to its Carried Interest in ACE II. Pursuant to the limited partnership agreement, ACE II will be dissolved on October 1, 2016, unless extended. The term of the fund can be extended by us for up to two additional years to allow for an orderly dissolution and liquidation of the fund’s investments in accordance with the limited partnership agreement
ACE III is a private equity fund, which was established in 2014 with $1.1 billion of equity commitments from third-party investors. ACAM manages ACE III for a base management fee of 1.25% on the net cost basis of ACE III’s assets (as of December 31, 2014 the cost basis of ACE III’s assets was $507 million) and 2% on outstanding capital commitments as well as 10% to 20% of the net profits of ACE III, subject to certain hurdles. As of December 31, 2014, the Carried Interest allocation to ACAM was $29 million, subject to certain clawback obligations, as defined in ACE III’s operating agreement. Pursuant to the operating agreement, ACE III will be dissolved on September 23, 2021, unless extended. The term of the fund can be extended by us, subject to certain approvals, for up to two additional years to allow for an orderly dissolution and liquidation of the fund’s investments in accordance with the operating agreement.
ECAS UK SME Debt is a private equity fund, which was established in 2014 with $165 million (£100 million) of committed capital with the ability to add £50 million of leverage. The British Business Bank has committed £50 million to the fund under the British Business Bank Investment Programme. The remaining £50 million has been committed by European Capital and its affiliates. ECAS UK SME Debt provides debt financing to small and medium sized companies in the United Kingdom. ACAM manages ECAS UK SME Debt for an annual management fee of 1.50% on deployed capital and up to a 15% Carried Interest, subject to certain hurdles. ECAS UK SME Debt will be dissolved on August 17, 2024.
In April 2007, ACAS CLO 2007-1 completed a $400 million securitization that invests primarily in senior floating rate loans. ACAM manages ACAS CLO 2007-1 for a base management fee of 0.68% of ACAS CLO 2007-1’s assets and a 20% Carried Interest, subject to certain hurdles. American Capital purchased 70% of the non-rated equity tranche of subordinated notes in ACAS CLO 2007-1 for $26 million and 55% of the originally rated BB/Ba2 notes for $9 million.
In September 2012, ACAS CLO 2012-1 completed a $362 million securitization that invests primarily in senior floating rate loans. ACAM manages ACAS CLO 2012-1 for a base management fee of 0.42% of ACAS CLO 2012-1’s total assets and a 20% Carried Interest, subject to certain hurdles. A subsidiary of ACAM also purchased 70% of the non-rated equity tranche of subordinated notes in ACAS CLO 2012-1 for $30 million.
In March 2013, ACAS CLO 2013-1 completed a $414 million securitization that invests primarily in senior floating rate loans purchased in the primary and secondary markets. ACAM manages ACAS CLO 2013-1 for a base management fee of 0.50% of ACAS CLO 2013-1’s assets and a 20% Carried Interest, subject to certain hurdles. A subsidiary of ACAM also purchased 70% of the non-rated equity tranche of subordinated notes in ACAS CLO 2013-1 for $25 million.
In September 2013, ACAS CLO 2013-2 completed a $414 million securitization that invests primarily in senior floating rate loans purchased in the primary and secondary markets. ACAM manages ACAS CLO 2013-2 for a base management fee of 0.50% of ACAS CLO 2013-2’s assets and a 20% Carried Interest, subject to certain hurdles. American Capital purchased 21% of the non-rated equity tranche of subordinated notes in ACAS CLO 2013-2 for $8 million.
In July 2014, ACAS CLO 2014-1 completed a $619 million securitization that invests primarily in senior floating rate loans purchased in the primary and secondary markets. ACAM manages ACAS CLO 2014-1 for an annual base management fee of
10
0.50% of ACAS CLO 2014-1’s assets and a 20% Carried Interest, subject to certain hurdles. A subsidiary of ACAM also purchased 60% of the non-rated equity tranche of subordinated notes in ACAS CLO 2014-1 for $31 million.
In November 2014, ACAS CLO 2014-2 completed a $411 million securitization that invests primarily in senior floating rate loans purchased in the primary and secondary markets. ACAM manages ACAS CLO 2014-2 for an annual base management fee of 0.50% of ACAS CLO 2014-2’s assets and a 20% Carried Interest, subject to certain hurdles. A subsidiary of ACAM also purchased 61% of the non-rated equity tranche of subordinated notes in ACAS CLO 2014-2 for $25 million.
In addition to managing ACAS CLO 2012-1, ACAS CLO 2013-1, ACAS CLO 2014-1 and ACAS CLO 2014-2, ACAM, through a wholly-owned subsidiary, also holds a direct investment in these funds consisting of 60% to 70% of the non-rated equity tranche of subordinated notes with a total fair value of $102 million as of December 31, 2014.
Third-Party Funds Under Development
We expect to continue to expand our asset management business and currently have several funds under development. For each of the funds under development, we have existing investment professionals on staff or have recently hired investment professionals to support each fund. In addition, in aggregate as of December 31, 2014, we have deployed approximately $400 million of capital at fair value for these funds under development with approximately $35 million of compensation costs recorded by ACAS or ACAM in 2014 for the investment teams that will manage these funds. We have a European debt fund, a European buyout fund, an international power fund, a North American energy fund, a commercial mortgage REIT fund and several CLO funds currently under development. These funds would be managed by a consolidated subsidiary of ACAM.
Structured Products Investments
Our Structured Products investments consist of investments in CLO, CDO and CMBS securities. Our Structured Products investments are generally in non-investment grade securities. We invest in Structured Products with the intention of holding them until maturity.
Our investments in CLO securities are generally secured by diverse pools of commercial corporate loans. Our investments are in 53 CLO funds managed by 27 separate portfolio managers. We also invest in CDO securities, which are generally secured by diverse pools of bonds of other securitizations including commercial loans, CMBS and residential mortgage backed securities. Certain of our commercial CLO investments are in a joint venture portfolio company. As of December 31, 2014, our investment in CLO and CDO securities was $554 million and $525 million at cost basis and fair value, respectively, or 8% of our total investments at fair value. This includes our investment in ACAS CLO 2007-1 and ACAS CLO 2013-2, which represents $23 million and $7 million at fair value, respectively. Our investments in CMBS bonds are secured by diverse pools of commercial mortgage loans. As of December 31, 2014, our total investment in CMBS bonds was $67 million and $35 million at cost basis and fair value, respectively, or less than 1% of our total investments at fair value.
Senior Floating Rate Loans
Our Senior Floating Rate Loans portfolio is composed primarily of diversified investments in first lien floating rate loans to large-market U.S. based companies (defined as issuers with EBITDA greater than $50 million). Our Senior Floating Rate Loans portfolio may also include second lien floating rate loans. Senior Floating Rate Loans are typically collateralized by a company’s assets and structured with first lien or second lien priority on collateral, providing for greater security and potential recovery in the event of default compared to other subordinated fixed-income products. Senior Floating Rate Loans generally have a stated term of three to seven years and typically pay interest based on a floating rate calculated as a spread over a market index, primarily LIBOR, and generally have a minimum market index floor. Our Senior Floating Rate Loans are also typically traded among investors in an active secondary market with no investor owning a significant percentage of the issue. We generally own less than 2% of any single loan issue.
As of December 31, 2014, there were debt investments in 230 companies in our Senior Floating Rate Loans portfolio with a cost basis and fair value of $1,690 million and $1,667 million, respectively. As of December 31, 2014, more than 98% of our Senior Floating Rate Loans portfolio, at fair value, was composed of loans with a facility rating by the S&P of at least “B” or higher. None of our investments in our Senior Floating Rate Loan portfolio were in default or on non-accrual as of December 31, 2014.
11
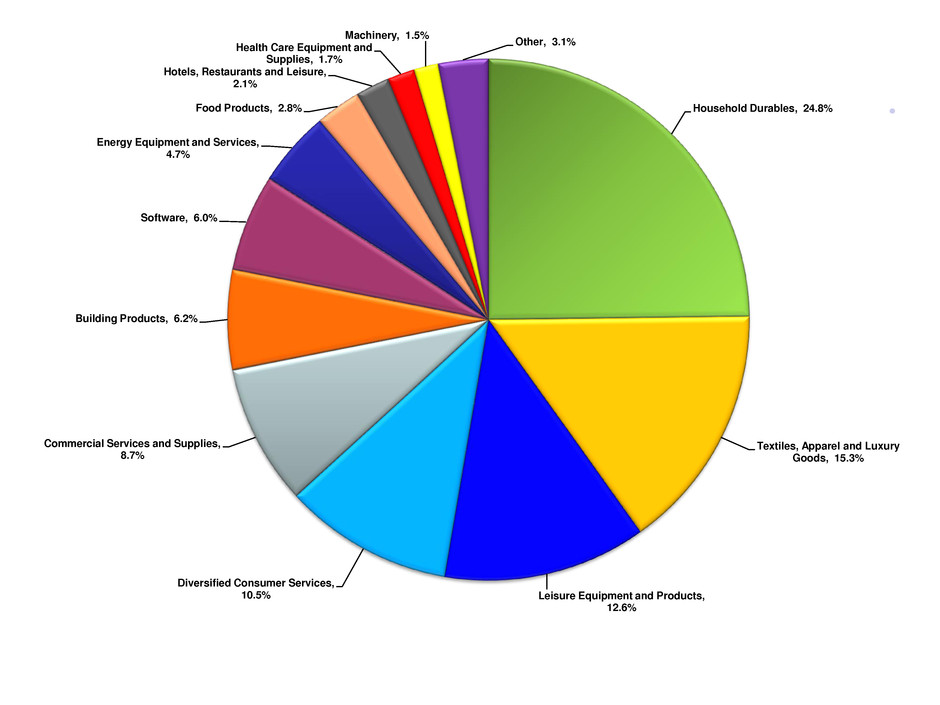
Our Senior Floating Rate Loan portfolio was diversified across both issuers and industries with the average exposure to an individual obligor of $7.2 million at fair value, or 0.4% of the Senior Floating Rate Loan portfolio, as of December 31, 2014. The following chart shows the Senior Floating Rate Loan portfolio composition by industry grouping at fair value as a percentage of total Senior Floating Rate Loans as of December 31, 2014:
Our Senior Floating Rate Loans portfolio was comprised of 100% floating rate loans with 98% having LIBOR floors ranging between 0.75% and 1.8%. As of December 31, 2014, our Senior Floating Rate Loans portfolio yield at cost was 4.4% and cost of funds was 2.2%, which represents the weighted average interest rate on our $750 million and $500 million secured revolving credit facilities as of December 31, 2014 along with an estimate for unfunded commitment fees plus amortization of debt financing costs. During the year ended December 31, 2014, we recognized operating revenues and interest expense from our Senior Floating Rate Loans portfolio totaling $33 million and $4 million, respectively.
European Capital
European Capital primarily invests in senior and mezzanine debt and equity in buyouts of private companies sponsored by European Capital (“European Capital One Stop Buyouts®”), or sponsored by other private equity funds and provides capital directly to early stage and mature private and small public companies (“European Capital Sponsor Finance Investments”).
As of December 31, 2014, European Capital had investments in 28 portfolio companies totaling $587 million at fair value, with an average investment size of $21 million, or 4% of its total assets. As of December 31, 2014, European Capital’s five largest investments at fair value were $388 million, or 66% of its total assets.
12
The following table shows the composition of European Capital’s investment portfolio by security type at cost basis and fair value, as a percentage of total investments as of December 31, 2014:
2014 | ||
Cost | ||
First Lien Senior Debt | 33.1 | % |
Second Lien Senior Debt | 3.3 | % |
Mezzanine Debt | 24.1 | % |
Preferred Equity | 24.0 | % |
Common Equity | 14.0 | % |
Structured Products | 1.5 | % |
Total | 100.0 | % |
Fair Value | ||
First Lien Senior Debt | 46.0 | % |
Second Lien Senior Debt | — | % |
Mezzanine Debt | 15.7 | % |
Preferred Equity | 13.3 | % |
Common Equity | 21.3 | % |
Structured Products | 3.7 | % |
Total | 100.0 | % |
13
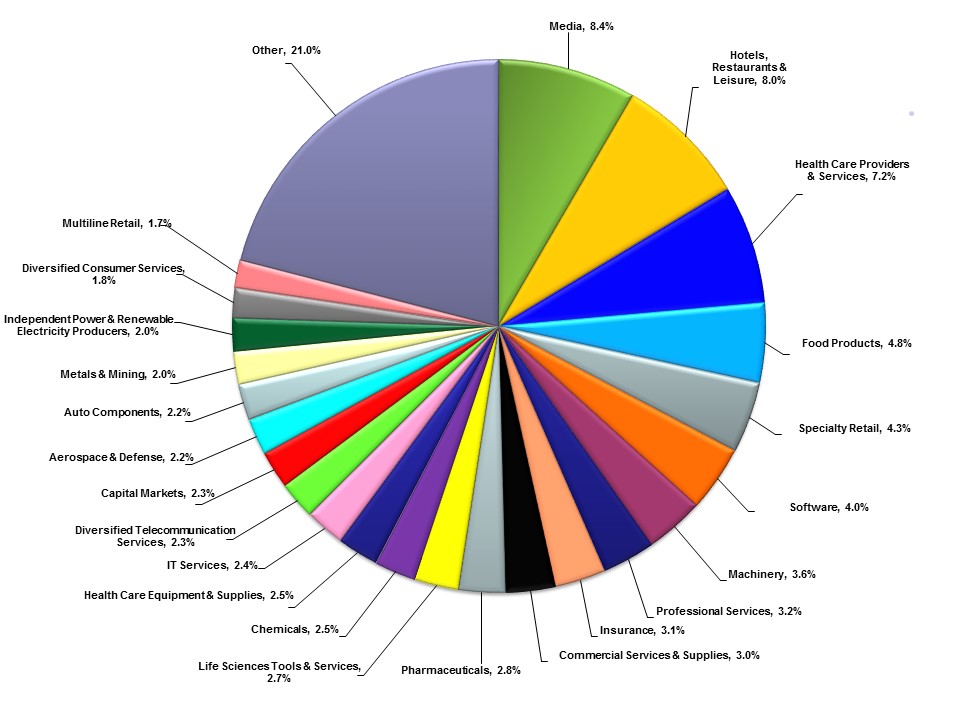
European Capital has a diversified investment portfolio and does not concentrate in any one or two industry sectors. European Capital uses the GICS® for classifying the industry groupings of its portfolio companies. The following chart shows European Capital’s portfolio composition by industry grouping at fair value as a percentage of its total investments as of December 31, 2014. Investments in European Capital CLO investments are excluded from the chart below.
Business Actions and Strategy
On November 5, 2014, we announced that, in October 2014, our Board of Directors approved the spin off of two new publicly traded BDCs to our shareholders, separating the majority of our investment assets from our asset management business. The two new BDCs will be called American Capital Growth & Income and American Capital Income. American Capital will continue as a public company primarily in the asset management business. American Capital Growth & Income’s assets will consist primarily of securities issued by operating companies purchased through American Capital One Stop Buyouts® and Senior Floating Rate Loans to private companies and CLO equity investments. American Capital Income’s assets will consist primarily of second lien and mezzanine loans to middle and large market companies consistent with our Sponsor Finance Investments. The two new BDCs are anticipated to qualify and elect to be taxed as regulated investment companies with the objective of paying market rate dividends. As part of the transaction, we will consolidate our operations and remaining assets with ACAM, and will discontinue being an investment company.
We also announced that due to changes in the composition of our investment portfolio and market conditions, we have undertaken various cost saving initiatives. Also, we will implement a program under which portfolio companies in which we, or our managed funds, have invested will reimburse us for certain services we provide to those portfolio companies.
We will seek to accomplish the spin off of American Capital Growth & Income by issuing a tax free dividend to our shareholders while the spin off of American Capital Income is expected to be treated as a taxable dividend to our shareholders. American Capital will continue to be a taxable corporation and will retain any NOLs that exist at the time of the spin offs. The transaction is subject to certain conditions including the approval of our shareholders who, among other matters, must approve our de-election to be regulated as a BDC under the 1940 Act.
14
Other conditions to completion of the transaction include final approval by our Board of Directors, receipt of a tax opinion from our tax advisers, the filing of registration statements with the SEC and their effectiveness, the holding of a special meeting of shareholders and the filing with and review of a proxy statement for that meeting by the SEC staff, the refinancing of our indebtedness and the establishment of credit facilities for the two new BDCs. We have concluded that the transaction does not likely need regularly relief from the SEC. We will, however, still need to file proxy and registration statements with the SEC, which we expect to file in the third calendar quarter of 2015. These documents will be subject to review and comment by the SEC, which may affect the time frame in which the transaction can be completed. No assurance can be given as to if or when the transaction will be completed. We expect to make necessary filings with the SEC as soon as practicable. There can be no assurances regarding the timing of the transaction, whether the transaction will be completed or the tax treatment of the transaction.
Lending and Investment Decision Criteria
We generally review certain criteria in order to make investment decisions. The list below represents a general overview of the criteria we use in making our lending and investment decisions in our investment portfolio. Not all criteria are required to be favorable in order for us to make an investment. Add-on investments for growth, acquisitions or recapitalizations are based on the same general criteria. Add-on investments in distressed situations are based on the same general criteria, but are also evaluated on the potential to preserve prior investments.
Operating History. We generally focus on middle market companies that have been in business over ten years and have an attractive operating history, including generating positive cash flow. We generally target companies with significant market share in their products or services relative to their competitors. In addition, we consider factors such as customer concentration, performance during recessionary periods, competitive environment and ability to sustain margins. As of December 31, 2014, our current portfolio companies, excluding SFRL, Structured Products and European Capital, had an average age of 22 years with average revenue and average adjusted earnings before interest, taxes, depreciation and amortization (“Adjusted EBITDA”) for the latest available twelve month period of $201 million, and $51 million, respectively. Adjusted EBITDA may reflect certain adjustments to the reported EBITDA of a portfolio company for non-recurring, unusual or infrequent items or other pro-forma items or events to normalize current earnings which a buyer may consider in a change in control transaction.
Growth. We consider a target company’s ability to increase its cash flow. Anticipated growth is a key factor in determining the ability of the company to repay its debt and the value ascribed to any warrants and equity interests acquired by us.
Liquidation Value of Assets. Although we do not operate as an asset-based lender, liquidation value of the assets collateralizing our loans is a factor in many credit decisions. Emphasis is placed both on tangible assets such as accounts receivable, inventory, plant, property and equipment as well as intangible assets such as brand recognition, market reputation, customer lists, networks, databases and recurring revenue streams.
Experienced Management Team. We consider the quality of senior management to be extremely important to the long-term performance of most companies. Therefore, we consider it important that senior management be experienced and properly incentivized through meaningful ownership interest in the company.
Exit Strategy. Almost all of our investments consist of securities acquired directly from their issuers in private transactions. These securities are rarely traded in public markets, thus limiting their liquidity. Therefore, we consider it important that a prospective portfolio company have a number of methods by which our financing can be repaid and our equity investment sold or redeemed. These methods would typically include the sale or refinancing of the business, the ability to generate sufficient cash flow to repurchase our equity securities and repay our loans or the ability to contribute the security to a fund that we manage.
Structured Products Criteria. We receive extensive information from the issuer regarding their track record and the collateral pool. We underwrite the manager and the collateral securing our investment as appropriate.
Fund Investment Criteria. We receive extensive information from the manager regarding their track record and the investment thesis. We assess the ability to raise capital with the manager and underwrite the manager and the investment strategy as appropriate.
Institutional Approach to Investing
We have built an institution with a leading capability to originate, underwrite, finance, syndicate, monitor and exit investments that generate attractive returns. Our dedicated teams of investment professionals are the cornerstone of our institution. We have also created an extensive support structure that provides in-house due diligence, operational, legal and human resources support to our investment professionals and to our portfolio company, ACAM. The following are our key functional teams.
Investment Teams: As of December 31, 2014, we had 26 Investment Teams with over 110 professionals located in our five offices in the United States, including Investment Teams and professionals of ACAM. The Investment Teams originate, review and screen investment opportunities, conduct business, management and operations due diligence, prepare investment committee reports and models, make recommendations to the investment committee, execute investments, represent us on the boards of directors of portfolio companies, assist in monitoring and valuing of investments and manage acquisitions, divestitures and exiting
15
of investments. Our Investment Teams are organized so that each team focuses on a specific investment strategy and work cooperatively to share expertise. Our Investment Teams include:
• | American Capital Buyout: A 20-person team that implements American Capital One Stop Buyouts® of middle market companies including corporate divestitures, acquisitions of portfolio companies from private equity funds, acquisitions of family-owned or closely held businesses, going private transactions and ownership transitions. They originate senior and mezzanine debt and equity in American Capital controlled buyouts. |
• | Sponsor Finance: An 8-person team that makes senior and mezzanine debt investments and equity co-investments in Sponsor Finance Investments. In addition, they make senior and mezzanine debt and equity investments in privately and publicly-held middle market companies. |
• | Special Situations: A 6-person team that implements American Capital One Stop Buyouts®, Sponsor Finance Investments and other direct investments in distressed companies, companies undergoing turnarounds, bankruptcy auctions, debtor-in-possession, exit financing and other special situations in middle market companies. They make senior and mezzanine debt and equity investments. |
• | European Capital: A 22-person team that invests in and sponsors management and employee buyouts. They invest in private equity buyouts and provides capital directly to private and public companies headquartered predominantly in Europe. |
• | Commercial Mortgage Asset Management: A 6-person team that invests in commercial mortgages and related assets. The team also participates in underwriting, due diligence and financing of real estate owned by our portfolio companies. |
• | Residential Mortgage: A 9-person team that invest in, finance and manage a leveraged portfolio of mortgage-related investments, such as agency mortgage-back securities for AGNC and agency residential mortgage-backed securities, non-agency mortgage investments and other mortgage-related investments for MTGE. |
• | Leverage Finance: A 21-person team that has responsibility for our investments in and manages senior loans for ACSF and third-party investors through structured finance products such as a CLO. The team invests in large market senior floating rate loans. They also invest in non-rated tranches of CLOs managed by other third-party fund managers. |
• | Energy and Infrastructure: A 13-person team that invests in energy infrastructure assets in emerging and developed markets, including power generation facilities, gas and power distribution and transmission networks, energy transportation assets, fuel production opportunities and product and service companies focused on the power and energy sector. |
Operations Team: A 22-person team with expertise in manufacturing services, consumer products, financial services, energy services, supply chain management, outsourcing and technology. The Operations Team includes seven former CEOs and presidents, three lean champions, seven financial VPs and associates and three supply chain and outsourcing specialists. The Operations Team conducts operational due diligence on prospective portfolio companies and reports and makes recommendations to our investment committee. The team will also assist portfolio companies post close with operational improvement. If we have a portfolio company that is underperforming, the Operations Team will work closely with the portfolio company to improve performance by providing interim leadership at the portfolio company and to identify business actions to help improve performance. The team will provide hands-on assistance to reduce costs, systemize sales and marketing, develop and align business plans, grow the business and strengthen management talent at the portfolio company.
Investment Committee Support Team: A 2-person team that assists our investment committee (the “Investment Committee”) in establishing procedures and controls, establishing due diligence protocol and working with Investment Teams to establish due diligence plans for each prospective investment, developing standard investment committee reports and models, organizing investment committee meetings, monitoring and reporting investment committee results and tracking subsequent developments.
Financial Advisory and Consulting Team (“FACT”): A 27-person team of valuation and audit professionals. FACT is responsible for providing pre- and post-investment financial due diligence, portfolio monitoring and quarterly valuations of portfolio company investments. FACT assists our Investment Teams in conducting extensive financial, accounting and information technology due diligence of each target investment company, which includes one or more on-site visits, a review of the portfolio company’s historical and prospective financial information, and identifying and confirming pro-forma financial adjustments. FACT also monitors the existing portfolio investments by gathering, inputting into an automated database, analyzing and regularly reviewing monthly financial information and other materials to assess financial performance as well as to ensure compliance with loan covenants. Also, FACT, with the assistance of our Investment Teams and subject to the oversight of the Audit, Compliance and Valuation Committee, prepares a quarterly valuation of each portfolio company investment.
16
Syndications Team: A 5-person team that is responsible for arranging syndications of all or part of the senior debt of our portfolio companies either at closing or subsequent to the closing of a senior financing transaction. They perform a variety of functions relating to the marketing and completing of such transactions.
Capital Markets, Finance and Treasury Team: A 34-person team that is responsible for raising equity and debt capital, investor relations, financial budgeting and forecasting and daily liquidity and cash management. Through its debt capital raising activities, the team is responsible for structuring, selling and administering on-balance sheet term debt securitizations of debt investments, secured and unsecured bonds and various other revolving facilities and term debt facilities for us and our funds under management. Through its equity capital raising activities, the team is responsible for structuring and selling equity for us and our public and private funds. The team is also responsible for monitoring and reporting on capital market conditions and researching, developing and raising private and public capital for new third-party funds for our asset management business. The team is also responsible for arranging syndications of all or part of the equity of our portfolio companies either at closing or subsequent to the closing of an equity financing transaction.
Accounting, Tax and Reporting Team: A 62-person team that is responsible for the accounting of our financial results as well as that of our managed funds, including financial reporting and communications to our shareholders, partners and regulatory bodies. Among its tasks are preparing financial statements, investment accounting, analysis of investment performance, loan servicing, billing, accounts receivable and payable, tax compliance, external audit coordination and developing and monitoring our internal controls.
Legal and Compliance Team: A 23-person team that provides legal support on corporate, capital raising and investing matters, is involved in regular reporting and special communications with our shareholders and regulatory bodies and manages the outside law firms that provide transactional, litigation and regulatory services to us. In addition, as required by the SEC, we have appointed a Chief Compliance Officer, who is responsible for administering our code of ethics and conduct and our legal compliance activities.
Internal Audit Team: A 9-person team that reports directly to the Audit, Compliance and Valuation Committee of our Board of Directors. The team tests our internal controls over financial reporting to assist management’s assessment of the effectiveness of our internal controls over financial reporting under the Sarbanes-Oxley Act of 2002.
Human Resources Team: An 8-person team that assists in recruiting and hiring as well as reviewing, establishing and administering compensation programs and benefit plans for our employees. In addition, the team is available to the Investment Teams and the Operations Team to assist with executive management and other human resources issues at portfolio companies.
Information Technology Team: A 34-person team that assists all departments in researching, developing, implementing and maintaining communication and technological resources for our multi-office operations, including highly specialized systems for the input, processing and reporting of data.
Investment Process
Investment Sourcing and Screening: We have a multi-disciplined approach to reach diverse channels of deal sources. Our Investment Teams target a referral network composed of investment bankers, private equity firms, mezzanine debt funds, trade organizations, commercial bankers, attorneys and business and financial brokers. We developed and maintain a proprietary industry-wide database of reported middle market transactions, which enables us to monitor and evaluate the middle market investing environment. This database is used to help us assess whether we are penetrating our target markets and to track terms and pricing. Our financial professionals review financing memorandums and private placement memorandums sourced from this referral network in search of potential buyout or financing opportunities. Our Investment Teams undertake a preliminary evaluation and analysis of potential investment opportunities to determine whether or not they meet our criteria based upon the limited information received in these early stages of the investment process. For investment opportunities that pass an initial screening process, our Investment Teams prepare an initial investment thesis and analysis that is presented to an internal Investment Committee, which includes representatives of our senior officers depending on the nature of the proposed investment, for approval to proceed further.
Due Diligence: In our investment portfolio, our investment professionals along with FACT and our Operations Team conduct due diligence of each target company that passes the initial screening process. This includes one or more on-site visits, a review of the target company’s historical and prospective financial information, identifying and confirming pro-forma financial adjustments, interviews with and assessments of management, employees, customers and vendors, review of the adequacy of the target company’s systems, background investigations of senior management and research on the target company’s products, services and industry. We often engage professionals such as environmental consulting firms, accounting firms, law firms, risk management companies and management consulting firms with relevant industry expertise to perform elements of the due diligence.
Investment Approval: Upon completion of our due diligence, our Investment Teams, FACT and our Operations Team, as well as any consulting firms that we have engaged, prepare and present a report containing the due diligence information for review by our Investment Committee. Our Board of Directors has delegated authority to the Investment Committee to conduct
17
the initial review and approval of our investments. Our Investment Committee generally must approve each investment. Investments exceeding a certain size or meeting certain other criteria must also be approved by our Board of Directors. Our Investment Committee is supported by a dedicated staff that focuses on the due diligence and other research done with regard to each proposed investment.
Documentation and Negotiations: Documentation for the legal agreements for a transaction is completed either by our in-house legal team or through the retention of outside legal counsel. We maintain custody of our investment securities and the original related investment documentation in custodial accounts with qualified banks and members of national securities exchanges in accordance with applicable regulatory and financing requirements.
Investment Funding: Prior to the release of any funding for investments, our treasury department prepares a summary of the investment terms, the funding amounts approved by our Investment Committee and wiring instructions. Our treasury department performs various procedures to confirm any wiring instructions. A senior executive officer must approve this summary of terms and funding amounts prior to the disbursement of the funds.
Portfolio Monitoring: In addition to the due diligence at the time of the original investment decision, we seek to preserve and enhance the performance of our portfolio companies under management through our active involvement with the portfolio companies. As a BDC, we are required by law to make significant managerial assistance available to most of our eligible portfolio companies. This generally includes providing guidance and counsel concerning the management, operations and business objectives and policies of the portfolio company to the portfolio company’s management and board of directors, including participating on the company’s board of directors. The respective Investment Teams, FACT, Operations Teams and accounting teams regularly review each portfolio company’s monthly financial statements to assess performance and trends, periodically conduct on-site financial and operational reviews and evaluate industry and economic issues that may affect the portfolio company.
Investment Exits: We regularly evaluate each investment to determine the appropriate time to exit an investment. For investments that we control, portfolio companies are usually sold through an auction process, following the engagement of an investment bank. For performing investments that we do not control, the exit typically occurs when the sponsor or other party in control of the portfolio company decides to recapitalize or sell the business. In both instances, our debt investment is typically paid in full and any equity investment we own realizes a value consistent with the value realized by the controlling parties. For non-performing investments that we do not control, we may determine that based on the facts and circumstances relating to the investment, to accept an amount less than what we are legally owed with any such decision requiring approval by our Investment Committee.
Portfolio Valuation
FACT, with the assistance of our Investment Teams and subject to the oversight of the Audit, Compliance and Valuation Committee, prepares a quarterly valuation of each of our portfolio company investments. Our Board of Directors approves our portfolio valuations as required by the 1940 Act.
Competition
We compete with strategic buyers, private equity funds, mezzanine debt funds and other buyers and financing sources, including traditional financial services companies such as finance companies, commercial banks, investment banks and other equity and non-equity based investment funds. Some of our competitors are substantially larger and have considerably greater financial resources than we do. Competitors may have a lower cost of funds and many have access to funding sources that are not available to us. In addition, certain of our competitors may have higher risk tolerances or different risk assessments, which could allow them to consider a wider variety of investments and establish more relationships and build their market shares.
Corporate Information
Our executive offices are located at 2 Bethesda Metro Center, 14th Floor, Bethesda, Maryland 20814, and our telephone number is (301) 951-6122. In addition to our executive offices, we, or subsidiaries of our wholly-owned portfolio company ACAM, maintain offices in New York, Chicago, Boston, Annapolis (Maryland), London, Paris and Singapore.
We make available all of our annual reports on Form 10-K, quarterly reports on Form 10-Q, current reports on Form 8-K and amendments to such reports free of charge on our internet website at www.AmericanCapital.com as soon as reasonably practical after such material is electronically filed with or furnished to the SEC. These reports are also available on the SEC’s internet website at www.sec.gov. The public may also read and copy paper filings that we have made with the SEC at the SEC’s Public Reference Room, located at 100 F Street, NE, Washington, D.C. 20549. Information on the operation of the Public Reference Room may be obtained by calling (800) SEC-0330.
18
Employees
As of December 31, 2014, we employed 366 full-time employees, which included 138 employees at ACAM, compared to 394 and 340 full-time employees as of December 31, 2013 and 2012, respectively. We believe that we have excellent relations with our employees.
Business Development Company Requirements
We are a closed-end, non-diversified, management investment company that has elected to be regulated as a BDC under the 1940 Act, and, as such, are subject to regulation under that act.
Qualifying Assets
As a BDC, we may not acquire any asset other than certain qualifying assets described in the 1940 Act, unless, at the time the acquisition is made, the value of such qualifying assets represent at least 70% of the value of our total assets. The principal categories of qualifying assets relevant to our business include the following:
• | securities purchased in transactions not involving any public offering from: |
(a) | an issuer that (i) is organized and has its principal place of business in the United States, (ii) is neither an investment company other than a wholly-owned small business investment company nor an entity that would be an investment company but for certain statutory exemptions, and (iii) does not have any class of securities listed on a national securities exchange with a market capitalization in excess of $250 million; or |
(b) | an issuer that satisfies the criteria set forth in clauses (a) (i) and (ii) above but not clause (a)(iii), so long as, at the time of purchase, we own at least 50% of (i) the greatest amount of equity securities of the issuer, including securities convertible into such securities and (ii) the greatest amount of certain debt securities of such issuer, held by us at any point in time during the period when such issuer was an eligible portfolio company, except that options, warrants, and similar securities which have by their terms expired and debt securities which have been converted, or repaid or prepaid in the ordinary course of business or incident to a public offering of securities of such issuer, shall not be considered to have been held by us, and we are one of the 20 largest holders of record of such issuer's outstanding voting securities; |
• | securities of an issuer described in clauses (a)(i) and (ii) above with respect to which we control (alone or together as a part of a group), we in fact exercise a controlling influence over such issuer’s management or policies and a person affiliated with us is on the issuer’s board of directors; |
• | securities received in exchange for or distributed with respect to securities described above, or pursuant to the exercise of options, warrants or rights relating to such securities; and |
• | cash, cash items, U.S. government securities, or high quality debt securities maturing in one year or less from the time of investment. |
To include certain securities above as qualifying assets for the purpose of the 70% test, a BDC must either control the issuer of the securities or offer to make significant managerial assistance available to the issuer of those securities, such as providing significant guidance and counsel concerning the management, operations, or business objectives and policies of a portfolio company or making loans to a portfolio company. We make significant managerial assistance available to most of our eligible portfolio companies.
Under the 1940 Act, we may not change the nature of our business so as to cease to be, or withdraw our election as, a BDC without consent of the holders of a majority of our outstanding voting securities. Since we made our BDC election, we have not made any substantial change in our structure or in the nature of our business.
Temporary Investments
Pending investment in other types of qualifying assets described in the 1940 Act, we may invest our funds in cash items, government securities, agency paper or high quality debt securities maturing in one year or less from the time of investment in such high quality debt investments. We refer to such assets and cash herein as temporary investments.
Leverage
The 1940 Act permits us, as a BDC, to issue senior debt securities and preferred stock (collectively, “Senior Securities”) in amounts such that our asset coverage is at least 200% after each issuance of Senior Securities. Asset coverage is defined in the 1940 Act as the ratio which the value of the total assets, less all liabilities and indebtedness not represented by Senior Securities, bears to the aggregate amount of Senior Securities representing indebtedness. Such indebtedness may also be incurred for the
19
purpose of effecting share repurchases. As a result, we are exposed to the risks of leverage. Although we have no current intention to do so, we have retained the right to issue preferred stock, subject to certain limitations under the 1940 Act. As permitted by the 1940 Act, we may, in addition, borrow amounts up to 5% of our total assets for temporary purposes. As of December 31, 2014, our asset coverage was 419%.
Under the 1940 Act, if a BDC has any senior debt securities outstanding that were publicly issued, the BDC must make provision to prohibit the declaration of any dividend (except a dividend payable in the stock of the BDC) if its asset coverage is below 200% at the time of the distribution after deducting the amount of such dividend.
Issuance of Stock
As a BDC, we are generally not able to issue and sell our common stock at a price below our NAV per share, exclusive of any distributing commission or discount, except (i) with the prior approval of a majority of our shareholders, (ii) in connection with a rights offering to our existing shareholders, or (iii) under such other circumstances as the SEC may permit. As of December 31, 2014, our NAV was $20.50 per share and our closing market price was $14.61 per share. As of the date of this filing, we do not have any authorization to issue shares of our common stock below our NAV per share.
Investment Objectives
Our primary business objectives are to increase our net earnings and NAV by investing in senior and mezzanine debt and equity securities of private companies and funds managed by ACAM with attractive current yields and/or potential for equity appreciation and realized gains and by growing our fee earning assets under management. Our investment objectives provide that:
• | We will at all times conduct our business so as to retain our status as a BDC. In order to retain that status, we may not acquire any assets (other than non-investment assets necessary and appropriate to our operations as a BDC) if after giving effect to the acquisition the value of our qualifying assets under the 1940 Act amounts to less than 70% of the value of our total assets. See “Business Development Company Requirements” for a discussion of certain qualifying assets described in the 1940 Act. We believe that most of the securities we will acquire (provided that we control, or through our officers or other participants in the financing transaction, make significant managerial assistance available to the issuers of these securities), as well as temporary investments, will generally be qualifying assets. Securities of public companies with a market capitalization in excess of $250 million, on the other hand, are generally not qualifying assets unless they were acquired in a distribution, in exchange for or upon the exercise of a right relating to securities that were qualifying assets. |
• | We may invest up to 100% of our assets in securities acquired directly from issuers in privately-negotiated transactions. With respect to such securities, we may, for the purpose of public resale, be deemed an “underwriter” as that term is defined in the Securities Act of 1933. |
• | We may issue Senior Securities to the extent permitted by the 1940 Act for the purpose of making investments, to fund share repurchases, or for temporary or emergency purposes. As a BDC, we may issue Senior Securities up to an amount so that the asset coverage, as defined in the 1940 Act, is at least 200% immediately after each issuance of Senior Securities. |
• | We generally will not (a) act as an underwriter of securities of other issuers (except to the extent that we may (i) be deemed an “underwriter” of securities purchased by us that must be registered under the Securities Act of 1933 before they may be offered or sold to the public or (ii) underwrite securities to be distributed to or purchased by our shareholders in connection with offerings of securities by companies in which we are a shareholder); (b) sell securities short (except with regard to managing risks associated with publicly traded securities issued by portfolio companies); (c) purchase securities on margin (except to the extent that we may purchase securities with borrowed money); (d) write or buy put or call options (except (i) to the extent of warrants or conversion privileges in connection with our acquisition financing or other investments, and rights to require the issuers of such investments or their affiliates to repurchase them under certain circumstances, or (ii) with regard to managing risks associated with publicly traded securities issued by portfolio companies); (e) engage in the purchase or sale of commodities or commodity contracts, including futures contracts (except where necessary in working out distressed loan or investment situations); or (f) acquire more than 3% of the voting stock of, or invest more than 5% of our total assets in any securities issued by, any other investment company (as defined in the 1940 Act), except as they may be acquired as part of a merger, consolidation or acquisition of assets or as otherwise permitted by the staff of the SEC. With regard to that portion of our investments in securities issued by other investment companies it should be noted that such investments may subject our shareholders to additional expenses. |
20
The percentage restrictions set forth above, other than the restriction pertaining to the issuance of Senior Securities, as well as those contained elsewhere herein, apply at the time a transaction is effected, and a subsequent change in a percentage resulting from market fluctuations or any cause other than an action by us will not require us to dispose of portfolio securities or to take other action to satisfy the percentage restriction.
The above investment objectives have been set by our Board of Directors and do not require shareholder consent to be changed.
Investment Advisor
We have no investment advisor and are internally managed by our executive officers under the supervision of our Board of Directors.
21
Item 1A. | Risk Factors |
You should carefully consider the risks described below, as well as other information contained in this Annual Report on Form 10-K, including our consolidated financial statements and the related notes thereto before making an investment decision. The risks and uncertainties described below are not the only ones we face. Additional risks and uncertainties not currently known to us or that we currently deem to be immaterial may also materially and adversely affect us in the future. Any of the following risks could materially adversely affect our business, financial condition, results of operations or cash flows. In such case, you may lose all or part of your original investment. The risks discussed below also include forward-looking statements, and our actual results may differ substantially from those discussed in these forward-looking statements. See “Forward-Looking Statements” in this Annual Report on Form 10-K.
Risks Related to Our Business and Structure
Our announced strategic plan may not be completed or it may take an extended time to complete
We have announced a strategic plan to split our businesses by transferring most of our investment assets to two newly established BDCs and having the Company continue primarily in the asset management business. It is contemplated that we will spin off the new BDCs to our shareholders, resulting in three, publicly-traded companies. No assurance can be given that this plan will be completed and, if it is completed, that it will be completed on any particular schedule. In addition, it is possible that we will undertake a strategic transaction that is materially different than what we have announced.
Future adverse market and economic conditions could cause harm to our operating results
Past recessions have had a significant negative impact on the operating performance and fair value of our portfolio investments. We have experienced losses during those recessions. Many of our portfolio companies could be adversely impacted again by any future economic downturn or recession and may be unable to repay our debt investments, may be unable to be sold at a price that would allow us to recover our investment, or may be unable to operate during such recession. Such portfolio company performance could have a material adverse effect on our business, financial condition and results of operations.
We have loans to and investments in middle market borrowers who may default on their loans and we may lose our investment
We have invested in and made loans to privately-held, middle market businesses and plan to continue to do so. There is generally a limited amount of publicly available information about these businesses. Therefore, we rely on our principals, associates, analysts, other employees and consultants to investigate and monitor these businesses. The portfolio companies in which we have invested may have significant variations in operating results, may from time to time be parties to litigation, may be engaged in rapidly changing businesses with products subject to a substantial risk of obsolescence, may require substantial additional capital to support their operations, to finance expansion or to maintain their competitive position, may otherwise have a weak financial position or may be adversely affected by changes in the business cycle. Our portfolio companies may not meet net income, cash flow and other coverage tests typically imposed by senior lenders. Numerous factors may affect a portfolio company’s ability to repay its loans, including the failure to meet its business plan, a downturn in its industry or negative economic conditions. Deterioration in a portfolio company’s financial condition and prospects may be accompanied by deterioration in the collateral for the loan. We have also made unsecured and mezzanine loans and invested in equity securities, which involve a higher degree of risk than senior secured loans. In certain cases, our involvement in the management of our portfolio companies may subject us to additional defenses and claims from borrowers and third-parties. These conditions may make it difficult for us to obtain repayment of our investments.
Middle market businesses typically have narrower business lines and smaller market shares than large businesses. They tend to be more vulnerable to competitors’ actions and market conditions, as well as general economic downturns. In addition, these companies may face intense competition, including competition from companies with greater financial resources, more extensive development, manufacturing, marketing, and other capabilities, and a larger number of qualified managerial and technical personnel.
These businesses may also experience substantial variations in operating results. Typically, the success of a middle market business also depends on the management talents and efforts of one or two persons or a small group of persons. The death, disability or resignation of one or more of these persons could have a material adverse impact on us. In addition, middle market businesses often need substantial additional capital to expand or compete and may have borrowed money from other lenders with claims that are senior to our claims.
Our senior loans generally are secured by the assets of our borrowers; however, certain of our senior loans may have a second priority lien and thus, our security interest may be subordinated to the payment rights and security interest of the first lien senior lender. Additionally, our mezzanine loans may or may not be secured by the assets of the borrower; however, if a mezzanine loan is secured, our rights to payment and our security interest are usually subordinated to the payment rights and security interests
22
of the first and second lien senior lenders. Therefore, we may be limited in our ability to enforce our rights to collect our second lien senior loans or mezzanine loans and to recover any of the loan balance through a foreclosure of collateral.
Non-accruing loans adversely affect our results of operations and financial condition and could result in further losses in the future
As of December 31, 2014 and 2013, our non-accruing loans at cost totaled $371 million and $287 million, or 9.4% and 17.0% of our total loans at cost, respectively. Non-accruing loans adversely affect net income in various ways. Upon becoming non-accruing, we reverse prior payment-in-kind (“PIK”) income from a non-accruing loan, if applicable, and no interest income is recorded on non-accruing loans, thereby, in both cases, adversely affecting income and returns on assets and equity. There is no assurance that we will not experience further increases in non-accruing loans in the future, or that non-accruing loans will not result in further losses to come.
There is uncertainty regarding the value of our portfolio investments
Virtually none of our portfolio investments are publicly traded. As required by law, we fair value these investments in accordance with the 1940 Act and Financial Accounting Standards Board (“FASB”) Accounting Standards Codification (“ASC”) Topic 820, Fair Value Measurements and Disclosures (“ASC 820”) based on a determination made in good faith by our Board of Directors. Due to the uncertainty inherent in valuing investments that are not publicly traded, as set forth in our audited consolidated financial statements included in this Annual Report on Form 10-K, our determinations of fair value may differ materially from the values that would exist if a ready market for these investments existed. Our determinations of the fair value of our investments have a material impact on our net earnings through the recording of unrealized appreciation or depreciation of investments as well as our assessment of income recognition. Thus, our NAV could be materially affected in the event of any changes in applicable law or accounting pronouncements governing how we currently fair value assets, or if our determinations regarding the fair value of our investments are materially different from the values that would exist if a ready market existed for these securities.
Our business has significant capital requirements and may be adversely affected by a prolonged inability to access the capital markets or to sell assets
Our business requires a substantial amount of capital to operate. We historically have financed our operations, including the funding of new investments, through cash generated by our operating activities, the repayment of debt investments, the sale of equity investments, the issuance of debt by special purpose affiliates to which we have contributed loan assets, the sale of our stock and through secured and unsecured borrowings. Our ability to continue to rely on such sources or other sources of capital is affected by restrictions in both the 1940 Act and in certain of our debt agreements relating to the incurrence of additional indebtedness as well as changes in the capital markets from the recent economic recession. It is also affected by legal, structural and other factors. There can be no assurance that we will be able to earn or access the funds necessary for our liquidity requirements.
Our ability to recognize the benefits of our deferred tax asset is dependent on future taxable income and could be substantially limited if we experience an “ownership change” within the meaning of Section 382 of the Code
We recognize the expected future tax benefit from a deferred tax asset when the tax benefit is considered more likely than not to be realized. Otherwise, a valuation allowance is applied against the deferred tax asset. Assessing the recoverability of a deferred tax asset requires management to make significant estimates related to expectations of future taxable income. Estimates of future taxable income are based on forecasted cash flows from investments and operations, the character of expected income or loss as either capital or ordinary and the application of existing tax laws in each jurisdiction. To the extent that future cash flows and the amount or character of taxable income differ significantly from estimates, our ability to realize the deferred tax asset could be impacted. See Note 11 to our audited consolidated financial statements included in this Annual Report on Form 10-K.
Additionally, under Sections 382 and 383 of the Code, following an “ownership change,” certain limitations apply to the use by a “loss corporation” of certain tax attributes including net operating loss carryforwards, capital loss carryforwards, unrealized built-in losses and tax credits arising before the “ownership change.” Such tax attributes represent substantially all of our deferred tax assets. In general, an “ownership change” would occur if there is a cumulative change in the ownership of our common stock of more than 50 percentage points by one or more “5% shareholders” during a three-year period. In the event of an “ownership change,” the tax attributes that may be used to offset our future taxable income in each year after the “ownership change” will be subject to an annual limitation. In general, the annual limitation is equal to the product of the fair market value of our common stock on the date of the “ownership change” and the “long term tax exempt rate” (which is published monthly by the Internal Revenue Service), subject to specified adjustments. This limitation could accelerate our cash tax payments and could result in a significant portion of our deferred tax assets expiring before we could fully use them. We do not believe that we have previously undergone an “ownership change” or that our tax attributes are currently subject to any such limitations. On April 27, 2012, we amended our Certificate of Incorporation to impose certain restrictions on the transfer of our common stock, although the restrictions will expire on April 27, 2015, without any further action by our Board of Directors or shareholders. These restrictions reduce, but do not eliminate, the risk of an “ownership change” in the future.
23
Changes in laws or regulations governing our operations or our failure to comply with those laws or regulations may adversely affect our business
We and our portfolio companies are subject to regulation by laws at the local, state, federal and foreign level, including with respect to securities laws, tax and accounting standards. These laws and regulations, as well as their interpretation, may be changed from time to time. Accordingly, any change in these laws or regulations or the failure to comply with these laws or regulations could have a material adverse impact on our business. Certain of these laws and regulations pertain specifically to BDCs.
A change in interest rates may adversely affect our profitability
Because we have funded a portion of our investments with borrowings, our earnings are affected by the spread between the interest rate on our investments and the interest rate at which we borrowed funds. We have attempted to match-fund our liabilities and assets by financing floating rate assets with floating rate liabilities and fixed rate assets with fixed rate liabilities or equity. We have entered and may enter into interest rate basis swap agreements to match the interest rate basis of a portion of our assets and liabilities, thereby locking in the spread between our asset yield and the cost of our borrowings, and to fulfill our obligations under the terms of any asset securitizations. However, such derivatives are considered economic hedges that do not qualify for hedge accounting under ASC Topic 815, Derivatives and Hedging (“ASC 815”). Therefore, payments under the hedges are recorded in net realized (loss) gain in our audited consolidated financial statements included in this Annual Report on Form 10-K.
Under any such interest rate swap agreements, we will generally pay a fixed rate and receive a floating interest rate based on LIBOR. We may enter into interest rate swaption agreements where, if exercised, we would receive a fixed rate and pay a floating rate based on LIBOR. We may also enter into interest rate cap agreements that would entitle us to receive an amount, if any, by which our interest payments on our variable rate debt exceed specified interest rates.
An increase or decrease in interest rates could reduce the spread between the rate at which we invest and the rate at which we borrow, and thus, adversely affect our profitability, if we have not appropriately match-funded our liabilities and assets or hedged against such event. Alternatively, our interest rate hedging activities may limit our ability to participate in the benefits of lower interest rates with respect to the hedged portfolio.
Also, the fair value of certain of our debt investments is based in part on the current market yields or interest rates of similar securities. A change in interest rates could have a significant impact on our determination of the fair value of these debt investments. In addition, a change in interest rates could also have an impact on the fair value of our interest rate swap agreements that could result in the recording of unrealized appreciation or depreciation in future periods. For example, a decline, or a flattening, of the forward interest rate yield curve will typically result in the recording of unrealized depreciation of our interest rate swap agreements.
Therefore, adverse developments resulting from changes in interest rates could have a material adverse effect on our business, financial condition and results of operations. See Item 7. Management’s Discussion and Analysis of Financial Condition and Results of Operations—Quantitative and Qualitative Disclosures About Market Risk and Item 8. Financial Statements and Supplementary Data for additional information on interest rate swap agreements.
A change in currency exchange rates may adversely affect our profitability
We have or may make investments in debt instruments that are denominated in currencies other than the U.S. dollar. In addition, we have or may make investments in the equity of portfolio companies whose functional currency is not the U.S. dollar. Our domestic portfolio companies may also transact a significant amount of business in foreign countries and therefore their profitability may be impacted by changes in foreign currency exchange rates. The functional currency of our consolidated portfolio company, European Capital, is the Euro. European Capital also has investments in other European currencies, including the British Pound. As a result, an adverse change in currency exchange rates may have a material adverse impact on our business, financial condition and results of operations.
We may experience fluctuations in our quarterly results
We have experienced and could experience material fluctuations in our quarterly operating results due to a number of factors including, among others, variations in and the timing of the recognition of realized and unrealized gains or losses, placing and removing investments on non-accrual status, the degree to which we encounter competition in our markets, the ability to sell investments at attractive terms, the ability to fund and close suitable investments, the timing of the recognition of fee income from closing investment transactions and general economic conditions. As a result of these factors, results for any period should not be relied upon as being indicative of performance in future periods. See Item 7. Management’s Discussion and Analysis of Financial Condition and Results of Operations.
24
We are dependent upon our key management personnel for our future success
We are dependent on the diligence and skill of our senior management and other members of management for raising capital and the selection, structuring, monitoring, restructuring/amendment, sale and exiting of our investments. Our future success depends to a significant extent on the continued service of our senior management and other members of management. Our failure to raise additional capital that would enhance the growth of our business, or our failure to provide appropriate opportunities for or compensate competitively senior management and other members of management may make it difficult to retain such individuals. The departure of certain executive officers or key employees could materially adversely affect our ability to implement our business strategy. We do not maintain key man life insurance on any of our officers or employees.
We operate in a highly competitive market for investment opportunities
We compete with strategic buyers and hundreds of private equity and mezzanine debt funds and other financing sources, including traditional financial services companies such as finance companies, commercial banks, investment banks and other equity and non-equity based investment funds. Some of our competitors are substantially larger and have considerably greater financial resources than us. Competitors may have lower cost of funds and many have access to funding sources that are not available to us. In addition, certain of our competitors may have higher risk tolerances or different risk assessments, which could allow them to offer better pricing and terms to prospective portfolio companies, consider a wider variety of investments and establish more relationships and build their market shares. There is no assurance that the competitive pressures we face will not have a material adverse effect on our business, financial condition and results of operations. In addition, as a result of this competition, we may not be able to take advantage of attractive investment opportunities from time to time and there can be no assurance that we will be able to identify and make investments that satisfy our investment objectives or that we will be able to meet our investment goals.
We could face losses and potential liability if intrusions, viruses or similar disruptions to our technology jeopardize our confidential information or that of users of our technology
Although we have implemented and will continue to implement security measures, our technology platform is and will continue to be vulnerable to intrusion, computer viruses or similar disruptive problems caused by transmission from unauthorized users. In addition, any misappropriation of proprietary information could expose us to a risk of loss or litigation.
Risks Related to Liquidity and Capital Resources
Our business is dependent on external financing
Our business requires a substantial amount of cash to operate. We historically have obtained the cash required for operations through the sale of certain senior loans originated by us, borrowings by us or special purpose affiliates and the sale of our equity. Our ability to continue to rely on such sources or other sources of capital depends on numerous legal, economic, structural and other factors and failure to obtain the cash required for operations could have a material adverse impact on our business.
Our secured and unsecured borrowing arrangements impose significant limitations on us
Our secured term loans (“Secured Term Loan Facility”) have scheduled amortization and mandatory prepayments in the event of a borrowing base deficiency or the issuance of new debt, and in certain cases, if there are realized proceeds from a portfolio company exit or excess cash flow. As of December 31, 2014, there was $446 million in principal outstanding under the Secured Term Loan Facility. Any loans that may be outstanding under our four-year $250 million secured revolving credit facility (“$250 Million Revolving Credit Facility”) are also subject to scheduled amortization after August 22, 2015 and mandatory prepayments in the event of a borrowing base deficiency.
The Secured Term Loan Facility and the $250 Million Revolving Credit Facility have covenants that in certain circumstances limit our ability to incur additional debt and liens, pay cash dividends, repurchase common stock, dispose of assets and make new investments and acquisitions. We are also prohibited from seeking to resume our status as a RIC and changing our regulatory status as a BDC. Both facilities require us to maintain a 100% borrowing base coverage. The $250 Million Revolving Credit Facility also includes other financial covenants that require us to maintain a maximum total leverage ratio not to exceed 0.75:1.00 and minimum adjusted EBITDA as defined in the $250 Million Revolving Credit Facility for ACAM. There can be no assurance that we will be able to maintain compliance with each of these covenants and a failure to do so could result in an event of default under the facilities. Other events of default under the Secured Term Loan Facility and the $250 Million Revolving Credit Facility include, without limitation, a payment default, an unremedied borrowing base deficiency, a cross default to our other facility, the cross acceleration of any debt in excess of an aggregate $50 million, the liquidation or bankruptcy of us or ACAM, the failure by us to conduct our asset management business through ACAM, one or more judgments in excess of an aggregate $50 million and a change of control.
25
Under the $750 million secured revolving credit facility with ACAS Funding I, LLC, a wholly-owned financing subsidiary, as borrower (the “$750 Million Revolving Credit Facility”) and the $500 million revolving credit facility with ACAS Funding II, LLC, a wholly-owned financing subsidiary, as borrower (the “$500 Million Revolving Credit Facility”), we have the ability to borrow, prepay and reborrow loans at any time prior to the commitment termination dates of May 27, 2016 and October 30, 2016, respectively, subject to certain terms and conditions. Any outstanding balance on the $750 Million Revolving Credit Facility and the $500 Million Revolving Credit Facility as of the commitment termination date is repayable on the maturity date of June 27, 2016 and October 31, 2016, respectively. As of December 31, 2014, the amount outstanding under the $750 Million Revolving Credit Facility and the $500 Million Revolving Credit Facility was $726 million and $51 million, respectively, which are secured by portfolio investments with fair values of $1,054 million and $315 million, respectively.
The $750 Million Revolving Credit Facility and the $500 Million Revolving Credit Facility have covenants that require the borrowers to maintain a minimum NAV and in certain circumstances limit their ability to incur additional debt and liens, pay cash dividends to us, dispose of assets and make new investments and acquisitions. There can be no assurance that we will be able to maintain compliance with each of these covenants and a failure to do so could result in an event of default under the facilities. Other events of default under the $750 Million Revolving Credit Facility and the $500 Million Revolving Credit Facility include, without limitation, a payment default, an unremedied borrowing base deficiency, the liquidation or bankruptcy of us, and the failure by us to maintain 100% ownership of each borrower.
The indenture relating to the issuance and sale by us of $350 million in aggregate principal amount of senior unsecured five-year notes (“Unsecured Private Notes”) contains restrictive covenants that, among other things, limit our ability to: (i) pay dividends or distributions, repurchase equity, prepay junior debt and make certain investments; (ii) incur additional debt and issue certain disqualified stock and preferred stock; (iii) incur certain liens; (iv) merge or consolidate with another company or sell substantially all of our assets; (v) enter into certain transactions with affiliates; and (vi) allow to exist certain restrictions on the ability of our subsidiaries to pay dividends or make other payments to us. The indenture also contains certain customary events of default. The occurrence of an event of default under the facilities could have a material adverse effect on our business, financial condition and results of operations.
The occurrence of an event of default under our borrowing arrangements could lead to termination of those facilities
Our borrowing arrangements contain certain default provisions, some of which are described in the immediately preceding paragraphs. An event of default under our borrowing arrangements could result, among other things, in termination of further funds availability under the facility, liquidation of the assets securing the facility, an accelerated maturity date for all amounts outstanding and the disruption of all or a portion of the business financed by the facility. This could reduce our revenues and, by delaying any cash payment allowed to us under the facility until the lender has been paid in full, reduce our liquidity and cash flow.
The 1940 Act limits our ability to issue Senior Securities in certain circumstances
As a BDC, the 1940 Act generally limits our ability to issue Senior Securities if our asset coverage ratio does not exceed 200% immediately after each issuance of Senior Securities or is improved immediately upon the issuance. Asset coverage ratio is defined in the 1940 Act as the ratio that the value of the total assets, less all liabilities and indebtedness not represented by Senior Securities, bears to the aggregate amount of Senior Securities representing indebtedness. We have operated at times in the past with our asset coverage ratio below 200% and there are no assurances that we will always operate above this ratio. The resulting restrictions on issuing Senior Securities could have a material adverse impact on our business operations.
The 1940 Act limits our ability to issue equity below our NAV per share
As a BDC, the 1940 Act generally limits our ability to issue and sell our common stock at a price below our NAV per share, exclusive of any distributing commission or discount, without shareholder approval. Since 2008, shares of our common stock have traded below our NAV per share. While our common stock continues to trade at a price below our NAV per share, there are no assurances that we can issue or sell shares of our common stock if needed to fund our business. In addition, even in certain instances where we could issue or sell shares of our common stock at a price below our NAV per share, such issuance could result in dilution in our NAV per share, which could result in a decline of our stock price.
We may enter into interest rate swap agreements with covenants that place limitations on us
From time to time, we enter into interest rate swap agreements to manage interest rate risk and also to fulfill our obligations under the terms of our asset securitizations. Our interest rate swap agreements may contain various events of default, including in certain cases an event of default that allows the counterparty to terminate transactions outstanding under the agreement following the occurrence of a cross default on certain of our other indebtedness. Our interest rate swap agreements may also contain an event of default that allows a counterparty to terminate transactions outstanding under the agreement if certain of our other indebtedness, as applicable, is accelerated. An event of default under certain of our interest rate swap agreements could also trigger a default under our secured debt facilities if such agreements are terminated early and would result in an aggregate amount due at such time
26
in excess of a certain amount. Our interest rate swap agreements may also be secured by first and second priority liens (subject to certain permitted liens) on substantially all of our non-securitized assets pari passu with other facilities, such as the Secured Term Loan Facility and the $250 Million Revolving Credit Facility or by a first priority lien (subject to certain permitted liens) on any securitized assets pari passu with our securitized debt. Thus, if we violate the covenants in any of such interest rate swap agreements, it could have a material adverse effect on our business, financial condition and results of operations.
The lack of liquidity in our privately-held securities may adversely affect our business
Most of our investments consist of securities acquired directly from their issuers in private transactions. Some of these securities are subject to restrictions on resale or otherwise are less liquid than public securities. The illiquidity of our investments may make it difficult for us to obtain cash equal to the value at which we record our investments upon exiting the investment.
Risks Related to Our Investing and Financing Strategy
We have and may incur additional debt that could increase your investment risks
We and certain of our consolidated affiliates have borrowed or may borrow money or issue debt securities, which give our lenders and the holder of our debt securities fixed dollar claims on our assets or the assets of such consolidated affiliates that are senior to the claims of our shareholders and, thus, our lenders may have preference over our shareholders with respect to these assets. In particular, our consolidated affiliates may pledge assets to lenders from time to time under asset securitizations that are sold or contributed to separate affiliated statutory trusts prior to such pledge. While we may own a beneficial interest in these trusts, such assets will be the property of the respective trusts, available to satisfy the debts of the trusts, and would only become available for distribution to our shareholders to the extent specifically permitted under the agreements governing those term debt notes. Additionally, we have granted a security interest in substantially all of our non-securitized assets to the lenders of our Secured Term Loan Facility and $250 Million Revolving Credit Facility, which impose certain limitations on us.
The following table is designed to illustrate the effect on returns to a holder of our common stock of the leverage created by our use of borrowing, at the weighted average interest rate of 4.9% for the year ended December 31, 2014, and assuming hypothetical annual returns on our portfolio of minus 15% to plus 15%. As illustrated below, leverage generally increases the return to shareholders when the portfolio return is positive and decreases the return when the portfolio return is negative. Actual returns may be greater or less than those appearing in the table.
Assumed Return on Portfolio (Net of Expenses)(1) | (15%) | (10%) | (5%) | —% | 5% | 10% | 15% |
Corresponding Return to Stockholders(2) | (22%) | (15%) | (8%) | (1%) | 6% | 13% | 20% |
(1) | The assumed portfolio return is required by regulation of the SEC and is not a prediction of, and does not represent, our projected or actual performance. |
(2) | In order to compute the “Corresponding Return to Shareholders,” the “Assumed Return on Portfolio” is multiplied by the total value of our assets at the beginning of the period to obtain an assumed return to us. From this amount, all interest expense accrued during the period is subtracted to determine the return available to shareholders. The return available to shareholders is then divided by the total value of our net assets as of the beginning of the period to determine the “Corresponding Return to Shareholders.” |
Although outstanding debt increases the potential for gain, it also increases the risk of loss of income or capital. This is the case, whether we are impacted by an increase or decrease in income or due to increases or decreases in asset values. Our ability to pay dividends is similarly impacted by outstanding debt.
Our credit ratings may not reflect all risks of an investment in our debt securities
Our credit ratings are an assessment by major debt rating agencies of our ability to pay our obligations. Consequently, actual or expected changes in our credit ratings will likely affect the market value of our traded debt securities. Our credit ratings, however, may not fully or accurately reflect all of the credit and market risks associated with our outstanding debt securities.
We may not realize gains from our equity investments
We invest in equity assets with the goal to realize income and gains from the performance and disposition of these assets. Some or all of these equity assets may not produce income or gains; accordingly, we may not be able to realize income or gains from our equity assets.
27
Our portfolio companies may be highly leveraged with debt
The debt levels of our portfolio companies may have important adverse consequences to such companies and to us as an investor. Portfolio companies that are indebted may be subject to restrictive financial and operating covenants. The leverage may impair these companies’ ability to finance their future operations and capital needs. As a result, their flexibility to respond to changing business and economic conditions and to business opportunities may be limited. A company’s income and net worth will tend to increase or decrease at a greater rate than if the company did not capitalize itself in part with debt.
One of our investments has subjected us to Nevada gaming regulation, which could affect our operations and changes in our ownership
Our portfolio company, Hard 8 Games, LLC (“Hard 8”), conducts activities that are subject to the Nevada Gaming Control Act and regulations of the Nevada Gaming Commission (“NGC”), the State Gaming Control Board (“GCB”), and the local laws, regulations and ordinances of various county and municipal regulatory authorities (collectively referred to as “the Nevada Gaming Authorities”). As a controlling member of Hard 8, we have been required to register with the Nevada Gaming Authorities as a publicly traded corporation and have been found suitable as a member of Hard 8. Also, certain of our officers and directors have been required to be found suitable and be licensed by the Nevada Gaming Authorities. We are required to make periodic reports to the Nevada Gaming Authorities and, in certain cases, may need to obtain the prior approval of the NGC for certain capital raising transactions.
In addition, beneficial holders of 5% or more of our voting securities may be required to make certain filings with the Nevada Gaming Authorities and beneficial holders of greater than 10% of our voting securities are required to file an application, be investigated, and be found suitable by the Nevada Gaming Authorities. Certain entities considered to be institutional investors who are holding our voting securities for investment purposes only may seek a waiver of this finding of suitability requirement. An applicant for licensing or a finding of suitability is required to pay all costs of the GCB investigation. Entities that fail to comply with these requirements may be guilty of a criminal offense. Thus, for so long as we are a controlling member of Hard 8, changes in control of American Capital through merger, consolidation, acquisition of assets or stock, management or otherwise may not occur without complying with Nevada law, including approval of the NGC. Also, persons having a material relationship or involvement with an entity proposing to acquire control of us would need to be investigated and licensed as part of the approval process relating to a change of control transaction.
Investments in non-investment grade Structured Products may be illiquid, may have a higher risk of default, and may not produce current returns
Our investments in Structured Products securities are generally non-investment grade. Non-investment grade Structured Products bonds and preferred shares tend to be illiquid, have a higher risk of default and may be more difficult to value than investment grade bonds. Recessions or poor economic or pricing conditions in the markets associated with Structured Products may cause higher defaults or losses than expected on these bonds and preferred shares. Non-investment grade securities are considered speculative, and their capacity to pay principal and interest in accordance with the terms of their issue is not certain.
Our assets include investments in Structured Products that are subordinate in right of payment to more senior securities
Our assets include subordinated CLO, CDO and CMBS securities, which are subordinated classes of securities in a structure of securities secured by a pool of loans. Accordingly, such securities are the first or among the first to bear the loss upon a restructuring or liquidation of the underlying collateral and the last to receive payment of interest and principal. Thus, there is generally only a nominal amount of equity or other debt securities junior to our positions, if any, issued in such structures. Additionally, the estimated fair values of our subordinated interests tend to be much more sensitive to changes in economic conditions than more senior securities.
The trading market or market value of our debt securities may fluctuate
Many factors may materially adversely affect the trading market for, and market value of, our debt securities including, but not limited to, the following:
• | future defaults under the securities; |
• | our creditworthiness; |
• | the time remaining to the maturity of these debt securities; |
• | the outstanding principal amount of debt securities with terms identical to these debt securities; |
• | the supply of debt securities trading in the secondary market, if any; |
• | the redemption or repayment features, if any, of these debt securities; |
28
• | the level, direction and volatility of market interest rates generally; and |
• | market rates of interest that are higher or lower than rates borne by the debt securities. |
There may also be a limited number of buyers when an investor decides to sell its debt securities. This too may materially adversely affect the market value of the debt securities or the trading market for the debt securities.
We may issue preferred stock in the future to help finance our business, which would magnify the potential for gain or loss and the risks of investing in us in the same way as our borrowings
Preferred stock, which is another form of leverage, has the same risks to our common shareholders as borrowings because the dividends on any preferred stock we issue must be cumulative. Payment of such dividends and repayment of the liquidation preference of such preferred stock must take preference over any dividends or other payments to our common shareholders, and preferred shareholders are not subject to any of our expenses or losses and are not entitled to participate in any income or appreciation in excess of their stated preference.
We have restrictions on the type of assets we can invest in as a BDC
As a BDC, we may not acquire any assets other than certain qualifying assets described in the 1940 Act, unless, at the time of and after giving effect to the acquisition, at least 70% of our total assets consist of such qualifying assets. Thus, in certain instances, we may be precluded from investing in potentially attractive investments that are not qualifying assets for purposes of the 1940 Act. In addition, there is a risk that this restriction could prevent us from making additional investments in our existing non-qualifying investments, which could cause our position to be diluted or limit the access to capital of our non-qualifying investments.
There are conflicts of interest with other funds that we manage
Through our wholly-owned portfolio company, ACAM, we manage various funds that may compete with us for investments. Although we have policies in place to seek to mitigate the effects of conflicts of interest, these policies will not eliminate the conflicts of interest that our officers and employees and the officers and employees of our fund managers and affiliates will face in making investment decisions on behalf of American Capital or any other American Capital-sponsored investment vehicles. Further, we do not have any agreement or understanding with our funds that would give us any priority over them in opportunities to invest in overlapping investments. Accordingly, we may compete for access to investments with other funds that we manage.
Risks Related to Our Common Stock
We may not pay any cash dividends
We are subject to federal and applicable state corporate income taxes on our taxable ordinary income and capital gains beginning with our tax year ended September 30, 2011, and are not subject to the annual distribution requirements under Subchapter M of the Code. We have not paid a cash dividend during the last four fiscal years ended December 31, 2014 and there can be no assurance that we will pay any cash dividends in the future as we may retain our earnings to facilitate the growth of our business, to invest, to provide liquidity, to repurchase our shares or for other corporate purposes.
Future equity issuances may be on terms adverse to shareholder interests
We may issue equity capital at prices below our NAV per share with shareholder approval. As of the date of this filing, we do not have such authorization; however, we may seek such approval in the future or we may elect to conduct a rights offering, which would not require shareholder approval under the 1940 Act. If we issue any shares of common stock below our NAV per share, the interests of our existing shareholders may be diluted. Any such dilution could include a reduction in our NAV per share as a result of the issuance of shares at a price below the NAV per share and a decrease in a shareholder’s interest in our earnings and assets and voting interest. As of December 31, 2014, the closing price of our common stock was below our NAV per share.
The following table is designed to illustrate the dilutive effect on NAV per share if we issue shares of common stock below our NAV per share. The table below reflects NAV per share diluted for the hypothetical issuance of 50,000,000 shares of common stock (about 19% of outstanding shares as of December 31, 2014), at hypothetical sales prices of 5%, 10%, 15%, 20%, 25% and 50% below the December 31, 2014 NAV of $20.50 per share.
Assumed Sales price per share below NAV per share(1) | (50%) | (25%) | (20%) | (15%) | (10%) | (5%) |
Diluted NAV per share | $18.89 | $19.70 | $19.86 | $20.02 | $20.18 | $20.34 |
% Dilution | (7.9%) | (3.9%) | (3.1%) | (2.4%) | (1.6%) | (0.8%) |
(1) | The assumed sales price per share is assumed to be net of any applicable underwriting commissions or discounts. |
29
The market price of our common stock may fluctuate significantly
The market price and marketability of shares of our securities may from time to time be significantly affected by numerous factors, including many over which we have no control and that may not be directly related to us. These factors include the following:
• | price and volume fluctuations in the stock market from time to time, which are often unrelated to the operating performance of particular companies; |
• | defaulting on our debt covenants; |
• | significant volatility in the market price and trading volume of securities of BDCs, financial service companies, asset managers or other companies in our sector, which is not necessarily related to the operating performance of particular companies; |
• | changes in laws, regulatory policies, tax guidelines or financial accounting standards, particularly with respect to BDCs; |
• | changes in our earnings or variations in operating results; |
• | any shortfall in revenue or net income or any increase in losses from levels expected by securities analysts and the market in general; |
• | decreases in our NAV per share; |
• | general economic trends and other external factors; and |
• | loss of a major funding source. |
Fluctuations in the trading price of our common stock may adversely affect the liquidity of the trading market for our common stock and, in the event that we seek to raise capital through future equity financings, our ability to raise such equity capital.
Our common stock may be difficult to resell
Investors may not be able to resell shares of common stock at or above their purchase prices due to a number of factors, including:
• | actual or anticipated fluctuation in our operating results; |
• | volatility in our common stock price; |
• | changes in expectations as to our future financial performance or changes in financial estimates of securities analysts; and |
• | departures of key personnel. |
Provisions of our Charter and Bylaws could deter takeover attempts
Our charter and bylaws and the Delaware General Corporation Law contain certain provisions that may have the effect of discouraging and delaying or making more difficult a change in control. For example, we are subject to Section 203 of the Delaware General Corporation Law, which prohibits business combinations with interested shareholders except in certain cases. The existence of these provisions may negatively impact the price of our common stock and may discourage third-party bids. These provisions may also reduce any premiums paid to our shareholders for shares of our common stock that they own.
Item 1B. | Unresolved Staff Comments |
None.
Item 2. | Properties |
We do not own any real estate or other physical properties materially important to our operations. We lease office space in six locations for terms ranging up to twelve years.
Item 3. | Legal Proceedings |
Neither we, nor any of our consolidated subsidiaries, are currently subject to any material litigation nor, to our knowledge, is any material litigation threatened against us or any consolidated subsidiary, other than routine litigation and administrative proceedings arising in the ordinary course of business. Such proceedings are not expected to have a material adverse effect on the business, financial conditions, or results of our operations.
30
Item 4. | Mine Safety Disclosures |
Not applicable.
31
PART II.
Item 5. | Market for Registrant’s Common Equity, Related Stockholder Matters and Issuer Purchases of Equity Securities |
Quarterly Stock Prices
Our common stock is quoted on The NASDAQ Global Select Market under the ticker symbol “ACAS”. As of February 13, 2015, we had 687 shareholders of record. Most of the shares of our common stock are held by brokers and other institutions on behalf of shareholders. We believe that there are approximately 77,000 additional beneficial holders of our common stock. During the years ended December 31, 2014 and 2013, we did not declare any dividends on our common stock. The following table sets forth the range of quarterly high and low sales prices of our common stock as reported on The NASDAQ Global Select Market for the years ended December 31, 2014 and 2013:
Sales Prices | |||||||
High | Low | ||||||
2014 | |||||||
First Quarter | $ | 16.37 | $ | 14.01 | |||
Second Quarter | $ | 16.03 | $ | 14.24 | |||
Third Quarter | $ | 15.77 | $ | 14.16 | |||
Fourth Quarter | $ | 16.10 | $ | 13.59 | |||
2013 | |||||||
First Quarter | $ | 15.24 | $ | 12.19 | |||
Second Quarter | $ | 15.20 | $ | 11.82 | |||
Third Quarter | $ | 13.94 | $ | 12.42 | |||
Fourth Quarter | $ | 15.67 | $ | 13.38 | |||
Dividend Reinvestment Plan
At the option of a holder of record of common stock, all cash distributions can be reinvested automatically under our dividend reinvestment plan (“DRIP”) in additional whole and fractional shares. Pursuant to our DRIP, a shareholder whose shares are registered in his own name may opt in to the plan and elect to reinvest all or a portion of his or her dividends in shares of our common stock by providing the required enrollment notice to the plan administrator, Computershare Investor Services. Shareholders whose shares are held in the name of a broker or the nominee of a broker may have distributions reinvested only if such service is provided by the broker or the nominee, or if the broker or the nominee permits participation in our DRIP. Shareholders whose shares are held in the name of a broker or other nominee should contact the broker or nominee for details. Shareholders that participate in the DRIP will receive the number of whole or fractional shares that can be obtained based on the price per share the plan administrator purchases the shares of common stock. Such shares will be acquired by the plan administrator through either receipt of newly issued shares or treasury shares from us or by purchase of outstanding shares of common stock on the open market. If the market price per share of our common stock on the dividend payment date does not exceed 110% of the NAV per share of our common stock as of the end of the most recently completed fiscal quarter (or as of such other time as may be determined by our Board of Directors), then our plan administrator will acquire shares of our common stock directly from us at a price equal to the greater of NAV per share or the market price on that date at a 2% discount. However, (i) if the market price per share of our common stock on the dividend payment date does not exceed 110% of the NAV per share of our common stock as of the end of the most recently completed fiscal quarter or (ii) if we advise the plan administrator that since such NAV per share was last determined we have become aware of events that indicate the possibility of a change in NAV per share as a result of which the NAV per share of the common stock on the dividend payment date might be higher than the current market price per share of our common stock, then the plan administrator will not acquire any newly issued shares from us at a discount and instead will buy shares of our common stock in the open market. You can find out more information about the DRIP by reading our Third Amended and Restated Dividend Reinvestment Plan, a copy of which is located on our internet website at www.AmericanCapital.com.
Our stock transfer agent, registrar and DRIP administrator is Computershare Investor Services. Requests for information from Computershare can be sent to Computershare Investor Services, P.O. Box 30170, College Station, TX 77842-3170, or calling (800) 733-5001 (U.S. and Canada) (781) 575-3400 (outside U.S. and Canada) or through the Internet, at www.computershare.com.
For the three fiscal years ended December 31, 2014, we have not sold any equity securities that were not registered under the Securities Act.
32
Equity Compensation Plans
The following table summarizes information, as of December 31, 2014, relating to our equity compensation plans pursuant to which grants of options or other rights to acquire shares of our common stock may be granted from time to time. See Item 8. Financial Statements and Supplementary Data—Notes to Consolidated Financial Statements for a description of our equity compensation plans (shares in millions).
Plan category | Number of securities to be issued upon exercise of outstanding options | Weighted-average exercise price of outstanding options | Number of securities remaining available for future issuance under equity compensation plans (excluding securities reflected in the first column of this table) | |||||||
Equity compensation plans approved by security holders(1) | 45.1 | $ | 9.21 | 3.7 | ||||||
Equity compensation plans not approved by security holders(1) | — | — | — | |||||||
Total | 45.1 | $ | 9.21 | 3.7 | ||||||
(1) | All of our equity compensation plans have been approved by our shareholders. |
33
Performance Graph
The performance graph below compares the total cumulative shareholder return on our common stock with the cumulative shareholder return on the equity securities of companies included in the Standard & Poor’s 500 Stock Index (“S&P 500”), S&P 500 Financials Sector Index and BDC Peer Group, measured as of the last trading day of each year shown. The performance graph represents past performance and should not be considered to be an indication of future performance.
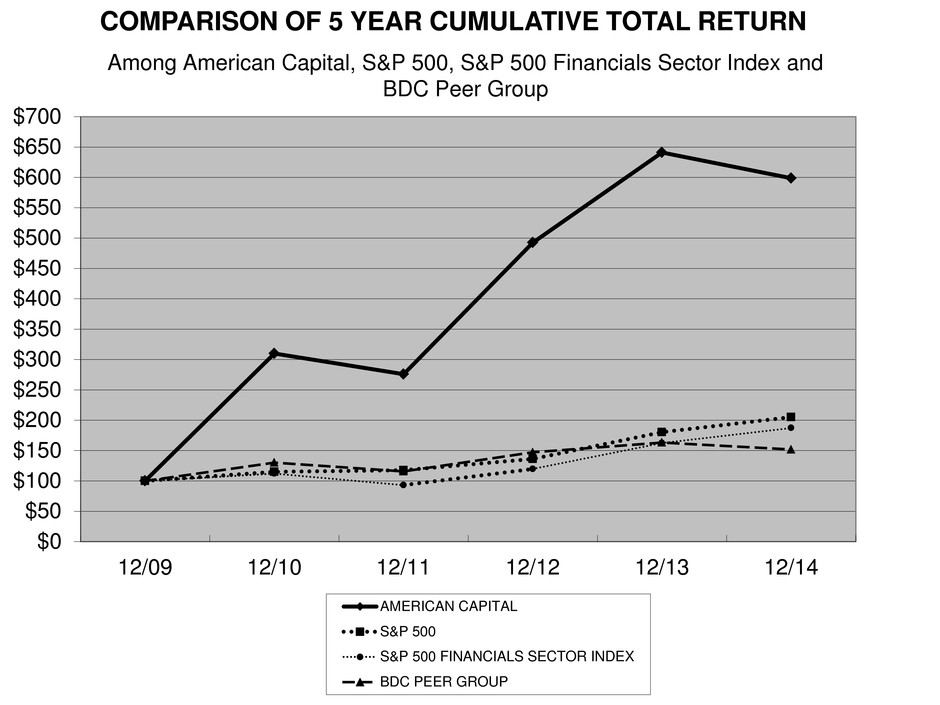
The preceding graph and the following table compares a shareholder’s cumulative total return for the last five fiscal years, assuming $100 invested as of December 31, 2009, with the reinvestment of all dividends without commissions, as if such amounts had been invested in: (i) our common stock; (ii) the stocks included in the S&P 500; (iii) the stocks included in the S&P 500 Financials Sector Index; and (iv) an index of selected issuers in our BDC Peer Group, composed of Apollo Investment Corporation, Ares Capital Corporation, BlackRock Kelso Capital Corporation, PennantPark Investment Corporation and Prospect Capital Corporation.
Cumulative Total Return | |||||||||||||||||||||||
12/09 | 12/10 | 12/11 | 12/12 | 12/13 | 12/14 | ||||||||||||||||||
AMERICAN CAPITAL | $ | 100 | $ | 310 | $ | 276 | $ | 493 | $ | 641 | $ | 599 | |||||||||||
S&P 500 | 100 | 115 | 117 | 136 | 180 | 205 | |||||||||||||||||
S&P 500 FINANCIALS SECTOR INDEX | 100 | 112 | 93 | 120 | 162 | 187 | |||||||||||||||||
BDC PEER GROUP | 100 | 122 | 110 | 140 | 168 | 162 | |||||||||||||||||
34
Item 6.Selected Financial Data
AMERICAN CAPITAL, LTD.
Consolidated Selected Financial Data
(in millions, except per share data)
The selected financial data should be read in conjunction with our audited consolidated financial statements and related notes thereto and “Management’s Discussion and Analysis of Financial Condition and Results of Operations” included in this Annual Report on Form 10-K and notes thereto.
As of and For the Year Ended December 31, | |||||||||||||||||||
2014 | 2013 | 2012 | 2011 | 2010 | |||||||||||||||
Total operating revenue | $ | 471 | $ | 487 | $ | 646 | $ | 591 | $ | 600 | |||||||||
Total operating expenses | 288 | 255 | 263 | 288 | 396 | ||||||||||||||
Net operating income before income taxes | 183 | 232 | 383 | 303 | 204 | ||||||||||||||
Tax (provision) benefit(1) | (66 | ) | (76 | ) | 14 | 145 | — | ||||||||||||
Net operating income (“NOI”) | 117 | 156 | 397 | 448 | 204 | ||||||||||||||
Loss on extinguishment of debt, net of tax | — | — | (3 | ) | — | — | |||||||||||||
Net realized gain (loss), net of tax(1) | 152 | (55 | ) | (270 | ) | (310 | ) | (576 | ) | ||||||||||
Net realized earnings (loss) | 269 | 101 | 124 | 138 | (372 | ) | |||||||||||||
Net unrealized appreciation, net of tax(1) | 165 | 83 | 1,012 | 836 | 1,370 | ||||||||||||||
Net increase in net assets resulting from operations (“Net earnings ”) | $ | 434 | $ | 184 | $ | 1,136 | $ | 974 | $ | 998 | |||||||||
Per share data: | |||||||||||||||||||
NOI: | |||||||||||||||||||
Basic | $ | 0.44 | $ | 0.53 | $ | 1.24 | $ | 1.30 | $ | 0.63 | |||||||||
Diluted | $ | 0.42 | $ | 0.51 | $ | 1.20 | $ | 1.26 | $ | 0.62 | |||||||||
Net earnings: | |||||||||||||||||||
Basic | $ | 1.62 | $ | 0.63 | $ | 3.55 | $ | 2.83 | $ | 3.06 | |||||||||
Diluted | $ | 1.55 | $ | 0.61 | $ | 3.44 | $ | 2.74 | $ | 3.02 | |||||||||
Balance sheet data: | |||||||||||||||||||
Total assets | $ | 7,640 | $ | 6,009 | $ | 6,319 | $ | 5,961 | $ | 6,084 | |||||||||
Total debt | $ | 1,703 | $ | 791 | $ | 775 | $ | 1,251 | $ | 2,259 | |||||||||
Total shareholders’ equity | $ | 5,472 | $ | 5,126 | $ | 5,429 | $ | 4,563 | $ | 3,668 | |||||||||
NAV per share | $ | 20.50 | $ | 18.97 | $ | 17.84 | $ | 13.87 | $ | 10.71 | |||||||||
Other data (unaudited): | |||||||||||||||||||
Number of portfolio companies at period end | 402 | 132 | 139 | 152 | 160 | ||||||||||||||
New investments(2) | $ | 3,610 | $ | 1,107 | $ | 719 | $ | 317 | $ | 234 | |||||||||
Realizations(3) | $ | 2,765 | $ | 1,208 | $ | 1,498 | $ | 1,066 | $ | 1,293 | |||||||||
Weighted average effective interest rate on debt investments at period end(4) | 6.6 | % | 10.0 | % | 11.4 | % | 10.7 | % | 10.2 | % | |||||||||
NOI return on average shareholders’ equity(5) | 2.2 | % | 2.9 | % | 7.7 | % | 10.7 | % | 6.8 | % | |||||||||
Net realized earnings return (loss) on average shareholders’ equity(5) | 5.1 | % | 1.9 | % | 2.4 | % | 3.3 | % | (12.5 | %) | |||||||||
Net earnings return on average shareholders’ equity(5) | 8.2 | % | 3.4 | % | 22.1 | % | 23.3 | % | 33.5 | % | |||||||||
Assets under management(6) | $ | 86,422 | $ | 93,210 | $ | 116,800 | $ | 68,129 | $ | 22,645 | |||||||||
Earning assets under management(7) | $ | 21,869 | $ | 18,613 | $ | 18,642 | $ | 13,496 | $ | 8,989 | |||||||||
(1) | Beginning in 2011, we were no longer taxed as a RIC under Subchapter M of the Code and instead became subject to taxation as a corporation under Subchapter C of the Code. As a result, we recorded a net deferred tax asset of $428 million in 2011 recorded as a deferred tax benefit of $145 million in NOI, $75 million in net realized (loss) gain and $208 million in net unrealized appreciation (depreciation). |
(2) | New investments include amounts as of the investment dates that are committed. |
(3) | Realizations represent cash proceeds received upon the exit of investments including payment of scheduled principal amortization, debt prepayments, proceeds from loan syndications and sales, payment of accrued PIK notes, and dividends and payments associated with accreted original issue discounts (“OID”) and sale of equity and other securities. |
35
(4) | Weighted average effective interest rate on debt investments as of period end is computed as (a) annual stated interest rate or yield earned plus the net annual amortization of OID and market discount earned on accruing debt investments, divided by (b) total debt investments at amortized cost. |
(5) | Return represents net increase or decrease in net assets resulting from operations. Average equity is calculated based on the quarterly shareholders' equity balances. |
(6) | Assets under management include both (i) the total assets of American Capital and (ii) the total assets of the funds under management by ACAM, excluding any direct investment we have in those funds. |
(7) | Earning assets under management include both (i) the total assets of American Capital and (ii) the total third-party earning assets under management by ACAM from which the associated base management fees are calculated, excluding any direct investment we have in those funds. |
36
Item 7. | Management’s Discussion and Analysis of Financial Condition and Results of Operations (in millions, except per share data) |
Forward-Looking Statements
All statements contained herein that are not historical facts including, but not limited to, statements regarding anticipated activity are forward looking in nature and involve a number of risks and uncertainties. Actual results may differ materially. Among the factors that could cause actual results to differ materially are the following: (i) changes in the economic conditions in which we operate negatively impacting our financial resources; (ii) certain of our competitors have greater financial resources than us, reducing the number of suitable investment opportunities offered to us or reducing the yield necessary to consummate the investment; (iii) there is uncertainty regarding the value of our privately-held securities that require our good faith estimate of fair value, and a change in estimate could affect our NAV; (iv) our investments in securities of privately-held companies may be illiquid, which could affect our ability to realize the investment; (v) our portfolio companies could default on their loans or provide no returns on our investments, which could affect our operating results; (vi) we use external financing to fund our business, which may not always be available; (vii) our ability to retain key management personnel; (viii) an economic downturn or recession could impair our portfolio companies and therefore harm our operating results; (ix) our borrowing arrangements impose certain restrictions; (x) changes in interest rates may affect our cost of capital and NOI; (xi) we cannot incur additional indebtedness unless immediately after a debt issuance we maintain an asset coverage of at least 200%, or equal to or greater than our asset coverage prior to such issuance, which may affect returns to our shareholder; (xii) our common stock price may be volatile; and (xiii) general business and economic conditions and other risk factors described in our reports filed from time to time with the SEC. For a discussion of the risks and uncertainties which could cause actual results to differ from those contained in the forward-looking statements, please see the information under the caption “Risk Factors” described in this Annual Report on Form 10-K. We caution readers not to place undue reliance on any such forward-looking statements, which are made pursuant to the Private Securities Litigation Reform Act of 1995 and, as such, speak only as of the date made.
Investing Activity
We primarily invest in senior and mezzanine debt and equity of middle and large market companies. We and ACAM also invest in assets that could be sold or contributed to public or private funds that ACAM could manage, as a means of “incubating” such funds. Currently, we will invest up to $600 million in a single middle market company in North America and Europe. We also have investments in Structured Products, including CLO, CDO and CMBS securities and invest in funds managed by us.
We seek to be a long-term partner with our portfolio companies. As a long-term partner, we will invest capital in a portfolio company subsequent to our initial investment if we believe that it can achieve appropriate returns for our investment. Add-on financings to our portfolio companies fund (i) strategic acquisitions by a portfolio company of either a complete business or specific lines of a business that are related to the portfolio company’s business, (ii) recapitalization of a portfolio company to raise financing on better terms, buyout one or several owners or to pay a dividend, (iii) growth of the portfolio company such as product development or plant expansions, or (iv) working capital for a portfolio company, sometimes in distressed situations, that needs capital to fund operating costs, debt service or growth in receivables or inventory.
The total fair value of our investment portfolio was $6.3 billion, $5.1 billion and $5.3 billion as of December 31, 2014, 2013 and 2012, respectively. Our new investments totaled $3.6 billion, $1.1 billion and $0.7 billion during the years ended December 31, 2014, 2013 and 2012, respectively.
37
The aggregate dollar amount of new investments by type, use and business line were as follows (in millions):
Type | 2014 | 2013 | 2012 | ||||||||
First Lien Senior Debt | $ | 2,039 | $ | 103 | $ | 309 | |||||
Second Lien Senior Debt | 589 | 511 | 108 | ||||||||
Mezzanine Debt | 10 | — | 56 | ||||||||
Preferred Equity | 35 | 125 | 87 | ||||||||
Common Equity | 405 | 236 | 150 | ||||||||
Structured Products | 532 | 132 | 9 | ||||||||
Total by security type | $ | 3,610 | $ | 1,107 | $ | 719 | |||||
Use | 2014 | 2013 | 2012 | ||||||||
Senior Floating Rate Loans | $ | 1,891 | $ | — | $ | — | |||||
Sponsor Finance Investments | 597 | 125 | 109 | ||||||||
Structured Products | 512 | 75 | 4 | ||||||||
Investments in ACAM and Fund Development | 437 | 271 | 121 | ||||||||
European Capital(1) | 39 | — | 50 | ||||||||
American Capital One Stop Buyouts® | — | 27 | 301 | ||||||||
Add-on financing for growth and working capital | 116 | 56 | 22 | ||||||||
Add-on financing for working capital in distressed situations | 14 | 42 | 22 | ||||||||
Add-on financing for recapitalizations, not including distressed investments | 4 | 104 | 71 | ||||||||
Add-on financing for acquisitions | — | 391 | 19 | ||||||||
Add-on financing for purchase of debt of a portfolio company | — | 16 | — | ||||||||
Total by use | $ | 3,610 | $ | 1,107 | $ | 719 | |||||
Business Line | 2014 | 2013 | 2012 | ||||||||
Senior Floating Rate Loans | $ | 1,891 | $ | — | $ | — | |||||
Sponsor Finance Investments | 689 | 258 | 193 | ||||||||
Structured Products | 512 | 75 | 4 | ||||||||
Investments in ACAM and Fund Development | 437 | 271 | 121 | ||||||||
American Capital One Stop Buyouts® | 42 | 503 | 351 | ||||||||
European Capital(1) | 39 | — | 50 | ||||||||
Total by business line | $ | 3,610 | $ | 1,107 | $ | 719 | |||||
(1) | Effective October 1, 2014, European Capital’s financial results as of and for the three months ended December 31, 2014 have been consolidated with the financial results of American Capital for the same period. Prior to October 1, 2014, our European Capital business line cash proceeds are comprised of dividend distributions on our equity investment in European Capital. Effective October 1, 2014, our European Capital business line cash proceeds are comprised of cash proceeds from realizations and repayments on European Capital’s portfolio investments. |
38
We received cash proceeds from realizations and repayments of portfolio investments by source and business line as follows (in millions):
Source | 2014 | 2013 | 2012 | ||||||||
Equity investments | $ | 1,523 | $ | 362 | $ | 274 | |||||
Principal prepayments | 699 | 604 | 938 | ||||||||
Payment of accrued PIK notes and dividend and accreted OID | 389 | 187 | 242 | ||||||||
Loan syndications and sales | 98 | 41 | 41 | ||||||||
Scheduled principal amortization | 56 | 14 | 3 | ||||||||
Total by source | $ | 2,765 | $ | 1,208 | $ | 1,498 | |||||
Business Line | 2014 | 2013 | 2012 | ||||||||
American Capital One Stop Buyouts® | $ | 1,167 | $ | 530 | $ | 927 | |||||
European Capital(1) | 651 | 195 | — | ||||||||
Sponsor Finance Investments | 386 | 444 | 528 | ||||||||
American Capital Asset Management | 206 | 12 | 15 | ||||||||
Structured Products | 192 | 27 | 28 | ||||||||
Senior Floating Rate Loans | 163 | — | — | ||||||||
Total by business line | $ | 2,765 | $ | 1,208 | $ | 1,498 | |||||
(1) | Effective October 1, 2014, European Capital’s financial results as of and for the three months ended December 31, 2014 have been consolidated with the financial results of American Capital for the same period. Prior to October 1, 2014, our European Capital business line cash proceeds are comprised of dividend distributions on our equity investment in European Capital. Effective October 1, 2014, our European Capital business line cash proceeds are comprised of cash proceeds from realizations and repayments on European Capital’s portfolio investments. |
39
Results of Operations
The following analysis of our financial condition and results of operations should be read in conjunction with our audited consolidated financial statements included in this Annual Report on Form 10-K and the notes thereto.
Our consolidated financial performance, as reflected in our consolidated statements of operations, is composed of the following three primary elements:
• | The first element is “NOI,” which is primarily the interest, dividends, prepayment fees, finance and transaction fees and portfolio company management fees earned from investing in debt and equity securities and the fees we earn from fund asset management, less our operating expenses and provision or benefit for income taxes. |
• | The second element is “Net realized gain (loss),” which reflects the difference between the proceeds from an exit of an investment and the cost at which the investment was carried on our consolidated balance sheets and periodic interest settlements and termination receipts or payments on derivatives, foreign currency transaction gains or losses and taxes on realized gains or losses. |
• | The third element is “Net unrealized appreciation (depreciation),” which is the net change in the estimated fair value of our portfolio investments and of our interest rate derivatives at the end of the period compared with their estimated fair values at the beginning of the period or their stated costs, as appropriate, and taxes on unrealized gains or losses. In addition, our net unrealized depreciation includes the foreign currency translation from converting the cost basis of our assets and liabilities denominated in a foreign currency to the U.S. dollar. |
The consolidated operating results were as follows (in millions):
2014 | 2013 | 2012 | |||||||||
Operating revenue | $ | 471 | $ | 487 | $ | 646 | |||||
Operating expenses | 288 | 255 | 263 | ||||||||
NOI before income taxes | 183 | 232 | 383 | ||||||||
Tax (provision) benefit | (66 | ) | (76 | ) | 14 | ||||||
NOI | 117 | 156 | 397 | ||||||||
Loss on extinguishment of debt, net of tax | — | — | (3 | ) | |||||||
Net realized gain (loss), net of tax | 152 | (55 | ) | (270 | ) | ||||||
Net realized earnings | 269 | 101 | 124 | ||||||||
Net unrealized appreciation, net of tax | 165 | 83 | 1,012 | ||||||||
Net earnings | $ | 434 | $ | 184 | $ | 1,136 | |||||
40
Operating Revenue
We derive the majority of our operating revenue from our investments in senior and mezzanine debt and equity of middle market companies and our investments in Structured Products, as well as dividend income from our fund management business which is conducted through ACAM.
Operating Revenue by Business Line
Operating revenue by business line was as follows (in millions):
Business Line | 2014 | 2013 | 2012 | ||||||||
American Capital One Stop Buyouts® | $ | 194 | $ | 145 | $ | 336 | |||||
American Capital Asset Management | 111 | 133 | 107 | ||||||||
Structured Products | 65 | 72 | 67 | ||||||||
Sponsor Finance Investments | 56 | 131 | 130 | ||||||||
Senior Floating Rate Loans | 33 | — | — | ||||||||
European Capital(1) | 12 | 6 | 6 | ||||||||
Total by business line | $ | 471 | $ | 487 | $ | 646 | |||||
——————————
(1) | Effective October 1, 2014, European Capital’s financial results as of and for the three months ended December 31, 2014 have been consolidated with the financial results of American Capital for the same period. |
American Capital One Stop Buyouts®
Interest, dividend and fee income from our American Capital One Stop Buyouts® increased by $49 million, or 34%, for the year ended December 31, 2014 over the comparable period in 2013, primarily due to additional dividend income as a result of the removal of certain preferred equity securities from non-accrual status as a result of improved portfolio company performance. Interest, dividend and fee income from our American Capital One Stop Buyouts® decreased by $191 million, or 57%, for the year ended December 31, 2013 over the comparable period in 2012, primarily due to reserves on accrued PIK interest and dividend income as a result of the addition of certain securities to non-accrual status due to decreased portfolio company performance.
American Capital Asset Management
Dividend and fee income from ACAM decreased by $22 million, or 17%, for the year ended December 31, 2014 over the comparable period in 2013, primarily due to reduced dividend income for the management of AGNC and MTGE due to a decrease in the assets under management for these funds as well as increased costs associated with fund development activities. This was partially offset by an increase in the funds under management of ACAM, primarily ACSF, ACAS CLO 2013-1, ACAS CLO 2013-2, ACAS CLO 2014-1 and ACAS CLO 2014-2. Dividend and fee income from ACAM increased by $26 million, or 24%, for the year ended December 31, 2013 over the comparable period in 2012, primarily due to an increase in fees earned for the management of AGNC and MTGE, both of which experienced growth as a result of follow-on equity offerings partially offset by share repurchases and realized losses, as well as fees earned for the management of ACAS CLO 2013-1 and ACAS CLO 2013-2.
Sponsor Finance Investments
Interest, dividend and fee income from our Sponsor Finance Investments decreased by $75 million, or 57%, for the year ended December 31, 2014 over the comparable period in 2013, primarily due to reserves on accrued PIK interest and dividend income as a result of the addition of certain securities to non-accrual status due to decreased portfolio company performance. Interest, dividend and fee income from our Sponsor Finance Investments increased by $1 million, or 1%, for the year ended December 31, 2013 over the comparable period in 2012.
Structured Products
Interest income on Structured Products investments decreased by $7 million, or 10%, for the year ended December 31, 2014 over the comparable period in 2013, primarily due to the accelerated recognition of income on CLO investments in 2013 due to higher projected payments. During 2014, we realized cash proceeds of $192 million and recognized interest income of $65 million from our Structured Products investments. Interest income on Structured Products investments increased by $5 million, or 7%, for the year ended December 31, 2013 over the comparable period in 2012, primarily due to higher actual and projected payments on our CLO investments. Our weighted average Structured Products investments outstanding increased by $75 million, or 20%, for the year ended December 31, 2014 over the comparable period in 2013, primarily as a result of new investments in CLO securities. Our weighted average Structured Products investments outstanding decreased by $44 million, or 11%, for the
41
year ended December 31, 2013 over the comparable period in 2012, primarily as a result of the write-off of non-performing CMBS investments in 2013.
In accordance with ASC Topic 325-40, Investments-Other, Beneficial Interests in Securitized Financial Assets (“ASC 325-40”), in the event that the estimated cash flows of an investment decrease below the current amortized cost used to determine the yield, we may be required to write down the current amortized cost by projected credit losses or to fair value (“Reference Amount”). We are precluded from reversing the write down for any subsequent increase in the estimated cash flows of an investment with the effect of increasing total interest income over the life of the investment and increasing the realized loss recorded at the exit of the investment by the amount of the write down. As of December 31, 2014, in aggregate, the amortized cost basis of our Structured Products investment portfolio exceeded the Reference Amount by approximately $75 million.
See Note 2—Interest and Dividend Income Recognition policy to our audited consolidated financial statements included in this Annual Report on Form 10-K for a description of how projected cash flows affect revenue recognition on our Structured Products investments.
Senior Floating Rate Loans
We initiated our Senior Floating Rate Loan portfolio in 2014 with the purchase of $1.9 billion of investments. Interest income on these loans was $33 million for the year ended December 31, 2014. The monthly weighted average effective interest rate on our Senior Floating Rate Loans portfolio was 4.1% for the year ended December 31, 2014, on a monthly weighted average balance of $814 million.
European Capital
European Capital’s operating revenue for the fourth quarter of 2014 was $12 million, comprised of $11 million of interest income on European Capital debt investments and $1 million of income on European Capital CLO investments. We received interest income from European Capital of $6 million for each of the years ended December 31, 2013 and 2012 related to interest payments on our unsecured revolving credit facility with European Capital.
American Capital Operating Revenue (excluding the financial results related to the consolidation of European Capital)
2014 | 2013 | 2012 | |||||||||
Interest income on debt investments | $ | 190 | $ | 209 | $ | 274 | |||||
Interest income on Structured Products investments | 65 | 72 | 67 | ||||||||
Dividend income from equity investments, excluding ACAM | 63 | 36 | 161 | ||||||||
Dividend income from ACAM | 82 | 105 | 83 | ||||||||
Other interest income | 1 | 1 | 1 | ||||||||
Interest and dividend income | 401 | 423 | 586 | ||||||||
Portfolio company advisory and administrative fees | 10 | 17 | 16 | ||||||||
Advisory and administrative services - ACAM | 27 | 26 | 20 | ||||||||
Other fees | 21 | 21 | 24 | ||||||||
Fee income | 58 | 64 | 60 | ||||||||
Total operating revenue | $ | 459 | $ | 487 | $ | 646 | |||||
42
American Capital Interest and Dividend Income (excluding the financial results related to the consolidation of European Capital)
The following table summarizes selected data for our debt (excluding SFRLs), Structured Products and equity investments outstanding, at cost (dollars in millions):
2014 | 2013 | 2012 | |||||||||
Debt investments at cost(1) | $ | 1,640 | $ | 1,821 | $ | 2,302 | |||||
Average non-accrual debt investments at cost(2) | $ | 272 | $ | 302 | $ | 361 | |||||
Effective interest rate on debt investments | 9.6 | % | 11.5 | % | 11.9 | % | |||||
Effective interest rate on debt investments, excluding non-accrual prior period adjustments | 10.2 | % | 10.7 | % | 11.7 | % | |||||
Structured Products investments at cost(1) | $ | 445 | $ | 370 | $ | 414 | |||||
Effective interest rate on Structured Products investments | 14.6 | % | 19.4 | % | 16.2 | % | |||||
Debt and Structured Products investments at cost(1) | $ | 2,085 | $ | 2,191 | $ | 2,716 | |||||
Effective interest rate on debt and Structured Products investments | 10.7 | % | 12.8 | % | 12.6 | % | |||||
Average daily one-month LIBOR | 0.2 | % | 0.2 | % | 0.2 | % | |||||
Equity investments at cost(1)(3) | $ | 1,662 | $ | 2,025 | $ | 2,101 | |||||
Effective dividend yield on equity investments(3) | 3.8 | % | 1.8 | % | 7.5 | % | |||||
Effective dividend yield on equity investments, excluding non-accrual prior period adjustments(3) | 3.9 | % | 4.1 | % | 5.7 | % | |||||
Debt, Structured Products and equity investments at cost(1)(3) | $ | 3,747 | $ | 4,216 | $ | 4,817 | |||||
Effective yield on debt, Structured Products and equity investments(3) | 7.6 | % | 7.5 | % | 10.4 | % | |||||
Effective yield on debt, Structured Products and equity investments, excluding non-accrual prior period adjustments(3) | 7.9 | % | 8.3 | % | 9.5 | % | |||||
——————————
(1) | Monthly weighted average of investments at cost. |
(2) | Quarterly average of investments at cost. |
(3) | Excludes our equity investment in ACAM and our investment in European Capital through September 30, 2014. |
Debt Investments
Interest income on debt investments decreased by $19 million, or 9%, for the year ended December 31, 2014 over the comparable period in 2013, primarily due to the net negative impact from non-accrual investments in 2014 compared to 2013. Our weighted average debt investments outstanding decreased by $181 million for the year ended December 31, 2014 over the comparable period in 2013, primarily as a result of repayment or sale of debt investments. The average non-accrual debt investments outstanding decreased from $302 million during 2013 to $272 million during 2014.
Interest income on debt investments decreased by $65 million, or 24%, for the year ended December 31, 2013 over the comparable period in 2012, primarily due to the decrease in our monthly weighted average debt investments outstanding. Our weighted average debt investments outstanding decreased by $481 million for the year ended December 31, 2013 over the comparable period in 2012, primarily as a result of repayment or sale of debt investments. In addition, the average non-accrual debt investments outstanding decreased from $361 million during 2012 to $302 million during 2013.
When a debt investment is placed on non-accrual, we may record reserves on uncollected PIK interest income recorded in prior periods as a reduction of interest income in the current period. Conversely, when a debt investment is removed from non-accrual, we may record interest income in the current period on prior period uncollected PIK interest income which was reserved in prior periods. For the year ended December 31, 2014, we recorded a net reserve on uncollected PIK interest income recorded in prior periods of $10 million as a result of debt investments being placed on non-accrual, which had an approximate 60 basis point negative impact on the effective interest rate on debt investments. For the years ended December 31, 2013 and 2012, we recorded additional interest income on uncollected PIK interest income recorded in prior periods of $14 million and $6 million, respectively, as a result of debt investments being removed from non-accrual, which had an approximate 80 basis point and 20 basis point positive impact, respectively, on the effective interest rate on debt investments.
Equity Investments, Excluding ACAM
Dividend income from equity investments, excluding ACAM, increased by $27 million, or 75%, for the year ended December 31, 2014 over the comparable period in 2013, due to the following:
• | for the year ended December 31, 2014, we recorded reserves on accrued PIK dividend income recorded in prior periods from preferred equity investments of $2 million; however, for the year ended December 31, 2013, we recorded reserves |
43
on accrued PIK dividend income recorded in prior periods from preferred equity investments of $46 million resulting in a $44 million year-over-year net positive impact;
• | for the year ended December 31, 2014, we recorded $34 million of dividend income for non-recurring dividends on common equity investments compared to $16 million for the year ended December 31, 2013, resulting in an $18 million year-over-year net positive impact; partially offset by |
• | a decrease of $705 million in the cost basis of accruing equity investments as of December 31, 2014 compared to December 31, 2013. |
As a result, the monthly weighted average effective dividend yield on equity investments was 3.8% for the year ended December 31, 2014, a 200 basis point increase over the comparable period in 2013.
Dividend income from equity investments, excluding ACAM, decreased by $125 million, or 78%, for the year ended December 31, 2013 over the comparable period in 2012, due to the following:
• | for the year ended December 31, 2013, we recorded reserves on accrued PIK dividend income recorded in prior periods from preferred equity investments of $46 million; however, for the year ended December 31, 2012, we recorded dividend income for the reversal of reserves of accrued dividend income attributable to prior periods from preferred equity investments of $37 million, resulting in an $83 million year-over-year net negative impact; |
• | for the year ended December 31, 2013, we recorded $16 million of dividend income for non-recurring dividends on common equity investments compared to $36 million for the year ended December 31, 2012, resulting in a $20 million year-over-year negative impact; and |
• | a decrease of $73 million in the cost basis of accruing equity investments as of December 31, 2013 compared to December 31, 2012. |
As a result, the monthly weighted average effective dividend yield on equity investments was 1.8% for the year ended December 31, 2013, a 570 basis point decrease from the comparable period in 2012.
When a preferred equity investment is placed on non-accrual, we may record net reserves on uncollected accrued dividend income recorded in prior periods as a reduction of dividend income in the current period. Conversely, when a preferred equity investment is removed from non-accrual, we may record dividend income in the current period for prior period uncollected accrued dividend income which was reserved in prior periods.
Equity Investments - ACAM
Dividend income from ACAM decreased by $23 million, or 22%, for the year ended December 31, 2014 over the comparable period in 2013, primarily due to a decrease in fees earned for the management of AGNC and MTGE due to a decline in their equity as a result of repurchases of common stock and realized losses as well as increased costs associated with fund development activities. This was partially offset by an increase in the funds under management of ACAM, primarily ACSF, ACAS CLO 2013-1, ACAS CLO 2013-2, ACAS CLO 2014-1 and ACAS CLO 2014-2.
Dividend income from ACAM increased by $22 million, or 27%, for the year ended December 31, 2013, over the comparable period in 2012, primarily due to an increase in fees earned for the management of AGNC and MTGE, both of which experienced growth as a result of follow-on equity offerings partially offset by share repurchases and realized losses, as well as fees earned for the management of ACAS CLO 2013-1 and ACAS CLO 2013-2.
For the years ended December 31, 2014, 2013 and 2012, we received an additional $11 million, $6 million and $9 million, respectively, of dividends from ACAM which were recorded as a reduction to the cost basis of our investment in ACAM.
Fee Income
Portfolio Company Advisory and Administrative Fees
As a BDC, we are required by law to make significant managerial assistance available to most of our portfolio companies. This generally includes providing guidance and counsel concerning the management, operations and business objectives and policies of the portfolio company to its management and board of directors, including participating on the company’s board of directors. Our portfolio company advisory and administrative fees for the years ended December 31, 2014, 2013 and 2012 were $10 million, $17 million and $16 million, respectively. Our portfolio company advisory and administrative fees decreased by $7 million, or 41%, for the year ended December 31, 2014 over the comparable period in 2013, primarily due to a decrease in the number of our operating portfolio companies.
Advisory and Administrative Services - ACAM
We have entered into service agreements with ACAM to provide additional asset management and administrative service support so that ACAM can fulfill its responsibilities under its management agreements. The fees generated from these service
44
agreements for the years ended December 31, 2014, 2013 and 2012 were $27 million, $26 million and $20 million, respectively. The fees generated from these service agreements increased by $6 million, or 30%, for the year ended December 31, 2013 over the comparable period in 2012 due to an increase in the funds under management of ACAM, primarily ACAS CLO 2012-1, ACAS CLO 2013-1 and ACAS CLO 2013-2.
Other Fees
Other fees are primarily composed of transaction fees for structuring, financing and executing portfolio transactions, which may not be recurring in nature. These fees amounted to $21 million, $21 million and $24 million, for the years ended December 31, 2014, 2013 and 2012, respectively.
Operating Expenses
Operating expenses increased by $33 million, or 13%, for the year ended December 31, 2014 over the comparable period in 2013 and by $8 million, or 3%, for the year ended December 31, 2013 over the comparable period in 2012. Operating expenses consisted of the following (in millions):
2014 | 2013 | 2012 | |||||||||
Interest | $ | 54 | $ | 44 | $ | 59 | |||||
Salaries, benefits and stock-based compensation | 168 | 156 | 148 | ||||||||
European Capital management fees | 5 | — | — | ||||||||
General and administrative | 61 | 55 | 56 | ||||||||
Total operating expenses | $ | 288 | $ | 255 | $ | 263 | |||||
Interest
Interest expense increased by $10 million, or 23%, for the year ended December 31, 2014, over the comparable period in 2013, primarily due to an increase in the daily weighted average debt balance partially offset by a decrease in the weighted average interest rate on our borrowings. The weighted average interest rate on all of our borrowings, including amortization of deferred financing costs, for the years ended December 31, 2014 and 2013 was 4.9% and 6.4%, respectively. The weighted average interest rate on all of our borrowings, excluding amortization of deferred financing costs, for the years ended December 31, 2014 and 2013 was 4.3% and 5.3%, respectively.
Interest expense decreased by $15 million, or 25%, for the year ended December 31, 2013, over the comparable period in 2012. The decrease in interest expense was primarily attributable to a decrease in the weighted average interest rate on outstanding borrowings for the year ended December 31, 2013 over the comparable period in 2012 as a result of our debt refinancing in August 2012 and the continued paydown of our asset securitizations.
As discussed in Note 2 to these consolidated financial statements, we consolidated our investment in European Capital effective October 1, 2014. For the quarter ended December 31, 2014, we recorded $1 million of interest expense related to European Capital’s debt.
Salaries, Benefits and Stock-based Compensation
Salaries, benefits and stock-based compensation consisted of the following (in millions):
2014 | 2013 | 2012 | |||||||||
Base salaries | $ | 57 | $ | 61 | $ | 55 | |||||
Incentive compensation | 43 | 52 | 40 | ||||||||
Benefits | 12 | 12 | 11 | ||||||||
Stock-based compensation | 37 | 31 | 42 | ||||||||
Severance related costs | 19 | — | — | ||||||||
Total salaries, benefits and stock-based compensation | $ | 168 | $ | 156 | $ | 148 | |||||
Due to changes in the composition of our investment portfolio and market conditions, we conducted strategic reviews of our business in the fourth quarter of 2014, which resulted in a workforce reduction of approximately 13% of our employees and the closing of one of our offices as well as the elimination of certain functions at other offices. In conjunction with the restructuring, the vesting of any unvested stock options held by impacted employees as of the date of their separation was accelerated, and they were given a period of up to one year from their separation date, or less if the expiration of the option was within one year from their separation date, to exercise all outstanding options. We have recorded charges for severance and related employee costs of
45
$19 million for the year ended December 31, 2014, including $11 million from the modification of stock options and $8 million for severance costs.
Salaries, benefits and stock-based compensation for the year ended December 31, 2014 increased $12 million, or 8%, from the comparable period in 2013 primarily due to (i) $5 million of stock-based compensation expense due to the acceleration of vesting on outstanding stock options for certain employees in conjunction with the ACE III transaction, (ii) $11 million of stock-based compensation expense due to the acceleration of stock options associated with the workforce reduction and (iii) $8 million in severance costs associated with the workforce reduction. Salaries, benefits and stock-based compensation for the year ended December 31, 2013 increased $8 million, or 5%, from the comparable period in 2012 primarily due to an increase in the number of employees and an increase in base salaries for non-executive officers and incentive compensation partially offset by a reduction in stock-based compensation. As of December 31, 2014, we employed 366 full-time employees, which included 138 employees at ACAM, compared to 394 and 340 full-time employees as of December 31, 2013 and 2012, respectively.
In 2014, we granted 0.1 million stock options with a weighted average fair value of $6.89 per option, or $1 million. In 2013, we granted 3.7 million stock options with a weighted average fair value of $5.88 per option, or $22 million, and in 2012, we granted 8.8 million stock options with a weighted average fair value of $4.97 per option, or $44 million. See Note 5 and Note 6 to our audited consolidated financial statements included in this Annual Report on Form 10-K for further discussion on stock-based compensation.
European Capital Management Fees
Management fees represent fees charged by European Capital Asset Management Limited, a wholly-owned subsidiary of ACAM, to European Capital for management and other services during the fourth quarter of 2014. These fees are recorded as operating revenue in ACAM’s statement of operations and are a component of the dividend income we receive from ACAM.
General and administrative
General and administrative expenses increased by $6 million, or 11%, for the year ended December 31, 2014, over the comparable period in 2013, primarily due to charges of approximately $5 million recorded during the fourth quarter of 2014 related to subleasing excess office facilities during the quarter.
As discussed in Note 2 to these consolidated financial statements, we consolidated our investment in European Capital effective October 1, 2014. For the quarter ended December 31, 2014, we recorded less than $1 million of general and administrative expenses related to European Capital.
Tax (Provision) Benefit
Our tax (provision) benefit consisted of the following (in millions):
2014 | 2013 | 2012 | |||||||||
Tax (provision) benefit - net operating income | $ | (66 | ) | $ | (76 | ) | $ | 14 | |||
Tax (provision) benefit - net realized gain (loss) | (53 | ) | 60 | 87 | |||||||
Tax benefit - loss on extinguishment of debt | — | — | 2 | ||||||||
Tax benefit (provision) - net unrealized appreciation | 55 | (37 | ) | (82 | ) | ||||||
Total tax (provision) benefit | $ | (64 | ) | $ | (53 | ) | $ | 21 | |||
During our tax year ended September 30, 2011, we became subject to taxation as a corporation under Subchapter C of the Code. During the year ended December 31, 2014, our effective tax rate was less than the statutory rate due to the reduction of our valuation allowance caused by appreciation in our capital investments and the consolidation of AC Corporate Holdings, Inc. that allowed us to reclassify certain capital deferred tax assets to ordinary deferred tax assets. During the year ended December 31, 2013, our tax rate was less than the statutory rate primarily due to rate differences on dividend income and a change in the state tax rate. During the year ended December 31, 2012, our effective tax rate was less than the statutory rate due to the reduction of our valuation allowance on our capital deferred tax assets caused by appreciation in our capital investments. See Note 11 to our audited consolidated financial statements included in this Annual Report on Form 10-K for further discussion of income taxes.
46
Net Realized Gain (Loss)
Our net realized gain (loss) consisted of the following individual portfolio company realized gains (losses) greater than $15 million (in millions):
2014 | 2013 | 2012 | |||||||||
FB Raphael 1 Limited (“Farrow & Ball”) (European Capital portfolio company) | $ | 213 | $ | — | $ | — | |||||
Sale to American Capital Equity III, LP | 107 | — | — | ||||||||
Unwired Holdings, Inc. | 53 | — | — | ||||||||
Specialty Brands Holdings, Inc. | 35 | — | — | ||||||||
SPL Acquisition Corp. | 33 | — | — | ||||||||
Anchor Drilling Fluids USA, Inc. | 21 | — | — | ||||||||
DelStar, Inc. | — | 44 | — | ||||||||
Mirion Technologies, Inc. | — | 27 | 1 | ||||||||
Orchard Brands Corporation | — | 16 | — | ||||||||
Other, net | 12 | 30 | 65 | ||||||||
Total gross realized portfolio gain | 474 | 117 | 66 | ||||||||
CH Holding Corp. | (50 | ) | — | — | |||||||
FL Acquisitions Holdings, Inc. | (33 | ) | — | — | |||||||
Egenera, Inc. | (28 | ) | — | — | |||||||
Neways Holdings, L.P. | (16 | ) | — | — | |||||||
FPI Holding Corporation | (15 | ) | (13 | ) | (81 | ) | |||||
Rebellion Media Group Corp. | (15 | ) | — | — | |||||||
Fosbel Global Services (LUXCO) S.C.A. | — | (40 | ) | — | |||||||
Paradigm Precision Holdings, LLC | — | (30 | ) | — | |||||||
Wachovia Bank Commercial Mortgage Trust, Series 2007-C34 | — | (27 | ) | (4 | ) | ||||||
LB-UBS Commercial Mortgage Trust, Series 2007-C6 | — | (15 | ) | — | |||||||
Small Smiles Holding Company, LLC | — | — | (66 | ) | |||||||
Halex Holdings Inc. | — | — | (27 | ) | |||||||
FreeConference.com, Inc. | — | — | (24 | ) | |||||||
Wachovia Bank Commercial Mortgage Trust, Series 2007-C32 | — | — | (23 | ) | |||||||
Contec, LLC | — | — | (17 | ) | |||||||
Other, net | (54 | ) | (96 | ) | (95 | ) | |||||
Total gross realized portfolio loss | (211 | ) | (221 | ) | (337 | ) | |||||
Total net realized portfolio gain (loss) | 263 | (104 | ) | (271 | ) | ||||||
Derivative agreements | 4 | (14 | ) | (87 | ) | ||||||
WRH, Inc. equity option | (45 | ) | — | — | |||||||
Foreign currency transactions | (17 | ) | 3 | 1 | |||||||
Tax (provision) benefit | (53 | ) | 60 | 87 | |||||||
Total net realized gain (loss) | $ | 152 | $ | (55 | ) | $ | (270 | ) | |||
The following are summary descriptions of portfolio companies with realized gains or losses equal to or greater than $30 million.
During 2014, European Capital’s portfolio company, Farrow & Ball, was sold. As part of the sale, we received $367 million in cash proceeds, realizing a gain of $213 million partially offset by a reversal of unrealized appreciation of $173 million.
47
During 2014, we completed a $1.1 billion private placement of partnership interests in American Capital Equity III, LP (“ACE III” or “the Fund”), a new private equity fund focused on investing in U.S. companies in the lower middle market. Concurrent with the private placement, we entered into a Contribution and Redemption Agreement with the Fund pursuant to which we agreed to contribute 100% of our equity and equity-related investments in seven portfolio companies (Affordable Care Holding Corp., Avalon Laboratories Holding Corp., CIBT Investment Holdings, LLC, FAMS Acquisition, Inc., Mirion Technologies, Inc., PHI Acquisitions, Inc. and SMG Holdings, Inc.) to the Fund and to provide the Fund with an option to acquire our equity investment in WRH, Inc. (the “Equity Option”), in exchange for partnership interests in the Fund. During the year ended December 31, 2014, we recognized a net realized gain of $62 million on the transaction. This was comprised of a $107 million net realized gain on the redemption of our partnership interests in ACE III and a realized loss of $45 million related to the fair value of the Equity Option.
During 2014, our portfolio company, Unwired Holdings, Inc., was sold. As part of the sale, we received $138 million in cash proceeds, realizing a gain of $53 million offset by a reversal of unrealized appreciation of $65 million. We also expect to receive $2 million of additional cash proceeds from this sale that remain held in a sale escrow as of December 31, 2014, which are recorded in the financial statement line item other assets in our consolidated balance sheets.
During 2014, our portfolio company, Specialty Brands Holdings, Inc., was sold. As part of the sale, we received $51 million in cash proceeds, realizing a gain of $35 million offset by a reversal of unrealized appreciation of $38 million. We also expect to receive $3 million of additional cash proceeds from this sale that remain held in a sale escrow as of December 31, 2014, which are recorded in the financial statement line item other assets in our consolidated balance sheets.
During 2014, our portfolio company, SPL Acquisition Corp., was sold. As part of the sale, we received $192 million in cash proceeds, realizing a gain of $33 million offset by a reversal of unrealized appreciation of $33 million. We also expect to receive $18 million of additional cash proceeds from this sale that remain held in a sale escrow as of December 31, 2014, which are recorded in the financial statement line item other assets in our consolidated balance sheets. Furthermore, as of December 31, 2014, we accrued an additional $3 million at fair value for additional proceeds contingent upon drug approval by the U.S. Food and Drug Administration and revenue earnout payments after certain milestones are achieved.
During 2014, our portfolio company, CH Holding Corp., was sold. As part of the sale, we received $6 million in cash proceeds, realizing a loss of $50 million offset by a reversal of unrealized depreciation of $49 million. We also expect to receive $1 million of additional cash proceeds from this sale that remain held in a sale escrow as of December 31, 2014, which are recorded in the financial statement line item other assets in our consolidated balance sheets.
During 2014, our portfolio company, FL Acquisitions Holdings, Inc., was sold. As part of the sale, we received $62 million in cash proceeds, realizing a loss of $33 million offset by a reversal of unrealized depreciation of $35 million. We also expect to receive $5 million of additional cash proceeds from this sale that remain held in a sale escrow as of December 31, 2014, which are recorded in the financial statement line item other assets in our consolidated balance sheets.
During 2013, our portfolio company DelStar, Inc. was sold. As part of the sale, we received $93 million in cash proceeds, realizing a gain of $44 million partially offset by a reversal of unrealized appreciation of $43 million. We also expect to receive $5 million of additional cash proceeds from this sale that remain held in a sale escrow as of December 31, 2014, which are recorded in the financial statement line item other assets in our consolidated balance sheets.
During 2013, due to declining performance, we wrote off a portion of our unsecured mezzanine debt investments in Fosbel Global Services (LUXCO) S.C.A. and realized a loss of $40 million, which was offset by a reversal of unrealized depreciation of $40 million.
During 2013, our portfolio company Paradigm Precision Holdings, LLC was sold. As part of the sale, we received $122 million in cash proceeds, realizing a loss of $30 million partially offset by a reversal of unrealized depreciation of $10 million. We also expect to receive $3 million of additional cash proceeds from this sale that remain held in a sale escrow as of December 31, 2014, which are recorded in the financial statement line item other assets in our consolidated balance sheets.
During 2012, due to declining performance, we wrote off all of our equity investments and mezzanine debt investments in FPI Holding Corporation (“FPI”) and realized a loss of $81 million, which was offset by a reversal of unrealized depreciation of $81 million. In the second quarter of 2013, we wrote off all of our senior term debt investments in FPI and realized a loss of $13 million, which was offset by a reversal of unrealized depreciation of $13 million.
During 2012, a U.S. Bankruptcy Court issued an order authorizing the sale of substantially all of the assets of Small Smiles Holding Company, LLC (“Small Smiles”). The fair value of the consideration we received was zero. Accordingly, in the second quarter of 2012, we wrote off all of our equity and senior debt investments in Small Smiles and realized a loss of $66 million, which was offset by a reversal of unrealized depreciation of $66 million.
We have entered into interest rate swap agreements in which we pay a fixed rate and receive a floating rate based on LIBOR. The net interest payments or receipts are recorded as a realized gain (loss) on the interest settlement dates. For the years ended
48
December 31, 2014, 2013 and 2012, we recorded a realized loss of $3 million, $6 million and $25 million, respectively, for net interest rate derivative periodic interest payments due to the significant decline in LIBOR as compared to LIBOR at the date of the origination of the interest rate swap agreements. For the years ended December 31, 2013 and 2012, we made $13 million and $62 million, respectively, in early termination payments to terminate certain derivative agreements, which were offset by a reversal of unrealized depreciation of $13 million and $55 million, respectively. For the years ended December 31, 2014 and 2013, we received $7 million and $5 million, respectively, in cash settlements on our total return swap transactions.
Net Unrealized Appreciation (Depreciation)
The following table itemizes the change in our net unrealized appreciation (depreciation) (in millions):
2014 | 2013 | 2012 | |||||||||
Gross unrealized appreciation of American Capital One Stop Buyouts® | $ | 220 | $ | 190 | $ | 270 | |||||
Gross unrealized depreciation of American Capital One Stop Buyouts® | (267 | ) | (292 | ) | (173 | ) | |||||
Gross unrealized appreciation of Sponsor Finance Investments | 72 | 91 | 142 | ||||||||
Gross unrealized depreciation of Sponsor Finance Investments | (61 | ) | (106 | ) | (45 | ) | |||||
Gross unrealized appreciation of European Capital investments | 26 | — | — | ||||||||
Gross unrealized depreciation of European Capital investments | (19 | ) | — | — | |||||||
Net unrealized appreciation of investment in European Capital | 167 | 281 | 146 | ||||||||
Net unrealized appreciation (depreciation) of investment in European Capital's foreign currency translation | 14 | (14 | ) | (19 | ) | ||||||
Net unrealized appreciation (depreciation) of ACAM | 222 | (165 | ) | 329 | |||||||
Net unrealized depreciation of Senior Floating Rate Loans | (24 | ) | — | — | |||||||
Net unrealized appreciation of MTGE | — | — | 12 | ||||||||
Net unrealized appreciation (depreciation) of Structured Products investments | 5 | (41 | ) | 47 | |||||||
Reversal of prior period net unrealized (appreciation) depreciation upon realization | (206 | ) | 105 | 296 | |||||||
Net unrealized appreciation of portfolio investments | 149 | 49 | 1,005 | ||||||||
Net unrealized appreciation due to consolidation of European Capital | 87 | — | — | ||||||||
Foreign currency translation - investment in European Capital | (75 | ) | 49 | 26 | |||||||
Foreign currency translation - European Capital investments | 11 | — | — | ||||||||
Foreign currency translation - other | (10 | ) | 3 | 1 | |||||||
Derivative agreements and other | (24 | ) | 19 | 62 | |||||||
WRH, Inc. Equity Option | (28 | ) | — | — | |||||||
Tax benefit (provision) | 55 | (37 | ) | (82 | ) | ||||||
Net unrealized appreciation | $ | 165 | $ | 83 | $ | 1,012 | |||||
See our “Investment Valuation Policy” in Note 2 to our audited consolidated financial statements included in this Annual Report on Form 10-K for a description of our valuation methodologies.
American Capital One Stop Buyouts®
For the year ended December 31, 2014, American Capital One Stop Buyouts® experienced $47 million of net unrealized depreciation driven by the ACE III transaction and specific company performance. For the year ended December 31, 2013, American Capital One Stop Buyouts® experienced $102 million of net unrealized depreciation driven primarily by declining specific company performance. For the year ended December 31, 2012, American Capital One Stop Buyouts® experienced $97 million of net unrealized appreciation driven primarily by improved company performance, multiple expansion of comparable companies and narrowing investment spreads.
Sponsor Finance Investments
For the year ended December 31, 2014, Sponsor Finance Investments experienced $11 million of net unrealized appreciation driven primarily by improved specific company performance. For the year ended December 31, 2013, Sponsor Finance Investments experienced $15 million of net unrealized depreciation driven primarily by declining specific company performance. For the year ended December 31, 2012, Sponsor Finance Investments experienced $97 million of net unrealized appreciation driven primarily by improved specific company performance and narrowing investment spreads.
49
European Capital
As discussed in Note 2 to these consolidated financial statements, we consolidated our investment in European Capital effective October 1, 2014. For the quarter ended December 31, 2014, we recorded $5 million of net unrealized appreciation on the consolidated European Capital investment portfolio.
For the nine months ended September 30, 2014, we recognized unrealized appreciation of $181 million on our investment in European Capital, composed of $167 million unrealized appreciation on our investment and $14 million of unrealized appreciation from foreign currency translation of the cumulative unrealized appreciation of our European Capital investment. For the year ended December 31, 2013, we recognized net unrealized appreciation of $267 million on our investment in European Capital composed of $281 million unrealized appreciation on our investment and $14 million of unrealized depreciation from foreign currency translation of the cumulative unrealized depreciation of our European Capital investment. For the year ended December 31, 2012, we recognized net unrealized appreciation of $127 million on our investment in European Capital composed of $146 million unrealized appreciation on our investment and $19 million of unrealized depreciation from foreign currency translation of the cumulative unrealized depreciation of our European Capital investment.
For foreign currency denominated investments recorded at fair value, such as our European Capital portfolio investments, the net unrealized appreciation or depreciation from foreign currency translation on the accompanying consolidated statements of operations represents the economic impact of translating the cost basis of the investment from a foreign currency, such as the Euro, to the U.S. dollar. However, the economic impact of translating the cumulative unrealized appreciation or depreciation from a foreign currency to the U.S. dollar is not recorded as net unrealized depreciation or appreciation from foreign currency translation but rather is included as net unrealized appreciation or depreciation of portfolio company investments on the accompanying consolidated statements of operations.
For the nine months ended September 30, 2014, we recorded unrealized depreciation of $75 million for foreign currency translation on the cost basis in our European Capital investment. For the years ended December 31, 2013 and 2012, we recorded unrealized appreciation of $49 million and $26 million, respectively, for foreign currency translation on the cost basis in our European Capital investment.
During the nine months ended September 30, 2014 and years ended December 31, 2013 and 2012, the unrealized appreciation on our investment in European Capital of $167 million, $281 million and $146 million, respectively, excluding unrealized appreciation and depreciation on foreign currency translation, was due primarily to an increase in the NAV of European Capital and a reduction to the discount applied to NAV.
The following is a summary composition of European Capital’s NAV at fair value and our equity investment’s implied discount to European Capital’s NAV at fair value (€ and $ in millions) as of September 30, 2014 and December 31, 2013 and 2012:
September 30, 2014 | 2013 | 2012 | |||||||||
Debt investments at fair value | € | 293 | € | 406 | € | 786 | |||||
Equity investments at fair value | 439 | 364 | 341 | ||||||||
Other assets and liabilities, net | (17 | ) | 56 | 20 | |||||||
Third-party secured debt at cost | — | — | (250 | ) | |||||||
Third-party unsecured debt at cost | (112 | ) | (107 | ) | (109 | ) | |||||
American Capital unsecured debt at cost | — | — | (83 | ) | |||||||
NAV (Euros) | 603 | 719 | 705 | ||||||||
Exchange rate | 1.27 | 1.38 | 1.32 | ||||||||
NAV (U.S. dollars) | $ | 766 | $ | 992 | $ | 931 | |||||
Fair value of American Capital equity investment | $ | 678 | $ | 841 | 700 | ||||||
Implied discount to NAV | 11.5 | % | 15.2 | % | 24.8 | % | |||||
American Capital Asset Management, LLC
ACAM had a cost basis and fair value of $429 million and $1,164 million, respectively, as of December 31, 2014. During the year ended December 31, 2014, we recognized $222 million of unrealized appreciation on our investment in ACAM. The unrealized appreciation on our investment in ACAM for the year ended December 31, 2014 was primarily due to multiple expansion, increases in actual and forecasted growth for AGNC and MTGE and projected fees for managing ACE III, partially offset by increased costs associated with fund development activities.
50
During the year ended December 31, 2013, we recognized $165 million of unrealized depreciation. During the year ended December 31, 2012, we recognized $329 million of unrealized appreciation on our investment in ACAM. The unrealized depreciation on our investment in ACAM for the year ended December 31, 2013 was primarily due to a reduction in projected management fees for managing AGNC and MTGE due to a decrease in the equity capital of each company as a result of share repurchases and realized losses. The unrealized appreciation on our investment in ACAM for the year ended December 31, 2012 was primarily due to increases in the projected management fees for managing AGNC and MTGE due to significant growth in the equity capital of each company from follow-on equity offerings. During the years ended December 31, 2013 and 2012, AGNC raised $1.8 billion and $3.8 billion of equity capital, respectively. During the years ended December 31, 2013 and 2012, MTGE raised $584 million and $580 million of equity capital, respectively. During the year ended December 31, 2013, AGNC and MTGE repurchased $856 million and $154 million of common stock, respectively. During the year ended December 31, 2013, AGNC and MTGE had realized losses of $1.3 billion and $41 million, respectively.
Structured Products Investments
American Capital has investments in Structured Products (which includes investment and non-investment grade tranches of CLO, CDO and CMBS securities) with a cost basis and fair value of $622 million and $560 million, respectively, as of December 31, 2014. During 2014, we realized cash proceeds of $192 million and recognized interest income of $65 million from our Structured Products investments. During the year ended December 31, 2014, we recorded $5 million of net unrealized appreciation on our Structured Products investments primarily due to an increase in the fair value of marketable equity securities held within one of our CLO investments. During the year ended December 31, 2013, we recorded $41 million of net unrealized depreciation on our Structured Products investments primarily due to unrealized depreciation on our investments in CLO and CDO portfolios of commercial loans due to decreasing spreads on underlying collateral as investments are nearing the end of their life. During the year ended December 31, 2012, we recorded $47 million of net unrealized appreciation on our Structured Products investments primarily due to unrealized appreciation on our investments in CLO and CDO portfolios of commercial loans due to a narrowing of investments spreads, higher broker quotes and improved projected cash flows.
Derivative Agreements and Other and WRH, Inc. Equity Option
For interest rate agreements, we estimate the fair value based on the estimated net present value of the future cash flows using a forward interest rate yield curve in effect as of the end of the measurement period, adjusted for nonperformance risk, if any, including an evaluation of our credit risk and our counterparty’s credit risk. A negative fair value would represent an amount we would have to pay a third-party and a positive fair value would represent an amount we would receive from a third-party to assume our obligation under an interest rate agreement. The derivative agreements generally appreciate or depreciate primarily based on relative market interest rates and their remaining term to maturity as well as changes in our and our counterparty’s credit risk.
During the year ended December 31, 2014, we recorded $24 million of net unrealized depreciation from derivative agreements and other primarily due to a decrease in the fair value of contingent earnout payments related to the sale of SPL Acquisition Corp. During the year ended December 31, 2014, we recorded $28 million of unrealized depreciation on the WRH, Inc. Equity Option due to an increase in the fair value of the Equity Option. During the years ended December 31, 2013 and 2012, we recorded $19 million and $62 million of net unrealized appreciation from derivative agreements and other, respectively, primarily due to reversals of unrealized depreciation upon realization of losses for terminated interest rate derivative agreements. The fair value of the liability for our derivative agreements as of December 31, 2014, 2013 and 2012 was $84 million, $9 million and $27 million, respectively.
Financial Condition, Liquidity and Capital Resources
Our primary sources of liquidity are our investment portfolio, cash and cash equivalents and the available capacity under our various revolving credit facilities.
As of December 31, 2014, we had $676 million of cash and cash equivalents and $167 million of restricted cash and cash equivalents and $723 million of available capacity under our various revolving credit facilities. As of December 31, 2014, our restricted cash and cash equivalents included $100 million of the funded cash collateral on deposit with a custodian under our total return swaps. During the years ended December 31, 2014, 2013 and 2012, we principally funded our operations from (i) cash receipts from interest, dividend and fee income from our investment portfolio, (ii) cash proceeds from the realization of portfolio investments and (iii) draws under our various revolving credit facilities.
As of December 31, 2014, our required principal amortization for the next twelve months consists of $4.5 million scheduled amortization on our secured term loans. We believe that we will continue to generate sufficient cash flow through the receipt of interest, dividend and fee payments from our investment portfolio, as well as cash proceeds from the realization of select portfolio investments, to allow us to continue to service our debt, pay our operating costs and expenses, fund capital to our current portfolio companies and originate new investments. However, there is no certainty that we will be able to generate sufficient liquidity.
51
Operating, Investing and Financing Cash Flows
For the years ended December 31, 2014, 2013 and 2012, net cash provided by operations was $145 million, $193 million and $164 million, respectively. Our cash flow from operations for the years ended December 31, 2014, 2013 and 2012 was primarily from the collection of interest, dividends and fees on our investment portfolio, less operating expenses.
For the year ended December 31, 2014, net cash used in investing activities was $504 million. For the years ended December 31, 2013 and 2012, net cash provided by investing activities was $173 million and $823 million, respectively. Our cash flow from investing activities included cash proceeds from the realization of portfolio investments totaling $2.8 billion, $1.2 billion and $1.5 billion for the years ended December 31, 2014, 2013 and 2012, respectively. As of December 31, 2014, we had portfolio investments totaling $6.3 billion at fair value, including $3.7 billion in debt investments, $2.0 billion in equity investments and $0.6 billion in Structured Products investments. However, a majority of our investments are generally illiquid and no active primary or secondary market exists for the trading of these investments and our estimates of fair value may differ significantly from the values that may be ultimately realized. We are generally repaid or exit our investments upon a change of control event of the portfolio company, such as a sale or recapitalization of the portfolio company.
For the year ended December 31, 2014, net cash provided by financing activities was $663 million. For the years ended December 31, 2013 and 2012, net cash used in financing activities was $382 million and $860 million, respectively. Our cash flow from financing activities during the year ended December 31, 2014 was primarily due to $777 million in proceeds received from our revolving credit facilities, partially offset by $137 million for repurchases of our common stock. The primary use of cash from financing activities during the years ended December 31, 2013 and 2012 was debt payments of $178 million and $487 million, respectively, on our asset securitizations and $561 million and $362 million, respectively, for repurchases of our common stock.
Debt Capital
As a BDC, we are permitted to issue Senior Securities in any amounts as long as immediately after such issuance our asset coverage is at least 200%, or equal to or greater than our asset coverage prior to such issuance, after taking into account the payment of debt with proceeds from such issuance. Asset coverage is defined as the ratio of the value of the total assets, less all liabilities and indebtedness not represented by Senior Securities, bears to the aggregate amount of Senior Securities representing indebtedness. However, if our asset coverage is below 200%, we may also borrow amounts up to 5% of our total assets for temporary purposes even if that would cause our asset coverage ratio to further decline. As of December 31, 2014, our debt obligations, excluding discounts, were $1,711 million and our asset coverage was 419%. In our calculation of asset coverage, we are including a notional amount of $27 million for the loans related to our total return swap transactions, less $100 million of cash collateral provided as of December 31, 2014. See Note 4 to our audited consolidated financial statements included in this Annual Report on Form 10-K for further discussion of our debt obligations.
The following table sets forth the scheduled amortization on the secured term loans, unsecured private notes and unsecured senior notes:
August 2015 | $4.5 million |
August 2016 | $4.5 million |
Secured Term Loans due August 2017 | Outstanding Balance |
Unsecured Private Notes due September 2018 | Outstanding Balance |
Unsecured senior notes (Series 2006-I) due January 2022 | Outstanding Balance |
Unsecured senior notes (Series 2007-I) due July 2022 | Outstanding Balance |
Unsecured senior notes (Series 2007-II) due July 2022 | Outstanding Balance |
The following table sets forth the outstanding balances on our revolving credit facilities:
Outstanding Balance | |||
Secured revolving credit facility due August 2016, $250 million commitment | $ | — | |
Secured revolving credit facility due June 2016, $750 million commitment | 726 | ||
Secured revolving credit facility due October 2016, $500 million commitment | 51 | ||
Total | $ | 777 | |
Total Return Swaps
American Capital TRS, LLC (“ACTRS”), a wholly owned consolidated affiliate of American Capital, entered into total return swap transactions with Citibank, N.A. (the “2012 TRS” and “2012 TRS II”). The total return swaps, which are non-recourse to American Capital, replicate the performance of reference pools of senior floating rate loans (each, a “Reference Pool”). The
52
maximum amount of the loans that can be included in the Reference Pool is $400 million (determined at the time each such loan is added to the Reference Pool) and the maximum cash collateral requirement is $100 million. As of December 31, 2014, ACTRS had provided $100 million of cash collateral for the loans in the 2012 TRS and 2012 TRS II Reference Pools, which is recorded in the financial statement line item restricted cash and cash equivalents in our consolidated balance sheets. ACTRS may also be required to post additional collateral from time to time as a result of unrealized losses on the loans included in each Reference Pool. As of December 31, 2014, the loans in the Reference Pools for the 2012 TRS and the 2012 TRS II had a notional of approximately $27 million. The 2012 TRS and 2012 TRS II matured in December 2014 and the posted cash collateral will be returned to ACTRS in the first quarter of 2015.
Equity Capital
As a BDC, we are generally not able to issue or sell our common stock at a price below our NAV per share, exclusive of any distributing commission or discount, except (i) with the prior approval of a majority of our shareholders, (ii) in connection with a rights offering to our existing shareholders, or (iii) under such other circumstances as the SEC may permit. As of December 31, 2014, our NAV was $20.50 per share per share and our closing market price was $14.61 per share.
During 2011, our Board of Directors adopted a program that may provide for stock repurchases or dividend payments (Stock Repurchase and Dividend Program). During the year ended December 31, 2014, we repurchased a total of 8.9 million shares of our common stock in the open market for $137 million at an average price of $15.38 per share. During the year ended December 31, 2013, we repurchased a total of 40.4 million shares of our common stock in the open market for $561 million at an average price of $13.90 per share. During the year ended December 31, 2012, we repurchased a total of 34.8 million shares of our common stock in the open market for $362 million at an average price of $10.39 per share.
Contractual Obligations
A summary of our contractual payment obligations as of December 31, 2014 are as follows (in millions):
Payment Due by Period | |||||||||||||||||||
Total | Less than 1 year | 2-3 years | 4-5 years | After 5 years | |||||||||||||||
Secured revolving credit facility due June 2016 | $ | 726 | $ | — | $ | 726 | $ | — | $ | — | |||||||||
Secured revolving credit facility due October 2016 | 51 | — | 51 | — | — | ||||||||||||||
Secured Term Loan due August 2017 | 446 | 5 | 441 | — | — | ||||||||||||||
Unsecured Private Notes due September 2018 | 350 | — | — | 350 | — | ||||||||||||||
Unsecured senior notes (Series 2006-I) due January 2022 | 64 | — | — | — | 64 | ||||||||||||||
Unsecured senior notes (Series 2007-I) due July 2022 | 37 | — | — | — | 37 | ||||||||||||||
Unsecured senior notes (Series 2007-II) due July 2022 | 37 | — | — | — | 37 | ||||||||||||||
Interest payments on debt obligations(1) | 188 | 57 | 94 | 31 | 6 | ||||||||||||||
Operating leases(2) | 146 | 15 | 30 | 30 | 71 | ||||||||||||||
Total | $ | 2,045 | $ | 77 | $ | 1,342 | $ | 411 | $ | 215 | |||||||||
(1) | For variable rate debt, future interest payments are based on the interest rate as of December 31, 2014. |
(2) | Net of estimated sublease revenue. |
Off Balance Sheet Arrangements
We have non-cancelable operating leases for office space and office equipment. The leases expire over the next thirteen years and contain provisions for certain annual rental escalations. However, certain of the non-cancelable operating leases for office space have been subleased to third-party tenants and we may attempt to further sublease excess office space in the future.
As of December 31, 2014, we had commitments under loan and financing agreements to fund up to $247 million to 29 portfolio companies. These commitments are primarily composed of working capital credit facilities, acquisition credit facilities and subscription agreements. The commitments are generally subject to the borrowers meeting certain criteria such as compliance with covenants and availability under borrowing base thresholds. The terms of the borrowings and financings subject to commitment are comparable to the terms of other loan and equity securities in our portfolio. As of December 31, 2014, European Capital and its affiliates had a commitment of $77 million to fund ECAS UK SME Debt and $201 million to fund European Capital Private Debt LP. In addition, as of December 31, 2014, ACAM had a commitment of $173 million to ACE III, which would be funded by an equity investment from American Capital. See Note 14 to our audited consolidated financial statements included in this Annual Report on Form 10-K for further discussion of ACAM’s ACE III commitment.
53
A summary of our loan and equity commitments as of December 31, 2014 is as follows (in millions):
Amount of Commitment Expiration by Period | |||||||||||||||||||
Total | Less than 1 year | 1-3 years | 4-5 years | After 5 years | |||||||||||||||
Loan and equity commitments | $ | 247 | $ | 89 | $ | 32 | $ | 18 | $ | 108 | |||||||||
Non-Performing Loans Analysis
We stop accruing interest on our debt investments when it is determined that interest is no longer collectible. Our valuation analysis serves as a critical piece of data in this determination. A significant change in the portfolio company valuation assigned by us could have an effect on the amount of our loans on non-accrual status.
American Capital Non-Performing Loans
As of December 31, 2014, American Capital loans on non-accrual status for 12 portfolio companies had a cost basis and fair value of $201 million and $116 million, respectively. As of December 31, 2014 and 2013, current loans, past due accruing loans and loans on non-accrual status were as follows (dollars in millions):
2014 | 2013 | ||||||
Current | $ | 3,248 | $ | 1,377 | |||
0 - 30 days past due | — | 26 | |||||
31 - 60 days past due | — | — | |||||
61 - 90 days past due | — | — | |||||
Greater than 90 days past due | — | — | |||||
Total past due accruing loans at cost | — | 26 | |||||
Non-accruing loans at cost | 201 | 287 | |||||
Total loans at cost | $ | 3,449 | $ | 1,690 | |||
Non-accruing loans at fair value | $ | 116 | $ | 154 | |||
Total loans at fair value | $ | 3,311 | $ | 1,580 | |||
Non-accruing loans at cost as a percent of total loans at cost | 5.8 | % | 17.0 | % | |||
Non-accruing loans at fair value as a percent of total loans at fair value | 3.5 | % | 9.7 | % | |||
Non-accruing loans at fair value as a percent of non-accruing loans at cost | 57.7 | % | 53.7 | % | |||
Non-accruing loans at cost decreased $86 million from December 31, 2013 to December 31, 2014 primarily due to $99 million of exits and write-offs and approximately $55 million of loans removed from non-accrual status due to improved portfolio company performance and approximately $26 million for reserves of accrued PIK interest, partial offset by $82 million of loans placed on non-accrual status due to weaker portfolio company performance. In addition, the cost basis of existing non-accrual loans was increased by $17 million due to fundings on prior period unfunded commitments.
During 2014, we recapitalized one portfolio company by exchanging our loans for common equity securities that had a cost basis and fair value of $9 million and $9 million, respectively. Of these recapitalizations, loans which were on non-accrual status had a cost basis and fair value of $9 million and $9 million, respectively.
During 2013, we recapitalized four portfolio companies by exchanging our loans for preferred or common equity securities that had a cost basis and fair value of $75 million and $76 million, respectively. Of these recapitalizations, loans which were on non-accrual status had a cost basis and fair value of $53 million and $54 million, respectively.
54
European Capital Non-Performing Loans
As of December 31, 2014, European Capital loans on non-accrual status for 8 portfolio companies had a cost basis and fair value of $170 million and $32 million, respectively. As of December 31, 2014, current loans, past due accruing loans and loans on non-accrual status were as follows (dollars in millions):
2014 | |||
Current | $ | 340 | |
0 - 30 days past due | — | ||
31 - 60 days past due | — | ||
61 - 90 days past due | — | ||
Greater than 90 days past due | — | ||
Total past due accruing loans at cost | — | ||
Non-accruing loans at cost | 170 | ||
Total loans at cost | $ | 510 | |
Non-accruing loans at fair value | $ | 32 | |
Total loans at fair value | $ | 361 | |
Non-accruing loans at cost as a percent of total loans at cost | 33.3 | % | |
Non-accruing loans at fair value as a percent of total loans at fair value | 8.9 | % | |
Non-accruing loans at fair value as a percent of non-accruing loans at cost | 18.8 | % | |
55
Impact of Inflation
We believe that inflation can influence the value of our investments through the impact it may have on interest rates, the capital markets, the valuations of business enterprises and the relationship of the valuations to underlying earnings.
Critical Accounting Policies
The discussion and analysis of our financial condition and results of operations are based on our consolidated financial statements, which have been prepared in accordance with U.S. GAAP. The preparation of these financial statements in accordance with U.S. GAAP requires us to utilize accounting policies and make certain estimates and assumptions that could affect the reported amounts of assets, liabilities, revenues, expenses and the related disclosures. We base our assumptions, estimates and judgments on historical experience, current trends and other factors that management believes to be relevant at the time the consolidated financial statements are prepared. Our significant accounting policies are more fully described in Note 2 to our audited consolidated financial statements included in this Annual Report on Form 10-K. The SEC considers an accounting policy to be critical if it is both important to a company’s financial condition and results of operations and it requires significant judgment and estimates on the part of management in its application.
Management believes that the following critical accounting policies are the most affected by judgments, estimates and assumptions. Management has reviewed these critical accounting policies and related disclosures with our independent auditor and the Audit, Compliance and Valuation Committee of our Board of Directors. Although we believe that our judgments and estimates are appropriate and correct, actual results may differ from those estimates. See Item 1A. Risk Factors for certain matters bearing risks on our future results of operations.
Valuation of Investments
Our investments consist of loans and securities issued by public and privately-held companies, including senior debt, mezzanine debt, equity warrants and preferred and common equity securities. We also invest in both investment grade and non-investment grade Structured Products, which includes CLO securities and CMBS.
We fair value our investments in accordance with the 1940 Act and ASC 820 as determined in good faith by our Board of Directors. We undertake a multi-step valuation process each quarter to determine the fair value of our investments in accordance with ASC 820. The quarterly valuation process begins with the development of a preliminary valuation recommendation for each investment by our FACT team, which is composed of valuation and audit professionals responsible for monitoring portfolio compliance and valuations. In preparing the preliminary valuation recommendations, FACT receives assistance from our investment professionals that both originated and monitor the investment as well as assistance from other departments including operations, accounting and legal. The preliminary valuation recommendations are reviewed by senior management and then presented to our Audit, Compliance and Valuation Committee for review and approval. Subsequent to the approval from our Audit, Compliance and Valuation Committee, the valuation recommendations are sent to our Board of Directors for final approval.
When available, we base the fair value of our investments that trade in active markets on directly observable market prices or on market data derived for comparable assets. For restricted securities of companies that are publicly traded, the value is based on the closing market quote on the valuation date less a discount for the restriction. For all other investments, inputs used to measure fair value reflect management’s best estimate of assumptions that would be used by market participants in pricing the investment in a hypothetical transaction. For these investments, we estimate the fair value of our senior debt, mezzanine debt, redeemable and convertible preferred equity, common equity and equity warrants using either an enterprise value waterfall methodology, which generally combines market and income approaches, or a market yield valuation methodology utilizing the income approach. We estimate the fair value of our Structured Products using the market and income approaches, as well as third-party broker quotes.
ASC 820 provides a framework for measuring the fair value of assets and liabilities and provides guidance regarding a fair value hierarchy, which prioritizes information used to measure fair value and the effect of fair value measurements on earnings. Due to the uncertainty inherent in the valuation process, estimates of fair value may differ significantly from the values that would have been used had a ready market for our investments existed, and the differences could be material. Additionally, changes in the market environment and other events that may occur over the life of the investments may cause the gains or losses ultimately realized on these investments to be different than the valuations currently assigned.
ASC 820 defines fair value in terms of the price that would be received upon the sale of an asset or paid to transfer a liability in an orderly transaction between market participants at the measurement date under current market conditions. The price used to measure the fair value is not adjusted for transaction costs while the cost basis of our investments may include initial transaction costs. Under ASC 820, the fair value measurement also assumes that the transaction to sell an asset occurs in the principal market for the asset or, in the absence of a principal market, the most advantageous market for the asset. The principal market for an asset is the market in which the reporting entity would sell or transfer the asset with the greatest volume and level of activity for the asset. In determining the principal market for an asset under ASC 820, it is assumed that the reporting entity has access to the
56
market as of the measurement date. If no market for the asset exists or if the reporting entity does not have access to the principal market, the reporting entity should use a hypothetical market.
The levels of fair value inputs used to measure our investments are characterized in accordance with the fair value hierarchy established by ASC 820. Where inputs for an asset or liability fall in more than one level in the fair value hierarchy, the investment is classified in its entirety based on the lowest level input that is significant to that investment’s fair value measurement. We use judgment and consider factors specific to the investment in determining the significance of an input to a fair value measurement. Our policy is to recognize transfers in and out of levels as of the beginning of each reporting period. The three levels of the fair value hierarchy and investments that fall into each of the levels are described below:
• | Level 1: Level 1 inputs are unadjusted quoted prices in active markets that are accessible at the measurement date for identical, unrestricted assets or liabilities. |
• | Level 2: Level 2 inputs are inputs, other than quoted prices included within Level 1, which are observable for the asset or liability, either directly or indirectly. |
• | Level 3: Level 3 inputs are unobservable and cannot be corroborated by observable market data. As of December 31, 2014, we use Level 3 inputs for measuring the fair value of our investments as follows: |
The principal market in which we would sell our Senior Floating Rate Loans and certain of our non-controlled Sponsor Finance debt investments is an active over-the-counter secondary market. For our other debt and equity investments, there is no active market and we are generally repaid our debt investment or sell our equity investment upon a change of control transaction such as through the mergers and acquisition (“M&A”) market. Accordingly, the market in which we would sell certain of our non-controlled debt and all of our equity investments is the M&A market. However, under ASC 820, we have identified the M&A market as the principal market for our investments in these portfolio companies only if we have the ability to control the decision to sell the portfolio company as of the measurement date. We determine whether we have the ability to control the decision to sell a portfolio company based on our ability to control or gain control of the board of directors of the portfolio company as of the measurement date and rights within the shareholders agreement. In evaluating if we can control or gain control of a portfolio company as of the measurement date, we include our equity securities and those securities held by entities managed by our wholly-owned portfolio company, ACAM, on a fully diluted basis. For investments in portfolio companies for which we do not have the ability to control or gain control as of the measurement date and for which there is no active market, the principal market under ASC 820 is a hypothetical secondary market.
Accordingly, we use the M&A market as the principal market for our investments in portfolio companies that we control or can gain control as of the measurement date, and we use a hypothetical secondary market for our investments in portfolio companies that we do not control or cannot gain control as of the measurement date. However, to the extent that an active market exists for such investments, we will consider that as the principal market. Our valuation policy considers the fact that no ready active market exists for a significant amount of our investments and that the fair value for our investments must typically be determined using unobservable inputs.
Enterprise Value Waterfall Methodology
For investments in portfolio companies that we have identified the M&A market as the principal market, we estimate the fair value based on the enterprise value waterfall (“Enterprise Value Waterfall”) valuation methodology. For minority equity securities in which the principal market is the hypothetical secondary market, we also estimate the fair value using the Enterprise Value Waterfall valuation methodology.
Under the Enterprise Value Waterfall valuation methodology, we estimate the enterprise value of a portfolio company and then waterfall the enterprise value over the portfolio company’s securities in order of their preference relative to one another. In applying the Enterprise Value Waterfall valuation methodology, we consider that in a change of control transaction, our loans are generally required to be repaid at par and that a buyer cannot assume the loan.
To estimate the enterprise value of the portfolio company, we prepare an analysis of traditional valuation methodologies including valuations of comparable public companies, recent sales of private and public comparable companies, discounting the forecasted cash flows of the portfolio company, estimating the liquidation or collateral value of the portfolio company’s assets, third-party valuations of the portfolio company, offers from third-parties to buy the portfolio company and consider the value of recent investments in the equity securities of the portfolio company. Significant inputs in these valuation methodologies to estimate enterprise value include the historical or projected operating results of the portfolio company, selection of comparable companies, discounts or premiums to the prices of comparable companies and discount rates applied to the forecasted cash flows. The operating results of a portfolio company may be unaudited, projected or pro forma financial information and may require adjustments for non-recurring items or to normalize the operating results that may require significant judgment in its determination. In addition, projecting future financial results requires significant judgment regarding future growth assumptions. In evaluating the operating results, we also analyze the impact of exposure to litigation, loss of customers or other contingencies. The selection of a population
57
of comparable companies requires significant judgment, including a qualitative and quantitative analysis of the comparability of the companies. In determining a discount or premium, if any, to prices of comparable companies, we use significant judgment for factors such as size, marketability, relative performance, and for portfolio companies in which we control, a control premium to the market price of comparable public companies. In determining a discount rate to apply to forecasted cash flows, we use significant judgment in the development of an appropriate discount rate including the evaluation of an appropriate risk premium. Further, a change in the future growth assumptions in projected future financial results could have a directionally opposite change in the assumptions used for determining an appropriate discount rate.
In valuing convertible debt, equity or other similar securities, we value our investment based on its priority in the waterfall and based on our pro rata share of the residual equity value available after deducting all outstanding debt from the estimated enterprise value. We value non-convertible debt at the face amount of the debt to the extent that the estimated enterprise value of the portfolio company exceeds the outstanding debt of the portfolio company. If the estimated enterprise value is less than the outstanding debt of the portfolio company, we reduce the fair value of our debt investment beginning with the junior most debt such that the enterprise value less the fair value of the outstanding debt is zero.
Market Yield Valuation Methodology
For debt and redeemable preferred equity investments in portfolio companies for which we are required to identify a hypothetical secondary market as the principal market, we estimate the fair value based on the assumptions that we believe hypothetical market participants would use to value the investment in a current hypothetical sale using a market yield (“Market Yield”) valuation methodology based on an exchange valuation premise under ASC 820.
For debt and redeemable preferred equity investments of our investment portfolio for which we do not control or cannot gain control as of the measurement date and no active market exists, we estimate the fair value based on such factors as third-party broker quotes and our own assumptions in the absence of market observable data, including estimated remaining life, current market yield and interest rate spreads of similar loans and securities as of the measurement date. We weight the use of third-party broker quotes, if any, in determining fair value based on our understanding of the level of actual transactions used by the broker to develop the quote and whether the quote was an indicative price or binding offer. We estimate the remaining life based on market data of the average life of similar loans. However, if we have information available to us that the loan is expected to be repaid in the near term, we would use an estimated remaining life based on the expected repayment date, including considering the current maturity date of the loan. The average life used to estimate the fair value of our loans may be shorter than the legal maturity of the loans since our loans have historically been prepaid prior to the maturity date. The current interest rate spreads used to estimate the fair value of our loans is based on our experience of current interest rate spreads on similar loans. We use significant judgment in determining the estimated remaining life as well as the current market yield and interest rate spreads. If there is a significant deterioration of the credit quality of a loan, we may consider other factors that a hypothetical market participant would use to estimate fair value, including the proceeds that would be received in a liquidation analysis.
We fair value our investments in Structured Products based on such factors as third-party broker quotes, purchases or sales of the same or similar securities, and our cash flow forecasts. Cash flow forecasts are subject to assumptions a market participant would use regarding the investments’ underlying collateral including, but not limited to, assumptions of default and recovery rates, reinvestment spreads and prepayment rates. Cash flow forecasts are discounted using a market participant’s market yield assumptions that are derived from multiple sources including, but not limited to, third-party broker quotes, industry research reports and transactions of securities and indices with similar structure and risk characteristics. We weight the use of third-party broker quotes, if any, in determining fair value based on the correlation of changes in third-party broker quotes with underlying performance and other market indices.
Third-party Vendor Pricing
For debt investments that trade in an active market or that have similar assets that trade in an active market, we estimate the fair value based on evaluated prices from a nationally recognized, independent pricing service or from third-party brokers who make markets in such debt instruments. When possible, we make inquiries of third-party pricing sources to understand their use of significant inputs and assumptions. We review the price provided by the third-party pricing service and perform procedures to validate their reasonableness, including a review and analysis of executable broker quote(s), range and dispersion of third-party estimates, frequency of pricing updates, yields of similar securities or other qualitative and quantitative information. If the prices provided by the pricing service are consistent with such information, we will generally use the price provided by the pricing service as fair value.
58
Investments in Investment Funds
For an investment in an investment fund that does not have a readily determinable fair value, we measure the fair value of our investment predominately based on the NAV per share of the investment fund if the NAV of the investment fund is calculated in a manner consistent with the measurement principles of ASC 946 as of the measurement date, including measurement of all or substantially all of the underlying investments of the investee in accordance with ASC 820. However, in determining the fair value of our investment, we may make adjustments to the NAV per share in certain circumstances, based on our analysis of any restrictions on redemption of our shares of our investment as of the measurement date, any restrictions on the ability to receive dividends, comparisons of market price to NAV per share of comparable publicly traded funds and trades or sales of comparable private and publicly traded funds, recent actual sales or redemptions of shares of the investment fund, public to private liquidity discounts, expected future cash flows available to equity holders including the rate of return on those cash flows compared to an implied market return on equity required by market participants, or other uncertainties surrounding our ability to realize the full NAV of the investment fund.
Interest Rate Derivatives
For interest rate derivative agreements, we estimate the fair value based on the estimated net present value of the future cash flows using a forward interest rate yield curve in effect as of the end of the measurement period, adjusted for nonperformance risk, if any, including a quantitative and/or qualitative evaluation of both our credit risk and counterparty credit risk. We consider the impact of any collateral requirements, credit enhancements or netting arrangements in evaluating credit risk.
See Note 3 to our audited consolidated financial statements included in this Annual Report on Form 10-K for further information regarding the classification of our investment portfolio by Levels 1, 2 and 3 as of December 31, 2014.
Interest and Dividend Income Recognition
Interest income is recorded on an accrual basis to the extent that such amounts are expected to be collected. OID and purchased discount and premiums are accreted into interest income using the effective interest method, where applicable. Loan origination fees are recorded as fee income upon receipt or deferred and accreted into interest income using the effective interest method. We record prepayment premiums on loans and other investments as interest income when such amounts are received. Dividend income is recognized on the ex-dividend date for publicly traded portfolio companies and the record date for private portfolio companies for common equity securities. Dividend income is recognized on an accrual basis for preferred equity securities to the extent that such amounts are expected to be collected or realized. In determining the amount of dividend income to recognize, if any, from cash distributions on common equity securities, we will assess many factors including a portfolio company’s cumulative undistributed income and operating cash flow. Cash distributions from common equity securities received in excess of such undistributed amounts are recorded first as a reduction of our investment and then as a realized gain on investment. We stop accruing interest or dividends on our investments when it is determined that the interest or dividend is not collectible. We assess the collectability of the interest and dividends based on many factors including the portfolio company’s ability to service our loan based on current and projected cash flows as well as the current valuation of the portfolio company’s total enterprise value. For investments with PIK interest and cumulative dividends, we base income and dividend accruals on the valuation of the PIK notes or securities received from the borrower or the redemption value of the security. If the portfolio company valuation indicates a value of the PIK notes or securities that is not sufficient to cover the contractual interest or dividend, we will not accrue interest or dividend income on the notes or securities and will record an allowance for any accrued interest or dividend receivable as a reduction of interest or dividend income in the period we determine it is not collectible.
We also receive interest and dividend income from our debt and equity investments in our asset management company, ACAM. Interest income from ACAM is recorded on an accrual basis to the extent that such amounts are expected to be collected. Dividend income is recorded on the record date.
A change in the portfolio company valuation assigned by us could have an effect on our recognition of interest income on debt investments and dividend income of preferred stock investments. Also, a change in a portfolio company’s operating performance and cash flows can impact a portfolio company’s ability to service our debt and therefore could impact our interest income recognition.
Interest income on Structured Products is recognized on the effective interest method as required by ASC 325-40. Under ASC 325-40, at the time of purchase, we estimate the future expected cash flows and determine the effective interest rate based on these estimated cash flows and our cost basis. Subsequent to the purchase and on a quarterly basis, these estimated cash flows are updated and a revised yield is calculated prospectively based on the current amortized cost of the investment. To the extent the current quarterly estimated cash flows decrease from the prior quarterly estimated cash flows, the revised yield is calculated prospectively based on the amortized cost basis of the investment calculated in accordance with ASC 320-10-35, Investment-Debt and Equity Securities. In the event that the estimated cash flows of an investment decrease below the current amortized cost used to determine the yield, we may be required to write down the current amortized cost by projected credit losses or to fair value. We
59
are precluded from reversing the write down for any subsequent increase in the estimated cash flows of an investment with the effect of increasing total interest income during the life of the investment and realized loss recorded at the exit of the investment by the amount of the write down. In estimating these cash flows, there are a number of assumptions that are subject to uncertainties and contingencies. These include the amount and timing of principal payments (including prepayments, repurchases, defaults and liquidations), the pass through or coupon rate, and interest rate fluctuations. In addition, interest payment shortfalls due to delinquencies on the underlying loans and the timing and magnitude of projected credit losses on the loans underlying the securities have to be estimated. These uncertainties and contingencies are difficult to predict and are subject to future events that may impact our estimates and interest income. As a result, actual results may differ significantly from these estimates.
Income Taxes
As of December 31, 2014, we have a net deferred tax asset of $617 million associated with our total ordinary deferred tax assets. We also have $230 million in total capital deferred tax assets, which have a $168 million reserve through a valuation allowance and results in a capital deferred tax asset of $62 million. We have a deferred tax liability of $325 million. Assessing the recoverability of a deferred tax asset requires management to consider the company’s history of cumulative pretax losses in the prior three years and make estimates related to expectations of future taxable income. Estimates of future taxable income are based on forecasted cash flows from investments and operations, the character of expected income or loss as either capital or ordinary, and the application of existing tax laws in each jurisdiction. We are also required to make estimates related to the expected tax character of recognition of the reversal of the deferred tax assets. To the extent that future cash flows or the amount or character of taxable income differ significantly from these estimates, our ability to realized the net deferred tax asset could be impacted.
Stock-based Compensation
We account for all share-based payments to employees under FASB ASC Topic 718, Compensation-Stock Compensation(“ASC 718”). We estimate the fair value of our employee stock awards at the date of grant using certain subjective assumptions, such as expected volatility, which is based on a combination of historical and market-based implied volatility, and the expected term of the awards which is based on our historical experience of employee stock option exercises. Our valuation assumptions used in estimating the fair value of share-based awards may change in future periods. We recognize the fair value of awards over the vesting period or the requisite service period only for those awards expected to vest using an estimated forfeiture rate. In addition, we calculate our pool of excess tax benefits available within capital in excess of par value on our consolidated balance sheets in accordance with the provisions ASC 718.
The following table reflects the weighted average fair value per employee stock option granted during the years ended December 31, 2014, 2013 and 2012, as well as the weighted average assumptions used in determining those fair values using a Black-Scholes option pricing model.
2014 | 2013 | 2012 | ||||||
Options granted (in millions) | 0.1 | 3.7 | 8.8 | |||||
Weighted average fair value per option on grant date | $6.89 | $5.88 | $4.97 | |||||
Expected dividend yield | — | % | — | % | — | % | ||
Expected volatility | 42 | % | 41 | % | 56 | % | ||
Risk-free interest rate | 2.1 | % | 1.2 | % | 1.2 | % | ||
Expected life (years) | 6.8 | 6.7 | 6.6 | |||||
We determine our expected volatility used in the Black-Scholes option pricing model based on a combination of our historical volatility during the expected term of the option and our implied volatility based on the market prices of traded options of our stock.
Determining the appropriate fair value model and calculating the fair value of share-based payment awards require the input of subjective assumptions, including the expected life of the share-based payment awards and stock price volatility. The assumptions used in calculating the fair value of share-based payment awards represent management’s best estimates, but these estimates involve inherent uncertainties and the application of management judgment. As a result, if factors change and we use different assumptions, our stock-based compensation expense could be materially different in the future. In addition, we are required to estimate the expected forfeiture rate based on historical experience and recognize expense only for those shares expected to vest. If our actual forfeiture rate is materially different from our estimate, the stock-based compensation expense could be significantly different from what we have recorded in the current period.
60
Item 7A. Quantitative and Qualitative Disclosure About Market Risk
We are subject to financial market risks, including changes in interest rates and the valuations of our investment portfolio.
Interest Rate Risk
Interest rate sensitivity refers to the change in NOI and net earnings that may result from changes in the level of interest rates. Because we fund a portion of our investments with borrowings, our NOI and net earnings are affected by the difference between the interest rate at which we invest and the interest rate at which we borrow. As a result, there can be no assurance that a significant change in market interest rates will not have a material adverse effect on our NOI and net earnings.
As of December 31, 2014, approximately 10% of the principal balance of the debt investments in our portfolio were at fixed rates, approximately 71% were at variable rates with interest rate floors, primarily one-month and three-month LIBOR, 5% were at variable rates with no interest rate floors and 14% were on non-accrual status (3% of loans on non-accrual status were at variable rates). Additionally, approximately 26% of our borrowings bear interest at variable rates with a 0.75% interest rate floor, 54% of our borrowings bear interest at variable rates with no interest rate floors and 20% of our borrowings bear interest at fixed rates. The one-month LIBOR rate was 0.2% as of December 31, 2014.
We maintain an interest rate risk management strategy under which we use derivative financial instruments to primarily manage the adverse impact of interest rate changes on our cash flows by locking in the spread between our asset yield and the cost of our borrowings and to fulfill our obligation under the terms of our asset securitizations. While our interest rate risk management strategy may mitigate our exposure to adverse fluctuations in interest rates, certain derivative transactions that we may enter into in the future, such as interest rate derivative agreements, may also limit our ability to participate in the benefits of lower interest rates with respect to our portfolio investments.
Our derivatives are considered economic hedges that do not qualify for hedge accounting under ASC 815. We record the accrual of the periodic interest settlements of interest rate derivatives in net unrealized appreciation or depreciation and subsequently record the cash payments as a realized gain or loss on the interest settlement date.
Based on our December 31, 2014 consolidated balance sheets, the following table shows the annual impact on NOI and net earnings of base rate changes in the applicable interest rate indexes, primarily one-month LIBOR, (considering interest rate floors for variable rate instruments and excluding changes in the fair value of our investments and derivative instruments and loans on non-accrual status) assuming no changes in our investment, hedging and borrowing structure (in millions):
Basis Point Change | Interest Income | Interest Expense | Net Operating Income (Loss) | Net Earnings (Loss) | ||||||||||||
Up 400 basis points | $ | 105 | $ | 45 | $ | 60 | $ | 60 | ||||||||
Up 300 basis points | $ | 73 | $ | 33 | $ | 40 | $ | 40 | ||||||||
Up 200 basis points | $ | 41 | $ | 20 | $ | 21 | $ | 21 | ||||||||
Up 100 basis points | $ | 11 | $ | 10 | $ | 1 | $ | 1 | ||||||||
Down 100 basis points | $ | — | $ | (1 | ) | $ | 1 | $ | 1 | |||||||
Foreign Currency Risks
As discussed in Note 2 to these audited consolidated financial statements included in this Annual Report on Form 10-K, we consolidated our investment in European Capital effective October 1, 2014. We have a number of investments in portfolio companies, primarily the European Capital investment portfolio, for which the investment is denominated in a foreign currency, primarily the Euro. We also have other assets and liabilities denominated in foreign currencies. Fluctuations in exchange rates therefore impact our financial condition and results of operations, as reported in U.S. dollars. During the year ended December 31, 2014, the foreign currency translation adjustment recorded in our consolidated statement of operations was net unrealized depreciation of $74 million, primarily due to the translation on the cost basis in our investment in European Capital through September 30, 2014. As of December 31, 2014, the cumulative translation adjustment, net of tax, recorded in our consolidated balance sheet was $38 million, due to the translation of European Capital’s balance sheet as of December 31, 2014.
As of December 31, 2014, our exposure to foreign currency exchange risk was estimated using a sensitivity analysis, which illustrates a hypothetical change in the foreign currency exchange rate as of December 31, 2014. As stated above, the Euro is the functional currency for the majority of our investments denominated in a foreign currency, and as such, the sensitivity analysis excludes any changes in other foreign currencies. Actual changes in foreign currency exchange rates may differ from this hypothetical change. Based on a hypothetical increase or decrease of 5% in the Euro to U.S. dollar exchange rate, assuming no hedging, the fair value of our investments would have increased or decreased by approximately $33 million.
61
Portfolio Valuation
Our investments are carried at fair value in accordance with the 1940 Act and ASC 820. Due to the uncertainty inherent in the valuation process, such estimates of fair value controls may differ significantly from the values that would have been used had a ready market for the securities existed, and the differences could be material. Additionally, changes in the market environment and other events that may occur over the life of the investments may cause the gains or losses ultimately realized on these investments to be different than the valuations currently assigned. As of December 31, 2014, the fair value of 68% our investments were estimated using Level 3 inputs determined in good faith by our Board of Directors because there was no active market for such investments.
62
Item 8. | Financial Statements and Supplementary Data |
Our management is responsible for the preparation, integrity and objectivity of the accompanying consolidated financial statements and the related financial information. The financial statements have been prepared in conformity with accounting principles generally accepted in the United States and necessarily include certain amounts that are based on estimates and informed judgments. Our management also prepared the related financial information included in this Annual Report on Form 10-K and is responsible for its accuracy and consistency with the consolidated financial statements.
The consolidated financial statements have been audited by Ernst & Young LLP, an independent registered public accounting firm, who conducted their audit in accordance with the standards of the Public Company Accounting Oversight Board (United States) as of December 31, 2014 and 2013, and for each of the three years in the period ended December 31, 2014, and the consolidated financial highlights for each of the five years in the period ended December 31, 2014. The independent registered public accounting firm’s responsibility is to express an opinion as to the fairness with which such consolidated financial statements and financial highlights present our financial position, results of operations, changes in net assets and cash flows in accordance with accounting principles generally accepted in the United States.
63
Management’s Report on Internal Control over Financial Reporting
Our management is responsible for establishing and maintaining adequate internal control over financial reporting as defined in Rule 13a-15(f) under the Securities Exchange Act of 1934. American Capital, Ltd.’s internal control over financial reporting is designed to provide reasonable assurance regarding the reliability of financial reporting and the preparation of consolidated financial statements for external purposes in accordance with accounting principles generally accepted in the United States (“U.S. GAAP”). American Capital, Ltd.’s internal control over financial reporting includes those policies and procedures that (i) pertain to the maintenance of records that, in reasonable detail, accurately and fairly reflect the transactions and dispositions of our assets; (ii) provide reasonable assurance that transactions are recorded as necessary to permit preparation of financial statements in accordance with U.S. GAAP, and that receipts and expenditures are being made only in accordance with authorizations of our management and Board of Directors; and (iii) provide reasonable assurance regarding prevention or timely detection of unauthorized acquisition, use, or disposition of our assets that could have a material effect on the consolidated financial statements.
Because of its inherent limitations, internal control over financial reporting may not prevent or detect misstatements. Also, projections of any evaluation of effectiveness to future periods are subject to the risk that controls may become inadequate because of changes in conditions, or that the degree of compliance with the policies or procedures may deteriorate.
Management assessed the effectiveness of American Capital, Ltd.’s internal control over financial reporting as of December 31, 2014, utilizing the criteria set forth by the Committee of Sponsoring Organizations of the Treadway Commission in the Internal Control-Integrated Framework (2013 Framework). Based on this assessment and those criteria, management determined that American Capital, Ltd.’s internal control over financial reporting was effective as of December 31, 2014. The effectiveness of American Capital, Ltd.’s internal control over financial reporting as of December 31, 2014 has been audited by Ernst & Young LLP, American Capital, Ltd.’s independent registered public accounting firm, as stated in their attestation report included in this Annual Report on Form 10-K.
64
Report of Independent Registered Public Accounting Firm
The Board of Directors and Shareholders of American Capital, Ltd.
We have audited American Capital, Ltd. internal control over financial reporting as of December 31, 2014 based on criteria established in Internal Control-Integrated Framework issued by the Committee of Sponsoring Organizations of the Treadway Commission (2013 Framework) (the COSO criteria). American Capital, Ltd.’s management is responsible for maintaining effective internal control over financial reporting, and for its assessment of the effectiveness of internal control over financial reporting included in the accompanying Management’s Report on Internal Control over Financial Reporting. Our responsibility is to express an opinion on the company’s internal control over financial reporting based on our audit.
We conducted our audit in accordance with the standards of the Public Company Accounting Oversight Board (United States). Those standards require that we plan and perform the audit to obtain reasonable assurance about whether effective internal control over financial reporting was maintained in all material respects. Our audit included obtaining an understanding of internal control over financial reporting, assessing the risk that a material weakness exists, testing and evaluating the design and operating effectiveness of internal control based on the assessed risk, and performing such other procedures as we considered necessary in the circumstances. We believe that our audit provides a reasonable basis for our opinion.
A company’s internal control over financial reporting is a process designed to provide reasonable assurance regarding the reliability of financial reporting and the preparation of financial statements for external purposes in accordance with generally accepted accounting principles. A company’s internal control over financial reporting includes those policies and procedures that (1) pertain to the maintenance of records that, in reasonable detail, accurately and fairly reflect the transactions and dispositions of the assets of the company; (2) provide reasonable assurance that transactions are recorded as necessary to permit preparation of financial statements in accordance with generally accepted accounting principles, and that receipts and expenditures of the company are being made only in accordance with authorizations of management and directors of the company; and (3) provide reasonable assurance regarding prevention or timely detection of unauthorized acquisition, use or disposition of the company’s assets that could have a material effect on the financial statements.
Because of its inherent limitations, internal control over financial reporting may not prevent or detect misstatements. Also, projections of any evaluation of effectiveness to future periods are subject to the risk that controls may become inadequate because of changes in conditions, or that the degree of compliance with the policies or procedures may deteriorate.
In our opinion, American Capital, Ltd maintained, in all material respects, effective internal control over financial reporting as of December 31, 2014, based on the COSO criteria.
We also have audited, in accordance with the standards of the Public Company Accounting Oversight Board (United States), the consolidated balance sheets of American Capital, Ltd., including the consolidated schedules of investments, as of December 31, 2014 and 2013, and the related consolidated statements of operations, comprehensive income, changes in net assets, and cash flows for each of the three years in the period ended December 31, 2014, and the consolidated financial highlights for each of the five years in the period ended December 31, 2014 and our report dated March 2, 2015 expressed an unqualified opinion thereon.
/s/ Ernst & Young LLP
McLean, Virginia
March 2, 2015
65
Report of Independent Registered Public Accounting Firm
The Board of Directors and Shareholders of American Capital, Ltd.
We have audited the accompanying consolidated balance sheets of American Capital, Ltd., including the consolidated schedules of investments, as of December 31, 2014 and 2013, and the related consolidated statements of operations, comprehensive income, changes in net assets, and cash flows for each of the three years in the period ended December 31, 2014, and the consolidated financial highlights for each of the five years in the period ended December 31, 2014. Our audit also included the financial statement schedule listed in the Index at Item 15(a)(2). These financial statements, financial highlights, and schedule are the responsibility of the Company’s management. Our responsibility is to express an opinion on these financial statements, financial highlights, and schedule based on our audits.
We conducted our audits in accordance with the standards of the Public Company Accounting Oversight Board (United States). Those standards require that we plan and perform the audit to obtain reasonable assurance about whether the financial statements and financial highlights are free of material misstatement. An audit includes examining, on a test basis, evidence supporting the amounts and disclosures in the financial statements and financial highlights. An audit also includes assessing the accounting principles used and significant estimates made by management, as well as evaluating the overall financial statement presentation. Our procedures included verification by examination of securities held by custodians and brokers as of December 31, 2014, and confirmation of securities not held by the custodian by correspondence with brokers, or by other appropriate auditing procedures when replies from brokers were not received. We believe that our audits provide a reasonable basis for our opinion.
In our opinion, the financial statements and financial highlights referred to above present fairly, in all material respects, the consolidated financial position of American Capital, Ltd. at December 31, 2014 and 2013, and the consolidated results of its operations, comprehensive income, changes in its net assets and its cash flows for each of the three years in the period ended December 31, 2014, and its consolidated financial highlights for each of the five years in the period ended December 31, 2014, in conformity with U.S. generally accepted accounting principles. Also, in our opinion, the related financial statement schedule, when considered in relation to the basic financial statements taken as a whole, presents fairly in all material respects the information set forth therein.
We also have audited, in accordance with the standards of the Public Company Accounting Oversight Board (United States), American Capital, Ltd.’s internal control over financial reporting as of December 31, 2014, based on criteria established in Internal Control-Integrated Framework issued by the Committee of Sponsoring Organizations of the Treadway Commission (2013 Framework) and our report dated March 2, 2015 expressed an unqualified opinion thereon.
/s/ Ernst & Young LLP
McLean, Virginia
March 2, 2015
66
AMERICAN CAPITAL, LTD.
CONSOLIDATED BALANCE SHEETS
(in millions, except per share amounts)
December 31, | |||||||
2014 | 2013 | ||||||
Assets | |||||||
Investments at fair value | |||||||
Non-Control/Non-Affiliate investments (cost of $3,846 and $1,338, respectively) | $ | 3,472 | $ | 1,085 | |||
Affiliate investments (cost of $29 and $302, respectively) | 26 | 282 | |||||
Control investments (cost of $2,542 and $3,908, respectively) | 2,782 | 3,705 | |||||
Total investments at fair value (cost of $6,417 and $5,548, respectively) | 6,280 | 5,072 | |||||
Cash and cash equivalents | 676 | 315 | |||||
Restricted cash and cash equivalents | 167 | 74 | |||||
Interest and dividend receivable | 46 | 38 | |||||
Deferred tax asset, net | 354 | 414 | |||||
Other | 117 | 96 | |||||
Total assets | $ | 7,640 | $ | 6,009 | |||
Liabilities and Shareholders’ Equity | |||||||
Debt ($5 and $5 due within one year, respectively) | $ | 1,703 | $ | 791 | |||
Trade date settlement liability | 191 | 15 | |||||
Long term incentive plan liability | 82 | — | |||||
Other | 192 | 77 | |||||
Total liabilities | 2,168 | 883 | |||||
Commitments and contingencies (Note 12) | |||||||
Shareholders’ equity | |||||||
Undesignated preferred stock, $0.01 par value, 5.0 shares authorized, 0 issued and outstanding | — | — | |||||
Common stock, $0.01 par value, 1,000.0 shares authorized, 271.1 and 274.8 issued and 266.9 and 270.2 outstanding, respectively | 3 | 3 | |||||
Capital in excess of par value | 6,246 | 6,296 | |||||
Cumulative translation adjustment, net of tax | (38 | ) | — | ||||
Distributions in excess of net realized earnings | (505 | ) | (774 | ) | |||
Net unrealized depreciation of investments | (234 | ) | (399 | ) | |||
Total shareholders’ equity | 5,472 | 5,126 | |||||
Total liabilities and shareholders’ equity | $ | 7,640 | $ | 6,009 | |||
Net Asset Value Per Common Share Outstanding | $ | 20.50 | $ | 18.97 | |||
See accompanying notes.
67
AMERICAN CAPITAL, LTD.
CONSOLIDATED STATEMENTS OF OPERATIONS
(in millions, except per share data)
Year Ended December 31, | |||||||||||
2014 | 2013 | 2012 | |||||||||
Operating Revenue | |||||||||||
Interest and dividend income | |||||||||||
Non-Control/Non-Affiliate investments | $ | 153 | $ | 162 | $ | 235 | |||||
Affiliate investments | (3 | ) | 40 | 31 | |||||||
Control investments | 263 | 221 | 320 | ||||||||
Total interest and dividend income | 413 | 423 | 586 | ||||||||
Fee income | |||||||||||
Non-Control/Non-Affiliate investments | 13 | 11 | 9 | ||||||||
Affiliate investments | 3 | 1 | — | ||||||||
Control investments | 42 | 52 | 51 | ||||||||
Total fee income | 58 | 64 | 60 | ||||||||
Total operating revenue | 471 | 487 | 646 | ||||||||
Operating Expenses | |||||||||||
Interest | 54 | 44 | 59 | ||||||||
Salaries, benefits and stock-based compensation | 168 | 156 | 148 | ||||||||
European Capital management fees | 5 | — | — | ||||||||
General and administrative | 61 | 55 | 56 | ||||||||
Total operating expenses | 288 | 255 | 263 | ||||||||
Net Operating Income Before Income Taxes | 183 | 232 | 383 | ||||||||
Tax (provision) benefit | (66 | ) | (76 | ) | 14 | ||||||
Net Operating Income | 117 | 156 | 397 | ||||||||
Loss on extinguishment of debt, net of tax | — | — | (3 | ) | |||||||
Net realized gain (loss) | |||||||||||
Non-Control/Non-Affiliate investments | 39 | (52 | ) | (138 | ) | ||||||
Affiliate investments | (32 | ) | 11 | 10 | |||||||
Control investments | 256 | (63 | ) | (143 | ) | ||||||
Foreign currency transactions | (17 | ) | 3 | 1 | |||||||
Derivative agreements | (41 | ) | (14 | ) | (87 | ) | |||||
Tax (provision) benefit | (53 | ) | 60 | 87 | |||||||
Total net realized gain (loss) | 152 | (55 | ) | (270 | ) | ||||||
Net unrealized appreciation (depreciation) | |||||||||||
Portfolio company investments | 149 | 49 | 1,005 | ||||||||
Foreign currency translation | (74 | ) | 52 | 27 | |||||||
Derivative agreements and other | 35 | 19 | 62 | ||||||||
Tax benefit (provision) | 55 | (37 | ) | (82 | ) | ||||||
Total net unrealized appreciation | 165 | 83 | 1,012 | ||||||||
Total net gain | 317 | 28 | 742 | ||||||||
Net Increase in Net Assets Resulting from Operations (“Net Earnings”) | $ | 434 | $ | 184 | $ | 1,136 | |||||
Net Operating Income Per Common Share | |||||||||||
Basic | $ | 0.44 | $ | 0.53 | $ | 1.24 | |||||
Diluted | $ | 0.42 | $ | 0.51 | $ | 1.20 | |||||
Net Earnings Per Common Share | |||||||||||
Basic | $ | 1.62 | $ | 0.63 | $ | 3.55 | |||||
Diluted | $ | 1.55 | $ | 0.61 | $ | 3.44 | |||||
Weighted Average Shares of Common Stock Outstanding | |||||||||||
Basic | 268.2 | 291.6 | 320.3 | ||||||||
Diluted | 280.7 | 303.9 | 330.3 | ||||||||
See accompanying notes.
68
AMERICAN CAPITAL, LTD.
CONSOLIDATED STATEMENTS OF COMPREHENSIVE INCOME
(in millions, except per share data)
Year Ended December 31, | |||||||||||
2014 | 2013 | 2012 | |||||||||
Net earnings | $ | 434 | $ | 184 | $ | 1,136 | |||||
Other comprehensive income: | |||||||||||
Cumulative translation adjustment | 31 | — | — | ||||||||
Tax benefit | 7 | — | — | ||||||||
Comprehensive income | $ | 472 | $ | 184 | $ | 1,136 | |||||
See accompanying notes.
69
AMERICAN CAPITAL, LTD.
CONSOLIDATED STATEMENTS OF CHANGES IN NET ASSETS
(in millions, except per share data)
Year Ended December 31, | |||||||||||
2014 | 2013 | 2012 | |||||||||
Operations | |||||||||||
Net operating income | $ | 117 | $ | 156 | $ | 397 | |||||
Loss on extinguishment of debt, net of tax | — | — | (3 | ) | |||||||
Net realized gain (loss), net of tax | 152 | (55 | ) | (270 | ) | ||||||
Net unrealized appreciation, net of tax | 165 | 83 | 1,012 | ||||||||
Net earnings | 434 | 184 | 1,136 | ||||||||
Capital Share Transactions | |||||||||||
Proceeds from issuance of common stock upon exercise of stock options | 38 | 31 | 36 | ||||||||
Repurchase of common stock | (137 | ) | (561 | ) | (362 | ) | |||||
Stock-based compensation | 42 | 32 | 44 | ||||||||
Cumulative translation adjustment, net of tax | (38 | ) | — | — | |||||||
Other | 7 | 11 | 12 | ||||||||
Net decrease in net assets resulting from capital share transactions | (88 | ) | (487 | ) | (270 | ) | |||||
Total increase (decrease) in net assets | 346 | (303 | ) | 866 | |||||||
Net assets at beginning of period | 5,126 | 5,429 | 4,563 | ||||||||
Net assets at end of period | $ | 5,472 | $ | 5,126 | $ | 5,429 | |||||
Net asset value per common share outstanding | $ | 20.50 | $ | 18.97 | $ | 17.84 | |||||
Common shares outstanding at end of period | 266.9 | 270.2 | 304.4 | ||||||||
See accompanying notes.
70
AMERICAN CAPITAL, LTD.
CONSOLIDATED STATEMENTS OF CASH FLOWS
(in millions)
Year Ended December 31, | |||||||||||
2014 | 2013 | 2012 | |||||||||
Operating Activities | |||||||||||
Net earnings | $ | 434 | $ | 184 | $ | 1,136 | |||||
Adjustments to reconcile net earnings to net cash provided by operating activities: | |||||||||||
Net unrealized appreciation of investments | (110 | ) | (120 | ) | (1,094 | ) | |||||
Net realized loss on investments | (205 | ) | 115 | 357 | |||||||
Effects on exchange rate changes on assets and liabilities denominated in foreign currencies | (8 | ) | — | — | |||||||
Loss on extinguishment of debt | — | — | 5 | ||||||||
Accrued PIK interest and dividends on investments | (67 | ) | (100 | ) | (228 | ) | |||||
Stock-based compensation | 48 | 32 | 44 | ||||||||
Decrease (increase) in deferred tax asset, net | 60 | 52 | (16 | ) | |||||||
Increase in interest and dividend receivable | (20 | ) | (4 | ) | (10 | ) | |||||
Decrease (increase) in other assets | 1 | 7 | (16 | ) | |||||||
Increase (decrease) in other liabilities | 9 | 27 | (9 | ) | |||||||
Other | 3 | — | (5 | ) | |||||||
Net cash provided by operating activities | 145 | 193 | 164 | ||||||||
Investing Activities | |||||||||||
Purchases and originations of investments | (3,206 | ) | (1,028 | ) | (588 | ) | |||||
(Fundings on) repayments from portfolio company revolving credit facility investments, net | (4 | ) | 72 | 10 | |||||||
Principal repayments on debt investments | 755 | 645 | 979 | ||||||||
Proceeds from loan syndications and loan sales | 98 | 14 | 3 | ||||||||
Payment of accrued PIK notes and dividend and accreted original issue discounts | 389 | 187 | 242 | ||||||||
Proceeds from equity investments | 1,523 | 362 | 274 | ||||||||
Increase in cash collateral on total return swaps | (35 | ) | (55 | ) | — | ||||||
Interest rate derivative periodic interest receipts (payments), net | 4 | (6 | ) | (25 | ) | ||||||
Interest rate derivative termination payments | — | (13 | ) | (62 | ) | ||||||
Other | (28 | ) | (5 | ) | (10 | ) | |||||
Net cash (used in) provided by investing activities | (504 | ) | 173 | 823 | |||||||
Financing Activities | |||||||||||
Proceeds from revolving credit facilities | 777 | — | — | ||||||||
Proceeds from secured term loan | — | 24 | 597 | ||||||||
Payments on secured borrowings | (5 | ) | (174 | ) | (575 | ) | |||||
Proceeds from unsecured borrowings | — | 342 | — | ||||||||
Payments on unsecured borrowings | — | — | (11 | ) | |||||||
Payments on notes payable from asset securitizations | — | (178 | ) | (487 | ) | ||||||
Proceeds from issuance of common stock upon exercise of stock options | 38 | 31 | 36 | ||||||||
Repurchase of common stock | (137 | ) | (561 | ) | (362 | ) | |||||
(Increase) decrease in debt service escrows | (15 | ) | 124 | (60 | ) | ||||||
Other | 5 | 10 | 2 | ||||||||
Net cash provided by (used in) financing activities | 663 | (382 | ) | (860 | ) | ||||||
Net increase (decrease) in cash and cash equivalents | 304 | (16 | ) | 127 | |||||||
Cash and cash equivalents at beginning of period | 315 | 331 | 204 | ||||||||
Increase in cash due to consolidation of European Capital | 57 | — | — | ||||||||
Cash and cash equivalents at end of period | $ | 676 | $ | 315 | $ | 331 | |||||
Supplemental Disclosures | |||||||||||
Cash paid for interest | $ | 47 | $ | 33 | $ | 45 | |||||
Cash (received) paid from taxes | $ | (9 | ) | $ | 3 | $ | (5 | ) | |||
Non-cash Investing Activities | |||||||||||
Debt investment received from the sale of equity investments | $ | — | $ | — | $ | 3 | |||||
Equity investment received related to the management agreement of American Capital Equity III, LP | $ | 22 | $ | — | $ | — | |||||
Equity investment received from the contribution of Structured Products investments | $ | — | $ | 25 | $ | — | |||||
See accompanying notes.
71
AMERICAN CAPITAL, LTD.
CONSOLIDATED FINANCIAL HIGHLIGHTS
(in millions, except per share data)
Year Ended December 31, | |||||||||||||||||||
2014 | 2013 | 2012 | 2011 | 2010 | |||||||||||||||
Per Share Data | |||||||||||||||||||
Net asset value at beginning of the period | $ | 18.97 | $ | 17.84 | $ | 13.87 | $ | 10.71 | $ | 8.29 | |||||||||
Loss on extinguishment of debt, net of tax(1) | — | — | (0.01 | ) | — | — | |||||||||||||
Net operating income(1) | 0.44 | 0.53 | 1.24 | 1.30 | 0.63 | ||||||||||||||
Net realized gain (loss), net of tax(1) | 0.57 | (0.18 | ) | (0.84 | ) | (0.90 | ) | (1.77 | ) | ||||||||||
Net unrealized appreciation, net of tax(1) | 0.61 | 0.28 | 3.16 | 2.43 | 4.20 | ||||||||||||||
Net earnings(1) | 1.62 | 0.63 | 3.55 | 2.83 | 3.06 | ||||||||||||||
Issuance of common stock from stock compensation plans | (0.23 | ) | (0.20 | ) | (0.24 | ) | (0.05 | ) | (0.58 | ) | |||||||||
Repurchase of common stock | 0.16 | 0.66 | 0.77 | 0.32 | — | ||||||||||||||
Cumulative translation adjustment, net of tax | (0.14 | ) | — | — | — | — | |||||||||||||
Other, net(2) | 0.12 | 0.04 | (0.11 | ) | 0.06 | (0.06 | ) | ||||||||||||
Net asset value at end of period | $ | 20.50 | $ | 18.97 | $ | 17.84 | $ | 13.87 | $ | 10.71 | |||||||||
Ratio/Supplemental Data | |||||||||||||||||||
Per share market value at end of period | $ | 14.61 | $ | 15.64 | $ | 12.02 | $ | 6.73 | $ | 7.56 | |||||||||
Total investment (loss) return(3) | (6.59 | %) | 30.12 | % | 78.61 | % | (10.98 | %) | 209.84 | % | |||||||||
Shares of common stock outstanding at end of period | 266.9 | 270.2 | 304.4 | 329.1 | 342.4 | ||||||||||||||
Net assets at end of period | $ | 5,472 | $ | 5,126 | $ | 5,429 | $ | 4,563 | $ | 3,668 | |||||||||
Average net assets(4) | $ | 5,284 | $ | 5,444 | $ | 5,152 | $ | 4,181 | $ | 2,981 | |||||||||
Average debt outstanding(5) | $ | 1,091 | $ | 694 | $ | 960 | $ | 1,662 | $ | 3,275 | |||||||||
Average debt outstanding per common share(1) | $ | 4.07 | $ | 2.38 | $ | 3.00 | $ | 4.83 | $ | 10.05 | |||||||||
Portfolio turnover rate | 50.55 | % | 21.23 | % | 9.47 | % | 5.39 | % | 2.80 | % | |||||||||
Ratio of operating expenses to average net assets | 5.45 | % | 4.68 | % | 5.10 | % | 6.89 | % | 13.28 | % | |||||||||
Ratio of operating expenses, net of interest expense, to average net assets | 4.43 | % | 3.88 | % | 3.96 | % | 4.74 | % | 7.34 | % | |||||||||
Ratio of interest expense to average net assets | 1.02 | % | 0.81 | % | 1.15 | % | 2.15 | % | 5.94 | % | |||||||||
Ratio of net operating income to average net assets | 2.21 | % | 2.87 | % | 7.71 | % | 10.72 | % | 6.84 | % | |||||||||
(1) | Weighted average basic per share data. |
(2) | Represents the impact of (i) the other components in the changes in net assets, including other capital transactions such as the purchase of common stock held in deferred compensation trusts, stock-based compensation, income tax deductions related to the exercise of stock options and distribution of stock awards in excess of U.S. GAAP expense credited to additional paid-in capital and (ii) the different share amounts used in calculating per share data as a result of calculating certain per share data based upon the weighted average basic shares outstanding during the period and certain per share data based on the shares outstanding as of a period end. |
(3) | Total investment return is based on the change in the market value of our common stock taking into account dividends, if any, reinvested in accordance with the terms of our dividend reinvestment plan. |
(4) | Based on the quarterly average of net assets as of the beginning and end of each period presented. |
(5) | Based on a daily weighted average balance of debt outstanding, excluding discounts, during the period. |
See accompanying notes.
72
AMERICAN CAPITAL, LTD. CONSOLIDATED SCHEDULE OF INVESTMENTS December 31, 2014 (in millions, except share data) | |||||||||||||||||||||||
Company(1) | Industry | Investments | Cash Interest Rate(2) | PIK Interest Rate(2) | Maturity Date(2) | # of Shares/ Units Owned | Principal | Cost | Fair Value | ||||||||||||||
AMERICAN CAPITAL NON-CONTROL / NON-AFFILIATE INVESTMENTS | |||||||||||||||||||||||
2 TransAm LLC | Real Estate | First Lien Senior Debt(6) | 5.4 | % | N/A | 1/18 | $ | 5.6 | $ | 5.6 | $ | 5.6 | |||||||||||
Aderant North America, Inc. | Software | Second Lien Senior Debt(6) | 10.0 | % | N/A | 6/19 | 16.0 | 15.8 | 16.2 | ||||||||||||||
American Acquisition, LLC(7) | Capital Markets | First Lien Senior Debt(6) | 19.3 | % | N/A | 3/15 | 2.7 | 2.7 | 2.7 | ||||||||||||||
AmWINS Group, LLC | Insurance | Second Lien Senior Debt | 9.5 | % | N/A | 9/20 | 46.0 | 44.8 | 45.1 | ||||||||||||||
Bensussen Deutsch & Associates, LLC | Distributors | Second Lien Senior Debt(6) | 12.0 | % | 2.0 | % | 9/19 | 45.3 | 42.9 | 42.8 | |||||||||||||
Common Stock(4) | 1,224,089 | 2.5 | 4.7 | ||||||||||||||||||||
45.4 | 47.5 | ||||||||||||||||||||||
BeyondTrust Software, Inc. | Software | First Lien Senior Debt(6) | 8.0 | % | N/A | 9/19 | 27.6 | 27.6 | 27.6 | ||||||||||||||
Blue Wolf Capital Fund II, L.P.(7) | Capital Markets | Limited Partnership Interest(4) | 8.8 | 8.6 | |||||||||||||||||||
BRG Sports, Inc. | Leisure Products | Redeemable Preferred Stock(4) | 1,171 | 1.2 | 1.8 | ||||||||||||||||||
Common Units(4) | 3,830,068 | 0.7 | — | ||||||||||||||||||||
1.9 | 1.8 | ||||||||||||||||||||||
CAMP International Holding Company | Transportation Infrastructure | Second Lien Senior Debt(6) | 8.3 | % | N/A | 11/19 | 15.0 | 15.0 | 15.1 | ||||||||||||||
CGSC of Delaware Holdings Corporation(7) | Insurance | Second Lien Senior Debt(6) | 8.3 | % | N/A | 10/20 | 2.0 | 2.0 | 1.8 | ||||||||||||||
Convergint Technologies, LLC | Commercial Services & Supplies | Second Lien Senior Debt(6) | 9.0 | % | N/A | 12/17-12/20 | 75.0 | 75.0 | 75.0 | ||||||||||||||
CPI Buyer, LLC | Trading Companies & Distributors | Second Lien Senior Debt(6) | 8.5 | % | N/A | 8/22 | 25.0 | 24.6 | 24.7 | ||||||||||||||
Datapipe, Inc. | IT Services | Second Lien Senior Debt(6) | 8.5 | % | N/A | 9/19 | 29.5 | 29.1 | 28.5 | ||||||||||||||
Delsey Holding S.A.S.(7) | Textiles, Apparel & Luxury Goods | First Lien Senior Debt(6) | 6.5 | % | 3.3 | % | 12/16 | 15.3 | 15.2 | 13.9 | |||||||||||||
Mezzanine Debt(5)(6) | N/A | 11.0 | % | 12/22 | 2.1 | 1.8 | 0.4 | ||||||||||||||||
17.0 | 14.3 | ||||||||||||||||||||||
Exchange South Owner, LLC(7) | Real Estate | First Lien Senior Debt(6) | 7.7 | % | N/A | 1/19 | 6.9 | 6.9 | 6.9 | ||||||||||||||
Flexera Software LLC | Software | Second Lien Senior Debt(6) | 8.0 | % | N/A | 4/21 | 5.0 | 5.0 | 4.8 | ||||||||||||||
Foamex Innovations, Inc. | Household Durables | Common Stock(4) | 2,708 | — | 0.6 | ||||||||||||||||||
Common Stock Warrants(4)(6) | 7,067 | — | 0.2 | ||||||||||||||||||||
— | 0.8 | ||||||||||||||||||||||
Inmar, Inc. | Commercial Services & Supplies | Second Lien Senior Debt(6) | 8.0 | % | N/A | 1/22 | 20.0 | 19.8 | 19.6 | ||||||||||||||
Iotum Global Holdings, Inc.(7) | Diversified Telecommunication Services | First Lien Senior Debt(6) | N/A | 10.0 | % | 5/17 | 2.4 | 2.4 | 2.4 | ||||||||||||||
iParadigms, LLC | Internet Software & Services | Second Lien Senior Debt(6) | 8.3 | % | N/A | 7/22 | 27.0 | 26.8 | 26.6 | ||||||||||||||
Jazz Acquisition, Inc. | Aerospace & Defense | Second Lien Senior Debt(6) | 7.8 | % | N/A | 6/22 | 25.0 | 24.9 | 24.5 | ||||||||||||||
Landslide Holdings, Inc. | Software | Second Lien Senior Debt(6) | 8.3 | % | N/A | 2/21 | 9.0 | 9.0 | 8.8 | ||||||||||||||
LTG Acquisition, Inc. | Communications Equipment | Second Lien Senior Debt(6) | 9.0 | % | N/A | 10/20 | 46.0 | 46.0 | 45.6 | ||||||||||||||
Common Stock(4)(6) | 5,000 | 5.0 | 7.3 | ||||||||||||||||||||
51.0 | 52.9 | ||||||||||||||||||||||
Mitchell International, Inc. | Software | Second Lien Senior Debt(6) | 8.5 | % | N/A | 10/21 | 7.0 | 6.9 | 7.0 | ||||||||||||||
M-IV Lake Center LLC(7) | Real Estate | First Lien Senior Debt(6) | 5.4 | % | N/A | 12/17 | 6.1 | 6.1 | 6.1 | ||||||||||||||
Parkeon S.A.S.(7) | Electronic Equipment, Instruments & Components | First Lien Senior Debt(6) | 2.4 | % | N/A | 12/17 | 4.3 | 4.0 | 3.6 | ||||||||||||||
Redeemable Preferred Stock(4)(6) | 5,234,743 | 0.5 | 1.2 | ||||||||||||||||||||
4.5 | 4.8 | ||||||||||||||||||||||
Parts Holding Coörperatief U.A(7) | Distributors | Membership Entitlements(4) | 173,060 | 6.4 | 1.7 | ||||||||||||||||||
Qualium I(7) | Capital Markets | Common Stock(4) | 247,939 | 6.9 | 6.9 | ||||||||||||||||||
Ranpak Corp. | Containers & Packaging | Second Lien Senior Debt(6) | 8.3 | % | N/A | 10/22 | 25.0 | 25.0 | 25.0 | ||||||||||||||
Roark - Money Mailer, LLC | Media | Common Membership Units | 3.5 | % | — | 0.8 | |||||||||||||||||
Sage Products Holdings III, LLC | Health Care Equipment & Supplies | Second Lien Senior Debt(6) | 9.3 | % | N/A | 6/20 | 22.8 | 22.9 | 22.6 | ||||||||||||||
Sparta Systems, Inc. | IT Services | First Lien Senior Debt(6) | 6.3 | % | 1.5% | 7/20 | 24.9 | 24.7 | 24.7 | ||||||||||||||
Convertible Preferred Stock(6) | 743 | 0.8 | 0.8 | ||||||||||||||||||||
25.5 | 25.5 | ||||||||||||||||||||||
Systems Maintenance Services Holding, Inc. | IT Services | Second Lien Senior Debt(6) | 9.3 | % | N/A | 10/20 | 28.0 | 27.8 | 27.8 | ||||||||||||||
Teasdale Foods, Inc. | Food & Staples Retailing | Second Lien Senior Debt(6) | 8.8 | % | N/A | 10/21 | 31.5 | 31.5 | 31.5 | ||||||||||||||
73
AMERICAN CAPITAL, LTD. CONSOLIDATED SCHEDULE OF INVESTMENTS—(Continued) December 31, 2014 (in millions, except share data) | |||||||||||||||||||||||
Company(1) | Industry | Investments | Cash Interest Rate(2) | PIK Interest Rate(2) | Maturity Date(2) | # of Shares/ Units Owned | Principal | Cost | Fair Value | ||||||||||||||
Tectum Holdings, Inc. | Auto Components | Second Lien Senior Debt(6) | 9.8 | % | N/A | 1/21 | 41.5 | 40.9 | 40.9 | ||||||||||||||
Convertible Preferred Stock(4)(6) | 25,000 | 2.5 | 2.5 | ||||||||||||||||||||
43.4 | 43.4 | ||||||||||||||||||||||
Tyche Holdings, LLC | IT Services | Second Lien Senior Debt(6) | 9.0 | % | N/A | 11/22 | 27.0 | 26.9 | 26.7 | ||||||||||||||
Tyden Cayman Holdings Corp.(7) | Electronic Equipment, Instruments & Components | Convertible Preferred Stock(4)(6) | 26,977 | 0.1 | 0.1 | ||||||||||||||||||
Common Stock(4)(6) | 3,218,667 | 3.8 | 2.3 | ||||||||||||||||||||
3.9 | 2.4 | ||||||||||||||||||||||
W3 CO. | Health Care Equipment & Supplies | Second Lien Senior Debt(6) | 9.3 | % | N/A | 9/20 | 17.0 | 16.8 | 16.4 | ||||||||||||||
WP CPP Holdings, LLC | Aerospace & Defense | Second Lien Senior Debt(6) | 8.8 | % | N/A | 4/21 | 40.0 | 39.8 | 38.2 | ||||||||||||||
WRH, Inc.(8) | Life Sciences Tools & Services | Mezzanine Debt(6) | 9.3 | % | 5.9 | % | 8/18 | 95.8 | 95.6 | 92.5 | |||||||||||||
Convertible Preferred Stock(4)(6) | 2,008,575 | 200.9 | 96.9 | ||||||||||||||||||||
Common Stock(4)(6) | 502,144 | 49.8 | — | ||||||||||||||||||||
346.3 | 189.4 | ||||||||||||||||||||||
EUROPEAN CAPITAL NON-CONTROL / NON-AFFILIATE INVESTMENTS | |||||||||||||||||||||||
Delsey Holdings S.A.S.(7) | Textiles, Apparel & Luxury Goods | First Lien Senior Debt | 6.5% | 2.0 | % | 12/16 | 89.4 | 89.4 | 84.2 | ||||||||||||||
Mezzanine Debt(5) | N/A | 11.0 | % | 12/22 | 12.2 | 10.5 | 2.4 | ||||||||||||||||
99.9 | 86.6 | ||||||||||||||||||||||
Financière OFIC S.A.S.(7) | Building Products | Warrants(4) | 1,574,600 | — | 2.8 | ||||||||||||||||||
Financière Poult S.A.S.(7) | Food Products | Mezzanine Debt | 5.0% | 5.3 | % | 6/22 | 16.2 | 16.2 | 15.9 | ||||||||||||||
Financière Riskeco S.A.S.(7) | Diversified Consumer Services | First Lien Senior Debt | 6.5% | 2.0 | % | 7/21 | 14.1 | 14.1 | 13.7 | ||||||||||||||
Groupe INSEEC(7) | Education Services | First Lien Senior Debt | 6.0% | 3.0 | % | 12/20 | 47.1 | 47.1 | 45.8 | ||||||||||||||
Hilding Anders AB(7) | Household Durables | Mezzanine Debt(5) | N/A | 12.0 | % | 12/19 | 36.2 | 17.7 | — | ||||||||||||||
Legendre Holding 31 S.A.(7) | Leisure Products | First Lien Senior Debt | 5.7% | N/A | 1/21 | 68.4 | 68.4 | 65.0 | |||||||||||||||
Common Stock(4) | 51,975,983 | 6.3 | 6.3 | ||||||||||||||||||||
74.7 | 71.3 | ||||||||||||||||||||||
Modacin France S.A.S.(7) | Textiles, Apparel & Luxury Goods | Mezzanine Debt(5) | 4.0% | 4.5 | % | 5/17 | 23.2 | 12.6 | — | ||||||||||||||
Parts Holding Coörperatief U.A.(7) | Auto Components | Common Stock(4) | 568,624 | — | 5.4 | ||||||||||||||||||
Skrubbe Vermogensverwaltungsgesellschaft mbH(7) | Hotels, Restaurants & Leisure | First Lien Senior Debt | 4.5% | 3.0 | % | 7/20 | 12.3 | 12.3 | 12.1 | ||||||||||||||
The Flexitallic Group S.A.S.(7) | Energy Equipment & Services | First Lien Senior Debt | 4.5% | 4.5 | % | 7/20 | 26.6 | 26.6 | 26.3 | ||||||||||||||
Tiama 2 S.A.S.(7) | Machinery | Mezzanine Debt(5) | 4.5% | 5.0 | % | 2/17 | 49.1 | 28.1 | — | ||||||||||||||
Unipex Neptune International SAS(7) | Chemical | Mezzanine Debt | 7.0% | 5.0 | % | 9/20 | 5.3 | 5.3 | 5.3 | ||||||||||||||
Zodiac Marine and Pool S.A.(7) | Marine | Second Lien Senior Debt(5) | — | % | 4.0 | % | 3/17 | 38.0 | 27.6 | — | |||||||||||||
Mezzanine Debt(5) | — | % | 8.0 | % | 9/17 | 69.9 | 38.8 | — | |||||||||||||||
66.4 | — | ||||||||||||||||||||||
SENIOR FLOATING RATE LOANS | |||||||||||||||||||||||
1011778 B.C. Unlimited Liability Company(7) | Hotels, Restaurants & Leisure | First Lien Senior Debt(6) | 4.5 | % | N/A | 12/21 | 17.0 | 16.8 | 17.0 | ||||||||||||||
24 Hour Fitness Worldwide, Inc. | Hotels, Restaurants & Leisure | First Lien Senior Debt(6) | 4.8 | % | N/A | 5/21 | 8.3 | 8.4 | 8.0 | ||||||||||||||
Accellent Inc. | Health Care Equipment & Supplies | First Lien Senior Debt(6) | 4.5 | % | N/A | 3/21 | 7.4 | 7.4 | 7.3 | ||||||||||||||
Acosta Holdco, Inc. | Media | First Lien Senior Debt(6) | 5.0 | % | N/A | 9/21 | 16.0 | 15.9 | 16.0 | ||||||||||||||
Advantage Sales & Marketing Inc. | Professional Services | First Lien Senior Debt(6) | 4.3 | % | N/A | 7/21 | 16.0 | 16.0 | 15.8 | ||||||||||||||
Second Lien Senior Debt(6) | 7.5 | % | N/A | 7/22 | 1.0 | 1.0 | 1.0 | ||||||||||||||||
17.0 | 16.8 | ||||||||||||||||||||||
Aecom Technology Corp(7) | Construction & Engineering | First Lien Senior Debt(6) | 3.8 | % | N/A | 10/21 | 4.2 | 4.2 | 4.2 | ||||||||||||||
Affinia Group Inc. | Auto Components | First Lien Senior Debt(6) | 4.8 | % | N/A | 4/20 | 7.6 | 7.6 | 7.6 | ||||||||||||||
Akorn, Inc.(7) | Pharmaceuticals | First Lien Senior Debt(6) | 4.5 | % | N/A | 4/21 | 5.0 | 5.0 | 5.0 | ||||||||||||||
Albertson's LLC | Food & Staples Retailing | First Lien Senior Debt(6) | 4.6 | % | N/A | 3/19-8/21 | 2.0 | 2.0 | 2.0 | ||||||||||||||
AlixPartners, LLP | Diversified Financial Services | First Lien Senior Debt(6) | 4.0 | % | N/A | 7/20 | 12.0 | 12.0 | 11.9 | ||||||||||||||
Alliance Laundry Systems LLC | Machinery | First Lien Senior Debt(6) | 4.3 | % | N/A | 12/18 | 4.5 | 4.5 | 4.4 | ||||||||||||||
American Airlines, Inc.(7) | Airlines | First Lien Senior Debt(6) | 3.8 | % | N/A | 6/19 | 9.9 | 9.9 | 9.9 | ||||||||||||||
American Renal Holdings Inc. | Health Care Providers & Services | First Lien Senior Debt(6) | 4.5 | % | N/A | 8/19 | 7.7 | 7.7 | 7.7 | ||||||||||||||
74
AMERICAN CAPITAL, LTD. CONSOLIDATED SCHEDULE OF INVESTMENTS—(Continued) December 31, 2014 (in millions, except share data) | |||||||||||||||||||||||
Company(1) | Industry | Investments | Cash Interest Rate(2) | PIK Interest Rate(2) | Maturity Date(2) | # of Shares/ Units Owned | Principal | Cost | Fair Value | ||||||||||||||
American Tire Distributors, Inc. | Distributors | First Lien Senior Debt(6) | 5.8 | % | N/A | 6/18 | 5.0 | 5.0 | 5.0 | ||||||||||||||
AmSurg Corp.(7) | Health Care Providers & Services | First Lien Senior Debt(6) | 3.8 | % | N/A | 7/21 | 10.0 | 10.0 | 9.9 | ||||||||||||||
AmWINS Group, LLC | Insurance | First Lien Senior Debt(6) | 5.3 | % | N/A | 9/19 | 8.8 | 8.8 | 8.8 | ||||||||||||||
Anchor Glass Container Corporation | Containers & Packaging | First Lien Senior Debt(6) | 4.3 | % | N/A | 6/21 | 7.5 | 7.5 | 7.4 | ||||||||||||||
Aquilex LLC | Commercial Services & Supplies | First Lien Senior Debt(6) | 5.0 | % | N/A | 12/20 | 3.0 | 3.0 | 2.9 | ||||||||||||||
Aramark Corporation(7) | Commercial Services & Supplies | First Lien Senior Debt(6) | 3.3 | % | N/A | 2/21 | 14.8 | 14.6 | 14.6 | ||||||||||||||
Ardent Medical Services, Inc. | Health Care Providers & Services | First Lien Senior Debt(6) | 6.8 | % | N/A | 7/18 | 0.3 | 0.3 | 0.3 | ||||||||||||||
ARG IH Corporation | Hotels, Restaurants & Leisure | First Lien Senior Debt(6) | 4.8 | % | N/A | 11/20 | 5.5 | 5.5 | 5.5 | ||||||||||||||
Aristocrat Leisure Limited(7) | Hotels, Restaurants & Leisure | First Lien Senior Debt(6) | 4.8 | % | N/A | 10/21 | 5.0 | 4.9 | 4.9 | ||||||||||||||
Ascend Learning, LLC | Diversified Consumer Services | First Lien Senior Debt(6) | 5.0 | % | N/A | 7/19 | 2.4 | 2.4 | 2.4 | ||||||||||||||
Ascensus, Inc. | Commercial Services & Supplies | First Lien Senior Debt(6) | 5.0 | % | N/A | 12/19 | 6.0 | 6.1 | 6.0 | ||||||||||||||
Asurion, LLC | Commercial Services & Supplies | First Lien Senior Debt(6) | 5.0 | % | N/A | 5/19 | 7.4 | 7.4 | 7.3 | ||||||||||||||
Atlantic Power Limited Partnership(7) | Independent Power & Renewable Electricity Producers | First Lien Senior Debt(6) | 4.8 | % | N/A | 2/21 | 4.5 | 4.5 | 4.5 | ||||||||||||||
AZ Chem US Inc. | Chemicals | First Lien Senior Debt(6) | 4.5 | % | N/A | 6/21 | 9.6 | 9.7 | 9.4 | ||||||||||||||
BarBri, Inc. | Diversified Consumer Services | First Lien Senior Debt(6) | 4.5 | % | N/A | 7/19 | 9.8 | 9.8 | 9.6 | ||||||||||||||
Berlin Packaging L.L.C. | Containers & Packaging | First Lien Senior Debt(6) | 4.5 | % | N/A | 10/21 | 6.5 | 6.4 | 6.5 | ||||||||||||||
Biomet, Inc. | Health Care Equipment & Supplies | First Lien Senior Debt(6) | 3.7 | % | N/A | 7/17 | 4.0 | 4.0 | 4.0 | ||||||||||||||
BJ’s Wholesale Club, Inc. | Food & Staples Retailing | First Lien Senior Debt(6) | 4.5 | % | N/A | 9/19 | 4.9 | 4.9 | 4.9 | ||||||||||||||
Blackboard Inc. | Software | First Lien Senior Debt(6) | 4.8 | % | N/A | 10/18 | 5.0 | 5.0 | 4.9 | ||||||||||||||
Boulder Brands, Inc.(7) | Food Products | First Lien Senior Debt(6) | 4.5 | % | N/A | 7/20 | 7.1 | 7.1 | 7.1 | ||||||||||||||
Boyd Gaming Corporation(7) | Hotels, Restaurants & Leisure | First Lien Senior Debt(6) | 4.0 | % | N/A | 8/20 | 6.4 | 6.4 | 6.3 | ||||||||||||||
Burlington Coat Factory Warehouse Corporation(7) | Specialty Retail | First Lien Senior Debt(6) | 4.3 | % | N/A | 8/21 | 4.0 | 4.0 | 3.9 | ||||||||||||||
BWAY Intermediate Company, Inc. | Containers & Packaging | First Lien Senior Debt(6) | 5.6 | % | N/A | 8/20 | 4.0 | 3.9 | 4.0 | ||||||||||||||
Camp International Holding Company | Transportation Infrastructure | First Lien Senior Debt(6) | 4.8 | % | N/A | 5/19 | 7.7 | 7.7 | 7.7 | ||||||||||||||
Capital Automotive L.P. | Real Estate | First Lien Senior Debt(6) | 4.0 | % | N/A | 4/19 | 12.3 | 12.3 | 12.1 | ||||||||||||||
Capital Safety North America Holdings Inc. | Commercial Services & Supplies | First Lien Senior Debt(6) | 3.8 | % | N/A | 3/21 | 9.4 | 9.2 | 9.2 | ||||||||||||||
Capsugel Holdings US, Inc. | Pharmaceuticals | First Lien Senior Debt(6) | 3.5 | % | N/A | 8/18 | 11.5 | 11.5 | 11.3 | ||||||||||||||
Carecore National, LLC | Health Care Providers & Services | First Lien Senior Debt(6) | 5.5 | % | N/A | 3/21 | 5.0 | 5.0 | 4.9 | ||||||||||||||
Carros Finance Luxembourg S.A.R.L.(7) | Machinery | First Lien Senior Debt(6) | 4.5 | % | N/A | 9/21 | 9.0 | 9.0 | 8.9 | ||||||||||||||
Catalent Pharma Solutions, Inc.(7) | Pharmaceuticals | First Lien Senior Debt(6) | 4.3 | % | N/A | 5/21 | 12.4 | 12.5 | 12.4 | ||||||||||||||
CCM Merger Inc. | Hotels, Restaurants & Leisure | First Lien Senior Debt(6) | 4.5 | % | N/A | 8/21 | 4.9 | 4.9 | 4.8 | ||||||||||||||
CEC Entertainment, Inc. | Hotels, Restaurants & Leisure | First Lien Senior Debt(6) | 4.0 | % | N/A | 2/21 | 12.4 | 12.3 | 12.1 | ||||||||||||||
Cequel Communications, LLC | Media | First Lien Senior Debt(6) | 3.5 | % | N/A | 2/19 | 15.1 | 14.9 | 15.0 | ||||||||||||||
Charter Communications Operating, LLC(7) | Media | First Lien Senior Debt(6) | 4.3 | % | N/A | 9/21 | 1.3 | 1.2 | 1.3 | ||||||||||||||
Checkout Holding Corp. | Media | First Lien Senior Debt(6) | 4.5 | % | N/A | 4/21 | 5.0 | 5.0 | 4.8 | ||||||||||||||
Chrysler Group LLC(7) | Automobiles | First Lien Senior Debt(6) | 3.3 | % | N/A | 12/18 | 9.9 | 9.9 | 9.9 | ||||||||||||||
CityCenter Holdings, LLC | Hotels, Restaurants & Leisure | First Lien Senior Debt(6) | 4.3 | % | N/A | 10/20 | 12.5 | 12.4 | 12.4 | ||||||||||||||
Connolly, LLC | Professional Services | First Lien Senior Debt(6) | 5.0 | % | N/A | 5/21 | 8.8 | 8.8 | 8.8 | ||||||||||||||
Second Lien Senior Debt(6) | 8.0 | % | N/A | 5/22 | 1.0 | 1.0 | 1.0 | ||||||||||||||||
9.8 | 9.8 | ||||||||||||||||||||||
75
AMERICAN CAPITAL, LTD. CONSOLIDATED SCHEDULE OF INVESTMENTS—(Continued) December 31, 2014 (in millions, except share data) | |||||||||||||||||||||||
Company(1) | Industry | Investments | Cash Interest Rate(2) | PIK Interest Rate(2) | Maturity Date(2) | # of Shares/ Units Owned | Principal | Cost | Fair Value | ||||||||||||||
Consolidated Communications, Inc.(7) | Diversified Telecommunication Services | First Lien Senior Debt(6) | 4.3 | % | N/A | 12/20 | 5.0 | 5.0 | 4.9 | ||||||||||||||
CPG International Inc. | Building Products | First Lien Senior Debt(6) | 4.8 | % | N/A | 9/20 | 7.4 | 7.5 | 7.4 | ||||||||||||||
CPI Buyer, LLC | Trading Companies & Distributors | First Lien Senior Debt(6) | 5.5 | % | N/A | 8/21 | 2.0 | 2.0 | 2.0 | ||||||||||||||
CPI International Inc. | Electronic Equipment, Instruments & Components | First Lien Senior Debt(6) | 4.3 | % | N/A | 11/17 | 10.4 | 10.4 | 10.3 | ||||||||||||||
CT Technologies Intermediate Holdings, Inc. | Health Care Technology | First Lien Senior Debt(6) | 6.0 | % | N/A | 12/21 | 3.0 | 3.0 | 3.0 | ||||||||||||||
DAE Aviation Holdings, Inc. | Aerospace & Defense | First Lien Senior Debt(6) | 5.0 | % | N/A | 11/18 | 3.6 | 3.6 | 3.6 | ||||||||||||||
Dave & Buster's, Inc. | Hotels, Restaurants & Leisure | First Lien Senior Debt(6) | 4.3 | % | N/A | 7/20 | 6.1 | 6.1 | 6.1 | ||||||||||||||
Del Monte Foods, Inc.(7) | Food Products | First Lien Senior Debt(6) | 4.3 | % | N/A | 2/21 | 5.0 | 5.0 | 4.6 | ||||||||||||||
Dell International LLC | Technology Hardware, Storage & Peripherals | First Lien Senior Debt(6) | 4.5 | % | N/A | 4/20 | 9.5 | 9.4 | 9.5 | ||||||||||||||
Deltek, Inc. | Software | First Lien Senior Debt(6) | 4.5 | % | N/A | 10/18 | 5.0 | 4.9 | 4.9 | ||||||||||||||
Dialysis Newco, Inc. | Health Care Providers & Services | First Lien Senior Debt(6) | 4.5 | % | N/A | 4/21 | 11.9 | 12.0 | 11.9 | ||||||||||||||
Dole Food Company, Inc. | Food Products | First Lien Senior Debt(6) | 4.5 | % | N/A | 11/18 | 10.2 | 10.3 | 10.1 | ||||||||||||||
DPX Holdings B.V. (7) | Life Sciences Tools & Services | First Lien Senior Debt(6) | 4.3 | % | N/A | 3/21 | 7.0 | 6.9 | 6.8 | ||||||||||||||
Drew Marine Group Inc. | Chemicals | First Lien Senior Debt(6) | 4.5 | % | N/A | 11/20 | 5.0 | 5.0 | 4.9 | ||||||||||||||
DTZ U.S. Borrower, LLC(7) | Real Estate | First Lien Senior Debt(6) | 5.5 | % | N/A | 11/21 | 2.0 | 2.0 | 2.0 | ||||||||||||||
Duff & Phelps Corporation | Capital Markets | First Lien Senior Debt(6) | 4.5 | % | N/A | 4/20 | 10.4 | 10.5 | 10.3 | ||||||||||||||
Dunkin' Brands, Inc.(7) | Hotels, Restaurants & Leisure | First Lien Senior Debt(6) | 3.3 | % | N/A | 2/21 | 7.5 | 7.4 | 7.3 | ||||||||||||||
DynCorp International Inc. | Aerospace & Defense | First Lien Senior Debt(6) | 6.3 | % | N/A | 7/16 | 1.0 | 1.0 | 1.0 | ||||||||||||||
Eco Services Operations LLC | Chemicals | First Lien Senior Debt(6) | 4.8 | % | N/A | 12/21 | 2.0 | 2.0 | 2.0 | ||||||||||||||
EFS Cogen Holdings I, LLC | Independent Power & Renewable Electricity Producers | First Lien Senior Debt(6) | 3.8 | % | N/A | 12/20 | 11.3 | 11.3 | 11.2 | ||||||||||||||
Electrical Components International, Inc. | Electrical Equipment | First Lien Senior Debt(6) | 5.8 | % | N/A | 5/21 | 3.0 | 3.0 | 3.0 | ||||||||||||||
Emdeon Inc. | Health Care Providers & Services | First Lien Senior Debt(6) | 3.8 | % | N/A | 11/18 | 10.0 | 9.9 | 9.8 | ||||||||||||||
Emerald Expositions Holding, Inc. | Media | First Lien Senior Debt(6) | 4.8 | % | N/A | 6/20 | 4.8 | 4.8 | 4.7 | ||||||||||||||
Entravision Communications Corporation(7) | Media | First Lien Senior Debt(6) | 3.5 | % | N/A | 5/20 | 1.9 | 1.9 | 1.8 | ||||||||||||||
EquiPower Resources Holdings, LLC | Independent Power & Renewable Electricity Producers | First Lien Senior Debt(6) | 4.3 | % | N/A | 12/18-12/19 | 4.9 | 4.9 | 4.8 | ||||||||||||||
Evergreen Acqco 1 LP | Multiline Retail | First Lien Senior Debt(6) | 5.0 | % | N/A | 7/19 | 12.4 | 12.5 | 12.0 | ||||||||||||||
EWT Holdings III Corp. | Machinery | First Lien Senior Debt(6) | 4.8 | % | N/A | 1/21 | 5.0 | 5.0 | 4.9 | ||||||||||||||
Fairmount Minerals, Ltd. | Metals & Mining | First Lien Senior Debt(6) | 4.5 | % | N/A | 9/19 | 5.0 | 5.0 | 4.5 | ||||||||||||||
Ferro Corporation(7) | Chemicals | First Lien Senior Debt(6) | 4.0 | % | N/A | 7/21 | 6.0 | 6.0 | 5.9 | ||||||||||||||
Filtration Group Corporation | Industrial Conglomerates | First Lien Senior Debt(6) | 4.5 | % | N/A | 11/20 | 10.0 | 10.0 | 9.9 | ||||||||||||||
First Data Corporation | IT Services | First Lien Senior Debt(6) | 4.0 | % | N/A | 3/18-3/21 | 17.4 | 17.4 | 17.2 | ||||||||||||||
Fitness International, LLC | Hotels, Restaurants & Leisure | First Lien Senior Debt(6) | 5.5 | % | N/A | 7/20 | 3.6 | 3.6 | 3.5 | ||||||||||||||
Flexera Software LLC | Software | First Lien Senior Debt(6) | 4.5 | % | N/A | 4/20 | 5.4 | 5.4 | 5.3 | ||||||||||||||
Fly Funding II S.à r.l.(7) | Trading Companies & Distributors | First Lien Senior Debt(6) | 4.5 | % | N/A | 8/19 | 4.6 | 4.6 | 4.5 | ||||||||||||||
Flying Fortress Inc.(7) | Capital Markets | First Lien Senior Debt(6) | 3.5 | % | N/A | 6/17 | 5.3 | 5.3 | 5.3 | ||||||||||||||
FMG Resources (August 2006) Pty LTD(7) | Metals & Mining | First Lien Senior Debt(6) | 3.8 | % | N/A | 6/19 | 5.0 | 5.0 | 4.5 | ||||||||||||||
Gates Global LLC | Machinery | First Lien Senior Debt(6) | 4.3 | % | N/A | 7/21 | 18.1 | 18.0 | 17.7 | ||||||||||||||
Global Tel*Link Corporation | Diversified Telecommunication Services | First Lien Senior Debt(6) | 5.0 | % | N/A | 5/20 | 4.3 | 4.3 | 4.2 | ||||||||||||||
76
AMERICAN CAPITAL, LTD. CONSOLIDATED SCHEDULE OF INVESTMENTS—(Continued) December 31, 2014 (in millions, except share data) | |||||||||||||||||||||||
Company(1) | Industry | Investments | Cash Interest Rate(2) | PIK Interest Rate(2) | Maturity Date(2) | # of Shares/ Units Owned | Principal | Cost | Fair Value | ||||||||||||||
Great Wolf Resorts, Inc. | Hotels, Restaurants & Leisure | First Lien Senior Debt(6) | 5.8 | % | N/A | 8/20 | 7.9 | 8.0 | 7.9 | ||||||||||||||
Greeneden U.S. Holdings II, LLC | Software | First Lien Senior Debt(6) | 4.0 | % | N/A | 2/20 | 5.0 | 4.9 | 4.9 | ||||||||||||||
Grosvenor Capital Management Holdings, LLLP | Capital Markets | First Lien Senior Debt(6) | 3.8 | % | N/A | 1/21 | 13.6 | 13.5 | 13.3 | ||||||||||||||
Guggenheim Partners Investment Management Holdings, LLC | Capital Markets | First Lien Senior Debt(6) | 4.3 | % | N/A | 7/20 | 9.0 | 8.9 | 8.9 | ||||||||||||||
H. J. Heinz Company | Food Products | First Lien Senior Debt(6) | 3.5 | % | N/A | 6/20 | 25.9 | 25.9 | 25.8 | ||||||||||||||
Hampton Rubber Company | Energy Equipment & Services | First Lien Senior Debt(6) | 5.0 | % | N/A | 3/21 | 4.0 | 4.0 | 3.8 | ||||||||||||||
Harbor Freight Tools USA, Inc. | Specialty Retail | First Lien Senior Debt(6) | 4.8 | % | N/A | 7/19 | 10.6 | 10.6 | 10.6 | ||||||||||||||
Hearthside Group Holdings, LLC | Food Products | First Lien Senior Debt(6) | 4.5 | % | N/A | 6/21 | 10.4 | 10.5 | 10.4 | ||||||||||||||
Hemisphere Media Holdings, LLC(7) | Media | First Lien Senior Debt(6) | 5.0 | % | N/A | 7/20 | 0.9 | 0.9 | 0.9 | ||||||||||||||
HFOTCO LLC | Oil, Gas & Consumable Fuels | First Lien Senior Debt(6) | 4.3 | % | N/A | 8/21 | 1.0 | 1.0 | 1.0 | ||||||||||||||
Hub International Limited | Insurance | First Lien Senior Debt(6) | 4.3 | % | N/A | 10/20 | 8.5 | 8.4 | 8.2 | ||||||||||||||
Hudson Products Holdings Inc. | Energy Equipment & Services | First Lien Senior Debt(6) | 5.0 | % | N/A | 3/19 | 7.5 | 7.5 | 7.2 | ||||||||||||||
Hyland Software, Inc. | Software | First Lien Senior Debt(6) | 4.8 | % | N/A | 2/21 | 4.0 | 4.0 | 4.0 | ||||||||||||||
Ikaria, Inc. | Health Care Providers & Services | First Lien Senior Debt(6) | 5.0 | % | N/A | 2/21 | 8.2 | 8.3 | 8.2 | ||||||||||||||
Immucor, Inc. | Health Care Equipment & Supplies | First Lien Senior Debt(6) | 5.0 | % | N/A | 8/18 | 7.9 | 8.0 | 7.8 | ||||||||||||||
IMS Health Incorporated(7) | Health Care Technology | First Lien Senior Debt(6) | 3.5 | % | N/A | 3/21 | 5.4 | 5.3 | 5.3 | ||||||||||||||
Indra Holdings Corp. | Textiles, Apparel & Luxury Goods | First Lien Senior Debt(6) | 5.3 | % | N/A | 4/21 | 4.1 | 4.2 | 4.1 | ||||||||||||||
Infinity Acquisition LLC | Software | First Lien Senior Debt(6) | 4.3 | % | N/A | 8/21 | 5.0 | 5.0 | 4.9 | ||||||||||||||
Information Resources, Inc. | Professional Services | First Lien Senior Debt(6) | 4.8 | % | N/A | 9/20 | 7.4 | 7.5 | 7.4 | ||||||||||||||
Inmar, Inc. | Commercial Services & Supplies | First Lien Senior Debt(6) | 4.3 | % | N/A | 1/21 | 4.9 | 4.9 | 4.8 | ||||||||||||||
Intelsat Jackson Holdings S.A.(7) | Diversified Telecommunication Services | First Lien Senior Debt(6) | 3.8 | % | N/A | 6/19 | 5.0 | 5.0 | 4.9 | ||||||||||||||
Interactive Data Corporation | Media | First Lien Senior Debt(6) | 4.8 | % | N/A | 4/21 | 8.5 | 8.5 | 8.4 | ||||||||||||||
Ion Media Networks, Inc. | Media | First Lien Senior Debt(6) | 4.8 | % | N/A | 12/20 | 5.0 | 5.0 | 4.9 | ||||||||||||||
J. Crew Group, Inc. | Specialty Retail | First Lien Senior Debt(6) | 4.0 | % | N/A | 3/21 | 7.5 | 7.4 | 7.1 | ||||||||||||||
J.C. Penney Corporation, Inc.(7) | Multiline Retail | First Lien Senior Debt(6) | 5.0 | % | N/A | 6/19 | 2.0 | 2.0 | 1.9 | ||||||||||||||
Jazz Acquisition, Inc. | Aerospace & Defense | First Lien Senior Debt(6) | 4.5 | % | N/A | 6/21 | 5.0 | 5.0 | 4.9 | ||||||||||||||
Key Safety Systems, Inc. | Auto Components | First Lien Senior Debt(6) | 4.8 | % | N/A | 8/21 | 5.2 | 5.2 | 5.2 | ||||||||||||||
Kindred Healthcare, Inc.(7) | Health Care Providers & Services | First Lien Senior Debt(6) | 4.3 | % | N/A | 4/21 | 7.4 | 7.3 | 7.2 | ||||||||||||||
La Frontera Generation, LLC | Independent Power & Renewable Electricity Producers | First Lien Senior Debt(6) | 4.5 | % | N/A | 9/20 | 8.7 | 8.7 | 8.6 | ||||||||||||||
La Quinta Intermediate Holdings L.L.C.(7) | Hotels, Restaurants & Leisure | First Lien Senior Debt(6) | 4.0 | % | N/A | 4/21 | 6.8 | 6.8 | 6.7 | ||||||||||||||
Landmark Aviation FBO Canada, Inc.(7) | Aerospace & Defense | First Lien Senior Debt(6) | 4.8 | % | N/A | 10/19 | 0.3 | 0.3 | 0.3 | ||||||||||||||
Landslide Holdings, Inc. | Software | First Lien Senior Debt(6) | 5.0 | % | N/A | 2/20 | 7.4 | 7.4 | 7.2 | ||||||||||||||
Learning Care Group (US) No. 2 Inc. | Diversified Consumer Services | First Lien Senior Debt(6) | 5.5 | % | N/A | 5/21 | 3.7 | 3.7 | 3.7 | ||||||||||||||
Leonardo Acquisition Corp. | Internet & Catalog Retail | First Lien Senior Debt(6) | 4.3 | % | N/A | 1/21 | 10.4 | 10.4 | 10.2 | ||||||||||||||
Level 3 Financing, Inc.(7) | Diversified Telecommunication Services | First Lien Senior Debt(6) | 4.5 | % | N/A | 1/22 | 4.0 | 4.0 | 4.0 | ||||||||||||||
Libbey Glass Inc.(7) | Household Durables | First Lien Senior Debt(6) | 3.8 | % | N/A | 4/21 | 4.5 | 4.5 | 4.4 | ||||||||||||||
Liberty Cablevision of Puerto Rico LLC | Media | First Lien Senior Debt(6) | 4.5 | % | N/A | 1/22 | 5.0 | 5.0 | 4.9 | ||||||||||||||
LM U.S. Member LLC | Aerospace & Defense | First Lien Senior Debt(6) | 4.8 | % | N/A | 10/19 | 7.7 | 7.6 | 7.6 | ||||||||||||||
77
AMERICAN CAPITAL, LTD. CONSOLIDATED SCHEDULE OF INVESTMENTS—(Continued) December 31, 2014 (in millions, except share data) | |||||||||||||||||||||||
Company(1) | Industry | Investments | Cash Interest Rate(2) | PIK Interest Rate(2) | Maturity Date(2) | # of Shares/ Units Owned | Principal | Cost | Fair Value | ||||||||||||||
MCC Iowa LLC | Media | First Lien Senior Debt(6) | 4.0 | % | N/A | 1/20-6/21 | 14.3 | 14.3 | 14.0 | ||||||||||||||
McJunkin Red Man Corporation(7) | Trading Companies & Distributors | First Lien Senior Debt(6) | 5.0 | % | N/A | 11/19 | 5.0 | 5.0 | 4.6 | ||||||||||||||
Mediacom Illinois, LLC | Media | First Lien Senior Debt(6) | 3.8 | % | N/A | 6/21 | 7.5 | 7.4 | 7.3 | ||||||||||||||
Michaels Stores, Inc.(7) | Specialty Retail | First Lien Senior Debt(6) | 3.8 | % | N/A | 1/20 | 19.7 | 19.7 | 19.3 | ||||||||||||||
Midas Intermediate Holdco II, LLC | Diversified Consumer Services | First Lien Senior Debt(6) | 4.8 | % | N/A | 8/21 | 2.0 | 2.0 | 2.0 | ||||||||||||||
Millennium Health, LLC | Health Care Providers & Services | First Lien Senior Debt(6) | 5.3 | % | N/A | 4/21 | 7.3 | 7.4 | 7.3 | ||||||||||||||
Minerals Technologies Inc.(7) | Chemicals | First Lien Senior Debt(6) | 4.0 | % | N/A | 5/21 | 2.8 | 2.8 | 2.8 | ||||||||||||||
Mirror Bidco Corp.(7) | Machinery | First Lien Senior Debt(6) | 4.3 | % | N/A | 12/19 | 7.8 | 7.9 | 7.8 | ||||||||||||||
Mitchell International, Inc. | Software | First Lien Senior Debt(6) | 4.5 | % | N/A | 10/20 | 9.4 | 9.5 | 9.3 | ||||||||||||||
Mitel US Holdings, Inc.(7) | Communications Equipment | First Lien Senior Debt(6) | 5.3 | % | N/A | 1/20 | 2.3 | 2.3 | 2.3 | ||||||||||||||
Moneygram International, Inc.(7) | IT Services | First Lien Senior Debt(6) | 4.3 | % | N/A | 3/20 | 5.0 | 4.9 | 4.6 | ||||||||||||||
MPG Holdco I Inc. | Auto Components | First Lien Senior Debt(6) | 4.3 | % | N/A | 10/21 | 7.8 | 7.8 | 7.9 | ||||||||||||||
MPH Acquisition Holdings LLC | Health Care Providers & Services | First Lien Senior Debt(6) | 3.8 | % | N/A | 3/21 | 16.5 | 16.4 | 16.1 | ||||||||||||||
Murray Energy Corporation | Oil, Gas & Consumable Fuels | First Lien Senior Debt(6) | 5.3 | % | N/A | 12/19 | 4.5 | 4.5 | 4.3 | ||||||||||||||
National Financial Partners Corp. | Insurance | First Lien Senior Debt(6) | 4.5 | % | N/A | 7/20 | 6.5 | 6.5 | 6.4 | ||||||||||||||
National Surgical Hospitals, Inc | Health Care Providers & Services | First Lien Senior Debt(6) | 5.3 | % | N/A | 8/19 | 5.5 | 5.5 | 5.4 | ||||||||||||||
Numericable U.S. LLC(7) | Media | First Lien Senior Debt(6) | 4.5 | % | N/A | 5/20 | 4.0 | 4.0 | 4.0 | ||||||||||||||
NVA Holdings, Inc. | Health Care Providers & Services | First Lien Senior Debt(6) | 4.8 | % | N/A | 8/21 | 8.5 | 8.5 | 8.4 | ||||||||||||||
Onex Carestream Finance LP | Health Care Equipment & Supplies | First Lien Senior Debt(6) | 5.0 | % | N/A | 6/19 | 14.1 | 14.2 | 14.1 | ||||||||||||||
Opal Acquisition, Inc. | Health Care Providers & Services | First Lien Senior Debt(6) | 5.0 | % | N/A | 11/20 | 5.0 | 5.0 | 4.9 | ||||||||||||||
Ortho-Clinical Diagnostics S.A.(7) | Health Care Providers & Services | First Lien Senior Debt(6) | 4.8 | % | N/A | 6/21 | 12.3 | 12.4 | 12.2 | ||||||||||||||
OSG Bulk Ships, Inc.(7) | Oil, Gas & Consumable Fuels | First Lien Senior Debt(6) | 5.3 | % | N/A | 8/19 | 8.7 | 8.8 | 8.5 | ||||||||||||||
OSP Group, Inc. | Internet & Catalog Retail | First Lien Senior Debt(6) | 4.5 | % | N/A | 3/21 | 11.5 | 11.5 | 11.4 | ||||||||||||||
Oxbow Carbon LLC | Metals & Mining | First Lien Senior Debt(6) | 4.3 | % | N/A | 7/19 | 4.9 | 4.9 | 4.5 | ||||||||||||||
P2 Lower Acquisition, LLC | Health Care Providers & Services | First Lien Senior Debt(6) | 5.5 | % | N/A | 10/20 | 1.9 | 1.8 | 1.8 | ||||||||||||||
Party City Holdings Inc. | Specialty Retail | First Lien Senior Debt(6) | 4.0 | % | N/A | 7/19 | 11.6 | 11.5 | 11.4 | ||||||||||||||
Peabody Energy Corporation(7) | Metals & Mining | First Lien Senior Debt(6) | 4.3 | % | N/A | 9/20 | 7.5 | 7.5 | 6.8 | ||||||||||||||
Penn Engineering & Manufacturing Corp. | Building Products | First Lien Senior Debt(6) | 4.5 | % | N/A | 8/21 | 6.5 | 6.5 | 6.5 | ||||||||||||||
Performance Food Group, Inc. | Food & Staples Retailing | Second Lien Senior Debt(6) | 6.3 | % | N/A | 11/19 | 4.0 | 4.0 | 3.9 | ||||||||||||||
Petroleum GEO-Services ASA(7) | Energy Equipment & Services | First Lien Senior Debt(6) | 3.3 | % | N/A | 3/21 | 5.0 | 4.9 | 4.2 | ||||||||||||||
Pharmaceutical Product Development, Inc. | Life Sciences Tools & Services | First Lien Senior Debt(6) | 4.0 | % | N/A | 12/18 | 28.2 | 28.3 | 28.0 | ||||||||||||||
PharMEDium Healthcare Corporation | Pharmaceuticals | First Lien Senior Debt(6) | 4.3 | % | N/A | 1/21 | 4.7 | 4.8 | 4.6 | ||||||||||||||
Phillips-Medisize Corporation | Health Care Equipment & Supplies | First Lien Senior Debt(6) | 4.8 | % | N/A | 6/21 | 6.0 | 6.0 | 6.0 | ||||||||||||||
Pilot Travel Centers LLC | Specialty Retail | First Lien Senior Debt(6) | 4.3 | % | N/A | 10/21 | 10.0 | 9.9 | 10.0 | ||||||||||||||
Pinnacle Foods Finance LLC(7) | Food Products | First Lien Senior Debt(6) | 3.0 | % | N/A | 4/20 | 14.3 | 14.2 | 13.9 | ||||||||||||||
Planet Fitness Holdings, LLC | Hotels, Restaurants & Leisure | First Lien Senior Debt(6) | 4.8 | % | N/A | 3/21 | 5.3 | 5.4 | 5.3 | ||||||||||||||
Post Holdings Inc.(7) | Food Products | First Lien Senior Debt(6) | 3.8 | % | N/A | 6/21 | 8.0 | 8.0 | 7.9 | ||||||||||||||
PQ Corporation | Chemicals | First Lien Senior Debt(6) | 4.0 | % | N/A | 8/17 | 5.0 | 5.0 | 4.9 | ||||||||||||||
Presidio, Inc. | IT Services | First Lien Senior Debt(6) | 5.0 | % | N/A | 3/17 | 4.6 | 4.7 | 4.6 | ||||||||||||||
Quikrete Holdings, Inc. | Construction Materials | First Lien Senior Debt(6) | 4.0 | % | N/A | 9/20 | 12.5 | 12.4 | 12.3 | ||||||||||||||
Quintiles Transnational Corp.(7) | Life Sciences Tools & Services | First Lien Senior Debt(6) | 3.8 | % | N/A | 6/18 | 3.0 | 2.9 | 2.9 | ||||||||||||||
Renaissance Learning, Inc. | Software | First Lien Senior Debt(6) | 4.5 | % | N/A | 4/21 | 9.9 | 9.9 | 9.7 | ||||||||||||||
78
AMERICAN CAPITAL, LTD. CONSOLIDATED SCHEDULE OF INVESTMENTS—(Continued) December 31, 2014 (in millions, except share data) | |||||||||||||||||||||||
Company(1) | Industry | Investments | Cash Interest Rate(2) | PIK Interest Rate(2) | Maturity Date(2) | # of Shares/ Units Owned | Principal | Cost | Fair Value | ||||||||||||||
Road Infrastructure Investment, LLC | Chemicals | First Lien Senior Debt(6) | 4.3 | % | N/A | 3/21 | 12.4 | 12.4 | 11.9 | ||||||||||||||
RPI Finance Trust(7) | Pharmaceuticals | First Lien Senior Debt(6) | 3.5 | % | N/A | 11/20 | 4.0 | 4.0 | 4.0 | ||||||||||||||
Sabre GLBL Inc.(7) | Software | First Lien Senior Debt(6) | 4.5 | % | N/A | 2/19 | 7.4 | 7.5 | 7.3 | ||||||||||||||
Sage Products Holdings III, LLC | Health Care Equipment & Supplies | First Lien Senior Debt(6) | 5.0 | % | N/A | 12/19 | 2.0 | 2.0 | 2.0 | ||||||||||||||
Schaeffler AG(7) | Auto Components | First Lien Senior Debt(6) | 4.3 | % | N/A | 5/20 | 1.0 | 1.0 | 1.0 | ||||||||||||||
Scientific Games International Inc.(7) | Hotels, Restaurants & Leisure | First Lien Senior Debt(6) | 6.0 | % | N/A | 10/21 | 4.0 | 4.0 | 4.0 | ||||||||||||||
Sears Roebuck Acceptance Corp.(7) | Multiline Retail | First Lien Senior Debt(6) | 5.5 | % | N/A | 6/18 | 5.0 | 5.0 | 4.8 | ||||||||||||||
Securus Technologies Holdings, Inc. | Diversified Telecommunication Services | First Lien Senior Debt(6) | 4.8 | % | N/A | 4/20 | 4.9 | 5.0 | 4.9 | ||||||||||||||
Sedgwick Claims Management Services, Inc. | Insurance | First Lien Senior Debt(6) | 3.8 | % | N/A | 3/21 | 13.9 | 13.7 | 13.6 | ||||||||||||||
Second Lien Senior Debt(6) | 6.8 | % | N/A | 2/22 | 5.0 | 5.0 | 4.7 | ||||||||||||||||
18.7 | 18.3 | ||||||||||||||||||||||
Seminole Hard Rock Entertainment, Inc. | Hotels, Restaurants & Leisure | First Lien Senior Debt(6) | 3.5 | % | N/A | 5/20 | 5.9 | 5.9 | 5.7 | ||||||||||||||
Serta Simmons Holdings, LLC | Household Durables | First Lien Senior Debt(6) | 4.3 | % | N/A | 10/19 | 8.8 | 8.8 | 8.7 | ||||||||||||||
Ship Luxco 3 S.a.r.l(7) | IT Services | First Lien Senior Debt(6) | 4.8 | % | N/A | 11/19 | 5.0 | 5.0 | 5.0 | ||||||||||||||
Sinclair Television Group, Inc.(7) | Media | First Lien Senior Debt(6) | 3.5 | % | N/A | 7/21 | 4.0 | 4.0 | 4.0 | ||||||||||||||
Southcross Energy Partners, L.P.(7) | Oil, Gas & Consumable Fuels | First Lien Senior Debt(6) | 5.3 | % | N/A | 8/21 | 1.0 | 1.0 | 0.9 | ||||||||||||||
Southwire Company, LLC | Electrical Equipment | First Lien Senior Debt(6) | 3.3 | % | N/A | 2/21 | 20.3 | 20.2 | 19.6 | ||||||||||||||
Spectrum Brands, Inc(7) | Household Products | First Lien Senior Debt(6) | 3.5 | % | N/A | 9/19 | 1.2 | 1.2 | 1.2 | ||||||||||||||
Spin Holdco Inc. | Diversified Consumer Services | First Lien Senior Debt(6) | 4.3 | % | N/A | 11/19 | 7.4 | 7.5 | 7.3 | ||||||||||||||
Standard Aero Limited(7) | Aerospace & Defense | First Lien Senior Debt(6) | 5.0 | % | N/A | 11/18 | 1.4 | 1.4 | 1.4 | ||||||||||||||
Star West Generation LLC | Independent Power & Renewable Electricity Producers | First Lien Senior Debt(6) | 4.3 | % | N/A | 3/20 | 2.0 | 2.0 | 2.0 | ||||||||||||||
Station Casinos LLC | Hotels, Restaurants & Leisure | First Lien Senior Debt(6) | 4.3 | % | N/A | 3/20 | 12.0 | 11.9 | 11.7 | ||||||||||||||
Steinway Musical Instruments, Inc. | Leisure Products | First Lien Senior Debt(6) | 4.8 | % | N/A | 9/19 | 5.0 | 5.0 | 5.0 | ||||||||||||||
STHI Holding Corp. | Life Sciences Tools & Services | First Lien Senior Debt(6) | 4.5 | % | N/A | 8/21 | 7.0 | 7.0 | 6.9 | ||||||||||||||
STS Operating, Inc. | Trading Companies & Distributors | First Lien Senior Debt(6) | 4.8 | % | N/A | 2/21 | 2.0 | 2.0 | 2.0 | ||||||||||||||
Syniverse Holdings, Inc. | Wireless Telecommunication Services | First Lien Senior Debt(6) | 4.0 | % | N/A | 4/19 | 15.0 | 14.9 | 14.6 | ||||||||||||||
Tallgrass Operations, LLC | Oil, Gas & Consumable Fuels | First Lien Senior Debt(6) | 4.3 | % | N/A | 11/18 | 8.4 | 8.4 | 8.3 | ||||||||||||||
The Brickman Group Ltd. LLC | Commercial Services & Supplies | First Lien Senior Debt(6) | 4.0 | % | N/A | 12/20 | 5.0 | 5.0 | 4.8 | ||||||||||||||
The Goodyear Tire & Rubber Company(7) | Auto Components | Second Lien Senior Debt(6) | 4.8 | % | N/A | 4/19 | 7.5 | 7.5 | 7.5 | ||||||||||||||
The Hillman Group, Inc. | Machinery | First Lien Senior Debt(6) | 4.5 | % | N/A | 6/21 | 9.0 | 9.0 | 8.9 | ||||||||||||||
The Kenan Advantage Group, Inc. | Road & Rail | First Lien Senior Debt(6) | 3.8 | % | N/A | 6/16 | 4.9 | 5.0 | 4.9 | ||||||||||||||
The Men’s Wearhouse, Inc.(7) | Specialty Retail | First Lien Senior Debt(6) | 4.5 | % | N/A | 6/21 | 10.0 | 10.0 | 10.0 | ||||||||||||||
The Neiman Marcus Group Inc. | Multiline Retail | First Lien Senior Debt(6) | 4.3 | % | N/A | 10/20 | 10.5 | 10.4 | 10.2 | ||||||||||||||
The Servicemaster Company, LLC(7) | Diversified Consumer Services | First Lien Senior Debt(6) | 4.3 | % | N/A | 7/21 | 5.5 | 5.4 | 5.4 | ||||||||||||||
TI Group Automotive Systems, L.L.C.(7) | Auto Components | First Lien Senior Debt(6) | 4.3 | % | N/A | 7/21 | 7.5 | 7.4 | 7.4 | ||||||||||||||
TMS International Corp. | Metals & Mining | First Lien Senior Debt(6) | 4.5 | % | N/A | 10/20 | 12.8 | 12.9 | 12.8 | ||||||||||||||
TNS, Inc. | IT Services | First Lien Senior Debt(6) | 5.0 | % | N/A | 2/20 | 4.0 | 4.0 | 3.9 | ||||||||||||||
TPF II LC, LLC | Independent Power & Renewable Electricity Producers | First Lien Senior Debt(6) | 5.5 | % | N/A | 9/21 | 2.0 | 2.0 | 2.0 | ||||||||||||||
TransDigm Inc.(7) | Aerospace & Defense | First Lien Senior Debt(6) | 3.8 | % | N/A | 6/21 | 7.5 | 7.4 | 7.4 | ||||||||||||||
79
AMERICAN CAPITAL, LTD. CONSOLIDATED SCHEDULE OF INVESTMENTS—(Continued) December 31, 2014 (in millions, except share data) | |||||||||||||||||||||||
Company(1) | Industry | Investments | Cash Interest Rate(2) | PIK Interest Rate(2) | Maturity Date(2) | # of Shares/ Units Owned | Principal | Cost | Fair Value | ||||||||||||||
Trans Union LLC | Professional Services | First Lien Senior Debt(6) | 4.0 | % | N/A | 4/21 | 19.9 | 19.8 | 19.7 | ||||||||||||||
Travelport Finance (Luxembourg) S.à r.l.(7) | Internet Software & Services | First Lien Senior Debt(6) | 6.0 | % | N/A | 9/21 | 4.0 | 3.9 | 4.0 | ||||||||||||||
TWCC Holding Corp. | Media | First Lien Senior Debt(6) | 3.5 | % | N/A | 2/17 | 5.0 | 4.9 | 4.9 | ||||||||||||||
Second Lien Senior Debt(6) | 7.0 | % | N/A | 6/20 | 5.0 | 5.0 | 4.8 | ||||||||||||||||
9.9 | 9.7 | ||||||||||||||||||||||
Tyche Holdings, LLC | IT Services | First Lien Senior Debt(6) | 5.5 | % | N/A | 11/21 | 5.4 | 5.4 | 5.4 | ||||||||||||||
U.S. Renal Care, Inc. | Health Care Providers & Services | First Lien Senior Debt(6) | 4.3 | % | N/A | 7/19 | 13.3 | 13.4 | 13.2 | ||||||||||||||
United Air Lines, Inc.(7) | Airlines | First Lien Senior Debt(6) | 3.8 | % | N/A | 9/21 | 8.0 | 7.9 | 7.9 | ||||||||||||||
Univision Communications Inc. | Media | First Lien Senior Debt(6) | 4.0 | % | N/A | 2/20-3/20 | 12.5 | 12.4 | 12.2 | ||||||||||||||
USIC Holdings, Inc. | Construction & Engineering | First Lien Senior Debt(6) | 4.0 | % | N/A | 7/20 | 14.9 | 14.8 | 14.6 | ||||||||||||||
USI, Inc. | Insurance | First Lien Senior Debt(6) | 4.3 | % | N/A | 12/19 | 8.4 | 8.5 | 8.3 | ||||||||||||||
Valeant Pharmaceuticals International, Inc.(7) | Pharmaceuticals | First Lien Senior Debt(6) | 3.5 | % | N/A | 2/19 | 8.7 | 8.7 | 8.6 | ||||||||||||||
Vencore, Inc. | Aerospace & Defense | First Lien Senior Debt(6) | 5.8 | % | N/A | 11/19 | 4.2 | 4.2 | 4.2 | ||||||||||||||
Veyance Technologies, Inc. | Machinery | First Lien Senior Debt(6) | 5.3 | % | N/A | 9/17 | 1.9 | 1.9 | 1.9 | ||||||||||||||
VWR Funding, Inc.(7) | Distributors | First Lien Senior Debt(6) | 3.4 | % | N/A | 4/17 | 9.9 | 9.9 | 9.9 | ||||||||||||||
Wall Street Systems Delaware, Inc.(7) | Software | First Lien Senior Debt(6) | 4.5 | % | N/A | 4/21 | 4.9 | 4.8 | 4.9 | ||||||||||||||
Wastequip, LLC | Machinery | First Lien Senior Debt(6) | 5.5 | % | N/A | 8/19 | 5.0 | 5.0 | 4.9 | ||||||||||||||
WaveDivision Holdings, LLC | Media | First Lien Senior Debt(6) | 4.0 | % | N/A | 10/19 | 8.4 | 8.5 | 8.3 | ||||||||||||||
WideOpenWest Finance, LLC | Media | First Lien Senior Debt(6) | 4.8 | % | N/A | 4/19 | 5.0 | 5.0 | 4.9 | ||||||||||||||
Wilsonart LLC | Building Products | First Lien Senior Debt(6) | 4.0 | % | N/A | 10/19 | 8.4 | 8.4 | 8.2 | ||||||||||||||
WP CPP Holdings, LLC | Aerospace & Defense | First Lien Senior Debt(6) | 4.8 | % | N/A | 12/19 | 7.1 | 7.1 | 7.1 | ||||||||||||||
XO Communications, LLC | Diversified Telecommunication Services | First Lien Senior Debt(6) | 4.3 | % | N/A | 3/21 | 10.4 | 10.4 | 10.3 | ||||||||||||||
Yankee Cable Acquisition, LLC | Media | First Lien Senior Debt(6) | 4.5 | % | N/A | 2/20-3/20 | 13.3 | 13.3 | 13.3 | ||||||||||||||
Yonkers Racing Corporation | Hotels, Restaurants & Leisure | First Lien Senior Debt(6) | 4.3 | % | N/A | 8/19 | 4.8 | 4.8 | 4.3 | ||||||||||||||
York Risk Services Holding Corp.(7) | Insurance | First Lien Senior Debt(6) | 4.8 | % | N/A | 10/21 | 1.0 | 1.0 | 1.0 | ||||||||||||||
Zayo Group LLC | Diversified Telecommunication Services | First Lien Senior Debt(6) | 4.0 | % | N/A | 7/19 | 5.0 | 5.0 | 4.9 | ||||||||||||||
AMERICAN CAPITAL CMBS INVESTMENTS | |||||||||||||||||||||||
CD 2007-CD4 Commercial Mortgage Trust(7) | Real Estate | Commercial Mortgage Pass-Through Certificates(4)(6) | 5.7 | % | N/A | 12/49 | 16.0 | 1.1 | 2.5 | ||||||||||||||
CD 2007-CD5 Mortgage Trust(7) | Real Estate | Commercial Mortgage Pass-Through Certificates(4)(6) | 6.1 | % | N/A | 12/17 | 14.8 | 7.3 | 1.8 | ||||||||||||||
Citigroup Commercial Mortgage Securities Trust 2007-C6(7) | Real Estate | Commercial Mortgage Pass-Through Certificates(4)(6) | 5.7 | % | N/A | 7/17 | 30.9 | 17.5 | 7.4 | ||||||||||||||
Credit Suisse Commercial Mortgage Trust Series 2007-C4(7) | Real Estate | Commercial Mortgage Pass-Through Certificates(4)(6) | 5.9 | % | N/A | 8/17 | 20.8 | 7.8 | 1.4 | ||||||||||||||
J.P. Morgan Chase Commercial Mortgage Securities Trust 2007-LDP11(7) | Real Estate | Commercial Mortgage Pass-Through Certificates(4)(6) | 5.8 | % | N/A | 7/17 | 25.2 | — | 2.6 | ||||||||||||||
LB-UBS Commercial Mortgage Trust 2007-C6(7) | Real Estate | Commercial Mortgage Pass-Through Certificates(4)(6) | 6.2 | % | N/A | 8/17 | 12.0 | 3.0 | 1.4 | ||||||||||||||
Wachovia Bank Commercial Mortgage Trust 2005-C22(7) | Real Estate | Commercial Mortgage Pass-Through Certificates(4)(6) | 5.4 | % | N/A | 3/16 | 15.0 | 1.1 | 4.0 | ||||||||||||||
Wachovia Bank Commercial Mortgage Trust 2006-C24(7) | Real Estate | Commercial Mortgage Pass-Through Certificates(4)(6) | 5.7 | % | N/A | 3/16 | 15.0 | 1.0 | 2.1 | ||||||||||||||
Wachovia Bank Commercial Mortgage Trust 2007-C31(7) | Real Estate | Commercial Mortgage Pass-Through Certificates(4)(6) | 5.8 | % | N/A | 5/17 | 20.0 | 10.6 | 1.1 | ||||||||||||||
Wachovia Bank Commercial Mortgage Trust, Series 2007-C32(7) | Real Estate | Commercial Mortgage Pass-Through Certificates(4)(6) | 5.7 | % | N/A | 10/17 | 60.9 | 12.3 | 6.9 | ||||||||||||||
80
AMERICAN CAPITAL, LTD. CONSOLIDATED SCHEDULE OF INVESTMENTS—(Continued) December 31, 2014 (in millions, except share data) | |||||||||||||||||||||||
Company(1) | Industry | Investments | Cash Interest Rate(2) | PIK Interest Rate(2) | Maturity Date(2) | # of Shares/ Units Owned | Principal | Cost | Fair Value | ||||||||||||||
Wachovia Bank Commercial Mortgage Trust, Series 2007-C34(7) | Real Estate | Commercial Mortgage Pass-Through Certificates(4)(6) | 5.9 | % | N/A | 10/17-12/20 | 5.6 | 5.6 | 3.9 | ||||||||||||||
AMERICAN CAPITAL CLO INVESTMENTS | |||||||||||||||||||||||
ACAS CLO 2007-1, Ltd.(7) | Secured Notes(6) | 4/21 | 8.5 | 8.4 | 8.3 | ||||||||||||||||||
Subordinated Notes(6) | 4/21 | 25.9 | 9.8 | 14.4 | |||||||||||||||||||
18.2 | 22.7 | ||||||||||||||||||||||
ACAS CLO 2013-2, Ltd.(7) | Subordinated Notes(6) | 10/25 | 8.0 | 7.0 | 6.6 | ||||||||||||||||||
Apidos CLO XIV(7) | Income Notes(6) | 4/25 | 8.1 | 7.3 | 7.3 | ||||||||||||||||||
Apidos CLO XIX(7) | Subordinated Notes(6) | 10/26 | 10.5 | 9.4 | 9.4 | ||||||||||||||||||
Apidos CLO XVIII, Ltd.(7) | Subordinated Notes(6) | 7/26 | 34.0 | 33.9 | 32.2 | ||||||||||||||||||
Ares IIIR/IVR CLO Ltd.(7) | Subordinated Notes(6) | 4/21 | 20.0 | 10.8 | 7.8 | ||||||||||||||||||
Ares XXIX CLO Ltd.(7) | Subordinated Notes(6) | 4/26 | 7.3 | 6.6 | 6.6 | ||||||||||||||||||
Avery Point II CLO, Limited(7) | Subordinated Notes(6) | 7/25 | 2.6 | 2.2 | 2.2 | ||||||||||||||||||
Babson CLO Ltd. 2006-II(7) | Income Notes(6) | 10/20 | 15.0 | 7.9 | 9.5 | ||||||||||||||||||
Babson CLO Ltd. 2014-II(7) | Subordinated Notes(6) | 9/26 | 25.0 | 23.6 | 23.6 | ||||||||||||||||||
Babson CLO Ltd. 2014-III(7) | Subordinated Notes(6) | 1/26 | 3.8 | 3.4 | 3.4 | ||||||||||||||||||
Blue Hill CLO, Ltd.(7) | Subordinated Notes(6) | 1/26 | 10.7 | 9.2 | 9.1 | ||||||||||||||||||
Carlyle Global Market Strategies CLO 2013-3, Ltd.(7) | Subordinated Notes(6) | 7/25 | 2.3 | 1.8 | 1.8 | ||||||||||||||||||
Carlyle Global Market Strategies CLO 2014-4, Ltd.(7) | Subordinated Notes(6) | 10/26 | 14.6 | 13.4 | 12.9 | ||||||||||||||||||
Cent CDO 12 Limited(7) | Income Notes(6) | 11/20 | 26.4 | 9.3 | 28.0 | ||||||||||||||||||
Cent CLO 18 Limited(7) | Subordinated Notes(6) | 7/25 | 3.8 | 3.0 | 3.4 | ||||||||||||||||||
Cent CLO 19 Limited(7) | Subordinated Notes(6) | 10/25 | 5.3 | 4.6 | 4.6 | ||||||||||||||||||
Cent CLO 22 Limited(7) | Subordinated Notes(6) | 11/26 | 35.0 | 33.7 | 33.7 | ||||||||||||||||||
Centurion CDO 8 Limited(7) | Subordinated Notes(4)(6) | 3/17 | 5.0 | 0.2 | — | ||||||||||||||||||
CoLTs 2005-1 Ltd.(7) | Preference Shares(4)(6) | 3/15 | 360 | 1.9 | 0.3 | ||||||||||||||||||
CoLTs 2005-2 Ltd.(7) | Preference Shares(4)(6) | 12/18 | 34,170,000 | 12.5 | 1.8 | ||||||||||||||||||
CREST Exeter Street Solar 2004-1(7) | Preferred Securities(4)(6) | 6/39 | 3,500,000 | 3.2 | — | ||||||||||||||||||
Dryden 31 Senior Loan Fund(7) | Subordinated Notes(6) | 3/26 | 2.3 | 2.0 | 2.0 | ||||||||||||||||||
Eaton Vance CDO X plc(7) | Secured Subordinated Notes(6) | 2/27 | 15.0 | 11.4 | 9.1 | ||||||||||||||||||
Flagship CLO V(7) | Deferrable Notes(6) | 9/19 | 1.7 | 1.5 | 1.6 | ||||||||||||||||||
Subordinated Securities(6) | 9/19 | 15,000 | 7.0 | 2.3 | |||||||||||||||||||
8.5 | 3.9 | ||||||||||||||||||||||
Galaxy III CLO, Ltd(7) | Subordinated Notes(4) | 8/16 | 4.0 | 0.2 | — | ||||||||||||||||||
Galaxy XVI CLO, Ltd.(7) | Subordinated Notes(6) | 11/25 | 2.3 | 2.1 | 2.1 | ||||||||||||||||||
GoldenTree Loan Opportunities IX, Limited(7) | Subordinated Notes(6) | 10/26 | 40.8 | 37.7 | 37.7 | ||||||||||||||||||
Halcyon Loan Advisors Funding 2014-1 Ltd.(7) | Subordinated Notes(6) | 2/26 | 1.3 | 1.1 | 1.1 | ||||||||||||||||||
Halcyon Loan Advisors Funding 2015-2, Ltd.(7) | Subordinated Notes(4)(6) | 12/17 | 15.0 | 15.0 | 15.0 | ||||||||||||||||||
Herbert Park B.V.(7) | Subordinated Notes(6) | 10/26 | 26.7 | 27.7 | 22.4 | ||||||||||||||||||
Highbridge Loan Management 2013-2, Ltd.(7) | Subordinated Notes(6) | 10/24 | 27.0 | 22.9 | 22.9 | ||||||||||||||||||
LightPoint CLO IV, LTD(7) | Income Notes(6) | 4/18 | 6.7 | 9.1 | 5.5 | ||||||||||||||||||
LightPoint CLO VII, Ltd.(7) | Subordinated Notes(6) | 5/21 | 9.0 | 3.0 | 2.5 | ||||||||||||||||||
Limerock CLO III, Ltd.(7) | Subordinated Notes(6) | 10/26 | 12.5 | 11.4 | 11.4 | ||||||||||||||||||
Magnetite VIII, Limited(7) | Subordinated Notes(6) | 5/26 | 6.7 | 6.5 | 6.2 | ||||||||||||||||||
Magnetite XIV, Limited(7) | Subordinated Notes(4)(6) | 6/16 | 20.0 | 20.0 | 20.0 | ||||||||||||||||||
Mayport CLO Ltd.(7) | Income Notes | 2/20 | 14.0 | 8.6 | 3.2 | ||||||||||||||||||
Neuberger Berman CLO XV, Ltd.(7) | Subordinated Notes(6) | 10/25 | 2.8 | 2.3 | 2.3 | ||||||||||||||||||
81
AMERICAN CAPITAL, LTD. CONSOLIDATED SCHEDULE OF INVESTMENTS—(Continued) December 31, 2014 (in millions, except share data) | |||||||||||||||||||||||
Company(1) | Industry | Investments | Cash Interest Rate(2) | PIK Interest Rate(2) | Maturity Date(2) | # of Shares/ Units Owned | Principal | Cost | Fair Value | ||||||||||||||
NYLIM Flatiron CLO 2006-1 LTD.(7) | Subordinated Securities(6) | 8/20 | 10,000 | 3.5 | 4.3 | ||||||||||||||||||
Och-Ziff VIII, Ltd.(7) | Subordinated Notes(6) | 9/26 | 16.0 | 15.1 | 15.1 | ||||||||||||||||||
Octagon Investment Partners VII, Ltd.(7) | Preferred Securities(4)(6) | 12/16 | 5,000,000 | 1.1 | — | ||||||||||||||||||
Octagon Investment Partners XIV, Ltd.(7) | Subordinated Notes(6) | 1/24 | 4.5 | 3.3 | 3.4 | ||||||||||||||||||
Octagon Investment Partners XIX, Ltd.(7) | Subordinated Notes(6) | 4/26 | 25.0 | 21.5 | 22.8 | ||||||||||||||||||
Octagon Investment Partners XX, Ltd.(7) | Subordinated Notes(6) | 8/26 | 2.5 | 2.5 | 2.5 | ||||||||||||||||||
Octagon Investment Partners XXII, Ltd.(7) | Subordinated Notes(6) | 11/25 | 8.4 | 7.7 | 7.7 | ||||||||||||||||||
Octagon Loan Funding, Ltd.(7) | Subordinated Notes(6) | 9/26 | 4.0 | 3.6 | 3.6 | ||||||||||||||||||
OHA Credit Partners VIII, Ltd.(7) | Subordinated Notes(6) | 4/25 | 5.0 | 4.5 | 4.5 | ||||||||||||||||||
Sapphire Valley CDO I, Ltd.(7) | Subordinated Notes(6) | 12/22 | 14.0 | 14.5 | 11.1 | ||||||||||||||||||
THL Credit Wind River 2014-1 CLO Ltd.(7) | Subordinated Notes(6) | 4/26 | 16.0 | 14.4 | 13.9 | ||||||||||||||||||
Vitesse CLO, Ltd.(7) | Preferred Securities(6) | 8/20 | 20,000,000 | 12.9 | 7.2 | ||||||||||||||||||
Voya CLO 2014-2, Ltd.(7) | Subordinated Notes(6) | 7/26 | 10.0 | 10.0 | 9.1 | ||||||||||||||||||
Voya CLO 2014-4, Ltd.(7) | Subordinated Notes(6) | 10/26 | 26.7 | 25.0 | 25.0 | ||||||||||||||||||
EUROPEAN CAPITAL CLO INVESTMENTS | |||||||||||||||||||||||
Ares European III B.V.(7) | Diversified Financial Services | Subordinated Notes | 8/24 | 6.1 | 3.4 | 3.5 | |||||||||||||||||
Cordatus CLO II plc(7) | Diversified Financial Services | Subordinated Notes | 7/24 | 6.1 | 2.2 | 6.1 | |||||||||||||||||
Eaton Vance CDO X plc(7) | Diversified Financial Services | Secured Subordinated Notes | 2/27 | 8.5 | 1.4 | 5.2 | |||||||||||||||||
Euro-Galaxy II CLO B.V.(7) | Diversified Financial Services | Income Notes | 10/22 | 3.0 | 2.7 | 2.8 | |||||||||||||||||
Subordinated Notes | 10/22 | 6.7 | 3.3 | 5.0 | |||||||||||||||||||
6.0 | 7.8 | ||||||||||||||||||||||
Subtotal Non-Control / Non-Affiliate Investments (55% of total investments at fair value) | $ | 3,846.1 | $ | 3,472.1 | |||||||||||||||||||
AMERICAN CAPITAL AFFILIATE INVESTMENTS | |||||||||||||||||||||||
IS Holdings I, Inc. | Software | Common Stock(4)(6) | 1,165,930 | $ | — | $ | 7.9 | ||||||||||||||||
Primrose Holding Corporation | Diversified Consumer Services | Common Stock(4)(6) | 4,213 | — | 4.6 | ||||||||||||||||||
EUROPEAN CAPITAL AFFILIATE INVESTMENTS | |||||||||||||||||||||||
Blue Topco GmbH(7) | Commercial Services & Supplies | First Lien Senior Debt | 2.3 | % | N/A | 6/16-6/18 | $ | 2.7 | 2.1 | 2.1 | |||||||||||||
Mezzanine Debt(5) | N/A | 3.1% | 12/18 | 8.6 | 7.6 | 2.6 | |||||||||||||||||
9.7 | 4.7 | ||||||||||||||||||||||
Mobipark S.A.S.(7) | Machinery | First Lien Senior Debt | 1.3 | % | N/A | 10/17-12/17 | 1.7 | 1.7 | 1.6 | ||||||||||||||
Second Lien Senior Debt | — | % | N/A | 11/17 | 0.7 | 0.7 | 0.6 | ||||||||||||||||
Convertible Preferred Stock(4) | 23,082,525 | 9.3 | 1.7 | ||||||||||||||||||||
Redeemable Preferred Stock(4) | 25,751,312 | 7.9 | 4.4 | ||||||||||||||||||||
19.6 | 8.3 | ||||||||||||||||||||||
Subtotal Affiliate Investments (1% of total investments at fair value) | $ | 29.3 | $ | 25.5 | |||||||||||||||||||
AMERICAN CAPITAL CONTROL INVESTMENTS | |||||||||||||||||||||||
ACAS Real Estate Holdings Corporation | Real Estate | Mezzanine Debt(5)(6) | N/A | 15.0 | % | 5/16 | $ | 8.7 | $ | 4.7 | $ | 5.0 | |||||||||||
Common Stock(6) | 100 | % | 13.8 | 25.7 | |||||||||||||||||||
18.5 | 30.7 | ||||||||||||||||||||||
American Capital Asset Management, LLC | Capital Markets | Mezzanine Debt(6) | 5.0 | % | N/A | 9/16 | 33.0 | 33.0 | 33.0 | ||||||||||||||
Common Membership Interest(6) | 100 | % | 395.5 | 1,131.4 | |||||||||||||||||||
428.5 | 1,164.4 | ||||||||||||||||||||||
American Driveline Systems, Inc. | Diversified Consumer Services | Redeemable Preferred Stock(4)(6) | 6,818,008 | 81.9 | 20.6 | ||||||||||||||||||
Common Stock(4)(6) | 197,161 | 18.2 | — | ||||||||||||||||||||
Common Stock Warrants(4)(6) | 136,183 | 9.9 | — | ||||||||||||||||||||
110.0 | 20.6 | ||||||||||||||||||||||
ASAP Industries Holdings, LLC | Energy Equipment & Services | Mezzanine Debt(6) | 12.0 | % | 2.0 | % | 12/18 | 20.5 | 20.3 | 20.5 | |||||||||||||
Membership Units(4)(6) | 106,911 | 30.3 | 15.0 | ||||||||||||||||||||
50.6 | 35.5 | ||||||||||||||||||||||
82
AMERICAN CAPITAL, LTD. CONSOLIDATED SCHEDULE OF INVESTMENTS—(Continued) December 31, 2014 (in millions, except share data) | |||||||||||||||||||||||
Company(1) | Industry | Investments | Cash Interest Rate(2) | PIK Interest Rate(2) | Maturity Date(2) | # of Shares/ Units Owned | Principal | Cost | Fair Value | ||||||||||||||
BMR Energy LLC | Independent Power & Renewable Electricity Producers | Preferred Units(6) | 11,620 | 11.9 | 11.9 | ||||||||||||||||||
Capital.com, Inc. | Diversified Financial Services | Common Stock(4)(6) | 8,500,100 | 0.9 | — | ||||||||||||||||||
CML Pharmaceuticals, Inc. | Life Sciences Tools & Services | First Lien Senior Debt(6) | 8.0 | % | N/A | 12/15-10/20 | 315.7 | 313.1 | 289.8 | ||||||||||||||
Convertible Preferred Stock(4)(6) | 243,642 | 144.6 | — | ||||||||||||||||||||
457.7 | 289.8 | ||||||||||||||||||||||
Contour Semiconductor, Inc. | Semiconductors & Semiconductor Equipment | First Lien Senior Debt(6) | N/A | 8.0 | % | 3/15-4/15 | 9.3 | 9.3 | 9.3 | ||||||||||||||
Convertible Preferred Stock(4)(6) | 143,896,948 | 13.5 | — | ||||||||||||||||||||
22.8 | 9.3 | ||||||||||||||||||||||
Core Financial Holdings, LLC(7) | Diversified Financial Services | Common Units(4)(6) | 57,940,360 | 43.8 | 0.2 | ||||||||||||||||||
Dyno Holding Corp. | Auto Components | First Lien Senior Debt(6) | 8.9 | % | 2.2 | % | 11/15 | 35.2 | 35.1 | 35.2 | |||||||||||||
Mezzanine Debt(5)(6) | N/A | 4.3 | % | 11/16 | 34.7 | 28.1 | 16.7 | ||||||||||||||||
Convertible Preferred Stock(4)(6) | 389,759 | 40.5 | — | ||||||||||||||||||||
Common Stock(4)(6) | 97,440 | 10.1 | — | ||||||||||||||||||||
113.8 | 51.9 | ||||||||||||||||||||||
ECA Medical Instruments | Health Care Equipment & Supplies | First Lien Senior Debt(6) | 10.0 | % | N/A | 3/16 | 6.8 | 6.8 | 6.8 | ||||||||||||||
Mezzanine Debt(6) | 13.0 | % | 3.5 | % | 7/16 | 18.1 | 18.1 | 18.1 | |||||||||||||||
Common Stock(4)(6) | 583 | 13.4 | 4.7 | ||||||||||||||||||||
38.3 | 29.6 | ||||||||||||||||||||||
eLynx Holdings, Inc. | IT Services | Convertible Preferred Stock(4)(6) | 11,728 | 20.6 | 16.0 | ||||||||||||||||||
Redeemable Preferred Stock(4)(6) | 21,113 | 9.0 | — | ||||||||||||||||||||
Common Stock(4)(6) | 11,261 | 1.1 | — | ||||||||||||||||||||
Common Stock Warrants(4)(6) | 1,002,678 | 5.5 | — | ||||||||||||||||||||
36.2 | 16.0 | ||||||||||||||||||||||
EXPL Pipeline Holdings LLC(7) | Oil, Gas & Consumable Fuels | First Lien Senior Debt(6) | 8.1 | % | N/A | 1/17 | 46.0 | 45.7 | 46.8 | ||||||||||||||
Common Membership Units(4)(6) | 58,297 | 44.5 | 20.1 | ||||||||||||||||||||
90.2 | 66.9 | ||||||||||||||||||||||
FAMS Acquisition, Inc. | Diversified Financial Services | Mezzanine Debt(6) | 12.3 | % | 2.6 | % | 1/16 | 42.8 | 42.8 | 40.7 | |||||||||||||
Fosbel Holding, Inc. | Commercial Services & Supplies | Mezzanine Debt(6) | N/A | 17.0 | % | 10/18 | 9.8 | 9.8 | 9.8 | ||||||||||||||
Mezzanine Debt(5)(6) | N/A | 17.0 | % | 10/18 | 45.6 | 19.1 | 3.7 | ||||||||||||||||
28.9 | 13.5 | ||||||||||||||||||||||
FPI Holding Corporation | Food Products | First Lien Senior Debt(5)(6) | N/A | 5.2 | % | 1/19 | 32.6 | 11.6 | 11.6 | ||||||||||||||
Group Montana, Inc. | Textiles, Apparel & Luxury Goods | First Lien Senior Debt(6) | 6.3 | % | N/A | 1/17 | 6.4 | 6.4 | 6.4 | ||||||||||||||
Convertible Preferred Stock(6) | 4,000 | 4.7 | 6.7 | ||||||||||||||||||||
Common Stock(4)(6) | 100 | % | 12.5 | 1.6 | |||||||||||||||||||
23.6 | 14.7 | ||||||||||||||||||||||
Halex Holdings, Inc. | Construction Materials | Second Lien Senior Debt(5)(6) | — | % | 12.0 | % | 3/15 | 18.3 | 18.3 | 18.8 | |||||||||||||
Redeemable Preferred Stock(4)(6) | 6,482,972 | 6.6 | — | ||||||||||||||||||||
24.9 | 18.8 | ||||||||||||||||||||||
HALT Medical, Inc. | Health Care Equipment & Supplies | First Lien Senior Debt(5)(6) | N/A | 22.0 | % | 3/15 | 45.2 | 36.5 | 35.6 | ||||||||||||||
Convertible Preferred Stock(4)(6) | 12,811,818 | 2.6 | — | ||||||||||||||||||||
Common Stock(4)(6) | 22,416,432 | 6.4 | — | ||||||||||||||||||||
45.5 | 35.6 | ||||||||||||||||||||||
Hard 8 Games, LLC | Hotels, Restaurants & Leisure | First Lien Convertible Senior Debt(6) | N/A | 6.0 | % | 2/15 | 8.2 | 8.2 | 8.2 | ||||||||||||||
Membership Unit(4)(6) | 1 | 19.0 | 28.8 | ||||||||||||||||||||
27.2 | 37.0 | ||||||||||||||||||||||
Hollyhock Limited(7) | Independent Power & Renewable Electricity Producers | Common Stock(4)(6) | 22,000,000 | 22.0 | 21.2 | ||||||||||||||||||
LLSC Holdings Corporation | Personal Products | Convertible Preferred Stock(4)(6) | 7,496 | 8.1 | 13.8 | ||||||||||||||||||
Montgomery Lane, LLC(7) | Diversified Financial Services | Common Membership Units(4)(6) | 100 | — | 6.9 | ||||||||||||||||||
MW Acquisition Corporation | Health Care Providers & Services | Mezzanine Debt(6) | 14.4 | % | 1.0 | % | 2/19 | 24.0 | 23.9 | 24.0 | |||||||||||||
Redeemable Preferred Stock(6) | 2,485 | 2.3 | 2.3 | ||||||||||||||||||||
Convertible Preferred Stock(4)(6) | 51,351 | 23.0 | 17.9 | ||||||||||||||||||||
49.2 | 44.2 | ||||||||||||||||||||||
NECCO Holdings, Inc. | Food Products | First Lien Senior Debt(5)(6) | 6.5 | % | N/A | 12/15 | 13.9 | 11.8 | 8.9 | ||||||||||||||
Second Lien Senior Debt(5)(6) | N/A | 18.0 | % | 11/15 | 6.4 | 3.2 | — | ||||||||||||||||
Common Stock(4)(6) | 860,189 | 0.1 | — | ||||||||||||||||||||
15.1 | 8.9 | ||||||||||||||||||||||
NECCO Realty Investments, LLC | Real Estate | First Lien Senior Debt(5)(6) | 2.9 | % | 11.1 | % | 12/17 | 67.0 | 32.8 | 19.9 | |||||||||||||
Common Membership Units(4)(6) | 7,450 | 4.9 | — | ||||||||||||||||||||
37.7 | 19.9 | ||||||||||||||||||||||
83
AMERICAN CAPITAL, LTD. CONSOLIDATED SCHEDULE OF INVESTMENTS—(Continued) December 31, 2014 (in millions, except share data) | |||||||||||||||||||||||
Company(1) | Industry | Investments | Cash Interest Rate(2) | PIK Interest Rate(2) | Maturity Date(2) | # of Shares/ Units Owned | Principal | Cost | Fair Value | ||||||||||||||
Orchard Brands Corporation | Internet & Catalog Retail | Common Stock(4)(6) | 87,838 | 55.1 | 87.9 | ||||||||||||||||||
PHC Sharp Holdings, Inc. | Commercial Services & Supplies | First Lien Senior Debt(6) | 12.5 | % | N/A | 12/15 | 1.4 | 1.4 | 1.4 | ||||||||||||||
Mezzanine Debt(6) | N/A | 17.0 | % | 12/16 | 13.6 | 13.6 | 13.6 | ||||||||||||||||
Mezzanine Debt(5)(6) | N/A | 19.0 | % | 12/16 | 25.0 | 11.0 | 12.0 | ||||||||||||||||
Common Stock(4)(6) | 367,881 | 4.2 | — | ||||||||||||||||||||
30.2 | 27.0 | ||||||||||||||||||||||
RD Holdco Inc. | Household Durables | Second Lien Senior Debt(6) | 11.3 | % | N/A | 6/17 | 16.9 | 14.6 | 17.1 | ||||||||||||||
Common Stock(4)(6) | 458,596 | 23.6 | 18.6 | ||||||||||||||||||||
Common Stock Warrants(4)(6) | 56,372 | 2.9 | 2.3 | ||||||||||||||||||||
41.1 | 38.0 | ||||||||||||||||||||||
Rebellion Media Group Corp.(7) | Internet Software & Services | First Lien Senior Debt(6) | N/A | 12.0 | % | 3/15 | 4.3 | 4.3 | 3.5 | ||||||||||||||
First Lien Senior Debt(5)(6) | N/A | 12.0 | % | 12/15 | 10.8 | 8.1 | — | ||||||||||||||||
12.4 | 3.5 | ||||||||||||||||||||||
Scanner Holdings Corporation | Technology Hardware, Storage & Peripherals | Mezzanine Debt(6) | 14.8 | % | N/A | 10/16-7/17 | 20.5 | 20.5 | 20.5 | ||||||||||||||
Convertible Preferred Stock(6) | 38,723,509 | 5.4 | 5.4 | ||||||||||||||||||||
Common Stock(4)(6) | 97,540 | 0.1 | — | ||||||||||||||||||||
26.0 | 25.9 | ||||||||||||||||||||||
SEHAC Holding Corporation | Diversified Consumer Services | Convertible Preferred Stock(6) | 14,850 | 14.8 | 103.6 | ||||||||||||||||||
Common Stock(6) | 150 | 0.2 | 1.0 | ||||||||||||||||||||
15.0 | 104.6 | ||||||||||||||||||||||
Soil Safe Acquisition Corp. | Professional Services | First Lien Senior Debt(6) | 8.0 | % | N/A | 1/18-12/18 | 23.5 | 23.4 | 23.5 | ||||||||||||||
Second Lien Senior Debt(6) | 10.8 | % | N/A | 7/19 | 12.7 | 12.7 | 12.7 | ||||||||||||||||
Mezzanine Debt(6) | 8.9 | % | 7.2 | % | 12/19 | 67.1 | 66.3 | 67.1 | |||||||||||||||
Common Stock | 810 | 9.5 | 9.2 | ||||||||||||||||||||
111.9 | 112.5 | ||||||||||||||||||||||
TestAmerica Environmental Services, LLC | Commercial Services & Supplies | Mezzanine Debt(5)(6) | 10.0 | % | 2.5 | % | 6/18 | 35.2 | 26.5 | — | |||||||||||||
Common Units(4)(6) | 490,000 | 2.0 | — | ||||||||||||||||||||
28.5 | — | ||||||||||||||||||||||
Warner Power, LLC | Electrical Equipment | Mezzanine Debt(5)(6) | N/A | 14.6 | % | 3/15 | 9.7 | 5.7 | 2.6 | ||||||||||||||
Redeemable Preferred Membership Units(4)(6) | 3,796,269 | 3.0 | — | ||||||||||||||||||||
Common Membership Units(4)(6) | 27,400 | 1.9 | — | ||||||||||||||||||||
10.6 | 2.6 | ||||||||||||||||||||||
WIS Holding Company, Inc. | Commercial Services & Supplies | Convertible Preferred Stock(6) | 703,406 | 57.9 | 82.9 | ||||||||||||||||||
Common Stock(4)(6) | 175,853 | 11.4 | 16.9 | ||||||||||||||||||||
69.3 | 99.8 | ||||||||||||||||||||||
EUROPEAN CAPITAL CONTROL INVESTMENTS | |||||||||||||||||||||||
Bellotto Holdings Limited(7) | Household Durables | Redeemable Preferred Stock | 7,300,610 | 2.0 | 34.6 | 36.5 | |||||||||||||||||
Common Stock(4) | 2,697,010 | 100.0 | 103.6 | ||||||||||||||||||||
134.6 | 140.1 | ||||||||||||||||||||||
European Capital UK SME Debt LP(7) | Partnership Interest | 500 | 0.6 | 0.6 | |||||||||||||||||||
Financière H S.A.S.(7) | Health Care Equipment & Supplies | Mezzanine Debt(5) | 3.0% | 5.8 | % | 10/15 | 15.0 | 9.7 | 9.5 | ||||||||||||||
Convertible Preferred Stock(4) | 930,558 | 58.1 | — | ||||||||||||||||||||
67.8 | 9.5 | ||||||||||||||||||||||
Financière Newglass S.A.S.(7) | Building Products | Convertible Preferred Stock(4) | 1 | 26.1 | 26.1 | ||||||||||||||||||
Common Stock(4) | 8,000,000 | 9.7 | 6.2 | ||||||||||||||||||||
35.8 | 32.3 | ||||||||||||||||||||||
Financière Tarmac S.A.S.(7) | Commercial Services & Supplies | First Lien Senior Debt | 4.0% | N/A | 12/20 | 5.0 | 4.1 | 5.1 | |||||||||||||||
Mezzanine Debt | N/A | 4.0 | % | 12/21 | 22.1 | 22.1 | 22.1 | ||||||||||||||||
Mezzanine Debt(5) | N/A | 4.0 | % | 12/21 | 28.8 | 17.2 | 17.2 | ||||||||||||||||
Convertible Preferred Stock(4) | 8,665,001 | 10.5 | — | ||||||||||||||||||||
Redeemable Preferred Stock(4) | 3.7 | 8.1 | — | ||||||||||||||||||||
62.0 | 44.4 | ||||||||||||||||||||||
Holding Saint Augustine S.A.S.(7) | Air Freight & Logistics | First Lien Senior Debt | N/A | N/A | 9/19 | 4.9 | 4.9 | 4.9 | |||||||||||||||
Convertible Preferred Stock(4) | 1,982,668 | 15.0 | — | ||||||||||||||||||||
Redeemable Preferred Stock(4) | 1 | — | 1.0 | ||||||||||||||||||||
19.9 | 5.9 | ||||||||||||||||||||||
Miles 33 Limited(7) | Media | First Lien Senior Debt | 3.5% | N/A | 9/17 | 8.3 | 8.3 | 8.3 | |||||||||||||||
Mezzanine Debt | 4.5% | 5.0 | % | 9/17 | 16.7 | 16.7 | 16.7 | ||||||||||||||||
Redeemable Preferred Stock(4) | 71.9 | 30.3 | 8.6 | ||||||||||||||||||||
Common Stock(4) | 600,000 | 0.9 | — | ||||||||||||||||||||
56.2 | 33.6 | ||||||||||||||||||||||
MP Equity S.A.S.(7) | Food Products | Redeemable Preferred Stock(4) | 2.7 | 2.5 | — | ||||||||||||||||||
84
AMERICAN CAPITAL, LTD. CONSOLIDATED SCHEDULE OF INVESTMENTS—(Continued) December 31, 2014 (in millions, except share data) | |||||||||||||||||||||||
Company(1) | Industry | Investments | Cash Interest Rate(2) | PIK Interest Rate(2) | Maturity Date(2) | # of Shares/ Units Owned | Principal | Cost | Fair Value | ||||||||||||||
AMERICAN CAPITAL CONTROL CLO INVESTMENT | |||||||||||||||||||||||
ACAS Wachovia Investments, L.P.(7) | Diversified Financial Services | Partnership Interest(4) | 90 | % | 2.2 | 0.6 | |||||||||||||||||
Subtotal Control Investments (44% of total investments at fair value) | $ | 2,541.5 | $ | 2,782.4 | |||||||||||||||||||
Total Investment Assets | $ | 6,416.9 | $ | 6,280.0 | |||||||||||||||||||
Counterparty | Instrument | Interest Rate(2) | Expiration Date(2) | # of Contracts | Notional | Cost | Fair Value | ||||||||||||||
DERIVATIVE AGREEMENTS | |||||||||||||||||||||
Citibank, N.A. | Interest Rate Swap - Pay Fixed/ Receive Floating(6) | 5.6%/LIBOR | 5/16-7/17 | 2 | $ | 27.5 | $ | — | $ | (3.4 | ) | ||||||||||
BNP Paribas | Interest Rate Swap - Pay Fixed/ Receive Floating(6) | 5.7%/LIBOR | 7/17 | 1 | 22.3 | — | (3.1 | ) | |||||||||||||
Wells Fargo Bank, N.A | Interest Rate Swap - Pay Fixed/ Receive Floating(6) | 5.6%/LIBOR | 8/16 | 1 | 11.9 | — | (1.0 | ) | |||||||||||||
Citibank, N.A. | Total Return Swaps | 12/14 | 2 | 27.1 | — | (3.0 | ) | ||||||||||||||
American Capital Equity III, LP(8) | WRH, Inc. Equity Option | 4/15 | 1 | — | (73.6 | ) | |||||||||||||||
Total Derivative Agreements | $ | — | $ | (84.1 | ) | ||||||||||||||||
Funds | Cost | Fair Value | ||||||
MONEY MARKET FUNDS(3) | ||||||||
Deutsche Global Liquidity Managed Sterling Fund | $ | 264.9 | $ | 264.9 | ||||
Wells Fargo Advantage Heritage Money Market Fund(6) | 10.0 | 10.0 | ||||||
Fidelity Institutional Money Market Fund(6) | 10.0 | 10.0 | ||||||
BofA Funds Series Trust - BofA Money Market Reserves(6) | 10.0 | 10.0 | ||||||
Dreyfus Institutional Cash Advantage-I Fund(6) | 10.0 | 10.0 | ||||||
STIT - Liquid Assets Portfolio(6) | 5.0 | 5.0 | ||||||
JPMorgan Prime Money Market Fund(6) | 5.0 | 5.0 | ||||||
Fidelity Institutional Money Market Funds - Prime Money Market Portfolio(6) | 5.0 | 5.0 | ||||||
Total Money Market Funds | $ | 319.9 | $ | 319.9 | ||||
(1) | Certain of the securities are issued by affiliate(s) of the listed portfolio company. |
(2) | Interest rates represent the weighted average annual stated interest rate on loans and debt securities in effect on the date presented, which are presented by the nature of indebtedness by a single issuer. Some loans and debt securities bear interest at variable rates, primarily one-month LIBOR, with interest rate floors. Payment-in-kind interest (“PIK”) represents contractually deferred interest that is typically compounded into the principal balance of the loan or debt security, if not paid on a current basis. PIK interest may be prepaid by the portfolio company’s election, but generally is paid upon a change of control transaction or maturity. The maturity date represents the latest date in which the loan or debt security is scheduled to terminate. |
(3) | Included in cash and cash equivalents on our consolidated balance sheets. |
(4) | Some or all of the securities are non-income producing. |
(5) | Loan is on non-accrual status and therefore considered non-income producing. |
(6) | All or a portion of the investments or instruments are pledged as collateral under various secured financing arrangements. |
(7) | Investments that are not “qualifying assets” under Section 55(a) of the 1940 Act. Under the 1940 Act, we may not acquire any non-qualifying asset unless, at the time such acquisition is made, qualifying assets represent at least 70% of our total assets. |
(8) | For further discussion on the WRH, Inc. Equity Option, see Note 14 to our audited consolidated financial statements included in this Annual Report on Form 10-K. |
85
AMERICAN CAPITAL, LTD. CONSOLIDATED SCHEDULE OF INVESTMENTS December 31, 2013 (in millions, except share data) | ||||||||||||||||||||||||
Company(1) | Industry | Investments | Cash Interest Rate(2) | PIK Interest Rate(2) | Maturity Date(2) | # of Shares/ Units Owned | Principal | Cost | Fair Value | |||||||||||||||
NON-CONTROL / NON-AFFILIATE INVESTMENTS | ||||||||||||||||||||||||
Aderant North America, Inc. | Software | Second Lien Senior Debt(6) | 10.0 | % | N/A | 6/19 | $ | 16.0 | $ | 15.8 | $ | 16.2 | ||||||||||||
Air Distribution Technologies Inc. | Commercial Services & Supplies | Second Lien Senior Debt(6) | 9.3 | % | N/A | 5/20 | 7.0 | 6.9 | 7.2 | |||||||||||||||
American Acquisition, LLC(7) | Capital Markets | First Lien Senior Debt(6) | 3.3 | % | 16.1% | 6/14 | 5.4 | 5.4 | 5.3 | |||||||||||||||
Blue Wolf Capital Fund II, L.P.(7) | Capital Markets | Limited Partnership Interest(4) | 8.2 | 8.4 | ||||||||||||||||||||
CAMP International Holding Co. | Transportation Infrastructure | Second Lien Senior Debt(6) | 8.3 | % | N/A | 12/19 | 15.0 | 15.0 | 15.0 | |||||||||||||||
CGSC of Delaware Holdings Corporation(7) | Insurance | Second Lien Senior Debt(6) | 8.3 | % | N/A | 10/20 | 2.0 | 2.0 | 2.0 | |||||||||||||||
CIBT Investment Holdings, LLC | Commercial Services & Supplies | Common Stock(4)(6) | 13,381 | 8.9 | 18.3 | |||||||||||||||||||
Datapipe, Inc. | IT Services | Second Lien Senior Debt(6) | 9.3 | % | N/A | 9/19 | 12.5 | 12.3 | 12.7 | |||||||||||||||
Delsey Holding S.A.S.(7) | Textiles, Apparel & Luxury Goods | First Lien Senior Debt(6) | 6.7 | % | 3.3% | 12/16 | 15.0 | 15.0 | 15.7 | |||||||||||||||
Mezzanine Debt(6) | N/A | 11.0% | 12/22 | 1.9 | 1.9 | 1.5 | ||||||||||||||||||
16.9 | 17.2 | |||||||||||||||||||||||
Digital Insight Corporation | Internet Software & Services | Second Lien Senior Debt(6) | 8.8 | % | N/A | 10/20 | 5.0 | 5.0 | 5.0 | |||||||||||||||
Easton Bell Sports, LLC | Leisure Products | Redeemable Preferred Stock | 1,171 | 2.4 | 2.1 | |||||||||||||||||||
Common Units(4) | 3,830,068 | 0.7 | — | |||||||||||||||||||||
3.1 | 2.1 | |||||||||||||||||||||||
FAMS Acquisition, Inc. | Diversified Financial Services | Mezzanine Debt(6) | 12.3 | % | 2.5% | 11/14 | 46.6 | 46.6 | 46.6 | |||||||||||||||
Redeemable Preferred Stock(6) | 919 | 2.0 | 2.0 | |||||||||||||||||||||
Convertible Preferred Stock(4)(6) | 861,364 | 21.0 | 15.2 | |||||||||||||||||||||
69.6 | 63.8 | |||||||||||||||||||||||
Foamex Innovations, Inc. | Household Durables | Common Stock(4) | 2,708 | — | 0.1 | |||||||||||||||||||
Iotum Global Holdings, Inc.(7) | Diversified Telecommunication Services | First Lien Senior Debt(6) | N/A | 10.0% | 5/17 | 3.5 | 3.5 | 3.5 | ||||||||||||||||
Mitchell International, Inc. | IT Services | Second Lien Senior Debt(6) | 8.5 | % | N/A | 10/21 | 7.0 | 6.9 | 6.9 | |||||||||||||||
Net1 Las Colinas Manager, LLC | Real Estate | Second Lien Senior Debt(5)(6) | 7.7 | % | N/A | 10/15 | 1.7 | 1.6 | 0.7 | |||||||||||||||
Parts Holding Coörperatief U.A(7) | Distributors | Membership Entitlements(4) | 173,060 | 6.4 | 1.2 | |||||||||||||||||||
Qualium I(7) | Capital Markets | Common Stock(4) | 247,939 | 5.3 | 5.3 | |||||||||||||||||||
Renaissance Learning, Inc. | Software | Second Lien Senior Debt(6) | 8.8 | % | N/A | 5/21 | 15.0 | 14.8 | 14.8 | |||||||||||||||
Roark - Money Mailer, LLC | Media | Common Membership Units(4) | 3.5 | % | — | 0.5 | ||||||||||||||||||
Soil Safe Holdings, LLC | Professional Services | First Lien Senior Debt(6) | 8.0 | % | N/A | 1/16 | 25.7 | 25.6 | 25.7 | |||||||||||||||
Second Lien Senior Debt(6) | 10.8 | % | N/A | 6/16 | 12.7 | 12.7 | 13.0 | |||||||||||||||||
Mezzanine Debt(6) | 12.3 | % | 3.3% | 7/16-11/16 | 44.5 | 44.3 | 44.4 | |||||||||||||||||
Mezzanine Debt(5)(6) | N/A | 17.5% | 8/17 | 48.1 | 45.3 | 41.7 | ||||||||||||||||||
127.9 | 124.8 | |||||||||||||||||||||||
SPL Acquisition Corp. | Pharmaceuticals | Second Lien Senior Debt(6) | 11.0 | % | N/A | 3/15 | 45.5 | 45.4 | 45.5 | |||||||||||||||
Mezzanine Debt(6) | 12.0 | % | 3.3 | % | 6/15-6/16 | 59.0 | 58.8 | 59.0 | ||||||||||||||||
Convertible Preferred Stock(6) | 84,043 | 71.3 | 71.3 | |||||||||||||||||||||
Common Stock(4)(6) | 84,043 | — | 47.5 | |||||||||||||||||||||
175.5 | 223.3 | |||||||||||||||||||||||
Survey Sampling International, LLC | Media | Second Lien Senior Debt(6) | 9.5 | % | N/A | 6/20 | 51.3 | 50.3 | 50.3 | |||||||||||||||
Systems Maintenance Services Holding, Inc. | IT Services | Second Lien Senior Debt(6) | 9.3 | % | N/A | 10/20 | 28.0 | 27.7 | 27.7 | |||||||||||||||
Tyden Cayman Holdings Corp.(7) | Electronic Equipment, Instruments & Components | Convertible Preferred Stock(4)(6) | 26,977 | 0.1 | 0.1 | |||||||||||||||||||
Common Stock(4)(6) | 3,218,667 | 3.8 | 2.9 | |||||||||||||||||||||
3.9 | 3.0 | |||||||||||||||||||||||
W3 CO. | Health Care Equipment & Supplies | Second Lien Senior Debt(6) | 9.3 | % | N/A | 9/20 | 17.0 | 16.8 | 17.3 | |||||||||||||||
WP CPP Holdings, LLC | Aerospace & Defense | Second Lien Senior Debt(6) | 8.8 | % | N/A | 4/21 | 40.0 | 39.8 | 39.8 | |||||||||||||||
WRH, Inc. | Life Sciences Tools & Services | Mezzanine Debt(6) | 9.6 | % | 5.6% | 8/18 | 90.6 | 90.3 | 90.3 | |||||||||||||||
Convertible Preferred Stock(4)(6) | 2,008,575 | 200.9 | 27.2 | |||||||||||||||||||||
Common Stock(4)(6) | 502,144 | 49.9 | — | |||||||||||||||||||||
341.1 | 117.5 | |||||||||||||||||||||||
CMBS INVESTMENTS | ||||||||||||||||||||||||
CD 2007-CD5 Mortgage Trust(7) | Real Estate | Commercial Mortgage Pass-Through Certificates(4)(6) | 6.1 | % | N/A | 12/17 | 14.8 | 7.7 | 1.7 | |||||||||||||||
86
AMERICAN CAPITAL, LTD. CONSOLIDATED SCHEDULE OF INVESTMENTS—(Continued) December 31, 2013 (in millions, except share data) | ||||||||||||||||||||||||
Company(1) | Industry | Investments | Cash Interest Rate(2) | PIK Interest Rate(2) | Maturity Date(2) | # of Shares/ Units Owned | Principal | Cost | Fair Value | |||||||||||||||
Citigroup Commercial Mortgage Securities Trust 2007-C6(7) | Real Estate | Commercial Mortgage Pass-Through Certificates(4)(6) | 5.7 | % | N/A | 7/17 | 30.9 | 18.0 | 5.1 | |||||||||||||||
COBALT CMBS Commercial Mortgage Trust 2007-C3(7) | Real Estate | Commercia1 Mortgage Pass-Through Certificates(4)(6) | 5.2 | % | N/A | 10/17 | 0.2 | 0.2 | 0.1 | |||||||||||||||
Credit Suisse Commercial Mortgage Trust Series 2007-C4(7) | Real Estate | Commercial Mortgage Pass-Through Certificates(4)(6) | 5.8 | % | N/A | 8/17 | 20.8 | 10.1 | 1.6 | |||||||||||||||
GS Mortgage Securities Trust 2007-GG10(7) | Real Estate | Commercial Mortgage Pass-Through Certificates(4) | 5.8 | % | N/A | 6/17 | 15.0 | — | 0.4 | |||||||||||||||
J.P. Morgan Chase Commercial Mortgage Securities Trust 2007-LDP11(7) | Real Estate | Commercial Mortgage Pass-Through Certificates(4)(6) | 5.8 | % | N/A | 7/17 | 136.1 | 8.4 | 5.7 | |||||||||||||||
LB-UBS Commercial Mortgage Trust 2007-C6(7) | Real Estate | Commercial Mortgage Pass-Through Certificates(4)(6) | 6.2 | % | N/A | 8/17 | 12.0 | 5.0 | 1.2 | |||||||||||||||
Wachovia Bank Commercial Mortgage Trust 2007-C31(7) | Real Estate | Commercial Mortgage Pass-Through Certificates(4)(6) | 5.8 | % | N/A | 5/17 | 20.0 | 10.7 | 0.8 | |||||||||||||||
Wachovia Bank Commercial Mortgage Trust, Series 2007-C32(7) | Real Estate | Commercial Mortgage Pass-Through Certificates(4)(6) | 5.7 | % | N/A | 10/17 | 38.9 | 10.2 | 1.7 | |||||||||||||||
Wachovia Bank Commercial Mortgage Trust, Series 2007-C34(7) | Real Estate | Commercial Mortgage Pass-Through Certificates(4)(6) | 5.9 | % | N/A | 10/17-12/20 | 5.6 | 5.6 | 2.4 | |||||||||||||||
Wachovia Bank Commercial Trust 2006-C28(7) | Real Estate | Commercial Mortgage Pass-Through Certificates(4)(6) | 5.9 | % | N/A | 11/16 | 0.5 | 0.5 | 0.3 | |||||||||||||||
CLO INVESTMENTS | ||||||||||||||||||||||||
ACAS CLO 2007-1, Ltd.(7) | Secured Notes(6) | 4/21 | 8.5 | 8.4 | 8.0 | |||||||||||||||||||
Subordinated Notes(6) | 4/21 | 25.9 | 10.9 | 17.2 | ||||||||||||||||||||
19.3 | 25.2 | |||||||||||||||||||||||
ACAS CLO 2013-2, Ltd(7) | Subordinated Notes(6) | 10/25 | 8.0 | 8.1 | 8.1 | |||||||||||||||||||
ACAS CLO 2014-1, Ltd(7) | Subordinated Notes(6) | 7/14 | 20.0 | 20.0 | 20.0 | |||||||||||||||||||
APIDOS CLO XIV(7) | Subordinated Notes(6) | 4/25 | 3.6 | 3.4 | 3.4 | |||||||||||||||||||
Ares IIIR/IVR CLO Ltd.(7) | Subordinated Notes(6) | 4/21 | 20.0 | 13.1 | 12.7 | |||||||||||||||||||
Ares VIII CLO, Ltd.(7) | Preference Shares(4)(6) | 2/16 | 6,241 | 3.7 | — | |||||||||||||||||||
Avalon Capital Ltd. 3(7) | Preferred Securities(6) | 2/19 | 13,796 | 3.9 | 0.2 | |||||||||||||||||||
Babson CLO Ltd. 2006-II(7) | Income Notes(6) | 10/20 | 15.0 | 7.8 | 12.3 | |||||||||||||||||||
BALLYROCK CLO 2006-2 LTD.(7) | Deferrable Notes(6) | 1/26 | 2.0 | 1.7 | 1.9 | |||||||||||||||||||
Blue Hill CLO, Ltd.(7) | Subordinated Notes(6) | 1/26 | 5.6 | 5.1 | 5.1 | |||||||||||||||||||
Carlyle Global Market Strategies CLO 2013-3, Ltd.(7) | Subordinated Notes(6) | 7/25 | 2.3 | 2.3 | 2.3 | |||||||||||||||||||
Cent CDO 12 Limited(7) | Income Notes(6) | 11/20 | 26.4 | 10.4 | 21.4 | |||||||||||||||||||
Cent CLO 18 Limited(7) | Subordinated Notes(6) | 7/25 | 3.8 | 3.8 | 3.8 | |||||||||||||||||||
Cent CLO 19 Limited(7) | Subordinated Notes(6) | 10/25 | 2.3 | 2.1 | 2.1 | |||||||||||||||||||
Centurion CDO 8 Limited(7) | Subordinated Notes(6) | 3/17 | 5.0 | 2.6 | 2.4 | |||||||||||||||||||
Champlain CLO(7) | Preferred Securities(4)(6) | 6/16 | 1,000,000 | 0.4 | 0.1 | |||||||||||||||||||
CoLTs 2005-1 Ltd.(7) | Preference Shares(4)(6) | 3/15 | 360 | 2.0 | 0.4 | |||||||||||||||||||
CoLTs 2005-2 Ltd.(7) | Preference Shares(6) | 12/18 | 34,170,000 | 19.5 | 6.2 | |||||||||||||||||||
CREST Exeter Street Solar 2004-1(7) | Preferred Securities(4)(6) | 6/39 | 3,500,000 | 5.9 | 0.1 | |||||||||||||||||||
Eaton Vance CDO X plc(7) | Secured Subordinated Notes(6) | 2/27 | 15.0 | 11.8 | 10.2 | |||||||||||||||||||
Essex Park CDO Ltd.(7) | Preferred Securities(6) | 9/16 | 5,750,000 | 4.4 | 3.2 | |||||||||||||||||||
Flagship CLO V(7) | Deferrable Notes(6) | 9/19 | 1.7 | 1.4 | 1.6 | |||||||||||||||||||
Subordinated Securities(6) | 9/19 | 15,000 | 7.4 | 7.4 | ||||||||||||||||||||
8.8 | 9.0 | |||||||||||||||||||||||
Galaxy III CLO, Ltd(7) | Subordinated Notes(4) | 8/16 | 4.0 | 0.9 | 0.5 | |||||||||||||||||||
Galaxy XVI CLO, Ltd.(7) | Subordinated Notes(6) | 11/25 | 2.3 | 2.1 | 2.1 | |||||||||||||||||||
Herbert Park B.V.(7) | Subordinated Notes(6) | 10/26 | 28.6 | 28.7 | 28.8 | |||||||||||||||||||
87
AMERICAN CAPITAL, LTD. CONSOLIDATED SCHEDULE OF INVESTMENTS—(Continued) December 31, 2013 (in millions, except share data) | ||||||||||||||||||||||||
Company(1) | Industry | Investments | Cash Interest Rate(2) | PIK Interest Rate(2) | Maturity Date(2) | # of Shares/ Units Owned | Principal | Cost | Fair Value | |||||||||||||||
LightPoint CLO IV, LTD(7) | Income Notes(6) | 4/18 | 6.7 | 7.6 | 4.3 | |||||||||||||||||||
LightPoint CLO VII, Ltd.(7) | Subordinated Notes(6) | 5/21 | 9.0 | 3.5 | 4.9 | |||||||||||||||||||
LightPoint CLO VIII, Ltd.(7) | Deferrable Notes(6) | 7/18 | 7.0 | 6.7 | 7.1 | |||||||||||||||||||
Mayport CLO Ltd.(7) | Income Notes | 2/20 | 14.0 | 8.6 | 5.4 | |||||||||||||||||||
Neuberger Berman CLO XV, Ltd.(7) | Subordinated Notes(6) | 10/25 | 2.8 | 2.6 | 2.6 | |||||||||||||||||||
NYLIM Flatiron CLO 2006-1 LTD.(7) | Subordinated Securities(6) | 8/20 | 10,000 | 3.7 | 5.6 | |||||||||||||||||||
Octagon Investment Partners VII, Ltd.(7) | Preferred Securities(4)(6) | 12/16 | 5,000,000 | 1.1 | — | |||||||||||||||||||
Octagon Investment Partners XIV, Ltd.(7) | Subordinated Notes(6) | 1/24 | 4.5 | 3.8 | 4.2 | |||||||||||||||||||
Octagon XIX CLO Warehouse(7) | Subordinated Notes(4)(6) | 12/16 | 15.0 | 15.0 | 15.0 | |||||||||||||||||||
Sapphire Valley CDO I, Ltd.(7) | Subordinated Notes(6) | 12/22 | 14.0 | 14.1 | 14.8 | |||||||||||||||||||
Vitesse CLO, Ltd.(7) | Preferred Securities(6) | 8/20 | 20,000,000 | 12.5 | 9.1 | |||||||||||||||||||
Subtotal Non-Control / Non-Affiliate Investments (21% of total investments at fair value) | $ | 1,338.0 | $ | 1,085.4 | ||||||||||||||||||||
AFFILIATE INVESTMENTS | ||||||||||||||||||||||||
Anchor Drilling Fluids USA, Inc. | Energy Equipment & Services | First Lien Senior Debt(6) | 10.5 | % | 0.8% | 3/14 | $ | 6.4 | $ | 6.4 | $ | 6.5 | ||||||||||||
Redeemable Preferred Stock(6) | 859 | 2.4 | 2.5 | |||||||||||||||||||||
Common Stock(4)(6) | 3,061 | 5.0 | 13.7 | |||||||||||||||||||||
13.8 | 22.7 | |||||||||||||||||||||||
Egenera, Inc. | Technology Hardware, Storage & Peripherals | Mezzanine Debt(5) | N/A | 15.0% | 3/14 | 5.9 | 3.2 | — | ||||||||||||||||
Common Stock(4)(6) | 8,569,905 | 25.4 | — | |||||||||||||||||||||
28.6 | — | |||||||||||||||||||||||
HALT Medical, Inc. | Health Care Equipment & Supplies | Convertible First Lien Senior Debt(6) | N/A | 20.2% | 1/14 | 26.8 | 26.8 | 26.7 | ||||||||||||||||
Convertible Preferred Stock(4)(6) | 5,592,367 | 9.0 | — | |||||||||||||||||||||
Common Stock(4)(6) | 131,315 | 0.1 | — | |||||||||||||||||||||
35.9 | 26.7 | |||||||||||||||||||||||
IS Holdings I, Inc. | Software | Common Stock(6) | 1,165,930 | — | 13.5 | |||||||||||||||||||
Neways Holdings, L.P. | Personal Products | First Lien Senior Debt(6) | 11.5 | % | N/A | 8/17 | 26.7 | 26.5 | 22.0 | |||||||||||||||
Second Lien Senior Debt(5)(6) | N/A | 16.0 | % | 2/18 | 12.1 | 8.9 | 3.4 | |||||||||||||||||
Common Units(4)(6) | 11.3 | % | 9.5 | — | ||||||||||||||||||||
44.9 | 25.4 | |||||||||||||||||||||||
Primrose Holding Corporation | Diversified Consumer Services | Common Stock(6) | 4,213 | — | 3.4 | |||||||||||||||||||
Qualitor Component Holdings, LLC | Auto Components | Redeemable Preferred Units(4) | 3,150,000 | 3.2 | 2.1 | |||||||||||||||||||
Common Units(4) | 350,000 | 0.4 | — | |||||||||||||||||||||
3.6 | 2.1 | |||||||||||||||||||||||
The Tensar Corporation | Construction & Engineering | Second Lien Senior Debt(6) | 11.9 | % | 3.4% | 10/15 | 105.1 | 104.2 | 106.0 | |||||||||||||||
Convertible Preferred Stock(6) | 12,135,088 | 66.9 | 79.2 | |||||||||||||||||||||
Common Stock Warrants(4) | 8,563,949 | 1.3 | — | |||||||||||||||||||||
172.4 | 185.2 | |||||||||||||||||||||||
WFS Holding, LLC | Software | Preferred Membership Units | 20,403,772 | 2.3 | 2.6 | |||||||||||||||||||
Subtotal Affiliate Investments (6% of total investments at fair value) | $ | 301.5 | $ | 281.6 | ||||||||||||||||||||
CONTROL INVESTMENTS | ||||||||||||||||||||||||
ACAS Real Estate Holdings Corporation | Real Estate | Mezzanine Debt(5)(6) | N/A | 15.0% | 5/16 | $ | 7.5 | $ | 3.7 | $ | 3.3 | |||||||||||||
Common Stock(6) | 100 | % | 11.1 | 23.7 | ||||||||||||||||||||
14.8 | 27.0 | |||||||||||||||||||||||
Affordable Care Holding Corp. | Health Care Providers & Services | Convertible Preferred Stock(6) | 81,087 | 70.3 | 138.2 | |||||||||||||||||||
Common Stock(4)(6) | 20,139,669 | 15.7 | 32.6 | |||||||||||||||||||||
86.0 | 170.8 | |||||||||||||||||||||||
American Capital Asset Management, LLC | Capital Markets | Senior Debt(6) | 5.0 | % | N/A | 9/16 | 33.0 | 33.0 | 33.0 | |||||||||||||||
Common Membership Interest(6) | 100 | % | 322.8 | 836.5 | ||||||||||||||||||||
355.8 | 869.5 | |||||||||||||||||||||||
American Driveline Systems, Inc. | Diversified Consumer Services | Redeemable Preferred Stock(4)(6) | 6,805,008 | 78.2 | 30.2 | |||||||||||||||||||
Common Stock(4)(6) | 128,681 | 10.8 | — | |||||||||||||||||||||
Common Stock Warrants(4)(6) | 204,663 | 17.3 | — | |||||||||||||||||||||
106.3 | 30.2 | |||||||||||||||||||||||
88
AMERICAN CAPITAL, LTD. CONSOLIDATED SCHEDULE OF INVESTMENTS—(Continued) December 31, 2013 (in millions, except share data) | ||||||||||||||||||||||||
Company(1) | Industry | Investments | Cash Interest Rate(2) | PIK Interest Rate(2) | Maturity Date(2) | # of Shares/ Units Owned | Principal | Cost | Fair Value | |||||||||||||||
ASAP Industries Holdings, LLC | Energy Equipment & Services | Mezzanine Debt(6) | 12.0 | % | 2.0% | 12/18 | 20.1 | 19.9 | 20.1 | |||||||||||||||
Membership Units(4)(6) | 100,000 | 28.9 | 17.8 | |||||||||||||||||||||
48.8 | 37.9 | |||||||||||||||||||||||
Avalon Laboratories Holding Corp. | Health Care Equipment & Supplies | Mezzanine Debt(6) | 12.0 | % | 2.0% | 8/20 | 12.6 | 12.4 | 12.6 | |||||||||||||||
Convertible Preferred Stock(6) | 145,316 | 26.1 | 59.4 | |||||||||||||||||||||
Common Stock(4)(6) | 13,031 | 1.8 | 5.0 | |||||||||||||||||||||
40.3 | 77.0 | |||||||||||||||||||||||
Capital.com, Inc. | Diversified Financial Services | Common Stock(4)(6) | 8,500,100 | 0.9 | 0.1 | |||||||||||||||||||
CH Holding Corp. | Leisure Products | Second Lien Senior Debt(5)(6) | — | % | 7.2% | 5/14 | 21.3 | 14.0 | 4.5 | |||||||||||||||
Redeemable Preferred Stock(4)(6) | 21 | 42.7 | — | |||||||||||||||||||||
56.7 | 4.5 | |||||||||||||||||||||||
CML Pharmaceuticals, Inc. | Life Sciences Tools & Services | First Lien Senior Debt(6) | 8.0 | % | N/A | 12/15-10/19 | — | (0.2 | ) | — | ||||||||||||||
Second Lien Senior Debt(6) | 8.0 | % | N/A | 10/20 | 288.3 | 285.6 | 288.3 | |||||||||||||||||
Convertible Preferred Stock(4)(6) | 243,642 | 144.6 | 104.3 | |||||||||||||||||||||
430.0 | 392.6 | |||||||||||||||||||||||
CMX Inc. | Construction & Engineering | First Lien Senior Debt(5)(6) | 3.4 | % | N/A | 2/14 | 4.5 | 4.4 | — | |||||||||||||||
Contour Semiconductor, Inc. | Semiconductors & Semiconductor Equipment | First Lien Senior Debt(6) | N/A | 8.0% | 2/14 | 5.4 | 5.4 | 5.4 | ||||||||||||||||
Convertible Preferred Stock(4)(6) | 77,504,840 | 13.6 | 8.0 | |||||||||||||||||||||
19.0 | 13.4 | |||||||||||||||||||||||
Core Financial Holdings, LLC(7) | Diversified Financial Services | Common Units(4)(6) | 57,940,360 | 44.2 | 0.9 | |||||||||||||||||||
Dyno Holding Corp. | Auto Components | First Lien Senior Debt(6) | 9.1 | % | 2.1% | 11/15 | 35.2 | 35.1 | 35.2 | |||||||||||||||
Mezzanine Debt(5)(6) | N/A | 4.2% | 11/16 | 33.2 | 25.5 | 12.3 | ||||||||||||||||||
Convertible Preferred Stock(4)(6) | 389,759 | 40.5 | — | |||||||||||||||||||||
Common Stock(4)(6) | 97,440 | 10.1 | — | |||||||||||||||||||||
111.2 | 47.5 | |||||||||||||||||||||||
ECA Medical Instruments | Health Care Equipment & Supplies | First Lien Senior Debt(6) | 10.0 | % | N/A | 3/16 | 5.8 | 5.8 | 5.8 | |||||||||||||||
Mezzanine Debt(6) | 13.0 | % | 3.5% | 7/16 | 17.4 | 17.4 | 17.4 | |||||||||||||||||
Common Stock(4)(6) | 583 | 11.1 | 5.0 | |||||||||||||||||||||
34.3 | 28.2 | |||||||||||||||||||||||
eLynx Holdings, Inc. | IT Services | Convertible Preferred Stock(4)(6) | 11,728 | 24.1 | 22.1 | |||||||||||||||||||
Redeemable Preferred Stock(4)(6) | 21,113 | 8.9 | — | |||||||||||||||||||||
Common Stock(4)(6) | 11,261 | 1.1 | — | |||||||||||||||||||||
Common Stock Warrants(4)(6) | 1,078,792 | 13.1 | — | |||||||||||||||||||||
47.2 | 22.1 | |||||||||||||||||||||||
European Capital Limited(7)(8) | Diversified Financial Services | Ordinary Shares(4)(6) | 100 | % | 1,092.8 | 841.0 | ||||||||||||||||||
EXPL Pipeline Holdings LLC(7) | Oil, Gas & Consumable Fuels | First Lien Senior Debt(6) | 8.1 | % | N/A | 1/17 | 45.8 | 45.4 | 45.8 | |||||||||||||||
Common Membership Units(4)(6) | 58,297 | 44.5 | 16.8 | |||||||||||||||||||||
89.9 | 62.6 | |||||||||||||||||||||||
FL Acquisitions Holdings, Inc. | Technology Hardware, Storage & Peripherals | First Lien Senior Debt(6) | 8.2 | % | N/A | 12/15 | 41.9 | 41.9 | 41.9 | |||||||||||||||
Mezzanine Debt(5)(6) | 4.1 | % | 16.3% | 12/15 | 83.2 | 35.9 | 15.1 | |||||||||||||||||
Redeemable Preferred Stock(4) | 583,000 | 0.6 | — | |||||||||||||||||||||
Common Stock(4)(6) | 129,514 | 15.6 | — | |||||||||||||||||||||
94.0 | 57.0 | |||||||||||||||||||||||
Fosbel Holding, Inc. | Commercial Services & Supplies | Mezzanine Debt(6) | 17.0 | % | N/A | 10/18 | 7.4 | 7.4 | 7.4 | |||||||||||||||
Mezzanine Debt(5)(6) | N/A | 17.0 | % | 10/18 | 38.4 | 19.1 | 7.7 | |||||||||||||||||
26.5 | 15.1 | |||||||||||||||||||||||
FPI Holding Corporation | Food Products | First Lien Senior Debt(5)(6) | N/A | 8.0% | 1/19 | 28.2 | 24.6 | 10.2 | ||||||||||||||||
Future Food, Inc. | Food Products | First Lien Senior Debt(5)(6) | 8.0 | % | N/A | 3/14 | 1.7 | 1.7 | 1.5 | |||||||||||||||
Common Stock(4)(6) | 64,917 | 12.9 | — | |||||||||||||||||||||
Common Stock Warrants(4)(6) | 6,500 | 1.3 | — | |||||||||||||||||||||
15.9 | 1.5 | |||||||||||||||||||||||
Group Montana, Inc. | Textiles, Apparel & Luxury Goods | First Lien Senior Debt(6) | 6.3 | % | N/A | 1/17 | 6.9 | 6.9 | 7.1 | |||||||||||||||
Convertible Preferred Stock(6) | 4,000 | 3.7 | 10.1 | |||||||||||||||||||||
Common Stock(4)(6) | 100 | % | 12.6 | 2.6 | ||||||||||||||||||||
23.2 | 19.8 | |||||||||||||||||||||||
Halex Holdings, Inc. | Construction Materials | Second Lien Senior Debt(5)(6) | — | % | 12.0% | 12/14 | 16.3 | 9.8 | 10.7 | |||||||||||||||
Redeemable Preferred Stock(4)(6) | 6,482,972 | 6.6 | — | |||||||||||||||||||||
16.4 | 10.7 | |||||||||||||||||||||||
Hard 8 Games, LLC | Hotels, Restaurants & Leisure | Membership Unit(4)(6) | 1 | 13.0 | 22.8 | |||||||||||||||||||
Hollyhock Limited(7) | Independent Power and Renewable Electricity Producers | Common Stock(4)(6) | 12,000,000 | 12.0 | 11.4 | |||||||||||||||||||
LLSC Holdings Corporation | Personal Products | Convertible Preferred Stock(4)(6) | 7,496 | 8.1 | 7.1 | |||||||||||||||||||
89
AMERICAN CAPITAL, LTD. CONSOLIDATED SCHEDULE OF INVESTMENTS—(Continued) December 31, 2013 (in millions, except share data) | ||||||||||||||||||||||||
Company(1) | Industry | Investments | Cash Interest Rate(2) | PIK Interest Rate(2) | Maturity Date(2) | # of Shares/ Units Owned | Principal | Cost | Fair Value | |||||||||||||||
Mirion Technologies, Inc. | Electrical Equipment | Convertible Preferred Stock(6) | 313,327 | 64.5 | 125.5 | |||||||||||||||||||
Common Stock(4)(6) | 55,290 | 5.5 | 9.3 | |||||||||||||||||||||
Common Stock Warrants(4)(6) | 222,414 | 18.6 | 37.3 | |||||||||||||||||||||
88.6 | 172.1 | |||||||||||||||||||||||
Montgomery Lane, LLC(7) | Diversified Financial Services | Common Membership Units(4)(6) | 100 | 0.8 | 7.0 | |||||||||||||||||||
MW Acquisition Corporation | Health Care Providers & Services | Mezzanine Debt(6) | 14.4 | % | 1.0% | 2/19 | 23.7 | 23.7 | 23.7 | |||||||||||||||
Redeemable Preferred Stock(6) | 2,485 | 2.0 | 2.0 | |||||||||||||||||||||
Convertible Preferred Stock(6) | 51,351 | 28.8 | 30.1 | |||||||||||||||||||||
Common Stock(4) | 64,546 | — | 1.4 | |||||||||||||||||||||
54.5 | 57.2 | |||||||||||||||||||||||
NECCO Holdings, Inc. | Food Products | First Lien Senior Debt(5)(6) | 6.5 | % | N/A | 12/15 | 10.3 | 8.9 | 5.8 | |||||||||||||||
Second Lien Senior Debt(5)(6) | N/A | 18.0 | % | 11/15 | 5.4 | 3.2 | — | |||||||||||||||||
Common Stock(4)(6) | 860,189 | 0.1 | — | |||||||||||||||||||||
12.2 | 5.8 | |||||||||||||||||||||||
NECCO Realty Investments, LLC | Real Estate | First Lien Senior Debt(5)(6) | 3.0 | % | 11.0% | 12/17 | 59.7 | 32.8 | 31.0 | |||||||||||||||
Common Membership Units(4)(6) | 7,450 | 4.9 | — | |||||||||||||||||||||
37.7 | 31.0 | |||||||||||||||||||||||
Orchard Brands Corporation | Internet & Catalog Retail | Common Stock(4)(6) | 86,514 | 55.0 | 39.2 | |||||||||||||||||||
PHC Sharp Holdings, Inc. | Commercial Services & Supplies | First Lien Senior Debt(6) | 12.5 | % | N/A | 12/14 | 1.9 | 1.9 | 1.9 | |||||||||||||||
Mezzanine Debt(6) | N/A | 17.0 | % | 12/15 | 14.1 | 14.1 | 14.1 | |||||||||||||||||
Mezzanine Debt(5)(6) | N/A | 19.0 | % | 12/15 | 20.7 | 7.2 | 5.6 | |||||||||||||||||
Common Stock(4)(6) | 367,881 | 4.2 | — | |||||||||||||||||||||
27.4 | 21.6 | |||||||||||||||||||||||
PHI Acquisitions, Inc. | Internet & Catalog Retail | Mezzanine Debt(6) | 12.0 | % | 3.3% | 3/16 | 28.4 | 28.3 | 28.4 | |||||||||||||||
Redeemable Preferred Stock(6) | 36,267 | 28.5 | 40.1 | |||||||||||||||||||||
Common Stock(4)(6) | 40,295 | 3.9 | 1.6 | |||||||||||||||||||||
Common Stock Warrants(4)(6) | 116,065 | 11.6 | 4.6 | |||||||||||||||||||||
72.3 | 74.7 | |||||||||||||||||||||||
Plumbing Holding Corporation | Building Products | Common Stock(4)(6) | 342,500 | 11.1 | 2.6 | |||||||||||||||||||
RD Holdco Inc. | Household Durables | Second Lien Senior Debt(6) | 11.3 | % | N/A | 6/17 | 16.9 | 13.8 | 16.9 | |||||||||||||||
Common Stock(4)(6) | 458,596 | 23.6 | 12.6 | |||||||||||||||||||||
Common Stock Warrants(4)(6) | 56,372 | 2.9 | 1.6 | |||||||||||||||||||||
40.3 | 31.1 | |||||||||||||||||||||||
RDR Holdings, Inc. | Household Durables | Redeemable Preferred Stock(4)(6) | 133 | 13.3 | — | |||||||||||||||||||
Convertible Preferred Stock(4)(6) | 539 | 92.1 | — | |||||||||||||||||||||
Common Stock(4)(6) | 1,013,471 | 132.9 | — | |||||||||||||||||||||
238.3 | — | |||||||||||||||||||||||
Rebellion Media Group Corp.(7) | Internet Software & Services | First Lien Senior Debt(6) | N/A | 5.7 | % | 7/14-12/15 | 14.2 | 13.4 | 14.2 | |||||||||||||||
First Lien Senior Debt(5)(6) | N/A | 8.0 | % | 12/15 | 8.6 | 7.5 | — | |||||||||||||||||
Convertible Preferred Stock(4)(6) | 2,081,879 | 7.6 | — | |||||||||||||||||||||
28.5 | 14.2 | |||||||||||||||||||||||
Scanner Holdings Corporation | Technology Hardware, Storage & Peripherals | Mezzanine Debt(6) | 12.0 | % | 2.0% | 10/16 | 16.4 | 16.4 | 16.4 | |||||||||||||||
Convertible Preferred Stock(6) | 77,447,018 | 8.7 | 9.6 | |||||||||||||||||||||
Common Stock(4)(6) | 97,540 | 0.1 | — | |||||||||||||||||||||
25.2 | 26.0 | |||||||||||||||||||||||
SEHAC Holding Corporation | Diversified Consumer Services | Convertible Preferred Stock(6) | 14,850 | 14.8 | 46.8 | |||||||||||||||||||
Common Stock(6) | 150 | 0.2 | 0.5 | |||||||||||||||||||||
15.0 | 47.3 | |||||||||||||||||||||||
SMG Holdings, Inc. | Hotels, Restaurants & Leisure | Convertible Preferred Stock(4)(6) | 1,101,673 | 180.6 | 186.7 | |||||||||||||||||||
Common Stock(4)(6) | 275,419 | 27.6 | 8.0 | |||||||||||||||||||||
208.2 | 194.7 | |||||||||||||||||||||||
Specialty Brands Holdings, Inc. | Food Products | Redeemable Preferred Stock(6) | 122,017 | 14.8 | 20.5 | |||||||||||||||||||
Common Stock(4)(6) | 184,994 | 3.7 | 28.4 | |||||||||||||||||||||
18.5 | 48.9 | |||||||||||||||||||||||
Spring Air International, LLC | Household Durables | Common Membership Units(4) | 49 | % | 1.9 | — | ||||||||||||||||||
TestAmerica Environmental Services, LLC | Commercial Services & Supplies | Mezzanine Debt(5)(6) | 10.0 | % | 2.5% | 6/18 | 31.1 | 26.5 | — | |||||||||||||||
Common Units(4)(6) | 490,000 | 2.0 | — | |||||||||||||||||||||
28.5 | — | |||||||||||||||||||||||
Unwired Holdings, Inc. | Electronic Equipment, Instruments & Components | First Lien Senior Debt(6) | 8.0 | % | N/A | 6/15 | 11.9 | 11.9 | 11.9 | |||||||||||||||
Mezzanine Debt(6) | N/A | 15.0% | 6/15 | 48.9 | 33.5 | 48.9 | ||||||||||||||||||
Redeemable Preferred Stock(4) | 1,890 | 1.9 | 3.7 | |||||||||||||||||||||
47.3 | 64.5 | |||||||||||||||||||||||
90
AMERICAN CAPITAL, LTD. CONSOLIDATED SCHEDULE OF INVESTMENTS—(Continued) December 31, 2013 (in millions, except share data) | ||||||||||||||||||||||||
Company(1) | Industry | Investments | Cash Interest Rate(2) | PIK Interest Rate(2) | Maturity Date(2) | # of Shares/ Units Owned | Principal | Cost | Fair Value | |||||||||||||||
Warner Power, LLC | Electrical Equipment | Mezzanine Debt(6) | N/A | 14.0% | 9/14 | 3.1 | 3.0 | 3.0 | ||||||||||||||||
Mezzanine Debt(5)(6) | N/A | 15.0% | 9/14 | 4.7 | 3.1 | 0.8 | ||||||||||||||||||
Redeemable Preferred Membership Units(4)(6) | 3,796,269 | 3.0 | — | |||||||||||||||||||||
Common Membership Units(4)(6) | 27,400 | 1.9 | — | |||||||||||||||||||||
11.0 | 3.8 | |||||||||||||||||||||||
WIS Holding Company, Inc. | Commercial Services & Supplies | Convertible Preferred Stock(6) | 703,406 | 51.5 | 76.4 | |||||||||||||||||||
Common Stock(4)(6) | 175,853 | 11.4 | 5.3 | |||||||||||||||||||||
62.9 | 81.7 | |||||||||||||||||||||||
CLO INVESTMENTS | ||||||||||||||||||||||||
ACAS Wachovia Investments, L.P.(7) | Diversified Financial Services | Partnership Interest | 90 | % | 6.7 | 0.8 | ||||||||||||||||||
Subtotal Control Investments (73% of total investments at fair value) | $ | 3,908.2 | $ | 3,705.1 | ||||||||||||||||||||
Total Investment Assets | $ | 5,547.7 | $ | 5,072.1 | ||||||||||||||||||||
Counterparty | Instrument | Interest Rate(2) | Expiration Date(2) | # of Contracts | Notional | Cost | Fair Value | ||||||||||||||
DERIVATIVE AGREEMENTS | |||||||||||||||||||||
European Capital Limited | Total Return Swap | 12/19 | 1 | $ | — | $ | 1.9 | ||||||||||||||
Subtotal Derivative Assets | $ | — | $ | 1.9 | |||||||||||||||||
Citibank, N.A. | Interest Rate Swap - Pay Fixed/ Receive Floating(6) | 5.6%/LIBOR | 5/16-7/17 | 2 | $ | 27.5 | $ | — | $ | (4.5 | ) | ||||||||||
BNP Paribas | Interest Rate Swap - Pay Fixed/ Receive Floating(6) | 5.7%/LIBOR | 7/17 | 1 | 22.3 | — | (4.0 | ) | |||||||||||||
Wells Fargo Bank, N.A | Interest Rate Swap - Pay Fixed/ Receive Floating(6) | 5.6%/LIBOR | 8/16 | 1 | 11.9 | — | (1.5 | ) | |||||||||||||
Citibank, N.A. | Total Return Swaps | 12/14 | 2 | 247.4 | — | (0.4 | ) | ||||||||||||||
Subtotal Derivative Liabilities | $ | — | $ | (10.4 | ) | ||||||||||||||||
Total Derivative Agreements, Net | $ | — | $ | (8.5 | ) | ||||||||||||||||
Funds | Cost | Fair Value | ||||||
MONEY MARKET FUNDS(3)(6) | ||||||||
Wells Fargo Advantage Heritage Money Market Fund | $ | 40.1 | $ | 40.1 | ||||
BofA Funds Series Trust - BofA Money Market Reserves | 23.0 | 23.0 | ||||||
Fidelity Institutional Money Market Funds - Prime Money Market Portfolio | 16.0 | 16.0 | ||||||
JPMorgan Prime Money Market Fund | 10.0 | 10.0 | ||||||
Morgan Stanley Institutional Liquidity Funds - Prime Portfolio | 10.0 | 10.0 | ||||||
Blackrock Liquidity Tempfund Instl Shares #24 | 5.0 | 5.0 | ||||||
Dreyfus Institutional Cash Advantage Fund | 5.0 | 5.0 | ||||||
STIT - Liquid Assets Portfolio | 5.0 | 5.0 | ||||||
Federated Prime Obligations Institutional Fund | 5.0 | 5.0 | ||||||
Fidelity Institutional Money Market Fund | 5.0 | 5.0 | ||||||
Federated Prime Cash Obligations Fund | 0.1 | 0.1 | ||||||
Total Money Market Funds | $ | 124.2 | $ | 124.2 | ||||
(1) | Certain of the securities are issued by affiliate(s) of the listed portfolio company. |
(2) | Interest rates represent the weighted average annual stated interest rate on loans and debt securities in effect on the date presented, which are presented by the nature of indebtedness by a single issuer. Some loans and debt securities bear interest at variable rates, primarily one-month LIBOR, with interest rate floors. PIK represents contractually deferred interest that is typically compounded into the principal balance of the loan or debt security, if not paid on a current basis. PIK interest may be prepaid by the portfolio company’s election, but generally is paid upon a change of control transaction or maturity. The maturity date represents the latest date in which the loan or debt security is scheduled to terminate. |
(3) | Included in cash and cash equivalents on our consolidated balance sheets. |
(4) | Some or all of the securities are non-income producing. |
(5) | Loan is on non-accrual status and therefore considered non-income producing. |
(6) | All or a portion of the investments or instruments are pledged as collateral under various secured financing arrangements. |
(7) | Investments that are not “qualifying assets” under Section 55(a) of the 1940 Act. Under the 1940 Act, we may not acquire any non-qualifying asset unless, at the time such acquisition is made, qualifying assets represent at least 70% of our total assets. |
(8) | In accordance with ASC 946, European Capital Limited has one unconsolidated portfolio company in which our proportionate share of their investment in the portfolio company, FB Raphael 1 Limited, exceeds 5% of our shareholders’ equity as of December 31, 2013. Below is a list of the securities and its values in Euros as of December 31, 2013 for European Capital’s investment in FB Raphael 1 Limited, which is located in the UK with an industry of Household Products: |
Investments | Shares/ Warrants | Principal | Cost | Fair Value | |||||||
Preferred Stock | € | 105.3 | € | 118.6 | € | 105.3 | |||||
Common Stock | 68,125 | 0.1 | 98.9 | ||||||||
Warrants | 4,058 | — | 5.9 | ||||||||
€ | 118.7 | € | 210.1 | ||||||||
91
AMERICAN CAPITAL, LTD.
NOTES TO CONSOLIDATED FINANCIAL STATEMENTS
(in millions, except per share data)
Note 1. | Organization |
American Capital, Ltd., (which is referred to throughout this report as “American Capital”, “we”, “our” and “us”) was incorporated in 1986. On August 29, 1997, we completed an initial public offering and became a non-diversified closed end investment company that has elected to be regulated as a business development company (“BDC”) under the Investment Company Act of 1940, as amended (“1940 Act”). As a BDC, we primarily invest in senior and mezzanine debt and equity in buyouts of private companies sponsored by us (“American Capital One Stop Buyouts®”) or sponsored by other private equity funds and provide capital directly to early stage and mature private and small public companies (“Sponsor Finance Investments”). We also invest in first and second lien floating rate loans to large-market U.S. based companies (“Senior Floating Rate Loans”) and structured finance investments (“Structured Products”), including collateralized loan obligation (“CLO”) securities and commercial mortgages and commercial mortgage backed securities (“CMBS”). Our primary business objectives are to increase our net earnings and net asset value (“NAV”) by making investments with attractive current yields and/or potential for equity appreciation and realized gains.
Through our tax years ended September 30, 1998 through September 30, 2010, we qualified to be taxed as a regulated investment company (“RIC”) under Subchapter M of the Internal Revenue Code of 1986, as amended (the “Code”). Effective with our tax year ended September 30, 2011, we did not qualify to be taxed as a RIC and became subject to taxation as a corporation under Subchapter C of the Code (a “Subchapter C corporation”). This change in tax status does not affect our status as a BDC under the 1940 Act or our compliance with the portfolio composition requirements of that statute.
Note 2. Summary of Significant Accounting Policies
Basis of Presentation
The accompanying consolidated financial statements have been prepared in accordance with accounting principles generally accepted in the United States (“U.S. GAAP”).
Reclassifications
We have reclassified certain prior period amounts in our consolidated financial statements to conform to our current period presentation. These reclassifications had no impact on prior periods’ net earnings or shareholders’ equity.
Consolidation
Under the investment company rules and regulations pursuant to Article 6 of Regulation S-X, the Securities and Exchange Commission’s (“SEC”) Division of Investment Management’s consolidation guidance in IM Guidance Update No. 2014-11 issued in October 2014 and Financial Accounting Standards Board (“FASB”) Accounting Standards Codification (“ASC”) Topic 946, Financial Services-Investment Companies (“ASC 946”), we are precluded from consolidating any entity other than another investment company that acts as an extension of our investment operations and facilitates the execution of our investment strategy. An exception to this guidance occurs if the investment company has an investment in a controlled operating company that provides substantially all of its services to the investment company.
We have determined that as of December 31, 2014 and for the periods presented in our audited consolidated financial statements included in this Annual Report on Form 10-K, European Capital Limited (“European Capital”) and American Capital Asset Management, LLC (“ACAM”), have met the conditions of a significant subsidiary under Rule 1-02(w) of Regulation S-X for which we are required, pursuant to Rule 3-09 of Regulation S-X, to attach separate financial statements as exhibits to our Form 10-K. As such, separate financial statements for European Capital and ACAM are filed herewith as Exhibits 99.1 and 99.2, respectively.
We currently consolidate ACAS Funding I, LLC and ACAS Funding II, LLC, which are wholly-owned special purpose financing vehicles that were formed for the purpose of purchasing Senior Floating Rate Loans under the $750 million secured revolving credit facility and $500 million secured revolving credit facility. As of December 31, 2014, ACAS Funding I, LLC and ACAS Funding II, LLC did not have any other operations or activities. We also consolidate American Capital TRS, LLC (“ACTRS”), which is a wholly-owned entity that has entered into non-recourse total return swaps (“TRS”) with Citibank, N.A. As of December 31, 2014, ACTRS did not have any other operations or activities. The TRS is accounted for as a derivative pursuant to FASB ASC Topic 815, Derivatives and Hedging.
92
AMERICAN CAPITAL, LTD.
NOTES TO CONSOLIDATED FINANCIAL STATEMENTS—(Continued)
(in millions, except per share data)
Our consolidated financial statements also include the accounts of European Capital, which is a wholly-owned investment company entity that, effective October 1, 2014, acts as an extension of our investment operations and facilitates the execution of our investment strategy. Our financial statements also include the accounts of AC Corporate Holdings, Inc. (“ACCH”), which is a wholly-owned entity that purchased numerous investment securities. As of December 31, 2014, European Capital and ACCH did not have any other operations or activities and were considered to be investment companies under ASC 946, as amended by Accounting Standards Update No. 2013-08, Financial Services-Investment Companies (Topic 946): Amendments to the Scope, Measurement and Disclosure Requirements.
Trade Date Accounting
In accordance with ASC 946, we account for security purchases and sales on a trade date basis other than when it is not in accordance with standard industry practice to account for the purchase or sale transaction on a trade date basis and the transaction is outside conventional channels, such as through a private placement or by submitting shares in a tender offer. In such circumstances, we record the transaction on the date we obtain a right to demand the securities purchased or collect the proceeds of sale and incur an obligation to pay the price of the securities purchased or to deliver the securities sold, respectively.
Investment Valuation Policy
Our investments consist of loans and securities issued by public and privately-held companies, including senior debt, mezzanine debt, equity warrants and preferred and common equity securities. We also invest in both investment grade and non-investment grade Structured Products, which includes CLO securities and CMBS.
We fair value our investments in accordance with the 1940 Act and FASB ASC Topic 820, Fair Value Measurements and Disclosures (“ASC 820”) as determined in good faith by our Board of Directors. We undertake a multi-step valuation process each quarter to determine the fair value of our investments in accordance with ASC 820. The quarterly valuation process begins with the development of a preliminary valuation recommendation for each investment by our Financial Advisory and Consulting Team (“FACT”), which is composed of valuation and audit professionals responsible for monitoring portfolio compliance and valuations. In preparing the preliminary valuation recommendations, FACT receives assistance from our investment professionals that both originated and monitor the investment as well as assistance from other departments including operations, accounting and legal. The preliminary valuation recommendations are reviewed by senior management and then presented to our Audit, Compliance and Valuation Committee for review and approval. Subsequent to the approval from our Audit, Compliance and Valuation Committee, the valuation recommendations are sent to our Board of Directors for final approval.
When available, we base the fair value of our investments that trade in active markets on directly observable market prices or on market data derived for comparable assets. For restricted securities of companies that are publicly traded, the value is based on the closing market quote on the valuation date less a discount for the restriction. For all other investments, inputs used to measure fair value reflect management’s best estimate of assumptions that would be used by market participants in pricing the investment in a hypothetical transaction. For these investments, we estimate the fair value of our senior debt, mezzanine debt, redeemable and convertible preferred equity, common equity and equity warrants using either an enterprise value waterfall methodology, which generally combines market and income approaches, or a market yield valuation methodology utilizing the income approach. We estimate the fair value of our Structured Products using the market and income approaches, as well as third-party broker quotes.
ASC 820 provides a framework for measuring the fair value of assets and liabilities and provides guidance regarding a fair value hierarchy, which prioritizes information used to measure fair value and the effect of fair value measurements on earnings. Due to the uncertainty inherent in the valuation process, estimates of fair value may differ significantly from the values that would have been used had a ready market for our investments existed, and the differences could be material. Additionally, changes in the market environment and other events that may occur over the life of the investments may cause the gains or losses ultimately realized on these investments to be different than the valuations currently assigned.
ASC 820 defines fair value in terms of the price that would be received upon the sale of an asset or paid to transfer a liability in an orderly transaction between market participants at the measurement date under current market conditions. The price used to measure the fair value is not adjusted for transaction costs while the cost basis of our investments may include initial transaction costs. Under ASC 820, the fair value measurement also assumes that the transaction to sell an asset occurs in the principal market for the asset or, in the absence of a principal market, the most advantageous market for the asset. The principal market for an asset is the market in which the reporting entity would sell or transfer the asset with the greatest volume and level of activity for the asset. In determining the principal market for an asset under ASC 820, it is assumed that the reporting entity has access to the market as of the measurement date. If no market for the asset exists or if the reporting entity does not have access to the principal market, the reporting entity should use a hypothetical market.
93
AMERICAN CAPITAL, LTD.
NOTES TO CONSOLIDATED FINANCIAL STATEMENTS—(Continued)
(in millions, except per share data)
The principal market in which we would sell our Senior Floating Rate Loans and certain of our non-controlled Sponsor Finance debt investments is an active over-the-counter secondary market. For our other debt and equity investments, there is no active market and we are generally repaid our debt investment or sell our equity investment upon a change of control transaction such as through the mergers and acquisition (“M&A”) market. Accordingly, the market in which we would sell certain of our non-controlled debt and all of our equity investments is the M&A market. However, under ASC 820, we have identified the M&A market as the principal market for our investments in these portfolio companies only if we have the ability to control the decision to sell the portfolio company as of the measurement date. We determine whether we have the ability to control the decision to sell a portfolio company based on our ability to control or gain control of the board of directors of the portfolio company as of the measurement date and rights within the shareholders agreement. In evaluating if we can control or gain control of a portfolio company as of the measurement date, we include our equity securities and those securities held by entities managed by our wholly-owned portfolio company, ACAM on a fully diluted basis. For investments in portfolio companies for which we do not have the ability to control or gain control as of the measurement date and for which there is no active market, the principal market under ASC 820 is a hypothetical secondary market.
Accordingly, we use the M&A market as the principal market for our investments in portfolio companies that we control or can gain control as of the measurement date, and we use a hypothetical secondary market for our investments in portfolio companies that we do not control or cannot gain control as of the measurement date. However, to the extent that an active market exists for such investments, we will consider that as the principal market. Our valuation policy considers the fact that no ready active market exists for a significant amount of our investments and that the fair value for our investments must typically be determined using unobservable inputs.
Enterprise Value Waterfall Methodology
For investments in portfolio companies that we have identified the M&A market as the principal market, we estimate the fair value based on the enterprise value waterfall (“Enterprise Value Waterfall”) valuation methodology. For minority equity securities in which the principal market is the hypothetical secondary market, we also estimate the fair value using the Enterprise Value Waterfall valuation methodology.
Under the Enterprise Value Waterfall valuation methodology, we estimate the enterprise value of a portfolio company and then waterfall the enterprise value over the portfolio company’s securities in order of their preference relative to one another. In applying the Enterprise Value Waterfall valuation methodology, we consider that in a change of control transaction, our loans are generally required to be repaid at par and that a buyer cannot assume the loan.
To estimate the enterprise value of the portfolio company, we prepare an analysis of traditional valuation methodologies including valuations of comparable public companies, recent sales of private and public comparable companies, discounting the forecasted cash flows of the portfolio company, estimating the liquidation or collateral value of the portfolio company’s assets, third-party valuations of the portfolio company, offers from third-parties to buy the portfolio company and consider the value of recent investments in the equity securities of the portfolio company. Significant inputs in these valuation methodologies to estimate enterprise value include the historical or projected operating results of the portfolio company, selection of comparable companies, discounts or premiums to the prices of comparable companies and discount rates applied to the forecasted cash flows. The operating results of a portfolio company may be unaudited, projected or pro forma financial information and may require adjustments for non-recurring items or to normalize the operating results that may require significant judgment in its determination. In addition, projecting future financial results requires significant judgment regarding future growth assumptions. In evaluating the operating results, we also analyze the impact of exposure to litigation, loss of customers or other contingencies. The selection of a population of comparable companies requires significant judgment, including a qualitative and quantitative analysis of the comparability of the companies. In determining a discount or premium, if any, to prices of comparable companies, we use significant judgment for factors such as size, marketability, relative performance, and for portfolio companies in which we control, a control premium to the market price of comparable public companies. In determining a discount rate to apply to forecasted cash flows, we use significant judgment in the development of an appropriate discount rate including the evaluation of an appropriate risk premium. Further, a change in the future growth assumptions in projected future financial results could have a directionally opposite change in the assumptions used for determining an appropriate discount rate.
In valuing convertible debt, equity or other similar securities, we value our investment based on its priority in the waterfall and based on our pro rata share of the residual equity value available after deducting all outstanding debt from the estimated enterprise value. We value non-convertible debt at the face amount of the debt to the extent that the estimated enterprise value of the portfolio company exceeds the outstanding debt of the portfolio company. If the estimated enterprise value is less than the outstanding debt of the portfolio company, we reduce the fair value of our debt investment beginning with the junior most debt such that the enterprise value less the fair value of the outstanding debt is zero.
94
AMERICAN CAPITAL, LTD.
NOTES TO CONSOLIDATED FINANCIAL STATEMENTS—(Continued)
(in millions, except per share data)
Market Yield Valuation Methodology
For debt and redeemable preferred equity investments in portfolio companies for which we are required to identify a hypothetical secondary market as the principal market, we estimate the fair value based on the assumptions that we believe hypothetical market participants would use to value the investment in a current hypothetical sale using a market yield (“Market Yield”) valuation methodology based on an exchange valuation premise under ASC 820.
For debt and redeemable preferred equity investments of our investment portfolio for which we do not control or cannot gain control as of the measurement date and no active market exists, we estimate the fair value based on such factors as third-party broker quotes and our own assumptions in the absence of market observable data, including estimated remaining life, current market yield and interest rate spreads of similar loans and securities as of the measurement date. We weight the use of third-party broker quotes, if any, in determining fair value based on our understanding of the level of actual transactions used by the broker to develop the quote and whether the quote was an indicative price or binding offer. We estimate the remaining life based on market data of the average life of similar loans. However, if we have information available to us that the loan is expected to be repaid in the near term, we would use an estimated remaining life based on the expected repayment date, including considering the current maturity date of the loan. The average life used to estimate the fair value of our loans may be shorter than the legal maturity of the loans since our loans have historically been prepaid prior to the maturity date. The current interest rate spreads used to estimate the fair value of our loans is based on our experience of current interest rate spreads on similar loans. We use significant judgment in determining the estimated remaining life as well as the current market yield and interest rate spreads. If there is a significant deterioration of the credit quality of a loan, we may consider other factors that a hypothetical market participant would use to estimate fair value, including the proceeds that would be received in a liquidation analysis.
We fair value our investments in Structured Products based on such factors as third-party broker quotes, purchases or sales of the same or similar securities, and our cash flow forecasts. Cash flow forecasts are subject to assumptions a market participant would use regarding the investments’ underlying collateral including, but not limited to, assumptions of default and recovery rates, reinvestment spreads and prepayment rates. Cash flow forecasts are discounted using a market participant’s market yield assumptions that are derived from multiple sources including, but not limited to, third-party broker quotes, industry research reports and transactions of securities and indices with similar structure and risk characteristics. We weight the use of third-party broker quotes, if any, in determining fair value based on the correlation of changes in third-party broker quotes with underlying performance and other market indices.
Third-party Vendor Pricing
For debt investments that trade in an active market or that have similar assets that trade in an active market, we estimate the fair value based on evaluated prices from a nationally recognized, independent pricing service or from third-party brokers who make markets in such debt instruments. When possible, we make inquiries of third-party pricing sources to understand their use of significant inputs and assumptions. We review the price provided by the third-party pricing service and perform procedures to validate their reasonableness, including a review and analysis of executable broker quote(s), range and dispersion of third-party estimates, frequency of pricing updates, yields of similar securities or other qualitative and quantitative information. If the prices provided by the pricing service are consistent with such information, we will generally use the price provided by the pricing service as fair value.
Investments in Investment Funds
For an investment in an investment fund that does not have a readily determinable fair value, we measure the fair value of our investment predominately based on the NAV per share of the investment fund if the NAV of the investment fund is calculated in a manner consistent with the measurement principles of ASC 946 as of the measurement date, including measurement of all or substantially all of the underlying investments of the investee in accordance with ASC 820. However, in determining the fair value of our investment, we may make adjustments to the NAV per share in certain circumstances, based on our analysis of any restrictions on redemption of our shares of our investment as of the measurement date, any restrictions on the ability to receive dividends, comparisons of market price to NAV per share of comparable publicly traded funds and trades or sales of comparable private and publicly traded funds, recent actual sales or redemptions of shares of the investment fund, public to private liquidity discounts, expected future cash flows available to equity holders including the rate of return on those cash flows compared to an implied market return on equity required by market participants, or other uncertainties surrounding our ability to realize the full NAV of the investment fund.
95
AMERICAN CAPITAL, LTD.
NOTES TO CONSOLIDATED FINANCIAL STATEMENTS—(Continued)
(in millions, except per share data)
Interest Rate Derivatives
For interest rate derivative agreements, we estimate the fair value based on the estimated net present value of the future cash flows using a forward interest rate yield curve in effect as of the end of the measurement period, adjusted for nonperformance risk, if any, including a quantitative and/or qualitative evaluation of both our credit risk and counterparty credit risk. We consider the impact of any collateral requirements, credit enhancements or netting arrangements in evaluating credit risk.
Investment Classification
As required by the 1940 Act, we classify our investments by level of control. As defined in the 1940 Act, “Control Investments” are investments in those companies that we are deemed to “Control.” “Affiliate Investments” are investments in those companies that are “Affiliated Companies” of us, as defined in the 1940 Act, other than Control Investments. “Non-Control/Non-Affiliate Investments” are those that are neither Control Investments nor Affiliate Investments. Generally, under the 1940 Act, we are deemed to control a company if we own more than 25% of the voting securities of such company or have greater than 50% representation on its board of directors. We are deemed to be an affiliate of a company in which we have invested if we own between 5% and 25% of the voting securities of such company.
Cash and Cash Equivalents
Cash and cash equivalents consist of money market funds, demand deposits and highly liquid investments with original maturities of three months or less. Cash and cash equivalents are carried at cost which approximates fair value.
Concentration of Credit Risk
We place our cash and cash equivalents with major financial institutions and cash held in checking accounts may exceed the Federal Deposit Insurance Corporation insured limit. Our interest rate derivative agreements are with multiple large commercial financial institutions.
Restricted Cash and Cash Equivalents
Restricted cash and cash equivalents primarily consist of funded cash collateral on deposit with a custodian under our TRS. Restricted cash and cash equivalents are carried at cost which approximates fair value.
Interest and Dividend Income Recognition
Interest income is recorded on an accrual basis to the extent that such amounts are expected to be collected. Original issue discount and purchased discount and premiums are accreted into interest income using the effective interest method, where applicable. Loan origination fees are recorded as fee income upon receipt or deferred and accreted into interest income using the effective interest method. We record prepayment premiums on loans and other investments as interest income when such amounts are received. Dividend income is recognized on the ex-dividend date for publicly traded portfolio companies and the record date for private portfolio companies for common equity securities. Dividend income is recognized on an accrual basis for preferred equity securities to the extent that such amounts are expected to be collected or realized. In determining the amount of dividend income to recognize, if any, from cash distributions on common equity securities, we will assess many factors including a portfolio company’s cumulative undistributed income and operating cash flow. Cash distributions from common equity securities received in excess of such undistributed amounts are recorded first as a reduction of our investment and then as a realized gain on investment. We stop accruing interest or dividends on our investments when it is determined that the interest or dividend is not collectible. We assess the collectability of the interest and dividends based on many factors including the portfolio company’s ability to service our loan based on current and projected cash flows as well as the current valuation of the portfolio company’s total enterprise value. For investments with payment-in-kind (“PIK”) interest and cumulative dividends, we base income and dividend accruals on the valuation of the PIK notes or securities received from the borrower or the redemption value of the security. If the portfolio company valuation indicates a value of the PIK notes or securities that is not sufficient to cover the contractual interest or dividend, we will not accrue interest or dividend income on the notes or securities and will record an allowance for any accrued interest or dividend receivable as a reduction of interest or dividend income in the period we determine it is not collectible.
We also receive interest and dividend income from our debt and equity investments in our asset management company, ACAM. Interest income from ACAM is recorded on an accrual basis to the extent that such amounts are expected to be collected. Dividend income is recorded on the record date.
A change in the portfolio company valuation assigned by us could have an effect on our recognition of interest income on debt investments and dividend income of preferred stock investments. Also, a change in a portfolio company’s operating
96
AMERICAN CAPITAL, LTD.
NOTES TO CONSOLIDATED FINANCIAL STATEMENTS—(Continued)
(in millions, except per share data)
performance and cash flows can impact a portfolio company’s ability to service our debt and therefore could impact our interest income recognition.
Interest income on Structured Products is recognized on the effective interest method as required by FASB ASC Subtopic 325-40, Investments-Other, Beneficial Interests in Securitized Financial Assets (“ASC 325-40”). Under ASC 325-40, at the time of purchase, we estimate the future expected cash flows and determine the effective interest rate based on these estimated cash flows and our cost basis. Subsequent to the purchase and on a quarterly basis, these estimated cash flows are updated and a revised yield is calculated prospectively based on the current amortized cost of the investment. To the extent the current quarterly estimated cash flows decrease from the prior quarterly estimated cash flows, the revised yield is calculated prospectively based on the amortized cost basis of the investment calculated in accordance with ASC 320-10-35, Investment-Debt and Equity Securities. In the event that the estimated cash flows of an investment decrease below the current amortized cost used to determine the yield, we may be required to write down the current amortized cost by projected credit losses or to fair value. We are precluded from reversing the write down for any subsequent increase in the estimated cash flows of an investment with the effect of increasing total interest income during the life of the investment and realized loss recorded at the exit of the investment by the amount of the write down. In estimating these cash flows, there are a number of assumptions that are subject to uncertainties and contingencies. These include the amount and timing of principal payments (including prepayments, repurchases, defaults and liquidations), the pass through or coupon rate, and interest rate fluctuations. In addition, interest payment shortfalls due to delinquencies on the underlying loans and the timing and magnitude of projected credit losses on the loans underlying the securities have to be estimated. These uncertainties and contingencies are difficult to predict and are subject to future events that may impact our estimates and interest income. As a result, actual results may differ significantly from these estimates.
Fee Income Recognition
Fees primarily include asset management, portfolio company management, transaction, structuring, financing and prepayment fees. Asset management fees primarily represent fees for providing investment advisory and support services to ACAM, our asset management portfolio company. Portfolio company management fees, which are generally recurring in nature, represent amounts received for providing advice and analysis to the companies in our investment portfolio. Asset management and portfolio company management fees are recognized as earned, provided that collection is probable. Transaction structuring and financing fees represent amounts received for structuring, financing and executing transactions and are generally payable only if the transaction closes and are recognized as earned when the transaction is completed. Debt prepayment fees are recognized as they are received.
Realized Gain or Loss and Unrealized Appreciation or Depreciation of Portfolio Investments
Realized gain or loss is recorded at the disposition of an investment and is the difference between the net proceeds from the sale and the cost basis of the investment using the specific identification method. We include the fair value of all financial assets received in our net proceeds in determining the realized gain or loss at disposition, including anticipated sale proceeds held in escrow at the time of sale. For an investment with a fair value of zero, we record a realized loss on the investment in the period in which we record a loss for income tax purposes.
Unrealized appreciation or depreciation reflects the difference between the Board of Directors’ valuation of the investment and the cost basis of the investment. For portfolio investments denominated in a functional currency other than the U.S. dollar, the cost basis of our investment is translated at the exchange rate in effect at the balance sheet date. The resulting translation adjustment is recorded as foreign currency translation in our consolidated statements of operations.
Foreign Currency Translation
We translate the financial statements of European Capital from its functional currency, the Euro, to U.S. dollars in accordance with FASB ASC Topic 830, Foreign Currency Matters (“ASC 830”). Assets and liabilities are translated at the exchange rate prevailing at the end of the period and revenues and expenses are translated at monthly average exchange rates. Under ASC 830, we are required to include translation adjustments associated with the translation of European Capital’s balance sheet in accumulated other comprehensive income.
Income Taxes
Income taxes are accounted for using the asset and liability approach in accordance with FASB ASC Topic 740, Income Taxes (“ASC 740”). Deferred tax assets and liabilities reflect the impact of temporary differences between the carrying amount of assets and liabilities and their tax basis and are stated at tax rates expected to be in effect when taxes are actually paid or recovered. Deferred tax assets are also recorded for net operating losses, capital losses and any tax credit carryforwards. A valuation allowance is provided against a deferred tax asset when it is more likely than not that some or all of the deferred tax assets will
97
AMERICAN CAPITAL, LTD.
NOTES TO CONSOLIDATED FINANCIAL STATEMENTS—(Continued)
(in millions, except per share data)
not be realized. All available evidence, both positive and negative, is considered to determine whether a valuation allowance for deferred tax assets is needed. Items considered in determining our valuation allowance include expectations of future earnings of the appropriate tax character, recent historical financial results, tax planning strategies, the length of statutory carryforward periods and the expected timing of the reversal of temporary differences. Under ASC 740, forming a conclusion that a valuation allowance is not needed is difficult when there is negative evidence, such as cumulative losses in recent years.
We recognize tax benefits of uncertain tax positions only when the position is more likely than not to be sustained assuming examination by tax authorities. We record income tax related interest and penalties, if applicable, within current income tax expense.
Use of Estimates in Preparation of Financial Statements
The preparation of financial statements in conformity with U.S. GAAP requires management to make estimates and assumptions that affect the reported amounts of assets and liabilities, disclosure of contingent assets and liabilities at the date of the financial statements and revenues and expenses during the period reported. Actual results could differ from those estimates.
Deferred Financing Costs
Financing costs related to long-term debt obligations are deferred and amortized over the life of the debt using either the effective interest method or straight-line method. Deferred financing costs are included in other assets on our consolidated balance sheets.
Transfer of Financial Assets
For a transfer of financial assets to be considered a sale, the transfer must meet the sale criteria of FASB ASC Topic 860, Transfers and Servicing (“ASC 860”), under which we must surrender control over the transferred assets. The assets must be isolated from us, even in bankruptcy or other receivership; the purchaser must have the right to pledge or sell the assets transferred and we may not have an option or obligation to reacquire the assets. If the sale criteria are not met, the transfer is considered to be a secured borrowing, the assets remain on our consolidated balance sheets and the sale proceeds are recognized as a liability. The transfers of financial assets to funds managed by subsidiaries of our wholly-owned portfolio company, ACAM, have been treated as sales by us under ASC 860.
Stock-Based Compensation
We account for all share-based payments to employees under FASB ASC Topic 718, Compensation-Stock Compensation (“ASC 718”). We estimate the fair value of our employee stock awards at the date of grant using certain subjective assumptions, such as expected volatility, which is based on a combination of historical and market-based implied volatility, and the expected term of the awards which is based on our historical experience of employee stock option exercises. Our valuation assumptions used in estimating the fair value of share-based awards may change in future periods. We recognize the fair value of awards over the vesting period or the requisite service period only for those awards expected to vest using an estimated forfeiture rate. In addition, we calculate our pool of excess tax benefits available within capital in excess of par value on our consolidated balance sheets in accordance with the provisions ASC 718.
Note 3. | Investments |
The levels of fair value inputs used to measure our investments are characterized in accordance with the fair value hierarchy established by ASC 820. Where inputs for an asset or liability fall in more than one level in the fair value hierarchy, the investment is classified in its entirety based on the lowest level input that is significant to that investment’s fair value measurement. We use judgment and consider factors specific to the investment in determining the significance of an input to a fair value measurement. Our policy is to recognize transfers in and out of levels as of the beginning of each reporting period. The three levels of the fair value hierarchy and investments that fall into each of the levels are described below:
• | Level 1: Level 1 inputs are unadjusted quoted prices in active markets that are accessible at the measurement date for identical, unrestricted assets or liabilities. |
• | Level 2: Level 2 inputs are inputs, other than quoted prices included within Level 1, which are observable for the asset or liability, either directly or indirectly. |
• | Level 3: Level 3 inputs are unobservable and cannot be corroborated by observable market data. |
The following fair value hierarchy tables set forth our assets and liabilities that are measured at fair value on a recurring basis by level as of December 31, 2014 and 2013:
2014 | |||||||||||||||
Level 1 | Level 2 | Level 3 | Total | ||||||||||||
First Lien Senior Debt | $ | — | $ | 1,644 | $ | 870 | $ | 2,514 | |||||||
Second Lien Senior Debt | — | 340 | 347 | 687 | |||||||||||
Mezzanine Debt | — | — | 472 | 472 | |||||||||||
Preferred Equity | — | — | 462 | 462 | |||||||||||
Common Equity | — | — | 1,562 | 1,562 | |||||||||||
Structured Products | — | — | 583 | 583 | |||||||||||
Investments at Fair Value | — | 1,984 | 4,296 | 6,280 | |||||||||||
Other Assets | — | — | 51 | 51 | |||||||||||
Derivative Agreements | — | (10 | ) | (74 | ) | (84 | ) | ||||||||
Long Term Incentive Plan Liability | — | — | (82 | ) | (82 | ) | |||||||||
— | (10 | ) | (105 | ) | (115 | ) | |||||||||
Total | $ | — | $ | 1,974 | $ | 4,191 | $ | 6,165 | |||||||
2013 | |||||||||||||||
Level 1 | Level 2 | Level 3 | Total | ||||||||||||
First Lien Senior Debt | $ | — | $ | — | $ | 356 | $ | 356 | |||||||
Second Lien Senior Debt | 704 | 704 | |||||||||||||
Mezzanine Debt | — | — | 520 | 520 | |||||||||||
Preferred Equity | — | — | 1,125 | 1,125 | |||||||||||
Common Equity | — | — | 2,091 | 2,091 | |||||||||||
Structured Products | — | — | 276 | 276 | |||||||||||
Investments at Fair Value | — | — | 5,072 | 5,072 | |||||||||||
Derivative Agreements, Net | — | (9 | ) | — | (9 | ) | |||||||||
Total | $ | — | $ | (9 | ) | $ | 5,072 | $ | 5,063 | ||||||
98
AMERICAN CAPITAL, LTD.
NOTES TO CONSOLIDATED FINANCIAL STATEMENTS—(Continued)
(in millions, except per share data)
The following tables set forth the summary of changes in the fair value of investment assets and liabilities measured using Level 3 inputs for the years ended December 31, 2014 and 2013.
Senior Debt | Mezzanine Debt | Preferred Equity | Common Equity | Structured Products | Other Assets | Long Term Incentive Plan Liability | Derivative Agreement | Total | |||||||||||||||||||||||||||
Balances, January 1, 2014 | $ | 1,060 | $ | 520 | $ | 1,125 | $ | 2,091 | $ | 276 | $ | 29 | $ | — | $ | — | $ | 5,101 | |||||||||||||||||
Net realized (loss) gain(1) | (34 | ) | (4 | ) | 90 | 212 | (10 | ) | — | — | (45 | ) | 209 | ||||||||||||||||||||||
Reversal of prior period net depreciation (appreciation) on realization(2) | 48 | 8 | (104 | ) | (167 | ) | 14 | (2 | ) | — | — | (203 | ) | ||||||||||||||||||||||
Net unrealized (depreciation) appreciation(2)(3) | (57 | ) | (2 | ) | (35 | ) | 383 | 9 | (20 | ) | (7 | ) | (28 | ) | 243 | ||||||||||||||||||||
Purchases(4) | 519 | 24 | 65 | 370 | 471 | 59 | — | — | 1,508 | ||||||||||||||||||||||||||
Sales(5) | (35 | ) | (18 | ) | (841 | ) | (1,011 | ) | — | — | — | (1 | ) | (1,906 | ) | ||||||||||||||||||||
Settlements, net(6) | (398 | ) | (169 | ) | (63 | ) | 71 | (194 | ) | (15 | ) | — | — | (768 | ) | ||||||||||||||||||||
Transfers out of Level 3(7) | (129 | ) | — | — | — | — | — | — | — | (129 | ) | ||||||||||||||||||||||||
Impact of consolidation of European Capital(8) | 243 | 113 | 225 | (387 | ) | 17 | — | (75 | ) | — | 136 | ||||||||||||||||||||||||
Balances, December 31, 2014 | $ | 1,217 | $ | 472 | $ | 462 | $ | 1,562 | $ | 583 | $ | 51 | $ | (82 | ) | $ | (74 | ) | $ | 4,191 | |||||||||||||||
Senior Debt | Mezzanine Debt | Preferred Equity | Common Equity | Structured Products | Total | ||||||||||||||||||
Balances, January 1, 2013 | $ | 843 | $ | 1,114 | $ | 1,194 | $ | 1,867 | $ | 247 | $ | 5,265 | |||||||||||
Net realized gain (loss)(1) | 2 | (41 | ) | 33 | 5 | (101 | ) | (102 | ) | ||||||||||||||
Reversal of prior period net depreciation (appreciation) on realization(2) | 9 | 20 | (26 | ) | 2 | 100 | 105 | ||||||||||||||||
Net unrealized (depreciation) appreciation(2)(3) | (1 | ) | (68 | ) | (92 | ) | 197 | (40 | ) | (4 | ) | ||||||||||||
Purchases(4) | 584 | 81 | 138 | 239 | 96 | 1,138 | |||||||||||||||||
Sales(5) | (14 | ) | — | (163 | ) | (257 | ) | — | (434 | ) | |||||||||||||
Settlements, net(6) | (363 | ) | (586 | ) | 41 | 38 | (26 | ) | (896 | ) | |||||||||||||
Balances, December 31, 2013 | $ | 1,060 | $ | 520 | $ | 1,125 | $ | 2,091 | $ | 276 | $ | 5,072 | |||||||||||
(1) | Included in net realized gain (loss) gain in the consolidated statements of operations. Excludes gain (loss) on realized foreign currency transactions on American Capital other assets and liabilities that are denominated in a foreign currency and any tax benefit (provision). Also, excludes realized gain (loss) from other assets and liabilities not measured at fair value. |
(2) | Included in net unrealized appreciation in the consolidated statements of operations. |
(3) | Excludes unrealized appreciation (depreciation) related to foreign currency translation for American Capital other assets and liabilities not measured at fair value that are denominated in a foreign currency. |
(4) | Includes increases in the cost basis of investments resulting from new and add-on portfolio investments, the accrual or allowance of PIK interest or cumulative dividends and the amortization of discounts, premiums and closing fees. |
(5) | Includes the sale of equity investments, collection of cumulative dividends, loan syndications and loan sales. |
(6) | Includes principal repayments on debt investments, collection of PIK interest, collection of accreted loan discounts, the exchange of one or more existing securities for one or more new securities and net interest rate derivative periodic interest and termination payments. |
(7) | During the year ended December 31, 2014, certain of our senior debt investments were transferred out of Level 3 and into Level 2 of the fair value hierarchy due to existence of executable quotes on these investments. Our policy is to recognize transfers as of the first day of a reporting period for investments existing as of the end of the period. |
(8) | Effective October 1, 2014, European Capital’s financial results as of and for the three months ended December 31, 2014 have been consolidated with the financial results of American Capital for the same period. |
99
AMERICAN CAPITAL, LTD.
NOTES TO CONSOLIDATED FINANCIAL STATEMENTS—(Continued)
(in millions, except per share data)
Significant Unobservable Inputs
The following table summarizes the significant unobservable inputs in the fair value measurements of our Level 3 investments by category of investment and valuation technique as of December 31, 2014:
Range | ||||||||||||
Fair Value | Valuation Techniques | Unobservable Inputs | Minimum | Maximum | Weighted Average | |||||||
Enterprise Value Waterfall Methodology | ||||||||||||
Senior Debt | $ | 558 | Enterprise discounted cash flow | Discount rate | 10% | 53% | 16% | |||||
Terminal value growth rate | 2% | 5% | 4% | |||||||||
Public comparable companies | Premium or (discount) to multiples of comparable companies | (55)% | (30)% | (44)% | ||||||||
Control premium | —% | 21% | 15% | |||||||||
Sales of comparable companies | Premium or (discount) to multiples of comparable companies | (45)% | 5% | (36)% | ||||||||
Mezzanine Debt | $ | 308 | Enterprise discounted cash flow | Discount rate | 11% | 34% | 15% | |||||
Terminal value growth rate | 2% | 4% | 3% | |||||||||
Public comparable companies | Premium or (discount) to multiples of comparable companies | (55%) | —% | (38%) | ||||||||
Control premium | 7% | 21% | 13% | |||||||||
Sales of comparable companies | Premium or (discount) to multiples of comparable companies | (50%) | 5% | (12%) | ||||||||
Preferred Equity | $ | 459 | Enterprise discounted cash flow | Discount rate | 7% | 38% | 16% | |||||
Terminal value growth rate | 2% | 5% | 3% | |||||||||
Public comparable companies | Premium or (discount) to multiples of comparable companies | (55%) | 35% | (34%) | ||||||||
Control premium | 4% | 19% | 12% | |||||||||
Sales of comparable companies | Premium or (discount) to multiples of comparable companies | (50%) | 5% | (27%) | ||||||||
Common Equity | $ | 1,562 | Enterprise discounted cash flow | Discount rate | 4% | 53% | 14% | |||||
Terminal value growth rate | 2% | 5% | 3% | |||||||||
Public comparable companies | Premium or (discount) to multiples of comparable companies | (55%) | 35% | (23%) | ||||||||
Control premium | —% | 21% | 13% | |||||||||
Sales of comparable companies | Premium or (discount) to multiples of comparable companies | (50%) | 15% | (17%) | ||||||||
Long Term Incentive Plan Liability | $ | (82 | ) | Discounted cash flow | Discount rate | 11% | 11% | 11% | ||||
(Discount) due to lack of control and marketability | (30%) | (10%) | (30%) | |||||||||
Market Yield Valuation Methodology | ||||||||||||
Senior Debt | $ | 641 | Discounted cash flow | Market yield | 5% | 18% | 10% | |||||
Estimated remaining life | 0 yrs | 4 yrs | 4 yrs | |||||||||
Mezzanine Debt | $ | 164 | Discounted cash flow | Market yield | 13% | 22% | 15% | |||||
Estimated remaining life | 1 yr | 4 yrs | 2 yrs | |||||||||
Preferred Equity | $ | 3 | Discounted cash flow | Market yield | 16% | 27% | 23% | |||||
Estimated remaining life | 3 yrs | 4 yrs | 4 yrs | |||||||||
Structured Products | $ | 583 | Discounted cash flow | Discount rate | 5% | 57% | 13% | |||||
Constant prepayment rate | 30% | 35% | 31% | |||||||||
Constant default rate | —% | 2% | 1% | |||||||||
Third-Party Vendor Pricing Service | ||||||||||||
Senior Debt | $ | 18 | Vendor Quotes | Vendor Quotes | Vendor Quotes | |||||||
Black-Scholes Option Pricing Methodology | ||||||||||||
Derivative Agreement | $ | (74 | ) | Black-Scholes model | Volatility | 117% | 117% | 117% | ||||
Estimated remaining life | 0.3 yrs | 0.3 yrs | 0.3 yrs | |||||||||
$ | 4,140 | |||||||||||
100
AMERICAN CAPITAL, LTD.
NOTES TO CONSOLIDATED FINANCIAL STATEMENTS—(Continued)
(in millions, except per share data)
The following table summarizes the significant unobservable inputs in the fair value measurements of our Level 3 investments by category of investment and valuation technique as of December 31, 2013:
Range | ||||||||||||
Fair Value | Valuation Techniques | Unobservable Inputs | Minimum | Maximum | Weighted Average | |||||||
Enterprise Value Waterfall Methodology | ||||||||||||
Senior Debt | $ | 598 | Enterprise discounted cash flow | Discount rate | 10% | 38% | 15% | |||||
Terminal value growth rate | 2% | 4% | 3% | |||||||||
Public comparable companies | Premium or (discount) to multiples of comparable companies | (65%) | (35%) | (54%) | ||||||||
Control premium | —% | 23% | 16% | |||||||||
Sales of comparable companies | Premium or (discount) to multiples of comparable companies | (45%) | (35%) | (44%) | ||||||||
Mezzanine Debt | $ | 433 | Enterprise discounted cash flow | Discount rate | 12% | 30% | 16% | |||||
Terminal value growth rate | 3% | 4% | 3% | |||||||||
Public comparable companies | Premium or (discount) to multiples of comparable companies | (65%) | —% | (40%) | ||||||||
Control premium | 9% | 23% | 18% | |||||||||
Sales of comparable companies | Premium or (discount) to multiples of comparable companies | (45%) | 5% | (23%) | ||||||||
Preferred Equity | $ | 1,041 | Enterprise discounted cash flow | Discount rate | 12% | 65% | 15% | |||||
Terminal value growth rate | 2% | 8% | 3% | |||||||||
Public comparable companies | Premium or (discount) to multiples of comparable companies | (65%) | —% | (31%) | ||||||||
Control premium | 9% | 23% | 16% | |||||||||
Sales of comparable companies | Premium or (discount) to multiples of comparable companies | (45%) | 30% | (9%) | ||||||||
Common Equity | $ | 2,091 | Enterprise discounted cash flow | Discount rate | 9% | 37% | 17% | |||||
Terminal value growth rate | 2% | 8% | 3% | |||||||||
Public comparable companies | Premium or (discount) to multiples of comparable companies | (65%) | —% | (29%) | ||||||||
Control premium | —% | 29% | 7% | |||||||||
Sales of comparable companies | Premium or (discount) to multiples of comparable companies | (45%) | 30% | (22%) | ||||||||
Market Yield Valuation Methodology | ||||||||||||
Senior Debt | $ | 462 | Discounted cash flow | Market yield | 8% | 25% | 12% | |||||
Estimated remaining life | 0 yrs | 4 yrs | 3 yrs | |||||||||
Mezzanine Debt | $ | 87 | Discounted cash flow | Market yield | 18% | 20% | 18% | |||||
Estimated remaining life | 3 yrs | 4 yrs | 3 yrs | |||||||||
Preferred Equity | $ | 84 | Discounted cash flow | Market yield | 18% | 22% | 22% | |||||
Estimated remaining life | 1 yr | 4 yrs | 1 yr | |||||||||
Structured Products | $ | 276 | Discounted cash flow | Discount rate | 5% | 25% | 13% | |||||
Constant prepayment rate | 10% | 35% | 29% | |||||||||
Constant default rate | —% | 2% | 2% | |||||||||
$ | 5,072 | |||||||||||
101
AMERICAN CAPITAL, LTD.
NOTES TO CONSOLIDATED FINANCIAL STATEMENTS—(Continued)
(in millions, except per share data)
The following tables show the composition summaries of our investment portfolio at cost basis and fair value, excluding derivative agreements, as a percentage of total investments as of December 31, 2014 and 2013:
2014 | 2013 | ||||
Cost | |||||
First Lien Senior Debt | 40.5 | % | 7.0 | % | |
Second Lien Senior Debt | 11.2 | % | 12.9 | % | |
Mezzanine Debt | 10.0 | % | 10.6 | % | |
Preferred Equity | 13.4 | % | 24.5 | % | |
Common Equity | 15.0 | % | 38.6 | % | |
Structured Products | 9.9 | % | 6.4 | % | |
Total | 100.0 | % | 100.0 | % | |
Fair Value | |||||
First Lien Senior Debt | 40.0 | % | 7.0 | % | |
Second Lien Senior Debt | 10.9 | % | 13.9 | % | |
Mezzanine Debt | 7.5 | % | 10.3 | % | |
Preferred Equity | 7.4 | % | 22.2 | % | |
Common Equity | 24.9 | % | 41.2 | % | |
Structured Products | 9.3 | % | 5.4 | % | |
Total | 100.0 | % | 100.0 | % | |
102
AMERICAN CAPITAL, LTD.
NOTES TO CONSOLIDATED FINANCIAL STATEMENTS—(Continued)
(in millions, except per share data)
We use the Global Industry Classification Standards (“GICS®”) for classifying the industry groupings of our portfolio companies. The GICS® was developed by MSCI, an independent provider of global indexes and benchmark-related products and services, and Standard & Poor’s, an independent international financial data and investment services company and provider of global equity indexes. The following tables show the portfolio composition by industry grouping at cost and at fair value as a percentage of total investments as of December 31, 2014 and 2013. Our investments in CLO securities and derivative agreements are excluded from the table below. Our investments in CMBS are classified in the Real Estate and Real Estate Investment Trusts category.
2014 | 2013 | ||||
Cost | |||||
Life Sciences Tools and Services | 14.5 | % | 18.5 | % | |
Capital Markets | 8.3 | % | 9.0 | % | |
Commercial Services and Supplies | 6.4 | % | 3.9 | % | |
Health Care Equipment and Supplies | 4.0 | % | 3.0 | % | |
Diversified Consumer Services | 3.7 | % | 2.9 | % | |
Household Durables | 3.5 | % | 6.7 | % | |
Auto Components | 3.3 | % | 2.7 | % | |
Software | 3.2 | % | 0.8 | % | |
IT Services | 3.2 | % | 2.3 | % | |
Hotels, Restaurants and Leisure | 3.0 | % | 5.3 | % | |
Health Care Providers and Services | 2.9 | % | 3.4 | % | |
Professional Services | 2.8 | % | 3.1 | % | |
Real Estate and Real Estate Investment Trusts | 2.7 | % | 3.1 | % | |
Textiles, Apparel and Luxury Goods | 2.5 | % | 1.0 | % | |
Media | 2.4 | % | 1.2 | % | |
Food Products | 2.2 | % | 1.7 | % | |
Oil, Gas and Consumable Fuels | 2.0 | % | 2.1 | % | |
Machinery | 1.8 | % | — | % | |
Aerospace and Defense | 1.7 | % | 1.0 | % | |
Diversified Financial Services | 1.7 | % | 2.8 | % | |
Insurance | 1.7 | % | 0.1 | % | |
Energy Equipment and Services | 1.6 | % | 1.5 | % | |
Specialty Retail | 1.5 | % | — | % | |
Internet and Catalog Retail | 1.3 | % | 3.0 | % | |
Pharmaceuticals | 0.8 | % | 4.2 | % | |
Technology Hardware, Storage and Peripherals | 0.6 | % | 3.5 | % | |
Electrical Equipment | 0.6 | % | 2.4 | % | |
Construction and Engineering | 0.3 | % | 4.2 | % | |
Other | 15.8 | % | 6.6 | % | |
Total | 100.0 | % | 100.0 | % | |
103
AMERICAN CAPITAL, LTD.
NOTES TO CONSOLIDATED FINANCIAL STATEMENTS—(Continued)
(in millions, except per share data)
2014 | 2013 | ||||
Fair Value | |||||
Capital Markets | 21.3 | % | 22.3 | % | |
Life Sciences Tools and Services | 9.2 | % | 12.8 | % | |
Commercial Services and Supplies | 5.8 | % | 3.6 | % | |
Diversified Consumer Services | 3.8 | % | 2.0 | % | |
Household Durables | 3.3 | % | 0.8 | % | |
Hotels, Restaurants and Leisure | 3.2 | % | 5.5 | % | |
Software | 3.0 | % | 1.2 | % | |
Professional Services | 2.9 | % | 3.1 | % | |
IT Services | 2.9 | % | 1.7 | % | |
Health Care Providers and Services | 2.9 | % | 5.7 | % | |
Health Care Equipment and Supplies | 2.7 | % | 3.8 | % | |
Media | 2.5 | % | 1.3 | % | |
Auto Components | 2.3 | % | 1.3 | % | |
Textiles, Apparel and Luxury Goods | 2.1 | % | 1.0 | % | |
Real Estate and Real Estate Investment Trusts | 2.1 | % | 2.0 | % | |
Food Products | 2.0 | % | 1.7 | % | |
Internet and Catalog Retail | 1.9 | % | 2.9 | % | |
Aerospace and Defense | 1.7 | % | 1.0 | % | |
Insurance | 1.7 | % | 0.1 | % | |
Oil, Gas and Consumable Fuels | 1.6 | % | 1.6 | % | |
Energy Equipment and Services | 1.3 | % | 1.5 | % | |
Diversified Financial Services | 1.1 | % | 1.8 | % | |
Pharmaceuticals | 0.8 | % | 5.6 | % | |
Technology Hardware, Storage and Peripherals | 0.6 | % | 2.1 | % | |
Electrical Equipment | 0.4 | % | 4.4 | % | |
Construction and Engineering | 0.3 | % | 4.8 | % | |
Electronic Equipment, Instruments and Components | 0.3 | % | 1.7 | % | |
Other | 16.3 | % | 2.7 | % | |
Total | 100.0 | % | 100.0 | % | |
Note 4. | Borrowings |
Our debt obligations consisted of the following as of December 31, 2014 and 2013:
2014 | 2013 | ||||||
Secured revolving credit facility due August 2016, $250 million commitment | $ | — | $ | — | |||
Secured revolving credit facility due June 2016, $750 million commitment | 726 | — | |||||
Secured revolving credit facility due October 2016, $500 million commitment | 51 | — | |||||
Secured term loan due August 2017, net of discount | 444 | 449 | |||||
Unsecured Private Notes due September 2018, net of discount | 344 | 342 | |||||
European Capital unsecured senior notes, Series 2006-I due January 2022, €52 million | 64 | — | |||||
European Capital unsecured senior notes, Series 2007-I due July 2022, $37.5 million | 37 | — | |||||
European Capital unsecured senior notes, Series 2007-II due July 2022, $37.5 million | 37 | — | |||||
Total | $ | 1,703 | $ | 791 | |||
The daily weighted average debt balance, excluding discounts, for the years ended December 31, 2014 and 2013 was $1,091 million and $694 million, respectively. The weighted average interest rate on all of our borrowings, including amortization of
104
AMERICAN CAPITAL, LTD.
NOTES TO CONSOLIDATED FINANCIAL STATEMENTS—(Continued)
(in millions, except per share data)
deferred financing costs, for the years ended December 31, 2014 and 2013 was 4.9% and 6.4%, respectively. The weighted average interest rate on all of our borrowings, excluding amortization of deferred financing costs, for the years ended December 31, 2014 and 2013 was 4.3% and 5.3%, respectively. The weighted average interest rate on all of our borrowings, excluding deferred financing costs, as of December 31, 2014 was 3.3%.
As of December 31, 2014 and 2013, the aggregate fair value of the above borrowings was $1,729 million and $817 million, respectively. The fair values of our debt obligations are determined in accordance with ASC 820, which defines fair value in terms of the price that would be paid to transfer a liability in an orderly transaction between market participants at the measurement date under current market conditions, and are measured using Level 3 inputs for our debt as of December 31, 2014 and 2013. It assumes that the liability is transferred to a market participant at the measurement date and that the nonperformance risk relating to that liability is the same before and after the transfer. Nonperformance risk refers to the risk that the obligation will not be fulfilled and affects the value at which the liability is transferred. The fair value of our debt obligations is valued at the closing market quotes as of the measurement date or estimated based upon market interest rates for our own borrowings or entities with similar credit risk, adjusted for nonperformance risk, if any, based on a quantitative and/or qualitative evaluation of our credit risk.
Unsecured Private Notes
On September 20, 2013, we entered into an indenture with U.S. Bank National Association, as trustee, relating to the issuance and sale by us of $350 million in aggregate principal amount of senior unsecured five-year notes (“Unsecured Private Notes”), for proceeds of $342 million, net of underwriters’ discounts. The Private Notes were sold in a private offering to qualified institutional buyers under Rule 144A and outside of the United States pursuant to Regulation S of the Securities Act of 1933, as amended. The Private Notes have a fixed interest rate of 6.50% and mature in September 2018. Interest payments are due semi-annually on March 15 and September 15 and all principal is due on maturity. The Private Notes were rated B3, B+ and BB- by Moody’s Investor Services, Standard & Poor’s Ratings Services and Fitch Ratings, respectively. The indenture contains restrictive covenants that, among other things, limit our ability to: (i) pay dividends or distributions, repurchase equity, prepay junior debt and make certain investments; (ii) incur additional debt and issue certain disqualified stock and preferred stock; (iii) incur certain liens; (iv) merge or consolidate with another company or sell substantially all of our assets; (v) enter into certain transactions with affiliates; and (vi) allow to exist certain restrictions on the ability of our subsidiaries to pay dividends or make other payments to us. The indenture also contains certain customary events of default. As of December 31, 2014, we were in compliance with all of the covenants under the Private Notes.
European Capital Unsecured Senior Notes
In December 2006, European Capital entered into a note purchase agreement to issue €52 million of senior unsecured 15-year notes due January 2022 to accredited investors in a private placement offering (“Series 2006-I Notes”). The Series 2006-I Notes have a floating rate of EURIBOR plus 2.75%. European Capital entered into a note purchase agreement to issue $37.5 million of senior unsecured notes due July 2022 to accredited investors in a private placement offering (“Series 2007-I Notes”). The Series 2007-I Notes have a floating rate of LIBOR plus 2.75%. In March 2007, European Capital entered into a note purchase agreement to issue $37.5 million of senior unsecured notes due July 2022 to accredited investors in a private placement offering (“Series 2007-II Notes”). The Series 2007-II Notes have a floating rate of LIBOR plus 2.75%. As of December 31, 2014, the interest rate on the Series 2006-I Notes, Series 2007-I Notes and Series 2007-II Notes was 2.84%, 2.98% and 2.98%, respectively.
The above unsecured senior notes contain covenants that, among other things, require that European Capital maintain a minimum consolidated tangible net worth of €225 million, plus 50% of any equity issued by European Capital after the issuance of the applicable notes, require the interest charge cover meet a minimum threshold depending on the ratio of earnings before interest and taxes to interest expense and a maximum debt to equity ratio of 4:1. The unsecured senior notes also contain cross-default provisions to debt of European Capital of $15 million or more. As of December 31, 2014, European Capital was in compliance with all covenants for these notes.
Secured Term Loan Facility
On February 26, 2014, we entered into an amendment (the “Amendment”) to the amended secured term loan facility under our Senior Secured Term Loan Credit Agreement, dated as of August 23, 2013, with the lenders party thereto and JPMorgan Chase Bank, N.A., as Administrative Agent (the “Secured Term Loan Facility”).
The Amendment reduced the interest rate on the Secured Term Loan Facility, which had an outstanding principal balance of $450 million as of the closing date, from the London Interbank Offered Rate (“LIBOR”) plus 3.00%, with a LIBOR floor of 1.00%, to LIBOR plus 2.75%, with a LIBOR floor of 0.75%. The Amendment also extended the Secured Term Loan Facility’s maturity date by one year to August 2017. We may prepay the loans under the Secured Term Loan Facility in full or in part without
105
AMERICAN CAPITAL, LTD.
NOTES TO CONSOLIDATED FINANCIAL STATEMENTS—(Continued)
(in millions, except per share data)
penalty at our option except in the event that the facility is refinanced at a lower rate, in full or in part, prior to February 23, 2015, in which case the prepayment shall be made for an amount equal to 101% of the principal prepaid plus accrued interest.
In accordance with FASB ASC Subtopic No. 470-50, Modifications and Extinguishments, $447 million of debt exchanged with the same lenders met the criterion for and was accounted as a modification of debt. Existing unamortized deferred financing costs and discount attributable to the modification of the Secured Term Loan Facility of $9 million will be amortized into interest expense over the life of the Secured Term Loan Facility using the effective interest method, while fees paid to other third party advisors of $1 million were expensed and included in general and administrative expenses in the consolidated statements of operations.
As of December 31, 2014, the interest rate on our Secured Term Loan Facility was 3.50% and the borrowing base coverage was 297%. As of December 31, 2014, we were in compliance with all of the covenants under the Secured Term Loan Facility.
The following table sets forth the scheduled amortization on the secured term loans, unsecured private notes and unsecured senior notes:
August 2015 | $4.5 million |
August 2016 | $4.5 million |
Secured Term Loans due August 2017 | Outstanding Balance |
Unsecured Private Notes due September 2018 | Outstanding Balance |
Unsecured senior notes (Series 2006-I) due January 2022 | Outstanding Balance |
Unsecured senior notes (Series 2007-I) due July 2022 | Outstanding Balance |
Unsecured senior notes (Series 2007-II) due July 2022 | Outstanding Balance |
$250 Million Revolving Credit Facility
On August 22, 2012, we obtained a four-year $250 million secured revolving credit facility (the “$250 Million Revolving Credit Facility”), which may be expanded to a maximum $375 million through additional commitments in accordance with the terms and conditions of the $250 Million Revolving Credit Facility and Secured Term Loan Facility. The $250 Million Revolving Credit Facility bears interest at a rate per annum equal to LIBOR plus 3.75%.
We may borrow, prepay and reborrow loans under the $250 Million Revolving Credit Facility at any time prior to August 22, 2015, the commitment termination date, subject to certain terms and conditions, including maintaining a borrowing base coverage of 150%, or 110% so long as our borrowing base coverage does not decrease following an advance. The $250 Million Revolving Credit Facility matures on August 22, 2016. Any outstanding balance on the $250 Million Revolving Credit Facility as of the commitment termination date is repayable ratably over the final 12 months until the maturity date.
We are required to pay a fee in an amount equal to 0.50% on the average daily unused amount of the lender commitments under our $250 Million Revolving Credit Facility from the closing date to but excluding the earlier of the date on which a lender’s commitment terminates and the commitment termination date, payable quarterly. As of December 31, 2014, the total commitments under our $250 Million Revolving Credit Facility were $250 million.
As of December 31, 2014, we were in compliance with all of the covenants under the $250 Million Revolving Credit Facility.
$750 Million Revolving Credit Facility
On June 27, 2014, ACAS Funding I, LLC, a wholly-owned financing subsidiary, obtained a $750 million secured revolving credit facility (the “$750 Million Revolving Credit Facility”), provided by Bank of America, N.A. The $750 Million Revolving Credit Facility, which matures in June 2016, bears interest at a rate per annum equal to LIBOR plus 1.60%. As of December 31, 2014, the interest rate on the $750 Million Revolving Credit Facility was 1.73%.
We may borrow, prepay and reborrow loans under the $750 Million Revolving Credit Facility at any time prior to May 27, 2016, the commitment termination date, subject to certain terms and conditions. Any outstanding balance on the $750 Million Revolving Credit Facility as of the commitment termination date is repayable on the maturity date.
Beginning on September 27, 2014, we are required to pay a fee in an amount equal to 1.60% on the average daily unused amount of the lender commitments up to $375 million and 0.75% on undrawn amounts above $375 million, payable quarterly. As of December 31, 2014, the total debt outstanding under our $750 Million Revolving Credit Facility was $726 million, which was secured by portfolio investments with fair values of $1,054 million.
106
AMERICAN CAPITAL, LTD.
NOTES TO CONSOLIDATED FINANCIAL STATEMENTS—(Continued)
(in millions, except per share data)
As of December 31, 2014, we were in compliance with all of the covenants under the $750 Million Revolving Credit Facility.
$500 Million Revolving Credit Facility
On October 30, 2014, ACAS Funding II, LLC, a wholly-owned financing subsidiary, obtained a $500 million secured revolving credit facility (the “$500 Million Revolving Credit Facility”), provided by Deutsche Bank AG. The $500 Million Revolving Credit Facility, which matures in October 2016, bears interest at a rate per annum equal to LIBOR plus 1.60%. As of December 31, 2014, the interest rate on the $500 Million Revolving Credit Facility was 1.86%
We may borrow, prepay and reborrow loans under the $500 Million Revolving Credit Facility at any time prior to October 30, 2016, the commitment termination date, subject to certain terms and conditions. Any outstanding balance on the $500 Million Revolving Credit Facility as of the commitment termination date is repayable on the maturity date.
We are required to pay an annual fee in an amount equal to 0.15% on the $500 Million Revolving Credit Facility. As of December 31, 2014, the total debt outstanding under our $500 Million Revolving Credit Facility was $51 million, which was secured by portfolio investments with fair values of $315 million.
As of December 31, 2014, we were in compliance with all of the covenants under the $500 Million Revolving Credit Facility.
Future Debt Maturities
The maturities of our debt obligations, excluding discounts, as of December 31, 2014 were as follows:
2015 | $ | 4.5 | |
2016 | 781.2 | ||
2017 | 436.5 | ||
Thereafter | 480.8 | ||
Total | $ | 1,703.0 | |
Note 5. | Stock Options |
We have stock option plans which provide for the granting of options to employees and non-employee directors to purchase shares of common stock at a price of not less than the fair market value of the common stock on the date of grant. Stock options granted under the employee stock option plans vest over either a three or five year period and may be exercised for a period of no more than ten years from the date of grant. Options granted under these plans may be either incentive stock options within the meaning of Section 422 of the Code or non-qualified stock options. As required by the 1940 Act, we are restricted from issuing awards to our employees and non-employee directors to the extent that the amount of voting securities that would result from the exercise of all such awards at the time of issuance exceeds 20% of our outstanding voting securities. As of December 31, 2014, there were 3.7 million shares available to be granted under the employee stock option plans and in accordance with the 1940 Act restrictions.
Our shareholders approved non-employee director stock option plans in 1998, 2000, 2006, 2007, 2008, 2009 and 2010 and we subsequently received orders from the SEC authorizing such plans. Stock options granted under the non-employee director stock option plans are non-qualified stock options that vest over a three year period and may be exercised for a period of no more than ten years from the date of grant. As of December 31, 2014, there were no shares available to be granted under the non-employee director stock option plans.
During the first quarter of 2014, we concluded that our Chief Executive Officer had been granted stock options in excess of the individual employee limits established in certain of our stock option plans. These stock option grants were made during fiscal years 2010, 2011 and 2012. As a result, the stock option grants in excess of the individual limits in any stock option plan have been considered null and void. Therefore, stock based-compensation expense associated with the null and void options of $3.5 million was reversed during the first quarter of 2014.
In addition, the communication of the voided stock option grants to our Chief Executive Officer resulted in a financial obligation under U.S. GAAP to provide equity compensation commensurate with the terms of the voided stock option grants in return for services to be performed by our Chief Executive Officer during the option vesting periods. This financial obligation has been accounted for as a liability award and stock-based compensation expense of $4.2 million associated with prior periods was recorded during the second quarter of 2014. The net impact of these adjustments was additional stock-based compensation expense of $2.3 million during the first quarter of 2014. An additional $1.4 million of income tax expense was recorded during the first
107
AMERICAN CAPITAL, LTD.
NOTES TO CONSOLIDATED FINANCIAL STATEMENTS—(Continued)
(in millions, except per share data)
quarter of 2014 as a result of these adjustments. These errors were immaterial to the individual prior periods impacted. During the second quarter of 2014, a cash bonus award of $10 million was granted to our Chief Executive Officer that partially settled this financial obligation. As of December 31, 2014, the fair value of this financial obligation was $4.2 million.
In conjunction with the American Capital Equity III, LP transaction, certain investment professionals were transferred to a wholly-owned subsidiary of ACAM, our wholly-owned portfolio company which manages American Capital Equity III, LP. Concurrent with this transfer, the vesting of any unvested stock options held by these investment professionals as of the date of the transfer was accelerated. In accordance with ASC 718, the acceleration of the unvested stock options was accounted for as a modification and resulted in additional stock-based compensation expense of approximately $5 million during the third quarter of 2014.
As discussed in Note 9, due to changes in the composition of our investment portfolio and market conditions, we conducted strategic reviews of our business in the fourth quarter of 2014, which resulted in a workforce reduction of approximately 13% of our employees and the closing of one of our offices as well as the elimination of certain functions at other offices. In conjunction with the restructuring, the vesting of any unvested stock options held by impacted employees as of the date of their separation was accelerated, and the employees were given a period of up to one year from their separation date, or less if the expiration of the option was within one year from their separation date, to exercise all outstanding options. In accordance with ASC 718, the acceleration of the 2.4 million unvested stock options was accounted for as a modification and resulted in additional stock-based compensation expense of approximately $11 million during the fourth quarter of 2014.
Fair Value Disclosures
The following table reflects the weighted average fair value per employee stock option granted during the years ended December 31, 2014, 2013 and 2012, as well as the weighted average assumptions used in determining those fair values using a Black-Scholes option pricing model.
2014 | 2013 | 2012 | ||||||
Options granted (in millions) | 0.1 | 3.7 | 8.8 | |||||
Weighted average fair value per option on grant date | $6.89 | $5.88 | $4.97 | |||||
Expected dividend yield | — | % | — | % | — | % | ||
Expected volatility | 42 | % | 41 | % | 56 | % | ||
Risk-free interest rate | 2.1 | % | 1.2 | % | 1.2 | % | ||
Expected life (years) | 6.8 | 6.7 | 6.6 | |||||
Stock Option Activity
A summary of the activity of our stock option plans as of and for the year ended December 31, 2014 is as follows:
Shares | Weighted Average Exercise Price | |||||
Options outstanding, beginning of year | 54.1 | $ | 9.13 | |||
Granted | 0.1 | $ | 15.03 | |||
Exercised | (5.3) | $ | 7.07 | |||
Voided | (2.4) | $ | 9.65 | |||
Canceled and expired | (1.4) | $ | 13.63 | |||
Options outstanding, end of year | 45.1 | $ | 9.21 | |||
Options exercisable, end of year | 30.9 | $ | 9.17 | |||
108
AMERICAN CAPITAL, LTD.
NOTES TO CONSOLIDATED FINANCIAL STATEMENTS—(Continued)
(in millions, except per share data)
The following table summarizes information about our stock options outstanding as of December 31, 2014:
Options Outstanding | Options Exercisable | |||||||||||||||
Range of Exercise Prices | Outstanding | Weighted Average Remaining Contractual life | Weighted Average Exercise Price | Exercisable | Weighted Average Remaining Contractual life | Weighted Average Exercise Price | ||||||||||
$0.94 to $5.00 | 5.7 | 4.2 | $ | 3.91 | 5.7 | 4.2 | $ | 3.91 | ||||||||
$5.01 to $10.00 | 23.4 | 5.9 | $ | 7.38 | 14.8 | 5.6 | $ | 7.15 | ||||||||
$10.01 to $15.00 | 11.8 | 6.5 | $ | 11.14 | 6.2 | 5.9 | $ | 10.77 | ||||||||
$15.01 to $20.00 | 3.4 | 3.5 | $ | 16.69 | 3.4 | 3.5 | $ | 16.71 | ||||||||
$20.01 to $47.90 | 0.8 | 2.1 | $ | 38.77 | 0.8 | 2.1 | $ | 38.77 | ||||||||
45.1 | 5.6 | $ | 9.21 | 30.9 | 5.1 | $ | 9.17 | |||||||||
As of December 31, 2014, the total compensation cost related to non-vested stock options not yet recognized was $30 million with a weighted average period to be recognized of 2.1 years. As of December 31, 2014, the intrinsic value for stock options outstanding and exercisable was $271 million and $201 million, respectively.
For the years ended December 31, 2014, 2013 and 2012, we recorded stock-based compensation expense attributable to our stock options of $44 million, $30 million and $31 million, respectively. Stock-based compensation expense was recognized only for options expected to vest, using an estimated forfeiture rate based on historical experience. For the years ended December 31, 2014, 2013 and 2012, the intrinsic value of stock options exercised were $44 million, $41 million and $55 million, respectively.
Note 6. | Deferred Compensation Plan |
We have a non-qualified deferred compensation plan (the “Deferred Plan”) for the purpose of granting cash bonus awards to our employees. The Compensation, Corporate Governance and Nominating Committee is the administrator of the Deferred Plan. The Deferred Plan is funded through a trust (the “Trust”) which is administered by a third-party trustee. The Compensation, Corporate Governance and Nominating Committee determines cash bonus awards to be granted under the Deferred Plan and the terms of such awards, including vesting schedules. The cash bonus awards are invested by the Trust in our common stock by purchasing shares in the open market. Awards vest contingent on the employee’s continued employment or the achievement of performance goals, if any, as determined by the Compensation, Corporate Governance and Nominating Committee. The Trust provides certain protections of its assets from events other than claims against our assets in the case of bankruptcy. The assets and liabilities of the Trust are consolidated in the accompanying consolidated financial statements. Shares of our common stock held by the Trust are accounted for as treasury stock in the accompanying consolidated balance sheets.
The Deferred Plan does not permit diversification and the cash bonus awards must be settled by the delivery of a fixed number of shares of our common stock. The awards under the Deferred Plan are accounted for as grants of unvested stock. We record stock-based compensation expense based on the fair market value of our stock on the date of grant. The compensation cost for awards with service conditions is recognized using the straight-line attribution method over the requisite service period. The compensation cost for bonus awards with performance and service conditions is recognized using the accelerated attribution method over the requisite service period. During the years ended December 31, 2014 and 2013, cash bonus awards of $10 million and $1.5 million, respectively, were granted under the Deferred Plan. During the year ended December 31, 2012, there were no grants under the Deferred Plan.
During the first quarter of 2014, we concluded that our Chief Executive Officer had been granted $2.6 million of cash bonus awards in fiscal year 2007 in excess of the annual individual employee limit established in the Deferred Plan. As a result, the $2.6 million of cash bonus awards have been considered null and void. Stock-based compensation expense associated with the null and void cash bonus awards of $2.6 million was reversed in the first quarter of 2014.
In addition, the communication of the $2.6 million of excess cash bonus awards to our Chief Executive Officer resulted in a financial obligation under U.S. GAAP to provide equity compensation commensurate with the terms of the cash bonus awards in return for services to be performed by our Chief Executive Officer during the award vesting period. This financial obligation has been accounted for as a liability award and stock-based compensation expense of $1.5 million associated with prior periods was recorded in the second quarter of 2014. The net impact of these adjustments was a $1.1 million reduction to stock-based compensation expense in the first quarter of 2014. An additional $0.3 million of income tax expense was recorded during the first quarter as a result of these adjustments. These errors were immaterial to the individual prior periods impacted. During the second
quarter of 2014, a cash bonus award of $10 million was granted to our Chief Executive Officer that partially settled this financial obligation. As of December 31, 2014, the fair value of this financial obligation was $1.5 million.
During the years ended December 31, 2014, 2013 and 2012, we recorded stock-based compensation expense of $5 million, $2 million and $13 million, respectively, attributable to the Deferred Plan. As of December 31, 2014, the total compensation cost related to non-vested cash bonus awards not yet recognized was $6 million with a weighted average period to be recognized of 3.3 years.
A summary of the bonus awards under the Deferred Plan as of and for the year ended December 31, 2014 is as follows:
Shares | Weighted Average Grant Date Fair Value | |||
Non-vested, beginning of year | 0.3 | $6.85 | ||
Granted | 0.7 | $14.95 | ||
Vested | (0.5 | ) | $10.12 | |
Canceled | 0.0 | $2.93 | ||
Non-vested, end of year | 0.5 | $14.84 | ||
As of December 31, 2014, there were 2.9 million shares of our common stock in the Trust that were vested but not yet distributed to the employees.
Long Term Incentive Plan Liability
European Capital has issued restricted mandatorily redeemable preferred shares (“Redeemable Preferred Shares”) to participating employees of subsidiary companies of its manager, European Capital Asset Management Limited (“ECAM”), a wholly owned subsidiary of ACAM, under Long-Term Incentive Plans (the “Plans” ) for an issue price determined at the time of issuance. The Plans have a 5-year vesting period. The Redeemable Preferred Shares are subdivided into subclasses of shares. The redemption value of each sub-class of Redeemable Preferred Shares is calculated using a predetermined formula and is based on the net liquidity proceeds, as defined in the Plans, on the exit of specifically referenced investments of European Capital in excess of certain hurdle rates. The Plans have annual calculation and redemption dates through December 31, 2018 and March 1, 2019, respectively, for sub-classes A, B and C and December 31, 2023 and March 1, 2024, respectively, for sub-classes D, E and F. Redeemable Preferred Shares related to specifically referenced investments not exited at the final annual calculation dates will be redeemed after the receipt of subsequent net liquidity proceeds or, if specifically referenced investments that remain outstanding on January 1, 2020 for sub-classes A, B and C and January 1, 2025 for sub-classes D, E and F, will be redeemed based on the realizable value of the remaining referenced investments. European Capital elected to recognize the Redeemable Preferred Shares at fair value in accordance with FASB ASC Topic 825, Financial Instruments.
The holders of the Redeemable Preferred Shares have no rights to participate or receive notice of any general meeting of European Capital and the shares are generally not transferable. The Redeemable Preferred Shares have no rights to receive dividends, and on the dissolution of European Capital, holders of the Redeemable Preferred Shares only receive the amounts originally paid for their shares. During the quarter ended December 31, 2014, European Capital did not issue or redeem any Redeemable Preferred Shares.
The fair value of the Redeemable Preferred Shares is calculated as of December 31, 2014 using the net present value of the estimated future cash flows of the underlying European Capital investments with discounts applied for equity risk, liquidity risk, credit risk, minority interests, lack of marketability and a forfeiture rate. The fair value of the Redeemable Preferred Shares included in our consolidated balance sheets as of December 31, 2014 was $82 million. The fair value of the underlying European Capital investments as of December 31, 2014 was $608 million. As of December 31, 2014, the redemption amount for 2015 is expected to be approximately $52 million.
109
AMERICAN CAPITAL, LTD.
NOTES TO CONSOLIDATED FINANCIAL STATEMENTS—(Continued)
(in millions, except per share data)
Note 7. | Net Operating Income and Net Earnings Per Common Share |
The following table sets forth the computation of basic and diluted net operating income and net earnings per common share for the years ended December 31, 2014, 2013 and 2012:
2014 | 2013 | 2012 | |||||||||
Numerator for basic and diluted net operating income per common share | $ | 117 | $ | 156 | $ | 397 | |||||
Numerator for basic and diluted net earnings per common share | $ | 434 | $ | 184 | $ | 1,136 | |||||
Denominator for basic weighted average common shares | 268.2 | 291.6 | 320.3 | ||||||||
Employee stock options and awards | 12.5 | 12.3 | 10.0 | ||||||||
Denominator for diluted weighted average common shares | 280.7 | 303.9 | 330.3 | ||||||||
Basic net operating income per common share | $ | 0.44 | $ | 0.53 | $ | 1.24 | |||||
Diluted net operating income per common share | $ | 0.42 | $ | 0.51 | $ | 1.20 | |||||
Basic net earnings per common share | $ | 1.62 | $ | 0.63 | $ | 3.55 | |||||
Diluted net earnings per common share | $ | 1.55 | $ | 0.61 | $ | 3.44 | |||||
In accordance with the provisions of FASB ASC Topic 260, Earnings per Share, basic earnings per share (“EPS”) is computed by dividing earnings available to common shareholders by the weighted average number of shares outstanding during the period. Other potentially dilutive common shares, and the related impact to earnings, are considered when calculating EPS on a diluted basis.
In computing diluted EPS, only potential common shares that are dilutive, those that reduce earnings per share or increase loss per share, are included. The effect of stock options, unvested employee stock awards and contingently issuable shares are not included if the result would be anti-dilutive, such as when a net loss is reported.
Stock options and unvested shares under our deferred compensation plan of 7.6 million, 8.6 million and 26.9 million for the years ended December 31, 2014, 2013 and 2012, respectively, were not included in the computation of diluted EPS either because the respective exercise or grant prices are greater than the average market value of the underlying stock or their inclusion would have been anti-dilutive, as determined using the treasury stock method.
Note 8. | Geographic Data |
The following table presents total operating revenue and total assets as of and for the years ended December 31, 2014, 2013 and 2012 by geographic location, excluding Structured Products. The geographic location of a portfolio company investment is determined by the location of the corporate headquarters of the portfolio company.
2014 | 2013 | 2012 | ||||||||||
Operating revenue | ||||||||||||
United States | $ | 392 | $ | 400 | $ | 564 | ||||||
International | 14 | 15 | 15 | |||||||||
Total operating revenue | $ | 406 | $ | 415 | $ | 579 | ||||||
Total assets | ||||||||||||
United States | $ | 6,311 | $ | 4,834 | $ | 5,133 | ||||||
International | 746 | 899 | 939 | |||||||||
Total assets | $ | 7,057 | $ | 5,733 | $ | 6,072 | ||||||
Note 9. | Restructuring Costs |
Due to changes in the composition of our investment portfolio and market conditions, we conducted strategic reviews of our business in the fourth quarter of 2014, which resulted in a workforce reduction of approximately 13% of our employees and the closing of one of our offices as well as the elimination of certain functions at other offices. In conjunction with the restructuring, the vesting of any unvested stock options held by impacted employees as of the date of their separation was accelerated, and they were given a period of up to one year from their separation date, or less if the expiration of the option was within one year from
110
AMERICAN CAPITAL, LTD.
NOTES TO CONSOLIDATED FINANCIAL STATEMENTS—(Continued)
(in millions, except per share data)
their separation date, to exercise all outstanding options. We have recorded charges for both severance and related employee costs and excess office facilities costs of $24 million for the year ended December 31, 2014, including $11 million from the modification of stock options. The severance and related costs and the additional stock-based compensation expense resulting from the modification are included in salaries, benefits and stock-based compensation and the excess facilities costs are included in general and administrative in our consolidated statements of operations. The liability for employee severance costs and excess facilities is included in other liabilities in our consolidated balance sheets as of December 31, 2014.
In determining our liability related to excess office facilities, we are required to estimate such factors as future vacancy rates, the time required to sublet properties and sublease rates. These estimates are reviewed quarterly based on known real estate market conditions and the credit-worthiness of subtenants, and may result in revisions to the liability. Our liability of $9 million as of December 31, 2014 related to excess office facilities represents gross lease commitments with agreements expiring at various dates through 2023 of approximately $36 million, net of committed and estimated sublease income of approximately $25 million and a present value factor of $2 million. We have entered into signed sublease arrangements for approximately $4 million, with the remaining $21 million based on estimated future sublease income.
Note 10. | Shareholders’ Equity |
Our common stock activity for the years ended December 31, 2014, 2013 and 2012 was as follows:
2014 | 2013 | 2012 | ||||||
Common stock outstanding at beginning of period | 270.2 | 304.4 | 329.1 | |||||
Issuance of common stock under stock option plans | 5.3 | 5.1 | 8.4 | |||||
Repurchase of common stock | (8.9 | ) | (40.4 | ) | (34.8 | ) | ||
Distribution of common stock held in deferred compensation trust | 0.3 | 1.1 | 1.7 | |||||
Common stock outstanding at end of period | 266.9 | 270.2 | 304.4 | |||||
Stock Repurchase and Dividend Program
During 2011, our Board of Directors adopted a program that may provide for stock repurchases or dividend payments (“Stock Repurchase and Dividend Program”). Under the Stock Repurchase and Dividend Program, we may consider quarterly setting an amount to be utilized for stock repurchases or dividends. Generally, the amount may be utilized for repurchases if the price of our common stock represents a discount to the NAV of our shares, and the amount may be utilized for the payment of cash dividends if the price of our common stock represents a premium to the NAV of our shares. In determining the quarterly amount for repurchases or dividends, our Board of Directors may be guided by our cumulative net cash provided by operating activities in the prior quarter and since the beginning of 2012, cumulative repurchases or dividends, cash on hand, debt service considerations, investment plans, forecasts of financial liquidity and economic conditions, operational issues and the then current trading price of our stock. During the year ended December 31, 2014, we repurchased a total of 8.9 million shares of our common stock in the open market for $137 million at an average price of $15.38 per share. During the year ended December 31, 2013, we repurchased a total of 40.4 million shares of our common stock in the open market for $561 million at an average price of $13.90 per share. During the year ended December 31, 2012, we repurchased a total of 34.8 million shares of our common stock in the open market for $362 million at an average price of $10.39 per share.
The Stock Repurchase and Dividend Program may be suspended, terminated or modified at any time for any reason. The program does not obligate us to acquire any specific number of shares, and all repurchases will be made in accordance with Rule 10b-18, which sets certain restrictions on the method, timing, price and volume of stock repurchases. In March 2014, our Board of Directors suspended the Stock Repurchase Program and Dividend Program for an indefinite period.
Note 11. | Income Taxes |
As a taxable corporation under Subchapter C of the Code, we are subject to federal and applicable state corporate income taxes on our taxable ordinary income and capital gains. However, we estimate that for income tax purposes, we had net operating loss carryforwards as of December 31, 2014. Our tax fiscal year ends on September 30.
We file a consolidated federal income tax return with eligible corporate subsidiaries, including portfolio companies in which we hold 80% or more of the outstanding equity interest measured by both vote and fair value. We have entered into a tax sharing agreement under which members of the consolidated tax group are compensated for losses and other tax benefits by members that are able to use those losses and tax benefits on their pro forma stand-alone federal income tax returns.
111
AMERICAN CAPITAL, LTD.
NOTES TO CONSOLIDATED FINANCIAL STATEMENTS—(Continued)
(in millions, except per share data)
During the quarter ended December 31, 2014, we consolidated our wholly owned portfolio company, European Capital in our consolidated financial statements. European Capital and its wholly owned subsidiary, European Capital S.A. SICAR (collectively, “ECAS”) are both controlled foreign corporations (“CFCs”) for U.S. tax purposes. Each entity pays an immaterial rate of non-U.S. income taxes. ECAS may produce subpart F income that must be reported on the U.S. tax return of American Capital.
The following table sets forth the significant components of our deferred tax assets and liabilities as of December 31, 2014 and 2013:
2014 | 2013 | ||||||
Deferred Tax Assets | |||||||
Net operating loss carryforwards | $ | 195 | $ | 197 | |||
Basis differences in ordinary investments | 139 | 156 | |||||
Stock-based compensation | 65 | 55 | |||||
Basis differences in investments held in ECAS | 193 | — | |||||
Other | 25 | 16 | |||||
Total ordinary deferred tax assets | 617 | 424 | |||||
Net capital loss carryforwards | — | 139 | |||||
Basis differences in capital investments | 230 | 486 | |||||
Total capital deferred tax assets | 230 | 625 | |||||
Total deferred tax assets | 847 | 1,049 | |||||
Less valuation allowance | (168 | ) | (404 | ) | |||
Total deferred tax assets less valuation allowance | 679 | 645 | |||||
Deferred Tax Liabilities | |||||||
Basis differences in ACAM | (309 | ) | (221 | ) | |||
Other | (16 | ) | (10 | ) | |||
Total deferred tax liabilities | (325 | ) | (231 | ) | |||
Total net deferred tax asset | $ | 354 | $ | 414 | |||
The table above classifies certain deferred tax assets and liabilities based on management’s estimate of the expected tax character of recognition of the reversal of the timing difference that gives rise to the deferred tax assets and liabilities as either ordinary or capital income. The ultimate tax character of the deferred tax assets and liabilities may change from the above classification based on the ultimate form of the recognition of the timing difference.
As a result of the inclusion of European Capital in the consolidated financial statements of American Capital, on October 1, 2014, we recorded a $206 million deferred tax asset for the temporary differences inside European Capital that will impact the recognition of taxable income by American Capital, $13 million of which was utilized during the quarter and $193 million of which is recorded as of December 31, 2014. As of December 31, 2014, we believe that it is more likely than not that we will have future ordinary income to realize our ordinary deferred tax assets and therefore we did not record a valuation allowance against these deferred tax assets. As a result of the inclusion of European Capital in the consolidated financial statements of American Capital, on October 1, 2014, we eliminated a $277 million capital deferred tax asset for the basis differences that American Capital had in its investment in the equity of European Capital.
As of December 31, 2014, we do not believe that we meet the more likely than not criteria regarding the ability to utilize all of our capital deferred tax assets and therefore we have recorded a partial valuation allowance of $168 million against certain capital deferred tax assets. In making the determination to establish a partial valuation allowance, we have weighed both the positive and negative evidence. Due to the capital gains realized in the first quarter of our September 30, 2015 tax year, scheduled capital gains and scheduled capital losses, we believe that we are more likely than not to utilize $62 million of capital deferred tax assets. During the year ended December 31, 2014, we reversed $236 million of the valuation allowance due to the $62 million valuation release as well as lower basis differences on our capital investments.
112
AMERICAN CAPITAL, LTD.
NOTES TO CONSOLIDATED FINANCIAL STATEMENTS—(Continued)
(in millions, except per share data)
Assessing the recoverability of a deferred tax asset requires management to make estimates related to expectations of future taxable income. Estimates of future taxable income are based on forecasted cash flows from investments and operations, the character of expected income or loss as either capital or ordinary, and the application of existing tax laws in each jurisdiction. To the extent that future cash flows or the amount or character of taxable income differ significantly from these estimates, our ability to realize the deferred tax assets could be impacted.
Under ASC 718, our capital in excess of par value in our shareholders’ equity includes the excess tax benefits generated from our stock-based compensation plans when our allowable income tax deduction for the award exceeds the compensation expense recorded for book purposes (“APIC Pool”). As of December 31, 2014, our APIC Pool totaled $30 million.
Additionally, under Sections 382 and 383 of the Code, following an “ownership change,” certain limitations apply to the use by a “loss corporation” of certain tax attributes including net operating loss carryforwards, capital loss carryforwards, unrealized built-in losses and tax credits arising before the “ownership change.” Such tax attributes represent substantially all of our deferred tax assets. In general, an “ownership change” would occur if there is a cumulative change in the ownership of our common stock of more than 50 percentage points by one or more “5% shareholders” during a three-year period. In the event of an “ownership change,” the tax attributes that may be used to offset our future taxable income in each year after the “ownership change” will be subject to an annual limitation. In general, the annual limitation is equal to the product of the fair market value of our common stock on the date of the “ownership change” and the “long term tax exempt rate” (which is published monthly by the Internal Revenue Service), subject to specified adjustments. This limitation could accelerate our cash tax payments and could result in a significant portion of our deferred tax asset expiring before we could fully use them. On April 27, 2012, we amended our Certificate of Incorporation to impose certain restrictions on the transfer of our common stock through April 27, 2015. These restrictions reduce, but do not eliminate, the risk of an “ownership change” through their effective date.
As of December 31, 2014, we estimate that we had $474 million of federal net operating loss carryforwards and various state net operating loss carryforwards for which we have recorded a gross ordinary deferred tax asset of $195 million. The ordinary deferred tax asset includes a reduction of $5 million for the excess tax benefits generated from our stock based compensation plans that resulted in an increase in our net operating losses, but which may not be recorded until utilization. For federal income tax purposes, the net operating loss carryforwards expire in various years from 2030 through 2034. The timing and manner in which we will utilize any net operating loss carryforwards in any year, or in total, may be limited in the future under the provisions of the Code and applicable state laws. As of December 31, 2014, we had fully utilized our capital loss carryforwards
A reconciliation of the provision (benefit) for income taxes computed at the U.S. federal statutory corporate income tax rate and our effective tax rate for the years ended December 31, 2014, 2013 and 2012 were as follows:
2014 | 2013 | 2012 | |||||||||
Tax on income computed at federal statutory corporate tax rate | $ | 174 | $ | 83 | $ | 391 | |||||
State taxes, net of federal tax benefit | 22 | 12 | 45 | ||||||||
Valuation allowance | (236 | ) | 7 | (444 | ) | ||||||
Rate difference on dividend income | (10 | ) | (6 | ) | — | ||||||
Change in state tax rate | (26 | ) | (12 | ) | — | ||||||
Permanent difference compensation | 13 | — | — | ||||||||
Consolidation of ACCH | 69 | — | — | ||||||||
Consolidation of European Capital | 71 | — | — | ||||||||
Permanent difference on European Capital appreciation | (30 | ) | — | — | |||||||
State deferred tax offset by valuation allowance | — | (27 | ) | — | |||||||
Other | 17 | (4 | ) | (13 | ) | ||||||
Total provision (benefit) for income taxes | $ | 64 | $ | 53 | $ | (21 | ) | ||||
During the second quarter of 2014, we consolidated ACCH, a wholly-owned company, in the consolidated financial statements of American Capital. ACCH had ordinary deferred tax assets of $30 million that are now reflected in our consolidated deferred tax assets. The capital deferred tax asset of $99 million that was reflected in prior periods, which had a valuation allowance of $99 million, related to the difference between our original equity cost basis for financial reporting purposes and our equity cost basis for tax purposes, has been eliminated. The net impact of the consolidation of ACCH was a decrease of our gross deferred tax assets of $69 million, offset by a release of valuation allowance of $99 million, resulting in a tax benefit of $30 million.
113
AMERICAN CAPITAL, LTD.
NOTES TO CONSOLIDATED FINANCIAL STATEMENTS—(Continued)
(in millions, except per share data)
As a result of the inclusion of European Capital in the consolidated financial statements of American Capital, on October 1, 2014, we recorded a $206 million deferred tax asset for the temporary differences inside European Capital that will impact the recognition of taxable income by American Capital. As a result of the inclusion of European Capital in the consolidated financial statements of American Capital, we eliminated a $277 million capital deferred tax asset for the basis differences that American Capital had in its investment in the equity of European Capital. The net impact of consolidation of European Capital was a $71 million tax provision.
When we consolidated European Capital in the financial statements of American Capital on October 1, 2014, we recognized $87 million of unrealized appreciation related to the difference between the fair value of American Capital’s investment in European Capital and European Capital’s NAV as of September 30, 2014. We were not required to record a tax provision of $30 million on the unrealized appreciation.
During the first quarter of 2014, we concluded that tax deductions recorded in fiscal years 2012 and 2013 pursuant to Section 162(m) of the Code were recorded in error for cash bonus payments and cash bonus awards under our Deferred Plan. As a result, $7.5 million of income tax expense associated with the reversal of these tax deductions was recorded in the financial statement line item tax provision in our consolidated statements of operations for the three months ended March 31, 2014. These errors were immaterial to the individual prior periods impacted. For the year ended December 31, 2014, we have recorded a $13 million tax provision related to deductions not allowed pursuant to section 162(m).
During 2013, we changed our presentation of the state deferred tax asset on capital items to a gross presentation without the impact of the federal benefit. This had no income statement impact and was wholly offset by the valuation allowance.
Components of our tax provision (benefit) for the years ended December 31, 2014, 2013 and 2012 were as follows:
2014 | 2013 | 2012 | |||||||||
Current Tax Provision (Benefit) | |||||||||||
Federal | $ | 7 | $ | 2 | $ | (5 | ) | ||||
State | — | 1 | 1 | ||||||||
Total current tax provision (benefit) | 7 | 3 | (4 | ) | |||||||
Deferred Tax Provision (Benefit) | |||||||||||
Federal | 49 | 50 | (15 | ) | |||||||
State | 8 | — | (2 | ) | |||||||
Total deferred tax provision (benefit) | 57 | 50 | (17 | ) | |||||||
Total provision (benefit) for income taxes | $ | 64 | $ | 53 | $ | (21 | ) | ||||
We identify our major tax jurisdictions as federal, New York and Maryland. The federal tax fiscal years ended September 30, 2011, 2012, 2013 and 2014 for American Capital remain subject to examination by the Internal Revenue Service (“IRS”). During the first quarter of 2014, we received notice from the IRS that their examination of the September 30, 2008 tax year was concluded and no changes to income or tax resulted.
We recognize tax benefits of uncertain tax positions only when the position is more likely than not to be sustained assuming examination by tax authorities. The following is a reconciliation of the beginning and ending balance of unrecognized tax benefits:
Unrecognized tax benefits - January 1, 2014 | $ | — | |
Increase related to positions taken during the current year | 48 | ||
Unrecognized tax benefits - December 31, 2014 | $ | 48 | |
The unrecognized tax benefit has been presented as a reduction of an ordinary deferred tax asset for a net operating loss.
Note 12. | Commitments and Contingencies |
In the normal course of business, we enter into contractual agreements that provide general indemnifications against losses, costs, claims and liabilities arising from the performance of our obligations under such agreements. We have not had any claims or made any payments pursuant to such agreements. We cannot estimate the maximum potential exposure under these arrangements as this would involve future claims that may be made against us that have not yet occurred. However, based on our experience, we expect the risk of any material loss to us to be remote.
114
AMERICAN CAPITAL, LTD.
NOTES TO CONSOLIDATED FINANCIAL STATEMENTS—(Continued)
(in millions, except per share data)
We are a party to certain legal proceedings incidental to the normal course of our business, including the enforcement of our rights under contracts with our portfolio companies. While the outcome of these legal proceedings cannot at this time be predicted with certainty, we do not expect that these proceedings will have a material effect on our financial condition or results of operations.
Loan and Financing Agreements
As of December 31, 2014, we had commitments under loan and financing agreements to fund up to $247 million to 29 portfolio companies. These commitments are primarily composed of working capital credit facilities, acquisition credit facilities and subscription agreements. The commitments are generally subject to the borrowers meeting certain criteria such as compliance with covenants and availability under borrowing base thresholds. The terms of the borrowings and financings subject to commitment are comparable to the terms of other loan and equity securities in our portfolio. As of December 31, 2014, European Capital and its affiliates had a commitment of $77 million to fund European Capital UK SME Debt Limited and $201 million to fund European Capital Private Debt LP. In addition, as of December 31, 2014, ACAM had a commitment of $173 million to American Capital Equity III, LP, which would be funded by an equity investment from American Capital. See Note 14 to our audited consolidated financial statements included in this Annual Report on form 10-K for further discussion of ACAM’s ACE III commitment.
Non-Cancelable Operating Leases
We have non-cancelable operating leases for office space and office equipment. The leases expire over the next twelve years and contain provisions for certain annual rental escalations. Rent expense for operating leases for the years ended December 31, 2014, 2013 and 2012 was $10 million, $9 million and $9 million, respectively.
Future minimum lease payments under non-cancelable operating leases as of December 31, 2014, net of any expected receipts under non-cancelable subleases, were as follows:
2015 | $ | 15 | ||
2016 | 15 | |||
2017 | 15 | |||
2018 | 16 | |||
2019 | 15 | |||
Thereafter | 70 | |||
Total | $ | 146 | ||
Total Return Swaps
ACTRS, a wholly owned consolidated affiliate of American Capital, entered into TRS transactions with Citibank, N.A. (the “2012 TRS” and “2012 TRS II”). The TRS’, which are non-recourse to American Capital, replicate the performance of reference pools of senior floating rate loans (each, a “Reference Pool”). The maximum amount of the loans that can be included in the Reference Pool is $400 million (determined at the time each such loan is added to the Reference Pool) and the maximum cash collateral requirement is $100 million. As of December 31, 2014, ACTRS had provided $100 million of cash collateral for the loans in the 2012 TRS and 2012 TRS II Reference Pools, which is recorded in the financial statement line item restricted cash and cash equivalents in our consolidated balance sheets. ACTRS may also be required to post additional collateral from time to time as a result of unrealized losses on the loans included in each Reference Pool. As of December 31, 2014, the loans in the Reference Pools for the 2012 TRS and the 2012 TRS II had a notional of approximately $27 million. The 2012 TRS and 2012 TRS II matured in December 2014 and the posted cash collateral will be returned to ACTRS in the first quarter of 2015.
Note 13. | Significant Subsidiaries |
We have determined that for the year ended December 31, 2014, European Capital Limited and CML Pharmaceuticals, Inc. met the conditions of a significant subsidiary under Rule 1-02(w) of Regulation S-X. Accordingly, pursuant to Rule 4-08(g)of Regulation S-X, aggregate financial information for the nine months ended September 30, 2014 and years ended December 31, 2013 and 2012 for European Capital Limited and for the years ended December 31, 2014, 2013 and 2012 for CML Pharmaceuticals, Inc. has been included as follows:
2014 | 2013 | 2012 | |||||||||
Current assets | $ | 137 | $ | 204 | $ | 50 | |||||
Noncurrent assets | $ | 1,251 | $ | 1,520 | $ | 1,689 | |||||
Current liabilities | $ | 61 | $ | 42 | $ | 76 | |||||
Noncurrent liabilities | $ | 458 | $ | 485 | $ | 618 | |||||
Redeemable preferred stocks | $ | 224 | $ | 219 | $ | 103 | |||||
Total revenue | $ | 256 | $ | 232 | $ | 99 | |||||
Total operating expenses | $ | 228 | $ | 170 | $ | 69 | |||||
Net operating income | $ | 27 | $ | 62 | $ | 30 | |||||
Net income | $ | 10 | $ | 177 | $ | 102 | |||||
Note 14. | Asset Sales |
On April 28, 2014, we completed a $1.1 billion private placement of partnership interests in American Capital Equity III, LP (“ACE III” or “the Fund”), a new private equity fund focused on investing in U.S. companies in the lower middle market. Concurrent with the private placement, we entered into a Contribution and Redemption Agreement with the Fund pursuant to which we agreed to contribute 100% of our equity and equity-related investments in seven portfolio companies (Affordable Care Holding Corp., Avalon Laboratories Holding Corp., CIBT Investment Holdings, LLC, FAMS Acquisition, Inc., Mirion Technologies, Inc., PHI Acquisitions, Inc. and SMG Holdings, Inc.) to the Fund and to provide the Fund with an option to acquire our equity investment in WRH, Inc. (the “Equity Option”), in exchange for partnership interests in the Fund. Collectively, the eight portfolio companies (including WRH, Inc. assuming the Equity Option is exercised) comprise the Secondary Portfolio for ACE III. The Equity Option may be exercised for the exercise price of $24 million at the earlier of (i) April 1, 2015 and (ii) any date after October 1, 2014 on the occurrence of certain events and expires after April 22, 2015.
The aggregate agreed upon value of the investments (the “Redemption Price”), assuming the Equity Option is exercised, was $640 million, subject to certain adjustments, including dividends, exits or add-on investments subsequent to December 31, 2013. The closing of the Fund was subject to regulatory approvals and other standard conditions which occurred in the third quarter of 2014 and the Fund closed on September 23, 2014 (the “Closing Date”). Following the closing, as defined in the Contribution and Redemption Agreement, ACE III redeemed our partnership interests for a cash amount of $434 million, equal to the Redemption Price of approximately $640 million, net of the Equity Option exercise price of $24 million and certain post December 31, 2013 adjustments, which included $106 million of proceeds from the sale of our equity investment in Avalon Laboratories Holding Corp. and $75 million related to dividend proceeds from SMG Holdings, Inc. and PHI Acquisitions, Inc. The fair value of the Equity Option as of the Closing Date and December 31, 2014 was approximately $46 million and $74 million, respectively, which has been accounted for as a derivative liability which is recorded in the financial statement line item other liabilities in our consolidated balance sheets.
Pursuant to the Fund’s partnership agreement, $420 million of the Fund’s aggregate $1.1 billion capital commitment will generally be used by ACE III to make control equity and equity-related investments in new portfolio companies (“Primary Investments”) and $25 million of the Fund’s aggregate $1.1 billion capital will be used to make follow-on investments in the Secondary Portfolio. The Fund’s aggregate $1.1 billion capital commitment includes a commitment of $200 million from ACAM for Primary Investments, of which $173 million was undrawn as of December 31, 2014.
ACE III is managed by our wholly-owned portfolio company, ACAM, through a wholly-owned affiliate, in exchange for an annual management fee of 2% on commitments attributable to Primary Investments and 1.25% on the agreed upon value of the Secondary Investments and uncalled follow-on commitments. Management fees are payable quarterly. In addition, ACAM can earn a carried interest of up to 20% of the net profits attributable to Primary Investments and up to 10% of the net profits attributable to Secondary Investments, subject to certain hurdles. The fair value of the management agreement as of the Closing Date was
115
AMERICAN CAPITAL, LTD.
NOTES TO CONSOLIDATED FINANCIAL STATEMENTS—(Continued)
(in millions, except per share data)
approximately $22 million, which has been included in the net realized gain on the redemption of our partnership interests in ACE III and is reflected as an increase to the cost basis of our investment in ACAM.
During the three months ended September 30, 2014, we recognized a net realized gain of $62 million on the transaction. The net realized gain was comprised of a $107 million net realized gain on the redemption of our partnership interests in ACE III which is recorded in the financial statement line item non-control/non-affiliate investments and control investments in the net realized gain (loss) section in our consolidated statements of operations and a realized loss of $45 million related to the fair value of the Equity Option recorded in the financial statement line item derivative agreements in our consolidated statements of operations.
Note 15. | Related Party Transactions |
As a BDC, we are required by law to make available significant managerial assistance to our eligible portfolio companies. Such assistance typically involves providing guidance and counsel concerning the management, operations and business objectives and policies of the portfolio company to its management and board of directors, including participating on the company’s board of directors. We have an operations team with significant turnaround and bankruptcy experience that assists our investment professionals in providing intensive operational and managerial assistance to our portfolio companies that require such assistance. As of December 31, 2014, we had board seats at 37 companies in our investment portfolio. Providing assistance to the companies in our investment portfolio serves as an opportunity for us to maximize their value.
The following table shows the operating revenue from our control investments, as defined under the 1940 Act, for the years ended December 31, 2014, 2013 and 2012:
2014 | 2013 | 2012 | |||||||||
Operating Revenue - Control Investments | |||||||||||
Interest and dividend income - control investments | $ | 263 | $ | 221 | $ | 320 | |||||
Fee income - control investments | $ | 42 | $ | 52 | $ | 51 | |||||
American Capital Asset Management
Our fund management business is conducted through ACAM. In general, ACAM provides investment management services through consolidated subsidiaries that enter into management agreements with each of its managed funds. In addition, American Capital or ACAM may invest directly into these funds and earn investment income from its investments in those funds. Under the management agreements, ACAM’s responsibilities include, but are not limited to, sourcing, analyzing and executing investments and asset sales, delivering financial and compliance reports to investors in the funds under management, administering the daily business and affairs of the funds under management and performing other asset management duties. We have entered into service agreements with ACAM to provide it with additional asset management and administrative services support. Through these agreements, we provide investment advisory and oversight services to ACAM, as well as access to our employees, infrastructure, business relationships, management expertise and capital raising capabilities. During the years ended December 31, 2014, 2013 and 2012, we recognized operating revenues from our investment in ACAM of $111 million, $133 million and $107 million, respectively.
European Capital
As discussed in Note 2 to these consolidated financial statements, we consolidated our investment in European Capital effective October 1, 2014. ACAM, through its subsidiary, ECAM, acts as the investment manager to European Capital. Under ACAM’s investment management agreement with European Capital, ACAM is entitled to receive an annual management fee of 2% of the weighted average monthly consolidated gross asset value of all the investments at fair value of European Capital, an incentive fee equal to 100% of the net earnings in excess of a return of 8% but less than a return of 10%, and 20% of the net earnings thereafter. The investment management agreement with European Capital was amended to waive the incentive fee for 2011, 2012, 2013, 2014 and 2015. The management fee charged by ACAM was $5 million for the quarter ended December 31, 2014 and is included in our consolidated statements of operations for the year ended December 31, 2014.
As discussed in Note 6 to these consolidated financial statements, European Capital has issued Redeemable Preferred Shares to employees of ECAM as part of long term employee incentive plans. These shares are redeemable by European Capital based on the aggregate returns on investments made after January 1, 2012 and are treated as mandatorily redeemable preferred stock in our consolidated balance sheets in accordance with ASC Topic No. 480, Distinguishing Liabilities from Equity. The fair value of the Redeemable Preferred Shares included in our consolidated balance sheets as of December 31, 2014 was $82 million. For the quarter ended December 31, 2014, European Capital recognized $7 million of unrealized depreciation on the Redeemable Preferred Shares, which is included in net unrealized appreciation in our consolidated statements of operations.
Note 16. | Selected Quarterly Financial Data (Unaudited) |
The following tables present our quarterly financial information for the fiscal years ended December 31, 2014 and 2013:
Three Months Ended | Year Ended December 31, 2014 | |||||||||||||||||||
March 31, 2014 | June 30, 2014 | September 30, 2014 | December 31, 2014(1) | |||||||||||||||||
Total operating revenue | $ | 84 | $ | 100 | $ | 129 | $ | 158 | $ | 471 | ||||||||||
Net operating income (“NOI”) | $ | 5 | $ | 26 | $ | 51 | $ | 35 | $ | 117 | ||||||||||
Net increase in net assets resulting from operations | $ | 70 | $ | 212 | $ | 114 | $ | 38 | $ | 434 | ||||||||||
NOI per basic common share(2) | $ | 0.02 | $ | 0.10 | $ | 0.19 | $ | 0.13 | $ | 0.44 | ||||||||||
NOI per diluted common share(2) | $ | 0.02 | $ | 0.09 | $ | 0.18 | $ | 0.12 | $ | 0.42 | ||||||||||
Net earnings per basic common share(2) | $ | 0.26 | $ | 0.80 | $ | 0.43 | $ | 0.14 | $ | 1.62 | ||||||||||
Net earnings per diluted common share(2) | $ | 0.25 | $ | 0.76 | $ | 0.41 | $ | 0.14 | $ | 1.55 | ||||||||||
Weighted average shares outstanding | ||||||||||||||||||||
Basic | 270.7 | 266.2 | 267.1 | 269.0 | 268.2 | |||||||||||||||
Diluted | 283.4 | 278.5 | 279.9 | 281.1 | 280.7 | |||||||||||||||
Three Months Ended | Year Ended December 31, 2013 | |||||||||||||||||||
March 31, 2013 | June 30, 2013 | September 30, 2013 | December 31, 2013 | |||||||||||||||||
Total operating revenue | $ | 133 | $ | 130 | $ | 106 | $ | 118 | $ | 487 | ||||||||||
Net operating income (“NOI”) | $ | 46 | $ | 49 | $ | 23 | $ | 38 | $ | 156 | ||||||||||
Net increase (decrease) in net assets resulting from operations | $ | 346 | $ | 21 | $ | (1 | ) | $ | (182 | ) | $ | 184 | ||||||||
NOI per basic common share(2) | $ | 0.15 | $ | 0.16 | $ | 0.08 | $ | 0.14 | $ | 0.53 | ||||||||||
NOI per diluted common share(2) | $ | 0.14 | $ | 0.16 | $ | 0.08 | $ | 0.14 | $ | 0.51 | ||||||||||
Net earnings (loss) per basic common share(2) | $ | 1.13 | $ | 0.07 | $ | (0.00 | ) | $ | (0.66 | ) | $ | 0.63 | ||||||||
Net earnings (loss) per diluted common share(2) | $ | 1.09 | $ | 0.07 | $ | (0.00 | ) | $ | (0.66 | ) | $ | 0.61 | ||||||||
Weighted average shares outstanding | ||||||||||||||||||||
Basic | 305.4 | 297.5 | 286.5 | 277.5 | 291.6 | |||||||||||||||
Diluted | 317.9 | 309.7 | 286.5 | 277.5 | 303.9 | |||||||||||||||
——————————
(1) | Effective October 1, 2014, European Capital’s financial results as of and for the three months ended December 31, 2014 have been consolidated with the financial results of ACAS for the same periods. |
(2) | Quarterly amounts may not equal full-year amounts due to changes in the weighted average shares outstanding. |
116
Item 9. | Changes in and Disagreements With Accountants on Accounting and Financial Disclosure |
None.
Item 9A. | Controls and Procedures |
Evaluation of Disclosure Controls and Procedures
We maintain disclosure controls and procedures that are designed to ensure that information required to be disclosed in our Exchange Act reports is recorded, processed, summarized and reported within the time periods specified in the SEC’s rules and forms, and that such information is accumulated and communicated to our management, including our Chief Executive Officer and Chief Financial Officer, as appropriate, to allow timely decisions regarding required disclosure based on the definition of “disclosure controls and procedures” as promulgated under the SEC Act of 1934, as amended. In designing and evaluating the disclosure controls and procedures, management recognized that any controls and procedures, no matter how well designed and operated, can provide only reasonable assurance of achieving the desired control objectives, and management necessarily was required to apply its judgment in evaluating the cost-benefit relationship of possible controls and procedures.
American Capital, including our Chief Executive Officer and Chief Financial Officer, evaluated the effectiveness of the design and operation of our disclosure controls and procedures. Based on the foregoing, our Chief Executive Officer and Chief Financial Officer concluded that our disclosure controls and procedures were effective as of December 31, 2014.
Management’s Report on Internal Control over Financial Reporting
Management’s Report on Internal Control over Financial Reporting is included in “Item 8.—Financial Statements and Supplementary Data.”
Changes in Internal Control over Financial Reporting
Effective October 1, 2014, we consolidated our investment in European Capital and implemented processes and controls around the consolidation of European Capital’s financial information into our consolidated financial statements. This included incorporating European Capital’s relevant financial processes and systems into our control environment and incorporating them into our Sarbanes-Oxley Act Section 404 compliance program. We believe that we successfully integrated European Capital’s operations in the fourth quarter of 2014, including internal controls and procedures. With the exception of this integration, there have been no changes in our internal control over financial reporting (as defined in Rule 13a-15(f) of the Securities Exchange Act of 1934, as amended) that occurred during the year ended December 31, 2014 that have materially affected, or are reasonably likely to materially affect, our internal control over financial reporting.
See Note 2 to these audited consolidated financial statements included in this Annual Report on Form 10-K for additional information regarding the consolidation of European Capital.
Item 9B. | Other Information |
None.
117
PART III
Item 10. Directors, Executive Officers and Corporate Governance
Information in response to this Item is incorporated herein by reference to the information provided in our Proxy Statement for our 2015 Annual Meeting of Stockholders (the “2015 Proxy Statement”) under the headings “PROPOSAL 1: ELECTION OF DIRECTORS”, “EXECUTIVE OFFICERS”, “CORPORATE GOVERNANCE”, “SECTION 16(a) BENEFICIAL OWNERSHIP REPORTING COMPLIANCE” and “CODE OF ETHICS AND CONDUCT.”
Item 11. | Executive Compensation |
Information in response to this Item is incorporated herein by reference to the information provided in the 2015 Proxy Statement under the headings “COMPENSATION DISCUSSION AND ANALYSIS”, “REPORT OF THE COMPENSATION AND CORPORATE GOVERNANCE COMMITEE”, “SUMMARY COMPENSATION TABLE”, “GRANTS OF PLAN-BASED AWARDS IN FISCAL YEAR 2014”, “OUTSTANDING EQUITY AWARDS AT FISCAL YEAR-END”, “OPTION EXERCISES AND STOCK VESTED”, “SEVERANCE AND CHANGE OF CONTROL PAYMENTS”, “PROPOASL 1: ELECTION OF DIRECTORS” and “COMPENSATION AND CORPORATE GOVERNANCE COMMITTEE INTERLOCKS AND INSIDER PARTICIPATION.”
Item 12. | Security Ownership of Certain Beneficial Owners and Management and Related Stockholder Matters |
Information in response to this Item is incorporated herein by reference to the information provided in the 2015 Proxy Statement under the heading “SECURITY OWNERSHIP OF MANAGEMENT AND CERTAIN BENEFICIAL OWNERS.”
Item 13. | Certain Relationships and Related Transactions, and Director Independence |
Information in response to this Item is incorporated herein by reference to the information provided in the 2015 Proxy Statement under the headings “CERTAIN TRANSACTIONS WITH RELATED PERSONS” and “PROPOSAL 1: ELECTION OF DIRECTORS.”
Item 14. | Principal Accounting Fees and Services |
Information in response to this Item is incorporated herein by reference to the information provided in the 2015 Proxy Statement under the heading “PROPOSAL 3: RATIFICATION OF APPOINTMENT OF INDEPENDENT PUBLIC ACCOUNTANT FOR 2015.”
PART IV
Item 15. EXHIBITS, FINANCIAL STATEMENT SCHEDULES
(a) | Financial Statements, Financial Statement Schedules and Exhibits. |
(1) | Financial Statements. |
The following financial statements and related notes are filed herewith (all financial statements listed below are those of American Capital and its consolidated subsidiaries):
Consolidated Balance Sheets as of December 31, 2014 and 2013. |
Consolidated Statements of Operations for the Fiscal Years Ended December 31, 2014, 2013 and 2012. |
Consolidated Statements of Comprehensive Income for the Fiscal Years Ended December 31, 2014, 2013 and 2012.
Consolidated Statements of Changes in Net Assets for the Fiscal Years Ended December 31, 2014, 2013 and 2012.
Consolidated Statements of Cash Flows for the Fiscal Years Ended December 31, 2014, 2013 and 2012. |
Consolidated Financial Highlights for the Fiscal Years Ended December 31, 2014, 2013, 2012, 2011 and 2010.
Consolidated Schedule of Investments as of December 31, 2014 and 2013. |
118
The following financial statements and related notes of European Capital Limited are filed herewith pursuant to Rule 3-09 of Regulation S-X:
Balance Sheets as of December 31, 2014 and 2013.
Statements of Operations for the Fiscal Years Ended December 31, 2014, 2013 and 2012.
Statements of Changes in Net Assets for the Fiscal Years Ended December 31, 2014, 2013 and 2012.
Statements of Cash Flows for the Fiscal Years Ended December 31, 2014, 2013 and 2012.
Financial Highlights for the Fiscal Years Ended December 31, 2014, 2013 and 2012.
Schedule of Investments as of December 31, 2014 and 2013.
The following financial statements and related notes of American Capital Asset Management, LLC are filed herewith pursuant to Rule 3-09 of Regulation S-X:
Balance Sheets as of December 31, 2014 and 2013.
Statements of Operations for the Fiscal Years Ended December 31, 2014, 2013 and 2012.
Statements of Comprehensive Income for the Fiscal Years Ended December 31, 2014, 2013 and 2012.
Statements of Cash Flows for the Fiscal Years Ended December 31, 2014, 2013 and 2012.
Statements of Changes in Member's Equity for the Fiscal Years Ended December 31, 2014, 2013 and 2012.
(2) | Financial Statement Schedules. |
The following financial statement schedules are filed herewith:
Schedule 12-14 Investments in and Advances to Affiliates.
Financial statement schedules other than those listed above have been omitted because the required information is contained in the financial statements and notes thereto, or because such schedules are not required or applicable.
(3) | Exhibits. |
*3.1. | American Capital, Ltd. (f/k/a American Capital Strategies, Ltd.) Third Amended and Restated Certificate of Incorporation, as amended, incorporated herein by reference to Exhibit 3.1 of Form 10-Q for the quarter ended March 31, 2012 (File No. 814-00149), filed May 7, 2012. |
*3.2. | American Capital, Ltd. (f/k/a American Capital Strategies, Ltd.) Second Amended and Restated Bylaws, as amended, incorporated herein by reference to Exhibit 3.2 of Form 10-Q for the quarter ended June 30, 2008 (File No. 814-00149), filed August 11, 2008. |
*4.1. | Instruments defining the rights of holders of securities: See Article IV of our Third Amended and Restated Certificate of Incorporation, as amended, incorporated herein by reference to Exhibit 3.1 of Form 10-Q for the quarter ended March 31, 2012 (File No. 814-00149), filed May 7, 2012. |
*4.2. | Instruments defining the rights of holders of securities: See Section I of our Second Amended and Restated Bylaws, as amended, incorporated herein by reference to Exhibit 3.2 of Form 10-Q for the quarter ended June 30, 2008 (File No. 814-00149), filed August 11, 2008. |
*4.3. | Indenture, dated as of September 20, 2013, between American Capital, Ltd. and U.S. Bank National Association, as Trustee, incorporated herein by reference to Exhibit 4.1 of Form 8-K (File No. 814-00149), filed September 24, 2013. |
*10.1. | Senior Secured Term Loan Credit Agreement, dated as of August 22, 2012, among American Capital, Ltd., as Borrower, the lenders party thereto, JPMorgan Chase Bank, N.A., as Administrative Agent, J.P. Morgan Securities LLC, BMO Capital Markets Corp. and UBS Securities LLC, as Syndication Agents, Joint Bookrunners and Joint Lead Arrangers, and Citibank, N.A., Credit Suisse Securities (USA) LLC and Goldman Sachs Bank USA, as Managing Agents, incorporated herein by reference to Exhibit 2.k.1 of Form N-2 (File No. 333-183926), filed September 14, 2012. |
*10.2. | Amendment No. 1 to the Senior Secured Term Loan Credit Agreement, dated as of August 23, 2013, among American Capital, Ltd., as Borrower, the lenders party thereto and JPMorgan Chase Bank, N.A., as Administrative Agent, incorporated herein by reference to Exhibit 2.k.2 of Form N-2/A (File No. 333-183926), filed September 27, 2013. |
119
*10.3. | Amendment No. 2 to the Senior Secured Term Loan Credit Agreement, dated as of February 26, 2014, among American Capital, Ltd., as Borrower, the lenders party thereto and JPMorgan Chase Bank, N.A., as Administrative Agent, incorporated herein by reference to Exhibit 10.1 of Form 10-Q for the quarter ended March 31, 2014 (File No. 814-00149), filed May 12, 2014. |
*10.4. | Senior Secured Revolving Credit Agreement, dated as of August 22, 2012, among American Capital, Ltd., as Borrower, the lenders party thereto, JPMorgan Chase Bank, N.A., as Administrative Agent, J.P. Morgan Securities LLC, BMO Capital Markets Corp. and UBS Securities LLC, as Syndication Agents, Joint Bookrunners and Joint Lead Arrangers, and Bank of America, N.A., Citibank N.A., Credit Suisse Securities (USA) LLC and Goldman Sachs Bank USA, as Managing Agents, incorporated herein by reference to Exhibit 2.k.2 of Form N-2 (File No. 333-183926), filed September 14, 2012. |
*10.5. | Collateral Agency and Intercreditor Agreement, dated as of August 22, 2012, among American Capital, Ltd. and JPMorgan Chase Bank, N.A., as Revolver Representative, Term Loan Representative and Collateral Agent, incorporated herein by reference to Exhibit 2.k.3 of Form N-2 (File No. 333-183926), filed September 14, 2012. |
*10.6. | Guarantee and Security Agreement, dated as of August 22, 2012, made by American Capital, Ltd. in favor of JPMorgan Chase Bank, N.A, as Collateral Agent, incorporated herein by reference to Exhibit 2.k.4 of Form N-2 (File No. 333-183926), filed September 14, 2012. |
*10.7. | Credit Agreement, dated as of June 27, 2014, among ACAS Funding I, LLC, as Borrower, the lender parties thereto and Bank of America, N.A., as Administrative Agent, incorporated herein by reference to Exhibit 10.1 of Form 10-Q for the quarter ended June 30, 2014 (File No. 814-00149), filed August 11, 2014. |
*10.8. | Security Agreement, dated as of June 27, 2014, between ACAS Funding I, LLC, as Borrower, and Bank of America, N.A., as Administrative Agent, incorporated herein by reference to Exhibit 10.2 of Form 10-Q for the quarter ended June 30, 2014 (File No. 814-00149), filed August 11, 2014. |
*10.9. | Collateral Administration Agreement, dated as of June 27, 2014, among ACAS Funding I, LLC, as Borrower, Bank of America, N.A., as Administrative Agent, and Deutsche Bank Trust Company Americas, as Collateral Administrator, incorporated herein by reference to Exhibit 10.3 of Form 10-Q for the quarter ended June 30, 2014 (File No. 814-00149), filed August 11, 2014. |
*10.10. | Sale and Participation Agreement, dated as of June 27, 2014, between American Capital, Ltd. and ACAS Funding I, LLC, incorporated herein by reference to Exhibit 10.4 of Form 10-Q for the quarter ended June 30, 2014 (File No. 814-00149), filed August 11, 2014. |
10.11. | Credit Agreement, dated as of October 30, 2014, among ACAS Funding II, LLC, as Borrower, the lender parties thereto and Deutsche Bank AG, New York Branch, as Administrative Agent, filed herewith. |
10.12. | Security Agreement, dated as of October 30, 2014, between ACAS Funding II, LLC, as Borrower, and Deutsche Bank AG, New York Branch, as Administrative Agent, filed herewith. |
10.13. | Custodial Agreement, dated as of October 30, 2014, among ACAS Funding II, LLC, as Borrower, American Capital Leveraged Finance Management, LLC, as Manager, Deutsche Bank AG, New York Branch, as Administrative Agent, and Deutsche Bank Trust Company Americas, as Custodian, filed herewith. |
10.14. | Contribution and Master Participation Agreement, dated as of October 30, 2014, between American Capital, Ltd. and ACAS Funding II, LLC, filed herewith. |
*10.15. | Amended and Restated Custodian Agreement between American Capital, Ltd. (f/k/a American Capital Strategies, Ltd.) and PNC Bank, N.A., December 18, 2007, incorporated herein by reference to Exhibit 10.32 of Form 10-K for the year ended December 31, 2011 (File No. 814-00149), filed February 27, 2012. |
*10.16. | Second Amended and Restated Custodian Agreement between American Capital, Ltd. (f/k/a American Capital Strategies, Ltd.) and Wells Fargo Bank, National Association, dated as of June 28, 2010, incorporated herein by reference to Exhibit 10.33 of Form 10-K for the year ended December 31, 2011 (File No. 814-00149), filed February 27, 2012. |
*10.17. | Custodian Agreement between American Capital, Ltd. and Wells Fargo Bank, National Association, dated as of June 28, 2010, incorporated herein by reference to Exhibit 10.34 of Form 10-K for the year ended December 31, 2011 (File No. 814-00149), filed February 27, 2012. |
†*10.18. | Amended and Restated Employment Agreement entered into and effective as of March 27, 2009 by and between John Erickson and American Capital, Ltd., incorporated herein by reference to Exhibit 10.7 of Form 10-Q for the quarter ended March 31, 2009 (File No. 814-00149), filed May 11, 2009. |
120
†*10.19. | Amendment No.1 to Amended and Restated Employment Agreement between American Capital, Ltd. and John Erickson effective as of December 10, 2009, incorporated herein by reference to Exhibit 2.k.8 of Form N-2 (File No. 333-183296), filed September 14, 2012. |
†*10.20. | Amended and Restated Employment Agreement entered into and effective as of March 27, 2009 by and between Samuel A. Flax and American Capital, Ltd., incorporated herein by reference to Exhibit 10.8 of Form 10-Q for the quarter ended March 31, 2009 (File No. 814-00149), filed May 11, 2009. |
†*10.21. | Amendment No.1 to Amended and Restated Employment Agreement between American Capital, Ltd. and Samuel A. Flax effective as of December 10, 2009, incorporated herein by reference to Exhibit 2.k.18 of Form N-2 (File No. 333-183296), filed September 14, 2012. |
†*10.22. | Amended and Restated Employment Agreement entered into and effective as of March 27, 2009 by and between Gordon O’Brien and American Capital, Ltd., incorporated herein by reference to Exhibit 10.10 of Form 10-Q for the quarter ended March 31, 2009 (File No. 814-00149), filed May 11, 2009. |
†*10.23. | Amendment No.1 to Amended and Restated Employment Agreement between American Capital, Ltd. and Gordon O’Brien effective as of December 10, 2009, incorporated herein by reference to Exhibit 2.k.14 of Form N-2 (File No. 333-183296), filed September 14, 2012. |
†*10.24. | Amended and Restated Employment Agreement entered into and effective as of March 27, 2009 by and between Ira Wagner and American Capital, Ltd. thereto, incorporated herein by reference to Exhibit 10.11 of Form 10-Q for the quarter ended March 31, 2009 (File No. 814-00149), filed May 11, 2009. |
†*10.25. | Amendment No.1 to Amended and Restated Employment Agreement between American Capital, Ltd. and Ira Wagner effective as of December 10, 2009, incorporated herein by reference to Exhibit 2.k.10 of Form N-2 (File No. 333-183296), filed September 14, 2012. |
†*10.26. | Amended and Restated Employment Agreement entered into and effective as of March 27, 2009 by and between Malon Wilkus and American Capital, Ltd., incorporated herein by reference to Exhibit 10.12 of Form 10-Q for the quarter ended March 31, 2009 (File No. 814-00149), filed May 11, 2009. |
†*10.27. | Amendment No.1 to Amended and Restated Employment Agreement between American Capital, Ltd. and Malon Wilkus effective as of December 10, 2009, incorporated herein by reference to Exhibit 2.k.6 of Form N-2 (File No. 333-183296), filed September 14, 2012. |
†*10.28. | Form of Indemnification Agreement entered into as of October 22, 2009 by and between American Capital, Ltd. and each of Malon Wilkus, Philip Harper, John Koskinen, Mary Baskin, Alvin Puryear, Kenneth Peterson, Jr., Stan Lundine, and Neil Hahl, incorporated herein by reference to Exhibit 10.1 of Form 8-K (File No. 814-00149), filed October 28, 2009. |
†*10.29. | Form of American Capital Strategies, Ltd. 2000 Employee Stock Option Plan, incorporated herein by reference to Appendix II to the Definitive Proxy Statement for the 2000 Annual Meeting filed April 5, 2000, as amended by Amendment No. 1, incorporated herein by reference to Exhibit II of the Definitive Proxy Statement for the 2001 Annual Meeting (File No. 814-00149), filed April 3, 2001. |
†*10.30. | Form of American Capital Strategies, Ltd. 2002 Employee Stock Option Plan, incorporated herein by reference to Exhibit I of the Definitive Proxy Statement for the 2002 Annual Meeting (File No. 814-00149), filed April 12, 2002. |
†*10.31. | Form of American Capital Strategies, Ltd. 2003 Employee Stock Option Plan, incorporated herein by reference to Exhibit I of the Definitive Proxy Statement for the 2003 Annual Meeting (File No. 814-00149), filed April 10, 2003. |
†*10.32. | Form of American Capital Strategies, Ltd. 2004 Employee Stock Option Plan, incorporated herein by reference to Exhibit II of the Definitive Proxy Statement for the 2004 Annual Meeting (File No. 814-00149), filed March 26, 2004. |
†*10.33. | Form of American Capital Strategies, Ltd. 2005 Employee Stock Option Plan, incorporated herein by reference to Exhibit III of the Definitive Proxy Statement for the 2004 Annual Meeting (File No. 814-00149), filed April 26, 2005. |
†*10.34. | Form of American Capital Strategies, Ltd. 2006 Employee Stock Option Plan, incorporated herein by reference to Exhibit I of the Definitive Proxy Statement for the 2006 Annual Meeting (File No. 814-00149), filed April 11, 2006. |
†*10.35. | Form of American Capital Strategies, Ltd. 2007 Stock Option Plan, incorporated herein by reference to Exhibit I of the Definitive Proxy Statement for the 2007 Annual Meeting (File No. 814-00149), filed March 27, 2007. |
†*10.36. | Form of American Capital Strategies, Ltd. 2008 Stock Option Plan, incorporated herein by reference to Exhibit I of the Definitive Proxy Statement for the 2008 Annual Meeting (File No. 814-00149), filed April 9, 2008. |
†*10.37. | Form of American Capital, Ltd. 2009 Stock Option Plan, incorporated herein by reference to Exhibit II of the Definitive Proxy Statement for the 2009 Annual Meeting (File No. 814-00149), filed April 30, 2009. |
121
†*10.38. | Form of 2014 Amended and Restated American Capital Performance Incentive Plan, as adopted June 12, 2014, incorporated herein by reference to Exhibit 10.5 of Form 10-Q for the quarter ended June 30, 2014 (File No. 814-00149), filed August 11, 2014. |
†*10.39. | Form of Acceptance and Election Agreement for Amended and Restated American Capital Incentive Bonus Plan, incorporated herein by reference to Exhibit 2.i.12 of the Pre-Effective Amendment No. 1 to the Registration Statement on Form N-2 (File No. 333-133571), filed June 26, 2006. |
†*10.40. | Form of American Capital, Ltd. 2010 Disinterested Director Stock Option Plan, incorporated herein by reference to Exhibit I of the Definitive Proxy Statement for the 2010 Annual Meeting (File No. 814-00149), filed August 6, 2010. |
†*10.41. | Amended and Restated American Capital Strategies, Ltd. Employee Stock Ownership Plan, effective as of January 1, 2009 Amended and Restated American Capital Strategies, Ltd. 401(k) Plan, effective as of January 1, 2009, incorporated herein by reference to Exhibit 10.34 of Form 10-K for the year ended December 31, 2009 (File No. 814-00149), filed March 1, 2010. |
12.1. | Computation of Ratio of Earnings to Fixed Charges. |
*14.0. | American Capital Strategies, Ltd. Code of Ethics and Conduct, incorporated herein by reference to Exhibit 2.r of Form N-2 (File No. 333-183296), filed September 14, 2012 and American Capital Strategies, Ltd. Personal Investments Code, incorporated herein by reference to Exhibit 2.r of Form N-2 (File No. 333-183296), filed September 14, 2012. |
21. | Subsidiaries of American Capital and jurisdiction of incorporation: |
1) AC Corporate Holdings, Inc., a Delaware corporation | |
2) ACAS CRE CDO 2007-1 Depositor, LLC, a Delaware limited liability company | |
3) ACAS Funding I, LLC, a Delaware limited liability company | |
4) ACAS Funding II, LLC, a Delaware limited liability company | |
5) ACAS Master Business Loan LLC, a Delaware limited liability company | |
6) American Capital TRS, LLC, a Delaware limited liability company | |
23.1 | Consent of Ernst & Young LLP. |
23.2 | Consent of Ernst & Young LLP relating to the financial statements of European Capital Limited. |
23.3 | Consent of Ernst & Young LLP relating to the financial statements of American Capital Asset Management, LLC. |
24. | Powers of Attorneys of directors and officers. |
31.1. | Certification of CEO Pursuant to Section 302 of the Sarbanes-Oxley Act of 2002. |
31.2. | Certification of CFO Pursuant to Section 302 of the Sarbanes-Oxley Act of 2002. |
32. | Certification of CEO and CFO Pursuant to 18 U.S.C. Section 1350, as Adopted Pursuant to Section 906 of the Sarbanes-Oxley Act of 2002. |
99.1 | European Capital Limited Consolidated Financial Statements as of December 31, 2014 and 2013 and for each of the Three Years Ended December 31, 2014. |
99.2 | American Capital Asset Management, LLC Consolidated Financial Statements as of December 31, 2014 and 2013 and for each of the Three Years Ended December 31, 2014. |
* | Fully or partly previously filed |
† | Management contract or compensatory plan or arrangement |
(b) | Exhibits |
See the exhibits filed herewith.
(c) | Additional financial statement schedules |
NONE
122
SIGNATURES
Pursuant to the requirements of Section 13 or 15(d) of the Securities Exchange Act of 1934, the registrant has duly caused this report to be signed on its behalf by the undersigned, thereunto duly authorized.
AMERICAN CAPITAL, LTD. | ||
By: | /s/ JOHN R. ERICKSON | |
John R. Erickson Chief Financial Officer | ||
Date: March 2, 2015
Pursuant to the requirements of the Securities Exchange Act of 1934, this report has been signed below by the following persons on behalf of the registrant and in the capacities and on the dates indicated.
Name | Title | Date | ||
* | Chairman of the Board and Chief Executive Officer (Principal Executive Officer) | March 2, 2015 | ||
Malon Wilkus | ||||
/s/ JOHN R. ERICKSON | Chief Financial Officer (Principal Financial and Accounting Officer) | March 2, 2015 | ||
John R. Erickson | ||||
* | Director | March 2, 2015 | ||
Mary C. Baskin | ||||
* | Director | March 2, 2015 | ||
Neil M. Hahl | ||||
* | Director | March 2, 2015 | ||
Philip R. Harper | ||||
* | Director | March 2, 2015 | ||
Stan Lundine | ||||
* | Director | March 2, 2015 | ||
Susan K. Nestegard | ||||
* | Director | March 2, 2015 | ||
Kenneth D. Peterson, Jr. | ||||
* | Director | March 2, 2015 | ||
Alvin N. Puryear | ||||
* By: /s/ JOHN R. ERICKSON | ||||
John R. Erickson Attorney-in-fact | ||||
123
Schedule 12-14 AMERICAN CAPITAL, LTD. SCHEDULE OF INVESTMENTS IN AND ADVANCES TO AFFILIATES As of and for the year ended December 31, 2014 (in millions) | ||||||||||||||||||||||||||
Amount of Interest or Dividends | ||||||||||||||||||||||||||
Company (1) | Investments | Credited to Income (2) | Other (3) | December 31, 2013 Fair Value | Gross Additions (4) | Gross Reductions (5) | December 31, 2014 Fair Value | |||||||||||||||||||
AMERICAN CAPITAL CONTROL INVESTMENTS | ||||||||||||||||||||||||||
ACAS Real Estate Holdings Corporation | Mezzanine Debt | $ | 1.0 | $ | — | $ | 3.3 | $ | 2.7 | $ | 1.0 | $ | 5.0 | |||||||||||||
Common Stock | 10.4 | 1.0 | 23.7 | 5.7 | 3.7 | 25.7 | ||||||||||||||||||||
11.4 | 1.0 | 27.0 | 8.4 | 4.7 | 30.7 | |||||||||||||||||||||
ACAS Wachovia Investments, L.P. | Partnership Interest | — | — | 0.8 | 4.3 | 4.5 | 0.6 | |||||||||||||||||||
Affordable Care Holding Corp. | Convertible Preferred Stock | 5.3 | — | 138.2 | 5.3 | 143.5 | — | |||||||||||||||||||
Common Stock | — | 15.6 | 32.6 | — | 32.6 | — | ||||||||||||||||||||
5.3 | 15.6 | 170.8 | 5.3 | 176.1 | — | |||||||||||||||||||||
American Capital Asset Management, LLC | Mezzanine Debt | 1.7 | — | 33.0 | 10.0 | 10.0 | 33.0 | |||||||||||||||||||
Common Membership Interest | 81.9 | 11.4 | 836.5 | 547.0 | 252.1 | 1,131.4 | ||||||||||||||||||||
83.6 | 11.4 | 869.5 | 557.0 | 262.1 | 1,164.4 | |||||||||||||||||||||
American Driveline Systems, Inc. | Mezzanine Debt | — | — | — | — | — | — | |||||||||||||||||||
Redeemable Preferred Stock | — | — | 30.2 | 5.2 | 14.8 | 20.6 | ||||||||||||||||||||
Common Stock | — | — | — | — | — | — | ||||||||||||||||||||
Common Stock Warrants | — | — | — | — | — | — | ||||||||||||||||||||
— | — | 30.2 | 5.2 | 14.8 | 20.6 | |||||||||||||||||||||
ASAP Industries Holdings, LLC | Mezzanine Debt | 2.9 | — | 20.1 | 0.4 | — | 20.5 | |||||||||||||||||||
Membership Units | — | — | 17.8 | 7.3 | 10.1 | 15.0 | ||||||||||||||||||||
2.9 | — | 37.9 | 7.7 | 10.1 | 35.5 | |||||||||||||||||||||
Avalon Laboratories Holding Corp. | Mezzanine Debt | 1.1 | — | 12.6 | 0.3 | 12.9 | — | |||||||||||||||||||
Convertible Preferred Stock | 1.0 | — | 59.4 | 1.0 | 60.4 | — | ||||||||||||||||||||
Common Stock | — | — | 5.0 | 0.1 | 5.1 | — | ||||||||||||||||||||
2.1 | — | 77.0 | 1.4 | 78.4 | — | |||||||||||||||||||||
BMR Energy LLC | Preferred Units | 0.3 | — | — | 11.9 | — | 11.9 | |||||||||||||||||||
Capital.com, Inc. | Common Stock | — | — | 0.1 | — | 0.1 | — | |||||||||||||||||||
CH Holding Corp. | Senior Debt | — | — | 4.5 | 17.2 | 21.7 | — | |||||||||||||||||||
Redeemable Preferred Stock | — | — | — | — | — | — | ||||||||||||||||||||
— | — | 4.5 | 17.2 | 21.7 | — | |||||||||||||||||||||
CML Pharmaceuticals, Inc. | Senior Debt | 24.7 | — | 288.3 | 45.8 | 44.3 | 289.8 | |||||||||||||||||||
Convertible Preferred Stock | — | — | 104.3 | 0.1 | 104.4 | — | ||||||||||||||||||||
24.7 | — | 392.6 | 45.9 | 148.7 | 289.8 | |||||||||||||||||||||
CMX Inc. | Senior Debt | — | — | — | — | — | — | |||||||||||||||||||
Contour Semiconductor, Inc. | Senior Debt | 0.5 | — | 5.4 | 4.4 | 0.5 | 9.3 | |||||||||||||||||||
Convertible Preferred Stock | — | — | 8.0 | 13.2 | 21.2 | — | ||||||||||||||||||||
0.5 | — | 13.4 | 17.6 | 21.7 | 9.3 | |||||||||||||||||||||
Core Financial Holdings, LLC | Common Units | — | 0.4 | 0.9 | — | 0.7 | 0.2 | |||||||||||||||||||
Dyno Holding Corp. | Senior Debt | 4.0 | — | 35.2 | 0.8 | 0.8 | 35.2 | |||||||||||||||||||
Mezzanine Debt | 2.7 | 0.1 | 12.3 | 8.4 | 4.0 | 16.7 | ||||||||||||||||||||
Convertible Preferred Stock | — | — | — | — | — | — | ||||||||||||||||||||
Common Stock | — | — | — | — | — | — | ||||||||||||||||||||
6.7 | 0.1 | 47.5 | 9.2 | 4.8 | 51.9 | |||||||||||||||||||||
ECA Medical Instruments | Senior Debt | 0.8 | — | 5.8 | 4.9 | 3.9 | 6.8 | |||||||||||||||||||
Mezzanine Debt | 2.9 | — | 17.4 | 0.7 | — | 18.1 | ||||||||||||||||||||
Common Stock | — | — | 5.0 | 2.3 | 2.6 | 4.7 | ||||||||||||||||||||
3.7 | — | 28.2 | 7.9 | 6.5 | 29.6 | |||||||||||||||||||||
eLynx Holdings, Inc. | Convertible Preferred Stock | (3.4 | ) | — | 22.1 | — | 6.1 | 16.0 | ||||||||||||||||||
Redeemable Preferred Stock | — | — | — | — | — | — | ||||||||||||||||||||
Common Stock | — | — | — | — | — | — | ||||||||||||||||||||
Common Stock Warrants | — | — | — | — | — | — | ||||||||||||||||||||
(3.4 | ) | — | 22.1 | — | 6.1 | 16.0 | ||||||||||||||||||||
European Capital Limited | Ordinary Shares | — | 264.6 | 841.0 | 181.0 | 1,022.0 | — | |||||||||||||||||||
EXPL Pipeline Holdings LLC | Senior Debt | 3.9 | — | 45.8 | 1.9 | 0.9 | 46.8 | |||||||||||||||||||
Common Membership Units | — | — | 16.8 | 4.0 | 0.7 | 20.1 | ||||||||||||||||||||
3.9 | — | 62.6 | 5.9 | 1.6 | 66.9 | |||||||||||||||||||||
FAMS Acquisition, Inc.(6) | Mezzanine Debt | 5.0 | — | — | 47.8 | 7.1 | 40.7 | |||||||||||||||||||
Redeemable Preferred Stock | 0.2 | — | — | 2.7 | 2.7 | — | ||||||||||||||||||||
Convertible Preferred Stock | — | — | — | 22.4 | 22.4 | — | ||||||||||||||||||||
5.2 | — | — | 72.9 | 32.2 | 40.7 | |||||||||||||||||||||
124
Schedule 12-14 AMERICAN CAPITAL, LTD. SCHEDULE OF INVESTMENTS IN AND ADVANCES TO AFFILIATES—(Continued) As of and for the year ended December 31, 2014 (in millions) | ||||||||||||||||||||||||||
Amount of Interest or Dividends | ||||||||||||||||||||||||||
Company (1) | Investments | Credited to Income (2) | Other (3) | December 31, 2013 Fair Value | Gross Additions (4) | Gross Reductions (5) | December 31, 2014 Fair Value | |||||||||||||||||||
FL Acquisitions Holdings, Inc. | Senior Debt | 2.3 | — | 41.9 | 1.9 | 43.8 | — | |||||||||||||||||||
Mezzanine Debt | 7.6 | 0.7 | 15.1 | 75.4 | 90.5 | — | ||||||||||||||||||||
Redeemable Preferred Stock | — | — | — | — | — | — | ||||||||||||||||||||
Common Stock | — | — | — | — | — | — | ||||||||||||||||||||
9.9 | 0.7 | 57.0 | 77.3 | 134.3 | — | |||||||||||||||||||||
Fosbel Global Services (LUXCO) S.C.A. | Mezzanine Debt | 1.5 | — | 15.1 | 10.4 | 12.0 | 13.5 | |||||||||||||||||||
Redeemable Preferred Stock | — | — | — | — | — | — | ||||||||||||||||||||
Common Stock | — | — | — | — | — | — | ||||||||||||||||||||
1.5 | — | 15.1 | 10.4 | 12.0 | 13.5 | |||||||||||||||||||||
FPI Holding Corporation | Senior Debt | — | — | 10.2 | 13.7 | 12.3 | 11.6 | |||||||||||||||||||
Future Food, Inc. | Senior Debt | — | 1.0 | 1.5 | 1.1 | 2.6 | — | |||||||||||||||||||
Common Stock | — | — | — | — | — | — | ||||||||||||||||||||
Common Stock Warrants | — | — | — | — | — | — | ||||||||||||||||||||
— | 1.0 | 1.5 | 1.1 | 2.6 | — | |||||||||||||||||||||
Group Montana, Inc. | Senior Debt | 0.4 | — | 7.1 | 0.9 | 1.6 | 6.4 | |||||||||||||||||||
Convertible Preferred Stock | 1.0 | — | 10.1 | 1.0 | 4.4 | 6.7 | ||||||||||||||||||||
Common Stock | — | — | 2.6 | — | 1.0 | 1.6 | ||||||||||||||||||||
1.4 | — | 19.8 | 1.9 | 7.0 | 14.7 | |||||||||||||||||||||
Halex Holdings, Inc. | Senior Debt | 8.5 | — | 10.7 | 9.0 | 0.9 | 18.8 | |||||||||||||||||||
Redeemable Preferred Stock | — | — | — | — | — | — | ||||||||||||||||||||
8.5 | — | 10.7 | 9.0 | 0.9 | 18.8 | |||||||||||||||||||||
HALT Medical, Inc.(7) | Senior Debt | 0.9 | — | — | 64.9 | 29.3 | 35.6 | |||||||||||||||||||
Convertible Preferred Stock | — | — | — | — | — | — | ||||||||||||||||||||
Common Stock | — | — | — | — | — | — | ||||||||||||||||||||
0.9 | — | — | 64.9 | 29.3 | 35.6 | |||||||||||||||||||||
Hard 8 Games, LLC | Senior Debt | 0.2 | — | — | 8.2 | — | 8.2 | |||||||||||||||||||
Membership Unit | — | — | 22.8 | 6.0 | — | 28.8 | ||||||||||||||||||||
0.2 | — | 22.8 | 14.2 | — | 37.0 | |||||||||||||||||||||
Hollyhock Limited | Common Stock | — | — | 11.4 | 10.0 | 0.2 | 21.2 | |||||||||||||||||||
LLSC Holdings Corporation | Convertible Preferred Stock | — | — | 7.1 | 6.7 | — | 13.8 | |||||||||||||||||||
Mirion Technologies, Inc. | Convertible Preferred Stock | 5.7 | — | 125.5 | 16.0 | 141.5 | — | |||||||||||||||||||
Common Stock | — | — | 9.3 | 0.5 | 9.8 | — | ||||||||||||||||||||
Common Stock Warrants | — | — | 37.3 | — | 37.3 | — | ||||||||||||||||||||
5.7 | — | 172.1 | 16.5 | 188.6 | — | |||||||||||||||||||||
Montgomery Lane, LLC | Common Membership Units | — | 0.7 | 7.0 | 0.6 | 0.7 | 6.9 | |||||||||||||||||||
MW Acquisition Corporation | Mezzanine Debt | 3.7 | — | 23.7 | 0.3 | — | 24.0 | |||||||||||||||||||
Redeemable Preferred Stock | 0.4 | — | 2.0 | 0.3 | — | 2.3 | ||||||||||||||||||||
Convertible Preferred Stock | (5.8 | ) | — | 30.1 | — | 12.2 | 17.9 | |||||||||||||||||||
Common Stock | — | — | 1.4 | — | 1.4 | — | ||||||||||||||||||||
(1.7 | ) | — | 57.2 | 0.6 | 13.6 | 44.2 | ||||||||||||||||||||
NECCO Holdings, Inc. | Senior Debt | — | 0.7 | 5.8 | 57.5 | 54.4 | 8.9 | |||||||||||||||||||
Common Stock | — | — | — | — | — | — | ||||||||||||||||||||
— | 0.7 | 5.8 | 57.5 | 54.4 | 8.9 | |||||||||||||||||||||
NECCO Realty Investments, LLC | Senior Debt | — | — | 31.0 | — | 11.1 | 19.9 | |||||||||||||||||||
Common Membership Units | — | — | — | — | — | — | ||||||||||||||||||||
— | — | 31.0 | — | 11.1 | 19.9 | |||||||||||||||||||||
Orchard Brands Corporation | Common Stock | — | — | 39.2 | 48.7 | — | 87.9 | |||||||||||||||||||
PHC Sharp Holdings, Inc. | Senior Debt | 0.2 | — | 1.9 | — | 0.5 | 1.4 | |||||||||||||||||||
Mezzanine Debt | 6.1 | — | 19.7 | 10.1 | 4.2 | 25.6 | ||||||||||||||||||||
Common Stock | — | — | — | — | — | — | ||||||||||||||||||||
6.3 | — | 21.6 | 10.1 | 4.7 | 27.0 | |||||||||||||||||||||
PHI Acquisitions, Inc. | Mezzanine Debt | 1.4 | — | 28.4 | 0.4 | 28.8 | — | |||||||||||||||||||
Redeemable Preferred Stock | 2.2 | — | 40.1 | 13.9 | 54.0 | — | ||||||||||||||||||||
Common Stock | 7.5 | — | 1.6 | 3.9 | 5.5 | — | ||||||||||||||||||||
Common Stock Warrants | — | — | 4.6 | 11.6 | 16.2 | — | ||||||||||||||||||||
11.1 | — | 74.7 | 29.8 | 104.5 | — | |||||||||||||||||||||
Plumbing Holding Corporation | Common Stock | — | — | 2.6 | 13.4 | 16.0 | — | |||||||||||||||||||
RD Holdco Inc. | Senior Debt | 2.6 | — | 16.9 | 0.7 | 0.5 | 17.1 | |||||||||||||||||||
Common Stock | — | — | 12.6 | 6.0 | — | 18.6 | ||||||||||||||||||||
Common Stock Warrants | — | — | 1.6 | 0.7 | — | 2.3 | ||||||||||||||||||||
2.6 | — | 31.1 | 7.4 | 0.5 | 38.0 | |||||||||||||||||||||
125
Schedule 12-14 AMERICAN CAPITAL, LTD. SCHEDULE OF INVESTMENTS IN AND ADVANCES TO AFFILIATES—(Continued) As of and for the year ended December 31, 2014 (in millions) | ||||||||||||||||||||||||||
Amount of Interest or Dividends | ||||||||||||||||||||||||||
Company (1) | Investments | Credited to Income (2) | Other (3) | December 31, 2013 Fair Value | Gross Additions (4) | Gross Reductions (5) | December 31, 2014 Fair Value | |||||||||||||||||||
Rebellion Media Group Corp. | Senior Debt | (0.5 | ) | — | 14.2 | 2.9 | 13.6 | 3.5 | ||||||||||||||||||
Convertible Preferred Stock | — | — | — | — | — | — | ||||||||||||||||||||
(0.5 | ) | — | 14.2 | 2.9 | 13.6 | 3.5 | ||||||||||||||||||||
Scanner Holdings Corporation | Mezzanine Debt | 2.7 | — | 16.4 | 4.1 | — | 20.5 | |||||||||||||||||||
Convertible Preferred Stock | 0.6 | 3.9 | 9.6 | 0.6 | 4.8 | 5.4 | ||||||||||||||||||||
Common Stock | — | — | — | — | — | — | ||||||||||||||||||||
3.3 | 3.9 | 26.0 | 4.7 | 4.8 | 25.9 | |||||||||||||||||||||
SEHAC Holding Corporation | Convertible Preferred Stock | 6.6 | — | 46.8 | 58.0 | 1.2 | 103.6 | |||||||||||||||||||
Common Stock | 0.1 | — | 0.5 | 0.5 | — | 1.0 | ||||||||||||||||||||
6.7 | — | 47.3 | 58.5 | 1.2 | 104.6 | |||||||||||||||||||||
SMG Holdings, Inc. | Convertible Preferred Stock | 4.7 | 0.2 | 186.7 | 25.2 | 211.9 | — | |||||||||||||||||||
Common Stock | — | 0.3 | 8.0 | 91.9 | 99.9 | — | ||||||||||||||||||||
4.7 | 0.5 | 194.7 | 117.1 | 311.8 | — | |||||||||||||||||||||
Soil Safe Acquisition Corp.(6) | Senior Debt | 0.9 | — | — | 39.2 | 3.0 | 36.2 | |||||||||||||||||||
Mezzanine Debt | 11.7 | 0.4 | — | 106.7 | 39.6 | 67.1 | ||||||||||||||||||||
Common Stock | — | — | — | 9.5 | 0.3 | 9.2 | ||||||||||||||||||||
12.6 | 0.4 | — | 155.4 | 42.9 | 112.5 | |||||||||||||||||||||
Specialty Brands of America, Inc. | Redeemable Preferred Stock | 0.5 | — | 20.5 | 6.2 | 26.7 | — | |||||||||||||||||||
Common Stock | — | — | 28.4 | 7.3 | 35.7 | — | ||||||||||||||||||||
0.5 | — | 48.9 | 13.5 | 62.4 | — | |||||||||||||||||||||
Spring Air International, LLC | Common Membership Units | — | 0.2 | — | — | — | — | |||||||||||||||||||
TestAmerica Environmental Services, LLC | Mezzanine Debt | — | — | — | — | — | — | |||||||||||||||||||
Common Units | — | — | — | — | — | — | ||||||||||||||||||||
— | — | — | — | — | — | |||||||||||||||||||||
Unique Fabricating Incorporated(8) | Redeemable Preferred Stock | 0.2 | — | — | — | — | — | |||||||||||||||||||
Unwired Holdings, Inc. | Senior Debt | 0.5 | — | 11.9 | 7.2 | 19.1 | — | |||||||||||||||||||
Mezzanine Debt | 6.1 | — | 48.9 | 25.5 | 74.4 | — | ||||||||||||||||||||
Redeemable Preferred Stock | 33.7 | — | 3.7 | 88.1 | 91.8 | — | ||||||||||||||||||||
40.3 | — | 64.5 | 120.8 | 185.3 | — | |||||||||||||||||||||
Warner Power, LLC | Mezzanine Debt | (1.0 | ) | — | 3.8 | 10.2 | 11.4 | 2.6 | ||||||||||||||||||
Redeemable Preferred Membership Units | — | — | — | — | — | — | ||||||||||||||||||||
Common Membership Units | — | — | — | — | — | — | ||||||||||||||||||||
(1.0 | ) | — | 3.8 | 10.2 | 11.4 | 2.6 | ||||||||||||||||||||
WIS Holding Company, Inc. | Convertible Preferred Stock | — | — | 76.4 | 20.1 | 13.6 | 82.9 | |||||||||||||||||||
Common Stock | 6.4 | — | 5.3 | 16.9 | 5.3 | 16.9 | ||||||||||||||||||||
6.4 | — | 81.7 | 37.0 | 18.9 | 99.8 | |||||||||||||||||||||
EUROPEAN CAPITAL CONTROL INVESTMENTS | ||||||||||||||||||||||||||
Bellotto Holdings Limited | Redeemable Preferred Stock | 1.7 | — | — | 36.5 | — | 36.5 | |||||||||||||||||||
Common Stock | — | — | — | 103.6 | — | 103.6 | ||||||||||||||||||||
1.7 | — | — | 140.1 | — | 140.1 | |||||||||||||||||||||
European Capital UK SME Debt LP | Common Stock | — | — | — | 0.6 | — | 0.6 | |||||||||||||||||||
FB Raphael 1 Limited | Redeemable Preferred Stock | 2.5 | — | — | 149.0 | 149.0 | — | |||||||||||||||||||
Common Stock | — | — | — | 161.0 | 161.0 | — | ||||||||||||||||||||
Warrants | — | — | — | 9.7 | 9.7 | — | ||||||||||||||||||||
2.5 | — | — | 319.7 | 319.7 | — | |||||||||||||||||||||
Financière H S.A.S. | Mezzanine Debt | — | — | — | 9.5 | — | 9.5 | |||||||||||||||||||
Convertible Preferred Stock | — | — | — | — | — | — | ||||||||||||||||||||
— | — | — | 9.5 | — | 9.5 | |||||||||||||||||||||
Financière Newglass S.A.S. | Convertible Preferred Stock | (4.1 | ) | — | — | 30.2 | 4.1 | 26.1 | ||||||||||||||||||
Common Stock | — | — | 6.2 | — | 6.2 | |||||||||||||||||||||
(4.1 | ) | — | — | 36.4 | 4.1 | 32.3 | ||||||||||||||||||||
Financière Tarmac S.A.S. | Senior Debt | 0.2 | — | — | 5.5 | 0.4 | 5.1 | |||||||||||||||||||
Mezzanine Debt | (4.2 | ) | — | — | 43.5 | 4.2 | 39.3 | |||||||||||||||||||
Convertible Preferred Stock | — | — | — | — | — | — | ||||||||||||||||||||
Redeemable Preferred Stock | — | — | — | — | — | — | ||||||||||||||||||||
(4.0 | ) | — | — | 49.0 | 4.6 | 44.4 | ||||||||||||||||||||
Holding Saint Augustine S.A.S. | Senior Debt | — | — | — | 4.9 | — | 4.9 | |||||||||||||||||||
Convertible Preferred Stock | — | — | — | — | — | — | ||||||||||||||||||||
Redeemable Preferred Stock | — | — | — | 1.0 | — | 1.0 | ||||||||||||||||||||
— | — | — | 5.9 | — | 5.9 | |||||||||||||||||||||
126
Schedule 12-14 AMERICAN CAPITAL, LTD. SCHEDULE OF INVESTMENTS IN AND ADVANCES TO AFFILIATES—(Continued) As of and for the year ended December 31, 2014 (in millions) | ||||||||||||||||||||||||||
Amount of Interest or Dividends | ||||||||||||||||||||||||||
Company (1) | Investments | Credited to Income (2) | Other (3) | December 31, 2013 Fair Value | Gross Additions (4) | Gross Reductions (5) | December 31, 2014 Fair Value | |||||||||||||||||||
Miles 33 Limited | Senior Debt | 0.1 | — | — | 8.5 | 0.2 | 8.3 | |||||||||||||||||||
Mezzanine Debt | 0.4 | — | — | 16.7 | — | 16.7 | ||||||||||||||||||||
Redeemable Preferred Stock | — | — | — | 8.6 | — | 8.6 | ||||||||||||||||||||
Common Stock | — | — | — | — | — | — | ||||||||||||||||||||
0.5 | — | — | 33.8 | 0.2 | 33.6 | |||||||||||||||||||||
MP Equity S.A.S. | Redeemable Preferred Stock | — | — | — | — | — | — | |||||||||||||||||||
Subtotal Control Investments | $ | 263.1 | $ | 301.2 | $ | 3,705.1 | $ | 2,467.7 | $ | 3,390.4 | $ | 2,782.4 | ||||||||||||||
AMERICAN CAPITAL AFFILIATE INVESTMENTS | ||||||||||||||||||||||||||
Anchor Drilling Fluids USA, Inc. | Senior Debt | $ | 0.2 | $ | — | $ | 6.5 | $ | — | $ | 6.5 | $ | — | |||||||||||||
Redeemable Preferred Stock | 0.1 | — | 2.5 | 0.2 | 2.7 | — | ||||||||||||||||||||
Common Stock | — | — | 13.7 | 1.0 | 14.7 | — | ||||||||||||||||||||
0.3 | — | 22.7 | 1.2 | 23.9 | — | |||||||||||||||||||||
Egenera, Inc. | Common Stock | — | — | — | — | — | — | |||||||||||||||||||
HALT Medical, Inc.(7) | Senior Debt | — | — | 26.7 | — | 26.7 | — | |||||||||||||||||||
Convertible Preferred Stock | — | — | — | — | — | — | ||||||||||||||||||||
Common Stock | — | — | — | — | — | — | ||||||||||||||||||||
— | — | 26.7 | — | 26.7 | — | |||||||||||||||||||||
IS Holdings I, Inc. | Common Stock | — | — | 13.5 | — | 5.6 | 7.9 | |||||||||||||||||||
Neways Holdings, L.P. | Senior Debt | 2.1 | 0.1 | 25.4 | 21.6 | 47.0 | — | |||||||||||||||||||
Common Units | — | — | — | — | — | — | ||||||||||||||||||||
2.1 | 0.1 | 25.4 | 21.6 | 47.0 | — | |||||||||||||||||||||
Primrose Holding Corporation | Common Stock | — | — | 3.4 | 1.2 | — | 4.6 | |||||||||||||||||||
Qualitor Component Holdings, LLC | Redeemable Preferred Units | 1.5 | — | 2.1 | 4.7 | 6.8 | — | |||||||||||||||||||
Common Units | — | — | — | — | — | — | ||||||||||||||||||||
1.5 | — | 2.1 | 4.7 | 6.8 | — | |||||||||||||||||||||
The Tensar Corporation | Senior Debt | 9.4 | — | 106.0 | 9.9 | 115.9 | — | |||||||||||||||||||
Convertible Preferred Stock | (16.9 | ) | — | 79.2 | 25.1 | 104.3 | — | |||||||||||||||||||
Common Stock Warrants | — | — | — | — | — | — | ||||||||||||||||||||
(7.5 | ) | — | 185.2 | 35.0 | 220.2 | — | ||||||||||||||||||||
WFS Holding, LLC | Preferred Membership Units | 0.1 | — | 2.6 | 1.8 | 4.4 | — | |||||||||||||||||||
EUROPEAN CAPITAL AFFILIATE INVESTMENTS | ||||||||||||||||||||||||||
Blue Topco GmbH | Senior Debt | 0.1 | — | — | 2.2 | 0.1 | 2.1 | |||||||||||||||||||
Mezzanine Debt | — | — | — | 2.6 | — | 2.6 | ||||||||||||||||||||
0.1 | — | — | 4.8 | 0.1 | 4.7 | |||||||||||||||||||||
Mobipark S.A.S. | Senior Debt | — | — | — | 2.2 | — | 2.2 | |||||||||||||||||||
Convertible Preferred Stock | — | — | — | 1.7 | — | 1.7 | ||||||||||||||||||||
Redeemable Preferred Stock | — | — | — | 4.4 | — | 4.4 | ||||||||||||||||||||
— | — | — | 8.3 | — | 8.3 | |||||||||||||||||||||
Subtotal Affiliate Investments | $ | (3.4 | ) | $ | 0.1 | $ | 281.6 | $ | 78.6 | $ | 334.7 | $ | 25.5 | |||||||||||||
Total Control and Affiliate Investments | $ | 259.7 | $ | 301.3 | $ | 3,986.7 | $ | 2,546.3 | $ | 3,725.1 | $ | 2,807.9 | ||||||||||||||
(1) | Certain of the securities are issued by affiliate(s) of the listed portfolio company. |
(2) | Represents the total amount of interest or dividends credited to income for the portion of the year an investment was included in Control or Affiliate categories. Includes payment-in-kind (“PIK”) interest or dividends. |
(3) | Other includes interest, dividend, or other income which was applied to the cost basis of the investment and therefore reduced the total investment. These reductions are also included in the Gross Reductions for the investments, as applicable. |
(4) | Gross additions include increases in the cost basis of investments resulting from new portfolio investments, PIK interest or dividends, the amortization of discounts and closing fees and the exchange of one or more existing securities for one or more new securities. Gross additions also include net increases in unrealized appreciation or net decreases in unrealized depreciation as well as allowances for discounts, closing fees, and PIK interest or dividends accrued during the year. |
(5) | Gross reductions include decreases in the cost basis of investments resulting from principal repayments or sales and the exchange of one or more existing securities for one or more new securities. Gross reductions also include net increases in unrealized depreciation or net decreases in unrealized appreciation as well as allowances for PIK interest and dividends recognized in prior periods. |
(6) | As of December 31, 2013, the portfolio company was classified as a Non-Control Investment. As of December 31, 2014, ACAS now has more than 25% voting interest or has greater than 50% representation of the board of directors of the portfolio company and is therefore classified as a Control Investment. |
(7) | As of December 31, 2013, the portfolio company was classified as an Affiliate Investment. As of December 31, 2014, ACAS now has more than 25% voting interest or has greater than 50% representation of the board of directors of the portfolio company and is therefore classified as a Control Investment. |
(8) | The portfolio company, which was classified as a Control Investment, was exited as of December 31, 2013. During the year ended December 31, 2014, ACAS collected additional PIK dividends and recognized income in excess of the amount accrued at the time of exit. |
** | Information related to the amount of equity in the net profit and loss for the period for the investments listed has not been included in this schedule. This information is not considered to be meaningful due to the complex capital structures of the portfolio companies, with different classes of equity securities outstanding with different preferences in liquidation. These investments are not consolidated, nor are they accounted for under the equity method of accounting. |
127