Attached files
| file | filename |
|---|---|
| EX-23.1 - KPMG CONSENT - RADISYS CORP | ex231kpmgconsent2014.htm |
| EX-32.1 - CEO 906 CERTIFICATION - RADISYS CORP | ex321906ceocertification20.htm |
| EX-31.2 - CFO 302 CERTIFICATION - RADISYS CORP | ex312302cfocertification20.htm |
| EX-32.2 - CFO 906 CERTIFICATION - RADISYS CORP | ex322906cfocertification20.htm |
| EX-12.0 - COMPUTATION OF RATIO OF EARNINGS TO FIXED CHARGES - RADISYS CORP | ex120computationofratioofe.htm |
| EX-21.1 - LIST OF SUBSIDIARIES - RADISYS CORP | ex211listofsubsidiaries123.htm |
| EXCEL - IDEA: XBRL DOCUMENT - RADISYS CORP | Financial_Report.xls |
| EX-31.1 - CEO 302 CERTIFICATION - RADISYS CORP | ex311302ceocertification20.htm |
UNITED STATES
SECURITIES AND EXCHANGE COMMISSION
Washington, D.C. 20549
__________________________________
Form 10-K
__________________________________
x | ANNUAL REPORT PURSUANT TO SECTION 13 OR 15(d) OF THE SECURITIES EXCHANGE ACT OF 1934 For the fiscal year ended December 31, 2014 |
Or
o | TRANSITION REPORT PURSUANT TO SECTION 13 OR 15(d) OF THE SECURITIES EXCHANGE ACT OF 1934 For the transition period from to . |
Commission file number 0-26844
__________________________________
RADISYS CORPORATION
(Exact name of registrant as specified in its charter)
__________________________________
Oregon | 93-0945232 | |
(State or other jurisdiction of incorporation or organization) | (I.R.S. Employer Identification Number) | |
5435 N.E. Dawson Creek Drive, Hillsboro, OR | 97124 | |
(Address of principal executive offices) | (Zip Code) | |
Registrant’s telephone number, including area code | (503) 615-1100 | |
Securities registered pursuant to Section 12(b) of the Act:
Title of each Class | Name of each exchange on which registered | |
Common Stock, No Par Value | The NASDAQ Stock Market LLC | |
Securities registered pursuant to Section 12(g) of the Act:
None
____________________________________________________________________
Indicate by check mark if the registrant is a well-known seasoned issuer, as defined in Rule 405 of the Securities Act. Yes o No x
Indicate by check mark if the registrant is not required to file reports pursuant to Section 13 or Section 15(d) of the Act. Yes o No x
Indicate by check mark whether the registrant (1) has filed all reports required to be filed by Section 13 or 15(d) of the Securities Exchange Act of 1934 during the preceding 12 months (or for such shorter period that the registrant was required to file such reports), and (2) has been subject to the filing requirements for the past 90 days. Yes x No o
Indicate by check mark whether the registrant has submitted electronically and posted on its corporate Web site, if any, every Interactive Data File required to be submitted and posted pursuant to Rule 405 of Regulation S-T (§232.405 of this chapter) during the preceding 12 months (or for such shorter period that the registrant was required to submit and post such files). Yes x No o
Indicate by check mark if disclosure of delinquent filers pursuant to Item 405 of Regulation S-K is not contained herein, and will not be contained, to the best of registrant’s knowledge, in definitive proxy or information statements incorporated by reference in Part III of this Form 10-K or in any amendment to this Form 10-K. o
Indicate by check mark whether the registrant is a large accelerated filer, an accelerated filer, a non accelerated filer, or a smaller reporting company. See definition of “large accelerated filer,” “accelerated filer” and “smaller reporting company” in Rule 12b-2 of the Exchange Act.
Large Accelerated Filer o | Accelerated Filer x | |
Non-accelerated filer o (Do not check if a smaller reporting company) | Smaller Reporting Company o | |
Indicate by check mark whether the registrant is a shell company (as defined in Rule 12b-2 of the Exchange Act) Yes o No x
The aggregate market value of the voting and non-voting common equity held by non-affiliates (based upon the closing price of the NASDAQ Global Select Market on June 30, 2014 of $3.49) of the registrant as of June 30, 2014 was approximately $126,188,960. For purposes of the calculation executive officers, directors and holders of 10% or more of the outstanding common stock are considered affiliates.
Number of shares of common stock outstanding as of February 25, 2015: 36,699,420
DOCUMENTS INCORPORATED BY REFERENCE
Portions of the registrant's Proxy Statement for the 2014 Annual Meeting of Shareholders are incorporated by reference into Part III of this report.
RADISYS CORPORATION
FORM 10-K
TABLE OF CONTENTS
Page | ||
2
PART I
Item 1. Business
General
Radisys Corporation (NASDAQ: RSYS), the services acceleration company, helps communications and content providers as well as their strategic partners create new revenue streams and drive cost out of their services delivery infrastructure. Radisys’ application aware traffic distribution platforms, real-time media processing engines and wireless access technologies enable service providers to maximize, virtualize and monetize their networks. These products, in addition to our Embedded Products and expert professional services organization, help accelerate our customer's ability to bring high-value telecom applications to market faster and with lower investment and risk. Beginning in early 2015, our products and services are broken into two operating segments: Software-Systems and Embedded Products and Hardware Services.
• | Software-Systems (previously referred to as Software and Solutions) is comprised of the following product families: |
◦ | FlowEngine, our recently announced product-line targeting the communication and content provider traffic management market, is a family of products designed to classify and intelligently distribute session data flows to appropriate network processing resources in new virtualized network functions ("NFV") based architectures. FlowEngine products enable communication and content service providers to efficiently transition towards NFV architectures by integrating a targeted subset of edge routing, data center switching, and load balancing functionality along with software-defined networking ("SDN") control. Our purpose-built appliances include only the specific functionality from these stand-alone devices needed to meet NFV architectures which will enable our customers to reduce significantly the investment necessary to efficiently process data flows in virtualized communications environments. |
◦ | MediaEngine products (previously referred to as Media Resource Function or MRF) are designed into the IMS core of telecom networks and provide the necessary media processing capabilities required for applications such as audio conferencing, Voice over Long-Term Evolution ("VoLTE"), Voice over WiFi (“VoWifi”), Rich Communications Services (“RCS”) and Web Real-Time Communication ("WebRTC"). We sell a complete high density system, the MediaEngine MPX-12000, as well as a virtualized software-only vMRF when our customers choose other lower-density processing platforms. As carriers consolidate network capacity from older (3G and 2G) architectures onto new LTE architectures, they will deploy VoLTE applications. Our MediaEngine provides the needed media processing capability that delivers audio, video or other multimedia modalities over LTE wireless networks. |
◦ | CellEngine software (previously referred to as Trillium), which includes our TotalENodeB LTE and Femtotality 3G software products, is targeted at providing the communication linkage between wireless end user devices and small cell base stations that mobile carriers are deploying to optimize wireless network spectrum utilization and coverage. Our focus is providing software applications which enable small 3G and LTE operator-controlled, low-power wireless base stations (known as small cells, femtocells, enterprise femtocells and picocells) that enable improved cellular coverage and capacity for homes and enterprises as well as metropolitan and rural areas. Additionally, we leverage our CellEngine technology to enable small cell applications to capture share in adjacent markets such as aerospace and defense as well as manufacturing and test environments. |
◦ | Also included in this segment is our Professional Service organization which is staffed with telecommunications experts who are available to assist our customers as they develop their own unique telecommunications products and applications. Our strategy is to enable the efficient and cost effective adoption of our Software-Systems products as customers integrate them into complete systems. |
• | Embedded Products and Hardware Services (comprising the product-lines previously referred to as ATCA, COMe/RMS and Other Products) are predominantly hardware based products that enable the control and movement of data in both 3G and LTE telecom networks. Our products enable network elements for applications such as Deep Packet Inspection ("DPI"), policy management and intelligent gateways (security, femto and LTE gateways). Our professional service organization of network experts accelerates our customers' time to market on these revenue generating assets. |
3
Unless required by context, or as otherwise indicated, “we,” “us,” “our” and similar terms, as well as references to the “Company” and “Radisys” refer to Radisys Corporation and include all of our consolidated subsidiaries.
Segments
Early in 2015, we implemented strategy and organizational changes resulting in a focus in two core areas: Software-Systems and Embedded Products and Hardware Services. As a result of these changes, the information our Chief Executive Officer, or chief operating decision maker, regularly reviews for purposes of allocating resources and assessing performance changed. Beginning in fiscal year 2015, we will report our financial performance in two segments: Software- Systems and Embedded Products and Hardware Services. To enable a historical comparison to prior year financial performance, we are reporting supplementary financial performance for the years ended December 31, 2014, 2013 and 2012 in our new operating segments.
Prior to the change in February of 2015, we operated as one segment as determined by the way management made operating decisions and assessed financial performance.
See Note 18 — Segment Information of the Notes to the Consolidated Financial Statements for segment information.
Market Drivers
Our Software-Systems products uniquely position us to capitalize on the upcoming global deployments of VoLTE applications and the need to optimize the capacity and coverage of various communication networks. In addition, as computer hardware continues to become more commoditized and carriers respond by moving away from purpose-built network elements to a virtualized architecture, the demand for devices that ensure the efficient and cost effective flow of ever increasing amounts of data is expected to grow significantly; specifically, demand for data and video traffic continues to expand exponentially as a result of increasing usage of smart phones, tablets and other wireless devices. In this evolving market, success demands a deep expertise in deploying fully integrated custom wireless applications. The key market drivers that we view as fundamental to our future success include the following:
• | Virtualizing the Core Network. Operators are continually looking to increase average revenue per user, while reducing cost to accelerate the deployment of new and exciting revenue-generating features. NFV and SDN are two capabilities that form the basis for the next generation telecom cloud. As carriers, cable providers, and other communications services providers role-out NFV and SDN architecture to commoditize the hardware in their network, and thereby dramatically reduce capital and operating expenses, there will inevitably be data-plane "choke points" in any implementation. Radisys believes it has identified a substantial data plane "choke point" which would thwart the QoS/QoE end user demands. Our FlowEngine technology, combining critical functionality of edge routers, ToR data center switching, and stateful load balancing capabilities, can alleviate this "choke point". These products will enable our customers to accelerate new service introduction in scalable SDN-enabled networks, while significantly reducing network complexity and required investment. The ability to understand and distribute data flows in NFV and SDN architectures ensures our FlowEngine products accelerate our customers' cost effective adoption of virtualized networks. The FlowEngine TDE-1000 Intelligent Load Balancer is the introductory product in this family and marries key data plane functionality found in today’s edge routers, top-of-rack ("ToR") switches and load balancers with flow management that can aggregate traffic by user, user group or traffic type under SDN policy control to create new instances and enforce QoS/traffic management for legacy and new application flows. This focused mix of capabilities, combined with high performance, throughput and flexibility, makes the TDE-1000 a key building block that complements both legacy and SDN/NFV infrastructure. |
• | Monetizing VoLTE and Video. Operators are continuing to deploy revenue generating applications for next generation LTE networks such as VoLTE, VoWiFi, WebRTC, Multimedia Conferencing, Mobile Value Added Services, Voice over IP ("VoIP") and Video over IP Communications. This growing variety of services and access technologies also introduces new high definition audio and video codecs into the network, driving a need for transcoding audio streams encoded using different codec standards, or trans-rating video streams to connect an HD large screen video terminal to a mobile device with a smaller screen or slower network connection. In next generation IMS architectures, it is the MRF that performs the intensive audio and video media packet processing, providing the underlying foundation that enables delivery of these customer applications. Our vMRF is designed to run in a virtualized environment, while the Media Engine MPX-12000 is an advanced multimedia resource function for LTE IMS that provides the scalable IP media processing required for high capacity VoLTE, HD video and multimedia transcoding. |
4
• | Maximizing spectrum utilization. Wireless spectrum is a limited resource over which data is transferred. Wireless network providers require continual technology advancements to allow increasing amounts of data to be transferred over the same band of wireless spectrum. The deployment of small cells, the emergence of heterogeneous networks ("HetNets") and the leap towards LTE-Advanced promises to further enhance spectrum utilization. The ability to take advantage of the possible spectrum available, such as FDD, TDD and non-continuous bands, is increasingly important for operators as they seek to deliver increased capacity and performance to their subscribers. These trends are making networks more efficient, increasing capacity and coverage, and enabling operators to more readily monetize mobile broadband usage. Our CellEngine products accelerate time to market by providing deployment proven standards compliant small cell protocol and application software for 3G HSPA+, LTE-FDD, LTE-TDD and LTE Advanced wireless and wireline networks. |
Our CellEngine lineup of products which includes Total eNodeB and Femtotality are a complete software suite that supports the latest standards (such as LTE-Advanced), and are deployment proven for both 3G and LTE networks and is pre-integrated with leading specialized small cell silicon for use by small cell gateway manufacturers or mobile network operators. Beyond small cell software, we provide an extensive portfolio of products and capabilities spanning from the RAN to the core network. We also provide value-added applications that enable bandwidth optimization and maximizes the network life of networks, such as monitoring traffic offload and load balancing. Our customers are able to leverage our proven CellEngine software interoperability and stability which enables them to focus on their own differentiation.
In addition to these fundamental market growth drivers, we believe the traditional embedded hardware market, specifically in telecom where our Embedded Products and Hardware Services products are targeted, has been under significant pressure over the last several years. The industry has experienced increased hardware commoditization that, along with SDN and NFV trends and the improved capability of a data center like topology, has permanently changed telecom’s embedded hardware industry. This has resulted in the continued contraction of the overall market for these technologies. In this environment, it is necessary to narrow our focus and investment to those strategic partnerships with key customers that value the quality, technology and extended support we provide and results in consistent profitability.
Our Strategy
Our strategy is to help communications and content providers, and their strategic partners, create new revenue streams and drive cost out of their services delivery infrastructure. Radisys’ service aware traffic distribution platforms, real-time media processing engines and wireless access technologies enable its customers to maximize, virtualize and monetize their networks. Our top strategic priories are:
• | Providing our FlowEngine product, the TDE-1000, which is designed to accelerate new service introduction in a scalable SDN-enabled networks while significantly reducing network complexity and required investment. The explosion of video, broadband mobile devices and the Internet has led to millions of data flows traversing the packet network. Content and service providers are keen to manage and monetize these broadband data flows. The service-aware TDE-1000 intelligently distributes data flows to only the Virtualized Network Function (VNF) resources applicable to each session’s processing requirements, such as video optimization, encryption or policy enforcement, and does so at line-rate speeds. Targeted specifically for communications and content providers that want more control and flexibility in their network, the TDE-1000 is interoperable with SDN controllers and provides unmatched flexibility, control and maximum efficiency. |
• | Providing our carrier grade MediaEngine products, the MediaEngine MPX-12000 and vMRF, that furnish the media processing capabilities necessary for our customers' VoLTE deployments, transcoding needs and early WebRTC work, while at the same time maintaining our market position in legacy audio conferencing applications. |
• | Providing CellEngine technology based systems that optimize carrier utilization of wireless spectrum through the deployment of small cell based wireless access points. We also seek to maximize the market potential of this technology beyond dedicated small cell applications to adjacent markets such as defense and aerospace, manufacturing and test markets that utilize the same underlying technology. |
• | Providing Embedded Products and Hardware Services to only those key strategic customers' who also value the quality, technology and extended support we provide, and who have adequate scale that meets our profitability objectives. This strategy will enable us to generate meaningful profitability and cash over the coming years, |
5
enabling the investment required to fuel our Software-Systems growth, while also continuing to support and win new business with our critical embedded products customer base.
We believe we are positioned to address the needs of our customers by:
• | Providing the technology that our customers require to meet the needs of continually evolving LTE networks and the move to software defined virtualized networks. Our MediaEngine, CellEngine and FlowEngine families of products leverage our unique technology and capabilities in media processing, protocol signaling and traffic management that our customers value, and enables them to focus on their own differentiating and value-added applications. |
• | Accelerating time-to-market for our customers. We offer standards-based, turn-key products such as our carrier grade MediaEngine MPX-12000, vMRF virtualized software, CellEngine software and our FlowEngine product line. We believe these products, combined with our strong expert telecom resources, provide OEM customers with significant time-to-market advantages when compared to systems developed internally and other competing technologies. |
• | Lowering total cost-of-ownership for our customers. We believe our products and service capabilities provide a lower total cost-of-ownership to our customers by reducing research and development and support costs when compared to utilizing their own internal development resources. By leveraging our expertise and development resources, our customers minimize integration risk and can focus their precious development resources on their own differentiating value-added applications. |
Our Products
Our portfolio of products addresses a variety of customer requirements. We have differentiated our products into the following segments:
• | Software-Systems. Software-Systems (previously referred to as Software and Solutions) is comprised of three product families: FlowEngine, MediaEngine and CellEngine. |
◦ | FlowEngine. Our new FlowEngine product-line consists of traffic distribution products designed for deployment in communication and content provider traffic management markets. The key role of these products is to classify session data flows, and intelligently distribute these flows to appropriate network processing resources. Included in the FlowEngine product family today is the Traffic Distribution Engine ("TDE") network appliance product, the TDE-1000. The appliance employs high performance packet classification and flow-based load balancing to offload complex data plane processing from physical and VNFs. By doing so, this appliance allows telecommunication service providers to efficiently transition towards a NFV architecture for providing subscriber services. |
Our TDE-1000 reduces service provider network costs by integrating a targeted subset of data plane features related to edge routing, data center switching, and load balancing along with SDN control. Key service provider use cases include traffic steering to dedicated network resource platforms such as video optimization and content caching, service function chaining for a pool of VNFs, and SDN-controlled traffic load balancing in packet optical networks.
◦ | Media Engine. Our family of MediaEngine products are powerful, reusable and highly scalable multimedia processing systems that enable audio and video conferencing, VoLTE, VoIP and mobile video services across next generation wireless networks. We sell our Media Engine products to telecommunication service providers, telecom equipment manufacturers, wireless operators, real-time communication system developers, OEM and enterprise customers. |
Our MediaEngine products also enable the convergence of fixed and mobile networks by delivering a shared media processing resource for any access network, including 4G/LTE wireless, broadband, cable, public switched telephone network ("PSTN") or satellite. The system's multi-service versatility enables service providers, as well as their application development and network infrastructure partners, to rapidly deploy innovative high-margin telecommunications services which include multimedia conferencing, ringback tones, unified communications and contact center applications. Our voice quality enhancement ("VQE") group of features is specifically designed to address noise, packet loss, and echo in VoIP
6
networks, which enhances the usability and differentiation of VoIP services. We believe ongoing investments in our Video over IP capabilities and densities will help grow our business from serving VoIP audio services into high value video enabled and mobile services. We also invest in IP-IP transcoding, transrating, and media conditioning features, to address growing scalability requirements to achieve seamless IP media stream interworking between 3G mobile, VoLTE IMS, Over-The-Top ("OTT"), and emerging WebRTC services and networks.
Our MediaEngine product family consists of the MediaEngine MPX-12000, a hardware-based fault-resilient MRF, as well as our MRF software, vMRF, designed for Linux servers and virtualized cloud deployments. vMRF provides a common media processing foundation for all of our MediaEngine products, ensuring identical media processing features, control interface, and management capabilities across the Media Engine product family, providing a unique value proposition to our customers.
◦ | CellEngine. Our CellEngine software protocols and applications are the underlying signaling and data infrastructure that enables the linkage between wireless end user devices and network base station access points. Today, CellEngine software is focused primarily on enabling 3G and LTE wireless network access. In addition, CellEngine supports various types of network infrastructure from access to the core of the network and from wireless to wireline networks. |
CellEngine products are the foundation for many 3G and LTE small cell products. Small cells enable mobile operators to increase network capacity, improve coverage and reduce the cost per bit of data traffic. Our products for 3G (Femtotality) and LTE (TOTALeNodeB) are complete applications that are integrated on specialized small cell silicon platforms and ultimately embedded in wireless base stations. This modular approach accelerates time-to-market and provides Radio Resource Management ("RRM"), Self-Organizing Networks ("SON"), and Operations, Administration and Maintenance ("OA&M") modules critical to customer's deployments. Our TOTALeNodeB software is the foundation for some of the world's first commercial LTE small cell deployments, including mobile operators in South Korea.
In addition, we believe our CellEngine product family allows customers to simplify their next generation networks, such as IMS and packet core networks, by addressing network providers' common interoperability, security, quality of service and legacy interworking concerns.
• | Embedded Products and Hardware Services. Our Embedded Products and Hardware Services provide customers with hardware based products necessary to control and move data in the telecom network, and enable network elements and applications such as Deep Packet Inspection ("DPI") and policy management. |
◦ | T-Series ATCA Platforms. Our T-Series ATCA product family includes a suite of fully integrated, application ready, software-rich hardware products that are largely ATCA based and modular in nature and enable configuration for a wide variety of applications. As a common managed platform, we believe our T-Series ATCA platforms provide carriers with faster time to market as well as reduced service and support costs on the network elements they deploy. |
Based on the standard ATCA form factor, the T-Series ATCA platforms integrate a number of key products and applications to enable functions within the wireless network core. These products are comprised of carrier blades, chassis, disk modules, line cards, and processing and switch modules. Specific functionality provided by our ATCA products includes:
* | Computing/Switching. These blades provide the essential functionality necessary to enable sophisticated applications such as traffic shaping, internet offload, load balancing, and security gateways. |
* | Network Processing. These products allow our customers, through the application of DPI, to analyze packets of data traveling across wireless networks and create protocols to manage the data flow. This functionality is required by telecommunications and network providers as they seek to improve the efficiency and revenue-generating capability of their networks. |
* | Digital Signal Processing. These products provide the key functionality required for audio, digital, and video signal compression, transcoding and transmission across wireless networks. |
7
* | Platform Software. This software, embedded within our T-Series ATCA platforms, enables the interoperability of the various elements within our T-Series systems and is an essential strategic element that allows our customers to focus on the value-added applications that utilize T-Series compute power. It also provides a single point of management for the entire platform as well as providing switch management, switch redundancy and load balancing. |
◦ | COM Express and Rackmount Servers. These products are targeted primarily at the medical imaging, test and measurement, and aerospace and defense markets. We have two primary product families in this category: |
▪ | Computer-on-Module Express. COM Express products are small form factor compute modules designed for applications that require a standard processor and memory subsystem, but also modular flexibility to retain key design-level IP on a separate carrier board. We believe our standards-based COM Express modules help equipment manufacturers shorten their time to market and reduce development costs. By making processor, chipset and memory independent of the rest of the system design, manufacturers can focus engineering resources on developing differentiating features and avoid the design turnover that comes with implementing new processor generations. |
▪ | Rack Mount Servers. Our enabling Rackmount Servers specialize in meeting the needs of specific applications that are designed to be the central control point of a larger integrated system. Medical imaging and diagnostic systems are examples of systems that incorporate these enabling servers. |
◦ | Other Products. These products comprise our remaining product offerings not specifically included in the above categories. These products are primarily custom built pre-ATCA based telecommunication products based on earlier technology standards. |
Competition
We face competition from four primary types of competitors:
• | Our target customers. Our primary competition is from our existing and potential future customers who choose to remain vertically integrated and internally develop their own enabling technology. |
• | Software- Systems. Our primary competitors in the enabling software systems market, into which our CellEngine software is sold, are Aricent Group and NodeH. We face competition in the MediaEngine market from Dialogic. |
• | Embedded Products and Hardware Services. Our competitors in this space include Artesyn Embedded Technologies, Advantech Co, ADLink Technologies and Kontron AG. |
We believe the main competitive factors are product performance, quality, service, time to market, ability to respond to technological change and/or price. Our system level architecture and design expertise coupled with our broad technology portfolio, flexibility in working intimately with system makers, and our ability to combine commercial off the shelf platforms with networking software and services to complete systems, enable product differentiation when compared to our competition. We believe our rapid design cycles and standards-based systems paired with our design and manufacturing presence in low cost geographies will provide customers with a time to market advantage at a lower total cost.
Customers
Our customers include many leading manufacturers who sell their products into a variety of end markets. Examples of these customers include: Aastra, Alcatel Lucent, Arris, Arrow Electronics, AT&T (fulfilled through Nokia Solutions and Networks), Danaher Corporation, Ericsson LG, Interdigital, Italtel, Lestina International, Litepoint, Mavenir (fulfilled partially through Unicom), Nanjing Linuoruite Technology Co., NEC, Nokia Solutions and Networks, Philips Healthcare, Rivada Networks, Unicom, Verint Systems, and West Corporation.
8
Our five largest customers, accounting for approximately 51% of revenues in 2014, are listed below with an example of the type of application which incorporates our products:
Customer | Application / End Customer | |
Nokia Solutions and Networks | 2, 2.5, and 3G wireless infrastructure equipment incorporated into Nokia Solutions and Networks as well as conferencing solutions sold through to the carrier AT&T | |
Philips Healthcare | Medical imaging equipment | |
NEC Corporation | ATCA systems for use in 3G and 4G wireless solutions for use in NEC applications | |
Danaher Corporation | Network performance monitoring equipment and network security | |
UNICOM | Network integration, engineering and logistical support | |
Nokia Solutions and Networks was our largest customer in 2014, accounting for 17% of 2014 revenues.
Supply Chain Operations
Our manufacturing is fully outsourced to a single contract manufacturing partner in Asia as we believe utilizing a contract manufacturing partner provides product cost advantages. We presently have offices in Shenzhen, China and Hillsboro, Oregon which oversee the supply chain management, manufacturing, integration and product testing and quality efforts conducted by our contract manufacturing partner. We also have integration facilities in Shenzhen, China for the final integration, testing and delivery of certain ATCA and MediaEngine systems. We transferred our contract manufacturing from Penang to Shenzhen during 2014 in order to realize further operational efficiencies to a new contract manufacturing partner, Ennoconn Corporation, in Shenzhen. This action allowed us to consolidate our Asian footprint into a single internal site within Shenzhen and enabled further cost savings by reducing our headcount in support of our contract manufacturing partner.
Professional Services
Our professional services organization actively partners with our customers in the development of Software-Systems technology features across our product portfolio to provide next generation architecture, product development engineering and development verification. Integration and testing services include validation, certification and network integration, support and training. Additionally, we offer deployment services such as branding, cost management and lifecycle management. Total professional services headcount located in our Bangalore, India facility was 124 as of December 31, 2014.
Research and Development
Because the industries in which we compete are characterized by rapid technological advances, our ability to compete successfully depends heavily upon our ability to ensure a continual and timely flow of competitive products, services and technologies to the marketplace. We continue to develop new technologies to enhance existing products and expand the range of our product offerings through research and development, licensing of intellectual property and acquisition of third-party businesses and technology. Our research and development ("R&D") staff consisted of 418 engineers and technicians as of December 31, 2014 located in the U.S, Canada, China, and India. R&D expense in 2014, 2013 and 2012 was $32.0 million, $45.0 million and $47.7 million.
Sales, Marketing and Service
Our products are sold through a variety of channels, including direct sales, distributors, sales representatives, and system integrators. Our sales teams, in conjunction with our product marketing and product development teams, collaborate with customers to accelerate product development and achieve higher quality, lower development and product cost and faster time to market for their products. Our total direct sales and marketing headcount was 77 as of December 31, 2014.
We market and sell our products in North America, Europe, Middle East and Africa ("EMEA") and Asia Pacific. In each of these geographic markets, products are sold principally through a direct sales force located in the U.S., Canada, Europe, China, Japan, India, and Korea. In addition, our direct sales team is supplemented with indirect sales representatives, which cost-effectively broadens our addressable markets and enables access to additional customers where we do not have a direct presence. In 2014, global revenues were comprised geographically as follows: 40% from North America, 22% from EMEA and 38% from Asia Pacific. See Note 18—Segment Information of the Notes to the Consolidated Financial Statements for financial information by geographic area and financial information regarding revenues of classes of similar products.
9
We have a worldwide hardware services organization focused on meeting our customers' needs for hardware repair, system integration, and training. In addition, if required by our customers, we provide technical support and maintenance service for Embedded Products and Hardware Services and Software and Systems products due to the software-rich content of the products. Certain customers enter into technical support and maintenance service agreements which provide access to product upgrades and enhancements over the life of the contract as such releases become generally available.
Backlog
As of December 31, 2014, our backlog was approximately $34.5 million, compared to $34.3 million as of December 31, 2013. We include in our backlog only unshipped purchase orders scheduled for delivery within the next twelve months.
Intellectual Property
We hold 42 U.S. and 30 foreign utility patents, and have 3 U.S. and 5 foreign patent applications pending. We also rely on copyrights, trademarks, trade secrets, know-how and rapid time to market for protection and leverage of our intellectual property. We have from time to time been made aware of others in the industry who assert exclusive rights to certain technologies, usually in the form of an offer to license certain rights for fees or royalties. Our policy is to evaluate such claims on a case-by-case basis. We may seek to enter into licensing agreements with companies having or asserting rights to technologies if we conclude that such licensing arrangements are necessary or desirable in developing specific products.
Employees
As of December 31, 2014, we had 859 employees, comprised of 817 regular employees and 42 temporary employees or contractors. We are not subject to any collective bargaining agreements, have never been subject to a work stoppage, and believe we have maintained good relationships with our employees.
Corporate History
Radisys Corporation was incorporated in March 1987 under the laws of the State of Oregon. Our principal offices are located at 5435 N.E. Dawson Creek Drive, Hillsboro, OR 97124; our telephone number is (503) 615-1100. Our website address is www.radisys.com.
INTERNET INFORMATION
Copies of our Annual Report on Form 10-K, Quarterly Reports on Form 10-Q, Current Reports on Form 8-K, and amendments to those reports filed or furnished pursuant to Section 13(a) or 15(d) of the Securities Exchange Act of 1934 (the “Exchange Act”) are available free of charge through our website (www.radisys.com) as soon as reasonably practicable after we electronically file the information with, or furnish it to, the Securities and Exchange Commission (the “SEC”). Reports filed with the SEC may be obtained on the SEC website (http://www.sec.gov) or may be read and copied at the SEC’s Public Reference Room at 100 F Street, NE, Washington, DC 20549. Further information about the Public Reference Room may be obtained by calling the SEC at 1-800-SEC-0330.
We have adopted Corporate Governance Guidelines for our Board of Directors and a Code of Conduct and Ethics (“the Code”) for our Board of Directors, our Chief Executive Officer, principal financial and accounting officers and other persons responsible for financial management and our employees generally. We also have charters for the Audit Committee, Compensation and Development Committee, Nominating and Corporate Governance Committee and Strategic Oversight Committee of our Board of Directors. Copies of the above-referenced documents may be obtained on our website (www.radisys.com), and such information is available in print to any shareholder who requests it by contacting us at our corporate headquarters at (503) 615-1100. We intend to disclose future amendments to, or waivers from, certain provisions of the Code on our website or in a current report on Form 8-K. Information contained on the Company’s website is not included as part of, or incorporated by reference into, this report.
We also utilize a third party compliance website, EthicsPoint®, to provide our employees with a simple, risk-free way to anonymously and confidentially report actual or suspected activities that may involve financial or criminal misconduct or violations of the Code. This webpage is hosted on EthicsPoint’s secure servers and is not part of our website or intranet.
10
FORWARD-LOOKING STATEMENTS
This Annual Report on Form 10-K contains forward-looking statements. Some of the forward-looking statements contained in this report include:
• | the Company's business strategy; |
• | changes in reporting segments |
• | expectations and goals for revenues, gross margin, research and development ("R&D") expenses, selling, general and administrative ("SG&A") expenses and profits; |
• | the impact of our restructuring events on future operating results, including statements related to investments in future growth, expense savings or reduction or operational and administrative efficiencies; |
• | timing of revenue recognition; |
• | expected customer orders; |
• | our projected liquidity; |
• | future operations and market conditions; |
• | industry trends or conditions and the business environment; |
• | future levels of inventory and backlog and new product introductions; |
• | financial performance, revenue growth, management changes or other attributes of Radisys following acquisition or divestiture activities; and |
• | other statements that are not historical facts. |
All statements that relate to future events or to our future performance are forward-looking statements. In some cases, forward-looking statements can be identified by terms such as “may,” “will,” “should,” “expect,” “plans,” “seeks,” “anticipate,” “believe,” “estimate,” “predict,” “potential,” “continue,” “seek to continue,” “consider,” “intends,” or other comparable terminology. These forward-looking statements are made pursuant to safe-harbor provisions of the Private Securities Litigation Reform Act of 1995. These forward-looking statements involve known and unknown risks, uncertainties and other factors that may cause our actual results or our industries’ actual results, levels of activity, performance or achievements to be materially different from any future results, levels of activity, performance or achievements expressed or implied by these forward-looking statements.
These factors include, among others, the Company's high degree of customer concentration, the use of a single contract manufacturer for a significant portion of the production of our products, key employee attrition, the anticipated amount and timing of revenues from design wins and product orders due to the Company's customers' product development schedules, cancellations or delays, market conditions, matters affecting the telecom industry, including changes in industry standards, changes in customer requirements and new product introductions, currency exchange rate fluctuations, changes in tariff and trade policies and other risks associated with foreign operations, actions by regulatory authorities or other third parties, cash generation, the Company's ability to successfully complete any restructuring, acquisition or divestiture activities and other factors listed in Item 1A “Risk Factors” and in other reports we file with the SEC. Although forward-looking statements help provide additional information about us, investors should keep in mind that forward-looking statements are only predictions, at a point in time, and are inherently less reliable than historical information.
Forward-looking statements in this report include discussions of our goals, including those discussions set forth in Item 7, "Management's Discussion and Analysis of Financial Condition and Results of Operations". We cannot provide assurance that these goals will be achieved.
We do not guarantee future results, levels of activity, performance or achievements, and we do not assume responsibility for the accuracy and completeness of these statements. The forward-looking statements contained in this report are made and based on information as of the date of this report. We assume no obligation to update any of these statements based on information after the date of this report.
Item 1A. | Risk Factors |
There are many factors that affect our business and the results of our operations, many of which are beyond our control. The risks described in this report are not the only risks facing our Company. Additional risks and uncertainties not currently known to us or that we currently deem to be immaterial also may materially adversely affect our business, financial condition and/or operating results.
Because of the significant percentage of our sales to certain customers, the loss of, or a substantial decline in sales to, a top customer could have a material adverse effect on our revenues and profitability.
11
For 2014, 2013 and 2012 we derived 51%, 52%, and 53% of our revenues from our five largest customers during these periods. These five customers in 2014 were Arrow Electronics, Danaher Corporation, NEC Corporation, Nokia Solutions and Networks and Philips Healthcare, each of which purchase a variety of products from us. During 2014, 2013 and 2012, revenues attributable to our largest customer, Nokia Solutions and Networks, were 17%, 19% and 23%. Due to our significant customer concentration, our largest customers have additional pricing power over us that can adversely affect revenues and gross margins or cause us to exit lines of business with them that do not meet profitability objectives. Further, a financial hardship experienced by, or a substantial decrease in sales to, any one of these customers could materially affect our revenues and profitability. Generally, our products are components for our customers’ products and in certain instances our customers are not the end-users of our products. If any of these customers’ efforts to market the products we design and manufacture for them or the end products into which our products are incorporated are unsuccessful in the marketplace or if these customers experience a decrease in demand for such products, our design wins, sales and/or profitability will be significantly reduced. Furthermore, if these customers experience adverse economic conditions in the end markets into which they sell our products, we would expect a significant reduction in spending by these customers in addition to increasing our exposure to credit risk, which may limit our ability to collect. Some of these end markets are characterized by intense competition, rapid technological change and economic uncertainty and as such there is no guarantee that the revenues associated with the potential loss of a key customer will be replaced by the establishment of new business relationships. Our exposure to economic cyclicality and any related fluctuation in demand from these customers could have a material adverse effect on our revenues and financial condition.
We use one contract manufacturer to assemble certain products, and a loss or degradation in performance of our contract manufacturer could have a material adverse effect on our business or our profitability.
If our third party manufacturer fails to adequately perform, our revenues and profitability could be adversely affected. Among other things, inadequate performance by our contract manufacturer could include the production of products that do not meet our quality standards or schedule and delivery requirements and could cause us to manufacture products internally or seek additional sources of manufacturing. Additionally, our contract manufacturer may decide in the future to discontinue conducting business with us. If we are required to change contract manufacturers or assume internal manufacturing operations due to any termination of the agreements with our contract manufacturer, we may lose revenue, experience manufacturing delays, incur increased costs or otherwise damage our customer relationships. We cannot guarantee that we will be able to establish alternative manufacturing relationships on similar terms. Furthermore, our contract manufacturer could require us to move to another one of its production facilities. This could result in disruptions in our ability to fulfill customer orders during a transition and impact our ability to utilize our current supply chain and attain raw materials.
Additionally, if our contract manufacturer is responsible for patent or copyright infringement (including through the supply of counterfeit parts), we may or may not be able to hold them responsible and we may incur costs in defending claims or providing remedies. Such infringements may also cause our customers to abruptly discontinue selling the impacted products, which would adversely affect our net sales of those products, and could affect our customer relationships more broadly.
Our failure to develop and introduce new products and applications or enhancements to existing products and applications on a timely basis could harm our ability to attract and retain customers.
Our industry is characterized by rapidly evolving technology, frequent product introductions and ongoing demands for greater performance and functionality. Therefore, we must continually identify, design, develop and introduce new and updated products and applications with improved features to remain competitive. To introduce these products and applications on a timely basis we must:
• design innovative and performance-improving features that differentiate our products and applications from those of our competitors;
• identify emerging technological trends in our target markets, including new standards for our products and applications in a timely manner;
• accurately define and design new products and applications to meet market needs;
• anticipate changes in end-user preferences with respect to our customers’ products;
• rapidly develop and produce these products and applications at competitive prices;
• anticipate and respond effectively to technological changes or product announcements by others; and
• provide effective technical and post-sales support for these new products and applications as they are deployed.
The process of developing new technology products and applications and enhancing existing products and applications is complex, costly and uncertain. If we fail to anticipate our customers’ changing needs and emerging technological trends, our market share and results of operations could suffer. We must make long-term investments, develop or obtain appropriate
12
intellectual property and commit significant resources before knowing whether our predictions will accurately reflect customer demand for our products and applications. If we are unable to extend our core technologies into new applications and new platforms and to anticipate or respond to technological changes, the market’s acceptance of our products and applications could decline and our results would suffer. Additionally, any delay in the development, production, marketing or offering of a new product or application or enhancement to an existing product or application could result in customer attrition or impede our ability to attract new customers, causing a decline in our revenues, earnings or stock price and weakening our competitive position. We maintain strategic relationships with third parties to market certain of our products and applications and support certain functionality. If we are unsuccessful in establishing or maintaining our strategic relationships with these third parties, our ability to compete in the marketplace, to reach new customers and geographies or to grow our revenues would be impaired and our operating results would suffer.
Our future performance depends in part on the research and development efforts of third parties.
We purchase technology from a number of third parties that is used in the development of new software and hardware products. If our third party vendors fail to adequately develop new products that meet our specifications, timeliness and cost targets, our revenues and profitability could be adversely affected as we may be unable to meet our customer delivery commitments or maintain pace with the development efforts of our competitors.
Our ability, as well as our contract manufacturer's ability, to meet customer demand depends largely on our ability to obtain raw materials and a reduction or disruption in the availability of raw materials could negatively impact our business.
The recent global economic contraction has caused many of our component suppliers to reduce their manufacturing capacity. As the global economy improves, our component suppliers are experiencing and may continue to experience supply constraints until they expand capacity to meet increased levels of demand. These supply constraints may adversely affect the availability and lead times of components for our products. Increased lead times mean we may have to forsake flexibility in aligning our supply to customer demand changes and increase our exposure to excess inventory since we may have to order material earlier and in larger quantities. Further, supply constraints will likely result in increased expediting and overall procurement costs as we attempt to meet customer demand requirements. In addition, these supply constraints may affect our ability, as well as our contract manufacturer's ability to meet customer demand and thus result in missed sales opportunities and a loss of market share, negatively impacting revenues and our overall operating results.
Because of the limited number of direct, and indirect suppliers, or in some cases, one supplier, for some of the components we and our contract manufacturer use, a loss of a supplier, a decline in the quality and/or a shortage in any of these components could have a material adverse effect on our business or our profitability.
There are only a limited number of direct and indirect suppliers, or in some cases, only one supplier, for a continuing supply of the components our contract manufacturer uses in the manufacturing of our products and any disruption in supply could adversely impact our financial performance. For example, certain silicon is solely sourced from large silicon producers. We obtain these components from resellers, integrators and component manufacturers. Alternative sources of components that are procured from one supplier or a limited number of suppliers could be difficult to locate and/or would require a significant amount of time and resources to establish. We have in the past experienced and may in the future experience difficulty obtaining adequate quantities of key components used in certain of our products, which have resulted and may result in delayed or lost sales. Delayed sales can also result from our silicon vendors delays or cancellations of new technologies and products as these technologies and products are often designed into our new Radisys products before they are fully available from our suppliers. In addition, current economic conditions expose us to an increased risk of vendor insolvency, which, given our reliance upon a limited supply base, could result in an inability to procure adequate quantities of materials and components to meet our customers’ demand and/or ability to procure the quality of materials and components our customers require.
Political events, war, terrorism, public health issues, natural disasters and other circumstances could have a material adverse effect on our financial condition and operating results.
War, terrorism, geopolitical uncertainties, public health issues, and other business interruptions have caused and could cause damage or disruption to international commerce and the global economy, and thus could have a strong negative effect on our business and our suppliers, logistics providers, manufacturing vendors and customers, including channel partners. Our business operations are subject to interruption by natural disasters, fire, power shortages, nuclear power plant accidents, terrorist attacks, and other hostile acts, labor disputes, public health issues, and other events beyond our control. Such events could decrease demand for our products, make it difficult or impossible for us to make and deliver products to our customers, including channel partners, or to receive components from our suppliers, and create delays and inefficiencies in our supply
13
chain. Should major public health issues, including pandemics, arise, our business could be negatively affected by more stringent employee travel restrictions, additional limitations in freight services, governmental actions limiting the movement of products between regions, delays in production ramps of new products, and disruptions in the operations of our manufacturing vendors and component suppliers. The majority of our research and development activities and other critical business operations, including certain component suppliers and manufacturing vendors, are in locations that could be affected by natural disasters. In the event of a natural disaster, losses, significant recovery time and substantial expenditures could be required to resume operations and our financial condition and operating results could be materially adversely affected.
We intend to develop new products and applications and expand into new markets, which may not be successful and could harm our operating results.
We intend to expand into new markets and develop new products and applications based on our existing technologies integrated with new technologies organically developed or acquired such as our new FlowEngine product. These efforts have required and will continue to require us to make substantial investments, including but not limited to significant research, development and engineering expenditures. We plan to devote significant resources to the development of technologies and applications in markets where our operating history is less extensive. These new offerings and markets may require a considerable investment of technical, financial, compliance and sales resources, and a scalable organization. Some of our competitors may have advantages over us due to their larger presence, larger developer network, deeper market experience and larger sales, consulting and marketing resources. If we are unable to successfully establish new offerings in light of the competitive environment, our operating results may suffer. Additionally, many of the new products and applications we are working on may take longer and more resources to develop and commercialize than originally anticipated. Specific risks in connection with expanding into new products and markets include, but are not limited to, the inability to transfer our quality standards and technology into new products, the failure of customers to accept our new products, longer product development cycles and competition and intellectual property disputes. New products and applications could subject us to increased risk of liability related to the provision of services as well as cause us to incur significant technical, legal or other costs. We may not be able to successfully manage expansion into new markets and products and these unsuccessful efforts may harm our financial condition and operating results.
The segments of the software industry in which we participate are intensely competitive, and our inability to compete effectively could harm our business.
We experience significant competition from a variety of sources with respect to the marketing and distribution of our products and applications. Many of our competitors have greater financial, marketing or technical resources than we do and may be able to adapt more quickly to new or emerging technologies and changes in customer requirements or to devote greater resources to the promotion and sale of their products than we can. Increased competition could make it more difficult for us to maintain our market presence or lead to downward pricing pressure. In addition, the marketplace for new products and applications is intensely competitive and characterized by low barriers to entry. As a result, new competitors possessing technological, marketing or other competitive advantages may emerge and rapidly acquire market share. In addition, current and potential competitors may make strategic acquisitions or establish cooperative relationships among themselves or with third parties, thereby increasing their ability to deliver products and applications that better address the needs of our prospective customers. Current and potential competitors may also be more successful than we are in having their products or technologies widely accepted. We may be unable to compete successfully against current and future competitors, and our failure to do so could have a material adverse effect on our business, prospects, financial condition and operating results.
Our projections of future purchase orders, revenues and earnings are highly subjective and may not reflect future results which could negatively affect our financial results and cause volatility in the price of our common stock.
We have several contracts with most of our major customers but these contracts do not typically commit our customers to purchase a minimum amount of our products. These contracts generally require our customers to provide us with forecasts of their anticipated purchases. However, our experience indicates that customers may change their purchasing patterns quickly in response to market demands, changes in their management or strategy, among other factors, and therefore these forecasts may not be relied upon to accurately forecast sales. From time to time we provide projections to our shareholders and the investment community of our future sales and earnings. Because we do not have long-term purchase commitments from our major customers and the customer order cycle is short, it is difficult for us to accurately predict the amount of our sales and related earnings in any given period. Our projections are based on management’s best estimate of sales using historical sales data, information from customers and other information deemed relevant. These projections are highly subjective since sales to our customers can fluctuate substantially based on the demands of their customers and the relevant markets. Our period to period revenues have varied in the past and may continue to vary in the future.
14
Unanticipated reductions in purchase orders from our customers may also result in us having to write off excess or obsolete inventory. Conversely, if we underestimate customer demand or if insufficient manufacturing capacity is available or if our customers experience a financial hardship or if we experience unplanned cancellations of customer contracts, the current provision for inventory reserves may be inadequate and as a result we could forego revenue opportunities and potentially lose market share and damage our customer relationships. In addition and as stated above, we have a high degree of customer concentration. Any significant change in purchases by any one of our large customers may significantly affect our sales and profitability.
If demand for our products and applications fluctuates, our revenues, profitability and financial condition could be adversely affected. Important factors that could cause demand for our products and applications to fluctuate include:
• | changes in customer product needs; |
• | changes in the level of our customers’ inventory; |
• | changes in business and economic conditions; |
• | changes in the mix of products and applications we sell; and |
• | market acceptance of our products and applications. |
The price of our common stock may be adversely affected by numerous factors, such as general economic and market conditions, changes in analysts’ estimates regarding earnings as well as factors relating to the commercial systems and communication networking markets in general. We cannot accurately forecast all of the above factors. As a result, we believe that period-to-period comparisons may not be indicative of future operating results. Our operating results in any future period may fall below the expectations of public market analysts or investors.
Our business depends on conditions in primary markets into which we sell our products and applications. Demand in these markets can be cyclical and volatile, and any inability to sell products to these markets or forecast customer demand due to unfavorable or volatile market conditions could have a material adverse effect on our revenues and gross margin.
Generally, our products and applications are components for our customers’ products and, in certain instances, our customers are not the end-users of our products and applications. If our customers experience adverse economic conditions in the end markets into which they sell our products, we would expect a significant reduction in spending by our customers. Some of these end markets are characterized by intense competition, rapid technological change, consolidation of providers and economic uncertainty. Our exposure to economic cyclicality and any related fluctuation in customer demand in these end markets could have a material adverse effect on our revenues and financial condition. We are expanding into applications either through new product development projects with our existing customers or through new customer relationships, but no assurance can be given that this strategy will be successful.
In addition, customer demand for our products and applications is subject to significant fluctuation. A prolonged economic downturn in the business or geographic areas in which we sell our products could reduce demand for our products and applications and result in a decline in our revenue, gross margin and overall profitability. Volatility and disruption of financial and credit markets could limit our customers’ ability to obtain adequate financing to maintain operations and invest in network infrastructure and therefore could also reduce demand for our products and applications and result in a decline in our revenue, gross margin and overall profitability. If we overestimate demand, we may experience underutilized capacity and excess inventory levels. As such, if we underestimate demand, we may miss sales opportunities and incur additional costs for labor overtime, equipment overuse and logistical complexities. Additionally, we have adverse purchase commitment liabilities pursuant to which we are contractually obligated to place a deposit with our contract manufacturer for the cost of excess inventory used in the manufacture of our products and applications for which there is no forecasted or alternative use. Unexpected decreases in customer demand or our inability to accurately forecast customer demand could also result in increases in our adverse purchase commitment liability and have a material adverse effect on our gross margins and profitability.
Not all new design wins ramp into production, and even if moving into production, the timing of such production may not occur as we or our customers had estimated or the volumes derived from such projects may not be as significant as we had estimated, which could have a substantial negative impact on our anticipated revenues and profitability.
Our product revenue expectations are highly dependent upon successful ramping of our design wins. The time between when we achieve a design win with a customer and when we begin shipping to that customer at production levels generally has been shortened with our standards-based model. In some cases there is no time between when a design win is achieved and when production level shipments begin. With many new design wins with our ATCA platforms and our COM Express modules, customers may require us to provide customization of our products. In addition, customers may require significant time to port
15
their own applications to our systems. Customization of our products as well as porting of customer specific applications can take six to twelve months and in some circumstances can be as long as 24 months. After that, there is an additional time lag from the start of production ramp to peak revenue. Not all design wins ramp into production and, even if a design win ramps into production, the volumes derived from such projects may be less than we had originally estimated. Customer projects related to design wins are sometimes canceled or delayed, or can perform below original expectations, which can adversely impact anticipated revenues and profitability. In particular, the volumes and time to production ramp associated with new design wins depend on the adoption rate of new technologies in our customers’ end markets, especially in the communications networking sector. Program delays or cancellations could be more frequent during times of meaningful economic downturn or due to the consolidation of one or more of our end customers. Should technologies such as VoLTE, IMS, 3G and 4G/LTE wireless technologies, advanced multimedia applications, Femtocell applications and other emerging technologies not be adopted as fast as we or our customers anticipate, actual volumes from new design wins may be lower than we are expecting, which could adversely affect our revenue growth and gross margin expectations.
We rely on our key management and depend on the recruitment and retention of qualified personnel, and our failure to attract and retain such personnel could adversely impact our business.
A small number of key executives manage our business. Their departure could have a material adverse effect on our operations. In addition, due to the specialized nature of our business, our future performance is highly dependent upon our ability to attract and retain qualified engineering, manufacturing, marketing, sales and management personnel for our operations. Competition for personnel is intense, and we may not be successful in attracting and retaining qualified personnel. Our failure to compete for these personnel could seriously harm our business, results of operations and financial condition. In addition, if incentive programs we offer are not considered desirable by current and prospective employees, we may have difficulty retaining or recruiting qualified personnel. If we are unable to recruit and retain key employees, our product development, marketing and sales may be harmed.
The success of our business is dependent upon successfully managing our international operations and attracting and retaining key international employees.
Substantially all of our product development and operations centers are located in China and India. This international presence results in risks that are inherent in doing business on an international level. These risks include:
• | difficulties in managing operations due to distance, language and cultural differences; |
• | different or conflicting laws and regulations; |
• | accounting (including managing internal control over financial reporting in our non-U.S. subsidiaries), tax and legal complexities arising from international operations; |
• | burdensome regulatory requirements and unexpected changes in these requirements, including data protection requirements; |
• | political and economic instability; |
• | fluctuations in currency exchange rates; and |
• | different laws and regulations surrounding taxes and their potentially adverse consequences. |
Our foreign currency exchange risk management program is designed to reduce, but does not eliminate, the impact of currency exchange rate movements. If we cannot manage our international operations successfully, our business, results of operations and financial condition could be adversely affected.
The U.S. Foreign Corrupt Practices Act (“FCPA”) and similar anti-bribery laws and regulations in other jurisdictions generally prohibit companies and their intermediaries from making improper payments to government officials for the purpose of obtaining or retaining business or securing an improper advantage. Our policies mandate compliance with applicable anti-bribery laws worldwide. However, if we are found to be in violation of the FCPA or other similar anti-bribery laws or regulations, whether due to our or others' actions or inadvertence, we could be subject to civil and criminal penalties or other sanctions that could have a material adverse impact on our business, financial condition or results of operations. In addition, actual or alleged violations could damage our reputation or ability to do business.
Acquisition, divestitures and partnerships may be more costly or less profitable than anticipated and may adversely affect the price of our common stock.
As part of our business strategy, we routinely engage in discussions with third parties regarding, and enter into agreements relating to, acquisitions, joint ventures and divestitures in order to manage our product and technology portfolios as part of and to further our strategic objectives. Our strategy may include the divestiture of certain product lines as we seek to
16
maximize shareholder value or improve our cash position. We also continually explore opportunities to increase the profitability of our operations through restructuring efforts and to consolidate operations across facilities where synergies exist. In order to pursue this strategy successfully, we must identify suitable acquisition, alliance or divestiture candidates, complete these transactions, some of which may be large and complex, and integrate acquired companies. Integration and other risks of acquisitions can be more pronounced for larger and more complicated transactions, or if multiple acquisitions are pursued simultaneously.
The integration of acquisitions may make the completion and integration of subsequent acquisitions more difficult. However, if we fail to identify and complete these transactions, we may be required to expend resources to internally develop products and technology or may be at a competitive disadvantage or may be adversely affected by negative market perceptions, which may have a material adverse effect on our business, results of operations and financial condition.
Acquisitions may require us to integrate different company cultures, management teams and business infrastructures and otherwise manage integration risks. Even if an acquisition is successfully integrated, we may not receive the expected benefits of the transaction.
A successful sale or divestiture depends on various factors, including our ability to effectively transfer assets and liabilities, contracts, facilities and employees to the purchaser, identify and separate the intellectual property to be divested from the intellectual property that we wish to keep and reduce fixed costs previously associated with the divested assets of the business.
Managing acquisitions and divestitures requires varying levels of management resources, which may divert management's attention from our other business operations. Acquisitions, including abandoned acquisitions, also may result in significant costs and expenses and charges to earnings.
Restructuring activities may result in business disruptions and may not produce the full efficiency and cost reduction benefits anticipated. Further, the benefits may be realized later than expected and the cost of implementing these measures may be greater than anticipated. If these measures are not successful, we may need to undertake additional cost reduction efforts, which could result in future charges. Moreover, we could experience business disruptions with customers and elsewhere if our cost reduction and restructuring efforts prove ineffective, and our ability to achieve our other strategic goals and business plans as well as our business, results of operations and financial condition could be materially adversely affected.
We operate in intensely competitive industries, and our failure to respond quickly to technological developments and incorporate new features into our products may have an adverse effect on our ability to compete.
We operate in intensely competitive industries that experience rapid technological developments, changes in industry standards, changes in customer requirements, industry migration to the private telecom cloud, and frequent new product introductions and improvements. If we are unable to respond quickly and successfully to these developments, we may lose our competitive position, and our products or technologies may become uncompetitive or obsolete. Similarly, if there are changes to technology requirements, it may render our products and technologies uncompetitive. To compete successfully, we must maintain a successful marketing and R&D effort, develop new products and production processes, and improve our existing products and processes at the same pace or ahead of our competitors. We may not be able to successfully develop and market these new products, the products we invest in and develop may not be well received by customers, and products developed and new technologies offered by others may affect the demand for our products. These types of events may have a variety of negative effects on our competitive position and our profitability and financial condition, such as reducing our revenue, increasing our costs, lowering our gross margin, reducing our profitability and/or requiring us to recognize and record impairments of our assets.
There are a number of trends and factors affecting our markets, including economic conditions in the United States, Europe and Asia, which are beyond our control. These trends and factors may result in increasing upward pressure on the costs of products and an overall reduction in demand.
There are trends and factors affecting our markets and our sources of supply that are beyond our control and may negatively affect our cost of sales. Such trends and factors include: adverse changes in the cost of raw commodities and increasing freight, energy, and labor costs in developing regions such as China and India. Our business strategy has been to provide customers with faster time-to-market and greater value solutions in order to help them compete in an industry that generally faces downward pricing pressure. In addition, our competitors have in the past lowered, and may again in the future lower, prices in order to increase their market share, which would ultimately reduce the price we may realize from our
17
customers. If we are unable to realize prices that allow us to continue to compete on this basis of performance, our profit margin, market share, and overall financial condition and operating results may be materially and adversely affected.
Some of the products or technologies acquired, licensed or developed by us incorporate open source software, and we may incorporate open source software into other products in the future. Any failure to comply with the terms of one or more of open source licenses could negatively effect our business.
The products, services or technologies we acquire, license, provide or develop may incorporate or use open source software. We monitor our use of open source software in an effort to avoid unintended consequences, such as reciprocal license grants, patent retaliation clauses, and the requirement to license our products at no cost. Nevertheless, we may be subject to unanticipated obligations regarding our products which incorporate open source software.
Competition in the market for enabling software and systems is intense, and if we lose market share, our revenues and profitability may deteriorate.
We face competition in the design of enabling solutions from a number of sources. Our principal competition remains the internal design resources of our own customers. Many of our customers retain the ability to design enabling solutions in-house. In order to achieve design wins and receive subsequent orders from these customers, we must convince them of the benefits associated with using our design services and solutions rather than solutions designed by their in-house personnel. While we believe that many of our customers will increase the proportion of their solutions sourced from merchant suppliers, we will need to continue to demonstrate the benefits of our solutions relative to similar products that could be developed by our customers’ internal personnel in order to successfully execute our strategy. In addition, consolidation of our customers may cause material changes in their use of third parties to realize new product designs.
We also compete with a number of companies and divisions of companies that focus on providing enabling solutions, including, but not limited to, ADLink Technologies, Advantech Co., Adlink, AudioCodes, Dialogic, Artesyn Embedded Technologies and Kontron AG. In addition, our primary competitors in the enabling software solutions market, into which our CellEngine software is sold, are Aricent Group, NodeH and in-house development by our target customer base.
Because the enabling software and systems market is growing, the market is attracting new non-traditional competitors. These non-traditional competitors include contract manufacturers that provide design services and Asia-based original design manufacturers.
Some of our competitors and potential competitors have a number of significant advantages over us, including:
• | a longer operating history; |
• | greater name recognition and marketing power; |
• | preferred vendor status with our existing and potential customers; |
• | significantly greater financial, technical, marketing and other resources, which allow them to respond more quickly to new or changing opportunities, technologies and customer requirements; |
• | broader product and service offerings to provide more complete and valued solutions; and |
• | lower cost structures which, among other things, could include different accounting principles relative to U.S. generally accepted accounting principles (“GAAP”). |
Furthermore, existing or potential competitors may establish cooperative relationships with each other or with third parties or adopt aggressive pricing policies to gain market share.
As a result of increased competition, we may encounter significant pricing pressures and/or suffer losses in market share. These pricing pressures could result in significantly lower average selling prices for our products. We may not be able to offset the effects of any price reductions with an increase in the number of customers, cost reductions or otherwise. In addition, many of the industries we serve, such as the communications industry, are encountering market consolidation, or are likely to encounter consolidation in the near future, which could result in increased pricing pressure and additional competition thus weakening our position or causing delays in new design wins and their associated production.
We have incurred, and may incur in the future, restructuring and other charges, the amounts of which are difficult to accurately predict.
From time to time, we have sought to optimize our operational capabilities and efficiencies and focus our efforts and expertise through business restructurings. In the future we may decide to engage in discrete restructurings of our operations if
18
business or economic conditions warrant. Possible adverse consequences related to such actions may include various charges for such items as idle capacity, disposition costs, severance costs, loss of propriety information and in-house knowledge. We may be unsuccessful in any of our current or future efforts to restructure our business, which may have a material adverse effect upon our business, financial condition or results of operations.
Our international operations expose us to additional political, economic and regulatory risks not faced by businesses that operate only in the United States.
In 2014, 2013 and 2012, as measured by delivery destination, we derived 22%, 22% and 21% of our revenues from EMEA and 38%, 34% and 41% from Asia Pacific. In 2014, all of our manufacturing was completed by our U.S. contract manufacturer's Asian supply chain and operations. As a result, we are subject to worldwide economic and market conditions risks generally associated with global trade such as fluctuating exchange rates, tariff and trade policies, increased protectionism of foreign governments, domestic and foreign tax policies, foreign governmental regulations, political unrest, wars and other acts of terrorism and changes in other economic conditions. These risks, among others, could adversely affect the results of our operations or financial position. Additionally, some of our sales to overseas customers are made under export licenses that must be obtained from the U.S. Department of Commerce. Protectionist trade legislation in either the United States or other countries, such as a change in the current tariff structures, export compliance laws, trade restrictions resulting from war or terrorism or other trade policies could adversely affect our ability to sell or to manufacture in international markets. Additionally, U.S. federal and state agency restrictions imposed by the Buy American Act or the Trade Agreement Act may apply to our products manufactured outside the United States. Furthermore, revenues from outside the United States are subject to inherent risks, including the general economic and political conditions in each country. As a result of tightening credit markets, our customers and suppliers may face issues gaining timely access to sufficient credit, which could impair our customers’ ability to make timely payments to us and could cause key suppliers to delay shipments and face serious risks of insolvency. These risks, among others, could adversely affect our results of operations or financial position.
If we are unable to protect our intellectual property, we may lose a valuable competitive advantage or be forced to endure costly litigation.
We are a technology dependent company, and our success depends on developing and protecting our intellectual property. We rely on patents, copyrights, trademarks, trade secret laws, know-how and rapid time to market to protect our intellectual property. At the same time, our products are complex and are often not patentable in their entirety. We also license intellectual property from third parties and rely on those parties to maintain and protect their technology. We cannot be certain that our actions will protect our proprietary rights. Any patents owned by us may be invalidated, circumvented or challenged. Any of our patent applications, whether or not being currently challenged, may not be issued with the scope of the claims we seek, if at all. If we are unable to adequately protect our technology, or if we are unable to continue to obtain or maintain licenses for protected technology from third parties, it could have a material adverse effect on our results of operations. In addition, some of our products are now designed, manufactured and sold outside of the United States. Despite the precautions we take to protect our intellectual property, this international exposure may reduce or limit protection of our intellectual property, which is more prone to design piracy outside of the United States.
Third parties may also assert infringement claims against us in the future; assertions by third parties may result in costly litigation and we may not prevail in such litigation or be able to license any valid and infringed patents from third parties on commercially reasonable terms. Litigation, regardless of its outcome, could result in substantial costs and diversion of our resources. Any infringement claim or other litigation against us or by us could materially adversely affect our financial condition and results of operations.
We may have additional tax liabilities.
Significant judgments and estimates are required in determining the provision for income taxes and other tax liabilities globally. Our tax expense may be impacted if our intercompany transactions, which are required to be computed on an arm’s-length basis, are challenged and successfully disputed by the tax authorities. Also, our tax expense may be impacted depending on the applicability of withholding taxes on software licenses and related intercompany transactions in certain jurisdictions. In addition, our ability to offset potential future profits in the U.S. with existing net operating losses may be limited by Section 382 of the Internal Revenue Code dependent upon future changes in the shareholders of our common stock. In determining the adequacy of income taxes, we assess the likelihood of adverse outcomes that could result if our tax positions were challenged by the Internal Revenue Service ("IRS") and other tax authorities. The tax authorities in the U.S. and other countries where we do business regularly may examine our income and other tax returns. The ultimate outcome of these examinations cannot be predicted with certainty. Should the IRS or other tax authorities assess additional taxes as a result of examinations, we may be
19
required to record charges to operations that could have a material impact on our results of operations, financial position, or cash flows.
Our disclosure controls and internal control over financial reporting do not guarantee the absence of error or fraud.
We do not expect that disclosure controls or internal control over financial reporting will prevent all errors and all fraud. A control system, no matter how well designed and operated, can provide only reasonable, not absolute, assurance that the control system's objectives will be met. Further, the design of a control system must reflect the fact that there are resource constraints and the benefits of controls must be considered relative to their costs. Because of the inherent limitations in all control systems, no evaluation of controls can provide absolute assurance that all control issues and instances of fraud, if any, have been detected. Failure of our control systems to prevent error or fraud could materially adversely impact us.
Increased IT security requirements, vulnerabilities, threats and more sophisticated and targeted computer crime and cyber attacks could pose a risk to our systems, networks, products, solutions, services and data.
Increased global IT security requirements, vulnerabilities, threats and more sophisticated and targeted computer crime and cyber attacks pose a risk to the security of our systems and networks and the confidentiality, availability and integrity of our data. While we attempt to mitigate these risks by employing a number of measures, including employee training, comprehensive monitoring of our networks and systems, and maintenance of backup and protective systems, our systems, networks, products, and solutions remain potentially vulnerable to advanced persistent threats. We also may have access to sensitive, confidential or personal data or information in certain of our businesses that is subject to privacy and security laws, regulations and customer-imposed controls. Despite our efforts to protect sensitive, confidential or personal data or information, our facilities and systems and those of our third-party service providers may be vulnerable to security breaches, theft, misplaced or lost data, programming and/or human errors that could potentially lead to the compromising of sensitive, confidential or personal data or information, improper use of our systems, software solutions or networks, unauthorized access, use, disclosure, modification or destruction of information, defective products, production downtimes and operational disruptions, which in turn could adversely affect our reputation, competitiveness and results of operations.
Oregon corporate law, our articles of incorporation and our bylaws contain provisions that could prevent or discourage a third party from acquiring us even if the change of control would be beneficial to our shareholders.
Our articles of incorporation and our bylaws contain anti-takeover provisions that could delay or prevent a change of control of our company, even if a change of control would be beneficial to our shareholders. These provisions:
• | authorize our Board of Directors to issue up to 5,663,952 shares of preferred stock and to determine the price, rights, preferences, privileges and restrictions, including voting rights, of those shares without prior shareholder approval, which could adversely affect the voting power or other rights of the holders of outstanding shares of preferred stock or common stock; |
• | establish advance notice requirements for nominations for election to our Board of Directors or for proposing matters that can be acted upon by shareholders at shareholder meetings; |
• | prohibit cumulative voting in the election of directors, which would otherwise allow less than a majority of shareholders to elect director candidates; and |
• | limit the ability of shareholders to take action by written consent, thereby effectively requiring all common shareholder actions to be taken at a meeting of our common shareholders. |
In addition, if our common stock is acquired in specified transactions deemed to constitute “control share acquisitions,” provisions of Oregon law condition the voting rights that would otherwise be associated with those common shares upon approval by our shareholders (excluding, among other things, the acquirer in any such transaction). Provisions of Oregon law also restrict, subject to specified exceptions, the ability of a person owning 15% or more of our common stock to enter into any “business combination transaction” with us.
The foregoing provisions of Oregon law and our articles of incorporation and bylaws could limit the price that investors might be willing to pay in the future for shares of our common stock and value of our convertible notes.
20
Sales of a significant number of shares of our common stock in the public markets, or the perception of such sales, could depress the market price of our common stock.
Sales of a substantial number of shares of our common stock or other equity-related securities in the public markets could depress the market price of our common stock, and impair our ability to raise capital through the sale of additional equity securities. We cannot predict the effect that future sales of our common stock or other equity-related securities would have on the market price of our common stock.
We have a substantial level of indebtedness and future obligations relative to our cash position.
As of December 31, 2014, we had $31.2 million of cash and cash equivalents which consisted of $23.4 million held domestically and $7.8 million held by foreign subsidiaries, and 2015 convertible senior notes outstanding with an aggregate principal amount of $18.0 million and we have a $10.0 million outstanding balance on our line of credit. In addition, we have various other short-term obligations which will require use of our cash to satisfy. This level of debt and our ability to repay or refinance this debt prior to maturity may have negative consequences to our business, including:
• | increasing the difficulty of our ability to make payments on our outstanding debt; |
• | requiring a substantial portion of our cash flow from operations to be dedicated to the payment of principal and interest on our indebtedness, therefore reducing our ability to use or cash flow to fund our operations, capital expenditures, acquisitions; |
• | limiting our ability to pursue our growth strategy; |
• | limiting our ability to incur additional indebtedness or obtain any necessary financing in the future for working capital, capital expenditures, debt service requirements, acquisitions, or general corporate purposes; |
• | placing us at a disadvantage compared to our competitors who are less highly leveraged and may be better able to use their cash flow to fund competitive responses to changing industry, market or economic conditions; and |
• | increasing our vulnerability in the event of an increase in interest rates if we must incur new debt to satisfy our obligations under the 2015 convertible senior notes. |
We may also be unable to borrow funds as a result of an inability of financial institutions to lend due to restrictive lending policies and/or institutional liquidity concerns.
If we experience a decline in revenues, we may have difficulty paying amounts due on our indebtedness. Any default under our indebtedness may have a material adverse impact on our business, operating results, and financial condition.
If required to fund operations, refinance debt or for other general corporate purposes, as of December 31, 2014 we had $14.4 million available for borrowing under our secured revolving line of credit agreement with Silicon Valley Bank, which matures on July 28, 2016. The line of credit, however, is subject to certain financial covenants and may not be available, in full or in part, on dates we may attempt to draw on the line in the future.
On February 17, 2015, we paid the remaining $18 million balance of our 4.50% convertible senior notes due 2015 from a combination of cash on hand and borrowings under our Silicon Valley Bank line of credit. After the repayment of the convertible senior notes, we expect our remaining borrowing availability under our Silicon Valley Bank line of credit to range between $7.0 million to $15.0 million as we manage our intra-quarter liquidity requirements due to the timing of customer collections and vendor payments and to remain compliant with covenants under the Agreement.
Item 1B. | Unresolved Staff Comments |
None.
21
Item 2. Properties
Information concerning our principal properties at December 31, 2014 is set forth below:
Location | Type | Principal Use | Square Footage | Ownership | |||||
Hillsboro, OR | Office | Headquarters, manufacturing support, marketing, research and engineering | 75,760 | Leased | |||||
Burnaby, Canada | Office | Manufacturing support, marketing, product integration, research and engineering | 13,512 | Leased | |||||
Bangalore, India | Office | Research and engineering and professional services | 99,206 | Leased | |||||
Shenzhen, China | Office | Manufacturing support, research and engineering | 60,612 | Leased | |||||
We also lease sales and support offices in Des Moines, Iowa, Marlboro, Massachusetts, Gdansk, Poland, Barcelona, Spain, Seongnam, Korea and Tokyo, Japan.
Item 3. Legal Proceedings
In the normal course of business, the Company becomes involved in litigation. As of December 31, 2014, in the opinion of management, Radisys had no pending litigation that would have a material effect on the Company’s financial position, results of operations or cash flows.
Item 4. Mine Safety Disclosures
Not applicable.
22
PART II
Item 5. Market for Registrant’s Common Equity, Related Stockholder Matters and Issuer Purchases of Equity Securities
Our common stock is traded on the NASDAQ Global Select Market under the symbol “RSYS.” The following table sets forth, for the periods indicated, the highest and lowest sale prices for our common stock, as reported by the NASDAQ Global Select Market.
High | Low | |||||||
2014 | ||||||||
Fourth Quarter | $ | 2.78 | $ | 2.08 | ||||
Third Quarter | 3.67 | 2.57 | ||||||
Second Quarter | 3.71 | 2.82 | ||||||
First Quarter | 4.59 | 2.18 | ||||||
2013 | ||||||||
Fourth Quarter | $ | 3.35 | $ | 2.02 | ||||
Third Quarter | 4.99 | 3.20 | ||||||
Second Quarter | 5.20 | 4.26 | ||||||
First Quarter | 4.95 | 2.80 | ||||||
The closing price as reported on the NASDAQ Global Select Market on February 25, 2015 was $2.34 per share. As of February 25, 2015, there were approximately 464 holders of record of our common stock. We believe that the number of beneficial owners is substantially greater than the number of record holders because a large portion of our outstanding common stock is held of record in “street name” by brokers and other financial institutions for the benefit of individual investors.
Dividend Policy
We have never paid any cash dividends on our common stock and do not expect to declare cash dividends on the common stock in the foreseeable future. Our ability to pay dividends is also restricted by our policy as well as the covenants arising from our line of credit agreement with Silicon Valley Bank, which prohibits the payment of any dividends, distributions or payment in respect of our common stock. As such, we plan to retain all of our earnings to finance future growth.
Stock Price Performance Graph
The following graph sets forth our total cumulative shareholder return as compared to the return of the NASDAQ Composite Index, the S&P 500 Index, and the NASDAQ Telecommunications Index for the period of December 31, 2009 through December 31, 2014. The graph reflects the investment of $100 on December 31, 2009 in our stock, the S&P 500 Index, the NASDAQ Index, and in the published industry indexes.
Total return also assumes reinvestment of dividends. As noted above, we have never paid dividends on our common stock. Historical stock price performance should not be relied upon as indicative of future stock price performance.
23
COMPARISON OF 5 YEAR CUMULATIVE TOTAL RETURN*
Among Radisys Corporation, the S&P 500 Index, the NASDAQ Composite Index and the NASDAQ Telecommunications Index
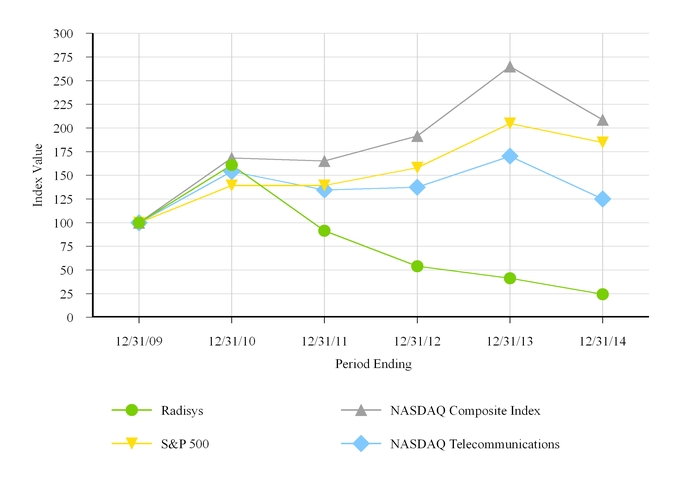
* | $100 invested on 12/31/2009 in the Company's common stock or the applicable index, including reinvestment of dividends. |
Fiscal Year ending December 31. | |
12/2009 | 12/2010 | 12/2011 | 12/2012 | 12/2013 | 12/2014 | ||||||||||||||
Radisys | 100.00 | 160.94 | 91.50 | 53.89 | 41.41 | 24.50 | |||||||||||||
NASDAQ Composite | 100.00 | 168.22 | 165.19 | 191.47 | 264.84 | 208.71 | |||||||||||||
S&P 500 | 100.00 | 139.23 | 139.23 | 157.90 | 204.63 | 184.64 | |||||||||||||
NASDAQ Telecommunications | 100.00 | 154.06 | 134.62 | 137.31 | 170.29 | 125.11 | |||||||||||||
24
Item 6. Selected Financial Data
For the Years Ended December 31, | ||||||||||||||||||||
2014 | 2013 | 2012 | 2011 (A) | 2010 | ||||||||||||||||
(In thousands, except per share data) | ||||||||||||||||||||
Consolidated Statements of Operations Data | ||||||||||||||||||||
Revenues | $ | 192,742 | $ | 237,863 | $ | 286,096 | $ | 330,865 | $ | 284,311 | ||||||||||
Gross margin | 51,802 | 64,138 | 88,039 | 96,765 | 87,214 | |||||||||||||||
Income (loss) from operations | (25,300 | ) | (34,766 | ) | (39,746 | ) | (11,403 | ) | 699 | |||||||||||
Net loss | (27,581 | ) | (49,404 | ) | (43,474 | ) | (1,529 | ) | (369 | ) | ||||||||||
Net loss per common share: | ||||||||||||||||||||
Basic | $ | (0.79 | ) | $ | (1.72 | ) | $ | (1.60 | ) | $ | (0.06 | ) | $ | (0.02 | ) | |||||
Diluted | $ | (0.79 | ) | $ | (1.72 | ) | $ | (1.60 | ) | $ | (0.06 | ) | $ | (0.02 | ) | |||||
Weighted average shares outstanding (basic) | 34,699 | 28,805 | 27,174 | 25,413 | 24,144 | |||||||||||||||
Weighted average shares outstanding (diluted) | 34,699 | 28,805 | 27,174 | 25,413 | 24,144 | |||||||||||||||
December 31, | ||||||||||||||||||||
2014 | 2013 | 2012 | 2011 (A) | 2010 | ||||||||||||||||
(In thousands) | ||||||||||||||||||||
Consolidated Balance Sheet Data | ||||||||||||||||||||
Working capital | $ | 23,240 | $ | 26,920 | $ | 41,887 | $ | 71,208 | $ | 147,049 | ||||||||||
Total assets | 160,720 | 176,185 | 232,394 | 297,273 | 240,928 | |||||||||||||||
Long term obligations, excluding current portion | 2,800 | 21,276 | 22,851 | 54,689 | 50,450 | |||||||||||||||
Total shareholders’ equity | 77,776 | 81,136 | 125,442 | 166,733 | 137,394 | |||||||||||||||
__________________________________
(A) | Effective July 8, 2011, we acquired Continuous Computing Corporation ("Continuous Computing"). Continuous Computing's operating results are only included for periods subsequent to the acquisition. |
25
Item 7. Management’s Discussion and Analysis of Financial Condition and Results of Operations
Overview
Radisys Corporation (NASDAQ: RSYS), the services acceleration company, helps communications and content providers as well as their strategic partners create new revenue streams and drive cost out of their services delivery infrastructure. Radisys’ application aware traffic distribution platforms, real-time media processing engines and wireless access technologies enable service providers to maximize, virtualize and monetize their networks. These products, in addition to our Embedded Products and expert professional services organization, help accelerate our customer's ability to bring high-value telecom applications to market faster and with lower investment and risk. Beginning in early 2015, our products and services are broken into two operating segments: Software-Systems and Embedded Products and Hardware Services.
• | Software-Systems (previously referred to as Software and Solutions) is comprised of the following product families: |
◦ | FlowEngine, our recently announced product-line targeting the communication and content provider traffic management market, is a family of products designed to classify and intelligently distribute session data flows to appropriate network processing resources in new virtualized network functions ("NFV") based architectures. FlowEngine products enable communication and content providers to efficiently transition towards NFV architectures by integrating a targeted subset of edge routing, data center switching, and load balancing functionality along with software-defined networking ("SDN") control. Our purpose-built appliances include only the specific functionality from these stand-alone devices needed to meet NFV architectures which will enable our customers to reduce significantly the investment necessary to efficiently process data flows in virtualized communication environments. |
◦ | MediaEngine products (previously referred to as Media Resource Function or MRF) are designed into the IMS core of telecom networks and provide the necessary media processing capabilities required for applications such as audio conferencing, Voice over Long-Term Evolution ("VoLTE"), Voice over WiFi (“VoWifi”), Rich Communications Services (“RCS”) and Web Real-Time Communication ("WebRTC"). We sell a complete high density system, the MediaEngine MPX-12000, as well as a virtualized software-only vMRF when our customers choose other lower-density processing platforms. As carriers consolidate network capacity from older (3G and 2G) architectures onto new LTE architectures, they will deploy VoLTE applications. Our MediaEngine provides the needed media processing capability that delivers audio, video or other multimedia modalities over LTE wireless networks. |
◦ | CellEngine software (previously referred to as Trillium), which includes our TotalENodeB LTE and Femtotality 3G software products, is targeted at providing the communication linkage between wireless end user devices and small cell base stations that mobile carriers are deploying to optimize wireless network spectrum utilization and coverage. Our focus is providing software applications which enable small 3G and LTE operator-controlled, low-power wireless base stations (known as small cells, femtocells, enterprise femtocells and picocells) that enable improved cellular coverage and capacity for homes and enterprises as well as metropolitan and rural areas. Additionally, we leverage our CellEngine technology to enable small cell applications to capture share in adjacent markets such as aerospace and defense as well as manufacturing and test environments. |
◦ | Also included in this segment is our Professional Service organization which is staffed with telecommunications experts who are available to assist our customers as they develop their own unique telecommunications products and applications. Our strategy is to enable the efficient and cost effective adoption of our Software-Systems products as customers integrate them into complete systems. |
• | Embedded Products and Hardware Services (comprising the product-lines previously referred to as ATCA, COMe/RMS and Other Products) are predominantly hardware based products that enable the control and movement of data in both 3G and LTE telecom networks. Our products enable network elements for applications such as Deep Packet Inspection ("DPI"), policy management and intelligent gateways (security, femto and LTE gateways). Our professional service organization of network experts accelerates our customers' time to market on these revenue generating assets. |
2014 Highlights
26
Our revenues for the year ended December 31, 2014 declined $45.1 million from the prior year primarily as a result of an overall softening in the market for our lower margin blade-only embedded products. Additionally, within our Software-Systems operating segment, demand for our audio conferencing products declined as our customers have begun experiencing increased competitive pressures from over-the-top providers and have also begun utilizing alternative architectures to provide the same audio conferencing applications. Continued delays in the deployment of next generation wireless network elements, specifically small cell base stations, combined with later than expected wireless spectrum release in certain geographies, have adversely affected our ability to offset the aforementioned revenue declines. Despite these factors, we have seen Embedded Products and Hardware Services revenue stabilize as represented by our relatively flat $37.7 million, $39.2 million, $39.6 million and $36.0 million of revenue reported over the last four quarters sequentially.
Management's continued focus on driving efficiencies has resulted in meaningful operating expense savings, with combined R&D and SG&A expense reductions of $18.4 million, or 21.3% for the year ended December 31, 2014 when compared to the same period in 2013. In addition, during 2014 we substantially completed the transition to our new contract manufacturing partner in Shenzhen. This transition has eliminated site redundancies and, when combined with reduced product costs, is expected to result in approximately $6.0 million of annualized cost savings as we exit 2014. This transition has also enabled us to reduce our inventory levels on December 31, 2014 to $18.5 million from $25.4 million on December 31, 2013.
Following are highlights and developments within our business for the year ended December 31, 2014:
• | Revenues decreased $45.2 million to $192.7 million for the year ended December 31, 2014 from $237.9 million for the year ended December 31, 2013. The decline was primarily caused by a $40.4 million reduction in our Embedded Products and Hardware Services revenue due to an overall softening in the market for blade-only products as well as blade level products that are trending towards end of life. |
• | Our gross profit margin as a percentage of revenue of 26.9% for the year ended December 31, 2014 was relatively flat when compared to 27.0% of revenue for the year ended December 31, 2013. Fewer shipments of higher margin embedded products and audio conferencing products, along with declining overall revenue, adversely affected our fixed cost absorption and offset the realization of a credit resulting from a vendor claim against faulty components and the completion of our manufacturing consolidation to Shenzen. |
• | R&D expense decreased $13.0 million to $32.0 million for the year ended December 31, 2014 from $45.0 million for the year ended December 31, 2013. The expense decrease is attributable to our second half 2013 restructuring efforts which included the consolidation of our Shanghai and Penang development sites into our Shenzhen development center that enabled the reduction of redundant employee, facilities and support costs. |
• | SG&A expense decreased $5.3 million to $35.9 million for the year ended December 31, 2014 from $41.2 million for the year ended December 31, 2013. This decrease was primarily the result of site closures that enabled the reduction of redundant employee, facilities and support costs as we closed and consolidated numerous sites globally. |
• | Cash and cash equivalents increased $5.7 million to $31.2 million at December 31, 2014 from $25.5 million at December 31, 2013. We raised $20.6 million in cash through a follow-on public offering of our common shares during the first quarter of 2014. This increase was offset by $6.8 million of operating cash consumption, $2.4 million of capital expenditures and the repayment of $5.0 million in debt that was previously outstanding under our Silicon Valley Bank line of credit. |
2015 Outlook
Over the last two years we have materially simplified our organization and cost structure resulting in an approximate 40% operating expense reduction. Our strategy is targeted at leveraging our unique traffic management, media processing, and wireless telecom competencies to drive long-term shareholder value. In February of 2015, the Company implemented organizational changes that results in a strategic focus in two areas. As a result, information the chief operating decision maker, our Chief Executive Officer, regularly reviews for purposes of allocating resources and assessing performance changed. Given this focus, we have reshaped the Company into two new operating segments - 'Software-Systems' and 'Embedded Products and Hardware Services'.
Our Software-Systems segment is comprised of three product lines: our FlowEngine product line, which includes the newly announced TDE-1000 intelligent load balancer that is targeted at the traffic management market, our MediaEngine (previously referred to as our Media Resource Function or MRF) in support of VoLTE, VoWiFi and audio conferencing and our CellEngine (previously refered to as Trillium) small cell software products and professional services. These three product lines
27
are expected to enable long-term revenue growth and will be supported by the majority of the Company's future R&D investment. Given our continued FlowEngine investments, we expect 2015 to be an investment year with the segment returning to profitability in 2016 with accelerating levels of revenue growth.
The second segment is our Embedded Products and Hardware Services business. This segment is comprised of our historically reported ATCA, Com-E/RMS and Other Products product groups. The traditional embedded hardware market, especially in telecom where these products have been targeted, has been under significant pressure over the last several years as evidenced by our own historic results as well as the ongoing challenges of many of our embedded competitors. The increased commoditization of hardware along with SDN and NFV network trends and the improved capability of a data center like topology has permanently altered telecom’s embedded hardware industry and thus we have concluded the overall market for our current technologies will continue to contract. Given this market reality, we will be limiting our focus to only those key strategic customers who have adequate scale that aligns with our profitability objectives and who value the quality, technology and extended support we provide. We expect this strategy will enable us to generate meaningful profitability and free cash flow over the coming years, enabling the investment required to fuel our Software-Systems growth, while also continuing to support, and win new business with, our critical embedded products customer base.
These two segments will have very different near-term financial objectives with Software-Systems revenue expected to grow meaningfully but operate at a loss over the next 12 to 18 months while Embedded Products and Hardware Services is expected to generate meaningful profits and free cash flow. We intend to report both revenue and profitability for these two segments in order to provide investors the necessary information to measure our progress on driving Software-Systems revenue growth and the investment that is required while also gauging our ability to meet profit and cash generation objectives.
In connection with these changes and to meet our expense targets, we will restructure our research and development and sales and general administrative presence primarily within Asia and North America. We expect to record 2015 restructuring charges of approximately $4.5 million to $5.5 million, substantially all of which will be for cash severance payments and other employee-related costs largely to be incurred in the first half of the year.
On February 17, 2015, we paid the remaining $18 million balance of our 4.50% convertible senior notes due 2015 from a combination of cash on hand and borrowings under our Silicon Valley Bank line of credit. No convertible senior notes were converted to common stock. After the repayment of the convertible senior notes, we expect our remaining borrowing availability under our Silicon Valley Bank line of credit to range between $7.0 million to $15.0 million as we manage our intra-quarter liquidity requirements due to the timing of customer collections and vendor payments and to remain compliant with covenants under the Agreement. We expect that with the combination of borrowing availability, cash and cash equivalents on hand and cash flow from operations, we will have adequate liquidity to fund operations and to complete the restructuring actions outlined above.
In summary, we believe our work over the last two years coupled with the transformational actions outlined above positions the company well to realize our objective of being a leading provider of media and data processing software and systems to the global communications market. We will grow our Software-Systems revenue by increasing share in our targeted growth markets through leveraging our market leadership, partnerships and customer relationships. We have meaningful growth potential as a result of our investments and expertise in the increasingly important and emerging virtualized network topology, VoLTE, VoWiFi, WebRTC and small cell markets.
28
Results of Operations
The following table sets forth certain operating data as a percentage of revenues:
For the Years Ended December 31, | ||||||||
2014 | 2013 | 2012 | ||||||
Revenues | 100.0 | % | 100.0 | % | 100.0 | % | ||
Cost of sales: | ||||||||
Cost of sales | 68.9 | 69.4 | 65.9 | |||||
Amortization of purchased technology | 4.2 | 3.6 | 3.3 | |||||
Total cost of sales | 73.1 | 73.0 | 69.2 | |||||
Gross margin | 26.9 | 27.0 | 30.8 | |||||
Research and development | 16.6 | 18.9 | 16.7 | |||||
Selling, general and administrative | 18.6 | 17.4 | 15.8 | |||||
Intangible assets amortization | 2.6 | 2.2 | 1.8 | |||||
Impairment of goodwill | — | — | 10.4 | |||||
Restructuring and other charges, net | 2.2 | 3.1 | — | |||||
Loss from operations | (13.1 | ) | (14.6 | ) | (13.9 | ) | ||
Interest expense | (0.6 | ) | (0.5 | ) | (0.6 | ) | ||
Interest income | — | — | — | |||||
Other income, net | 0.7 | 0.6 | 0.2 | |||||
Loss before income tax expense | (13.0 | ) | (14.5 | ) | (14.3 | ) | ||
Income tax expense | 1.3 | 6.3 | 0.9 | |||||
Net loss | (14.3 | )% | (20.8 | )% | (15.2 | )% | ||
Revenues
The following table sets forth our revenues by previously disclosed product groups and is included as a reference to transition from our prior reporting structure to our new operating segments structure (in thousands):
For the Years Ended December 31, | Change | ||||||||||||||||
2014 | 2013 | 2012 | 2014 vs 2013 | 2013 vs 2012 | |||||||||||||
ATCA | $ | 91,094 | $ | 116,537 | $ | 136,572 | (21.8 | )% | (14.7 | )% | |||||||
Software and Solutions | 40,281 | 44,934 | 52,666 | (10.4 | ) | (14.7 | ) | ||||||||||
COM Express and Rackmount Server | 49,660 | 56,019 | 49,538 | (11.4 | ) | 13.1 | |||||||||||
Other Products | 11,707 | 20,373 | 47,320 | (42.5 | ) | (56.9 | ) | ||||||||||
Total Revenues | $ | 192,742 | $ | 237,863 | $ | 286,096 | (19.0 | )% | (16.9 | )% | |||||||
The following table sets forth operating segment revenues (in thousands):
For the Years Ended December 31, | Change | ||||||||||||||||
2014 | 2013 | 2012 | 2014 vs 2013 | 2013 vs 2012 | |||||||||||||
Software-Systems | $ | 40,281 | $ | 44,934 | $ | 52,666 | (10.4 | )% | (14.7 | )% | |||||||
Embedded Products and Hardware Services | 152,461 | 192,929 | 233,430 | (21.0 | ) | (17.4 | ) | ||||||||||
Total Revenues | $ | 192,742 | $ | 237,863 | $ | 286,096 | (19.0 | )% | (16.9 | )% | |||||||
29
Software-Systems
Revenues in the Software-Systems segment decreased $4.6 million to $40.3 million in 2014 from $44.9 million in 2013. Revenue in this segment decreased primarily as a result of continued softness in the audio conferencing market and delays in LTE small cell deployments. Somewhat offsetting this decline was an increase in MediaEngine shipments in support of a large Asian carrier's VoLTE deployment.
Revenues in the Software-Systems segment decreased $7.8 million to $44.9 million in 2013 from $52.7 million in 2012. Strong MediaEngine deployments for use in audio conferencing applications during 2012 were not repeated during the comparable period of 2013 primarily due to a top five customer shifting its port redundancy strategy, resulting in more efficient utilization of previously licensed ports throughout their network.
Embedded Products and Hardware Services
Revenues in the Embedded Products and Hardware Services segment decreased $40.4 million to $152.5 million in 2014 from $192.9 million in 2013. Revenues in the ATCA product group decreased $25.4 million in 2014 primarily as the result of network deployments in North America and Japan that were completed in the first half of 2013 and were not repeated in 2014. Revenues in COM Express and Rackmount Server and Other Product product groups decreased $15.0 million as the result of our strategic decision to manage for cash the value-line of our COM Express modules and Other Products as these hardware-centric products trend towards end of life and our largest customer continues to transition to next-generation network elements.
Revenues in the Embedded Products and Hardware Services segment decreased $40.5 million to $192.9 million in 2013 from $233.4 million in 2012. Revenues in the ATCA product group decreased $20.0 million in 2013 due to a $12.4 million decrease in the APAC region which was caused by fewer LTE deployments in certain geographies and design wins that never materialized into revenue and a $5.4 million decrease in EMEA region sales due to the continued softening of European market telecom spend. Additionally, our Other Products product group decreased $26.9 million as the result of these hardware centric products reaching their end of life and our largest customer transitioning to ATCA-based products. These declines were offset by a $6.5 million increase in COM Express and Rackmount Server product group sales due to shipments to a specific end-customer combined with COM Express last time buy activity during the first half of 2013, that was one-time in nature.
Revenue by Geography
The following tables outline overall revenue dollars (in thousands) and the percentage of revenues, by geographic region:
For the Years Ended December 31, | Change | ||||||||||||||||
2014 | 2013 | 2012 | 2014 vs 2013 | 2013 vs 2012 | |||||||||||||
North America | $ | 76,709 | $ | 103,822 | $ | 109,168 | (26.1 | )% | (4.9 | )% | |||||||
EMEA | 42,881 | 52,511 | 60,379 | (18.3 | ) | (13.0 | ) | ||||||||||
APAC | 73,152 | 81,530 | 116,549 | (10.3 | ) | (30.0 | ) | ||||||||||
Total | $ | 192,742 | $ | 237,863 | $ | 286,096 | (19.0 | )% | (16.9 | )% | |||||||
For the Years Ended December 31, | ||||||||
2014 | 2013 | 2012 | ||||||
North America | 39.8 | % | 43.6 | % | 38.2 | % | ||
EMEA | 22.2 | 22.1 | 21.1 | |||||
APAC | 38.0 | 34.3 | 40.7 | |||||
Total | 100.0 | % | 100.0 | % | 100.0 | % | ||
North America. North American revenues decreased by $27.1 million to $76.7 million in 2014 from $103.8 million in 2013 primarily attributable to a $20.6 million decrease in sales of our Embedded Products and Hardware segment. Within this segment, revenues from our ATCA products decreased $12.7 million due to inconsistent order patterns of a top North American customer who was acquiring hardware in 2013 to support a project to be deployed in 2014. COM Express and Rackmount Server product sales decreased $7.2 million as the result of our strategic decision to manage for cash the value-line of our COM Express modules. In addition, our Software-Systems segment sales decreased $6.5 million due primarily to the softening of audio conferencing and other non-VoLTE application market conditions.
30
North American revenues decreased by $5.4 million to $103.8 million in 2013 from $109.2 million in 2012. This decrease was due to a $6.2 million decrease in revenues from our Software-Systems segment related to the timing of audio conferencing product deployments by our largest customers. Within our Embedded Products and Hardware Services segment, we experienced a $2.2 million decrease in ATCA product sales driven by a last time buy from a North American customer in 2012 that was not repeated in 2013. The decrease was offset by $4.5 million of increased of COM Express and Rackmount Server revenues as a result of shipments to support a specific customer's deployments and product last time buys made in 2013.
EMEA. Revenues from the EMEA region decreased $9.6 million to $42.9 million in 2014 from $52.5 million in 2013 due to a $9.3 million decrease in sales of Other Products within our Embedded Products and Hardware Services segment as these hardware-centric products trend towards end of life and our largest customer continues to transition to next-generation network elements.
Revenues from the EMEA region decreased $7.9 million to $52.5 million in 2013 from $60.4 million in 2012 due to the softening of telecom spend in the European markets. Within our Embedded Products and Hardware Service segment, revenue decreased $7.6 million as a result of stagnant telecom infrastructure development and older hardware centric products reaching end of life.
Asia Pacific. Revenues from the Asia Pacific region decreased $8.3 million to $73.2 million in 2014 from $81.5 million in 2013. These decreases primarily relate to decreases in Japanese LTE deployments as these projects were substantially completed by the end of 2013.
Revenues from the Asia Pacific region decreased $35.0 million to $81.5 million in 2013 from $116.5 million in 2012. Revenues from our Other Product group decreased by $24.3 million as these hardware centric products near end of life and our largest customer transitions to next generation technologies. Additionally, the ATCA product group decreased by $12.4 million as 2012 LTE deployments both in the Japanese and Korean markets did not repeat and a delay in the release of China's LTE wireless spectrum materially impacted our anticipated revenue ramp from existing design wins in this geography.
We currently expect continued fluctuations in the revenue contribution from each geographic region. Additionally, we expect non-U.S. revenues to remain a significant portion of our revenues.
Gross Margin
The following table sets forth operating segment gross margins (in thousands):
For the Years Ended December 31, | Change | ||||||||||||||||
2014 | 2013 | 2012 | 2014 vs 2013 | 2013 vs 2012 | |||||||||||||
Gross margin | |||||||||||||||||
Software-Systems | $ | 24,949 | $ | 25,860 | $ | 36,326 | (3.5 | )% | (28.8 | )% | |||||||
Embedded Products and Hardware Services | 35,449 | 47,603 | 61,642 | (25.5 | ) | (22.8 | ) | ||||||||||
Corporate and other | (8,596 | ) | (9,325 | ) | (9,929 | ) | (7.8 | ) | (6.1 | ) | |||||||
Total gross margin | $ | 51,802 | $ | 64,138 | $ | 88,039 | (19.2 | )% | (27.1 | )% | |||||||
For the Years Ended December 31, | Change | |||||||||||||
2014 | 2013 | 2012 | 2014 vs 2013 | 2013 vs 2012 | ||||||||||
Gross margin | ||||||||||||||
Software-Systems | 61.9 | % | 57.6 | % | 69.0 | % | 4.3 | % | (11.4 | )% | ||||
Embedded Products and Hardware Services | 23.3 | 24.7 | 26.4 | (1.4 | ) | (1.7 | ) | |||||||
Corporate and other | (4.5 | ) | (3.9 | ) | (3.5 | ) | (0.6 | ) | (0.4 | ) | ||||
Total gross margin | 26.9 | % | 27.0 | % | 30.8 | % | (0.1 | )% | (3.8 | )% | ||||
Software-Systems. Gross margin as a percentage of revenues increased 430 basis points to 61.9% in 2014 from 57.6% in 2013. The increase is primarily attributable to a $2.0 million credit resulting from a vendor claim on faulty components, offset by the negative impact on fixed cost absorption resulting from a $4.7 million decrease in revenue.
31
Gross margin as a percentage of revenues decreased 1140 basis points to 57.6% in 2013 from 69.0% in 2012. The decline was a result of fewer high margin license sales in 2013 compared to 2012 and negative impact on fixed cost absorption resulting from a $7.7 million decrease in revenue in 2014 from 2013.
Embedded Products and Hardware Services. Gross margin as a percentage of revenues decreased 160 basis points to 23.3% in 2014 from 24.7% in 2013. Revenue decreased from 2014 to 2013 by $40.5 million adversely affecting fixed cost absorption that was modestly offset by gross margin improvements resulting from our contact manufacturing change and site consolidation in 2014.
Gross margin as a percentage of revenues decreased 170 basis points to 24.7% in 2013 from 26.4% in 2012. The decrease was attributable to the release of higher cost 40G products in 2013 and the negative impact on fixed cost absorption resulting from a $40.5 million decrease in 2013 revenue from 2012.
Corporate and other. Gross margin increased $0.7 million to $(8.6) million in 2014 from $(9.3) million in 2013. Items included in Corporate and other cost of sales include expenses not allocated to our two operating segments. These costs include amortization of intangible assets, stock compensation and restructuring and other expenses. The increase is attributable to a $0.3 million decrease in the amortization of intangible assets and a $0.2 million decrease in stock compensation expense.
Gross margin increased $0.6 million to $(9.3) million in 2013 from $(9.9) million in 2012. The decrease is attributable to a $1.0 million decrease in the amortization of intangible assets offset by a $0.5 million increase in stock compensation expense.
Operating Expenses
The following table summarizes our operating expenses (in thousands):
For the Years Ended December 31, | Change | ||||||||||||||||
2014 | 2013 | 2012 | 2014 vs 2013 | 2013 vs 2012 | |||||||||||||
Research and development | $ | 31,958 | $ | 45,000 | $ | 47,739 | (29.0 | )% | (5.7 | )% | |||||||
Selling, general and administrative | 35,862 | 41,210 | 45,200 | (13.0 | ) | (8.8 | ) | ||||||||||
Intangible assets amortization | 5,077 | 5,215 | 5,215 | (2.6 | ) | — | |||||||||||
Impairment of goodwill | — | — | 29,748 | — | 100.0 | ||||||||||||
Restructuring and other charges, net | 4,205 | 7,479 | (117 | ) | (43.8 | ) | (6,492.3 | ) | |||||||||
Total | $ | 77,102 | $ | 98,904 | $ | 127,785 | (22.0 | )% | (22.6 | )% | |||||||
Research and Development
R&D expenses consist primarily of salary, bonuses and benefits for product development staff, the cost of development supplies and equipment, net of reimbursements for nonrecurring engineering services. R&D expenses decreased $13.0 million to $32.0 million in 2014 from $45.0 million in 2013. The expense decrease is attributable to our restructuring efforts in the second half of 2013, which included the consolidation of our Shanghai and Penang development sites into our Shenzhen development center and focusing engineering headcount in lower cost geographic regions. This enabled a reduction in salary related expense of $8.9 million and reduced facilities related expenses of $1.9 million in 2014. R&D headcount increased to 418 at December 31, 2014 from 410 at December 31, 2013.
R&D expenses decreased $2.7 million to $45.0 million in 2013 from $47.7 million in 2012. R&D product development expenses decreased due to lower project-related spending for new product introductions specifically related to our ATCA T-Series 40G products, which were substantially released by the end of 2012. In addition, we significantly reduced our Shanghai development site in the second half of 2013. R&D headcount decreased to 410 at December 31, 2013 from 454 at December 31, 2012.
Selling, General, and Administrative
SG&A expenses consist primarily of salary, commissions and benefits for sales, marketing and administrative personnel, as well as legal and audit service providers and the costs of other general corporate activities. SG&A expenses decreased $5.3 million to $35.9 million in 2014 from $41.2 million in 2013. The decrease is attributable to facility and headcount restructuring actions, which resulted in $3.7 million in cost savings. In addition, we recorded a $1.3 million reversal of expense in 2013 as
32
the result of a licensing infringement settlement where the company was awarded legal fees reimbursements. SG&A headcount decreased to 157 at December 31, 2014 from 180 at December 31, 2013.
SG&A expenses decreased $4.0 million to $41.2 million in 2013 from $45.2 million in 2012. The decrease is attributable to facility and headcount restructuring actions, which resulted in $3.0 million in cost savings associated with payroll and facilities costs. In addition, we recorded a $1.3 million reversal of expense in 2013 as the result of licensing infringement settlement where the company was awarded legal fees reimbursements. SG&A headcount decreased to 180 at December 31, 2013 from 200 at December 31, 2012.
Intangible Assets Amortization
Intangible assets amortization decreased $0.1 million to $5.1 million in 2014 from $5.2 million in 2013. Intangible assets amortization remained at $5.2 million for 2013 and 2012. The amortization charges for each year were associated with the amortization of previously acquired intangible assets.
We perform impairment reviews of the purchased intangible assets whenever events or changes in circumstances indicate the carrying amount of an asset may not be recoverable. There have been no impairments of intangible assets (other than goodwill, as discussed below) recorded to date.
Impairment of Goodwill
In 2014 and 2013, we had no remaining goodwill.
In the second quarter of 2012, we completed an impairment analysis of goodwill pursuant to ASC 350-20-35 as we determined that a triggering event occurred that required analysis of both our goodwill and long-lived assets for impairment. We concluded at that time that we passed the first step of the two-step impairment test and therefore no impairment of goodwill was recorded. However, during the third quarter of 2012, we observed additional impairment indicators, including a further deterioration in the market in which we operate and a decrease in our market capitalization. Accordingly, in connection with the preparation of our third quarter financial statements, we completed an interim goodwill impairment test and recorded a goodwill impairment charge of $29.7 million, representing all of our goodwill.
We estimated the fair value of our single reporting unit using a market approach. The market approach estimates fair value in part on market capitalization plus an estimated control premium paid in acquisitions of publicly traded companies with similar characteristics to Radisys. Based upon our analysis, the implied fair value of goodwill was lower than its carrying value.
Restructuring and Other Charges, Net
Restructuring and other charges, net includes expenses associated with restructuring activities and other non-recurring gains and losses which are not indicative of our ongoing business operations. We evaluate the adequacy of the accrued restructuring charges on a quarterly basis. As a result, we record reversals to the accrued restructuring in the period in which we determine that expected restructuring and other obligations are less than the amounts accrued.
Restructuring and other charges, net decreased $3.3 million to $4.2 million in 2014 from $7.5 million in 2013. The decrease is due to the completion of restructuring actions primarily associated with our Shanghai and Penang development site closures.
During the year ended December 31, 2014, the Company recorded the following restructuring and other charges:
• | $1.5 million net expense relating to the severance of employees in connection with the previously reported Penang site closure, as well as severance for 20 additional employees, net of reductions resulting from changes in previously estimated amounts for employee severance and associated payroll costs; |
• | $2.1 million net integration-related expense principally associated with the Penang site closure asset write-offs and personnel transfers; |
• | $0.8 million legal expenses associated with non-operating strategic projects; and |
• | $0.2 million gain due to a decrease in the fair value of the Continuous Computing contingent consideration liability. |
33
Restructuring and other charges, net increased $7.6 million to $7.5 million in 2013 from $(0.1) million in 2012. The increase is due to restructuring actions primarily associated with our Shanghai and Malaysia site reductions and lease abandonment charges incurred in 2013. The following is the composition of charges during 2013:
• | $5.5 million net expense for the severance of employees, including a $0.9 million contractual severance benefit provided to our former Chief Executive Officer, and severance paid to other executive officers, net of reductions resulting from changes in previously estimated amounts for employee severance and associated payroll costs; |
• | $2.9 million expense relating to the write off of the Company's Security Gateway ("SEG") purchased computer software resulting from management's decision to abandon this technology; |
• | $1.7 million gain due to the decrease in fair value of the Continuous Computing contingent consideration liability; |
• | $1.5 million net gain from the sale of the Company's OS-9 software assets; |
• | $1.0 million net integration-related expense principally associated with asset write-offs, personnel overlap resulting from resource consolidation primarily associated with our Shanghai and Penang site reductions; |
• | $0.6 million net expense resulting from facilities rationalization in certain North American sites; and |
• | $0.8 million in legal expenses associated with non-operating strategic projects. |
Stock-based Compensation Expense
Included within costs of sales, R&D and SG&A are expenses associated with stock-based compensation. Stock-based compensation expense consists of amortization of stock-based compensation associated with unvested stock options, restricted stock units issued to employees under the 2007 stock plan, long-term incentive plan (as amended and restated, the "LTIP"), and the employee stock purchase plan (“ESPP”).
We incurred and recognized stock-based compensation expense as follows (in thousands):
For the Years Ended December 31, | Change | ||||||||||||||||
2014 | 2013 | 2012 | 2014 vs 2013 | 2013 vs 2012 | |||||||||||||
Cost of sales | $ | 386 | $ | 550 | $ | 25 | (29.8 | )% | 2,100.0 | % | |||||||
Research and development | 818 | 1,170 | 601 | (30.1 | ) | 94.7 | |||||||||||
Selling, general and administrative | 2,893 | 3,578 | 765 | (19.1 | ) | 367.7 | |||||||||||
Total | $ | 4,097 | $ | 5,298 | $ | 1,391 | (22.7 | )% | 280.9 | % | |||||||
Stock-based compensation expense decreased $1.2 million in 2014 to $4.1 million in 2014 compared to $5.3 million in 2013. Expense associated with restricted stock awards and stock options decreased $1.0 million due to decreased restricted stock awards granted since the third quarter of 2012 and 2014 stock option forfeitures.
Stock-based compensation expense increased $3.9 million in 2013 to $5.3 million in 2013 compared to $1.4 million in 2012. This was the result of $2.4 million previously recognized LTIP expense being reversed in 2012 and $1.6 million LTIP and Overlay performance based stock awards expense recognized in 2013. The 2012 reversal was due to a determination that the Plan's performance targets were not met.
Income (Loss) from Operations
The following table summarizes our income (loss) from operations (in thousands):
For the Years Ended December 31, | Change | ||||||||||||||||
2014 | 2013 | 2012 | 2014 vs 2013 | 2013 vs 2012 | |||||||||||||
Income (loss) from operations | |||||||||||||||||
Software-Systems | $ | (6,169 | ) | $ | (7,974 | ) | $ | 3,735 | (22.6 | )% | (313.5 | )% | |||||
Embedded Products and Hardware Services | 2,457 | (25 | ) | 2,661 | (9,928.0 | ) | (100.9 | ) | |||||||||
Corporate and other | (21,588 | ) | (26,767 | ) | (46,142 | ) | (19.3 | ) | (42.0 | ) | |||||||
Total income (loss) from operations | $ | (25,300 | ) | $ | (34,766 | ) | $ | (39,746 | ) | (27.2 | )% | (12.5 | )% | ||||
34
Software-Systems. Loss from operations improved by $1.8 million to a loss of $6.2 million in 2014 from a loss of $8.0 million in 2013 due to a $2.0 million 2014 credit that resulted from a vendor claim on faulty components as well as increased VoLTE shipments that were offset by continued softness in the audio conferencing market and delays in LTE small cell deployments.
Income (loss) from operations decreased $11.7 million to a loss of $8.0 million in 2013 from income of $3.7 million in 2012. This is attributable to a $10.5 million decrease in gross margin that resulted from softening in the audio conferencing market and increases in research and development spending attributable to the development of next generation MediaEngine products targeted at the VoLTE market.
Embedded Products and Hardware Services. Income (loss) from operations improved by $2.5 million to income of $2.5 million in 2014 from roughly break-even in 2013. The increase is related to $14.6 million in reduced research and development investment, marketing and commissions primarily due to previously disclosed restructuring actions that more than offset lower revenue levels that resulted in a $12.2 million reduction in gross margin.
Income (loss) from operations decreased $2.7 million to break even in 2013 from income of $2.7 million in 2012. The decrease is attributable to a $14.0 million decrease in gross margin which was partially offset by $11.4 million in reduced research and development investment and general and administrative expenses primarily attributable to restructuring actions.
Corporate and other. Items in Corporate and other loss from operations are amortization of intangible assets, stock compensation, restructuring and other, and impairment expenses. Loss from operations decreased $5.2 million to $21.6 million in 2014 from $26.8 million in 2013. The decrease is attributable to a $3.3 million decrease in restructuring and other expenses, $1.2 million decrease in stock compensation expense and a $0.5 million decrease in the amortization of intangible assets.
Loss from operations decreased $19.3 million to $26.8 million in 2013 from $46.1 million in 2012. The decrease is attributable to a $29.7 million impairment of goodwill recognized in 2012 offset by a $7.6 million increase in restructuring and other expenses and a $3.9 million increase in stock compensation.
Non-Operating Expenses
The following table summarizes our non-operating expenses (in thousands):
For the Years Ended December 31, | Change | ||||||||||||||||
2014 | 2013 | 2012 | 2014 vs 2013 | 2013 vs 2012 | |||||||||||||
Interest expense | $ | (1,242 | ) | $ | (1,220 | ) | $ | (1,722 | ) | 1.8 | % | (29.2 | )% | ||||
Interest income | 64 | 26 | 39 | 146.2 | (33.3 | ) | |||||||||||
Other income, net | 1,389 | 1,511 | 545 | (8.1 | ) | 177.2 | |||||||||||
Total | $ | 211 | $ | 317 | $ | (1,138 | ) | (33.4 | )% | (127.9 | )% | ||||||
Interest Expense
Interest expense includes interest incurred on our convertible senior notes and our revolving line of credit. In 2014, $1.2 million of interest expense remained unchanged when compared to 2013. In 2014, following a first quarter $5.0 million line of credit repayment, the Company maintained a $10.0 million outstanding letter of credit balance. In the prior year, the Company repaid $16.9 million of our 2013 convertible senior notes in February 2013 and subsequently drew $15.0 million on its line of credit. Despite the decrease in debt, interest expense remained constant as the Company paid higher interest rates on 2014 outstanding debt.
In 2013, interest expense included interest incurred on our convertible notes and outstanding balances on our line of credit plus the amortization of debt issuance costs. In 2013, interest expense decreased $0.5 million to $1.2 million in 2013 from $1.7 million in 2012 due to the $16.9 million repayment of our 2013 convertible senior notes in February 2013.
Other Income (Expense), Net
Other income, net decreased $0.1 million to $1.4 million in 2014 from $1.5 million in 2013. We recorded one time non-recurring credits in both periods as the Company realized a life insurance benefit of $0.4 million in 2014 and a $0.8 million gain from the sale of land adjacent to our Corporate Headquarters in Hillsboro, Oregon during in 2013. The remaining balance
35
in both periods relates primarily to the amortization of forward points associated with the Company's Indian Rupee cash flow hedges.
In 2013, other income, net increased $1.0 million to $1.5 million in 2013 from $0.5 million in 2012. This improvement was primarily the result of a $0.8 million gain that was realized from the sale of land adjacent to our Corporate Headquarters in Hillsboro, Oregon during the fourth quarter of 2013.
Income Tax Provision
We recorded income tax expense of $2.5 million, $15.0 million, and $2.6 million for the years ended December 31, 2014, 2013, and 2012, respectively. Our current effective tax rate differs from the statutory rate in all periods due to a full valuation allowance provided against our U.S. net deferred tax assets and a partial valuation allowance against certain of our foreign deferred tax assets. In addition, our effective tax rate in 2013 was impacted by the establishment of a $12.5 million valuation allowance against certain of our foreign deferred tax assets.
At December 31, 2014 and 2013, we had net deferred tax assets of $1.1 million and $3.8 million. We had valuation allowances of $84.2 million and $76.9 million as of December 31, 2014 and 2013, which represents a full valuation allowance against our U.S. deferred tax assets and a partial valuation allowance against certain of our foreign deferred tax assets. In evaluating our valuation allowance, we considered all available positive and negative evidence, including scheduled reversals of deferred tax liabilities, projected future taxable income, tax planning strategies, and recent financial performance. In the event we were to determine that we would not be able to realize all or part of our foreign net deferred tax assets in the future, we would increase the valuation allowance, resulting in a charge to earnings in the period in which we make such determination. Likewise, if we later determine that we are more likely than not to realize all or a portion of the U.S. or foreign net deferred tax assets, we would reverse the previously provided valuation allowance. All future reversals of the valuation allowance would result in a benefit in the period recognized. Although realization is not assured, management believes that it is more likely than not that the balance of the deferred tax assets, net of the valuation allowance, as of December 31, 2014 will be realized.
We are subject to income taxes in the U.S. and various foreign countries, and on occasion, we have been subject to corporate income tax audits. In determining the amount of income tax liabilities for uncertain tax positions, we have evaluated whether certain tax positions are more likely than not to be sustained by taxing authorities. We believe that we have adequately provided in our financial statements for additional taxes that may result from examination. To the extent the ultimate outcome of an examination differs from the amounts provided for as uncertain tax positions either additional expense or benefit will be recognized in the period in which the examination is effectively settled.
We are currently under tax examination in India. The periods covered under examination are the Company's financial years 2006 through 2008 and 2010 through 2011. The examinations are in various stages of appellate proceedings and all material uncertain tax positions associated with the examination have been taken into account in the ending balance of the unrecognized tax benefits at December 31, 2014.
Liquidity and Capital Resources
The following table summarizes selected financial information (in thousands):
For the Years Ended December 31, | |||||||||||
2014 | 2013 | 2012 | |||||||||
Cash and cash equivalents | $ | 31,242 | $ | 25,482 | $ | 33,182 | |||||
Working capital | 23,240 | 26,920 | 41,887 | ||||||||
Accounts receivable, net | 43,845 | 41,359 | 51,881 | ||||||||
Inventories, net | 18,475 | 24,928 | 20,071 | ||||||||
Accounts payable | 33,679 | 35,081 | 41,191 | ||||||||
Line of credit | 10,000 | 15,000 | — | ||||||||
2013 convertible senior notes | — | — | 16,919 | ||||||||
2015 convertible senior notes | 18,000 | 18,000 | 18,000 | ||||||||
36
Cash Flows
Cash and cash equivalents increased by $5.7 million to $31.2 million at December 31, 2014 from $25.5 million at December 31, 2013. As of December 31, 2014, the amount of cash held by our foreign subsidiaries was $7.8 million and the remaining $23.4 million was held in the U.S. During 2012, we repatriated $21.3 million with the intent of using these funds for the repayment of our February 2013 convertible senior notes in the amount of $17.5 million of principal and accrued interest and for continued working capital usage. It is not our intent to permanently reinvest funds in certain of our foreign entities, and we expect to repatriate cash from these foreign entities on an ongoing basis in future periods. Repatriation of funds from these foreign entities is not expected to result in actual cash tax payments due to the utilization of previously generated operating losses and credits of our U.S. entity.
Activities impacting cash and cash equivalents are as follows (in thousands):
For the Years Ended December 31, | |||||||||||
2014 | 2013 | 2012 | |||||||||
Operating Activities | |||||||||||
Net loss | $ | (27,581 | ) | $ | (49,404 | ) | $ | (43,474 | ) | ||
Non-cash adjustments | 30,101 | 44,422 | 57,191 | ||||||||
Changes in working capital | (9,317 | ) | 2,891 | (8,106 | ) | ||||||
Cash provided by (used in) operating activities | (6,797 | ) | (2,091 | ) | 5,611 | ||||||
Cash provided by (used in) investing activities | (2,196 | ) | (3,495 | ) | (11,160 | ) | |||||
Cash provided by (used in) financing activities | 15,304 | (2,034 | ) | (9,022 | ) | ||||||
Effect of exchange rate changes | (551 | ) | (80 | ) | (17 | ) | |||||
Net increase (decrease) in cash and cash equivalents | $ | 5,760 | $ | (7,700 | ) | $ | (14,588 | ) | |||
Operating Activities
Cash used in operating activities in 2014 was $6.8 million and consisted of a net loss of $27.6 million, adjustments for non-cash items of $30.1 million and an increase in working capital items of $9.3 million. For the year ended December 31, 2014 principal drivers to changes in our working capital consisted of the following:
• | Accounts receivables increased $2.3 million due to extended payment terms for a certain aging customer; |
• | Other receivables increased $3.7 million as the result of sales of inventory to our new contract manufacturer; |
• | Inventory decreased by $4.4 million due to the sale of inventory to our new contract manufacturer; |
• | Accounts payable decreased $1.5 million due fewer purchases from our contract manufacturer resulting from fewer sales in the year ended December 31, 2014 2014 compared to the same period in 2013. |
• | Accrued restructuring decreased $2.0 million due primarily to payments made for employee-related restructuring activities; and |
• | Deferred revenue decreased $2.0 million due primarily to the recognition of previously deferred MediaEngine product shipments. |
Cash used in operating activities in 2013 was $2.1 million and consisted of a net loss of $49.4 million, adjustments for non-cash items of $44.4 million and increase in working capital items of $2.9 million. For the year ended December 31, 2013 principal drivers to changes in our working capital consisted of the following:
• | Net trade accounts receivable decreased largely as the result of a reduction in our revenues from prior year. |
• | Net inventories and inventory deposits remained constant year over year as a result of a decrease in our finished goods inventory resulting from increased operational focus to reduce our inventory levels which was offset by an increase in consigned inventory held at our contract manufacturer associated with products in excess of one hundred eighty days demand. |
• | Accounts payable decreased as a direct result of timing of vendor payments and reduced customer orders. |
• | Deferred income decreased due to the timing of recognition of previously deferred amounts and new shipments that require deferrals due to undelivered elements or acceptance provisions. |
• | Other accrued liabilities decreased as a result of timing of payments. Specifically, accrued wages and bonuses decreased due to a decrease in our variable compensation provision for 2013 as compared to 2012. Accrued restructuring increased as a result of the timing of our restructuring activities. Finally, the contingent |
37
consideration liability resulting from our acquisition of Continuous Computing decreased due to a decline in projected revenues earned during the arrangement.
Investing Activities
Cash used in investing activities in 2014 of $2.2 million was attributable to $2.4 million used for capital expenditures.
Cash used in investing activities in 2013 of $3.5 million was attributable to $6.0 million used for capital expenditures offset by $1.1 million of proceeds from the sale of our OS-9 software asset and $1.4 million of proceeds received for the sale of land previously held for sale.
Financing Activities
Cash provided in financing activities in 2014 of $15.3 million was attributable to $20.6 million of cash generated from the issuance of 6.6 million newly issued shares of our common stock which was partially offset by the repayment of $5.0 million against out Silicon Valley Bank line credit.
Cash used in financing activities in 2013 of $2.0 million was the result of our payment of $16.9 million aggregate principal amount of our 2013 convertible senior notes, offset by $15.0 million in borrowings against our revolving line of credit.
Line of Credit
Silicon Valley Bank
At the beginning of the first quarter of 2014, we had a $35.0 million secured revolving line of credit agreement (as amended, the "Agreement") with Silicon Valley Bank ("SVB") with a stated maturity date of July 28, 2016. On March 14, 2014, we entered into an amended and restated $25.0 million secured revolving line of credit agreement (as amended, the "2014 Agreement") with SVB that replaces the Agreement and has a stated maturity date of July 28, 2016. On May 30, 2014 the 2014 Agreement was amended to increase the letter of credit sublimit under the secured revolving credit facility from $1,000,000 to $2,000,000. The secured revolving credit facility under the 2014 Agreement is available for cash borrowings and is subject to a borrowing formula based upon eligible accounts receivable less outstanding letters of credit (aggregate letters of credit are not to exceed $2,000,000). Eligible accounts receivable include 80% of domestic and 65% of foreign accounts receivable (80% in certain cases) for our U.S. companies, limited to concentration by certain customers, not greater than 60 days past original invoice date.The interest rate is dependent upon Liquidity (as defined in the 2014 Agreement) when compared to a pre-determined threshold (the "Liquidity Threshold"), which is defined in the 2014 Agreement as $15.0 million, with the exception of the last month end of each quarter, where it is defined as $20.0 million. Liquidity is calculated under the 2014 Agreement as unrestricted cash plus unused availability on the revolving line of credit; however if the 2015 convertible senior notes are not renewed or refinanced 120 days prior to their maturity date, which is February 15, 2015, Liquidity (for purposes of testing against the Liquidity Threshold) will be reduced by the outstanding principal amount of the 2015 convertible senior notes. The calculation of interest under the 2014 Agreement is as follows:
• | When Liquidity is above the Liquidity Threshold, the interest rate is the prime rate (as published in Wall Street Journal) plus 0.75%; and |
• | When Liquidity is below the Liquidity Threshold, the interest rate is the prime rate (as published in Wall Street Journal) plus 2.25%. |
Under the 2014 Agreement, we are required to make interest payments monthly. We were further required to pay a loan modification fee of $35,000 and a commitment fee equal to $35,000 on July 29, 2014 and will be required to pay the commitment fee annually thereafter. Under the 2014 Agreement, we are required to pay the higher of actual monthly interest incurred or the interest equivalent of $10.0 million in average monthly borrowings. If we terminate the commitment under the 2014 Agreement prior to the maturity date, we are required to pay a cancellation fee equal to 1.5% of the commitment under the 2014 Agreement. As of September 1, 2014, and at all times thereafter, the we are required to maintain a balance of at least $4,000,000 with SVB or its affiliates and we are required to have at least 50% of our cash with SVB or its affiliates or in an account where SVB has a control agreement.
The 2014 Agreement requires us to make certain representations, warranties and other agreements that are customary in credit agreements of this type. The 2014 Agreement also includes a financial covenant that requires us to maintain minimum Liquidity of $10.0 million tested monthly.
38
As of December 31, 2014 and 2013, we had outstanding balances of $10.0 million and $15.0 million issued on our behalf under the Agreement. At December 31, 2014, we had $14.4 million of total borrowing availability remaining under the Agreement. In 2015, after the repayment of the convertible senior notes, we expect our remaining borrowing availability under our Silicon Valley Bank line of credit to range between $7.0 million to $15.0 million as we manage our intra-quarter liquidity requirements due to the timing of customer collections and vendor payments and to remain compliant with covenants under the Agreement. We were in compliance with all covenants under the Agreement as of December 31, 2014.
2013 Convertible Senior Notes
On February 15, 2013, we repaid at maturity the entire outstanding balance of the 2.75% convertible senior notes due 2013 (the "2013 convertible senior notes") in accordance with the terms thereof.
2015 Convertible Senior Notes
On June 20, 2012, we entered into subscription agreements with certain holders of the 2013 convertible senior notes. Pursuant to the subscription agreements, on June 29, 2012 we exchanged $18.0 million aggregate principal amount of the 2013 convertible senior notes for $18.0 million aggregate principal amount of the new 2015 convertible senior notes. The 2015 convertible senior notes mature on February 15, 2015 and had a coupon rate of 4.5%.
As of December 31, 2014 and 2013 we had outstanding 2015 convertible senior notes with a face value of $18.0 million. As of December 31, 2014, the estimated fair value of our 2015 convertible senior notes was $18.0 million.
On February 17, 2015, we repaid at maturity the entire outstanding balance of the 2015 convertible senior notes in accordance with the terms thereof. No convertible senior notes were converted to common stock.
Derivatives
We enter into forward foreign currency exchange contracts for the Indian Rupee to reduce the impact of foreign currency exchange risks where natural hedging strategies could not be effectively employed.
We do not hold or issue derivative financial instruments for trading purposes. The purpose of our hedging activities is to reduce the risk that the eventual cash flows of the underlying assets, liabilities and firm commitments will be adversely affected by changes in exchange rates. In general, our hedging activities do not create foreign currency exchange rate risk because fluctuations in the value of the instruments used for hedging purposes are offset by fluctuations in the value of the underlying exposures being hedged. Counterparties to derivative financial instruments expose us to credit-related losses in the event of non-performance. We do not believe there is a significant credit risk associated with our hedging activities because the counterparties are all large financial institutions with high credit ratings.
All derivatives, including foreign currency exchange contracts are recognized on the balance sheet at fair value. Unrealized gain positions are recorded as other current assets and unrealized loss positions are recorded as other current liabilities. Changes in the fair values of the outstanding derivatives that are highly effective are recorded in other comprehensive income (loss) until net income (loss) is affected by the variability of the cash flows of the hedged transaction. Hedge ineffectiveness may result when the amount of our hedge contracts exceed our forecasted or actual transactions for which the hedge contracts were designed to hedge. Once a hedge contract matures the associated gain (loss) on the contract will remain in other comprehensive income until the underlying hedged transaction affects net income (loss), at which time the gain (loss) will be recorded to the expense line item being hedged, which is primarily Cost of Sales and R&D. One of the criteria for this accounting treatment is that the forward foreign currency exchange contract amount should not be in excess of specifically identified anticipated transactions. By their nature, estimates of anticipated transactions may fluctuate over time and may ultimately vary from actual transactions. If anticipated transaction estimates or actual transaction amounts decrease below hedged levels, or when the timing of transactions change significantly, we would reclassify a portion of the cumulative changes in fair values of the related hedge contracts from other comprehensive income (loss) to other income (expense) during the quarter in which the changes occur.
39
Contractual Obligations
The following summarizes our contractual obligations at December 31, 2014 and the effect of such on our liquidity and cash flows in future periods (in thousands):
Total | 2015 | 2016-2017 | 2018-2019 | 2020 & Thereafter | |||||||||||||||
Operating leases | $ | 8,354 | $ | 3,363 | $ | 3,573 | $ | 1,190 | $ | 228 | |||||||||
Purchase obligations (A) | 1,733 | 1,733 | — | — | — | ||||||||||||||
2015 convertible senior notes | 18,000 | 18,000 | — | — | — | ||||||||||||||
Line of credit (B) | 10,000 | 10,000 | — | — | — | ||||||||||||||
Interest on convertible senior notes | 405 | 405 | — | — | |||||||||||||||
Total | $ | 38,492 | $ | 33,501 | $ | 3,573 | $ | 1,190 | $ | 228 | |||||||||
(A) | Purchase obligations include agreements or purchase orders to purchase goods or services that are enforceable and legally binding and specify all significant terms, including: fixed or minimum quantities to be purchased, fixed, minimum or variable price provisions and the approximate timing of the transaction. Purchase obligations exclude agreements that are cancelable without penalty. These purchase obligations are entered into in the ordinary course of business and are expected to be funded by cash flows from continuing operations. |
(B) | The secured revolving line of credit agreement has a stated maturity date of July 28, 2016. |
In addition to the above, we have approximately $3.7 million in liabilities associated with unrecognized tax benefits. We are not able to reasonably estimate when we would make any cash payments required to settle these liabilities, but do not believe that the ultimate settlement of our obligations will materially affect our liquidity.
Off-Balance Sheet Arrangements
We do not engage in any activity involving special purpose entities or off-balance sheet financing.
Shelf Registration Statement
On September 18, 2013, we filed an unallocated shelf registration statement on Form S-3 for the offering from time to time of up to $100 million in securities consisting of common stock, preferred stock, depositary shares, warrants, debt securities or units consisting of one or more of these securities. The SEC declared the shelf registration statement effective on October 16, 2013, and it will expire in October 2016. Except as may be stated in a prospectus supplement for any particular offering, we intend to use the net proceeds from the sale of any securities for general corporate purposes, which may include acquiring companies in our industry and related businesses, repaying existing debt, providing additional working capital and procuring capital assets.
Liquidity Outlook
At December 31, 2014, our cash and cash equivalents amounted to $31.2 million. On February 17, 2015, we repaid at maturity the $18.0 million balance of the 2015 convertible senior notes. We believe our current cash and cash equivalents, cash expected to be generated from operations and borrowings under our Silicon Valley Bank line of credit will satisfy our short and long-term expected working capital needs, capital expenditures, acquisitions, stock repurchases, and other liquidity requirements associated with our present business operations. We believe our current working capital, plus availability under the line of credit, provides sufficient liquidity to operate the business at normal levels; however, if available liquidity is not sufficient to meet our operating requirements, we may, among other available options, pursue alternative financing arrangements or reduce expenditures as necessary to meet our cash requirements throughout 2015.
40
Critical Accounting Policies and Estimates
Management’s discussion and analysis of our financial condition and results of operations is based upon the Consolidated Financial Statements, which have been prepared in accordance with U.S. GAAP. The preparation of these financial statements requires management to make estimates and judgments that may affect the reported amounts of assets, liabilities, and revenues and expenses. On an on-going basis, management evaluates its estimates. Management bases its estimates on historical experience and on various other assumptions that are believed to be reasonable under the circumstances, the results of which form the basis for making judgments about the carrying values of assets and liabilities that are not readily apparent from other sources. Actual results may differ from these estimates under different assumptions or conditions.
An accounting policy is deemed to be critical if it requires an accounting estimate to be made based on assumptions about matters that are highly uncertain at the time the estimate is made, and if different estimates that reasonably could have been used, or changes in the accounting estimates that are reasonably likely to occur periodically, could materially impact the financial statements. Management believes the following critical accounting policies reflect the more significant estimates and assumptions used in the preparation of the Consolidated Financial Statements.
Revenue Recognition
Multiple Element Arrangements
A significant portion of our revenue relates to product sales for which revenue is recognized upon shipment, with limited judgment required related to product returns. Title transfer for substantially all product sales occurs upon delivery of products to our customer's freight forwarders. The software elements included in certain components of ATCA systems and MediaEngine products are considered to be functioning together with the non-software elements to provide the tangible product's essential functionality and these arrangements generally include multiple elements such as hardware, technical support services as well as software upgrades or enhancements on a when and if available basis. Arrangements including multiple elements require significant management judgment to evaluate the effective terms of agreements, our performance commitments and determination of fair value of the various deliverables under the arrangement.
ASU 2009−13 provides a fair value hierarchy in order to determine the appropriate relative fair value for each element of an arrangement. When available, we use vendor specific objective evidence (“VSOE”) to determine the estimated selling price. In the absence of VSOE or third−party evidence ("TPE") for a delivered element, we then use an estimated selling price in order to determine fair value. Estimated selling prices represent our best estimate of the price at which it would transact if the deliverables were sold on a standalone basis. For technical support services, we generally determine our selling price based on VSOE as supported by substantive renewal rates in the related service agreements. In certain instances where VSOE cannot be established, we then rely upon the estimated selling price for such deliverables as TPE is generally not available due to the unique company specific terms surrounding such service agreements. In establishing an appropriate estimated selling price for these technical support agreements, we considered entity specific factors such as its historical and projected costs, historical and projected revenues, and profit objectives. We also considered market specific factors when establishing reasonable profit objectives.
Hardware
Revenue from hardware products is recognized in accordance with ASC 605 Revenue Recognition. Under our standard terms and conditions of sale, we transfer title and risk of loss to the customer at the time product is shipped to the customer and revenue is recognized accordingly, unless customer acceptance is uncertain or significant obligations remain. We reduce revenue for estimated customer returns resulting from rotation rights according to agreements with our distributors. The amount of revenues derived from these distributors as a percentage of total revenues was 16.3%, 14.3% and 16.0% for the years ended December 31, 2014, 2013 and 2012. We accrue the estimated cost of product warranties based on historical failure rates and the cost of fixing or replacing defective units at the time we recognize revenue.
The software elements included in certain components of embedded product systems and MediaEngine products are considered to be functioning together with the non-software elements to provide the tangible product's essential functionality and our MediaEngine arrangements generally include multiple elements such as hardware and technical support services.
Software licenses and royalties
Revenue from software licenses and royalties is recognized in accordance with ASC 985 Software. We recognize software license revenue at the time of shipment or upon delivery of the software master provided that the revenue recognition
41
criteria have been met and VSOE exists to allocate the total fee to all undelivered elements of the arrangement. We defer revenue on arrangements including specified software upgrades until the specified upgrade has been delivered. Revenue from customers for prepaid, non-refundable software royalties is recorded when the revenue recognition criteria have been met. Revenue for non-prepaid royalties is recognized at the time we receive reporting from our customers as we have not established an ability to reliably estimate customer royalties prior to time contractually obligated reporting is received.
Technical support services
Technical support services revenue is recognized as earned on the straight-line basis over the term of the contract in accordance with applicable GAAP for revenue recognition. The fair value of our post-contract support has been determined by renewal rates within our support agreements, the actual amounts charged to customers for renewal of their support services or based on an estimated selling price.
Professional and other services
Professional services revenue is recognized upon completion of certain contractual milestones and customer acceptance of the services rendered. Other services revenues include hardware repair services and custom software implementation projects. Hardware repair services revenues are recognized when the services are complete. Software implementation revenues are recognized upon completion of certain contractual milestones and customer acceptance of the services rendered or as services are performed under the percentage-of-completion method when we are reasonably able to estimate the total effort required to complete the contract.
Deferred income
Deferred income represents amounts received or billed for the following types of transactions:
• | Undelivered elements of an arrangement—Certain arrangements include specified software upgrades and enhancements to an existing product. Revenue for such arrangements is deferred until the future obligation is fulfilled. |
• | Technical support services—We have a number of technical support agreements with our customers for hardware and software maintenance. Generally, these services are billed in advance and recognized over the term of the agreement. |
Allowance for Doubtful Accounts
We have a relatively small set of multinational customers that typically make up the majority of our accounts receivable balance. Our allowance for doubtful accounts is determined using a combination of factors to ensure that our trade receivables balances are not overstated. We record reserves for individual accounts when we become aware of a customer’s inability to meet its financial obligations to us, such as in the case of bankruptcy filings or deterioration in the customer’s operating results or financial position. If circumstances related to customers change, our estimates of the recoverability of receivables would be further adjusted. At December 31, 2014, 18.5% of our accounts receivable was due from our largest customer. If one of our large customers or a number of our smaller customers files for bankruptcy or otherwise is unable to pay the amounts due to us, the current allowance for doubtful accounts may not be adequate. During the years ended December 31, 2014 and 2013, there were no significant account balances reserved.
We maintain a non-specific bad debt reserve for all customers. This non-specific bad debt reserve is calculated based on our historical pattern of bad debt write offs as a percentage of annual revenues, which percentage is then applied to the current rolling four-quarter's revenue.
Inventory Valuation
We record an inventory valuation allowance for estimated obsolete or unmarketable inventories as the difference between the cost of inventories and the estimated net realizable value based upon assumptions about future demand and market conditions. Our inventory valuation allowances establish a new cost basis for inventory. Factors influencing the provision include: changes in demand; rapid technological changes; product life cycle and development plans; component cost trends; product pricing; regulatory requirements affecting components; and physical deterioration. If actual market conditions are less favorable than those projected by management, additional provisions for inventory reserves may be required. Our estimate for
42
the allowance is based on the assumption that our customers comply with their current contractual obligations. We provide long-life support to our customers and therefore we have material levels of customer specific inventory. If our customers experience a financial hardship or if we experience unplanned cancellations of customer contracts, the current provision for the inventory reserves may be inadequate. Additionally, we may incur additional expenses associated with any non-cancelable purchase obligations to our suppliers if they provide customer-specific components.
Long-Lived Assets
Our long-lived assets include definite-lived intangible assets and property and equipment. The net balance of our definite-lived intangible assets and property and equipment at December 31, 2014 and December 31, 2013 amounted to $53.0 million and $71.4 million.
Intangible assets, net of accumulated amortization, primarily consist of acquired patents, completed technology, technology licenses, trade names and customer lists. Intangible assets are being amortized on a straight-line basis over estimated useful lives with remaining lives of one to seven years as of December 31, 2014. Property and equipment, net of accumulated depreciation, primarily consists of office equipment and software, manufacturing equipment, leasehold improvements and other physical assets owned by us. Property and equipment are being depreciated or amortized on a straight-line basis over estimated useful lives ranging from one to fifteen years. We assess impairment of intangible assets and property and equipment whenever conditions indicate that the carrying values of the assets may not be recoverable.
Conditions that would trigger a long-lived asset impairment assessment include, but are not limited to, a significant adverse change in legal factors or in the business climate that could affect the value of an asset or an adverse action or assessment by a regulator. If we determine that a long-lived asset impairment assessment is required, we must determine the fair value of the asset. Impairments would be recognized in operating results to the extent that the carrying value exceeds this calculated fair value of the long-lived assets. We determined triggering events occurred during the third quarters of 2014 due to lower than expected sales within our Software-Systems segment and 2013 due to a significant decrease in the Company's stock price which required analysis of the recoverability of the Company's long-lived assets. After finalizing this analysis, we concluded our long-lived assets were not impaired.
Considerable management judgment is required in determining if and when a condition would trigger an impairment assessment of our long-lived assets and once such a determination has been made, considerable management judgment is required to determine the expected future cash flows and the fair market value of the long-lived asset. If and when a condition has triggered an impairment analysis of our long-lived assets, we may incur substantial impairment losses due to the write-down or the write-off of our long-lived assets.
Accrued Restructuring
Because we have a history of paying severance benefits, expenses associated with exit or disposal activities are recognized when probable and estimable.
We have engaged, and may continue to engage, in restructuring actions, which require us to make significant estimates in several areas including: realizable values of assets made redundant or obsolete; expenses for severance and other employee separation costs; the ability and timing to generate sublease income, as well as our ability to terminate lease obligations at the amounts we have estimated; and other exit costs. Should the actual amounts differ from our estimates, the amount of the restructuring charges could be materially impacted. For a description of our restructuring actions, refer to our discussion of restructuring and other charges, net in the Results of Operations section.
Accrued Warranty
We provide for the estimated cost of product warranties at the time revenue is recognized. Our standard product warranty terms generally include repairs or replacement of a product at no additional charge for a specified period of time, which is generally 12 or 24 months after shipment. The workmanship of our products produced by our contract manufacturer is covered under warranties provided by the contract manufacturer for 12 to 24 months. We engage in extensive product quality programs and processes, including actively monitoring and evaluating the quality of our component suppliers. Our estimated warranty obligation is based upon ongoing product failure rates, internal repair costs, contract manufacturing repair charges for repairs not covered by the contract manufacturer’s warranty, average cost per repair and current period product shipments. If actual product failure rates, repair rates, service delivery costs, or post-sales support costs differ from our estimates, revisions to the estimated warranty liability would be required. Additionally, we accrue warranty costs for specific customer product repairs
43
that are in excess of our warranty obligation calculation described above. Accrued warranty reserves are included in short-term and long-term other accrued liabilities in the accompanying Consolidated Balance Sheets.
Income Taxes
Income tax accounting requires the recognition of deferred tax assets and liabilities for the expected future tax consequences of temporary differences between the carrying amounts and tax bases of the assets and liabilities. We record a valuation allowance to reduce deferred tax assets if it is “more likely than not” that all or a portion of the asset will not be realized due to inability to generate sufficient taxable income in the relevant period to utilize the deferred tax asset. Our net deferred tax assets amounted to $1.1 million as of December 31, 2014. We have considered future market growth, forecasted earnings, future taxable income, the mix of earnings in the jurisdictions in which we operate and prudent and feasible tax planning strategies in determining the need for a valuation allowance. In the event we were to determine that we would not be able to realize all or part of our net deferred tax assets in the future, we would increase the valuation allowance and make a corresponding charge to earnings in the period in which we make such determination. Likewise, if we later determine that we are more likely than not to realize the net deferred tax assets, we would reverse the applicable portion of the previously provided valuation allowance. All future reversals of the valuation allowance would result in a benefit in the period recognized.
We evaluate liabilities for estimated tax exposures in all of our operational jurisdictions. The calculation of our tax liabilities includes addressing uncertainties in the application of complex tax regulations. We recognize liabilities for uncertain tax positions in the U.S. and other tax jurisdictions based on recognition and measurement criteria that allow financial statement benefits to be recognized only for tax positions that are more-likely-than-not to be sustained upon tax audit, administrative appeals or final court determination. The liabilities are reviewed for their adequacy and appropriateness. Changes to our assumptions could cause a revision of past estimates. Such a change in measurement would result in the recognition of a tax benefit or an additional charge to the tax provision.
Stock-based Compensation
We measure stock-based compensation at the grant date, based on the fair value of the award, and recognize expense on a straight-line basis over the employee's requisite service period. For performance-based restricted stock unit awards under the LTIP or the Overlay Plan of the 2007 Stock Plan ("Overlay") the requisite service period is equal to the period of time over which performance objectives underlying the award are expected to be achieved and vested. The number of shares that ultimately vest depends on the achievement of certain performance criteria over the measurement period. Quarterly, we reevaluate the period during which the performance objective will be met and the number of shares expected to vest. The amount of expense recorded each period is based on our estimate of the number of awards that will ultimately vest.
We estimate the fair value of stock options and purchase rights under our employee stock purchase plans using a Black-Scholes option-pricing model. The Black-Scholes option-pricing model incorporates several highly subjective assumptions including expected volatility, expected term and interest rates.
In reaching our determination of expected volatility, we use the historic volatility of our shares of common stock. We base the expected term of our stock options on historic experience. The expected term for purchase rights under our employee stock plans is based on the 18 month offering period. The risk-free rate is based on the U.S. Treasury constant maturities in effect at the time of grant for the expected term of the option or share.
The calculation includes several assumptions that require management's judgment. The expected term of the option or share is determined based on assumptions about patterns of employee exercises and represents a probability-weighted average time-period from grant until exercise of stock options, subject to information available at time of grant. Determining expected volatility generally begins with calculating historical volatility for a similar long-term period and then considers the ways in which the future is reasonably expected to differ from the past.
The input factors used in the valuation model are based on subjective future expectations combined with management judgment. If there is a difference between the assumptions used in determining stock-based compensation cost and the actual factors which become known over time, we may change the input factors used in determining stock-based compensation costs. These changes may materially impact the results of operations in the event such changes are made. In addition, if we were to modify any awards, additional charges would be taken. If our actual forfeiture rate is materially different from our estimate the stock-based compensation expense could be significantly different from what we have recorded in the current period. See Note 17 — Employee Benefit Plans of the Notes to the Consolidated Financial Statements for a further discussion on stock-based compensation.
44
Recent Accounting Pronouncements
On May 28, 2014, the FASB issued ASU No. 2014-09, Revenue from Contracts with Customers, which requires an entity to recognize the amount of revenue to which it expects to be entitled for the transfer of promised goods or services to customers. The ASU will replace most existing revenue recognition guidance in U.S. GAAP when it becomes effective. The new standard is effective for us on January 1, 2017. Early application is not permitted. The standard permits the use of either the retrospective or cumulative effect transition method. We are evaluating the effect that ASU 2014-09 will have on our consolidated financial statements and related disclosures. We have not yet selected a transition method and have not determined the effect of the standard on our ongoing financial reporting.
Item 7A. Quantitative and Qualitative Disclosures about Market Risk
We are exposed to market risk from changes in interest rates, foreign currency exchange rates, and equity trading prices, which could affect our financial position and results of operations.
Foreign Currency Risk. We pay the expenses of our international operations in local currencies, namely, the Canadian Dollar, Euro, Chinese Yuan, Indian Rupee, Japanese Yen, Malaysian Ringgit and British Pound Sterling. Our international operations are subject to risks typical of an international business, including, but not limited to: differing economic conditions, changes in political climate, differing tax structures, foreign exchange rate volatility and other regulations and restrictions. Accordingly, future results could be materially and adversely affected by changes in these or other factors. We are also exposed to foreign exchange rate fluctuations as the balance sheets and income statements of our foreign subsidiaries are translated into U.S. Dollars during the consolidation process. Because exchange rates vary, these results, when translated, may vary from expectations and adversely affect overall expected profitability.
Based on our policy, we have established a foreign currency exposure management program which uses derivative foreign exchange contracts to address nonfunctional currency exposures. In order to reduce the potentially adverse effects of foreign currency exchange rate fluctuations, we have entered into forward exchange contracts. These hedging transactions limit our exposure to changes in the U.S. Dollar to the Indian Rupee exchange rates, and as of December 31, 2014 the total notional or contractual value of the contracts we held was $14.2 million. These contracts will mature over the next 17 months.
Holding other variables constant, a 10% adverse fluctuation, in relation to our hedge positions, of the U.S. Dollar relative to the Indian Rupee would require an adjustment of $1.5 million and increase our Indian Rupee hedge liability as of December 31, 2014, to $1.4 million. A 10% favorable fluctuation, in relation to our hedge positions, of the U.S. Dollar relative to the Indian Rupee would result in an adjustment of $1.3 million, reversing our Indian Rupee hedge liability and creating a hedge asset as December 31, 2014, in the amount of $1.4 million. We do not expect a 10% fluctuation to have any impact on our operating results as the underlying hedged transactions will move in an equal and opposite direction. If there is an unfavorable movement in the Indian Rupee relative to our hedged positions this would be offset by reduced expenses, after conversion to the U.S. Dollar, associated with obligations paid for in the Indian Rupee.
Convertible Notes. The fair value of the 2015 convertible senior notes is sensitive to interest rate changes as well as changes in our stock price. Interest rate changes would result in an increase or decrease in the fair value of the convertible senior notes due to differences between market interest rates and rates in effect at the inception of the obligation. Fluctuations in our stock price would result in an increase or decrease in the fair value of the convertible senior notes due to the value of the notes derived from the conversion feature. Unless we elect to repurchase our 2015 convertible senior notes in the open market, changes in the fair value of the convertible senior notes have no impact on our cash flows or Consolidated Financial Statements. The estimated fair value of the 2015 convertible senior notes was $18.0 million at December 31, 2014.
45
Item 8. Financial Statements and Supplementary Data
Quarterly Financial Data (unaudited)
For the Year Ended December 31, 2014 | For the Year Ended December 31, 2013 | ||||||||||||||||||||||||||||||
First Quarter | Second Quarter | Third Quarter | Fourth Quarter | First Quarter | Second Quarter | Third Quarter | Fourth Quarter | ||||||||||||||||||||||||
(In thousands, except per share data) | |||||||||||||||||||||||||||||||
Revenues | $ | 43,799 | $ | 49,964 | $ | 50,805 | $ | 48,174 | $ | 68,178 | $ | 65,438 | $ | 54,109 | $ | 50,138 | |||||||||||||||
Gross margin | 11,148 | 12,007 | 14,697 | 13,950 | 19,655 | 19,464 | 14,166 | 10,853 | |||||||||||||||||||||||
Loss from operations(A) | (9,464 | ) | (7,429 | ) | (4,103 | ) | (4,304 | ) | (5,550 | ) | (3,273 | ) | (11,996 | ) | (13,947 | ) | |||||||||||||||
Net Loss (A) | (10,434 | ) | (8,211 | ) | (4,469 | ) | (4,467 | ) | (6,557 | ) | (4,112 | ) | (12,720 | ) | (26,015 | ) | |||||||||||||||
Loss per share: | |||||||||||||||||||||||||||||||
Basic | $ | (0.35 | ) | $ | (0.23 | ) | $ | (0.12 | ) | $ | (0.12 | ) | $ | (0.23 | ) | $ | (0.14 | ) | $ | (0.44 | ) | $ | (0.89 | ) | |||||||
Diluted | $ | (0.35 | ) | $ | (0.23 | ) | $ | (0.12 | ) | $ | (0.12 | ) | $ | (0.23 | ) | $ | (0.14 | ) | $ | (0.44 | ) | $ | (0.89 | ) | |||||||
(A) | The comparability of our income (loss) from operations and net income (loss) per share was affected by the following unusual income or expense items: |
• | During the fourth quarter of 2013, the Company recorded a $12.5 million loss associated with the establishment of a valuation allowance against certain of the Company's foreign deferred tax assets. |
• | During the first quarter of 2013, the Company recorded a $2.9 million loss associated to the write off of the Company's Security Gateway ("SEG") purchased computer software due to management's decision to abandon future development of this technology. |
• | During the first quarter of 2013, the Company recorded a $1.5 million gain associated with the the sale of the Company's OS-9 software assets. |
46
MANAGEMENT’S REPORT ON INTERNAL CONTROL OVER FINANCIAL REPORTING
The management of the Company is responsible for establishing and maintaining adequate internal control over financial reporting as defined in Rules 13a-15(f) and 15d-15(f) under the Securities Exchange Act of 1934. The Company’s internal control over financial reporting is a process designed to provide reasonable assurance regarding reliability of financial reporting and the preparation and fair presentation of published financial statements for external purposes in accordance with generally accepted accounting principles.
Because of its inherent limitations, internal control over financial reporting may not prevent or detect misstatements. Also, projections of any evaluation of effectiveness to future periods are subject to the risk that controls may become inadequate because of changes in conditions, or that the degree of compliance with the policies or procedures may deteriorate.
Management assessed the effectiveness of the Company’s internal control over financial reporting as of December 31, 2014. In making this assessment, management used the criteria set forth by the Committee of Sponsoring Organizations of the Treadway Commission (COSO) in the Internal Control—Integrated Framework (1992). Based on our assessment, we conclude that, as of December 31, 2014 the Company’s internal control over financial reporting is effective based on those criteria to provide reasonable assurance regarding the reliability of financial reporting and the preparation of financial statements for external purposes in accordance with generally accepted accounting principles.
The effectiveness of internal control over financial reporting as of December 31, 2014, has been audited by KPMG LLP, the independent registered public accounting firm who also audited the Company’s Consolidated Financial Statements included in this Item 8, as stated in the report which appears on page 48 hereof.
47
Report of Independent Registered Public Accounting Firm
The Board of Directors and Shareholders
Radisys Corporation:
We have audited the accompanying consolidated balance sheets of Radisys Corporation and subsidiaries (the Company) as of December 31, 2014 and 2013, and the related consolidated statements of operations, comprehensive loss, changes in shareholders' equity, and cash flows for each of the years in the three-year period ended December 31, 2014. We also have audited Radisys Corporation's internal control over financial reporting as of December 31, 2014, based on criteria established in Internal Control - Integrated Framework (1992) issued by the Committee of Sponsoring Organizations of the Treadway Commission (COSO). Radisys Corporation's management is responsible for these consolidated financial statements, for maintaining effective internal control over financial reporting, and for its assessment of the effectiveness of internal control over financial reporting, included in the accompanying Management's Report on Internal Control Over Financial Reporting. Our responsibility is to express an opinion on these consolidated financial statements and an opinion on the Company's internal control over financial reporting based on our audits.
We conducted our audits in accordance with the standards of the Public Company Accounting Oversight Board (United States). Those standards require that we plan and perform the audits to obtain reasonable assurance about whether the financial statements are free of material misstatement and whether effective internal control over financial reporting was maintained in all material respects. Our audits of the consolidated financial statements included examining, on a test basis, evidence supporting the amounts and disclosures in the financial statements, assessing the accounting principles used and significant estimates made by management, and evaluating the overall financial statement presentation. Our audit of internal control over financial reporting included obtaining an understanding of internal control over financial reporting, assessing the risk that a material weakness exists, and testing and evaluating the design and operating effectiveness of internal control based on the assessed risk. Our audits also included performing such other procedures as we considered necessary in the circumstances. We believe that our audits provide a reasonable basis for our opinions.
A company's internal control over financial reporting is a process designed to provide reasonable assurance regarding the reliability of financial reporting and the preparation of financial statements for external purposes in accordance with generally accepted accounting principles. A company's internal control over financial reporting includes those policies and procedures that (1) pertain to the maintenance of records that, in reasonable detail, accurately and fairly reflect the transactions and dispositions of the assets of the company; (2) provide reasonable assurance that transactions are recorded as necessary to permit preparation of financial statements in accordance with generally accepted accounting principles, and that receipts and expenditures of the company are being made only in accordance with authorizations of management and directors of the company; and (3) provide reasonable assurance regarding prevention or timely detection of unauthorized acquisition, use, or disposition of the company's assets that could have a material effect on the financial statements.
Because of its inherent limitations, internal control over financial reporting may not prevent or detect misstatements. Also, projections of any evaluation of effectiveness to future periods are subject to the risk that controls may become inadequate because of changes in conditions, or that the degree of compliance with the policies or procedures may deteriorate.
In our opinion, the consolidated financial statements referred to above present fairly, in all material respects, the financial position of Radisys Corporation and subsidiaries as of December 31, 2014 and 2013, and the results of its operations and its cash flows for each of the years in the three-year period ended December 31, 2014, in conformity with U.S. generally accepted accounting principles. Also in our opinion, Radisys Corporation maintained, in all material respects, effective internal control over financial reporting as of December 31, 2014, based on criteria established in Internal Control - Integrated Framework (1992) issued by the Committee of Sponsoring Organizations of the Treadway Commission.
/s/ KPMG LLP
Portland, Oregon
February 27, 2015
48
RADISYS CORPORATION
CONSOLIDATED STATEMENTS OF OPERATIONS
(In thousands, except per share amounts)
For the Years Ended December 31, | |||||||||||
2014 | 2013 | 2012 | |||||||||
Revenues | $ | 192,742 | $ | 237,863 | $ | 286,096 | |||||
Cost of sales: | |||||||||||
Cost of sales | 132,730 | 165,166 | 188,513 | ||||||||
Amortization of purchased technology | 8,210 | 8,559 | 9,544 | ||||||||
Total cost of sales | 140,940 | 173,725 | 198,057 | ||||||||
Gross margin | 51,802 | 64,138 | 88,039 | ||||||||
Research and development | 31,958 | 45,000 | 47,739 | ||||||||
Selling, general and administrative | 35,862 | 41,210 | 45,200 | ||||||||
Intangible assets amortization | 5,077 | 5,215 | 5,215 | ||||||||
Impairment of goodwill | — | — | 29,748 | ||||||||
Restructuring and other charges, net | 4,205 | 7,479 | (117 | ) | |||||||
Loss from operations | (25,300 | ) | (34,766 | ) | (39,746 | ) | |||||
Interest expense | (1,242 | ) | (1,220 | ) | (1,722 | ) | |||||
Interest income | 64 | 26 | 39 | ||||||||
Other income | 1,389 | 1,511 | 545 | ||||||||
Loss before income tax expense | (25,089 | ) | (34,449 | ) | (40,884 | ) | |||||
Income tax expense | 2,492 | 14,955 | 2,590 | ||||||||
Net loss | $ | (27,581 | ) | $ | (49,404 | ) | $ | (43,474 | ) | ||
Net loss per share: | |||||||||||
Basic | $ | (0.79 | ) | $ | (1.72 | ) | $ | (1.60 | ) | ||
Diluted | $ | (0.79 | ) | $ | (1.72 | ) | $ | (1.60 | ) | ||
Weighted average shares outstanding: | |||||||||||
Basic | 34,699 | 28,805 | 27,174 | ||||||||
Diluted | 34,699 | 28,805 | 27,174 | ||||||||
The accompanying notes are an integral part of these financial statements.
49
RADISYS CORPORATION
CONSOLIDATED STATEMENTS OF COMPREHENSIVE LOSS
(In thousands)
For the Years Ended December 31, | |||||||||||
2014 | 2013 | 2012 | |||||||||
Net loss | $ | (27,581 | ) | $ | (49,404 | ) | $ | (43,474 | ) | ||
Other comprehensive loss: | |||||||||||
Translation adjustments | (556 | ) | (438 | ) | (325 | ) | |||||
Adjustment for fair value of hedge derivatives, net of tax | 123 | (110 | ) | 9 | |||||||
Other comprehensive loss | (433 | ) | (548 | ) | (316 | ) | |||||
Comprehensive loss | $ | (28,014 | ) | $ | (49,952 | ) | $ | (43,790 | ) | ||
The accompanying notes are an integral part of these financial statements.
50
RADISYS CORPORATION
CONSOLIDATED BALANCE SHEETS
(In thousands except per share amounts)
December 31, 2014 | December 31, 2013 | ||||||
ASSETS | |||||||
Current assets: | |||||||
Cash and cash equivalents | $ | 31,242 | $ | 25,482 | |||
Accounts receivable, net | 43,845 | 41,359 | |||||
Other receivables | 6,324 | 2,634 | |||||
Inventories, net | 18,475 | 24,928 | |||||
Inventory deposit, net | — | 481 | |||||
Other current assets | 3,276 | 4,688 | |||||
Deferred tax assets, net | 222 | 1,121 | |||||
Total current assets | 103,384 | 100,693 | |||||
Property and equipment, net | 9,786 | 14,854 | |||||
Intangible assets, net | 43,224 | 56,510 | |||||
Long-term deferred tax assets, net | 858 | 2,686 | |||||
Other assets | 3,468 | 1,442 | |||||
Total assets | $ | 160,720 | $ | 176,185 | |||
LIABILITIES AND SHAREHOLDERS’ EQUITY | |||||||
Current liabilities: | |||||||
Accounts payable | $ | 33,679 | $ | 35,081 | |||
Accrued wages and bonuses | 5,006 | 5,547 | |||||
Deferred income | 6,204 | 8,167 | |||||
Convertible senior notes | 18,000 | — | |||||
Line of credit | 10,000 | 15,000 | |||||
Other accrued liabilities | 7,255 | 9,978 | |||||
Total current liabilities | 80,144 | 73,773 | |||||
Long-term liabilities: | |||||||
Convertible senior notes | — | 18,000 | |||||
Other long-term liabilities | 2,800 | 3,276 | |||||
Total long-term liabilities | 2,800 | 21,276 | |||||
Total liabilities | 82,944 | 95,049 | |||||
Commitments and contingencies (Note 14) | |||||||
Shareholders’ equity: | |||||||
Preferred stock — $0.01 par value, 5,664 shares authorized; none issued or outstanding at December 31, 2014 and December 31, 2013 | — | — | |||||
Common stock — no par value, 100,000 shares authorized; 36,532 and 29,198 shares issued and outstanding at December 31, 2014 and December 31, 2013 | 334,024 | 309,370 | |||||
Accumulated deficit | (256,671 | ) | (229,090 | ) | |||
Accumulated other comprehensive income: | |||||||
Cumulative translation adjustments | 1,175 | 1,731 | |||||
Unrealized loss on hedge instruments | (752 | ) | (875 | ) | |||
Total accumulated other comprehensive income | 423 | 856 | |||||
Total shareholders’ equity | 77,776 | 81,136 | |||||
Total liabilities and shareholders’ equity | $ | 160,720 | $ | 176,185 | |||
The accompanying notes are an integral part of these financial statements.
51
RADISYS CORPORATION
CONSOLIDATED STATEMENT OF CHANGES IN SHAREHOLDERS’ EQUITY
(In thousands)
Common Stock | Accumulated Deficit | Accumulated Other Comprehensive Income | Total | |||||||||||||||
Shares | Amount | |||||||||||||||||
Balances, December 31, 2011 | 27,949 | $ | 301,225 | $ | (136,212 | ) | $ | 1,720 | $ | 166,733 | ||||||||
Shares issued pursuant to benefit plans | 384 | 1,272 | — | — | 1,272 | |||||||||||||
Stock based compensation associated with employee benefit plans | — | 1,391 | — | — | 1,391 | |||||||||||||
Vesting of restricted stock units | 176 | — | — | — | — | |||||||||||||
Restricted share forfeitures for tax settlements | (38 | ) | (164 | ) | — | — | (164 | ) | ||||||||||
Net adjustment for fair value of hedge derivatives, net of taxes | — | — | — | 9 | 9 | |||||||||||||
Translation adjustments | — | — | — | (325 | ) | (325 | ) | |||||||||||
Net loss for the period | — | — | (43,474 | ) | — | (43,474 | ) | |||||||||||
Balances, December 31, 2012 | 28,471 | $ | 303,724 | $ | (179,686 | ) | $ | 1,404 | $ | 125,442 | ||||||||
Shares issued pursuant to benefit plans | 424 | 806 | — | — | 806 | |||||||||||||
Stock based compensation associated with employee benefit plans | — | 5,298 | — | — | 5,298 | |||||||||||||
Vesting of restricted stock units | 417 | — | — | — | — | |||||||||||||
Restricted share forfeitures for tax settlements | (114 | ) | (458 | ) | — | — | (458 | ) | ||||||||||
Net adjustment for fair value of hedge derivatives, net of taxes | — | — | — | (110 | ) | (110 | ) | |||||||||||
Translation adjustments | — | — | — | (438 | ) | (438 | ) | |||||||||||
Net loss for the period | — | — | (49,404 | ) | — | (49,404 | ) | |||||||||||
Balances, December 31, 2013 | 29,198 | $ | 309,370 | $ | (229,090 | ) | $ | 856 | $ | 81,136 | ||||||||
Shares issued pursuant to benefit plans | 281 | 635 | — | — | 635 | |||||||||||||
Stock based compensation associated with employee benefit plans | — | 4,097 | — | — | 4,097 | |||||||||||||
Vesting of restricted stock units | 709 | — | — | — | — | |||||||||||||
Restricted share forfeitures for tax settlements | (211 | ) | (629 | ) | — | — | (629 | ) | ||||||||||
Net adjustment for fair value of hedge derivatives, net of taxes | — | — | — | 123 | 123 | |||||||||||||
Translation adjustments | — | — | — | (556 | ) | (556 | ) | |||||||||||
Issuance of common stock | 6,555 | 20,551 | 20,551 | |||||||||||||||
Net loss for the period | — | — | (27,581 | ) | — | (27,581 | ) | |||||||||||
Balances, December 31, 2014 | 36,532 | $ | 334,024 | $ | (256,671 | ) | $ | 423 | $ | 77,776 | ||||||||
The accompanying notes are an integral part of these financial statements.
52
RADISYS CORPORATION
CONSOLIDATED STATEMENTS OF CASH FLOWS
(In thousands)
For the Years Ended December 31, | |||||||||||
2014 | 2013 | 2012 | |||||||||
Cash flows from operating activities: | |||||||||||
Net loss | $ | (27,581 | ) | $ | (49,404 | ) | $ | (43,474 | ) | ||
Adjustments to reconcile net loss to net cash provided by (used in) operating activities: | |||||||||||
Depreciation and amortization | 20,240 | 21,748 | 22,079 | ||||||||
Impairment of goodwill | — | — | 29,748 | ||||||||
Inventory valuation allowance | 2,539 | 3,302 | 1,232 | ||||||||
Deferred income taxes | 3,106 | 703 | 1,531 | ||||||||
Deferred tax valuation allowance provision | — | 12,476 | — | ||||||||
Write off of purchased computer software | — | 2,868 | — | ||||||||
Gain on sale of assets | — | (2,303 | ) | — | |||||||
Stock-based compensation expense | 4,097 | 5,298 | 1,391 | ||||||||
Other | 119 | 330 | 1,210 | ||||||||
Changes in operating assets and liabilities, net of acquisitions: | |||||||||||
Accounts receivable | (2,262 | ) | 11,119 | (2,082 | ) | ||||||
Other receivables | (3,689 | ) | (303 | ) | 1,005 | ||||||
Inventories | 4,882 | (10,192 | ) | 4,864 | |||||||
Inventory deposit | (481 | ) | 10,349 | 352 | |||||||
Other current assets | 1,379 | (1,197 | ) | 744 | |||||||
Accounts payable | (1,534 | ) | (6,013 | ) | 3,718 | ||||||
Accrued wages and bonuses | (538 | ) | (1,640 | ) | (3,608 | ) | |||||
Accrued restructuring | (2,006 | ) | 1,551 | (3,014 | ) | ||||||
Deferred income | (1,963 | ) | (1,145 | ) | (2,733 | ) | |||||
Other | (3,105 | ) | 362 | (7,352 | ) | ||||||
Net cash provided by (used in) operating activities | (6,797 | ) | (2,091 | ) | 5,611 | ||||||
Cash flows from investing activities: | |||||||||||
Capital expenditures | (2,396 | ) | (6,047 | ) | (11,092 | ) | |||||
Proceeds from sale of assets | 200 | 2,552 | (68 | ) | |||||||
Net cash used in investing activities | (2,196 | ) | (3,495 | ) | (11,160 | ) | |||||
Cash flows from financing activities: | |||||||||||
Repayments on line of credit | (5,000 | ) | (1,919 | ) | — | ||||||
Repayment of convertible notes | — | (10,081 | ) | ||||||||
Proceeds from issuance of common stock | 21,186 | 806 | 1,272 | ||||||||
Other financing activities | (882 | ) | (921 | ) | (213 | ) | |||||
Net cash provided by (used in) financing activities | 15,304 | (2,034 | ) | (9,022 | ) | ||||||
Effect of exchange rate changes on cash | (551 | ) | (80 | ) | (17 | ) | |||||
Net increase (decrease) in cash and cash equivalents | 5,760 | (7,700 | ) | (14,588 | ) | ||||||
Cash and cash equivalents, beginning of period | 25,482 | 33,182 | 47,770 | ||||||||
Cash and cash equivalents, end of period | $ | 31,242 | $ | 25,482 | $ | 33,182 | |||||
Supplemental disclosure of cash flow information: | |||||||||||
Cash paid during the year for: | |||||||||||
Interest | $ | 1,207 | $ | 1,090 | $ | 1,347 | |||||
Income taxes | $ | 1,532 | $ | 1,415 | $ | 1,202 | |||||
The accompanying notes are an integral part of these financial statements.
53
Note 1 — Nature of Operations
Radisys Corporation (NASDAQ: RSYS), the services acceleration company, provides application aware traffic distribution platforms, real-time media processing engines and wireless access technologies. The Company's products and services are broken into two operating segments: Software-Systems and Embedded Products and Hardware Services.
• | Software-Systems (previously referred to as Software and Solutions). Software-Systems product are comprised of three product families: FlowEngine, MediaEngine and CellEngine. |
◦ | FlowEngine, the recently announced products targeting the communication and content provider traffic management market, are a family of products designed to classify and intelligently distribute session data flows to appropriate network processing resources. |
◦ | MediaEngine (previously referred to as Media Resource Funtion or MRF) products which can be purchased either as a complete system, MediaEngine MPX-12000, or as virtualized MediaEngine software ("vMRF") are designed into the IP Multimedia Subsystem ("IMS") core of telecom networks and provide media processing capabilities. |
◦ | CellEngine (previously referred to as Trillium) software is the protocol foundation that enables the communication linkage between end user wireless devices and the small cell base stations mobile carriers in both the 3G and LTE networks. |
• | Embedded Products and Hardware Services (comprising the product-lines previously referred to as ATCA, COMe RMS and Other Products). These hardware based products provide platforms to control and move data in the core of the telecom network. |
Note 2 — Significant Accounting Policies
Principles of Consolidation
The accompanying Consolidated Financial Statements include the accounts of the Company and its wholly owned subsidiaries. All inter-company accounts and transactions have been properly eliminated in consolidation.
Management Estimates
The Consolidated Financial Statements have been prepared in accordance with U.S. generally accepted accounting principles (“GAAP”). The preparation of these Consolidated Financial Statements requires management to make estimates and judgments that may affect the amounts reported in its Consolidated Financial Statements and accompanying notes. Actual results may differ from these estimates under different assumptions or conditions.
Revenue Recognition
Multiple Element Arrangements
A significant portion of the Company's revenue relates to product sales for which revenue is recognized upon shipment, with limited judgment required related to estimates of product returns. Title transfer for substantially all product sales occurs upon delivery of products to the Company's customer's freight forwarders. The software elements included in certain components of ATCA systems and MRF products are considered to be functioning together with the non-software elements to provide the tangible product's essential functionality and these arrangements generally include multiple elements such as hardware, technical support services as well as software upgrades or enhancements on a when and if available basis. Arrangements including multiple elements require significant management judgment to evaluate the effective terms of agreements, the Company's performance commitments and determination of fair value of the various deliverables under the arrangement.
For hardware sales which may include software, ASU 2009-13 provides a fair value hierarchy in order to determine the appropriate relative fair value for each element of an arrangement. When available, the Company uses vendor specific objective evidence (“VSOE”) to determine the estimated fair value of each element of the arrangement. In the absence of VSOE or third
54
−party evidence ("TPE") for a delivered element, the Company then uses an estimated selling price in order to determine fair value. Estimated selling prices represent the Company's best estimate of the price at which it would transact if the deliverables were sold on a standalone basis. For technical support services, the Company generally determines its selling price based on VSOE as supported by substantive renewal rates in the related service agreements. In certain instances where VSOE cannot be established, the Company then relies upon its estimated selling price for such deliverables as TPE is generally not available due to the unique company-specific terms surrounding such service agreements. In establishing an appropriate estimated selling price for these technical support agreements, the Company considered entity specific factors such as its historical and projected costs, historical and projected revenues, and profit objectives. The Company also considered market specific factors when establishing reasonable profit objectives.
Hardware
Revenue from hardware products is recognized in accordance with ASC 605 Revenue Recognition. Under the Company’s standard terms and conditions of sale, the Company transfers title and risk of loss to the customer at the time product is shipped to the customer and revenue is recognized accordingly, unless customer acceptance is uncertain or significant obligations remain. The Company reduces revenue for estimated customer returns for rotation rights according to agreements with the Company's distributors. The amount of revenues derived from distributors as a percentage of revenues was 16.3%, 14.3% and 16.0% for the years ended December 31, 2014, 2013 and 2012. Revenues associated with distributors are generally recognized upon shipment as the Company has established a sell-to model with distributors. The Company accrues the estimated cost of product warranties, based on historical experience at the time the Company recognizes revenue.
The software elements included in certain components of embedded product systems and MRF products are considered to be functioning together with the non-software elements to provide the tangible product's essential functionality and the Company’s MRF arrangements generally include multiple elements such as hardware and technical support services.
Software licenses and royalties
Revenue from software licenses and royalties is recognized in accordance with ASC 985 Software. The Company recognizes software license revenue at the time of shipment or upon delivery of the software master provided that the revenue recognition criteria have been met and VSOE exists to allocate the total fee to all undelivered elements of the arrangement. The Company defers revenue on arrangements, including specified software upgrades, until the specified upgrade has been delivered. Revenue from customers for prepaid, non-refundable software royalties is recorded when the revenue recognition criteria have been met. Revenue for non-prepaid royalties is recognized at the time the Company receives reporting from customers as the Company has not established an ability to reliably estimate customer royalties prior to time contractually obligated reporting is received.
Technical support services
Technical support services revenue is recognized as earned on the straight-line basis over the term of the contract. The fair value of the Company’s post-contract support has been determined by renewal rates within the Company’s support agreements, the actual amounts charged to customers for renewal of their support services or based on an estimated selling price.
Professional and other services
Professional services revenue is recognized upon completion of certain contractual milestones and customer acceptance of the services rendered. Other services revenues include hardware repair services and custom software implementation projects. Hardware repair services revenues are recognized when the services are complete. Software implementation revenues are recognized upon completion of certain contractual milestones and customer acceptance of the services rendered or as services are performed under the percentage-of-completion method when the Company is reasonably able to estimate the total effort required to complete the contract.
Deferred income
Deferred income represents amounts received or billed for the following types of transactions:
• | Undelivered elements of an arrangement—Certain software sales include specified upgrades and enhancements to an existing product. Revenue for such products is deferred until the future obligation is fulfilled. |
55
• | Technical support services—The Company has a number of technical support agreements with customers for hardware and software maintenance. Generally, these services are billed in advance and recognized over the term of the agreement. |
Capitalized Software Development Costs
The Company does not capitalize internal software development costs incurred in the production of computer software as the Company does not incur any material costs between the point of technological feasibility and general release of the product to customers in the future. As such software development costs are expensed as research and development (“R&D”) costs.
Shipping Costs
The Company’s shipping and handling costs for product sales are included under cost of sales for all periods presented. For the years ended December 31, 2014, 2013 and 2012 shipping and handling costs represented approximately 2% of cost of sales.
Advertising Costs
The Company expenses advertising costs as incurred. Advertising costs consist primarily of media, display, web, and print advertising, along with trade show costs and product demos and brochures. For the years ended December 31, 2014, 2013 and 2012 advertising costs were $1.1 million, $2.0 million and $2.1 million.
Cash Equivalents
The Company considers all highly liquid investments purchased with an original or remaining maturity of three months or less at the date of purchase to be cash equivalents.
Accounts Receivable
Trade accounts receivable are stated at invoice amount net of an allowance for doubtful accounts and do not bear interest. An allowance for doubtful accounts is maintained for estimated losses resulting from the inability of customers to make required payments. Management reviews the allowance for doubtful accounts quarterly for reasonableness and adequacy. If the financial condition of the Company’s customers were to deteriorate resulting in an impairment of their ability to make payments, additional provisions for uncollectible accounts receivable may be required. In the event the Company determined that a smaller or larger reserve was appropriate, it would record a credit or a charge in the period in which such determination is made. In addition to specific customer reserves, the Company maintains a non-specific bad debt reserve for all customers. This non-specific bad debt reserve is calculated based on the Company's historical pattern of bad debt write-offs as a percentage of gross accounts receivable for the current rolling eight quarters, which percentage is then applied to the current gross accounts receivable. The Company’s customers are concentrated in the technology indus
try and the collection of its accounts receivable are directly associated with the operational results of the industry.
Inventories
Inventories are stated at the lower of cost, determined on the first-in, first-out (FIFO) basis, or market, net of an inventory valuation allowance. The Company uses a standard cost methodology to determine the cost basis for its inventories. The Company evaluates inventory on a quarterly basis for obsolete or slow-moving items to ascertain if the recorded allowance is reasonable and adequate. Inventory is written down for estimated obsolescence or unmarketable inventory equal to the difference between the cost of inventory and the estimated net realizable value based upon assumptions about future demand and market conditions. The Company's inventory valuation allowances establish a new cost basis for inventory.
Long-Lived Assets
Long-lived assets, such as property and equipment and definite-life intangible assets are evaluated for impairment whenever events or changes in circumstances indicate the carrying value of an asset may not be recoverable. The Company assesses the impairment of the assets based on the undiscounted future cash flow the assets are expected to generate compared to the carrying value of the assets. If the carrying amount of the assets is determined not to be recoverable, a write-down to fair value is recorded. Management estimates future cash flows using assumptions about expected future operating performance.
56
Management’s estimates of future cash flows may differ from actual cash flow due to, among other things, technological changes, economic conditions or changes to the Company’s business operations.
Intangible assets with estimable useful lives are amortized on a straight-line basis over their respective estimated life and reviewed for impairment when certain triggering events suggest impairment has occurred. The Company determined a triggering event occurred during the third quarters of 2014 and 2013 and required an analysis of the recoverability of its long-lived assets. After finalizing these analyses, the Company concluded its long-lived assets were not impaired.
Property and Equipment
Property and equipment is recorded at historical cost is depreciated or amortized on a straight-line basis according to the table below. In certain circumstances where the Company is aware that an asset’s life differs from the general guidelines set forth in its policy, management adjusts its depreciable life accordingly, to ensure expense is being recognized over the appropriate future periods. Ordinary maintenance and repair expenses are expensed when incurred.
Machinery, equipment, furniture and fixtures | 5 years | |
Software, computer hardware and manufacturing test fixtures | 3 years | |
Engineering demonstration products and samples | 1 year | |
Leasehold improvements | Lesser of the lease term or estimated useful lives | |
Leases
The Company leases all of its facilities, certain office equipment and vehicles under non-cancelable operating leases that expire at various dates through 2020, along with options that permit renewals for additional periods. Rent escalations are considered in the determination of straight-line rent expense for operating leases. Leasehold improvements made at the inception of or during the lease are amortized over the shorter of the asset life or the lease term.
Accrued Restructuring
Expenses associated with exit or disposal activities are recognized when probable and estimable because the Company has a history of paying severance benefits. The Company has engaged, and may continue to engage, in restructuring actions, which require the Company to make significant estimates in several areas including: realizable values of assets made redundant or obsolete; expenses for severance and other employee separation costs; the ability and timing to generate sublease income, as well as the Company's ability to terminate lease obligations at the amounts estimated; and other exit costs. Should the actual amounts differ from the estimates, the amount of the restructuring charges could be materially impacted.
Warranty
The Company provides for the estimated cost of product warranties at the time it recognizes revenue. Products are generally sold with warranty coverage for a period of 12 or 24 months after shipment. On a quarterly basis the Company assesses the reasonableness and adequacy of the warranty liability and adjusts such amounts as necessary. Warranty reserves are included in other accrued liabilities and other long-term liabilities in the accompanying Consolidated Balance Sheets as of December 31, 2014 and 2013.
Research and Development
Research, development and engineering costs are expensed as incurred. R&D expenses consist primarily of salary, bonuses and benefits for product development staff, and cost of design and development supplies and equipment, net of reimbursements for non-recurring engineering services.
Income Taxes
Income tax accounting requires the recognition of deferred tax assets and liabilities for the expected future tax consequences of temporary differences between the financial statement carrying amounts and tax bases of assets and liabilities. Valuation allowances are established to reduce deferred tax assets if it is “more likely than not” that all or portion of the asset will not be realized due to inability to generate sufficient taxable income in the relevant period to utilize the deferred tax asset. Tax law and rate changes are reflected in the period such changes are enacted. The Company recognizes uncertain tax positions
57
after evaluating whether certain tax positions are more likely than not to be sustained by taxing authorities. In addition, the Company recognizes potential accrued interest and penalties related to unrecognized tax benefits in income tax expense.
Comprehensive Income (Loss)
The Company reports accumulated other comprehensive income (loss) in its Consolidated Balance Sheets. Comprehensive income (loss) includes net income (loss), translation adjustments and unrealized gains (losses) on hedging instruments net of their tax effect. The cumulative translation adjustments consist of unrealized gains (losses) for foreign currency translation.
Stock-Based Compensation
The Company measures stock-based compensation at the grant date, based on the fair value of the award, and recognizes expense on a straight-line basis over the employee's requisite service period. For performance awards the requisite service period is equal to the period of time over which performance objectives underlying the award are expected to be achieved and vested. The number of performance shares that ultimately vest depends on the achievement of certain performance criteria over the measurement period. Quarterly, the Company reevaluates the probability that the performance objectives will be met and the number of performance shares expected to vest. The amount of expense recorded each period for performance awards is based on the Company's estimate of the number of awards that will ultimately vest.
Net loss per share
Basic loss per share amounts are computed based on the weighted average number of common shares outstanding. Diluted net loss per share incorporates the incremental shares issuable upon the assumed exercise of stock options, incremental shares associated with the assumed vesting of restricted stock and the assumed conversion of the Company’s convertible notes, as if the conversion to common shares had occurred at the beginning of the fiscal year and when such conversion would have a dilutive effect. When the conversion of the Company’s convertible notes are dilutive, earnings would be adjusted for interest expense incurred on the convertible notes.
Derivatives
The Company hedges exposure to changes in exchange rates from the US Dollar to the Indian Rupee. These derivatives are recognized on the balance sheet at their fair value. Unrealized gain positions are recorded as other current assets and unrealized loss positions are recorded as other accrued liabilities. Changes in the fair values of the outstanding derivatives that are highly effective are recorded in other comprehensive income until net income (loss) is affected by the variability of the cash flows of the hedged transaction. Hedge ineffectiveness could result when the amount of the Company’s hedge contracts exceed the Company’s forecasted or actual transactions for which the hedge contracts were designed to hedge. Once a hedge contract matures the associated gain (loss) on the contract will remain in other comprehensive income (loss) until the underlying hedged transaction affects net income (loss), at which time the gain (loss) will be recorded to the expense line item being hedged, which is primarily cost of sales and research and development. The Company only enters into derivative contracts in order to hedge foreign currency exposure. If the Company entered into a contract for speculative reasons or if the Company’s current hedge position becomes ineffective, changes in the fair values of the derivatives would be recognized in earnings in the current period.
Foreign currency translation
Assets and liabilities of international operations using a functional currency other than the U.S. dollar are translated into U.S. dollars at exchange rates as of December 31, 2014 and 2013. Income and expense accounts are translated into U.S. dollars at the average daily rates of exchange prevailing during the period. Adjustments resulting from translating foreign functional currency financial statements into U.S. dollars are recorded as a separate component in shareholders’ equity. Foreign exchange transaction gains and losses are included in other income (expense), net, in the Consolidated Statements of Operations.
Recent Accounting Pronouncements
On May 28, 2014, the FASB issued ASU No. 2014-09, Revenue from Contracts with Customers, which requires an entity to recognize the amount of revenue to which it expects to be entitled for the transfer of promised goods or services to customers. The ASU will replace most existing revenue recognition guidance in U.S. GAAP when it becomes effective. The new standard is effective for the Company on January 1, 2017. Early application is not permitted. The standard permits the use
58
of either the retrospective or cumulative effect transition method. The Company is evaluating the effect that ASU 2014-09 will have on its consolidated financial statements and related disclosures. The Company has not yet selected a transition method and has not determined the effect of the standard on its ongoing financial reporting.
Note 3 — Goodwill
The Company had no Goodwill recorded at December 31, 2014 or 2013. During the third quarter of 2012, the Company determined that indicators of potential impairment existed to require an interim goodwill impairment assessment. These indicators included the recent trading value of the Company's common stock, coupled with overall telecommunications market conditions. As a result, the Company compared its book value to its market capitalization, adjusted for factors such as a control premium and concluded step two of the impairment test should be performed.
During 2012, the Company was organized as a single reporting unit. The Company estimated the fair value of its single reporting unit using a market approach. The market approach estimates fair value in part on market capitalization plus an estimated control premium paid in acquisitions of publicly traded companies with similar characteristics to the Company. Based on the Company's analysis, the implied fair value of goodwill was lower than its carrying value. As a result, the Company recorded a full impairment charge of $29.7 million against the carrying amount of goodwill and as of December 31, 2012 the Company had no goodwill. The impairment charge is included in "Impairment of goodwill" in the Consolidated Statements of Operations.
Note 4 — Fair Value of Financial Instruments
The Company measures at fair value certain financial assets and liabilities. GAAP specifies a hierarchy of valuation techniques based on whether the inputs to those valuation techniques are observable or unobservable. Observable inputs reflect market data obtained from independent sources, while unobservable inputs reflect the Company's market assumptions. These two types of inputs have created the following fair-value hierarchy:
Level 1— Quoted prices for identical instruments in active markets;
Level 2— Quoted prices for similar instruments in active markets, quoted prices for identical or similar instruments in markets that are not active, and model-derived valuations in which all significant inputs and significant value drivers are observable in active markets; and
Level 3— Valuations derived from valuation techniques in which one or more significant inputs or significant value drivers are unobservable.
Foreign currency forward contracts are measured at fair value using models based on observable market inputs such as foreign currency exchange rates; therefore, they are classified within Level 2 of the valuation hierarchy. The cash surrender value of life insurance contracts and deferred compensation liability are measured at fair value using quoted market prices for similar instruments; therefore, they are classified within Level 2 of the valuation hierarchy.
The Company had obligations ("contingent consideration"), to be paid in cash, related to the acquisition of Continuous Computing Corporation ("Continuous Computing") based on the amount of product royalty revenues to be generated by a specified set of contracts associated with certain of Continuous Computing's products over a period of 36 months after closing. The contingent consideration liability was established at the time of acquisition and was evaluated at the end of each reporting period. As the significant inputs used in determining the fair value were unobservable, this liability was classified within Level 3 of the fair value hierarchy.
The fair value of the contingent consideration was determined by calculating the net present value of the expected payments using significant inputs that are not observable in the market, including revenue projections and discount rates consistent with the level of risk of achievement; therefore the Company developed its own assumptions for the expected product royalty revenues generated under the arrangement. The fair value of the contingent consideration was affected most significantly by changes in the amount and timing of the revenue projections. If the revenue projections increased or decreased the fair value of the contingent consideration would increase or decrease accordingly in amounts that will vary based on the timing of the projected revenues and the timing of the expected payments. The royalty earning period for Continuous Computing's products was completed during the quarter ended September 30, 2014. The remaining liability was paid in the fourth quarter of 2014.
59
The following table summarizes the fair value measurements as of December 31, 2014 for the Company's financial instruments (in thousands):
Fair Value Measurements as of December 31, 2014 | |||||||||||
Total | Level 1 | Level 2 | Level 3 | ||||||||
Foreign currency forward contracts | (83 | ) | — | (83 | ) | — | |||||
The following table summarizes the fair value measurements as of December 31, 2013, for the Company’s financial instruments (in thousands):
Fair Value Measurements as of December 31, 2013 | |||||||||||||||
Total | Level 1 | Level 2 | Level 3 | ||||||||||||
Cash surrender value of life insurance contracts(A) | $ | 1,866 | $ | — | $ | 1,866 | $ | — | |||||||
Deferred compensation liability (A) | (1,276 | ) | (1,276 | ) | |||||||||||
Foreign currency forward contracts | (169 | ) | — | (169 | ) | — | |||||||||
Contingent consideration liability | (390 | ) | — | — | (390 | ) | |||||||||
Total | $ | 31 | $ | — | $ | 421 | $ | (390 | ) | ||||||
(A) During the year ended December 31, 2013, the company terminated its Deferred Compensation Plan. Substantially all of the plan assets and participant balances were liquidated and distributed to participants during the year ended December 31, 2014.
The following table summarizes level 3 activity for the Company's contingent consideration liability (in thousands):
Fair Value | |||
Contingent Consideration | |||
Balance at December 31, 2012 | 2,541 | ||
Additions | — | ||
Decrease in liability due to re-measurement | (1,891 | ) | |
Payments | (447 | ) | |
Accretion | 187 | ||
Balance at December 31, 2013 | $ | 390 | |
Additions | — | ||
Decrease in liability due to re-measurement | (156 | ) | |
Payments | (273 | ) | |
Accretion | 39 | ||
Balance at December 31, 2014 | $ | — | |
The Company records all changes in estimates and accretion on the contingent consideration liability to restructuring and other charges, net in the Consolidated Statements of Operations. The royalty earning period for Continuous Computing's products was completed during the third quarter of 2014 and the remaining liability was paid in the fourth quarter of 2014.
Assets and Liabilities Measured at Fair Value on a Nonrecurring Basis
The Company assessed certain long-lived assets for impairment during the third quarter of 2014, comparing the undiscounted future cash flow the assets are expected to generate to the carrying value of the assets. The probability-weighted analysis of expected undiscounted future cash flows exceeded the book value of the long lived assets by $5.0 million, or 28%. Key assumptions used in this analysis included revenue growth for the Company's technologies as well as general economic and business conditions.
60
Note 5 — Accounts Receivable and Other Receivables
Accounts receivable balances consisted of the following (in thousands):
December 31, 2014 | December 31, 2013 | ||||||
Accounts receivable, gross | $ | 43,969 | $ | 41,707 | |||
Less: allowance for doubtful accounts | (124 | ) | (348 | ) | |||
Accounts receivable, net | $ | 43,845 | $ | 41,359 | |||
Accounts receivable at December 31, 2014 and 2013 consisted of sales to the Company’s customers which are generally based on standard terms and conditions. The Company recorded the following activity in allowance for doubtful accounts (in thousands):
For the Years Ended December 31, | |||||||||||
2014 | 2013 | 2012 | |||||||||
Allowance for doubtful accounts, beginning of the year | $ | 348 | $ | 779 | $ | 828 | |||||
Charged to costs and expenses | (75 | ) | (310 | ) | — | ||||||
Less: write-offs, net of recoveries | (149 | ) | (121 | ) | (49 | ) | |||||
Remaining allowance, end of the year | $ | 124 | $ | 348 | $ | 779 | |||||
As of December 31, 2014 and 2013, other receivables were $6.3 million and $2.6 million. Other receivables consisted primarily of non-trade receivables including inventory transferred to the Company’s contract manufacturing partner on which the Company does not recognize revenue and receivables for value-added taxes.
Note 6 — Inventories
Inventories consisted of the following (in thousands):
December 31, 2014 | December 31, 2013 | ||||||
Raw materials | $ | 9,219 | $ | 21,127 | |||
Work-in-process | 1,195 | 1,194 | |||||
Finished goods | 10,762 | 9,644 | |||||
21,176 | 31,965 | ||||||
Less: inventory valuation allowance | (2,701 | ) | (7,037 | ) | |||
Inventories, net | $ | 18,475 | $ | 24,928 | |||
December 31, 2014 | December 31, 2013 | ||||||
Inventory deposit (A) | $ | 370 | $ | 1,289 | |||
Less: inventory deposit valuation allowance | (370 | ) | (808 | ) | |||
Inventory deposit, net | $ | — | $ | 481 | |||
(A) | During 2013 the Company modified the inventory deposit arrangement with its former contract manufacturing partner. Prior to the modification, the Company was obligated to place a deposit with its former contract manufacturer for the cost of excess inventory that had been purchased as a result of the Company's forecasted demand when there was no alternative use. Under the new arrangement, rather than place a deposit with the former contract manufacturer, the Company was obligated to purchase the inventory on consignment. The calculation of excess inventory and its impact on the Company’s cash and reported aggregate inventory levels is the same under the consignment arrangement as it was under the deposit arrangement. In the third quarter of 2014, the Company substantially completed the transition to a new contract manufacturing partner; however, as of December 31, 2014, there was a remaining $0.1 million balance of consigned inventory at the Company’s former contract manufacturing partner and a remaining deposit of $0.4 million relating to service inventory, which is fully reserved. |
61
Consigned inventory is held at third-party locations, including the Company's contract manufacturing partner and customers. The Company retains title to the inventory until purchased by the third-party. Consigned inventory, consisting of raw materials and finished goods, was $2.6 million and $12.0 million at December 31, 2014 and 2013.
The Company recorded the following charges associated with the valuation of inventory, inventory deposit and the adverse purchase commitment liability for the years ended December 31 (in thousands):
2014 | 2013 | 2012 | |||||||||
Inventory, net | $ | 2,412 | $ | 3,302 | $ | 1,080 | |||||
Inventory deposit, net | 126 | 945 | 926 | ||||||||
Adverse purchase commitments | 323 | 327 | 31 | ||||||||
The following is a summary of the change in the Company’s inventory valuation allowance for the years ended December 31 (in thousands):
2014 | 2013 | ||||||
Inventory valuation allowance, beginning of the year | $ | 7,037 | $ | 2,199 | |||
Usage: | |||||||
Inventory scrapped | (5,768 | ) | (956 | ) | |||
Inventory utilized | (1,005 | ) | (363 | ) | |||
Subtotal—usage | (6,773 | ) | (1,319 | ) | |||
Write-downs of inventory valuation | 3,417 | 3,665 | |||||
Transfer from other liabilities (A) | (1,013 | ) | 35 | ||||
Transfer from (to) inventory deposit valuation allowance | 33 | 2,457 | |||||
Inventory valuation allowance, end of the year | $ | 2,701 | $ | 7,037 | |||
(A) | Transfer from other liabilities is related to obsolete inventory purchased from contract manufacturers during the year which was previously reserved for as an adverse purchase commitment. (Note 10—Other Accrued and Other Long-Term Liabilities and Note 14—Commitments and Contingencies.) |
Note 7 — Property and Equipment
Property and equipment consisted of the following (in thousands):
December 31, 2014 | December 31, 2013 | |||||||
Manufacturing equipment | $ | 24,643 | $ | 26,779 | ||||
Office equipment and software | 30,702 | 30,745 | ||||||
Leasehold improvements | 5,163 | 5,973 | ||||||
Property and equipment, gross | 60,508 | 63,497 | ||||||
Less: accumulated depreciation and amortization | (50,722 | ) | (48,643 | ) | ||||
Property and equipment, net | $ | 9,786 | $ | 14,854 | ||||
Depreciation expense associated with property and equipment for the years ended December 31, 2014, 2013 and 2012 was $7.0 million, $8.0 million and $7.3 million.
62
Note 8 — Intangible Assets
The following tables summarize the Company’s total purchased intangible assets (in thousands):
Gross | Accumulated Amortization | Net | |||||||||
December 31, 2014 | |||||||||||
Purchased technology | $ | 114,754 | $ | (87,398 | ) | $ | 27,356 | ||||
Patents | 6,472 | (6,472 | ) | — | |||||||
Customer lists | 37,000 | (26,284 | ) | 10,716 | |||||||
Trade names | 11,536 | (6,384 | ) | 5,152 | |||||||
Backlog | 2,127 | (2,127 | ) | — | |||||||
Total intangible assets | $ | 171,889 | $ | (128,665 | ) | $ | 43,224 | ||||
December 31, 2013 | |||||||||||
Purchased technology | $ | 114,754 | $ | (79,189 | ) | $ | 35,565 | ||||
Patents | 6,472 | (6,472 | ) | — | |||||||
Customer lists | 37,000 | (21,997 | ) | 15,003 | |||||||
Trade names | 11,536 | (5,594 | ) | 5,942 | |||||||
Backlog | 2,127 | (2,127 | ) | — | |||||||
Total intangible assets | $ | 171,889 | $ | (115,379 | ) | $ | 56,510 | ||||
Intangible assets amortization expense was $13.3 million, $13.8 million and $14.8 million for the years ended December 31, 2014, 2013 and 2012. The Company’s purchased intangible assets have remaining useful lives of one to seven years as of December 31, 2014. The Company reviews for impairment all of its purchased intangible assets whenever events or changes in circumstances indicate that the carrying amount of an asset may not be recoverable.
The estimated future amortization expense of purchased intangible assets as of December 31, 2014 is as follows (in thousands):
For the Years Ending December 31, | Estimated Intangible Amortization Amount | ||
2015 | $ | 12,901 | |
2016 | 12,747 | ||
2017 | 10,714 | ||
2018 | 4,870 | ||
2019 | 790 | ||
Thereafter | 1,202 | ||
Total estimated future amortization expense | $ | 43,224 | |
63
Note 9 — Restructuring and Other Charges
The following table summarizes the Company's restructuring and other gains and charges as presented in the Consolidated Statement of Operations (in thousands):
December 31, 2014 | December 31, 2013 | December 31, 2012 | |||||||||
Employee-related restructuring expenses | $ | 1,468 | $ | 5,463 | $ | 2,769 | |||||
Fair value adjustments to contingent consideration liability | (156 | ) | (1,740 | ) | (5,052 | ) | |||||
Facility reductions | — | 602 | 1,590 | ||||||||
Write off of purchased computer software | — | 2,868 | — | ||||||||
Net gain from sale of OS-9 software assets | — | (1,532 | ) | — | |||||||
Integration-related expenses | 2,097 | 1,039 | 576 | ||||||||
Non-recurring legal expenses | 796 | 779 | — | ||||||||
Restructuring and other charges, net | $ | 4,205 | $ | 7,479 | $ | (117 | ) | ||||
Restructuring and other charges may include costs from non-recurring events such as costs incurred for employee severance, acquisition or divestiture activities, excess facility costs, certain legal costs, asset related charges and other expenses associated with business restructuring activities.
During the year ended December 31, 2014, the Company recorded the following restructuring and other charges:
• | $1.5 million net expense relating to the severance of employees in connection with the previously reported Penang site closure, as well as severance for 20 additional employees, net of reductions resulting from changes in previously estimated amounts for employee severance and associated payroll costs; |
• | $2.1 million million integration-related net expense principally associated with asset write-offs and personnel overlap resulting from resource consolidation primarily associated with the Penang site closure; |
• | $0.8 million legal expenses associated with non-operating strategic projects; |
• | $0.2 million gain resulting from the decrease in fair value of the Continuous Computing contingent consideration liability; |
During the year ended December 31, 2013, the Company recorded the following restructuring and other charges:
• | $5.5 million net expense for the severance of 203 employees, primarily related to Shanghai and Penang site reductions and severance for named executives, net of reductions resulting from changes in previously estimated amounts for employee severance and associated payroll costs; |
• | $2.9 million expense relating to the write off of the Company's Security Gateway ("SEG") purchased computer software resulting from management's decision to abandon this technology; |
• | $1.7 million gain resulting from the decrease in fair value of the Continuous Computing contingent consideration liability; |
• | $1.5 million net gain from the sale of the Company's OS-9 software assets; |
• | $1.0 million net expense principally associated with asset write-offs, legal fees, and personnel overlap resulting from resource consolidation primarily associated with our Shanghai and Penang site reductions; |
• | $0.6 million net lease abandonment expense primarily resulting from a lease abandonment charge resulting from the shuttering of the Company's San Diego facility; and |
• | $0.8 million legal expenses associated with a non-operating strategic projects. |
64
Accrued restructuring, which is included in other accrued liabilities and other long-term liabilities in the accompanying Consolidated Balance Sheets as of December 31, 2014 and 2013, consisted of the following (in thousands):
Severance, payroll taxes and other employee benefits | Facility reductions | Total | |||||||||
Balance accrued as of December 31, 2013 | $ | 1,786 | $ | 961 | $ | 2,747 | |||||
Additions | 1,637 | 1,637 | |||||||||
Reversals | (169 | ) | (6 | ) | (175 | ) | |||||
Expenditures | (3,088 | ) | (368 | ) | (3,456 | ) | |||||
Balance accrued as of December 31, 2014 | $ | 166 | $ | 587 | $ | 753 | |||||
Of the $0.8 million and $2.7 million accrued restructuring balance at December 31, 2014 and 2013, $0.4 million and $0.6 million is included in other long-term liabilities on the Consolidated Balance Sheets as of December 31, 2014 and 2013. These amounts represent the long-term portion of accrued lease abandonment charges. The remaining balances are presented in other accrued liabilities on the Consolidated Balance Sheets.
The Company evaluates the adequacy of the accrued restructuring charges on a quarterly basis. Reversals are recorded in the period in which the Company determines that expected restructuring obligations are less than the amounts accrued.
Note 10 — Other Accrued and Other Long-Term Liabilities
Other accrued liabilities consisted of the following (in thousands):
December 31, 2014 | December 31, 2013 | ||||||
Accrued warranty reserve | $ | 2,018 | $ | 2,599 | |||
Adverse purchase commitments | 1,733 | 632 | |||||
Accrued restructuring | 332 | 2,105 | |||||
Income tax payable, net | 429 | 508 | |||||
Contingent consideration liability | — | 390 | |||||
Deferred compensation plan liability | — | 1,276 | |||||
Other | 2,743 | 2,468 | |||||
Other accrued liabilities | $ | 7,255 | $ | 9,978 | |||
Other long-term liabilities consisted of the following (in thousands):
December 31, 2014 | December 31, 2013 | ||||||
Accrued restructuring | $ | 421 | $ | 642 | |||
Accrued warranty reserve | 582 | 729 | |||||
Long-term income tax payable | 1,699 | 1,487 | |||||
Other | 98 | 418 | |||||
Other long-term liabilities | $ | 2,800 | $ | 3,276 | |||
Note 11 — Short-Term Borrowings
Silicon Valley Bank
At the beginning of the first quarter of 2014, the Company had a $35.0 million secured revolving line of credit agreement (as amended, the "Agreement") with Silicon Valley Bank ("SVB") with a stated maturity date of July 28, 2016. On March 14, 2014, the Company entered into an amended and restated $25.0 million revolving line of credit agreement with SVB (the "2014 Agreement") that replaces the Agreement and has a stated maturity date of July 28, 2016. On May 30, 2014, the 2014 Agreement was amended to increase the letter of credit sublimit under the secured revolving credit facility from $1,000,000 to
65
$2,000,000. The secured revolving credit facility under the 2014 Agreement is available for cash borrowings and is subject to a borrowing formula based upon eligible accounts receivable less outstanding letters of credit (aggregate letters of credit are not to exceed $2,000,000). Eligible accounts receivable include 80% of domestic and 65% of foreign accounts receivable (80% in certain cases), in each case, not greater than 60 days past original invoice date. The interest rate is dependent upon the Company's Liquidity (as defined in the 2014 Agreement) when compared to a pre-determined threshold (the "Liquidity Threshold"), which is defined in the 2014 Agreement as $15.0 million, with the exception of the last month end of each quarter, where it is defined as $20.0 million. Liquidity is calculated under the 2014 Agreement as unrestricted cash plus unused availability on the revolving line of credit; however, if the 4.50% convertible senior notes due 2015 are not renewed or refinanced 120 days prior to their maturity date, which is February 15, 2015, Liquidity (for purposes of testing against the Liquidity Threshold) will be reduced by the outstanding principal amount of the 2015 convertible senior notes. The calculation of interest under the 2014 Agreement is as follows:
• | When Liquidity is above the Liquidity Threshold, the interest rate is the prime rate (as published in Wall Street Journal) plus 0.75%; |
• | When Liquidity is below the Liquidity Threshold, the interest rate is the prime rate (as published in Wall Street Journal) plus 2.25%; |
Under the 2014 Agreement, the Company is required to make interest payments monthly. The Company was further required to pay a loan modification fee of $35,000 and paid a commitment fee equal to $35,000 on July 29, 2014 and annually thereafter. Under the 2014 Agreement, the Company is required to pay the higher of actual monthly interest incurred or the interest equivalent of $10.0 million in average monthly borrowings. If the Company terminates the commitment under the 2014 Agreement prior to the maturity date, the Company is required to pay a cancellation fee equal to 1.5% of the commitment under the 2014 Agreement. As of September 1, 2014, and at all times thereafter, the Company is required to maintain a balance of at least $4,000,000 with SVB or its affiliates and the Company is required to have at least 50%of its cash with SVB or its affiliates or in an account where SVB has a control agreement.
The 2014 Agreement requires the Company to make certain representations, warranties and other agreements that are customary in credit agreements of this type. The 2014 Agreement also includes a financial covenant that requires the Company to maintain minimum Liquidity of $10.0 million which is tested monthly.
As of December 31, 2014 and 2013, the Company had outstanding balances of $10.0 million and $15.0 million issued on its behalf under the Agreement. At December 31, 2014, the Company had $14.4 million of total borrowing availability remaining under the Agreement. After giving effect to the repayment of the convertible senior notes, at February 17, 2015, the Company had $7.4 million of total borrowing availability remaining under the Agreement. The Company was in compliance with all covenants under the Agreement.
Note 12 — Convertible Debt
2013 Convertible Senior Notes
On February 15, 2013, the Company repaid at maturity the entire outstanding balance of the 2.75% convertible senior notes due 2013 (the "2013 convertible senior notes") in accordance with the terms thereof.
2015 Convertible Senior Notes
On June 20, 2012, the Company entered into subscription agreements with certain holders of the Company's 2013 convertible senior notes. Pursuant to the subscription agreements, on June 29, 2012 the Company exchanged $18.0 million aggregate principal amount of the 2013 convertible senior notes for $18.0 million aggregate principal amount of the Company's 2015 convertible senior notes. The 2015 convertible senior notes mature on February 15, 2015 and had a coupon rate of 4.5%.
As of December 31, 2014 and 2013, the Company had outstanding 2015 convertible senior notes with a combined face value of $18.0 million. Of these balances $18.0 million and $0.0 million were classified as current liabilities in the Consolidated Balance Sheets at December 31, 2014 and 2013. As of December 31, 2014 and 2013, the estimated fair value of the Company's 2015 convertible senior notes was $18.0 million and $17.8 million.
On February 17, 2015, the Company repaid at maturity the entire outstanding balance of the 2015 convertible senior notes in accordance with the terms thereof. No convertible senior notes were converted to common stock.
66
The following table outlines the effective interest rate, contractually stated interest costs, and costs related to the amortization of issuance costs for the Company's 2013 and 2015 convertible senior notes:
Years Ended | |||||
December 31, | |||||
2014 | 2013 | 2012 | |||
Effective interest rate of 2013 convertible senior notes | NA | NA | 3.73% | ||
Effective interest rate of 2015 convertible senior notes | 4.50% | 4.50% | 4.50% | ||
Contractually stated interest costs | $810 | $810 | $1,289 | ||
Amortization of interest costs | $43 | $43 | $398 | ||
Note 13 — Hedging
The Company’s business activities expose it to a variety of market risks, including the effects of changes in foreign currency exchange rates. The Company manages these risks through the use of forward exchange contracts, designated as foreign-currency cash flow hedges, in an attempt to reduce the potentially adverse effects of foreign currency exchange rate fluctuations that occur in the normal course of business. As such, the Company’s hedging activities are employed solely for risk management purposes. All hedging transactions are conducted with, in the opinion of management, financially stable and reputable financial institutions. As of and for the years ended December 31, 2014 and 2013, the only hedge instruments executed by the Company were associated with its exposure to fluctuations in the Indian Rupee which result from obligations such as payroll and rent paid in Rupees.
These derivatives are recognized on the balance sheet at their fair value. Unrealized gain positions are recorded as other current assets and unrealized loss positions are recorded as other current liabilities. Changes in the fair values of the outstanding derivatives that are highly effective are recorded in other comprehensive income until net income is affected by the variability of the cash flows of the hedged transaction. Hedge ineffectiveness could result when the amount of the Company’s hedge contracts exceed the Company’s forecasted or actual transactions for which the hedge contracts were designed to hedge. Once a hedge contract matures, the associated gain (loss) on the contract will remain in other comprehensive income until the underlying hedged transaction affects net income (loss), at which time the gain (loss) will be recorded to the expense line item being hedged, which is primarily within Cost of Sales and R&D. The Company only enters into derivative contracts in order to hedge foreign currency exposure, which contracts do not exceed two years from inception. If the Company entered into a contract for speculative reasons or if the Company’s current hedge position becomes ineffective, changes in the fair values of the derivatives would be recognized in earnings in the current period.
The Company assesses, both at the inception of the hedge and on an ongoing basis, whether the derivatives that are used in hedging transactions have been highly effective in offsetting changes in the cash flows of hedged items and whether those derivatives are expected to remain highly effective in future periods. For the years ended December 31, 2014 and 2013 the Company had no hedge ineffectiveness.
During the year ended December 31, 2014, the Company entered into 18 new foreign currency forward contracts, with total contractual values of $11.6 million. During the year ended December 31, 2013, the Company entered into 33 new foreign currency forward contracts, with total contractual values of $12.8 million.
A summary of the aggregate contractual or notional amounts, balance sheet location and estimated fair values of derivative financial instruments designated as cash flow hedges at December 31, 2014 is as follows (in thousands):
Contractual / Notional Amount | Consolidated Balance Sheet Classification | Estimated Fair Value | ||||||||||||
Asset | (Liability) | |||||||||||||
Foreign currency forward exchange contracts | $ | 14,193 | Other accrued liabilities | $ | — | $ | (83 | ) | ||||||
67
A summary of the aggregate contractual or notional amounts, balance sheet location and estimated fair values of derivative financial instruments designated as cash flow hedges at December 31, 2013 is as follows (in thousands):
Contractual / Notional Amount | Consolidated Balance Sheet Classification | Estimated Fair Value | ||||||||||||
Asset | (Liability) | |||||||||||||
Foreign currency forward exchange contracts | $ | 15,328 | Other accrued liabilities | $ | — | $ | (169 | ) | ||||||
There were no ineffective hedges for the years ended December 31, 2014, 2013 and 2012. The following table summarizes the effect of derivative instruments on the Consolidated Statements of Operations as follows (in thousands):
2014 | 2013 | 2012 | |||||||||
Cost of sales | $ | 178 | $ | 498 | $ | 286 | |||||
Research and development | 295 | 544 | 183 | ||||||||
Selling, general and administrative | 154 | 158 | 87 | ||||||||
Total derivative instrument expense | $ | 627 | $ | 1,200 | $ | 556 | |||||
The following is a summary of changes to comprehensive income (loss) associated with the Company's hedging activities (in thousands):
December 31, 2014 | December 31, 2013 | December 31, 2012 | |||||||||
Beginning balance of unrealized loss on forward exchange contracts | $ | (875 | ) | $ | (765 | ) | $ | (774 | ) | ||
Other comprehensive loss before reclassifications | (504 | ) | (1,310 | ) | (547 | ) | |||||
Amounts reclassified from other comprehensive income | 627 | 1,200 | 556 | ||||||||
Other comprehensive income (loss) | 123 | (110 | ) | 9 | |||||||
Ending balance of unrealized loss on forward exchange contracts | $ | (752 | ) | $ | (875 | ) | $ | (765 | ) | ||
Over the next twelve months, the Company expects to reclassify into earnings a loss of approximately $0.5 million currently recorded as other comprehensive income, as a result of the maturity of currently held forward exchange contracts.
The bank counterparties in these contracts expose the Company to credit-related losses in the event of their nonperformance. However, to mitigate that risk, the Company only contracts with counterparties who meet its minimum requirements regarding counterparty credit worthiness. In addition, the Company monitors credit ratings, credit spreads and potential downgrades prior to entering into any new hedging contracts.
Note 14 — Commitments and Contingencies
Operating Leases
Radisys is obligated under non-cancelable operating leases for certain facilities, office equipment, and vehicles. Future minimum lease payments with initial or remaining non-cancelable lease terms in excess of one year, at December 31, 2014, were as follows (in thousands):
For the Years Ending December 31, | Future Minimum Lease Payments | ||
2015 | $ | 3,494 | |
2016 | 2,374 | ||
2017 | 1,419 | ||
2018 | 734 | ||
2019 | 457 | ||
2020+ | 228 | ||
Total future minimum lease commitments | $ | 8,706 | |
Rent expense totaled $3.6 million, $4.2 million and $5.4 million for the years ended December 31, 2014, 2013 and 2012.
Adverse Purchase Commitments
68
The Company is contractually obligated to reimburse its contract manufacturer for the cost of excess inventory used in the manufacture of the Company's products if there is no alternative use. This liability, referred to as adverse purchase commitments, is presented in other accrued liabilities in the accompanying Consolidated Balance Sheets. Estimates for adverse purchase commitments are derived from reports received on a quarterly basis from the Company's contract manufacturer. Increases to this liability are charged to cost of sales. If and when the Company takes possession of inventory reserved for in this liability, the liability is transferred from other accrued liabilities to the excess and obsolete inventory valuation allowance (Note 10 — Other Accrued and Other Long-Term Liabilities) to the excess and obsolete inventory valuation allowance (Note 6 — Inventories).
Guarantees and Indemnification Obligations
As permitted under Oregon law, the Company has agreements whereby it indemnifies its officers, directors and certain finance employees for certain events or occurrences while the officer, director or employee is or was serving in such capacity at the request of the Company. The term of the indemnification period is for the officer’s, director’s or employee’s lifetime. The maximum potential amount of future payments the Company could be required to make under these indemnification agreements is unlimited; however, the Company has a Director and Officer insurance policy that limits its exposure and enables the Company to recover a portion of any future amounts paid. To date, the Company has not incurred any costs associated with these indemnification agreements and, as a result, management believes the estimated fair value of these indemnification agreements is minimal. Accordingly, the Company has not recorded any liabilities for these agreements as of December 31, 2014.
The Company enters into standard indemnification agreements in its ordinary course of business. Pursuant to these agreements, the Company indemnifies, holds harmless, and agrees to reimburse the indemnified party for losses suffered or incurred by the indemnified party, generally the Company’s business partners or customers, in connection with patent, copyright or other intellectual property infringement claims by any third party with respect to the Company’s current products, as well as claims relating to property damage or personal injury resulting from the performance of services by us or the Company’s subcontractors. The maximum potential amount of future payments the Company could be required to make under these indemnification agreements is generally limited. Historically, the Company’s costs to defend lawsuits or settle claims relating to such indemnity agreements have been minimal and accordingly management believes the estimated fair value of these agreements is immaterial.
Accrued Warranty
The Company provides for the estimated cost of product warranties at the time it recognizes revenue. Products are generally sold with warranty coverage for a period of 12 or 24 months after shipment. Parts and labor are covered under the terms of the warranty agreement. The workmanship of the Company’s products produced by the contract manufacturer is covered under warranties provided by the contract manufacturer for 12 to 24 months. The warranty provision is based on historical experience by product family. The Company engages in product quality programs and processes, including actively monitoring and evaluating the quality of its components suppliers; however ongoing failure rates, material usage and service delivery costs incurred in correcting product failure, as well as specific product class failures out of the Company’s baseline experience, affect the estimated warranty obligation. If actual product failure rates, material usage or service delivery costs differ from estimates, revisions to the estimated warranty liability would be required.
The following is a summary of the change in the Company’s warranty accrual reserve (in thousands):
For the Years Ended December 31, | ||||||||
2014 | 2013 | |||||||
Warranty liability balance, beginning of the year | $ | 3,328 | $ | 3,954 | ||||
Product warranty accruals | 2,665 | 3,131 | ||||||
Adjustments for payments made | (3,393 | ) | (3,757 | ) | ||||
Warranty liability balance, end of the year | $ | 2,600 | $ | 3,328 | ||||
At December 31, 2014 and 2013, $2.0 million and $2.6 million of the warranty liability balance are included in other accrued liabilities and $0.6 million and $0.7 million are included in other long-term liabilities in the accompanying Consolidated Balance Sheets.
69
Liquidity Outlook
At December 31, 2014, the Company's cash and cash equivalents amounted to $31.2 million. On February 17, 2015, the Company repaid at maturity the $18.0 million balance of the 2015 convertible senior notes. The Company believes that its current cash and cash equivalents, cash expected to be generated from operations and borrowings under the 2014 Agreement will satisfy the Company's short and long-term expected working capital needs, capital expenditures, acquisitions, stock repurchases, and other liquidity requirements associated with the Company's present business operations. The Company believes its current working capital, plus availability under the line of credit, provides sufficient liquidity to operate the business at normal levels; however, if available liquidity is not sufficient to meet operating requirements, the Company may, among other available options, pursue alternative financing arrangements or reduce expenditures as necessary to meet cash requirements throughout 2015.
Note 15 — Basic and Diluted Loss per Share
A reconciliation of the numerator and the denominator used to calculate basic and diluted loss per share is as follows (in thousands, except per share amounts):
For the Years Ended December 31, | ||||||||||||
2014 | 2013 | 2012 | ||||||||||
Numerator—Basic | ||||||||||||
Net loss, basic | $ | (27,581 | ) | $ | (49,404 | ) | $ | (43,474 | ) | |||
Numerator—Diluted | ||||||||||||
Net loss, basic | $ | (27,581 | ) | $ | (49,404 | ) | $ | (43,474 | ) | |||
Interest on convertible senior notes, net of tax benefit (B) | — | — | — | |||||||||
Net loss, diluted | $ | (27,581 | ) | $ | (49,404 | ) | $ | (43,474 | ) | |||
Denominator—Basic | ||||||||||||
Weighted average shares used to calculate net loss per share, basic | 34,699 | 28,805 | 27,174 | |||||||||
Denominator—Diluted | ||||||||||||
Weighted average shares used to calculate net loss per share, basic | 34,699 | 28,805 | 27,174 | |||||||||
Effect of escrow shares (A) | — | — | — | |||||||||
Effect of convertible notes (B) | — | — | — | |||||||||
Effect of dilutive restricted stock (C)(D) | — | — | — | |||||||||
Effect of dilutive stock options (C) | — | — | — | |||||||||
Weighted average shares used to calculate net loss per share, diluted | 34,699 | 28,805 | 27,174 | |||||||||
Net loss per share: | ||||||||||||
Basic | $ | (0.79 | ) | $ | (1.72 | ) | $ | (1.60 | ) | |||
Diluted | $ | (0.79 | ) | $ | (1.72 | ) | $ | (1.60 | ) | |||
(A) | For the years ended December 31, 2014 and 2013 there were no contingently issuable escrow shares outstanding. For the year ended December 31, 2012, 0.7 million contingently issuable escrow shares were excluded from the calculation as their effect would have been anti-dilutive. |
(B) | The following as-if converted shares associated with the Company’s 2013 and 2015 convertible senior notes were excluded from the calculation as their effect would be anti-dilutive (in thousands): |
For the Years Ended December 31, | |||||||||
2014 | 2013 | 2012 | |||||||
2013 convertible senior notes | — | — | 2,450 | ||||||
2015 convertible senior notes | 2,110 | 2,110 | 1,067 | ||||||
Total as-if converted shares excluded | 2,110 | 2,110 | 3,517 | ||||||
70
(C) | The following shares, by equity award type, were excluded from the calculation, as their effect would have been anti-dilutive (in thousands): |
For the Years Ended December 31, | |||||||||
2014 | 2013 | 2012 | |||||||
Stock options | 2,841 | 3,465 | 2,555 | ||||||
Restricted stock units | 128 | 335 | 527 | ||||||
Performance based restricted stock units (D) | 240 | 193 | — | ||||||
Total equity award shares excluded | 3,209 | 3,993 | 3,082 | ||||||
(D) Shares under the Long-Term Incentive Plan ("LTIP") are presented based on attainment of 100% of the performance goals being met. The LTIP provides for the grants of awards payable in shares of common stock upon the achievement of performance goals set by the Company's Compensation and Development Committee. In addition to the performance conditions, the awards contain market-based multipliers based on the average price of the Company's common stock thirty days prior to the end of each semi-annual performance period. The maximum multiplier for a given semi-annual performance period is 2.75x the original grant and overall achievement is limited to a maximum of 2.5x of the target award over the entire performance period. Based on this formula, the maximum number of shares that could be earned was 0.6 million and 0.5 million for the years ended December 31, 2014 and 2013.
Note 16 — Income Taxes
The income tax provision consists of the following (in thousands):
For the Years Ended December 31, | ||||||||||||
2014 | 2013 | 2012 | ||||||||||
Current provision: | ||||||||||||
Federal | $ | — | $ | — | $ | — | ||||||
State | 21 | (70 | ) | 122 | ||||||||
Foreign | 2,127 | 2,299 | 1,252 | |||||||||
Total current provision | 2,148 | 2,229 | 1,374 | |||||||||
Deferred provision (benefit): | ||||||||||||
Federal | (73 | ) | — | (65 | ) | |||||||
State | (3 | ) | — | (3 | ) | |||||||
Foreign | 420 | 12,726 | 1,284 | |||||||||
Total deferred provision | 344 | 12,726 | 1,216 | |||||||||
Total income tax provision | $ | 2,492 | $ | 14,955 | $ | 2,590 | ||||||
71
The income tax provision (benefit) differs from the amount computed by applying the statutory federal income tax rate to pretax income as a result of the following differences (dollar amounts in thousands):
For the Years Ended December 31, | |||||||||||||||||||||
2014 | 2013 | 2012 | |||||||||||||||||||
$ | % | $ | % | $ | % | ||||||||||||||||
Statutory federal tax (benefit) rate | $ | (8,781 | ) | 35.0 | % | $ | (12,057 | ) | 35.0 | % | $ | (14,309 | ) | 35.0 | % | ||||||
Increase (decrease) in rates resulting from: | |||||||||||||||||||||
State taxes | (246 | ) | 1.0 | (356 | ) | 1.0 | (266 | ) | 0.7 | ||||||||||||
Foreign dividends and unremitted earnings | (586 | ) | 2.3 | 1,938 | (5.6 | ) | 6,754 | (16.5 | ) | ||||||||||||
Goodwill impairment expense and (benefit) from acquisitions | — | — | — | — | 9,377 | (22.9 | ) | ||||||||||||||
Valuation allowance | 7,367 | (29.4 | ) | 26,662 | (77.4 | ) | 3,725 | (9.1 | ) | ||||||||||||
Taxes on foreign income that differ from U.S. tax rate | 2,488 | (9.9 | ) | (2,314 | ) | 6.7 | (2,796 | ) | 6.8 | ||||||||||||
Tax credits | — | — | (252 | ) | 0.7 | (304 | ) | 0.7 | |||||||||||||
Non-deductible stock-based compensation expense | 1,206 | (4.8 | ) | 1,596 | (4.6 | ) | 1,812 | (4.4 | ) | ||||||||||||
Earnout liability fair value adjustment | (43 | ) | 0.2 | (596 | ) | 1.7 | (1,768 | ) | 4.3 | ||||||||||||
Other | 1,087 | (4.3 | ) | 334 | (1.0 | ) | 365 | (0.9 | ) | ||||||||||||
Effective tax rate | $ | 2,492 | (9.9 | )% | $ | 14,955 | (43.4 | )% | $ | 2,590 | (6.3 | )% | |||||||||
The components of deferred taxes consist of the following (in thousands):
December 31, 2014 | December 31, 2013 | |||||||
Deferred tax assets: | ||||||||
Accrued warranty | $ | 937 | $ | 1,166 | ||||
Inventory | 1,731 | 2,952 | ||||||
Restructuring accrual | 58 | 317 | ||||||
Net operating loss carryforwards | 61,521 | 52,248 | ||||||
Tax credit carryforwards | 23,866 | 24,692 | ||||||
Stock-based compensation | 2,042 | 2,490 | ||||||
Capitalized research and development | — | 144 | ||||||
Fixed assets | 950 | 2,437 | ||||||
Goodwill | 2,516 | 3,358 | ||||||
Other | 4,056 | 5,005 | ||||||
Total deferred tax assets | 97,677 | 94,809 | ||||||
Less: valuation allowance | (84,240 | ) | (76,873 | ) | ||||
Net deferred tax assets | 13,437 | 17,936 | ||||||
Deferred tax liabilities: | ||||||||
Intangible assets | (11,955 | ) | (13,636 | ) | ||||
Other | (402 | ) | (493 | ) | ||||
Total deferred tax liabilities | (12,357 | ) | (14,129 | ) | ||||
Total net deferred tax assets | $ | 1,080 | $ | 3,807 | ||||
At December 31, 2014, the Company's unrecognized tax benefits associated with uncertain tax positions were $3.7 million, of which $3.2 million, if recognized, would favorably affect the effective tax rate.
The Company's ongoing practice is to recognize potential accrued interest and penalties related to unrecognized tax benefits within its global operations in income tax expense. During 2014, the Company recognized a net increase of approximately $0.2 million in potential interest and penalties associated with uncertain tax positions in the Consolidated
72
Statements of Operations. The Company had approximately $0.6 million and $0.3 million of interest and penalties associated with uncertain tax positions at December 31, 2014, which are excluded from the unrecognized tax benefits table below.
The Company’s total amounts of unrecognized tax benefits at the beginning and end of the period are as follows (in thousands):
Total | |||
Balance as of December 31, 2012 | $ | 3,011 | |
Additions based on tax positions related to the current year | 532 | ||
Additions for tax positions of prior years | 281 | ||
Reductions for tax positions of prior years | (102 | ) | |
Reductions as a result of a lapse of applicable statute of limitations | (70 | ) | |
Other | (206 | ) | |
Balance as of December 31, 2013 | $ | 3,446 | |
Additions based on tax positions related to the current year | 357 | ||
Additions for tax positions of prior years | 76 | ||
Reductions for tax positions of prior years | (98 | ) | |
Reductions as a result of a lapse of applicable statute of limitations | (95 | ) | |
Other | 2 | ||
Balance as of December 31, 2014 | $ | 3,688 | |
The Company and its subsidiaries are subject to federal income tax as well as income tax of multiple state and foreign jurisdictions. The Company's statutes of limitations are closed for all federal and state income tax years before 2010 and 2009. The statutes of limitations for the Company's other foreign subsidiaries are closed for all income tax years before 2006. However, to the extent allowed by law, the taxing authorities may have the right to examine prior periods where net operating losses and credits were generated and carried forward, and make adjustments up to the net operating loss and credit carryforward amounts. It is reasonably possible that the Company's uncertain tax positions, including interest and penalties, could decrease by approximately $0.5 million in the next twelve months due to the expiration of the statute of limitations and settlements primarily related to intercompany transactions..
The Company is currently under examination in India. The periods covered by the examination are the Company's assessment years 2006 through 2008 and 2010 through 2011. The examinations are in various stages of appellate proceedings and all material uncertain tax positions associated with the examination have been taken into account in the ending balance of the unrecognized tax benefits at December 31, 2014.
The Company has recorded valuation allowances of $84.2 million and $76.9 million as of December 31, 2014 and 2013. This represents a full valuation allowance against the Company's U.S. net deferred tax assets as well as a partial valuation allowance against the Company's Canadian net deferred tax assets. During 2013 the Company recognized a partial valuation allowance against the Company's Canadian net deferred tax assets in the amount of $12.5 million due to expected changes in the nature of the Company's operations in Canada. In evaluating its valuation allowance, the Company considers all available positive and negative evidence, including scheduled reversals of deferred tax liabilities, projected future taxable income, tax planning strategies, and recent financial performance.
At December 31, 2014 the Company had total available federal and state net operating loss carryforwards of approximately $170.6 million and $89.5 million. The federal and state net operating loss carryforwards expire between 2017 and 2034. The net operating losses from acquisitions are stated net of limitations pursuant to Section 382 of the Internal Revenue Code. The Company also had net operating loss carryforwards of approximately $4.5 million from the United Kingdom (“U.K.”) and China. The U.K. tax losses may be carried forward indefinitely provided certain requirements are met. The Chinese tax losses may be carried forward 5 years.
The Company has federal and state research and development tax credit and other federal credit carryforwards of approximately $17.1 million at December 31, 2014, to reduce future income tax liabilities. The federal and Oregon credits expire between 2015 and 2031. The California research and development credits do not expire. The credits from acquisitions are stated net of limitations pursuant to Section 383 of the Internal Revenue Code. The Company's Canadian subsidiary also had approximately $4.7 million in investment tax credit, $15.9 million of unclaimed scientific research and experimental expenditures to be carried forward and applied against future income in Canada.
73
Realization of the Company's foreign deferred tax assets is dependent on generating sufficient taxable income prior to the expiration of the net operating loss and tax credit carryforwards. Although realization is not assured, management believes that it is more likely than not that the results of future operations will generate sufficient taxable income to realize the balance of the deferred tax assets, net of the valuation allowance, as of December 31, 2014. The amount of the net deferred tax assets that is considered realizable, however, could be reduced if estimates of future taxable income during the carryforward periods are reduced. Should management determine that the Company would not be able to realize all or part of the net deferred tax assets in the future, adjustments to the valuation allowance for deferred tax assets may be required.
The company has provided a deferred tax liability of $0.2 million related to $0.5 million of unremitted earnings of certain foreign subsidiaries. The Company plans to indefinitely reinvest the earnings of certain foreign subsidiaries. Should the Company repatriate any foreign earnings from the remaining subsidiaries in the future, it may be required to establish an income tax liability and recognize additional income tax expense related to such earnings. The Company has indefinitely reinvested approximately $20.8 million of undistributed earnings from the foreign subsidiaries at December 31, 2014. Such earnings would be subject to U.S. and foreign taxation if repatriated to the U.S.
Pretax book loss from domestic operations for the fiscal years 2014, 2013, and 2012 was $29.9 million, $47.2 million, and $55.8 million. Pretax book income from foreign operations for the fiscal years 2014, 2013, and 2012 was $4.8 million, $12.8 million, and $14.9 million.
Note 17 — Employee Benefit Plans
Stock-Based Employee Benefit Plans
Equity instruments are granted to employees, directors and consultants in certain instances, as defined in the respective plan agreements.
Stock Options and Restricted Stock Awards
On May 15, 2007, the Company's shareholders approved the 2007 Stock Plan (as amended, the "2007 Stock Plan") which provides for issuance of stock options, restricted shares, restricted stock units and performance-based awards. Under the 2007 Stock Plan, 6,700,000 shares have been reserved and authorized for issuance to any non-employee directors and employees. The 2007 Stock Plan provides the Board of Directors discretion in creating employee equity incentives. Unless otherwise stipulated in the plan document, the Board of Directors determines stock option exercise prices, which may not be less than the fair value of Radisys common stock at the date of grant, vesting periods and the expiration periods which are a maximum of 10 years from the date of grant for certain awards.
On August 17, 2010, the shareholders approved the Long-Term Incentive Plan ("LTIP"). The LTIP provides for the grants of awards payable in shares of common stock upon the achievement of performance goals set by the Company’s Compensation and Development Committee (“the Committee”). In addition to the performance conditions, the awards contain market-based multipliers based on the average price of the Company's common stock thirty days prior to the end of each semi-annual performance period. The maximum multiplier for a given semi-annual performance period is 2.75x the original grant and overall achievement is limited to a maximum of 2.5x of the target award over the entire performance period. The number of shares of the Company’s common stock initially reserved for issuance under the LTIP is 2,000,000 shares with a maximum of 500,000 shares in any calendar year to one participant.
On May 3, 2011 the Company registered 600,000 shares of its common stock under the Radisys Corporation Inducement Stock Plan for CCPU Employees (the "CCPU Plan"). The CCPU Plan was adopted without shareholder approval in reliance upon the exception provided under NASDAQ Listing Rule 5635(c)(4) relating to awards granted in connection with the hiring of new employees, including grants to transferred employees in connection with a merger or acquisition. Awards under the CCPU Plan are made only to employees of Continuous Computing or its subsidiaries and became effective upon the completion of the Continuous Computing acquisition. The CCPU Plan provides for the issuance of stock options, restricted shares and restricted stock units. In 2011, the Company issued 368,000 shares under the CCPU Plan and no future awards will be granted.
The Company assumed the stock plans of Continuous Computing on July 8, 2011. Under the terms of the Company's merger agreement with Continuous Computing, options outstanding under these plans were converted to options to purchase shares of the Company's common stock. Options issued under these plans vest over four years from the original grant date and have an expiration date of 10 years from the original grant date. The exercise price of each converted option is equal to the product of the original exercise price and the original number of options granted divided by the number of converted options received. These stock plans have been suspended and no future awards will be granted under these plans. A total of 319,000 shares of common stock were issued under the Continuous Computing stock plans.
74
In accordance with the Continuous Computing merger agreement, unvested options pursuant to the Continuous Computing plans were required to be converted into multiple awards on the acquisition date, with the resulting awards becoming non-contingent and contingent options of the Company. Both the non-contingent and contingent awards continue to vest under the original service conditions of the awards. However, the contingent awards contain post-vesting restrictions tied to payment of certain merger contingencies such as the earn-out and indemnification agreements. The assumed options were valued using a Black-Scholes option-pricing model. In addition, the Company utilized the Finnerty Asian Put Option Approach to estimate the discount associated with the post-vesting restrictions for the contingent options. The resulting discount applied was 10%.
On September 4, 2012, the Committee approved 291,375 performance based restricted stock awards under the Overlay Plan based on attainment of the performance goals at maximum levels. The Overlay provides for the grants of awards payable in shares of common stock upon the achievement of performance goals set by the Committee. The awards had four separate quarterly performance achievement dates in 2013 and vest one year after they are earned. As of December 31, 2014, there are no outstanding awards under the Overlay plan.
Effective September 10, 2012, the Committee canceled all outstanding awards under the LTIP, resulting in the shares underlying such awards becoming eligible for grants of additional awards under the LTIP.
Following such cancellation of awards, on September 10, 2012, the Committee approved 799,975 performance based restricted stock awards under the LTIP based on attainment of 100% of the performance goals being met. The LTIP provides for the grants of awards payable in shares of common stock upon the achievement of performance goals set by the Committee. The awards have four separate semi-annual performance achievement dates in 2013 and 2014 and vest upon attainment of the performance conditions. In addition to the performance conditions, the awards contain market-based multipliers based on the average price of the Company's common stock thirty days prior to each semi-annual performance period. The maximum multiplier for a given semi-annual performance period is 2.75x the original grant and limited to a maximum of 2.5x (or 1,999,938 shares) over the entire performance period.
As of December 31, 2014, the Company had 2,112,242 common shares available for future grant under its equity plans.
The following table summarizes stock option activity for 2014 (in thousands, except average prices and weighted average remaining contractual lives):
Options | Weighted Average Exercise Price | Weighted Average Remaining Contractual Term (Years) | Aggregate Intrinsic Value | |||||||||
Balance, December 31, 2013 | 3,465 | $ | 5.15 | 4.65 | $ | 211 | ||||||
Granted | 445 | 3.32 | ||||||||||
Exercised | (63 | ) | 1.79 | |||||||||
Forfeited | (583 | ) | 3.38 | |||||||||
Expired | (423 | ) | 7.52 | |||||||||
Balance, December 31, 2014 | 2,841 | $ | 4.95 | 4.40 | $ | 43 | ||||||
Options exercisable at December 31, 2014 | 1,742 | $ | 5.93 | 3.74 | $ | 42 | ||||||
Options vested as of December 31, 2014 and expected to vest after December 31, 2014 | 2,783 | $ | 4.98 | 4.37 | $ | 43 | ||||||
The aggregate intrinsic value in the table above represents the total pretax value, based on the Company's closing common stock price of $2.34 at December 31, 2014 that would have been received by the option holders had all option holders exercised their in-the-money options on December 31, 2014.
Total intrinsic value of options exercised for the years ended December 31, 2014, 2013 and 2012 was $0.1 million, $0.2 million, and $0.1 million. The total amount of cash received from the exercise of options was $0.1 million in 2014, 2013 and 2012.
As of December 31, 2014, the Company had $1.3 million in unrecognized compensation expense related to stock options which is expected to be recognized over a weighted average period of 1.5 years.
75
The following table summarizes nonvested stock activity for 2014:
Restricted Stock Units | LTIP and Overlay Awards | ||||||||||||
Restricted Shares | Weighted Average Fair Value | Restricted Shares | Weighted Average Fair Value | ||||||||||
Balance, December 31, 2013 | 335 | $ | 4.73 | 796 | $ | 5.00 | |||||||
Granted | 102 | 3.51 | 172 | 3.46 | |||||||||
Vested | (231 | ) | 4.84 | (478 | ) | 3.62 | |||||||
Forfeited | (78 | ) | 4.63 | (250 | ) | 3.65 | |||||||
Balance, December 31, 2014 | 128 | $ | 3.78 | 240 | $ | 3.55 | |||||||
The total fair value of restricted stock units that vested in 2014, 2013 and 2012 was $1.1 million, $1.4 million and $1.0 million. As of December 31, 2014, the Company had $0.3 million in unrecognized compensation expense related to restricted stock units which is expected to be recognized over a weighted average period of 1.0 years. The LTIP and Overlay awards are separated into four performance periods which range from September 10, 2012 to December 31, 2014. Expense associated with each service period is measured on the date the respective service period begins. At December 31, 2014, there was no remaining unrecognized compensation expense associated with the LTIP or Overlay awards.
Employee Stock Purchase Plan
In December 1995, the Company established an Employee Stock Purchase Plan (“ESPP”). All employees of Radisys and its subsidiaries who customarily work 20 or more hours per week, including all officers, are eligible to participate in the ESPP. Separate offerings of common stock to eligible employees under the ESPP (an “Offering”) commence on February 15, May 15, August 15 and November 15 of each calendar year (“Enrollment Dates”) and continue for a period of 18 months. Multiple separate offerings are in operation under the ESPP at any given time. An employee may participate in only one Offering at a time and may purchase shares only through payroll deductions permitted under the provisions stipulated by the ESPP. The purchase price is the lesser of 85% of the fair market value of the common stock on date of grant or that of the purchase date (“look-back feature”). Pursuant to the provisions of the ESPP, as amended, the Company is authorized to issue up to 6.7 million shares of common stock under the ESPP. At December 31, 2014, 587,739 shares were available for issuance under the ESPP.
During the second quarter of 2009, the Board of Directors approved an amendment to the Company’s ESPP to provide for a one-year holding period with respect to common stock shares purchased by participants under the ESPP. The one-year holding period took effect during the fourth quarter of 2009. Due to the holding period, the Company applies a discount to the ESPP stock compensation to reflect the decreased liquidity. The Company utilizes the Finnerty Asian Put Option Approach to estimate the discount. Inputs for the model include the length of the holding period, volatility and risk-free rate. The discount applied in the fourth quarter of 2014, 2013 and 2012 was 13.0%.
The following table summarizes shares issued under the ESPP (in thousands, except per share amounts):
Year Ended December 31, | ||||||||||||
2014 | 2013 | 2012 | ||||||||||
Shares issued pursuant to the ESPP | 242 | 381 | 352 | |||||||||
Cash received for the purchase of shares pursuant to the ESPP | $ | 514 | $ | 767 | $ | 1,225 | ||||||
Weighted average purchase price per share | $ | 2.12 | $ | 2.01 | $ | 3.48 | ||||||
Stock-Based Compensation Expense
The Company uses the Black-Scholes model to measure the grant-date fair value of stock options and ESPP shares. The grant-date fair value of stock options that are expected to vest is recognized on a straight-line basis over the requisite service period, generally, three years. The grant date fair value of ESPP shares that are expected to vest is recognized on a straight-line basis over the requisite service period, generally, 18 months, subject to modification at the date of purchase due to the ESPP look-back feature. The estimate of the number of options, ESPP shares and restricted stock units granted under the 2007 Stock Plan expected to vest is determined based on historical experience.
The Company estimates the fair value of stock options and purchase rights under the ESPP using a Black-Scholes option-pricing model. The calculation includes several assumptions that require management’s judgment. The expected term of the option or share is determined based on assumptions about patterns of employee exercises, and represents a probability-
76
weighted average time period from grant until exercise of stock options, subject to information available at time of grant. Determining expected volatility generally begins with calculating historical volatility for a similar long-term period and then considering the ways in which the future is reasonably expected to differ from the past.
The Company uses one employee population. The expected term computation is based on historical vested option exercise and post-vest forfeiture patterns and is also factored by an estimate of the expected term for fully vested and outstanding options. The estimate of the expected term for options that were fully vested and outstanding was determined as the midpoint between the evaluation date and the contractual term date of the option.
The risk free interest rate is based on the U.S. Treasury constant maturities in effect at the time of grant for the expected term of the option or share.
The fair value of unvested stock is the market value as of the grant date. The grant-date fair value of the restricted stock units that are expected to vest is recognized on a straight-line basis over the requisite service period, which is three years. The grant-date fair value of the LTIP and Overlay awards is recognized ratably over the service period which equals the measurement period of the award. The measurement period is the period of time over which performance objectives are expected to be achieved. Since the number of shares that may be issued under the LTIP and Overlay and the service period are both variable, the Company evaluates the LTIP and Overlay awards on a quarterly basis and adjusts the number of shares expected to be awarded based upon financial results of the Company as compared to the performance goals set for the award. Adjustments to the number of shares awarded, and to the corresponding compensation expense, are made on a cumulative basis at the date of adjustment based upon the estimated probable number of shares to be awarded. Adjustments made to compensation expense resulting from a change in the estimated probable vesting date of the awards are made on a prospective basis. Additionally, under the 2012 LTIP the Company is required to measure the fair value of the market-based condition contained in the awards. This fair value of this feature is measured at the outset of each semi-annual performance period and recognized over the service period of the respective performance period.
The fair value calculations for stock options and ESPP shares used the following assumptions for the years ended December 31:
Stock Options | Employee Stock Purchase Plan | ||||||||||||||||||||||
2014 | 2013 | 2012 | 2014 | 2013 | 2012 | ||||||||||||||||||
Estimated fair value | $ | 0.90 | $ | 3.45 | $ | 2.10 | $ | 0.95 | $ | 1.79 | $ | 2.05 | |||||||||||
Expected life (in years) | 4.4 | 4.5 | 4.5 | 1.5 | 1.5 | 1.5 | |||||||||||||||||
Interest rate | 1.46 | % | 1.33 | % | 0.65 | % | 0.13 | % | 0.15 | % | 0.18 | % | |||||||||||
Volatility | 52 | % | 57 | % | 71 | % | 53 | % | 52 | % | 53 | % | |||||||||||
Dividend yield | — | — | — | — | — | — | |||||||||||||||||
For the years ended December 31, 2014, 2013 and 2012, stock-based compensation was recognized and allocated in the Consolidated Statements of Operations as follows (in thousands):
2014 | 2013 | 2012 | ||||||||||
Cost of sales | $ | 386 | $ | 550 | $ | 25 | ||||||
Research and development | 818 | 1,170 | 601 | |||||||||
Selling, general and administrative | 2,893 | 3,578 | 765 | |||||||||
Total stock-based compensation expense | $ | 4,097 | $ | 5,298 | $ | 1,391 | ||||||
77
401(k) Savings Plan
The Company established a 401(k) Savings Plan (“401(k) Plan”), a defined contribution plan, as of January 1, 1989 and amended through January 1, 2007, in compliance with Section 401(k) and other related sections of the Internal Revenue Code and corresponding regulations issued by the Department of Treasury and Section 404(c) of Employee Retirement Income Security Act of 1974 (“ERISA”), to provide retirement benefits for its U.S employees. Under the provisions of the plan, eligible employees are allowed pre-tax contributions of up to 30% of their annual compensation or the maximum amount permitted by the applicable statutes. Additionally, eligible employees can elect to make catch-up contributions, within the limits set forth by pre-tax contributions, or to the maximum amount permitted by the applicable statutes. Pursuant to the provisions of the 401(k) Plan, the Company may contribute 50% of pre-tax contributions made by eligible employees, adjusted for loans and withdrawals, up to 6% of annual compensation for each eligible employee. The Company may elect to make supplemental contributions as periodically determined by the Board of Directors at their discretion. The contributions made by the Company on behalf of eligible employees become 100% vested after three years of service, or 33% per year after one year of service. The Company’s total contributions to the 401(k) Plan amounted to $0.8 million, $0.7 million, and $0.7 million in 2014, 2013 and 2012. In addition, some of the Company’s employees outside the U.S are covered by various defined contribution plans, in compliance with the statutes of respective countries. The participants pay for the 401(k) Plan administrative expenses.
Deferred Compensation Plan
The Company terminated its Deferred Compensation Plan during 2013. The distribution of plan assets and participant balances began during 2013 and will continue through January 2015 based on participant elections. The Deferred Compensation Plan provided its directors and certain eligible employees with opportunities to defer a portion of their compensation as defined by the provisions of the plan. The Company credited additional amounts to the Deferred Compensation Plan to make up for reductions of Company contributions under the 401(k) Plan. The deferred amounts were credited with earnings and losses under investment options chosen by the participants. The Company set aside deferred amounts, which were then invested in long-term insurance contracts. All deferred amounts and earnings are 100% vested at all times, but are subject to the claims of creditors of the Company under a bankruptcy proceeding. Benefits were payable to a participant upon retirement, death, and termination of employment and paid as elected by the participant in accordance with the terms of the plan.
Note 18 — Segment Information
During 2014, 2013 and 2012 Company's Chief Operating Decision Maker (CODM), Radisys' Chief Executive Officer, reviewed the Company's results of operations on a consolidated level and executive staff was structured by function rather than by product category. Therefore, the Company was one operating segment. Key resources, decisions, and assessment of performance were also analyzed on a company-wide level.
In 2015, the Company implemented strategic and organizational changes resulting in a strategic focus in two areas: Software-Systems and Embedded Products and Hardware Services. As a result of these changes, the information the Company's Chief Executive Officer, or chief operating decision maker, regularly reviews for purposes of allocating resources and assessing performance changed. Beginning in fiscal year 2015, the Company will report financial performance in two segments: Software- Systems and Embedded Products and Hardware Services.
• | Software-Systems (previously referred to as Software and Solutions). Software-Systems product are comprised of three product families: FlowEngine, MediaEngine and CellEngine. |
• | Embedded Products and Hardware Services (comprising the product-lines previously referred to as ATCA, COMe RMS and Other Products). These hardware based products provide platforms to control and move data in the core of the telecom network. |
Cost of sales, research and development and selling, general and administrative expenses are allocated to Software-Systems and Embedded Products and Hardware Services. Expenses, reversals, gains and losses not allocated to Software-Systems or Embedded Product and Hardware Services include amortization of acquired intangible assets, stock-based compensation, restructuring and other charges, and other one-time non-recurring events. These items are allocated to corporate and other.
The Company is providing a supplemental historical reporting of revenue, gross margin and operating income by operating segment for the years ended December 31, 2014, 2013 and 2012 (in thousands):
78
For the Years Ended December 31, | ||||||||||||
2014 | 2013 | 2012 | ||||||||||
Revenue | ||||||||||||
Software-Systems | $ | 40,281 | $ | 44,934 | $ | 52,666 | ||||||
Embedded Products and Hardware Services | 152,461 | 192,929 | 233,430 | |||||||||
Total revenues | $ | 192,742 | $ | 237,863 | $ | 286,096 | ||||||
For the Years Ended December 31, | ||||||||||||
2014 | 2013 | 2012 | ||||||||||
Gross margin | ||||||||||||
Software-Systems | $ | 24,949 | $ | 25,860 | $ | 36,326 | ||||||
Embedded Products and Hardware Services | 35,449 | 47,603 | 61,642 | |||||||||
Corporate and other | (8,596 | ) | (9,325 | ) | (9,929 | ) | ||||||
Total gross margin | $ | 51,802 | $ | 64,138 | $ | 88,039 | ||||||
For the Years Ended December 31, | ||||||||||||
2014 | 2013 | 2012 | ||||||||||
Loss from operations | ||||||||||||
Software-Systems | $ | (6,169 | ) | $ | (7,974 | ) | $ | 3,735 | ||||
Embedded Products and Hardware Services | 2,457 | (25 | ) | 2,661 | ||||||||
Corporate and other | (21,588 | ) | (26,767 | ) | (46,142 | ) | ||||||
Total loss from operations | $ | (25,300 | ) | $ | (34,766 | ) | $ | (39,746 | ) | |||
Assets are not allocated to segments for internal reporting presentations. A portion of depreciation is allocated to the respective segment. It is impracticable for the Company to separately identify the amount of depreciation by segment that is included in the measure of segment profit or loss.
The following table summarizes revenue by product group that the Company has historically disclosed. In 2015, the Company has reorganized into two operating segments, and therefore in the future these product groups will no longer be disclosed. Product group revenues are as follows (in thousands):
For the Years Ended December 31, | ||||||||||||
2014 | 2013 | 2012 | ||||||||||
ATCA | $ | 91,094 | $ | 116,537 | $ | 136,572 | ||||||
Software and Solutions | 40,281 | 44,934 | 52,666 | |||||||||
COM Express and Rackmount Server | 49,660 | 56,019 | 49,538 | |||||||||
Other Products | 11,707 | 20,373 | 47,320 | |||||||||
Total revenues | $ | 192,742 | $ | 237,863 | $ | 286,096 | ||||||
79
Geographic Revenues
For the Years Ended December 31, | ||||||||||||
2014 | 2013 | 2012 | ||||||||||
United States | $ | 74,630 | $ | 100,780 | $ | 105,858 | ||||||
Other North America | 2,079 | 3,042 | 3,310 | |||||||||
China | 31,975 | 29,818 | 45,419 | |||||||||
Japan | 14,848 | 30,724 | 39,435 | |||||||||
Other APAC | 26,329 | 20,988 | 31,695 | |||||||||
Total APAC | 73,152 | 81,530 | 116,549 | |||||||||
Germany | 2,808 | 11,770 | 18,580 | |||||||||
Netherlands | 22,608 | 19,017 | 19,896 | |||||||||
Other EMEA | 17,465 | 21,724 | 21,903 | |||||||||
Total EMEA | 42,881 | 52,511 | 60,379 | |||||||||
Foreign Countries | 118,112 | 137,083 | 180,238 | |||||||||
Total revenues | $ | 192,742 | $ | 237,863 | $ | 286,096 | ||||||
Long-lived assets by Geographic Area
For the Years Ended December 31, | ||||||||
2014 | 2013 | |||||||
Property and equipment, net | ||||||||
United States | $ | 4,558 | $ | 7,421 | ||||
Other North America | 672 | 942 | ||||||
China | 2,427 | 3,396 | ||||||
Other APAC | 11 | 185 | ||||||
Total APAC | 2,438 | 3,581 | ||||||
India | 2,115 | 2,893 | ||||||
Other EMEA | 3 | 17 | ||||||
Total EMEA | 2,118 | 2,910 | ||||||
Foreign Countries | 5,228 | 7,433 | ||||||
Total property and equipment, net | $ | 9,786 | $ | 14,854 | ||||
Intangible assets, net | ||||||||
United States | $ | 43,224 | $ | 56,474 | ||||
Other North America | — | 36 | ||||||
Total intangible assets, net | $ | 43,224 | $ | 56,510 | ||||
The following customers accounted for more than 10% of total revenues for the years ended December 31:
2014 | 2013 | 2012 | ||||
Nokia Solutions and Networks | 17.0% | 18.7% | 22.5% | |||
Philips Healthcare | 14.9% | NA | NA | |||
NEC | NA | NA | 11.1% | |||
The following customer accounted for more than 10% of accounts receivable for the years ended December 31:
2014 | 2013 | |||
Nokia Solutions and Networks | 18.5% | 20.7% | ||
Philips Healthcare | 13.9% | NA | ||
80
Note 19 — Legal Proceedings
In the normal course of business, the Company becomes involved in litigation. As of December 31, 2014, in the opinion of management, Radisys had no pending litigation that would have a material effect on the Company’s financial position, results of operations or cash flows.
Note 20 — Subsequent Events
On February 3, 2015, the Company announced plans it would reorganize into two operating segments - 'Software-Systems' and 'Embedded Products and Hardware Services'. In connection with these changes, the Company will restructure its research and development and sales and general administrative presence primarily within Asia and North America. The Company expects to record 2015 restructuring charges in the range of approximately $4.5 million to $5.5 million, substantially all of which will be paid in the first half of 2015 for cash severance payments and other employee-related costs.
Item 9. Changes In and Disagreements with Accountants on Accounting and Financial Disclosure
Not applicable.
Item 9A. Controls and Procedures
Disclosure Controls and Procedures. Based on their evaluation as of the end of the period covered by this Annual Report on Form 10-K, the Company’s Chief Executive Officer and Chief Financial Officer have concluded that the Company’s “disclosure controls and procedures” (as defined in Rules 13a-15(e) and 15d-15(e) under the Exchange Act) are effective.
During the Company’s fiscal quarter ended December 31, 2014, no change occurred in the Company’s internal control over financial reporting that has materially affected, or is reasonably likely to materially affect, the Company’s internal control over financial reporting.
For Management’s Report on Internal Control Over Financial Reporting and the Report of Independent Registered Public Accounting Firm on Internal Control over Financial Reporting, see Item 8, Financial Statements and Supplementary Data.
Item 9B. Other Information
None
81
PART III
The Company will file its definitive proxy statement for the Annual Meeting of Shareholders pursuant to Regulation 14A of the Exchange Act (the “Proxy Statement”), not later than 120 days after the end of the fiscal year covered by this Annual Report. This Annual Report incorporates by reference specified information included in the Proxy Statement.
Item 10. Directors, Executive Officers and Corporate Governance
The information with respect to the Company’s directors and officers and corporate governance is included under the proposal to elect directors, "Executive Officers," "Section 16(a) Beneficial Ownership Reporting Compliance" and "Corporate Governance" in the Company’s Proxy Statement and is incorporated herein by reference. The information with respect to the Company’s code of ethics is included in Item 1. "Business" in this Annual Report on Form 10-K.
Item 11. Executive Compensation
Information with respect to executive compensation is included under “Director Compensation,” “Executive Officer Compensation,” “Compensation and Development Committee Report,” and “Potential Post-Employment Payments” in the Company’s Proxy Statement and is incorporated herein by reference.
Item 12. Security Ownership of Certain Beneficial Owners and Management and Related Stockholder Matters
Information with respect to security ownership of certain beneficial owners and management and equity compensation plan information is included under “Security Ownership of Certain Beneficial Owners and Management” in the Company’s Proxy Statement and is incorporated herein by reference.
EQUITY COMPENSATION PLAN INFORMATION
The following table summarizes information about the Company’s equity compensation plans as of December 31, 2014. All outstanding awards relate to the Company’s common stock.
Plan category | Number of securities to be issued upon exercise of outstanding options, warrants and rights | Weighted average exercise price of outstanding options, warrants and rights ($) | Number of securities remaining available for future issuance under equity compensation plans | ||||||||
Equity compensation plans approved by security holders | 3,726,522 | (1) | $ | 4.94 | 2,474,867 | (2) | |||||
Equity compensation plans not approved by security holders (3) | 68,944 | (4) | 5.34 | — | |||||||
Total | 3,795,466 | $ | 4.95 | 2,474,867 | |||||||
_____________________________
(1) | Includes 129,251 restricted stock units and 825,512 performance-based restricted stock units which will vest only if specific service measures are met. Also includes 1,540,595 performance-based restricted stock units which represents the maximum number of shares that might be earned upon attaining certain performance goals. The number of shares subject to performance-based restricted stock units at threshold levels is 240,162. |
(2) | Includes 587,739 of securities authorized and available for issuance in connection with the RadiSys Corporation 1996 Employee Stock Purchase Plan. Includes performance-based restricted stock units reserved at the maximum number of shares that might be earned upon attaining certain performance goals. |
(3) | Includes 41,250 shares granted under the Radisys Corporation Inducement Stock Plan for CCPU Employees. The CCPU Plan is intended to comply with the National Association of Securities Dealers, Inc.’s (“NASD”) Marketplace Rule 4350 which provides an exception to the NASD stockholder approval requirement for the issuance of securities with regard to grants to new Employees of the Company, including grants to transferred Employees in connection with a merger or other acquisition. |
(4) | Includes 27,694 stock options assumed as part of the acquisition of Continuous Computing Corporation. |
82
Description of Equity Compensation Plans Not Adopted by Shareholders
Additional information required by this item is included in the Company’s Proxy Statement and is incorporated herein by reference.
Item 13. Certain Relationships and Related Transactions, and Director Independence
The information with respect to certain relationships and related transactions and director independence is included under “Certain Relationships and Related Transactions”, "Related Party Transactions Policy", and "Corporate Governance" in the Company’s Proxy Statement and is incorporated herein by reference.
Item 14. Principal Accounting Fees and Services
The information with respect to principal accountant fees and services is included under “Principal Accountant Fees and Services” and "Audit Committee Pre-Approval of Audit and Permissible Non-Audit Services of Independent Registered Public Accounting Firm" in the Company’s proxy statement and is incorporated herein by reference.
83
PART IV
Item 15. Exhibits and Financial Statement and Schedules
(a) (1) Financial Statements
Index to Financial Statements
Form 10-K Page No. | ||
(a) (2) Financial Statement Schedule
None.
(a) (3) Exhibits
Exhibit No | Description | |
2.1 | Amended and Restated Asset Purchase Agreement, dated September 12, 2007, by and between the Company and Intel Corporation. Incorporated by reference from Exhibit 2.1 to the Company’s Current Report on Form 8-K/A, filed on November 1, 2007 (SEC File No. 000-26844). | |
2.2 | Transition Services Agreement, dated September 12, 2007, by and between the Company and Intel Corporation (portions of the exhibit have been omitted pursuant to a request for confidential treatment to the Commission). Incorporated by reference from Exhibit 10.2 to the Company’s Quarterly Report on Form 10-Q for the quarterly period ended September 30, 2007, filed on November 8, 2007 (SEC File No. 000-26844). | |
2.3 | Warranty Services Agreement, dated September 12, 2007, by and between the Company and Intel Corporation (portions of the exhibit have been omitted pursuant to a request for confidential treatment to the Commission). Incorporated by reference from Exhibit 10.3 to the Company’s Quarterly Report on Form 10-Q for the quarterly period ended September 30, 2007, filed on November 8, 2007 (SEC File No. 000-26844). | |
2.4 | Arrangement Agreement among the Company, Convedia Corporation and RadiSys Canada Inc., effective as of July 26, 2006. Incorporated by reference from Exhibit 2.1 to the Company’s Current Report on Form 8-K filed on July 28, 2006 (SEC File No. 000-26844). | |
2.5 | Agreement and Plan of Merger, dated May 2, 2011, by and among the Company, RadiSys Holdings, Inc., Continuous Computing Corporation and Shareholder Representative Services LLC. Incorporated by reference from Exhibit 2.1 to the Company’s Current Report on Form 8-K filed on May 3, 2011 (SEC File No. 000-26844). | |
2.6 | Amendment No. 1 to Agreement and Plan of Merger, dated June 22, 2011, by and among the Company, RadiSys Holdings, Inc., Continuous Computing Corporation and Shareholder Representative Services LLC. Incorporated by reference from Exhibit 2.2 to the Company’s Current Report on Form 8-K filed on July 11, 2011 (SEC File No. 000-26844). | |
3.1 | Second Restated Articles of Incorporation and amendments thereto. Incorporated by reference from Exhibit 4.1 to the Company’s Registration Statement on Form S-8, filed on September 1, 2006 (SEC File No. 333-137060), as amended by the Articles of Amendment incorporated by reference from Exhibit 3.2 in the Company’s Current Report on Form 8-K filed on January 30, 2008 (SEC File No. 000-26844). | |
84
Exhibit No | Description | |
3.2 | Second Amended and Restated Bylaws and amendments thereto. Incorporated by reference from Exhibit 3.1 to the Company’s Quarterly Report on Form 10-Q for the quarterly period ended September 30, 2014, filed on November 7, 2014 (SEC File No. 000-26844). | |
4.1 | Second Restated Articles of Incorporation and amendments thereto. See Exhibit 3.1. | |
4.2 | Second Amended and Restated Bylaws and amendments thereto. See Exhibit 3.2. | |
4.3 | Specimen Common Stock Certificate. Incorporated by reference from Exhibit 4.3 to the Company’s Registration Statement on Form S-8, filed on September 1, 2006 (SEC File No. 333-137060). | |
4.4 | Indenture, dated February 12, 2008, by and between the Company and The Bank of New York Trust Company, N.A. Incorporated by reference from Exhibit 4.1 to the Company’s Current Report on Form 8-K filed on February 12, 2008 (SEC File No. 000-26844). | |
4.5 | First Supplemental Indenture, dated February 12, 2008, by and between the Company and The Bank of New York Trust Company, N.A. Incorporated by reference from Exhibit 4.2 to the Company’s Current Report on Form 8-K filed on February 12, 2008 (SEC File No. 000-26844). | |
4.6 | Form of Global Security for the 2.75% Convertible Senior Notes due 2013 (included in Exhibit 4.5). | |
4.7 | Second Supplemental Indenture, dated June 29, 2012, by and between the Company and The Bank of New York Mellon Trust Company, N.A. Incorporated by reference from Exhibit 4.1 to the Company's Current Report on Form 8-K filed on July 2, 2012 (SEC File No. 000-26844). | |
4.8 | Form of Global Security for the 4.50% Convertible Senior Notes due 2015 (included in Exhibit 4.7). | |
4.9 | Form of Debt Securities Indenture. Incorporated by reference from Exhibit 4.5 to the Company’s Registration Statement on Form S-3, filed on October 26, 2010 (SEC File No. 333-170148). | |
10.1 | Amended and Restated Asset Purchase Agreement, dated September 12, 2007, by and between the Company and Intel Corporation. See Exhibit 2.1. | |
10.2 | Transition Services Agreement, dated September 12, 2007, by and between the Company and Intel Corporation. See Exhibit 2.2 | |
10.3 | Warranty Services Agreement, dated September 12, 2007, by and between the Company and Intel Corporation. See Exhibit 2.3 | |
10.4* | RadiSys Corporation 1995 Stock Incentive Plan, as amended. Incorporated by reference from Exhibit (d)(1) to the Tender Offer Statement filed by the Company on Schedule TO-I, filed July 31, 2003 (SEC File No. 005-49160). | |
10.5* | Form of Notice of Stock Option Grant for the 1995 Stock Incentive Plan. Incorporated by reference from Exhibit (d)(3) to the Tender Offer Statement filed by the Company on Schedule TO-I, filed July 31, 2003 (SEC File No. 005-49160). | |
10.6* | Form of Restricted Stock Grant Agreement for the 1995 Stock Incentive Plan. Incorporated by reference from Exhibit 10.1 to the Company’s Quarterly Report on Form 10-Q for the quarterly period ended March 31, 2006, filed on May 9, 2006 (SEC File No. 000-26844). | |
10.7* | RadiSys Corporation 1996 Employee Stock Purchase Plan, as amended through June 26, 2012. Incorporated by reference from Appendix D to the Company’s Proxy Statement on Schedule 14A, filed on May 17, 2012 (SEC File No. 000-26844). | |
10.8* | RadiSys Corporation 2001 Nonqualified Stock Option Plan, as amended. Incorporated by reference from Exhibit (d)(2) to the Tender Offer Statement filed by the Company on Schedule TO-I, filed July 31, 2003 (SEC File No. 005-49160). | |
10.9* | Form of Notice of Stock Option Grant for the 2001 Nonqualified Stock Option Plan. Incorporated by reference from Exhibit (d)(4) to the Tender Offer Statement filed by the Company on Schedule TO-I, filed July 31, 2003 (SEC File No. 005-49160). | |
10.10* | Amended and Restated Radisys Corporation Deferred Compensation Plan, dated January 1, 2008. Incorporated by reference from Exhibit 10.10 to the Company's Annual Report on Form 10-K for the year ended December 31, 2013, filed on March 14, 2014 (SEC File No. 000-26844). | |
85
Exhibit No | Description | |
10.11* | Amendment No. 1 to Amended and Restated Radisys Corporation Deferred Compensation Plan, effective January 1 2009. Incorporated by reference from Exhibit 10.11 to the Company's Annual Report on Form 10-K for the year ended December 31, 2013, filed on March 14, 2014 (SEC File No. 000-26844). | |
10.12* | Amendment No. 2 to Amended and Restated Radisys Corporation Deferred Compensation Plan, effective January 1 2009. Incorporated by reference from Exhibit 10.12 to the Company's Annual Report on Form 10-K for the year ended December 31, 2013, filed on March 14, 2014 (SEC File No. 000-26844). | |
10.13* | Amendment No. 3 to Amended and Restated Radisys Corporation Deferred Compensation Plan, effective January 1 2009. Incorporated by reference from Exhibit 10.13 to the Company's Annual Report on Form 10-K for the year ended December 31, 2013, filed on March 14, 2014 (SEC File No. 000-26844). | |
10.14* | RadiSys Corporation Stock Plan for Convedia Employees. Incorporated by reference from Exhibit 4.4 to the Company’s Registration Statement on Form S-8, filed on September 1, 2006 (SEC File No. 333-137060). | |
10.15* | Form of Notice of Option Grant for United States employees for the RadiSys Corporation Stock Plan for Convedia Employees. Incorporated by reference from Exhibit 4.5 to the Company’s Registration Statement on Form S-8, filed on September 1, 2006 (SEC File No. 333-137060). | |
10.16* | Form of Notice of Option Grant for Canada employees for the RadiSys Corporation Stock Plan for Convedia Employees. Incorporated by reference from Exhibit 4.6 to the Company’s Registration Statement on Form S-8 filed on September 1, 2006 (SEC File No. 333-137060). | |
10.17* | Form of Notice of Option Grant for international employees for the RadiSys Corporation Stock Plan for Convedia Employees. Incorporated by reference from Exhibit 4.7 to the Company’s Registration Statement on Form S-8, filed on September 1, 2006 (SEC File No. 333-137060). | |
10.18* | Form of Notice of Option Grant for China employees for the RadiSys Corporation Stock Plan for Convedia Employees. Incorporated by reference from Exhibit 4.8 to the Company’s Registration Statement on Form S-8, filed on September 1, 2006 (SEC File No. 333-137060). | |
10.19* | Form of Restricted Stock Grant Agreement for the RadiSys Corporation Stock Plan for Convedia Employees. Incorporated by reference from Exhibit 4.9 to the Company’s Registration Statement on Form S-8, filed on September 1, 2006 (SEC File No. 333-137060). | |
10.20* | Form of Restricted Stock Unit Grant Agreement for the RadiSys Corporation Stock Plan for Convedia Employees. Incorporated by reference from Exhibit 4.10 to the Company’s Registration Statement on Form S-8, filed on September 1, 2006 (SEC File No. 333-137060). | |
10.21* | RadiSys Corporation 2007 Stock Plan, as amended through June 26, 2012. Incorporated by reference from Appendix C to the Company’s Proxy Statement on Schedule 14A, filed on May 17, 2012 (SEC File No. 000-26844). | |
10.22* | Form of Overlay Plan Award Agreement for Performance-Based Restricted Stock Units under the RadiSys Corporation 2007 Stock Plan. Incorporated by reference from Exhibit 10.1 to the Company’s Current Report on Form 8-K filed on September 10, 2012 (SEC File No. 000-26844). | |
10.23* | Form of Notice of Option Grant for United States employees for the RadiSys Corporation 2007 Stock Plan. Incorporated by reference from Exhibit 4.5 to the Company’s Registration Statement on Form S-8, filed on May 15, 2007 (SEC File No. 333-142968). | |
10.24* | Form of Notice of Option Grant for Canada employees for the RadiSys Corporation 2007 Stock Plan. Incorporated by reference from Exhibit 4.6 to the Company’s Registration Statement on Form S-8, filed on May 15, 2007 (SEC File No. 333-142968). | |
10.25* | Form of Notice of Option Grant for China employees for the RadiSys Corporation 2007 Stock Plan. Incorporated by reference from Exhibit 4.7 to the Company’s Registration Statement on Form S-8, filed on May 15, 2007 (SEC File No. 333-142968). | |
10.26* | Form of Notice of Option Grant for international employees for the RadiSys Corporation 2007 Stock Plan. Incorporated by reference from Exhibit 4.8 to the Company’s Registration Statement on Form S-8, filed on May 15, 2007 (SEC File No. 333-142968). | |
10.27* | Form of Restricted Stock Unit Grant Agreement for the RadiSys Corporation 2007 Stock Plan. Incorporated by reference from Exhibit 4.9 to the Company’s Registration Statement on Form S-8, filed on May 15, 2007 (SEC File No. 333-142968). | |
86
Exhibit No | Description | |
10.28* | Form of Restricted Stock Unit Grant Agreement for non-employee Board of Directors for the Radisys Corporation 2007 Stock Plan. Incorporated by reference from Exhibit 10.1 to the Company's Quarterly Report on Form 10-Q for the quarterly period ended March 31, 2014, filed on May 2, 2014 (SEC File No. 000-26844). | |
10.29* | Form of Notice of Stock Option Grant for non-employee directors for the Radisys Corporation 2007 Stock Plan. Incorporated by reference from Exhibit 10.2 to the Company's Quarterly Report on Form 10-Q for the quarterly period ended March 31, 2014, filed on May 2, 2014 (SEC File No. 000-26844). | |
10.30* | RadiSys Corporation Long-Term Incentive Plan (as amended and restated). Incorporated by reference from Appendix C to the Company’s Proxy Statement on Schedule 14A, filed on July 6, 2010 (SEC File No. 000-26844). | |
10.31* | First Amendment to RadiSys Corporation Long-Term Incentive Plan (as amended and restated). Incorporated by reference from Exhibit 10.3 to the Company’s Current Report on Form 8-K filed on September 10, 2012 (SEC File No. 000-26844). | |
10.32* | Form of LTIP Tranche #2 Award Agreement for Performance-Based Restricted Stock Units under the RadiSys Corporation Long-Term Incentive Plan (as amended and restated). Incorporated by reference from Exhibit 10.3 to the Company’s Quarterly Report on Form 10-Q for the quarterly period ended March 31, 2014, filed on May 2, 2014 (SEC File No. 000-26844). | |
10.33* | RadiSys Corporation Inducement Stock Plan for CCPU Employees. Incorporated by reference from Exhibit 4.4 to the Company’s Registration Statement on Form S-8, filed on May 3, 2011 (SEC File No. 333-173885). | |
10.34* | Form of Notice of Option Grant for United States employees for the RadiSys Corporation Inducement Stock Plan for CCPU Employees. Incorporated by reference from Exhibit 4.5 to the Company’s Registration Statement on Form S-8, filed on May 3, 2011 (SEC File No. 333-173885). | |
10.35* | Form of Notice of Option Grant for international employees for the RadiSys Corporation Inducement Stock Plan for CCPU Employees. Incorporated by reference from Exhibit 4.6 to the Company’s Registration Statement on Form S-8, filed on May 3, 2011 (SEC File No. 333-173885). | |
10.36* | Form of Restricted Stock Unit Grant Agreement for United States employees for the RadiSys Corporation Inducement Stock Plan for CCPU Employees. Incorporated by reference from Exhibit 4.7 to the Company’s Registration Statement on Form S-8, filed on May 3, 2011 (SEC File No. 333-173885). | |
10.37* | Form of Restricted Stock Unit Grant Agreement for international employees for the RadiSys Corporation Inducement Stock Plan for CCPU Employees. Incorporated by reference from Exhibit 4.8 to the Company’s Registration Statement on Form S-8, filed on May 3, 2011 (SEC File No. 333-173885). | |
10.38* | Sixth Amended and Restated Continuous Computing Corporation 1998 Stock Incentive Plan. Incorporated by reference from Exhibit 4.4 to the Company’s Registration Statement on Form S-8, filed on July 13, 2011 (SEC File No. 333-175510). | |
10.39* | Amendment to Sixth Amended and Restated Continuous Computing Corporation 1998 Stock Incentive Plan, dated June 23, 2011. Incorporated by reference from Exhibit 4.5 to the Company’s Registration Statement on Form S-8, filed on July 13, 2011 (SEC File No. 333-175510). | |
10.40* | Amendment to Sixth Amended and Restated Continuous Computing Corporation 1998 Stock Incentive Plan, dated July 6, 2011. Incorporated by reference from Exhibit 4.6 to the Company’s Registration Statement on Form S-8, filed on July 13, 2011 (SEC File No. 333-175510). | |
10.41* | Notice of Option Assumption and Conversion under the Sixth Amended and Restated Continuous Computing Corporation 1998 Stock Incentive Plan for U.S. employees. Incorporated by reference from Exhibit 4.7 to the Company’s Registration Statement on Form S-8, filed on July 13, 2011 (SEC File No. 333-175510). | |
10.42* | Notice of Option Assumption and Conversion under the Sixth Amended and Restated Continuous Computing Corporation 1998 Stock Incentive Plan for non-U.S. employees. Incorporated by reference from Exhibit 4.8 to the Company’s Registration Statement on Form S-8, filed on July 13, 2011 (SEC File No. 333-175510). | |
10.43* | Amended and Restated Executive Change of Control Agreement, dated October 1, 2012, between the Company and Brian Bronson. Incorporated by reference from Exhibit 10.2 to the Company’s Current Report on Form 8-K filed on October 2, 2012 (SEC File No. 000-26844). | |
87
Exhibit No | Description | |
10.44* | Amended and Restated Executive Severance Agreement, dated October 1, 2012, between the Company and Brian Bronson. Incorporated by reference from Exhibit 10.1 to the Company’s Current Report on Form 8-K filed on October 2, 2012 (SEC File No. 000-26844). | |
10.45* | Amended and Restated Executive Change of Control Agreement, dated February 1, 2013, between the Company and Allen Muhich. Incorporated by reference from Exhibit 10.2 to the Company’s Current Report on Form 8-K filed on February 6, 2013 (SEC File No. 000-26844). | |
10.46* | Amended and Restated Executive Severance Agreement, dated February 1, 2013, between the Company and Allen Muhich. Incorporated by reference from Exhibit 10.1 to the Company’s Current Report on Form 8-K filed on February 6, 2013 (SEC File No. 000-26844). | |
10.47* | Executive Change of Control Agreement, dated August 2, 2012, between the Company and Fred Barden. Incorporated by reference from Exhibit 10.1 to the Company’s Quarterly Report on Form 10-Q for the quarterly period ended September 30, 2012, filed on November 2, 2012 (SEC File No. 000-26844). | |
10.48* | Amended and Restated Executive Severance Agreement, dated August 2, 2012, between the Company and Fred Barden. Incorporated by reference from Exhibit 10.2 to the Company’s Quarterly Report on Form 10-Q for the quarterly period ended September 30, 2012, filed on November 2, 2012 (SEC File No. 000-26844). | |
10.49* | Executive Change of Control Agreement, dated August 1, 2012, between the Company and Keate Despain. Incorporated by reference from Exhibit 10.3 to the Company’s Quarterly Report on Form 10-Q for the quarterly period ended September 30, 2012, filed on November 2, 2012 (SEC File No. 000-26844). | |
10.50* | Executive Severance Agreement, dated August 1, 2012, between the Company and Keate Despain. Incorporated by reference from Exhibit 10.4 to the Company’s Quarterly Report on Form 10-Q for the quarterly period ended September 30, 2012, filed on November 2, 2012 (SEC File No. 000-26844). | |
10.51* | Amended and Restated Executive Change of Control Agreement, dated August 3, 2012, between the Company and Amit Agarwal. Incorporated by reference from Exhibit 10.5 to the Company’s Quarterly Report on Form 10-Q for the quarterly period ended September 30, 2012, filed on November 2, 2012 (SEC File No. 000-26844). | |
10.52* | Amended and Restated Executive Severance Agreement, dated August 3, 2012, between the Company and Amit Agarwal. Incorporated by reference from Exhibit 10.6 to the Company’s Quarterly Report on Form 10-Q for the quarterly period ended September 30, 2012, filed on November 2, 2012 (SEC File No. 000-26844). | |
10.53* | Form of Indemnity Agreement for directors and officers of the Company. Incorporated by reference from Exhibit 10.23 to the Company’s Annual Report on Form 10-K for the year ended December 31, 2006, filed on March 2, 2007. | |
10.54* | Transition Agreement, dated January 10, 2014, between the Company and Amit Agarwal. Incorporated by reference from Exhibit 10.52 to the Company's Annual Report on Form 10-K for the year ended December 31, 2013, filed on March 14, 2014 (SEC File No. 000-26844). | |
10.55* | Executive Change of Control Agreement, dated October 23, 2013, between the Company and Stephen T. Collins. Incorporated by reference from Exhibit 10.53 to the Company's Annual Report on Form 10-K for the year ended December 31, 2013, filed on March 14, 2014 (SEC File No. 000-26844). | |
10.56* | Executive Severance Agreement, dated October 23, 2013, between the Company and Stephen T. Collins. Incorporated by reference from Exhibit 10.54 to the Company's Annual Report on Form 10-K for the year ended December 31, 2013, filed on March 14, 2014 (SEC File No. 000-26844). | |
10.57* | Employment Agreement, dated March 9, 2010, by and between Radisys Corporation and Grant Henderson. Incorporated by reference from Exhibit 10.1 to the Company's Quarterly Report on Form 10-Q for the quarterly period ended September 30, 2014, filed November 7, 2014 (SEC File No. 000-26844). | |
10.58 | Form of Indemnification Agreement (for directors and the CEO/CFO). Incorporated by reference from Exhibit 10.1 to the Company’s Current Report on Form 8-K filed on December 14, 2011 (SEC File No. 000-26844). | |
10.59 | Form of Indemnification Agreement (for certain executive officers). Incorporated by reference from Exhibit 10.2 to the Company’s Current Report on Form 8-K filed on December 14, 2011 (SEC File No. 000-26844). | |
10.60 | Dawson Creek II Lease, dated March 21, 1997, incorporated by reference from Exhibit 10.1 to the Company’s Quarterly Report on Form 10-Q for the quarterly period ended June 30, 1997, filed on August 13, 1997 (SEC File No. 000-26844). | |
88
Exhibit No | Description | |
10.61 | Form of Subscription Agreement, dated June 20, 2012, by and between the Company and each participating holder. Incorporated by reference from Exhibit 10.1 to the Company’s Current Report on Form 8-K filed on June 26, 2012 (SEC File No. 000-26844). | |
10.62 | Form of Registration Rights Agreement, dated June 29, 2012, by and between the Company and each participating holder. Incorporated by reference from Exhibit 10.1 to the Company’s Current Report on Form 8-K filed on July 2, 2012 (SEC File No. 000-26844). | |
10.63 | Second Amended and Restated Loan and Security Agreement, dated July 29, 2013, between Radisys Corporation and Silicon Valley Bank. Incorporated by reference from Exhibit 10.1 to the Company's Current Report on Form 8-K filed on July 30, 2013 (SEC File No. 000-26844). | |
10.64 | Amendment No. 1 to Second Amended and Restated Loan and Security Agreement, dated November 4, 2013, between Radisys Corporation and Silicon Valley Bank. Incorporated by reference from Exhibit 10.1 to the Company's Current Report on Form 8-K filed on November 4, 2013 (SEC File No. 000-26844). | |
10.65 | Amendment No. 2 to Second Amended and Restated Loan and Security Agreement, dated February 10, 2014, between Radisys Corporation and Silicon Valley Bank. Incorporated by reference from Exhibit 10.1 to the Company's Current Report on Form 8-K filed on February 11, 2014 (SEC File No. 000-26844). | |
10.66 | Third Amended and Restated Loan and Security Agreement, dated March 14, 2014, between Radisys Corporation and Silicon Valley Bank. Incorporated by reference from Exhibit 10.63 to the Company's Current Report on Form 10-K for the year ended December 31, 2013 filed on March 14, 2014 (SEC File No. 000-26844). | |
10.67 | Amendment No. 1 to the Third Amended and Restated Loan and Security Agreement, dated May 30, 2014, between Radisys Corporation and Silicon Valley Bank. Incorporated by reference from Exhibit 10.1 to the Company's Current Report on Form 8-K filed on June 3, 2014 (SEC File No. 000-26844). | |
10.68 | Letter Agreement, dated July 9, 2014, between Radisys Corporation and Silicon Valley Bank. Incorporated by reference from Exhibit 10.2 to the Company's Quarterly Report on Form 10-Q for the quarterly period ended June 30, 2014, filed on August 6, 2014 (SEC File No. 000-26844). | |
12** | Computation of Ratio of Earnings to Fixed Charges. | |
21.1** | List of Subsidiaries. | |
23.1** | Consent of KPMG LLP. | |
31.1** | Certification of the Chief Executive Officer required by Rule 13a-14(a) or Rule 15d-14(a) of the Exchange Act pursuant to Section 302 of the Sarbanes-Oxley Act of 2002. | |
31.2** | Certification of the Chief Financial Officer required by Rule 13a-14(a) or Rule 15d-14(a) of the Exchange Act pursuant to Section 302 of the Sarbanes-Oxley Act of 2002. | |
32.1*** | Certification of the Chief Executive Officer pursuant to 18 U.S.C. Section 1350, as adopted pursuant to Section 906 of the Sarbanes-Oxley Act of 2002. | |
32.2*** | Certification of the Chief Financial Officer pursuant to 18 U.S.C. Section 1350, as adopted pursuant to Section 906 of the Sarbanes-Oxley Act of 2002. | |
101.INS** | XBRL Instance Document | |
101.SCH** | XBRL Taxonomy Extension Schema | |
101.CAL** | XBRL Taxonomy Extension Calculation Linkbase | |
101.LAB** | XBRL Taxonomy Extension Label Linkbase | |
101.PRE** | XBRL Taxonomy Presentation Linkbase | |
101.DEF** | XBRL Taxonomy Definition Linkbase | |
89
* | This Exhibit constitutes a management contract or compensatory plan or arrangement. |
** | Filed herewith. |
*** | Furnished herewith. |
(b) See (a) (3) above.
(c) See (a) (2) above.
90
SIGNATURES
Pursuant to the requirements of Section 13 or 15(d) of the Securities Exchange Act of 1934, the registrant has duly caused this report to be signed on its behalf by the undersigned, thereunto duly authorized.
RADISYS CORPORATION | ||
By: | /s/ Brian Bronson | |
Brian Bronson | ||
Chief Executive Officer and President | ||
Dated: February 27, 2015
Pursuant to the requirements of the Securities Exchange Act of 1934, this report has been signed below by the following persons on behalf of the Registrant and in the capacities indicated on February 27, 2015.
Signature | Title | |
/s/ Brian Bronson | Chief Executive Officer, President, and Director | |
Brian Bronson | (Principal Executive Officer) | |
/s/ Jonathan Wilson | Chief Financial Officer, Vice President of Finance, and Secretary | |
Jonathan Wilson | (Principal Financial and Accounting Officer) | |
Directors: | ||
/s/ C. Scott Gibson | Chairman of the Board and Director | |
C. Scott Gibson | ||
/s/ Hubert de Pesquidoux | Director | |
Hubert de Pesquidoux | ||
/s/ Niel Ransom | Director | |
Niel Ransom | ||
/s/ Lorene K. Steffes | Director | |
Lorene K. Steffes | ||
/s/ Vincent H. Tobkin | Director | |
Vincent H. Tobkin | ||
91
EXHIBIT INDEX
Exhibit No | Description | |
2.1 | Amended and Restated Asset Purchase Agreement, dated September 12, 2007, by and between the Company and Intel Corporation. Incorporated by reference from Exhibit 2.1 to the Company’s Current Report on Form 8-K/A, filed on November 1, 2007 (SEC File No. 000-26844). | |
2.2 | Transition Services Agreement, dated September 12, 2007, by and between the Company and Intel Corporation (portions of the exhibit have been omitted pursuant to a request for confidential treatment to the Commission). Incorporated by reference from Exhibit 10.2 to the Company’s Quarterly Report on Form 10-Q for the quarterly period ended September 30, 2007, filed on November 8, 2007 (SEC File No. 000-26844). | |
2.3 | Warranty Services Agreement, dated September 12, 2007, by and between the Company and Intel Corporation (portions of the exhibit have been omitted pursuant to a request for confidential treatment to the Commission). Incorporated by reference from Exhibit 10.3 to the Company’s Quarterly Report on Form 10-Q for the quarterly period ended September 30, 2007, filed on November 8, 2007 (SEC File No. 000-26844). | |
2.4 | Arrangement Agreement among the Company, Convedia Corporation and RadiSys Canada Inc., effective as of July 26, 2006. Incorporated by reference from Exhibit 2.1 to the Company’s Current Report on Form 8-K filed on July 28, 2006 (SEC File No. 000-26844). | |
2.5 | Agreement and Plan of Merger, dated May 2, 2011, by and among the Company, RadiSys Holdings, Inc., Continuous Computing Corporation and Shareholder Representative Services LLC. Incorporated by reference from Exhibit 2.1 to the Company’s Current Report on Form 8-K filed on May 3, 2011 (SEC File No. 000-26844). | |
2.6 | Amendment No. 1 to Agreement and Plan of Merger, dated June 22, 2011, by and among the Company, RadiSys Holdings, Inc., Continuous Computing Corporation and Shareholder Representative Services LLC. Incorporated by reference from Exhibit 2.2 to the Company’s Current Report on Form 8-K filed on July 11, 2011 (SEC File No. 000-26844). | |
3.1 | Second Restated Articles of Incorporation and amendments thereto. Incorporated by reference from Exhibit 4.1 to the Company’s Registration Statement on Form S-8, filed on September 1, 2006 (SEC File No. 333-137060), as amended by the Articles of Amendment incorporated by reference from Exhibit 3.2 in the Company’s Current Report on Form 8-K filed on January 30, 2008 (SEC File No. 000-26844). | |
3.2 | Second Amended and Restated Bylaws and amendments thereto. Incorporated by reference from Exhibit 3.1 to the Company’s Quarterly Report on Form 10-Q for the quarterly period ended September 30, 2014, filed on November 7, 2014 (SEC File No. 000-26844). | |
4.1 | Second Restated Articles of Incorporation and amendments thereto. See Exhibit 3.1. | |
4.2 | Second Amended and Restated Bylaws and amendments thereto. See Exhibit 3.2. | |
4.3 | Specimen Common Stock Certificate. Incorporated by reference from Exhibit 4.3 to the Company’s Registration Statement on Form S-8, filed on September 1, 2006 (SEC File No. 333-137060). | |
4.4 | Indenture, dated February 12, 2008, by and between the Company and The Bank of New York Trust Company, N.A. Incorporated by reference from Exhibit 4.1 to the Company’s Current Report on Form 8-K filed on February 12, 2008 (SEC File No. 000-26844). | |
4.5 | First Supplemental Indenture, dated February 12, 2008, by and between the Company and The Bank of New York Trust Company, N.A. Incorporated by reference from Exhibit 4.2 to the Company’s Current Report on Form 8-K filed on February 12, 2008 (SEC File No. 000-26844). | |
4.6 | Form of Global Security for the 2.75% Convertible Senior Notes due 2013 (included in Exhibit 4.5). | |
4.7 | Second Supplemental Indenture, dated June 29, 2012, by and between the Company and The Bank of New York Mellon Trust Company, N.A. Incorporated by reference from Exhibit 4.1 to the Company's Current Report on Form 8-K filed on July 2, 2012 (SEC File No. 000-26844). | |
4.8 | Form of Global Security for the 4.50% Convertible Senior Notes due 2015 (included in Exhibit 4.7). | |
4.9 | Form of Debt Securities Indenture. Incorporated by reference from Exhibit 4.5 to the Company’s Registration Statement on Form S-3, filed on October 26, 2010 (SEC File No. 333-170148). | |
10.1 | Amended and Restated Asset Purchase Agreement, dated September 12, 2007, by and between the Company and Intel Corporation. See Exhibit 2.1. | |
92
Exhibit No | Description | |
10.2 | Transition Services Agreement, dated September 12, 2007, by and between the Company and Intel Corporation. See Exhibit 2.2 | |
10.3 | Warranty Services Agreement, dated September 12, 2007, by and between the Company and Intel Corporation. See Exhibit 2.3 | |
10.4* | RadiSys Corporation 1995 Stock Incentive Plan, as amended. Incorporated by reference from Exhibit (d)(1) to the Tender Offer Statement filed by the Company on Schedule TO-I, filed July 31, 2003 (SEC File No. 005-49160). | |
10.5* | Form of Notice of Stock Option Grant for the 1995 Stock Incentive Plan. Incorporated by reference from Exhibit (d)(3) to the Tender Offer Statement filed by the Company on Schedule TO-I, filed July 31, 2003 (SEC File No. 005-49160). | |
10.6* | Form of Restricted Stock Grant Agreement for the 1995 Stock Incentive Plan. Incorporated by reference from Exhibit 10.1 to the Company’s Quarterly Report on Form 10-Q for the quarterly period ended March 31, 2006, filed on May 9, 2006 (SEC File No. 000-26844). | |
10.7* | RadiSys Corporation 1996 Employee Stock Purchase Plan, as amended through June 26, 2012. Incorporated by reference from Appendix D to the Company’s Proxy Statement on Schedule 14A, filed on May 17, 2012 (SEC File No. 000-26844). | |
10.8* | RadiSys Corporation 2001 Nonqualified Stock Option Plan, as amended. Incorporated by reference from Exhibit (d)(2) to the Tender Offer Statement filed by the Company on Schedule TO-I, filed July 31, 2003 (SEC File No. 005-49160). | |
10.9* | Form of Notice of Stock Option Grant for the 2001 Nonqualified Stock Option Plan. Incorporated by reference from Exhibit (d)(4) to the Tender Offer Statement filed by the Company on Schedule TO-I, filed July 31, 2003 (SEC File No. 005-49160). | |
10.10* | Amended and Restated Radisys Corporation Deferred Compensation Plan, dated January 1, 2008. Incorporated by reference from Exhibit 10.10 to the Company's Annual Report on Form 10-K for the year ended December 31, 2013, filed on March 14, 2014 (SEC File No. 000-26844). | |
10.11* | Amendment No. 1 to Amended and Restated Radisys Corporation Deferred Compensation Plan, effective January 1 2009. Incorporated by reference from Exhibit 10.11 to the Company's Annual Report on Form 10-K for the year ended December 31, 2013, filed on March 14, 2014 (SEC File No. 000-26844). | |
10.12* | Amendment No. 2 to Amended and Restated Radisys Corporation Deferred Compensation Plan, effective January 1 2009. Incorporated by reference from Exhibit 10.12 to the Company's Annual Report on Form 10-K for the year ended December 31, 2013, filed on March 14, 2014 (SEC File No. 000-26844). | |
10.13* | Amendment No. 3 to Amended and Restated Radisys Corporation Deferred Compensation Plan, effective January 1 2009. Incorporated by reference from Exhibit 10.13 to the Company's Annual Report on Form 10-K for the year ended December 31, 2013, filed on March 14, 2014 (SEC File No. 000-26844). | |
10.14* | RadiSys Corporation Stock Plan for Convedia Employees. Incorporated by reference from Exhibit 4.4 to the Company’s Registration Statement on Form S-8, filed on September 1, 2006 (SEC File No. 333-137060). | |
10.15* | Form of Notice of Option Grant for United States employees for the RadiSys Corporation Stock Plan for Convedia Employees. Incorporated by reference from Exhibit 4.5 to the Company’s Registration Statement on Form S-8, filed on September 1, 2006 (SEC File No. 333-137060). | |
10.16* | Form of Notice of Option Grant for Canada employees for the RadiSys Corporation Stock Plan for Convedia Employees. Incorporated by reference from Exhibit 4.6 to the Company’s Registration Statement on Form S-8 filed on September 1, 2006 (SEC File No. 333-137060). | |
10.17* | Form of Notice of Option Grant for international employees for the RadiSys Corporation Stock Plan for Convedia Employees. Incorporated by reference from Exhibit 4.7 to the Company’s Registration Statement on Form S-8, filed on September 1, 2006 (SEC File No. 333-137060). | |
10.18* | Form of Notice of Option Grant for China employees for the RadiSys Corporation Stock Plan for Convedia Employees. Incorporated by reference from Exhibit 4.8 to the Company’s Registration Statement on Form S-8, filed on September 1, 2006 (SEC File No. 333-137060). | |
10.19* | Form of Restricted Stock Grant Agreement for the RadiSys Corporation Stock Plan for Convedia Employees. Incorporated by reference from Exhibit 4.9 to the Company’s Registration Statement on Form S-8, filed on September 1, 2006 (SEC File No. 333-137060). | |
93
Exhibit No | Description | |
10.20* | Form of Restricted Stock Unit Grant Agreement for the RadiSys Corporation Stock Plan for Convedia Employees. Incorporated by reference from Exhibit 4.10 to the Company’s Registration Statement on Form S-8, filed on September 1, 2006 (SEC File No. 333-137060). | |
10.21* | RadiSys Corporation 2007 Stock Plan, as amended through June 26, 2012. Incorporated by reference from Appendix C to the Company’s Proxy Statement on Schedule 14A, filed on May 17, 2012 (SEC File No. 000-26844). | |
10.22* | Form of Overlay Plan Award Agreement for Performance-Based Restricted Stock Units under the RadiSys Corporation 2007 Stock Plan. Incorporated by reference from Exhibit 10.1 to the Company’s Current Report on Form 8-K filed on September 10, 2012 (SEC File No. 000-26844). | |
10.23* | Form of Notice of Option Grant for United States employees for the RadiSys Corporation 2007 Stock Plan. Incorporated by reference from Exhibit 4.5 to the Company’s Registration Statement on Form S-8, filed on May 15, 2007 (SEC File No. 333-142968). | |
10.24* | Form of Notice of Option Grant for Canada employees for the RadiSys Corporation 2007 Stock Plan. Incorporated by reference from Exhibit 4.6 to the Company’s Registration Statement on Form S-8, filed on May 15, 2007 (SEC File No. 333-142968). | |
10.25* | Form of Notice of Option Grant for China employees for the RadiSys Corporation 2007 Stock Plan. Incorporated by reference from Exhibit 4.7 to the Company’s Registration Statement on Form S-8, filed on May 15, 2007 (SEC File No. 333-142968). | |
10.26* | Form of Notice of Option Grant for international employees for the RadiSys Corporation 2007 Stock Plan. Incorporated by reference from Exhibit 4.8 to the Company’s Registration Statement on Form S-8, filed on May 15, 2007 (SEC File No. 333-142968). | |
10.27* | Form of Restricted Stock Unit Grant Agreement for the RadiSys Corporation 2007 Stock Plan. Incorporated by reference from Exhibit 4.9 to the Company’s Registration Statement on Form S-8, filed on May 15, 2007 (SEC File No. 333-142968). | |
10.28* | Form of Restricted Stock Unit Grant Agreement for non-employee Board of Directors for the Radisys Corporation 2007 Stock Plan. Incorporated by reference from Exhibit 10.1 to the Company's Quarterly Report on Form 10-Q for the quarterly period ended March 31, 2014, filed on May 2, 2014 (SEC File No. 000-26844). | |
10.29* | Form of Notice of Stock Option Grant for non-employee directors for the Radisys Corporation 2007 Stock Plan. Incorporated by reference from Exhibit 10.2 to the Company's Quarterly Report on Form 10-Q for the quarterly period ended March 31, 2014, filed on May 2, 2014 (SEC File No. 000-26844). | |
10.30* | RadiSys Corporation Long-Term Incentive Plan (as amended and restated). Incorporated by reference from Appendix C to the Company’s Proxy Statement on Schedule 14A, filed on July 6, 2010 (SEC File No. 000-26844). | |
10.31* | First Amendment to RadiSys Corporation Long-Term Incentive Plan (as amended and restated). Incorporated by reference from Exhibit 10.3 to the Company’s Current Report on Form 8-K filed on September 10, 2012 (SEC File No. 000-26844). | |
10.32* | Form of LTIP Tranche #2 Award Agreement for Performance-Based Restricted Stock Units under the RadiSys Corporation Long-Term Incentive Plan (as amended and restated). Incorporated by reference from Exhibit 10.3 to the Company’s Quarterly Report on Form 10-Q for the quarterly period ended March 31, 2014, filed on May 2, 2014 (SEC File No. 000-26844). | |
10.33* | RadiSys Corporation Inducement Stock Plan for CCPU Employees. Incorporated by reference from Exhibit 4.4 to the Company’s Registration Statement on Form S-8, filed on May 3, 2011 (SEC File No. 333-173885). | |
10.34* | Form of Notice of Option Grant for United States employees for the RadiSys Corporation Inducement Stock Plan for CCPU Employees. Incorporated by reference from Exhibit 4.5 to the Company’s Registration Statement on Form S-8, filed on May 3, 2011 (SEC File No. 333-173885). | |
10.35* | Form of Notice of Option Grant for international employees for the RadiSys Corporation Inducement Stock Plan for CCPU Employees. Incorporated by reference from Exhibit 4.6 to the Company’s Registration Statement on Form S-8, filed on May 3, 2011 (SEC File No. 333-173885). | |
10.36* | Form of Restricted Stock Unit Grant Agreement for United States employees for the RadiSys Corporation Inducement Stock Plan for CCPU Employees. Incorporated by reference from Exhibit 4.7 to the Company’s Registration Statement on Form S-8, filed on May 3, 2011 (SEC File No. 333-173885). | |
94
Exhibit No | Description | |
10.37* | Form of Restricted Stock Unit Grant Agreement for international employees for the RadiSys Corporation Inducement Stock Plan for CCPU Employees. Incorporated by reference from Exhibit 4.8 to the Company’s Registration Statement on Form S-8, filed on May 3, 2011 (SEC File No. 333-173885). | |
10.38* | Sixth Amended and Restated Continuous Computing Corporation 1998 Stock Incentive Plan. Incorporated by reference from Exhibit 4.4 to the Company’s Registration Statement on Form S-8, filed on July 13, 2011 (SEC File No. 333-175510). | |
10.39* | Amendment to Sixth Amended and Restated Continuous Computing Corporation 1998 Stock Incentive Plan, dated June 23, 2011. Incorporated by reference from Exhibit 4.5 to the Company’s Registration Statement on Form S-8, filed on July 13, 2011 (SEC File No. 333-175510). | |
10.40* | Amendment to Sixth Amended and Restated Continuous Computing Corporation 1998 Stock Incentive Plan, dated July 6, 2011. Incorporated by reference from Exhibit 4.6 to the Company’s Registration Statement on Form S-8, filed on July 13, 2011 (SEC File No. 333-175510). | |
10.41* | Notice of Option Assumption and Conversion under the Sixth Amended and Restated Continuous Computing Corporation 1998 Stock Incentive Plan for U.S. employees. Incorporated by reference from Exhibit 4.7 to the Company’s Registration Statement on Form S-8, filed on July 13, 2011 (SEC File No. 333-175510). | |
10.42* | Notice of Option Assumption and Conversion under the Sixth Amended and Restated Continuous Computing Corporation 1998 Stock Incentive Plan for non-U.S. employees. Incorporated by reference from Exhibit 4.8 to the Company’s Registration Statement on Form S-8, filed on July 13, 2011 (SEC File No. 333-175510). | |
10.43* | Amended and Restated Executive Change of Control Agreement, dated October 1, 2012, between the Company and Brian Bronson. Incorporated by reference from Exhibit 10.2 to the Company’s Current Report on Form 8-K filed on October 2, 2012 (SEC File No. 000-26844). | |
10.44* | Amended and Restated Executive Severance Agreement, dated October 1, 2012, between the Company and Brian Bronson. Incorporated by reference from Exhibit 10.1 to the Company’s Current Report on Form 8-K filed on October 2, 2012 (SEC File No. 000-26844). | |
10.45* | Amended and Restated Executive Change of Control Agreement, dated February 1, 2013, between the Company and Allen Muhich. Incorporated by reference from Exhibit 10.2 to the Company’s Current Report on Form 8-K filed on February 6, 2013 (SEC File No. 000-26844). | |
10.46* | Amended and Restated Executive Severance Agreement, dated February 1, 2013, between the Company and Allen Muhich. Incorporated by reference from Exhibit 10.1 to the Company’s Current Report on Form 8-K filed on February 6, 2013 (SEC File No. 000-26844). | |
10.47* | Executive Change of Control Agreement, dated August 2, 2012, between the Company and Fred Barden. Incorporated by reference from Exhibit 10.1 to the Company’s Quarterly Report on Form 10-Q for the quarterly period ended September 30, 2012, filed on November 2, 2012 (SEC File No. 000-26844). | |
10.48* | Amended and Restated Executive Severance Agreement, dated August 2, 2012, between the Company and Fred Barden. Incorporated by reference from Exhibit 10.2 to the Company’s Quarterly Report on Form 10-Q for the quarterly period ended September 30, 2012, filed on November 2, 2012 (SEC File No. 000-26844). | |
10.49* | Executive Change of Control Agreement, dated August 1, 2012, between the Company and Keate Despain. Incorporated by reference from Exhibit 10.3 to the Company’s Quarterly Report on Form 10-Q for the quarterly period ended September 30, 2012, filed on November 2, 2012 (SEC File No. 000-26844). | |
10.50* | Executive Severance Agreement, dated August 1, 2012, between the Company and Keate Despain. Incorporated by reference from Exhibit 10.4 to the Company’s Quarterly Report on Form 10-Q for the quarterly period ended September 30, 2012, filed on November 2, 2012 (SEC File No. 000-26844). | |
10.51* | Amended and Restated Executive Change of Control Agreement, dated August 3, 2012, between the Company and Amit Agarwal. Incorporated by reference from Exhibit 10.5 to the Company’s Quarterly Report on Form 10-Q for the quarterly period ended September 30, 2012, filed on November 2, 2012 (SEC File No. 000-26844). | |
10.52* | Amended and Restated Executive Severance Agreement, dated August 3, 2012, between the Company and Amit Agarwal. Incorporated by reference from Exhibit 10.6 to the Company’s Quarterly Report on Form 10-Q for the quarterly period ended September 30, 2012, filed on November 2, 2012 (SEC File No. 000-26844). | |
95
Exhibit No | Description | |
10.53* | Form of Indemnity Agreement for directors and officers of the Company. Incorporated by reference from Exhibit 10.23 to the Company’s Annual Report on Form 10-K for the year ended December 31, 2006, filed on March 2, 2007. | |
10.54* | Transition Agreement, dated January 10, 2014, between the Company and Amit Agarwal. Incorporated by reference from Exhibit 10.52 to the Company's Annual Report on Form 10-K for the year ended December 31, 2013, filed on March 14, 2014 (SEC File No. 000-26844). | |
10.55* | Executive Change of Control Agreement, dated October 23, 2013, between the Company and Stephen T. Collins. Incorporated by reference from Exhibit 10.53 to the Company's Annual Report on Form 10-K for the year ended December 31, 2013, filed on March 14, 2014 (SEC File No. 000-26844). | |
10.56* | Executive Severance Agreement, dated October 23, 2013, between the Company and Stephen T. Collins. Incorporated by reference from Exhibit 10.54 to the Company's Annual Report on Form 10-K for the year ended December 31, 2013, filed on March 14, 2014 (SEC File No. 000-26844). | |
10.57* | Employment Agreement, dated March 9, 2010, by and between Radisys Corporation and Grant Henderson. Incorporated by reference from Exhibit 10.1 to the Company's Quarterly Report on Form 10-Q for the quarterly period ended September 30, 2014, filed November 7, 2014 (SEC File No. 000-26844). | |
10.58 | Form of Indemnification Agreement (for directors and the CEO/CFO). Incorporated by reference from Exhibit 10.1 to the Company’s Current Report on Form 8-K filed on December 14, 2011 (SEC File No. 000-26844). | |
10.59 | Form of Indemnification Agreement (for certain executive officers). Incorporated by reference from Exhibit 10.2 to the Company’s Current Report on Form 8-K filed on December 14, 2011 (SEC File No. 000-26844). | |
10.60 | Dawson Creek II Lease, dated March 21, 1997, incorporated by reference from Exhibit 10.1 to the Company’s Quarterly Report on Form 10-Q for the quarterly period ended June 30, 1997, filed on August 13, 1997 (SEC File No. 000-26844). | |
10.61 | Form of Subscription Agreement, dated June 20, 2012, by and between the Company and each participating holder. Incorporated by reference from Exhibit 10.1 to the Company’s Current Report on Form 8-K filed on June 26, 2012 (SEC File No. 000-26844). | |
10.62 | Form of Registration Rights Agreement, dated June 29, 2012, by and between the Company and each participating holder. Incorporated by reference from Exhibit 10.1 to the Company’s Current Report on Form 8-K filed on July 2, 2012 (SEC File No. 000-26844). | |
10.63 | Second Amended and Restated Loan and Security Agreement, dated July 29, 2013, between Radisys Corporation and Silicon Valley Bank. Incorporated by reference from Exhibit 10.1 to the Company's Current Report on Form 8-K filed on July 30, 2013 (SEC File No. 000-26844). | |
10.64 | Amendment No. 1 to Second Amended and Restated Loan and Security Agreement, dated November 4, 2013, between Radisys Corporation and Silicon Valley Bank. Incorporated by reference from Exhibit 10.1 to the Company's Current Report on Form 8-K filed on November 4, 2013 (SEC File No. 000-26844). | |
10.65 | Amendment No. 2 to Second Amended and Restated Loan and Security Agreement, dated February 10, 2014, between Radisys Corporation and Silicon Valley Bank. Incorporated by reference from Exhibit 10.1 to the Company's Current Report on Form 8-K filed on February 11, 2014 (SEC File No. 000-26844). | |
10.66 | Third Amended and Restated Loan and Security Agreement, dated March 14, 2014, between Radisys Corporation and Silicon Valley Bank. Incorporated by reference from Exhibit 10.63 to the Company's Current Report on Form 10-K for the year ended December 31, 2013 filed on March 14, 2014 (SEC File No. 000-26844). | |
10.67 | Amendment No. 1 to the Third Amended and Restated Loan and Security Agreement, dated May 30, 2014, between Radisys Corporation and Silicon Valley Bank. Incorporated by reference from Exhibit 10.1 to the Company's Current Report on Form 8-K filed on June 3, 2014 (SEC File No. 000-26844). | |
10.68 | Letter Agreement, dated July 9, 2014, between Radisys Corporation and Silicon Valley Bank. Incorporated by reference from Exhibit 10.2 to the Company's Quarterly Report on Form 10-Q for the quarterly period ended June 30, 2014, filed on August 6, 2014 (SEC File No. 000-26844). | |
12** | Computation of Ratio of Earnings to Fixed Charges. | |
21.1** | List of Subsidiaries. | |
96
Exhibit No | Description | |
23.1** | Consent of KPMG LLP. | |
31.1** | Certification of the Chief Executive Officer required by Rule 13a-14(a) or Rule 15d-14(a) of the Exchange Act pursuant to Section 302 of the Sarbanes-Oxley Act of 2002. | |
31.2** | Certification of the Chief Financial Officer required by Rule 13a-14(a) or Rule 15d-14(a) of the Exchange Act pursuant to Section 302 of the Sarbanes-Oxley Act of 2002. | |
32.1*** | Certification of the Chief Executive Officer pursuant to 18 U.S.C. Section 1350, as adopted pursuant to Section 906 of the Sarbanes-Oxley Act of 2002. | |
32.2*** | Certification of the Chief Financial Officer pursuant to 18 U.S.C. Section 1350, as adopted pursuant to Section 906 of the Sarbanes-Oxley Act of 2002. | |
101.INS** | XBRL Instance Document | |
101.SCH** | XBRL Taxonomy Extension Schema | |
101.CAL** | XBRL Taxonomy Extension Calculation Linkbase | |
101.LAB** | XBRL Taxonomy Extension Label Linkbase | |
101.PRE** | XBRL Taxonomy Presentation Linkbase | |
101.DEF** | XBRL Taxonomy Definition Linkbase | |
* | This Exhibit constitutes a management contract or compensatory plan or arrangement. |
** | Filed herewith. |
*** | Furnished herewith. |
97