Attached files
| file | filename |
|---|---|
| EX-21.1 - EX-21.1 - Monotype Imaging Holdings Inc. | d843908dex211.htm |
| EX-31.2 - EX-31.2 - Monotype Imaging Holdings Inc. | d843908dex312.htm |
| EX-23.1 - EX-23.1 - Monotype Imaging Holdings Inc. | d843908dex231.htm |
| EX-32.1 - EX-32.1 - Monotype Imaging Holdings Inc. | d843908dex321.htm |
| EX-31.1 - EX-31.1 - Monotype Imaging Holdings Inc. | d843908dex311.htm |
| EXCEL - IDEA: XBRL DOCUMENT - Monotype Imaging Holdings Inc. | Financial_Report.xls |
Table of Contents
UNITED STATES
SECURITIES AND EXCHANGE COMMISSION
Washington, D.C. 20549
FORM 10-K
| þ | ANNUAL REPORT PURSUANT TO SECTION 13 OR 15(d) OF THE SECURITIES EXCHANGE ACT OF 1934 |
For the fiscal year ended December 31, 2014
| ¨ | TRANSITION REPORT PURSUANT TO SECTION 13 OR 15(d) OF THE SECURITIES EXCHANGE ACT OF 1934 |
For the transition period from to
Commission File Number 001-33612
MONOTYPE IMAGING HOLDINGS INC.
(Exact name of registrant as specified in its charter)
| Delaware | 20-3289482 | |
| (State of incorporation) | (I.R.S. Employer Identification No.) | |
| 600 Unicorn Park Drive Woburn, Massachusetts |
01801 | |
| (Address of principal executive offices) | (Zip Code) | |
Registrant’s telephone number, including area code: (781) 970-6000
Securities Registered Pursuant to Section 12(b) of the Act:
| Title of Each Class |
Name of Exchange on Which Registered | |
| Common Stock, $0.001 par value | The NASDAQ Stock Market LLC |
Securities Registered Pursuant to Section 12(g) of the Act:
None
Indicate by check mark if the registrant is a well-known seasoned issuer, as defined in Rule 405 of the Securities Act. Yes þ No ¨
Indicate by check mark if the registrant is not required to file reports pursuant to Section 13 or 15(d) of the Act. Yes ¨ No þ
Indicate by check mark whether the registrant (1) has filed all reports required to be filed by Section 13 or 15(d) of the Securities Exchange Act of 1934 during the preceding 12 months (or such shorter period that the registrant was required to file such reports), and (2) has been subject to such filing requirements for the past 90 days.
Yes þ No ¨
Indicate by check mark whether the registrant has submitted electronically and posted on its corporate Web site, if any, every Interactive Data File required to be submitted and posted pursuant to Rule 405 of Regulation S-T (§232.405 of this chapter) during the preceding 12 months (or for such shorter period that the registrant was required to submit and post such files). Yes þ No ¨
Indicate by check mark if disclosure of delinquent filers pursuant to Item 405 of Regulation S-K is not contained herein, and will not be contained, to the best of registrant’s knowledge, in definitive proxy or information statements incorporated by reference in Part III of this Form 10-K or any amendment to this Form 10-K. ¨
Indicate by check mark whether the registrant is a large accelerated filer, an accelerated filer, a non-accelerated filer, or a smaller reporting company. See the definitions of “large accelerated filer,” “accelerated filer” and “smaller reporting company” in Rule 12b-2 of the Exchange Act. (Check one):
Large accelerated filer þ Accelerated filer ¨ Non-accelerated filer ¨ Smaller reporting company ¨
Indicate by check mark whether the registrant is a shell company (as defined in Rule 12b-2 of the Act). Yes ¨ No þ
The aggregate market value of the registrant’s common stock held by non-affiliates of the registrant, computed by reference to the last reported sale price of the common stock as reported on the NASDAQ Global Select Market on June 30, 2014 was approximately $981,518,215 (assumes officers, directors, and all shareholders beneficially owning 5% or more of the outstanding common shares are affiliates).
The number of shares outstanding of the registrant’s common stock as of February 19, 2015 was approximately 39,532,666.
DOCUMENTS INCORPORATED BY REFERENCE.
Portions of the registrant’s definitive Proxy Statement to be filed with the Securities and Exchange Commission pursuant to Regulation 14A in connection with the 2014 Annual Meeting of Stockholders are incorporated herein by reference into Part III of this report.
Table of Contents
MONOTYPE IMAGING HOLDINGS INC.
| Item No. |
Page No. | |||||
| PART I | ||||||
| Item 1. | 2 | |||||
| Item 1A. | 15 | |||||
| Item 1B. | 28 | |||||
| Item 2. | 28 | |||||
| Item 3. | 28 | |||||
| Item 4. | 28 | |||||
| PART II | ||||||
| Item 5. | 29 | |||||
| Item 6. | 33 | |||||
| Item 7. | Management’s Discussion and Analysis of Financial Condition and Results of Operations |
34 | ||||
| Item 7A. | 53 | |||||
| Item 8. | 56 | |||||
| Item 9. | Changes in and Disagreements With Accountants on Accounting and Financial Disclosure |
93 | ||||
| Item 9A. | 93 | |||||
| Item 9B. | 97 | |||||
| PART III | ||||||
| Item 10. | 97 | |||||
| Item 11. | 97 | |||||
| Item 12. | Security Ownership of Certain Beneficial Owners and Management and Related Stockholder Matters |
97 | ||||
| Item 13. | Certain Relationships and Related Transactions, and Directors Independence |
97 | ||||
| Item 14. | 97 | |||||
| PART IV | ||||||
| Item 15. | 98 | |||||
| 103 | ||||||
As used in this report, the terms “we,” “us,” “our,” “Monotype” and the “Company” mean Monotype Imaging Holdings Inc. and its subsidiaries, unless the context indicates another meaning.
Unless otherwise noted, all dollar amounts in this report are expressed in United States dollars.
We own, have rights to, or have applied for the trademarks and trade names that we use in conjunction with our business, including our name and logo. All other trademarks and trade names appearing in this report are the property of their respective holders.
1
Table of Contents
PART I
| Item 1. | Business |
Certain statements in this Annual Report on Form 10-K are “forward-looking statements” within the meaning of Section 27A of the Securities Act of 1933, as amended (the “Securities Act”), and Section 21E of the Securities Exchange Act of 1934, as amended (the “Exchange Act”). These statements involve a number of risks, uncertainties and other factors that could cause our actual results, performance or achievements to be materially different from any future results, performance or achievements expressed or implied by these forward-looking statements. Factors which could materially affect such forward-looking statements can be found in the section entitled “Risk Factors” in Part 1, Item 1A in this Annual Report on Form 10-K. Investors are urged to consider these factors carefully in evaluating the forward-looking statements and are cautioned not to place undue reliance on such forward-looking statements. The forward-looking statements made herein are only made as of the date hereof and we will undertake no obligation to publicly update such forward-looking statements to reflect subsequent events or circumstances.
Overview
Monotype Imaging Holdings Inc. is a leading provider of type, technology and expertise for creative applications and consumer devices. Our vision is that our fonts and technology empower every word and experience. We strive to enable the best user experience and ensure brand integrity, regardless of device, platform or language. We help creative professionals, consumer device manufacturers and independent software vendors connect their brands, content, products and services to consumers and businesses everywhere, from content creation to consumption. Monotype is home to some of the world’s best known typeface collections. Along with our custom type services, our solutions enable customers to express their creativity, while our tools and technologies improve creative workflows and maximize efficiency as content is published or distributed. Our solutions provide worldwide language coverage and high-quality text, and our embedded solutions support compelling user interfaces and brand fidelity by providing for the display of content on any device or platform, as the author intended.
To best serve our customers, our business is organized as follows:
Creative Professional—Our focus is to help customers worldwide provide high-quality, branded content across multiple devices and mediums. Our solutions, which include type, custom design services, and tools and technologies that enable the creative process, are licensed through our direct sales channel, as well as our e-commerce platforms and indirect sales channels. We work with a wide range of customers, including brands, agencies, publishers, corporations, enterprises, small businesses and individuals.
OEM—Our focus is to provide consumer device manufacturers and independent software vendors, or ISVs, the right solutions for delivering consistent, compelling user experiences. Our solutions power the visual expression of the leading makers of a wide range of devices, including laser printers, digital copiers, mobile phones, e-book readers, tablets, automotive displays, digital cameras, navigation devices, digital televisions, set-top boxes and consumer appliances, as well as provide a high-quality text experience in numerous software applications and operating systems.
Our principal office is located in Woburn, Massachusetts, with regional offices in San Francisco and Los Altos, California; Boulder, Colorado; Elk Grove Village, Illinois; New York City, New York; Belfast, Northern Ireland; Cardiff, United Kingdom; Salfords, United Kingdom; London, United Kingdom; Bad Homburg, and Berlin, Germany (“Monotype Germany”); Noida, India; Hong Kong, China; Seoul, South Korea; and Tokyo, Japan.
Industry Overview and Market Opportunity
People and businesses face a world of unparalleled access to content. News, blogs, social media, photos, videos, movies and television shows are consumed across a growing number of devices as screens and Internet connectivity become ubiquitous. For creative professionals—including brand managers, agencies and other
2
Table of Contents
marketing professionals—who author and provide content, an important challenge is creating content once and having it distributed seamlessly and consistently to consumers everywhere, regardless of their consumption medium. Advertising professionals face a similar challenge when they design and distribute web and mobile advertising while preserving brand standards for multiple screens and devices. For device manufacturers, the challenge is creating a way that allows users to easily consume content with the look the author intended. In each case, the goal is to provide a great user experience. We serve a wide spectrum of markets from content creation, to consumption (which we refer to as the “content continuum”) with a range of products, technologies and services that make workflows more efficient, provide a choice of fonts for creativity and language coverage, and result in a great user experience.
Overarching themes that matter to these markets include:
| • | Seamlessly connecting the content continuum. Inconsistencies in design platforms, distribution networks, operating systems and device technologies make it difficult to create content once and publish it everywhere while maintaining fidelity to the author’s original design. As a result, content creators must create a single piece of content in multiple formats or bear the risk of a poor user experience. Similarly, device manufacturers are unable to guarantee a consistent user experience without investing in high-end hardware or creating a closed ecosystem. In these cases, a first sign of inconsistency is a font problem. Both content creators and content distributors need ways to connect across the components of the content continuum to ensure the best user experience. |
| • | Design matters. More than ever, design quality impacts consumer perception. Beautiful design starts with typography. Typeface choice is a major component of design that helps to set overall tone and layout. We believe brands are particularly aware of the importance of design and their responsibility for providing a consistent, high-quality, branded experience across every device and platform. When successful, content is perceived as important and valuable. |
| • | User experience. The way consumers interact with a device as well as its applications drives consumer satisfaction. In today’s multiscreen world, which offers ubiquitous connectivity to the Internet, the visual solution is as important as the technical solution. Additionally, we believe consumers – especially younger consumers – are seeking an ability to personalize their communications with a unique look and feel. |
| • | The cloud as a common platform. One approach that addresses inconsistency across devices, platforms and operating systems is to reduce reliance on the device to store and serve all information required to render content. HTML5 and CSS3 standards support the on-demand retrieval of fonts and type-related tools from the cloud. This minimizes dependence on native operating environments to provide all elements required to deliver a consistent user experience across devices. In addition, businesses and consumers are increasingly licensing applications and content using cloud subscription models as opposed to “buy-and-load-on-a-local-device” models. This shift is also helping to drive demand in responsive advertising and design solutions for creative professionals to help them ensure a consistent experience across devices and to increase engagement with the end users. |
| • | Value shift from devices to ecosystems. Any device with a connected screen allows people to consume content. Mobile phones, tablets, e-readers, automobiles and a wide range of appliances are or will be used to search for information, engage socially and access news. We believe users are increasingly deriving less value from the functionality of these devices than from the software and applications that reside either locally or are accessed via the Internet. Manufacturers are struggling to make money on the hardware and are building ecosystems to connect devices to each other and to the cloud to achieve a consistent user experience. For these OEMs, the value of embedded technologies on devices is declining and the value of combining embedded capabilities with cloud-based functionality is increasing. |
3
Table of Contents
Our customers turn to us for comprehensive, powerful and easy-to-use solutions based on our type, technology and expertise, which address the needs of three types of customers: content creators; consumer device manufacturers; and independent software vendors. These customers use our products to enhance the creation, display and consumption of digital and print content.
Content Creators
Content creators include brands, advertising agencies, graphic designers, printers, publishers, and non-professional creators of content (such as social media users, designers, bloggers and self-publishers). Content creators produce digital and/or printed material, and they seek creative ways to convey meaning and differentiate identity. Fonts are an important tool for this differentiation. For example, creative professionals at multinational corporations are increasingly tasked with creating solutions that extend their brand into new markets. The challenge is to ensure that branding efforts are reflected consistently in every communication, regardless of media. In addition, creative professionals need design tools that integrate seamlessly into their workflows, making them more efficient. Web fonts, which travel with the content to a user’s device for consistent viewing regardless of the environment, and responsive design tools, which allow designers to create content that re-scales depending on viewers’ screen size, are examples of solutions that address the needs of creative professional customers.
Consumer Device Manufacturers
Consumer devices are easily recognized as platforms for consuming content. These devices increasingly require robust multimedia functionality, as consumers create rich digital content and/or access such content from service providers, over the Internet, as packaged media and from other users. Consumer device manufacturers must display multimedia content, including text, from these different sources, while being expected to provide a consistent look-and-feel across devices, support worldwide languages and, in many cases, support enhanced personalization. As technologies enable media to move seamlessly from one device to another, scalable, multilingual type and related display solutions that are optimized for these devices become ever more critical. For example:
| • | The automotive industry is increasingly moving toward digital displays with complex, worldwide language requirements and improved legibility in an effort to help reduce driver distraction. |
| • | Digital TVs are incorporating scalable text for menu navigation, content delivery and connectivity. |
| • | Electronic publishing and the prevalence of e-book readers are driving the publishing industry’s need for robust, global text-display solutions. |
| • | PC-like rich media functionality has moved to mobile platforms, driving the adoption of scalable text on phones, tablets and similar devices. |
| • | Appliance manufacturers worldwide are adding Internet connectivity and control panels with enhanced graphical user interfaces to improve the user experience and to provide consumers with additional control and functionality. |
The market for laser printers and digital copiers is generally more mature than the rest of the consumer device market. As a result, the least expensive end of the market is becoming more commoditized. Laser printer manufacturers are responding by increasing the functionality of their products with advances such as a larger number of embedded fonts, enhanced control panel functionality, and creating new printing paradigms and services offerings, including mobile printing and managed print services. The increased capabilities are in turn driving the advancement of the printer industry, particularly the laser printer industry in emerging markets such as Asia. With this in mind, increased reliance by laser printer manufacturers on enhancing technologies to drive value, together with advancing capabilities and functionality of multimedia devices, favor comprehensive global text solutions and related technologies.
4
Table of Contents
Independent Software Vendors and Developers
Similar to consumer devices, software solutions and new cloud services are marketed globally. For example, ISVs require multilingual text solutions for product user interfaces as well as a range of type to add functionality to applications. Mobile device game developers want a distinctive and consistent typeface for their games, especially when the game is designed to run on multiple devices and consoles. In addition, developers want to customize their offerings with fonts specific to their vertical market or geographic regions.
ISVs and platform developers are distributing their solutions through multiple channels (including traditional CD-based models, as well as software-as-a-service distribution through cloud-based models) and to multiple devices (including PCs, mobile phones, game consoles, tablets and other devices). As a result, developers require font technologies that allow products to maintain a consistent, high-quality user experience regardless of distribution channel or device screen resolution.
Our Products
We develop end-user and embedded solutions and provide services that enable the display and printing of high-quality text in all of the world’s major languages, including the following:
Type
| • | The core of our business, the Monotype® Libraries comprise some of the largest and most trusted inventories of typefaces in the world. Included in the continuously expanding Monotype, Linotype®, FontFont®, ITC®, Ascender™ and Bitstream® collections, which contain more than 25,000 typefaces, are some of the world’s most well-known designs, such as the Times New Roman®, Helvetica®, Frutiger®, ITC Franklin Gothic™, FF® Meta® and Droid™ typefaces. |
| • | Our e-commerce websites including myfonts.com, fonts.com, fontshop.com, linotype.com and fontfont.com offer thousands of high-quality font products, in some cases more than 127,000, including our own libraries as well as fonts from third parties. Our sites attracted more than 77 million visits in 2014 from over 200 countries and territories. |
| • | Our Fonts.com Web Fonts service features more than 30,000 high-quality web fonts for website design. Fonts.com Web Fonts offers a superior range of fonts, language support and workflow capabilities, in addition to multiple licensing options, including subscription plans and self-hosting opportunities. Our hinted web fonts are designed especially for the online environment, providing web designers and content developers with type that upholds a high display quality in any browser. |
| • | Our font solutions for consumer device manufacturers, including our EdgeTM and SmartHintTM technologies, enable precise pixel adjustments to enable fonts to display with optimal quality in suboptimal display environments. |
| • | Our core sets of fonts for printer manufacturers consist of the PCL® (Printer Command Language) 6 and PostScript® 3 font collections. These fonts are designed for compatibility with Hewlett Packard, or HP, and Adobe Systems Incorporated, or Adobe, font specifications. |
Technology
| • | Screen Imaging Technologies |
| • | Our iType® font scaling engine renders high-quality display of text in every major language and in any size on memory-constrained devices, including, but not limited to, automotive displays, mobile phones, e-readers, tablets, set-top boxes and digital cameras, and are fully compatible with the industry-standard TrueType® and OpenType® font formats. |
5
Table of Contents
| • | Our iType Connects plug-ins streamline the process of integrating iType by providing a pre-integrated solution for common consumer device platforms. |
| • | Our WorldType® Layout Engine enables consumer devices to accurately compose, position and render multilingual text, including text composed in complex writing systems such as Indic, Arabic and Hebrew scripts. |
| • | Our WorldType Shaper product provides customers with existing layout systems the ability to integrate intelligent shaping and bi-directional capabilities to support complex scripts. |
| • | Our Monotype® Spark™ solution is a small, yet powerful type and technology solution for developing high-quality, scalable text interfaces in low-end platforms with limited run-time memory. Previously, designers and engineers were limited in their ability to create a flexible, scalable text display in low and mid-end devices like wearables, medical devices and low-to-mid-end automotive clusters, without investing a substantial amount of work or money in additional hardware or memory. Monotype Spark makes the type on these devices more beautiful and enables product manufacturers to keep development costs low and create an easy path to scale devices to support new languages and character sets in the future. |
| • | Our Edge rendering technologies preserve the look of high-quality text on a wide range of displays, even at small text sizes. Resolution and display technology such as LCD or e-paper can significantly affect the visual display of rendered text. Edge Technology encompasses Edge Tuner, the ability to “tune” the rendered output, and Edge Hinting, a method for fine-tuning individual characters. Edge Tuning and Edge Hinting help customers achieve superior visual results using scalable fonts in a low memory footprint. |
| • | Our Edge360TM technology brings advanced textual effects to 2D and 3D user interfaces, applications and games. For example, text can be zoomed in and out very quickly without having to re-render the text at the end of the zoom process. Text can be rotated in three dimensions—all while retaining clarity throughout the process. |
| • | Our SmartHint technology maintains the clarity of East Asian stroke-based fonts at any size. At small sizes, SmartHint technology preserves spatial relationships and removes strokes, if necessary, without changing the meaning of characters. |
| • | Our Type Enhancements for Android® products bring rich, high-quality text and worldwide language support to Android 4.0 devices. OEMs are able to meet a wide range of requirements, including the ability to deliver crisp, readable text in multiple languages, superior web browsing experiences and end-user personalization through user-selected fonts. |
| • | Our FlipFontTM mobile font download solution allows users to personalize and enhance the user interface and menus of their Android phones, making them more appealing and fun to use. Android handset manufacturers can enable FlipFont so users easily connect to an online selection of fonts, choose a new typeface, purchase the font, and safely download and install it. |
| • | Printer Imaging Technologies |
| • | Our Universal Font Scaling Technology, or UFST® font scaling engine, and our MicroType® font compression technology are our primary solutions for laser printer manufacturers. Our font scaling engine and font compression technologies are compatible with virtually all font formats and industry standards, including the PostScript and PCL printing languages. |
| • | Our page description language, or PDL, software offerings and complete solutions enable printer manufacturers to simplify product development, achieve faster time to market and enhance their ability to manage overall controller development costs. |
6
Table of Contents
| • | Our printer driver kits enable printer manufacturers to create customized laser printer drivers that allow applications to print as intended. |
| • | Creative Tools |
| • | Membership by Monotype is a subscription program that offers unlimited and instantaneous typeface experimentation, a library that supports web and print design, and a clear-cut licensing model. Membership is designed to give brands and agencies the flexibility and dependability they need to create beautiful, consistent brand expressions across every medium. Depending on their membership level, subscribers can install an unlimited number of desktop fonts from a selection of more than 17,000 fonts from the Monotype Libraries. Every typeface is available in both web and desktop formats, so subscribers never have to compromise their brand as they move between digital and print. |
| • | Unique to our Fonts.com Web Fonts service is a selection of desktop fonts that may be downloaded each month by Pro and Master subscribers for satisfying their digital and print needs. With our top-tier Master plan, subscribers receive an unlimited number of desktop fonts, along with the more than 30,000 Web fonts and over 9,000 typefaces for use in desktop design applications. |
| • | Our web fonts extension for Adobe® Photoshop® CC and version CS5 or higher enables users to proof and prototype their work without leaving their application. The extension allows the use of our high-quality web fonts for greater quality and accuracy, and is accessible within the Photoshop canvas. |
| • | Our FontGazerTM plug-in allows users to search, purchase and install new typefaces without having to close or turn away from an open Adobe InDesign® file. |
| • | Our TypecastTM application is an award-winning browser-based tool that enables designers to create working web page prototypes using simple visual controls. With the Typecast application, designers can easily draft copy, compare fonts side-by-side, publish and share projects for feedback and review, and easily export production-ready HTML and CSS. |
| • | Cloud-based Technology Platform |
| • | Our Monotype BaselineTM Platform provides developers with cloud-based access to our font libraries, so OEMs and ISVs can integrate features that automate the process of finding and fixing missing fonts, resulting in a user experience that matches the original intention of the content creator, regardless of device, platform or media. |
| • | Our SkyFontsTM technology is a patent-pending, lightweight utility that runs in the background of Macintosh® or PC workstations, allowing for the temporary installation of desktop fonts and the ability to sync them on up to five workstations. SkyFonts is integrated into Fonts.com, Google Fonts, MyFonts.com and Membership by Monotype. Paired with these services, SkyFonts provides effortless access to thousands of quality typefaces to browse, try, and install typefaces almost instantly. |
| • | Font Management |
| • | Our FontExplorer® X Pro and FontExplorer X Server font management solutions provide powerful, flexible and easy-to-use capabilities for managing and accessing fonts. |
| • | Our Fontwise® product is a comprehensive font license management solution that allows creative and business professionals to audit, manage and purchase font licenses. |
Expertise
| • | Our Monotype Studio provides expert consultation and custom type design services to help customers articulate their distinctive brand value through type. We have strong relationships |
7
Table of Contents
| with a broad network of highly talented font designers. Working directly with clients and through branding agencies, our type design experts have developed the branding fonts used by many Fortune 1000 companies. |
Competitive Strengths
We are a leading global provider of type, technology and expertise that enable the best user experiences and ensure brand integrity. Our core strengths include:
Type. Our Monotype Libraries comprised of the Monotype, Linotype, ITC, Ascender, FontFont and Bitstream type collections, are some of the world’s best known inventories of type. Our selection is continuously expanding, adding even more fonts from some of the world’s best type designers. Today, we offer more than 25,000 typeface designs, featuring a rich blend of timeless classics and cutting-edge designs, which support more than 250 Latin and non-Latin languages. Our hinted web fonts provide web designers and content developers with type that displays with high-quality in any browser. Our hinting and rendering technologies for consumer devices ensure high-quality display on any screen, regardless of text size or language used. Our solutions for printer manufacturers ensure high-quality output and flexibility to meet specific requirements.
Technological and Intellectual Property Leadership. Our technologies are key to providing unique, flexible and comprehensive solutions for content creation, distribution and consumption, and we continue to invest in extending our technology and market leadership positions. For example, we offer web fonts that are hand-hinted by experts to deliver a high quality experience on the web. Our Monotype Spark solution draws from our iType and WorldType Layout solutions to bring high-quality text rendering to low-memory devices, enabling devices such as wearables to improve their user interfaces. Insights gained from such research help us to offer tailored, comprehensive solutions, like the Monotype Portfolio for Automotive, which brings type, technology and expert consultation to the automotive industry.
Expertise, Experienced Leadership and Employee Base. Our expertise in font design and engineering gives us a strong foundation to meet tough challenges in today’s consumer environments. Our Monotype Studio is home to some of the world’s top type designers, who provide expert consultation and custom design services to help customers articulate their distinctive brand values. Our Monotype Studio experts work closely with customers to achieve goals like developing successful brand identities, expanding brands into global markets and managing the consistent use of a brand across an organization. Our employee base includes some of the world’s most experienced professionals who intimately understand typefaces and software. A number of our sales, engineering and support staff have been with us since we began serving creative professionals and OEMs. As a result, there is significant continuity between our team and our customers.
Established Relationships with Market Leaders. Several of our customer relationships date back 20 years or more. Our OEM customers are many of the largest and most successful companies in each of the markets that they serve. In the consumer device space, we provide solutions to market leaders like Google, Apple, Microsoft and Amazon. In the laser printer market, our customers include nine of the top ten laser printer manufacturers based on the volume of units shipped worldwide. Our Creative Professional customers include major international media, publishing and marketing solutions companies, such as Gannett and Pearson as well as other large publishers and major design firms.
Global and Multi-Channel Presence. In 2014, 2013 and in 2012, 47.6%, 45.3% and 47.5% of our revenue, respectively, was derived from sales by our operating subsidiaries located in the United Kingdom, Germany, China and Japan. Our customers are located throughout the world, and we have built an extensive customer base of creative professionals and OEMs. Our websites including myfonts.com, fonts.com, fontshop.com, linotype.com and fontfont.com provide us with a substantial online presence offering
8
Table of Contents
more than 127,000 font products. Our technologies and font IP are crucial to our OEM customers who manufacture high-volume consumer devices that have multimedia functionality and multinational distribution. We support all of the world’s major languages and have specifically designed our solutions for displaying rich content in Asian and other non-Latin languages. We enable OEM customers to engineer a common platform supporting multiple languages, reducing costs and time to market, and increasing product flexibility. China, Japan and Korea are increasingly becoming centers of design, manufacturing and consumers of consumer devices, and we have over 20 years of experience partnering with leading Asian companies such as Ricoh, Samsung, Toshiba and Kyocera Mita.
Attractive Business Model. We have a significant, recurring base of licensing revenues that is based, in part, on multi-year financial commitments by our OEM customers. Our revenues are also highly predictable because of our established relationships with OEMs and due to quarterly royalty reports we receive from them. Other revenue contracts have renewable term licenses, and in Creative Professional, our web font service is primarily a subscription-based model, providing a recurring stream of revenue. In addition, the high volume of low-dollar web transactions runs at a predictable rate, which together lends to an overall recurring and predictable revenue base of over approximately 85% of our total revenue. As a technology licensing business, we generate significant cash flows from incremental OEM revenue. We have a relatively low cash tax rate, due primarily to the tax deductibility of goodwill associated with our German subsidiary, which increases our cash flows.
Our Strategy
Our strategy is to enable beautiful design and great user experiences, as well as to ease points of friction in the content continuum. We offer a wide range of products, technologies and services that make workflows more efficient, provide a choice of fonts for creativity and language coverage, and result in a great experience.
Our traditional offering focused on two distinct customer groups—creative professionals and device manufacturers. Creative professionals created content for digital and print using individual workstation-based authorship tools. Output was sent to devices that rendered the content using fonts and rendering technology embedded on those devices.
These markets and their associated needs have evolved, making workflows much more complex. While a large amount of content is still produced using workstation-based applications for print-first distribution, more content is being produced for digital only or digital first. Creative workflows are more efficient when web-based tools are used, because they offer greater consistency of experience for the designer and more flexibility for experimentation. Users expect a consistent experience across any device they use to access content – a result of responsive design. This need for responsive design has become increasingly important as the number of connected devices continues to expand at a rapid pace. As such, the requirements faced by content creators and device manufacturers are becoming intertwined, as authors must design for multiple devices and devices must display the content in the way the authors intended.
From content creation to consumption, we strive to be the first place to turn for the type, technology and expertise that enable the best user experiences and ensure brand integrity, regardless of device, platform or language. Following are the key components of our strategy:
Creative Professional
Empower Creative Professionals with the Right Solutions as Requirements Shift from Print to Mobile, Web and Applications. Our focus is to help customers succeed as workflows and publishing environments become more complex, while building strategic, long-term relationships. To remain competitive, customers such as brands, agencies, publishers and corporations are diversifying to support a broad range of publishing
9
Table of Contents
environments, including the web, mobile devices, applications, as well as print. We provide a comprehensive selection of solutions, including typeface designs, custom typefaces, worldwide language support and fonts that are tuned to display in the highest quality, regardless of the output medium. Our licensing options provide flexible coverage to meet our customers’ unique and evolving requirements. An additional component to supporting the evolving needs of creative professionals is providing web-based tools, like our Typecast application, which enables website design using web fonts right inside the browser. And our Membership by Monotype subscription plans, web font offerings and workflow tools enable a high level of flexibility and functionality to help meet customers’ evolving needs.
Position and Deliver our Solutions to Meet Evolving Markets and Requirements. The cornerstone of our e-commerce business is the Monotype Libraries, which comprise individual collections, including the Monotype, Linotype, ITC, FontFont, Ascender and Bitstream collections, in addition to fonts from independent foundries and individuals. These fonts are licensed to creative professionals and casual users through our e-commerce sites, including myfonts.com, fonts.com, fontshop.com, linotype.com and fontfont.com. Our strong online presence, which represents more than 127,000 fonts, also includes access to web fonts, where our inventory of more than 30,000 high-quality web fonts continues to grow. In 2014, our websites attracted more than 77 million visits from over 200 countries and territories. In addition to e-commerce channels, fonts from our libraries as well as custom fonts are also licensed through our direct and indirect sales channels. And as casual users of fonts embrace personalization in the digital world, such as through our Swyft Media and FlipFont offerings, we will seek opportunities to deliver self-expression, including through fonts, to these consumer markets.
Fulfull Web Font Requirements as Customers Transition to HTML-5-Based Solutions for Digital Marketing Campaigns. Digital Marketing continues to be a significant area of focus for Monotype, where we see opportunities for our fonts as part of dynamic, HTML-5-based marketing campaigns. As this market evolves, we intend to continue executing on our strategy to better understand the ecosystem and emerging standards, align our offerings and establish meaningful partnerships. Our goal is to be there for our customers when they’re ready to take full advantage of web fonts in rich-media, digital marketing campaigns.
Enhance Personalization and Self Expression Across the Mobile Messaging Ecosystem – from Brands, Advertisers and Platform Providers to the Mass Consumer Marketplace. Mobile messaging apps are a fast-growing market. The primary users of these solutions are millennials who are eager to personalize their text messages with branded content such as digital stickers. Swyft Media, which we acquired on January 30, 2015, brings to Monotype a platform that provides value to stakeholders across the mobile messaging ecosystem. Brands and advertisers are able to reach consumers through branded, monetizable content that’s unobtrusively integrated within the messaging experience. In addition, consumers are able to take advantage of shareable, branded content such as digital stickers to personalize their text messages. Our goal is to expand opportunities with Swyft and provide even more value across the ecosystem – with our fonts.
OEM
Display Imaging
Develop Innovative Solutions to Optimize the Deployment and Consumption of Text on all Digital Displays. Through our type, technology and expertise, we strive to enhance digital lifestyles, regardless of medium or platform. Whether off-the-shelf or customized, our solutions are designed to help customers maintain brand integrity by incorporating text that is highly legible, brand faithful and supports the world’s languages.
Increase Penetration of our Technologies and Fonts into a Wide Range of Device Categories, From Automotive to Smart TVs. Our technologies and fonts play an important role in the mass-market success of device categories such as automotive displays, smart TVs, mobile devices and e-book readers and tablets. We
10
Table of Contents
have an established base of customers in these categories, and we will seek to expand within existing accounts as new models are added, or as new product lines are introduced. We intend to continue to pursue new design wins such as next-generation in-vehicle displays, helping customers to meet key requirements including brand integrity, high legibility and worldwide language support.
Diversify into the Wide-Ranging Category, the Internet of Things. The growing market of the Internet of Things represents an emerging opportunity to bring high-quality and scalable text to a vast range of new devices. The Monotype Spark solution, in addition to our fonts, positions us to enable the development of beautiful text interfaces for low-end, memory-constrained devices.
Printer Imaging
Leverage Our Long-Term Relationships. We constantly strive to strengthen these relationships by continuing to work closely with OEMs to fulfill evolving requirements, such as providing value-added solutions that differentiate offerings, reduce cost, or capitalize on new technology paradigms. For example, we offer printer manufacturers flexible, high-performance printer driver tool kits that support popular operating systems. OEMs are able to integrate and customize robust printing capabilities to gain a competitive edge. Our flexible architecture, support for multiple print languages and extensive use of common code enables printer manufacturers to speed products to market while reducing development time and costs. Using our solution to support multiple page description languages, in combination with our fonts and drivers, provides a more complete solution. By providing additional technologies and fonts, we seek to increase our value to customers and to expand our presence within our existing customer base.
Extend our Leadership Position with Enhanced Technologies. While the laser printer market has been growing at a slower pace than the market for other consumer devices, we have historically sustained consistent growth by anticipating and rapidly adapting to changes in the market. For example, we support the increased font offering that is part of Microsoft® Windows® operating systems, and fonts to support global and cloud printing. Going forward, we intend to continue to expand our offerings to provide additional technologies to the laser printer market, while leveraging our extensive experience and long-standing customer relationships.
Independent Software Vendors and Developers
Expand Support of ISVs to All Deployment Environments. Our core offering to ISVs and developers consists of providing fonts, custom typefaces and rendering technologies for language coverage, platform compatibility, user experience enhancement and creative expression. Options for accessing and deploying our software and applications have expanded from on-device to secure cloud-based services and combinations of the two. Our ISV strategy is to provision and license our fonts and tools to provide the flexibility ISVs need to create compelling offerings for devices like tablets, smartphones and medical devices, as well as for emerging categories such as wearables and the Internet of Things.
We will also seek to:
Expand and Deepen our Global Presence, Particularly in Asia. We intend to drive our revenue growth by leveraging our knowledge of global markets and through our global operations. We believe that economic growth in Asia will further the demand throughout Asia for our solutions. Through this organic expansion and possible acquisitions, we intend to increase our ability to service consumer device manufacturers and content creators throughout the world, as significant growth opportunities exist in these markets.
Selectively Pursue Complementary Acquisitions, Strategic Partnerships and Third-Party Intellectual Property. We intend to continue to selectively pursue acquisitions, strategic partnerships and third-party intellectual property to accelerate our time to market with complementary solutions, penetrate new geographies and enhance our intellectual property portfolio. We believe that the market for our solutions
11
Table of Contents
is still fragmented. We have a demonstrated track record of identifying, acquiring and integrating companies that enhance our intellectual property portfolio. On July 14, 2014, we acquired FontShop International GmbH and FontShop AG, privately-held font distributors located in Berlin, Germany, and related intellectual property for an aggregate purchase price approximately $14.8 million and on April 7, 2014, the Company purchased all of the outstanding stock of Mark Boulton Design Limited, a privately-held Web design studio located in Cardiff, Wales, United Kingdom, for approximately $0.8 million.
Our Customers
We are committed to serving the typographic and design needs of our customers. In today’s global marketplace, where brands and technologies cross borders and industries seemingly in nanoseconds, we remain a trusted source for creative professionals, enterprises, application developers, device manufacturers and others who value and desire the highest-quality type available. Our technologies and services are sold to customers in two principal markets: Creative Professional and OEM. Our Creative Professional customers include branding and design agencies, as well as leading marketers and publishers. The OEM market consists of both consumer device manufacturers and independent software vendors. In 2014, 2013 and 2012 our revenue in these two markets was as follows (in thousands):
| 2014 | 2013 | 2012 | ||||||||||||||||||||||
| Principal Markets |
Revenue | Percentage of Total Revenue |
Revenue | Percentage of Total Revenue |
Revenue | Percentage of Total Revenue |
||||||||||||||||||
| Creative Professional |
$ | 76,961 | 42 | % | $ | 63,689 | 38 | % | $ | 51,751 | 35 | % | ||||||||||||
| OEM |
107,539 | 58 | % | 102,935 | 62 | % | 98,110 | 65 | % | |||||||||||||||
|
|
|
|
|
|
|
|
|
|
|
|
|
|||||||||||||
| Total |
$ | 184,500 | 100 | % | $ | 166,624 | 100 | % | $ | 149,861 | 100 | % | ||||||||||||
|
|
|
|
|
|
|
|
|
|
|
|
|
|||||||||||||
Our solutions are embedded in a broad range of consumer devices and are compatible with most major operating environments. We partner with operating system and software application vendors such as Google, Apple, Microsoft, Oracle and Access, and have made our patented iType scalable font engine available as a plug-in for open source Linux® environments. Additionally, we are an active participant in the development of industry standards which pave the way for emerging capabilities, such as automotive and e-book fonts that support advanced typographic and styling capabilities across devices. We are active in the development of various technology standards, including the EPUB e-book standard, W3C Digital Publishing Interest Group and ISO/IEC core font technology standardization work through our active participation in the various projects coordinated by the ISO MPEG Committee. We also serve as the chair of the W3C Web Fonts Working Group, demonstrating our commitment of ensuring that industry standards effectively support fonts and font technologies, ultimately bringing to end users the highest level of text quality, performance and flexibility. In the past, we contributed to a wide variety of standardization activities including the developments of hardware-accelerated vector graphics APIs (The Khronos Group), Java ME platforms for mobile devices (JSR-271 and JSR-287), DVB Multimedia Home Platform and OMA Rich Media Environment.
Our customers are among the world’s leading consumer device manufacturers and creative professionals, including:
| • | nine of the top ten laser printer manufacturers based on the volume of units shipped worldwide; |
| • | web fonts customers including The Economist, Hyundai, Hilton and Pepsi; |
| • | major software companies including Microsoft, Google and Apple; |
| • | e-book readers/tablets, including Amazon and Kobo; |
| • | other multinational corporations such as Condé Nast, Lloyds TSB, Panasonic, Pearson, Sony Computer Entertainment of America, Nintendo, Activision, TiVo, Ubisoft, Adidas and Nike; |
12
Table of Contents
| • | major international media and marketing solutions companies including Gannett; |
| • | many of the top automotive brands including Chrysler, Ford, Honda, and Hyundai; |
| • | digital television and set-top box manufacturers including TTE Technology, Toshiba and Sharp; and |
| • | major home appliance manufacturers. |
In 2014, 2013 and 2012, our top ten licensees by revenue accounted for approximately 35.3%, 37.2% and 41.0% of our total revenue, respectively. In 2014, 2013 and 2012, no one customer accounted for more than 10% of our total revenue. For the quarter ended December 31, 2013, one customer accounted for 10.2% of our revenue. For the quarters ended December 2014 and 2012, no customer individually accounted for more than 10% of our total revenue.
Sales and Marketing
Our Creative Professional sales representatives directly target prospective clients, primarily publishers, agencies and corporate customers. Our e-commerce websites, myfonts.com, fonts.com, fontshop.com, linotype.com and fontfont.com drive sales from professional and casual users. Our web font services offer web fonts by subscription or through self-hosting options to provide for the ability to use fonts in web page design. Our OEM sales efforts are focused primarily on establishing long-term relationships with leading consumer device manufacturers and independent software vendors.
Our marketing organization works to deliver a consistent message detailing our capabilities and to develop new avenues for presenting our solutions. We promote our solutions through a combination of web content, social media outlets, public relations activities, opt-in e-mail newsletters, blogs, editorial articles, brochures, print advertising, case studies, collateral, speaking engagements, special events, exhibitions, educational programs, and attendance and participation at industry conferences and trade shows. Our e-commerce websites, myfonts.com, fonts.com, fontshop.com, linotype.com and fontfont.com are also promoted through a combination of affiliate programs, search engine optimization, e-mail marketing and crowdsourcing opportunities.
Research and Development
We have a strong commitment to research and development for core technology programs directed at creating new products, product enhancements and new applications for existing products, as well as funding research into future market opportunities. Each of the markets we serve is generally characterized by rapid technological change and product innovation. We believe that continued timely development of new products and product enhancements to serve existing and new markets is necessary to remain competitive. Our research and development operations are located in Woburn, Massachusetts; San Mateo, California; Boulder, Colorado; Belfast, Northern Ireland; Cardiff, United Kingdom; Salfords, United Kingdom; Bad Homburg, Germany; Berlin, Germany; Noida, India; Hong Kong, China; and Tokyo, Japan.
In 2014, 2013 and 2012, we incurred research and development expenses of $20.7 million, or 11.2% of sales, $19.9 million, or 11.9% of sales and $18.0 million, or 12.0% of sales, respectively. Further information on research and development expenses may be found in Item 7, Management’s Discussion and Analysis of Financial Condition and Results of Operations.
Intellectual Property
We rely on a combination of copyright, patent and trademark laws and on contractual restrictions to establish and protect proprietary rights in our technologies and fonts. Whenever possible, we enter into non-disclosure agreements with our suppliers, partners and others to limit access to and disclosure of our proprietary information.
13
Table of Contents
We apply for U.S. and international patents with respect to our technologies, and seek copyright registration of our software and U.S. and international trademark registration in those instances which we determine are competitively advantageous and cost effective to do so. We have been granted a total of 20 patents and have 26 patents pending with either the U.S. Patent and Trademark Office or foreign jurisdictions. Some of our most important patents are related to our subpixel rendering technology, our ACTTM compression technology and dynamic subsetting technology. We have unregistered trademarks and, where appropriate, registered trademarks on the key fonts in our Monotype libraries. We intend to continue our policy of taking all measures we deem necessary to protect our patent, copyright, trade secret and trademark rights.
Some of our fonts are owned by third parties that we license under exclusive or non-exclusive agreements. We have also collaborated with third parties in the production and development of fonts.
Competition
Our solutions compete with those offered by a variety of companies, including vendors of print and screen imaging technologies, printer drivers and design tools, as well as designers and distributors of fonts. We compete principally on the basis of our technical innovation, engineering and customer support expertise, the breadth of our font offerings and the overall performance of our solutions, including reliability and timely delivery. Competition with our solutions comes from a variety of sources, including companies that license technologies and fonts, such as Adobe, and local providers of solutions that are specific to a particular country’s language requirements, such as Morisawa in Japan. We also compete with open source fonts and technologies, including the FreeType™ text renderer, a product of an open source collaborative organization that provides its Linux font rendering code for free, and Google, which provides open source fonts. In addition, we compete with printer driver provider Software Imaging, PDL provider Zoran (a division of CSR) and font management software vendors Extensis and Insider Software. The competition for our custom font design services generally comes from companies offering their own type libraries and custom type services, including boutique font foundries and independent professionals. We also compete with in-house resources of our OEM customers.
Employees and Consultants
At December 31, 2014, we employed 435 persons. The table below provides our employees by functional area.
| Number of Employees |
Percentage | |||||||
| Sales and marketing |
162 | 37 | % | |||||
| Research and development |
197 | 45 | % | |||||
| General and administration |
76 | 18 | % | |||||
|
|
|
|
|
|||||
| Total |
435 | 100 | % | |||||
|
|
|
|
|
|||||
None of our employees or consultants is represented by a union or covered by a collective bargaining agreement. Our German employees are represented by works councils in Berlin and Bad Homburg. These works councils have the right to participate in certain decisions by Monotype GmbH, including operational changes, such as relocation of the business or change of control transactions, and social matters such as wages and salaries and working hours. We believe that our relations with our employees and consultants are good.
Segment Information
Information concerning revenue from our two principal markets for the last three years may be found in Note 14 to our consolidated financial statements included in this Annual Report on Form 10-K.
14
Table of Contents
We do not allocate expenses and assets to our two principal markets, Creative Professional and OEM, and operating results are assessed on an aggregate basis to make decisions about the allocation of resources. Further information about our principal markets and segment information, including geographic revenue, may be found in Note 14 to our consolidated financial statements included in this Annual Report on Form 10-K.
Corporate and Investor Information
We maintain a website at monotype.com. We make available on our website documents describing our corporate governance and our Code of Business Conduct and Ethics. We are not including the information contained on our website as a part of, or incorporating it by reference into, this Annual Report on Form 10-K. We make available free of charge through our website our proxy statements, registration statements, annual reports on Form 10-K, quarterly reports on Form 10-Q and current reports on Form 8-K, and amendments to these reports, as soon as reasonably practicable after we electronically file such material with, or furnish such material to, the Securities and Exchange Commission, or the SEC. Our SEC filings are also available over the Internet at the SEC’s website at http://www.sec.gov. You may also read and copy any document we have filed by visiting the SEC’s public reference room at 100 F Street, NE., Washington, DC 20549. Please call the SEC at 1-800-SEC-0330 for further information about the public reference room. The SEC maintains an internet site that contains reports, proxy and information statements and other information regarding our filings at www.sec.gov. Our SEC reports and other information may also be inspected at the offices of the Financial Industry Regulatory Authority, 1735 K Street, N.W., Washington, D.C. 20006.
| Item 1A. | Risk Factors |
Set forth below are certain risk factors that could harm our business, results of operations and financial condition. You should carefully read the following risk factors, together with the financial statements, related notes and other information contained in this Annual Report on Form 10-K. This Annual Report on Form 10-K contains forward-looking statements that contain risks and uncertainties. Please refer to the discussion of “Forward-Looking Statements” on page two of this Annual Report on Form 10-K in connection with your consideration of the risk factors and other important factors that may affect future results described below.
Risks Related to Our Industries
Software licensing models are evolving and if we are not able to make our fonts and font technologies available under these models, our business prospects could suffer.
New licensing and business models are evolving in the software industry. For example, as content is delivered across a variety of digital and print media, licensing models that provide flexibility across consumption platforms are being introduced. As software licensing models evolve, we may not be successful in adapting to or maintaining these new business models and our business prospects could suffer.
We face significant competition in various markets, and if we are unable to compete successfully, our ability to generate revenue from our business could suffer.
We face significant competition in the market for type and related technologies. We believe that our most significant competitive threat comes from companies that compete with some of our specific offerings. Those competitors currently include Adobe, Google, FreeType and local providers of solutions whose products are specific to a particular country’s language. We also compete with the internal resources of our customers to whom we license our solutions, most of which have greater financial, technical and other resources than we do. Similarly, we also face competition from font foundries, font-related websites and independent professionals.
15
Table of Contents
Some of our current or future competitors may have significantly greater financial, technical, marketing and other resources than we do, may enjoy greater name recognition than we do or may have more experience or advantages than we have in the markets in which they compete. These advantages may include, among others:
| • | sales and marketing advantages; |
| • | the recruitment and retention of skilled personnel; |
| • | the establishment and negotiation of profitable strategic, distribution and customer relationships; |
| • | the development and acquisition of innovative software technology and the acquisition of software companies; |
| • | greater ability to experiment with and to drive industry-wide adoption of new licensing models; |
| • | greater ability to pursue larger scale product development and distribution initiatives on a global basis; |
| • | substantially larger patent portfolios; and |
| • | operational advantages. |
Further, many of the devices that incorporate our solutions also include technologies and fonts developed by our competitors. As a result, we must continue to invest significant resources in product development in order to enhance our solutions and introduce new high-quality solutions to meet the wide variety of competitive pressures. Our ability to generate revenue from our business could suffer if we fail to do so successfully.
Current and future industry standards may limit our business opportunities.
Various industry leaders have adopted or are in the process of adopting standards for consumer devices that incorporate, or have the potential to incorporate, our technologies. In addition, standards applicable to web-based development and distribution, such as web publishing platforms, are evolving. Although we have made some efforts, where applicable, to have our solutions adopted as industry standards, these efforts have been limited, and we do not control the ultimate decision with respect to whether our solutions will be adopted as industry standards in the future or, to the extent they are adopted, whether and for how long they will continue as such. If industry standards adopted exclude our solutions or we are unable to be compatible with such adopted solutions, we will lose market share and our ability to secure the business of customers subject to those standards will be adversely affected. Costs or potential delays in the development of our solutions to comply with such standards could significantly increase our expenses and place us at a competitive disadvantage compared to others who comply faster or in a more cost efficient way or those whose solutions are adopted as the industry standard. We may also need to acquire or license additional intellectual property rights from third parties which may not be available on commercially reasonable terms, and we may be required to license our intellectual property to third parties for purposes of standards compliance.
Open source software may make us more vulnerable to competition because new market entrants and existing competitors could introduce similar products quickly and cheaply.
Open source refers to the free sharing of software code used to build applications in the software development community. Individual programmers may modify and create derivative works and distribute them at no cost to the end-user. To the extent that open source software that has the same or similar functionality as our technologies is developed or gains market share, demand for our technologies may decline; we may have to reduce the prices we charge for our technologies; and our results of operations may be negatively affected. For example, as the Android operating system became more prevalent in smart phones and tablets, the opportunity to embed our technology directly into these devices declined.
16
Table of Contents
In addition, open source type software has become more widely available and to the extent such type is widely adopted, the demand for our type offerings may decrease and our revenue could be adversely affected.
Risks Related to Our Type, Technology and Expertise
If we fail to develop and deliver innovative type and technologies in response to changes in our industry, including changes in consumer tastes or trends, our revenue could decline.
The markets for our type, technology and expertise are characterized by rapid change and technological evolution and are intensely competitive and price sensitive. Our future success depends, to a great extent, on our ability to develop and deliver innovative type and technologies that are widely adopted in response to changes in our industry, that are compatible with the solutions introduced by other participants in our industry and for which our customers are willing to pay competitive prices. For example, as screen resolution technology improves, our offering must evolve to reflect the fact that text legibility is, in part, being addressed by these technical solutions. We rely on the introduction of new or expanded solutions with additional or enhanced features and functionality to allow us to maintain our value in the face of downward pressure on our pricing resulting from efforts by our Creative Professional and OEM customers to reduce costs. We may not correctly identify new or changing market trends at an early enough stage to capitalize on market opportunities. For example, our customers are participating in an increasingly global marketplace, and we need to ensure our global type offering and related technologies meet these needs. Our failure to deliver such innovative type and technologies that allow us to stay competitive and for which we can maintain our pricing would adversely affect our revenue.
The success of our business is influenced by the interoperability of our solutions with a variety of consumer devices and software applications and operating systems.
To be successful we must design our type and technologies to interoperate effectively with a variety of consumer devices, software applications, operating systems and content creation platforms. We depend on the cooperation of consumer device manufacturers with respect to the components integrated into their devices, such as PDLs, as well as software developers that create the operating systems and applications, to incorporate our solutions into their product offerings. Content creation platforms are evolving rapidly and our solutions must meet the needs of both authors and device manufacturer who seek to have targeted customers consume information on multiple devices. To the extent our fonts and font technologies are less relevant, are incompatible, or contain errors or defects, our business would be adversely affected.
Our type and technologies compete with solutions offered by some of our customers, which have significant competitive advantages.
We face competitive risks in situations where our customers are also current or potential competitors. For example, Adobe is a significant licensee of our fonts, but Adobe is also a competitor with respect to the licensing of technologies and fonts. To the extent that Adobe or our other customers choose to utilize competing solutions they have developed or in which they have an interest, rather than utilizing our solutions, our business and operating results could be adversely affected. Adobe also offers broader product lines than we do, including software products outside of the type market that provide Adobe with greater opportunities to bundle and cross-sell products to its large user base. To the extent our customers were to offer type or technologies comparable to ours at a similar or lower price, our revenue could decline and our business would be harmed.
Our business is dependent in part on type and technologies we license from third parties and these license rights may be inadequate for our business.
Certain of our solutions are dependent in part on the licensing and incorporation of technologies from third parties, and we license a substantial number of fonts from third parties. For example, we have
17
Table of Contents
license agreements with Microsoft, Adobe and others under which we license certain fonts, and our e-commerce sites, including www.myfonts.com, rely upon the license of type from third parties. Our license agreements with these parties are limited by the ownership or licensing rights of our licensors. If any of the technologies we license from third parties fail to perform as expected, if our licensors do not continue to support any of their technology or intellectual property, including fonts, because they go out of business or otherwise, or if the technologies or fonts we license are subject to infringement claims, then we may incur substantial costs in replacing the licensed technologies or fonts or fall behind in our development schedule and our business plan while we search for a replacement. In addition, replacement technology and fonts may not be available for license on commercially reasonable terms, or at all, which could subject us to claims by our customers for breach of the terms of our agreements with them.
Our business and prospects depend on the strength of our brands, and if we do not maintain and strengthen our brands, we may be unable to maintain or expand our business.
Maintaining and strengthening the brand of the Monotype Libraries and our other brands is critical to maintaining and expanding our business, as well as to our ability to enter into new markets for our type, technology and expertise. If we fail to promote and maintain these brands successfully, our ability to sustain and expand our business and enter into new markets will suffer. Maintaining and strengthening our brands will depend heavily on our ability to continue to develop and provide innovative and high-quality solutions for our customers, as well as to continue to maintain our strong online presence and relationships with third-party type and technology providers. For example, we will need to ensure our type and technologies are as relevant for the evolving digital publishing needs of our Creative Professional customers. If we fail to adapt to changing consumer preferences or if we introduce solutions that our customers or potential customers reject, the strength of our brands could be adversely affected. Further, unauthorized third parties may use our brands in ways that may dilute or undermine their strength.
If we fail to adequately protect our intellectual property, we could lose our intellectual property rights, which could negatively affect our revenue or dilute or undermine the strength of our brands.
Our success is heavily dependent upon our ability to protect our intellectual property which includes our type and technologies. To protect our intellectual property, we rely on a combination of United States and international patents, design registrations, copyrights, trademarks, trade secret restrictions, end user license agreements, or EULAs, and the implementation and enforcement of nondisclosure and other contractual restrictions. Despite these efforts, we may be unable to effectively protect our proprietary rights and the enforcement of our proprietary rights may be extremely costly. For example, our ability to enforce intellectual property rights in the actual design of our fonts is limited.
We hold patents related to certain of our rasterizer and compression technologies and registered trademarks on many of our fonts. Our patents may be challenged or invalidated, patents may not issue from any of our pending applications or claims allowed from existing or pending patents may not be of sufficient scope or strength (or may not issue in the countries where products incorporating our technology may be sold) to provide meaningful protection or be of any commercial advantage to us. Some of our patents have been and/or may be licensed or cross-licensed to our competitors. We rely on trademark protection for the names of our fonts. Unauthorized parties may attempt to copy or otherwise obtain and distribute our proprietary technologies and fonts. Also, many applications do not need to identify our fonts by name, such as those designs embedded in mobile telephones and set-top boxes, and therefore may not need to license trademarked fonts. We sometimes protect fonts by copyright registration but we do not always own the copyrights in fonts licensed from third parties. In addition, we cannot be certain that we will be able to enforce our copyrights against a third party who independently develops fonts even if it generates font designs identical to ours.
Our EULA generally permits the embedding of our fonts into an electronic document only for the purpose of viewing and printing the document, but technologies, including those related to web-based fonts, may exist or may develop which allow unauthorized persons who receive such an embedded
18
Table of Contents
document to use the embedded font for editing the document or even to install the font into an operating system, the same as if the font had been properly licensed. Unauthorized use of our intellectual property or copying of our fonts may dilute or undermine the strength of our brands. Also, we may be unable to generate revenue from products that incorporate our type or technologies without our authorization. Monitoring unauthorized use of our solutions is difficult and expensive. A substantial portion of the consumer devices that require type or related technologies are manufactured in China. We cannot be certain that the steps we take to prevent unauthorized use of our intellectual property will be effective, particularly in countries like China where the laws may not protect proprietary rights as fully as in the United States.
We may be forced to litigate to defend our intellectual property rights or to defend against claims by third parties against us relating to intellectual property rights.
Disputes and litigation regarding the ownership of technologies and fonts and rights associated with solutions such as ours are common, and sometimes involve patent holding companies or other adverse patent owners who have no relevant product revenue and against whom our own patents may therefore provide little or no deterrence. Third parties have from time-to-time claimed, and in the future may claim, that our products and services infringe or violate their intellectual property rights. Any such claims could cause us to incur significant expenses and, if successfully asserted against us, could require that we pay substantial damages and prevent us from selling our products. We may be forced to litigate to enforce or defend our intellectual property rights, to protect our trade secrets or to determine the validity and scope of other parties’ proprietary rights. Even if we were to prevail, any litigation regarding intellectual property could be costly and time-consuming and divert the attention of our management and key personnel from our business operations. We may also be obligated to indemnify our customers or business partners pursuant to any such litigation, which could further exhaust our resources. Furthermore, as a result of an intellectual property challenge, we may be required to enter into royalty, license or other agreements, and we may not be able to obtain such agreements at all or on terms acceptable to us. We have been in the past involved in litigation with third parties, including Adobe, to defend our intellectual property rights and have not always prevailed.
Certain component technologies in our solutions may be subject to open source licenses, which may restrict how we use or distribute our technologies or require that we release the source code of certain technologies subject to those licenses.
Certain open source licenses, such as the GNU Lesser General Public License, require that source code subject to the license be released or made available to the public. Such open source licenses typically mandate that proprietary technologies, when combined in specific ways with open source software, become subject to the open source license. We take steps to ensure that our proprietary technologies are not combined with, or do not incorporate, open source software in ways that would require our proprietary technologies to be subject to an open source license. However, few courts have interpreted the open source licenses, and the manner in which these licenses may be interpreted and enforced is therefore subject to uncertainty. While our end-user license agreement, or EULA, prohibits the use of our technologies in any way that would cause them to become subject to an open source license, our customers could, in violation of our EULA, combine our technologies with technologies covered by an open source license.
In addition, we rely on multiple software engineers to design our proprietary technologies. Although we take steps to ensure that our engineers do not include open source software in the technologies they design, we may not exercise complete control over the product development efforts of our engineers and we cannot be certain that they have not incorporated open source software into our proprietary technologies. In the event that portions of our proprietary technologies are determined to be subject to an open source license, we might be required to publicly release the affected portions of our source code, which could reduce or eliminate our ability to commercialize our solutions. Also, our ability to market our
19
Table of Contents
type and technologies depends in part on the existence of proprietary operating systems. If freely distributed operating systems like Linux or Android become more prevalent, the need for our solutions may diminish and our revenue could be adversely affected. Finally, in the event we develop technologies that operate under or are delivered under an open source license, such technologies may have little or no direct financial benefit to us.
Risks Related to Our Customers and our Customer Relationships
We derive a substantial majority of our revenue from a limited number of licensees, and if we are unable to maintain these customer relationships or attract additional customers, our revenue will be adversely affected.
We derive a substantial majority of our revenue from the licensing of our type and technologies to OEMs, including ISVs, and to creative professionals who use our fonts in the content that they create. Some of our license agreements are for a limited period of time and, upon expiration of their license agreements, these customers may not renew their agreements or may elect not to enter into new agreements with us on terms as favorable as our current agreements. In addition, for the years ended December 31, 2014, 2013 and 2012, our top ten licensees by revenue accounted for approximately 35.3%, 37.2% and 41.0% of our total revenue, respectively. Accordingly, if we are unable to maintain these relationships or establish relationships with new customers, our licensing revenue will be adversely affected.
If standard setting industry leaders were to discontinue their use of our solutions in their products, our business could be materially and adversely affected.
Because of their market position as industry leaders, the incorporation by Hewlett Packard, or HP, of our solutions in its laser printers and the incorporation of our solutions by Adobe in its PostScript product promote widespread adoption of our technologies by manufacturers seeking to maintain compatibility with HP and Adobe. If HP or Adobe were to stop using our solutions in their products, the market acceptance of our technologies by other consumer device manufacturers would be materially and adversely affected, and this would in turn adversely affect our revenue.
We face pressure from our customers to lower our license fees and, to the extent we lower them in the future, our revenue may be adversely affected.
The consumer device markets are highly competitive and consumer device manufacturers are continually looking for ways to reduce the costs of components included in their products in order to maintain or broaden consumer acceptance of those products. Because our type and technologies are a component incorporated into consumer devices, when negotiating renewals of customer contracts, we face pressure from our customers to lower our license fees. In addition, our Creative Professional business is increasingly comprised of recurring revenue, including SaaS subscription-based licensing models. We have in the past, and may in the future, need to lower our recurring license fees, either immediately or over time, to preserve customer relationships or extend use of our type or technologies. To the extent contractual license fees for any particular customer are lower in the future, we cannot be certain that we will be able to achieve related increases in the use of our technologies or other benefits to fully offset the effects of these adjustments.
If we are unable to further penetrate our existing markets or adapt or develop our type or technologies, our business prospects could be limited.
In our Creative Professional business, we expect that our future success will depend, in part, upon our ability to successfully penetrate both the desktop and digital publishing and advertising markets through our relationships with our e-commerce, business enterprise, agency and publishing customers. To date, we have penetrated only some of these markets. In our OEM business, we expect that our future
20
Table of Contents
success will depend, in part, upon our ability to successfully penetrate existing markets for consumer devices, including laser printers, digital copiers, mobile devices, e-book readers, automotive displays, digital televisions, set-top boxes and consumer appliances. Our ability to grow our revenue depends upon our ability to further penetrate these markets and to successfully penetrate those markets in which we currently have no presence. Demand for our solutions in any of these developing markets may not develop or grow, and a sufficiently broad base of Creative Professional and OEM customers may not adopt or continue to use products that employ our solutions. Because of our limited experience in some of these markets, we may not be able to adequately adapt our business and our solutions to the needs of these customers.
Our success depends on the existence of a market for consumer devices that incorporate our type and technologies.
| • | Our revenue depends in large part on market demand for solutions that enable consumer devices to render high-quality text. |
The consumer device market is characterized by rapidly changing technology, evolving industry standards and needs, and frequent new platform and product introductions. If the need for laser printers and other consumer devices utilizing our technology were to decrease or if current models of these products were replaced by new or existing products for which we do not have a competitive solution or if our solutions are replaced by others that become the industry standard and we are not able to develop technologies to build on such industry standards, our customers may not purchase our solutions and our revenue would be adversely affected. For example, if consumer devices evolve from text-based screens to voice controlled or gesture activated interactions, our solutions may be less relevant to the device manufacturers. Similarly, if the Android platform, for example, increases market share in the e-reader, television or automotive industries and we are not able to develop additional solutions to build on such platform, our revenue would be adversely affected.
| • | The market for laser printers is a mature market growing at a slower rate than other markets in which we operate. To the extent that sales of laser printers level off or decline, our licensing revenue may be adversely affected. |
A significant portion of our revenue in 2014, 2013 and 2012 was derived from laser printer manufacturers. The laser printer market is a mature market and as a result, it has grown at a slower rate than other markets in which we operate. If sales of printers incorporating our solutions level off, or decline, then our licensing revenue may be adversely affected.
| • | Our licensing revenue depends in large part upon device manufacturers incorporating our type and technologies into their products, and if our solutions are not incorporated in these products or fewer products are sold that incorporate our solutions, our revenue will be adversely affected. |
Our licensing revenue from OEMs depends upon the extent to which these device manufacturers embed our type and technologies in their products. We do not control their decision whether or not to embed our solutions into their products, and we do not control their product development or commercialization efforts. If we fail to develop and offer solutions that adequately or competitively address the needs of the changing marketplace, OEMs may not be willing to embed our solutions into their products. The process utilized by OEMs to design, develop, produce and sell their products is generally 12 to 24 months in duration. As a result, if an OEM is unwilling or unable to embed our solutions into a product that it is manufacturing or developing, we may experience significant delays in generating revenue while we wait for that OEM to begin development of a new product that may embed our solutions. In addition, if OEMs sell fewer products incorporating our solutions, our revenue will be adversely affected.
21
Table of Contents
Our operating results may fluctuate based upon an increase or decrease of market share by consumer device manufacturers to whom we license our type or technologies.
The terms of our license agreements with our consumer device manufacturers vary. For example, we have fixed fee licensing agreements with certain customers, some of which may decline over time. If these customers, some of whom are instrumental in setting industry standards and influencing early adoption of platforms or technology incorporating our solutions, were to increase their share of the consumer device market, under the terms of these agreements there would not be a corresponding increase in our revenue. Any change in the market share of consumer device manufacturers to whom we license our type or technologies is entirely outside of our control.
Risks Related to Our Business Operations
We conduct a substantial portion of our business outside North America and, as a result, we face diverse risks related to engaging in international business.
We have offices in six foreign countries and we are dedicating a significant portion of our sales efforts in countries outside North America. We are dependent on international sales for a substantial amount of our total revenue. In 2014, 2013 and 2012, approximately 47.6%, 45.3% and 47.5%, respectively, of our total revenue was derived from operations outside the U.S. and we expect that international sales will continue to represent a substantial portion of our revenue for the foreseeable future. This future international revenue will depend on the continued use and expansion of our type and technologies, including the licensing of our solutions worldwide.
We are subject to the risks of conducting business internationally, including:
| • | our ability to enforce our contractual and intellectual property rights, especially in those foreign countries that do not respect and protect intellectual property rights to the same extent that the United States does, which increases the risk of unauthorized and uncompensated use of our type or technologies; |
| • | United States and foreign government trade restrictions, including those that may impose restrictions on importation of programming, technology or components to or from the United States; |
| • | foreign government taxes, regulations and permit requirements, including foreign taxes that we may not be able to offset against taxes imposed upon us in the United States, and foreign tax and other laws limiting our ability to repatriate funds to the United States; |
| • | risks related to fluctuations in foreign currency exchange rates, in particular fluctuations in the exchange rate of the Japanese yen, the European Union’s euro, and the United Kingdom’s pound sterling, including risks related to hedging activities we may undertake; |
| • | foreign labor laws, regulations and restrictions; |
| • | changes in diplomatic and trade relationships; |
| • | difficulty in staffing and managing foreign operations; |
| • | political instability, natural disasters, war and/or events of terrorism; and |
| • | the strength of international economies. |
If we have difficulty finding appropriate partnership and/or acquisition candidates, our ability to execute aspects of our strategic plan may be hindered.
We intend to pursue selectively complementary acquisitions, strategic partnerships, including relationships with creative agencies, and third party intellectual property licenses to accelerate our time to market, penetrate new geographies and expand our offering. Execution of our strategy relies on finding
22
Table of Contents
and closing partnerships and/or acquisitions that fit with our business and that meet our financial expectations. To the extent that we are unable to identify appropriate opportunities and close deals on acceptable financial terms, we may face hurdles in executing portions of our strategy. In addition, the pursuit of potential acquisitions may divert the attention of management and cause us to incur various expenses in identifying, investigating and pursuing suitable acquisitions, whether or not they are consummated.
If we do find appropriate acquisition candidates, the acquisition process may divert our management’s attention or result in additional dilution to stockholders or use of resources that are necessary to operate other parts of our business.
As part of our business strategy, we may seek to acquire businesses, products or technologies that we believe could complement or expand our products, enhance our technical capabilities or otherwise offer growth opportunities. Acquisitions could create risks for us, including:
| • | difficulties in assimilating acquired personnel, operations and technologies; |
| • | unanticipated costs or liabilities associated with such acquisitions; |
| • | incurrence of acquisition-related costs; |
| • | diversion of management’s attention from other business concerns; |
| • | use of resources that are needed in other parts of our business; and |
| • | use of substantial portions of our available cash to consummate such acquisitions. |
In addition, we could discover deficiencies withheld from us in an acquisition or otherwise not uncovered in our due diligence prior to the acquisition. These deficiencies could include problems in internal controls, product quality, customer relationships or compliance with applicable laws, any of which could result in us becoming subject to unforeseen liabilities. Moreover, a significant portion of the purchase price of companies we acquire may be allocated to acquired goodwill and other intangible assets, which must be assessed for impairment at least annually. In the future, if our acquisitions do not yield expected returns, we may be required to take charges to our earnings based on this impairment assessment process, which could harm our results of operations. Acquisitions could also result in potentially dilutive issuances of equity securities or in the incurrence of debt, which could adversely affect our operating results and integrating acquired entities that have operating practices and cultures that differ from our own may hinder our ability to achieve the expected results of an acquisition. In addition, if an acquired business fails to meet our expectations, our operating results may suffer.
We rely on the manufacturers to whom we license our type and technologies to prepare accurate royalty reports for our determination of licensing revenue and if these reports are inaccurate, our revenue may be under-, or over-stated and our forecasts and budgets may be incorrect.
Our license revenue is generated primarily from royalties and recurring revenues paid by customers who license our type and technologies. Under these arrangements, our customers typically pay us a fee based on usage of our solutions and we rely on our licensees to accurately report their usage. We calculate our license fees, prepare our financial reports, projections and budgets and direct our licensing and technology development efforts based in part on these reports. However, it is often difficult for us to independently determine whether or not our licensees are reporting accurately. We have implemented an audit program of our licensees’ records, but the effects of this program may be limited as audits are generally expensive and time consuming, and initiating audits could harm our relationships with licensees. In addition, our audit rights are contractually limited. To the extent that our licensees understate or fail to report their usage of their solutions, we will not collect and recognize revenue to which we are entitled. Alternatively, we may encounter circumstances in which a customer may notify us that it previously reported inaccurate usage. In such cases, we may be required to give our licensee a credit which would result in a reduction in revenue in the period in which a credit is granted, and such a reduction could be material.
23
Table of Contents
Parties from whom we license fonts or components of our technologies may challenge the basis for our calculations of the royalties due to them.
Some of our agreements with licensors require us to give them the right to audit our calculations of royalties payable to them. In addition, licensors may at any time challenge the basis of our calculations and we cannot be sure that we will be successful in our defense. Any royalties paid as a result of any successful challenge would increase our expenses and could negatively impact our relationship with such licensor, including by impairing our ability to continue to use and re-license technologies or fonts from that licensor.
A prolonged economic downturn could materially harm our business.
Our ability to generate revenue is affected by the level of business activity of our Creative Professional and OEM customers, which, in most cases, is affected by the level of economic activity occurring in the industries and markets that our customers serve. Negative trends in the general economy, including trends resulting from a recession, the availability of credit, actual or threatened military action by the United States, terrorist attacks on the United States or abroad, or increased oil prices, could cause a decrease in consumer and/or business spending on computer hardware and software, and consumer devices in general, and could negatively affect the rate of growth of consumer device markets or of adoption of consumer devices. Any economic downturn, including a reduction in consumer confidence or disposable income in general, could also adversely affect the demand for fonts or impair the ability of our customers to pay for products and services that they have purchased. We cannot predict the timing, strength or duration of any economic slowdown or subsequent economic recovery and this uncertainty makes it difficult to determine if past experience is a good guide to the future. If the general economy or markets in which we operate worsen from present levels, the demand for fonts and font technologies could decline, and our revenue and profitability could be materially and adversely impacted.
Security vulnerabilities in our products or systems could lead to reduced revenues or to liability claims.
Maintaining the security of our products, computers and networks, including data centers that house our equipment and deliver our services, is an important issue for us and our customers. Unauthorized parties may be able to develop and deploy viruses, worms, malware and other malicious software programs that attack our products and services, our networks, or otherwise exploit any security vulnerabilities of our products, services and networks. Hardware, software and applications including cloud-based solutions that we procure from third parties may contain defects in design or manufacture, including bugs and other problems that could unexpectedly compromise the security of the system. Because techniques used by unauthorized parties to obtain unauthorized access to or sabotage systems change frequently and generally are not recognized until long after being launched against a target, we may be unable to anticipate these techniques or to implement adequate preventative measures. We can make no assurance that we will be able to detect, prevent, timely and adequately address, or mitigate the negative effects of cyberattacks or other security breaches, and we cannot guarantee that our systems will not be compromised, whether as a result of criminal conduct, advances in computer hacking, service disruptions, or data security incidents due to employee error, malfeasance, or other vulnerabilities. Any of these occurrences, whether intentional or accidental, could lead to interruptions, delays, or cessation of operation of our products, services and networks.
Unauthorized parties may seek to, among other things, misappropriate, compromise or alter our intellectual property, our confidential information, or confidential information of third parties including our customers; create system disruptions or product or service vulnerabilities; or cause shutdowns. Unauthorized disclosure, misuse, loss or corruption of our data, damage or misuse of our computer systems, or the inability of our customers to access or use our systems and solutions could disrupt our operations, result in a material loss of business, expose us to substantial legal liability, and significantly harm our reputation. Potential breaches of our security measures and the accidental loss, inadvertent
24
Table of Contents
disclosure or unauthorized dissemination of proprietary information or sensitive, personal or confidential data about us, our employees or our customers, including the potential loss or disclosure of such information or data as a result of hacking, fraud, trickery or other forms of deception, could expose us, our employees, our customers or the individuals affected to a risk of loss or misuse of this information, result in litigation and potential liability or fines for us, governmental inquiry and oversight, damage our brand and reputation or otherwise harm our business. We may be required to expend significant resources to attempt to protect against security threats, enhance our security measures, or investigate and remediate any security vulnerabilities. If such efforts are unsuccessful, we could experience the disruption of our operations, a material loss of business, exposure to substantial legal liability and significant harm to our reputation.
We incur significant costs and demands upon management as a result of complying with changing laws and regulations, including those affecting public companies, which could affect our operating results.
We have incurred and will incur significant costs, and have and could experience internal resources constraints, associated with the evaluation of and compliance with evolving corporate governance, reporting and other requirements, including requirements under the Sarbanes-Oxley Act and the Massachusetts data protection laws, as well as rules implemented by the SEC, and the NASDAQ Global Select Market. The expenses incurred by public companies for reporting and corporate governance purposes have been increasing. We expect that the rules and regulations applicable to us could cause our legal and financial compliance costs to increase and could make some activities more time-consuming and costly. In addition, in the current public company environment, officers and directors are subject to increased scrutiny and may be subject to increased potential liability. As a result, it may be more difficult for us to attract and retain qualified individuals to serve on our board of directors or as our executive officers. This could negatively impact our future success.
Our quarterly results may fluctuate significantly.
We expect our operating results to be subject to quarterly fluctuations. The revenue we generate and our operating results will be affected by numerous factors, including:
| • | general economic conditions; |
| • | demand for consumer devices that include our solutions; |
| • | demand for our fonts and custom font design services; |
| • | delays in product shipment by our customers; |
| • | industry consolidation; |
| • | introduction, enhancement and market acceptance of type and technology offered by us and our competitors; |
| • | price reductions or business model changes by us or our competitors or changes in how type and related technologies are priced and licensed; |
| • | the mix of solutions offered by us and our competitors; |
| • | the mix of international and U.S. revenue generated by licensing our solutions; |
| • | financial implications of acquisitions, in particular foreign acquisitions involving different accounting standards, foreign currency issues, international tax planning requirements and the like; |
| • | timing of billings to customers on royalty reports received by us under our licensing agreements; and |
| • | our ability to hire and retain qualified personnel. |
25
Table of Contents
A substantial portion of our quarterly revenue is based on actual shipments by our customers of products incorporating our solutions in the preceding quarter, and not on contractually agreed upon minimum revenue commitments. Because the shipping of products by our customers is outside our control and difficult to predict, our ability to accurately forecast quarterly revenue is limited. Our revenue also varies from quarter-to-quarter as a result of variances on the timing of transactions through our e-commerce websites. Quarterly fluctuations in our operating results may, in turn, cause the price of our stock to fluctuate substantially. We believe that quarterly comparisons of our financial results are not necessarily meaningful and should not be relied upon as an indication of our future performance.
The loss of members of our executive and senior management team may prevent us from executing our business strategy.
Our future success depends in large part upon the continued services of key members of our executive and senior management team. Many of our executive officers are long-tenured and have a deep knowledge and understanding of our business. Our senior officers bring a diverse skill set to our management team, which we rely on for strategy and direction as the Company grows and diversifies. The loss of the services of any of these key employees could seriously harm our ability to execute our business strategy. Further, all of our officers are at-will employees. The loss of any of these key employees may cause us to incur significant costs in identifying, hiring, training and retaining their replacements.
We rely on highly skilled personnel, and if we are unable to retain or motivate key personnel or hire qualified personnel, or implement the appropriate processes and systems to support them, we may not be able to maintain our operations or grow effectively.
Our performance is largely dependent on the talents and efforts of highly skilled individuals, including font designers who are recognized as leaders in the industry and experienced software engineers. These individuals have acquired specialized knowledge and skills with respect to us and our operations. These individuals can be terminated or can leave our employ at any time. Some of these individuals are consultants. If any of these individuals or a group of individuals were to terminate their employment unexpectedly or end their consulting relationship sooner than anticipated, we could face substantial difficulty in hiring qualified successors, could incur significant costs in connection with their termination and could experience a loss in productivity while any such successor obtains the necessary training and experience.
Our future success depends on our continuing ability to identify, hire, develop, motivate and retain highly skilled personnel and consultants for all areas of our organization to drive the execution of our strategic vision. In this regard, if we are unable to hire, train and support, with internal systems and processes, a sufficient number of qualified employees and consultants for any reason or retain employees or consultants with the required expertise, we may not be able to implement our current initiatives or grow effectively or execute our business strategy successfully.
Risks Related to the Securities Markets and Investment in our Common Stock
Market volatility may affect our stock price and the value of your investment.
The market price of our common stock may fluctuate significantly in response to a number of factors, most of which we cannot control, including:
| • | announcements of new products, services or technologies, commercial relationships, acquisitions or other events by us or our competitors; |
| • | fluctuations in stock market prices and trading volumes of similar companies; |
| • | variations in our quarterly operating results; |
| • | changes in our financial guidance or securities analysts’ estimates of our financial performance; |
26
Table of Contents
| • | changes in accounting principles; |
| • | sales of large blocks of our common stock, including sales by our executive officers, directors and significant stockholders; |
| • | additions or departures of key personnel; |
| • | discussion of us or our stock price by the financial press and in online investor communities; |
| • | general market or economic conditions, including factors unrelated to our operating performance or the operating performance of our competitors; and |
| • | other risks and uncertainties described in these “Risk Factors”. |
Market prices of technology companies have been extremely volatile. Stock prices of many technology companies have often fluctuated in a manner unrelated or disproportionate to the operating performance of such companies. In the past, following periods of market volatility, stockholders have often instituted securities class action litigation. If we were involved in securities litigation, it could have a substantial cost and divert resources and the attention of management from our business.
The structure of our current Credit Facility could affect our financing options and liquidity.
We have a five-year, $120.0 million secured revolving credit facility (the “Credit Facility”) with Wells Fargo Capital Finance LLC, the administrative agent for a syndicate of Lenders. Borrowings under the Credit Facility bear interest at a variable rate based upon, at the Company’s option, either London Interbank Offering Rate, (“LIBOR”) or the base rate, plus in each case, an applicable margin. The Credit Facility contains certain financial covenants and is secured by substantially all of our assets. In the event that we draw down on the Credit Facility, it could have important consequences to our business or the holders of our common stock, including:
| • | limiting our ability to obtain additional financing in the future for working capital, capital expenditures or acquisitions; |
| • | requiring a significant portion of our cash flow from operations to be dedicated to the payment of the principal of and interest on our indebtedness, thereby reducing funds available for other purposes; and |
| • | making us more vulnerable to economic downturns and limiting our ability to withstand competitive pressures. |
Anti-takeover provisions in our charter documents and under Delaware law could make an acquisition of us, which may be beneficial to our stockholders, more difficult and may inhibit attempts by our stockholders to replace or remove our current management.
Provisions in our certificate of incorporation and by-laws may delay or prevent an acquisition of us or a change in our management. These provisions include a classified board of directors, a prohibition on actions by written consent of our stockholders and the ability of our board of directors to issue preferred stock without stockholder approval. In addition, because we are incorporated in Delaware, we are governed by the provisions of Section 203 of the Delaware General Corporation Law, which limits the ability of stockholders owning in excess of 15% of our outstanding voting stock to merge or combine with us. Although we believe these provisions collectively provide for an opportunity to obtain greater value for stockholders by requiring potential acquirers to negotiate with our board of directors, they would apply even if an offer rejected by our board were considered beneficial by some stockholders. In addition, these provisions may frustrate or prevent any attempts by our stockholders to replace or remove our current management by making it more difficult for stockholders to replace members of our board of directors, which is responsible for appointing the members of our management.
27
Table of Contents
We currently pay dividends on our common stock, but there is no guarantee that this will continue.
Beginning in the third quarter of 2012, our Board of Directors approved a quarterly dividend to shareholders of our common stock. Future payments and record dates are subject to board approval, however if our financial or operating conditions change, or if we fail to satisfy the restrictive covenants contained in the terms of our Credit Facility that limit our ability to make dividend payments, it may affect our ability to pay dividends on a quarterly basis or at all.
We may require additional capital, and raising additional funds by issuing securities or additional debt financing may cause dilution to existing stockholders, restrict our operations or require us to relinquish proprietary rights.
We may need to raise additional capital in the future. We may raise additional funds through public or private equity offerings or debt financings. To the extent that we raise additional capital by issuing equity securities, our existing stockholders’ ownership will be diluted. Any new debt financing we enter into may involve covenants that restrict our operations more than our current credit facility. These restrictive covenants would likely include limitations on additional borrowing, specific restrictions on the use of our assets and our ability to pay dividends, as well as prohibitions on our ability to create liens, make investments or repurchase stock.
| Item 1B. | Unresolved Staff Comments |
None.
| Item 2. | Properties |
The principal leased properties of the Company and its subsidiaries are listed in the table below.
| Location |
Principal Use |
Approximate Square Feet |
Lease term | |||||
| Facilities Used in Current Operations |
||||||||
| Bad Homburg, Germany |
Software Development, Marketing, Sales and Administrative |
16,000 | Leased; expires in December 2017 | |||||
| Woburn, Massachusetts, USA |
Software Development, Marketing, Sales, Administrative and Corporate | 81,000 | Leased; expires September 2022 with two 5-year renewal options | |||||
We also maintain fourteen additional leased facilities in San Francisco and Los Altos, California; Boulder, Colorado; Elk Grove Village, Illinois; New York City, New York; Plaistow, New Hampshire; Penarth, Salfords and London, United Kingdom; Berlin, Germany; Noida, India; Hong Kong, China; Seoul, South Korea; and Tokyo, Japan. These additional offices occupy approximately 56,000 square feet in the aggregate. We do not consider any specific leased facility to be material to our operations. We believe equally suited facilities are available in several other areas throughout the United States and abroad.
| Item 3. | Legal Proceedings |
From time to time, we may be a party to various claims, suits and complaints. We do not believe that there are claims or legal proceedings that, if determined adversely to us, would have a material adverse effect on our business, results of operations or financial condition.
| Item 4. | Mine Safety Disclosures |
Not applicable.
28
Table of Contents
PART II
| Item 5. | Market for Registrant’s Common Equity, Related Stockholder Matters and Issuer Purchases of Equity Securities |
Market Information and Related Stockholder Matters
Our common shares, $0.001 par value, traded on the NASDAQ Global Market under the symbol “TYPE” from July 25, 2007 until March 17, 2008 and on the NASDAQ Global Select Market since March 18, 2008. Prior to July 25, 2007, there was no public market for our common stock.
The following table sets forth, for the periods indicated, the high and low closing sales prices per share of our common stock as reported by the NASDAQ Global Select Market.
| High | Low | |||||||
| Period 2014: |
||||||||
| First Quarter |
$ | 32.07 | $ | 28.18 | ||||
| Second Quarter |
31.16 | 24.82 | ||||||
| Third Quarter |
30.64 | 27.78 | ||||||
| Fourth Quarter |
29.23 | 26.77 | ||||||
| Period 2013: |
||||||||
| First Quarter |
$ | 23.75 | $ | 16.28 | ||||
| Second Quarter |
25.61 | 22.00 | ||||||
| Third Quarter |
28.66 | 23.64 | ||||||
| Fourth Quarter |
32.67 | 27.13 | ||||||
The closing price of our common stock, as reported by the NASDAQ Global Select Market, was $31.91 on February 19, 2015.
Holders
As of February 19, 2015, there were approximately 248 holders of record of our common stock.
Dividends
The following table sets forth, for the dates indicated, dividends declared on our common stock.
| Declaration Date |
Per share amount |
|||
| Period 2014: |
||||
| October 28, 2014 |
$ | 0.08 | ||
| July 25, 2014 |
0.08 | |||
| April 28, 2014 |
0.08 | |||
| February 4, 2014 |
0.08 | |||
| Period 2013: |
||||
| October 23, 2013 |
$ | 0.06 | ||
| July 25, 2013 |
0.06 | |||
| April 29, 2013 |
0.06 | |||
| February 12, 2013 |
0.06 | |||
The Company paid a total of $11.8 million and $8.5 million in dividends during 2014 and 2013, respectively. We anticipate paying cash dividends on a quarterly basis in the future, subject to approval by our Board of Directors. On February 10, 2015, our Board of Directors declared a $0.10 per share quarterly cash dividend on our outstanding common stock.
29
Table of Contents
Securities Authorized for Issuance Under Equity Compensation Plans
The following table sets forth information regarding securities authorized for issuance under the Company’s equity compensation plans as of December 31, 2014. To date, the Company has not granted any warrants or rights.
| Plan Category |
Number of securities to be issued upon exercise of outstanding options |
Weighted- average exercise price of outstanding options |
Number of securities remaining available for future issuance under equity compensation plans (excluding securities reflected in first column) (3) |
|||||||||
| Equity compensation plans approved by security holders (1) |
2,007,801 | $ | 16.69 | 3,681,148 | ||||||||
| Equity compensation plans not approved by security holders (2) |
73,946 | $ | 12.72 | 332,020 | ||||||||
|
|
|
|
|
|||||||||
| Total |
2,081,747 | $ | 15.65 | 4,013,168 | ||||||||
|
|
|
|
|
|||||||||
| (1) | Includes our 2004 Stock Option and Grant Plan, or 2004 Award Plan, and our Second Amended and Restated 2007 Stock Option and Incentive Plan, or 2007 Award Plan. |
| (2) | Options issued in connection with our 2012 acquisition of Bitstream Inc. and 2010 acquisition of Ascender under Marketplace Rule 5635(c)(4) of the NASDAQ Global Select Market. 43,486 shares, 35,477 shares, 15,648 shares and 53,763 shares of restricted stock were also issued in connection with the Mark Boulton Design, Design By Front Limited, Bitstream Inc. and the Ascender acquisitions, respectively. |
| (3) | Total shares allocated to the plans less the total number of awards granted through December 31, 2014. |
The Company is subject to the listing requirements of the NASDAQ Global Select Market.
30
Table of Contents
Performance Graph
This performance graph shall not be deemed “filed” with the SEC or subject to Section 18 of the Exchange Act, nor shall it be deemed incorporated by reference in any of our filings under the Securities Act.
The following graph shows a comparison from December 31, 2009 through December 31, 2014 of the cumulative total return for our common stock, NASDAQ Composite Index and NASDAQ Computer Index. Such returns are based on historical results and are not intended to suggest future performance. Data assumes that dividends, if any, were reinvested.
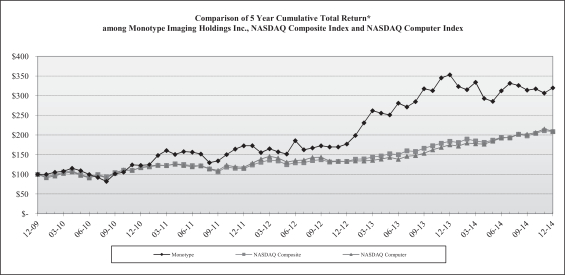
| * | Assumes $100 was invested on December 31, 2009 in our common stock and in the applicable indexes. |
Unregistered Sales of Equity Securities
On April 7, 2014 and April 14, 2014, in connection with the Company’s acquisition of Mark Boulton Design, we issued an aggregate of 43,486 shares of our restricted common stock as inducement awards to seven employees of Mark Boulton Design who became employees of the Company. On November 1, 2012 in connection with the Company’s acquisition of Design By Front Limited, we issued an aggregate of 35,477 shares of our restricted common stock as inducement awards to thirteen employees of Design By Front who became employees of the Company. On March 19, 2012, in connection with our acquisition of Bitstream Inc., we issued an aggregate of 15,648 shares of restricted common stock and 44,273 non-qualified stock options as inducement awards to thirteen Bitstream employees who became employees of the Company. These issuances were made in compliance with NASDAQ Marketplace Rule 5635(c) and in reliance upon exemptions from registration provided by Section 4(2) of the Securities Act.
Issuer Purchases of Securities
On October 23, 2013, the Company’s Board of Directors approved a share repurchase program of up to $50.0 million of the Company’s outstanding shares of common shares over the following two years. Intended to offset shareholder dilution, the Company expects purchases under the program will be made periodically, on the open market as business and market conditions warrant. The share repurchase program does not obligate the Company to acquire any particular amount of common stock, and the program may be suspended or discontinued at any time.
31
Table of Contents
Pursuant to the terms of our 2007 Award Plan and 2010 Inducement Stock Plan, or 2010 Inducement Plan, we automatically reacquire any unvested restricted shares at their original price from the grantee upon termination of employment.
The following table provides information about purchases by the Company during the quarter ended December 31, 2014 of equity securities that are registered by the Company pursuant to Section 12 of the Exchange Act:
Monotype Imaging Holdings Inc. Purchases of Equity Securities
| Period |
Total Number of Shares Purchased |
Weighted- average Price Paid per Share |
Total Number of Shares Purchased as Part of Publicly Announced Plans or Programs |
Maximum Number (or Approximate Dollar Value) of Shares that May Yet be Purchased Under the Plans or Programs |
||||||||||||
| October 1, 2014 to October 31, 2014(1)(2) |
57,176 | $ | 26.60 | 55,200 | $ | 20,218,365 | ||||||||||
| November 3, 2014 to November 28, 2014(1)(2) |
25,825 | $ | 27.32 | 25,000 | 19,510,495 | |||||||||||
| December 1, 2014 to December 31, 2014(1)(2) |
53,121 | $ | 25.76 | 49,758 | 18,139,421 | |||||||||||
|
|
|
|
|
|||||||||||||
| Total |
136,122 | $ | 26.46 | 129,958 | 18,139,421 | |||||||||||
|
|
|
|
|
|||||||||||||
| (1) | The Company purchased 6,164 shares of unvested restricted stock in accordance with the Second Amended and Restated 2007 Stock Option and Incentive Plan (the “2007 Stock Option Plan”). The price paid by the Company was determined pursuant to the terms of the 2007 Stock Option Plan and related restricted stock agreements. |
| (2) | The Company purchased shares of common stock in accordance with its share repurchase program announced on October 31, 2013. The Company purchased shares on the open market at prevailing market prices. |
The Company repurchased 100,000 shares of common stock for $2.8 million in the period of January 13 to January 30, 2015, at a weighted-average price per share of $28.32, and 36,700 shares of common stock for $1.1 million in the period of February 2 to February 19, 2014, at a weighted-average price per share of $30.95. The Company purchased these shares on the open market at prevailing market prices. At February 19, 2015, $14.2 million remains for future purchases under the share repurchase plan.
32
Table of Contents
| Item 6. | Selected Financial Data |
The following selected consolidated financial data should be read in conjunction with our consolidated financial statements and related notes and “Management’s Discussion and Analysis of Financial Condition and Results of Operations” appearing elsewhere in this report. The data presented for the years ended December 31, 2014, 2013 and 2012, and as of December 31, 2014 and 2013, are derived from our audited consolidated financial statements included elsewhere in this report. The data presented for the years ended December 31, 2011 and 2010, and as of December 31, 2012, 2011 and 2010, are derived from our consolidated financial statements not included in this report.
| Years Ended December 31, | ||||||||||||||||||||
| 2014 | 2013 | 2012 | 2011 | 2010 | ||||||||||||||||
| Consolidated Statement of Income Data: |
||||||||||||||||||||
| Revenue |
$ | 184,500 | $ | 166,624 | $ | 149,861 | $ | 123,212 | $ | 106,659 | ||||||||||
| Cost of revenue |
28,583 | 23,776 | 21,005 | 10,155 | 7,477 | |||||||||||||||
| Cost of revenue—amortization of acquired technology |
4,574 | 4,560 | 4,051 | 3,169 | 3,488 | |||||||||||||||
|
|
|
|
|
|
|
|
|
|
|
|||||||||||
| Total cost of revenue |
33,157 | 28,336 | 25,056 | 13,324 | 10,965 | |||||||||||||||
|
|
|
|
|
|
|
|
|
|
|
|||||||||||
| Gross profit |
151,343 | 138,288 | 124,805 | 109,888 | 95,694 | |||||||||||||||
| Marketing and selling |
49,580 | 42,019 | 35,953 | 32,622 | 25,935 | |||||||||||||||
| Research and development |
20,684 | 19,897 | 18,007 | 16,540 | 15,404 | |||||||||||||||
| General and administrative |
23,599 | 19,720 | 18,908 | 17,413 | 16,488 | |||||||||||||||
| Amortization of other intangibles |
5,398 | 5,963 | 5,469 | 5,071 | 4,795 | |||||||||||||||
|
|
|
|
|
|
|
|
|
|
|
|||||||||||
| Total operating expenses |
99,261 | 87,599 | 78,337 | 71,646 | 62,622 | |||||||||||||||
|
|
|
|
|
|
|
|
|
|
|
|||||||||||
| Income from operations |
52,082 | 50,689 | 46,468 | 38,242 | 33,072 | |||||||||||||||
| Other (income) expense: |
||||||||||||||||||||
| Interest expense, net |
1,034 | 1,272 | 1,725 | 2,754 | 4,405 | |||||||||||||||
| Loss on extinguishment of debt |
— | — | — | 422 | — | |||||||||||||||
| Other expense, net |
1,628 | 1,469 | 563 | 446 | 1,687 | |||||||||||||||
|
|
|
|
|
|
|
|
|
|
|
|||||||||||
| Total other expense |
2,662 | 2,741 | 2,288 | 3,622 | 6,092 | |||||||||||||||
| Income before provision for income taxes |
49,420 | 47,948 | 44,180 | 34,620 | 26,980 | |||||||||||||||
| Provision for income taxes |
16,875 | 16,863 | 15,215 | 11,951 | 8,620 | |||||||||||||||
|
|
|
|
|
|
|
|
|
|
|
|||||||||||
| Net income |
$ | 32,545 | $ | 31,085 | $ | 28,965 | $ | 22,669 | $ | 18,360 | ||||||||||
|
|
|
|
|
|
|
|
|
|
|
|||||||||||
| Net income available to common stockholders—basic |
$ | 31,940 | $ | 30,582 | $ | 28,496 | $ | 22,302 | $ | 18,237 | ||||||||||
|
|
|
|
|
|
|
|
|
|
|
|||||||||||
| Net income available to common stockholders—diluted |
$ | 31,950 | $ | 30,582 | $ | 28,510 | $ | 22,302 | $ | 18,237 | ||||||||||
|
|
|
|
|
|
|
|
|
|
|
|||||||||||
| Net income per common share: |
||||||||||||||||||||
| Basic |
$ | 0.83 | $ | 0.81 | $ | 0.78 | $ | 0.63 | $ | 0.52 | ||||||||||
|
|
|
|
|
|
|
|
|
|
|
|||||||||||
| Diluted |
$ | 0.81 | $ | 0.78 | $ | 0.76 | $ | 0.61 | $ | 0.51 | ||||||||||
|
|
|
|
|
|
|
|
|
|
|
|||||||||||
| Weighted-average number of common shares outstanding—basic |
38,565,368 | 37,833,817 | 36,311,835 | 35,357,630 | 34,762,919 | |||||||||||||||
| Weighted-average number of common shares outstanding—diluted |
39,466,717 | 39,285,651 | 37,561,953 | 36,817,379 | 35,990,295 | |||||||||||||||
| Cash dividends declared per common share |
$ | 0.32 | $ | 0.24 | $ | 0.08 | $ | — | $ | — | ||||||||||
|
|
|
|
|
|
|
|
|
|
|
|||||||||||
33
Table of Contents
| 2014 | 2013 | 2012 | 2011 | 2010 | ||||||||||||||||
| Consolidated Summary Balance Sheet Data: |
||||||||||||||||||||
| Cash and cash equivalents |
$ | 90,325 | $ | 78,411 | $ | 39,340 | $ | 53,850 | $ | 42,786 | ||||||||||
| Total current assets |
109,456 | 97,013 | 53,217 | 64,905 | 50,676 | |||||||||||||||
| Total assets |
374,458 | 356,359 | 320,066 | 283,822 | 278,805 | |||||||||||||||
| Total current liabilities |
33,473 | 28,318 | 39,273 | 32,380 | 31,830 | |||||||||||||||
| Total debt |
— | — | 22,321 | 37,321 | 65,859 | |||||||||||||||
| Additional paid-in capital |
232,522 | 209,376 | 179,094 | 167,448 | 155,791 | |||||||||||||||
| Total stockholders’ equity |
295,113 | 286,875 | 235,519 | 198,361 | 164,982 | |||||||||||||||
| Item 7. | Management’s Discussion and Analysis of Financial Condition and Results of Operations |
You should read the following discussion and analysis of our financial condition and results of operations in conjunction with our consolidated financial statements and notes to those statements, appearing elsewhere in this report. This report contains forward-looking statements reflecting our current expectations that involve risks and uncertainties, such as statements of our plans, objectives, expectations and intentions. The cautionary statements made in this report should be read as applying to all related forward-looking statements wherever they appear in this report. Our actual results may differ materially from those indicated in the forward-looking statements due to a number of factors, including those discussed in Item 1A, Risk Factors and elsewhere in this report.
Overview
We are a leading provider of type, technology and expertise for creative applications and consumer devices. Our vision is that our fonts and technology empower every word and experience. We strive to enable the best user experience and ensure brand integrity, regardless of device, platform or language. We help creative professionals, consumer device manufacturers and independent software vendors connect their brands, content, products and services to consumers and businesses everywhere, from content creation to consumption. Monotype is home to some of the world’s best known typeface collections. Along with our custom type services, our solutions enable customers to express their creativity, while our tools and technologies improve creative workflows and maximize efficiency as content is published or distributed. Our solutions provide worldwide language coverage and high-quality text, and our embedded solutions support compelling user interfaces and brand fidelity by providing for the display of content on any device or platform, as the author intended. We offer more than 25,000 typeface designs, and include some of the world’s most widely used designs, such as the Times New Roman®, Helvetica®, Frutiger®, ITC Franklin Gothic™, FF Meta and Droid™ typefaces, and support more than 250 Latin and non-Latin languages. Our e-commerce websites, including myfonts.com, fonts.com, fontshop.com, linotype.com and fontfont.com, which attracted more than 77 million visits in 2014 from over 200 countries and territories, offer thousands of high-quality font products, in some cases more than 127,000, including our own fonts from the Monotype Libraries as well as fonts from third parties.
On July 14, 2014, the Company purchased all of the outstanding stock of FontShop International GmbH, a privately-held font distributor located in Berlin, Germany, its wholly-owned subsidiary FontShop International, Inc. based in San Francisco, California, the FontFont typeface library, FontShop AG of Berlin, the largest distributor of the FontFont library, and certain other typeface families, collectively FontShop, for an aggregate purchase price of approximately $13.0 million plus a working capital adjustment of approximately $1.8 million. We paid approximately $11.9 million from cash on hand at the time of the acquisition, and the remainder, or $2.9 million, was paid in January 2015. Of the purchase price, approximately $8.5 million and $6.3 million have been preliminarily allocated to intangible assets and goodwill, respectively. The purchase price has been allocated to the tangible and intangible assets acquired and liabilities assumed based upon the respective estimates of fair value as of the date of the acquisition, which remains preliminary as of December 31, 2014, and using assumptions that the Company management believes are reasonable given the information currently available. The
34
Table of Contents
final allocation of the purchase price to intangible assets, goodwill and deferred tax assets and liabilities may differ materially from the information presented in these audited consolidated financial statements. On October 9, 2014, FontShop International GmbH was merged into Monotype Germany effective August 1, 2014. Following the merger, FontShop International Inc. is a wholly-owned subsidiary of Monotype Germany. On October 28, 2014, FontShop AG was merged into Monotype Germany. Fifty employees joined the Company in connection with the acquisition.
On April 7, 2014, the Company purchased all of the outstanding stock of Mark Boulton Design Limited, a privately-held Web design studio located in Cardiff, Wales, United Kingdom, for $0.8 million in cash. The Company issued approximately $1.0 million in restricted stock awards in connection with the acquisition, which vest based upon continued employment over four years. The purchase price has been allocated to goodwill. Following the acquisition, Mark Boulton Design Limited became a wholly- owned subsidiary of the Company. Seven former employees of Mark Boulton Design Limited joined the Company in connection with the acquisition.
Sources of Revenue
We derive revenue from two principal sources: licensing our fonts and font related services to creative and business professionals, which we refer to as our Creative Professional revenue, and licensing our text imaging solutions to consumer device manufacturers and independent software vendors, which we refer to as our OEM revenue. We derive our Creative Professional revenue primarily from brands, agencies, publishers, corporations, enterprises, small businesses and individuals. We derive our OEM revenue primarily from consumer device manufacturers. Some of our revenue streams, particularly project-related and custom revenue where spending is largely discretionary in nature, have historically been and we expect them to continue to be in the future, susceptible to weakening economic conditions.
Our customers are located in the United States, Asia, Europe, and throughout the rest of the world, and our operating subsidiaries are located in the United States, the United Kingdom, Germany, India, China and Japan. We are dependent on international sales by our foreign operating subsidiaries for a substantial amount of our total revenue. Revenue from our China subsidiary is generally from Asian customers and revenue from our other subsidiaries is from customers in a number of different countries, including the United States. We attribute revenue to geographic areas based on the location of our subsidiary receiving such revenue. For example, licenses may be sold to a large international company headquartered in South Korea, but the sale is received and recorded by our subsidiary located in the United States. In this example, the revenue would be reflected in the United States totals in the table below.
| 2014 | 2013 | 2012 | ||||||||||||||||||||||
| Sales | % of Total | Sales | % of Total | Sales | % of Total | |||||||||||||||||||
| (In thousands of dollars, except %) | ||||||||||||||||||||||||
| United States |
$ | 96,696 | 52.4 | % | $ | 91,037 | 54.7 | % | $ | 78,653 | 52.5 | % | ||||||||||||
| United Kingdom |
10,716 | 5.8 | 7,029 | 4.2 | 5,214 | 3.5 | ||||||||||||||||||
| Germany |
23,049 | 12.5 | 18,331 | 11.0 | 19,717 | 13.1 | ||||||||||||||||||
| Japan |
53,318 | 28.9 | 49,706 | 29.8 | 45,739 | 30.5 | ||||||||||||||||||
| Other Asia |
721 | 0.4 | 521 | 0.3 | 538 | 0.4 | ||||||||||||||||||
|
|
|
|
|
|
|
|
|
|
|
|
|
|||||||||||||
| Total |
$ | 184,500 | 100.0 | % | $ | 166,624 | 100.0 | % | $ | 149,861 | 100.0 | % | ||||||||||||
|
|
|
|
|
|
|
|
|
|
|
|
|
|||||||||||||
For the years ended December 31, 2014, 2013 and 2012, sales by our subsidiaries located outside North America comprised 47.6%, 45.3% and 47.5%, respectively, of our total revenue. We expect that sales by our international subsidiaries will continue to represent a substantial portion of our revenue for the foreseeable future. Future international revenue will depend on the continued use and expansion of our text imaging solutions worldwide.
35
Table of Contents
We derive a significant portion of our OEM revenue from a limited number of customers, in particular manufacturers of laser printers and consumer electronic devices. For the years ended December 31, 2014, 2013 and 2012, our top ten licensees by revenue accounted for approximately 35.3%, 37.2% and 41.0% of our total revenue, respectively. No one customer accounted for more than 10% of our total revenue in 2014, 2013 or 2012. For the quarter ended December 31, 2013, one customer accounted for 10.2% of our total revenue. For the quarters ended December 2014 and 2012, no customer individually accounted for more than 10% of our total revenue.
Cost of Revenue
Our cost of revenue consists of font license fees that we pay on certain fonts that are owned by third parties, allocated internal engineering expense and overhead costs directly related to custom design services. License fees that we pay to third parties are typically based on a percentage of our Creative Professional and OEM revenue and do not involve minimum fees. Our cost of OEM revenue is typically lower than our cost of Creative Professional revenue because we own a higher percentage of the fonts licensed to our OEM customers, provide value-added technology and have negotiated lower royalty rates on the fonts we license from third parties because of volume. The cost of our custom design service revenue is substantially higher than the cost of our other revenue and, as a result, our gross margin varies from period-to-period depending on the level of custom design revenue recorded.
Cost of revenue also includes amortization of acquired technology, which we amortize over 8 to 15 years. For purposes of amortizing acquired technology we estimate the remaining useful life of the technology based upon various considerations, including our knowledge of the technology and the way our customers use it. We use the straight-line method to amortize our acquired technology. There is no reliable evidence to suggest that we should expect any other pattern of amortization than an even pattern, and we believe this best reflects the expected pattern of economic usage.
Gross Profit
Our gross profit percentage is influenced by a number of factors including product mix, pricing and volume at any particular time. However, our cost of OEM revenue is typically lower than our cost of Creative Professional revenue because we own a higher percentage of the fonts licensed to our OEM customers, provide value-added technology and have negotiated lower royalty rates on the fonts we license from third parties because of volume. Within our Creative Professional business, the cost of our custom design service revenue is substantially higher than the cost of our other revenue. As a result, our gross profit varies from period-to-period depending on the mix between, and within, Creative Professional and OEM revenue.
Marketing and Selling
Our marketing and selling expense consists of salaries, bonuses, commissions and benefits related to our marketing and selling personnel, business travel expenses, advertising and trade show expenses, web-related expenses, allocated facilities costs and other overhead expenses. Sales commission expense varies as a function of revenue and goal achievement from period-to-period.
Research and Development
Our research and development expense consists of salaries, bonuses and benefits related to our research and development, engineering, font design and integration support personnel and their business travel expenses, license fees related to certain of our technology licenses, expenses for contracted services and allocated facilities costs and other overhead expenses. Our research and development expense in a given period may be reduced to the extent that internal engineering resources are allocated to cost of revenue for custom design services.
36
Table of Contents
Our research and development is primarily focused on enhancing the functionality of our text imaging solutions and developing new products. From time-to-time we license third-party font technology in connection with new technology development projects that are part of our research and development efforts. Our research and development costs are expensed as incurred.
General and Administrative
Our general and administrative expense consists of salaries, bonuses and benefits related to our general and administrative personnel, accounting, legal and other professional fees, allocated facilities costs and other overhead expenses and insurance costs.
Amortization of Intangible Assets
We amortize intangible assets acquired as follows:
| • | Customer relationships—7 to 16 years; |
| • | Acquired technology—8 to 15 years; and |
| • | Non-compete agreements—3 to 6 years. |
For purposes of amortization, we estimate the life of customer relationships based upon various considerations, including our knowledge of the industry and the marketplace in which we operate. We amortize non-compete agreements over the stated life of the agreement. We use the straight-line method to amortize our intangible assets. There is no reliable evidence to suggest that we should expect any other pattern of amortization than an even pattern, and we believe this best reflects the expected pattern of economic usage.
Critical Accounting Policies
The preparation of financial statements and related disclosures in conformity with generally accepted accounting principles, or GAAP, and our discussion and analysis of our financial condition and results of operations requires us to make judgments, assumptions and estimates that affect the amounts reported in our consolidated financial statements and accompanying notes. We base our estimates on historical experience and on various other assumptions that we believe are reasonable under the circumstances, the results of which form the basis for judgments about the carrying values of assets and liabilities. Actual results may differ from these estimates.
We believe the following critical accounting policies affect our more significant judgments used in the preparation of our consolidated financial statements. Additional information about our critical accounting policies may be found in Note 2 to our consolidated financial statements in Item 8 of this Annual Report on Form 10-K.
Revenue Recognition
We recognize revenue in accordance with ASC Topic No. 985-605, Software—Revenue Recognition. Revenue is recognized when persuasive evidence of an agreement exists, the product has been delivered or services have been provided, the fee is fixed or determinable, and collection of the fee is probable. However, determining whether and when some of these criteria have been satisfied often involves assumptions and judgments that can have a significant impact on the timing and amount of revenues the Company reports. For example, the Company often receives multiple purchase orders or contracts from a single customer or a group of related parties that are evaluated to determine if they are, in effect, parts of a single arrangement. If they are determined to be parts of a single arrangement, revenues are recorded as if a single multiple-element arrangement exists. In addition, arrangements with customers may include
37
Table of Contents
multiple deliverables, or multiple elements in a single purchase order or contract. The fee for such arrangement is allocated to the various elements based on vendor-specific objective evidence of fair value, or VSOE, and revenue is recognized accordingly. In the absence of VSOE, all revenue from the arrangement is deferred until the earlier of the point at which (a) such sufficient VSOE does exist or (b) all elements of the arrangement have been delivered. In certain circumstances, the revenue is recognized ratably, in accordance with the revenue recognition guidance.
Creative Professional Revenue
Our Creative Professional revenue is derived from font licenses, font related services and from custom font design services. We license fonts directly to end-users through our e-commerce websites, via telephone, e-mail and indirectly through third-party resellers. Font related services refer to our web font services and web design tools. We also license fonts and provide custom font design services to graphic designers, advertising agencies, media organizations and corporations. We refer to direct, indirect and custom revenue, as non-web revenue, and refer to revenue that is derived from our websites, as web revenue.
Revenue from font licenses to our e-commerce customers is recognized upon payment by the customer and the software embodying the font is shipped or made available. Revenue from font licenses to other customers is recognized upon shipment of the software embodying the font and when all other revenue recognition criteria have been met. Revenue from resellers is recognized upon notification from the reseller that our font product has been licensed and when all other revenue recognition criteria have been met. Custom font design services are generally recognized upon delivery. Font related service revenue is mainly subscription based and it may contain software as a service. The subscription revenue is recognized ratably over the subscription period. We consider web server and commercial rights to online fonts as recurring revenue and it is recognized upon payment by the customer and proof of font delivery, when all other revenue recognition criteria have been met. Contract accounting is used where services are deemed essential to the software.
OEM Revenue
Our OEM revenue is derived substantially from per-unit royalties received for printer imaging and printer driver, or printer products, and display imaging products. Under our licensing arrangements we typically receive a royalty for each product unit incorporating our fonts and technology that is shipped by our OEM customers. We also receive OEM revenue from fixed fee licenses with certain of our OEM customers. Fixed fee licensing arrangements are not based on units the customer ships, but instead, customers pay us on a periodic basis for the right to embed our fonts and technology. Although significantly less than royalties from per-unit shipments and fixed fees from OEM customers, we also receive revenue from software application and operating systems vendors, who include our fonts and technology in their products, and for font development. Many of our per-unit royalty licenses continue for the duration that our OEM customers ship products that include our technology, unless terminated for breach. Other licenses have terms that typically range from one to five years, and usually provide for automatic or optional renewals. We recognize revenue from per-unit royalties in the period during which we receive a royalty report from a customer, typically one quarter after royalty-bearing units are shipped, as we do not have the ability to estimate the number of units shipped by our customers. Revenue from fixed fee licenses is generally recognized when it is billed to the customer, so long as the product has been delivered, the license fee is fixed and non-refundable and collection is probable. OEM revenue also includes project-related agreements for which contract accounting may be used.
Goodwill, Indefinite-Lived Intangible Assets and Long-lived Assets
We record tangible and intangible assets acquired and liabilities assumed in a business combination under the purchase method of accounting. Amounts paid for acquisitions are allocated to the assets acquired and liabilities assumed based on their fair values at the date of acquisition. We allocate the
38
Table of Contents
excess of the cost of an acquired entity over the amounts assigned to assets acquired and liabilities assumed in a business combination to goodwill. The value initially assigned to the acquired assets and assumed liabilities, particularly intangible assets and goodwill, are subject to underlying assumptions that require significant management judgment. If different assumptions were used, it could materially impact the purchase price allocation and our financial position and results of operations.
We assess the impairment of goodwill and indefinite-lived intangible assets annually, or more frequently if events or changes in circumstances indicate that the carrying value of such assets exceeds their fair value. We perform our annual goodwill and indefinite-lived intangible impairment tests as of December 31. In accordance with Accounting Standards Update, ASU, No. 2011-08, Intangibles – Goodwill and Other (Topic 350): Testing Goodwill for Impairment, we have opted to perform a qualitative assessment of the fair value of the reporting unit. If the Company determines, on the basis of the qualitative factors, that the fair value of the reporting unit is more likely than not less than its carrying value, the quantitative two-step fair value impairment test is required. Otherwise, no further testing is required. Similarly, for indefinite-lived intangible assets, in accordance with ASU No. 2012-02, Intangibles – Goodwill and Other (Topic 350): Testing Indefinite-Lived Intangible Assets for Impairment, an entity has the option to first assess qualitative factors to determine whether it is necessary to perform the two-step test. If an entity believes, as a result of its qualitative assessment, that it is more-likely-than-not that the fair value of a reporting unit is less than its carrying amount, the quantitative impairment test is required. Otherwise, the quantitative test is optional for indefinite-lived intangible assets. For both years presented, 2014 and 2013, we assessed qualitative factors of goodwill, as described below, to determine whether it was more likely than not that the fair value of our reporting unit was impaired and determined that the fair value was more likely than not higher than its carrying value. For both years presented, 2014 and 2013, we assessed qualitative factors of our indefinite-lived intangible assets. We applied the relief from royalty method, a variation of the discounted cash flow method, to determine the fair value of these assets under the two-step test. In both years presented, we determined that the fair value was more likely than not higher that the carrying value.
With respect to both goodwill and indefinite-lived intangible assets, factors that could trigger an impairment review include significant negative industry or economic trends, exiting an activity in conjunction with a restructuring of operations, a sustained decrease in share price or current, historical or projected losses that demonstrate continuing losses associated with an asset. Impairment evaluations involve management estimates of useful lives and future cash flows, including assumptions about future conditions such as future revenue, operating expenses, the fair values of certain assets based on appraisals and industry trends. Actual useful lives and cash flows could be different from those estimated by our management. If this resulted in an impairment of goodwill and indefinite-lived intangible assets, it could have a material adverse effect on our financial position and results of operations.
Share Based Compensation
We account for share based compensation in accordance with ASC Topic No. 718, Compensation—Stock Compensation or ASC 718, which requires the measurement of compensation costs at fair value on the date of grant and recognition of compensation expense over the service period for awards expected to vest.
For restricted stock awards issued under the Company’s stock-based compensation plans, the fair value of each grant is calculated based on the Company’s stock price on the date of grant. For service-based awards, the Company recognizes compensation expense on a straight-line basis over the requisite service period of the award. For performance based awards, share based compensation expense is recognized over the expected performance achievement period of individual performance milestones when the achievement of each individual performance milestone becomes probable.
39
Table of Contents
The Company uses the Black-Scholes option pricing model to determine the weighted-average fair value of options granted and recognizes the compensation cost of share based awards on a straight-line basis over the vesting period of the award. The determination of the fair value of share based payment awards using the Black-Scholes model are affected by our stock price and a number of assumptions, including expected volatility, expected life, risk-free interest rate and expected dividends. Since July 2013, volatility is estimated based on our own stock price history. Prior to July 2013, we estimated volatility by using a blend of our stock price history, for the length of time we have market data for our stock and the historical volatility of similar public companies for the remainder of the expected term of each grant. This is estimated in accordance with Staff Accounting Bulletin No. 110, or SAB 110. Since July 2013, the expected life of awards is estimated based on actual historical exercise behavior of our employees. Prior to July 2013, the expected life of the awards is estimated based on the simplified method, as defined in SAB 110. The risk-free interest rate assumption is based on a U.S. treasury instrument whose term is consistent with the expected life of our awards. The expected dividend yield assumption for 2014 and 2013 are based on the actual annual yield. For 2012 the expected dividend yield assumption is based on our history of no expectation of paying dividends together with the actual yield of one quarterly dividend that was paid during the fourth quarter. Prior to 2012, the expected dividend yield assumption was based on our history up to that point, and the expectation of paying no dividends.
Forfeitures are estimated at the time of grant and revised, if necessary, in subsequent periods if actual forfeitures differ from those estimates. Share based compensation expense recognized in our financial statements is based on awards that are ultimately expected to vest. We evaluate the assumptions used to value our awards on a quarterly basis and if factors change and we employ different assumptions, share based compensation expense may differ significantly from what we have recorded in the past. If there are any modifications or cancellations of the underlying unvested securities, we may be required to accelerate, increase or cancel any remaining unearned share based compensation expense. Future share based compensation expense and unearned share based compensation will increase to the extent that we grant additional equity awards to employees or we assume unvested equity awards in connection with acquisitions.
During the years ended December 31, 2014, 2013 and 2012, we recorded total share based compensation expense of $10.8 million, $8.2 million and $6.9 million, respectively. In 2014, approximately $10.7 million of the $10.8 million was expensed. See Note 13 for further details. As of December 31, 2014, the Company had $20.1 million of unrecognized compensation expense related to employees and directors unvested stock options and restricted share awards that are expected to be recognized over a weighted-average period of 1.7 years. As of December 31, 2014, the performance criteria was not met on the performance based restricted stock units; however, if the Company had determined that achievement of the performance criteria was probable by December 31, 2014, the Company would have $4.5 million of unrecognized compensation expense related to these awards.
Pension Plan
We account for our defined benefit pension plan in accordance with ASC Subtopic No. 715-30, Defined Benefit Plans—Pension. Our unfunded defined benefit pension plan was acquired in connection with our acquisition of our German subsidiary on August 1, 2006. The pension plan was closed to new participants in 2006. The pension plan covers substantially all employees of our German subsidiary who joined our German subsidiary prior to the plan closing. Benefits under this plan are based on the employees’ years of service and compensation. We fund the plan sufficiently to meet current benefits only. There are no assets associated with the plan. In 2014, 2013 and 2012 we paid $0.1 million, $91 thousand and $79 thousand, respectively, to the plan participants. At December 31, 2014 and 2013, our unfunded position was $5.7 million and $5.1 million, respectively. A significant portion of the pension benefit obligation is determined based on the rate of future compensation increases, inflation and interest
40
Table of Contents
rates. Given the fact that the pension plan is unfunded, changes in economic and market conditions may require us to increase cash contributions in future years. In addition, changes to our assumptions may materially impact the accrued pension liability.
Provision for Income Taxes
We provide for income taxes in accordance with ASC Topic No. 740, Income Taxes, or ASC 740. Under this method, a deferred tax asset or liability is determined based on the difference between the financial statement and the tax basis of assets and liabilities, as measured by enacted tax rates in effect when these differences are expected to be reversed. This process includes estimating current tax exposure together with assessing temporary differences resulting from differing treatment of items for tax and financial accounting purposes. These differences result in deferred tax assets and liabilities. We also assess the likelihood that our deferred tax assets will be recovered from future taxable income and, to the extent we believe recovery to be unlikely, we have established a valuation allowance. Significant judgment is required in determining the provision for income taxes, deferred tax assets and liabilities and any valuation allowance against our deferred tax assets. Our financial position and results of operations may be materially affected if actual results significantly differ from these estimates or the estimates are adjusted in future periods.
We have recorded a valuation allowance against certain deferred tax assets, including foreign tax credits, where we have determined that their future use is uncertain. ASC 740 requires a valuation allowance be established when it is “more likely than not” that all or a portion of deferred tax assets will not be realized. A review of all available positive and negative evidence is considered, including a company’s performance, the market environment in which the company operates, length of carry-back and carry-forward periods, existing sales backlog, future taxable income projections and tax planning strategies. We have historically provided valuation allowances on certain tax assets, due to the uncertainty of generating taxable income in the appropriate jurisdiction and of the appropriate character to realize such assets. In these instances, the Company has made the determination that it is “more likely than not” that all or a portion of the deferred tax will not be realized.
We will continue to review our deferred tax position on a periodic basis and will reflect any change in judgment as a discrete item in the related period.
The amount of income taxes we pay is subject to ongoing audits by federal, state and foreign tax authorities, which often result in proposed assessments. Our estimate for the potential outcome for any uncertain tax issue is highly judgmental. We believe we have adequately provided for any reasonably foreseeable outcome related to these matters. However, our future results may include favorable or unfavorable adjustments to our estimated tax liabilities in the period that the assessments are made or resolved, or when the statute of limitations for certain periods expires. As a result, our effective tax rate may fluctuate significantly on a quarterly basis.
As part of the process of preparing our consolidated financial statements, we are required to estimate our income taxes in each of the jurisdictions in which we operate. This process involves estimating our actual current tax expense together with assessing the future impact of temporary differences resulting from differing treatment of items for tax and accounting purposes. The tax effect of these temporary differences is shown on our December 31, 2014 consolidated balance sheet (see Note 11 to our consolidated financial statements) and denotes these differences as a net deferred tax liability of $30.0 million. This consists of total deferred tax liabilities of $43.5 million and net deferred tax assets of $13.5 million after providing a valuation allowance of $1.8 million.
41
Table of Contents
Results of Operations
The following table sets forth items in the consolidated statement of income as a percentage of sales for the periods indicated:
| Year Ended December 31, | ||||||||||||
| 2014 | 2013 | 2012 | ||||||||||
| Revenue: |
||||||||||||
| Creative Professional |
41.7 | % | 38.2 | % | 34.5 | % | ||||||
| OEM |
58.3 | 61.8 | 65.5 | |||||||||
|
|
|
|
|
|
|
|||||||
| Total revenue |
100.0 | 100.0 | 100.0 | |||||||||
| Cost of revenue |
15.5 | 14.3 | 14.0 | |||||||||
| Cost of revenue—amortization of acquired technology |
2.5 | 2.7 | 2.7 | |||||||||
|
|
|
|
|
|
|
|||||||
| Total cost of revenue |
18.0 | 17.0 | 16.7 | |||||||||
|
|
|
|
|
|
|
|||||||
| Gross profit |
82.0 | 83.0 | 83.3 | |||||||||
| Marketing and selling |
26.9 | 25.2 | 24.1 | |||||||||
| Research and development |
11.2 | 12.0 | 12.0 | |||||||||
| General and administrative |
12.8 | 11.8 | 12.6 | |||||||||
| Amortization of other intangible assets |
2.9 | 3.6 | 3.6 | |||||||||
|
|
|
|
|
|
|
|||||||
| Total operating expenses |
53.8 | 52.6 | 52.3 | |||||||||
|
|
|
|
|
|
|
|||||||
| Income from operations |
28.2 | 30.4 | 31.0 | |||||||||
| Interest expense, net |
0.5 | 0.7 | 1.1 | |||||||||
| Loss on foreign exchange |
1.0 | 0.7 | 0.4 | |||||||||
| (Gain) loss on derivatives |
(0.1 | ) | 0.2 | — | ||||||||
|
|
|
|
|
|
|
|||||||
| Total other expenses |
1.4 | 1.6 | 1.5 | |||||||||
| Income before provision for income taxes |
26.8 | 28.8 | 29.5 | |||||||||
| Provision for income taxes |
9.2 | 10.1 | 10.2 | |||||||||
|
|
|
|
|
|
|
|||||||
| Net income |
17.6 | % | 18.7 | % | 19.3 | % | ||||||
|
|
|
|
|
|
|
|||||||
Year Ended December 31, 2014 as Compared to Year Ended December 31, 2013
Sales by Market. We view our operations and manage our business as one segment; the development, marketing and licensing of technologies and fonts. Factors used to identify our single segment include the financial information available for evaluation by our chief operating decision maker, our president and chief executive officer, in determining how to allocate resources and assess performance. While our technologies and services are sold to customers in two principal markets Creative Professional and consumer device manufacturers and independent software vendors, together OEM, expenses and assets are not formally allocated to these markets, and operating results are assessed on an aggregate basis to make decisions about the allocation of resources. The following table presents revenue for these two principal markets (in thousands):
| 2014 | 2013 | Increase | ||||||||||
| Creative Professional |
$ | 76,961 | $ | 63,689 | $ | 13,272 | ||||||
| OEM |
107,539 | 102,935 | 4,604 | |||||||||
|
|
|
|
|
|
|
|||||||
| Total revenue |
$ | 184,500 | $ | 166,624 | $ | 17,876 | ||||||
|
|
|
|
|
|
|
|||||||
Revenue
Revenue was $184.5 million and $166.6 million for the years ended December 31, 2014 and 2013, respectively, an increase of $17.9 million, or 10.7%.
42
Table of Contents
Creative Professional revenue increased $13.3 million, or 20.8%, to $77.0 million for the year ended December 31, 2014, as compared to $63.7 million for the year ended December 31, 2013, primarily due to an increase in web and direct revenue. Web revenue increased mainly due to increased desktop revenue, partially due to our acquisition of FontShop in July 2014, and font license revenue, together with increased sales of our web font services, in the year ended December 31, 2014, as compared to the same period in 2013. Direct revenue increased partially as a result of recurring royalty and license web server applications and increased sales of our web font services to enterprise customers, period over period.
OEM revenue was $107.5 million and $102.9 million for the years ended December 31, 2014 and 2013, respectively, an increase of $4.6 million, or 4.5%, mainly due to increased revenue from per unit royalty arrangements with our printer and display imaging OEM customers.
Cost of Revenue
Cost of revenue, excluding amortization of acquired technology, increased $4.8 million, or 20.2%, to $28.6 million in the year ended December 31, 2014, as compared to $23.8 million for the year ended December 31, 2013. As a percentage of total revenue, cost of revenue, excluding amortization of acquired technology was 15.5% and 14.3% for the years ended December 31, 2014 and 2013, respectively. The increases, both in dollars and as a percentage of revenue, are predominantly due to variations in product mix. Our Creative Professional revenue typically has a higher associated cost than our OEM revenue because Creative Professional revenue contains a higher proportion of third party fonts, which carry a higher cost of revenue. In 2014, Creative Professional revenue was 41.7% of total revenue, as compared to 38.2% of total revenue in 2013. The increase in dollars is partially a result of increased sales volume and partially the result of a product mix change, period over period.
The portion of cost of revenue consisting of amortization of acquired technology was unchanged at $4.6 million in the years ended December 31, 2014 and 2013, respectively.
Gross Profit
Gross profit was 82.0% and 83.0% of revenue in the years ended December 31, 2014 and 2013, respectively, a decrease of 1.0 percentage point, primarily due to variations in product mix, as described above.
Operating Expenses
Marketing and Selling. Marketing and selling expense increased $7.6 million, or 18.0%, to $49.6 million for the year ended December 31, 2014, as compared to $42.0 million for the year ended December 31, 2013. Personnel expenses increased $4.8 million, mainly the result of additional headcount partially from our acquisition of FontShop and other targeted hiring, increased stock based compensation and variable compensation in the year ended December 31, 2014, as compared to the same period in 2013. Increased marketing activities, such as demand generation, brand promotions, tradeshows and online advertising contributed to a $2.7 million increase period over period.
Research and Development. Research and development expense was $20.7 million and $19.9 million in 2014 and 2013, respectively, an increase of $0.8 million, or 4.0%, mainly the result of personnel expenses. The increase in personnel and personnel related expenses primarily resulted from increased headcount, including additions from our FontShop acquisition, variable compensation, share based compensation and travel related expenses.
General and Administrative. General and administrative expense increased $3.9 million, or 19.7%, to $23.6 million in the year ended December 31, 2014, as compared to $19.7 million for the year ended December 31, 2013. Legal and professional services expenses increased $2.8 million in the year ended December 31, 2014, as compared to the same period in 2013, primarily the result of FontShop and Mark
43
Table of Contents
Boulton Design acquisition related expenses. Personnel and personnel related expenses increased $1.2 million in 2014, as compared to 2013, mainly due to increased share based compensation and travel expenses. Increased facilities related expenses, such as rent and insurance expenses, contributed $0.6 million to the overall increase period over period. These increases were partially offset by a $1.8 million reduction in expense recognized in the year ended December 31, 2014 due to an estimate revision for contingent acquisition consideration.
Amortization of Other Intangible Assets. Amortization of other intangible assets decreased $0.6 million, or 9.5%, to $5.4 million for the year ended December 31, 2014, as compared to $6.0 million for the year ended December 31, 2013, primarily a result of an asset that became fully amortized in October 2014.
Interest Expense, Net
Interest expense, net of interest income decreased $0.3 million, or 18.7%, to $1.0 million in the year ended December 31, 2014, as compared to $1.3 million in the year ended December 31, 2013. Interest expense, net of interest income in the year ended December 31, 2014, consisted mainly of unused line fees, in connection with our Credit Facility, as there was no debt outstanding. In the year ended December 31, 2013, interest expense, net of interest income consisted of interest associated with our Credit Facility until May 2013 when the debt was repaid in full and after that time, interest consisted mainly of unused line fees in connection with the Credit Facility.
Loss on Foreign Exchange
Loss on foreign exchange increased $0.7 million, or 60.8%, to $1.8 million in 2014, as compared to $1.1 million in 2013. The loss in both periods was the result of currency fluctuations on our foreign denominated receivables and payables.
(Gain) Loss on Derivatives
(Gain) loss on derivatives was a gain of $0.2 million and a loss of $0.4 million in 2014 and 2013, respectively, the net result of changes in the market value of our currency derivative contracts.
Provision for Income Taxes
Our effective tax rate was 34.2% and 35.2% for the years ended December 31, 2014 and 2013, respectively. The effective tax rate for the year ended December 31, 2014, included a benefit of 1.3% for the write down of the contingent acquisition consideration, based on changes in performance estimates. There was no similar item in 2013. The effective tax rate for 2014 included a benefit of 0.8% for federal research tax credits, as compared to a benefit of 1.1% in 2013. The 2013 rate includes both the 2012 and 2013 research credits, as the tax credit had expired in 2012 and was not renewed until 2013.
As of December 31, 2014, the total amount of unrecognized tax benefits was $8.2 million. At December 31, 2013, we had $6.2 million of unrecognized tax benefits. The increase in unrecognized tax benefits in 2014 relates primarily to uncertainty concerning potential transfer pricing adjustments. We classify potential interest and penalties as a component of tax expense. As of December 31, 2014 and 2013 we had $0.2 million and $56 thousand of accrued interest and penalties, respectively.
Year Ended December 31, 2013 as Compared to Year Ended December 31, 2012
Sales by Market. The following table presents revenue for these two principal markets (in thousands):
| 2013 | 2012 | Increase | ||||||||||
| Creative Professional |
$ | 63,689 | $ | 51,751 | $ | 11,938 | ||||||
| OEM |
102,935 | 98,110 | 4,825 | |||||||||
|
|
|
|
|
|
|
|||||||
| Total revenue |
$ | 166,624 | $ | 149,861 | $ | 16,763 | ||||||
|
|
|
|
|
|
|
|||||||
44
Table of Contents
Revenue
Revenue was $166.6 million and $149.9 million for the years ended December 31, 2013 and 2012, respectively, an increase of $16.8 million, or 11.2%, mainly due to increased Creative Professional revenue.
Creative Professional revenue increased $11.9 million, or 23.1%, to $63.7 million for the year ended December 31, 2013, as compared to $51.8 million for the year ended December 31, 2012, primarily due to an increase in web revenue. Web revenue increased $11.9 million, mainly due to a full twelve months of Bitstream revenue following the acquisition in March 2012, together with increased sales of our web font services. In addition, direct revenue increased primarily due to increased sales of our web font services. These increases were partially offset by a decrease in custom revenue, due to the timing of custom work in the year ended December 31, 2013, as compared to the same period in 2012.
OEM revenue was $102.9 million and $98.1 million for the years ended December 31, 2013 and 2012, respectively, an increase of $4.8 million, or 4.9%, mainly due to increased revenue from per unit royalty arrangements with our printer and display imaging OEM customers.
Cost of Revenue
Cost of revenue, excluding amortization of acquired technology, was $23.8 million and $21.0 million, for the years ended December 31, 2013 and 2012, respectively, an increase of $2.8 million, or 13.2%. As a percentage of total revenue, cost of revenue, excluding amortization of acquired technology was 14.3% and 14.0% for the years ended December 31, 2013 and 2012, respectively. The increase in cost of revenue, excluding amortization of acquired technology, was partially due to a full twelve months of Bitstream, following the acquisition in March 2012, and variations in product mix resulting from the acquisition of Bitstream. Bitstream’s web business sells a higher proportion of third-party fonts, which carry a higher cost of revenue. We expect our cost of revenue, excluding amortization of acquired technology, to fluctuate as a percentage of revenue from period to period due to variations in product mix.
The portion of cost of revenue consisting of amortization of acquired technology was $4.6 million and $4.1 million in the years ended December 31, 2013 and 2012, respectively, an increase of $0.5 million, or 12.6%, mainly due to our acquisitions of Bitstream, in March 2012, and Design by Front, in October 2012.
Gross Profit
Gross profit was 83.0% and 83.3% of revenue in the years ended December 31, 2013 and 2012, respectively, a decrease of 0.3 percentage points, primarily due to product mix as described above.
Operating Expenses
Marketing and Selling. Marketing and selling expense increased $6.0 million, or 16.9%, to $42.0 million for the year ended December 31, 2013, as compared to $36.0 million for the year ended December 31, 2012. Personnel expenses increased $2.7 million, mainly the result of a full twelve months of Design by Front and Bitstream personnel, targeted hiring, annual salary increases and increased share based compensation in 2013, as compared to 2012. Increased discretionary spending, such as website design work, targeted advertising and branding related expenses, contributed $1.3 million to the increase, period over period. Other expenses, such as processing fees on web sales, travel costs and facilities expenses increased $1.5 million in the year ended December 31, 2013, as compared to the same period in 2012.
45
Table of Contents
Research and Development. Research and development expense was $19.9 million and $18.0 million, in 2013 and 2012, respectively, an increase of $1.9 million, or 10.5%. The increase consists mainly of increased personnel expenses, primarily due to additional personnel, annual salary increases and increased share based compensation, and travel and facilities expense resulting from a full twelve months of Bitstream in 2013, as compared to 2012.
General and Administrative. General and administrative expense was $19.7 million and $18.9 million for the years ended December 31, 2013 and 2012, respectively, an increase of $0.8 million, or 4.3%. Personnel expenses increased $1.1 million, mainly due to annual salary increases and increased share based compensation expense in the year ended 2013, as compared to the same period in 2012. This increase was partially offset by a decrease in professional services expenses in 2013, as compared to 2012 when we acquired Bitstream and Design by Front.
Amortization of Other Intangible Assets. Amortization of other intangible assets was $6.0 million and $5.5 million for the years ended December 31, 2013 and 2012, respectively, an increase of $0.5 million, or 9.0%, primarily due to our acquisitions of Bitstream and Design by Front.
Interest Expense, Net
Interest expense, net of interest income decreased $0.4 million, or 26.3%, to $1.3 million in the year ended December 31, 2013, as compared to $1.7 million in the year ended December 31, 2012. The decrease in interest expense was the result of lower average total debt outstanding and an increase in the unused line fees. The average debt balance in the year ended December 31, 2013 was $4.6 million in the year ended December 31, 2013, as compared to $37.3 million in the same period in 2012. Borrowings under our Credit Facility were repaid in full in May 2013. Since June 2013, interest expense consists mainly of unused line fees in connection with our Credit Facility. By contrast, interest expense in the same period in 2012 related mainly to outstanding debt.
Loss on Foreign Exchange
Loss on foreign exchange was $1.1 million and $0.6 million in 2013 and 2012, respectively. The loss in both periods was the result of currency fluctuations on our foreign denominated receivables and payables.
Loss on Derivatives
Loss on derivatives was $0.4 million and $11 thousand in 2013 and 2012, respectively, the net result of changes in the market value of our currency derivative contracts. In the year ended December 31, 2013, the loss related to short term forward contracts, and in the same period in 2012, the loss was mainly due to an interest rate swap contract that expired in July 2012.
Provision for Income Taxes
Our effective tax rate was 35.2% and 34.4% for the years ended December 31, 2013 and 2012, respectively. The effective tax rate for the year ended December 31, 2013 included a charge of 1.7%, as compared to 1.0% in 2012, related to state income taxes, net of federal benefit. The effective tax rate for 2013 included a benefit of 1.1% for research credits. In 2012, the effective tax rate did not include this benefit, as the tax credit had expired, and was not renewed until 2013. The 2013 rate includes both the 2012 and 2013 research credits. The effective tax rate for the year ended December 31, 2012 included a larger income tax benefit received related to the reversal of reserves for uncertain tax positions, as compared to the same period in 2013.
As of December 31, 2013, the total amount of unrecognized tax benefits was $6.2 million. At December 31, 2012, we had $4.6 million of unrecognized tax benefits. We classify potential interest and penalties as a component of tax expense. As of December 31, 2013 and 2012 we had $56 thousand and $78 thousand of accrued interest and penalties, respectively.
46
Table of Contents
Recently Issued Accounting Pronouncements
Going Concern
In August 2014, the Financial Accounting Standards Board, or FASB issued ASU 2014-15, Presentation of Financial Statements – Going Concern (Subtopic 205-40); Disclosure of Uncertainties about an Entity’s Ability to Continue as a Going Concern, which requires management of a company to evaluate whether there is substantial doubt about the company’s ability to continue as a going concern. The ASU provides guidance on evaluating an entity’s ability to continue as a going concern and the content of any required footnote disclosure based on that evaluation. The assessment period is one year after the date of the financial statements are issued. The standard is effective for the Company on January 1, 2017. Early adoption is permitted. The Company is currently evaluating the impact of the adoption of ASU 2014-15, but we do not expect the adoption of this standard to have any impact on our consolidated financial statements.
Revenue Recognition
In May 2014, the Financial Accounting Standards Board, or FASB, issued Accounting Standards Update 2014-9, Revenue from Contracts with Customers (Topic 606), which provides a comprehensive new revenue recognition model that requires revenue to be recognized in a manner to depict the transfer of good or services to a customer at an amount that reflects the consideration expected to be received in exchange for those goods or services. This guidance is effective for annual reporting and interim periods beginning after December 15, 2016 and allows for either full retrospective or modified retrospective application, with early adoption not permitted. Accordingly, the standard is effective for the Company on January 1, 2017. The Company is currently evaluating the adoption method it will apply and the impact that this guidance will have on its financial statements and related disclosures.
Liquidity and Capital Resources
Cash Flows for the Years Ended December 31, 2014, 2013 and 2012
Since our inception, we have financed our operations primarily through cash from operations, private and public stock sales and long-term debt arrangements, as described below. We believe our existing cash and cash equivalents, our cash flow from operating activities and available bank borrowings will be sufficient to meet our anticipated cash needs for at least the next twelve months. At December 31, 2014, our principal sources of liquidity were cash and cash equivalents totaling $90.3 million and a $120.0 million revolving credit facility, of which there were no outstanding borrowings at December 31, 2014. On October 23, 2013, our Board of Directors approved a share repurchase program of up to $50.0 million of our outstanding common stock over the following two years, and in the fourth quarter of 2014, we used $31.9 million to purchase 1.1 million shares. Our future working capital requirements will depend on many factors, including the operations of our existing business, our potential strategic expansion, and future acquisitions we might undertake.
The following table presents our cash flows from operating activities, investing activities and financing activities for the periods presented (in thousands):
| Year Ended December 31, | ||||||||||||
| 2014 | 2013 | 2012 | ||||||||||
| Net cash provided by operating activities |
$ | 61,579 | $ | 51,336 | $ | 50,428 | ||||||
| Net cash used in investing activities |
(19,541 | ) | (2,196 | ) | (53,161 | ) | ||||||
| Net cash used in financing activities |
(29,122 | ) | (10,086 | ) | (11,753 | ) | ||||||
| Effect of exchange rates on cash and cash equivalents |
(1,002 | ) | 17 | (24 | ) | |||||||
|
|
|
|
|
|
|
|||||||
| Total increase in cash and cash equivalents |
$ | 11,914 | $ | 39,071 | $ | (14,510 | ) | |||||
|
|
|
|
|
|
|
|||||||
47
Table of Contents
Operating Activities
Significant variations in operating cash flows frequently occur because, from time to time, our customers make prepayments against future royalties. Prepayments may be required under the terms of our license agreements and are occasionally made on an elective basis and often cause large fluctuations in accounts receivable and deferred revenue. The timing and extent of such prepayments significantly impact our cash balances.
In 2014, we generated $61.6 million in cash from our operations. Net income after adjusting for depreciation and amortization, loss on retirement of fixed assets, amortization of deferred financing costs and accreted interest, adjustment to contingent consideration, share based compensation, provision for doubtful accounts, deferred income taxes, unrealized currency (loss) gain on foreign denominated intercompany and derivatives loss generated $57.7 million in cash. Increases in accounts receivable and deferred revenue used $0.9 million in cash, mainly due to timing of customer payments. Increases in prepaid expenses and other assets used $1.9 million in cash mainly due to insurance renewals and software licensing agreements paid prior to year end. Increases in accrued expenses and other liabilities generated $2.8 million in cash partially due to increased accruals related to increased dividend declared at December 31, 2014 compared to December 31, 2013. Accrued income taxes and excess tax benefit on stock options generated $3.8 million in cash during 2014.
In 2013, we generated $51.3 million in cash from our operations. Net income after adjusting for depreciation and amortization, amortization of deferred financing costs, loss on retirement of fixed assets, share based compensation, provision for doubtful accounts, deferred income taxes, unrealized currency gain on foreign denominated intercompany and accreted interest generated $56.8 million in cash. Increased accounts receivable and decreased deferred revenue used $3.0 million in cash, mainly due to timing of customer payments. Increases in prepaid expenses and other assets, net of increases in accrued expenses and other liabilities generated $0.9 million in cash mainly due to accruals related to the increased dividends declared at December 31, 2013 compared to December 31, 2012. Accrued income taxes and excess tax benefit on stock options used $3.5 million in cash during 2013.
In 2012, we generated $50.4 million in cash from our operations. Net income after adjusting for depreciation and amortization, amortization of deferred financing costs, loss on retirement of fixed assets, share based compensation, provision for doubtful accounts, deferred income taxes, unrealized currency gain on foreign denominated intercompany and derivatives loss generated $50.1 million in cash. Accounts receivable and deferred revenue generated $1.2 million in cash, mainly due to increased sales in 2012. Prepaid expenses and other assets and accrued expenses and other liabilities, net of accounts payable, generated $1.3 million in cash mainly due to increases in accrued expense related to our Bitstream operation. Income tax refunds receivable, accrued income taxes and excess tax benefit on stock options used $2.1 million in cash during 2012.
Investing Activities
During 2014, we used $19.5 million in investing activities for the purchase of $8.0 million of property and equipment and $11.5 million for acquisitions. During 2013, we used $2.2 million in investing activities mainly due to the purchase of property and equipment. During 2012, we used $49.1 million for the acquisition of Bitstream and $2.4 million for the acquisition of Design by Front, net of cash acquired. As of December 31, 2012, $2.1 million of additional costs were accrued for final adjustments and contingent consideration. We also used $1.6 million for the purchase of property and equipment, exclusive license and other intangible assets during 2012.
48
Table of Contents
Financing Activities
Cash used by financing activities in 2014 was $29.1 million. We received cash from exercises of stock options of $8.5 million and excess tax benefit on stock options provided $3.9 million. We paid shareholder dividends of $11.8 million in 2014. We also used $29.7 million to purchase treasury stock in 2014.
Cash used by financing activities in 2013 was $10.1 million. We repaid $22.3 million of borrowings against our revolving Credit Facility in 2013. We received cash from exercises of stock options of $16.1 million and excess tax benefit on stock options provided $6.8 million. We paid out shareholder dividends of $8.5 million in 2013. We also purchased $2.2 million in treasury stock in 2013.
Cash used by financing activities in 2012, was $11.8 million. Borrowings against our revolving Credit Facility amounted to $25.0 million to partially fund our acquisition of Bitstream, which was offset by $40.0 million in repayments in 2012. We received cash from exercises of stock options of $3.2 million and excess tax benefit on stock options provided $1.5 million. We also paid out a shareholder dividend of $1.5 million in 2012.
Dividends
Dividends are declared at the discretion of the Company’s Board of Directors and dependent on actual cash from operations, the Company’s financial condition and capital requirements and any other factors the Company’s Board of Directors may consider relevant. We anticipate this to be a recurring quarterly dividend with future payments and record dates subject to board approval. On October 28, 2014 the Board of Directors approved a $0.08 per share, quarterly cash dividend on our outstanding common stock. The record date was January 2, 2015 and the dividend was paid to shareholders on January 22, 2015. On February 10, 2015, our Board of Directors approved a $0.10 per share quarterly cash dividend on our outstanding common stock. The record date is set for April 1, 2015 and the dividend is payable to shareholders of record on April 21, 2015.
Credit Facility
On July 13, 2011 we entered into a five-year $120.0 million revolving credit facility (the “Credit Facility”). The Credit Facility replaced the Amended and Restated Credit Agreement, which was scheduled to expire on July 30, 2012. Borrowings under the Credit Facility bear interest based on the leverage ratio at either (i) the prime rate plus 0.5%, as defined in the credit agreement, or (ii) LIBOR plus 1.5%. The Company is required to pay an unused line fee equal to 0.375% per annum on the undrawn portion available under the revolving credit facility and variable per annum fees in respect of outstanding letters of credit. As of December 31, 2014 our rate, inclusive of applicable margins, was 3.75% for prime and we had no outstanding debt under the Credit Facility. There are no required repayments. The Company, in accordance with the Credit Facility, is permitted to request that the Lenders, at their election, increase the secured credit facility to a maximum of $140.0 million.
In addition, the Credit Facility provides that we maintain a maximum leverage ratio. The leverage ratio is defined as the ratio of aggregate outstanding indebtedness to trailing twelve months Adjusted EBITDA. Adjusted EBITDA is defined as consolidated net earnings (or loss), plus net interest expense, income taxes, depreciation and amortization and share based compensation expense, plus restructuring, issuance costs, cash non-operating costs and other expenses or losses minus cash non-operating gains and other non-cash gains; provided however that the aggregate of all cash non-operating expense shall not exceed $250 thousand and all such fees, costs and expenses shall not exceed $1.5 million on a trailing twelve months basis.
49
Table of Contents
Additional limits are imposed on acquisition related expenses. The Credit Facility contains financial covenants which include (i) a maximum ratio of consolidated total debt to consolidated adjusted EBITDA of 3.00:1.00, and (ii) a minimum consolidated fixed charge coverage ratio of 1.25:1.00. As of December 31, 2014, our leverage ratio was 0.00:1.00 and our fixed charge ratio was 3.77:1.00. Failure to comply with these covenants, or the occurrence of an event of default, could permit the lenders under the Credit Facility to declare all amounts borrowed under the Credit Facility, together with accrued interest and fees, to be immediately due and payable. In addition, the Credit Facility is secured by substantially all of our assets and places limits on the Company’s and its subsidiaries’ ability to incur debt or liens and engage in sale-leaseback transactions, make loans and investments, incur additional indebtedness, engage in mergers, acquisitions and asset sales, transact with affiliates and alter its business.
The following table presents a reconciliation from net income, which is the most directly comparable GAAP operating performance measure, to EBITDA and from EBITDA to Adjusted EBITDA as defined in our credit facilities (in thousands):
| Year Ended December 31, | ||||||||||||
| 2014 | 2013 | 2012 | ||||||||||
| Net income |
$ | 32,545 | $ | 31,085 | $ | 28,965 | ||||||
| Provision for income taxes |
16,875 | 16,863 | 15,215 | |||||||||
| Interest expense, net |
1,034 | 1,272 | 1,725 | |||||||||
| Depreciation and amortization |
11,663 | 12,090 | 10,837 | |||||||||
|
|
|
|
|
|
|
|||||||
| EBITDA |
$ | 62,117 | $ | 61,310 | $ | 56,742 | ||||||
| Share based compensation |
10,649 | 8,209 | 6,918 | |||||||||
| Non-cash add backs |
(1,781 | ) | — | 686 | ||||||||
| Restructuring, issuance and cash non-operating costs (2) |
1,010 | 828 | (552 | ) | ||||||||
| Acquisition expenses |
1,384 | — | 773 | |||||||||
|
|
|
|
|
|
|
|||||||
| Adjusted EBITDA (1) |
$ | 73,379 | $ | 70,347 | $ | 64,567 | ||||||
|
|
|
|
|
|
|
|||||||
| (1) | Adjusted EBITDA is not a measure of operating performance under GAAP and should not be considered as an alternative or substitute for GAAP profitability measures such as income (loss) from operations and net income (loss). Adjusted EBITDA as an operating performance measure has material limitations since it excludes the statement of income impact of depreciation and amortization expense, interest expense, net, the provision (benefit) for income taxes and share based compensation and therefore does not represent an accurate measure of profitability, particularly in situations where a company is highly leveraged or has a disadvantageous tax structure. We have significant intangible assets and amortization expense is a meaningful element in our financial statements and therefore its exclusion from Adjusted EBITDA is a material limitation. In the past, we have had a significant amount of debt, and interest expense is a necessary element of our costs and therefore its exclusion from Adjusted EBITDA is a material limitation. We generally incur significant U.S. federal, state and foreign income taxes each year and the provision (benefit) for income taxes is a necessary element of our costs and therefore its exclusion from Adjusted EBITDA is a material limitation. Share based compensation and the associated expense has a meaningful impact on our financial statements. Non-cash expenses, restructuring, issuance and cash non-operating expenses have a meaningful impact on our financial statements. Therefore, their exclusion from Adjusted EBITDA is a material limitation. As a result, Adjusted EBITDA should be evaluated in conjunction with net income (loss) for complete analysis of our profitability, as net income (loss) includes the financial statement impact of these items and is the most directly comparable GAAP operating performance measure to Adjusted EBITDA. As Adjusted EBITDA is not defined by GAAP, our definition of Adjusted EBITDA may differ from and therefore may not be comparable to similarly titled measures used by other companies, thereby limiting its usefulness as a comparative measure. Because of the limitations that Adjusted EBITDA has as an analytical tool, investors should not consider it in isolation, or as a substitute for analysis of our operating results as reported under GAAP. |
50
Table of Contents
| (2) | As defined in the Credit Facility, an add-back of up to $250 thousand of cash non-operating expense, which is not to exceed $1.5 million when combined together with restructuring and issuance costs. |
The Credit Facility also contains provisions for an increased interest rate during periods of default. We do not believe that these covenants will affect our ability to operate our business, and we were in compliance with the covenants under our Credit Facility as of December 31, 2014.
Non-GAAP Measures
In our quarterly earnings press releases and conference calls, in addition to Adjusted EBITDA as discussed above, we discuss a key measure that is not calculated according to GAAP. This non-GAAP measure is net adjusted EBITDA, which is defined as income (loss) from operations before depreciation, amortization of acquired intangible assets and share based compensation expenses. We use net adjusted EBITDA as a principal indicator of the operating performance of our business. We use net adjusted EBITDA in internal forecasts and models when establishing internal operating budgets, supplementing the financial results and forecasts reported to our board of directors, determining bonus compensation for our employees based on operating performance and evaluating short-term and long-term operating trends in our operations. We believe that net adjusted EBITDA permits a comparative assessment of our operating performance, relative to our performance based on our GAAP results, while isolating the effects of charges that may vary from period-to-period without direct correlation to underlying operating performance. We believe that these non-GAAP financial adjustments are useful to investors because they allow investors to evaluate the effectiveness of the methodology and information used by management in our financial and operational decision-making. We believe that trends in our net adjusted EBITDA may be valuable indicators of our operating performance.
The following table presents a reconciliation from income from operations, which is the most directly comparable GAAP operating financial measure, to net adjusted EBITDA as used by management (in thousands):
| Year Ended December 31, | ||||||||||||
| 2014 | 2013 | 2012 | ||||||||||
| Income from operations |
$ | 52,082 | $ | 50,689 | $ | 46,468 | ||||||
| Depreciation and amortization |
11,663 | 12,090 | 10,837 | |||||||||
| Share based compensation |
10,649 | 8,209 | 6,918 | |||||||||
|
|
|
|
|
|
|
|||||||
| Net adjusted EBITDA (1) |
$ | 74,394 | $ | 70,988 | $ | 64,223 | ||||||
|
|
|
|
|
|
|
|||||||
| (1) | Net adjusted EBITDA is not a measure of operating performance under GAAP and should not be considered as an alternative or substitute for GAAP profitability measures such as income (loss) from operations and net income (loss). Net adjusted EBITDA as an operating performance measure has material limitations since it excludes the statement of income impact of depreciation and amortization expense and share based compensation and therefore does not represent an accurate measure of profitability. We have significant intangible assets and amortization expense is a meaningful element in our financial statements and therefore its exclusion from net adjusted EBITDA is a material limitation. Share based compensation and the associated expense has a meaningful impact on our financial statements and therefore its exclusion from net adjusted EBITDA is a material limitation. As a result, net adjusted EBITDA should be evaluated in conjunction with income (loss) from operations for complete analysis of our profitability, as income (loss) from operations includes the financial statement impact of these items and is the most directly comparable GAAP operating performance measure to net adjusted EBITDA. As net adjusted EBITDA is not defined by GAAP, our definition of net adjusted EBITDA may differ from and therefore may not be comparable to similarly titled measures used by other companies, thereby limiting its usefulness as a comparative measure. Because of the limitations that net adjusted EBITDA has as an analytical tool, investors should not consider it in isolation, or as a substitute for analysis of our operating results as reported under GAAP. |
51
Table of Contents
In our quarterly earnings press releases and conference calls, in addition to Adjusted EBITDA and net adjusted EBITDA as discussed above, we discuss a key measure that is not calculated according to GAAP. This non-GAAP measure is non-GAAP earnings per diluted share, which is defined as earnings per diluted share before amortization of acquired intangible assets and share based compensation expenses. We use non-GAAP earnings per diluted share as one of our principal indicators of the operating performance of our business. We use non-GAAP earnings per diluted shares in internal forecasts, supplementing the financial results and forecasts reported to our board of directors and evaluating short-term and long-term operating trends in our operations. We believe that non-GAAP earnings per diluted share permits a comparative assessment of our operating performance, relative to our performance based on our GAAP results, while isolating the effects of charges that may vary from period-to-period without direct correlation to underlying operating performance. We believe that these non-GAAP financial adjustments are useful to investors because they allow investors to evaluate the effectiveness of the methodology and information used by management in our financial and operational decision-making. We believe that trends in our non-GAAP earnings per diluted share may be valuable indicators of our operating performance.
The following table presents a reconciliation from earnings per diluted share, which is the most directly comparable GAAP measure, to non-GAAP earnings per diluted share as used by management:
| Year Ended December 31, | ||||||||||||
| 2014 | 2013 | 2012 | ||||||||||
| GAAP earnings per diluted share |
$ | 0.81 | $ | 0.78 | $ | 0.76 | ||||||
| Amortization, net of tax |
0.17 | 0.18 | 0.18 | |||||||||
| Share based compensation, net of tax |
0.18 | 0.14 | 0.12 | |||||||||
|
|
|
|
|
|
|
|||||||
| Non-GAAP earnings per diluted share (1) |
$ | 1.16 | $ | 1.10 | $ | 1.06 | ||||||
|
|
|
|
|
|
|
|||||||
| (1) | Non-GAAP earnings per diluted share is not a measure of operating performance under GAAP and should not be considered as an alternative or substitute for GAAP profitability measures such as earnings per share and earnings per diluted share. Non-GAAP earnings per diluted share as an operating performance measure has material limitations since it excludes the statement of income impact of amortization expense and share based compensation, and therefore, does not represent an accurate measure of profitability. We have significant intangible assets and amortization expense is a meaningful element in our financial statements and therefore its exclusion from non-GAAP earnings per diluted share is a material limitation. Share based compensation and the associated expense has a meaningful impact on our financial statements and therefore its exclusion from non-GAAP diluted earnings per share is a material limitation. As a result, non-GAAP earnings per diluted share should be evaluated in conjunction with earnings per diluted share for complete analysis of our profitability, as earnings per diluted share includes the financial statement impact of these items and is the most directly comparable GAAP operating performance measure to non-GAAP earnings per diluted share. As non-GAAP earnings per diluted share is not defined by GAAP, our definition of non-GAAP earnings per diluted share may differ from and therefore may not be comparable to similarly titled measures used by other companies, thereby limiting its usefulness as a comparative measure. Because of the limitations that non-GAAP earnings per share has as an analytical tool, investors should not consider it in isolation, or as a substitute for analysis of our operating results as reported under GAAP. |
52
Table of Contents
Other Liquidity Matters
Contractual Obligations
The following summarizes our contractual obligations at December 31, 2014 and the effect of such obligations on liquidity and cash flow in future years (in thousands):
| Contractual Obligations |
Total | 2015 | 2016-2017 | 2018-2019 | Thereafter | |||||||||||||||
| Operating leases (1) |
$ | 14,255 | $ | 2,955 | $ | 4,778 | $ | 3,042 | $ | 3,480 | ||||||||||
| License fees (1) |
1,500 | 500 | 600 | 200 | 200 | |||||||||||||||
| Purchase obligation |
1,717 | 1,717 | — | — | — | |||||||||||||||
|
|
|
|
|
|
|
|
|
|
|
|||||||||||
| Total |
$ | 17,472 | $ | 5,172 | $ | 5,378 | $ | 3,242 | $ | 3,680 | ||||||||||
|
|
|
|
|
|
|
|
|
|
|
|||||||||||
| (1) | See Note 15 to the audited consolidated financial statements regarding contractual obligations included in this Annual Report on Form 10-K under Item 8. |
We may be required to make cash outlays related to our unrecognized tax benefits. However, due to the uncertainty of the timing of future cash flows associated with our unrecognized tax benefits, we are unable to make reasonably reliable estimates of the period of cash settlement, if any, with the respective taxing authorities. Accordingly, unrecognized tax benefits of $8.1 million as of December 31, 2014 have been excluded from the contractual obligations table above. For further information on unrecognized tax benefits, see Note 11 to our consolidated financial statements included in this Annual Report on Form 10-K under Item 8.
In connection with the acquisition of Design by Front Limited we established a liability for part of the purchase price to be paid upon the attainment of certain criteria through 2014. That liability, the contingent acquisition consideration, was $0.3 million at December 31, 2014. For further information on the acquisition, see Note 3, and further details regarding the liability can be found in Note 9 to our consolidated financial statements included in this Annual Report on Form 10-K under Item 8.
In addition to the above, we have a pension obligation under the German defined benefit pension plan. The total projected benefit obligation is $5.7 million and details regarding this plan are located in Note 10 to our consolidated financial statement included in this Annual Report on Form 10-K under Item 8.
Legal proceedings and disputes
Details on recent legal matters can be found in Note 15 to our consolidated financial statements included in this Annual Report on Form 10-K under Item 8.
Off-Balance Sheet Arrangements
As of December 31, 2014 and 2013, we did not have any material relationships with unconsolidated entities, often referred to as special purpose entities, which would have been established for the purpose of facilitating off-balance sheet arrangements or other contractually narrow or limited purposes. Other than our operating leases for office space and computer equipment, and derivative financial instruments discussed in “Quantitative and Qualitative Disclosures about Market Risk,” we do not engage in off-balance sheet financing arrangements.
| Item 7A. | Quantitative and Qualitative Disclosures about Market Risk |
We are exposed to financial market risk, including interest rate risk and foreign currency exchange risk.
53
Table of Contents
Concentration of Revenue and Credit Risk
Financial instruments that potentially subject us to concentrations of credit risk consist principally of cash and cash equivalents and trade receivables. Cash equivalents consist primarily of bank deposits and certain investments, such as commercial paper and municipal securities, with maturities less than 90 days at the date of purchase. Deposits of cash held outside the United States totaled approximately $10.3 million and $6.8 million at December 31, 2014 and 2013, respectively.
We grant credit to customers in the ordinary course of business. Credit evaluations are performed on an ongoing basis to reduce credit risk, and no collateral is required from our customers. An allowance for uncollectible accounts is provided for those accounts receivable considered to be uncollectible based upon historical experience and credit evaluation. As of December 31, 2014, one customer, Ford Motor Company, individually accounted for 10.1% of our gross accounts receivable. As of December 31, 2013, there were no customers that individually accounted for 10% or more of our gross accounts receivable. Due to the nature of our quarterly revenue streams derived from royalty revenue, it is not unusual for our accounts receivable balances to include a few customers with large balances. Historically, we have not recorded material losses due to customers’ nonpayment.
For the years ended December 31, 2014, 2013 and 2012, no customer accounted for more than 10% of our total revenue. For the quarter ended December 31, 2013, one customer, Ricoh Company, Ltd., individually accounted for 10.2% of our total revenue. For the quarters ended December 2014 and 2012, no customer individually accounted for more than 10% of our total revenue.
Derivative Financial Instrument and Interest Rate Risk
In the past we have used interest rate derivative instruments to hedge our exposure to interest rate volatility resulting from our variable rate debt. ASC Topic No. 815, Derivatives and Hedging, or ASC 815, requires that all derivative instruments be reported on the balance sheet at fair value and establishes criteria for designation and effectiveness of hedging relationships, including a requirement that all designations must be made at the inception of each instrument. As we did not make such initial designations, changes in the fair value of the derivative instrument are to be recognized as current period income or expense.
The fair value of derivative instruments is estimated based on the amount that we would receive or pay to terminate the agreements at the reporting date. Our exposure to market risk associated with changes in interest rates relates primarily to our long term debt. The interest rate on our Credit Facility fluctuates with either the prime rate or the LIBOR interest rate. At both December 31, 2014 and 2013, the Company had no borrowings under our revolving Credit Facility. Historically, we have purchased interest rate swap instruments to hedge our exposure to interest rate fluctuations on our debt obligations.
Foreign Currency Exchange Rate Risk
In accordance with ASC Topic No. 830, Foreign Currency Matters, or ASC 830, all assets and liabilities of our foreign subsidiaries whose functional currency is a currency other than U.S. dollars are translated into U.S. dollars at an exchange rate as of the balance sheet date or historical rates, as appropriate. Revenue and expenses of these subsidiaries are translated at the average monthly exchange rates. The resulting translation adjustments as calculated from the translation of the foreign subsidiaries to U.S. dollars are recorded as a separate component of comprehensive income. For the years ended December 31, 2014, 2013 and 2012, sales by our subsidiaries located outside North America, particularly the U.K, Germany and Japan, comprised 47.6%, 45.3% and 47.5%, respectively, of our total revenue. An effect of a 10% strengthening of the British pound sterling, the Euro or Japanese yen, relative
54
Table of Contents
to the U.S. dollar, would have decreased our revenues by $18.5 million, increased expenses by $13.3 million and decreased operating income by $5.2 million for the year ended December 31, 2014. The sensitivity analysis assumes that all currencies move in the same direction at the same time and the ratio of non-U.S. dollar denominated revenue and expenses to U.S. dollar denominated revenue and expenses does not change from current levels.
We also incur foreign currency exchange gains and losses related to certain customers that are invoiced in U.S. dollars, but who have the option to make an equivalent payment in their own functional currencies at a specified exchange rate as of a specified date. In the period from that date until payment in the customer’s functional currency is received and converted into U.S. dollars, we can incur realized gains and losses. To mitigate our exposure, we utilize forward contracts with maturities of 90 days or less to hedge our exposure to these currency fluctuations. Any increase or decrease in the fair value of the forward contracts is offset by the change in the value of the hedged assets of our consolidated foreign affiliate. At December 31, 2014 we had one 30-day contract to sell 2.3 million British pound sterling and purchase $3.5 million that together, had an immaterial fair value. At December 31, 2013, we had one 30- day forward contract to sell 3.0 million British pound sterling and one 30-day forward contract outstanding to purchase $5.0 million that together, had an immaterial fair value.
55
Table of Contents
| Item 8. | Financial Statements and Supplementary Data |
MONOTYPE IMAGING HOLDINGS INC.
INDEX TO CONSOLIDATED FINANCIAL STATEMENTS
56
Table of Contents
REPORT OF INDEPENDENT REGISTERED PUBLIC ACCOUNTING FIRM
The Board of Directors and Stockholders of
Monotype Imaging Holdings Inc.
We have audited the accompanying consolidated balance sheets of Monotype Imaging Holdings Inc. as of December 31, 2014 and 2013, and the related consolidated statements of income, comprehensive income, stockholders’ equity, and cash flows for each of the three years in the period ended December 31, 2014. Our audits also included the financial statement schedule listed in the Index at Item 15(a). These financial statements and schedule are the responsibility of the Company’s management. Our responsibility is to express an opinion on these financial statements and schedule based on our audits.
We conducted our audits in accordance with the standards of the Public Company Accounting Oversight Board (United States). Those standards require that we plan and perform the audit to obtain reasonable assurance about whether the financial statements are free of material misstatement. An audit includes examining, on a test basis, evidence supporting the amounts and disclosures in the financial statements. An audit also includes assessing the accounting principles used and significant estimates made by management, as well as evaluating the overall financial statement presentation. We believe that our audits provide a reasonable basis for our opinion.
In our opinion, the financial statements referred to above present fairly, in all material respects, the consolidated financial position of Monotype Imaging Holdings Inc. at December 31, 2014 and 2013, and the consolidated results of its operations and its cash flows for each of the three years in the period ended December 31, 2014, in conformity with U.S. generally accepted accounting principles. Also, in our opinion, the related financial statement schedule, when considered in relation to the basic financial statements taken as a whole, presents fairly in all material respects the information set forth therein.
We also have audited, in accordance with the standards of the Public Company Accounting Oversight Board (United States), Monotype Imaging Holdings Inc.’s internal control over financial reporting as of December 31, 2014, based on criteria established in Internal Control-Integrated Framework issued by the Committee of Sponsoring Organizations of the Treadway Commission (1992 framework) and our report dated February 27, 2015 expressed an unqualified opinion thereon.
/s/ ERNST & YOUNG LLP
Boston, Massachusetts
February 27, 2015
57
Table of Contents
MONOTYPE IMAGING HOLDINGS INC.
CONSOLIDATED BALANCE SHEETS
(in thousands, except share and per share data)
| December 31, | ||||||||
| 2014 | 2013 | |||||||
| ASSETS | ||||||||
| Current assets: |
||||||||
| Cash and cash equivalents |
$ | 90,325 | $ | 78,411 | ||||
| Accounts receivable, net of allowance for doubtful accounts of $164 and $171 at December 31, 2014 and 2013, respectively |
9,279 | 8,317 | ||||||
| Income tax refunds receivable |
2,593 | 3,334 | ||||||
| Deferred income taxes |
2,898 | 3,557 | ||||||
| Prepaid expenses and other current assets |
4,361 | 3,394 | ||||||
|
|
|
|
|
|||||
| Total current assets |
109,456 | 97,013 | ||||||
| Property and equipment, net |
10,578 | 3,568 | ||||||
| Goodwill |
176,999 | 176,350 | ||||||
| Intangible assets, net |
73,862 | 76,684 | ||||||
| Other assets |
3,563 | 2,744 | ||||||
|
|
|
|
|
|||||
| Total assets |
$ | 374,458 | $ | 356,359 | ||||
|
|
|
|
|
|||||
| LIABILITIES AND STOCKHOLDERS’ EQUITY | ||||||||
| Current liabilities: |
||||||||
| Accounts payable |
$ | 1,156 | $ | 1,112 | ||||
| Accrued expenses and other current liabilities |
24,570 | 20,425 | ||||||
| Accrued income taxes payable |
640 | 14 | ||||||
| Deferred revenue |
7,107 | 6,767 | ||||||
|
|
|
|
|
|||||
| Total current liabilities |
33,473 | 28,318 | ||||||
| Other long-term liabilities |
2,596 | 972 | ||||||
| Deferred income taxes |
32,960 | 32,600 | ||||||
| Reserve for income taxes |
4,637 | 2,496 | ||||||
| Accrued pension benefits |
5,679 | 5,098 | ||||||
| Commitments and contingencies (Note 15) |
||||||||
| Stockholders’ equity: |
||||||||
| Preferred stock, $0.001 par value, Authorized shares: 10,000,000 at December 31, 2014 and 2013; Issued and outstanding: none |
— | — | ||||||
| Common stock, $0.001 par value; Authorized shares: 250,000,000 at December 31, 2014 and 2013; Shares issued: 40,770,197 and 39,482,543 at December 31, 2014 and 2013, respectively |
39 | 39 | ||||||
| Additional paid-in capital |
232,522 | 209,376 | ||||||
| Treasury stock, at cost, 1,303,737 and 204,830 shares at December 31, 2014 and 2013, respectively |
(31,946 | ) | (2,279 | ) | ||||
| Retained earnings |
98,672 | 78,741 | ||||||
| Accumulated other comprehensive (loss) income |
(4,174 | ) | 998 | |||||
|
|
|
|
|
|||||
| Total stockholders’ equity |
295,113 | 286,875 | ||||||
|
|
|
|
|
|||||
| Total liabilities and stockholders’ equity |
$ | 374,458 | $ | 356,359 | ||||
|
|
|
|
|
|||||
The accompanying notes are an integral part of these consolidated financial statements.
58
Table of Contents
MONOTYPE IMAGING HOLDINGS INC.
CONSOLIDATED STATEMENTS OF INCOME
(in thousands, except share and per share data)
| Year Ended December 31, | ||||||||||||
| 2014 | 2013 | 2012 | ||||||||||
| Revenue |
$ | 184,500 | $ | 166,624 | $ | 149,861 | ||||||
| Cost of revenue |
28,583 | 23,776 | 21,005 | |||||||||
| Cost of revenue—amortization of acquired technology |
4,574 | 4,560 | 4,051 | |||||||||
|
|
|
|
|
|
|
|||||||
| Total cost of revenue |
33,157 | 28,336 | 25,056 | |||||||||
|
|
|
|
|
|
|
|||||||
| Gross profit |
151,343 | 138,288 | 124,805 | |||||||||
| Operating expenses: |
||||||||||||
| Marketing and selling |
49,580 | 42,019 | 35,953 | |||||||||
| Research and development |
20,684 | 19,897 | 18,007 | |||||||||
| General and administrative |
23,599 | 19,720 | 18,908 | |||||||||
| Amortization of other intangible assets |
5,398 | 5,963 | 5,469 | |||||||||
|
|
|
|
|
|
|
|||||||
| Total operating expenses |
99,261 | 87,599 | 78,337 | |||||||||
|
|
|
|
|
|
|
|||||||
| Income from operations |
52,082 | 50,689 | 46,468 | |||||||||
| Other (income) expense: |
||||||||||||
| Interest expense |
1,202 | 1,295 | 1,842 | |||||||||
| Interest income |
(168 | ) | (23 | ) | (117 | ) | ||||||
| Loss on foreign exchange |
1,841 | 1,145 | 578 | |||||||||
| (Gain) loss on derivatives |
(187 | ) | 354 | 11 | ||||||||
| Other income, net |
(26 | ) | (30 | ) | (26 | ) | ||||||
|
|
|
|
|
|
|
|||||||
| Total other expense |
2,662 | 2,741 | 2,288 | |||||||||
|
|
|
|
|
|
|
|||||||
| Income before provision for income taxes |
49,420 | 47,948 | 44,180 | |||||||||
| Provision for income taxes |
16,875 | 16,863 | 15,215 | |||||||||
|
|
|
|
|
|
|
|||||||
| Net income |
$ | 32,545 | $ | 31,085 | $ | 28,965 | ||||||
|
|
|
|
|
|
|
|||||||
| Net income available to common stockholders—basic |
$ | 31,940 | $ | 30,582 | $ | 28,496 | ||||||
|
|
|
|
|
|
|
|||||||
| Net income available to common stockholders—diluted |
$ | 31,950 | $ | 30,582 | $ | 28,510 | ||||||
|
|
|
|
|
|
|
|||||||
| Net income per common share: |
||||||||||||
| Basic |
$ | 0.83 | $ | 0.81 | $ | 0.78 | ||||||
|
|
|
|
|
|
|
|||||||
| Diluted |
$ | 0.81 | $ | 0.78 | $ | 0.76 | ||||||
|
|
|
|
|
|
|
|||||||
| Weighted-average number of shares outstanding—basic |
38,565,368 | 37,833,817 | 36,311,835 | |||||||||
| Weighted-average number of shares outstanding—diluted |
39,466,717 | 39,285,651 | 37,561,953 | |||||||||
| Dividends declared per common share |
$ | 0.32 | $ | 0.24 | $ | 0.08 | ||||||
|
|
|
|
|
|
|
|||||||
The accompanying notes are an integral part of these consolidated financial statements.
59
Table of Contents
MONOTYPE IMAGING HOLDINGS INC.
CONSOLIDATED STATEMENTS OF COMPREHENSIVE INCOME
(in thousands)
| Year Ended December 31, | ||||||||||||
| 2014 | 2013 | 2012 | ||||||||||
| Net income |
$ | 32,545 | $ | 31,085 | $ | 28,965 | ||||||
| Other comprehensive income, net of tax: |
||||||||||||
| Unrecognized actuarial gain (loss), net of tax |
(726 | ) | 216 | (665 | ) | |||||||
| Foreign currency translation adjustments, net of tax |
(4,446 | ) | 1,288 | 182 | ||||||||
|
|
|
|
|
|
|
|||||||
| Comprehensive income |
$ | 27,373 | $ | 32,589 | $ | 28,482 | ||||||
|
|
|
|
|
|
|
|||||||
The accompanying notes are an integral part of these consolidated financial statements.
60
Table of Contents
MONOTYPE IMAGING HOLDINGS INC.
CONSOLIDATED STATEMENTS OF STOCKHOLDERS’ EQUITY
(in thousands, except share and per share data)
| Common Stock | Treasury Stock | Additional Paid-In Capital |
Retained Earnings |
Accumulated Other Comprehensive Income (Loss) |
Total Stock- holders’ Equity |
|||||||||||||||||||||||||||
| Shares | Amount | Shares | Amount | |||||||||||||||||||||||||||||
| Balance, December 31, 2011 |
36,439,910 | $ | 36 | 98,527 | $ | (86 | ) | $ | 167,448 | $ | 30,986 | $ | (23 | ) | $ | 198,361 | ||||||||||||||||
| Net income |
28,965 | 28,965 | ||||||||||||||||||||||||||||||
| Issuance of capital shares |
||||||||||||||||||||||||||||||||
| —restricted share grants |
294,948 | 1 | (1 | ) | — | |||||||||||||||||||||||||||
| —exercised options |
683,132 | — | 3,215 | 3,215 | ||||||||||||||||||||||||||||
| Repurchase of unvested shares of restricted common stock |
— | 17,574 | — | — | ||||||||||||||||||||||||||||
| Share based compensation |
6,918 | 6,918 | ||||||||||||||||||||||||||||||
| Tax benefit associated with options |
1,101 | 1,101 | ||||||||||||||||||||||||||||||
| Dividends declared |
(2,971 | ) | (2,971 | ) | ||||||||||||||||||||||||||||
| Unrecognized actuarial loss, net of tax |
(665 | ) | (665 | ) | ||||||||||||||||||||||||||||
| Cumulative translation adjustment, net of tax |
182 | 182 | ||||||||||||||||||||||||||||||
|
|
|
|
|
|
|
|
|
|
|
|
|
|
|
|
|
|||||||||||||||||
| Balance, December 31, 2012 |
37,417,990 | $ | 37 | 116,101 | $ | (86 | ) | $ | 178,681 | $ | 56,980 | $ | (506 | ) | $ | 235,106 | ||||||||||||||||
| Net income |
31,085 | 31,085 | ||||||||||||||||||||||||||||||
| Issuance of capital shares |
||||||||||||||||||||||||||||||||
| —restricted share grants |
276,279 | — | — | — | ||||||||||||||||||||||||||||
| —exercised options |
1,788,274 | 2 | 16,107 | 16,109 | ||||||||||||||||||||||||||||
| Repurchase of unvested shares of restricted common stock |
— | 13,729 | — | — | ||||||||||||||||||||||||||||
| Purchase of treasury shares |
— | 75,000 | (2,193 | ) | (2,193 | ) | ||||||||||||||||||||||||||
| Share based compensation |
8,209 | 8,209 | ||||||||||||||||||||||||||||||
| Tax benefit associated with options |
6,379 | 6,379 | ||||||||||||||||||||||||||||||
| Dividends declared |
(9,324 | ) | (9,324 | ) | ||||||||||||||||||||||||||||
| Unrecognized actuarial loss, net of tax |
216 | 216 | ||||||||||||||||||||||||||||||
| Cumulative translation adjustment, net of tax |
1,288 | 1,288 | ||||||||||||||||||||||||||||||
|
|
|
|
|
|
|
|
|
|
|
|
|
|
|
|
|
|||||||||||||||||
| Balance, December 31, 2013 |
39,482,543 | $ | 39 | 204,830 | $ | (2,279 | ) | $ | 209,376 | $ | 78,741 | $ | 998 | $ | 286,875 | |||||||||||||||||
61
Table of Contents
MONOTYPE IMAGING HOLDINGS INC.
CONSOLIDATED STATEMENTS OF STOCKHOLDERS’ EQUITY—(Continued)
(in thousands, except share and per share data)
| Common Stock | Treasury Stock | Additional Paid-In Capital |
Retained Earnings |
Accumulated Other Comprehensive Income (Loss) |
Total Stock- holders’ Equity |
|||||||||||||||||||||||||||
| Shares | Amount | Shares | Amount | |||||||||||||||||||||||||||||
| Balance, December 31, 2013 |
39,482,543 | $ | 39 | 204,830 | $ | (2,279 | ) | $ | 209,376 | $ | 78,741 | $ | 998 | $ | 286,875 | |||||||||||||||||
| Net income |
32,545 | 32,545 | ||||||||||||||||||||||||||||||
| Issuance of capital shares |
||||||||||||||||||||||||||||||||
| —restricted share grants |
484,148 | — | — | — | ||||||||||||||||||||||||||||
| —exercised options |
803,506 | — | 8,462 | 8,462 | ||||||||||||||||||||||||||||
| Repurchase of unvested shares of restricted common stock |
— | 27,780 | — | — | ||||||||||||||||||||||||||||
| Purchase of treasury shares |
— | 1,071,127 | (29,667 | ) | (29,667 | ) | ||||||||||||||||||||||||||
| Share based compensation |
10,788 | 10,788 | ||||||||||||||||||||||||||||||
| Tax benefit associated with options |
3,896 | 3,896 | ||||||||||||||||||||||||||||||
| Dividends declared |
(12,614 | ) | (12,614 | ) | ||||||||||||||||||||||||||||
| Unrecognized actuarial loss, net of tax |
(726 | ) | (726 | ) | ||||||||||||||||||||||||||||
| Cumulative translation adjustment, net of tax |
(4,446 | ) | (4,446 | ) | ||||||||||||||||||||||||||||
|
|
|
|
|
|
|
|
|
|
|
|
|
|
|
|
|
|||||||||||||||||
| Balance, December 31, 2014 |
40,770,197 | $ | 39 | 1,303,737 | $ | (31,946 | ) | $ | 232,522 | $ | 98,672 | $ | (4,174 | ) | $ | 295,113 | ||||||||||||||||
|
|
|
|
|
|
|
|
|
|
|
|
|
|
|
|
|
|||||||||||||||||
The accompanying notes are an integral part of these consolidated financial statements.
62
Table of Contents
MONOTYPE IMAGING HOLDINGS INC.
CONSOLIDATED STATEMENTS OF CASH FLOWS
(in thousands)
| Year Ended December 31, | ||||||||||||
| 2014 | 2013 | 2012 | ||||||||||
| Cash flows from operating activities: |
||||||||||||
| Net income |
$ | 32,545 | $ | 31,085 | $ | 28,965 | ||||||
| Adjustments to reconcile net income to net cash provided by operating activities: |
||||||||||||
| Depreciation and amortization |
11,663 | 12,090 | 10,837 | |||||||||
| Loss on retirement of fixed assets |
173 | 23 | 6 | |||||||||
| Amortization of deferred financing costs and accreted interest |
434 | 541 | 303 | |||||||||
| Adjustment to contingent consideration |
(1,781 | ) | — | — | ||||||||
| Share based compensation |
10,649 | 8,209 | 6,918 | |||||||||
| Excess tax benefit on stock options |
(3,896 | ) | (6,775 | ) | (1,514 | ) | ||||||
| Provision for doubtful accounts |
138 | 97 | 38 | |||||||||
| Deferred income taxes |
3,296 | 4,970 | 2,746 | |||||||||
| Unrealized currency loss (gain) on foreign denominated intercompany transactions |
561 | (216 | ) | (390 | ) | |||||||
| Unrealized loss on derivatives |
— | — | 681 | |||||||||
| Changes in operating assets and liabilities, net of effect of acquisitions: |
||||||||||||
| Accounts receivable |
(1,410 | ) | (1,437 | ) | 129 | |||||||
| Prepaid expenses and other assets |
(1,856 | ) | (899 | ) | 488 | |||||||
| Accounts payable |
132 | 60 | (113 | ) | ||||||||
| Accrued income taxes payable |
7,660 | 3,312 | (635 | ) | ||||||||
| Accrued expenses and other liabilities |
2,750 | 1,820 | 900 | |||||||||
| Deferred revenue |
521 | (1,544 | ) | 1,069 | ||||||||
|
|
|
|
|
|
|
|||||||
| Net cash provided by operating activities |
61,579 | 51,336 | 50,428 | |||||||||
| Cash flows from investing activities: |
||||||||||||
| Purchases of property and equipment |
(7,960 | ) | (2,124 | ) | (1,486 | ) | ||||||
| Purchase of exclusive license and other intangible assets |
(312 | ) | — | (150 | ) | |||||||
| Acquisition of businesses, net of cash acquired |
(11,269 | ) | (72 | ) | (51,525 | ) | ||||||
|
|
|
|
|
|
|
|||||||
| Net cash used in investing activities |
(19,541 | ) | (2,196 | ) | (53,161 | ) | ||||||
| Cash flows from financing activities: |
||||||||||||
| Payments on line of credit |
— | (22,321 | ) | (40,000 | ) | |||||||
| Proceeds from issuance of debt, net of issuance costs |
— | — | 25,000 | |||||||||
| Excess tax benefit of stock options |
3,896 | 6,775 | 1,514 | |||||||||
| Common stock dividend paid |
(11,813 | ) | (8,456 | ) | (1,482 | ) | ||||||
| Purchase of treasury stock |
(29,667 | ) | (2,193 | ) | — | |||||||
| Proceeds from exercise of common stock options |
8,462 | 16,109 | 3,215 | |||||||||
|
|
|
|
|
|
|
|||||||
| Net cash used in financing activities |
(29,122 | ) | (10,086 | ) | (11,753 | ) | ||||||
| Effect of exchange rates on cash and cash equivalents |
(1,002 | ) | 17 | (24 | ) | |||||||
|
|
|
|
|
|
|
|||||||
| Increase (decrease) in cash and cash equivalents |
11,914 | 39,071 | (14,510 | ) | ||||||||
| Cash and cash equivalents, beginning of year |
78,411 | 39,340 | 53,850 | |||||||||
|
|
|
|
|
|
|
|||||||
| Cash and cash equivalents, end of year |
$ | 90,325 | $ | 78,411 | $ | 39,340 | ||||||
|
|
|
|
|
|
|
|||||||
| Supplemental disclosures: |
||||||||||||
| Interest paid |
$ | 457 | $ | 599 | $ | 1,416 | ||||||
| Income taxes paid |
$ | 7,714 | $ | 8,456 | $ | 11,518 | ||||||
| Non cash transactions: |
||||||||||||
| Dividends declared |
$ | 3,158 | $ | 2,357 | $ | 1,492 | ||||||
| Excess tax benefit on stock options |
$ | — | $ | — | $ | 413 | ||||||
The accompanying notes are an integral part of these consolidated financial statements.
63
Table of Contents
MONOTYPE IMAGING HOLDINGS INC.
NOTES TO CONSOLIDATED FINANCIAL STATEMENTS
December 31, 2014
1. Nature of Business
Monotype Imaging Holdings Inc. (the “Company” or “we”) is a leading provider of type, technology and expertise for creative applications and consumer devices. Our end-user and embedded solutions for print, web and mobile environments enable people to create and consume dynamic content on any and every device. Our technologies and fonts enable the display and printing of high quality digital text. Our technologies and fonts have been widely deployed across, and embedded in, a range of consumer devices including laser printers, digital copiers, mobile phones, e-book readers, tablets, automotive displays, digital cameras, navigation devices, digital televisions, set-top boxes and consumer appliances, as well as in numerous software applications and operating systems. We also provide printer drivers, page description language interpreters, printer user interface technology and color imaging solutions to printer manufacturers and OEMs (original equipment manufacturers). We license our fonts and technologies to consumer device manufacturers, independent software vendors and creative and business professionals and we are headquartered in Woburn, Massachusetts. We operate in one business segment: the development, marketing and licensing of technologies and fonts. We also maintain various offices worldwide for selling and marketing, research and development and administration. At December 31, 2014, we conduct our operations through three domestic operating subsidiaries, Monotype Imaging Inc., Monotype ITC Inc. (“ITC”) and MyFonts Inc. (“MyFonts”), and five foreign operating subsidiaries, Monotype Ltd. (“Monotype UK”), Monotype GmbH (“Monotype Germany”) and its wholly-owned subsidiary, FontShop International Inc., Monotype Solutions India Pvt. Ltd. (“Monotype India”), Monotype Hong Kong Ltd. (“Monotype Hong Kong”) and Monotype KK (“Monotype Japan”).
2. Significant Accounting Policies
The accompanying consolidated financial statements reflect the application of certain significant accounting policies as described in this note and elsewhere in these notes to the accompanying consolidated financial statements.
Basis of Presentation and Consolidation
The consolidated financial statements include the accounts of Monotype Imaging Holdings Inc. and its wholly-owned subsidiaries and have been prepared by the Company in United States (U.S.) dollars and in accordance with accounting principles generally accepted in the United States, or GAAP, applied on a consistent basis.
The accompanying consolidated financial statements present the Company as of December 31, 2014 and 2013 and for the years ended December 31, 2014, 2013 and 2012, including the accounts of ITC, MyFonts, Monotype UK, Monotype Germany, FontShop International Inc., Monotype India, Monotype Hong Kong and Monotype Japan. All intercompany accounts and transactions have been eliminated.
Use of Estimates
The preparation of the financial statements in conformity with GAAP requires management to make estimates and assumptions that affect the reported amounts of assets and liabilities and the disclosure of contingent assets and liabilities at the date of the financial statements and the reported amounts of revenue and expenses during the reporting period. We believe the most judgmental estimates include those related to revenue recognition, the allowance for doubtful accounts, income taxes, the valuation of goodwill, intangible assets, other long-lived assets and derivatives, the valuation of share based compensation, accrued pension benefits and the recoverability of the Company’s net deferred tax assets.
64
Table of Contents
We base our estimates and judgments on historical experience and various other appropriate factors, the results of which form the basis for making judgments about the carrying values of assets and liabilities and the amount of revenue and expenses that are not readily apparent from other sources. Although the Company regularly reassesses the assumptions underlying these estimates, actual results could differ materially from these estimates. Changes in estimates are recorded in the period in which they become known. The Company bases its estimates on historical experience and various other assumptions that it believes to be reasonable under the circumstances. Actual results may differ from management’s estimates if these results differ from historical experience or other assumptions prove not to be substantially accurate, even if such assumptions are reasonable when made.
The Company is subject to a number of risks similar to those of other companies of similar size in its industry, including, but not limited to, rapid technological changes, competition from substitute products and services from larger companies, limited number of suppliers, customer concentration, government regulations, management of international activities, protection of proprietary rights, patent litigation, and dependence on key individuals.
Subsequent Events Considerations
The Company considers events or transactions that occur after the balance sheet date but prior to the issuance of the financial statements to provide additional evidence for certain estimates or to identify matters that require additional disclosure. Subsequent events have been evaluated as required. The Company has evaluated all subsequent events and determined that, other than as reported herein, there are no material recognized or unrecognized subsequent events.
Fair Value of Financial Instruments
Our financial instruments consist of cash and cash equivalents, accounts receivable, derivative instruments and debt. We value our financial instruments at fair value in accordance with Accounting Standards Codification, or ASC, Topic No. 820, Fair Value Measurement and Disclosures. The Company’s recurring fair value measures relate to derivative instruments and cash equivalents. The Company’s non-financial assets and non-financial liabilities subject to non-recurring measures include goodwill and intangibles.
Cash and Cash Equivalents
Cash and cash equivalents consist of bank deposits and certain investments, such as commercial paper, corporate bonds and municipal securities, with maturities of less than 90 days at the date of purchase. We consider all highly liquid investments with original maturities of three months or less at the time of acquisition to be cash equivalents which are stated at fair value. The Company does not believe it is exposed to any significant credit risk on its cash equivalents.
Concentration of Credit Risks
Financial instruments that potentially subject us to concentrations of credit risk consist principally of cash and cash equivalents and accounts receivables. Cash equivalents consist primarily of bank deposits and certain investments, such as commercial paper and municipal securities, with maturities of less than 90 days at the date of purchase. Deposits of cash held outside the U.S. totaled approximately $10.3 million and $6.8 million, at December 31, 2014 and 2013, respectively.
We grant credit to customers in the ordinary course of business. Credit evaluations are performed on an ongoing basis to reduce credit risk, and no collateral is required from our customers. An allowance for uncollectible accounts is provided for those accounts receivable considered to be uncollectible based upon historical experience and credit evaluation. As of December 31, 2014, one customer individually accounted for 10.1% of our gross accounts receivable. As of December 31, 2013, there were no customers
65
Table of Contents
that accounted for 10% of our gross accounts receivable. For the years ended December 31, 2014, 2013 and 2012 no one customer accounted for 10% or more of our total revenue. For the quarter ended December 31, 2013, one customer accounted for 10.2% of our total revenue. For the quarters ended December 2014 and 2012, no customer individually accounted for more than 10% of our total revenue. Historically, we have not recorded material losses due to customers’ nonpayment. Due to these factors, no additional losses beyond the amounts provided for collection losses is believed by management to be probable in the Company’s accounts receivable.
Property and Equipment
Property and equipment are stated at cost. We capitalize expenditures that materially increase asset lives and charge ordinary repairs and maintenance to operations as incurred. Depreciation and amortization is computed using the straight-line method over the estimated useful lives of the assets, as there is no reliable evidence to suggest that we should expect any other pattern of depreciation or amortization than an even pattern. We believe this best reflects the expected pattern of economic usage. The estimated useful lives are as follows:
| Estimated Useful Life | ||
| Computer equipment and software |
2 to 5 years | |
| Furniture and fixtures |
3 to 13 years | |
| Leasehold improvements |
Shorter of lease term or estimated useful life of 3 to 5 years |
Goodwill and Indefinite-lived Intangible Assets
Goodwill represents the excess of the cost of acquired businesses over the fair value of identifiable net assets assumed in a business combination. We account for goodwill and indefinite-lived intangible assets in accordance with ASC Topic No. 350, Intangibles—Goodwill and Other, or ASC 350, which requires that goodwill not be amortized, but instead be tested at least annually for impairment in accordance with the provisions of ASC 350. The provisions of ASC 350 provide for a two-step impairment test framework to be performed on goodwill and indefinite-lived intangible assets. For goodwill, in the first step of the two-step test, the Company must compare the fair value of each reporting unit to its carrying value. The Company determines the fair value of its reporting units based on the present value of estimated future cash flows and market approach. If the fair value of the reporting unit exceeds the carrying value of the net assets assigned to that unit, goodwill is not impaired and further testing is not required. If the carrying value of the net assets assigned to the reporting unit exceeds the fair value of the reporting unit, then the Company must perform the second step of the impairment test in order to determine the implied fair value of the reporting unit’s goodwill. If the carrying value of a reporting unit’s goodwill exceeds its implied fair value, then an impairment loss equal to the difference will need to be recorded. For intangible assets that have indefinite useful lives, the impairment evaluation includes a comparison of the carrying value of the intangible asset to that intangible assets’ fair value. The fair value of the asset is based upon the net present value of future cash flows, including a terminal value calculation. If the intangible asset’s estimated fair value exceeds its carrying value, no impairment exists. If the fair value of the intangible asset does not exceed its carrying value, then an impairment loss shall be recognized in an amount equal to the excess.
In accordance with Accounting Standards Update, ASU, No. 2011-08, Intangibles – Goodwill and Other (Topic 350): Testing Goodwill for Impairment, the Company has the option of performing a qualitative assessment of the fair value of the reporting unit. If the Company determines, on the basis of the qualitative factors, that the fair value of the reporting unit is more likely than not less than its carrying value, the quantitative two-step fair value impairment test is required. Otherwise, no further testing is required. Similarly, for indefinite-lived intangible assets, in accordance with ASU No. 2012-02, Intangibles – Goodwill and Other (Topic 350): Testing Indefinite-Lived Intangible Assets for Impairment, an entity has the
66
Table of Contents
option to first assess qualitative factors to determine whether it is necessary to perform the two-step test. If an entity believes, as a result of its qualitative assessment, that it is more-likely-than-not that the fair value of a reporting unit is less than its carrying amount, the quantitative impairment test is required. Otherwise, the quantitative test is optional for indefinite-lived intangible assets.
Impairment testing for goodwill is done at a reporting unit level. Reporting units are one level below the business segment level, but can be combined when reporting units within the same segment have similar economic characteristics. We operate within a single business segment and reporting unit. The Company performs its annual goodwill impairment test as of December 31. As of December 31, 2014 and 2013, we elected to perform a qualitative analysis of the fair value of our goodwill and determined that the fair value was more likely than not higher than its carrying value. As such, the two-step test was not necessary.
For both years presented, 2014 and 2013, we elected to perform a qualitative analysis of the fair value of our indefinite-lived intangible assets. We perform our annual indefinite-lived intangible asset impairment test as of December 31. The fair value was determined to be more likely than not greater than the carrying value of the indefinite-lived intangible assets, and therefore, no write down of such assets was recorded in any of the years presented.
Long-Lived Assets
We account for long-lived assets including property and equipment and long-lived amortizable intangible assets in accordance with ASC Topic No. 360, Property, Plant and Equipment, or ASC 360. ASC 360 requires companies to assess whether indicators of impairment are present on a periodic basis. If such indicators are present, ASC 360 prescribes a two-step impairment test (i) if the carrying amount of a long-lived asset is not recoverable based on its undiscounted future cash flows, then (ii) the impairment loss is measured as the difference between the carrying amount and the fair value of the asset based on the forecasted discounted cash flows of the asset. We have had no impairments or indicators of impairment of our long-lived assets during the years presented.
Software Development Costs
We expense software development costs, including costs to develop software or the software products to be marketed to external users, before technological feasibility of such products is reached. Costs that are incurred to produce the finished product after technological feasibility has been established if material, would be capitalized as an intangible asset, and are amortized on a straight line basis over the economic useful lives. For the years ended December 31, 2014, 2013 and 2012, there were no material costs capitalized since substantially all development costs were incurred prior to attaining technological feasibility. In addition to the software development costs described above, the Company capitalizes certain costs that are incurred to purchase or create and implement internal-use software programs, including software coding, installation, testing and certain data conversions. These capitalized costs are amortized on a straight-line basis over the economic useful life or approximately three years. At December 31, 2014 and 2013, the Company had $4.8 million and $1.5 million, respectively, of unamortized software costs included in property and equipment, net in our accompanying consolidated balance sheets. The balance in both periods predominantly pertained to an ongoing internal use software project.
Business Acquisitions
In accordance with ASC Topic No. 805, Business Combinations, or ASC 805, we record acquisitions under the purchase method of accounting. Accordingly, the purchase price is allocated to the tangible assets and liabilities and intangible assets acquired, based on their estimated fair values from the
67
Table of Contents
perspective of a market participant. The excess purchase price over the fair value of identified assets is recorded as goodwill. Under ASC 350, goodwill and purchased intangible assets with indefinite lives are not amortized but are reviewed for impairment annually, or more frequently, if impairment indicators arise. Purchased intangible assets with definite lives are amortized over their respective useful lives.
Revenue Recognition
We recognize revenue in accordance with ASC Topic No. 985-605, Software Revenue Recognition. Revenue is recognized when persuasive evidence of an agreement exists, the product has been delivered or services have been provided, the fee is fixed or determinable and collection of the fee is probable. However, determining whether and when some of these criteria have been satisfied often involves assumptions and judgments that can have a significant impact on the timing and amount of revenues the Company reports. For example, the Company often receives multiple purchase orders or contracts from a single customer or a group of related parties that are evaluated to determine if they are, in effect, parts of a single arrangement. If they are determined to be parts of a single arrangement, revenues are recorded as if a single multiple-element arrangement exists. In addition, arrangements with customers may include multiple deliverables, or multiple elements in a single purchase order or contract. The fee for such arrangement is allocated to the various elements based on vendor-specific objective evidence of fair value, or VSOE, and revenue is recognized accordingly. In the absence of VSOE, all revenue from the arrangement is deferred until the earlier of the point at which (a) such sufficient VSOE does exist or (b) all elements of the arrangement have been delivered. In certain circumstances, the revenue is recognized ratably, in accordance with the revenue recognition guidance.
Creative Professional Revenue
Our Creative Professional revenue is derived from font licenses, font related services and from custom font design services. We license fonts directly to end-users through our e-commerce websites, via telephone, e-mail and indirectly through third-party resellers. We also license fonts and provide custom font design services to graphic designers, advertising agencies, media organizations and corporations. We refer to direct, indirect and custom revenue, as non-web revenue, and refer to revenue that is derived from our websites, as web revenue.
Revenue from font licenses to our e-commerce customers is recognized upon payment by the customer and the software embodying the font is shipped or made available. Revenue from font licenses to other customers is recognized upon shipment of the software embodying the font and when all other revenue recognition criteria have been met. Revenue from resellers is recognized upon notification from the reseller that our font product has been licensed and when all other revenue recognition criteria have been met. Custom font design services are generally recognized upon delivery. Font related service revenue is mainly subscription based and, from time to time, it may contain software as a service. The subscription revenue is recognized ratably over the subscription period. Web server and commercial rights to online fonts is recurring revenue and is recognized upon payment by the customer and proof of font delivery, and when all other revenue recognition criteria have been met. Contract accounting is used where services are deemed essential to the software.
OEM Revenue
Our OEM revenue is derived substantially from per-unit royalties received for printer imaging and printer driver, or printer products, and display imaging products. Under our licensing arrangements we typically receive a royalty for each product unit incorporating our fonts and technology that is shipped by our OEM customers. We also receive OEM revenue from fixed fee licenses with certain of our OEM customers. Fixed fee licensing arrangements are not based on units the customer ships, but instead, customers pay us on a periodic basis for the right to embed our fonts and technology. Although
68
Table of Contents
significantly less than royalties from per-unit shipments and fixed fees from OEMs, we also receive revenue from software application and operating systems vendors who include our fonts and technology in their products, and for font development. Many of our per-unit royalty licenses continue for the duration that our OEM customers ship products that include our technology, unless terminated for breach. Other licenses have terms that typically range from one to five years, and usually provide for automatic or optional renewals. Revenue from per-unit royalties is recognized in the period during which we receive a royalty report from a customer, typically one quarter after royalty-bearing units are shipped, as we do not have the ability to estimate the number of units shipped by our customers. Revenue from fixed fee licenses is generally recognized when it is billed to the customer, so long as the product has been delivered, the license fee is fixed and non-refundable and collection is probable. OEM revenue also includes project-related agreements for which contract accounting may be used.
Cost of Revenue
Our cost of revenue consists of font license fees that we pay on certain fonts that are owned by third parties, allocated internal engineering expense and overhead costs directly related to custom design services. We recognize royalty expenses with respect to those font license fees concurrent with the recognition of revenue on licenses to which they relate. Amortization of acquired technology is an additional cost of revenue (see Note 5).
Deferred Revenue
Deferred revenue results primarily from subscriptions, and from time to time, prepayments against future royalties received from our customers. These amounts are recognized as revenue as the royalties are earned, based upon subsequent royalty reports received from the customers. Long-term deferred revenue is classified as other long-term liabilities in the accompanying consolidated balance sheets at December 31, 2014 and 2013.
Research and Development Expenses
Our research and development expense consists principally of salaries, bonuses and benefits of our research and development, engineering and font design personnel who are primarily focused on enhancing the functionality of our text imaging solutions and developing new products. In accordance with ASC Topic No. 730, Research and Development, such costs are required to be expensed until the point that technological feasibility of the software is established. Technological feasibility is determined after a working model has been completed. As our research and development costs primarily relate to software development during the period prior to technological feasibility, all research and development costs are charged to operations as incurred.
Advertising Costs
We expense advertising costs as incurred. Advertising expenses were $1.7 million, $1.7 million and $1.3 million for the years ended December 31, 2014, 2013 and 2012, respectively.
Share Based Compensation
We account for share based compensation in accordance with ASC Topic No. 718, Compensation—Stock Compensation, which requires all share based payments to employees, including grants of employee stock options, to be recognized in the income statement based on their estimated fair values.
The Company uses the Black-Scholes option pricing model to determine the weighted-average fair value of options granted and recognizes the compensation cost of share based awards on a straight-line basis over the vesting period of the award. The determination of the fair value of share based payment awards using the Black-Scholes model are affected by our stock price and a number of assumptions,
69
Table of Contents
including expected volatility, expected life, risk-free interest rates and expected dividends. Beginning in July 2013, the expected volatility assumption is based on the Company’s actual historical stock price volatility. Prior to July 2013, we estimated volatility by using a blend of our stock price history, for the length of time we had market data for our stock, and the historical volatility of similar public companies for the remainder of the expected term of each grant. This was estimated in accordance with Staff Accounting Bulletin No. 110, or SAB 110. Beginning in July 2013, the expected life of awards is based on the actual historical exercise behavior of our employees. Prior to July 2013, the expected life of the awards was estimated based on the simplified method, as defined in SAB 110. The risk-free interest rate assumption is based on a U.S. treasury instrument whose term is consistent with the expected life of our awards. The expected dividend yield assumption for grants awarded after our initial dividend declaration date of July 25, 2012, is based on the estimated annualized dividend yield. Prior to this, the expected dividend yield assumption was based on our history up to that point, and the expectation of paying no dividends.
Forfeitures are estimated at the time of grant and revised, if necessary, in subsequent periods if actual forfeitures differ from those estimates. Share based compensation expense recognized in our financial statements is based on awards that are ultimately expected to vest. We evaluate the assumptions used to value our awards on a quarterly basis and if factors change and we employ different assumptions, share based compensation expense may differ significantly from what we have recorded in the past. If there are any modifications or cancellations of the underlying unvested securities, we may be required to accelerate, increase or cancel any remaining unearned share based compensation expense. Future share based compensation expense and unearned share based compensation will increase to the extent that we grant additional equity awards to employees or we assume unvested equity awards in connection with acquisitions.
The benefits of tax deductions in excess of recognized share based compensation are reported as a financing activity rather than an operating activity in the statement of cash flows. This requirement reduces net operating cash flows and increase net financing cash flows in certain periods.
The fair value of options was estimated at the date of grant using a Black-Scholes option-pricing model with the following weighted-average assumptions:
| Year Ended December 31, | ||||||
| 2014 | 2013 | 2012 | ||||
| Risk-free interest rate |
1.6% | 1.1% | 1.1% | |||
| Expected dividend yield |
1.1% | 1.1% | 0.0% | |||
| Expected volatility |
44.1% | 58.0% | 59.9% | |||
| Expected term |
5.0 years | 6.1 years | 6.1 years | |||
| Weighted-average fair value per share |
$11.01 | $10.99 | $7.74 | |||
For restricted stock awards issued under the Company’s stock-based compensation plans, the fair value of each grant is calculated based on the Company’s stock price on the date of grant. For service-based awards, the Company recognizes compensation expense on a straight-line basis over the requisite service period of the award. For performance based awards, share based compensation expense is recognized over the expected performance achievement period of individual performance milestones when the achievement of each individual performance milestone becomes probable. See Note 13 for a summary of the stock option activity under our share based employee compensation plans for the year ended December 31, 2014.
Derivative Financial Instruments
We use foreign currency derivative instruments to hedge our exposure to fluctuations in foreign currencies on our intercompany note (Note 8) and other foreign currency transactions. We have
historically used interest rate derivative instruments to hedge the exposure to interest rate volatility
70
Table of Contents
resulting from our variable rate debt. ASC Topic No. 815, Derivatives and Hedging, or ASC 815, requires that all derivative instruments be reported on the balance sheet at fair value and establishes criteria for designation and effectiveness of hedging relationships, including a requirement that all designations must be made at the inception of each instrument. As we did not make such initial designations, ASC 815 requires changes in the fair value of the derivative instrument to be recognized as current period income or expense.
Foreign Currency Translation
In accordance with ASC Topic No. 830, Foreign Currency Matters, all assets and liabilities of our foreign subsidiaries whose functional currency is a currency other than U.S. dollars are translated into U.S. dollars at an exchange rate as of the balance sheet date or historical rates, as appropriate. Revenue and expenses of these subsidiaries are translated at the average monthly exchange rates in effect for the periods in which the transactions occur. Accordingly, gains and losses resulting from translating foreign currency financial statements are reported as a separate component of other comprehensive income. Foreign currency transaction gains and losses including those related to intercompany translation with subsidiaries are included in net income.
Comprehensive Income
ASC Topic No. 220, Comprehensive Income, requires disclosure of all components of comprehensive income on an annual and interim basis. Comprehensive income is defined as the change in equity of a business enterprise during a period from transactions and other events and circumstances from non-owner sources. Comprehensive income consists of foreign currency translation adjustments and adjustments to record changes in the funded status of our defined benefit pension plan in accordance with ASC Subtopic No. 715-30, Defined Benefit Plans—Pension. At December 31, 2014, 2013 and 2012, the accumulated balance of foreign currency translation adjustment was a cumulative loss of $3.1 million, and cumulative income of $1.3 million and $45 thousand, respectively, net of tax of $2.8 million, $0.7 million and $0.1 million, respectively. The accumulated balance of the unrecognized actuarial gain (loss) were cumulative losses of $1.1 million, $0.3 million and $0.6 million at December 31, 2014, 2013 and 2012, respectively, net of tax of $0.3 million, $0.1 million and $0.3 million, respectively.
Income Taxes
We account for income taxes in accordance with ASC Topic No. 740, Income Taxes, or ASC 740. Under this method, a deferred tax asset or liability is determined based on the difference between the financial statement and the tax basis of assets and liabilities, as measured by enacted tax rates in effect when these differences are expected to be reversed. This process includes estimating current tax expense together with assessing temporary differences resulting from differing treatment of items for tax and financial accounting purposes. These differences result in deferred tax assets and liabilities. We also assess the likelihood that our deferred tax assets will be recovered from future taxable income and, to the extent we believe, based on the weight of available evidence, it is more likely than not that some or all of the deferred tax assets will not be realized, we have established a valuation allowance. Significant judgment is required in determining the provision for income taxes, deferred tax assets and liabilities and any valuation allowance against our deferred tax assets.
The Company accrues liabilities for uncertain tax positions in accordance with the framework provided in ASC 740. The total amount of uncertain tax positions, at December 31, 2014 and 2013 was $8.1 million and $6.2 million, respectively. The Company classifies interest and penalties as a component of tax expense. The total amount of recorded interest and penalties expense at December 31, 2014, 2013 and 2012 was $0.2 million, $56 thousand and $78 thousand, respectively.
71
Table of Contents
Net income per share data
The Company calculates net income per share in accordance with ASC Topic No. 260, Earnings Per Share, or ASC 260. ASC 260 outlines the use of the “two-class” and treasury stock methods of calculating earnings per share. Under the two-class method, basic net income per share is computed by dividing the net income applicable to common stockholders by the weighted-average number of common shares outstanding for the fiscal period. Diluted net income per share is computed using the more dilutive of (a) the if-converted, or treasury stock, method or (b) the two-class method. The treasury stock method gives effect to all potentially dilutive securities, including the exercise of stock options and vesting of restricted stock. The two-class method assumes the exercise of stock options consistent with the treasury stock method, but assumes participating securities (unvested restricted stock) are not vested and allocates earnings to common shares and participating securities. Income is allocated to participating securities and common stockholders.
Recently Issued Accounting Pronouncements
Going Concern
In August 2014, the Financial Accounting Standards Board, or FASB issued ASU 2014-15, Presentation of Financial Statements – Going Concern (Subtopic 205-40); Disclosure of Uncertainties about an Entity’s Ability to Continue as a Going Concern, which requires management of a company to evaluate whether there is substantial doubt about the company’s ability to continue as a going concern. The ASU provides guidance on evaluating an entity’s ability to continue as a going concern and the content of any required footnote disclosure based on that evaluation. The assessment period is one year after the date of the financial statements are issued. The standard is effective for the Company on January 1, 2017. Early adoption is permitted. The Company is currently evaluating the impact of the adoption of ASU 2014-15, but we do not expect the adoption of this standard to have any impact on our consolidated financial statements.
Revenue Recognition
In May 2014, the Financial Accounting Standards Board, or FASB, and the International Accounting Standards Board jointly issued ASU 2014-9, Revenue from Contracts with Customers (Topic 606), which provides a comprehensive new revenue recognition model that requires revenue to be recognized in a manner to depict the transfer of goods or services to a customer at an amount that reflects the consideration expected to be received in exchange for those goods or services. This guidance is effective for annual reporting and interim periods beginning after December 15, 2016 and allows for either full retrospective or modified retrospective application, with early adoption not permitted. Accordingly, the standard is effective for the Company on January 1, 2017. The Company is currently evaluating the adoption method it will apply and the impact that this guidance will have on its financial statements and related disclosures.
3. Acquisitions
FontShop
On July 14, 2014, the Company purchased all of the outstanding stock of FontShop International GmbH, a privately-held font distributor located in Berlin, Germany, its wholly-owned subsidiary FontShop International, Inc. based in San Francisco, California, the FontFont typeface library, FontShop AG of Berlin, the largest distributor of the FontFont library, and certain other typeface families, collectively FontShop, for an aggregate purchase price of approximately $14.8 million. We paid approximately $11.9 million from cash on hand at the time of the acquisition, and the remainder, or $2.9 million, was paid in January 2015. Of the purchase price, approximately $8.5 million and $6.3 million
72
Table of Contents
have been allocated to intangible assets and goodwill, respectively. Approximately $6.3 million of the goodwill is expected to be deductible for tax purposes. The purchase price has been allocated to the tangible and intangible assets acquired and liabilities assumed based upon the respective estimates of fair value as of the date of the acquisition, which remains preliminary as of December 31, 2014, and using assumptions that the Company’s management believes are reasonable given the information currently available. The final allocation of the purchase price to intangible assets, goodwill and deferred tax assets and liabilities may differ materially from the information presented in these consolidated financial statements. On October 9, 2014, FontShop International GmbH was merged into Monotype Germany effective August 1, 2014. Following the merger, FontShop International Inc. became a wholly-owned subsidiary of Monotype Germany. On October 28, 2014, FontShop AG was merged into Monotype Germany. Fifty employees joined the Company in connection with the acquisition.
Mark Boulton Design
On April 7, 2014, the Company purchased all of the outstanding stock of Mark Boulton Design Limited, a privately-held Web design studio located in Cardiff, Wales, United Kingdom, for $0.8 million in cash. The Company issued approximately $1.0 million in restricted stock awards in connection with the acquisition, which vest based upon continued employment over four years. The purchase price has been allocated to goodwill. None of the goodwill is expected to be deductible for tax purposes. Following the acquisition, Mark Boulton Design Limited became a wholly owned subsidiary of the Company. Seven former employees of Mark Boulton Design Limited joined the Company in connection with the acquisition.
4. Property and Equipment
Property and equipment consists of the following (in thousands):
| December 31, | ||||||||
| 2014 | 2013 | |||||||
| Computer equipment and software |
$ | 12,084 | $ | 11,371 | ||||
| Furniture and fixtures |
1,093 | 1,170 | ||||||
| Leasehold improvements |
3,498 | 866 | ||||||
|
|
|
|
|
|||||
| Total cost |
16,675 | 13,407 | ||||||
| Less accumulated depreciation and amortization |
(6,097 | ) | (9,839 | ) | ||||
|
|
|
|
|
|||||
| Property and equipment, net |
$ | 10,578 | $ | 3,568 | ||||
|
|
|
|
|
|||||
At December 31, 2014, computer equipment and software included $4.5 million of unamortized software costs related to internal use software projects in process and leasehold improvements included approximately $2.7 million for building improvements in connection with our new office lease, which amortization will commence once we occupy the space. During 2014, the Company disposed of $5.0 million of retired computer equipment, which had associated accumulated depreciation of approximately $4.9 million, as the equipment was no longer in use.
Depreciation and amortization expense for the years ended December 31, 2014, 2013 and 2012 was $1.7 million, $1.6 million and $1.3 million, respectively.
73
Table of Contents
5. Goodwill and Intangible Assets
Goodwill
The changes in the carrying value of goodwill are as follows (in thousands):
| Balance at December 31, 2012 |
$ | 174,294 | ||
| Acquisition adjustment |
(11 | ) | ||
| Foreign currency exchange rate changes |
2,004 | |||
| Deferred tax adjustment |
63 | |||
|
|
|
|||
| Balance at December 31, 2013 |
$ | 176,350 | ||
| Acquisitions |
7,044 | |||
| Foreign currency exchange rate changes |
(6,223 | ) | ||
| Deferred tax adjustment |
(172 | ) | ||
|
|
|
|||
| Balance at December 31, 2014 |
$ | 176,999 | ||
|
|
|
The majority of the Company’s goodwill balance is not denominated in U.S. dollars, and is therefore, subject to currency fluctuations. In 2014, the Company recorded approximately $0.8 million and $6.3 million in increases to goodwill related to the Mark Boulton Design and FontShop acquisitions. See Note 3 for further details on our acquisitions of Mark Boulton Design and FontShop.
Intangible Assets
Intangible assets are stated at cost and are amortized over the expected life of the asset. Intangible assets as of December 31, 2014 and 2013 are as follows (dollar amounts in thousands):
| Weighted- Average Amortization Period (Years) |
December 31, 2014 | December 31, 2013 | ||||||||||||||||||||||||||
| Gross Carrying Amount |
Accumulated Amortization |
Net Balance |
Gross Carrying Amount |
Accumulated Amortization |
Net Balance |
|||||||||||||||||||||||
| Customer relationships |
10 | $ | 57,488 | $ | (47,018 | ) | $ | 10,470 | $ | 57,319 | $ | (42,482 | ) | $ | 14,837 | |||||||||||||
| Acquired technology |
11 | 55,064 | (34,411 | ) | 20,653 | 51,206 | (29,734 | ) | 21,472 | |||||||||||||||||||
| Non-compete agreements |
4 | 12,172 | (11,862 | ) | 310 | 12,077 | (11,903 | ) | 174 | |||||||||||||||||||
| Trademarks |
38,029 | — | 38,029 | 35,801 | — | 35,801 | ||||||||||||||||||||||
| Domain names |
4,400 | — | 4,400 | 4,400 | — | 4,400 | ||||||||||||||||||||||
|
|
|
|
|
|
|
|
|
|
|
|
|
|||||||||||||||||
| Total |
$ | 167,153 | $ | (93,291 | ) | $ | 73,862 | $ | 160,803 | $ | (84,119 | ) | $ | 76,684 | ||||||||||||||
|
|
|
|
|
|
|
|
|
|
|
|
|
|||||||||||||||||
Amortization expense is calculated using the straight-line method as there is no reliable evidence to suggest that we should expect any pattern of amortization other than an even pattern, and we believe this best reflects the expected pattern of economic usage.
74
Table of Contents
Estimated future intangible amortization expense based on balances at December 31, 2014 is as follow (in thousands):
| Acquired Technology |
Other Intangible Assets |
|||||||
| 2015 |
$ | 5,161 | $ | 2,022 | ||||
| 2016 |
4,760 | 1,879 | ||||||
| 2017 |
2,752 | 1,837 | ||||||
| 2018 |
2,649 | 1,567 | ||||||
| 2019 |
2,606 | 1,510 | ||||||
| Thereafter |
2,725 | 1,965 | ||||||
|
|
|
|
|
|||||
| Total amortization expense |
$ | 20,653 | $ | 10,780 | ||||
|
|
|
|
|
|||||
6. Accrued Expenses and Other Current Liabilities
Accrued expenses and other current liabilities consist of the following (in thousands):
| December 31, | ||||||||
| 2014 | 2013 | |||||||
| Payroll and related benefits |
$ | 6,761 | $ | 7,143 | ||||
| Royalties |
3,604 | 3,285 | ||||||
| Legal and audit fees |
759 | 844 | ||||||
| Sales tax payable |
2,701 | 1,604 | ||||||
| Dividend payable |
3,158 | 2,357 | ||||||
| Contingent acquisition consideration |
270 | 2,302 | ||||||
| Acquisition consideration |
2,703 | — | ||||||
| Other |
4,614 | 2,890 | ||||||
|
|
|
|
|
|||||
| Total |
$ | 24,570 | $ | 20,425 | ||||
|
|
|
|
|
|||||
7. Debt
On July 13, 2011 the Company entered into a credit agreement (“Credit Facility”) with Wells Fargo Capital Finance, LLC, the administrative agent for a syndicate of Lenders (“Lenders”) which provides the Company with a five-year, $120.0 million secured revolving credit facility. Borrowings under the Credit Facility bear interest at a variable rate based upon, at the Company’s option, either the London Interbank Offering Rate, (“LIBOR”) or the base rate (which is the highest of (i) the prime rate, (ii) 0.5% plus the overnight federal funds rate, and (iii) 1.0% in excess of the three-month LIBOR rate), plus in each case, an applicable margin. The applicable margin for LIBOR loans, based on the applicable leverage ratio, is either 1.5% or 2.0% per annum, and the applicable margin for base rate loans, based on the applicable leverage ratio, is either 0.5% or 1.0% per annum. At December 31, 2014 our rate, inclusive of applicable margins, was 3.75% for prime. At December 31, 2014, the Company had no outstanding debt under the Credit Facility. The Company is required to pay an unused line fee equal to 0.375% per annum on the undrawn portion available under the revolving credit facility and variable per annum fees in respect of outstanding letters of credit, if any. Such fees are included in interest expense in the accompanying consolidated statements of income.
The Credit Facility contains financial covenants which include (i) a maximum ratio of consolidated total debt to consolidated adjusted EBITDA of 3.00:1.00, and (ii) a minimum consolidated fixed charge coverage ratio of 1.25:1.00. Adjusted EBITDA, under the Credit Facility, is defined as consolidated net earnings (or loss), plus net interest expense, income taxes, depreciation and amortization and share based compensation expense, plus acquisition expenses not to exceed $2.0 million, plus restructuring, issuance
75
Table of Contents
costs, cash non-operating costs and other expenses or losses minus cash non-operating gains and other non-cash gains; provided however that the aggregate of all cash non-operating expense shall not exceed $250 thousand and all such fees, costs and expenses shall not exceed $1.5 million on a trailing twelve months basis. Failure to comply with these covenants, or the occurrence of an event of default, could permit the Lenders under the Credit Facility to declare all amounts borrowed under the Credit Facility, together with accrued interest and fees, to be immediately due and payable. In addition, the Credit Facility is secured by substantially all of our assets and places limits on the Company and its subsidiaries ability to incur debt or liens and engage in sale-leaseback transactions, make loans and investments, incur additional indebtedness, engage in mergers, acquisitions and asset sales, transact with affiliates and alter its business. We were in compliance with all covenants under our Credit Facility as of December 31, 2014 and 2013.
8. Derivative Financial Instruments
We incur foreign currency exchange gains and losses related to certain customers that are invoiced in U.S. dollars, but have the contractual option to make an equivalent payment in their own functional currencies at a specified exchange rate as of a specified date. In the period from that date until payment in the customer’s functional currency is received and converted into U.S. dollars, we can incur unrealized gains and losses. We also incur foreign currency exchange gains and losses on certain intercompany assets and liabilities denominated in foreign currencies. We are currently utilizing 30-day forward contracts to mitigate our exposure on these currency fluctuations. These contracts are generally set to expire and are settled at month end. The instruments are not designated as hedging instruments, and accordingly, the gain or loss is recognized upon cash settlement and is included in gain or loss on derivatives in the accompanying consolidated statements of income. At December 31, 2014 and 2013, we had one forward contract outstanding, which was entered into on those dates. See Note 9 for details regarding the fair value. There were no outstanding forward contracts at December 31, 2012.
On May 24, 2010, we entered into a long term interest rate swap contract to pay a fixed rate of interest of 1.5% in exchange for a floating rate interest payment tied to the one-month LIBOR beginning November 28, 2010 to mitigate our exposure to interest rate fluctuations on our debt obligations for the remainder of the term of the note. The contract had a notional amount of $50.0 million with a $20.0 million reduction in the notional amount on January 3, 2012 and matured on July 30, 2012. We did not designate this contract as a hedge; as such, associated gains and losses were recorded in loss on derivatives in our consolidated statements of income.
On May 7, 2008, we entered into a long-term currency swap contract to purchase 18.3 million Euros in exchange for $28.0 million to mitigate foreign currency exchange rate risk on a Euro denominated intercompany note. In 2012, we incurred net losses of $5 thousand on the intercompany note. The currency swap matured on December 14, 2012. The contract payment terms approximated the payment terms of this intercompany note. We did not designate the contract as a hedge; as such, associated gains and losses are recorded to loss on derivatives in our consolidated statements of income.
The following table presents the losses and (gains) on our derivative financial instruments which are included in (gain) loss on derivatives in our accompanying consolidated statements of income (in thousands):
| 2014 | 2013 | 2012 | ||||||||||
| Interest rate swaps |
$ | — | $ | — | $ | 26 | ||||||
| Currency swaps |
(187 | ) | 354 | (15 | ) | |||||||
|
|
|
|
|
|
|
|||||||
| Total |
$ | (187 | ) | $ | 354 | $ | 11 | |||||
|
|
|
|
|
|
|
|||||||
76
Table of Contents
9. Fair Value Measurements
Fair value is defined as the price that would be received to sell an asset or paid to transfer a liability in an orderly transaction between market participants at the measurement date. In order to increase consistency and comparability in fair value measurements, the Codification establishes a fair value hierarchy that prioritizes observable and unobservable inputs used to measure fair value into three broad levels, which are described below:
Level 1: Quoted prices (unadjusted) in active markets that are accessible at the measurement date for assets or liabilities. The fair value hierarchy gives the highest priority to Level 1 inputs.
Level 2: Other inputs that are observable directly or indirectly, such as quoted prices for similar assets and liabilities or market corroborated inputs.
Level 3: Unobservable inputs are used when little or no market data is available and requires the Company to develop its own assumptions about how market participants would price the assets or liabilities. The fair value hierarchy gives the lowest priority to Level 3 inputs.
In determining fair value, the Company utilizes valuation techniques that maximize the use of observable inputs and minimizes the use of unobservable inputs to the extent possible as well as considers counterparty and our own credit risk in its assessment of fair value.
The following tables present our financial assets and liabilities that are carried at fair value, classified according to the three categories described above (in thousands):
| Fair Value Measurement at December 31, 2014 | ||||||||||||||||
| Total | Quoted Prices in Active Markets for Identical Assets (Level 1) |
Significant Other Observable Inputs (Level 2) |
Significant Unobservable Inputs (Level 3) |
|||||||||||||
| Assets: |
||||||||||||||||
| Cash equivalents—money market funds |
$ | 34,309 | $ | 34,309 | $ | — | $ | — | ||||||||
| Cash equivalents—commercial paper |
3,000 | — | 3,000 | — | ||||||||||||
| Cash equivalents—U.S. government and agency securities |
2,700 | — | 2,700 | — | ||||||||||||
|
|
|
|
|
|
|
|
|
|||||||||
| Total assets |
$ | 40,009 | $ | 34,309 | $ | 5,700 | $ | — | ||||||||
|
|
|
|
|
|
|
|
|
|||||||||
| Liabilities: |
||||||||||||||||
| Contingent acquisition consideration |
$ | 270 | $ | — | $ | 270 | $ | — | ||||||||
|
|
|
|
|
|
|
|
|
|||||||||
| Total liabilities |
$ | 270 | $ | — | $ | 270 | $ | — | ||||||||
|
|
|
|
|
|
|
|
|
|||||||||
77
Table of Contents
| Fair Value Measurement at December 31, 2013 | ||||||||||||||||
| Total | Quoted Prices in Active Markets for Identical Assets (Level 1) |
Significant Other Observable Inputs (Level 2) |
Significant Unobservable Inputs (Level 3) |
|||||||||||||
| Assets: |
||||||||||||||||
| Cash equivalents—money market funds |
$ | 832 | $ | 832 | $ | — | $ | — | ||||||||
| Cash equivalents—commercial paper |
8,998 | — | 8,998 | — | ||||||||||||
| Cash equivalents—corporate bonds |
8,585 | — | 8,585 | — | ||||||||||||
|
|
|
|
|
|
|
|
|
|||||||||
| Total assets |
$ | 18,415 | $ | 832 | $ | 17,583 | $ | — | ||||||||
|
|
|
|
|
|
|
|
|
|||||||||
| Liabilities: |
||||||||||||||||
| Contingent acquisition consideration |
$ | 2,302 | $ | — | $ | — | $ | 2,302 | ||||||||
|
|
|
|
|
|
|
|
|
|||||||||
| Total liabilities |
$ | 2,302 | $ | — | $ | — | $ | 2,302 | ||||||||
|
|
|
|
|
|
|
|
|
|||||||||
The Company’s recurring fair value measures relate to short-term investments, which are classified as cash equivalents and derivative instruments. The fair value of our cash equivalents are either based on quoted prices for similar assets or other observable inputs such as yield curves at commonly quoted intervals and other market corroborated inputs. The fair value of our derivatives is based on quoted market prices from various banking institutions or an independent third party provider for similar instruments. In determining the fair value, we consider our non-performance risk and that of our counterparties. At December 31, 2014, we had one 30-day forward contract to sell 2.3 million British pound sterling and purchase $3.5 million that together, had an immaterial fair value. At December 31, 2013, we had one 30-day forward contract outstanding to sell 3.0 million British pound sterling and one 30-day forward contract outstanding to purchase $5.0 million that together, had an immaterial fair value.
For the recurring fair value measure of contingent acquisition consideration, the Company estimated the fair value of the liability by probability weighting the range of possible achievement of the criteria upon which the contingent consideration to be paid will be determined as of December 31, 2013. The resulting estimated amount was then adjusted to its estimated net present value based upon a present value factor that was derived by applying a risk adjusted discount rate over the applicable contingency period. At December 31, 2014, the contingent acquisition consideration fair value, in the table above, approximated its book value and represents the amount to be paid based on actual achievement of the criteria. The contingent acquisition consideration decreased by $1.8 million in 2014, as the estimated liability was revised based on changes in performance estimates. In addition in 2014, the liability decreased due to the payment of $0.4 million in accordance with the terms of the underlying agreement. These decreases were partially offset by the accretion of the net present value of the liability. The gain of $1.8 million in the year ended December 31, 2014 is included in general and administrative expense in our consolidated statements of income.
The Company’s non-financial assets and non-financial liabilities subject to non-recurring measurements include goodwill and intangible assets.
10. Employee Benefit Plans
Defined Contribution Plans
The Company has defined contribution plans in the United States, the United Kingdom, India and Japan. The Company has a defined contribution employee savings plan in the United States, the Monotype Imaging Employee Savings Plan, or the U.S. 401(k) Plan. In the United States, the provisions of Section 401(k) of the Internal Revenue Code under which its United States employees may make
78
Table of Contents
contributions govern the plan. The U.S. 401(k) Plan provides for a discretionary employer matching contribution. For the years ended December 31, 2014, 2013 and 2012, the Company matched dollar-for-dollar up to the first 6% of the participant’s compensation. The U.S. 401(k) Plan also provides for a discretionary employer profit sharing contribution. Participants are fully vested in the current value of their contributions and all earnings thereon. Participants become vested in the employer contributions and all earnings thereon based on years of service as follows: 25.0% vested after one year; 50.0% vested after two years; 100.0% vested after three years. In the United Kingdom we contribute 5% of each employee’s salary into a retirement account, provided the employee contributes a minimum of 3% of salary. In India, the Company matches participant contributions dollar-for-dollar up to 12% of salary into an interest bearing government-controlled account, as required by law. In Japan, the Company contributes a fixed percent of the employee’s salary into an interest bearing account. Contributions to all of the Company’s defined contribution plans were $1.7 million, $1.7 million and $1.5 million for the years ended December 31, 2014, 2013 and 2012, respectively, and have been included in the accompanying consolidated statements of income.
Defined Benefit Pension Plan
Monotype Germany maintains an unfunded defined benefit pension plan, or the German Plan, which covers substantially all employees who joined the company prior to the plan’s closure to new participants in 2006. Participants are entitled to benefits in the form of retirement, disability and surviving dependent pensions. Benefits generally depend on years of service and the salary of the employees.
The components of net periodic benefit cost included in the accompanying consolidated statements of income were as follows:
| 2014 | 2013 | 2012 | ||||||||||
| Service cost |
$ | 114 | $ | 119 | $ | 83 | ||||||
| Interest cost |
171 | 161 | 175 | |||||||||
| Amortization of loss |
1 | 22 | — | |||||||||
|
|
|
|
|
|
|
|||||||
| Net periodic benefit cost |
$ | 286 | $ | 302 | $ | 258 | ||||||
|
|
|
|
|
|
|
|||||||
The assumptions used to determine the net periodic benefit cost were as follows:
| 2014 | 2013 | 2012 | ||||||||||
| Weighted-average discount rate |
2.25 | % | 3.5 | % | 3.25 | % | ||||||
| Weighted-average rate of compensation increase |
3.0 | % | 3.0 | % | 3.0 | % | ||||||
79
Table of Contents
Reconciliation of Funded Status and Accumulated Benefit Obligation
The German Plan is an unfunded plan and accordingly has no assets. A reconciliation of the beginning and ending balance of the projected benefit obligation for the years ended December 31, 2014 and 2013 is as follows:
| 2014 | 2013 | |||||||
| Change in projected benefit obligation: |
||||||||
| Projected benefit obligation at beginning of year |
$ | 5,122 | $ | 4,949 | ||||
| Service cost |
114 | 119 | ||||||
| Interest cost |
171 | 161 | ||||||
| Actuarial loss (gain) |
1,129 | (238 | ) | |||||
| Benefits paid |
(101 | ) | (91 | ) | ||||
| Foreign currency exchange rate changes |
(742 | ) | 222 | |||||
|
|
|
|
|
|||||
| Projected benefit obligation at end of year |
$ | 5,693 | $ | 5,122 | ||||
|
|
|
|
|
|||||
| Accumulated benefit obligation |
$ | 5,521 | $ | 4,978 | ||||
|
|
|
|
|
|||||
| Funded status at end of year |
$ | (5,693 | ) | $ | (5,122 | ) | ||
|
|
|
|
|
|||||
| Net Amounts Recognized in the Financial Statements: |
||||||||
| Current liability |
$ | 109 | $ | 112 | ||||
| Unrecognized actuarial gain reported within accrued pension benefits |
5,584 | 5,010 | ||||||
|
|
|
|
|
|||||
| Net accrued pension liability recognized |
5,693 | 5,122 | ||||||
| Amounts included in accumulated other comprehensive income not yet recognized in periodic pension cost, net of tax |
(1,537 | ) | (511 | ) | ||||
| Amounts expected to be amortized from accumulated other comprehensive income into net periodic pension costs over the next fiscal year (consists of net actuarial gain/loss) |
84 | 1 | ||||||
Monotype Germany also provides cash awards to its employees based on length of service. At December 31, 2014 and 2013, the balance accrued for such benefits totaled $95 thousand and $87 thousand, respectively, and is included in accrued pension benefits in the accompanying consolidated balance sheets.
The assumptions used to determine the accrued pension benefits (obligations) were as follows:
| 2014 | 2013 | |||||||
| Weighted-average discount rate |
2.25 | % | 3.5 | % | ||||
| Weighted-average rate of compensation increase |
3.0 | % | 3.0 | % | ||||
| Rate of inflation |
2.0 | % | 2.0 | % | ||||
The most recent actuarial valuation of the plan was performed as of December 31, 2014. The measurement dates are December 31, 2014 for 2014 and December 31, 2013 for 2013.
The following table reflects the total future expected benefit payments to plan participants. These payments have been estimated based on the same assumptions used to measure the Company’s benefit obligation at year end.
| Expected Future Benefit Payments: |
||||
| 2015 |
$ | 109 | ||
| 2016 |
136 | |||
| 2017 |
152 | |||
| 2018 |
162 | |||
| 2019 |
172 | |||
| 2020-2024 |
975 |
80
Table of Contents
11. Income Taxes
The components of domestic and foreign income before the provision for income taxes are as follows (in thousands):
| 2014 | 2013 | 2012 | ||||||||||
| U.S. |
$ | 28,900 | $ | 34,060 | $ | 27,354 | ||||||
| Foreign |
20,520 | 13,888 | 16,826 | |||||||||
|
|
|
|
|
|
|
|||||||
| Total income before provision for income taxes |
$ | 49,420 | $ | 47,948 | $ | 44,180 | ||||||
|
|
|
|
|
|
|
|||||||
The components of the provision for income taxes are as follows (in thousands):
| December 31, | ||||||||||||
| 2014 | 2013 | 2012 | ||||||||||
| Current |
||||||||||||
| U.S. Federal |
$ | 4,971 | $ | 6,414 | $ | 6,586 | ||||||
| State and local |
1,039 | 968 | 462 | |||||||||
| Foreign jurisdictions |
7,569 | 4,511 | 5,355 | |||||||||
|
|
|
|
|
|
|
|||||||
| 13,579 | 11,893 | 12,403 | ||||||||||
| Deferred |
||||||||||||
| U.S. Federal |
3,296 | 5,009 | 2,842 | |||||||||
| State and local |
259 | 424 | 555 | |||||||||
| Foreign jurisdictions |
(259 | ) | (463 | ) | (585 | ) | ||||||
|
|
|
|
|
|
|
|||||||
| 3,296 | 4,970 | 2,812 | ||||||||||
|
|
|
|
|
|
|
|||||||
| Total provision |
$ | 16,875 | $ | 16,863 | $ | 15,215 | ||||||
|
|
|
|
|
|
|
|||||||
A reconciliation of income taxes computed at federal statutory rates to income tax expense is as follows (dollar amounts in thousands):
| December 31, | ||||||||||||||||||||||||
| 2014 | 2013 | 2012 | ||||||||||||||||||||||
| Provision for income taxes at statutory rate |
$ | 17,297 | 35.0 | % | $ | 16,782 | 35.0 | % | $ | 15,462 | 35.0 | % | ||||||||||||
| State and local income taxes, net of federal tax benefit |
844 | 1.7 | % | 791 | 1.7 | % | 429 | 1.0 | % | |||||||||||||||
| Foreign rate differential |
31 | 0.1 | % | (150 | ) | (0.3 | )% | (220 | ) | (0.5 | )% | |||||||||||||
| Effect of rate changes on deferred taxes |
— | — | 110 | 0.2 | % | 232 | 0.5 | % | ||||||||||||||||
| Stock compensation |
180 | 0.4 | % | 60 | 0.1 | % | 113 | 0.2 | % | |||||||||||||||
| Research credits |
(394 | ) | (0.8 | )% | (535 | ) | (1.1 | )% | — | — | ||||||||||||||
| Reversal of reserve for income taxes |
(279 | ) | (0.5 | )% | (86 | ) | (0.2 | )% | (361 | ) | (0.8 | )% | ||||||||||||
| Contingent acquisition consideration |
(629 | ) | (1.3 | )% | — | — | — | — | ||||||||||||||||
| Other, net |
(175 | ) | (0.4 | )% | (109 | ) | (0.2 | )% | (440 | ) | (1.0 | )% | ||||||||||||
|
|
|
|
|
|
|
|
|
|
|
|
|
|||||||||||||
| Reported income tax provision |
$ | 16,875 | 34.2 | % | $ | 16,863 | 35.2 | % | $ | 15,215 | 34.4 | % | ||||||||||||
|
|
|
|
|
|
|
|
|
|
|
|
|
|||||||||||||
For the year ended December 31, 2014, our effective tax rate was 34.2%. The effective tax rate included a benefit of 1.3% for a reduction of book expense that resulted from the difference between the estimated and actual liability for contingent acquisition consideration, which does not increase taxable income. The effective tax rate also included a benefit of 0.8% for federal research tax credits, the benefit of which was less than the benefit realized in 2013, resulting in a rate increase of 0.3% in 2014. The foreign rate differential was a charge of 0.1% in 2014, as compared to a benefit of 0.3% in 2013. There was no effect of rate changes on deferred taxes in 2014, as compared to 2013.
81
Table of Contents
For the year ended December 31, 2013, our effective tax rate was 35.2%. The effective tax rate included a benefit of 1.1% for federal research tax credits, as the credit expired in 2011 but was renewed in 2013. The 2013 benefit included both the 2012 and 2013 research credits. The effective tax rate included a charge of 1.7% for state and local income taxes, net of federal benefit, as compared to a charge of 1.0% in 2012.
For the year ended December 31, 2012, our effective tax rate was 34.4%. The effective tax rate for 2012 did not include a benefit for federal research tax credits, as the credit expired at the end of 2011. The effect of rate changes on deferred taxes was a charge of 0.5% in 2012 resulting from an increase in our state tax rates
The provision for income taxes includes $3.9 million, $6.4 million and $1.5 million for the years ended December 31, 2014, 2013 and 2012, respectively, that was credited directly to stockholders’ equity, rather than to the provision for income taxes for the tax benefit associated with the exercise of non-qualified stock options by employees. In addition, the 2014, 2013 and 2012 provision does not include a benefit of $3.1 million, provisions of $0.7 million and $0.1 million, respectively, related to other amounts recorded directly to accumulated other comprehensive income.
Significant components of the Company’s deferred tax assets and liabilities consisted of the following (in thousands):
| December 31, | ||||||||
| 2014 | 2013 | |||||||
| Deferred tax assets: |
||||||||
| Compensation related deductions |
$ | 7,033 | $ | 5,982 | ||||
| Tax credit carryforwards |
2,297 | 3,032 | ||||||
| Federal and state net operating losses |
1,136 | 2,775 | ||||||
| Cumulative translation and foreign items |
2,522 | — | ||||||
| Accrued expenses |
2,298 | 1,890 | ||||||
|
|
|
|
|
|||||
| Subtotal deferred tax assets |
15,286 | 13,679 | ||||||
| Valuation allowance |
(1,801 | ) | (2,266 | ) | ||||
|
|
|
|
|
|||||
| Total deferred income tax assets |
$ | 13,485 | $ | 11,413 | ||||
|
|
|
|
|
|||||
| Deferred tax liabilities: |
||||||||
| Fixed assets |
$ | 623 | $ | 299 | ||||
| Intangible assets |
5,877 | 6,108 | ||||||
| Goodwill and indefinite lived intangibles |
36,909 | 33,177 | ||||||
| Unrealized gains |
25 | 42 | ||||||
| Other |
16 | 710 | ||||||
|
|
|
|
|
|||||
| Total deferred tax liabilities |
$ | 43,450 | $ | 40,336 | ||||
|
|
|
|
|
|||||
| Net deferred tax liabilities |
$ | 29,965 | $ | 28,923 | ||||
|
|
|
|
|
|||||
| Deferred tax assets and liabilities as classified in the consolidated balance sheets, based on the tax jurisdiction in which they reside as follows: |
||||||||
| Net deferred income tax assets—short-term |
$ | 2,898 | $ | 3,557 | ||||
| Net deferred income tax assets—long-term (1) |
105 | 130 | ||||||
| Net deferred income tax liabilities—short-term (2) |
(8 | ) | (10 | ) | ||||
| Net deferred income tax liabilities—long-term |
(32,960 | ) | (32,600 | ) | ||||
|
|
|
|
|
|||||
| Net deferred income tax liabilities |
$ | (29,965 | ) | $ | (28,923 | ) | ||
|
|
|
|
|
|||||
| (1) | Included in other assets in the accompanying consolidated balance sheets. |
| (2) | Included in accrued expenses and other current liabilities in the accompanying consolidated balance sheets. |
82
Table of Contents
In assessing the realizability of the deferred tax assets within each jurisdiction, the primary evidence we considered included the cumulative pre-tax income for financial reporting purposes over the past three years, and the estimated future taxable income based on historical, as well as subsequent interim period operating results. After giving consideration to these factors, we concluded that it was more likely than not that the domestic deferred tax assets would be fully realized, and as a result, no valuation allowance against the domestic deferred tax assets was deemed necessary at December 31, 2014 and 2013, except as described below.
A valuation allowance has been established for potential U.S. foreign tax credits that may be generated by Monotype Germany’s deferred tax liability related to temporary differences. As of December 31, 2014, the valuation allowance against these credits was $1.6 million. Monotype Germany is a branch for U.S. tax purposes, and therefore we are eligible to claim a foreign tax credit for taxes paid to Germany. As a result of the complexity of the U.S. foreign tax credit computation, and the uncertainty related to whether we will be entitled to a foreign tax credit when the related deferred taxes are paid or accrued, we have established a partial valuation allowance against these credits. The Company also maintains a partial valuation allowance against the tax benefit of net operating losses.
In accordance with ASC Topic No. 740, the Company has recorded approximately $8.1 million to its reserve for uncertain tax positions at December 31, 2014. The following is a reconciliation of the Company’s gross uncertain tax positions at December 31, 2014 and 2013 (in thousands):
| December 31, 2011 |
$ | 909 | ||
| Decrease related to lapse of applicable statutes of limitations |
(253 | ) | ||
| Increases related to positions taken and acquired in the current year |
3,963 | |||
|
|
|
|||
| December 31, 2012 |
$ | 4,619 | ||
| Decrease related to lapse of applicable statues of limitations |
(357 | ) | ||
| Increase related to positions taken in prior years |
1,654 | |||
| Increases related to positions taken in the current year |
258 | |||
|
|
|
|||
| December 31, 2013 |
$ | 6,174 | ||
| Decrease related to positions lapse of applicable statutes of limitations |
(131 | ) | ||
| Increase related to positions taken in prior years |
1,827 | |||
| Increases related to positions taken and acquired in the current year |
276 | |||
|
|
|
|||
| December 31, 2014 |
$ | 8,146 | ||
|
|
|
Of this amount of unrecognized tax benefits, approximately $5.3 million, $4.8 million and $4.6 million, if recognized, would result in a reduction of the Company’s effective tax rate at December 31, 2014, 2013 and 2012, respectively. The Company recognizes interest and penalties as a component of income tax expense. As of December 31, 2014, 2013 and 2012, the Company has accrued approximately $0.2 million, $56 thousand and $78 thousand, respectively, related to interest and penalties. The tax provision for the year ended December 31, 2014 includes a provision of $0.2 million for interest and at December 31, 2013 included a net benefit of $14 thousand related to interest. In 2012, the net benefit was $0.1 million. The increase in unrecognized tax benefits in 2014 relates primarily to uncertainty concerning potential transfer pricing adjustments. The increase in unrecognized tax benefits in 2013 relates to potential uncertainty surrounding the timing of deductions for certain accrued liabilities. The Company does not anticipate a significant change in the balance of uncertain tax positions over the next twelve months.
The Company monitors the undistributed earnings of foreign subsidiaries and, as necessary, provides for income taxes on those earnings that are not deemed permanently invested.
As of December 31, 2014, the Company does not have any material amount of undistributed earnings at its foreign subsidiaries.
83
Table of Contents
As of December 31, 2014, federal and state net operating loss carryforwards of $2.1 million and $0.6 million, respectively, are available, which begin to expire in 2020. These net operating losses were acquired in connection with the Bitstream acquisition, and are therefore, subject to limitation pursuant to Internal Revenue Code Section 382. The annual limitation on these losses is $4.9 million per year in 2014 through 2016.
The Company’s 2012 tax return is currently under audit by the U.S. Internal Revenue Service, and the years 2011 through 2013 are under audit by taxing authorities in Japan. These audits are expected to be completed in 2015. The Company currently has approximately $5.7 million in uncertain tax positions that could be settled in the next twelve months related to the years that are subject to audit. In addition, the Company’s federal tax return is open to audit for the years 2011 through 2014, and the Company and its subsidiaries’ state income tax returns are subject to audit for the years 2010 through 2014.
12. Net income per share
Basic and diluted earnings per share are computed pursuant to the two-class method. The two-class method determines earnings per share for each class of common stock and participating security according to their respective participation rights in undistributed earnings. Unvested restricted stock awards granted to employees are considered participating securities as they receive non-forfeitable rights to cash dividends at the same rate as common stock. In accordance with ASC Topic No. 260, diluted net income per share is calculated using the more dilutive of the following two approaches:
| 1. | Assume exercise of stock options and vesting of restricted stock using the treasury stock method. |
| 2. | Assume exercise of stock options using the treasury stock method, but assume participating securities (unvested restricted stock) are not vested and allocate earnings to common shares and participating securities using the two-class method. |
84
Table of Contents
For the years ended December 31, 2014 and 2012, the two class method was used in the computation as it was the more dilutive of the two approaches. For the year ended December 31, 2013, the treasury stock method was used in the computation as it was the more dilutive of the two approaches. The following presents a reconciliation of the numerator and denominator used in the calculation of basic net income per share and a reconciliation of the denominator used in the calculation of diluted net income per share (in thousands, except share and per share data):
| Year Ended December 31, | ||||||||||||
| 2014 | 2013 | 2012 | ||||||||||
| Numerator: |
||||||||||||
| Net income, as reported |
$ | 32,545 | $ | 31,085 | $ | 28,965 | ||||||
| Less: net income attributable to participating securities |
(605 | ) | (503 | ) | (469 | ) | ||||||
|
|
|
|
|
|
|
|||||||
| Net income available to common shareholders—basic for 2014 and 2012, basic and diluted for 2013 |
$ | 31,940 | $ | 30,582 | $ | 28,496 | ||||||
|
|
|
|
|
|
|
|||||||
| Denominator: |
||||||||||||
| Basic: |
||||||||||||
| Weighted-average shares of common stock outstanding |
39,311,182 | 38,470,376 | 36,914,163 | |||||||||
| Less: weighted-average shares of unvested restricted common stock outstanding |
(745,814 | ) | (636,559 | ) | (602,328 | ) | ||||||
|
|
|
|
|
|
|
|||||||
| Weighted-average number of common shares used in computing basic net income per common share |
38,565,368 | 37,833,817 | 36,311,835 | |||||||||
|
|
|
|
|
|
|
|||||||
| Net income per share applicable to common shareholders—basic |
$ | 0.83 | $ | 0.81 | $ | 0.78 | ||||||
|
|
|
|
|
|
|
|||||||
| Denominator: |
||||||||||||
| Diluted: |
||||||||||||
| Weighted-average shares of common stock outstanding |
38,470,376 | |||||||||||
| Less: weighted-average shares of unvested restricted common stock outstanding |
(636,559 | ) | ||||||||||
| Weighted-average number of common shares issuable upon exercise of outstanding stock options, based on the treasury stock method |
1,240,629 | |||||||||||
| Weighted-average number of shares of restricted common stock outstanding, based on the treasury stock method |
211,205 | |||||||||||
|
|
|
|||||||||||
| Weighted-average number of common shares used in computing diluted net income per common share |
39,285,651 | |||||||||||
|
|
|
|||||||||||
| Net income per share applicable to common shareholders—diluted |
$ | 0.78 | ||||||||||
|
|
|
|||||||||||
| Numerator: |
||||||||||||
| Net income available to common shareholders—basic |
$ | 31,940 | $ | 28,496 | ||||||||
| Plus: undistributed earnings allocated to participating securities |
379 | 424 | ||||||||||
| Less: undistributed earnings reallocated to participating securities |
(369 | ) | (410 | ) | ||||||||
|
|
|
|
|
|||||||||
| Net income available to common shareholders—diluted |
$ | 31,950 | $ | 28,510 | ||||||||
|
|
|
|
|
|||||||||
| Denominator: |
||||||||||||
| Diluted: |
||||||||||||
| Weighted-average shares of common stock outstanding |
39,311,182 | 36,914,163 | ||||||||||
| Less: weighted-average shares of unvested restricted common stock outstanding |
(745,814 | ) | (602,328 | ) | ||||||||
| Weighted-average number of common shares issuable upon exercise of outstanding stock options, based on the treasury stock method |
901,349 | 1,250,118 | ||||||||||
|
|
|
|
|
|||||||||
| Weighted-average number of common shares used in computing diluted net income per common share |
39,466,717 | 37,561,953 | ||||||||||
|
|
|
|
|
|||||||||
| Net income per share applicable to common shareholders—diluted |
$ | 0.81 | $ | 0.76 | ||||||||
|
|
|
|
|
|||||||||
85
Table of Contents
The following common share equivalents have been excluded from the computation of diluted weighted-average shares outstanding, for the periods indicated, as their effect would have been anti-dilutive:
| Year Ended December 31, | ||||||||||||
| 2014 | 2013 | 2012 | ||||||||||
| Options |
376,606 | 390,974 | 1,638,905 | |||||||||
| Unvested restricted common stock |
117,111 | 17,620 | 1,459 | |||||||||
| Unvested restricted stock units |
2,221 | — | — | |||||||||
13. Stockholders’ Equity
Share repurchases
On October 23, 2013, the Company’s Board of Directors approved a share repurchase program of up to $50.0 million of the Company’s outstanding shares of common stock over the next two years. Intended to offset shareholder dilution, the Company expects purchases under the program will be made periodically, on the open market as business and market conditions warrant. The share repurchase program does not obligate the Company to acquire any particular amount of common stock, and the program may be suspended or discontinued at management’s and/or the Board of Directors’ discretion. As of December 31, 2014, the Company has purchased a total of 1,146,127 shares of its common stock for an aggregate purchase price of $31.9 million, including brokers’ fees. As of December 31, 2013, the Company repurchased 75,000 shares of its common stock for an aggregate purchase price of $2.2 million, including brokers’ fees.
Stock Compensation Plans
In November 2004, the Company’s stockholders approved the 2004 Stock Option and Grant Plan, or the 2004 Award Plan. The 2004 Award Plan provides long-term incentives and rewards to full-time and part-time officers, directors, employees, consultants, advisors and other key persons (collectively, “Key Persons”) who are responsible for, or contribute to, the management, growth or profitability of the Company. Options and stock grants issued under the 2004 Award Plan generally vest over a four year period and expire ten years from the date of grant. The Company has granted incentive stock options, nonqualified stock options and restricted stock awards under the 2004 Award Plan. As of December 31, 2014, 2,591,204 options and 2,810,403 restricted stock awards have been granted under the 2004 Option Plan. There will be no future grants of awards from the 2004 Award Plan.
In March 2007, the Company’s Board of Directors approved the adoption of the Company’s 2007 Stock Option and Incentive Plan, which was subsequently approved by stockholders in May 2007 and became effective on July 24, 2007. On March 30, 2011, the Company’s Board of Directors approved an amendment and restatement of the 2007 Stock Option and Incentive Plan, which was subsequently approved by stockholders on May 13, 2011. On March 26, 2014, the Company’s Board of Directors approved a second amendment and restatement of the 2007 Stock Option and Incentive Plan, or 2007 Award Plan, which was subsequently approved by the stockholders on May 5, 2014. The 2007 Award Plan permits the Company to make grants of incentive stock options, non-qualified stock options, stock appreciation rights, deferred stock awards, or restricted stock units, restricted stock awards, unrestricted stock awards, cash-based awards and dividend equivalent rights to Key Persons. A total of 9,383,560 shares of common stock have been authorized for issuance of awards under the 2007 Award Plan, subject to adjustment for any stock split, dividend or other change in the Company’s capitalization. In addition, shares that are forfeited or cancelled from awards under the 2004 Award Plan or the 2007 Award Plan will be available for future grants under the 2007 Award Plan. The number of shares authorized for issuance under the 2007 Award Plan increased by 2,000,000 shares from 4,383,560 in May 2011 in
86
Table of Contents
connection with the shareholder approval of the amended and restated 2007 Stock Option and Incentive Plan. Further in May 2014, the number of shares authorized for issuance under the 2007 Award Plan increased by 3,000,000 shares from 6,383,560, in connection with shareholder approval of the Second Amended and Restated 2007 Award Plan, or 2007 Award Plan.
Stock options granted under the 2007 Award Plan have a maximum term of ten years from the date of grant and generally vest over four years. Option awards granted under the 2007 Award Plan must have an exercise price of no less than the fair market value of the common stock on the date of grant. The Company has granted nonqualified stock options and restricted stock awards under the 2007 Plan, and during 2014, the Company granted restricted stock units. Some of the restricted stock units granted are subject to performance-based vesting conditions. The vesting for those grants is based on the achievement of specific annual Company revenue targets over three consecutive years; there is no time-based vesting element to these awards. Achievement can be accelerated or cumulative, and there is a catch up provision. Prior to 2014, all equity grants were subject to time-based vesting. As of December 31, 2014, the annual revenue target associated with the grant of restricted stock units had not been met, and it was determined that it was not probable that the future performance criteria will be met, and therefore, no compensation expense was recorded in the financial statements for these equity awards. The Company will continue to monitor the circumstances of these awards. As of December 31, 2014, 4,849,298 options, 1,453,942 restricted stock awards and 174,032 restricted stock units have been granted under the 2007 Award Plan. Pursuant to the terms of our 2007 Award Plan, we automatically reacquire any unvested restricted shares at their original price from the grantee upon termination of employment. In the years ended December 31, 2014, 2013 and 2012, the Company repurchased 32,932 shares, 13,314 shares and 17,574 shares, respectively, of unvested restricted common stock pursuant to the 2007 Award Plan.
On December 7, 2010 the Company’s Management Development and Compensation Committee approved the 2010 Inducement Stock Plan, or 2010 Inducement Plan, in connection with our acquisition of Ascender Corporation. The Company is permitted to issue equity awards to individuals in certain circumstances in accordance with Marketplace Rule 5635(c)(4) of the NASDAQ Stock Market, Inc., without prior shareholder approval. The Company established the 2010 Inducement Plan for such purpose. The 2010 Inducement Plan permits the Company to make grants of non-qualified stock options, stock appreciation rights, deferred stock awards, restricted stock awards and unrestricted stock awards to induce highly qualified prospective officers and employees, who are not employed by the Company and its subsidiaries, on the date of grant to accept employment and to provide them with a proprietary interest in the Company. The Company has reserved 700,000 shares of common stock for issuance of awards under the plan. Shares of stock underlying any award that is forfeited, canceled, held back upon the exercise of an option, settlement of tax withholding or otherwise terminated shall be added back to the shares of stock available for issuance under the 2010 Inducement Plan. Stock options granted under the 2010 Inducement Plan have a maximum term of ten years from the date of grant and generally vest over four years. Option awards granted under the 2010 Inducement Plan must have an exercise price of no less than the fair market value of the common stock on the date of grant. The Company has granted nonqualified stock options and restricted stock awards under the 2010 Plan. As of December 31, 2014, 148,374 options and 227,490 restricted stock awards have been granted under the 2010 Inducement Plan. Pursuant to the terms of our 2010 Inducement Plan, we automatically reacquire any unvested restricted shares at their original price from the grantee upon termination of employment. In the years ended December 31, 2014 and 2013, we repurchased 1,781 shares and 415 shares, respectively, of our common stock in accordance with the 2010 Inducement Plan. The Company did not repurchase any shares of our common stock in accordance with the 2010 Inducement Plan in the year ended December 31, 2012.
87
Table of Contents
Share Based Compensation
The following presents the impact of share based compensation expense on our consolidated statements of income (in thousands):
| Year Ended December 31, |
||||||||||||
| 2014 | 2013 | 2012 | ||||||||||
| Marketing and selling |
$ | 4,813 | $ | 3,780 | $ | 3,068 | ||||||
| Research and development |
2,352 | 1,910 | 1,589 | |||||||||
| General and administrative |
3,484 | 2,519 | 2,261 | |||||||||
|
|
|
|
|
|
|
|||||||
| Total expensed |
$ | 10,649 | $ | 8,209 | $ | 6,918 | ||||||
| Property and equipment |
139 | — | — | |||||||||
|
|
|
|
|
|
|
|||||||
| Total share based compensation |
$ | 10,788 | $ | 8,209 | $ | 6,918 | ||||||
|
|
|
|
|
|
|
|||||||
As of December 31, 2014, the Company had $20.1 million of unrecognized compensation expense related to employees and directors unvested stock option awards, restricted share awards and restricted stock units that are expected to be recognized over a weighted-average period of 1.7 years. As of December 31, 2014, the performance criteria was not met on the performance based restricted stock units; however, if the Company had determined that achievement of the performance criteria was probable, the Company would have $4.5 million of unrecognized compensation expense related to these awards.
Stock Option Awards
Stock option activity for all plans for the year ended December 31, 2014 is presented below:
| Number of Shares |
Weighted- Average Price per Share |
Aggregate Intrinsic Value (1) (in thousands) |
Weighted- Average Remaining Contractual Life (in Years) |
|||||||||||||
| Outstanding at December 31, 2013 |
2,703,631 | $ | 12.84 | |||||||||||||
| Granted |
249,552 | $ | 30.00 | |||||||||||||
| Exercised |
(803,506 | ) | $ | 10.58 | ||||||||||||
| Expired |
(24,423 | ) | $ | 9.48 | ||||||||||||
| Forfeited |
(43,507 | ) | $ | 21.38 | ||||||||||||
|
|
|
|||||||||||||||
| Outstanding at December 31, 2014 |
2,081,747 | $ | 15.63 | $ | 27,819 | 6.1 | ||||||||||
|
|
|
|||||||||||||||
| Exercisable at December 31, 2014 |
1,394,691 | $ | 12.13 | $ | 23,293 | 5.1 | ||||||||||
|
|
|
|||||||||||||||
| Vested and expected to vest at December 31, 2014 (2) |
2,045,385 | $ | 15.50 | $ | 27,579 | |||||||||||
|
|
|
|||||||||||||||
| (1) | The aggregate intrinsic value is calculated as the positive difference between the exercise price of the underlying options and the quoted price of our shares of common stock on December 31, 2014. |
| (2) | Represents the number of vested options as of December 31, 2014, plus the number of unvested options at December 31, 2014 that are ultimately expected to vest based on our estimated forfeiture rate. |
The aggregate intrinsic value of exercised options in the years ended December 31, 2014, 2013 and 2012 was $14.5 million, $25.8 million and $6.8 million, respectively.
88
Table of Contents
Unvested Restricted Stock Awards
Unvested restricted stock award activity for the year ended December 31, 2014 is presented below:
| Shares | Weighted- Average Fair Value Per Share |
|||||||
| Unvested shares outstanding at December 31, 2013 |
568,114 | $ | 17.64 | |||||
| Granted |
484,148 | $ | 29.73 | |||||
| Vested |
(308,952 | ) | $ | 16.55 | ||||
| Forfeited |
(27,780 | ) | $ | 23.55 | ||||
|
|
|
|||||||
| Unvested shares outstanding at December 31, 2014 |
715,530 | $ | 26.06 | |||||
|
|
|
|||||||
The fair value of shares vested during 2014, 2013 and 2012 was $8.8 million, $6.6 million and $3.2 million, respectively.
Unvested Restricted Stock Units
Unvested restricted stock unit activity for the year ended December 31, 2014 is presented below:
| Number of Shares |
Weighted- Average Price per Share |
Aggregate Intrinsic Value (1) (in thousands) |
Weighted- Average Remaining Contractual Life (in Years) |
|||||||||||||
| Outstanding at December 31, 2013 |
— | |||||||||||||||
| Granted |
174,032 | |||||||||||||||
| Converted |
— | $ | — | |||||||||||||
| Expired |
— | |||||||||||||||
| Forfeited |
(6,933 | ) | ||||||||||||||
|
|
|
|||||||||||||||
| Outstanding at December 31, 2014 |
167,099 | $ | — | $ | 4,817 | 1.2 | ||||||||||
|
|
|
|||||||||||||||
| Convertible at December 31, 2014 |
— | $ | — | $ | — | — | ||||||||||
|
|
|
|||||||||||||||
| Expected to convert at December 31, 2014 (2) |
18,089 | $ | — | $ | 296 | |||||||||||
|
|
|
|||||||||||||||
| (1) | The aggregate intrinsic value is calculated as the positive difference between the exercise price of the underlying units and the quoted price of our shares of common stock on December 31, 2014. |
| (2) | Represents the number of unvested restricted stock units as of December 31, 2014 that are ultimately expected to vest based on our estimated forfeiture rate or probability of achievement. |
89
Table of Contents
14. Segment Reporting
We view our operations and manage our business as one segment: the development, marketing and licensing of technologies and fonts. Factors used to identify our single segment include the financial information available for evaluation by our chief operating decision maker, our president and chief executive officer, in determining how to allocate resources and assess performance. While our technologies and services are sold into two principal markets, Creative Professional and OEM, assets and expenses are not formally allocated to these market segments, and operating results are assessed on an aggregate basis to make decisions about the allocation of resources. The following table presents revenue for our two major markets (in thousands):
| Year Ended December 31, | ||||||||||||
| 2014 | 2013 | 2012 | ||||||||||
| Creative Professional |
$ | 76,961 | $ | 63,689 | $ | 51,751 | ||||||
| OEM |
107,539 | 102,935 | 98,110 | |||||||||
|
|
|
|
|
|
|
|||||||
| Total |
$ | 184,500 | $ | 166,624 | $ | 149,861 | ||||||
|
|
|
|
|
|
|
|||||||
Geographic segment information
The Company attributes revenues to geographic areas based on the location of our subsidiary receiving such revenue. For example, licenses may be sold to large international companies which may be headquartered in South Korea for instance, but the sales are received and recorded by our subsidiary located in the United States. This revenue is therefore reflected in the United States totals in the table below. We market our products and services through offices in the U.S., United Kingdom, Germany, China, South Korea and Japan. The following summarizes revenue by location:
| Year Ended December 31, | ||||||||||||||||||||||||
| 2014 | 2013 | 2012 | ||||||||||||||||||||||
| Sales | % of Total | Sales | % of Total | Sales | % of Total | |||||||||||||||||||
| (In thousands, except percentages) | ||||||||||||||||||||||||
| United States |
$ | 96,696 | 52.4 | % | $ | 91,037 | 54.7 | % | $ | 78,653 | 52.5 | % | ||||||||||||
| United Kingdom |
10,716 | 5.8 | 7,029 | 4.2 | 5,214 | 3.5 | ||||||||||||||||||
| Germany |
23,049 | 12.5 | 18,331 | 11.0 | 19,717 | 13.1 | ||||||||||||||||||
| Japan |
53,318 | 28.9 | 49,706 | 29.8 | 45,739 | 30.5 | ||||||||||||||||||
| Other Asia |
721 | 0.4 | 521 | 0.3 | 538 | 0.4 | ||||||||||||||||||
|
|
|
|
|
|
|
|
|
|
|
|
|
|||||||||||||
| Total |
$ | 184,500 | 100.0 | % | $ | 166,624 | 100.0 | % | $ | 149,861 | 100.0 | % | ||||||||||||
|
|
|
|
|
|
|
|
|
|
|
|
|
|||||||||||||
Long-lived assets, which include property and equipment, goodwill and intangibles, but exclude other assets, long-term investments and deferred tax assets, are attributed to geographic areas in which Company assets reside and is shown below (in thousands):
| December 31, | ||||||||
| 2014 | 2013 | |||||||
| Long-lived assets: |
||||||||
| United States |
$ | 189,927 | $ | 192,066 | ||||
| United Kingdom |
5,138 | 4,926 | ||||||
| Germany |
62,917 | 56,140 | ||||||
| Asia (including Japan) |
3,457 | 3,470 | ||||||
|
|
|
|
|
|||||
| Total |
$ | 261,439 | $ | 256,602 | ||||
|
|
|
|
|
|||||
90
Table of Contents
15. Commitments and Contingencies
Operating Leases
We conduct operations in facilities under operating leases expiring through 2022. In accordance with the lease terms, we pay real estate taxes and other operating costs. Our leases in California, New York, Massachusetts, Germany, India and Japan contain renewal options. The Company’s future minimum payments under non-cancelable operating leases as of December 31, 2014 are approximately as follows (in thousands):
| Years ending December 31: |
||||
| 2015 |
$ | 2,955 | ||
| 2016 |
2,647 | |||
| 2017 |
2,131 | |||
| 2018 |
1,594 | |||
| 2019 |
1,448 | |||
| Thereafter |
3,480 | |||
|
|
|
|||
| Total |
$ | 14,255 | ||
|
|
|
Certain of our operating leases include escalating rental payments and lease incentives such as free rent. We record rent expense on a straight-line basis over the contractual life of the lease. Rent expense charged to operations was approximately $2.6 million, $2.2 million and $1.9 million for the years ended December 31, 2014, 2013 and 2012, respectively.
License Agreements
We license certain font related technology from a third-party for development and resale purposes. The license agreement provides for minimum annual payments, as of December 31, 2014, as follows (in thousands):
| Years ending December 31: |
||||
| 2015 |
$ | 500 | ||
| 2016 |
500 | |||
| 2017 |
100 | |||
| 2018 |
100 | |||
| 2019 |
100 | |||
| Thereafter |
200 | |||
|
|
|
|||
| Total |
$ | 1,500 | ||
|
|
|
Legal Proceedings
From time to time, we may be a party to various claims, suits and complaints. We do not believe that there are claims or legal proceedings that, if determined adversely to us, would have a material adverse effect on our business, results of operations or financial condition.
Licensing Warranty
Under our standard license agreement with OEMs, we warrant that the licensed technologies are free of infringement claims of intellectual property rights and will meet the specifications as defined in the licensing agreement for a one-year period. Under the licensing agreements, liability for such indemnity obligations is limited, generally to the total arrangement fee; however, exceptions have been made on a case-by-case basis, increasing the maximum potential liability to agreed upon amounts at the time the contract is entered into. We have never incurred costs payable to a customer or business partner to
91
Table of Contents
defend lawsuits or settle claims related to these warranties, and as a result, management believes the estimated fair value of these warranties is minimal. Accordingly, there are no liabilities recorded for these warranties as of December 31, 2014 and 2013.
16. Supplementary Financial Data (Unaudited)
(in thousands, except per share amounts)
| Three Months Ended | ||||||||||||||||||||||||||||||||
| December 31, 2014 |
September 30, 2014 |
June 30, 2014 |
March 31, 2014 |
December 31, 2013 |
September 30, 2013 |
June 30, 2013 |
March 31, 2013 |
|||||||||||||||||||||||||
| Revenue |
$ | 46,402 | $ | 47,063 | $ | 44,963 | $ | 46,072 | $ | 43,032 | $ | 40,468 | $ | 41,085 | $ | 42,039 | ||||||||||||||||
| Gross profit |
37,737 | 38,692 | 36,495 | 38,419 | 36,074 | 33,392 | 33,930 | 34,892 | ||||||||||||||||||||||||
| Net income |
9,370 | 7,039 | 7,691 | 8,445 | 8,094 | 7,064 | 7,311 | 8,616 | ||||||||||||||||||||||||
| Net income available to common shareholders—basic |
9,197 | 6,899 | 7,532 | 8,317 | 7,973 | 6,950 | 7,182 | 8,478 | ||||||||||||||||||||||||
| Net income available to common shareholders—diluted |
9,199 | 6,899 | 7,534 | 8,319 | 7,973 | 6,950 | 7,185 | 8,481 | ||||||||||||||||||||||||
| Income per common share: |
||||||||||||||||||||||||||||||||
| Basic |
$ | 0.24 | $ | 0.18 | $ | 0.19 | $ | 0.21 | $ | 0.21 | $ | 0.18 | $ | 0.19 | $ | 0.23 | ||||||||||||||||
| Diluted |
$ | 0.23 | $ | 0.17 | $ | 0.19 | $ | 0.21 | $ | 0.20 | $ | 0.18 | $ | 0.18 | $ | 0.22 | ||||||||||||||||
17. Subsequent Events
Dividend Declaration
On February 10, 2015 the Company’s Board of Directors declared a $0.10 per share quarterly cash dividend on our outstanding common stock. The record date is set for April 1, 2015 and the dividend is payable to shareholders on April 21, 2015. Dividends are declared at the discretion of the Company’s Board of Directors and depend on actual cash from operations, the Company’s financial condition and capital requirements and any other factors the Company’s Board of Directors may consider relevant. Future dividend declarations, as well as the record and payment dates for such dividends, will be determined by the Company’s Board of Directors on a quarterly basis.
Share Repurchase Program
The Company repurchased 100,000 shares of common stock for $2.8 million in the period of January 13 to January 30, 2015, at a weighted-average price per share of $28.32, and 36,700 shares of common stock for $1.1 million in the period of February 2 to February 19, 2015, at a weighted-average price per share of $30.95. The Company purchased these shares on the open market at prevailing market prices. At February 19, 2015, $14.2 million remains for future purchases under the Plan.
Acquisition
On February 2, 2015, the Company purchased all of the outstanding stock of TextPride, Inc. operating under the name of Swyft Media, a privately-held mobile messaging company located in New York, New York, for an aggregate purchase price of approximately $12.0 million in cash on hand, plus contingent consideration of up to $15.0 million payable through 2017.
92
Table of Contents
| Item 9. | Changes In and Disagreements With Accountants on Accounting and Financial Disclosure |
None.
| Item 9A. | Controls and Procedures |
We maintain disclosure controls and procedures, which are designed to ensure that information required to be disclosed in the reports we file or submit under the Exchange Act is recorded, processed, summarized and reported within the time periods specified in the SEC’s rules and forms, and that such information is accumulated and communicated to our management, including our principal executive officer and principal financial officer, as appropriate, to allow timely decisions regarding required disclosure.
Our management, including our principal executive officer and principal financial officer, evaluated the effectiveness of our disclosure controls and procedures, as such term is defined in Rule 13a-15(e) and Rule 15d-15(e) under the Exchange Act, as of the end of the period covered by this Annual Report on Form 10-K. Based on that evaluation, our management, including our principal executive officer and principal financial officer, concluded that our disclosure controls and procedures were effective as of December 31, 2014. All internal control systems, no matter how well designed, have inherent limitations. Therefore, even those systems determined to be effective can provide only reasonable assurance with respect to financial statement preparation and presentation.
Management’s Annual Report on Internal Control Over Financial Reporting
Our management is responsible for establishing and maintaining adequate internal control over financial reporting, as this term is defined in Rule 13a-15(f) and 15d-15(f) of the Exchange Act. All internal control systems, no matter how well designed, have inherent limitations. Therefore, even those systems determined to be effective can provide only reasonable assurance with respect to financial statement preparation and presentation.
Under the supervision and with the participation of our management, including our principal executive officer and principal financial officer, we conducted an evaluation of the effectiveness of our internal control over financial reporting as of December 31, 2014 based on the framework set forth in Internal Control-Integrated Framework issued by the Committee of Sponsoring Organizations of the Treadway Commission (1992 Framework).
Based on our evaluation under the framework set forth in Internal Control-Integrated Framework, our management concluded that our internal control over financial reporting was effective at the reasonable assurance level as of December 31, 2014. Management excluded from its assessment of the Company’s internal control over financial reporting as of December 31, 2014, the internal control over financial reporting of FontShop International GmbH, its wholly-owned subsidiary FontShop International, Inc., and FontShop AG, collectively FontShop, which was acquired by the Company on July 14, 2014. This exclusion is consistent with guidance issued by the SEC that an assessment of a recently acquired business may be omitted from management’s report on internal control over financial reporting in the year of acquisition. FontShop represented 0.7% and 0.4% of our consolidated total and net assets, respectively, as of December 31, 2014 and 2.6% and 3.5% of our consolidated net revenues and net income, respectively, for the year ended December 31, 2014. See a discussion of this acquisition in the notes to the consolidated financial statements in Note 3 of this annual report on Form 10-K. Based on our evaluation under the framework set forth in Internal Control-Integrated Framework, our management concluded that our internal control over financial reporting was effective at the reasonable assurance level as of December 31, 2014.
93
Table of Contents
Our internal control over financial reporting as of December 31, 2014 has been audited by Ernst & Young LLP, an independent registered public accounting firm, as stated in their report below.
Changes in Internal Control over Financial Reporting
An evaluation was also performed under the supervision and with the participation of our management, including the principal executive officer and principal financial officer, of any change in our internal controls over financial reporting that occurred during our last fiscal quarter and that has materially affected, or is reasonably likely to affect, our internal controls over financial reporting. There has been no change in our internal controls over financial reporting during our most recent fiscal quarter that has materially affected, or is reasonably likely to materially affect, our internal controls over financial reporting.
94
Table of Contents
REPORT OF INDEPENDENT REGISTERED PUBLIC ACCOUNTING FIRM
The Board of Directors and Stockholders of
Monotype Imaging Holdings Inc.
We have audited Monotype Imaging Holdings Inc.’s internal control over financial reporting as of December 31, 2014, based on criteria established in Internal Control-Integrated Framework issued by the Committee of Sponsoring Organizations of the Treadway Commission (1992 framework) (the COSO criteria). Monotype Imaging Holdings Inc.’s management is responsible for maintaining effective internal control over financial reporting, and for its assessment of the effectiveness of internal control over financial reporting included in the accompanying Management’s Annual Report on Internal Control Over Financial Reporting. Our responsibility is to express an opinion on the company’s internal control over financial reporting based on our audit.
We conducted our audit in accordance with the standards of the Public Company Accounting Oversight Board (United States). Those standards require that we plan and perform the audit to obtain reasonable assurance about whether effective internal control over financial reporting was maintained in all material respects. Our audit included obtaining an understanding of internal control over financial reporting, assessing the risk that a material weakness exists, testing and evaluating the design and operating effectiveness of internal control based on the assessed risk, and performing such other procedures as we considered necessary in the circumstances. We believe that our audit provides a reasonable basis for our opinion.
A company’s internal control over financial reporting is a process designed to provide reasonable assurance regarding the reliability of financial reporting and the preparation of the financial statements for external purposes in accordance with generally accepted accounting principles. A company’s internal control over financial reporting includes those policies and procedures that (1) pertain to the maintenance of records that, in reasonable detail, accurately and fairly reflect the transactions and dispositions of the assets of the company; (2) provide reasonable assurance that transactions are recorded as necessary to permit preparation of financial statements in accordance with generally accepted accounting principles, and that receipts and expenditures of the company are being made only in accordance with authorizations of management and directors of the company; and (3) provide reasonable assurance regarding prevention or timely detection of unauthorized acquisition, use or disposition of the company’s assets that could have a material effect on the financial statements.
Because of its inherent limitations, internal control over financial reporting may not prevent or detect misstatements. Also, projections of any evaluation of effectiveness to future periods are subject to the risk that controls may become inadequate because of changes in conditions, or that the degree of compliance with the policies or procedures may deteriorate.
As indicated in the accompanying Management’s Annual Report on Internal Control Over Financial Reporting, management’s assessment of and conclusion on the effectiveness of internal control over financial reporting did not include the internal controls of FontShop International GmbH, its wholly-owned subsidiary FontShop International Inc., and FontShop AG, collectively FontShop, which is included in the 2014 consolidated financial statements of Monotype Imaging Holdings Inc. and constituted 0.7% and 0.4% of total and net assets, respectively, as of December 31, 2014 and 2.6% and 3.5% of revenues and net loss, respectively, for the year then ended. Our audit of internal control over financial reporting of Monotype Imaging Holdings Inc. also did not include an evaluation of the internal control over financial reporting of FontShop.
In our opinion, Monotype Imaging Holdings Inc. maintained, in all material respects, effective internal control over financial reporting as of December 31, 2014, based on the COSO criteria.
95
Table of Contents
We also have audited, in accordance with the standards of the Public Company Accounting Oversight Board (United States), the consolidated balance sheets of Monotype Imaging Holdings Inc. as of December 31, 2014 and 2013, and the related consolidated statements of income, comprehensive income, stockholders’ equity and cash flows for each of the three years in the period ended December 31, 2014 of Monotype Imaging Holdings Inc. and our report dated February 27, 2015 expressed an unqualified opinion thereon.
/s / ERNST & YOUNG LLP
Boston, Massachusetts
February 27, 2015
96
Table of Contents
| Item 9B. | Other Information |
None
PART III
| Item 10. | Directors, Executive Officers and Corporate Governance |
Pursuant to General Instructions G to Form 10-K, the information required for Part III, Item 10 is incorporated herein by reference from our proxy statement in connection with our 2015 Annual Meeting of Stockholders, which proxy statement is expected to be filed with the SEC not later than 120 days after the close of our fiscal year ended December 31, 2014.
| Item 11. | Executive Compensation |
Pursuant to General Instructions G to Form 10-K, the information required for Part III, Item 11, including specifically the “Compensation Committee Report,” is incorporated herein by reference from our proxy statement in connection with our 2015 Annual Meeting of Stockholders, which proxy statement is expected to be filed with the SEC not later than 120 days after the close of our fiscal year ended December 31, 2014.
| Item 12. | Security Ownership of Certain Beneficial Owners and Management and Related Stockholder Matters |
Pursuant to General Instructions G to Form 10-K, the information required for Part III, Item 12 is incorporated herein by reference from our proxy statement in connection with our 2015 Annual Meeting of Stockholders, which proxy statement is expected to be filed with the SEC not later than 120 days after the close of our fiscal year ended December 31, 2014.
| Item 13. | Certain Relationships and Related Transactions, and Directors Independence |
Pursuant to General Instructions G to Form 10-K, the information required for Part III, Item 13 is incorporated herein by reference from our proxy statement in connection with our 2015 Annual Meeting of Stockholders, which proxy statement is expected to be filed with the SEC not later than 120 days after the close of our fiscal year ended December 31, 2014.
| Item 14. | Principal Accounting Fees and Services |
Pursuant to General Instructions G to Form 10-K, the information required for Part III, Item 14 is incorporated herein by reference from our proxy statement in connection with our 2015 Annual Meeting of Stockholders, which proxy statement is expected to be filed with the SEC not later than 120 days after the close of our fiscal year ended December 31, 2014.
97
Table of Contents
PART IV
| Item 15. | Exhibits and Financial Statement Schedules |
(a) The following documents are filed as part of this Report:
1. Consolidated Financial Statements
The financial statements required by this item are listed in Item 8, “Financial Statements and Supplementary Data” herein.
2. List of Financial Statement Schedules
See “Schedule II—Valuation and Qualifying Accounts.” All other schedules are omitted because they are not applicable, not required or the required information is shown in the consolidated financial statements or notes thereto.
3. List of Exhibits
EXHIBIT INDEX
| Exhibit Number |
Description |
Incorporated by Reference | ||||
| Form |
Filing Date | |||||
| 3.1 | Amended and Restated Certificate of Incorporation of the Registrant | Form S-1, Amendment No. 5 (File No. 333-140232) |
July 10, 2007 | |||
| 3.2 | Amended and Restated By-Laws of the Registrant | Form S-1, Amendment No. 4 (File No. 333-140232) |
July 5, 2007 | |||
| 3.3 | Amendment No. 1 to the Amended and Restated By-Laws | Form 8-K | November 7, 2008 | |||
| 4.1 | Specimen Stock Certificate | Form 10-K | March 3, 2011 | |||
| 4.2 | Registration Rights Agreement by and among Monotype Imaging Holdings Corp., the Investors and the Management Stockholders named therein, dated as of November 5, 2004 | Form S-1 (File No. 333-140232) |
January 26, 2007 | |||
| 4.3 | Stockholders Agreement by and among Monotype Imaging Holdings Corp., the Management Stockholders and the Investors named therein, dated as of November 5, 2004 | Form S-1 (File No. 333-140232) |
January 26, 2007 | |||
| 4.4 | Amendment No. 1 to Registration Rights Agreement by and among Monotype Imaging Holdings Corp., and Investors and the Management Stockholders named therein, dated as March 31, 2008 | Form S-1 (File No. 333-150034) |
April 2, 2008 | |||
| 10.1 | 2004 Stock Option and Grant Plan | Form S-1 (File No. 333-140232) |
January 26, 2007 | |||
98
Table of Contents
| Exhibit Number |
Description |
Incorporated by Reference | ||||
| Form |
Filing Date | |||||
| 10.2 | Form of Non-Qualified Option Agreement under the 2004 Stock Option and Grant Plan | Form S-1 (File No. 333-140232) |
January 26, 2007 | |||
| 10.3 | Form of Incentive Stock Option Agreement under the 2004 Stock Option and Grant Plan | Form S-1 (File No. 333-140232) |
January 26, 2007 | |||
| 10.4 | Form of Restricted Stock Agreement under the 2004 Stock Option and Grant Plan | Form S-1 (File No. 333-140232) |
January 26, 2007 | |||
| 10.5 | Second Amended and Restated 2007 Stock Option and Incentive Plan | Form S-8 (File No. 333-195732) |
May 6, 2014 | |||
| 10.6 | Form of Non-Qualified Option Agreement under the Amended and Restated 2007 Stock Option and Incentive Plan | Form 10-K | March 1, 2013 | |||
| 10.7 | Form of Incentive Stock Option Agreement under the Amended and Restated 2007 Stock Option and Incentive Plan | Form 10-K | March 1, 2013 | |||
| 10.8 | Form of Restricted Stock Agreement under the Amended and Restated 2007 Stock Option and Incentive Plan | Form 10-K | March 1, 2013 | |||
| 10.9 | Form of Restricted Stock Unit Agreement under the Amended and Restated 2007 Stock Option and Incentive Plan | Form 10-K | March 11, 2014 | |||
| 10.10 | Form of Director Restricted Stock Award Agreement under the Amended and Restated 2007 Stock Option and Incentive Plan | Form 10-K | March 1, 2013 | |||
| 10.11 | 2010 Inducement Stock Plan | Form S-8 (File No. 333-171036) |
December 8, 2010 | |||
| 10.12 | Form of Non-Qualified Option Agreement under the 2010 Inducement Plan | Form 10-K | March 1, 2013 | |||
| 10.13 | Form of Restricted Stock Agreement under the 2010 Inducement Plan | Form 10-K | March 1, 2013 | |||
| 10.14 | Equity Award Grant Policy, as amended | Form 10-Q | October 31, 2014 | |||
| 10.15 | Amended and restated employment agreement by and between Douglas J. Shaw and Monotype Imaging Inc., effective as of May 21, 2013 | Form 10-Q | October 31, 2013 | |||
| 10.16 | Amended and restated employment agreement by and between Scott E. Landers and Monotype Imaging Inc., effective as of May 21, 2013 | Form 10-Q | October 31, 2013 | |||
99
Table of Contents
| Exhibit Number |
Description |
Incorporated by Reference | ||||
| Form |
Filing Date | |||||
| 10.17 | Amended and restated employment agreement by and between John L. Seguin and Monotype Imaging Inc., effective as of May 21, 2013 | Form 10-Q | October 31, 2013 | |||
| 10.18 | Amended and restated employment agreement by and between Janet M. Dunlap and Monotype Imaging Inc., effective as of May 21, 2013 | Form 10-Q | October 31, 2013 | |||
| 10.19 | Employment agreement by and between Steven R. Martin and Monotype Imaging Inc., effective as of May 21, 2013 | Form 8-K | May 24, 2013 | |||
| 10.20 | Form of Indemnification Agreement between Monotype Imaging Inc. and certain of its Directors and Officers | Form S-1 (File No. 333-140232) |
January 26, 2007 | |||
| 10.21 | Change in Control Severance Pay Plan | Form 10-Q | October 31, 2013 | |||
| 10.22 | Lease, dated as of January 5, 2005, between Acquiport Unicorn, Inc. and Monotype Imaging, Inc., as amended | Form S-1, Amendment No. 2 (File No. 333-140232) |
April 13, 2007 | |||
| 10.23 | Third Amendment to Lease by and between Acquiport Unicorn, Inc. and Monotype Imaging, Inc., dated as of March 4, 2008 | Form 10-K | March 27, 2008 | |||
| 10.24 | Fourth Amendment to Lease by and between Acquiport Unicorn, Inc. and Monotype Imaging, Inc., dated as of December 2, 2009 | Form 10-K | March 5, 2010 | |||
| 10.25 | Fifth Amendment to Lease by and between Acquiport Unicorn, Inc. and Monotype Imaging, Inc., dated as of May 2, 2014 | Form 10-Q | July 28, 2014 | |||
| 10.25 | Lease, dated April 11, 2008, between ELINOR Grundstücksgesellschaft GmbH & Co. Apollo KG and Linotype GmbH | Form S-1, Amendment No. 2 (File No. 333-150034) |
May 23, 2008 | |||
| 10.26 | Lease, dated May 31, 2011, between ELINOR Grundstücksgesellschaft GmbH & Co. Apollo KG and Linotype GmbH | Form 10-K | March 1, 2012 | |||
| 10.27 | Stock Purchase Agreement by and among Agfa Corp., Agfa Monotype Corporation and Imaging Acquisition Corporation, dated as of November 5, 2004 | Form S-1, Amendment No. 1 (File No. 333-140232) |
February 8, 2007 | |||
| 10.28 | Credit Agreement by and among Monotype Imaging Holdings Inc., as Parent, Monotype Imaging Inc., as Borrower, the Lenders (as defined therein) and Wells Fargo Capital Finance, LLC, as Agent, dated as of July 13, 2011. | Form 8-K | July 19, 2011 | |||
100
Table of Contents
| Exhibit Number |
Description |
Incorporated by Reference | ||||
| Form |
Filing Date | |||||
| 10.29 | Second Amendment to the Credit Agreement by and among Monotype Imaging Holdings Inc., as Parent, Monotype Imaging Inc., as Borrower, the Lenders (as defined therein) and Wells Fargo Capital Finance, LLC, as Agent, dated October 28, 2013 | Form 10-K | March 11, 2014 | |||
| 10.30 | General Continuing Guaranty by and among the Guarantors (as defined therein) and Wells Fargo Capital Finance, LLC, dated as of July 13, 2011. | Form 8-K | July 19, 2011 | |||
| 10.31 | Security Agreement by and among the Grantors (as defined therein) and Wells Fargo Capital Finance, LLC, dated as of July 13, 2011. | Form 8-K | July 19, 2011 | |||
| 10.32 | Executive Incentive Bonus Plan | Form 8-K | February 26, 2014 | |||
| 10.33 | Agreement and Plan of Merger by and among the Registrant, MIHC Merger Sub Inc. and Monotype Imaging Holdings Corp., dated as of August 24, 2005 | Form S-1 (File No. 333-140232) |
January 26, 2007 | |||
| 10.34 | Stock Purchase Agreement by and among Monotype Imaging Inc. and certain stockholders of China Type Design Limited, dated as of July 28, 2006 | Form S-1 (File No. 333-140232) |
January 26, 2007 | |||
| 10.35 | Purchase Agreement for the Sale of Shares in Linotype GmbH by and among Heidelberger Druckmaschinen Aktiengesellschaft, Blitz 06-683 GmbH and Monotype Imaging Holdings Corp., dated as of August 1, 2006 | Form S-1, Amendment No. 2 (File No. 333-140232) |
April 13, 2007 | |||
| 10.36 | Agreement and Plan of Merger, dated as of November 10, 2011, among Bitstream Inc., Monotype Imaging Holdings Inc. and Birch Acquisition Corporation | Form 8-K | November 10, 2011 | |||
| 14.1 | Code of Business Conduct and Ethics | Form 10-Q | October 31, 2014 | |||
| 21.1 | List of Subsidiaries * | |||||
| 23.1 | Consent of Independent Registered Public Accounting Firm * | |||||
101
Table of Contents
| Exhibit Number |
Description |
Incorporated by Reference | ||||
| Form |
Filing Date | |||||
| 31.1 | Chief Executive Officer Certification pursuant to Section 302 of the Sarbanes-Oxley Act of 2002* | |||||
| 31.2 | Chief Financial Officer Certification pursuant to Section 302 of the Sarbanes-Oxley Act of 2002 * | |||||
| 32.1 | Certification pursuant to 18 U.S.C. Section 1350, as adopted pursuant to Section 906 of the Sarbanes-Oxley Act of 2002, by Chief Executive Officer and Chief Financial Officer ** | |||||
| 101.INS | XBRL Instance Document | |||||
| 101.SCH | XBRL Taxonomy Extension Schema Document | |||||
| 101.CAL | XBRL Taxonomy Extension Calculation Linkbase Document | |||||
| 101.DEF | XBRL Taxonomy Extension Definition Linkbase Document | |||||
| 101.LAB | XBRL Taxonomy Extension Label Linkbase Document | |||||
| 101.PRE | XBRL Taxonomy Extension Presentation Linkbase Document | |||||
| * | Filed herewith. |
| ** | Furnished herewith. |
102
Table of Contents
Pursuant to the requirements of Section 13 or 15(d) of the Securities Exchange Act of 1934, the Registrant has duly caused this report to be signed on its behalf by the undersigned, thereunto duly authorized on February 27, 2015.
| MONOTYPE IMAGING HOLDINGS INC. | ||
| By: | /s/ DOUGLAS J. SHAW | |
| Douglas J. Shaw | ||
| President and Chief Executive Officer and Director | ||
SIGNATURES AND POWER OF ATTORNEY
KNOWN ALL MEN BY THESE PRESENTS that each individual whose signature appears below constitutes and appoints each of Douglas J. Shaw and Scott E. Landers such person’s true and lawful attorney-in-fact and agent with full power of substitution and resubstitution, for such person and in such person’s name, place and stead, in any and all capacities, to sign any and all amendments to this Annual Report on Form 10-K, and to file the same, with all exhibits thereto, and all documents in connection therewith, with the Securities and Exchange Commission, granting unto each said attorney-in-fact and agent full power and authority to do and perform each and every act and thing requisite and necessary to be done in and about the premises, as fully to all intents and purposes as such person might or could do in person, hereby ratifying and confirming all that any said attorney-in-fact and agent, or any substitute or substitutes of any of them, may lawfully do or cause to be done by virtue hereof.
Pursuant to the requirements of the Securities Exchange Act of 1934, this report has been signed by the following persons on behalf of the registrant and in the capacities and on the dates indicated:
| Signature |
Title |
Date | ||
| /s/ DOUGLAS J. SHAW Douglas J. Shaw |
President, Chief Executive Officer and Director (Duly Authorized Officer and Principal Executive Officer) |
February 27, 2015 | ||
| /s/ SCOTT E. LANDERS Scott E. Landers |
Senior Vice President, Chief Financial Officer, Treasurer and Assistant Secretary (Principal Accounting Officer) |
February 27, 2015 | ||
| /s/ ROBERT L. LENTZ Robert L. Lentz |
Chairman of the Board of Directors | February 27, 2015 | ||
| /s/ GAY W. GADDIS Gay W. Gaddis |
Director | February 27, 2015 | ||
|
/s/ ROGER J. HEINEN, JR. Roger J. Heinen, Jr. |
Director | February 27, 2015 | ||
|
/s/ PAMELA F. LENEHAN Pamela F. Lenehan |
Director | February 27, 2015 | ||
| /s/ PETER J. SIMONE Peter J. Simone |
Director | February 27, 2015 | ||
| /s/ TIMOTHY B. YEATON Timothy B. Yeaton |
Director | February 27, 2015 | ||
103
Table of Contents
MONOTYPE IMAGING HOLDINGS INC.
SCHEDULE II—VALUATION AND QUALIFYING ACCOUNTS
| Description |
Balance at Beginning of Period |
Charged (benefit) to Costs and Expenses |
Deductions | Balance at End of Period |
||||||||||||
| Year ended December 31, 2014 |
$ | 171 | $ | 138 | $ | (145 | ) | $ | 164 | |||||||
| Year ended December 31, 2013 |
129 | 97 | (55 | ) | 171 | |||||||||||
| Year ended December 31, 2012 |
91 | 38 | — | 129 | ||||||||||||
104