Attached files
| file | filename |
|---|---|
| EX-10.I - EXHIBIT 10.I - MATERION Corp | mtrn-ex10i_20141231.htm |
| EXCEL - IDEA: XBRL DOCUMENT - MATERION Corp | Financial_Report.xls |
| EX-21 - EXHIBIT 21 - MATERION Corp | mtrn-ex21_201412311.htm |
| EX-24 - EXHIBIT 24 - MATERION Corp | mtrn-ex24_201312311.htm |
| EX-95 - EXHIBIT 95 - MATERION Corp | mtrn-ex95_201412311.htm |
| EX-23 - EXHIBIT 23 - MATERION Corp | mtrn-ex23_201312311.htm |
| EX-31.2 - EXHIBIT 31.2 - MATERION Corp | mtrn-ex312_201412311.htm |
| EX-31.1 - EXHIBIT 31.1 - MATERION Corp | mtrn-ex311_201412311.htm |
| EX-4.I - EXHIBIT 4.I - MATERION Corp | mtrn-ex4i_20141231.htm |
| EX-32 - EXHIBIT 32 - MATERION Corp | mtrn-ex32_201412311.htm |
UNITED STATES
SECURITIES AND EXCHANGE COMMISSION
Washington, D.C. 20549
__________________________________
Form 10-K
__________________________________
(Mark One)
ý | ANNUAL REPORT PURSUANT TO SECTION 13 OR 15(d) OF THE SECURITIES EXCHANGE ACT OF 1934 |
For the Fiscal Year Ended December 31, 2014
OR
¨ | TRANSITION REPORT PURSUANT TO SECTION 13 OR 15(d) OF THE SECURITIES EXCHANGE ACT OF 1934 |
For the Transition Period from to
Commission File Number 1-15885
__________________________________
MATERION CORPORATION
(Exact name of Registrant as specified in its charter)
Ohio | 34-1919973 |
(State or other jurisdiction of incorporation or organization) | (I.R.S. Employer Identification No.) |
6070 Parkland Blvd., Mayfield Heights, Ohio | 44124 |
(Address of principal executive offices) | (Zip Code) |
Registrant’s telephone number, including area code
216-486-4200
Securities registered pursuant to Section 12(b) of the Act:
Title of Each Class | Name of Each Exchange on Which Registered | |
Common Stock, no par value | New York Stock Exchange | |
Securities registered pursuant to Section 12(g) of the Act:
None
____________________________________
Indicate by check mark if the registrant is a well-known seasoned issuer, as defined in Rule 405 of the Securities Act. Yes ý No ¨
Indicate by check mark if the registrant is not required to file reports pursuant to Section 13 or Section 15(d) of the Act. Yes ¨ No ý
Indicate by check mark whether the registrant (1) has filed all reports required to be filed by Section 13 or 15(d) of the Securities Exchange Act of 1934 during the preceding 12 months (or for such shorter period that the registrant was required to file such reports), and (2) has been subject to such filing requirements for the past 90 days. Yes ý No ¨
Indicate by check mark whether the registrant has submitted electronically and posted on its corporate Web site, if any, every Interactive Data File required to be submitted and posted pursuant to Rule 405 of Regulation S-T (§ 232.405 of this chapter) during the preceding 12 months (or for such shorter period that the registrant was required to submit and post such files). Yes ý No ¨
Indicate by check mark if disclosure of delinquent filers pursuant to Item 405 of Regulation S-K (§ 229.405 of this chapter) is not contained herein, and will not be contained, to the best of registrant’s knowledge, in definitive proxy or information statements incorporated by reference in Part III of this Form 10-K or any amendment to this Form 10-K. ý
Indicate by check mark whether the registrant is a large accelerated filer, an accelerated filer, a non-accelerated filer, or a smaller reporting company. See the definitions of “large accelerated filer,” “accelerated filer” and “smaller reporting company” in Rule 12b-2 of the Exchange Act. (Check one):
Large accelerated filer | x | Accelerated filer | ¨ | |||
Non-accelerated filer | ¨ (Do not check if a smaller reporting company) | Smaller reporting company | ¨ | |||
Indicate by check mark whether the registrant is a shell company (as defined in Rule 12b-2 of the Act). Yes ¨ No ý
The aggregate market value of common shares, no par value, held by non-affiliates of the registrant (based upon the closing sale price on the New York Stock Exchange) on June 26, 2014 was $753,171,599.
As of February 20, 2015, there were 20,100,633 common shares, no par value, outstanding.
DOCUMENTS INCORPORATED BY REFERENCE
Portions of the proxy statement for the annual meeting of shareholders to be held on May 6, 2015 are incorporated by reference into Part III.
MATERION CORPORATION
Index to Annual Report
On Form 10-K for
Year Ended December 31, 2014
Item 1. | ||
Item 1A. | ||
Item 1B. | ||
Item 2. | ||
Item 3. | ||
Item 4. | ||
Item 5. | ||
Item 6. | ||
Item 7. | ||
Item 7A. | ||
Item 8. | ||
Item 9. | ||
Item 9A. | ||
Item 9B. | ||
Item 10. | ||
Item 11. | ||
Item 12. | ||
Item 13. | ||
Item 14. | ||
Item 15. | ||
Forward-looking Statements
Portions of the narrative set forth in this document that are not statements of historical or current facts are forward-looking statements. Our actual future performance may materially differ from that contemplated by the forward-looking statements as a result of a variety of factors. These factors include, in addition to those mentioned elsewhere herein:
▪ | Actual net sales, operating rates, and margins for 2015; |
▪ | Our ability to strengthen our internal control over financial reporting and disclosure controls and procedures; |
▪ | The global economy; |
▪ | The impact of any U.S. Federal Government shutdowns and sequestrations; |
▪ | The condition of the markets which we serve, whether defined geographically or by segment, with the major market segments being: consumer electronics, industrial components, medical, automotive electronics, energy, telecommunications infrastructure, defense, and commercial aerospace; |
▪ | Changes in product mix and the financial condition of customers; |
▪ | Our success in developing and introducing new products and new product ramp-up rates; |
▪ | Our success in passing through the costs of raw materials to customers or otherwise mitigating fluctuating prices for those materials, including the impact of fluctuating prices on inventory values; |
▪ | Our success in integrating acquired businesses; |
▪ | The impact of the results of acquisitions on our ability to achieve fully the strategic and financial objectives related to these acquisitions; |
▪ | Our success in achieving the expected benefits from our facility consolidations; |
▪ | Our success in implementing our strategic plans and the timely and successful completion and start-up of any capital projects, including the beryllium pebble facility in Elmore, Ohio; |
▪ | The availability of adequate lines of credit and the associated interest rates; |
▪ | Other financial factors, including the cost and availability of raw materials (both base and precious metals), physical inventory valuations, metal financing fees, tax rates, exchange rates, pension costs and required cash contributions and other employee benefit costs, energy costs, regulatory compliance costs, the cost and availability of insurance, and the impact of the Company’s stock price on the cost of incentive compensation plans; |
▪ | The uncertainties related to the impact of war, terrorist activities, and acts of God; |
▪ | Changes in government regulatory requirements and the enactment of new legislation that impacts our obligations and operations; |
• | The conclusion of pending litigation matters in accordance with our expectation that there will be no material adverse effects; |
• | The success of the realignment of our businesses; and |
• | The risk factors set forth elsewhere in Item 1A of this Form 10-K. |
1
Item 1. | BUSINESS |
Materion Corporation, through its wholly owned subsidiaries, is an integrated producer of high performance advanced engineered materials used in a variety of electrical, electronic, thermal, and structural applications. Our products are sold into numerous end markets, including consumer electronics, industrial components, medical, automotive electronics, energy, telecommunications infrastructure, defense, and commercial aerospace. As of December 31, 2014, we had 2,671 employees.
Previously, we aggregated our businesses into four reportable segments: Performance Alloys, Advanced Materials Technologies, Beryllium and Composites, and Technical Materials. Beginning with the fourth quarter of 2014, we changed our segments to align with the way the business is managed. Organizing the businesses within three reportable segments allows Materion to more appropriately focus our resources to drive growth across our diversified customer base, while bringing better clarity to investors.
Prior year results have been recast to reflect the change. Our businesses are now organized under three reportable segments: Performance Alloys and Composites, Advanced Materials, and Other. The former Performance Alloys, Beryllium and Composites, and Technical Materials segments are now combined under the Performance Alloys and Composites segment. The former Advanced Materials and Technologies segment has been separated into the Advanced Materials segment and the Precision Coatings group. The Precision Coatings group, which includes the Precision Optics and Large Area Coatings businesses, is now included in the Other segment. The Other reportable segment also includes unallocated corporate costs.
The cost of gold, silver, platinum, palladium, and copper can be quite volatile. The Company's pricing policy is to directly pass the cost of these metals on to the customer in order to mitigate the impact of metal price volatility on the results from operations. Trends and comparisons of net sales are affected by movements in the market prices of these metals, but changes in net sales due to metal price movements may not directly impact our profitability.
Internally, management reviews net sales on a value-added basis. Value-added sales is a non-GAAP measure that removes the impact of pass-through metal costs from net sales. Value-added sales allows management to assess the impact of differences in net sales between periods, segments, or markets and analyze the resulting margins and profitability without the distortion of the movements in the pass-through metal values. The dollar amount of gross margin and operating profit is not affected by the value-added sales calculation. The Company sells other metals and materials that are not considered direct pass-throughs, and these costs are not deducted from net sales when calculating value-added sales.
Beginning with the first quarter of 2013, the Company reported value-added sales and margins externally. By presenting information on net sales and value-added sales, it is the Company's intention to allow users of its financial statements to review net sales with and without the impact of the pass-through metals. Refer to Item 7 "Management's Discussion and Analysis of Financial Condition and Results of Operations" for a reconciliation of net sales to value-added sales.
We use our Investor Relations web site, http://materion.com, as a channel for routine distribution of important information, including news releases, analyst presentations, and financial information. We post filings as soon as reasonably practicable after they are electronically filed with, or furnished to, the SEC, including our annual, quarterly, and current reports on Forms 10-K, 10-Q, and 8-K; our proxy statements; and any amendments to those reports or statements. All such postings and filings are available on our Investor Relations web site. In addition, this web site allows investors and other interested persons to sign up to automatically receive e-mail alerts when we post press releases and financial information on our web site. The SEC also maintains a web site, www.sec.gov, that contains reports, proxy, and information statements, and other information regarding issuers who file electronically with the SEC. The content on any web site referred to in this Form 10-K is not incorporated by reference into this Form 10-K unless expressly noted.
PERFORMANCE ALLOYS AND COMPOSITES
The Performance Alloys and Composites segment is comprised of the following operating units:
Performance Metals produces strip and bulk form alloy products, beryllium-based metals, beryllium and aluminum metal matrix composites, in rod, sheet, foil, and a variety of customized forms, beryllia ceramics, and bulk metallic glass materials at manufacturing facilities in the United States, Europe, and Asia. The segment also operates the world's largest bertrandite ore mine and refinery in Utah, providing feedstock hydroxide for its beryllium business and external sale.
• | Strip products, the largest of the product families, include thin gauge precision strip and thin diameter rod and wire. These copper and nickel alloys provide a combination of high conductivity, high reliability, and formability for use as connectors, contacts, switches, relays, shielding, and bearings. Major end markets for strip products include consumer electronics, telecommunications infrastructure, automotive electronics, appliance, and medical. Performance Metals’ primary direct competitor in strip form beryllium alloys is NGK Insulators, Ltd. of Nagoya, Japan, with subsidiaries |
2
in the United States and Europe. Performance Metals also competes with alloy systems manufactured by Global Brass and Copper, Inc., Wieland Electric, Inc., Stolberger Metallwerke GmbH, Nippon Mining, and PMX Industries, Inc., as well as with other generally less expensive materials, including phosphor bronze, stainless steel, and other specialty copper and nickel alloys, which are produced by a variety of companies around the world;
• | Bulk products are copper and nickel-based alloys manufactured in plate, rod, bar, tube, and other customized forms that, depending upon the application, may provide superior strength, corrosion or wear resistance, thermal conductivity, or lubricity. While the majority of bulk products contain beryllium, a growing portion of bulk products' net sales is from non-beryllium-containing alloys as a result of product diversification efforts. Applications for bulk products include oil and gas drilling components, bearings, bushings, welding rods, plastic mold tooling, and undersea telecommunications housing equipment. Major end markets for bulk products include industrial components, commercial aerospace, energy, and telecommunications infrastructure. In the area of bulk products, in addition to NGK Insulators, Ltd., Performance Metals competes with several smaller regional producers such as International Beryllium Corp., Ningxia Orient Tantalum Industry Co., Ltd. in China, and LeBronze Industriel in Europe. Strip and bulk products are manufactured at facilities in Ohio and Pennsylvania and are distributed internationally through a network of company-owned service centers and outside distributors and agents. Additional facilities are located in California, Arizona, and England; |
• | Beryllium hydroxide is produced at our milling operations in Utah from our bertrandite mine and purchased beryl ore. The hydroxide is used primarily as a raw material input for strip and bulk products and, to a lesser extent, for beryllium products. Net sales of beryllium hydroxide to NGK Insulators, Ltd. from the Utah operations were less than 4% of Performance Metals’ total net sales in each of the three most recent years; and |
• | Beryllium products manufactures beryllium and aluminum metal matrix composites (MMCs), beryllia ceramics, and bulk metallic glass materials. These materials are used in applications that require high stiffness and/or low density, and they tend to be premium-priced due to their unique combination of properties. Defense and science are the largest markets for beryllium products, while other end markets served include industrial components, commercial aerospace, medical, energy, and telecommunications infrastructure. Products are also sold for acoustics, optical scanning, and performance automotive applications. While Performance Metals is the only domestic producer of metallic beryllium, it competes primarily with designs utilizing other materials including metals, MMCs, and organic composites. Our aluminum powder metal MMCs compete with DWA Aluminum Composites and cast MMCs made by Duralcan USA. Electronic components utilizing beryllia and alumina ceramics are used in the telecommunications infrastructure, medical, industrial components, commercial aerospace, defense, and science end markets. Direct competitors include American Beryllia Inc., CBL Ceramics Limited, and CoorsTek, Inc. Manufacturing facilities for beryllium products are located in Ohio, California, Arizona, and England. |
Technical Materials produces strip metal products with clad inlay and overlay metals, including precious and base metals electroplated systems, electron beam welded systems, contour profiled systems, and solder-coated metal systems. This operating unit is located in Lincoln, Rhode Island and shares service and distribution centers with Performance Metals in Europe and Asia. These specialty strip metal products provide a variety of thermal, electrical, or mechanical properties from a surface area or particular section of the material. Our cladding and plating capabilities allow for a precious metal or other base metal to be applied in continuous strip form only where it is needed, reducing the material cost to the customer as well as providing design flexibility and performance. Major applications for these products include connectors, contacts, power lead frames, and semiconductors, while the largest end markets are automotive electronics and consumer electronics. The energy and medical end markets are smaller but offer further growth opportunities. Technical Materials' products are manufactured at our Lincoln, Rhode Island facility and are sold directly and through its sales representatives. Technical Materials' major competitors include Heraeus Inc., AMI Doduco, Inc., and other North American continuous strip and plating companies.
Performance Alloys and Composites — Sales and Backlog
Net sales for this segment were $433.3 million, or 38% of total net sales, in 2014; $422.9 million, or 36% of total net sales, in 2013; and $424.4 million, or 33% of total net sales, in 2012. Value-added sales were $358.5 million, or 56% of total value-added sales, in 2014; $339.9 million, or 56% of total value-added sales, in 2013; and $337.0 million, or 55% of total value-added sales, in 2012. As of December 31, 2014, Performance Alloys and Composites had 1,405 employees.
Sales were made to over 2,600 customers in 2014. Government sales in 2014, 2013, and 2012 accounted for less than 1% of segment sales. Sales outside the United States, principally to Europe and Asia, accounted for approximately 46% of net segment sales in 2014 and 45% of net segment sales in 2013 and 2012. Other segment reporting and geographic information is contained in Note M to the Consolidated Financial Statements, which can be found in Item 8 of this Form 10-K and which is incorporated herein by reference.
3
The backlog of unshipped orders for Performance Alloys and Composites as of December 31, 2014, 2013, and 2012 was $144.2 million, $178.8 million, and $111.9 million, respectively. Backlog is generally represented by purchase orders that may be terminated under certain conditions. We expect that substantially all the backlog of orders for this segment as of December 31, 2014 will be filled during 2015.
Performance Alloys and Composites — Research and Development
Active research and development programs seek new product compositions and designs as well as process innovations. Expenditures for research and development amounted to $6.3 million in 2014, $5.4 million in 2013, and $4.5 million in 2012. A staff of 17 scientists, engineers, and technicians was employed in this effort as of December 31, 2014.
ADVANCED MATERIALS
Advanced Materials produces advanced chemicals, microelectronics packaging, precious metal, non-precious metal and specialty metal products, including vapor deposition targets, frame lid assemblies, clad and precious metal pre-forms, high temperature braze materials, and ultra-fine wire. These products are used in semiconductor, wireless, LED, and data storage applications within the consumer electronics, industrial components, and telecommunications infrastructure end markets. Other key end markets for these products include energy, medical, defense, and science. Advanced Materials also has metal recovery operations and in-house refineries that allow for the reclaim of precious metals from internally generated or customers’ scrap.
Advanced Materials products are sold directly from its facilities throughout the U.S., Asia, and Europe, as well as through direct sales offices and independent sales representatives throughout the world. Principal competition includes companies such as Eastman Chemical Company, Heraeus Inc., Honeywell International, Inc., Johnson Matthey plc, Praxair, Inc., Solar Applied Materials Technology Corp., Sumitomo Metals Industries, Ltd., and Tanaka Holding Co., Ltd., as well as a number of smaller regional and national suppliers.
The majority of the sales into the consumer electronics market from this segment are vapor deposition targets, lids, wire, other related precious and non-precious metal products, and advanced chemicals for semiconductors and other microelectronic applications. These materials are used in wireless, LED, handheld devices and other applications, as well as in a number of applications within the defense end market. Since we are an up-front material supplier, changes in our consumer electronics sales levels do not necessarily correspond to changes in the end-use consumer demand in the same period due to down-stream inventory positions, the time to develop and deploy new products, and manufacturing lead times and scheduling. While our product and market development efforts allow us to capture new applications, we may lose existing applications and customers from time to time due to the rapid change in technologies and other factors.
Advanced Materials — Sales and Backlog
Net sales for this segment were $547.3 million, or 49% of total net sales, in 2014; $592.0 million, or 51% of total net sales, in 2013; and $694.8 million, or 55% of total net sales, in 2012. Value-added sales were $181.0 million, or 28% of total value-added sales, in 2014; $168.6 million, or 28% of total value-added sales, in 2013; and $172.1 million, or 28% of total value-added sales, in 2012. As of December 31, 2014, Advanced Materials had 615 employees.
Sales were made to over 1,800 customers in 2014. Government sales accounted for less than 1% of the sales volume in 2014, 2013, and 2012. Sales outside the United States, principally to Europe and Asia, accounted for approximately 29% of net segment sales in 2014, 22% of net segment sales in 2013, and 24% of net segment sales in 2012. Other segment reporting and geographic information is contained in Note M to the Consolidated Financial Statements, which can be found in Item 8 of this Form 10-K and which is incorporated herein by reference.
The backlog of unshipped orders for Advanced Materials as of December 31, 2014, 2013, and 2012 was $17.8 million, $19.2 million, and $17.6 million, respectively. Backlog is generally represented by purchase orders that may be terminated under certain conditions. We expect that substantially all of our backlog of orders for this segment at December 31, 2014 will be filled during 2015.
Advanced Materials — Research and Development
Active research and development programs seek new product compositions and designs as well as process innovations. Expenditures for research and development for Advanced Materials amounted to $2.6 million in 2014 and $3.3 million in 2013 and 2012. A staff of 18 scientists, engineers, and technicians was employed in this effort as of December 31, 2014.
4
OTHER
The Other segment is comprised of the Precision Coatings group and unallocated corporate costs. The Precision Coatings group includes the following operating units:
Precision Optics produces sputter-coated precision thin film coatings and optical filter materials. Based in Westford, Massachusetts, the group has manufacturing facilities in the United States and China.
Large Area Coatings produces sputter-coated and precision thin film materials. Based in Windsor, Connecticut, the business manufactures and distributes coated material primarily for medical testing and diagnosis applications.
Precision Coatings products are sold directly from its facilities throughout the U.S. and Asia, as well as through direct sales offices and independent sales representatives throughout the world. Principal competition includes companies such as JDS Uniphase Corporation and Saint-Gobain S.A. and a number of smaller regional and national suppliers.
Other — Sales and Backlog
Net sales for this segment were $146.3 million, or 13% of total net sales, in 2014; $152.0 million, or 13% of total net sales, in 2013; and $153.9 million, or 12% of total net sales, in 2012. Value-added sales were $97.6 million, or 15% of total value-added sales, in 2014; $100.6 million, or 17% of total value-added sales, in 2013; and $106.5 million, or 17% of total value-added sales, in 2012. As of December 31, 2014, Other had 651 employees.
Sales were made to over 300 customers in 2014. Government sales accounted for less than 1% of the sales volume in 2014, 2013, and 2012. Sales outside the United States, principally to Europe and Asia, accounted for approximately 27% of net segment sales in 2014, 24% of net segment sales in 2013, and 22% of net segment sales in 2012. Other segment reporting and geographic information is contained in Note M to the Consolidated Financial Statements, which can be found in Item 8 of this Form 10-K and which is incorporated herein by reference.
The backlog of unshipped orders for Precision Coatings as of December 31, 2014, 2013, and 2012 was $35.0 million, $34.4 million, and $36.7 million, respectively. Backlog is generally represented by purchase orders that may be terminated under certain conditions. We expect that substantially all of our backlog of orders for this segment at December 31, 2014 will be filled during 2015.
Other — Research and Development
Active research and development programs seek new product compositions and designs as well as process innovations. Expenditures for research and development for Precision Optics and Large Area Coatings amounted to $4.0 million in 2014, $4.7 million in 2013, and $4.7 million in 2012.
GENERAL
Availability of Raw Materials
The principal raw materials we use are aluminum, beryllium, cobalt, copper, gold, nickel, palladium, platinum, ruthenium, silver, and tin. Ore reserve data can be found in Item 7 "Management's Discussion and Analysis of Financial Condition and Results of Operations". The availability of these raw materials, as well as other materials used by us, is adequate and generally not dependent on any one supplier.
Patents and Licenses
We own patents, patent applications, and licenses relating to certain of our products and processes. While our rights under the patents and licenses are of some importance to our operations, our business is not materially dependent on any one patent or license or on all of our patents and licenses as a group.
Regulatory Matters
We are subject to a variety of laws that regulate the manufacture, processing, use, handling, storage, transport, treatment, emission, release, and disposal of substances and wastes used or generated in manufacturing. For decades we have operated our facilities under applicable standards of inplant and outplant emissions and releases. The inhalation of airborne beryllium particulate may present a health hazard to certain individuals.
Standards for exposure to beryllium are under review by the United States Occupational Safety and Health Administration (OSHA) and by other governmental and private standard-setting organizations. One result of these reviews will likely be more
5
stringent worker safety standards. Some organizations, such as the California Occupational Health and Safety Administration and the American Conference of Governmental Industrial Hygienists, have adopted standards that are more stringent than the current standards of OSHA. The development, proposal, or adoption of more stringent standards may affect the buying decisions by the users of beryllium-containing products. If the standards are made more stringent and/or our customers or other downstream users decide to reduce their use of beryllium-containing products, our results of operations, liquidity, and financial condition could be materially adversely affected. The impact of this potential adverse effect would depend on the nature and extent of the changes to the standards, the cost and ability to meet the new standards, the extent of any reduction in customer use, and other factors. The magnitude of this potential adverse effect cannot be estimated.
6
Executive Officers of the Registrant
As announced on December 3, 2014, John D. Grampa, age 67, former Senior Vice President Finance and Chief Financial Officer, plans to retire during 2015. Until Mr. Grampa's retirement, he will maintain his responsibilities for global procurement, information technology, and corporate communications as Senior Vice President, Administration. Effective January 1, 2015, Joseph P. Kelley was appointed Vice President, Finance and Chief Financial Officer.
Name | Age | Positions and Offices | ||
Richard J. Hipple | 62 | Chairman of the Board, President and Chief Executive Officer. In May 2006, Mr. Hipple was named Chairman of the Board and Chief Executive Officer of Materion Corporation. He had served as President since May 2005. He was Chief Operating Officer from May 2005 until May 2006. Mr. Hipple served as President of Performance Alloys from May 2002 until May 2005. He joined the Company in July 2001 as Vice President of Strip Products, Performance Alloys and served in that position until May 2002. Prior to joining Materion Corporation, Mr. Hipple was President of LTV Steel Company, a business unit of the LTV Corporation (integrated steel producer and metal fabricator). Prior to running LTV’s steel business, Mr. Hipple held numerous leadership positions in engineering, operations, strategic planning, sales and marketing, and procurement since 1975 at LTV. Mr. Hipple has served on the Board of Directors of Ferro Corporation since 2007. Mr. Hipple has served on the Board of Directors of KeyCorp since July 2012. | ||
Joseph P. Kelley | 42 | Vice President, Finance and Chief Financial Officer. Mr. Kelley was appointed Vice President, Finance and Chief Financial Officer effective January 2015. He had served as Vice President Finance since October 2013 and as Vice President, Finance for the Advanced Materials Group from December 2011 until October 2013. Prior to joining Materion, Mr. Kelley served as Vice President of Planning and Investor Relations at PolyOne Corporation (specialized polymer materials, services and solutions) since 2009. Earlier, he had served in progressively responsible financial management positions in North America and Europe with Lincoln Electric Holdings, Inc., CNH Global NV, Lante Corporation, and PricewaterhouseCoopers LLP. | ||
Gregory R. Chemnitz | 57 | Vice President, General Counsel. Mr. Chemnitz joined Materion Corporation in September 2007 as its Vice President, General Counsel. Prior to that, he had served in various roles in the Law Department at Avery Dennison Corporation beginning in 1992, including most recently, as Assistant General Counsel, Americas, where he had responsibility for the legal affairs of Avery Dennison’s business units in North and South America. | ||
7
Item 1A. RISK FACTORS
Our business, financial condition, results of operations, and cash flows can be affected by a number of factors, including, but not limited to, those set forth below and elsewhere in this Form 10-K, any one of which could cause our actual results to vary materially from recent results or from our anticipated future results. Therefore, an investment in us involves some risks, including the risks described below. The risks discussed below are not the only risks that we may experience. If any of the following risks occur, our business, results of operations, or financial condition could be negatively impacted.
The businesses of many of our customers are subject to significant fluctuations as a result of the cyclical nature of their industries and their sensitivity to general economic conditions, which could adversely affect their demand for our products and reduce our sales and profitability.
A substantial number of our customers are in the consumer electronics, industrial components, commercial aerospace, automotive electronics, defense, medical, energy, and telecommunications infrastructure industries. Each of these industries is cyclical in nature, influenced by a combination of factors which could have a negative impact on our business, including, among other things, periods of economic growth or recession, strength or weakness of the U.S. dollar, the strength of the consumer electronics, automotive electronics, and oil and gas industries, the rate of construction of telecommunications infrastructure equipment, and government spending on defense.
Also, in times when growth rates in our markets slow down, there may be temporary inventory adjustments by our customers that may negatively affect our business.
Because we experience seasonal fluctuations in our sales, our quarterly results will fluctuate, and our annual performance will be affected by the fluctuations.
We expect seasonal patterns to continue, which may cause our quarterly results to fluctuate. For example, the Christmas season generates increased demand from our customers that manufacture consumer products. If our revenue during any quarter were to fall below the expectations of investors or securities analysts, our share price could decline, perhaps significantly. Unfavorable economic conditions, lower than normal levels of demand, and other occurrences in any of the other quarters could also harm our results of operations. For example, we have experienced customers building inventory in anticipation of increased demand, whereas in previous periods, demand decreased because our customers had excess inventory.
A portion of our revenue is derived from the sale of defense-related products through various contracts and subcontracts. These contracts may be suspended, canceled, or delayed, which could have an adverse impact on our revenues.
In 2014, 6% of our value-added sales was derived from sales to customers in the defense market. A portion of these customers operate under contracts with the U.S. Government, which are vulnerable to termination at any time, for convenience or default. Some of the reasons for cancellation include, but are not limited to, budgetary constraints or re-appropriation of government funds, timing of contract awards, violations of legal or regulatory requirements, and changes in political agenda. If cancellations were to occur, it would result in a reduction in our revenue. For example, value-added sales to the defense market were approximately 23% lower in 2014 compared to 2013. The decline in value-added sales resulted from push-outs, largely due to government delays and spending cuts. Furthermore, significant additional reductions to defense spending could occur over the next decade, which could have a significant adverse impact on us. For example, high-margin defense application delays and/or push-outs may adversely impact our results of operations, including quarterly earnings.
The markets for our products are experiencing rapid changes in technology.
We operate in markets characterized by rapidly changing technology and evolving customer specifications and industry standards. New products may quickly render an existing product obsolete and unmarketable. For example, for many years thermal and mechanical performance have been at the forefront of device packaging for wireless communications infrastructure devices. In recent years, a tremendous effort has been put into developing simpler packaging solutions composed of copper and other similar components. Our growth and future results of operations depend in part upon our ability to enhance existing products and introduce newly developed products on a timely basis that conform to prevailing and evolving industry standards, meet or exceed technological advances in the marketplace, meet changing customer specifications, achieve market acceptance, and respond to our competitors’ products.
The process of developing new products can be technologically challenging and requires the accurate anticipation of technological and market trends. We may not be able to introduce new products successfully or do so on a timely basis. If we fail to develop new products that are appealing to our customers or fail to develop products on time and within budgeted amounts, we may be unable to recover our research and development costs, which could adversely affect our margins and profitability.
8
We are dependent on our beryllium pebble facility for our future supply of pure beryllium.
In 2008, we entered into an agreement with the Department of Defense to share in the cost of the beryllium pebble plant in Elmore, Ohio for primary beryllium feedstock. This beryllium pebble facility commenced operations in 2013. Manufacturing inefficiencies, start-up and maintenance costs, and inconsistent production levels resulted in disruptions to material flow and lower gross margins in 2013. While we believe that we addressed these issues in 2014, our earnings may be impacted by plant manufacturing inefficiencies in the future. Temporary interruptions to make necessary repairs and any delay in further transitioning the operation to run at required production levels could negatively impact our net sales and/or cost structure.
The availability of competitive substitute materials for beryllium-containing products may reduce our customers’ demand for these products and reduce our net sales.
In certain product applications, we compete with manufacturers of non-beryllium-containing products, including organic composites, metal alloys or composites, titanium, and aluminum. Our customers may choose to use substitutes for beryllium-containing products in their products for a variety of reasons, including, among other things, the lower costs of those substitutes, the health and safety concerns relating to these products, and the risk of litigation relating to beryllium-containing products. If our customers use substitutes for beryllium-containing products in their products, the demand for our beryllium-containing products may decrease, which could reduce our net sales.
Our lengthy and variable sales and development cycle makes it difficult for us to predict if and when a new product will be sold to customers.
Our sales and development cycle, which is the period from the generation of a sales lead or new product idea through the development of the product and the recording of sales, may typically take up to two or three years, making it very difficult to forecast sales and results of operations. Our inability to accurately predict the timing and magnitude of sales of our products, especially newly introduced products, could affect our ability to meet our customers’ product delivery requirements or cause our results of operations to suffer if we incur expenses in a particular period that do not translate into sales during that period, or at all. In addition, these failures would make it difficult to plan future capital expenditure needs and could cause us to fail to meet our cash flow requirements.
The availability and prices of some raw materials we use in our manufacturing operations fluctuate, and increases in raw material costs can adversely affect our operating results and our financial condition.
We manufacture advanced engineered materials using various precious and non-precious metals, including aluminum, beryllium, cobalt, copper, gold, nickel, palladium, platinum, ruthenium, silver, and tin. The availability of, and prices for, these raw materials are subject to volatility and are influenced by worldwide economic conditions, speculative action, world supply and demand balances, inventory levels, availability of substitute metals, the U.S. dollar exchange rate, production costs of United States and foreign competitors, anticipated or perceived shortages, and other factors. Precious metal prices, including prices for gold and silver, have fluctuated significantly in recent years. Higher prices can cause adjustments to our inventory carrying values, whether as a result of quantity discrepancies, normal manufacturing losses, differences in scrap rates, theft or other factors, which could have a greater impact on our profitability and cash flows. Also, the price of our products has increased in tandem with rising metal prices, as a result of changes in precious metal prices that are passed through to our customers, which could deter them from purchasing our products and adversely affect our net sales.
Further, we maintain some precious metals and copper on a consigned inventory basis. The owners of the precious metals and copper charge a fee that fluctuates based on the market price of those metals and other factors. A significant increase in the market price of precious metals or the consignment fee could increase our financing costs, which could increase our operating costs.
Utilizing precious metal in the manufacturing process creates challenges in physical inventory valuations that may impact earnings.
We manufacture precious, non-precious, and specialty metal products and also have metal cleaning operations and in-house refineries that allow for the reclaim of precious metals from internally generated or customer scrap. We refine that scrap through our internal operations and externally through outside vendors.
When taking periodic physical inventories in our refinery operations, we reconcile the actual precious metals to what was estimated prior to the physical inventory count. Those estimates are based on assays or samples of precious metals taken during the refining process. If those estimates are inaccurate, we may have an inventory long (more physical precious metal than what we had estimated) or short (less physical precious metal than what we had estimated). These fluctuations could have a material
9
impact on our financial statements and may impact earnings. For example, our 2013 and 2012 gross margins were reduced by net quarterly physical inventory adjustments totaling $2.2 million and $7.4 million, respectively, at our Albuquerque, New Mexico facility within the Advanced Materials segment. Higher precious metal prices may magnify the value of any potential inventory long or short.
Our ability to maintain effective internal control over financial reporting may be insufficient to allow us to accurately report our financial results or prevent fraud, and this could cause our financial statements to become materially misleading and adversely affect the trading price of our common stock.
We are required to maintain effective internal control over financial reporting to provide reasonable assurance with respect to the reliability of financial reporting and the preparation of our consolidated financial statements in accordance with generally accepted accounting principles. Internal control over financial reporting may not prevent or detect misstatements because of its inherent limitations, including the possibility of human error, the circumvention or overriding of controls, or fraud. Therefore, even effective internal controls can provide only reasonable assurance with respect to the preparation and fair presentation of financial statements. If we cannot provide reasonable assurance with respect to our financial statements and effectively prevent fraud, our financial statements could become materially misleading, which could adversely affect the trading price of our common stock. If we are not able to maintain the adequacy of our internal control over financial reporting, including any failure to implement required new or improved controls, or if we experience difficulties in their implementation, our business, financial condition, and operating results could be harmed. Any significant deficiency or material weakness in our internal control over financial reporting could affect investor confidence in the accuracy and completeness of our financial statements. As a result, our ability to obtain any additional financing, or additional financing on favorable terms, could be materially and adversely affected. This, in turn, could materially and adversely affect our business, financial condition, and the market value of our securities and require us to incur additional costs to improve our internal control systems and procedures.
Because we maintain a significant inventory of precious metals, we may experience losses due to employee error and theft.
Because we manufacture products that contain precious metals, we maintain a significant amount of precious metals at certain of our manufacturing facilities. Accordingly, we are subject to the risk of precious metal shortages resulting from employee error and theft. For example, in 2013, the Company filed a claim with its insurance carrier for a theft of approximately $10 million of silver at its Albuquerque, New Mexico refinery, which was settled for $6.8 million in the second quarter of 2014.
While we maintain controls to prevent theft, including physical security measures, if our controls do not operate effectively or are structured ineffectively, our profitability could be adversely affected, including any charges that we might incur as a result of the shortage of our inventory and by costs associated with increased security, preventative measures, and insurance.
We have a limited number of manufacturing facilities, and damage to those facilities could interrupt our operations, increase our costs of doing business, and impair our ability to deliver our products on a timely basis.
Some of our facilities are interdependent. For instance, our manufacturing facility in Elmore, Ohio relies on our mining operation for its supply of beryllium hydroxide used in production of most of its beryllium-containing materials. Additionally, our Reading, Pennsylvania; Fremont, California; and Tucson, Arizona manufacturing facilities are dependent on materials produced by our Elmore, Ohio manufacturing facility, and our Wheatfield, New York manufacturing facility is dependent on our Buffalo, New York manufacturing facility. The destruction or closure of any of our manufacturing facilities or our mine for a significant period of time as a result of fire, explosion, act of war or terrorism, or other natural disaster or unexpected event may interrupt our manufacturing capabilities, increase our capital expenditures and our costs of doing business, and impair our ability to deliver our products on a timely basis. In such an event, we may need to resort to an alternative source of manufacturing or to delay production, which could increase our costs of doing business. Our property damage and business interruption insurance may not cover all of our potential losses and may not continue to be available to us on acceptable terms, if at all.
Equipment failures and other unexpected events at our facilities may lead to manufacturing curtailments or shutdowns.
The manufacturing processes that take place in our mining operation, as well as in our manufacturing facilities, depend on critical pieces of equipment. This equipment may, on occasion, be out of service because of unanticipated failure, and some equipment is not readily available or replaceable. In addition to equipment failures, our facilities are also subject to the risk of loss due to unanticipated events such as fires, explosions, or other disasters. Material plant shutdowns or reductions in operations could harm our ability to fulfill our customers’ demands, which could harm our net sales and cause our customers to find other suppliers. Further, remediation of any interruption in production capability may require us to make large capital expenditures, which may have a negative effect on our profitability and cash flows. Our business interruption insurance may not cover all of the lost revenues associated with interruptions in our manufacturing capabilities.
10
Many of our manufacturing facilities are dependent on single source energy suppliers, and interruption in energy services may cause manufacturing curtailments or shutdowns.
Many of our manufacturing facilities depend on one source for electric power and for natural gas. For example, Utah Power is the sole supplier of electric power to the processing facility for our mining operations in Utah. A significant interruption in service from our energy suppliers due to equipment failures, terrorism, or any other cause may result in substantial losses that are not fully covered by our business interruption insurance. Any substantial unmitigated interruption of our operations due to these conditions could harm our ability to meet our customers’ demands and reduce our net sales.
If the price of electrical power, fuel, or other energy sources increases, our operating expenses could increase significantly.
We have numerous milling and manufacturing facilities and a mining operation, which depend on electrical power, fuel, or other energy sources. Our operating expenses are sensitive to changes in electricity prices and fuel prices, including natural gas prices. Prices for electricity and natural gas may increase and can fluctuate widely with availability and demand levels from other users. During periods of peak usage, supplies of energy may be curtailed, and we may not be able to purchase energy at historical market rates. While we have some long-term contracts with energy suppliers, we are exposed to fluctuations in energy costs that can affect our production costs. Although we enter into forward-fixed price supply contracts for natural gas and electricity for use in our operations, those contracts are of limited duration and do not cover all of our fuel or electricity needs. Additionally, price increases in fuel and electricity costs, such as those increases which may occur from climate change legislation or other environmental mandates, may increase our cost of operations.
Disruptions or volatility in global financial markets could adversely impact our financial performance.
Global economic conditions may cause volatility and disruptions in the capital and credit markets. Should global economic conditions deteriorate or access to credit markets be reduced, customers may experience difficulty in obtaining adequate financing, thereby impacting our net sales. Our exposure to bad debt losses may also increase if customers are unable to pay for products previously ordered. Negative or uncertain financial and macroeconomic conditions may have a significant adverse impact on our sales, profitability, and results of operations. If current global economic conditions deteriorate, it could trigger an economic downturn similar to the one experienced in 2008 and 2009. This could have a negative impact on our net sales.
A lower interest rate environment coupled with less than expected investment performance may require us to increase our pension liability and expense, which may require us to fund a portion of our pension obligations and divert funds from other potential uses.
We provide defined benefit pension plans to eligible employees. Our pension expense and our required contributions to our pension plans are directly affected by the value of plan assets, the projected rate of return on plan assets, the actual rate of return on plan assets, and the actuarial assumptions we use to measure our defined benefit pension plan obligations, including the rate at which future obligations are discounted to a present value, or the discount rate.
Lower investment performance of our pension plan assets resulting from a decline in the stock market could significantly increase the unfunded liability of our plans. Should the pension asset return fall below our expectations, it is likely that future pension expenses would increase. The actual return on our plan assets for the year ended December 31, 2014 was a gain of approximately 3.7%. For pension accounting purposes in 2014, we assumed a 7.25% expected rate of return on pension assets.
We establish the discount rate used to determine the present value of the projected and accumulated benefit obligation at the end of each year based upon the available market rates for high quality, fixed income investments. An increase in the discount rate would reduce the future pension expense and, conversely, a lower discount rate would raise the future pension expense. As of December 31, 2014, for pension accounting purposes, we assumed a 4.0% discount rate for our domestic defined benefit plan compared to 4.875% as of December 31, 2013.
Based on current guidelines, assumptions, and estimates, including stock market prices and interest rates, we anticipate that we will make cash contributions of approximately $16.0 million to our pension plan in 2015. If our current assumptions and estimates are not correct, contributions in 2015 and beyond may be greater than our current or future projections.
We cannot predict whether changing market or economic conditions, regulatory changes, or other factors will further increase our pension expenses or funding obligations, diverting funds we would otherwise apply to other uses.
Our expenditures for post-employment health benefits could be materially higher than we have predicted if our underlying assumptions prove to be incorrect.
11
We provide post-employment health benefits to eligible employees. Our retiree health expense is directly affected by the assumptions we use to measure our retiree health plan obligations, including the assumed rate at which health care costs will increase and the discount rate used to calculate future obligations. For retiree health accounting purposes, we have used a graded assumption schedule to assume the rate at which health care costs will increase. At December 31, 2014 and December 31, 2013, we assumed rates of 7.0% and 7.5%, respectively, for each of the following years. We have assumed that this health care cost increase trend rate will decline in 0.5% increments to the ultimate trend rate of 5.0% by 2019.
Assumed health care cost trend rates have a significant effect on the amounts reported for the health care plans. A one percentage point increase in assumed health care cost trend rates would have increased the post-employment benefit obligation by $0.4 million at December 31, 2014.
We cannot predict whether changing market or economic conditions, regulatory changes, or other factors will further increase our retiree health care expenses or obligations, diverting funds we would otherwise apply to other uses.
Our financial results are likely to be negatively impacted by an impairment of goodwill should our shareholder equity exceed our market capitalization for a number of quarters.
A goodwill impairment charge may be triggered by a reduction in actual and projected cash flows, which could be negatively impacted by the market price of our common shares. Our goodwill balance at December 31, 2014 was $86.7 million. Any required non-cash impairment charge could significantly reduce this balance and have a material adverse impact on our reported financial position and results of operations.
A major portion of our bank debt consists of variable-rate obligations, which subjects us to interest rate fluctuations.
Our credit facilities are secured by substantially all of our assets (other than non-mining real property and certain other assets). Our working capital line of credit includes variable-rate obligations, which expose us to interest rate risks. If interest rates increase, our debt service obligations on our variable-rate indebtedness would increase even if the amount borrowed remained the same, resulting in a decrease in our net income. We have developed a hedging strategy to manage the risks associated with interest rate fluctuations, but our program may not effectively eliminate all of the financial exposure associated with interest rate fluctuations. Additional information regarding our market risks is contained in Item 7A "Quantitative and Qualitative Disclosures About Market Risk".
We may be unable to access the financial markets on favorable terms.
The inability to raise capital on favorable terms, particularly during times of uncertainty in the financial markets, could impact our ability to sustain and grow our business and would increase our capital costs. In particular, the substantial volatility in world capital markets due to the global economic crisis has had a significant negative impact on the global financial markets.
We rely on access to financial markets as a significant source of liquidity for capital requirements not satisfied by cash on hand or operating cash flow. Our access to the financial markets could be adversely impacted by various factors, including:
• | changes in credit markets that reduce available credit or the ability to renew existing credit facilities on acceptable terms; |
• | a deterioration of our credit; |
• | a deterioration in the financial condition of the banks with which we do business; |
• | extreme volatility in our markets that increases margin or credit requirements; and |
• | the collateral pledge of substantially all of our assets in connection with our existing indebtedness, which limits our flexibility in raising additional capital. |
These factors have adversely impacted our access to the financial markets from time to time. Negative or uncertain global economic conditions may make it difficult for us to access the credit market and to obtain financing or refinancing, as the case may be, to the extent necessary, on satisfactory terms or at all.
Our failure to comply with the covenants contained in the terms of our indebtedness could result in an event of default, which could materially and adversely affect our operating results and our financial condition.
The terms of our credit facilities require us to comply with various covenants, including financial covenants. In the event of a global economic downturn, it could have a material adverse impact on our earnings and cash flow, which could adversely
12
affect our ability to comply with our financial covenants and could limit our borrowing capacity. Our ability to comply with these covenants depends, in part, on factors over which we may have no control. A breach of any of these covenants could result in an event of default under one or more of the agreements governing our indebtedness which, if not cured or waived, could give the holders of the defaulted indebtedness the right to terminate commitments to lend and cause all amounts outstanding with respect to the indebtedness to be due and payable immediately. Acceleration of any of our indebtedness could result in cross defaults under our other debt instruments. Our assets and cash flow may be insufficient to fully repay borrowings under all of our outstanding debt instruments if some or all of these instruments are accelerated upon an event of default, in which case we may be required to seek legal protection from our creditors.
The terms of our indebtedness may restrict our operations, including our ability to pursue our growth and acquisition strategies.
The terms of our credit facilities contain a number of restrictive covenants, including restrictions in our ability to, among other things, borrow and make investments, acquire other businesses, and consign additional precious metals. These covenants could adversely affect our business by limiting our ability to plan for or react to market conditions or to meet our capital needs, as well as adversely affect our ability to pursue our growth, acquisition strategies, and other strategic initiatives.
We may not be able to complete our acquisition strategy or successfully integrate acquired businesses.
We have been active over the last several years in pursuing niche acquisitions. For example, we completed the acquisition of Aerospace Metal Composites Ltd. in 2012. We intend to continue to consider further growth opportunities through the acquisition of assets or companies and routinely review acquisition opportunities. We cannot predict whether we will be successful in pursuing any acquisition opportunities or what the consequences of any acquisition would be. Future acquisitions may involve the expenditure of significant funds and management time. Depending upon the nature, size, and timing of future acquisitions, we may be required to raise additional financing, which may not be available to us on acceptable terms. Further, we may not be able to successfully integrate any acquired business with our existing businesses or recognize any expected advantages from any completed acquisition.
In addition, there may be liabilities that we fail, or are unable, to discover in the course of performing due diligence investigations on the assets or companies we have already acquired or may acquire in the future. We cannot assure that rights to indemnification by the sellers of these assets or companies to us, even if obtained, will be enforceable, collectible, or sufficient in amount, scope, or duration to fully offset the possible liabilities associated with the business or property acquired. Any such liabilities, individually or in the aggregate, could have a materially adverse effect on our business, financial condition, and results of operations.
Payment of dividends will depend on our future financial condition and performance.
Although our Board of Directors currently intends to continue the payment of regular quarterly cash dividends on shares of our common stock, the timing and amount of future dividends will depend on the Board's assessment of our operations, financial condition, projected liabilities, our compliance with contractual restrictions in our credit agreement, restrictions imposed by applicable laws, and other factors. We cannot guarantee that we will continue to declare dividends at the same or similar rates.
We are subject to fluctuations in currency exchange rates, which may negatively affect our financial performance.
A significant portion of our net sales is conducted in international markets and priced in currencies other than the U.S. dollar. Revenues from customers outside of the United States (principally Europe and Asia) amounted to 35% of net sales in 2014 and 31% in both 2013 and 2012. Significant fluctuations in currency values relative to the U.S. dollar may negatively affect our financial performance. In the past, fluctuations in currency exchange rates, particularly for the euro and the yen, have impacted our sales, margins, and profitability. The fair value of our net asset relating to outstanding foreign currency contracts was $3.5 million at December 31, 2014, indicating that the average hedge rates were favorable compared to the actual year-end market exchange rates. While we may hedge our currency transactions to mitigate the impact of currency price volatility on our earnings, hedging activities may not be successful. For example, hedging activities may not cover the Company’s complete exposure which could have an unfavorable impact on our results of operations.
Our products are deployed in complex applications and may have errors or defects that we find only after deployment.
Our products are highly complex, designed to be deployed in complicated applications, and may contain undetected defects, errors, or failures. Although our products are generally tested during manufacturing, prior to deployment, they can only be fully tested when deployed in specific applications. For example, we sell beryllium-copper alloy strip products in a coil form to some customers, who then stamp the alloy for its specific purpose. On occasion, it is not until such customer stamps the alloy that a defect in the alloy is detected. Consequently, our customers may discover errors after the products have been deployed. The occurrence of any defects, errors, or failures could result in installation delays, product returns, termination of contracts with our
13
customers, diversion of our resources, increased service and warranty costs, and other losses to our customers, end users, or to us. Any of these occurrences could also result in the loss of, or delay in, market acceptance of our products and could damage our reputation, which could reduce our net sales.
In addition to the risk of unanticipated warranty or recall expenses, our customer contracts may contain provisions that could cause us to incur penalties, be liable for damages, including liquidated damages, or incur other expenses, if we experience difficulties with respect to the functionality, deployment, operation, and availability of our products and services. In the event of late deliveries, late or improper installations or operations, failure to meet product or performance specifications or other product defects, or interruptions or delays in our managed service offerings, our customer contracts may expose us to penalties, liquidated damages, and other liabilities. In the event we were to incur contractual penalties, such as liquidated damages or other related costs that exceed our expectations, our business, financial condition, and operating results could be materially and adversely affected.
Our business could be adversely impacted if we fail to adequately address information security issues.
We have taken measures to protect the integrity of our technology infrastructure and the privacy of confidential information. However, our technology infrastructure is potentially vulnerable to physical or electronic break-ins, computer viruses, or similar problems. If a person or entity circumvents our security measures, they could jeopardize the security of confidential information stored on our systems, misappropriate proprietary information, or cause interruptions in our operations. Interruptions in our operations could adversely affect our results. Additionally, we may be required to make substantial additional investments and efforts to protect against or remedy security breaches. Security breaches that result in access to confidential information could damage our reputation and expose us to a risk of loss or liability.
We conduct our sales and distribution operations on a worldwide basis and are subject to the risks associated with doing business outside the United States.
We sell to customers outside of the United States from our United States and international operations. We have been and are continuing to expand our geographic reach in Europe and Asia. Shipments to customers outside of the United States accounted for approximately 35% in 2014 and 31% of our net sales in both 2013 and 2012. We anticipate that international shipments will account for a significant portion of our net sales for the foreseeable future. Revenue from international operations (principally Europe and Asia) amounted to approximately 22% of our net sales in 2014, 18% of our net sales in 2013, and 16% in 2012. There are a number of risks associated with international business activities, including:
• | burdens to comply with multiple and potentially conflicting foreign laws and regulations, including export requirements, tariffs and other barriers, environmental health and safety requirements, and unexpected changes in any of these factors; |
• | difficulty in obtaining export licenses from the United States Government; |
• | political and economic instability and disruptions, including terrorist attacks; |
• | disadvantages of competing against companies from countries that are not subject to U.S. laws and regulations, including the Foreign Corrupt Practices Act (FCPA); |
• | potentially adverse tax consequences due to overlapping or differing tax structures; and |
• | fluctuations in currency exchange rates. |
Any of these risks could have an adverse effect on our international operations by reducing the demand for our products or reducing the prices at which we can sell our products, which could result in an adverse effect on our business, financial position, results of operations, or cash flows.
In addition, we could be adversely affected by violations of the FCPA and similar worldwide anti-bribery laws. The FCPA and similar anti-bribery laws in other jurisdictions generally prohibit companies and their intermediaries from making improper payments to non-U.S. officials for the purpose of obtaining or retaining business. Our policies mandate compliance with these anti-bribery laws. We operate in many parts of the world that have experienced governmental corruption to some degree and, in certain circumstances strict compliance with anti-bribery laws may conflict with local customs and practices. We cannot assure you that our internal controls and procedures always will protect us from the reckless or criminal acts committed by our employees or agents. If we are found to be liable for FCPA violations, we could suffer from criminal or civil penalties or other sanctions, which could have a material adverse effect on our business.
14
Changes in laws or regulations or the manner of their interpretation or enforcement could adversely impact our financial performance and restrict our ability to operate our business or execute our strategies.
New laws or regulations, or changes in existing laws or regulations, or the manner of their interpretation or enforcement, could increase our cost of doing business and restrict our ability to operate our business or execute our strategies. This includes, among other things, the possible taxation under U.S. law of certain income from foreign operations, compliance costs, and enforcement under the Dodd-Frank Wall Street Reform and Consumer Protection Act, and costs associated with complying with the Patient Protection and Affordable Care Act of 2010 and the regulations promulgated thereunder.
We are exposed to lawsuits in the normal course of business, which could harm our business.
During the ordinary conduct of our business, we may become involved in certain legal proceedings, including those involving product liability claims, third-party lawsuits relating to exposure to beryllium, and claims against us of infringement of intellectual property rights of third parties. Due to the uncertainties of litigation, we can give no assurance that we will prevail at the conclusion of future claims. Certain of these matters involve types of claims that, if they result in an adverse ruling to us, could give rise to substantial liability which could have a material adverse effect on our business, operating results, or financial condition.
We are presently uninsured for beryllium-related claims where the claimants’ first exposure to beryllium occurred on or after January 1, 2008, and we have not undertaken to estimate the impact of any such claims, which have yet to be asserted. In addition, some jurisdictions preclude insurance coverage for punitive damage awards. Accordingly, our profitability could be adversely affected if any current or future claimants obtain judgments for any uninsured compensatory or punitive damages. Further, an unfavorable outcome or settlement of a pending beryllium case or adverse media coverage could encourage the commencement of additional similar litigation.
Health issues, litigation, and government regulations relating to our beryllium operations could significantly reduce demand for our products, limit our ability to operate, and adversely affect our profitability.
If exposed to respirable beryllium fumes, dusts, or powder, some individuals may demonstrate an allergic reaction to beryllium and may later develop a chronic lung disease known as chronic beryllium disease, or CBD. Some people who are diagnosed with CBD do not develop clinical symptoms at all. In others, the disease can lead to scarring and damage of lung tissue, causing clinical symptoms that include shortness of breath, wheezing, and coughing. Severe cases of CBD can cause disability or death.
Further, some scientists claim there is evidence of an association between beryllium exposure and lung cancer, and certain standard-setting organizations have classified beryllium and beryllium compounds as human carcinogens.
The health risks relating to exposure to beryllium have been, and will continue to be, a significant issue confronting the beryllium-containing products industry. The health risks associated with beryllium have resulted in product liability claims, employee, and third-party lawsuits. As of December 31, 2014, we had one CBD case outstanding.
The increased levels of scrutiny by federal, state, foreign, and international regulatory authorities could lead to regulatory decisions relating to the approval or prohibition of the use of beryllium-containing materials for various uses. Concerns over CBD and other potential adverse health effects relating to beryllium, as well as concerns regarding potential liability from the use of beryllium, may discourage our customers’ use of our beryllium-containing products and significantly reduce demand for our products. In addition, adverse media coverage relating to our beryllium-containing products could damage our reputation or cause a decrease in demand for beryllium-containing products, which could adversely affect our profitability.
Our bertrandite ore mining and beryllium-related manufacturing operations and some of our customers’ businesses are subject to extensive health and safety regulations that impose, and will continue to impose, significant costs and liabilities, and future regulation could increase those costs and liabilities, or effectively prohibit production or use of beryllium-containing products.
We, as well as our customers, are subject to laws regulating worker exposure to beryllium. Standards for exposure to beryllium are under review by OSHA, the Department of Energy, and by other U.S. and foreign governmental and private standard-setting organizations. One result of these reviews will likely be more stringent worker safety standards. Some organizations, such as the California Occupational Health and Safety Administration and the American Conference of Governmental Industrial Hygienists, have adopted standards that are more stringent than the current standards of OSHA. The development, proposal, or adoption of more stringent standards may affect buying decisions by the users of beryllium-containing products. If the standards are made more stringent and/or our customers or other downstream users decide to reduce their use of beryllium-containing products, our results of operations, liquidity, and financial condition could be materially adversely affected. The impact of this potential adverse effect would depend on the nature and extent of the changes to the standards, the cost and ability to meet the
15
new standards, the extent of any reduction in customer use, and other factors. The magnitude of this potential adverse effect cannot be estimated.
Our bertrandite ore mining and manufacturing operations are subject to extensive environmental regulations that impose, and will continue to impose, significant costs and liabilities on us, and future regulation could increase these costs and liabilities or prevent production of beryllium-containing products.
We are subject to a variety of governmental regulations relating to the environment, including those relating to our handling of hazardous materials and air and wastewater emissions. Some environmental laws impose substantial penalties for non-compliance. Others, such as the federal Comprehensive Environmental Response, Compensation, and Liability Act, or CERCLA, impose strict, retroactive, and joint and several liability upon entities responsible for releases of hazardous substances. Bertrandite ore mining is also subject to extensive governmental regulation on matters such as permitting and licensing requirements, plant and wildlife protection, reclamation and restoration of mining properties, the discharge of materials into the environment, and the effects that mining has on groundwater quality and availability. Future requirements could impose on us significant additional costs or obligations with respect to our extraction, milling, and processing of ore. If we fail to comply with present and future environmental laws and regulations, we could be subject to liabilities or our operations could be interrupted. In addition, future environmental laws and regulations could restrict our ability to expand our facilities or extract our bertrandite ore deposits. These environmental laws and regulations could also require us to acquire costly equipment, obtain additional financial assurance, or incur other significant expenses in connection with our business, which would increase our costs of production.
Natural disasters, equipment failures, work stoppages, bankruptcies, and other unexpected events may lead our customers to curtail production or shut down their operations.
Our customers’ manufacturing operations are subject to conditions beyond their control, including raw material shortages, natural disasters, interruptions in electrical power or other energy services, equipment failures, bankruptcies, work stoppages due to strikes or lockouts, including those affecting the automotive industry, which is one of our major markets, and other unexpected events. For example, the tsunami that hit Japan in March 2011 caused wide-scale destruction of the Tohoku region and led most manufacturers in the area, most notably those in the automotive and consumer electronics markets, to slow or halt production. Similar events could also affect other suppliers to our customers. Such events could cause our customers to curtail production or to shut down a portion or all of their operations, which could reduce their demand for our products and reduce our net sales.
Unexpected events and natural disasters at our mine could increase the cost of operating our business.
A portion of our production costs at our mine are fixed regardless of current operating levels. Our operating levels are subject to conditions beyond our control that may increase the cost of mining for varying lengths of time. These conditions include, among other things, fire, natural disasters, pit wall failures, and ore processing changes. Our mining operations also involve the handling and production of potentially explosive materials. It is possible that an explosion could result in death or injuries to employees and others and material property damage to third parties and us. Any explosion could expose us to adverse publicity or liability for damages and materially adversely affect our operations. Any of these events could increase our cost of operations.
Terrorist attacks and other acts of violence or war may directly harm our operations.
Terrorist attacks or other acts of violence or war may directly impact our facilities. For example, our Elmore, Ohio facility is located near, and derives power from, a nuclear power plant, which could be a target for a terrorist attack. In addition, terrorist attacks, related armed conflicts, or prolonged or increased tensions in the Middle East or other regions of the world could cause consumer confidence and spending to decrease, decreasing demand for consumer goods that contain our products. Further, when the United States armed forces are involved in active hostilities or large-scale deployments, defense spending tends to focus more on meeting the physical needs of the troops, and planned expenditures on weapons and other systems incorporating our products may be reduced or deferred. Any of these occurrences could also increase volatility in the United States and worldwide financial markets, which could negatively impact our net sales.
Item 1B. | UNRESOLVED STAFF COMMENTS |
None.
16
Item 2. | PROPERTIES |
We operate manufacturing plants, service and distribution centers, and other facilities throughout the world. During 2014, we made effective use of our productive capacities at our principal facilities. We believe that the quality and production capacity of our facilities is sufficient to maintain our competitive position for the foreseeable future. Information as of December 31, 2014, with respect to our significant facilities that are owned or leased, and the respective segments in which they are included, is set forth below:
Location | Owned or Leased | Approximate Number of Square Feet | |
Corporate and Administrative Offices | |||
Mayfield Heights, Ohio (1)(2)(3) | Leased | 79,130 | |
Manufacturing Facilities | |||
Albuquerque, New Mexico (2) | Owned/Leased/Subleased | 13,000/28,800/8,500 | |
Bloomfield, Connecticut (3) | Leased | 23,400 | |
Brewster, New York (2) | Leased | 75,000 | |
Buffalo, New York (2) | Owned | 97,000 | |
Delta, Utah (1) | Owned | 100,836 | |
Elmore, Ohio (1) | Owned/Leased | 681,000/191,000 | |
Farnborough, England (1) | Leased | 10,000 | |
Fremont, California (1) | Leased | 40,000 | |
Limerick, Ireland (2) | Leased | 18,000 | |
Lincoln, Rhode Island (1) | Owned/Leased | 130,000/28,000 | |
Lorain, Ohio (1) | Owned | 55,000 | |
Milwaukee, Wisconsin (2) | Owned | 98,750 | |
Reading, Pennsylvania (1) | Owned | 128,863 | |
Santa Clara, California (2) | Leased | 5,800 | |
Shanghai, China (3) | Leased | 101,400 | |
Singapore (2) | Leased | 35,000 | |
Subic Bay, Philippines (2) | Leased | 5,000 | |
Suzhou, China (2) | Leased | 22,400 | |
Taipei, Taiwan (2) | Leased | 11,500 | |
Tucson, Arizona (1) | Owned | 53,000 | |
Tyngsboro, Massachusetts (3) | Leased | 38,000 | |
Westford, Massachusetts (3) | Leased | 78,000 | |
Wheatfield, New York (2) | Owned | 35,000 | |
Windsor, Connecticut (3) | Leased | 34,700 | |
Service and Distribution Centers | |||
Elmhurst, Illinois (1) | Leased | 28,500 | |
Fukaya, Japan (1) | Owned | 35,500 | |
Singapore (1) | Leased | 2,500 | |
Stuttgart, Germany (1) | Leased | 24,800 | |
Tokyo, Japan (1) | Leased | 7,200 | |
Warren, Michigan (1) | Leased | 34,500 | |
(1) | Performance Alloys and Composites |
(2) | Advanced Materials |
(3) | Other |
In addition to the above, the Company holds certain mineral rights on 7,500 acres in Juab County, Utah, from which the beryllium-bearing ore, bertrandite, is mined by the open pit method. A portion of these mineral rights are held under lease. Ore reserve data can be found in Item 7 "Management's Discussion and Analysis of Financial Condition and Results of Operations".
17
Item 3. | LEGAL PROCEEDINGS |
Our subsidiaries and our holding company are subject, from time to time, to a variety of civil and administrative proceedings arising out of our normal operations, including, without limitation, product liability claims, health, safety and environmental claims, and employment-related actions. Among such proceedings are cases alleging that plaintiffs have contracted, or have been placed at risk of contracting, beryllium sensitization or chronic beryllium disease or other lung conditions as a result of exposure to beryllium (“beryllium cases”). The plaintiffs in beryllium cases seek recovery under negligence and various other legal theories and demand compensatory and often punitive damages, in many cases of an unspecified sum. Spouses of some plaintiffs claim loss of consortium.
Beryllium Claims
As of December 31, 2014, our subsidiary, Materion Brush Inc., was a defendant in one beryllium case (involving three plantiffs), as described more fully below. During 2014, one beryllium case (involving two plaintiffs) was settled and dismissed. As of December 31, 2013, there were two pending beryllium cases (involving five plaintiffs).
The Company is one of five defendants in a case filed on October 4, 2013 in the Superior Court of the State of Arizona, Maricopa County, titled Parmar et al. v. Dolphin, Inc. et al., CV 2013-012980. One plaintiff alleges that he contracted chronic beryllium disease from exposures that resulted from his employment at manufacturing facilities of Karsten Manufacturing Corporation (“Karsten”) in Arizona, and asserts claims for negligence, strict liability, and fraudulent concealment. His wife claims a loss of consortium. Another plaintiff alleges that he has been diagnosed with beryllium sensitization that resulted from his employment at Karsten, and asserts a claim for medical monitoring. Plaintiffs seek compensatory and punitive damages and/or medical monitoring in unspecified sums.
The Company was one of two defendants in a case originally filed on September 25, 2012 in the Court of Common Pleas of Philadelphia County, Pennsylvania titled Schwartz v. Accuratus Corporation et al., and subsequently removed to the United States District Court for the Eastern District of Pennsylvania (No. 12-6189). Plaintiff alleged that she contracted chronic beryllium disease from “take-home” exposures resulting from her husband’s employment at facilities at the Company and of codefendant Accuratus Corporation, and asserted claims for negligence and strict liability. She sought compensatory and exemplary damages in unspecified amounts. Her husband claimed a loss of consortium. The Company entered into a settlement agreement with plaintiffs, and the court dismissed all claims against the Company with prejudice on September 22, 2014. (The case continues on appeal against Accuratus.)
The Company has some insurance coverage, subject to an annual deductible.
Item 4. | MINE SAFETY DISCLOSURES |
Information concerning mine safety violations or other regulatory matters required by Section 1503(a) of the Dodd-Frank Wall Street Reform and Consumer Protection Act and Item 104 of Regulation S-K (17 CFR 229.104) is included in Exhibit 95 to this Form 10-K.
18
PART II
Item 5. | MARKET FOR REGISTRANT’S COMMON EQUITY, RELATED STOCKHOLDER MATTERS AND ISSUER PURCHASES OF EQUITY SECURITIES |
Market Information and Dividends
The Company's common shares are listed on the New York Stock Exchange under the symbol “MTRN”. As of February 13, 2015, there were 997 shareholders of record. The table below is a summary of the range of market prices with respect to common shares during each quarter of fiscal years 2014 and 2013 and the dividends declared per common share.
Stock Price Range | ||||||||||||
Fiscal Quarters | High | Low | Dividends | |||||||||
2014 | ||||||||||||
First | $ | 35.19 | $ | 25.21 | $ | 0.080 | ||||||
Second | 37.96 | 31.69 | 0.085 | |||||||||
Third | 39.38 | 30.88 | 0.085 | |||||||||
Fourth | 40.60 | 26.64 | 0.085 | |||||||||
2013 | ||||||||||||
First | $ | 29.81 | $ | 26.20 | $ | 0.075 | ||||||
Second | 31.49 | 24.58 | 0.080 | |||||||||
Third | 33.69 | 27.09 | 0.080 | |||||||||
Fourth | 32.73 | 25.75 | 0.080 | |||||||||
We began paying dividends in June of 2012. We expect to pay cash dividends in the future, subject to the continuing determination by our Board of Directors that paying dividends remains in the best interest of our shareholders. The agreements governing our credit facilities restrict the amount of cash dividends that we can pay. Any determinations by our Board of Directors to pay cash dividends in the future will take into account various factors, including our financial condition, results of operations, current and anticipated cash needs, plans for expansion, and restrictions under the agreements governing our credit facilities, and any agreement governing our future debt. We cannot provide assurance that dividends will be paid in the future or that, if paid, the dividends will be at the same amount or frequency.
During the three months ended December 31, 2014, we repurchased 210,785 shares under our share buyback authorization of $50.0 million.
Period | Total Number of Shares Purchased | Average Price Paid per Share | Total Number of Shares Purchased as Part of Publicly Announced Plans or Programs | Maximum Dollar Value that may yet be Purchased Under the Plans or Programs (1) | |||||||
September 27 through October 31, 2014 | 176,469 | $30.59 | 176,469 | $28,965,941 | |||||||
November 1 through November 28, 2014 | 16,682 | 37.99 | 16,682 | 28,332,238 | |||||||
November 29 through December 31, 2014 | 17,634 | 34.86 | 17,634 | 27,717,575 | |||||||
Total | 210,785 | $31.53 | 210,785 | $27,717,575 | |||||||
(1) On January 14, 2014, we announced that our Board of Directors had authorized the repurchase of up to $50.0 million of our common shares. In 2014, we purchased an aggregate of 690,339 shares at an average price of $32.28 totaling $22.3 million. As of December 31, 2014, $27.7 million may still be purchased under the program.
19
Performance Graph
The following graph sets forth the cumulative shareholder return on our common shares as compared to the cumulative total return of the Russell 2000 Index and the S&P SmallCap 600 Index, as Materion Corporation is a component of these indices.
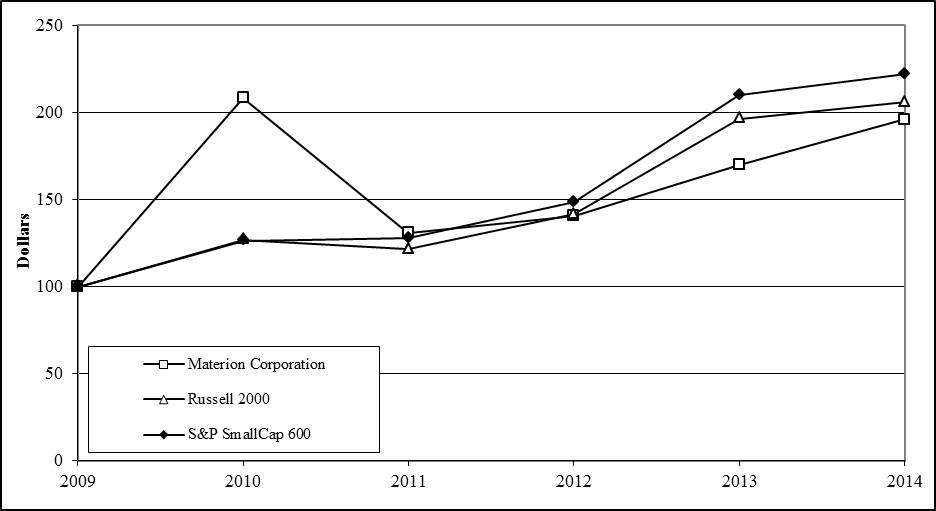
2009 | 2010 | 2011 | 2012 | 2013 | 2014 | |||||||
Materion Corporation | $100 | $208 | $131 | $141 | $170 | $196 | ||||||
Russell 2000 | 100 | 127 | 122 | 141 | 196 | 206 | ||||||
S&P SmallCap 600 | 100 | 126 | 128 | 148 | 210 | 222 | ||||||
The above graph assumes that the value of our common shares and each index was $100 on December 31, 2009 and that all applicable dividends were reinvested.
20
Item 6. | SELECTED FINANCIAL DATA |
Materion Corporation and Subsidiaries
(Thousands except per share data) | 2014 | 2013 | 2012 | 2011 | 2010 | |||||||||||||||
For the year | ||||||||||||||||||||
Net sales | $ | 1,126,890 | $ | 1,166,882 | $ | 1,273,078 | $ | 1,526,730 | $ | 1,302,314 | ||||||||||
Cost of sales | 920,987 | 978,904 | 1,074,295 | 1,311,409 | 1,079,666 | |||||||||||||||
Gross margin | 205,903 | 187,978 | 198,783 | 215,321 | 222,648 | |||||||||||||||
Operating profit | 56,957 | 26,831 | 36,776 | 57,078 | 73,633 | |||||||||||||||
Interest expense - net | 2,787 | 3,036 | 3,134 | 2,812 | 2,665 | |||||||||||||||
Income before income taxes | 54,170 | 23,795 | 33,642 | 54,266 | 70,968 | |||||||||||||||
Income taxes | 12,449 | 4,088 | 8,978 | 14,287 | 24,541 | |||||||||||||||
Net income | 41,721 | 19,707 | 24,664 | 39,979 | 46,427 | |||||||||||||||
Earnings per share of common stock: | ||||||||||||||||||||
Basic | 2.04 | 0.96 | 1.21 | 1.96 | 2.29 | |||||||||||||||
Diluted | 2.00 | 0.94 | 1.19 | 1.93 | 2.25 | |||||||||||||||
Dividends per share of common stock | 0.335 | 0.315 | 0.225 | — | — | |||||||||||||||
Depreciation and amortization | 43,516 | 42,328 | 37,695 | 44,194 | 35,932 | |||||||||||||||
Capital expenditures | 29,312 | 27,848 | 34,088 | 28,187 | 42,314 | |||||||||||||||
Mine development expenditures | 1,247 | 4,776 | 10,573 | 560 | 11,348 | |||||||||||||||
Year-end position | ||||||||||||||||||||
Net current assets | 282,628 | 266,248 | 251,922 | 231,230 | 208,365 | |||||||||||||||
Ratio of current assets to current liabilities | 3.7 to 1 | 3.1 to 1 | 2.7 to 1 | 2.7 to 1 | 2.4 to 1 | |||||||||||||||
Property, plant, and equipment: | ||||||||||||||||||||
At cost | $ | 800,671 | $ | 782,879 | $ | 779,785 | $ | 752,726 | $ | 719,953 | ||||||||||
Cost less depreciation, depletion, and amortization | 247,588 | 261,893 | 272,542 | 263,398 | 265,868 | |||||||||||||||
Total assets | 762,069 | 777,945 | 814,917 | 772,103 | 735,410 | |||||||||||||||
Long-term liabilities | 173,890 | 153,296 | 203,335 | 184,143 | 157,571 | |||||||||||||||
Long-term debt | 23,613 | 29,267 | 44,880 | 40,463 | 38,305 | |||||||||||||||
Shareholders’ equity | 458,133 | 463,321 | 414,995 | 405,982 | 384,356 | |||||||||||||||
Weighted-average number of shares of common stock outstanding: | ||||||||||||||||||||
Basic | 20,461 | 20,571 | 20,418 | 20,365 | 20,282 | |||||||||||||||
Diluted | 20,810 | 20,895 | 20,679 | 20,754 | 20,590 | |||||||||||||||
Capital expenditures shown above include amounts spent under government contracts for which reimbursements were received from the government in the amounts of $1.0 million in 2012, $5.4 million in 2011, and $21.9 million in 2010.
Refer to Notes to Consolidated Financial Statements.
21
Item 7. | MANAGEMENT’S DISCUSSION AND ANALYSIS OF FINANCIAL CONDITION AND RESULTS OF OPERATIONS |
OVERVIEW
We are an integrated producer of high-performance advanced engineered materials used in a variety of electrical, electronic, thermal, and structural applications. Our products are sold into numerous end markets, including consumer electronics, industrial components, medical, automotive electronics, energy, telecommunications infrastructure, defense, commercial aerospace, science, services, and appliance.
Net sales for 2014 of $1.1 billion were 3% lower than net sales of $1.2 billion in 2013 due primarily to a decrease in precious metal prices. The net sales comparison between years was affected by the pass-through of lower metal prices. The costs of gold, silver, platinum, palladium, and copper are typically passed through to customers and, therefore, movements in the prices of these metals will affect net sales, but may not have a proportionate impact on gross margin.
Lower pass-through metal costs were partially offset by an increase in value-added sales. Value-added sales were $637.1 million in 2014, an increase of 5% as compared to 2013 value-added sales of $609.1 million. Value-added sales is a non-GAAP measure that removes the impact of pass-through metal costs and allows for analysis without the distortion of the movement or volatility in metal prices. Internally, we manage our business on this basis, and a reconciliation of net sales to value-added sales is included herein.
Gross margin was $205.9 million in 2014 compared to $188.0 million in 2013. The increased gross margin represents an approximate 150 basis point margin expansion as a percentage of value-added sales associated with improved sales volume, better product mix, and facility consolidation savings.
Operating profit was $57.0 million in 2014 compared to $26.8 million in 2013. The increased operating profit was driven by the gross margin improvement and favorable one-time items including a $6.8 million insurance settlement related to a precious metal theft claim, a $4.0 million settlement of a legal claim related to our beryllium pebble facility, and a $2.4 million gain on the sale of used equipment.
As a result of the aforementioned items, overall diluted earnings per share increased to $2.00 in 2014 versus $0.94 in 2013, an increase in excess of 100%.
We also repurchased 690,339 shares of common stock during 2014 for $22.3 million in the aggregate.
22
RESULTS OF OPERATIONS
(Millions except per share data) | 2014 | 2013 | 2012 | |||||||||
Net sales | $ | 1,126.9 | $ | 1,166.9 | $ | 1,273.1 | ||||||
Value-added sales | 637.1 | 609.1 | 615.6 | |||||||||
Operating profit | 57.0 | 26.8 | 36.8 | |||||||||
Income before income taxes | 54.2 | 23.8 | 33.6 | |||||||||
Net income | 41.7 | 19.7 | 24.7 | |||||||||
Diluted earnings per share | 2.00 | 0.94 | 1.19 | |||||||||
2014 Compared to 2013
Net sales were $1.1 billion in 2014, a decline of $40.0 million, or 3%, from net sales of $1.2 billion in 2013. The net sales comparisons between years were primarily affected by the pass-through of lower metal prices. The costs of gold, silver, platinum, palladium, and copper are typically passed through to customers and, therefore, movements in the prices of these metals will affect net sales, but may not have a proportionate impact on margins. The average prices for the metals we purchased in 2014 were lower than 2013. The net change in metal prices resulted in an estimated $58.7 million decrease in net sales in 2014 from 2013 and accounted for the reduction in net sales for the year.
Value-added sales of $637.1 million in 2014 increased $28.0 million or 5% compared to 2013. The year-over-year improvement in value-added sales was primarily driven by increases in value-added sales to the consumer electronics and medical end markets, partially offset by a decrease in sales to the defense end market.
Value-added sales to the consumer electronics end market, our largest market accounting for approximately 28% of our total value-added sales in 2014, were 8% higher in 2014 versus 2013. The increase in value-added sales to the consumer electronics end market in 2014 was due to higher shipments for semiconductor, hand-held devices, and other applications.
Value-added sales to the medical end market, which accounted for 12% of total value-added sales in 2014, increased 17% in 2014 as compared to 2013. The increase in medical end market value-added sales was due to higher sales for nuclear medicine applications and higher shipments related to life science and medical research.
Defense end market sales, which accounted for 6% of total value-added sales in 2014, decreased 23% versus 2013. There was a decline in value-added sales largely due to government project delays and spending cuts.
Gross margin was $205.9 million in 2014, or 10% above the $188.0 gross margin recorded in 2013. Expressed as a percentage of value-added sales, gross margin improved approximately 150 basis points from 31% in 2013 to 32% in 2014. The increased gross margin was a combination of improved leverage on value-added sales volume growth, improved yields at our Buffalo, New York facility, and facility consolidation and savings of approximately $4.9 million in 2014 related to product line rationalization initiatives undertaken late in 2013. In addition, gross margin in 2013 was negatively impacted by net quarterly physical inventory adjustments totaling $2.2 million at our Albuquerque, New Mexico facility.
Selling, general, and administrative (SG&A) expenses totaled $137.1 million in 2014, or an increase of $3.9 million as compared to 2013. SG&A increased in 2014 due to higher cash-based incentive compensation expense versus 2013, partially offset by a decrease in stock-based compensation expense. Stock-based compensation expense, including the expense for stock appreciation rights, restricted stock, and performance restricted shares, was $5.4 million in 2014 and $5.7 million in 2013. The comparison of stock-based compensation expense between years may be affected by changes in plan design, the number of grants in a given year, actual performance relative to the plan objectives, movement in our stock price, forfeitures, vesting schedules, and other factors.
Expressed as a percentage of value-added sales, SG&A remained consistent at 22% in 2014 and 2013. Despite the higher incentive compensation expense in 2014, we leveraged our existing SG&A structure to handle value-added sales growth and continued to realize benefits of approximately $5.4 million in 2014 from recent rationalization actions in the Advanced Materials segment and Precision Coatings group taken in the fourth quarter of 2013. Corporate costs in 2013 also included legal and investigation expenses associated with the Albuquerque, New Mexico inventory loss and the related insurance claim and totaled $1.3 million.
Research and development (R&D) expenses were $12.9 million in 2014, a 4% decrease from the expense of $13.4 million in 2013. R&D expenses as a percentage of value-added sales remained consistent in 2014 versus 2013 at 2%.
Other - net totaled $1.0 million of income in 2014 and $14.5 million of expense in 2013. Refer to Note N in the Consolidated Financial Statements for the details of the major components of other-net. The reduction in other-net in 2014 was primarily due
23
to several one-time items consisting of a $6.8 million favorable insurance settlement related to a precious metal theft claim, $4.0 million favorable legal settlement related to our beryllium pebble facility, and $2.4 million net gain on the sale of used equipment. Other-net in 2013 also included $1.4 million of expense related to costs associated with our facility consolidation projects and one-time bank fees of $0.9 million associated with the renewal of metal consignment facilities.
Operating profit was $57.0 million, or 9% of value-added sales, in 2014 compared to $26.8 million, or 4% of value-added sales, in 2013. The higher operating profit in 2014 was due to improved gross margin from our businesses and other one-time gains included in other-net. Operating profit also benefited from lower expense on our domestic defined benefit pension plan and retiree medical plan. The decrease in pension expense from $13.3 million in 2013 to $9.4 million in 2014 was primarily due to changes in the discount rate. We recognized $0.7 million of income related to our retiree medical plan in 2014 as compared to $1.7 million of expense in 2013 due to a modification of the benefit formula for plan participants designed to lower costs for us and plan participants. Refer to Note I to the Consolidated Financial Statements.
Interest expense - net was $2.8 million in 2014 and $3.0 million in 2013. The lower expense in 2014 resulted from lower average outstanding debt levels.
Income tax expense for 2014 and 2013 was $12.4 million and $4.1 million, respectively. The effective tax rates for 2014 and 2013 were 23% and 17%, respectively. The effects of percentage depletion (a tax benefit resulting from our mining operations), foreign source income and deductions, the production deduction, the R&D tax credit, discrete events, and other items were major causes of the differences between the effective and statutory rates in 2014 and 2013.
The research and experimentation credit provided a tax benefit of $0.7 million in 2014 and $1.8 million in 2013. The difference between years is due to the fact that the 2013 benefit includes amounts related to both 2013 and 2012. The federal government did not extend the benefit of the tax credit for 2012 until January of 2013. U.S. generally accepted accounting principles require us to record tax expense based upon the laws in effect at the end of the year. The effective tax rate in 2013 includes the benefit for 2013 and 2012.
Tax expense included net favorable discrete items totaling $1.5 million in 2014 and $1.4 million in 2013. Discrete items included reductions to tax reserves due to the lapse of the statute of limitations and adjustments to the respective prior-year’s tax returns in each year.
Refer to Note Q to the Consolidated Financial Statements for a reconciliation of the statutory and effective tax rates.
Net income was $41.7 million, or $2.00 per share diluted, in 2014, compared to $19.7 million, or $0.94 per share diluted, in 2013.
2013 Compared to 2012
Net sales were $1.2 billion in 2013, a decline of $106.2 million, or 8%, from net sales of $1.3 billion in 2012. The net sales comparisons between years were affected by the pass-through of lower metal prices, the discontinuation of a non-strategic product line, changes in the use of customer-supplied metal, new product development, and changes in market demand. The costs of gold, silver, platinum, palladium and copper are typically passed through to customers and, therefore, movements in the prices of these metals will affect net sales, but may not have a proportionate impact on margins. The average prices for the metals we purchased in 2013 were lower than 2012. The net change in metal prices resulted in an estimated $92.3 million decrease in net sales in 2013 from 2012 and accounted for the majority of the reduction in net sales for the year.
In addition, as part of our product rationalization actions, we exited the silver investment bar business in 2012. This non-strategic product line generated extremely low margins that could not support the associated level of working capital and overhead. This action resulted in a reduction of net sales of approximately $9.3 million in 2013 from 2012 with an immaterial impact on value-added sales and profitability.
Value-added sales were $609.1 million in 2013 compared to $615.6 million in 2012. Value-added sales to the consumer electronics end market, our largest end market accounting for approximately 27% of our total value-added sales in 2013, were 3% lower in 2013 than in 2012. The decline in value-added sales in 2013 was due to lower shipments of precious metal products offset in part by increased shipments of various products for gaming systems and advanced chemicals for LED applications.
Industrial components end market value-added sales also softened in 2013 as compared to 2012. Value-added sales for certain industrial applications, including x-ray windows, declined in 2013 from 2012 levels. Value-added sales to the industrial components end market accounted for approximately 14% of our total value-added sales in 2013.
Medical end market value-added sales improved in 2013 versus 2012 due to increased sales for blood glucose strip applications. Medical end market value-added sales were 11% of our total value-added sales in 2013.
24
Energy end market value-added sales grew in 2013 as compared to 2012. The growth in 2013 was largely due to higher value-added sales for oil and gas applications in the second half of the year from improved market conditions as the rig count increased. The energy end market represented 8% of our total value-added sales in 2013.
Value-added sales to the automotive electronics end market grew at a double-digit rate in 2013 over 2012. The growth in 2013 was due to a combination of improved market conditions in the U.S. and Europe, new product development, and other factors. Value-added sales to this end market accounted for 10% of our total value-added sales in 2013.
Value-added sales to the defense end market were lower in 2013 versus 2012. The fall-off resulted from a decline in value-added sales of optics, largely due to government project delays and spending cuts, offset in part by an increase in value-added sales of beryllium materials. Value-added sales to the defense end market accounted for approximately 8% of our total value-added sales in 2013.
Gross margin was $188.0 million, or 31% of value-added sales, in 2013, as compared to $198.8 million, or 32% of value-added sales, in 2012. Lower manufacturing and precious metal yields and an unfavorable change in product mix within our precious metal operations accounted for the majority of the gross margin decline in 2013 as a percentage of value-added sales. Manufacturing inefficiencies in our Elmore, Ohio strip manufacturing operations also contributed to the decline. Inefficiencies and inconsistent production output continued from the new beryllium facility in 2013 as it did in 2012, but improvements were made throughout the year. We also made manufacturing improvements at our Lincoln, Rhode Island facility in 2013.
Improved pricing and product mix in portions of our business provided a margin benefit in 2013, while the lower value-added sales volume had a negative impact on margins as compared to 2012. The cost of bertrandite ore was higher and had a negative impact on gross margin in 2013 versus 2012.
The 2013 gross margin was reduced by net quarterly physical inventory adjustments totaling $2.2 million at the Albuquerque, New Mexico facility within the Advanced Materials segment. The majority of this loss was recorded in the first quarter of 2013. The gross margin in 2012 was also reduced by a net physical inventory adjustment of $7.4 million recorded in the fourth quarter at the Albuquerque facility. Physical inventories were taken at this facility in the first and second quarters in 2012 that resulted in a combined net short of $0.2 million.
We believe that a significant portion of the inventory loss at Albuquerque was due to theft. We filed a claim with our insurance company and reached a settlement in the second quarter of 2014 which resulted in the recognition of a $6.8 million gain in connection with the receipt of insurance proceeds. Shipments to customers were not affected by the physical inventory losses.
During 2013 and 2012, we took steps to consolidate several of our smaller operations, rationalize our product lines, and reduce overhead costs. Specifically:
• | We shut down our microelectronics packaging business in Massachusetts and transferred the operations to Singapore in order to more effectively serve our customer base in Asia. The relocation and customer qualifications were completed in the third quarter of 2013; |
• | We shut down the precision cleaning facility in the Czech Republic in the fourth quarter 2012. The existing customer base is now serviced from our Irish operations. The Czech operation had been unprofitable; |
• | The majority of the ongoing operations at our optics facility in Buellton, California were transferred to our Westford, Massachusetts operations in the fourth quarter of 2013. Buellton’s business had declined due to changes in market conditions, and we had excess capacity. The Buellton operations remained open on a reduced basis to service a key application with one customer. Manpower reductions were also made at the Westford and Shanghai, China facilities in an effort to right-size the optics operations; |
• | The Albuquerque operations were consolidated from four leased facilities into two in the fourth quarter of 2013 in order to improve work flow and manufacturing efficiencies. Portions of the operations were also transferred to our Wheatfield, New York facility; and |
• | Manpower reductions were made in the management group of the Advanced Materials segment in the fourth quarter of 2013 in order to reduce costs and streamline operations. |
Costs associated with these actions, including severance, equipment write-offs, equipment relocations, and other related items, totaled $6.0 million in 2013, with $1.8 million recorded in cost of sales, $2.8 million recorded in selling, general, and administrative expense, and $1.4 million in other-net. Related costs for these actions totaled $4.8 million in 2012 with $1.6 million recorded in cost of sales, $1.6 million recorded in selling, general, and administrative expense, and $1.6 million recorded in other-net expense. These actions resulted in a reduction in excess of 200 employees, or approximately 7% of our total workforce.
SG&A expenses totaled $133.3 million in 2013 and $133.9 million in 2012, or approximately 22% of value-added sales in both years. The incentive compensation expense on plans that pay in cash was slightly lower in 2013 versus 2012. The changes
25
in the annual expense between years were caused primarily by the performance of the individual operations relative to plan objectives. Stock-based compensation expense, including the expense for stock appreciation rights, restricted stock, and performance restricted shares, was $5.7 million in 2013 and $5.9 million in 2012. The comparison of stock-based compensation expense between years may be affected by changes in plan design, the number of grants in a given year, actual performance relative to the plan objectives, movement in our stock price, forfeitures, vesting schedules, and other factors.
Various corporate costs increased in 2013 over 2012. A portion of the higher costs was due to various initiatives, including a new centralized procurement function, that are designed to produce long-term savings and improve profitability across the organization. Other costs increased in 2013, including administration, legal, information technology, and business development, in order to support a more diverse organization. Corporate costs also included legal and investigation expenses associated with the Albuquerque inventory loss and the related insurance claim totaling $1.3 million in 2013.
SG&A savings in 2013 from the plant consolidations and related efforts totaled an estimated $2.9 million.
R&D expenses were $13.4 million in 2013, a 7% increase from the expense of $12.5 million in 2012. R&D expenses were 2% of value-added sales for 2013 and 2012. Our R&D staff works closely with production engineers, sales engineers, and marketing to support the development of new products and applications as well as to make improvements in the current product portfolio.
Other - net totaled $14.5 million of expense in 2013 and $15.6 million of expense in 2012. Refer to Note N to the Consolidated Financial Statements for the details of the major components of other-net. In addition to the previously discussed charges recorded in conjunction with the plant consolidation efforts, the major differences in other-net between the years include the following:
• | The metal consignment fee was $1.8 million lower in 2013 than in 2012, mainly due to differences in the rate charged by the financial institutions and the value of the metal on hand; |
• | There were one-time bank fees of $0.9 million in 2013 associated with the renewal of the metal consignment facilities; and |
• | The net foreign currency exchange gains totaled $1.5 million in both 2013 and 2012. The gains and losses result from movements in the value of the U.S. dollar versus other currencies, primarily the euro and yen, and the related impact on certain foreign currency denominated assets, liabilities, and transactions and the maturity of foreign currency hedge contracts. |
Operating profit was $26.8 million (4% of value-added sales) in 2013 compared to $36.8 million (6% of value-added sales) in 2012. The lower profit in 2013 was largely due to the decline in gross margin as a result of manufacturing inefficiencies and other operating factors. In addition, the annual expense on the domestic defined benefit pension plan was $13.3 million in 2013 and $9.8 million in 2012. The increase in pension expense was due to changes in the discount rate, the performance of plan assets, and other factors and affected cost of sales, selling, general, and administrative expenses and, to a lesser extent, research and development expenses. Refer to Note I to the Consolidated Financial Statements.
Interest expense - net was $3.0 million in 2013 and $3.1 million in 2012. The lower expense in 2013 resulted from lower average outstanding debt levels offset in part by a higher average borrowing rate.
Income tax expense was $4.1 million for 2013 and $9.0 million for 2012, respectively. The effective tax rates for 2013 and 2012 were 17% and 27%, respectively. The effects of percentage depletion (a tax benefit resulting from our mining operations), foreign source income and deductions, the production deduction, discrete events, and other items were major causes of the differences between the effective and statutory rates in 2013 and 2012.
The research and experimentation credit provided a tax benefit in 2011, but this credit was not extended by the federal government for 2012 until January 2013. U.S. generally accepted accounting principles require us to record tax expense based upon the laws in effect at the end of the year and even though the research and experimentation credit was used to determine our actual liability on our 2012 tax return, the 2012 benefit of this credit was not recorded in our Consolidated Statement of Income until 2013. The effective tax rate in 2013 also includes the benefit of this credit for 2013 activity.
Tax expense included net favorable discrete items totaling $1.4 million in 2013 and $0.3 million in 2012. Discrete items included reductions to tax reserves due to the lapse of the statute of limitations and adjustments to the respective prior year’s tax returns in each year. Discrete items in 2013 also included the favorable impact from filing an amended return for a prior period, while 2012 discrete items included the impact of a change in Japanese tax rates on the carrying value of certain deferred tax assets.
Refer to Note Q to the Consolidated Financial Statements for a reconciliation of the statutory and effective tax rates.
Net income was $19.7 million, or $0.94 per share diluted, in 2013, compared to $24.7 million, or $1.19 per share diluted, in 2012.
26
Segment Disclosures
As further described in Item 1 and Note M to the Consolidated Financial Statements, the Company changed its operating segments in the fourth quarter of 2014 to more appropriately focus our resources to drive new product development and growth across our diversified customer base. The Company now consists of three reportable segments: Performance Alloys and Composites, Advanced Materials, and Other. The Other reportable segment includes the results of our Precision Optics and Large Area Coatings operating segments, which do not meet the quantitative thresholds for separate disclosure and are collectively referred to as our Precision Coatings group. The Other reportable segment also includes unallocated corporate costs. The Company also changed its methodology for allocating certain general corporate and shared services expenses. The Company reclassified a portion of these expenses from its operating segments to corporate to better align with our management of these costs.
Performance Alloys and Composites
(Millions) | 2014 | 2013 | 2012 | |||||||||
Net sales | $ | 433.3 | $ | 422.9 | $ | 424.4 | ||||||
Value-added sales | 358.5 | 339.9 | 337.0 | |||||||||
Operating profit | 33.3 | 30.8 | 29.3 | |||||||||
2014 Compared to 2013
Net sales from the Performance Alloys and Composites segment of $433.3 million in 2014 were 2% higher than net sales of $422.9 million in 2013. Net sales were higher due to improved product mix and an increase in sales volume, partially offset by lower copper prices on average in 2014 as compared to 2013, which lowered metal pass-through prices by an estimated $3.1 million.
Value-added sales of $358.5 million in 2014 were 5% higher than value-added sales of $339.9 million in 2013. The increase in value-added sales was primarily driven by improved product mix and higher value-added sales into the medical and energy end markets, partially offset by lower value-added sales to the defense end market. Shipments of ToughMet products in 2014 increased 19% as compared to 2013.
Value-added sales to the energy end market, which accounted for 12% of Performance Alloys and Composites total value-added sales in 2014, increased 12% in 2014 as compared to 2013. The increase in energy end market value-added sales was due to higher sales to the oil and gas industry.
Value-added sales to the medical end market, which accounted for 5% of Performance Alloys and Composites total value-added sales in 2014, increased 77% in 2014 as compared to 2013. The increase in medical end market value-added sales was due primarily to higher sales for nuclear medicine applications and the growth of oncology and imaging in emerging markets.
Defense end market sales, which accounted for 6% of total value-added sales in 2014, decreased 22% versus 2013. There was a decline in value-added sales largely due to government project delays and spending cuts.
Performance Alloys and Composites generated a gross margin of $100.9 million in 2014, or 28% of value-added sales, as compared to $94.8 million in 2013, or 28% of value added sales. The $6.1 million increase in gross margin in 2014 compared to 2013 resulted from higher sales volume, and improvements in manufacturing efficiencies. Production of beryllium pebbles increased 18% in 2014 as compared to 2013.
SG&A, R&D, and other-net expenses were $54.5 million in 2014, an increase of 4% from the expense total of $52.1 million in 2013. The increase was due primarily to higher R&D expense tied to new product development efforts.
Performance Alloys and Composites generated operating profit of $33.3 million, or 9% of value-added sales, in 2014 as compared to $30.8 million, or 9% of value-added sales, in 2013 due to the reasons mentioned above.
2013 Compared to 2012
Net sales from the Performance Alloys and Composites segment in 2013 of $422.9 million were relatively flat as compared to net sales of $424.4 million in 2012. Net sales reflect a $3.0 million decrease related to declining metal market pricing, partially offset by volume growth and improvements in product mix.
27
Value-added sales of $339.9 million in 2013 were 1% higher than value-added sales of $337.0 million in 2012. The increase in value-added sales was primarily driven by higher sales to the automotive electronics end market, partially offset by a decline in sales to the consumer electronics end market. Value-added sales to the automotive electronics market grew as a result of improved market conditions both domestically and internationally and the development of new applications. The decline in value-added sales to the consumer electronics market was largely due to changes in technologies and the phase out of the current design of a disk drive arm application.
Performance Alloys and Composites generated a gross margin of $94.8 million in 2013, or 28% of value-added sales, as compared to $95.5 million in 2012, or 28% of value-added sales. The $0.7 million reduction in gross margin in 2013 compared to 2012 resulted in part from lower yields and manufacturing performance that affected strip production at our Elmore, Ohio facility. Performance had stabilized by year-end 2013 and yields returned to historical levels by the end of the first quarter 2014. Gross margin was also negatively affected in 2013 by an increase of approximately $0.8 million in the bertrandite ore cost in 2013 over 2012 due to the higher cost to remove the overburden during the construction of our most recent open pit mine.
The impact of the above items on gross margins was partially offset by pricing improvements and favorable product mix, as well as improved yields and efficiencies in our beryllium pebble facility in Elmore, Ohio.
Progress was made with the beryllium pebble plant at our Elmore, Ohio facility during 2013. This operation is designed to produce pure beryllium metal from beryllium hydroxide that is mined by our Utah operations allowing us to significantly reduce our dependency upon external sources for pure beryllium metal. In prior periods, manufacturing inefficiencies, start-up and maintenance costs, and inconsistent production levels resulted in disruptions to the material flow and lower gross margins. A number of these issues continued into 2013, but manufacturing efficiencies improved and the productive output increased sequentially each quarter during the year. While the plant did not operate for the full year at the designed level of output and cost, it operated at a level during the fourth quarter of 2013 that was sufficient to satisfy 2014 demand.
SG&A, R&D, and other-net expenses were $52.1 million in 2013, a decrease of 4% from the expense total of $54.5 million in 2012. The decrease was due to a reduction in incentive compensation expense, differences in currency exchange gains and losses, and lower selling expenses. The decrease was partially offset by increased spending on R&D projects, including bulk metallic glass, amorphous metals, and investment casting technology projects.
Performance Alloys and Composites generated operating profit of $30.8 million, or 9% of value-added sales, in 2013 as compared to $29.3 million, or 9% of value-added sales, in 2012 due to the reasons mentioned above.
Advanced Materials
(Millions) | 2014 | 2013 | 2012 | |||||||||
Net sales | $ | 547.3 | $ | 592.0 | $ | 694.8 | ||||||
Value-added sales | 181.0 | 168.6 | 172.1 | |||||||||
Operating profit | 32.7 | 8.4 | 21.8 | |||||||||
2014 Compared to 2013
Net sales from the Advanced Materials segment of $547.3 million in 2014 were 8% lower than net sales of $592.0 million in 2013. Metal prices on average were lower in 2014 than 2013, and we estimate that lower pass-through metal prices reduced net sales by $51.4 million in 2014.
Value-added sales of $181.0 million were 7% higher than value-added sales of $168.6 million in 2013, which partially offset lower pass-through metal prices. The increase in value-added sales was primarily driven by higher value-added sales to the consumer electronics end market and increased volumes into the semiconductor industry and related precious metal cleaning services.
Value-added sales to the consumer electronics end market, which represents the largest end market segment for Advanced Materials and accounted for 48% of total segment value-added sales in 2014, increased 11% in 2014 as compared to 2013. The increase in consumer electronics end market value-added sales in 2014 as compared to 2013 was due to higher volume of our products used in hand-held devices.
Value-added sales to the services end market, which accounted for 16% of Advanced Materials total value-added sales in 2014, increased 11% in 2014 as compared to 2013. The increase in services end market value-added sales was due in part to higher refine and chamber cleaning volume tied directly to the increased shipments into the semiconductor end market.
28
Advanced Materials generated a gross margin of $73.6 million in 2014, or 41% of value-added sales, as compared to $60.1 million in 2013, or 36% of value-added sales. The $13.5 million increase in gross margin in 2014 compared to 2013 resulted from higher value-added sales volumes, improvement in manufacturing yields in our precious metal operations, and manufacturing efficiencies resulting from facility consolidation and manufacturing rationalization efforts completed in late 2013. Manufacturing cost savings realized in 2014 related to the 2013 restructuring actions totaled $3.7 million.
SG&A, R&D, and other-net expenses were $34.9 million in 2014, a decrease of 24% from the expense total of $46.2 million in 2013. SG&A expense in 2014 included a benefit of approximately $3.6 million related to savings associated with restructuring actions. Other-net for 2014 was positively impacted by a $6.8 million favorable insurance settlement. The results for 2013 also included an unfavorable net impact of $1.3 million related to charges recorded for plant consolidation costs, offset by rationalization savings related to the program.
Advanced Materials generated operating profit of $32.7 million, or 18% of value-added sales, in 2014 as compared to $8.4 million, or 5% of value-added sales, in 2013 due to the aforementioned reasons, including total restructuring savings of $7.3 million.
2013 Compared to 2012
Net sales from the Advanced Materials segment in 2013 of $592.0 million were $102.8 million, or 15%, lower than net sales of $694.8 million in 2012.
Metal prices on average were lower in 2013 than 2012, and we estimate that the lower metal price pass-through accounted for approximately $83.0 million of the decline in net sales in 2013.
Value-added sales of $168.6 million in 2013 were 2% lower than value-added sales of $172.1 million in 2012.
Value-added sales to the consumer electronics end market decreased in 2013 from 2012. Consumer electronics represents this segment’s largest end market, accounting for 47% of total value-added sales in 2013.
Value-added sales of precious metal products into the consumer electronics end market were down slightly in 2013 compared to 2012, primarily for LED, data storage, and semiconductor applications. The decline in precious metal value-added sales to the consumer electronics market was partially offset by increased sales of advanced chemicals in 2013. Value-added sales of our advanced chemicals for LEDs increased in 2013 over 2012 due to changes in technology and product development activities.
Refine and chamber cleaning value-added sales declined slightly in 2013 from 2012 partially as a result of the lower precious metal prices reducing the value of the metal that we retained as part of the standard pricing arrangements with our refine customers.
Advanced Materials generated a gross margin of $60.1 million in 2013 and $71.9 million in 2012. Expressed as a percentage of value-added sales, gross margin was 36% in 2013 and 42% of value-added sales in 2012. The $11.8 million decline in gross margins in 2013 from 2012 was due in part to lower value-added sales in 2013. The decline in gross margin in 2013 was also caused in part by physical inventory losses and lower manufacturing yields in our precious metal operations, including the refining and shield kit cleaning operations. The change in product mix was unfavorable in 2013 compared to 2012 and also contributed to the lower gross margin dollars.
SG&A, R&D, and other-net expenses were $46.2 million in 2013 compared to $44.8 million in 2012. The increase is due to higher incentive compensation expense and higher SG&A due to various projects, inflation, and other factors. Expense totals included $4.2 million of plant consolidation costs in 2013 and $3.2 million in 2012 and the resulting savings of $2.9 million in 2013.
Advanced Materials generated operating profit of $8.4 million, or 5% of value-added sales, in 2013 versus $21.8 million, or 13% of value-added sales, in 2012 due to the factors mentioned previously.
Other
(Millions) | 2014 | 2013 | 2012 | |||||||||
Net sales | $ | 146.3 | $ | 152.0 | $ | 153.9 | ||||||
Value-added sales | 97.6 | 100.6 | 106.5 | |||||||||
Operating loss | (9.0 | ) | (12.4 | ) | (14.3 | ) | ||||||
29
2014 Compared to 2013
The Other reportable segment in total includes the operating results of the Precision Coatings group and unallocated corporate costs.
Net sales for the Other reportable segment totaled $146.3 million in 2014 and $152.0 million in 2013. Including unallocated corporate costs, the Other reportable segment had an operating loss of $9.0 million in 2014 compared to an operating loss of $12.4 million in 2013.
Within the Other reportable segment, net sales for the Precision Coatings group were $147.7 million in 2014 as compared to $152.3 million in 2013, and value-added sales were $102.4 million in 2014 versus $104.2 million in 2013. The slight decrease in value-added sales was primarily driven by lower sales to the defense end market, partially offset by higher sales to the consumer electronics and medical end markets. Lower sales to the defense end market were due to a reduction in sales of optics as a result of government spending patterns and cutbacks. Consumer electronics sales were up due to higher sales in projector display product applications. Medical end market sales were up slightly due to an increase in shipments for life science applications.
Gross margin for the Precision Coatings group included within the Other reportable segment was $33.3 million, or 33% of value-added sales, in 2014 versus gross margin of $33.5 million, or 32% of value-added sales, in 2013. Despite slightly lower value-added sales, gross margin as a percentage of value-added sales improved slightly due to a reduction in manufacturing costs related to the closure of our Buellton, California facility and manpower reductions at our Westford, Massachusetts and Shanghai, China facilities in an effort to right-size our optic operations.
SG&A, R&D, and other-net expenses for the Precision Coatings group within the Other reportable segment were $21.7 million in 2014 compared to $27.0 million in 2013. The reduction in expense is due to restructuring savings in 2014 and other factors.
Within the Other reportable segment, the Precision Coatings group reported an operating profit of $9.3 million, or 9% of value-added sales, in 2014 versus $4.2 million, or 4% of value-added sales, in 2013 based on the aforementioned factors.
The Other reportable segment also contains unallocated corporate costs. Corporate costs of $18.3 million in 2014 increased $1.7 million as compared to $16.6 million in 2013. The increase in corporate costs was due primarily to an increase in incentive compensation expense as a result of improved financial performance.
2013 Compared to 2012
The Other reportable segment in total includes the operating results of the Precision Coatings group and unallocated corporate costs.
Net sales for the Other reportable segment totaled $152.0 million in 2013 and $153.9 million in 2012. Including unallocated corporate costs, the Other reportable segment had an operating loss of $12.4 million in 2013 versus an operating loss of $14.3 million in 2012.
Within the Other reportable segment, net sales for the Precision Coatings group were $152.3 million in 2013 as compared to $153.0 million in 2012, and value-added sales were $104.2 million in 2013 versus $106.4 million in 2012. The decrease in value-added sales was primarily driven by lower sales to the defense end market, combined with smaller decreases in other end markets, partially offset by higher sales to the medical end market. Lower sales to the defense end market were due to a reduction in sales of optics as a result of government spending patterns and cutbacks. Medical end market sales were up due to an increase in sales of precision precious metal-coated polymer films for blood glucose test strip applications.
Gross margin for the Precision Coatings group included within the Other reportable segment was $33.5 million, or 32% of value-added sales, in 2013 and $32.5 million, or 31% of value-added sales, in 2012.
SG&A, R&D, and other-net expenses for the Precision Coatings group within the Other reportable segment were $27.0 million in 2013 compared to $28.7 million in 2012.
Within the Other reportable segment, the Precision Coatings group reported an operating profit of $4.2 million, or 4% of value-added sales, in 2013 versus $1.8 million, or 2% of value-added sales, in 2012 based on the aforementioned factors.
The Other reportable segment also contains unallocated corporate costs. Corporate costs of $16.6 million in 2013 were relatively comparable to $16.1 million in 2012.
30
International Sales and Operations
We operate in worldwide markets and our international customer base continues to expand geographically. In Asia, we have strategically located our facilities in Japan, Singapore, China, Korea, Taiwan, and the Philippines, while our European facilities are in Germany, the United Kingdom, and Ireland.
Our international operations provide a combination of manufacturing, finishing operations, local sales support, and distribution services and are designed to provide a cost-effective method of capturing the growing overseas demand for our products over the long term. We also augment our sales and distribution efforts with an established network of independent distributors and agents throughout the world.
The following table summarizes total international sales by region for the last three years:
(Millions) | 2014 | 2013 | 2012 | |||||||||
Asia | $ | 238.7 | $ | 196.0 | $ | 217.4 | ||||||
Europe | 136.6 | 136.6 | 139.5 | |||||||||
Rest of world | 20.4 | 23.6 | 34.2 | |||||||||
Total | $ | 395.7 | $ | 356.2 | $ | 391.1 | ||||||
Percent of total net sales | 35 | % | 31 | % | 31 | % | ||||||
International sales include sales from international operations and direct exports from our U.S. operations. The international sales in the above chart are included in the individual segment sales previously discussed.
Total international sales increased 11% in 2014 from 2013 due to strong sales growth in Asia. Asian sales increased due to stronger demand in the consumer electronics and telecommunications infrastructure end markets.
Sales from European and certain Asian operations are primarily denominated in local currencies. Exports from the U.S. and the balance of the sales from the Asian operations are typically denominated in U.S. dollars. Local competition generally limits our ability to adjust selling prices upwards to compensate for short-term unfavorable exchange rate movements.
We have a hedge program with the objective of minimizing the impact of fluctuating currency values on our consolidated operating profit. Refer to Note H to the Consolidated Financial Statements.
Value-Added Sales - Reconciliation of Non-GAAP Measure
A reconciliation of net sales to value-added sales, a non-GAAP measure, for each reportable segment and for the Company in total for 2014, 2013, and 2012 is as follows:
(Millions) | 2014 | 2013 | 2012 | |||||||||
Net Sales | ||||||||||||
Performance Alloys and Composites | $ | 433.3 | $ | 422.9 | $ | 424.4 | ||||||
Advanced Materials | 547.3 | 592.0 | 694.8 | |||||||||
Other | 146.3 | 152.0 | 153.9 | |||||||||
Total | $ | 1,126.9 | $ | 1,166.9 | $ | 1,273.1 | ||||||
Less: pass-through metal costs | ||||||||||||
Performance Alloys and Composites | $ | 74.8 | $ | 83.0 | $ | 87.4 | ||||||
Advanced Materials | 366.3 | 423.4 | 522.7 | |||||||||
Other | 48.7 | 51.4 | 47.4 | |||||||||
Total | $ | 489.8 | $ | 557.8 | $ | 657.5 | ||||||
Value-added sales | ||||||||||||
Performance Alloys and Composites | $ | 358.5 | $ | 339.9 | $ | 337.0 | ||||||
Advanced Materials | 181.0 | 168.6 | 172.1 | |||||||||
Other | 97.6 | 100.6 | 106.5 | |||||||||
Total | $ | 637.1 | $ | 609.1 | $ | 615.6 | ||||||
31
The cost of gold, silver, platinum, palladium, and copper can be quite volatile. Our pricing policy is to directly pass the cost of these metals on to the customer in order to mitigate the impact of metal price volatility on our results from operations. Trends and comparisons of net sales are affected by movements in the market prices of these metals, but changes in net sales due to metal price movements may not have a proportionate impact on our profitability.
Internally, management reviews net sales on a value-added basis. Value-added sales are a non-GAAP measure that deducts the value of the pass-through metal costs from net sales. Value-added sales allow management to assess the impact of differences in net sales between periods, segments, or markets, and analyze the resulting margins and profitability without the distortion of movements in pass-through metal costs. The dollar amount of gross margin and operating profit is not affected by the value-added sales calculation. We sell other metals and materials that are not considered direct pass-throughs, and these costs are not deducted from net sales when calculating value-added sales.
Our net sales are also affected by changes in the use of customer-supplied metal. When we manufacture a precious metal product, the customer may purchase metal from us or may elect to provide its own metal, in which case we process the metal on a toll basis and the metal value does not flow through net sales or cost of sales. In either case, we generally earn our margin based upon our fabrication efforts. The relationship of this margin to net sales can change depending upon whether or not the product was made from our metal or the customer’s metal. The use of value-added sales removes the potential distortion in the comparison of net sales caused by changes in the level of customer-supplied metal.
By presenting information on net sales and value-added sales, it is our intention to allow users of our financial statements to review our net sales with and without the impact of the pass-through metals.
Legal Proceedings
One of our subsidiaries, Materion Brush Inc., is a defendant from time to time in proceedings in various state and federal courts brought by plaintiffs alleging that they have contracted chronic beryllium disease or other lung conditions as a result of exposure to beryllium. Plaintiffs in beryllium cases generally seek recovery under negligence and various other legal theories and seek compensatory and punitive damages, in many cases of an unspecified sum. Spouses, if any, often claim loss of consortium.
There was one chronic beryllium disease (CBD) case outstanding against us as of December 31, 2014. This case was filed in 2013. The Company does not expect the resolution of this matter to have a material impact on the consolidated financial statements. One other case was settled and dismissed during the third quarter of 2014.
Additional beryllium claims may arise. Management believes that we have substantial defenses in these types of cases and intends to contest the suits vigorously should they arise. Employee cases, in which plaintiffs have a high burden of proof, have historically involved relatively small losses to us. Third-party plaintiffs (typically employees of customers or contractors) face a lower burden of proof than do employees or former employees, but these cases are generally covered by varying levels of insurance.
Although it is not possible to predict the outcome of any litigation, we provide for costs related to these matters when a loss is probable, and the amount is reasonably estimable. Litigation is subject to many uncertainties, and it is possible that some of these actions could be decided unfavorably in amounts exceeding our reserves. An unfavorable outcome or settlement of a beryllium case or adverse media coverage could encourage the commencement of additional similar litigation. We are unable to estimate our potential exposure to unasserted claims.
Based upon currently known facts and our experience with beryllium cases and assuming collectibility of insurance, we do not believe that resolution of future beryllium proceedings will have a material adverse effect on our financial condition or cash flow. However, our results of operations could be materially affected by unfavorable results in one or more of these cases in the future.
Regulatory Matters. Standards for exposure to beryllium are under review by the United States Occupational Safety and Health Administration (OSHA) and by other governmental and private standard-setting organizations. One result of these reviews will likely be more stringent worker safety standards. Some organizations, such as the California Occupational Health and Safety Administration and the American Conference of Governmental Industrial Hygienists, have adopted standards that are more stringent than the current standards of OSHA. The development, proposal, or adoption of more stringent standards may affect the buying decisions by the users of beryllium-containing products. If the standards are made more stringent and/or our customers or other downstream users decide to reduce their use of beryllium-containing products, our results of operations, liquidity, and financial condition could be materially adversely affected. The impact of this potential adverse effect would depend on the nature and extent of the changes to the standards, the cost and ability to meet the new standards, the extent of any reduction in customer use, and other factors. The magnitude of this potential adverse effect cannot be estimated.
32
FINANCIAL POSITION
Net cash provided from operations totaled $60.3 million in 2014 as a result of strong operating performance of our business, partially offset by an increase in inventory levels. Of the total cash used in operations of $30.4 million that resulted in increased inventory levels, approximately $27.1 million of the increase from December 31, 2013 related to our Performance Alloys and Composites segment. Inventories increased due primarily to higher inventory quantities related to the continued ramp up of production of the beryllium pebble facility and the timing of production and stocking of inventory in key product lines in anticipation of future sales activity, as well as planned production equipment shutdowns in 2015. Production of beryllium pebbles in 2014 increased 18% as compared to 2013.
Net cash provided from operations in the fourth quarter of 2014 was $39.3 million, more than half of the total cash provided from operations for the full year.
Net cash provided from operations totaled $75.9 million in 2013 based on strong earnings, a decline in accounts receivable, and the net movements in other working capital items. Cash provided from operations in the fourth quarter of 2013 was $37.4 million, almost half of the total cash provided from operations for the full year.
As previously noted, price movements of precious and base metals are essentially passed to customers. Therefore, while sudden movements in the price of metals can cause a temporary imbalance in our cash receipts and payments in either direction, once prices stabilize, our cash flow tends to stabilize as well.
Cash balances of $13.2 million as of December 31, 2014 were lower than $22.8 million as of December 31, 2013 due to the repayment of debt in 2014.
Accounts receivable totaled $112.8 million as of December 31, 2014, a slight decrease of $0.2 million from the prior year end balance of $113.0 million.
The decrease was due to strong collections. Our three-month trailing days sales outstanding (DSO) was approximately 37 days at the end of 2014 versus approximately 38 days at the end of 2013. We have procedures in place to closely monitor our accounts receivable aging and to monitor past due accounts. We evaluate the credit position of new customers in advance of the initial sale, and we continually evaluate the credit positions of our existing customers. We will revise credit terms offered to our customers as conditions warrant in order to minimize our risk. Credit terms may vary by country based upon local customary practices and competition. Billings for precious metals generally have tighter payment terms than billings for other products. Advance billings are used from time to time to reduce credit exposures and accelerate the collection of cash.
Inventories were $232.4 million as of December 31, 2014 and $232.8 million as of December 31, 2013. We repaid a precious metal-denominated loan in the third quarter of 2014, which totaled $28.7 million as of December 31, 2013. The debt reduction was completed by transferring 23,781 ounces of gold held in inventory to the lender as repayment for the outstanding short-term debt. As a result, there was a corresponding decrease in inventory of $28.7 million related to this transaction, which was treated as a non-cash item in the Consolidated Statement of Cash Flows. This decrease was offset by cash used in operations of $30.4 million to increase inventory levels as previously noted.
Intangible assets totaled $18.6 million as of the end of 2014 compared to $24.2 million as of the end of 2013. The decline was due to current year amortization. Refer to Note E to the Consolidated Financial Statements for additional details on our intangible assets.
Retirement and Post-employment Benefits
The long-term retirement and post-employment benefit obligation was $103.9 million as of December 31, 2014 and $80.3 million as of December 31, 2013. The majority of the change in this obligation was due primarily to an increase in the liability for our domestic defined benefit plan, partially offset by a reduction in our retiree medical benefit plan liability.
The liability for our domestic defined benefit plan, which covers a significant portion of our domestic employees, was $71.9 million at the end of 2014 as compared to $35.7 million at the end of 2013. The increase was largely due to a decrease in the discount rate from 4.875% as of December 31, 2013 to 4.0% as of December 31, 2014. In addition, we also updated our mortality rate assumptions based on new guidance issued from the Society of Actuaries which increased our liability. Refer to “Critical Accounting Polices” for additional information. Total benefit payments were $8.3 million in 2014, and total expense recognized during 2014 was $9.4 million. The market value of the plan assets increased from $167.0 million at the end of 2013 to $180.1 million at the end of 2014 as a result of contributions totaling $15.8 million and investment earnings of $6.2 million less benefit payments and expenses of $8.9 million.
33
The plan assets generated a return of 3.7% in 2014.
A portion of our domestic retirees and current employees are eligible to participate in a retiree medical benefit plan. The plan is unfunded and the liability was $16.5 million as of December 31, 2014 (with $1.5 million classified as short-term and $15.0 million classified as long-term) as compared to $31.4 million as of December 31, 2013 (with $2.7 million classified as short-term and $28.7 million classified as long-term). The decrease in our retiree medical benefit plan liability is due to changes implemented during 2014, including a modification of the benefit formula for participants covered by the plan. The revised benefit formula is designed to lower costs for the Company and the majority of plan participants. As a result of these changes, we reduced the liability on our Consolidated Balance Sheet by $14.0 million in the first quarter of 2014, with the offset increasing other comprehensive income, a component of shareholders’ equity. The liability reduction will be recognized in earnings through 2023. The retiree medical plan income in 2014 was $0.7 million as compared to $1.7 million of expense in 2013.
We also have a subsidiary in Germany with an unfunded retirement plan for its employees and a subsidiary in England with a funded retirement plan. Refer to Note I to the Consolidated Financial Statements for additional details on our retirement obligations.
Capital Expenditures
A summary of capital expenditures for 2014 and 2013 is as follows:
(Millions) | 2014 | 2013 | ||||||
Capital expenditures | $ | 29.3 | $ | 27.8 | ||||
Mine development | 1.2 | 4.8 | ||||||
Net spending | $ | 30.5 | $ | 32.6 | ||||
Capital spending by Performance Alloys and Composites was $17.0 million in 2014 and $18.3 million in 2013. Major projects in 2014 included capacity expansion at our Lorain, Ohio facility, an upgrade to the strip rolling equipment at our Reading, Pennsylvania location, and various other facility upgrade projects.
In the Advanced Materials segment, we spent $6.4 million on capital projects in 2014 as compared to $4.2 million in 2013. Current year projects primarily related to facility and equipment modernization and other infrastructure projects.
In the Other segment, we spent $7.1 million on capital projects in 2014 as compared to $10.1 million in 2013. Other capital spending in 2014 consisted of $5.9 million related to the Precision Coatings group, with the remaining $1.2 million of capital spend related to corporate projects. Major projects for the Precision Coatings group in 2014 included capacity expansion and process automation to support new business opportunities and future sales growth.
Acquisitions
We acquired Aerospace Metal Composites Limited in 2012 for a total cost of $3.3 million net of cash acquired, including $1.9 million of acquired goodwill. The acquisition was financed with a combination of cash on hand and borrowings under our revolving credit agreement. Refer to Note B to the Consolidated Financial Statements.
Debt
Total outstanding debt decreased from $64.8 million at the end of 2013 to $24.3 million at the end of 2014 due to the repayment of a precious metal-denominated loan of $28.7 million and the use of cash provided from operations to reduce our outstanding debt balances.
Shareholders’ Equity
Shareholders’ equity was $458.1 million as of December 31, 2014 and $463.3 million as of December 31, 2013. Causes for the changes in equity in both years included comprehensive income, share repurchases, and the payment of dividends.
In January of 2014, our Board of Directors approved a plan to repurchase up to $50.0 million of our common stock. The timing of the share purchases will depend upon several factors, including market and business conditions, our cash flow, debt levels, and other investment opportunities. There is no minimum required purchase quantity for a given year, and the purchases may be discontinued at any time. We purchased 690,339 shares at a total cost of $22.3 million during 2014. We did not repurchase any shares in 2013.
34
Our Board of Directors implemented a dividend program in the second quarter of 2012 and increased the quarterly dividend from $0.08 per share to $0.085 per share in the second quarter of 2014. Cash dividends paid totaled $6.9 million in 2014 and $6.5 million in 2013. We intend to pay a quarterly dividend on an ongoing basis, subject to a continuing strong capital structure and a determination that the dividend remains in the best interest of our shareholders.
We received $0.4 million from the exercise of approximately 20,000 options in 2014 and $1.2 million from the exercise of approximately 74,000 options in 2013.
Equity was also affected by stock-based compensation expense, the tax benefits on stock compensation realization, and other factors in both 2014 and 2013.
Off-balance Sheet Obligations
We maintain the majority of the precious metals we use in production and a portion of our copper requirements on a consignment basis in order to reduce our exposure to metal price movements and to reduce our working capital investment. Refer to Item 7A “Quantitative and Qualitative Disclosures about Market Risk”. The notional value of off-balance sheet precious metals was $310.6 million as of December 31, 2014 versus $255.8 million as of December 31, 2013. We were in compliance with all of the covenants contained in the consignment agreements as of December 31, 2014 and December 31, 2013.
Contractual Obligations
A summary of payments to be made under long-term debt agreements, operating leases, significant capital leases, pension plan contributions, and material purchase commitments by year is as follows:
(Millions) | 2015 | 2016 | 2017 | 2018 | 2019 | There- after | Total | |||||||||||||||||||||
Long-term debt | $ | 0.7 | $ | 9.0 | $ | 0.7 | $ | 10.8 | $ | 0.8 | $ | 2.3 | $ | 24.3 | ||||||||||||||
Non-cancelable lease payments | 6.4 | 5.9 | 4.4 | 3.5 | 3.0 | 6.3 | 29.5 | |||||||||||||||||||||
Capital lease payments | 1.1 | 1.1 | 1.0 | 1.0 | 1.0 | 3.8 | 9.0 | |||||||||||||||||||||
Pension plan contribution | 16.0 | — | — | — | — | — | 16.0 | |||||||||||||||||||||
Purchase commitments | 20.8 | — | — | — | — | — | 20.8 | |||||||||||||||||||||
Total | $ | 45.0 | $ | 16.0 | $ | 6.1 | $ | 15.3 | $ | 4.8 | $ | 12.4 | $ | 99.6 | ||||||||||||||
The revolving credit agreement matures in 2018 and the long-term debt repayment in 2018 in the above chart includes $10.0 million borrowed under this agreement as of December 31, 2014. In the past, we have renegotiated a new facility prior to the maturity of the then-existing credit facility, and we anticipate that we would plan to do the same in the future. However, we cannot guarantee that a replacement facility will be available or have similar terms as our existing facility. Refer to Note F to the Consolidated Financial Statements for additional debt information.
The non-cancelable lease payments represent payments under operating leases with initial lease terms in excess of one year as of December 31, 2014. The capital lease payments include a building at the Elmore, Ohio site and other material capital leases. Refer to Note G to the Consolidated Financial Statements for further leasing details. The pension plan contribution of $16.0 million in the above table represents our best estimate of the contribution we expect to make as of early 2015. Refer to the "Liquidity" section below for further discussion.
The purchase commitments of $20.8 million are for mine development and minimum raw material purchase requirements in 2015.
Liquidity
We believe that cash flow from operations plus the available borrowing capacity and our current cash balance are adequate to support operating requirements, capital expenditures, projected pension plan contributions, the current dividend and share repurchase programs, environmental remediation projects, and strategic acquisitions. A summary of key data relative to our liquidity, including the outstanding debt, cash balances, available borrowing capacity, and the debt-to-debt-plus-equity ratio, as of December 31, 2014 and December 31, 2013 is as follows:
35
December 31, | ||||||||
(Dollars in millions) | 2014 | 2013 | ||||||
Total outstanding debt | $ | 24.3 | $ | 64.8 | ||||
Cash | 13.2 | 22.8 | ||||||
Net debt | $ | 11.1 | $ | 42.0 | ||||
Available borrowing capacity | $ | 229.4 | $ | 186.8 | ||||
Debt-to-debt-plus-equity ratio | 5 | % | 12 | % | ||||
Net debt is a non-GAAP measure. We are providing this information because we believe it is more indicative of our overall financial position. It is also a measure our management uses to assess financing and other decisions.
The cumulative cash flow provided from operations in 2014 and 2013 totaled $136.2 million and is net of contributions to the domestic defined benefit plan of $25.0 million. This cash flow allowed us to fund capital expenditures of $63.2 million (including mine development), share repurchases of $22.3 million, and dividend payments of $13.4 million. In addition, we also reduced net debt from $42.0 million at the end of 2013 to $11.1 million at the end of 2014. As a result, the debt-to-debt-plus-equity ratio improved to 5% as of December 31, 2014 from 12% as of December 31, 2013. We believe that based on our typical cash flow from operations, we can support a higher leverage ratio in future periods.
The available borrowing capacity in the table above represents the additional amounts that could be borrowed under our revolving credit facility and other secured lines existing as of the end of each year depicted. The applicable debt covenants have been taken into account when determining the available borrowing capacity, including the covenant that restricts the borrowing capacity to a multiple of the twelve-month trailing earnings before interest, income taxes, depreciation and amortization, and other adjustments. The main cause for the increase in the available borrowing capacity in 2014 as compared to 2013 was the impact of this covenant and our higher profitability.
We entered into a revolving credit facility in the second quarter of 2013 that replaced the prior facility that was scheduled to mature in 2016. The revolving credit facility is secured and provides up to $375.0 million of borrowing capacity, an increase of $50.0 million over the prior facility. Borrowing rates are based on a spread over LIBOR, with the spreads being slightly lower under the new facility as compared to the previous facility. The financial covenants remained unchanged. The revolving credit facility matures in 2018.
We were in compliance with all of our debt covenants as of December 31, 2014 and December 31, 2013.
We intend to continue to repurchase shares and pay quarterly dividends, subject to a continuing strong capital structure and a determination that these actions remain in the best interest of our shareholders.
In January of 2014, our Board of Directors authorized the purchase of up to $50.0 million of our common stock, which replaced the prior authorization to purchase up to 1,000,000 shares of stock. Under the new authorization, the Company spent $22.3 million to repurchase 690,339 shares in 2014. We may use several methods to purchase stock, including open market purchases, negotiated block transactions, accelerated share purchases, or open market solicitations for shares, some of which may be conducted through Rule 10b5-1 plans. The timing of our share purchases will depend upon several factors, including market and business conditions, our cash flow, debt levels, and other investment opportunities, including acquisitions. There is no minimum required purchase quantity for a given year, and the purchases may be discontinued at any time. We did not purchase any of our common stock in 2013.
Our domestic defined benefit pension plan is under-funded as of December 31, 2014. Contributions in future periods will be dependent upon regulatory requirements, the plan funded ratio, plan investment performance, discount rates, actuarial assumptions, plan amendments, our contribution objectives, and other factors. Federal legislation enacted during 2012 resulted in a reduction in mandatory contributions in the short term from the levels under the previous regulations, but we may elect to contribute funds in excess of the mandatory levels in a given year depending upon our cash flow from operations and other considerations. As of early in the first quarter of 2015, we anticipate contributing approximately $16.0 million to our defined benefit domestic plan in 2015. This estimate is in excess of the mandatory contributions. This higher contribution level is designed to minimize our PBGC premium payments, as well as to maintain the plan funded ratio in line with our long-term objectives. We also anticipate funding those contributions with cash on hand, cash generated from operations, or borrowings under our existing lines of credit. It is not practical to estimate the required contributions beyond 2015 at the present time.
The closure of the domestic defined benefit plan to new entrants in 2012 will reduce our plan funding requirements in the long term, but closure has a minimal impact on our funding requirements in the short term.
36
During 2013, we offered a one-time opportunity for terminated deferred vested participants in the domestic defined benefit plan the election of a lump sum payment in 2013 in lieu of an annuity upon retirement. The resulting lump sum payouts of $14.8 million were made from the pension plan assets during 2013, and no additional contribution from the Company was required to fund the payments. The lump sum payout option was part of a long-term program to reduce risk associated with our domestic pension plan assets and liabilities.
Portions of our business utilize off-balance sheet consignment arrangements to finance metal requirements. Expansion of business volumes and/or higher metal prices can put pressure on the consignment line limitations from time to time. As a result we have negotiated increases in the available capacity under existing lines, added additional lines, and extended the maturity dates of existing lines in recent years. The available and unused capacity under the metal financing lines totaled approximately$139.4 million as of December 31, 2014. The availability is determined by Board approved levels and actual line capacity.
We have an active environmental compliance program. We estimate the probable cost of identified environmental remediation projects and establish reserves accordingly. The environmental remediation reserve balance was $4.9 million at December 31, 2014 and $4.8 million at December 31, 2013. Payments for environmental projects totaled $0.2 million in 2014 and $1.0 million in 2013. Environmental projects tend to be long term, and the associated payments are typically made over a number of years. Refer to Note J to the Consolidated Financial Statements.
Cash on hand does not affect the covenants or the borrowing capacity under our debt agreements. Portions of our cash balances may be invested in high-quality, highly liquid investments with maturities of three months or less from time to time.
37
ORE RESERVES
We have proven and probable reserves of beryllium-bearing bertrandite ore in Juab County, Utah. We own approximately 90 percent of the proven reserves, with the remaining reserves leased from the State of Utah. We augment our proven reserves of bertrandite ore through the purchase of imported beryl ore from time to time. This ore, which is approximately 4 percent beryllium, is also processed at the Utah extraction facility. Approximately 87 percent of the beryllium in ore is recovered in the extraction process. Proven and probable reserves are based on extensive drilling, sampling, mine modeling, and metallurgical testing from which we determine economic feasibility.
The term “proven reserves” means reserves for which (a) quantity is computed from dimensions revealed in outcrops, trenches, workings, or drill holes; grade and/or quality are computed from the results of detailed sampling and (b) the sites for inspection, sampling, and measurement are spaced so closely and the geologic character is so well defined that size, shape, depth, and mineral content of reserves are well-established, and (c) for which are commercially recoverable through open-pit methods.
The term “probable reserves” means reserves for which quantity and grade and/or quality are computed from information similar to that used for proven reserves, but the sites for inspection, sampling, and measurement are farther apart or are otherwise less adequately spaced. The degree of assurance, although lower than that for proven reserves, is high enough to assume continuity between points of observation.
Proven | Probable | Total | |||||||
As of December 31, 2014 | |||||||||
Tonnage (in thousands) | 6,122 | 3,519 | 9,641 | ||||||
Grade (% beryllium) | 0.262 | % | 0.232 | % | 0.251 | % | |||
Beryllium pounds (in millions) | 32.02 | 16.33 | 48.35 | ||||||
As of December 31, 2013 | |||||||||
Tonnage (in thousands) | 6,173 | 3,519 | 9,692 | ||||||
Grade (% beryllium) | 0.263 | % | 0.232 | % | 0.252 | % | |||
Beryllium pounds (in millions) | 32.48 | 16.33 | 48.81 | ||||||
Based upon average production levels in recent years and our near-term production forecasts, proven reserves would last approximately 70 years. Efforts are underway to further analyze, quantify, and develop the reserves classified as probable. The inclusion of probable reserves as proven reserves could provide more than 25 years of additional reserve life. The table below details our production of beryllium at our Utah location.
(Thousands of Pounds of Beryllium) | 2014 | 2013 | 2012 | ||||||
Domestic ore | 593 | 514 | 486 | ||||||
Non-domestic ore | 21 | 17 | 17 | ||||||
Unyielded total | 614 | 531 | 503 | ||||||
Annual yield | 89 | % | 85 | % | 87 | % | |||
Beryllium produced | 546 | 450 | 438 | ||||||
% of mill capacity | 73 | % | 60 | % | 58 | % | |||
CRITICAL ACCOUNTING POLICIES
The preparation of financial statements requires the inherent use of estimates and management’s judgment in establishing those estimates. The following are the most significant accounting policies we use that rely upon our judgment.
Accrued Liabilities. We have various accruals on our balance sheet that are based in part upon our judgment, including accruals for litigation, environmental remediation, and workers’ compensation costs. We establish accrual balances at the best estimate determined by a review of the available facts and trends by management and independent advisors and specialists as appropriate. Absent a best estimate, the accrual is established at the low end of the estimated reasonable range in accordance with U.S. generally accepted accounting principles. Litigation and environmental accruals are established only for identified and/or asserted claims; future claims, therefore, could give rise to increases to the accruals. The accruals are adjusted as facts and circumstances change, as well as for changes in our strategies or the pertinent regulatory requirements. Since these accruals are
38
estimates, the ultimate resolution may be greater or less than the established accrual balance for a variety of reasons, including court decisions, additional discovery, inflation levels, cost control efforts, and resolution of similar cases. Changes to the accruals would then result in an additional charge or credit to the income statement in the period when the change is made. Refer to Note J to the Consolidated Financial Statements.
Legal claims may be subject to partial or complete insurance recovery. The accrued liability is recorded at the gross amount of the estimated cost and the insurance recoverable, if any, is recorded as an asset and is not netted against the liability. The accrued legal liability includes the estimated indemnity cost only, if any, to resolve the claim through a settlement or court verdict. The legal defense costs are not included in the accrual and are expensed in the period incurred, with the level of expense in a given year affected by the number and types of claims we are actively defending.
Non-employee claims for beryllium disease made prior to 2022 where any of the alleged exposure period is prior to year-end 2007 are covered by insurance. The insurance covers defense costs and indemnity payments (resulting from settlements or court verdicts) and is subject to a $1.0 million annual deductible. In 2014 and 2013, defense and indemnity costs were less than the deductible.
Pensions. Carrying values of the defined benefit pension plan assets and liabilities are determined on an actuarial basis using numerous actuarial and financial assumptions. Differences between the assumptions and current period actual results are typically deferred into the net pension asset or liability value and amortized in the Consolidated Statement of Income under established guidelines. The deferral process generally reduces the volatility of the recognized net pension asset or liability and current period income or expense. Unrealized gains or losses are recorded in other comprehensive income (OCI), a component of shareholders’ equity.
Management, in conjunction with our actuaries, annually review key pension plan assumptions, including the expected return on plan assets, the discount rate, the average projected wage rate increase, and mortality levels, against actual results, trends, Company strategies, interest rate curves, the current and projected investment environment, industry standards, and other regulations, and make adjustments accordingly. The actuaries will make calculations and annually adjust various assumptions to reflect changes in demographics and other factors, including employee turnover, as warranted. These adjustments may then lead to a higher or lower expense in future periods.
We establish the discount rate used to determine the present value of the projected and accumulated benefit obligation at the end of each year based upon the available market rates for high quality, fixed income investments whose maturities match the plan’s projected cash flows. An increase to the discount rate would reduce the present value of the projected benefit obligation and future pension expense and, conversely, a lower discount rate would raise the benefit obligation and future pension expense. For our domestic defined benefit pension plan, we elected to use a discount rate of 4.0% as of December 31, 2014, a decrease from the 4.875% assumption as of December 31, 2013.
Our pension plan investment strategies are governed by a policy adopted by the Board of Directors. A senior management team oversees a group of outside investment analysts and brokerage firms that implement these strategies. The future return on pension assets is dependent upon the plan’s asset allocation, which changes from time to time, and the performance of the underlying investments. As a result of our review of various factors, we used an expected rate of return on plan assets assumption of 7.25% as of December 31, 2014 and December 31, 2013. This assumption is reflective of management’s view of the long-term returns in the market place, as well as changes in risk profiles and available investments. Should the assets earn an average return less than 7.25% over time, in all likelihood the future pension expense would increase. Investment earnings in excess of 7.25% would tend to reduce future expense.
The impact of a change in the discount rate or expected rate of return assumption on pension expense can vary from year to year depending upon the undiscounted liability level, the current discount rate, the asset balance, other changes to the plan, and other factors. If the December 31, 2014 discount rate were reduced by 25 basis points (0.25%) and all other pension assumptions remained constant, then the 2015 projected pension expense would increase by approximately $0.9 million. If the expected rate of return assumption was reduced by 25 basis points and all other pension assumptions remained constant, the 2015 projected pension expense would increase by approximately $0.5 million.
Refer to Note I to the Consolidated Financial Statements for additional details on our pension and other retirement plans.
LIFO Inventory. The prices of certain major raw materials that we use, including copper, nickel, gold, silver, and other precious metals, fluctuate during a given year. Where possible, such changes in material costs, in either direction, are generally reflected in selling price adjustments, particularly with precious metals and copper.
The prices of labor and other factors of production, including supplies and utilities, generally increase with inflation. Portions of these cost increases may be offset by manufacturing improvements and other efficiencies. From time to time, we will revise
39
our billing practices to include an energy surcharge in attempts to recover a portion of our higher energy costs from our customers. However, market factors, alternative materials, and competitive pricing may limit our ability to offset all or a portion of a cost increase with higher prices.
We use the LIFO method for costing the majority of our domestic inventories. Under the LIFO method, inflationary cost increases are charged against the current period cost of goods sold in order to more closely match the cost with the associated revenue. The carrying value of the inventory is based upon older costs and, as a result, the LIFO cost of the inventory on the balance sheet is typically, but not always, lower than it would be under most alternative costing methods. The LIFO cost may also be lower than the current replacement cost of the inventory. The LIFO inventory value tends to be less volatile during years of fluctuating costs than the inventory value would be using other costing methods.
The LIFO impact on the income statement in any given year is dependent upon the inflation rate effect on raw material purchases and manufacturing conversion costs, the level of purchases in a given year, and changes in the inventory mix and quantities.
Deferred Taxes. We record deferred tax assets and liabilities based upon the temporary difference between the financial reporting and tax basis of assets and liabilities. We review the expiration dates of deferred taxes against projected income levels to determine if the deferred taxes will or can be realized. If it is determined that it is more likely than not that a deferred tax asset will not be realized, a valuation allowance would be established for that item. Certain deferrals do not have an expiration date. We will also evaluate deferred tax assets for impairment due to cumulative operating losses by jurisdiction and record a valuation allowance as warranted. A valuation allowance may increase tax expense and reduce net income in the period it is recorded. If a valuation allowance is no longer required, it will reduce tax expense and increase net income in the period that it is reversed.
We had valuation allowances of $4.4 million associated with state and foreign deferred tax assets as of year-end 2014, primarily for net operating loss carryforwards.
Refer to Note Q to the Consolidated Financial Statements for additional deferred tax details.
Unearned revenue. Billings to customers in advance of the shipment of the goods are initially recorded as unearned revenue, which is a liability on our Consolidated Balance Sheets. This liability is subsequently reversed and the revenue, cost of sales, and gross margin are recorded when the goods are shipped, title passes to the customer, and all other revenue recognition criteria are satisfied. The related inventory also remains on our balance sheet until these revenue recognition criteria are met. Advanced billings are typically made in association with products with long manufacturing times and/or products paid with funds from a customer’s contract with the government. Billings in advance of the shipments allow us to collect cash earlier than billing at the time of the shipment and, therefore, the collected cash can be used to reduce our investment in working capital. The unearned revenue balance was $4.9 million as of year-end 2014.
Unearned income. Expenditures for capital equipment to be reimbursed under the Title III contract with the government were initially recorded in construction in process. Reimbursements from the government for those expenditures were recorded in unearned income as a liability on the Consolidated Balance Sheets. The total cost of the assets to be constructed under this contract included costs reimbursed by the government as well as costs borne by us. The assets were placed in service and capitalized in 2012. Depreciation expense was calculated and recorded based upon the assets’ total cost and estimated useful lives. The unearned income liability is reduced and credited to cost of sales on a ratable basis with the annual depreciation expense on the associated assets. The benefit from reducing the unearned income liability in effect reduces the net expense charged to the income statement to an amount equal to the depreciation on the portion of the cost of the assets borne by us. Depreciation and amortization on the Consolidated Statements of Cash Flows is presented net of the current period reduction in the unearned income liability.
Reimbursements recorded in unearned income for equipment purchased totaled $63.5 million, and the last reimbursement received was in 2012.
We reduced the liability by $4.7 million in 2014 and 2013 and credited cost of sales on the Consolidated Statements of Income in both years. The unearned income balance was $51.8 million as of December 31, 2014 and $56.5 million as of December 31, 2013.
Precious metal physical inventory counts. We take and record the results of a physical inventory count of our precious metals on a quarterly basis. Our precious metal operations include a refinery that processes precious metal-containing scrap and other materials from our customers as well as our own internally generated scrap. We also outsource portions of our refining requirements to other vendors, particularly those materials with longer processing times. The precious metal content within these various refine streams may be in solutions, sludges, and other non-homogeneous forms and can vary over time based upon the input materials, yield rates, and other process parameters. The determination of the weight of the precious metal content within the refine streams as part of a physical inventory count requires the use of estimates and calculations based upon assays, assumed
40
recovery percentages developed from actual historical data and other analyses, the total estimated volumes of solutions and other materials within the refinery, data from our refine vendors, and other factors. The resulting calculated weight of the precious metals in our refine operations may differ, in either direction, from what our records indicate that we should have on hand, which would then result in an adjustment to our pre-tax income in the period when the physical inventory was taken and the related estimates were made.
Derivatives. We may use derivative financial instruments to hedge our foreign currency, commodity and precious metal price, and interest rate exposures. We apply hedge accounting when an effective hedge relationship can be documented and maintained. The effective portion of the change in a cash flow hedge’s fair value is recorded in other comprehensive income, a component of shareholders’ equity, until the underlying hedged item matures. If a hedge does not qualify as effective, changes in its fair value are recorded against income in the current period. If a derivative is deemed to be a hedge of the fair value of a balance sheet item, the change in the derivative’s value will be recorded in income and will offset the change in the fair value of the hedged item to the extent that the hedge is effective.
We secure derivatives with the intention of hedging existing or forecasted transactions only and do not engage in speculative trading or holding derivatives for investment purposes. Hedge contracts are typically held until maturity unless there is a change in the underlying hedged transaction. Our annual budget, quarterly forecasts, monthly estimates, customer agreements, and other analyses serve as the basis for determining forecasted transactions. The use of derivatives is governed by policies established by the Audit Committee of the Board of Directors. These policies provide guidance on the allowable types of hedge contracts, the allowable duration of the contracts, the maximum allowable notional amount of the outstanding contracts, and other related matters. Hedge contracts are approved by senior financial managers at our corporate office. The amount of derivatives outstanding at a particular point in time may also be limited by the availability of credit from financial institutions.
Our practice has been to secure hedge contracts denominated in the same manner as the underlying exposure; for example, a yen exposure will only be hedged with a yen contract and not with a surrogate currency and a silver exposure will only be hedged with a silver contract and not a gold contract. We also typically secure contracts through financial institutions that are already part of our bank group.
Refer to Note H to the Consolidated Financial Statements and Item 7A “Quantitative and Qualitative Disclosures About Market Risk”.
41
OUTLOOK
The Company made significant progress in 2014. The success of new product development and manufacturing technology has yielded a number of new products which are beginning to gain momentum in a myriad of customer applications. These new products include optical coatings for 3D gesture control, wafer-level processing for infrared and sensing, EStainless, and Cupack Power RF packages.
The outlook for the major markets we serve is solid in the near term with energy being the one end market that may experience a significant downturn in 2015. Because of high-end performance characteristics, our materials continue to be the product of choice in a wide range of applications and end markets. Our products serve a number of applications that demand high quality and high reliability in consumer electronics, industrial components, medical, automotive electronics, energy, telecommunications infrastructure, defense, and commercial aerospace, and we have a well-established presence in these end markets.
We face a challenge in the ongoing trend of lower defense spending. While portions of our defense applications tend to be long-term strategic programs that are not as affected by current changes in spending budgets, other portions of our defense business have declined due to project delays and/or spending cut backs.
We also face pressures from our customers and downstream consumers to reduce the cost of the final product. Given the relatively higher price of our materials, particularly our precious metal products, customers are attempting to change designs to utilize lower quantities of our materials or electing to use lower-performing materials in some cases.
To counter balance these trends and to further grow our sales and the breadth of our product reach, we have an active pipeline of new product development and technologies that are being designed to capitalize on our materials’ strengths. We believe that these new products and applications will be a key to our growth in the near term, based on our differentiated products with leading positions in long-term global growth markets.
We expect that sales for telecommunications infrastructure will be stronger in 2015 as compared to 2014 due to the global buildout of 4G and undersea cable.
Offsetting the strength of our new product pipeline, we expect to encounter headwinds in 2015. Our domestic defined benefit pension expense will be higher due to the lower discount rate used to measure the liability as of December 31, 2014, as well as new mortality rate assumptions that assume retirees are living longer. There is a risk that the U.S. dollar remains strong or continues to strengthen, which could reduce overall net sales and profits generated from our international operations. In addition, there is the possibility that select markets may experience softness, including the energy and defense end markets, and there are slower growth forecasts for Asia and Europe.
Overall, we believe our profitability will improve in 2015 as compared to 2014 due to an expected increase in value-added sales, sales from new products, and other factors.
42
Item 7A. | QUANTITATIVE AND QUALITATIVE DISCLOSURES ABOUT MARKET RISK |
We are exposed to precious metal and commodity price, interest rate, foreign exchange rate, and utility cost differences. While the degree of exposure varies from year to year, our methods and policies designed to manage these exposures have remained fairly consistent over time. Generally, we attempt to minimize the effects of these exposures on our pre-tax income and cash flows through the use of natural hedges, which include pricing strategies, borrowings denominated in the same terms as the exposed asset, off-balance sheet financing arrangements, and other methods. Where we cannot use a natural hedge, we may use derivative financial instruments to minimize the effects of these exposures when practical and cost efficient. The use of off-balance sheet financing arrangements and derivative financial instruments is subject to policies approved by the Audit Committee of the Board of Directors with oversight provided by a group of senior financial managers at our corporate office.
Precious metals. We use gold and other precious metals in manufacturing various products. To reduce the exposure to market price changes, the majority of our precious metal requirements are maintained on a consigned inventory basis. We purchase the metal out of consignment from our suppliers when it is ready to ship to a customer as a finished product. Our purchase price forms the basis for the price charged to the customer for the precious metal content and, therefore, the current cost is matched to the selling price, and the price exposure is minimized.
We are charged a consignment fee by the financial institutions that own the precious metals. This fee is a function of the market price of the metal, the quantity of metal we have on hand, and the rate charged by the institution. Because of market forces and competition, the fee can only be charged to customers in a limited case-by-case basis. Should the market price of precious metals that we have on consignment increase by 20% from the prices on December 31, 2014, the additional pre-tax cost to us as a result of an increase in the consignment fee would be approximately $0.9 million on an annual basis. This calculation assumes no changes in the quantity of metal held on consignment or the underlying fee and that none of the additional fees are charged to customers.
To further limit price and financing rate exposures, under some circumstances, we will require customers to furnish their own metal for processing. Customers may also elect to provide their own material for us to process on a toll basis as opposed to purchasing our material.
The available capacity of our existing credit lines to consign precious metals is a function of the quantity and price of the metals on hand. As prices increase, a given quantity of metal will utilize a larger proportion of the existing credit lines. A significant prolonged increase in metal prices could result in our credit lines being fully utilized, and, absent securing additional credit line capacity from financial institutions, could require us to purchase precious metals rather than consign them, require customers to supply their own metal and/or force us to turn down additional business opportunities. If we were in a significant precious metal ownership position, we might elect to use derivative financial instruments to hedge the potential price exposure. The cost to finance and potentially hedge the purchased inventory may also be higher than the consignment fee. The financial statement impact of the risk from rising metal prices impacting our credit availability cannot be estimated at the present time.
In certain circumstances, we may elect to fix the price of precious metals for a customer for a stated quantity over a specified period of time. In those cases, we may secure hedge contracts whose terms match the terms in the agreement with our customer so that the gain or loss on the contract with the customer due to subsequent movements in the precious metal price will generally be offset by a gain or loss on the hedge contract. At December 31, 2014, we had no such hedge contracts outstanding.
Copper. We also use copper in our production processes. When possible, fluctuations in the purchase price of copper are passed on to customers in the form of price adders or reductions. While over time our price exposure to copper is generally in balance, there can be a lag between the change in our cost and the pass-through to our customers, resulting in higher or lower margins in a given period.
We consign a portion of our copper inventory requirements. As with precious metals, the available capacity under the existing lines is a function of the quantity and price of metal on hand. Should the market cost of copper increase by 20% from the price as of December 31, 2014, the additional pre-tax cost to us as a result of an increase in the consignment fee would be approximately $0.2 million on an annual basis. This calculation assumes no changes in the quantity of inventory or the underlying fee and that none of the additional fees are charged to customers.
Lower of cost or market. In our manufacturing processes, we use various metals that are not widely used by others or actively traded and, therefore, there is no established efficient market for derivative financial instruments that could be used to effectively hedge the related price exposures. For certain applications, our pricing practice with respect to these metals is to establish the selling price based upon our cost to purchase the material, limiting our price exposure. However, the inventory carrying value may be exposed to market fluctuations. The inventory value is maintained at the lower of cost or market and if the market value were to drop below the carrying value, the inventory would have to be reduced accordingly and a charge recorded against cost of sales. This risk is mainly associated with long manufacturing lead-time items and with sludges and scrap materials,
43
which generally have longer processing times to be refined or processed into a usable form for further manufacturing and are typically not covered by specific sales orders from customers. We did not record any material lower of cost or market charges in 2014, 2013, or 2012 as a result of market price fluctuations of metals in our inventories.
Interest rates. We are exposed to changes in interest rates on portions of our debt and cash balances. This interest rate exposure is managed by maintaining a combination of short-term and long-term debt and variable and fixed rate instruments. We may also use interest rate swaps to fix the interest rate on variable rate obligations, as we deem appropriate. There were no interest rate derivatives outstanding as of December 31, 2014. Excess cash is typically invested in high quality instruments that mature in 90 days or less. Investments are made in compliance with policies approved by the Board of Directors. Assuming no change in the amount or make-up of the outstanding debt as of December 31, 2014, a 200 basis point movement upwards in the interest rates on our variable rate debt would increase our annual interest expense by $0.4 million.
Foreign currencies. Portions of our international operations sell products priced in foreign currencies, mainly the euro and yen, while the majority of these products’ costs are incurred in U.S. dollars. We are exposed to currency movements in that if the U.S. dollar strengthens, the translated value of the foreign currency sale and the resulting margin on that sale will be reduced. We typically cannot increase the price of our products for short-term exchange rate movements because of local competition. To minimize this exposure, we may purchase foreign currency forward contracts, options, and collars in compliance with approved policies. If the dollar strengthened, the decline in the translated value of our margins would be at least partially offset by a gain on the hedge contract. A decrease in the value of the dollar would result in larger margins but potentially a loss on the contract, depending upon the method used to hedge the exposure. Our current policy limits our hedges to 80% or less of the forecasted exposure.
The notional value of the outstanding currency contracts was $40.1 million as of December 31, 2014. If the dollar weakened 10% against the currencies we have hedged from the December 31, 2014 exchange rates, the reduced gain and/or increased loss on the outstanding contracts as of December 31, 2014 would reduce pre-tax profits by approximately $3.7 million in 2015. This calculation does not take into account the increase in margins as a result of translating foreign currency sales at the more favorable exchange rates, any changes in margins from potential volume fluctuations caused by currency movements, or the translation effects on any other foreign currency denominated income statement or balance sheet item.
Utilities. The cost of natural gas and electricity used in our operations may vary from year to year and from season to season. We attempt to minimize these fluctuations and the exposure to higher costs by utilizing fixed price agreements of set durations, when deemed appropriate, obtaining competitive bidding between regional energy suppliers and other methods.
Economy. We are exposed to changes in global economic conditions and the potential impact those changes may have on various facets of our business. We have a program in place to closely monitor the credit worthiness and financial condition of our key providers of financial services, including our bank group and insurance carriers, as well as the credit worthiness of customers and vendors, and have various contingency plans in place.
We negotiated extensions to our bank lines for credit, consignment, and hedging purposes during 2013. These lines are established with a number of different banks in order to mitigate our exposure with any one financial institution. All of the banks in our bank group had credit in good standing as of year-end 2014. The financial statement impact from the risk of one or more of the banks in our bank group reducing our lines due to their insolvency or other causes cannot be estimated at the present time.
44
Item 8. | FINANCIAL STATEMENTS AND SUPPLEMENTARY DATA |
Financial Statements | Page |
Management’s Report on Internal Control over Financial Reporting | |
Reports of Independent Registered Public Accounting Firm | |
Consolidated Statements of Income for the Years Ended December 31, 2014, 2013, and 2012 | |
Consolidated Statements of Comprehensive Income for the Years Ended December 31, 2014, 2013, and 2012 | |
Consolidated Statements of Cash Flows for the Years Ended December 31, 2014, 2013, and 2012 | |
Consolidated Balance Sheets as of December 31, 2014 and 2013 | |
Consolidated Statements of Shareholders’ Equity for the Years Ended December 31, 2014, 2013, and 2012 | |
Notes to Consolidated Financial Statements | |
45
Management’s Report on Internal Control over Financial Reporting
The management of Materion Corporation and subsidiaries are responsible for establishing and maintaining adequate internal controls over financial reporting, as such term is defined in Exchange Act Rules 13a-15(f) and 15d-15(f). Materion Corporation and subsidiaries’ internal control system was designed to provide reasonable assurance to the Company’s management and Board of Directors regarding the preparation and fair presentation of published financial statements. All internal control systems, no matter how well designed, have inherent limitations. Therefore, even those systems determined to be effective can provide only reasonable assurance with respect to financial statement preparation and presentation.
Materion Corporation and subsidiaries’ management assessed the effectiveness of the Company’s internal control over financial reporting as of December 31, 2014. In making this assessment, it used the framework set forth by the Committee of Sponsoring Organizations of the Treadway Commission (the COSO criteria) in Internal Control - Integrated Framework (2013). Based on our assessment we believe that, as of December 31, 2014, the Company’s internal control over financial reporting is effective.
The effectiveness of our internal control over financial reporting as of December 31, 2014 has been audited by Ernst & Young LLP, an independent registered public accounting firm, as stated in their report.
/S/ RICHARD J. HIPPLE | |
Richard J. Hipple | |
Chairman, President and Chief Executive Officer | |
/S/ JOSEPH P. KELLEY | |
Joseph P. Kelley | |
Vice President, Finance and Chief Financial Officer | |
46
Report of Independent Registered Public Accounting Firm
The Board of Directors and Shareholders of Materion Corporation
We have audited Materion Corporation and subsidiaries’ internal control over financial reporting as of December 31, 2014, based on criteria established in Internal Control-Integrated Framework issued by the Committee of Sponsoring Organizations of the Treadway Commission “(2013 framework)” (the COSO criteria). Materion Corporation and subsidiaries’ management is responsible for maintaining effective internal control over financial reporting, and for its assessment of the effectiveness of internal control over financial reporting included in the accompanying Management’s Report on Internal Control over Financial Reporting. Our responsibility is to express an opinion on the company’s internal control over financial reporting based on our audit.
We conducted our audit in accordance with the standards of the Public Company Accounting Oversight Board (United States). Those standards require that we plan and perform the audit to obtain reasonable assurance about whether effective internal control over financial reporting was maintained in all material respects. Our audit included obtaining an understanding of internal control over financial reporting, assessing the risk that a material weakness exists, testing and evaluating the design and operating effectiveness of internal control based on the assessed risk, and performing such other procedures as we considered necessary in the circumstances. We believe that our audit provides a reasonable basis for our opinion.
A company’s internal control over financial reporting is a process designed to provide reasonable assurance regarding the reliability of financial reporting and the preparation of financial statements for external purposes in accordance with generally accepted accounting principles. A company’s internal control over financial reporting includes those policies and procedures that (1) pertain to the maintenance of records that, in reasonable detail, accurately and fairly reflect the transactions and dispositions of the assets of the company; (2) provide reasonable assurance that transactions are recorded as necessary to permit preparation of financial statements in accordance with generally accepted accounting principles, and that receipts and expenditures of the company are being made only in accordance with authorizations of management and directors of the company; and (3) provide reasonable assurance regarding prevention or timely detection of unauthorized acquisition, use, or disposition of the company’s assets that could have a material effect on the financial statements.
Because of its inherent limitations, internal control over financial reporting may not prevent or detect misstatements. Also, projections of any evaluation of effectiveness to future periods are subject to the risk that controls may become inadequate because of changes in conditions, or that the degree of compliance with the policies or procedures may deteriorate.
In our opinion, Materion Corporation and subsidiaries maintained, in all material respects, effective internal control over financial reporting as of December 31, 2014, based on the COSO criteria.
We also have audited, in accordance with the standards of the Public Company Accounting Oversight Board (United States), the consolidated balance sheets as of December 31, 2014 and 2013, and the related consolidated statements of income, comprehensive loss, shareholders’ equity, and cash flows for each of the three years in the period ended December 31, 2014 of Materion Corporation and subsidiaries and our report dated February 27, 2015 expressed an unqualified opinion thereon.
/s/ Ernst & Young LLP
Cleveland, Ohio
February 27, 2015
47
Report of Independent Registered Public Accounting Firm
The Board of Directors and Shareholders of Materion Corporation
We have audited the accompanying consolidated balance sheets of Materion Corporation and subsidiaries as of December 31, 2014 and 2013, and the related consolidated statements of income, comprehensive income, shareholders' equity and cash flows for each of the three years in the period ended December 31, 2014. Our audits also included the financial statement schedule listed in the Index at Item 15(a). These financial statements and schedule are the responsibility of the Company's management. Our responsibility is to express an opinion on these financial statements and schedule based on our audits.
We conducted our audits in accordance with the standards of the Public Company Accounting Oversight Board (United States). Those standards require that we plan and perform the audit to obtain reasonable assurance about whether the financial statements are free of material misstatement. An audit includes examining, on a test basis, evidence supporting the amounts and disclosures in the financial statements. An audit also includes assessing the accounting principles used and significant estimates made by management, as well as evaluating the overall financial statement presentation. We believe that our audits provide a reasonable basis for our opinion.
In our opinion, the financial statements referred to above present fairly, in all material respects, the consolidated financial position of Materion Corporation and subsidiaries at December 31, 2014 and 2013, and the consolidated results of its operations and its cash flows for each of the three years in the period ended December 31, 2014, in conformity with U.S. generally accepted accounting principles. Also, in our opinion, the related financial statement schedule, when considered in relation to the basic financial statements taken as a whole, presents fairly in all material respects the information set forth therein.
We also have audited, in accordance with the standards of the Public Company Accounting Oversight Board (United States), Materion Corporation and subsidiaries’ internal control over financial reporting as of December 31, 2014, based on criteria established in Internal Control-Integrated Framework issued by the Committee of Sponsoring Organizations of the Treadway Commission (2013 framework) and our report dated February 27, 2015 expressed an unqualified opinion thereon.
/s/ Ernst & Young LLP
Cleveland, Ohio
February 27, 2015
48
Materion Corporation and Subsidiaries
Years Ended December 31, 2014, 2013, and 2012
Consolidated Statements of Income
(Thousands except per share amounts) | 2014 | 2013 | 2012 | ||||||||
Net sales | $ | 1,126,890 | $ | 1,166,882 | $ | 1,273,078 | |||||
Cost of sales | 920,987 | 978,904 | 1,074,295 | ||||||||
Gross margin | 205,903 | 187,978 | 198,783 | ||||||||
Selling, general, and administrative expense | 137,118 | 133,253 | 133,893 | ||||||||
Research and development expense | 12,850 | 13,432 | 12,505 | ||||||||
Other — net | (1,022 | ) | 14,462 | 15,609 | |||||||
Operating profit | 56,957 | 26,831 | 36,776 | ||||||||
Interest expense — net | 2,787 | 3,036 | 3,134 | ||||||||
Income before income taxes | 54,170 | 23,795 | 33,642 | ||||||||
Income tax expense | 12,449 | 4,088 | 8,978 | ||||||||
Net income | $ | 41,721 | $ | 19,707 | $ | 24,664 | |||||
Basic earnings per share: | |||||||||||
Net income per share of common stock | $ | 2.04 | $ | 0.96 | $ | 1.21 | |||||
Diluted earnings per share: | |||||||||||
Net income per share of common stock | $ | 2.00 | $ | 0.94 | $ | 1.19 | |||||
Cash dividends per share | $ | 0.335 | $ | 0.315 | $ | 0.225 | |||||
Weighted-average number of shares of common stock outstanding | |||||||||||
Basic | 20,461 | 20,571 | 20,418 | ||||||||
Diluted | 20,810 | 20,895 | 20,679 | ||||||||
Refer to Notes to Consolidated Financial Statements.
49
Materion Corporation and Subsidiaries
Years Ended December 31, 2014, 2013, and 2012
Consolidated Statements of Comprehensive Income
(Thousands) | 2014 | 2013 | 2012 | ||||||||
Net income | $ | 41,721 | $ | 19,707 | $ | 24,664 | |||||
Other comprehensive income: | |||||||||||
Foreign currency translation adjustment | (4,440 | ) | (3,790 | ) | (870 | ) | |||||
Derivative and hedging activity, net of tax benefit (expense) of ($1,318), $160, and $385 | 2,244 | (296 | ) | (715 | ) | ||||||
Pension and post-employment benefit adjustment, net of tax of $11,626, ($17,613), and $7,676 | (20,153 | ) | 32,627 | (14,629 | ) | ||||||
Net change in accumulated other comprehensive income | (22,349 | ) | 28,541 | (16,214 | ) | ||||||
Comprehensive income | $ | 19,372 | $ | 48,248 | $ | 8,450 | |||||
Refer to Notes to Consolidated Financial Statements.
50
Materion Corporation and Subsidiaries
Years Ended December 31, 2014, 2013, and 2012
Consolidated Statements of Cash Flows
(Thousands) | 2014 | 2013 | 2012 | ||||||||
Cash flows from operating activities: | |||||||||||
Net income | $ | 41,721 | $ | 19,707 | $ | 24,664 | |||||
Adjustments to reconcile net income to net cash provided from operating activities: | |||||||||||
Depreciation, depletion, and amortization | 42,721 | 41,649 | 37,046 | ||||||||
Amortization of deferred financing costs in interest expense | 795 | 679 | 649 | ||||||||
Stock-based compensation expense | 5,446 | 5,741 | 5,889 | ||||||||
Deferred tax (benefit) expense | (5,495 | ) | (2,442 | ) | (2,462 | ) | |||||
Changes in assets and liabilities net of acquired assets and liabilities: | |||||||||||
Decrease (increase) in accounts receivable | (2,066 | ) | 12,116 | (4,716 | ) | ||||||
Decrease (increase) in inventory | (30,412 | ) | (8,241 | ) | (18,880 | ) | |||||
Decrease (increase) in prepaid and other current assets | (191 | ) | 6,647 | 483 | |||||||
Increase (decrease) in accounts payable and accrued expenses | 6,164 | (7,739 | ) | 1,472 | |||||||
Increase (decrease) in unearned revenue | 4,401 | (1,064 | ) | (1,491 | ) | ||||||
Increase (decrease) in interest and taxes payable | 1,161 | 2,391 | (2,324 | ) | |||||||
Increase (decrease) in long-term liabilities | (7,348 | ) | 6,879 | (5,053 | ) | ||||||
Other — net | 3,384 | (401 | ) | 3,343 | |||||||
Net cash provided from operating activities | 60,281 | 75,922 | 38,620 | ||||||||
Cash flows from investing activities: | |||||||||||
Payments for purchase of property, plant, and equipment | (29,312 | ) | (27,848 | ) | (34,088 | ) | |||||
Payments for mine development | (1,247 | ) | (4,776 | ) | (10,573 | ) | |||||
Reimbursement for capital spending under government contract | — | — | 991 | ||||||||
Payments for purchase of business less cash received | — | — | (3,894 | ) | |||||||
Proceeds from sale of property, plant, and equipment | 3,090 | 22 | — | ||||||||
Other investments — net | (2 | ) | 15 | 4,201 | |||||||
Net cash (used in) investing activities | (27,471 | ) | (32,587 | ) | (43,363 | ) | |||||
Cash flows from financing activities: | |||||||||||
Proceeds from issuance (repayment) of short-term debt | (6,291 | ) | (13,692 | ) | 8,594 | ||||||
Proceeds from issuance of long-term debt | 33,332 | 70,423 | 32,403 | ||||||||
Repayment of long-term debt | (38,945 | ) | (86,036 | ) | (27,986 | ) | |||||
Principal payments under capital lease obligations | (666 | ) | (657 | ) | (749 | ) | |||||
Cash dividends paid | (6,865 | ) | (6,497 | ) | (4,615 | ) | |||||
Deferred financing costs | — | (1,587 | ) | — | |||||||
Repurchase of common stock | (22,282 | ) | — | (119 | ) | ||||||
Issuance of common stock under stock option plans | 359 | 1,163 | 158 | ||||||||
Tax benefit from stock compensation realization | 477 | 711 | 817 | ||||||||
Net cash (used in) provided from financing activities | (40,881 | ) | (36,172 | ) | 8,503 | ||||||
Effects of exchange rate changes | (1,553 | ) | (445 | ) | 41 | ||||||
Net change in cash and cash equivalents | (9,624 | ) | 6,718 | 3,801 | |||||||
Cash and cash equivalents at beginning of period | 22,774 | 16,056 | 12,255 | ||||||||
Cash and cash equivalents at end of period | $ | 13,150 | $ | 22,774 | $ | 16,056 | |||||
Refer to Notes to Consolidated Financial Statements.
51
Materion Corporation and Subsidiaries
December 31, 2014 and 2013
Consolidated Balance Sheets
(Thousands) | 2014 | 2013 | |||||
Assets | |||||||
Current assets | |||||||
Cash and cash equivalents | $ | 13,150 | $ | 22,774 | |||
Accounts receivable (net of allowance of $1,578 for 2014 and $1,421 for 2013) | 112,780 | 113,012 | |||||
Inventories | 232,409 | 232,800 | |||||
Prepaid expenses | 14,953 | 16,353 | |||||
Deferred income taxes | 13,402 | 10,325 | |||||
Total current assets | 386,694 | 395,264 | |||||
Long-term deferred income taxes | 17,722 | 5,941 | |||||
Property, plant, and equipment | 800,671 | 782,879 | |||||
Less allowances for depreciation, depletion, and amortization | (553,083 | ) | (520,986 | ) | |||
Property, plant, and equipment — net | 247,588 | 261,893 | |||||
Intangible assets | 18,559 | 24,248 | |||||
Other assets | 4,781 | 3,874 | |||||
Goodwill | 86,725 | 86,725 | |||||
Total Assets | $ | 762,069 | $ | 777,945 | |||
Liabilities and Shareholders’ Equity | |||||||
Current liabilities | |||||||
Short-term debt | $ | 653 | $ | 35,566 | |||
Accounts payable | 36,239 | 36,556 | |||||
Salaries and wages | 35,448 | 28,202 | |||||
Taxes other than income taxes | 1,306 | 1,527 | |||||
Other liabilities and accrued items | 22,397 | 25,122 | |||||
Income taxes | 3,144 | 1,564 | |||||
Unearned revenue | 4,879 | 479 | |||||
Total current liabilities | 104,066 | 129,016 | |||||
Other long-term liabilities | 18,203 | 16,531 | |||||
Retirement and post-employment benefits | 103,891 | 80,275 | |||||
Unearned income | 51,796 | 56,490 | |||||
Long-term income taxes | 1,750 | 1,576 | |||||
Deferred income taxes | 617 | 1,469 | |||||
Long-term debt | 23,613 | 29,267 | |||||
Shareholders’ equity | |||||||
Serial preferred stock (no par value; 5,000 authorized shares, none issued) | — | — | |||||
Common stock (no par value; 60,000 authorized shares, issued shares of 27,226 for 2014 and 27,164 for 2013) | 202,104 | 197,576 | |||||
Retained earnings | 476,277 | 441,518 | |||||
Common stock in treasury (6,857 shares for 2014 and 6,274 shares for 2013) | (140,938 | ) | (118,151 | ) | |||
Other comprehensive income (loss) | (82,237 | ) | (59,888 | ) | |||
Other equity transactions | 2,927 | 2,266 | |||||
Total shareholders’ equity | 458,133 | 463,321 | |||||
Total Liabilities and Shareholders’ Equity | $ | 762,069 | $ | 777,945 | |||
Refer to Notes to Consolidated Financial Statements.
52
Materion Corporation and Subsidiaries
Years Ended December 31, 2014, 2013, and 2012
Consolidated Statements of Shareholders’ Equity
(Thousands) | Common Stock | Retained Earnings | Common Stock In Treasury | Other Comprehensive Income (Loss) | Other Equity Transactions | Total | |||||||||||||||||
Balance at January 1, 2012 | $ | 185,913 | $ | 408,380 | $ | (118,279 | ) | $ | (72,215 | ) | $ | 2,183 | $ | 405,982 | |||||||||
Net income | — | 24,664 | — | — | — | 24,664 | |||||||||||||||||
Other comprehensive income | — | — | — | (16,214 | ) | — | (16,214 | ) | |||||||||||||||
Cash dividends declared | — | (4,650 | ) | — | — | — | (4,650 | ) | |||||||||||||||
Proceeds from exercise of 16 shares under option plans | 158 | — | — | — | — | 158 | |||||||||||||||||
Income tax benefit from stock compensation realization | 817 | — | — | — | — | 817 | |||||||||||||||||
Repurchase of 6 shares | — | — | (119 | ) | — | — | (119 | ) | |||||||||||||||
Stock-based compensation expense | 5,889 | — | — | — | — | 5,889 | |||||||||||||||||
Shares withheld for employee taxes on equity awards | (1,608 | ) | — | — | — | — | (1,608 | ) | |||||||||||||||
Directors' deferred compensation | — | — | 100 | — | (24 | ) | 76 | ||||||||||||||||
Balance at December 31, 2012 | $ | 191,169 | $ | 428,394 | $ | (118,298 | ) | $ | (88,429 | ) | $ | 2,159 | $ | 414,995 | |||||||||
Net income | — | 19,707 | — | — | — | 19,707 | |||||||||||||||||
Other comprehensive income | — | — | — | 28,541 | — | 28,541 | |||||||||||||||||
Cash dividends declared | — | (6,583 | ) | — | — | — | (6,583 | ) | |||||||||||||||
Proceeds from exercise of 74 shares under option plans | 1,163 | — | — | — | — | 1,163 | |||||||||||||||||
Income tax benefit from stock compensation realization | 711 | — | — | — | — | 711 | |||||||||||||||||
Stock-based compensation expense | 5,741 | — | — | — | — | 5,741 | |||||||||||||||||
Shares withheld for employee taxes on equity awards | (1,208 | ) | — | — | — | — | (1,208 | ) | |||||||||||||||
Directors’ deferred compensation | — | — | 147 | — | 107 | 254 | |||||||||||||||||
Balance at December 31, 2013 | $ | 197,576 | $ | 441,518 | $ | (118,151 | ) | $ | (59,888 | ) | $ | 2,266 | $ | 463,321 | |||||||||
Net income | — | 41,721 | — | — | — | 41,721 | |||||||||||||||||
Other comprehensive income | — | — | — | (22,349 | ) | — | (22,349 | ) | |||||||||||||||
Cash dividends declared | — | (6,962 | ) | — | — | — | (6,962 | ) | |||||||||||||||
Proceeds from exercise of 20 shares under option plans | 359 | — | — | — | — | 359 | |||||||||||||||||
Income tax benefit from stock compensation realization | 477 | — | — | — | — | 477 | |||||||||||||||||
Repurchase of 690 shares | — | — | (22,282 | ) | — | — | (22,282 | ) | |||||||||||||||
Stock-based compensation expense | 5,446 | — | — | — | — | 5,446 | |||||||||||||||||
Shares withheld for employee taxes on equity awards | (1,754 | ) | — | — | — | — | (1,754 | ) | |||||||||||||||
Directors’ deferred compensation | — | — | (505 | ) | — | 661 | 156 | ||||||||||||||||
Balance at December 31, 2014 | $ | 202,104 | $ | 476,277 | $ | (140,938 | ) | $ | (82,237 | ) | $ | 2,927 | $ | 458,133 | |||||||||
Refer to Notes to Consolidated Financial Statements.
53
Materion Corporation and Subsidiaries
Notes to Consolidated Financial Statements
Note A — Significant Accounting Policies
Organization: Materion Corporation (the Company) is a holding company with subsidiaries that have operations in the United States, Europe, and Asia. These operations manufacture advanced engineered materials used in a variety of end markets, including consumer electronics, industrial components, medical, automotive electronics, energy, telecommunications infrastructure, defense, and commercial aerospace. The Company has three reportable segments: Performance Alloys and Composites, Advanced Materials, and Other. Other includes the operating results of our Precision Optics and Large Area Coatings operating segments (collectively referred to as our Precision Coatings group) and unallocated corporate costs.
Refer to Note M to the Consolidated Financial Statements for additional segment details. The Company is vertically integrated and distributes its products through a combination of company-owned facilities and independent distributors and agents.
Use of Estimates: The preparation of financial statements in conformity with accounting principles generally accepted in the United States requires management to make estimates and assumptions that affect the amounts reported in the financial statements and accompanying notes. Actual results may differ from those estimates.
Consolidation: The Consolidated Financial Statements include the accounts of Materion Corporation and its subsidiaries. All of the Company’s subsidiaries are wholly owned as of December 31, 2014. Intercompany accounts and transactions are eliminated in consolidation.
Cash Equivalents: All highly liquid investments with a maturity of three months or less when purchased are considered to be cash equivalents.
Accounts Receivable: An allowance for doubtful accounts is maintained for the estimated losses resulting from the inability of customers to pay the amounts due. The allowance is based upon identified delinquent accounts, customer payment patterns, and other analyses of historical data and trends. The Company extends credit to customers based upon their financial condition, and generally collateral is not required.
Inventories: Inventories are stated at the lower of cost or market. The cost of the majority of domestic inventories is determined using the last-in, first-out (LIFO) method. The remaining inventories are stated principally at average cost.
Property, Plant, and Equipment: Property, plant, and equipment is stated on the basis of cost. Depreciation is computed principally by the straight-line method, except certain assets for which depreciation may be computed by the units-of-production method. The depreciable lives that are used in computing the annual provision for depreciation by class of asset are as follows:
Years | ||
Land improvements | 5 to 25 | |
Buildings | 10 to 40 | |
Leasehold improvements | Life of lease | |
Machinery and equipment | 3 to 15 | |
Furniture and fixtures | 4 to 15 | |
Automobiles and trucks | 2 to 8 | |
Research equipment | 6 to 12 | |
Computer hardware | 3 to 10 | |
Computer software | 3 to 10 | |
An asset acquired under a capital lease will be recorded at the lesser of the present value of the projected lease payments or the fair value of the asset and will be depreciated in accordance with the above schedule. Leasehold improvements will be depreciated over the life of the improvement if it is shorter than the life of the lease. Repair and maintenance costs are expensed as incurred.
Mineral Resources and Mine Development: Property acquisition costs are capitalized as mineral resources on the balance sheet and are depleted using the units-of-production method based upon recoverable proven reserves of the ore body.
Mine development costs at our open pit surface mines include drilling, infrastructure, other related costs to delineate an ore body, and the removal of overburden to initially expose an ore body. Costs incurred before mineralization is classified as proven
54
and probable reserves are expensed and classified as Exploration expense. Capitalization of mine development project costs that meet the definition of an asset begins once mineralization is classified as proven and probable reserves.
Drilling and related costs are capitalized for an ore body where proven and probable reserves exist, and the activities are directed at obtaining additional information on the ore body or converting mineralized material to proven and probable reserves. All other drilling and related costs are expensed as incurred. Drilling costs incurred during the production phase for operational ore control are allocated to inventory costs and then included as a component of costs applicable to sales.
The cost of removing overburden and waste materials to access the ore body at an open-pit mine prior to the production phase are referred to as “development costs.” Development costs are capitalized during the development of an open-pit mine and are capitalized at each pit. These costs are amortized as the ore is extracted using the units-of-production method based upon recoverable proven reserves.
To the extent that the aforementioned costs benefit an entire ore body, the costs are amortized over the estimated useful life of the ore body. Costs incurred to access specific ore blocks or areas that only provide benefit over the life of that area are amortized over the estimated life of that specific ore block area.
Goodwill and Other Intangible Assets: Goodwill is not amortized, but instead reviewed annually as of December 31 of each year, or more frequently under certain circumstances, for impairment. Goodwill is assigned to the reporting unit, which is the operating segment level or one level below the operating segment. Intangible assets with finite lives are amortized using the straight-line method or effective interest method, as applicable, over the periods estimated to be benefited, which is generally 20 years or less. Finite-lived intangible assets are also reviewed for impairment if facts and circumstances warrant.
Asset Impairment: In the event that facts and circumstances indicate that the carrying value of long-lived assets may be impaired, an evaluation of recoverability is performed by comparing the carrying value of the assets to the associated estimated future undiscounted cash flow. If the carrying value exceeds that cash flow, then the assets are written down to their fair values.
Derivatives: The Company recognizes all derivatives on the balance sheet at fair value. If the derivative is designated and effective as a cash flow hedge, changes in the fair value of the derivative are recognized in other comprehensive income (loss), a component of shareholders’ equity, until the hedged item is recognized in earnings. If the derivative is designated as a fair value hedge, changes in fair value are offset against the change in the fair value of the hedged asset, liability, or commitment through earnings. The ineffective portion of a derivative’s change in fair value, if any, is recognized in earnings immediately. If a derivative is not a hedge, changes in its fair value are adjusted through the income statement.
Asset Retirement Obligation: The Company records a liability to recognize the legal obligation to remove an asset at the time the asset is acquired or when the legal liability arises. The liability is recorded for the present value of the ultimate obligation by discounting the estimated future cash flows using a credit-adjusted risk-free interest rate. The liability is accreted over time, with the accretion charged to expense. An asset equal to the fair value of the liability is recorded concurrent with the liability and depreciated over the life of the underlying asset.
Unearned Income: Expenditures for capital equipment to be reimbursed under government contracts are recorded in property, plant, and equipment, while the reimbursements for those expenditures are recorded in unearned income, a liability on the balance sheet. When the assets subject to reimbursement are placed in service, the total cost is depreciated over the useful lives, and the unearned income liability is reduced and credited to cost of sales on the Consolidated Statements of Income ratably with the annual depreciation expense. Depreciation and amortization expense on the Consolidated Statements of Cash Flows is shown net of the associated period reduction in the unearned income liability.
Revenue Recognition: The Company generally recognizes revenue when the goods are shipped and title passes to the customer. The Company requires persuasive evidence that a revenue arrangement exists, delivery of the product has occurred, the selling price is fixed or determinable, and collectibility is reasonably assured before revenue is realized and earned. Billings in advance of the shipment of the goods are recorded as unearned revenue, which is a liability on the balance sheet. Revenue is recognized for these transactions when the goods are shipped and all other revenue recognition criteria are met.
Shipping and Handling Costs: The Company records shipping and handling costs for products sold to customers in cost of sales on the Consolidated Statements of Income.
Advertising Costs: The Company expenses all advertising costs as incurred. Advertising costs were $1.2 million in 2014, $1.1 million in 2013, and $1.2 million in 2012.
Stock-based Compensation: All stock-based compensation instruments, including options, stock appreciation rights, restricted stock, and performance restricted stock, are viewed collectively when determining the accounting treatment of the tax considerations upon the realization of the benefit by the recipient.
55
Capitalized Interest: Interest expense associated with active capital asset construction and mine development projects is capitalized and amortized over the future useful lives of the related assets.
Income Taxes: The Company uses the liability method in measuring the provision for income taxes and recognizing deferred tax assets and liabilities on the balance sheet. The Company will record a valuation allowance to reduce the deferred tax assets to the amount that is more likely than not to be realized, as warranted by current facts and circumstances. The Company applies a more-likely-than-not recognition threshold for all tax uncertainties and will record a liability for those tax benefits that have a less than 50% likelihood of being sustained upon examination by the taxing authorities.
Net Income Per Share: Basic earnings per share (EPS) is computed by dividing income available to common stockholders by the weighted-average number of common shares outstanding for the period. Diluted EPS reflects the assumed conversion of all dilutive common stock equivalents as appropriate using the treasury stock method.
Reclassification: Certain amounts in prior years have been reclassified to conform to the 2014 consolidated financial statement presentation.
New Pronouncements: In May 2014, the Financial Accounting Standards Board (FASB) issued an Accounting Standards Update, Revenue from Contracts with Customers, which supersedes previous revenue recognition guidance. The new standard requires that a company recognize revenue when it transfers promised goods or services to customers in an amount that reflects the consideration the Company expects to receive in exchange for those goods or services. Companies will need to use more judgment and estimates than under the guidance currently in effect, including estimating the amount of variable revenue to recognize over each identified performance obligation. Additional disclosures will be required to help users of financial statements understand the nature, amount, and timing of revenue and cash flows arising from contracts. The new standard will become effective for the Company beginning with the first quarter of 2017 and can be adopted either retrospectively to each prior reporting period presented or as a cumulative effect adjustment as of the date of adoption. The Company is currently evaluating the impact of adopting this new guidance on the consolidated financial statements.
In July 2013, the FASB issued new accounting guidance that requires an entity to net its liability for unrecognized tax positions against a net operating loss carryforward, a similar tax loss, or a tax credit carryforward when settlement in this manner is available under the tax law. The provisions of this new guidance were effective in 2014. Adoption of this new guidance did not have a material impact on the Company's consolidated financial statements.
Note B — Acquisitions
In the first quarter of 2012, the Company acquired all of the outstanding stock of Aerospace Metal Composites Limited (AMC) of Farnborough, England for $3.3 million, net of $1.5 million of cash acquired. This acquisition was financed with a combination of cash on hand and borrowings under the existing revolving credit agreement. AMC manufactures ultrafine particulate reinforced metal matrix composites, primarily aluminum materials, that are used in performance automotive, aerospace, defense, and precision high-speed machinery applications. Goodwill was valued at $1.9 million.
The result of the above acquired business was included in the Company’s consolidated financial statements since the acquisition date. The AMC acquisition is included in the Performance Alloys and Composites segment. Refer to Note E for additional information on the intangible assets associated with this acquisition.
Note C — Inventories
Inventories on the Consolidated Balance Sheets are summarized as follows:
December 31, | ||||||||
(Thousands) | 2014 | 2013 | ||||||
Principally average cost: | ||||||||
Raw materials and supplies | $ | 39,559 | $ | 39,201 | ||||
Work in process | 155,377 | 152,645 | ||||||
Finished goods | 37,473 | 40,954 | ||||||
Net inventories | $ | 232,409 | $ | 232,800 | ||||
56
Average cost approximates current cost. Gross inventories accounted for using the LIFO method totaled $183.9 million at December 31, 2014 and $175.6 million at December 31, 2013. Net inventory includes a LIFO reserve balance of $53.7 million as of December 31, 2014, and $58.2 million as of December 31, 2013. The use of the LIFO method results in a better matching of revenue and costs. The liquidation of LIFO inventory layers reduced cost of sales by $0.1 million in 2014 and $1.0 million in 2013.
The Company repaid a precious metal-denominated loan totaling $28.7 million as of December 31, 2013 in the third quarter of 2014. This debt reduction was completed by transferring 23,781 ounces of gold held in inventory to the lender as repayment for the outstanding short-term debt, and this transaction was treated as a non-cash item in the Consolidated Statement of Cash Flows.
The December 31, 2013 balance reflects a reclassification of $19.4 million from prepaid assets to inventory. The Company determined it was more appropriate to reflect the fair market value adjustment related to certain of its precious metal inventory as inventory. The reclassification did not impact previously reported total current assets or total assets in the accompanying Consolidated Balance Sheets, net income in the Consolidated Statements of Income, or net cash provided by operating activities in the Consolidated Statements of Cash Flows.
Note D — Property, Plant, and Equipment
Property, plant, and equipment on the Consolidated Balance Sheets is summarized as follows:
December 31, | ||||||||
(Thousands) | 2014 | 2013 | ||||||
Land | $ | 7,458 | $ | 8,097 | ||||
Buildings | 129,673 | 128,187 | ||||||
Machinery and equipment | 579,906 | 569,617 | ||||||
Software | 34,525 | 31,571 | ||||||
Construction in progress | 16,818 | 14,363 | ||||||
Allowances for depreciation | (534,908 | ) | (510,718 | ) | ||||
Subtotal | 233,472 | 241,117 | ||||||
Capital leases | 10,912 | 10,912 | ||||||
Allowances for depreciation | (1,988 | ) | (1,728 | ) | ||||
Subtotal | 8,924 | 9,184 | ||||||
Mineral resources | 4,980 | 4,979 | ||||||
Mine development | 16,399 | 15,153 | ||||||
Allowances for amortization and depletion | (16,187 | ) | (8,540 | ) | ||||
Subtotal | 5,192 | 11,592 | ||||||
Property, plant, and equipment — net | $ | 247,588 | $ | 261,893 | ||||
The Company had a Title III contract with the Department of Defense (DoD) for the design and development of a primary beryllium production facility. Construction of the facility would not have been economically feasible without assistance from the government. The cost of the project, which included the equipment and building and project design, administrative, and other general costs that were not capitalizable as fixed assets, totaled approximately $104.9 million. The Company capitalized $14.7 million of fixed assets and $10.0 million of capital leases as a portion of its cost share for the project. Reimbursements received by the Company from the DoD included $63.5 million for its share of the cost of equipment that was purchased by the Company and installed in the facility. The cost paid by the Company was recorded in property, plant and equipment, and the reimbursement from the government was recorded as unearned income on the Consolidated Balance Sheets. The unearned income liability will be reduced and credited to income ratably with the depreciation expense recorded over the useful life of the equipment.
The equipment was placed in service during 2012. Depreciation expense on the portion of the equipment whose cost was reimbursed by the DoD was $4.7 million in 2014 and 2013. Accordingly, unearned income was reduced by $4.7 million in 2014 and 2013 and credited to cost of sales in the Consolidated Statements of Income, offsetting the impact of the depreciation expense on the associated equipment on the Company's cost of sales and gross margin.
Depreciation, depletion, and amortization of mine development expense, including depreciation for assets recorded under capital leases, was $37.5 million in 2014, $36.1 million in 2013, and $31.0 million in 2012. The expense is net of the above
57
referenced reductions in the unearned income liability. Depreciation, depletion, and amortization as shown on the Consolidated Statement of Cash Flows is also net of the reduction in the unearned income liability in 2014 and 2013. The net book value of capitalized software as of December 31, 2014 was $6.1 million and $7.0 million as of December 31, 2013. Depreciation expense related to software was $1.8 million in 2014, $1.7 million in 2013, and $1.6 million in 2012.
Note E — Intangible Assets
Assets Acquired
The Company acquired a license in 2014 with a cost of $0.3 million with a weighted-average amortization period of 8.5 years. The Company incurred $1.6 million for deferred financing costs associated with new debt agreements in 2013 with a weighted-average amortization period of 4.8 years.
Assets Subject to Amortization
The cost, accumulated amortization, and net book value of intangible assets subject to amortization as of December 31, 2014 and 2013, and the aggregate amortization expense for each year then ended is as follows:
(Thousands) | 2014 | 2013 | ||||||
Deferred financing costs | ||||||||
Cost | $ | 7,794 | $ | 7,794 | ||||
Accumulated amortization | (5,302 | ) | (4,507 | ) | ||||
Net book value | 2,492 | 3,287 | ||||||
Customer relationships | ||||||||
Cost | 38,427 | 38,427 | ||||||
Accumulated amortization | (26,544 | ) | (22,624 | ) | ||||
Net book value | 11,883 | 15,803 | ||||||
Technology | ||||||||
Cost | 12,092 | 12,092 | ||||||
Accumulated amortization | (8,594 | ) | (7,626 | ) | ||||
Net book value | 3,498 | 4,466 | ||||||
License | ||||||||
Cost | 2,755 | 2,480 | ||||||
Accumulated amortization | (2,096 | ) | (1,828 | ) | ||||
Net book value | 659 | 652 | ||||||
Trade Name | ||||||||
Cost | 62 | 62 | ||||||
Accumulated amortization | (35 | ) | (22 | ) | ||||
Net book value | 27 | 40 | ||||||
Total | ||||||||
Cost | $ | 61,130 | $ | 60,855 | ||||
Accumulated amortization | (42,571 | ) | (36,607 | ) | ||||
Net book value | $ | 18,559 | $ | 24,248 | ||||
Aggregate amortization expense | $ | 5,964 | $ | 6,208 | ||||
The aggregate amortization expense is estimated to be $5.8 million in 2015, $5.1 million in 2016, $4.6 million in 2017, $1.8 million in 2018, and $0.6 million in 2019.
58
Assets Not Subject to Amortization
The Company’s only intangible asset not subject to amortization is goodwill. A reconciliation of the goodwill activity for 2014 and 2013 is as follows:
(Thousands) | 2014 | 2013 | ||||||
Balance at the beginning of the year | $ | 86,725 | $ | 88,753 | ||||
Adjustment | — | (2,028 | ) | |||||
Balance at the end of the year | $ | 86,725 | $ | 86,725 | ||||
In connection with a change in the Company's operating segments as described in Note M , the Company reassigned goodwill based on relative fair value. Goodwill totaling $46.6 million has been assigned to the Advanced Materials segment. Within the Precision Coatings group, goodwill of $17.6 million and $20.6 million has been assigned to the Precision Optics and Large Area Coatings operating segments, respectively. The remaining $1.9 million has been assigned to the Beryllium reporting unit within the Performance Alloys and Composites segment.
In the third quarter of 2014, the Company recorded an adjustment of $2.0 million to increase deferred tax assets and reduce goodwill to correct the amount of deferred tax assets recognized in connection with the acquisition of EIS Optics Limited in 2011, which is included in the Other segment. This adjustment was not material to previously issued financial statements as it had no net impact on total assets, equity, or cash flows and had an immaterial impact in the Consolidated Statements of Income. The Company has reflected this adjustment in the accompanying 2013 Consolidated Balance Sheet.
Note F — Debt
Long-term debt in the Consolidated Balance Sheets is summarized as follows:
December 31, | ||||||||
(Thousands) | 2014 | 2013 | ||||||
Revolving credit agreement | $ | 10,000 | $ | 15,000 | ||||
Fixed rate industrial development revenue bonds payable in annual installments through 2021 | 5,961 | 6,575 | ||||||
Variable rate industrial development revenue bonds payable in 2016 | 8,305 | 8,305 | ||||||
Total outstanding | 24,266 | 29,880 | ||||||
Current portion of long-term debt | (653 | ) | (613 | ) | ||||
Total | $ | 23,613 | $ | 29,267 | ||||
Maturities on long-term debt instruments as of December 31, 2014 are as follows:
2015 | $ | 653 | |
2016 | 9,000 | ||
2017 | 733 | ||
2018 | 10,773 | ||
2019 | 819 | ||
Thereafter | 2,288 | ||
Total | $ | 24,266 | |
In 2013, the Company entered into an Amended and Restated Credit Agreement (Credit Agreement) with six financial institutions that matures in 2018 and provides for a $375.0 million revolving credit facility comprised of sub-facilities for revolving loans, swing-line loans, letters of credit, and foreign borrowings. The Credit Agreement also provides for an uncommitted incremental facility whereby, under certain conditions, the Company may be able to borrow additional term loans in an aggregate amount not to exceed $100.0 million. The Credit Agreement is secured by substantially all of the assets of the Company and its direct subsidiaries, with the exception of non-mining real property and certain other assets. The Credit Agreement allows the Company to borrow money at a premium over LIBOR or prime rate and at varying maturities. The premium resets quarterly according to the terms and conditions available under the agreement.
59
At December 31, 2014, there was $42.5 million outstanding against the letters of credit sub-facility. The Company pays a variable commitment fee that resets quarterly (0.225% as of December 31, 2014) of the available and unborrowed amounts under the revolving credit line.
The Credit Agreement is subject to restrictive covenants including incurring additional indebtedness, acquisition limits, dividend declarations, and stock repurchases. In addition, the Credit Agreement includes covenants subject to a maximum leverage ratio and a minimum fixed charge coverage ratio. The Company was in compliance with all of its debt covenants as of December 31, 2014 and December 31, 2013.
The following table summarizes the Company’s short-term lines of credit. Amounts shown as outstanding are included in short-term debt in the Consolidated Balance Sheets.
December 31, 2014 | December 31, 2013 | |||||||||||||||||||||||
(Thousands) | Total | Outstanding | Available | Total | Outstanding | Available | ||||||||||||||||||
Domestic | $ | 322,475 | $ | — | $ | 322,475 | $ | 320,510 | $ | 6,291 | $ | 314,219 | ||||||||||||
Foreign | 12,334 | — | 12,334 | 13,320 | — | 13,320 | ||||||||||||||||||
Precious metal | — | — | — | 28,662 | 28,662 | — | ||||||||||||||||||
Total | $ | 334,809 | $ | — | $ | 334,809 | $ | 362,492 | $ | 34,953 | $ | 327,539 | ||||||||||||
While the available borrowings under the individual existing credit lines total $334.8 million, the covenants in the domestic Credit Agreement restrict the aggregate available borrowings to $229.4 million as of December 31, 2014.
The domestic line is committed and includes all sub-facilities in the $375.0 million maximum borrowing under the Credit Agreement. The Company has various foreign lines of credit, one of which for 3.5 million euros, is committed and secured. The remaining foreign lines are uncommitted, unsecured, and renewed annually. The average interest rate on short-term debt was 4.90% and 2.47% as of December 31, 2014 and 2013, respectively. In the third quarter of 2014, the Company transferred its precious metal-denominated debt to its precious metals consignment facility. Refer to Note C for additional information.
In April of 2011, the Company entered into an agreement with the Toledo-Lucas County Port Authority and the Dayton–Montgomery County Port Authority to co-issue $8.0 million in taxable development revenue bonds, with a fixed amortization term that will mature in 2021. The interest rate on these bonds is fixed at 4.9%, and the unamortized balance of the bonds was $6.0 million at December 31, 2014.
In November of 1996, the Company entered into an agreement with the Lorain Port Authority, Ohio to issue $8.3 million in variable rate industrial revenue bonds, maturing in 2016. The variable rate ranged from 0.18% to 0.28% in 2014 and from 0.19% to 0.38% in 2013.
Note G — Leasing Arrangements
The Company leases warehouse and manufacturing real estate, and manufacturing and computer equipment under operating leases with terms ranging up to 25 years. Operating lease expense amounted to $8.7 million, $9.4 million, and $9.0 million during 2014, 2013, and 2012, respectively. The future estimated minimum payments under capital leases and non-cancelable operating leases with initial lease terms in excess of one year at December 31, 2014, are as follows:
Capital | Operating | |||||||
(Thousands) | Leases | Leases | ||||||
2015 | $ | 1,064 | $ | 6,474 | ||||
2016 | 1,064 | 5,875 | ||||||
2017 | 1,064 | 4,359 | ||||||
2018 | 1,064 | 3,550 | ||||||
2019 | 1,064 | 3,017 | ||||||
2020 and thereafter | 3,639 | 9,461 | ||||||
Total minimum lease payments | 8,959 | $ | 32,736 | |||||
Amounts representing interest | 1,747 | |||||||
Present value of net minimum lease payments | $ | 7,212 | ||||||
60
The Company was in compliance with all of the covenants contained in lease agreements as of December 31, 2014 and December 31, 2013.
Note H — Fair Value Information and Derivative Financial Instruments
The Company measures and records financial instruments at fair value. A hierarchy is used for those instruments measured at fair value that distinguishes between assumptions based upon market data (observable inputs) and the Company's assumptions (unobservable inputs). The hierarchy consists of three levels:
Level 1 — Quoted market prices in active markets for identical assets and liabilities;
Level 2 — Inputs other than Level 1 inputs that are either directly or indirectly observable; and
Level 3 — Other significant unobservable inputs developed using estimates and assumptions developed by the Company, which reflect those that a market participant would use.
The following table summarizes the financial instruments measured at fair value in the Consolidated Balance Sheet as of December 31, 2014:
Fair Value Measurements | ||||||||||||||||
(Thousands) | Total | Quoted Prices in Active Markets for Identical Assets (Level 1) | Significant Observable Inputs (Level 2) | Other Significant Unobservable Inputs (Level 3) | ||||||||||||
Financial Assets | ||||||||||||||||
Directors’ deferred compensation investments | $ | 396 | $ | 396 | $ | — | $ | — | ||||||||
Foreign currency forward contracts | 3,456 | — | 3,456 | — | ||||||||||||
Total | $ | 3,852 | $ | 396 | $ | 3,456 | $ | — | ||||||||
Financial Liabilities | ||||||||||||||||
Directors’ deferred compensation liability | $ | 396 | $ | 396 | $ | — | $ | — | ||||||||
Total | $ | 396 | $ | 396 | $ | — | $ | — | ||||||||
The Company uses a market approach to value the assets and liabilities for outstanding derivative contracts in the table above. Foreign currency and precious metal hedge contracts are valued through models that utilize market observable inputs, including both spot and forward prices, for the same underlying currencies and metals. The carrying values of the other working capital items and debt in the Consolidated Balance Sheet approximate fair values as of December 31, 2014.
The Company uses derivative contracts to hedge portions of its foreign currency exposures and may also use derivatives to hedge a portion of its precious metal exposures. The objectives and strategies for using derivatives in these areas are as follows:
Foreign Currency. The Company sells products to overseas customers in their local currencies, primarily the euro and yen. The Company secures foreign currency derivatives, mainly forward contracts and options, to hedge these anticipated sales transactions. The purpose of the hedge program is to protect against the reduction in the dollar value of foreign currency sales from adverse exchange rate movements. Should the dollar strengthen significantly, the decrease in the translated value of the foreign currency sales should be partially offset by gains on the hedge contracts. Depending upon the methods used, the hedge contracts may limit the benefits from a weakening U.S. dollar.
The use of forward contracts locks in a firm rate and eliminates any downside from an adverse rate movement as well as any benefit from a favorable rate movement. The Company may from time to time choose to hedge with options or a tandem of options known as a collar. These hedging techniques can limit or eliminate the downside risk but can allow for some or all of the benefit from a favorable rate movement to be realized. Unlike a forward contract, a premium is paid for an option; collars, which are a combination of a put and call option, may have a net premium but can be structured to be cash neutral. The Company will primarily hedge with forward contracts due to the relationship between the cash outlay and the level of risk.
Precious Metals. The Company maintains the majority of its precious metal production requirements on consignment in order to reduce its working capital investment and the exposure to metal price movements. When a precious metal product is fabricated and ready for shipment to the customer, the metal is purchased out of consignment at the current market price. The price paid by the Company forms the basis for the price charged to the customer. This methodology allows for changes in either direction in the market prices of the precious metals used by the Company to be passed through
61
to the customer and reduces the impact changes in prices could have on the Company's margins and operating profit. The consigned metal is owned by financial institutions who charge the Company a financing fee based upon the current value of the metal on hand.
In certain instances, a customer may want to establish the price for the precious metal at the time the sales order is placed rather than at the time of shipment. Setting the sales price at a different date than when the material would be purchased potentially creates an exposure to movements in the market price of the metal. Therefore, in these limited situations, the Company may elect to enter into a forward contract to purchase precious metal. The forward contract allows the Company to purchase metal at a fixed price on a specific future date. The price in the forward contract serves as the basis for the price to be charged to the customer. By doing so, the selling price and purchase price are matched, and the Company's price exposure is reduced.
The Company refines precious metal containing materials for its customers and typically will purchase the refined metal from the customer at current market prices. In limited circumstances, the customer may want to fix the price to be paid at the time of the order as opposed to when the material is refined. The customer may also want to fix the price for a set period of time. The Company may then elect to enter into a hedge contract, either a forward contract or a swap, to fix the price for the estimated quantity of metal to be purchased, thereby reducing the exposure to adverse movements in the price of the metal.
The Company may from time to time elect to purchase precious metal and hold in inventory rather than on consignment due to potential credit line limitations or other factors. These purchases are typically held for a short duration. A forward contract will be secured at the time of the purchase to fix the price to be used when the metal is transferred back to the consignment line, thereby limiting any price exposure during the time when the metal was owned.
A team consisting of senior financial managers reviews the estimated exposure levels, as defined by budgets, forecasts, and other internal data, and determines the timing, amounts, and instruments to use to hedge exposures. Management analyzes the effective hedged rates and the actual and projected gains and losses on the hedging transactions against the program objectives, targeted rates, and levels of risk assumed. Foreign currency contracts are typically layered in at different times for a specified exposure period in order to minimize the impact of market rate movements.
The use of derivatives is governed by policies adopted by the Audit Committee of the Board of Directors. The Company will only enter into a derivative contract if there is an underlying identified exposure. Contracts are typically held to maturity. The Company does not engage in derivative trading activities and does not use derivatives for speculative purposes. The Company only uses hedge contracts that are denominated in the same currency or metal as the underlying exposure.
The fair values of the outstanding derivatives are recorded as assets (if the derivatives are in a gain position) or liabilities (if the derivatives are in a loss position). The fair values will also be classified as short term or long term depending upon maturity dates. The following table summarizes the notional amount and the fair value of the Company’s outstanding derivatives and balance sheet classification as of December 31, 2014 and 2013:
December 31, 2014 | December 31, 2013 | |||||||||||||||
(Thousands) | Notional Amount | Fair Value | Notional Amount | Fair Value | ||||||||||||
Prepaid expenses | ||||||||||||||||
Foreign currency forward contracts - yen | $ | 6,835 | $ | 773 | $ | 4,951 | $ | 292 | ||||||||
Foreign currency forward contracts - euro | 33,215 | 2,683 | — | — | ||||||||||||
Precious metal forward contracts | — | — | 5,663 | 11 | ||||||||||||
Total | 40,050 | 3,456 | 10,614 | 303 | ||||||||||||
Other liabilities and accrued items | ||||||||||||||||
Foreign currency forward contracts - euro | — | — | 25,112 | (364 | ) | |||||||||||
Precious metal swaps | — | — | 4,511 | (30 | ) | |||||||||||
Total | — | — | 29,623 | (394 | ) | |||||||||||
Other long-term liabilities | ||||||||||||||||
Foreign currency forward contracts - euro | — | — | 952 | (15 | ) | |||||||||||
Total | $ | 40,050 | $ | 3,456 | $ | 41,189 | $ | (106 | ) | |||||||
62
All of the foreign currency derivative contracts outstanding at December 31, 2014 and 2013, and the precious metal contracts at December 31, 2013, were designated and effective as cash flow hedges. There were no precious metal derivative contracts outstanding at December 31, 2014.
There was no ineffectiveness associated with the derivative contracts outstanding at December 31, 2014 or 2013, and no ineffectiveness expense was recorded in 2014, 2013, or 2012.
The fair value of derivative contracts recorded in accumulated other comprehensive income totaled $3.5 million as of December 31, 2014. The Company expects to relieve this balance to the Consolidated Statement of Income in 2015. The fair value of derivative contracts in accumulated other comprehensive income totaled $(0.1) million at December 31, 2013.
Note I — Pensions and Other Post-Employment Benefits
The obligation and funded status of the Company’s pension and other post-employment benefit plans are shown below. The Pension Benefits column aggregates defined benefit pension plans in the U.S., Germany, and England, and the U.S. supplemental retirement plans. The Other Benefits column includes the domestic retiree medical and life insurance plan.
63
Pension Benefits | Other Benefits | |||||||||||||||
(Thousands) | 2014 | 2013 | 2014 | 2013 | ||||||||||||
Change in benefit obligation | ||||||||||||||||
Benefit obligation at beginning of year | $ | 221,748 | $ | 253,839 | $ | 31,398 | $ | 34,294 | ||||||||
Service cost | 7,963 | 9,724 | 138 | 305 | ||||||||||||
Interest cost | 10,339 | 9,936 | 675 | 1,243 | ||||||||||||
Plan amendments | — | — | (14,034 | ) | — | |||||||||||
Actuarial (gain) loss | 43,476 | (28,581 | ) | 223 | (2,396 | ) | ||||||||||
Benefit payments from fund | (8,387 | ) | (22,893 | ) | — | — | ||||||||||
Benefit payments directly by Company | (1,236 | ) | (136 | ) | (1,968 | ) | (2,271 | ) | ||||||||
Expenses paid from assets | (570 | ) | (613 | ) | — | — | ||||||||||
Medicare Part D subsidy | — | — | 108 | 223 | ||||||||||||
Foreign currency exchange rate changes | (1,548 | ) | 472 | — | — | |||||||||||
Benefit obligation at end of year | 271,785 | 221,748 | 16,540 | 31,398 | ||||||||||||
Change in plan assets | ||||||||||||||||
Fair value of plan assets at beginning of year | 173,494 | 163,436 | — | — | ||||||||||||
Actual return on plan assets | 6,852 | 23,824 | — | — | ||||||||||||
Employer contributions | 16,145 | 9,615 | — | — | ||||||||||||
Benefit payments from fund | (8,387 | ) | (22,893 | ) | — | — | ||||||||||
Expenses paid from assets | (569 | ) | (613 | ) | — | — | ||||||||||
Foreign currency exchange rate changes | (349 | ) | 125 | — | — | |||||||||||
Fair value of plan assets at end of year | 187,186 | 173,494 | — | — | ||||||||||||
Funded status at end of year | $ | (84,599 | ) | $ | (48,254 | ) | $ | (16,540 | ) | $ | (31,398 | ) | ||||
Amounts recognized in the Consolidated Balance Sheets consist of: | ||||||||||||||||
Other assets | $ | 1,703 | $ | 1,321 | $ | — | $ | — | ||||||||
Other liabilities and accrued items | (753 | ) | (1,138 | ) | (1,472 | ) | (2,663 | ) | ||||||||
Retirement and post-employment benefits | (85,549 | ) | (48,437 | ) | (15,068 | ) | (28,735 | ) | ||||||||
$ | (84,599 | ) | $ | (48,254 | ) | $ | (16,540 | ) | $ | (31,398 | ) | |||||
Amounts recognized in other comprehensive income (before tax) consist of: | ||||||||||||||||
Net actuarial loss | $ | 122,641 | $ | 78,983 | $ | 275 | $ | 52 | ||||||||
Net prior service (credit) cost | (1,300 | ) | (1,734 | ) | — | — | ||||||||||
$ | 121,341 | $ | 77,249 | $ | 275 | $ | 52 | |||||||||
Amortizations expected to be recognized during next fiscal year (before tax): | ||||||||||||||||
Amortization of net loss | $ | 7,558 | $ | 5,100 | $ | — | $ | — | ||||||||
Amortization of prior service credit | (450 | ) | (434 | ) | — | — | ||||||||||
$ | 7,108 | $ | 4,666 | $ | — | $ | — | |||||||||
Additional information | ||||||||||||||||
Accumulated benefit obligation for all defined benefit pension plans | $ | 260,536 | $ | 213,585 | $ | — | $ | — | ||||||||
For defined benefit pension plans with benefit obligations in excess of plan assets: | ||||||||||||||||
Aggregate benefit obligation | 266,377 | 216,567 | — | — | ||||||||||||
Aggregate fair value of plan assets | 180,075 | 166,992 | — | — | ||||||||||||
For defined benefit pension plans with accumulated benefit obligations in excess of plan assets: | ||||||||||||||||
Aggregate accumulated benefit obligation | 255,128 | 208,404 | — | — | ||||||||||||
Aggregate fair value of plan assets | 180,075 | 166,992 | — | — | ||||||||||||
64
Components of net benefit cost and other amounts recognized in other comprehensive income (OCI)
Pension Benefits | Other Benefits | |||||||||||||||||||||||
(Thousands) | 2014 | 2013 | 2012 | 2014 | 2013 | 2012 | ||||||||||||||||||
Net benefit cost | ||||||||||||||||||||||||
Service cost | $ | 7,963 | $ | 9,724 | $ | 7,915 | $ | 138 | $ | 305 | $ | 285 | ||||||||||||
Interest cost | 10,339 | 9,936 | 9,912 | 675 | 1,243 | 1,439 | ||||||||||||||||||
Expected return on plan assets | (12,419 | ) | (12,261 | ) | (11,934 | ) | — | — | — | |||||||||||||||
Amortization of prior service cost (benefit) | (434 | ) | (340 | ) | (335 | ) | (1,498 | ) | 115 | 87 | ||||||||||||||
Recognized net actuarial loss | 5,263 | 7,912 | 5,605 | — | — | — | ||||||||||||||||||
Net periodic cost | 10,712 | 14,971 | 11,163 | (685 | ) | 1,663 | 1,811 | |||||||||||||||||
Settlements | 7 | — | — | — | — | — | ||||||||||||||||||
Total net benefit cost | $ | 10,719 | $ | 14,971 | $ | 11,163 | $ | (685 | ) | $ | 1,663 | $ | 1,811 | |||||||||||
Pension Benefits | Other Benefits | ||||||||||||||||||||||
(Thousands) | 2014 | 2013 | 2012 | 2014 | 2013 | 2012 | |||||||||||||||||
Change in other comprehensive income | |||||||||||||||||||||||
OCI at beginning of year | $ | 77,249 | $ | 124,955 | $ | 104,056 | $ | 52 | $ | 2,587 | $ | 1,180 | |||||||||||
Increase (decrease) in OCI: | |||||||||||||||||||||||
Recognized during year — prior service cost (credit) | 434 | 340 | 335 | 1,498 | (115 | ) | (87 | ) | |||||||||||||||
Recognized during year — net actuarial (losses) gains | (5,263 | ) | (7,912 | ) | (5,605 | ) | — | — | — | ||||||||||||||
Occurring during year — prior service cost | — | — | 117 | (14,034 | ) | — | — | ||||||||||||||||
Occurring during year — net actuarial losses (gains) | 49,037 | (40,143 | ) | 25,995 | 223 | (2,397 | ) | 1,494 | |||||||||||||||
Other adjustments | — | (3 | ) | — | — | (23 | ) | — | |||||||||||||||
Foreign currency exchange rate changes | (116 | ) | 12 | 57 | — | — | — | ||||||||||||||||
OCI at end of year | $ | 121,341 | $ | 77,249 | $ | 124,955 | $ | (12,261 | ) | $ | 52 | $ | 2,587 | ||||||||||
Summary of key valuation assumptions
Pension Benefits | Other Benefits | |||||||||||||||||
2014 | 2013 | 2012 | 2014 | 2013 | 2012 | |||||||||||||
Weighted-average assumptions used to determine benefit obligations at fiscal year end | ||||||||||||||||||
Discount rate | 4.00 | % | 4.80 | % | 3.99 | % | 3.50 | % | 4.50 | % | 3.75 | % | ||||||
Rate of compensation increase | 3.96 | % | 4.43 | % | 4.44 | % | 4.00 | % | 4.50 | % | 4.50 | % | ||||||
Weighted-average assumptions used to determine net cost for the fiscal year | ||||||||||||||||||
Discount rate | 4.79 | % | 3.97 | % | 4.81 | % | 4.13 | % | 3.75 | % | 4.50 | % | ||||||
Expected long-term return on plan assets | 7.15 | % | 7.44 | % | 7.65 | % | N/A | N/A | N/A | |||||||||
Rate of compensation increase | 4.42 | % | 4.42 | % | 4.43 | % | 4.50 | % | 4.50 | % | 4.50 | % | ||||||
The Company used a December 31 measurement date for the above plans.
65
Effective January 1, 2014, the Company revised the expected long-term rate of return assumption used in calculating the annual expense for its domestic defined benefit pension plan, decreasing it to 7.25% from 7.50%. Effective January 1, 2013, the Company revised the expected long-term rate of return assumption used in calculating the annual expense for its domestic defined benefit pension plan, decreasing it to 7.50% from 7.75%. In each instance, the impact was accounted for as a change in estimate.
Management establishes the domestic expected long-term rate of return assumption by reviewing historical trends and analyzing the current and projected market conditions in relation to the plan’s asset allocation and risk management objectives. Consideration is given to both recent plan asset performance as well as plan asset performance over various long-term periods of time, with an emphasis on the assumption being a prospective, long-term rate of return. Management consults with and considers the opinions of its outside investment advisors and actuaries when establishing the rate and reviews assumptions with the Audit Committee of the Board of Directors. Management believes that the 7.25% domestic expected long-term rate of return assumption is achievable and reasonable given current market conditions and forecasts, asset allocations, investment policies, and investment risk objectives.
The rate of compensation increase assumption was changed to 4.0% for 2014 and years after in the domestic defined benefit pension plan and the domestic retiree medical plan.
The Company also updated mortality rate assumptions based on new guidance issued from the Society of Actuaries, which increased the domestic defined benefit plan liability.
In the second quarter of 2012, the Company closed its domestic defined benefit pension plan to new entrants. Current plan participants will continue to accrue benefits under the existing formulas, while new hires will be offered an enhanced defined contribution plan.
Assumptions for the defined benefit pension plans in Germany and England are determined separately from the U.S. plan assumptions, based on historical trends and current and projected market conditions in Germany and England. The plan in Germany is unfunded and the plan in England has assets that are approximately 4.0% of the Company’s aggregated total fair value of plan assets as of December 31, 2014.
The Company has notified participants of changes to the domestic retiree medical plan, including changing the benefit formula for participants covered by the plan. The revised benefit formula is designed to lower costs for the Company and the majority of plan participants. As a result of this change, the plan liability on the Company's Consolidated Balance Sheet was reduced by $14.0 million in the first quarter of 2014, with the offset increasing other comprehensive income, a component of shareholders' equity. The liability reduction will be recognized in earnings over the average remaining service life of participants.
Assumed health care trend rates at fiscal year end | 2014 | 2013 | ||
Health care trend rate assumed for next year | 7.00% | 7.50% | ||
Rate that the trend rate gradually declines to (ultimate trend rate) | 5.00% | 5.00% | ||
Year that the rate reaches the ultimate trend rate | 2019 | 2019 | ||
Assumed health care cost trend rates have a significant effect on the amounts reported for the health care plans. A one-percentage-point change in assumed health care cost trend rates would have the following effects:
1-Percentage- Point Increase | 1-Percentage- Point Decrease | |||||||||||||||
(Thousands) | 2014 | 2013 | 2014 | 2013 | ||||||||||||
Effect on total of service and interest cost components | $ | 15 | $ | 30 | $ | (14 | ) | $ | (26 | ) | ||||||
Effect on post-employment benefit obligation | 427 | 602 | (392 | ) | (567 | ) | ||||||||||
66
Plan Assets
The following tables present the fair values of the Company’s defined benefit pension plan assets as of December 31, 2014 and 2013 by asset category. Refer to Note H to the Consolidated Financial Statements for definitions of fair value hierarchy.
December 31, 2014 | ||||||||||||||||
Total | Level 1 | Level 2 | Level 3 | |||||||||||||
(Thousands) | ||||||||||||||||
Cash | $ | 6,173 | $ | 6,173 | $ | — | $ | — | ||||||||
Equity securities: | ||||||||||||||||
U.S. (a) | 60,028 | 49,625 | 10,403 | — | ||||||||||||
International (b) | 28,372 | 25,361 | 3,011 | — | ||||||||||||
Emerging markets (c) | 13,498 | 13,300 | 198 | — | ||||||||||||
Fixed-income securities: | ||||||||||||||||
Intermediate-term bonds (d) | 18,635 | 14,755 | 3,880 | — | ||||||||||||
Short-term bonds (e) | 3,631 | — | 3,631 | — | ||||||||||||
Global bonds (f) | 30,030 | 26,795 | 3,235 | — | ||||||||||||
Other types of investments: | ||||||||||||||||
Real estate fund (g) | 6,513 | 6,433 | 80 | — | ||||||||||||
Alternative strategies (h) | 8,477 | 8,382 | 95 | — | ||||||||||||
Pooled investment fund (i) | 6,613 | — | — | 6,613 | ||||||||||||
Multi-strategy hedge funds (j) | 4,962 | — | — | 4,962 | ||||||||||||
Private equity funds | 254 | — | — | 254 | ||||||||||||
Total | $ | 187,186 | $ | 150,824 | $ | 24,533 | $ | 11,829 | ||||||||
December 31, 2013 | ||||||||||||||||
Total | Level 1 | Level 2 | Level 3 | |||||||||||||
(Thousands) | ||||||||||||||||
Cash | $ | 6,568 | $ | 6,568 | $ | — | $ | — | ||||||||
Equity securities: | ||||||||||||||||
U.S. (a) | 63,321 | 54,095 | 9,226 | — | ||||||||||||
International (b) | 27,403 | 23,911 | 3,492 | — | ||||||||||||
Emerging markets (c) | 14,165 | 13,908 | 257 | — | ||||||||||||
Fixed income securities: | ||||||||||||||||
Intermediate-term bonds (d) | 21,874 | 14,482 | 7,392 | — | ||||||||||||
Short-term bonds (e) | 11,608 | 11,608 | — | — | ||||||||||||
Global bonds (f) | 12,728 | 10,879 | 1,849 | — | ||||||||||||
Other types of investments: | ||||||||||||||||
Real estate fund (g) | 9,943 | 9,882 | 61 | — | ||||||||||||
Multi-strategy hedge funds (j) | 5,467 | — | — | 5,467 | ||||||||||||
Private equity funds | 417 | — | — | 417 | ||||||||||||
Total | $ | 173,494 | $ | 145,333 | $ | 22,277 | $ | 5,884 | ||||||||
(a) | Mutual funds that invest in various sectors of the U.S. market. |
(b) | Mutual funds that invest in non-U.S. companies primarily in developed countries that are generally considered to be value stocks. |
(c) | Mutual funds that invest in non-U.S. companies in emerging market countries. |
(d) | Includes a mutual fund that employs a value-oriented approach to fixed income investment management and a mutual fund that invests primarily in investment-grade debt securities. |
(e) | Includes a mutual fund that seeks a market rate of return for a fixed-income portfolio with low relative volatility of returns, investing generally in U.S. and foreign debt securities maturing in five years or less. |
(f) | Mutual funds that invest in domestic and foreign sovereign securities, fixed income securities, mortgage-backed and asset-backed bonds, convertible bonds, high-yield bonds, and emerging market bonds. |
67
(g) | Includes a mutual fund that typically invests at least 80% of its assets in equity and debt securities of companies in the real estate industry or related industries or in companies which own significant real estate assets at the time of investment. |
(h) | Includes a mutual fund that tactically allocates assets to global equity, fixed income, and alternative strategies. |
(i) | Includes a fund that invests in a broad portfolio of hedge funds. |
(j) | Includes a hedge fund that employs multiple strategies to multiple asset classes with low correlations. |
The following table summarizes changes in the fair value of the Company’s defined benefit pension plan Level 3 assets measured using significant unobservable inputs during 2014 and 2013:
(Thousands) | Total | Pooled Investment Fund | Multi-strategy Hedge Funds | Private Equity Funds | ||||||||||||
Balance as of January 1, 2013 | $ | 4,836 | $ | — | $ | 4,191 | $ | 645 | ||||||||
Actual return: | ||||||||||||||||
On assets still held at reporting date | 1,183 | — | 1,276 | (93 | ) | |||||||||||
On assets sold during the period | 229 | — | — | 229 | ||||||||||||
Purchases, sales, and settlements | (364 | ) | — | — | (364 | ) | ||||||||||
Balance as of December 31, 2013 | $ | 5,884 | $ | — | $ | 5,467 | $ | 417 | ||||||||
Actual return: | ||||||||||||||||
On assets still held at reporting date | (406 | ) | 113 | (505 | ) | (14 | ) | |||||||||
On assets sold during the period | (20 | ) | — | — | (20 | ) | ||||||||||
Purchases, sales, and settlements | 6,371 | 6,500 | — | (129 | ) | |||||||||||
Balance as of December 31, 2014 | $ | 11,829 | $ | 6,613 | $ | 4,962 | $ | 254 | ||||||||
Capital may be withdrawn from the multi-strategy hedge fund partnership on a monthly basis with a ten-day notice period.
The Company’s domestic defined benefit pension plan investment strategy, as approved by the Governance and Organization Committee of the Board of Directors, is to employ an allocation of investments that will generate returns equal to or better than the projected long-term growth of pension liabilities so that the plan will be self-funding. The return objective is to maximize investment return to achieve and maintain a 100% funded status over time, taking into consideration required cash contributions. The allocation of investments is designed to maximize the advantages of diversification while mitigating the risk and overall portfolio volatility to achieve the return objective. Risk is defined as the annual variability in value and is measured in terms of the standard deviation of investment return. Under the Company’s investment policies, allowable investments include domestic equities, international equities, fixed income securities, cash equivalents, and alternative securities (which include real estate, private venture capital investments, hedge funds, and tactical asset allocation). Ranges, in terms of a percentage of the total assets, are established for each allowable class of security. Derivatives may be used to hedge an existing security or as a risk reduction strategy. Current asset allocation guidelines are to invest 30% to 70% in equity securities, 20% to 50% in fixed income securities and cash, and up to 20% in alternative securities. Management reviews the asset allocation on a quarterly or more frequent basis and makes revisions as deemed necessary.
None of the plan assets noted above are invested in the Company’s common stock.
Cash Flows
Employer Contributions
The Company expects to contribute $16.0 million to its domestic defined benefit pension plan and $1.5 million to its other benefit plans in 2015.
68
Estimated Future Benefit Payments
The following benefit payments, which reflect expected future service, as appropriate, are expected to be paid:
Other Benefits | ||||||||||||
Pension Benefits | Gross Benefit Payment | Net of Medicare Part D Subsidy | ||||||||||
(Thousands) | ||||||||||||
2015 | $ | 9,672 | $ | 1,472 | $ | 1,435 | ||||||
2016 | 9,894 | 1,483 | 1,447 | |||||||||
2017 | 12,320 | 1,566 | 1,533 | |||||||||
2018 | 11,202 | 1,597 | 1,565 | |||||||||
2019 | 12,581 | 1,541 | 1,512 | |||||||||
2020 through 2024 | 72,765 | 6,442 | 6,334 | |||||||||
Other Benefit Plans
In addition to the plans shown above, the Company also has certain foreign subsidiaries with accrued unfunded pension and other post-employment arrangements. The liability for these arrangements was $2.1 million at December 31, 2014 and $2.3 million at December 31, 2013, and was included in retirement and post-employment benefits in the Consolidated Balance Sheets.
The Company also sponsors defined contribution plans available to substantially all U.S. employees. The Company’s annual defined contribution expense, including the expense for the enhanced defined contribution plan that was implemented in the second quarter of 2012, was $3.0 million in 2014, $2.8 million in 2013, and $2.5 million in 2012.
Note J — Contingencies and Commitments
CBD Claims
The Company is a defendant from time to time in proceedings in various state and federal courts brought by plaintiffs alleging that they have contracted chronic beryllium disease (CBD) or related ailments as a result of exposure to beryllium. Plaintiffs in CBD cases seek recovery under theories of negligence and various other legal theories and seek compensatory and punitive damages, in many cases of an unspecified sum. Spouses, if any, often claim loss of consortium.
Employee cases, in which plaintiffs have a high burden of proof, have historically involved relatively small losses to the Company. Third-party plaintiffs (typically employees of customers) face a lower burden of proof than do the Company’s employees, but these cases have generally been covered by varying levels of insurance. Management has vigorously contested the CBD cases brought against the Company.
Claims filed by third-party plaintiffs alleging CBD filed prior to the end of 2022 are covered by insurance if any portion of the alleged exposure period occurred prior to year-end 2007. Both defense and indemnity costs are covered subject to an annual $1.0 million deductible and other terms and provisions.
There was one CBD case outstanding as of December 31, 2014. This case was filed during 2013. There was one settlement paid during 2014. This case was filed during 2012 and was settled for an immaterial amount. There were no other settlements paid or cases dismissed during 2014 or 2013.
Although it is not possible to predict the outcome of any pending litigation, the Company provides for costs related to litigation matters when a loss is probable, and the amount is reasonably estimable. Litigation is subject to many uncertainties, and it is possible that some of the actions could be decided unfavorably in amounts exceeding the Company’s reserves. An unfavorable outcome or settlement of a CBD case or adverse media coverage could encourage the commencement of additional similar litigation. The Company is unable to estimate its potential exposure to unasserted claims.
Based upon currently known facts and assuming collectibility of insurance, the Company does not believe that resolution of the current or future beryllium proceedings will have a material adverse effect on the financial condition or cash flow of the Company. However, the Company’s results of operations could be materially affected by unfavorable results in one or more cases.
69
Insurance Recoverable
After recording and investigating a $7.4 million inventory loss in the fourth quarter 2012, the Company filed a claim with its insurance provider under existing polices for theft. In the second quarter of 2014, the Company and the insurance company settled the claim, and the Company received a cash payment of $6.8 million and recognized the amount in Other-net in the Consolidated Statement of Income.
During the third quarter of 2014, the Company collected $4.0 million as part of a settlement agreement with a contractor for an outstanding dispute regarding construction of the Company's beryllium pebble plant located in Elmore, Ohio. The cash received and the benefit of this settlement was recorded in the third quarter of 2014 in Other-net in the Consolidated Statement of Income.
Environmental Proceedings
The Company has an active program for environmental compliance that includes the identification of environmental projects and estimating the impact on the Company’s financial performance and available resources. Environmental expenditures that relate to current operations, such as wastewater treatment and control of airborne emissions, are either expensed or capitalized as appropriate. The Company records reserves for the probable costs for identified environmental remediation projects. The Company’s environmental engineers perform routine ongoing analyses of the remediation sites and will use outside consultants to assist in their analyses from time to time. Accruals are based upon their analyses and are established at either the best estimate or, absent a best estimate, at the low end of the estimated range of costs. The accruals are revised for the results of ongoing studies, changes in strategies, inflation, and for differences between actual and projected costs. The accruals may also be affected by rulings and negotiations with regulatory agencies. The timing of payments often lags the accrual, as environmental projects typically require a number of years to complete.
The environmental reserves recorded represent the Company's best estimate of what is reasonably possible and cover existing or currently foreseen projects based upon current facts and circumstances. The Company does not believe that it is reasonably possible that the cost to resolve environmental matters for sites where the investigative work and work plan development are substantially complete will be materially different than what has been accrued while the ultimate loss contingencies for sites that are in the preliminary stages of investigation cannot be reasonably determined at the present time. As facts and circumstances change, the ultimate cost may be revised and the recording of additional costs may be material in the period in which the additional costs are accrued. The Company does not believe that the ultimate liability for environmental matters will have a material impact on its financial condition or liquidity due to the nature of known environmental matters and the extended period of time during which environmental remediation normally takes place.
The undiscounted reserve balance at the beginning of the year, the amounts expensed and paid, and the balance at the end of the year for 2014 and 2013 are as follows:
(Thousands) | 2014 | 2013 | ||||||
Reserve balance at beginning of year | $ | (4,809 | ) | $ | (5,301 | ) | ||
Expensed | (275 | ) | (503 | ) | ||||
Paid | 162 | 995 | ||||||
Reserve balance at end of year | $ | (4,922 | ) | $ | (4,809 | ) | ||
Ending balance recorded in: | ||||||||
Other liabilities and accrued items | $ | (460 | ) | $ | (430 | ) | ||
Other long-term liabilities | (4,462 | ) | (4,379 | ) | ||||
The majority of spending in 2014 and 2013 was for various remediation projects at the Elmore, Ohio plant site.
Long-term Obligation
The Company had a long-term supply agreement with Ulba/Kazatomprom of the Republic of Kazakhstan and its marketing representative, Nukem, Inc. (Nukem) of Connecticut, for the purchase of approximately 775,000 pounds of beryllium copper master alloy. The pricing for the beryllium content of the material is fixed while the price for the copper content fluctuates based upon the monthly average LME market price. The contract was completed prior to December 31, 2013. Purchases made under this agreement totaled $1.8 million in 2013 and $5.2 million in 2012. This contract was replaced with short-term agreements in 2014. The material purchased from Nukem is used in the manufacture of beryllium-containing alloy products by the Performance Alloys and Composites segment.
70
Other
The Company is subject to various legal or other proceedings that relate to the ordinary course of its business. The Company believes that the resolution of these proceedings, individually or in the aggregate, will not have a material adverse impact upon the Company’s consolidated financial statements.
The Company has outstanding letters of credit totaling $42.5 million related to workers’ compensation, consigned precious metal guarantees, environmental remediation issues, and other matters. The majority of the Company's outstanding letters of credit expire in 2015 and are expected to be renewed.
Note K — Common Stock and Stock-based Compensation
A reconciliation of the changes in the number of common shares issued is as follows:
(Thousands) | Number of Shares | ||
Issued as of January 1, 2012 | 27,024 | ||
Exercise of stock options and stock appreciation rights (SARs) | 26 | ||
Issued as of December 31, 2012 | 27,050 | ||
Exercise of stock options and SARs | 114 | ||
Issued as of December 31, 2013 | 27,164 | ||
Exercise of stock options and SARs | 62 | ||
Issued as of December 31, 2014 | 27,226 | ||
Stock incentive plans (the 2006 Stock Incentive Plan and the 2006 Non-employee Director Equity Plan) were approved at the May 2, 2006 annual meeting of shareholders. These plans authorize the granting of option rights, stock appreciation rights, performance-restricted shares, performance shares, performance units, and restricted shares and replaced the 1995 Stock Incentive Plan and the 1997 Stock Incentive Plan for Non-employee Directors. The 2006 Stock Incentive Plan and the 2006 Non-employee Director Equity Plan were amended to, among other things, add additional shares to the plans. These amendments were approved by shareholders at the May 2014 annual meeting.
Stock Options
Stock options may be granted to employees or non-employee directors of the Company. Option rights entitle the optionee to purchase common shares at a price equal to or greater than the market value on the date of grant. Option rights granted to employees generally become exercisable (i.e. vest) over a four-year period and expire ten years from the date of the grant. Options granted to employees may also be issued with shorter vesting periods. Options granted to non-employee directors vest in six months and expire ten years from the date of the grant. The number of options available to be issued is established in plans approved by shareholders. The exercise of options is generally satisfied by the issuance of new shares.
The following table summarizes the Company’s stock option activity during 2014:
(Shares in thousands) | Number of Options | Weighted- average Exercise Price Per Share | Aggregate Intrinsic Value | Weighted- average Remaining Term (Years) | |||||||||
Outstanding at December 31, 2013 | 21 | $ | 17.29 | $ | — | — | |||||||
Exercised | (20 | ) | 17.29 | — | — | ||||||||
Canceled | (1 | ) | 17.08 | — | — | ||||||||
Outstanding at December 31, 2014 | — | — | — | ||||||||||
Vested and expected to vest as of December 31, 2014 | — | — | — | ||||||||||
Exercisable at December 31, 2014 | — | — | — | ||||||||||
Cash received from the exercise of stock options totaled $0.4 million in 2014, $1.2 million in 2013, and $0.2 million in 2012. The tax benefit realized from tax deductions from exercises was $0.1 million in 2014, $0.5 million in 2013, and $0.1 million in 2012. The total intrinsic value of options exercised during the years ended December 31, 2014, 2013, and 2012, was $0.3 million, $1.0 million, and $0.3 million, respectively.
71
Restricted Stock
The Company may grant restricted stock to employees and non-employee directors of the Company. These shares are restricted and vest over a designated period of time as defined at the date of the grant and are forfeited should the holder’s employment terminate during the restriction period. The fair market value of the restricted shares is determined on the date of the grant and is amortized over the restriction period. The restriction period is typically three years.
The fair value of the restricted stock is based on the closing stock price on the date of grant. The weighted-average grant date fair value for 2014, 2013, and 2012 was $33.29, $27.35, and $27.87, respectively.
Compensation cost was $2.2 million in 2014, $2.5 million in 2013, and $2.7 million in 2012. The unamortized compensation cost on the outstanding restricted stock was $1.8 million as of December 31, 2014 and is expected to be amortized over a weighted-average period of 20 months. The income tax expense recognized from the vesting of restricted stock totaled $0.1 million in 2014, as compared to the tax benefit realized from the vesting of restricted stock of $0.2 million in 2013 and $0.7 million in 2012.
The following table summarizes the restricted stock activity during 2014:
(Shares in thousands) | Number of Shares | Weighted- average Grant Date Fair Value | |||||
Outstanding at December 31, 2013 | 200 | $ | 32.71 | ||||
Granted | 60 | 33.29 | |||||
Vested | (81 | ) | 33.21 | ||||
Forfeited | (27 | ) | 33.21 | ||||
Outstanding at December 31, 2014 | 152 | $ | 30.76 | ||||
Long-term Incentive Plans
Under long-term incentive compensation plans, executive officers and selected other employees receive cash or stock awards based upon the Company’s performance over the defined period, typically three years. Awards may vary based upon the degree to which actual performance exceeds the pre-determined threshold, target, and maximum performance levels at the end of the performance periods. Payouts may be subjected to attainment of threshold performance objectives.
Compensation expense is based upon the performance projections for the three-year plan period, the percentage of requisite service rendered, and the fair market value of the Company’s common shares on the date of grant. The offset to the compensation expense for the portion of the award to be settled in shares is recorded within shareholders’ equity and was $1.0 million for 2014, $0.8 million for 2013, and $0.4 million for 2012.
Directors Deferred Compensation
Non-employee directors may defer all or part of their fees into the Company’s common shares. The fair value of the deferred shares is determined at the share acquisition date and is recorded within shareholders’ equity. Subsequent changes in the fair value of the Company’s common shares do not impact the recorded values of the shares.
The following table summarizes the stock activity for the directors' deferred compensation plan during 2014:
(Shares in thousands) | Number of Shares | Weighted- average Grant Date Fair Value | |||||
Outstanding at December 31, 2013 | 101 | $ | 23.74 | ||||
Granted | 19 | 33.46 | |||||
Outstanding at December 31, 2014 | 120 | $ | 25.33 | ||||
During the years ended December 31, 2014, 2013 and 2012, the weighted-average grant date fair value of shares granted was $33.46, $26.99, and $23.10, respectively.
Stock Appreciation Rights
72
The Company may grant SARs to certain employees and non-employee directors. Upon exercise of vested SARs, the participant will receive a number of shares of common stock equal to the spread (the difference between the market price of the Company’s common shares at the time of the exercise and the strike price established in the SARs agreement) divided by the common share price. The strike price of the SARs is equal to or greater than the market value of the Company’s common shares on the day of the grant. The number of SARs available to be issued is established by plans approved by the shareholders. The vesting period and the life of the SARs are established in the SARs agreement at the time of the grant. The exercise of the SARs is satisfied by the issuance of treasury shares. The SARs vest three years from the date of grant. SARs granted prior to 2011 expire in ten years, while the SARs granted in 2011 and later expire in seven years.
The following table summarizes the Company's SARs activity during 2014:
(Shares in thousands) | Number of SARs | Weighted- average Exercise Price Per Share | Aggregate Intrinsic Value | Weighted- average Remaining Term (Years) | |||||||||
Outstanding at December 31, 2013 | 984 | $ | 26.34 | $ | — | — | |||||||
Granted | 143 | 33.29 | — | — | |||||||||
Exercised | (154 | ) | 20.15 | — | — | ||||||||
Cancelled | (5 | ) | 33.30 | — | — | ||||||||
Outstanding at December 31, 2014 | 968 | 28.32 | 7,633,000 | 4.4 | |||||||||
Vested and expected to vest as of December 31, 2014 | 968 | 28.32 | 7,633,000 | 4.4 | |||||||||
Exercisable at December 31, 2014 | 504 | 26.51 | 5,334,000 | 3.6 | |||||||||
The weighted-average fair value of the SARs granted in 2014 was $33.29. The fair value will be amortized to compensation cost on a straight-line basis over the three-year vesting period. Compensation cost was $2.2 million, $2.4 million and $2.8 million in 2014, 2013, and 2012, respectively, and was included in selling, general, and administrative expense. The unamortized compensation cost balance was $2.2 million as of December 31, 2014.
Summarized information on SARs outstanding as of December 31, 2014 follows:
SARs Prices | Number Outstanding (Thousands) | Weighted- average Remaining Life (Years) | Weighted- average Exercise Price | ||||||
$15.01 | 162 | 3.7 | $ | 15.01 | |||||
$21.24-$24.03 | 140 | 4.4 | 21.40 | ||||||
$27.78-$29.45 | 337 | 4.5 | 28.90 | ||||||
$33.30-$34.70 | 146 | 6.3 | 33.32 | ||||||
$39.30-$44.72 | 183 | 3.1 | 40.41 | ||||||
968 | 4.4 | $ | 28.32 | ||||||
The SARs granted at $15.01, $21.24, $24.03, $27.78, $34.70, $39.30, and $44.72 are exercisable.
The fair value of the SARs was estimated on the grant date using the Black-Scholes pricing model with the following assumptions:
2014 | 2013 | 2012 | |||||||
Risk-free interest rate | 1.64 | % | 0.70 | % | 0.89 | % | |||
Dividend yield | 1.0 | % | 1.1 | % | — | % | |||
Volatility | 45.5 | % | 56.6 | % | 50.0 | % | |||
Expected lives (in years) | 5.0 | 5.0 | 5.0 | ||||||
The risk-free rate of return was based on the five-year Treasury note rate at the time the SARs were granted. The Company initiated a dividend in May of 2012, subsequent to the 2012 grant date. The share price volatility was calculated based on the actual closing prices of the Company's common shares at month end over a period of approximately ten years prior to the granting of the SARs. This approach to measuring volatility is consistent with the approach used to calculate the volatility assumption in
73
the valuation of stock options. The Company's current SARs program has been in place since 2006. The expected life assumption was based upon prior analyses.
Serial Preferred Stock
The Company has five million shares of Serial Preferred Stock authorized (no par value), none of which have been issued. Certain terms of the Serial Preferred Stock, including dividends, redemption, and conversion, will be determined by the Board of Directors prior to issuance.
Note L — Accumulated Other Comprehensive Income
Changes in the components of accumulated other comprehensive income, including amounts reclassified out, for 2014, 2013 and 2012, and the balances in accumulated other comprehensive income as of December 31, 2014, 2013, and 2012 are as follows:
74
Gains and Losses On Cash Flow Hedges | Pension and Post- Employment Benefits | Foreign Currency Translation | |||||||||||||||||||||
(Thousands) | Foreign Currency | Precious Metals | Total | Total | |||||||||||||||||||
Accumulated other comprehensive income as of December 31, 2011 | |||||||||||||||||||||||
Gross | $ | 1,399 | $ | 51 | $ | 1,450 | $ | (105,236 | ) | $ | 4,947 | $ | (98,839 | ) | |||||||||
Deferred tax expense (benefit) | (913 | ) | 18 | (895 | ) | (25,729 | ) | — | (26,624 | ) | |||||||||||||
Net | $ | 2,312 | $ | 33 | $ | 2,345 | $ | (79,507 | ) | $ | 4,947 | $ | (72,215 | ) | |||||||||
2012 activity | |||||||||||||||||||||||
Other comprehensive income (loss) before reclassifications | $ | 693 | $ | (552 | ) | $ | 141 | $ | (27,662 | ) | $ | (870 | ) | $ | (28,391 | ) | |||||||
Amounts reclassified from accumulated other comprehensive income | (1,839 | ) | 598 | (1,241 | ) | 5,357 | — | 4,116 | |||||||||||||||
Net current period other comprehensive income (loss) before tax | (1,146 | ) | 46 | (1,100 | ) | (22,305 | ) | (870 | ) | (24,275 | ) | ||||||||||||
Deferred taxes on current period activity | (401 | ) | 16 | (385 | ) | (7,676 | ) | — | (8,061 | ) | |||||||||||||
2012 other comprehensive income (loss) after tax | (745 | ) | 30 | (715 | ) | (14,629 | ) | (870 | ) | (16,214 | ) | ||||||||||||
Accumulated other comprehensive income as of December 31, 2012 | |||||||||||||||||||||||
Gross | 253 | 97 | 350 | (127,541 | ) | 4,077 | (123,114 | ) | |||||||||||||||
Deferred tax expense (benefit) | (1,314 | ) | 34 | (1,280 | ) | (33,405 | ) | — | (34,685 | ) | |||||||||||||
Net | $ | 1,567 | $ | 63 | $ | 1,630 | $ | (94,136 | ) | $ | 4,077 | $ | (88,429 | ) | |||||||||
2013 activity | |||||||||||||||||||||||
Other comprehensive income (loss) before reclassifications | $ | 618 | $ | 4 | $ | 622 | $ | 42,553 | $ | (3,790 | ) | $ | 39,385 | ||||||||||
Amounts reclassified from accumulated other comprehensive income | (958 | ) | (120 | ) | (1,078 | ) | 7,687 | — | 6,609 | ||||||||||||||
Net current period other comprehensive income (loss) before tax | (340 | ) | (116 | ) | (456 | ) | 50,240 | (3,790 | ) | 45,994 | |||||||||||||
Deferred taxes on current period activity | (119 | ) | (41 | ) | (160 | ) | 17,613 | — | 17,453 | ||||||||||||||
2013 other comprehensive income (loss) after tax | (221 | ) | (75 | ) | (296 | ) | 32,627 | (3,790 | ) | 28,541 | |||||||||||||
Accumulated other comprehensive income as of December 31, 2013 | |||||||||||||||||||||||
Gross | (87 | ) | (19 | ) | (106 | ) | (77,301 | ) | 287 | (77,120 | ) | ||||||||||||
Deferred tax (benefit) | (1,433 | ) | (7 | ) | (1,440 | ) | (15,792 | ) | — | (17,232 | ) | ||||||||||||
Net | $ | 1,346 | $ | (12 | ) | $ | 1,334 | $ | (61,509 | ) | $ | 287 | $ | (59,888 | ) | ||||||||
2014 activity | |||||||||||||||||||||||
Other comprehensive income (loss) before reclassifications | $ | 3,456 | $ | 19 | $ | 3,475 | $ | (35,109 | ) | $ | (4,440 | ) | $ | (36,074 | ) | ||||||||
Amounts reclassified from accumulated other comprehensive income | 87 | — | 87 | 3,330 | — | 3,417 | |||||||||||||||||
Net current period other comprehensive income (loss) before tax | 3,543 | 19 | 3,562 | (31,779 | ) | (4,440 | ) | (32,657 | ) | ||||||||||||||
Deferred taxes on current period activity | 1,311 | 7 | 1,318 | (11,626 | ) | — | (10,308 | ) | |||||||||||||||
2014 other comprehensive income (loss) after tax | 2,232 | 12 | 2,244 | (20,153 | ) | (4,440 | ) | (22,349 | ) | ||||||||||||||
Accumulated other comprehensive income as of December 31, 2014 | |||||||||||||||||||||||
Gross | 3,456 | — | 3,456 | (109,080 | ) | (4,153 | ) | (109,777 | ) | ||||||||||||||
Deferred tax (benefit) | (122 | ) | — | (122 | ) | (27,418 | ) | — | (27,540 | ) | |||||||||||||
Net | $ | 3,578 | $ | — | $ | 3,578 | $ | (81,662 | ) | $ | (4,153 | ) | $ | (82,237 | ) | ||||||||
75
Reclassifications from accumulated other comprehensive income of gains and losses on foreign currency cash flow hedges are recorded in Other-net in the Consolidated Statements of Income while gains and losses on precious metal cash flow hedges are recorded in Cost of sales in the Consolidated Statements of Income. Refer to Note H for additional details on cash flow hedges.
Reclassifications from accumulated other comprehensive income for pension and post-employment benefits are included in the computation of the net periodic pension and post-employment benefit expense. Refer to Note I for additional details on pension and post-employment expenses.
Note M — Segment Reporting and Geographic Information
The Company reorganized its operating segments in the fourth quarter of 2014 to more appropriately focus resources to drive new product development and growth across its diversified customer base. In accordance with the requirements of the Segment Reporting Topic of the Accounting Standards Codification (ASC) issued by the FASB, the Company determined its reportable segments based on the Company’s new organizational structure.
The Company is now organized into three reportable segments: Performance Alloys and Composites, Advanced Materials, and Other. The Other reportable segment includes the operating results of our Precision Optics and Large Area Coatings operating segments (collectively referred to as the Precision Coatings group) and unallocated corporate costs. Precision Optics and Large Area Coatings do not meet the quantitative threshold criteria for separate disclosure. The Company also changed its methodology for allocating certain general corporate and shared services expenses. The Company reclassified a portion of these expenses from its operating segments to corporate to better align with our management of these costs and has recast the effect for all periods presented.
The factors that the Company considered in determining its reportable segments included the economic similarity of its businesses, the nature of products sold or services provided, production processes, types of customers, and distribution methods.
Performance Alloys and Composites produces strip and bulk form alloy products, strip metal products with clad inlay and overlay metals, beryllium-based metals, beryllium, and aluminum metal matrix composites, in rod, sheet, foil, and a variety of customized forms, beryllia ceramics, and bulk metallic glass materials.
Advanced Materials produces advanced chemicals, microelectric packaging, precious, non-precious metal and specialty metal products, including vapor deposition targets, frame lid assemblies, clad and precious metal preforms, high temperature braze materials, and ultra-fine wire.
The Precision Coatings group produces thin film coatings, optical filter materials, sputter-coated, and precision-converted thin film materials.
76
Financial information for reportable segments, which has been recast for all periods presented to reflect the current organizational structure, was as follows:
Other | ||||||||||||||||||||||||
(Thousands) | Performance Alloys and Composites | Advanced Materials | Other (1) | Corporate (2) | Subtotal | Total | ||||||||||||||||||
2014 | ||||||||||||||||||||||||
Net sales | $ | 433,288 | $ | 547,282 | $ | 147,659 | $ | (1,339 | ) | $ | 146,320 | $ | 1,126,890 | |||||||||||
Intersegment sales (3) | 743 | 54,404 | — | — | — | 55,147 | ||||||||||||||||||
Value-added sales | 358,511 | 181,040 | 102,378 | (4,856 | ) | 97,522 | 637,073 | |||||||||||||||||
Operating profit (loss) | 33,290 | 32,692 | 9,272 | (18,297 | ) | (9,025 | ) | 56,957 | ||||||||||||||||
Depreciation, depletion, and amortization | 24,712 | 6,890 | 10,175 | 944 | 11,119 | 42,721 | ||||||||||||||||||
Expenditures for long-lived assets | 16,998 | 6,412 | 5,869 | 1,280 | 7,149 | 30,559 | ||||||||||||||||||
Assets | 433,997 | 148,303 | 122,337 | 57,432 | 179,769 | 762,069 | ||||||||||||||||||
2013 | ||||||||||||||||||||||||
Net sales | $ | 422,936 | $ | 591,972 | $ | 152,269 | $ | (295 | ) | $ | 151,974 | $ | 1,166,882 | |||||||||||
Intersegment sales (3) | 447 | 56,048 | 5 | — | 5 | 56,500 | ||||||||||||||||||
Value-added sales | 339,903 | 168,600 | 104,232 | (3,644 | ) | 100,588 | 609,091 | |||||||||||||||||
Operating profit (loss) | 30,737 | 8,427 | 4,262 | (16,595 | ) | (12,333 | ) | 26,831 | ||||||||||||||||
Depreciation, depletion, and amortization | 23,033 | 9,037 | 8,446 | 1,133 | 9,579 | 41,649 | ||||||||||||||||||
Expenditures for long-lived assets | 18,354 | 4,201 | 6,763 | 3,306 | 10,069 | 32,624 | ||||||||||||||||||
Assets | 428,706 | 184,027 | 122,964 | 42,248 | 165,212 | 777,945 | ||||||||||||||||||
2012 | ||||||||||||||||||||||||
Net sales | $ | 424,480 | $ | 694,793 | $ | 153,038 | $ | 767 | $ | 153,805 | $ | 1,273,078 | ||||||||||||
Intersegment sales (3) | 1,268 | 53,169 | 99 | — | 99 | 54,536 | ||||||||||||||||||
Value-added sales | 336,977 | 172,124 | 106,383 | 79 | 106,462 | 615,563 | ||||||||||||||||||
Operating profit (loss) | 29,319 | 21,760 | 1,727 | (16,030 | ) | (14,303 | ) | 36,776 | ||||||||||||||||
Depreciation, depletion, and amortization | 19,486 | 8,078 | 8,204 | 1,278 | 9,482 | 37,046 | ||||||||||||||||||
Expenditures for long-lived assets | 31,473 | 5,646 | 6,227 | 1,315 | 7,542 | 44,661 | ||||||||||||||||||
Assets | 427,745 | 222,828 | 119,475 | 44,869 | 164,344 | 814,917 | ||||||||||||||||||
(1) | Other represents the Precision Coatings group, which is a business included in the Other reportable segment. |
(2) | Costs associated with our unallocated corporate functions have been shown separately to better illustrate the financial information for the businesses within the Other reportable segment. |
(3) | Intersegment sales are eliminated in consolidation. |
The primary measure of evaluating segment performance is operating profit. In addition to net sales, value-added sales is also reviewed. Value-added sales represents a non-GAAP measure which removes the impact of pass-through metal costs and allows for analysis without the distortion of the movement or volatility in pass-through metal prices. Value-added sales is a metric of particular importance to the Advanced Materials segment, since a significant portion of Advanced Materials net sales are based on the value of precious metals which can fluctuate significantly from period to period.
From a segment assets perspective, segments are evaluated based upon a return on assets metric, which includes inventory (excluding the impact of LIFO), accounts receivable, and property, plant, and equipment. Therefore, segment assets listed in the above table represent the total of these three amounts.
The Other reportable segment includes the operating results and assets of the Precision Coatings group, as well as unallocated corporate costs and assets.
77
Other geographic information includes the following:
(Thousands) | 2014 | 2013 | 2012 | |||||||||
Net sales from U.S. operations | $ | 884,175 | $ | 962,288 | $ | 1,064,779 | ||||||
Net sales based upon location of customers | ||||||||||||
United States | $ | 731,203 | $ | 810,642 | $ | 881,968 | ||||||
All other | 395,687 | 356,240 | 391,110 | |||||||||
Total | $ | 1,126,890 | $ | 1,166,882 | $ | 1,273,078 | ||||||
Long-lived assets by country deployed | ||||||||||||
United States | $ | 322,090 | $ | 340,922 | $ | 354,122 | ||||||
All other | 30,782 | 31,944 | 36,042 | |||||||||
Total | $ | 352,872 | $ | 372,866 | $ | 390,164 | ||||||
No individual country, other than the United States, or customer accounted for 10% or more of the Company’s net sales for the years presented. Net sales outside of the United States are primarily to Asia and Europe.
Note N — Other-net
Other-net is summarized for 2014, 2013, and 2012 as follows:
Income (Expense) | ||||||||||||
(Thousands) | 2014 | 2013 | 2012 | |||||||||
Foreign currency exchange/translation gain (loss) | $ | 1,676 | $ | 1,506 | $ | 1,477 | ||||||
Amortization of intangible assets | (5,169 | ) | (5,529 | ) | (6,008 | ) | ||||||
Metal consignment fees | (7,332 | ) | (7,218 | ) | (9,011 | ) | ||||||
Net gain (loss) on disposal of fixed assets | 2,435 | (1,459 | ) | (1,836 | ) | |||||||
Recovery from insurance | 6,750 | — | — | |||||||||
Legal settlement | 4,000 | — | — | |||||||||
Consignment facility renegotiation bank fee | — | (853 | ) | — | ||||||||
Other items | (1,338 | ) | (909 | ) | (231 | ) | ||||||
Total | $ | 1,022 | $ | (14,462 | ) | $ | (15,609 | ) | ||||
Note O — Facility Consolidation
During 2012, the Company announced a plan to consolidate various small facilities to improve efficiencies and reduce overhead costs in order to improve profitability and cash flows. As part of this program, two facilities were closed and operations transferred to other existing facilities (one in the fourth quarter of 2012 and the other in the third quarter of 2013), one operation was consolidated from four separate buildings into two in the fourth quarter of 2013, and the majority of equipment from a fourth operation was either transferred to another facility or written off and closed in the first quarter of 2014. The program also involved a reduction in the hourly workforce and management group at other facilities. All of the affected facilities and manpower reductions were within the Advanced Materials and Other segments.
78
Costs associated with the consolidation program included severance and related manpower costs, equipment write-downs, equipment relocations, and other related costs. These costs were included in the Consolidated Statements of Income as follows:
(Thousands) | 2014 | 2013 | ||||||
Cost of sales | $ | 433 | $ | 1,812 | ||||
Selling, general, and administrative expense | 104 | 2,805 | ||||||
Other-net | 170 | 1,373 | ||||||
Total | $ | 707 | $ | 5,990 | ||||
Included in these costs are equipment write-offs of $1.2 million in 2013 that resulted from the abandonment of equipment with no realizable value.
An accrual totaling $2.0 million, primarily for severance and other manpower costs associated with this program, was recorded on the Company's balance sheet as of December 31, 2013. In 2014, the Company also recognized an incremental $0.7 million charge primarily related to facility maintenance costs. Cash payments associated with this program totaled $2.5 million in 2014, primarily related to severance. The accrual balance remaining at December 31, 2014 is $0.2 million.
Note P — Interest
The following chart summarizes the interest incurred, capitalized, and paid, as well as the amortization of capitalized interest for 2014, 2013, and 2012:
(Thousands) | 2014 | 2013 | 2012 | |||||||||
Interest incurred | $ | 3,012 | $ | 3,286 | $ | 3,334 | ||||||
Less capitalized interest | 225 | 250 | 200 | |||||||||
Total net expense | $ | 2,787 | $ | 3,036 | $ | 3,134 | ||||||
Interest paid | $ | 2,215 | $ | 2,671 | $ | 2,639 | ||||||
Amortization of capitalized interest included in cost of sales | $ | 261 | $ | 265 | $ | 336 | ||||||
The difference in expense among 2014, 2013, and 2012 was primarily due to changes in the level of outstanding debt and capital leases and the average borrowing rate. Amortization of deferred financing costs within interest expense was $0.8 million in 2014, $0.7 million in 2013, and $0.6 million in 2012.
79
Note Q — Income Taxes
Income before income taxes and income taxes (benefit) are comprised of the following:
(Thousands) | 2014 | 2013 | 2012 | |||||||||
Income before income taxes: | ||||||||||||
Domestic | $ | 39,789 | $ | 16,528 | $ | 23,379 | ||||||
Foreign | 14,381 | 7,267 | 10,263 | |||||||||
Total income before income taxes | $ | 54,170 | $ | 23,795 | $ | 33,642 | ||||||
Income taxes: | ||||||||||||
Current income taxes: | ||||||||||||
Domestic | $ | 14,487 | $ | 4,325 | $ | 7,825 | ||||||
Foreign | 3,457 | 2,205 | 3,615 | |||||||||
Total current | $ | 17,944 | $ | 6,530 | $ | 11,440 | ||||||
Deferred income taxes (benefit): | ||||||||||||
Domestic | $ | (4,604 | ) | $ | (2,958 | ) | $ | (3,084 | ) | |||
Foreign | (553 | ) | 319 | (44 | ) | |||||||
Valuation allowance | (338 | ) | 197 | 666 | ||||||||
Total deferred | $ | (5,495 | ) | $ | (2,442 | ) | $ | (2,462 | ) | |||
Total income taxes | $ | 12,449 | $ | 4,088 | $ | 8,978 | ||||||
The reconciliation of the federal statutory and effective income tax rates follows:
2014 | 2013 | 2012 | |||||||
Federal statutory rate | 35.0 | % | 35.0 | % | 35.0 | % | |||
State and local income taxes, net of federal tax effect | 0.8 | (0.8 | ) | (0.3 | ) | ||||
Effect of excess of percentage depletion over cost depletion | (5.1 | ) | (11.8 | ) | (7.3 | ) | |||
Manufacturing production deduction | (2.5 | ) | (2.4 | ) | (2.2 | ) | |||
Officers’ compensation | 0.2 | 0.4 | 1.1 | ||||||
Adjustment to unrecognized tax benefits | 0.3 | 0.3 | (0.6 | ) | |||||
Foreign rate differential | (3.2 | ) | (3.1 | ) | (3.1 | ) | |||
Research and experimentation tax credit | (1.3 | ) | (7.4 | ) | — | ||||
Retiree medical expense | — | — | (2.0 | ) | |||||
Valuation allowance | (0.6 | ) | 2.2 | 4.0 | |||||
Other items | (0.6 | ) | 4.8 | 2.1 | |||||
Effective tax rate | 23.0 | % | 17.2 | % | 26.7 | % | |||
Included in domestic income taxes, as shown in the Consolidated Statements of Income, are $0.6 million, $(0.2) million, and $(0.1) million of state and local income taxes in 2014, 2013, and 2012, respectively.
The Company had domestic and foreign income tax payments of $13.1 million, $8.2 million, and $13.2 million in 2014, 2013, and 2012, respectively.
80
Deferred tax assets and liabilities are determined based on temporary differences between the financial reporting bases and the tax bases of assets and liabilities. Deferred tax assets and (liabilities) recorded in the Consolidated Balance Sheets consist of the following:
December 31, | ||||||||
(Thousands) | 2014 | 2013 | ||||||
Asset (liability) | ||||||||
Post-employment benefits other than pensions | $ | 5,543 | $ | 10,989 | ||||
Other reserves | 17,764 | 13,744 | ||||||
Environmental reserves | 1,808 | 1,789 | ||||||
Inventory | 4,808 | 3,934 | ||||||
Pensions | 24,158 | 9,867 | ||||||
Net operating loss and credit carryforwards | 5,714 | 5,588 | ||||||
Miscellaneous | 345 | 303 | ||||||
Subtotal | 60,140 | 46,214 | ||||||
Valuation allowance | (4,444 | ) | (4,782 | ) | ||||
Total deferred tax assets | 55,696 | 41,432 | ||||||
Depreciation | (16,226 | ) | (18,669 | ) | ||||
Amortization | (7,001 | ) | (7,371 | ) | ||||
Capitalized interest expense | (141 | ) | (184 | ) | ||||
Mine development | (571 | ) | (2,309 | ) | ||||
Derivative instruments and hedging activities | (1,250 | ) | (130 | ) | ||||
Total deferred tax liabilities | (25,189 | ) | (28,663 | ) | ||||
Net deferred tax asset | $ | 30,507 | $ | 12,769 | ||||
The Company had deferred income tax assets offset with a valuation allowance for state and foreign net operating losses and state investment tax credit carryforwards. The Company intends to maintain a valuation allowance on these deferred tax assets until a realization event occurs to support reversal of all or a portion of the allowance.
At December 31, 2014, for income tax purposes, the Company had foreign net operating loss carryforwards of $6.5 million that do not expire, and $6.3 million that expire in calendar years 2015 through 2023. The Company had state net operating loss carryforwards of $19.6 million that expire in calendar years 2017 through 2033. The Company had state tax credits of $2.6 million that expire in calendar years 2015 through 2028.
The Company files income tax returns in the U.S. federal jurisdiction, and in various state, local, and foreign jurisdictions. With limited exceptions, the Company is no longer subject to U.S. federal examinations for years before 2010, state and local examinations for years before 2010, and foreign examinations for tax years before 2008. The Company is not presently under examination for its income tax filings.
A reconciliation of the Company’s unrecognized tax benefits for the year-to-date periods ending December 31, 2014 and 2013 is as follows:
(Thousands) | 2014 | 2013 | ||||||
Balance as of January 1 | $ | 1,679 | $ | 1,767 | ||||
Additions to tax provisions related to the current year | 12 | — | ||||||
Additions to tax positions related to prior years | 483 | 484 | ||||||
Reduction to tax positions related to prior years | — | (17 | ) | |||||
Lapses on statutes of limitations | (384 | ) | (555 | ) | ||||
Balance as of December 31 | $ | 1,790 | $ | 1,679 | ||||
At December 31, 2014, the Company had $1.8 million of unrecognized tax benefits, of which $1.0 million would affect the Company’s effective tax rate if recognized.
81
The Company classifies all interest and penalties as income tax expense. The amount of interest and penalties, net of related federal tax benefit, recognized in earnings was immaterial during 2014, 2013, and 2012. As of December 31, 2014 and 2013, accrued interest and penalties, net of related federal tax benefit, were immaterial.
A provision has not been made with respect to $53.2 million of unremitted earnings at December 31, 2014 because such earnings may be considered to be reinvested indefinitely. It is not practical to estimate the amount of unrecognized deferred tax liability for undistributed foreign earnings.
Note R — Earnings Per Share
The following table sets forth the computation of basic and diluted EPS:
(Thousands except per share amounts) | 2014 | 2013 | 2012 | |||||||||
Numerator for basic and diluted EPS: | ||||||||||||
Net income | $ | 41,721 | $ | 19,707 | $ | 24,664 | ||||||
Denominator: | ||||||||||||
Denominator for basic EPS: | ||||||||||||
Weighted-average shares outstanding | 20,461 | 20,571 | 20,418 | |||||||||
Effect of dilutive securities: | ||||||||||||
Stock options and stock appreciation rights | 185 | 188 | 163 | |||||||||
Restricted stock | 95 | 101 | 94 | |||||||||
Performance-based restricted shares | 69 | 35 | 4 | |||||||||
Diluted potential common shares | 349 | 324 | 261 | |||||||||
Denominator for diluted EPS: | ||||||||||||
Adjusted weighted-average shares outstanding | 20,810 | 20,895 | 20,679 | |||||||||
Basic EPS | $ | 2.04 | $ | 0.96 | $ | 1.21 | ||||||
Diluted EPS | $ | 2.00 | $ | 0.94 | $ | 1.19 | ||||||
SARs with grants in excess of the average annual share price totaling 329,000 in 2014, 368,000 in 2013, and 465,000 in 2012 were excluded from the diluted EPS calculation as their effect would have been anti-dilutive.
82
Note S — Quarterly Data (Unaudited)
The following tables summarize selected quarterly financial data for the years ended December 31, 2014 and 2013:
2014 | ||||||||||||||||||||
(Thousands except per share amounts) | First Quarter | Second Quarter | Third Quarter | Fourth Quarter | Total | |||||||||||||||
Net sales | $ | 258,929 | $ | 287,965 | $ | 291,570 | $ | 288,426 | $ | 1,126,890 | ||||||||||
Gross margin | 45,462 | 49,801 | 54,843 | 55,797 | 205,903 | |||||||||||||||
Percent of net sales | 17.6 | % | 17.3 | % | 18.8 | % | 19.3 | % | 18.3 | % | ||||||||||
Net income | $ | 7,331 | $ | 9,974 | $ | 12,440 | $ | 11,976 | $ | 41,721 | ||||||||||
Net income per share of common stock: | ||||||||||||||||||||
Basic | $ | 0.36 | $ | 0.48 | $ | 0.61 | $ | 0.59 | $ | 2.04 | ||||||||||
Diluted | 0.35 | 0.47 | 0.60 | 0.58 | 2.00 | |||||||||||||||
Cash dividends per share of common stock | 0.08 | 0.085 | 0.085 | 0.085 | 0.335 | |||||||||||||||
Stock price range: | ||||||||||||||||||||
High | $ | 35.19 | $ | 37.96 | $ | 39.38 | $ | 40.60 | ||||||||||||
Low | 25.21 | 31.69 | 30.88 | 26.64 | ||||||||||||||||
2013 | ||||||||||||||||||||
First Quarter | Second Quarter | Third Quarter | Fourth Quarter | Total | ||||||||||||||||
Net sales | $ | 299,169 | $ | 306,141 | $ | 275,434 | $ | 286,138 | $ | 1,166,882 | ||||||||||
Gross margin | 48,339 | 45,992 | 44,483 | 49,164 | 187,978 | |||||||||||||||
Percent of net sales | 16.2 | % | 15.0 | % | 16.2 | % | 17.2 | % | 16.1 | % | ||||||||||
Net income | $ | 6,785 | $ | 4,155 | $ | 4,992 | $ | 3,775 | $ | 19,707 | ||||||||||
Net income per share of common stock: | ||||||||||||||||||||
Basic | $ | 0.33 | $ | 0.20 | $ | 0.24 | $ | 0.18 | $ | 0.96 | ||||||||||
Diluted | 0.33 | 0.20 | 0.24 | 0.18 | 0.94 | |||||||||||||||
Cash dividends per share of common stock | 0.075 | 0.080 | 0.080 | 0.080 | 0.315 | |||||||||||||||
Stock price range: | ||||||||||||||||||||
High | $ | 29.81 | $ | 31.49 | $ | 33.69 | $ | 32.73 | ||||||||||||
Low | 26.20 | 24.58 | 27.09 | 25.75 | ||||||||||||||||
During the fourth quarter of 2013, the Company determined that there were procedural errors made during the reconciliation of the physical inventory counts taken and recorded at one of its facilities within the Advanced Materials reporting segment during the second and third quarters of 2013 that were not detected by the management review process on a timely basis. The Company, after determining that these errors were material to the applicable quarterly financial results, filed amended Quarterly Reports on Form 10-Q in March of 2014 with corrected financial statements for the periods ended June 28, 2013 and September 27, 2013.
The corrections reduced the previously reported gross margin in the second quarter of 2013 by $6.8 million and net income by $4.8 million, or $0.23 per share diluted. The corrections reduced the previously reported gross margin by $0.7 million in the third quarter of 2013. Net income was reduced by $0.1 million and earnings per share was reduced by a nominal amount in the third quarter of 2013. The figures in the above table represent the corrected amounts for each quarter.
83
Item 9. | CHANGES IN AND DISAGREEMENTS WITH ACCOUNTANTS ON ACCOUNTING AND FINANCIAL DISCLOSURE |
None.
Item 9A. | CONTROLS AND PROCEDURES |
a)Evaluation of Disclosure Controls and Procedures
We carried out an evaluation under the supervision and with participation of our management, including the chief executive officer and chief financial officer, of the effectiveness of the design and operation of our disclosure controls and procedures as of December 31, 2014 pursuant to Rule 13a-15(b) and 15d-15(b) under the Securities Exchange Act of 1934, as amended (Exchange Act).
b)Management’s Report on Internal Control over Financial Reporting
The Report of Management on Internal Control over Financial Reporting and of the Report of Independent Registered Public Accounting Firm thereon are set forth in Item 8 of this Form 10-K and are incorporated herein by reference.
c)Changes in Internal Control over Financial Reporting
During the year ended December 31, 2014, we implemented internal control procedures to address a material weakness recognized during 2013 related to our physical inventory count reconciliation process at one of our facilities. These internal controls included (a) timely entry of third-party refiner movement transactions and the associated reconciliation of third-party refiner monthly statements to our perpetual inventory system, (b) testing of the associated system report of inventory held at third party refiners for accuracy and completeness, (c) enhancement of the reconciliation review process including the completion of a formal audit program performed by independent members of management, (d) a quarterly executive management team analysis and discussion of all results and key components of the reconciliation and audit process. After completing our testing of the design and operating effectiveness of these new procedures, we concluded that we have remediated the previously identified material weakness as of December 31, 2014.
Except for the items described above, there have been no other changes in our internal control over financial reporting identified in connection with the evaluation required by Rule 13a-15(d) and 15d-15(d) of the Exchange Act that occurred during the three months ended December 31, 2014 that has materially affected, or is reasonably likely to materially affect, our internal control over financial reporting.
Item 9B. | OTHER INFORMATION |
None.
84
PART III
Item 10. | DIRECTORS, EXECUTIVE OFFICERS AND CORPORATE GOVERNANCE |
The information under “Election of Directors” in the proxy statement for our 2015 annual meeting of shareholders, to be filed with the Securities and Exchange Commission pursuant to Regulation 14A, is incorporated herein by reference. The information required by Item 10 relating to our executive officers is included under the caption “Executive Officers of the Registrant” in Part I of this Form 10-K and is incorporated herein by reference. The information required by Item 10 with respect to directors, the Audit Committee of the Board of Directors and Audit Committee financial experts is incorporated herein by reference from the section entitled “Corporate Governance; Committees of the Board of Directors — Audit Committee” and “— Audit Committee Expert, Financial Literacy and Independence” in the proxy statement for our 2015 annual meeting of shareholders to be filed with the Securities and Exchange Commission pursuant to Regulation 14A. The information required by Item 10 regarding compliance with Section 16(a) of the Exchange Act is incorporated herein by reference from the section entitled “Section 16(a) Beneficial Ownership Reporting Compliance” in the proxy statement for our 2015 annual meeting of shareholders to be filed with the Securities and Exchange Commission pursuant to Regulation 14A.
We have adopted a Policy Statement on Significant Corporate Governance Issues and a Code of Conduct Policy that applies to our chief executive officer and senior financial officers, including the principal financial and accounting officer, controller and other persons performing similar functions, in compliance with applicable New York Stock Exchange and Securities and Exchange Commission requirements. The aforementioned materials, along with the charters of the Audit, Governance and Organization and Compensation Committees of our Board of Directors, which also comply with applicable requirements, are available on our web site at http://materion.com, and copies are also available upon request by any shareholder to Secretary, Materion Corporation, 6070 Parkland Boulevard, Mayfield Heights, Ohio 44124. We make our reports on Forms 10-K, 10-Q, and 8-K available on our web site, free of charge, as soon as reasonably practicable after these reports are filed with the Securities and Exchange Commission, and any amendments and/or waivers to our Code of Conduct Policy, Policy Statement on Significant Corporate Governance Issues and Committee Charters will also be made available on our web site. The information on our web site is not incorporated by reference into this Form 10-K.
Item 11. | EXECUTIVE COMPENSATION |
The information required under Item 11 is incorporated by reference from the sections entitled “Executive Compensation” and “2014 Director Compensation” in the proxy statement for our 2015 annual meeting of shareholders to be filed with the Securities and Exchange Commission pursuant to Regulation 14A.
85
Item 12. | SECURITY OWNERSHIP OF CERTAIN BENEFICIAL OWNERS AND MANAGEMENT AND RELATED STOCKHOLDER MATTERS |
The information required under Item 12 regarding security ownership is incorporated by reference from the section entitled “Security Ownership of Certain Beneficial Owners and Management” in the proxy statement for our 2015 annual meeting of shareholders to be filed with the Securities and Exchange Commission pursuant to Regulation 14A. The securities authorized for issuance information required by Item 12 is set forth in the table below.
Equity Compensation Plan Information
Plan Category | Number of Securities to be Issued Upon Exercise of Outstanding Options, Warrants and Rights (1) | Weighted-average Exercise Price of Outstanding Options, Warrants and Rights | Number of Securities Remaining available for Future Issuance Under Equity Compensation Plan (Excluding Securities Reflected in Column a) (2) | ||||||
Equity compensation plans approved by security holders | 968,210 | $28.32 | 1,009,986 | ||||||
Equity compensation plans not approve be security holders | — | — | — | ||||||
Total | 968,210 | $28.32 | 1,009,986 | ||||||
(1) Consists of SARs awarded under the 2006 Stock Incentive Plan, as Amended and Restated.
(2) Represents the number of shares of common stock available to be awarded as of December 31, 2014. Effective May 7, 2014, all equity compensation awards are granted pursuant to the shareholder approved 2006 Stock Incentive Plan, as Amended and Restated and the 2006 Non-employee Director Equity Plan, as Amended and Restated.
Item 13. | CERTAIN RELATIONSHIPS AND RELATED TRANSACTIONS, AND DIRECTOR INDEPENDENCE |
The information required under Item 13 is incorporated herein by reference from the sections entitled “Related Party Transactions” and “Corporate Governance; Committees of the Board of Directors — Director Independence” of the proxy statement for our 2015 annual meeting of shareholders to be filed with the Securities and Exchange Commission pursuant to Regulation 14A.
Item 14. | PRINCIPAL ACCOUNTANT FEES AND SERVICES |
The information required under Item 14 is incorporated herein by reference from the section entitled “Ratification of Independent Registered Public Accounting Firm” of the proxy statement for our 2015 annual meeting of shareholders to be filed with the Securities and Exchange Commission pursuant to Regulation 14A.
86
PART IV
Item 15. | EXHIBITS AND FINANCIAL STATEMENT SCHEDULES |
(a) | 1. Financial Statements and Supplemental Information |
The financial statements listed in the accompanying index to financial statements are included in Item 8 of this Form 10-K.
(a) | 2. Financial Statement Schedules |
The following consolidated financial information for the years ended December 31, 2014, 2013, and 2012 is submitted herewith:
Schedule II — Valuation and qualifying accounts.
All other schedules for which provision is made in the applicable accounting regulations of the Securities and Exchange Commission are not required under the related instructions or are inapplicable, and therefore have been omitted.
(a) | 3. Exhibits |
All documents referenced below were filed pursuant to the Exchange Act by Materion Corporation, file number 001-15885, unless otherwise noted.
(3a) | Amended and Restated Articles of Incorporation of Materion Corporation (filed as Exhibit 3.2 to the Company's Quarterly Report on Form 10-Q for the period ended on June 27, 2014), incorporated herein by reference. | |
(3b) | Amended and Restated Code of Regulations (filed as Exhibit 3.1 to the Company’s Quarterly Report on Form 10-Q for the period ended June 27, 2014), incorporated herein by reference. | |
(4a) | Indenture Modification between Toledo-Lucas County Port Authority, dated as of May 30, 2003 (filed as Exhibit 4 to the Company’s Quarterly Report on Form 10-Q for the period ended June 27, 2003), incorporated herein by reference. | |
(4b) | Pursuant to Regulation S-K, Item 601(b)(4), the Company agrees to furnish to the Securities and Exchange Commission, upon its request, a copy of the instruments defining the rights of holders of long-term debt of the Company that are not being filed with this report. | |
(4c) | Second Amended and Restated Credit Agreement dated June 20, 2013, among Materion Corporation, Materion Advanced Materials Technologies and Services Netherlands B.V., JPMorgan Chase Bank, N.A. and other lenders from time to time party thereto (filed as Exhibit 10.1 to the Company's Form 8-K filed on June 25, 2013), incorporated herein by reference. | |
(4d) | Third Amended and Restated Precious Metals Agreement dated October 1, 2010, between Brush Engineered Materials Inc. and other borrowers and The Bank of Nova Scotia (filed as Exhibit 4.2 to the Company’s Form 8-K filed on October 4, 2010), incorporated herein by reference. | |
(4e) | Amendment No. 1 to the Third Amended and Restated Precious Metals Agreement dated March 31, 2011, among Materion Corporation and other borrowers and The Bank of Nova Scotia (filed as Exhibit 10.1 to the Company’s Form 8-K filed on April 6, 2011), incorporated herein by reference. | |
(4f) | Amendment No. 2 to the Third Amended and Restated Precious Metals Agreement dated August 18, 2011, among Materion Corporation and other borrowers and The Bank of Nova Scotia (filed as Exhibit 10.1 to the Company’s Form 8-K filed on August 22, 2011), incorporated herein by reference. | |
(4g) | Amendment No. 3 to the Third Amended and Restated Precious Metals Agreement dated October 17, 2011, among Materion Corporation and other borrowers and The Bank of Nova Scotia (filed as Exhibit 10.1 to the Company’s Form 8-K filed on October 18, 2011), incorporated herein by reference. | |
(4h) | Amendment No. 4 to the Third Amended and Restated Precious Metals Agreement dated September 13, 2013, among Materion Corporation and other borrowers and The Bank of Nova Scotia (filed as Exhibit 10.1 to the Company's Form 8-K filed on September 18, 2013), incorporated herein by reference. | |
(4i)# | Amendment No. 5 to the Third Amended and Restated Precious Metals Agreement dated January 13, 2015, among Materion Corporation and other borrowers and The Bank of Nova Scotia. | |
(10a) | Form of Indemnification Agreement entered into by the Company and its executive officers (filed as Exhibit 10a to the Company’s Annual Report on Form 10-K for the year ended December 31, 2008), incorporated herein by reference. | |
87
(10b) | Form of Indemnification Agreement entered into by the Company and its directors (filed as Exhibit 10b to the Company’s Annual Report on Form 10-K for the year ended December 31, 2008), incorporated herein by reference. | |
(10c)* | Amended and Restated Form of Severance Agreement for Executive Officers (filed as Exhibit 10.2 to the Company’s Quarterly Report on Form 10-Q for the period ended June 27, 2008), incorporated herein by reference. | |
(10d)* | Amendment No. 1 to Amended and Restated Severance Agreement, dated May 4, 2011 (filed as Exhibit 10.2 to the Company’s Quarterly Report on Form 10-Q for the period ended July 1, 2011), incorporated herein by reference. | |
(10e)* | Amended and Restated Form of Severance Agreement for Key Employees (filed as Exhibit 10.1 to the Company’s Quarterly Report on Form 10-Q for the period ended June 27, 2008), incorporated herein by reference. | |
(10f)* | Form of Executive Insurance Agreement entered into by the Company and certain employees dated January 2, 2002 (filed as Exhibit 10g to the Company’s Annual Report on Form 10-K for the year ended December 31, 1994), incorporated herein by reference. | |
(10g)* | Form of Trust Agreement between the Company and Key Trust Company of Ohio, N.A. (formerly Ameritrust Company National Association) on behalf of the Company’s executive officers (filed as Exhibit 10e to the Company’s Annual Report on Form 10-K for the year ended December 31, 1994), incorporated herein by reference. | |
(10h)* | Materion Corporation Management Incentive Plan (filed as Exhibit 10.1 to the Company's Current Report on Form 8-K filed by the Company on May 29, 2013), incorporated herein by reference. | |
(10i)*# | 2015 Management Incentive Plan. | |
(10j)* | 1995 Stock Incentive Plan (as Amended March 3, 1998) (filed as Appendix A to the Company’s Proxy Statement dated March 16, 1998), incorporated herein by reference. | |
(10k)* | Amendment No. 1, effective May 16, 2000, to the 1995 Stock Incentive Plan (filed as Exhibit 4b to Post-Effective Amendment No. 1 to Registration Statement on Form S-8, Registration No. 333-63357), incorporated herein by reference. | |
(10l)* | Amendment No. 2, effective February 1, 2005, to the 1995 Stock Incentive Plan (filed as Exhibit 10.4 to the Current Report on Form 8-K filed by the Company on February 7, 2005) incorporated herein by reference. | |
(10m)* | Amended and Restated 2006 Stock Incentive Plan (filed as Exhibit 10.3 to the Company’s Quarterly Report on Form 10-Q for the period ended June 27, 2008), incorporated herein by reference. | |
(10n)* | Amended and Restated Materion Corporation 2006 Stock Incentive Plan (as Amended and Restated as of May 4, 2011) (filed as Exhibit 10.1 to the Registrant’s Form 8-K filed on May 5, 2011), incorporated herein by reference. | |
(10o)* | Amended and Restated Materion Corporation 2006 Stock Incentive Plan (as Amended and Restated as of May 7, 2014) (filed as Exhibit 4.4 to the Registration Statement on Form S-8 (Registration No. 333-195762), incorporated herein by reference. | |
(10p)* | Form of 2011 Restricted Stock Units Agreement (Stock-settled) (filed as Exhibit 10.1 to the Company’s Form 8-K filed on March 3, 2011), incorporated herein by reference. | |
(10q)* | Form of 2011 Restricted Stock Units Agreement (Cash-settled) (filed as Exhibit 10.2 to the Company’s Form 8-K filed on March 3, 2011), incorporated herein by reference. | |
(10r)* | Form of 2012 Restricted Stock Units Agreement (Cash-Settled) (filed as Exhibit 10aa to the Company's Annual Report on Form 10-K for the year ended December 31, 2012), incorporated herein by reference. | |
(10s)* | Form of 2012 Restricted Stock Units Agreement (Stock-Settled) (filed as Exhibit 10ab to the Company's Annual Report on Form 10-K for the year ended December 31, 2012), incorporated herein by reference. | |
(10t)* | Form of 2012 Performance-Based Restricted Stock Units and Performance Shares Agreement (Cash-settled) (filed as Exhibit 10ad to the Company's Annual Report on Form 10-K for the year ended December 31, 2012), incorporated herein by reference. | |
(10u)* | Form of 2012 Performance-Based Restricted Stock Units and Performance Shares Agreement (Stock-settled) (filed as Exhibit 10ae to the Company's Annual Report on Form 10-K for the year ended December 31, 2012), incorporated herein by reference. | |
(10v)* | Form of 2012 Restricted Stock Units Agreement (Cash-Settled) (filed as Exhibit 10aa to the Company's Annual Report on Form 10-K for the year ended December 31, 2012), incorporated herein by reference. | |
88
(10w)* | Form of 2014 Performance-Based Restricted Stock Units (Cash-settled) (filed as Exhibit 10y to the Company's Annual Report on Form 10-K for the year ended December 31, 2013), incorporated herein by reference. | |
(10x)* | Form of 2014 Performance-Based Restricted Stock Units (Stock-settled) (filed as Exhibit 10z to the Company's Annual Report on Form 10-K for the year ended December 31, 2013), incorporated herein by reference. | |
(10y)* | Form of 2006 Stock Appreciation Rights Agreement (filed as Exhibit 10.3 to the Current Report on Form 8-K filed by the Company on May 8, 2006), incorporated herein by reference. | |
(10z)* | Form of 2007 Stock Appreciation Rights Agreement (filed as Exhibit 10.5 to Amendment No. 1 to the Current Report on Form 8-K filed by the Company on February 16, 2007), incorporated herein by reference. | |
(10aa)* | Form of 2008 Stock Appreciation Rights Agreement (filed as Exhibit 10an to the Company’s Annual Report on Form 10-K for the year ended December 31, 2007), incorporated herein by reference. | |
(10ab)* | Form of 2009 Stock Appreciation Rights Agreement (filed as Exhibit 10ag to the Company’s Annual Report on Form 10-K for the year ended December 31, 2008), incorporated herein by reference. | |
(10ac)* | Form of 2010 Stock Appreciation Rights Agreement (filed as Exhibit 10ah to the Company’s Annual Report on Form 10-K for the year ended December 31, 2009), incorporated herein by reference. | |
(10ad)* | Form of 2011 Stock Appreciation Rights Agreement (filed as Exhibit 10.3 to the Company’s Form 8-K filed on March 3, 2011), incorporated herein by reference. | |
(10ae)* | Materion Corporation Supplemental Retirement Benefit Plan (filed as Exhibit 10.1 to the Company’s Form 8-K filed on September 19, 2011), incorporated herein by reference. | |
(10af)* | Amendment No. 1 to the Supplemental Retirement Benefit Plan (filed as Exhibit 10al to the Company's Annual Report on Form 10-K for the year ended December 31, 2012), incorporated herein by reference. | |
(10ag)* | Amendment No. 2 to the Supplemental Retirement Benefit Plan (filed as Exhibit 10ah to the Company's Annual Report on Form 10-K for the year ended December 31, 2013), incorporated herein by reference. | |
(10ah)* | Key Employee Share Option Plan (filed as Exhibit 4.1 to the Registration Statement on Form S-8, Registration No. 333-52141, filed by Brush Wellman Inc. on May 5, 1998), incorporated herein by reference. | |
(10ai)* | Amendment No. 1 to the Key Employee Share Option Plan (effective May 16, 2005) (filed as Exhibit 4b to Post-Effective Amendment No. 1 to Registration Statement on Form S-8, Registration No. 333-52141), incorporated herein by reference. | |
(10aj)* | Amendment No. 2 to the Key Employee Share Option Plan dated June 10, 2005 (filed as Exhibit 10aw to the Company’s Annual Report on Form 10-K for the year ended December 31, 2006), incorporated herein by reference. | |
(10ak)* | Amendment No. 3 to the Key Employee Share Option Plan dated July 12, 2011 (filed as Exhibit 10.4 to the Company’s Quarterly Report on Form 10-Q for the period ended July 1, 2011), incorporated herein by reference. | |
(10al)* | 1997 Stock Incentive Plan for Non-employee Directors (As Amended and Restated as of May 1, 2001) (filed as Appendix B to the Company’s Proxy Statement dated March 19, 2001), incorporated herein by reference. | |
(10am)* | Amendment No. 1 to the 1997 Stock Incentive Plan for Non-employee Directors (filed as Exhibit 10gg to the Company’s Annual Report on Form 10-K for the year ended December 31, 2003), incorporated herein by reference. | |
(10an)* | 1992 Deferred Compensation Plan for Non-employee Directors (As Amended and Restated as of December 2, 1997) (filed as Exhibit 4d to the Registration Statement on Form S-8, Registration No. 333-63355, filed by Brush Wellman Inc.), incorporated herein by reference. | |
(10ao)* | 2000 Reorganization Amendment, dated May 16, 2000, to the 1997 Deferred Compensation Plan for Non-employee Directors (filed as Exhibit 4b to Post-Effective Amendment No. 1 to Registration Statement on Form S-8, Registration No. 333-63353), incorporated herein by reference. | |
(10ap)* | Amendment No. 1 (effective September 11, 2001) to the 1992 Deferred Compensation Plan for Non-employee Directors (filed as Exhibit 4c to the Company’s Post-Effective Amendment No. 1 to Registration Statement on Form S-8, Registration No. 333-74296), incorporated herein by reference. | |
(10aq)* | 1992 Deferred Compensation Plan for Non-employee Directors (As Amended and Restated as of December 2, 1997) (filed as Exhibit 4d to the Registration Statement on Form S-8, Registration No. 333-63355, filed by Brush Wellman Inc.), incorporated herein by reference. | |
89
(10ar)* | Amendment No. 2 (effective September 13, 2004) to the 1992 Deferred Compensation Plan for Non-employee Directors (filed as Exhibit 10.1 to the Company’s Quarterly Report on Form 10-Q for the period ended October 1, 2004), incorporated herein by reference. | |
(10as)* | Amendment No. 3 (effective January 1, 2005) to the 1992 Deferred Compensation Plan for Non-employee Directors (filed as Exhibit 10rr to the Company’s Annual Report on Form 10-K for the year ended December 31, 2004), incorporated herein by reference. | |
(10at)* | Amendment No. 4 (effective April 1, 2009) to the 1992 Deferred Compensation Plan for Non- employee Directors (filed as Exhibit 10bb to the Company’s Annual Report on Form 10-K for the year ended December 31, 2008), incorporated herein by reference. | |
(10au)* | Amended and Restated 2005 Deferred Compensation Plan for Non-employee Directors (filed as Exhibit 10.2 to the Company’s Quarterly Report on Form 10-Q for the period ended September 26, 2008), incorporated herein by reference. | |
(10av)* | Amended and Restated Materion Corporation 2006 Non-employee Director Equity Plan (as Amended and Restated as of May 4, 2011) (filed as Appendix B to the Registrant’s Proxy Statement filed on March 25, 2011), incorporated herein by reference. | |
(10aw)* | First Amendment to the 2006 Non-employee Director Equity Plan (as Amended and Restated as of May 4, 2011) (filed as Exhibit 10bb to the Company's Annual Report on Form 10-K for the year ended December 31, 2012), incorporated herein by reference. | |
(10ax)* | Amended and Restated Materion Corporation 2006 Non-employee Director Equity Plan (as Amended and Restated as of May 7, 2014) (filed as Exhibit 4.4 to the Registration Statement on Form S-8 (Registration No. 333-195761), incorporated herein by reference. | |
(10ay)* | Amended and Restated Executive Deferred Compensation Plan II (filed as Exhibit 10.1 to the Company’s Quarterly Report on Form 10-Q for the period ended March 28, 2008), incorporated herein by reference. | |
(10az)* | Amendment No. 1 to the Amended and Restated Executive Deferred Compensation Plan II (filed as Exhibit 10bf to the Company’s Annual Report on Form 10-K for the year ended December 31, 2008), incorporated herein by reference. | |
(10ba)* | Amendment No. 2 to the Amended and Restated Executive Deferred Compensation Plan II (filed as Exhibit 10.2 to the Company’s Quarterly Report on Form 10-Q for the period ended July 3, 2009), incorporated herein by reference. | |
(10bb)* | Amendment No. 3 to the Amended and Restated Executive Deferred Compensation Plan II, dated July 6, 2011 (filed as Exhibit 10.3 to the Company’s Quarterly Report on Form 10-Q for the period ended July 1, 2011), incorporated herein by reference. | |
(10bc)* | Trust Agreement between the Company and Fidelity Investments dated September 26, 2006 for certain deferred compensation plans for Non-employee Directors of the Company (filed as Exhibit 99.4 to the Current Report on Form 8-K filed by the Company on September 29, 2006), incorporated herein by reference. | |
(10bd)* | Trust Agreement between the Company and Fidelity Management Trust Company, dated June 25, 2009 relating to the Executive Deferred Compensation Plan II (filed as Exhibit 10.1 to the Company’s Quarterly Report on Form 10-Q for the period ended July 3, 2009), incorporated herein by reference. | |
(10be) | Trust Agreement between the Company and Fifth Third Bank N.A. dated September 25, 2006 relating to the Key Employee Share Option Plan (filed as Exhibit 99.3 to the Current Report on Form 8-K filed by the Company on September 29, 2006), incorporated herein by reference. | |
(10bf) | Lease dated as of October 1, 1996, between Brush Wellman Inc. and Toledo-Lucas County Port Authority (filed as Exhibit 10v to the Company’s Annual Report on Form 10-K for the year ended December 31, 1996), incorporated herein by reference. | |
(10bg) | Amended and Restated Inducement Agreement with the Prudential Insurance Company of America dated May 30, 2003 (filed as Exhibit 10 to the Company’s Quarterly Report on Form 10-Q for the period ended June 27, 2003), incorporated herein by reference. | |
(10bh) | Amended and Restated Supply Agreement between RWE Nukem, Inc. and Brush Wellman Inc. for the sale and purchase of beryllium products (filed as Exhibit 10 to the Company’s Quarterly Report on Form 10-Q for the period ended September 26, 2003), incorporated herein by reference. | |
(10bi) | Supply Agreement between the Defense Logistics Agency and Brush Wellman Inc. for the sale and purchase of beryllium products (filed as Exhibit 10tt to the Company’s Annual Report on Form 10-K for the year ended December 31, 2004), incorporated herein by reference. | |
90
(10bj) | Asset Purchase Agreement by and between Williams Advanced Materials Inc. and Techni-Met, Inc. dated December 20, 2007 (filed as Exhibit 10bw to the Company’s Annual Report on Form 10-K for the year ended December 31, 2007), incorporated herein by reference. | |
(10bk) | Consignment Agreement dated October 2, 2009 between Brush Engineered Materials Inc. and Canadian Imperial Bank of Commerce and CIBC World Markets Inc. (filed as Exhibit 10.1 to the Company’s Form 8-K on October 8, 2009), incorporated herein by reference. | |
(10bl) | Amendment No. 1 to the Consignment Agreement dated October 2, 2009 between Brush Engineered Materials Inc. and Canadian Imperial Bank of Commerce and CIBC World Markets Inc. (filed as Exhibit 99.1 to the Company’s Form 8-K on March 12, 2010), incorporated herein by reference. | |
(10bm) | Amendment No. 2 to the Consignment Agreement dated June 11, 2010 between Brush Engineered Materials Inc. and Canadian Imperial Bank of Commerce and CIBC World Markets Inc. (filed as Exhibit 99.1 to the Company’s Form 8-K filed on June 14, 2010), incorporated herein by reference. | |
(10bn) | Amendment No. 3 to the Consignment Agreement dated September 30, 2010 between Brush Engineered Materials Inc. and Canadian Imperial Bank of Commerce and CIBC World Markets Inc. (filed as Exhibit 10.1 to the Company’s Form 8-K on October 4, 2010), incorporated herein by reference. | |
(10bo) | Amendment No. 4 to the Consignment Agreement dated November 10, 2010 between Brush Engineered Materials Inc. and Canadian Imperial Bank of Commerce and CIBC World Markets Inc. (filed as Exhibit 99.1 to the Company’s Form 8-K on November 12, 2010), incorporated herein by reference. | |
(10bp) | Amendment No. 5 to the Consignment Agreement dated March 7, 2011 between Brush Engineered Materials Inc. and Canadian Imperial Bank of Commerce and CIBC World Markets Inc. (filed as Exhibit 10.1 to the Company’s Quarterly Report on Form 10-Q for the period ended April 1, 2011), incorporated herein by reference. | |
(10bq) | Amendment No. 6 to the Consignment Agreement dated September 13, 2011 between Materion Corporation and Canadian Imperial Bank of Commerce and CIBC World Markets Inc. (filed as Exhibit 10.1 to the Company’s Form 8-K filed on September 16, 2011), incorporated herein by reference. | |
(10br) | Amendment No. 7 to the Consignment Agreement dated August 24, 2012 between Materion Corporation and Canadian Imperial Bank of Commerce and CIBC World Markets Inc. (filed as Exhibit 10.1 to the Company's Form 8-K filed on August 31, 2012), incorporated herein by reference. | |
(10bs) | Amendment No. 8 to the Consignment Agreement dated October 1, 2013 between Materion Corporation and Canadian Imperial Bank of Commerce and CIBC World Markets Inc. (filed as Exhibit 10.1 to the Company's Form 10-Q for the period ended September 26, 2014), incorporated herein by reference. | |
(10bt) | Amendment No. 9 to the Consignment Agreement dated July 23, 2014 between Materion Corporation and Canadian Imperial Bank of Commerce and CIBC World Markets Inc. (filed as Exhibit 10.2 to the Company's Form 10-Q for the period ended September 26, 2014), incorporated herein by reference. | |
(10bu) | Amendment No. 10 to the Consignment Agreement dated September 30, 2014 between Materion Corporation and Canadian Imperial Bank of Commerce and CIBC World Markets Inc. (filed as Exhibit 10.3 to the Company's Form 8-K for the period ended September 26, 2014), incorporated herein by reference. | |
(10bv) | Letter Agreement, dated March 18, 2014, by and between Materion Corporation and GAMCO Asset Management Inc. (filed as Exhibit 10.1 to the Company's Form 10-Q for the period ended March 28, 2014), incorporated herein by reference. | |
(21)# | Subsidiaries of the Registrant. | |
(23)# | Consent of Ernst & Young LLP. | |
(24)# | Power of Attorney. | |
(31.1)# | Certification of Chief Executive Officer required by Rule 13a-14(a) or 15d-14(a). | |
(31.2)# | Certification of Chief Financial Officer required by Rule 13a-14(a) or 15d-14(a). | |
(32)# | Certifications of Chief Executive Officer and Chief Financial Officer required by 18 U.S.C. Section 1350. | |
(95)# | Mine Safety Disclosure Pursuant to Section 1503(a) of the Dodd-Frank Wall Street Reform and Consumer Protection Act for the Fiscal Year Ended December 31, 2013. | |
91
(101.INS) | XBRL Instance Document. | |
(101.SCH) | XBRL Taxonomy Extension Schema Document. | |
(101.CAL) | XBRL Taxonomy Extension Calculation Linkbase Document. | |
(101.DEF) | XBRL Taxonomy Extension Definition Linkbase Document. | |
(101.LAB) | XBRL Taxonomy Extension Label Linkbase Document. | |
(101.PRE) | XBRL Taxonomy Extension Presentation Linkbase Document. | |
* | Denotes a compensatory plan or arrangement. |
# | Filed herewith. |
92
SIGNATURES
Pursuant to the requirements of Section 13 or 15(d) of the Securities Exchange Act of 1934, the registrant has duly caused this report to be signed on its behalf by the undersigned, thereunto duly authorized.
MATERION CORPORATION | ||||||
By: | /s/ RICHARD J. HIPPLE | By: | /s/ JOSEPH P. KELLEY | |||
Richard J. Hipple | Joseph P. Kelley | |||||
Chairman of the Board, President and Chief Executive Officer | Vice President, Finance and Chief Financial Officer | |||||
February 27, 2015
Pursuant to the requirements of the Securities Exchange Act of 1934, this report has been signed below by the following persons on behalf of the registrant and in the capacities and on the dates indicated.
/s/ RICHARD J. HIPPLE | Chairman of the Board, President, Chief Executive Officer and Director (Principal Executive Officer) | February 27, 2015 | ||
Richard J. Hipple | ||||
/s/ JOSEPH P. KELLEY | Vice President, Finance and Chief Financial Officer (Principal Financial and Accounting Officer) | February 27, 2015 | ||
Joseph P. Kelley | ||||
/s/ EDWARD F. CRAWFORD* | Director | February 27, 2015 | ||
Edward F. Crawford* | ||||
/s/ JOSEPH P. KEITHLEY* | Director | February 27, 2015 | ||
Joseph P. Keithley* | ||||
/s/ VINOD M. KHILNANI* | Director | February 27, 2015 | ||
Vinod M. Khilnani* | ||||
/s/ WILLIAM B. LAWRENCE* | Director | February 27, 2015 | ||
William B. Lawrence* | ||||
/s/ N. MOHAN REDDY* | Director | February 27, 2015 | ||
N. Mohan Reddy* | ||||
/s/ CRAIG S. SHULAR* | Director | February 27, 2015 | ||
Craig S. Shular* | ||||
/s/ DARLENE J. S. SOLOMON* | Director | February 27, 2015 | ||
Darlene J. S. Solomon* | ||||
/s/ ROBERT B. TOTH* | Director | February 27, 2015 | ||
Robert B. Toth* | ||||
/s/ GEOFFREY WILD* | Director | February 27, 2015 | ||
Geoffrey Wild* | ||||
* | The undersigned, by signing his/her name hereto, does sign and execute this report on behalf of each of the above-named officers and directors of Materion Corporation, pursuant to Powers of Attorney executed by each such officer and director filed with the Securities and Exchange Commission. |
By: | /s/ JOSEPH P. KELLEY | |||
Joseph P. Kelley | ||||
February 27, 2015 | Attorney-in-Fact | |||
93
Materion Corporation and Subsidiaries
Schedule II—Valuation and Qualifying Accounts
Years Ended December 31, 2014, 2013, and 2012
Column A | Column B | Column C | Column D | Column E | ||||||||||||||||
(Thousands) | Balance at Beginning of Period | ADDITIONS | Deduction- Describe | Balance at End of Period | ||||||||||||||||
Charged to Costs and Expenses | Charged to Other Accounts-Describe | |||||||||||||||||||
Year ended December 31, 2014 | ||||||||||||||||||||
Deducted from asset accounts: | ||||||||||||||||||||
Allowance for doubtful accounts receivable | $ | 1,421 | $ | 664 | $ | — | $ | 507 | (A) | $ | 1,578 | |||||||||
Inventory reserves and obsolescence | 6,333 | 6,067 | — | 4,207 | (B) | 8,193 | ||||||||||||||
Year ended December 31, 2013 | ||||||||||||||||||||
Deducted from asset accounts: | ||||||||||||||||||||
Allowance for doubtful accounts receivable | 1,403 | 127 | (12 | ) | 97 | (A) | 1,421 | |||||||||||||
Inventory reserves and obsolescence | 5,872 | 5,250 | — | 4,789 | (B) | 6,333 | ||||||||||||||
Year ended December 31, 2012 | ||||||||||||||||||||
Deducted from asset accounts: | ||||||||||||||||||||
Allowance for doubtful accounts receivable | 1,490 | 560 | (305 | ) | 342 | (A) | 1,403 | |||||||||||||
Inventory reserves and obsolescence | 6,336 | 3,935 | — | 4,399 | (B) | 5,872 | ||||||||||||||
Note (A) - Bad debts written-off, net of recoveries
Note (B) - Inventory write-off
94