Attached files
| file | filename |
|---|---|
| EX-10.33 - EX-10.33 - IMMERSION CORP | d826013dex1033.htm |
| EXCEL - IDEA: XBRL DOCUMENT - IMMERSION CORP | Financial_Report.xls |
| EX-23.1 - EX-23.1 - IMMERSION CORP | d826013dex231.htm |
| EX-31.1 - EX-31.1 - IMMERSION CORP | d826013dex311.htm |
| EX-31.2 - EX-31.2 - IMMERSION CORP | d826013dex312.htm |
| EX-21.1 - EX-21.1 - IMMERSION CORP | d826013dex211.htm |
| EX-32.2 - EX-32.2 - IMMERSION CORP | d826013dex322.htm |
| EX-10.34 - EX-10.34 - IMMERSION CORP | d826013dex1034.htm |
| EX-32.1 - EX-32.1 - IMMERSION CORP | d826013dex321.htm |
Table of Contents
UNITED STATES
SECURITIES AND EXCHANGE COMMISSION
Washington, D.C. 20549
FORM 10-K
| [x] | ANNUAL REPORT PURSUANT TO SECTION 13 OR 15(D) OF THE SECURITIES EXCHANGE ACT OF 1934 |
For the fiscal year ended December 31, 2014 or
| [ ] | TRANSITION REPORT PURSUANT TO SECTION 13 OR 15(D) OF THE SECURITIES EXCHANGE ACT OF 1934 |
For the transition period from to
Commission File Number 000-27969
Immersion Corporation
(Exact name of registrant as specified in its charter)
| Delaware | 94-3180138 | |
| (State or other jurisdiction of incorporation or organization) | (IRS Employer Identification No.) |
30 Rio Robles
San Jose, California 95134
(Address of principal executive offices, zip code)
(408) 467-1900
(Registrant’s telephone number, including area code)
Securities registered pursuant to Section 12(b) of the Act:
| Title of Each Class |
Name of Each Exchange on which Registered | |
| Common Stock, $0.001 par value |
The Nasdaq Stock Market LLC |
Securities registered pursuant to Section 12(g) of the Act:
None
Indicate by check mark if the registrant is a well-known seasoned issuer, as defined in Rule 405 of the Securities Act. Yes [ ] No [x]
Indicate by check mark if the registrant is not required to file reports pursuant to Section 13 or Section 15(d) of the Act. Yes [ ] No [x]
Indicate by check mark whether the registrant (1) has filed all reports required to be filed by Section 13 or 15(d) of the Securities Exchange Act of 1934 during the preceding 12 months (or for such shorter period that the registrant was required to file such reports), and (2) has been subject to such filing requirements for the past 90 days. Yes [x] No [ ]
Indicate by check mark whether the registrant has submitted electronically and posted on its corporate Web site, if any, every Interactive Data File required to be submitted and posted pursuant to Rule 405 of Regulation S-T (§232.405 of this chapter) during the preceding 12 months (or for such shorter period that the registrant was required to submit and post such files). Yes [x] No [ ]
Indicate by check mark if disclosure of delinquent filers pursuant to Item 405 of Regulation S-K is not contained herein, and will not be contained, to the best of registrant’s knowledge, in definitive proxy or information statements incorporated by reference in Part III of this Form 10-K or any amendment to this Form 10-K. [ x ]
Indicate by check mark whether the registrant is a large accelerated filer, an accelerated filer, a non-accelerated filer, or a smaller reporting company. See the definitions of “large accelerated filer,” “accelerated filer” and “smaller reporting company” in Rule 12b-2 of the Exchange Act. (Check one):
| Large accelerated filer [ ] |
Accelerated filer [x] | |||
|
Non-accelerated filer [ ] (Do not check if a smaller reporting company) |
Smaller reporting company [ ] | |||
Indicate by check mark whether the registrant is a shell company (as defined in Rule 12b-2 of the Act). Yes [ ] No [x]
The aggregate market value of the registrant’s common stock held by non-affiliates of the registrant on June 30, 2014, the last business day of the registrant’s most recently completed second fiscal quarter, was $204,529,854 (based on the closing sales price of the registrant’s common stock on that date). Shares of the registrant’s common stock held by each officer and director and each person whom owns 5% or more of the outstanding common stock of the registrant have been excluded in that such persons may be deemed to be affiliates. This determination of affiliate status is not necessarily a conclusive determination for other purposes. Number of shares of common stock outstanding at February 19, 2015: 27,745,434.
DOCUMENTS INCORPORATED BY REFERENCE
Portions of the definitive Proxy Statement for the 2015 Annual Meeting are incorporated by reference into Part III hereof.
Table of Contents
IMMERSION CORPORATION
2014 FORM 10-K ANNUAL REPORT
| PART I | Page | |||||
| Item 1. |
3 | |||||
| Item 1A. |
12 | |||||
| Item 1B. |
26 | |||||
| Item 2. |
26 | |||||
| Item 3. |
27 | |||||
| Item 4. |
28 | |||||
| PART II | ||||||
| Item 5. |
29 | |||||
| Item 6. |
31 | |||||
| Item 7. |
Management’s Discussion and Analysis of Financial Condition and Results of Operations |
32 | ||||
| Item 7A. |
44 | |||||
| Item 8. |
45 | |||||
| Item 9. |
Changes in and Disagreements with Accountants on Accounting and Financial Disclosure |
77 | ||||
| Item 9A. |
77 | |||||
| Item 9B. |
77 | |||||
| PART III | ||||||
| Item 10. |
79 | |||||
| Item 11. |
79 | |||||
| Item 12. |
Security Ownership of Certain Beneficial Owners and Management and Related Stockholder Matters |
79 | ||||
| Item 13. |
Certain Relationships and Related Transactions, and Director Independence |
79 | ||||
| Item 14. |
79 | |||||
| PART IV | ||||||
| Item 15. |
80 | |||||
| 84 | ||||||
Table of Contents
Forward-looking Statements
In addition to historical information this Annual Report on Form 10-K includes forward-looking statements within the meaning of Section 27A of the Securities Act of 1933, as amended (“the Securities Act”), and Section 21E of the Securities Exchange Act of 1934, as amended (“the Exchange Act”). The forward-looking statements involve risks and uncertainties. Forward-looking statements are identified by words such as “anticipates,” “believes,” “expects,” “intends,” “may,” “will,” and other similar expressions. However, these words are not the only way we identify forward-looking statements. In addition, any statements which refer to expectations, projections, or other characterizations of future events, or circumstances, are forward-looking statements. Actual results could differ materially from those projected in the forward-looking statements as a result of a number of factors, including those set forth below in “Management’s Discussion and Analysis of Financial Condition and Results of Operations,” “Risk Factors” and those described elsewhere in this report, and those described in our other reports filed with the Securities and Exchange Commission (“SEC”). We caution you not to place undue reliance on these forward-looking statements, which speak only as of the date of this report, and we undertake no obligation to update these forward-looking statements after the filing of this report. You are urged to review carefully and consider our various disclosures in this report and in our other reports publicly disclosed or filed with the SEC that attempt to advise you of the risks and factors that may affect our business.
PART I
Overview
Immersion Corporation (“Immersion”) is a premier intellectual property (“IP”) and software licensing company focused on the creation, design, development, and licensing of patented haptic innovations and software that allow people to use their sense of touch more fully when operating a wide variety of digital devices. Our mission is to innovate touch technology that informs, humanizes, and excites while working with customers and partners to bring these tactile experiences to consumers. While we believe that our innovations are broadly applicable, we are currently focusing our marketing and business development activities on the following target markets: mobile devices, wearables, consumer, mobile entertainment and other content; console gaming; automotive; medical; and commercial.
In our target markets, we license our software and IP to manufacturers for use in products sold under their own brand names. We and our wholly-owned subsidiaries hold more than 1,900 issued or pending patents in the U.S. and other countries, covering a wide range of digital technologies, including many of the ways in which touch-related technology can be incorporated into and between hardware products, systems software, application software, and digital content.
We were incorporated in 1993 in California and reincorporated in Delaware in 1999. We consummated our initial public offering on November 12, 1999.
Our Business Strategy
Our goal is to continue to be the technology and market leader in haptic technologies and drive the adoption of our touch software and IP across markets and applications to improve the user experience with digital devices and systems. Key aspects of our strategy include:
Innovate: Develop and patent our innovative technology to provide haptics in mobile, wearable, automotive, gaming, medical, consumer, and commercial products and services to transform user experiences with unique and customizable touch feedback effects.
3
Table of Contents
Drive Adoption: Communicate the advantages of our patented innovations and technologies to the relevant industries and encourage their adoption through demonstrations and incorporation in the products of world-class companies.
Expand Markets and Applications: Broaden the use of haptics within target markets through working with hardware component suppliers as well as the ecosystem of experience designers and content creators, including touch-enabled mobile advertising, entertainment content, and communications technologies. Expand the use of haptics into new markets, such as wearables and networked devices, as well as new form factors.
Monetize: License our patented inventions and software to customers for use in creating, commercializing, and enjoying haptics in mobile, wearable, automotive, gaming, medical, consumer, and commercial products and services.
We believe that the successful execution of this strategy requires a focus on a broad ecosystem of customers and partners — working with content creators to ensure the design and implementation of engaging haptic experiences into software, as well as device manufacturers and their suppliers, to ensure a high quality tactile experience. To achieve this, Immersion has developed unique licensing platforms and business models that rely on the skills and talent of our employees. Accordingly, we seek to hire and retain employees with world class haptic expertise, as well as the executive management and operating personnel required to successfully execute our business strategies. In order to attract high quality employees, we have created an environment and culture that encourages, fosters, and supports research, development, and innovation in breakthrough technologies with significant opportunities for broad industry adoption through licensing. We believe that we have created a compelling company for inventors and innovators who are able to work within our supportive corporate environment to drive strong future growth.
Haptics and Its Benefits
While digital devices offer many advanced capabilities they often fail to provide users with the meaningful touch experiences that enrich their real world interactions. For example, when dialing a number or entering text on a conventional touchscreen, users feel only the touchscreen surface, without the subtle, yet confirming sensation they expect from mechanical switches and keyboards. Similarly, communications with other users and experiences with digital content can feel flat or lifeless without the accompanying tactile feedback that is an essential part of the physical world. Immersion’s haptic technologies can restore these missing elements of confirmation, realism and rich communication to the digital world.
Our haptic technology breathes life into digital experiences, enabling users to feel realistic tactile feedback or resistance as they push a virtual button, scroll through a list or encounter the end of a menu. In a video or mobile game with haptics, users can feel the gun recoil, the engine rev, or the crack of the bat meeting the ball. When simulating the placement of cardiac pacing leads, a user can feel the forces that would be encountered when navigating the leads through a beating heart, providing a more realistic experience of performing this procedure.
Haptics can enhance the user experience through:
| • | Improved Usability: By restoring the sense of touch to otherwise lifeless surfaces, haptics creates fulfilling experiences that can improve usability by engaging touch, sight, and sound. From the confidence users receive through touch confirmation when selecting a virtual button to the contextual awareness they receive through haptics in a first person shooter game, haptics improves usability by more fully engaging the senses. |
| • | Enhanced Realism: Haptics injects a sense of realism into user experiences by exciting the senses and allowing the user to feel the action and nuance of the application. This is particularly relevant in applications like games, video content, or simulations that otherwise rely on only visual and audio outputs. The inclusion of tactile feedback provides additional context that captures the user’s attention and translates it into a more engaging sense of realism. |
4
Table of Contents
| • | Enriched Communications: Haptics uses the sense of touch to communicate information to users in an unobtrusive and intuitive manner. In mobile devices, the sense of touch can enhance voice, chat, or video applications to create more engaging and emotional communications. In wearable devices, haptics can provide meaningful information to users without disruptive audio or visual feedback. |
| • | Restoration of Mechanical Feel: Today’s touchscreens, touch pads, and other touch surfaces lack the physical feedback that humans frequently need to fully understand the context of their interactions. By providing users with intuitive and unmistakable tactile confirmation, haptics can create a more confident user experience and can also improve safety by overcoming distractions. This is especially important when audio or visual confirmation is insufficient, or for applications that involve distractions, such as automotive and commercial applications. |
We believe these features of our haptic technology are broadly applicable to a number of markets and devices. By continuing to enhance these features through further research and development, we believe we will serve as a strategic partner for our customers and partners in helping them develop a more compelling user experience for consumers.
Our Offerings
We offer our patented inventions and software to our customers through either a software license or a patent license or a combination thereof.
Our software license offerings include a range of software developed by Immersion, including our TouchSense Core software that we provide for incorporation into mobile devices, video console gaming systems, consumer electronics, medical simulation and surgical robotic systems, and automotive controls, and our TouchSense Engage suite of easy-to-use design tools and software development kits (“SDKs”) making it simple to design and integrate tactile effects into mobile games, ads and videos. Further, under software licenses, our customers typically receive licenses to our patents necessary to implement the licensed software in their products, with the specific rights and restrictions to the applicable patents described in their license agreements.
We also offer our customers patent licenses, through which we provide a license to specified aspects of our broad portfolio of patented inventions. The patent license provides the customer with a defined right to use our patented innovations in the customer’s own products, which may be limited to specific fields of use.
Our software license agreements and patent license agreements or combinations thereof are structured with fixed, variable or a hybrid of fixed and variable royalty payments over certain defined periods.
For both our software and patent licensees, we offer our expertise to help our customers design and integrate touch effects into their products. This expertise may include turn-key engineering and integration services, design kits for prototyping, authoring tools, application programming interfaces (“APIs”), and the development of hardware and software technologies that are compatible with industry standards.
Software Licenses
TouchSense: We license our TouchSense software to original equipment manufacturers (“OEMs”) or their suppliers who then include our software in products sold under their own brand names. We license our software under the TouchSense brand, and have developed a family of TouchSense software that is intended to address the needs of our target markets.
TouchSense 1000: Targeted to the commercial and industrial and automotive markets, TouchSense 1000 software offers haptic effects for large touch screens, touch panels, and touch surfaces that are optimized for strength in demanding applications and extreme environments.
TouchSense 2000: Targeted to mass market consumer electronic devices such as microwaves, cameras and other handheld consumer electronics, TouchSense 2000 software provides haptic effects for touch screens and touch panels, providing pre-designed haptic effects and user interface (“UI”) support along with design
5
Table of Contents
recommendations oriented for mass market devices. TouchSense 2000 is offered as a direct software license to the OEM as well as through our integrated circuit partners who preload their integrated circuits with the TouchSense 2000 Player.
TouchSense Core: Targeted to the mobile device, wearable, and consumer electronics market, TouchSense Core consists of solution sets for the design of tactile effects used in device UI and applications, and to enhance the playback of haptic content.
Integrator: Working in conjunction with Immersion’s mobile TouchSense Core software, Integrator consists of modules that OEMs can choose from to easily incorporate haptic experiences into their mobile device operating system. Integrator Modules include: UI Module, which streamlines haptic integration by automatically associating haptic effects with select UI elements such as button presses and scrolling actions; Themes Module, which allows OEMs to waterfall a signature haptic feel through the UI of the device; WebKit Module, which extends the theme controls to the device internet browser experience; and Ringtones Module, which enables support of unique and distinct haptic vibrations to be used during the device silent mode.
TouchSense Engage: Targeted to mobile application developers, advertisers and content creators, TouchSense Engage consists of design tools, integration software and effect libraries that allow for the design, encoding and playback of tactile effects in mobile content, including games, ads and video. The TouchSense Engage solution offers high fidelity tactile effects to augment and enhance mobile content, while ensuring quality playback within the consumer device.
Patent Licenses
In addition to licensing software, we also offer patent licenses to those customers who wish to develop their own proprietary haptic implementations. We license our patents across all of our target markets.
Basic Haptics: Targeted primarily to the mobile communications and consumer electronics markets, a Basic Haptics license allows customers to develop their own haptic implementations or utilize standard operating systems’ implementations of haptics where the haptic effects are based on sensing a user’s input on a touchscreen and associating events with a limited set of haptic effects in a multi-tasking environment.
Force Feedback: Targeted at the gaming, automotive, and medical markets, Immersion’s Force Feedback license allows customers to create custom implementations of force feedback based on the unique requirements of the application including: gaming peripherals and simulation; navigation controls for automotive environments; as well as medical applications such as virtual reality training simulators for interventional and surgical procedures, robotic surgical tools, medical instrumentation, and wearable medical devices.
Haptic Expertise
For both our TouchSense and patent licensees, we offer our expertise to help them design and integrate touch effects into their products. This expertise includes turn-key engineering and integration services, design kits for prototyping, authoring tools, APIs, and the development of hardware and software technologies that are compatible with industry standards.
Turn-key Engineering and Integration Services — We offer engineering assistance, including technical and design assistance and integration services that allow our licensees to incorporate our touch-enabling products and technologies into their products at a reasonable cost and in a shortened time frame. This allows them to get to market quickly by using our years of haptic development and solution deployment expertise. We offer product development solutions including product software libraries, design, prototype creation, technology transfer, actuator selection, component sourcing, development/integration kits, sample source code, comprehensive documentation, and other engineering services. In addition, we help ensure a quality end-user experience by offering testing and certification services to a number of licensees.
6
Table of Contents
Design Kits for Prototyping — We offer several design kits for customers to use for technology evaluation, internal evaluation, usability testing, and focus group testing. The kits include components and documentation that designers, engineers, and system integrators need for prototyping tactile effects into an existing or sample product or application.
Authoring Tools — We license authoring tools, including our TouchSense Engage technology, that enable haptic designers and software developers to quickly design and incorporate customized touch feedback into their applications. Authoring tools allow designers to create, modify, experience, and save or restore haptic effects for a haptically-enabled device. Our authoring tools are the equivalent of a computer-aided design application for haptics, and support vibro-tactile haptic devices (such as mobile devices, touchscreens, and vibro-tactile gaming peripherals), as well as kinesthetic haptic devices (such as rotary devices, 2D devices, and joysticks). Various haptic effect parameters can be defined and modified, and the result immediately experienced. Our authoring tools run on mainstream operating systems such as Microsoft Windows. Commencing in March 2011, we have made Immersion’s Haptic Development Platform available to Android software developers for use in integrating tactile effects into mobile games and other downloadable applications.
Application Programming Interfaces — Our APIs provide haptic-effect generation capability. This allows designers and software programmers to focus on adding haptic effects to their applications instead of struggling with the mechanics of programming real-time algorithms and handling communications between computers and devices. Some of our haptic APIs are device independent (for example, they work with scroll wheels, rotary knobs, 2D joysticks, and other devices) to allow flexibility and reusability. Others are crafted to meet the needs of a particular customer or industry.
Platform Independent Solutions — Our software driver and API technology have been designed to be easily ported to a variety of operating systems including Android, Tizen, Linux, and Windows.
Markets
Mobile Communications, Wearables, and Consumer Electronics — We offer both TouchSense software and patent licenses to OEMs in the mobile device, wearables, and consumer electronics markets. In addition, our integrated circuit partners preload their integrated circuits with our TouchSense software and offer these integrated circuits to OEMs in the mobile device market.
Our licensees currently include some of the top makers of mobile devices in the world including: Samsung, Motorola, LG Electronics, Fujitsu, NEC, Xiaomi, Huawei, and Toshiba, as well as integrated circuit manufacturers such as Texas Instruments and Atmel.
In addition to our work with device manufacturers, we also work with mobile application and content creators to offer tools and expertise to incorporate tactile effects into mobile applications, advertisements and content. Our licensees have included Slate, Showtime, Rockstar Games and Sega.
For the years ended December 31, 2014, 2013, and 2012, respectively, 60%, 66%, and 46% of our total revenues were generated from customers in the mobile communications market.
Console Gaming — We have licensed our patents to Microsoft Corporation for use in its gaming products and to Sony Computer Entertainment Inc. (“Sony”) for use in its legacy and current PlayStation console gaming products. We have also licensed our patents to over a dozen gaming peripheral manufacturers and distributors, including Logitech, Guillemot Corporation, and Mad Catz, Inc., to bring haptic technology to PC platforms including Microsoft Windows operating systems, as well as to video game consoles.
In the video game console peripheral market, we have licensed our patents for use in hundreds of spinning mass tactile feedback devices and force feedback devices such as steering wheels and joysticks to various manufacturers, including: Bensussen Deutsch & Associates Inc., Datel Design & Inc., dreamGear LLC, Logitech Inc., Mad Catz, Inc., Microsoft Corporation, Performance Designed Products (formerly Electro Source LLC), Razer PTE Ltd, Guillemot Corporation, and Sony. These products are designed to work with one or more video
7
Table of Contents
game consoles including the Xbox, Xbox 360, and Xbox One from Microsoft; the PlayStation, PlayStation 2, PlayStation 3, and PlayStation 4 from Sony; and the N64, GameCube, and Wii from Nintendo. Currently, products sold to consumers using Immersion technology include PC joysticks, steering wheels, and gamepads from various licensees.
For the years ended December 31, 2014, 2013, and 2012, respectively, 27%, 21%, and 28% of our total revenues were generated from customers in the PC and console gaming markets.
Automotive — We offer both TouchSense software and patent licenses to automotive component suppliers. Our current licensees include: ALPS Electric Co., Ltd, Continental, Marquardt, Methode Electronics, Inc., Visteon, SMK Corporation, Tokai Rika Co., Ltd., and Panasonic Corp.
For the years ended December 31, 2014, 2013, and 2012, respectively, 5%, 5%, and 6% of our total revenues were from automotive customers.
Medical — Throughout 2012, we maintained a single medical simulation product line, the Virtual IV system, which simulated needle-based procedures such as intravenous catheterization and phlebotomy. This product was produced for Laerdal Medical A/S, who distributed it on a world-wide basis. In December of 2012, we signed a licensing agreement for this product line with Laerdal Medical A/S. As of January, 2013, we continued to license patents to the medical market, but no longer manufactured any product lines. Our current licensees include: MAKO Surgical Corp., SOFAR S.P.A., CAE Healthcare, Simbionix, and Laerdal Medical A/S.
For the years ended December 31, 2014, 2013, and 2012, respectively 8%, 8%, and 16% of our total revenues were from the medical market.
Manufactured Products
As of December 2013, we ceased selling manufactured products and only license our patents and software. Our product solutions, which did not represent a material part of our business, were limited to components used for design kits. Through 2012, we manufactured products including the Virtual IV system which was produced on a “private” label basis for a customer (See Product and Markets – Medical). All products produced were from contracted manufacturing services.
Sales
Our sales have been seasonal with typically an increase in the first quarter reflecting holiday shipments of our customer’s products with integrated Immersion technology. Both mobile devices and gaming products are subject to shipment increases in the fourth quarter which is reflected in our first quarter revenue. Seasonal fluctuations have not been extremely significant to our overall revenue trends in the past. As we are increasingly entering into license agreements that include recurring fixed payments to us, we anticipate that our sales may become less seasonal over time.
We employ a consolidated direct sales force in the United States, Europe, and Asia to license our software and patents across our target markets and augment that sales force via partnerships and licensing agreements with component suppliers and system integrators.
Additional information about significant customers is incorporated herein by reference to Note 16 of our consolidated financial statements and related financial information in Item 8. Financial Statements and Supplementary Data.
Competition
Our biggest source of competition derives from decisions made by internal design groups at our OEM customers and potential OEM customers. We expect that these internal design groups will continue to make choices regarding whether to implement haptics or not, or whether to develop their own haptic solutions.
8
Table of Contents
In the event we have granted or grant a license to our patent portfolio to an OEM, its internal design group may design technology that is less expensive to implement or that enables products with higher performance or additional features. In some cases, the OEM may elect not to include haptics in its products due to the higher bill of materials costs associated with incorporating haptics.
In addition to licensing OEMs directly, our business also includes licensing to semiconductor manufacturers who incorporate certain of our lower-tiered technology in their integrated circuits for use in certain electronic devices.
The principal competitive factors are the strength of the patents underlying the technology, the technological expertise and design innovation and the use, reliability and cost-effectiveness of the solutions. We believe we compete favorably in all these areas.
For licensed applications, our competitive position is partially dependent on the competitive positions of our licensees that pay a license fee and/or royalty. Our licensees’ markets are highly competitive. We believe that the principal competitive factors in our licensees’ markets include price, performance, user-centric design, ease-of-use, quality, and timeliness of products, as well as the manufacturer’s responsiveness, capacity, technical abilities, established customer relationships, retail shelf space, advertising, promotional programs, and brand recognition. Touch-related benefits in some of these markets may be viewed simply as enhancements and compete with nontouch-enabled technologies.
Research and Development
Our success depends on our ability to invent and improve our technologies in a timely manner; to design and develop software to meet specifications based on research and our understanding of customer needs and expectations; and to collaborate with our licensees who are integrating our technologies into theirs.
Immersion Engineering — We have assembled a multi-disciplinary team of highly skilled engineers and scientists with the experience required for development of touch-enabling technology. The team’s experience includes skills related to mechanical engineering, electrical engineering, embedded systems and firmware, control techniques, software, quality control, haptic content design, and project and process management. This team continues to generate patents that strengthen our IP position.
Application Engineering and Technical Support — We may provide application engineering and technical support during integration of our touch-enabling technology into customer products. To facilitate the validation and adoption of touch-enabling technology, we have developed various design kits. These kits may include actuators, mounting suggestions, controller boards, software libraries, programming examples, and documentation. Our application engineers support customer use of these design kits, including through phone and e-mail technical support and onsite training. This team continues to generate patents that strengthen our IP position.
Research — We have multidisciplinary expertise in usability and multimodal user interface design, actuator design, sensors, integration, material science, real-time simulation algorithms, control, and software development. Our research team works with existing and potential partners to help them assess and prove the value of haptics in their field of interest, creating main competitive differentiator and value added solutions. This team continues to generate patents, actively contributing to the reinforcement of Immersion’s IP position.
User Experience — We have a dedicated team of user interaction specialists, focusing on user research and design to enable new and improved applications of haptics. We have unique expertise in haptics, usability and interface design. Our team works with existing and potential partners to help them determine the best implementation of haptics in their specific application. This team works on the cutting edge of new user interface paradigms using haptics, resulting in an ongoing generation of patents, actively contributing to the development of new IP for us.
9
Table of Contents
For the years ended December 31, 2014, 2013, and 2012, research and development expenses were $11.8 million, $10.9 million, and $8.4 million respectively.
Intellectual Property
We believe that IP protection is crucial to our business. We rely on a combination of patents, copyrights, trade secrets, trademarks, nondisclosure agreements with employees and third parties, licensing arrangements, and other contractual agreements with third parties to protect our IP. We maintain and support an active program to protect our IP, primarily through the filing of patent applications and the defense of issued patents against infringement.
Our failure to obtain or maintain adequate protection for our IP rights for any reason could hurt our competitive position. There is no guarantee that patents will be issued from the patent applications that we have filed or may file. Our issued patents may be challenged, invalidated, or circumvented, and claims of our patents may not be of sufficient scope or strength, or issued in the proper geographic regions, to provide meaningful protection or any commercial advantage.
At the end of 2014, we and our wholly owned subsidiaries had over 1,900 currently issued or pending patents in the U.S. and other countries that cover various aspects of our technologies. The duration of our issued patents is determined by the laws of the country of issuance and for the United States is typically 17 years from the date of issuance of the patent or 20 years from the date of filing of the patent application resulting in the patent. Some of our U.S. patents began expiring in 2007.
Financial Information about Industry Segments and Geographic Areas
We manage our operations and allocate resources as a single reporting segment. Additional information about our business segments and geographic areas is incorporated herein by reference to Note 16 of our consolidated financial statements and related financial information in Item 8. Financial Statements and Supplementary Data. In addition, financial information regarding our operations, assets and liabilities, including our total net revenue and net income (loss) for the years ended December 31, 2014, 2013, and 2012 and our total assets as of December 31, 2014 and 2013, is included in our consolidated financial statements and related financial information in Item 8. Financial Statements and Supplementary Data.
Investor Information
You can access financial and other information in the Investor Relations section of our web site at www.immersion.com. We make available, on our Web site, free of charge, copies of our annual report on Form 10-K, quarterly reports on Form 10-Q, current reports on Form 8-K, and amendments to those reports filed or furnished pursuant to Section 13(a) or 15(d) of the Exchange Act as soon as reasonably practicable after filing such material electronically or otherwise furnishing it to the SEC.
The charters of our audit committee, our compensation committee, and our nominating/corporate governance committee, and our Code of Business Conduct and Ethics (including code of ethics provisions that apply to our principal executive officer, principal financial officer, controller, and senior financial officers) and our Corporate Governance Principles are also available at our web site under “Corporate Governance.” These items are also available to any stockholder who requests them by calling +1 408.467.1900.
The SEC maintains an Internet site that contains reports, proxy, and information statements, and other information regarding issuers that file electronically with the SEC at www.sec.gov.
Employees
As of December 31, 2014, we had 141 full-time and part-time employees, including 70 in research and development, 37 in sales and marketing, and 34 in legal, finance, and administration. We also use independent contractors. None of our employees are represented by a labor union, and we consider our employee relations to be positive.
10
Table of Contents
Executive Officers
The following table sets forth information regarding our executive officers as of February 19, 2015.
| Name | Position with the Company | Age | ||
| Victor Viegas |
Chief Executive Officer and Member of the Board of Directors | 57 | ||
| Dennis Sheehan |
Vice President, Marketing | 53 | ||
| Paul Norris |
Chief Financial Officer | 53 | ||
| Jason Patton |
Vice President & General Manager of Content & Media Business | 41 | ||
| Mahesh Sundaram |
Vice President, Worldwide OEM Sales | 44 |
Victor Viegas was named our Chief Executive Officer in April 2010, and served as our Interim Chief Financial Officer from December 2011 until May 2012. He served as our Interim Chief Executive Officer from October 2009 to April 2010, and has served as a member of the board of directors since October 2002. Mr. Viegas was our Chief Executive Officer from October 2002 through April 2008, and President from February 2002 through April 2008. Mr. Viegas was also Chairman of the board of directors from October 2007 to February 2009, and assumed the role of interim Chief Financial Officer from December 2011 through May 2012. Mr. Viegas also served as Chief Financial Officer until February 2005, having joined us in August 1999 as Chief Financial Officer, Vice President, Finance. From June 1996 to August 1999, he served as Vice President, Finance and Administration and Chief Financial Officer of Macrovision Corporation, a developer and licensor of video and software copy protection technologies. From October 1986 to June 1996, he served as Vice President of Finance and Chief Financial Officer of Balco Incorporated, a manufacturer of advanced automotive service equipment. He holds a B.S. in Accounting and an M.B.A. from Santa Clara University. Mr. Viegas is also a Certified Public Accountant in the State of California, on inactive status.
Dennis Sheehan assumed the role as Immersion’s Vice President of Marketing, responsible for leading all of Immersion’s worldwide marketing initiatives for all areas of our business, in October 2014. Previously, Mr. Sheehan was our SVP of Sales & Marketing from October 2012 to October 2014 and Vice President of Marketing from January 2009 to October 2012. Prior to joining Immersion, Mr. Sheehan was the Senior Director of Product Management at SiRF technology, a supplier of GPS semiconductor solutions for mobile phones and personal navigation devices from June 2006 to December 2009. From March 2005 to November 2005, Mr. Sheehan was the Vice President of Business Development and Strategy for Varatouch, an IP components and software company. Earlier in his career, Mr. Sheehan held various marketing and management positions at Intel. He holds a B.S. in Chemical Engineering from Stanford University and an M.B.A. from Northwestern University’s Kellogg School of Management.
Paul Norris joined Immersion as Chief Financial Officer in May 2012. Prior to joining Immersion, Mr. Norris served as a partner at Accanto Partners, LLC, an investment fund focusing on technology and digital media companies from July 2011 to May 2012. Prior to that, from June 2005 to February 2011, Mr. Norris served in various executive positions at Sonic Solutions, a digital media software and entertainment solutions provider, acting as its Senior Vice President and General Counsel from June 2005 to February 2008, and its Executive Vice President, Chief Financial Officer and General Counsel February 2008 until its acquisition by Rovi Corporation, a digital entertainment technology solutions provider in February 2011. From February 2011 through June 2011, Mr. Norris assisted Rovi in its integration activities as an Executive Advisor. Mr. Norris holds a Bachelor of Arts from Yale University and a Juris Doctor degree from Harvard Law School.
Jason Patton joined Immersion in January 2014. He is responsible for the development and management of our Content & Media line of business. Prior to joining Immersion, Mr. Patton was Senior Vice President, Business Development & Technology of YOD China, a publicly-traded company focused entirely on bringing
11
Table of Contents
advanced TV offerings featuring premium Hollywood content to mainland China, from October 2010 to December 2013. From June 2001 to November 2009, Mr. Patton managed business development for In Demand Networks, the joint venture owned by Comcast, Cox and Time Warner Cable serving most recently as Senior Vice President, Business Development. He has also worked at AT&T in both business development and mergers & acquisitions. Mr. Patton holds a B.S. in broadcast journalism from Boston University, a B.S. in business administration from Boston University, and an M.B.A. from the Harvard Business School.
Mahesh Sundaram joined Immersion in October 2014. He is responsible for leading our worldwide OEM sales organization to support the growing opportunities of Immersion technology. Prior to joining Immersion, Mr. Sundaram was Vice President, Asia Pacific of Dolby Laboratories, a global innovator and developer of audio, imaging and voice technologies for cinema, home theaters, PCs, mobile phones, and games, from October 2008 to October 2014. Mr. Sundaram also served as a Director of Consumer Electronics Market Segment at Dolby Laboratories, from July 2006 to September 2008. From January 1996 to November 2003, he managed product marketing for Intel, one of the largest manufacturers of semiconductors for PCs, servers, phones, tablets, and consumer electronic devices, where he was responsible for product marketing and bringing new products and technologies to market in the Asia Pacific region. Mr. Sundaram holds a Bachelor of Engineering in electrical engineering from University of Mumbai.
You should carefully consider the following risks and uncertainties, as well as other information in this report and our other SEC filings, in considering our business and prospects. If any of the following risks or uncertainties actually occurs, our business, financial condition, or results of operations could be materially adversely affected. The following risks and uncertainties are not the only ones facing us. Additional risks and uncertainties of which we are unaware or that we currently believe are immaterial could also materially adversely affect our business, financial condition, or results of operations. In any case, the trading price of our common stock could decline, and you could lose all or part of your investment. See also the Forward-looking Statements discussion in Item 7, “Management’s Discussion and Analysis of Financial Condition and Results of Operations.”
Company Risks
If we are unable to enter into new and renewed licensing arrangements with our existing licensees and with additional third-parties for our touch-enabling technologies, our royalty and license revenue may not grow and could decline.
Our revenue growth is largely dependent on our ability to enter into new and renewed licensing arrangements. Our failure to enter into new or renewed licensing arrangements will cause our operating results to suffer. We face numerous risks in obtaining new or renewed licenses on terms consistent with our business objectives and in maintaining, expanding, and supporting our relationships with our current licensees. These risks include:
| • | the competition we may face from third parties and/or the internal design teams of existing and potential licensees; |
| • | difficulties in persuading third parties to work with us, to rely on us for critical technology, and to disclose to us proprietary product development and other strategies; |
| • | difficulties in persuading existing licensees who compensate us for including our software in certain of their touch-enabled products to also license and compensate us for our patents that cover other touch-enabled products of theirs that do not include our software; |
| • | challenges in demonstrating the compelling value of our technologies and challenges associated with customers’ ability to easily implement our technologies; |
12
Table of Contents
| • | difficulties in obtaining new licensees for yet-to-be commercialized technology because their suppliers may not be ready to meet stringent quality and parts availability requirements; |
| • | difficulties in entering into or renewing gaming licenses if video console makers choose not to license third parties to make peripherals for their new consoles, if video console makers no longer require peripherals to play video games, if video console makers no longer utilize technology in the peripherals that are covered by our patents or if the overall market for video consoles deteriorates substantially; |
| • | reluctance of content developers or distributors, mobile device manufacturers, and service providers to sign license agreements without a critical mass of other such inter-dependent supporters of the mobile device industry also having a license, or without enough similar devices in the market that incorporate our technologies; and |
| • | inability of current or prospective licensees to ship certain devices if they are involved in IP infringement claims by third parties that ultimately prevent them from shipping products or that impose substantial royalties on their products. |
A limited number of customers account for a significant portion of our revenue, and the loss of major customers could harm our operating results.
Samsung Electronics accounted for approximately 38%, 47%, and 24% of our total revenues for the years ended December 31, 2014, 2013, and 2012, respectively. Other customers accounted for 17% and 12% of our revenues in 2014. We cannot be certain that customers that have accounted for significant revenue in past periods, individually or as a group, will continue to generate similar revenue in any future period. If we fail to renew or lose a major customer or group of customers, our revenue could decline if we are unable to replace the lost revenue with revenue from other sources.
Future revenue is difficult to predict, and our failure to predict revenue accurately may cause our results to be below our expectations or those of investors and result in our stock price declining.
Our lengthy and costly license negotiation cycle and any IP litigation that we may engage in make the amount and/or timing of future revenue difficult to predict because we may not be successful in entering into or renewing licenses with our customers on our estimated timelines, and we may be reliant on litigation timelines, which are difficult to control, with unpredictable results.
Some of our license agreements provide for per-unit royalty payments and may also be subject to adjustments based on volume. The sales volume and prices of our licensees’ products in any given period can be difficult to predict. In addition, in certain product markets, we have entered into licensing agreements pursuant to which customers make fixed recurring payments to us in exchange for use of our IP and technology. As a result, a portion of the revenue we report each quarter results from the recognition of deferred revenue from fixed payments we have received from these customers during previous quarters. If we were to experience significant decline in our ability to renew these agreements or enter into new agreements that include fixed recurring payments, our reported financial results might not reflect such downturns until future periods. Moreover, to the extent our business model depends on fixed payments that we recognize over time, it may also be difficult for us to rapidly increase our revenues through additional sales in any period, as revenue from new customers will be recognized over multiple quarters. Additionally, if we have agreed that a customer may pay us a fixed amount for use of our IP and technology during a given time period, we may receive lower revenues than we would have received under a per unit royalty arrangement if the customer’s business grows or it otherwise performs better than we anticipated at the time we entered into our licensing agreement with the customer.
In addition, a portion of our revenue comes from development and support services provided to our licensees, or may be part of a contractual arrangement involving multiple elements. Depending upon the nature of the services or elements, all or a portion of the revenue may be recognized ratably over time or may be deferred in part or in whole.
13
Table of Contents
All of these factors make it difficult to predict future revenue and may result in our revenue being below our previously announced guidance or analysts’ estimates, which would likely cause our stock price to decline.
Our international expansion efforts subject us to additional risks and costs.
We currently have sales personnel in Japan, Korea, Taiwan, China, and Switzerland and we intend to continue to expand our international activities, including continued investment in Asia. International operations are subject to a number of difficulties and special costs, including:
| • | compliance with multiple, conflicting and changing governmental laws and regulations; |
| • | laws and business practices favoring local competitors; |
| • | foreign exchange and currency risks; |
| • | import and export restrictions, duties, tariffs, quotas and other barriers; |
| • | difficulties staffing and managing foreign operations; |
| • | difficulties and expense in enforcing IP rights; |
| • | business risks, including fluctuations in demand for our technologies and products and the cost and effort to conduct international operations and travel abroad to promote international distribution and overall global economic conditions; |
| • | multiple conflicting tax laws and regulations; |
| • | political and economic instability; and |
| • | the possibility of an outbreak of hostilities or unrest in markets where major customers are located, including Korea and Hong Kong. |
Our international operations could also increase our exposure to international laws and regulations. If we cannot comply with foreign laws and regulations, which are often complex and subject to variation and unexpected changes, we could incur unexpected costs and potential litigation. For example, the governments of foreign countries might attempt to regulate our products or levy sales or other taxes relating to our activities. In addition, foreign countries may impose tariffs, duties, price controls, or other restrictions on foreign currencies or trade barriers, any of which could make it more difficult for us to conduct our business. Our international operations could also increase our exposure to complex international tax rules and regulations. Changes in, or interpretations of, tax rules and regulations may adversely affect our income tax provision. In addition, our operations outside the United States may be affected by changes in trade protection laws, policies and measures, and other regulatory requirements affecting trade and investment, including the Foreign Corrupt Practices Act and local laws prohibiting corrupt payments by our employees, vendors, or agents.
We are currently involved in litigation proceedings involving some of our key patents; any final judgment invalidation or limiting of the scope of our key patents could significantly harm our business.
As more fully described under Part I, Item 3 — “Legal Proceedings,” we are currently involved in litigation involving some of our patents. The defendant in this litigation has challenged the validity, scope, enforceability and ownership of our patents. Most recently, the Court in this litigation granted in part the motion for summary judgment of non-infringement of three of the patents, finding that the HTC’s products do not literally infringe two of the patents; and granted the motions for partial summary judgment shortening the damages period of one of the patents, and for summary judgment of invalidity of three of the patents.
We cannot predict the outcome of pending litigation. If there is a final adverse ruling in any legal or administrative proceeding relating to the infringement, validity, enforceability or ownership of any of our patents, or if a court issues a final judgment limiting the scope of the claims or an administrative body such as the
14
Table of Contents
U.S. Patent and Trademark Office limits the scope of the claims of any of our patents, we could be prevented from enforcing, or earning future revenues from those patents, and the likelihood that customers will take new licenses and that current licensees will continue to agree to pay under their existing licenses could be significantly reduced. The resulting reduction in license fees and royalties could significantly harm our business, consolidated financial position, results of operations or cash flows, or the trading price of our common stock.
Furthermore, regardless of the merits of any claim, the continued maintenance of these legal proceedings may result in substantial legal expenses and divert our management’s time and attention away from our other business operations, which could significantly harm our business. The time to resolution and complexity of our litigation, its significance to our business, the propensity for delay in patent litigation, and the potential that we may lose particular motions as well as the overall litigation could cause significant volatility in our stock price and materially adversely affect our business and consolidated financial position, results of operations and cash flows.
Our current or any future litigation is expensive, disruptive, and time consuming, and will continue to be, until resolved, and regardless of whether we are ultimately successful, could adversely affect our business.
We have been in the past and are currently a party to various legal proceedings. Due to the inherent uncertainties of litigation, we cannot accurately predict how these cases will ultimately be resolved. We anticipate that currently pending or any future litigation will continue to be costly and that future litigation will result in additional legal expenses, and there can be no assurance that we will be successful or be able to recover the costs we incur in connection with litigation. We expense litigation costs as incurred, and only accrue for costs that have been incurred but not paid to the vendor as of the financial statement date. Although protecting intellectual property is a fundamental part of our business, at times, our litigation has diverted, and could continue to divert, the efforts and attention of some of our key management and personnel away from other licensing transactions. As a result, until such time as it is resolved or concluded, litigation could adversely affect our business. Further, any unfavorable outcome could adversely affect our business. For additional background on our litigation, please see Note 15 to the consolidated financial statements in Part II, Item 8- “Financial Statements and Supplementary Data” and Part I, Item 3- “Legal Proceedings”.
The terms in our agreements may be construed by our licensees in a manner that is inconsistent with the rights that we have granted to other licensees, or in a manner that may require us to incur substantial costs to resolve conflicts over license terms.
We have entered into, and we expect to continue to enter into, agreements pursuant to which our licensees are granted rights to our technology and under our IP. These rights may be granted in certain fields of use, or with respect to certain market sectors or product categories, and may include exclusive rights or sublicensing rights. We refer to the license terms and restrictions in our agreements, including, but not limited to, field of use definitions, market sector, and product category definitions, collectively as “License Provisions.”
Due to the continuing evolution of market sectors, product categories, and licensee business models, and to the compromises inherent in the drafting and negotiation of License Provisions, our licensees may interpret License Provisions in their agreements in a way that is different from our interpretation of such License Provisions, or in a way that is in conflict with the rights that we have granted to other licensees. Such interpretations by our licensees may lead to claims that we have granted rights to one licensee that are inconsistent with the rights that we have granted to another licensee. Many of our customers report royalties to us based on their shipments or their revenues and their interpretation and allocation of contracted royalty rates. It is possible that the originally reported royalties could differ materially from those determined by either a customer self-reported correction or from an audit we have performed. These interpretations may also cause disagreements arising during customer audits, may lead to claims or litigation, and may have an adverse effect on the results of our operations. Further, although our agreements generally give us the right to audit books and records of our licensees, audits can be expensive, time consuming, and may not be cost justified based on our understanding of our licensees’ businesses. Pursuant to our license compliance program, we audit certain licensees to review the accuracy of the information contained in their royalty reports in an effort to decrease the risk of our not receiving royalty revenues to which we are entitled, but we cannot give assurances that such audits will be effective.
15
Table of Contents
In addition, after we enter into an agreement, it is possible that markets and/or products, or legal and/or regulatory environments, will evolve in an unexpected manner. As a result, in any agreement, we may have granted rights that will preclude or restrict our exploitation of new opportunities that arise after the execution of the agreement.
Competing technologies may harm our business.
One of our biggest sources of competition is derived from decisions made by internal design groups at our OEM customers and potential OEM customers. These internal design groups typically make choices regarding whether to implement haptics or not, whether to use our software or other standard haptic capability (e.g., haptic capability offered by the Android operating system), or even whether to develop their own haptic solutions. In instances where the design team elects not to use our software but implements unlicensed haptic capability, we may seek to enforce our IP. If the OEM is unwilling to enter into a license agreement, we may elect to pursue litigation which would harm our relationship with the OEM and could harm our relationships with other licensees or our ability to gain new customers, who may postpone licensing decisions pending the outcome of the litigation or dispute, or who may, as a result of such litigation, choose not to adopt our technologies. In addition, these legal proceedings could be very expensive and could have a negative impact on our financial results.
In our OEM agreements, we typically grant licenses to our patent portfolio for one or more specified fields of use. Depending on the specific terms of our agreement with an OEM, the OEM’s internal design group may be able to develop technology that is less expensive to implement or that enables products with higher performance or additional features than our own technology and products. Many of these internal design groups have substantially greater resources, greater financial strength and lower cost structures than we do. They also have the inherent advantage of access to internal corporate strategies, technology roadmaps and technical information. As a result, they may be able to bring alternative solutions to market more easily and quickly.
In addition to licensing OEMs directly, we also license to semiconductor manufacturers who incorporate certain of our less advanced technologies into their integrated circuits for use in certain electronic devices. While our relationships with these semiconductor manufacturers increases our distribution channels by leveraging their sales channels, it is possible that OEMs may elect to implement haptics using less advanced integrated circuit solutions rather than the higher-end solutions we offer directly, which may negatively impact our financial results.
Winning business is often subject to a competitive selection process that can be lengthy and requires us to incur significant expense, and we may not be selected.
In many cases, we must win competitive selection processes, known as “design wins,” before our haptic technologies are included in our customers’ products. These selection processes can be lengthy and can require us to incur significant design and development expenditures. We may not win the competitive selection process and may never generate any revenue despite incurring significant design and development expenditures. Because we typically focus on only a few customers in a given product area, the loss of a design win may result in our failure to have haptics added to new generation products in that area. This can result in lost sales and could hurt our position in future competitive selection processes to the extent we are not perceived as being a technology leader.
After winning a product design for one of our customers, we may still experience delays in generating revenue as a result of lengthy customer development and design cycles. In addition, a change, delay or cancellation of a customer’s plans could significantly adversely affect our financial results, as we may have incurred significant expense and generated no revenue. Finally, even if a design is introduced, if our customers fail to successfully market and sell their products, it could materially adversely affect our business, financial condition, and results of operations.
16
Table of Contents
We may not be able to continue to derive significant revenues from makers of peripherals for popular video gaming platforms.
A significant portion of our gaming royalty revenues come from third-party peripheral makers who make licensed gaming products designed for use with popular video game console systems from Microsoft, Sony, and Nintendo. Video game console systems are closed, proprietary systems, and video game console system makers typically impose certain requirements or restrictions on third-party peripheral makers who wish to make peripherals that will be compatible with a particular video game console system. If third-party peripheral makers cannot or are not allowed to satisfy these requirements or restrictions, our gaming royalty revenues could be significantly reduced. Furthermore, should a significant video game console maker choose to omit touch-enabling capabilities from its console systems or somehow restrict or impede the ability of third parties to make touch-enabling peripherals, it could lead our gaming licensees to stop making products with touch-enabling capabilities, thereby significantly reducing our gaming royalty revenues. Also, if the gaming industry changes such that mobile or other platforms increase in popularity at the expense of traditional video game consoles, our gaming royalty revenues could be substantially reduced if we are unable to enter into replacement arrangements enabling us to license our software or IP in connection with gaming on such mobile or other platforms.
Automobiles and medical devices incorporating our touch-enabling technologies are subject to lengthy product development periods, making it difficult to predict when and whether we will receive royalties for these product types.
The product development process for automobiles and medical devices is very lengthy, sometimes longer than four years. We may not earn royalty revenue on our automotive/medical device technologies unless and until products featuring our technologies are shipped to customers, which may not occur until several years after we enter into an agreement with a manufacturer or a supplier to a manufacturer. Throughout the product development process, we face the risk that a manufacturer or supplier may delay the incorporation of, or choose not to incorporate, our technologies into its products, making it difficult for us to predict the royalties we may receive, if any. After the product launches, our royalties still depend on market acceptance of the vehicle, the option packages if our technology is an option (for example, a navigation unit) or medical device, which is likely to be determined by many factors beyond our control.
If we fail to successfully manage our new content and media initiative, our results of operations could be negatively impacted.
We seek to find new applications and markets for our technologies. We have invested and continue to invest significant resources in the development of technologies and software related to enhancing mobile content with haptics. Market acceptance of these new technologies and software offerings will be dependent in part on our ability to show that mobile content enhanced with haptics generates greater levels of consumer engagement, improves long-term content recall and generates more positive levels of enjoyment and brand sentiment. While we do not anticipate any meaningful revenue associated with this initiative in 2015, if we are unable to successfully establish these new offerings, our results of operations could be negatively impacted. In addition, if we fail to properly manage the licensing of rights in our OEM and content businesses, we may inadvertently impair our ability to monetize our technology in one of these businesses and our results of operations would be negatively impacted.
We have little or no control or influence on our licensees’ design, manufacturing, quality control, promotion, distribution, or pricing of their products incorporating our touch-enabling technologies, upon which we generate royalty revenue.
A key part of our business strategy is to license our software and IP to companies that manufacture and sell products incorporating our touch-enabling technologies. For the years ended December 31, 2014, 2013, and 2012, 98%, 97% and 90%, respectively, of our total revenues were royalty and license revenues. We do not control or influence the design, manufacture, quality control, promotion, distribution, or pricing of products that are manufactured and sold by our licensees, nor can we control consolidation within an industry which could
17
Table of Contents
either reduce the number of licensable products available or reduce royalty rates for the combined licensees. In addition, we generally do not have commitments from our licensees that they will continue to use our technologies in current or future products. As a result, products incorporating our technologies may not be brought to market, achieve commercial acceptance, or otherwise generate meaningful royalty revenue for us. For us to generate royalty and license revenue, licensees that pay us per-unit royalties must manufacture and distribute products incorporating our touch-enabling technologies in a timely fashion and generate consumer demand through marketing and other promotional activities. If our licensees’ products fail to achieve commercial success, or if their products are recalled because of quality control problems or if they do not ship products incorporating our touch-enabling technologies in a timely fashion or fail to achieve strong sales, our revenues will not grow and could decline.
If we fail to protect and enforce our IP rights or if we fail to continuously develop or acquire successful innovations and obtain patents on these innovations, our ability to license our technologies and generate revenues would be impaired.
Our business depends on generating revenues by licensing our IP rights and by customers selling products that incorporate our technologies. We rely on our significant patent portfolio to protect our proprietary rights. If we are not able to protect and enforce those rights, our ability to obtain future licenses or maintain current licenses and royalty revenue could be impaired. In addition, if a court or patent office were to limit the scope, declare unenforceable, or invalidate any of our patents, current licensees may refuse to make royalty payments, or they may choose to challenge one or more of our patents. It is also possible that:
| • | our pending patent applications may not result in the issuance of patents; |
| • | our patents may not be broad enough to protect our proprietary rights; and |
| • | effective patent protection may not be available in every country, particularly in Asia, where we or our licensees do business. |
In addition, our patents will continue to expire according to their terms, including the expiration of several gaming patent licenses in 2015. Our failure to continuously develop or acquire successful innovations and obtain patents on those innovations could significantly harm our business, financial condition, results of operations, or cash flows.
We also rely on licenses, confidentiality agreements, other contractual agreements, and copyright, trademark, and trade secret laws to establish and protect our proprietary rights. It is possible that:
| • | laws and contractual restrictions may not be sufficient to prevent misappropriation of our technologies or deter others from developing similar technologies; and |
| • | policing unauthorized use of our patented technologies, trademarks, and other proprietary rights would be difficult, expensive, and time-consuming, within and particularly outside of the United States. |
We have in the past initiated legal proceedings to protect our intellectual property and may need to continue to do so in the future. Any legal or administrative proceeding initiated by us to protect or enforce our IP rights may result in substantial legal expenses and may divert our management’s time and attention away from our other business operations, which could significantly harm our business.
We had an accumulated deficit of $83 million as of December 31, 2014, have only recently achieved profitability, and may not maintain profitability in the future.
As of December 31, 2014, we had an accumulated deficit of $83 million. We need to generate significant ongoing revenue to maintain consistent profitability. We will continue to incur expenses as we:
| • | engage in research and develop our technologies; |
| • | increase our sales and marketing efforts; |
18
Table of Contents
| • | attempt to expand the market for touch-enabled technologies and products; |
| • | protect and enforce our IP; |
| • | expand our international presence; |
| • | incur costs related to pending and anticipated litigation; and |
| • | acquire IP or other assets from third-parties. |
If our revenues grow more slowly than we anticipate or if our operating expenses exceed our expectations, we may not maintain profitability.
We have limited engineering, customer service, technical support, quality assurance and operations resources to design and meet delivery schedules and to provide support for our various technologies and, as a result, we could fail to deliver software and services in a timely way, with sufficient levels of quality, or at all, which may reduce our revenue.
We deploy our limited engineering, customer service, technical support, quality assurance, and operations resources on a variety of different projects and programs intended to provide sufficient levels of quality necessary for channels and customers. Our success in various markets may depend on timely deliveries and overall levels of sustained quality and customer service. Our failure to provide high quality customer deliverables in a timely fashion or at all, or our failure to maintain sufficient customer service levels, could disrupt our customer relationships, harm our brand, and reduce our revenues.
Our business depends in part on access to third-party platforms and technologies, and if the access is withdrawn, denied, or is not available on terms acceptable to us, or if the platforms or technologies change, our business and operating results could be adversely affected.
Many of our current and future software technologies are designed for use with third-party platforms and technologies. Our business relies on our access to these platforms and technologies of third parties, which can be withdrawn, denied or not be available on terms acceptable to us.
Our access to third-party platforms and technologies may require paying royalties or other amounts, which lowers our margins, or may otherwise be on terms that are not acceptable to us. In addition, the third-party platforms or technologies used to interact with our software technologies can be delayed in production or can change in ways that negatively impact the operation of our software.
If we are unable to access third-party platforms or technologies, or if our access is withdrawn, denied, or is not available on terms acceptable to us, or if the platforms or technologies are delayed or change, our business and operating results could be adversely affected.
Because we have a fixed payment license with Microsoft, our royalty revenue from licensing in the gaming market and other consumer markets has previously declined and may further do so if Microsoft increases its volume of sales of touch-enabled products at the expense of our other licensees.
Under the terms of our present agreement with Microsoft, Microsoft receives a royalty-free, perpetual, irrevocable license (including sublicense rights) to our worldwide portfolio of patents. This license permits Microsoft to make, use, and sell hardware, software, and services, excluding specified products, covered by our patents. We will not receive any further revenues or royalties from Microsoft under our current agreement with Microsoft, including with respect to Microsoft’s Xbox One gaming product. Microsoft has a significant share of the market for touch-enabled console gaming computer peripherals and is pursuing other consumer markets such as mobile devices and tablets. Microsoft has significantly greater financial, sales, and marketing resources, as well as greater name recognition and a larger customer base than some of our other licensees. In the event that Microsoft increases its share of these markets, our royalty revenue from other licensees in these market segments may decline.
19
Table of Contents
The market for certain touch-enabling technologies and touch-enabled products is at an early stage and if market demand does not develop, we may not achieve or sustain revenue growth.
The market for certain of our touch-enabling technologies and certain of our licensees’ touch-enabled products is at an early stage. If we and our licensees are unable to develop demand for our touch-enabling technologies and products, we may not achieve or sustain revenue growth. We cannot accurately predict the growth of the markets for these technologies and products, the timing of product introductions, or the timing or likelihood of these products achieving widespread commercial adoption.
We expect that we will need to continue to pursue extensive and expensive marketing and sales efforts to educate prospective licensees, component customers, and end users about the uses and benefits of our technologies and to persuade software developers and content producers to create products that utilize our technologies. Negative product reviews or publicity about our company, our technologies, our licensees’ products, haptic features, or haptic technology in general could have a negative impact on market adoption, our revenue, and/or our ability to license our technologies in the future.
Our business may suffer if third parties assert that we violate their IP rights.
Third parties have previously claimed and may in the future claim that we or our customers are infringing upon their IP rights. Even if we believe that such claims are without merit, they can be time-consuming and costly to defend against and may divert management’s attention and resources away from our business. Furthermore, third parties making such claims may be able to obtain injunctive or other equitable relief that could block our ability to further develop or commercialize some or all of our software technologies or services in the United States and abroad. Claims of IP infringement also might require us to enter into costly settlement or license agreements or pay costly damage awards. Even if we have an agreement that provides for a third party to indemnify us against such costs, the indemnifying party may be unable or unwilling to perform its contractual obligations.
We license some technologies from third parties. We must rely upon the owners of these technologies for information on the origin and ownership of the technologies. As a result, our exposure to infringement claims may increase. We generally obtain representations as to the origin and ownership of acquired or licensed technologies and indemnification to cover any breach of these representations. However, representations may not be accurate and indemnification may not provide adequate compensation for breach of the representations. If we cannot or do not license the infringed IP at all or on reasonable terms, or substitute similar technology from another source, our business, financial position, results of operations or cash flows could suffer.
Changes to U.S. patent laws and proposed changes to the rules of the U.S. Patent and Trademark Office may adversely impact our business.
Our business relies in part on the uniform and historically consistent application of U.S. patent laws and regulations. There are numerous recent changes to the patent laws and rules of the U.S. Patent and Trademark Office, which may have a significant impact on our ability to protect our technology and enforce our IP rights. For example, on September 16, 2011, President Obama signed the Leahy-Smith America Invents Act, which codified significant changes to the U.S. patent laws, including, among other things, changing from a “first to invent” to a “first inventor to file” system, limiting where a patentee may file a patent suit, requiring the apportionment of patent damages, replacing interference proceedings with derivation actions and creating a post-grant opposition process to challenge patents after they have been issued. The U.S. Patent and Trademark Office has developed new and untested regulations and procedures to govern the full implementation of the Leahy-Smith America Invents Act, and many of the substantive changes to patent law associated with the Leahy-Smith America Invents Act, and in particular, the “first inventor to file” provisions. It is not clear what impact the Leahy-Smith Act will have on the operation of our business and the protection and enforcement of our intellectual property. In addition, in recent years, the courts have interpreted U.S. patent laws and regulations differently, and in particular the U.S. Supreme Court has decided a number of patent cases and continues to actively review more patent cases than it has in the past. Some of these changes or potential changes may not be
20
Table of Contents
advantageous for us, and may make it more difficult to obtain adequate patent protection or to enforce our patents against parties using them without a license or payment of royalties. These changes could increase the costs and uncertainties surrounding the prosecution of our patent applications and the enforcement or defense of our patent rights, and could have a deleterious effect on our licensing program and, therefore, the royalties we can collect.
If we fail to develop new or enhanced technologies for new applications and platforms, we may not be able to create a market for our technologies or our technologies may become obsolete, and our ability to grow and our results of operations might be harmed.
We derive a significant portion of our revenues from licenses and royalties from a relatively small number of key technologies. We devote significant engineering resources to develop new technologies to address the evolving needs of our customers and potential customers. To remain competitive, we must introduce new technologies in a timely manner and the market must adopt them. Our initiatives to develop new and enhanced technologies and to commercialize these technologies for new applications and new platforms may not be successful or timely. Any new or enhanced technologies may not be favorably received by our licensees, potential licensees, or consumers and could damage our reputation or our brand. Expanding and enhancing our technologies could also require significant additional expenses and strain our management, financial, and operational resources.
Moreover, technology products generally have relatively short product life cycles and our current technologies may become obsolete in the future. Our ability to achieve revenue growth also depends on our continuing ability to improve and reduce the cost of our technologies, to improve their ease of integration in both hardware and software, and to introduce these technologies to the marketplace in a timely manner. If our development efforts are not successful or are significantly delayed, companies may not incorporate our technologies into their products and our revenues may not grow and could decline.
The higher cost of products incorporating our touch-enabling technologies may inhibit or prevent their widespread adoption.
Mobile devices, tablets, touchscreens, personal computer and console gaming peripherals, and automotive, medical, and industrial controls incorporating our touch-enabling technologies can be more expensive than similar competitive products that are not touch-enabled. Although many OEMs have licensed our technologies, there is generally no commitment on their part to use our technologies in their devices. The greater expense of development and production of products containing our touch-enabling technologies, together with the higher price to the end customer, may be a significant barrier to their widespread adoption and sale.
If we are unable to develop open source compliant products, our ability to license our technologies and generate revenues would be impaired.
We have seen, and believe that we will continue to see, an increase in customers requesting that we develop products that will operate in an “open source” environment. Developing open source compliant products without imperiling the IP rights upon which our licensing business depends may prove difficult under certain circumstances, thereby placing us at a competitive disadvantage for new product designs. Some of our proprietary technologies incorporate open source software that may be subject to open source licenses. These open source licenses may require that source code subject to the license be released or made available to the public. Such open source licenses may mandate that software developed based on source code that is subject to the open source license, or combined in specific ways with such open source software, become subject to the open source license. We take steps to ensure that proprietary software we do not wish to disclose is not combined with, or does not incorporate, open source software in ways that would require such proprietary software to be subject to an open source license. However, few courts have interpreted open source licenses, and the manner in which these licenses may be interpreted and enforced is therefore subject to some uncertainty. We often take steps to disclose source code for which disclosure is required under an open source license, but it is possible that we have made or will make mistakes in doing so, which could negatively impact our brand or our adoption in the community, or could expose us to additional liability. In addition, we rely on multiple software programmers to
21
Table of Contents
design our proprietary products and technologies. Although we take steps to ensure that our programmers (both internal and outsourced) do not include open source software in products and technologies we intend to keep proprietary, we cannot be certain that open source software is not incorporated into products and technologies we intend to keep proprietary. In the event that portions of our proprietary technology are determined to be subject to an open source license, or are intentionally released under an open source license, we could be required to publicly release the relevant portions of our source code, which could reduce or eliminate our ability to commercialize our products and technologies. As a result, our revenues may not grow and could decline.
The uncertain economic environment could reduce our revenues and could have an adverse effect on our financial condition and results of operations.
The current global economic conditions and political climate could materially hurt our business in a number of ways, including longer sales and renewal cycles, exchange rate volatility, delays in adoption of our products or technologies or those of our customers, increased risk of competition, higher overhead costs as a percentage of revenue, delays in signing or failing to sign customer agreements or signing customer agreements with reduced royalty rates. In addition, our customers, potential customers, and business partners would likely face similar challenges, which could materially and adversely affect the level of business they conduct with us or the sales volume of products that include our technology.
We might be unable to retain or recruit necessary personnel, which could slow the development and deployment of our technologies.
Our technologies are complex, and we rely upon the continued service of our existing personnel to support licensees, enhance existing technologies, and develop new technologies. Accordingly, our ability to develop and deploy our technologies and to sustain our revenue growth depends upon the continued service of our management and other key personnel, many of whom would be difficult to replace. Furthermore, we believe that there are a limited number of engineering and technical personnel that are experienced in haptics. Management and other key employees may voluntarily terminate their employment with us at any time without notice. The loss of management or key personnel could delay product development cycles or otherwise harm our business.
We believe that our future success will also depend largely on our ability to attract, integrate, and retain sales, support, marketing, and research and development personnel. Competition for such personnel is intense, and we may not be successful in attracting, integrating, and retaining such personnel. Given the protracted nature of, if, how, and when we collect royalties on new design contracts, it may be difficult to craft compensation plans that will attract and retain the level of salesmanship needed to secure these contracts. Additionally, some of our executive officers and key employees hold stock options with exercise prices that may be above the current market price of our common stock or that are largely vested. Each of these factors may impair our ability to retain the services of our executive officers and key employees.
As our business grows, such growth may place a significant strain on our management and operations and, as a result, our business may suffer.
We plan to continue expanding our business, and any significant growth in revenue or headcount could place a significant strain on our management systems, infrastructure and other resources. We will need to continue to invest the necessary capital to upgrade and improve our operational, financial and management reporting systems. If our management fails to manage our growth effectively, we could experience increased costs, declines in product quality, and/or customer satisfaction, which could harm our business.
Product liability claims could be time-consuming and costly to defend and could expose us to loss.
Our products or our licensees’ products may have flaws or other defects that may lead to personal or other injury claims. If products that we or our licensees sell cause personal injury, property damage, financial loss, or other injury to our or our licensees’ customers, the customers or our licensees may seek damages or other recovery from us. In addition, even though we have transitioned from the medical products line of business, we could face product liability claims for products that we have sold or that our successors have sold or may sell in
22
Table of Contents
the future. Defending any claims against us, regardless of merit, would be time-consuming, expensive, and distracting to management, and could result in damages and injure our reputation, the reputation of our technology, services, or products, or the reputation of our licensees or their products. This damage could limit the market for our and our licensees’ products and harm our results of operations. In addition, if our business liability insurance coverage proves inadequate or future coverage is unavailable on acceptable terms or at all, our business, operating results and financial condition could be adversely affected.
In the past, manufacturers of peripheral products, including certain gaming products such as joysticks, wheels, or gamepads, have been subject to claims alleging that use of their products has caused or contributed to various types of repetitive stress injuries, including carpal tunnel syndrome. While we have not experienced any product liability claims to date, we could face such claims in the future, which could harm our business and reputation. Although our license agreements typically contain provisions designed to limit our exposure to product liability claims, existing or future laws or unfavorable judicial decisions could limit or invalidate the provisions.
Our technologies are complex and may contain undetected errors, which could harm our reputation and future sales.
Any failure to provide high quality and reliable technologies, whether caused by our own failure or failures of our suppliers or OEM customers, could damage our reputation and reduce demand for our technologies. Our technologies have in the past contained, and may in the future contain, undetected errors or defects. Some errors in our technologies may only be discovered after a customer’s product incorporating our technologies has been shipped to customers. Any errors or defects discovered in our technologies after commercial release could result in product recalls, loss of revenue, loss of customers, and increased service and warranty costs, any of which could adversely affect our business.
Our customers may have difficulties obtaining the components necessary to manufacture haptic-based products, which could harm our business and results of operations.
In order to manufacture haptic-based products, our customers require components such as actuators and amplifiers. The inability of suppliers to deliver adequate supplies of these components could disrupt our customers’ production processes, which would harm our business and results of operations. In addition, if our customers choose to use lower quality actuators as a cost-saving measure, the technical performance of our software may be adversely affected which could also harm our business and results of operations. Certain of our newer products require new types of components that we expect will be developed and sold by our ecosystem partners. Failure of our ecosystem partners to bring these products to market in a timely and quality fashion at attractive prices may negatively affect our ability to secure customers for these newer products which could harm our business and results of operations. Component suppliers to customers could also be affected by natural disasters and other similar events, including losses due to earthquakes.
Catastrophic events, such as natural disasters, war, and acts of terrorism could disrupt the business of our customers, which could harm our business and results of operations.
The production processes and operations of our customers are susceptible to the occurrence of catastrophic events, such as natural disasters, war, and acts of terrorism, all of which are outside of our control. Any such events could cause a serious business disruption to our customers’ ability to manufacture, distribute and sell products incorporating our touch-enabling technologies, which may adversely affect our business and results of operation.
If our facilities were to experience catastrophic loss, our operations would be seriously harmed.
Our facilities could be subject to a catastrophic loss such as fire, flood, earthquake, power outage, or terrorist activity. A substantial portion of our research and development activities, our corporate headquarters, and other critical business operations are located near major earthquake faults in San Jose, California, an area with a history of seismic events. An earthquake at or near our facilities could disrupt our operations and result in large expenses to repair and replace the facility. While we believe that we maintain insurance sufficient to cover most long-term potential losses at our facilities, our existing insurance may not be adequate for all possible losses including losses due to earthquakes.
23
Table of Contents
If we fail to establish and maintain proper and effective internal controls, our ability to produce accurate financial statements on a timely basis could be impaired, which would adversely affect our consolidated operating results, our ability to operate our business and our stock price.
We have in the past had material weaknesses in our internal control over financial reporting. Ensuring that we have adequate internal financial and accounting controls and procedures in place to produce accurate financial statements on a timely basis is a costly and time-consuming effort that needs to be re-evaluated frequently. Any failure on our part to remedy identified material weaknesses, or any additional delays or errors in our financial reporting controls or procedures, could cause our financial reporting to be unreliable and could have a material adverse effect on our business, results of operations, or financial condition and could have a substantial adverse impact on the trading price of our common stock.
We do not expect that our internal control over financial reporting will prevent or detect all errors and all fraud. A control system, no matter how well designed and operated, can provide only reasonable, not absolute, assurance that the control system’s objectives will be met. Because of the inherent limitations in all control systems, no evaluation of controls can provide absolute assurance that misstatements due to error or fraud will not occur or that all control issues and instances of fraud, if any, within our company will have been detected.
The nature of some of our products may also subject us to export control regulation by the U.S. Department of State and the Department of Commerce. Violations of these regulations can result in monetary penalties and denial of export privileges.
Our sales to customers or sales by our customers to their end customers in some areas outside the United States could be subject to government export regulations or restrictions that prohibit us or our licensees from selling to customers in some countries or that require us or our licensees to obtain licenses or approvals to export such products internationally. Delays or denial of the grant of any required license or approval, or changes to the regulations, could make it difficult or impossible to make sales to foreign customers in some countries and could adversely affect our revenue. In addition, we could be subject to fines and penalties for violation of these export regulations if we were found in violation. Such violation could result in penalties, including prohibiting us from exporting our products to one or more countries, and could materially and adversely affect our business.
Investment Risks
Our quarterly revenues and operating results are volatile, and if our future results are below the expectations of public market analysts or investors, the price of our common stock is likely to decline.
Our revenues and operating results are likely to vary significantly from quarter to quarter due to a number of factors, many of which are outside of our control and any of which could cause the price of our common stock to decline.
These factors include:
| • | the establishment or loss of licensing relationships; |
| • | the timing and recognition of payments under fixed and/or up-front license agreements, as well as other multi-element arrangements; |
| • | seasonality in the demand for our technologies or products or our licensees’ products; |
| • | the timing of our expenses, including costs related to litigation, stock-based awards, acquisitions of technologies, or businesses; |
| • | developments in and costs of pursuing any pending litigation; |
| • | the timing of introductions and market acceptance of new technologies and products and product enhancements by us, our licensees, our competitors, or their competitors; |
24
Table of Contents
| • | the timing of work performed under development agreements; and |
| • | errors in our licensees’ royalty reports, and corrections and true-ups to royalty payments and royalty rates from prior periods. |
Changes in financial accounting standards, policies or practices may have adverse, unexpected financial reporting implications and affect our reported results of operations.
A change in accounting standards, policies, or practices, such as the new revenue accounting standard that will become effective for us in 2017, ASU No. 2014-09 “Revenue from Contracts with Customers: Topic 606”, can have a significant effect on our reported results and may even affect our reporting of transactions completed before the change is effective. New accounting pronouncements and varying interpretations of accounting pronouncements have occurred and may occur in the future. Changes to existing rules or the questioning of current practices may adversely affect our reported financial results or the way we conduct our business.
Our business is subject to changing regulations regarding corporate governance and other compliance areas that will increase both our costs and the risk of noncompliance.
As a public company, we are subject to the reporting requirements of the Exchange Act, the Sarbanes-Oxley Act of 2002, and the rules and regulations of The NASDAQ Stock Market. The requirements of these and other rules and regulations have increased and we expect will continue to increase our legal, accounting and financial compliance costs, will make some activities more difficult, time-consuming and costly, and may also place undue strain on our personnel, systems and resources.
Our stock price may fluctuate regardless of our performance.
The stock market has experienced extreme volatility that often has been unrelated or disproportionate to the performance of particular companies. These market fluctuations may cause our stock price to decline regardless of our performance. The market price of our common stock has been, and in the future could be, significantly affected by factors such as: actual or anticipated fluctuations in operating results; announcements of technical innovations; announcements regarding litigation in which we are involved; the acquisition or loss of customers; changes by game console manufacturers to not include touch-enabling capabilities in their products; new products or new contracts; sales or the perception in the market of possible sales of large number of shares of our common stock by insiders or others; stock repurchase activity; changes in securities analysts’ recommendations; personnel changes; changing circumstances regarding competitors or their customers; governmental regulatory action or inaction; developments with respect to patents or proprietary rights; inclusion in or exclusion from various stock indices; and general market conditions. In the past, following periods of volatility in the market price of a company’s securities, securities class action litigation has been initiated against that company.
Our stock repurchase program could affect our stock price and add volatility.
Any repurchases pursuant to our stock repurchase program could affect our stock price and add volatility. There can be no assurance that any repurchases will actually be made under the program, nor is there any assurance that a sufficient number of shares of our common stock will be repurchased to satisfy the market’s expectations. Furthermore, there can be no assurance that any repurchases conducted under the plan will be made at the best possible price. The existence of a stock repurchase program could also cause our stock price to be higher than it would be in the absence of such a program and could potentially reduce the market liquidity for our stock. Additionally, we are permitted to and could discontinue our stock repurchase program at any time and any such discontinuation could cause the market price of our stock to decline.
Provisions in our charter documents and Delaware law could prevent or delay a change in control, which could reduce the market price of our common stock.
Provisions in our certificate of incorporation and bylaws may have the effect of delaying or preventing a change of control or changes in our board of directors or management, including the following:
| • | our board of directors is classified into three classes of directors with staggered three-year terms; |
25
Table of Contents
| • | only our chairperson of the board of directors, a majority of our board of directors or 10% or greater stockholders are authorized to call a special meeting of stockholders; |
| • | our stockholders can only take action at a meeting of stockholders and not by written consent; |
| • | vacancies on our board of directors can be filled only by our board of directors and not by our stockholders; |
| • | our restated certificate of incorporation authorizes undesignated preferred stock, the terms of which may be established and shares of which may be issued without stockholder approval; and |
| • | advance notice procedures apply for stockholders to nominate candidates for election as directors or to bring matters before an annual meeting of stockholders. |
In addition, certain provisions of Delaware law may discourage, delay, or prevent someone from acquiring or merging with us. These provisions could limit the price that investors might be willing to pay in the future for shares.
We may engage in acquisitions that could dilute stockholders’ interests, divert management attention, or cause integration problems.
As part of our business strategy, we have in the past and may in the future, acquire businesses or IP that we feel could complement our business, enhance our technical capabilities, or increase our IP portfolio. The pursuit of potential acquisitions may divert the attention of management and cause us to incur various expenses in identifying, investigating, and pursuing suitable acquisitions, whether or not they are consummated.
If we consummate acquisitions through the issuance of our securities, our stockholders could suffer significant dilution. Acquisitions could also create risks for us, including:
| • | unanticipated costs associated with the acquisitions; |
| • | use of substantial portions of our available cash to consummate the acquisitions; |
| • | diversion of management’s attention from other business concerns; |
| • | difficulties in assimilation of acquired personnel or operations; |
| • | failure to realize the anticipated benefits of acquired IP or other assets; |
| • | charges associated with amortization of acquired assets or potential charges for write-down of assets or goodwill associated with unsuccessful acquisitions; |
| • | potential IP infringement or other claims related to acquired businesses, assets, product lines, or technologies; and |
| • | potential costs associated with failed acquisition efforts. |
Any acquisitions, even if successfully completed, might not generate significant additional revenue or provide any benefit to our business.
Item 1B. Unresolved Staff Comments
None.
We lease a facility in San Jose, California of approximately 33,000 square feet, which serves as our corporate headquarters and includes our sales, marketing, administration, and research and development functions. The lease for this property was to expire in December 2016. On November 12, 2014, we entered into
26
Table of Contents
an amendment that terminates the lease of this facility in May 2015. Under the amendment, we also entered into a lease for a new San Jose facility of approximately 42,000 square foot as of February 2015. The lease for the new facility expires in April 2023 and we have an option to renew through April 2028.
We lease a facility in Montreal, Quebec, Canada of approximately 10,000 square feet, for our subsidiary, Immersion Canada, Inc. The facility is used for research and development and administration functions. The lease for this property expires in December 2018.
We also lease office space in Seocho-gu, Seoul, Korea; Shanghai, China; Zhonghe City, Taipei, Taiwan; and Tokyo, Japan.
We believe that our existing facilities are adequate to meet our current needs.
Immersion Corporation vs. Motorola Mobility, Inc., Motorola Mobility Holdings, Inc., HTC Corporation, HTC America Holding, Inc., HTC America, Inc., HTC (B.V.I.) Corporation, Exedea, Inc., Brightstar Corporation, and Brightpoint, Inc.
On February 7, 2012, we filed a complaint against Motorola with the U.S. International Trade Commission (the “ITC”) alleging that certain Motorola mobile electronic devices, including smartphones and cellular phones, infringe six of our patents that cover various uses of haptic effects in connection with touchscreens (the “ITC Complaint”). We amended the ITC Complaint on March 2, 2012 to add the following parties: HTC Corporation, HTC America Holding, Inc., HTC America, Inc., HTC (B.V.I.) Corporation, Exedea, Inc., Brightstar Corporation and Brightpoint, Inc. We subsequently withdrew HTC America Holding, Inc., HTC (B.V.I.) Corporation, Exedea, Brightstar, and Brightpoint from the ITC Complaint. The ITC instituted an investigation against Motorola Mobility, Inc., Motorola Mobility Holdings, Inc., HTC Corporation, and HTC America, Inc. on April 2, 2012.
On March 2, 2012, we filed a complaint against HTC Corporation, HTC America Holding, Inc., HTC America, Inc., HTC (B.V.I.) Corporation, Exedea, Inc., Brightstar Corporation and Brightpoint, Inc. (collectively, “HTC”) in the U.S. District Court for the District of Delaware (the “HTC Delaware Complaint”) alleging that certain of HTC’s mobile electronic devices, including smartphones and cellular phones, infringe six of our patents that cover various uses of haptic effects. The HTC Delaware Complaint covers the same patents as the ITC Complaint. The HTC Delaware Complaint seeks damages and injunctive relief. The parties stipulated to stay the case pending the completion of the ITC investigation.
The HTC Delaware Complaint currently asserts infringement of the following patents:
U.S. Patent No 6,429,846 (the ’846 patent): “Haptic Feedback for Touchpads and Other Touch Controls”
U.S. Patent No 7,969,288 (the ’288 patent): “Force Feedback System Including Multi-Tasking Graphical Host Environment and Interface Device”
U.S. Patent No 7,982,720 (the ’720 patent): “Haptic Feedback for Touchpads and Other Touch Controls”
U.S. Patent No 8,031,181 (the ’181 patent): “Haptic Feedback for Touchpads and Other Touch Controls”
U.S. Patent No 8,059,105 (the ’105 patent): “Haptic Feedback for Touchpads and Other Touch Controls”
HTC asserted that the patents are not infringed, are invalid, and are unenforceable.
On November 21, 2012, we entered into a confidential settlement agreement with Motorola. On January 15, 2013, the Administrative Law Judge issued an Initial Determination terminating the ITC investigation as to Motorola. On March 15, 2013, we dismissed the Motorola Delaware Complaint.
27
Table of Contents
On March 12, 2013, we filed motions to suspend the procedural schedule and to terminate the ITC investigation against HTC. The Administrative Law Judge issued an order granting the motion to suspend the procedural schedule on March 19, 2013 and issued an Initial Determination terminating the ITC investigation as to HTC on March 27, 2013. The decision became final on April 26, 2013.
We requested that the U.S. District Court for the District of Delaware re-open the case against HTC filed in that Court, and the case was reopened on May 1, 2013. We filed an amended complaint on May 3, 2013. HTC answered the amended complaint on June 28, 2013, stating affirmative defenses of (1) non-infringement, (2) invalidity, (3) prosecution history estoppel, (4) equitable estoppel, exhaustion, license, and/or waiver, (5) intervening rights, (6) unclean hands, (7) patent misuse, (8) inequitable conduct based on ’720 patent reexamination, (9) inequitable conduct (’846 patent family), (10) inequitable conduct (’288 patent), (11) double patenting, (12) failure to comply with 35 U.S.C. § 120, and (13) failure to mark / failure to mitigate. On September 30, 2013 the Court entered a Scheduling Order in the case.
On October 3, 2014, HTC filed five motions with the Court: (1) motion to exclude the testimony of Immersion’s damages expert; (2) motion for partial summary judgment shortening the damages period for U.S. Patent Nos. 7,969,288; 7,982,720, and 8,031,18; (3) motion for summary judgment of invalidity of U.S. Patent Nos. 8,059,105; 8,031,181; and 7,982,720; (4) motion for summary judgment of non-infringement of U.S. Patent No. 7,969,288, and; (5) motion for summary judgment of non-infringement of U.S. Patent Nos. 6,429,846; 7,982,720; 8,031,181; and 8,059,105. A hearing on claim construction and the latter three motions was held on November 25, 2014. A hearing on the first motion was held on January 30, 2015. On February 11, the Court issued rulings on claim construction and on four of HTC’s five motions. The Court denied the motion for summary judgment of non-infringement of the ’288 patent (because the Court found the ’720 and ’181 patents invalid as anticipated, it did not address HTC’s arguments with regard to these patents); granted in part the motion for summary judgment of non-infringement of the ’846, ’720, ’181, and ’105 patents, finding that the HTC’s products do not literally infringe the ’846, and ’105 patents; and granted the motions for partial summary judgment shortening the damages period of the ’288 patent, and for summary judgment of invalidity of the ’105, ’181, and ’720 patents. On February 24, 2015 the Court denied in part and granted in part the first motion, ruling that Immersion’s damages expert may testify about reasonable royalties but not about lost profits. Trial is scheduled to begin on March 23, 2015.
In the U.S. Patent Office, HTC filed requests for ex-parte reexamination of three of our patents: the ’288, ’999, and ‘720 patents. Reexamination of the ’288 patent was requested on July 30, 2012. The U.S. Patent Office granted the request on October 24, 2012. Reexamination of the ’999 patent was requested on September 6, 2012. The U.S. Patent Office granted the request on November 26, 2012. Reexamination of the ’720 patent was requested on September 10, 2012. The U.S. Patent Office granted the request on November 28, 2012. On July 24, 2013, the U.S. Patent Office issued a Reexamination Certificate for the ’999 patent, after certain claims were cancelled and other claims were amended. On February 18, 2014, the U.S. Patent Office issued a Reexamination Certificate for the ’720 patent after certain claims were cancelled and other claims were amended. On February 10, 2014 the U.S. Patent Office issued a Reexamination Certificate for the ‘288 patent after certain claims were cancelled and claim 18 was amended.
We cannot predict the ultimate outcome of the above-mentioned federal actions, and we are unable to estimate any potential liability we may incur.
Item 4. Mine Safety Disclosures
Not applicable.
28
Table of Contents
PART II
| Item 5. | Market for Registrant’s Common Equity, Related Stockholder Matters and Issuer Purchases of Equity Securities |
Our common stock is traded on the Nasdaq Global Market under the symbol “IMMR.” The following table sets forth, for the periods indicated, the high and low sales prices for our common stock on such market.
| High |
Low |
|||||||
| Fiscal year ended December 31, 2014 |
||||||||
| Fourth Quarter |
$ | 9.62 | $ | 7.20 | ||||
| Third Quarter |
$ | 14.72 | $ | 8.51 | ||||
| Second Quarter |
$ | 12.79 | $ | 10.00 | ||||
| First Quarter |
$ | 12.60 | $ | 9.69 | ||||
| Fiscal year ended December 31, 2013 |
||||||||
| Fourth Quarter |
$ | 13.91 | $ | 10.35 | ||||
| Third Quarter |
$ | 16.73 | $ | 12.25 | ||||
| Second Quarter |
$ | 15.75 | $ | 9.63 | ||||
| First Quarter |
$ | 11.99 | $ | 5.90 | ||||
On February 19, 2015, the closing price was $8.77 per share and there were 91 holders of record of our common stock. Because many of such shares are held by brokers and other institutions on behalf of stockholders, we are unable to estimate the total number of stockholders represented by these record holders.
Dividend Policy
We have never declared or paid any cash dividends on our common stock and we do not anticipate paying cash dividends in the foreseeable future. We currently intend to retain any earnings to fund future growth, product development, and operations.
Purchases of Equity Securities by the Issuer
Below is a summary of stock repurchases for the three months ended December 31, 2014. See Note 10 of our consolidated financial statements for information regarding our stock repurchase program.
| Program/Period (1) | Shares |
Average |
Approximate Dollar Value that May Yet Be Purchased |
|||||||||
| Beginning approximate dollar value available to be repurchased as of September 30, 2014 |
$ | 7,442 | ||||||||||
| Additional authorization on October 22, 2014 |
30,000 | |||||||||||
| Less repurchases: |
||||||||||||
| October 1 — October 31, 2014 |
376,504 | $ | 7.97 | |||||||||
| November 1 — November 30, 2014 |
0 | 0.00 | ||||||||||
| December 1 — December 31, 2014 |
0 | 0.00 | ||||||||||
|
|
|
|||||||||||
| October 1 — December 31, 2014 |
376,504 | 3,002 | ||||||||||
|
|
|
|
|
|||||||||
| Ending approximate dollar value that may be repurchased under the program as of December 31, 2014 |
$ | 34,440 | ||||||||||
|
|
|
|||||||||||
(1) On November 1, 2007, our board of directors authorized a share repurchase program of up to $50,000,000. On October 22, 2014, our board of directors authorized an additional $30,000,000 under the share repurchase program. These share repurchase authorizations have no expiration dates and do not require us to repurchase a specific number of shares. The timing and amount of any share repurchase will depend on the share price, corporate and regulatory requirements, economic and market conditions, and other factors. The repurchase authorizations may be modified, suspended, or discontinued at any time.
29
Table of Contents
(2) All shares were repurchased on the open market as part of the plan publicly announced on November 1, 2007. The repurchases were effected by a single broker in market transactions at prevailing market prices net of transaction costs pursuant to a trading plan designed to satisfy the conditions of Rule 10b5-1 under the Exchange Act, as amended.
Company Stock Performance Graph
The information contained in the Performance Graph shall not be deemed to be “soliciting material” or “filed” with the SEC or subject to the liabilities of Section 18 of the Exchange Act, as amended, except to the extent that we specifically incorporate it by reference into a document filed under the Securities Act, as amended, or the Exchange Act.
The graph below depicts a five-year comparison of cumulative total shareholder returns for Immersion common stock, the NASDAQ Composite Index, and the RDG Technology Composite Index. The graph assumes an investment of $100 for the five-year period commencing on December 31, 2009 and ending on December 31, 2014, in Immersion’s common stock, and in the NASDAQ Composite and the RDG Technology Composite indices, and reinvestment of dividends, if any.
The comparison below is based on historical data, and Immersion cautions that the stock price performance shown in the graph is not indicative of, nor intended to forecast, the potential future performance of Immersion’s common stock. Information used in the graph was obtained from a source believed to be reliable, but Immersion is not responsible for any errors or omissions in such information.
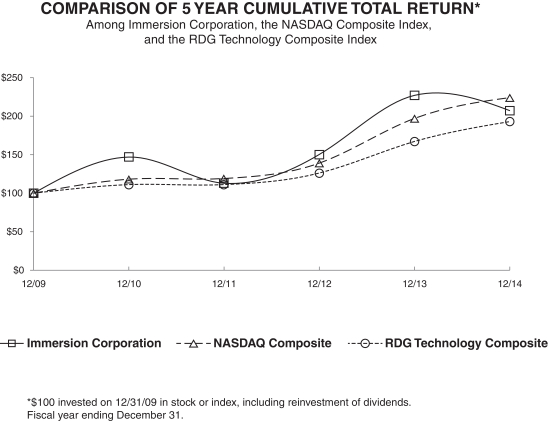
| December 31, | ||||||||||||||||||||||||
| 2009 |
2010 |
2011 |
2012 |
2013 |
2014 |
|||||||||||||||||||
| Immersion Corporation |
$ | 100 | $ | 147 | $ | 113 | $ | 150 | $ | 227 | $ | 207 | ||||||||||||
| NASDAQ Composite |
100 | 118 | 119 | 139 | 197 | 224 | ||||||||||||||||||
| RDG Technology Composite |
100 | 111 | 111 | 126 | 167 | 193 | ||||||||||||||||||
30
Table of Contents
Securities Authorized for Issuance under Equity Compensation Plans
The information concerning our equity compensation plans is incorporated by reference herein to Note 9 to the notes to our consolidated financial statements.
Item 6. Selected Financial Data
The following selected consolidated financial data is qualified in its entirety by, and should be read in conjunction with, “Management’s Discussion and Analysis of Financial Condition and Results of Operations” and the consolidated financial statements and notes thereto included elsewhere in this Annual Report on Form 10-K.
| Years Ended December 31, | ||||||||||||||||||||
| 2014 |
2013 |
2012 |
2011 |
2010 (1) |
||||||||||||||||
| (In thousands, except per share data) | ||||||||||||||||||||
| CONSOLIDATED STATEMENTS OF OPERATIONS DATA: |
||||||||||||||||||||
| Revenues |
$ | 52,937 | $ | 47,470 | $ | 32,169 | $ | 30,635 | $ | 31,124 | ||||||||||
| Costs and expenses |
46,970 | 43,866 | 38,897 | 32,514 | 37,301 | |||||||||||||||
| Operating income (loss) |
5,967 | 3,604 | (6,728 | ) | (1,879 | ) | (6,177 | ) | ||||||||||||
| Income tax benefit (provision) from continuing operations |
(2,196 | ) | 36,483 | (792 | ) | (1,816 | ) | (1,501 | ) | |||||||||||
| Income (loss) from continuing operations |
4,123 | 40,155 | (7,350 | ) | (3,491 | ) | (7,406 | ) | ||||||||||||
| Gain from discontinued operations (net of tax) |
0 | 0 | 153 | 61 | 130 | |||||||||||||||
| Net income (loss) |
4,123 | 40,155 | (7,197 | ) | (3,430 | ) | (7,276 | ) | ||||||||||||
| Basic net income (loss) per share |
||||||||||||||||||||
| Continuing operations |
$ | 0.15 | $ | 1.42 | $ | (0.27 | ) | $ | (0.12 | ) | $ | (0.26 | ) | |||||||
| Discontinued operations |
0.00 | 0.00 | 0.01 | 0.00 | 0.00 | |||||||||||||||
|
|
|
|
|
|
|
|
|
|
|
|||||||||||
| Total |
$ | 0.15 | $ | 1.42 | $ | (0.26 | ) | $ | (0.12 | ) | $ | (0.26 | ) | |||||||
| Shares used in calculating basic net income (loss) per share |
28,246 | 28,190 | 27,735 | 28,564 | 28,113 | |||||||||||||||
| Diluted net income (loss) per share |
||||||||||||||||||||
| Continuing operations |
$ | 0.14 | $ | 1.37 | $ | (0.27 | ) | $ | (0.12 | ) | $ | (0.26 | ) | |||||||
| Discontinued operations |
0.00 | 0.00 | 0.01 | 0.00 | 0.00 | |||||||||||||||
|
|
|
|
|
|
|
|
|
|
|
|||||||||||
| Total |
$ | 0.14 | $ | 1.37 | $ | (0.26 | ) | $ | (0.12 | ) | $ | (0.26 | ) | |||||||
| Shares used in calculating diluted net income (loss) per share |
29,144 | 29,338 | 27,735 | 28,564 | 28,113 | |||||||||||||||
| December 31, | ||||||||||||||||||||
| 2014 |
2013 |
2012 |
2011 |
2010 |
||||||||||||||||
| (In thousands) | ||||||||||||||||||||
| CONSOLIDATED BALANCE SHEET DATA: |
||||||||||||||||||||
| Cash, cash equivalents, and short-term investments |
$ | 57,361 | $ | 71,112 | $ | 43,546 | $ | 56,285 | $ | 61,204 | ||||||||||
| Working capital |
58,025 | 64,249 | 38,378 | 49,245 | 56,504 | |||||||||||||||
| Total assets |
97,521 | 110,575 | 48,011 | 60,794 | 68,704 | |||||||||||||||
| Total stockholders’ equity |
76,603 | 80,671 | 29,278 | 37,891 | 41,780 | |||||||||||||||
(1) On March 30, 2010, we divested certain medical simulation product lines through an asset sale. Revenues and costs for these product lines have been included in the operating loss in continuing operations through the date of the sale.
31
Table of Contents
Item 7. Management’s Discussion and Analysis of Financial Condition and Results of Operations
The following discussion should be read in conjunction with the consolidated financial statements and notes thereto.
This Management’s Discussion and Analysis of Financial Condition and Results of Operations includes forward-looking statements within the meaning of Section 27A of the Securities Act, as amended, and Section 21E of the Exchange Act, as amended. The forward-looking statements involve risks and uncertainties. Forward-looking statements are identified by words such as “anticipates,” “believes,” “expects,” “intends,” “may,” “will,” and other similar expressions. However, these words are not the only way we identify forward-looking statements. In addition, any statements, which refer to expectations, projections, or other characterizations of future events or circumstances, are forward-looking statements. Actual results could differ materially from those projected in the forward-looking statements as a result of a number of factors, including those set forth in Item 1A, “Risk Factors,” those described elsewhere in this report, and those described in our other reports filed with the SEC. We caution you not to place undue reliance on these forward-looking statements, which speak only as of the date of this report, and we undertake no obligation to release the results of any revisions to these forward-looking statements that could occur after the filing of this report.
Critical Accounting Policies and Estimates
Our discussion and analysis of our financial condition and results of operations are based upon our consolidated financial statements, which have been prepared in accordance with accounting principles generally accepted in the United States of America (“GAAP”). The preparation of these consolidated financial statements requires management to make estimates and assumptions that affect the reported amounts of assets, liabilities, revenues, expenses, and related disclosure of contingent assets and liabilities. On an ongoing basis, we evaluate our estimates and assumptions, including those related to revenue recognition, stock-based compensation, short-term investments, patents and intangible assets, income taxes, contingencies, and litigation. We base our estimates and assumptions on historical experience and on various other factors that we believe to be reasonable under the circumstances, the results of which form the basis for making judgments about the carrying values of assets and liabilities that are not readily apparent from other sources. Actual results may differ from these estimates and assumptions.
We believe the following are our most critical accounting policies as they require our significant judgments and estimates in the preparation of our consolidated financial statements:
Revenue Recognition
We recognize revenues in accordance with applicable accounting standards, including Accounting Standards Codification (“ASC”) 605-10-S99, “Revenue Recognition” (“ASC 605-10-S99”); ASC 605-25, “Multiple Element Arrangements” (“ASC 605-25”); and ASC 985-605, “Software-Revenue Recognition” (“ASC 985-605”). We derive our revenues from three principal sources: royalty and license fees, development contract and service fees, and, previously, product sales. As described below, management judgments and estimates must be made and used in connection with the revenue recognized in any accounting period. Material differences may result in the amount and timing of our revenue for any period based on the judgments and estimates made by our management. Specifically, in connection with each transaction, we must evaluate whether: (i) persuasive evidence of an arrangement exists, (ii) delivery has occurred, (iii) the fee is fixed or determinable, and (iv) collectibility is probable. We apply these criteria as discussed below.
| • | Persuasive evidence of an arrangement exists. For a license arrangement, we require a written contract, signed by both the customer and us. For a stand-alone product sale, we require a purchase order or other form of written agreement with the customer. |
| • | Delivery has occurred. We deliver software and product to our customers physically and also deliver software electronically. For physical deliveries not related to software, our transfer terms |
32
Table of Contents
| typically include transfer of title and risk of loss at our shipping location. For electronic deliveries, delivery occurs when we provide the customer access codes or “keys” that allow the customer to take immediate possession of the software. |
| • | The fee is fixed or determinable. Our arrangement fee is based on the use of standard payment terms which are those that are generally extended to the majority of customers. For transactions involving extended payment terms, we deem these fees not to be fixed or determinable for revenue recognition purposes and revenue is deferred until the fees become due and payable. |
| • | Collectibility is probable. To recognize revenue, we must judge collectibility of fees, which we do on a customer-by-customer basis pursuant to our credit review policy. We typically sell to customers with whom we have a history of successful collection. For new customers, we evaluate the customer’s financial condition and ability to pay. If we determine that collectibility is not probable based upon our credit review process or the customer’s payment history, we recognize revenue when payment is received. |
Royalty and license revenue — We license our patents and software to customers in a variety of industries such as mobility, gaming, automotive, and medical devices. Certain of these are variable fee arrangements where the royalties earned by us are based on unit or sales volumes of the respective licensees. We also enter into fixed license fee arrangements. The terms of the royalty agreements generally require licensees to give notification of royalties due to us within 30 – 45 days of the end of the quarter during which their related sales occur. As we are unable to reliably estimate the licensees’ sales in any given quarter to determine the royalties due to us, we recognize royalty revenues based on royalties reported by licensees and when all revenue recognition criteria are met. Certain royalties are based upon customer shipments or revenues and could be subject to change and may result in out of period adjustments. We recognize fixed license fee revenue for licenses when earned under the terms of the agreements, which is generally recognized on a straight-line basis over the expected term of the license.
Development, services, and other revenue — Development, services, and other revenue are composed of engineering services (engineering services and/or development contracts), and in limited cases, post contract customer support (“PCS”). Engineering services revenues are recognized under the proportional performance accounting method based on physical completion of the work to be performed or completed performance method. A provision for losses on contracts is made, if necessary, in the period in which the loss becomes probable and can be reasonably estimated. Revisions in estimates are reflected in the period in which the conditions become known. To date, such losses have not been significant. Revenue from PCS is typically recognized over the period of the ongoing obligation, which is generally consistent with the contractual term.
Multiple element arrangements — We enter into multiple element arrangements in which customers purchase time-based non-exclusive licenses that cannot be resold to others, which include a combination of software and/or IP licenses, engineering services, and in limited cases PCS. For arrangements that are software based and include software and engineering services, the services are generally not essential to the functionality of the software, and customers may purchase engineering services to facilitate the adoption of our technology, but they may also decide to use their own resources or appoint other engineering service organizations to perform these services. For arrangements that are in substance subscription arrangements, the entire arrangement fee is recognized ratably over the contract term, subject to any limitations related to extended payment terms. For arrangements involving upfront fees for services and royalties earned by us based on unit or sales volumes of the respective licensees, and the services are performed ratably over the arrangement or are front-end loaded, the upfront fees are recognized ratably over the contract term and royalties based on unit or sales volume are recognized when they become fixed and determinable. As we are unable to reliably estimate the licensees’ sales in any given quarter to determine the royalties due to us, we recognize per unit or sales volume driven royalty revenues based on royalties reported by licensees and when all revenue recognition criteria are met.
Product sales — We recognize revenue from the sale of products and the license of associated software, if any, and expense all related costs of products sold, once delivery has occurred and customer acceptance, if required, has been achieved. We typically grant our customers a warranty which guarantees that
33
Table of Contents
our products will substantially conform to our current specifications for generally three to twelve months from the delivery date pursuant to the terms of the arrangement. Historically, warranty-related costs have not been significant. As of December 2013, we ceased selling products.
Cost of Revenues
Cost of revenues includes both cost of development and services revenues and cost of product sales. Cost of development and services revenue includes primarily labor related costs relating to these contracts. Cost of product sales consists primarily of contract manufacturing and other overhead costs.
Stock-based Compensation
Stock-based compensation cost is measured at the grant date based on the fair value of the award and is recognized as expense on a straight-line basis over the requisite service period, which is the vesting period.
Valuation and amortization methods — We use the Black-Scholes-Merton option pricing model (“Black-Scholes model”), single-option approach to determine the fair value of standard stock options and Employee Stock Purchase Plan (“ESPP”) shares. All share-based payment awards are amortized on a straight-line basis over the requisite service periods of the awards, which are generally the vesting periods. Stock-based compensation expense recognized at fair value includes the impact of estimated forfeitures. We estimate future forfeitures at the date of grant and revise the estimates if necessary, in subsequent periods if actual forfeitures differ from these estimates. The determination of the fair value of stock-based payment awards on the date of grant using an option-pricing model is affected by our stock price as well as assumptions regarding a number of complex and subjective variables. These variables include actual and projected employee stock option exercise behaviors that impact the expected term, our expected stock price volatility over the term of the awards, risk-free interest rate, and expected dividends.
We use the Monte-Carlo Simulation model to value our stock options with a market condition. Valuation techniques such as the Monte-Carlo Simulation model have been developed to value path-dependent awards. The Monte-Carlo Simulation model is a generally accepted statistical technique used, in this instance, to simulate a range of future stock prices for the Company.
The Black-Scholes model was developed for use in estimating the fair value of traded options that have no vesting restrictions and are fully transferable, characteristics not present in our option grants and ESPP shares. Existing valuation models, including the Black-Scholes model and the Monte-Carlo Simulation, may not provide reliable measures of the fair values of our stock-based compensation. Consequently, there is a risk that our estimates of the fair values of our stock-based compensation awards on the grant dates may bear little resemblance to the actual values realized upon the exercise, expiration, early termination, or forfeiture of those stock-based payments in the future. Certain stock-based payments, such as employee stock options, may expire and be worthless or otherwise result in zero intrinsic value as compared to the fair values originally estimated on the grant date and reported in our financial statements. Alternatively, value may be realized from these instruments that are significantly higher than the fair values originally estimated on the grant date and reported in our financial statements. There currently is no market-based mechanism or other practical application to verify the reliability and accuracy of the estimates stemming from these valuation models, nor is there a means to compare and adjust the estimates to actual values.
If factors change and we employ different assumptions for estimating stock-based compensation expense in future periods, or if we decide to use a different valuation model, the future periods may differ significantly from what we have recorded in the current period and could materially affect our operating results.
See Note 9 to the consolidated financial statements for further information regarding stock-based compensation.
34
Table of Contents
Accounting for Income Taxes
We use the asset and liability method of accounting for income taxes. Under this method, income tax expense is recognized for the amount of taxes payable or refundable for the current year. In addition, deferred tax assets and liabilities are recognized for the expected future tax consequences of temporary differences between the financial reporting and tax bases of assets and liabilities, and for operating losses and tax credit carryforwards. Valuation allowances are established when necessary to reduce deferred tax assets to the amount expected to be realized and are reversed at such time that realization is believed to be more likely than not.
Our judgments, assumptions, and estimates relative to the current provision for income tax take into account current tax laws, our interpretation of current tax laws, and possible outcomes of current and future audits conducted by foreign and domestic tax authorities. We have established reserves for income taxes to address potential exposures involving tax positions that could be challenged by tax authorities. Although we believe our judgments, assumptions, and estimates are reasonable, changes in tax laws or our interpretation of tax laws and any future tax audits could significantly impact the amounts provided for income taxes in our consolidated financial statements.
Our assumptions, judgments, and estimates relative to the value of a deferred tax asset take into account predictions of the amount and category of future taxable income, such as income from operations or capital gains income. Actual operating results and the underlying amount and category of income in future years could render inaccurate our current assumptions, judgments, and estimates of recoverable net deferred tax assets. Any of the assumptions, judgments, and estimates mentioned above could cause our actual income tax obligations to differ from our estimates, thus materially impacting our financial position and results of operations.
See Note 12 to the consolidated financial statements for further information concerning income taxes.
Short-term Investments
Our short-term investments consist primarily of U.S. treasury bills and government agency securities purchased with an original or remaining maturity of greater than 90 days on the date of purchase. We classify all debt securities with readily determinable market values as “available-for-sale”. Even though the stated maturity dates of these debt securities may be one year or more beyond the balance sheet date, we have classified all debt securities as short-term investments as they are available for current operations and reasonably expected to be realized in cash or sold within one year. These investments are carried at fair market value, and using the specific identification method, any unrealized gains and losses considered to be temporary in nature are reported as a separate component of other comprehensive income (loss) within stockholders’ equity.
For debt securities in an unrealized loss position, we are required to assess whether (i) we have the intent to sell the debt security or (ii) it is more likely than not that we will be required to sell the debt security before its anticipated recovery. If either of these conditions is met, an other-than-temporary impairment on the security must be recognized in earnings equal to the entire difference between its fair value and amortized cost basis.
For debt securities in an unrealized loss position which are deemed to be other-than-temporary where neither of the criteria in the paragraph above are present, the difference between the security’s then-current amortized cost basis and fair value is separated into (i) the amount of the impairment related to the credit loss (i.e., the credit loss component) and (ii) the amount of the impairment related to all other factors (i.e., the non-credit loss component). The credit loss component is recognized in earnings. The non-credit loss component is recognized in accumulated other comprehensive loss. The credit loss component is the excess of the amortized cost of the security over the best estimate of the present value of the cash flows expected to be collected from the debt security. The non-credit component is the residual amount of the other-than-temporary impairment.
When calculating the present value of expected cash flows to determine the credit loss component of the other-than-temporary impairment, we estimate the amount and timing of projected cash flows on a security-by-security basis. These calculations reflect our expectations of the performance of the underlying collateral and of the issuer to meet payment obligations as applicable. The expected cash flows are discounted using the effective
35
Table of Contents
interest rate of the security prior to any impairment. The amortized cost basis of a debt security is adjusted for credit losses recorded to earnings. The difference between the cash flows expected to be collected and the new cost basis is accreted to investment income over the remaining expected life of the security.
Further information about short-term investments may be found in Note 2 to the consolidated financial statements.
Patents and Intangible Assets
Intangible assets with finite useful lives are amortized and intangible assets with indefinite lives are not amortized but rather are tested at least annually for impairment.
We have acquired patents and other intangible assets. In addition, we internally develop and license IP and software, and when possible, we protect our IP and software with patents and trademarks. External patent-related costs are expensed as incurred and classified as general and administrative expenses in our consolidated statement of income, consistent with the classification of internal legal costs associated with internally developed patents and trademarks. Costs associated with the purchase of patents are capitalized. These costs are amortized utilizing the straight-line method, which approximates the pattern of consumption over the estimated useful lives of the respective assets, generally ten years.
The above listing is not intended to be a comprehensive list of all of our accounting policies. In many cases, the accounting treatment of a particular transaction is specifically dictated by GAAP, with no need for management’s judgment in its application. There are also areas in which management’s judgment in selecting any available alternative would not produce a materially different result.
Results of Operations
Overview of 2014
We continued to invest in research, development, sales, and marketing in our key lines of business. Key events in the year were as follows:
| • | We increased our royalty and license revenue by 12% and our overall revenue by 12% for the year ended December 31, 2014 compared to 2013. The increase in royalty and license revenue was driven mainly by our gaming licensees, along with increases from our automotive, mobility, and medical licensees as well. |
| • | Our income from continuing operations was $4.1 million for the year ended December 31, 2014 compared to income from continuing operations of $40.2 million for the year ended December 31, 2013. The decrease in income from continuing operations of $36.1 million was primarily due to a decreased benefit from income taxes of $38.7 million from a non-recurring benefit from taxes of $36.5 million in 2013 that did not recur in 2014, and increased expenses of $3.1 million which primarily consisted of sales and marketing and research and development expenses, partially offset by an increase in gross profit of $5.5 million primarily from additional royalty and license revenue. In 2013, the benefit from taxes of $36.5 million was primarily due to the partial release of our Federal deferred income tax asset valuation allowance based on the assessment of our ability to utilize these deferred income tax assets. See Note 12 to the consolidated financial statements for additional information on our income taxes. |
In 2015, we expect royalty and license revenue, mainly from our mobility and gaming lines of business, to be the major component of our revenue as our technology continues to be included in more of our licensees’ products and as we continue to execute our patent licensing program relating to Basic Haptics in mobility, as well as console gaming. IP litigation may cause us to expend significant financial resources in the future and may have an adverse effect on the results of our operations. Additionally, our success could be limited by various factors, including global economic conditions, the timely release of our new products and our licensees’ products, continued market acceptance of our products and technology, and the introduction of new products by existing or new competitors. For a further discussion of these and other risk factors, see Item 1A – “Risk Factors.”
36
Table of Contents
The following table sets forth our consolidated statements of operations data as a percentage of total revenues:
| Years Ended December 31, | ||||||||||||
| 2014 |
2013 |
2012 |
||||||||||
| Revenues: |
||||||||||||
| Royalty and license |
97.9 | % | 97.2 | % | 90.1 | % | ||||||
| Product sales |
0.0 | 0.2 | 6.2 | |||||||||
| Development, services, and other |
2.1 | 2.6 | 3.7 | |||||||||
|
|
|
|
|
|
|
|||||||
| Total revenues |
100.0 | 100.0 | 100.0 | |||||||||
|
|
|
|
|
|
|
|||||||
| Costs and expenses: |
||||||||||||
| Cost of revenues (exclusive of amortization of intangibles shown separately below) |
0.9 | 1.0 | 3.7 | |||||||||
| Sales and marketing |
20.6 | 19.7 | 21.0 | |||||||||
| Research and development |
22.3 | 22.9 | 26.2 | |||||||||
| General and administrative |
44.9 | 48.6 | 69.8 | |||||||||
| Amortization of intangibles |
0.1 | 0.2 | 0.2 | |||||||||
|
|
|
|
|
|
|
|||||||
| Total costs and expenses |
88.8 | 92.4 | 120.9 | |||||||||
|
|
|
|
|
|
|
|||||||
| Operating income (loss) |
11.2 | 7.6 | (20.9 | ) | ||||||||
| Interest and other income |
0.7 | 0.1 | 0.5 | |||||||||
|
|
|
|
|
|
|
|||||||
| Income (loss) from continuing operations before provision for income taxes |
11.9 | 7.7 | (20.4 | ) | ||||||||
| Benefit (provision) for income taxes |
(4.1 | ) | 76.9 | (2.5 | ) | |||||||
|
|
|
|
|
|
|
|||||||
| Income (loss) from continuing operations |
7.8 | 84.6 | (22.9 | ) | ||||||||
| Gain on sales of discontinued operations, net of provision for income taxes |
0.0 | 0.0 | 0.5 | |||||||||
|
|
|
|
|
|
|
|||||||
| Net income (loss) |
7.8 | % | 84.6 | % | (22.4 | ) % | ||||||
|
|
|
|
|
|
|
|||||||
Revenues
| Percent | Percent | |||||||||||||||||||||||||||
| 2014 | Change | Change | 2013 | Change | Change | 2012 | ||||||||||||||||||||||
| ($ in thousands) | ||||||||||||||||||||||||||||
| Royalty and license |
$ | 51,804 | $ | 5,650 | 12 | % | $ | 46,154 | $ | 17,165 | 59 | % | $ | 28,989 | ||||||||||||||
| Product sales |
0 | (105 | ) | (100 | )% | 105 | (1,877 | ) | (95 | )% | 1,982 | |||||||||||||||||
| Development, services, and other |
1,133 | (78 | ) | (6 | )% | 1,211 | 13 | 1 | % | 1,198 | ||||||||||||||||||
|
|
|
|
|
|
|
|
|
|
|
|||||||||||||||||||
| Total revenue |
$ | 52,937 | $ | 5,467 | 12 | % | $ | 47,470 | $ | 15,301 | 48 | % | $ | 32,169 | ||||||||||||||
|
|
|
|
|
|
|
|
|
|
|
|||||||||||||||||||
2014 Compared to 2013
Royalty and license revenue — Royalty and license revenue is comprised of royalties earned on sales by our licensees and license fees charged for our IP. The increase in royalty and license revenue was driven primarily by increases from our gaming licensees, and to a lesser extent, by increases from our automotive, mobility, and medical licensees.
Variable royalty revenue based on shipping volumes and per unit prices increased to $21.6 million for the year ended December 31, 2014 from $19.5 million for the year ended December 31, 2013. The increase in 2014 variable royalty revenue was primarily from our gaming and automotive customers. This increase was partially
37
Table of Contents
offset by lower variable royalty revenue from our mobile customers as 2013 included approximately $2 million from the overlapping receipt of both contract completion or tail period revenue and new revenue under an agreement that expired and was subsequently renewed during 2013, an event that did not recur in 2014. Fixed payment license revenue increased to $30.2 million for the year ended December 31, 2014 from $26.7 million for the year ended December 31, 2013, due to increased license fees from gaming and mobility licensees, and to a lesser extent, by increases from our medical and automotive licensees.
Royalty and license revenue from gaming customers increased by 50% primarily due to license fees and the sale of gaming console products, including the Sony PlayStation 4. Revenue from gaming customers can fluctuate based upon consumer gaming preferences, the timing of introductions of new gaming console systems, and the timing of new products from third party peripheral makers that are our licensees.
Royalty and license revenue from automotive customers increased by 13%, primarily due to a new customer contract in Europe, as well as our technology being incorporated in an increased volume of vehicles sold by our licensees.
Royalty and license revenue from mobility customers increased by 2% primarily due to increased license revenue from our licensees in Asia; partially offset by the fact that 2013 revenue included approximately $2 million from the overlapping receipt of both tail period revenue and new revenue under an agreement that expired and was subsequently renewed during 2013, an event that did not recur in 2014. We anticipate that our mobility line of business will continue to be of primary importance as mobile device manufacturers continue to recognize the value of our IP and technology and as we expand our presence in Asia.
Royalty and license revenue also increased by 1% for medical customers primarily due to increased license fees, partially offset by a decreased level of sales by licensees.
We expect royalty and license revenue to be the major component of our future revenue as our technology continues to be included in more products and as we continue our efforts to monetize our IP. We typically experience seasonally higher revenue from our gaming and mobility customers due to the reporting of holiday sales in the first calendar quarter compared to other calendar quarters.
Product sales — Product sales decreased as we discontinued selling all products as of December 31, 2013. We do not plan on product sales and will focus on licensing our software and patents going forward.
Development, services, and other revenue — Development, services, and other revenue is comprised of primarily of development work, implementation support, and other contract engineering services provided to customers. Development, services, and other revenue decreased mainly due to a decrease in engineering services for our mobility customers. We continue to focus our engineering resources on development efforts that leverage our existing sales and channel distribution capabilities. Accordingly, we do not expect development, services, and other revenue to be a significant part of total revenues in the future.
For 2014 revenues generated in North America, Europe, and Asia represented 29%, 3%, and 68%, respectively, compared to 28%, 4%, and 68%, respectively, for 2013. There was no significant shift in revenues among regions as royalty and license revenues in each region increased at relatively consistent rates. The increase in royalty and license revenue in North America was primarily due to an increase in royalty and license revenue from our gaming, mobility, and medical licensees. The increase in royalty and license revenue in Europe from our automotive customers was relatively less than the overall increase in North America, resulting in a decrease in the percentage of revenue attributed to Europe as a part of total revenue.
2013 Compared to 2012
Royalty and license revenue — The increase in royalty and license revenue was driven primarily by increases from our mobility licensees, and to a lesser extent, by increases from our automotive, gaming, and medical licensees.
38
Table of Contents
Variable royalty revenue based on shipping volumes and per unit prices decreased to $19.5 million for the year ended December 31, 2013 from $21.3 million for the year ended December 31, 2012, as we entered into new licensing agreements that include recurring fixed payments. Fixed payment license revenue increased to $26.7 million for the year ended December 31, 2013 from $7.7 million for the year ended December 31, 2012, primarily due to increased license fees from new license agreements in Asia and North America, and to a lesser extent, increased license fees from our gaming licensees.
Royalty and license revenue from mobility customers increased by 121% primarily due to increased revenue from a renewed multi-year license agreement entered into with Samsung in March 2013; increased mobile device business by existing licensees; as well as new customer contracts in the United States, China, and Japan; partially offset by decreased license revenues from our European market.
Royalty and license revenue from gaming customers increased by 8%, primarily due to new gaming console products that first entered the market in the fourth quarter of 2013, including the Sony PlayStation 4. In addition, we secured increases in gaming royalty and license revenue through our royalty compliance program.
Royalty and license revenue from automotive customers increased by 21%, primarily due to our technology being incorporated in an increased volume of vehicles sold by our licensees.
Royalty and license revenue also increased by 10% for medical customers primarily due an increased level of sales by these customers.
Product sales — Product sales in 2013 were comprised primarily of sales of actuators, design kits, and integrated circuits. The decrease in product sales primarily reflects a reduction in medical product sales specifically related to our Virtual IV simulator product that was sold in 2012. In December of 2012 we entered into a royalty generating licensing agreement with our Virtual IV partner in accordance with which we no longer produce or sell the Virtual IV system.
Development, services, and other revenue — Development, services, and other revenue increased mainly due to an increase in ongoing engineering services for certain mobility customers, partially offset by a decrease in one time contract engineering services.
For 2013 revenues generated in North America, Europe, and Asia represented 28%, 4%, and 68%, respectively, compared to 41%, 13%, and 46%, respectively, for 2012. The shift in revenues among regions was mainly due to a relative increase in royalty and license revenue in Asia offset by a smaller increase in royalty and license revenue in North America, a decrease in royalty and license revenue in Europe, and a decrease in product revenue in North America. The increase in royalty and license revenue from Asia was mainly due to increased license and royalty revenue from our mobility licensees in Korea, China, and Japan, including increased revenue recognized under the renewed agreement entered into with Samsung, who represented 47% of our sales in 2013 and 24% in 2012. The increase in royalty and license revenue in North America was primarily due to an increase in royalty and license revenue from our mobility, gaming, and medical licensees. The decrease in royalty and license revenue in Europe was mainly due to a decrease in royalty and license revenue from our mobility licensees. The decrease in product revenue in North America revenue was due to a decrease in medical product sales.
Cost of Revenues
| 2014 |
Change |
% Change |
2013 |
Change |
% Change |
2012 |
||||||||||||||||||||||
| ($ in thousands) | ( $ in thousands) | |||||||||||||||||||||||||||
| Cost of revenues |
$ | 460 | $ | (2) | 0 | % | $ | 462 | $ | (726 | ) | (61 | )% | $ | 1,188 | |||||||||||||
2014 compared to 2013 — Our cost of revenues consists primarily of labor related costs for development, services, and other; as well as direct materials, contract manufacturing, and other overhead costs for product sales. It excludes amortization of intangibles. The discontinuation of all product sales as of December 31, 2013 was the major contributor to the reduction of cost of revenues for the year ended December 31, 2014 as
39
Table of Contents
compared to the year ended December 31, 2013; partially offset by increased labor related costs for development and services for our mobility customers in Asia. As a result of our focus on licensing our software and patents in the future, we expect cost of revenue in 2015 will consist of labor related costs for development and other services, and may increase moderately from 2014.
2013 compared to 2012 — Lower product sales were the major contributor to the overall reduction of cost of revenues for 2013 as compared to 2012. Specifically, the decrease in cost of revenues was primarily due to a reduction in direct material costs, contract manufacturing costs, and related costs of $701,000.
Expenses
| Percent |
Percent |
|||||||||||||||||||||||||||
| 2014 |
Change |
Change |
2013 |
Change |
Change |
2012 |
||||||||||||||||||||||
| ($ in thousands) | ($ in thousands) | |||||||||||||||||||||||||||
| Sales and marketing |
$ | 10,896 | $ | 1,558 | 17 | % | $ | 9,338 | $ | 2,563 | 38 | % | $ | 6,775 | ||||||||||||||
| Research and development |
11,793 | 910 | 8 | % | 10,883 | 2,462 | 29 | % | 8,421 | |||||||||||||||||||
| General and administrative |
23,754 | 650 | 3 | % | 23,104 | 640 | 3 | % | 22,464 | |||||||||||||||||||
| Amortization and impairment of intangibles |
67 | (12 | ) | (15 | )% | 79 | 30 | 61 | % | 49 | ||||||||||||||||||
Sales and Marketing — Our sales and marketing expenses are composed of employee compensation and benefits, sales commissions, advertising, trade shows, collateral marketing materials, market development funds, travel, and an allocation of facilities costs. The increase in sales and marketing expense for 2014 as compared to 2013 was primarily due to increased compensation, benefits, and other related costs of $1.1 million, mainly due to increased headcount and stock compensation expense; increased travel expenses of $265,000 mainly due to increased headcount and an increased number of tradeshows attended in 2014; and increased consulting and outside services expense of $260,000 due to current marketing initiatives and preparation for tradeshows. We expect that sales and marketing expenses will increase in 2015 as we continue to invest in sales and marketing to further market acceptance for our touch technologies and expanding our focus on the content and media business.
The increase in sales and marketing expense for 2013 as compared to 2012 was primarily due to increased compensation, benefits, and other related costs of $1.7 million, mainly due to increased sales and marketing headcount, benefits, and stock compensation expense; increased marketing, advertising, and public relations costs of $421,000 and increased consulting expenses of $175,000, both due to current marketing initiatives; and increased travel expenses of $333,000 mainly due to increased headcount. This was partially offset by a decrease in bad debt expense of $105,000.
Research and Development — Our research and development expenses are composed primarily of employee compensation and benefits, consulting fees, tooling and supplies, and an allocation of facilities costs. The increase in research and development expenses for 2014 as compared to 2013 was primarily due to increased compensation, benefits, and other related costs of $487,000, mainly due to increased headcount, benefits, and stock compensation expense; increased travel expenses of $219,000, mainly due to increased headcount; increased lab and office expense of $121,000, primarily due to increased software licenses for software development tools; and increased consulting and outside services expense of $69,000, in part related to our investment in our content and media initiative. We believe that continued significant investment in research and development is critical to our future success, and we expect to make significant increased investments in areas of research and development to support future growth including our content and media business.
The increase in research and development expenses for 2013 as compared to 2012 was primarily due to increased compensation, benefits, and other related costs of $2.0 million mainly due to increased headcount, benefits, and stock compensation expense, and increased consulting and outside services expense of $434,000, in part related to our investment in our content and media initiative.
40
Table of Contents
General and Administrative — Our general and administrative expenses are composed primarily of employee compensation and benefits, legal and professional fees, external legal costs for patents, office supplies, travel, and an allocation of facilities costs. The increase in general and administrative expenses for 2014 as compared to 2013 was primarily due to increased legal and professional expenses of $1.7 million and increased foreign exchange transaction expense of $53,000; partially offset by decreased compensation, benefits, and other related costs of $1.1 million. The increased legal and professional expenses were primarily due to increased patent related legal costs of $1.2 million, increased other professional services and license fee expenses of $974,000, partially offset by decreased litigation expenses of $495,000 relating to ongoing and completed litigation. The decreased compensation, benefits, and other related costs were mainly due to decreased facilities overhead and other compensation costs. We will continue to incur costs related to litigation, as we continue to assert our IP and contractual rights and defend any lawsuits brought against us.
The increase in general and administrative expenses for 2013 as compared to 2012 was primarily due to increased compensation, benefits, and other related costs of $2.6 million and increased public company expense, fees, and taxes of $145,000; partially offset by decreased legal and professional expenses of $2.2 million. The increased compensation, benefits, and other related costs were mainly due to increased headcount, benefits, and stock compensation expense. The decreased legal and professional expenses were primarily due to decreased litigation expenses of $3.1 million relating to ongoing and completed litigation, partially offset by increased patent related legal costs of $571,000, and increased other professional services expense of $306,000.
Interest and Other Income
| Percent |
Percent |
|||||||||||||||||||||||||||
| 2014 |
Change |
Change |
2013 |
Change |
Change |
2012 |
||||||||||||||||||||||
| ($ in thousands) | ($ in thousands) | |||||||||||||||||||||||||||
| Interest and other income |
$ | 352 | $ | 284 | 418 | % | $ | 68 | $ | (102 | ) | (60 | )% | $ | 170 | |||||||||||||
Interest and Other Income — Interest and other income consist primarily of interest income from cash and cash equivalents and short-term investments, interest on notes receivable, translation exchange rate gains and losses and other income. Interest and other income increased in 2014 compared to 2013 as a result of a non-recurring gain of $344,000 in the fourth quarter of 2014, partially offset by exchange rate losses of $72,000.
Interest and other income decreased in 2013 compared to 2012 primarily as a result of decreased interest income due to decreased interest on notes receivable.
Benefit (provision) for Taxes
| Percent |
Percent |
|||||||||||||||||||||||||||
| 2014 |
Change |
Change |
2013 |
Change |
Change |
2012 |
||||||||||||||||||||||
| ($ in thousands) | ($ in thousands) | |||||||||||||||||||||||||||
| Benefit (provision) for income taxes |
$ | (2,196 | ) | $ | (38,679 | ) | (106 | )% | $ | 36,483 | $ | 37,275 | 4,706 | % | $ | (792 | ) | |||||||||||
| Income (loss) from continuing operations before benefit (provision) for income taxes |
6,319 | 3,672 | (6,558 | ) | ||||||||||||||||||||||||
| Effective tax rate |
34.8 | % | (993.5 | )% | (12.1 | )% | ||||||||||||||||||||||
For 2014, we recorded a provision for income taxes of $2.2 million, yielding an effective tax rate of 34.8%. The 2014 tax provision resulted primarily from the decrease in deferred tax assets and foreign withholding tax expense. Based upon the current year activity, we continue to maintain a valuation allowance of $1.1 million against U.S. Federal deferred tax assets based on our conclusion that it was not more likely than not that they would be utilized. We also maintain a valuation allowance of $6.6 million against our state and certain other foreign deferred tax assets as there was not sufficient evidence to support the release of such valuation allowance.
41
Table of Contents
In 2015, we expect to use a 35% tax rate to record the federal portion of our income tax provision expense, yet we expect there to be a limited cash impact as we will use our net operating losses and other deferred tax assets that have been carried forward to reduce taxes paid in cash. Our 2015 effective tax rate may differ from the federal tax rate due to the impact of certain planning strategies that we may undertake during the year.
For 2013, we recorded a benefit for income taxes of $36.5 million yielding an effective tax rate of (993.5)%. The 2013 tax benefit is primarily reflective of the partial release of our deferred income tax asset valuation allowance.
Prior to December 31, 2013, we maintained a valuation allowance for our entire deferred tax assets as a result of uncertainties regarding the realization of the asset balance due to historical losses, the variability of operating results, and limited visibility into our near term projected results. This valuation allowance was maintained since the likelihood of the realization of those assets had not become “more likely than not” based on our assessment of available evidence. We completed a full evaluation of the realizability of deferred tax assets during the fourth quarter of 2013. The process of evaluating the need to continue with a valuation allowance for deferred tax assets was highly subjective and required significant judgment at many points during the analysis. Based on our analysis and a review of all positive and negative evidence related to historical operations, future projections of taxable income which include fixed fees to be recognized under existing non-cancelable license agreements, and tax planning strategies, we determined that it was more likely than not that certain of our Federal deferred tax assets would be realizable. For the year ended December 31, 2013, we released the valuation allowance against certain of our U.S. Federal and Foreign deferred tax assets which resulted in a tax benefit of $36.8 million. We concluded that it was not more likely than not that certain other U.S. Federal deferred tax assets would be utilized and, accordingly, maintained a valuation allowance of $1.1 million against these deferred tax assets. We also determined there was not sufficient evidence to support the release of the valuation allowance against our State and certain other Foreign deferred tax assets. Accordingly, we maintained a valuation allowance of $6.0 million against these deferred tax assets.
For 2012 we recorded a provision for income taxes of $792,000 yielding an effective tax rate of (12.1)%. The 2012 tax provision is primarily reflective of the recording of foreign withholding tax expense which decreased as a result of reduced withholding tax expense from certain Asian countries.
Discontinued Operations
| Percent |
Percent |
|||||||||||||||||||||||||||
| 2014 |
Change |
Change |
2013 |
Change |
Change |
2012 |
||||||||||||||||||||||
| ($ in thousands) | ($ in thousands) | |||||||||||||||||||||||||||
| Gain on sales of discontinued operations |
$ | 0 | $ | 0 | 0 | % | $ | 0 | $ | (153 | ) | (100 | )% | $ | 153 | |||||||||||||
There was no gain on sales of discontinued operations for the years ended December 31, 2014 and 2013, respectively.
Gain on sales of discontinued operations, net of tax, decreased for the year ended December 31, 2013 compared to the year ended December 31, 2012 due to decreased payments received from the sale of our 3D family of products. During 2009, we ceased operations of the 3D product line and sold our CyberGlove family of products, SoftMouse 3D positioning device family of products, and our Microscribe family of products, and recorded a gain on sale from discontinued operations. Accordingly, the operations of the 3D product line were classified as discontinued operations in the consolidated statement of operations.
Liquidity and Capital Resources
Our cash, cash equivalents, and short-term investments consist primarily of money market funds and U.S. treasury bills and government agency securities. All of our short-term investments are classified as available-for-sale. The securities are stated at market value, with unrealized gains and losses reported as a component of accumulated other comprehensive income, within stockholders’ equity.
42
Table of Contents
As of December 31, 2014, our cash, cash equivalents, and short-term investments totaled $57.4 million, a decrease of $13.7 million from $71.1 million on December 31, 2013. The decrease was primarily due to increased activity under our authorized stock repurchase program, offset in part by the timing of cash provided by investing activities.
Cash provided by (used in) operating activities — Net cash provided by operating activities during 2014 was $291,000 compared to $21.2 million provided by operating activities in 2013, a decrease of $20.9 million. Cash provided by operating activities during 2014 was primarily the result of our net income of $4.1 million, and an increase of $1.9 million due to a change in deferred income taxes due to their use to reduce tax payments. These increases were partially offset by a decrease of $6.8 million due to the recognition of revenue from customers that previously had been deferred, a decrease of $2.4 million due to a change in accounts receivable arising from the timing of invoices and cash collections, and a decrease of $2.2 million due to a change in accrued compensation and other current liabilities mainly from a decrease in accruals for compensation and benefit related items. Cash used by operating activities during 2014 was also affected by noncash charges of $5.9 million, including $5.3 million of noncash stock-based compensation and $567,000 in depreciation and amortization.
Net cash provided by operating activities during 2013 was $21.2 million compared to $7.4 million used in operating activities in 2012, an increase in cash provided of $28.6 million. Cash provided by operating activities during 2013 was primarily the result of our net income of $40.2 million, an increase of $8.2 million due to a change in deferred revenue mainly due to renewed agreements and projects with customers, an increase of $2.8 million due to a change in accrued compensation and other liabilities primarily from an increase in accruals for compensation and benefit related items and legal expenses, an increase of $1.3 million due to a change in accounts and other receivables mainly as a result of the collection of accounts receivable, and an increase of $341,000 due to a change in accounts payable from the timing of payments to vendors. These increases were partially offset by a decrease of $36.9 million due to a change in deferred taxes primarily arising from the release of most of our Federal deferred tax valuation allowance. Cash provided by operating activities during 2013 was also affected by noncash charges of $5.3 million, including $4.6 million of noncash stock-based compensation and $584,000 in depreciation and amortization.
Cash provided by (used in) investing activities — Net cash provided by investing activities during 2014 was $13.3 million, compared to the $18.2 million used in investing activities during 2013, an increase in cash provided of $31.5 million. Net cash provided by investing activities during 2014 consisted of maturities of short-term investments of $57.0 million. This was partially offset by purchases of short-term investments of $43.0 million and purchases of property, plant, and equipment of $779,000. Net cash used in investing activities during 2013 was $18.2 million, compared to the $9.2 million provided by investing activities during 2012, an increased use of $27.4 million. Net cash used in investing activities during 2013 consisted of purchases of short-term investments of $94.9 million and purchases of property, plant, and equipment of $234,000. This was partially offset by maturities of short-term investments of $77.0 million.
Cash provided by (used in) financing activities — Net cash used in financing activities during 2014 was $13.3 million compared to $6.6 million provided by financing activities during 2013, or a decrease in cash provided of $19.9 million compared to the prior year. Net cash used in financing activities during 2014 consisted primarily of repurchases of common stock of $15.0 million, partially offset by the exercises of stock options and the issuance of common stock under the ESPP of $1.7 million. Net cash provided by financing activities during 2013 was $6.6 million compared to $4.5 million used in 2012, or a $11.1 million increase compared to the prior year. Net cash provided by financing activities during 2013 consisted primarily of exercises of stock options and the issuance of common stock under the ESPP of $6.6 million.
We believe that our cash, cash equivalents, and short-term investments will be sufficient to meet our working capital needs for at least the next twelve months. We will continue to invest in, protect, and defend our extensive IP portfolio, which is expected to result in the continued use of cash. On November 1, 2007, our board of directors authorized a share repurchase program of $50 million. In addition, on October 22, 2014, our board of directors authorized another $30 million under the share repurchase program. $34.4 million remains under the share repurchase program as of December 31, 2014. We anticipate that capital expenditures for property and equipment for the year ended December 31, 2015 will be less than $4 million. Cash flows from our discontinued operations have been included in our consolidated statement of cash flows with continuing
43
Table of Contents
operations within each cash flow category. The absence of cash flows from discontinued operations is not expected to affect our future liquidity or capital resources. Cash from operations could also be affected by various risks and uncertainties, including, but not limited to the risks detailed in Part I, Item 1A titled “Risk Factors.” Additionally, if we acquire businesses, patents, or technology, our cash or capital requirements could increase substantially. In the event of such an acquisition, or should any unanticipated circumstances arise that significantly increase our capital requirements, we may elect to raise additional capital through debt or equity financing. Any of these events could result in substantial dilution to our stockholders. There is no assurance that such additional capital will be available on terms acceptable to us, if at all.
Summary Disclosures about Contractual Obligations and Commercial Commitments
The following table reflects a summary of our contractual cash obligations and other commercial commitments as of December 31, 2014 (in thousands):
| Contractual Obligations |
Total |
Less Than |
1-3 Years |
3-5 Years |
More Than |
|||||||||||||||
| Operating Leases |
$ | 7,493 | $ | 993 | $ | 1,694 | $ | 1,815 | $ | 2,991 | ||||||||||
At December 31, 2014, we had a liability for unrecognized tax benefits totaling $1.8 million including interest of $73,000, of which approximately $272,000 could be payable in cash. The Company expects to release reserves and record a tax benefit due to the expiration of statute of limitations during the next 12 months. We did not have any other significant non-cancellable purchase commitments as of December 31, 2014.
Recent Accounting Pronouncements
See Note 1 to the consolidated financial statements for information regarding the effect of new accounting pronouncements on our financial statements.
Item 7A. Quantitative and Qualitative Disclosures about Market Risk
We are exposed to financial market risks, including changes in interest rates and foreign currency exchange rates. Changes in these factors may cause fluctuations in our earnings and cash flows. We evaluate and manage the exposure to these market risks as follows:
Cash Equivalents and Short-term Investments — We had cash equivalents and short-term investments of $54.5 million as of December 31, 2014, which are subject to interest rate fluctuations. An increase in interest rates could adversely affect the market value of our cash equivalents and short-term investments. A hypothetical 100 basis point increase in interest rates would result in a decrease of approximate $203,000 in the fair value of our cash equivalents and short-term investments as of December 31, 2014.
We limit our exposure to interest rate and credit risk by establishing and monitoring clear policies and guidelines for our cash equivalents and short-term investment portfolios. The primary objective of our policies is to preserve principal while at the same time maximizing yields, without significantly increasing risk. Our policy’s guidelines also limit exposure to loss by limiting the sums we can invest in any individual security and restricting investments to securities that meet certain defined credit ratings. We do not use derivative financial instruments in our investment portfolio to manage interest rate risk.
Foreign Currency Exchange Rates — A substantial majority of our revenue, expense, and capital purchasing activities are transacted in U.S. dollars. However, we do incur certain operating costs for our foreign operations in other currencies but these operations are limited in scope and thus we are not materially exposed to foreign currency fluctuations. Additionally we have some reliance on international revenues that are subject to the risks of fluctuations in currency exchange rates. Because a substantial majority of our international revenues, as well as expenses, are typically denominated in U.S. dollars, a strengthening of the U.S. dollar could cause our licenses to become relatively more expensive to customers in a particular country, leading to a reduction in sales or profitability in that country. We have no foreign exchange contracts, option contracts, or other foreign currency hedging arrangements and we do not expect to have such arrangements in the foreseeable future.
44
Table of Contents
Item 8. Financial Statements and Supplementary Data
IMMERSION CORPORATION
INDEX TO CONSOLIDATED FINANCIAL STATEMENTS
| Page | ||||
| 46 | ||||
| Consolidated Balance Sheets as of December 31, 2014 and 2013 |
47 | |||
| 48 | ||||
| 49 | ||||
| Consolidated Statements of Cash Flows for the Years Ended December 31, 2014, 2013, and 2012 |
50 | |||
| 51 | ||||
45
Table of Contents
REPORT OF INDEPENDENT REGISTERED PUBLIC ACCOUNTING FIRM
To the Board of Directors and Stockholders of Immersion Corporation
San Jose, California
We have audited the accompanying consolidated balance sheets of Immersion Corporation and subsidiaries (the “Company”) as of December 31, 2014 and 2013, and the related consolidated statements of operations and comprehensive income (loss), stockholders’ equity, and cash flows for each of the three years in the period ended December 31, 2014. Our audits also included the financial statement schedule listed in the Index at Item 15. These financial statements and financial statement schedule are the responsibility of the Company’s management. Our responsibility is to express an opinion on the financial statements and financial statement schedule based on our audits.
We conducted our audits in accordance with the standards of the Public Company Accounting Oversight Board (United States). Those standards require that we plan and perform the audit to obtain reasonable assurance about whether the financial statements are free of material misstatement. An audit includes examining, on a test basis, evidence supporting the amounts and disclosures in the financial statements. An audit also includes assessing the accounting principles used and significant estimates made by management, as well as evaluating the overall financial statement presentation. We believe that our audits provide a reasonable basis for our opinion.
In our opinion, such consolidated financial statements present fairly, in all material respects, the financial position of Immersion Corporation and subsidiaries as of December 31, 2014 and 2013, and the results of their operations and their cash flows for each of the three years in the period ended December 31, 2014, in conformity with accounting principles generally accepted in the United States of America. Also, in our opinion, such financial statement schedule, when considered in relation to the basic consolidated financial statements taken as a whole, present fairly, in all material respects, the information set forth therein.
We have also audited, in accordance with the standards of the Public Company Accounting Oversight Board (United States), the Company’s internal control over financial reporting as of December 31, 2014, based on the criteria established in Internal Control — Integrated Framework (2013) issued by the Committee of Sponsoring Organizations of the Treadway Commission and our report dated February 27, 2015 expressed an unqualified opinion on the Company’s internal control over financial reporting.
/s/ DELOITTE & TOUCHE LLP
San Jose, California
February 27, 2015
46
Table of Contents
IMMERSION CORPORATION
(In thousands, except share and per share amounts)
| December 31, | ||||||||
| 2014 |
2013 |
|||||||
| ASSETS | ||||||||
| Current assets: |
||||||||
| Cash and cash equivalents |
$ | 14,380 | $ | 14,136 | ||||
| Short-term investments |
42,981 | 56,976 | ||||||
| Accounts and other receivables (net of allowances for doubtful accounts of: $28 and $9, respectively) |
3,021 | 598 | ||||||
| Deferred income taxes |
9,377 | 7,784 | ||||||
| Prepaid expenses and other current assets |
845 | 690 | ||||||
|
|
|
|
|
|||||
| Total current assets |
70,604 | 80,184 | ||||||
| Property and equipment, net |
1,207 | 944 | ||||||
| Deferred income tax assets |
25,419 | 29,066 | ||||||
| Intangibles and other assets, net |
291 | 381 | ||||||
|
|
|
|
|
|||||
| Total assets |
$ | 97,521 | $ | 110,575 | ||||
|
|
|
|
|
|||||
| LIABILITIES AND STOCKHOLDERS’ EQUITY | ||||||||
| Current liabilities: |
||||||||
| Accounts payable |
$ | 669 | $ | 682 | ||||
| Accrued compensation |
1,906 | 4,680 | ||||||
| Other current liabilities |
2,225 | 1,653 | ||||||
| Deferred revenue |
7,779 | 8,920 | ||||||
|
|
|
|
|
|||||
| Total current liabilities |
12,579 | 15,935 | ||||||
| Long-term deferred revenue |
7,827 | 13,441 | ||||||
| Other long-term liabilities |
512 | 528 | ||||||
|
|
|
|
|
|||||
| Total liabilities |
20,918 | 29,904 | ||||||
|
|
|
|
|
|||||
| Commitments and contingencies (Notes 8 and 15) |
||||||||
| Stockholders’ equity: |
||||||||
| Common stock and additional paid-in capital – $0.001 par value; 100,000,000 shares authorized; 34,225,778 and 33,619,766 shares issued, respectively; 27,715,387 and 28,637,022 shares outstanding, respectively |
204,876 | 198,057 | ||||||
| Accumulated other comprehensive income |
102 | 112 | ||||||
| Accumulated deficit |
(82,806 | ) | (86,929 | ) | ||||
| Treasury stock at cost: 6,510,391 and 4,982,744 shares, respectively |
(45,569 | ) | (30,569 | ) | ||||
|
|
|
|
|
|||||
| Total stockholders’ equity |
76,603 | 80,671 | ||||||
|
|
|
|
|
|||||
| Total liabilities and stockholders’ equity |
$ | 97,521 | $ | 110,575 | ||||
|
|
|
|
|
|||||
See notes to consolidated financial statements.
47
Table of Contents
IMMERSION CORPORATION
CONSOLIDATED STATEMENTS OF OPERATIONS AND COMPREHENSIVE INCOME (LOSS)
(In thousands, except per share amounts)
| Years Ended December 31, | ||||||||||||
| 2014 |
2013 |
2012 |
||||||||||
| Revenues: |
||||||||||||
| Royalty and license |
$ | 51,804 | $ | 46,154 | $ | 28,989 | ||||||
| Product sales |
0 | 105 | 1,982 | |||||||||
| Development, services, and other |
1,133 | 1,211 | 1,198 | |||||||||
|
|
|
|
|
|
|
|||||||
| Total revenues |
52,937 | 47,470 | 32,169 | |||||||||
| Costs and expenses: |
||||||||||||
| Cost of revenues (exclusive of amortization of intangibles shown separately below) |
460 | 462 | 1,188 | |||||||||
| Sales and marketing |
10,896 | 9,338 | 6,775 | |||||||||
| Research and development |
11,793 | 10,883 | 8,421 | |||||||||
| General and administrative |
23,754 | 23,104 | 22,464 | |||||||||
| Amortization of intangibles |
67 | 79 | 49 | |||||||||
|
|
|
|
|
|
|
|||||||
| Total costs and expenses |
46,970 | 43,866 | 38,897 | |||||||||
|
|
|
|
|
|
|
|||||||
| Operating income (loss) |
5,967 | 3,604 | (6,728 | ) | ||||||||
| Interest and other income |
352 | 68 | 170 | |||||||||
|
|
|
|
|
|
|
|||||||
| Income (loss) from continuing operations before provision for income taxes |
6,319 | 3,672 | (6,558 | ) | ||||||||
| Benefit (provision) for income taxes |
(2,196 | ) | 36,483 | (792 | ) | |||||||
|
|
|
|
|
|
|
|||||||
| Income (loss) from continuing operations |
4,123 | 40,155 | (7,350 | ) | ||||||||
| Discontinued operations (Note 11): |
||||||||||||
| Gain on sales of discontinued operations, net of provision for income taxes of $0, $0 and $97, respectively |
0 | 0 | 153 | |||||||||
|
|
|
|
|
|
|
|||||||
| Net income (loss) |
$ | 4,123 | $ | 40,155 | $ | (7,197 | ) | |||||
|
|
|
|
|
|
|
|||||||
| Basic net income (loss) per share: |
||||||||||||
| Continuing operations |
$ | 0.15 | $ | 1.42 | $ | (0.27 | ) | |||||
| Discontinued operations |
0.00 | 0.00 | 0.01 | |||||||||
|
|
|
|
|
|
|
|||||||
| Total |
$ | 0.15 | $ | 1.42 | $ | (0.26 | ) | |||||
|
|
|
|
|
|
|
|||||||
| Shares used in calculating basic net income (loss) per share |
28,246 | 28,190 | 27,735 | |||||||||
|
|
|
|
|
|
|
|||||||
| Diluted net income (loss) per share: |
||||||||||||
| Continuing operations |
$ | 0.14 | $ | 1.37 | $ | (0.27 | ) | |||||
| Discontinued operations |
0.00 | 0.00 | 0.01 | |||||||||
|
|
|
|
|
|
|
|||||||
| Total |
$ | 0.14 | $ | 1.37 | $ | (0.26 | ) | |||||
|
|
|
|
|
|
|
|||||||
| Shares used in calculating diluted net income (loss) per share |
29,144 | 29,338 | 27,735 | |||||||||
|
|
|
|
|
|
|
|||||||
| Other comprehensive income (loss), net of tax |
||||||||||||
| Change in unrealized gains (losses) on short-term investments |
(10 | ) | 3 | (9 | ) | |||||||
|
|
|
|
|
|
|
|||||||
| Total other comprehensive income (loss) |
(10 | ) | 3 | (9 | ) | |||||||
|
|
|
|
|
|
|
|||||||
| Total comprehensive income (loss) |
$ | 4,113 | $ | 40,158 | $ | (7,206 | ) | |||||
|
|
|
|
|
|
|
|||||||
See notes to consolidated financial statements.
48
Table of Contents
IMMERSION CORPORATION
CONSOLIDATED STATEMENTS OF STOCKHOLDERS’ EQUITY
(In thousands, except share amounts)
| Common Stock
and Additional Paid-In Capital |
Accumulated Other Comprehensive Income (Loss) |
Accumulated Deficit |
Treasury Stock | Total Stockholders’ Equity |
||||||||||||||||||||||||||
| Shares |
Amount |
Shares |
Amount |
|||||||||||||||||||||||||||
| Balances at January 1, 2012 |
31,786,030 | $ | 182,508 | $ | 118 | $ | (119,887 | ) | 3,928,206 | $ | (24,848 | ) | $ | 37,891 | ||||||||||||||||
|
|
|
|
|
|
|
|
|
|
|
|
|
|
|
|||||||||||||||||
| Net loss |
(7,197 | ) | (7,197 | ) | ||||||||||||||||||||||||||
| Unrealized gain (loss) on available-for-sale securities, net of taxes |
(9 | ) | (9 | ) | ||||||||||||||||||||||||||
| Repurchase of stock |
1,054,538 | (5,721 | ) | (5,721 | ) | |||||||||||||||||||||||||
| Issuance of stock for ESPP purchase |
25,628 | 122 | 122 | |||||||||||||||||||||||||||
| Exercise of stock options |
231,403 | 1,046 | 1,046 | |||||||||||||||||||||||||||
| Release of restricted stock units and awards |
235,269 | 1,299 | 1,299 | |||||||||||||||||||||||||||
| Stock based compensation |
1,847 | 1,847 | ||||||||||||||||||||||||||||
|
|
|
|
|
|
|
|
|
|
|
|
|
|
|
|||||||||||||||||
| Balances at December 31, 2012 |
32,278,330 | $ | 186,822 | $ | 109 | $ | (127,084 | ) | 4,982,744 | $ | (30,569 | ) | $ | 29,278 | ||||||||||||||||
|
|
|
|
|
|
|
|
|
|
|
|
|
|
|
|||||||||||||||||
| Net income |
40,155 | 40,155 | ||||||||||||||||||||||||||||
| Unrealized gain (loss) on available-for-sale securities, net of taxes |
3 | 3 | ||||||||||||||||||||||||||||
| Issuance of stock for ESPP purchase |
36,921 | 198 | 198 | |||||||||||||||||||||||||||
| Exercise of stock options |
956,633 | 6,393 | 6,393 | |||||||||||||||||||||||||||
| Release of restricted stock units and awards |
347,882 | 3,482 | 3,482 | |||||||||||||||||||||||||||
| Stock based compensation |
1,162 | 1,162 | ||||||||||||||||||||||||||||
|
|
|
|
|
|
|
|
|
|
|
|
|
|
|
|||||||||||||||||
| Balances at December 31, 2013 |
33,619,766 | $ | 198,057 | $ | 112 | $ | (86,929 | ) | 4,982,744 | $ | (30,569 | ) | $ | 80,671 | ||||||||||||||||
|
|
|
|
|
|
|
|
|
|
|
|
|
|
|
|||||||||||||||||
| Net income |
4,123 | 4,123 | ||||||||||||||||||||||||||||
| Unrealized gain (loss) on available-for-sale securities, net of taxes |
(10 | ) | (10 | ) | ||||||||||||||||||||||||||
| Repurchase of stock |
1,527,647 | (15,000 | ) | (15,000 | ) | |||||||||||||||||||||||||
| Issuance of stock for ESPP purchase |
38,298 | 381 | 381 | |||||||||||||||||||||||||||
| Exercise of stock options |
205,744 | 1,304 | 1,304 | |||||||||||||||||||||||||||
| Release of restricted stock units and awards |
361,970 | 3,976 | 3,976 | |||||||||||||||||||||||||||
| Tax benefit/(deficiency) from the stock incentive plans |
(161 | ) | (161 | ) | ||||||||||||||||||||||||||
| Stock based compensation |
1,319 | 1,319 | ||||||||||||||||||||||||||||
|
|
|
|
|
|
|
|
|
|
|
|
|
|
|
|||||||||||||||||
| Balances at December 31, 2014 |
34,225,778 | $ | 204,876 | $ | 102 | $ | (82,806 | ) | 6,510,391 | $ | (45,569 | ) | $ | 76,603 | ||||||||||||||||
|
|
|
|
|
|
|
|
|
|
|
|
|
|
|
|||||||||||||||||
See notes to consolidated financial statements.
49
Table of Contents
IMMERSION CORPORATION
CONSOLIDATED STATEMENTS OF CASH FLOWS
(In thousands)
| Years Ended December 31, | ||||||||||||
| 2014 |
2013 |
2012 |
||||||||||
| Cash flows from operating activities: |
||||||||||||
| Net income (loss) |
$ | 4,123 | $ | 40,155 | $ | (7,197 | ) | |||||
| Adjustments to reconcile net income (loss) to net cash provided by (used in) operating activities: |
||||||||||||
| Depreciation and amortization of property and equipment |
500 | 584 | 654 | |||||||||
| Amortization of intangibles |
67 | 79 | 49 | |||||||||
| Stock-based compensation |
5,295 | 4,644 | 3,146 | |||||||||
| Allowance for doubtful accounts |
16 | 8 | 113 | |||||||||
| Loss on disposal of equipment |
52 | 11 | 27 | |||||||||
| Gain on sales of discontinued operations |
0 | 0 | (153 | ) | ||||||||
| Changes in operating assets and liabilities: |
||||||||||||
| Accounts and other receivables |
(2,439 | ) | 1,272 | (504 | ) | |||||||
| Inventories |
0 | 141 | 282 | |||||||||
| Deferred income taxes |
1,893 | (36,850 | ) | 0 | ||||||||
| Prepaid expenses and other current assets |
(155 | ) | 16 | (227 | ) | |||||||
| Other assets |
(39 | ) | (152 | ) | (54 | ) | ||||||
| Accounts payable |
(10 | ) | 341 | 8 | ||||||||
| Accrued compensation and other current liabilities |
(2,241 | ) | 2,788 | (717 | ) | |||||||
| Deferred revenue |
(6,755 | ) | 8,206 | (3,194 | ) | |||||||
| Other long-term liabilities |
(16 | ) | (91 | ) | 374 | |||||||
|
|
|
|
|
|
|
|||||||
| Net cash provided by (used in) operating activities |
291 | 21,152 | (7,393 | ) | ||||||||
|
|
|
|
|
|
|
|||||||
| Cash flows provided by (used in) investing activities: |
||||||||||||
| Purchases of short-term investments |
(42,953 | ) | (94,931 | ) | (43,944 | ) | ||||||
| Proceeds from maturities of short-term investments |
57,000 | 77,000 | 54,000 | |||||||||
| Additions to intangibles |
0 | 0 | (100 | ) | ||||||||
| Purchases of property and equipment |
(779 | ) | (234 | ) | (1,000 | ) | ||||||
| Proceeds from sales of discontinued operations |
0 | 0 | 250 | |||||||||
|
|
|
|
|
|
|
|||||||
| Net cash provided by (used in) investing activities |
13,268 | (18,165 | ) | 9,206 | ||||||||
|
|
|
|
|
|
|
|||||||
| Cash flows provided by (used in) financing activities: |
||||||||||||
| Issuance of common stock under employee stock purchase plan |
381 | 198 | 122 | |||||||||
| Exercise of stock options |
1,304 | 6,393 | 1,046 | |||||||||
| Purchases of treasury stock |
(15,000 | ) | 0 | (5,721 | ) | |||||||
|
|
|
|
|
|
|
|||||||
| Net cash provided by (used in) financing activities |
(13,315 | ) | 6,591 | (4,553 | ) | |||||||
|
|
|
|
|
|
|
|||||||
| Net increase (decrease) in cash and cash equivalents |
244 | 9,578 | (2,740 | ) | ||||||||
| Cash and cash equivalents: |
||||||||||||
| Beginning of year |
14,136 | 4,558 | 7,298 | |||||||||
|
|
|
|
|
|
|
|||||||
| End of year |
$ | 14,380 | $ | 14,136 | $ | 4,558 | ||||||
|
|
|
|
|
|
|
|||||||
| Supplemental disclosure of cash flow information: |
||||||||||||
| Cash paid for taxes |
$ | 47 | $ | 18 | $ | 21 | ||||||
|
|
|
|
|
|
|
|||||||
| Supplemental disclosure of noncash operating, investing, and financing activities: |
||||||||||||
| Amounts accrued for property and equipment |
$ | 60 | $ | 24 | $ | 0 | ||||||
|
|
|
|
|
|
|
|||||||
| Release of Restricted Stock Units and Awards under company stock plan |
$ | 3,976 | $ | 3,482 | $ | 1,298 | ||||||
|
|
|
|
|
|
|
|||||||
See notes to consolidated financial statements.
50
Table of Contents
IMMERSION CORPORATION
NOTES TO CONSOLIDATED FINANCIAL STATEMENTS
1. Significant Accounting Policies
Description of Business
Immersion Corporation (the “Company”) was incorporated in 1993 in California and reincorporated in Delaware in 1999. It is an intellectual property (“IP”) and software licensing company focused on the creation, design, development, and licensing of patented haptic innovations and software that allow people to use their sense of touch more fully when operating a wide variety of digital devices.
Principles of Consolidation and Basis of Presentation
The consolidated financial statements include the accounts of Immersion Corporation and its wholly-owned subsidiaries, Immersion Canada Inc.; Immersion International, LLC; Immersion Medical, Inc.; Immersion Japan K.K.; Immersion Ltd.; Immersion Software Ireland Ltd.; Haptify, Inc.; and Immersion (Shanghai) Science & Technology Company, Ltd. All intercompany accounts, transactions, and balances have been eliminated in consolidation. The Company has prepared the accompanying consolidated financial statements in conformity with accounting principles generally accepted in the United States of America (“GAAP”).
Cash Equivalents
The Company considers all highly liquid instruments purchased with an original or remaining maturity of less than three months at the date of purchase to be cash equivalents.
Short-term Investments
The Company’s short-term investments consist primarily of U.S treasury bills and government agency securities purchased with an original or remaining maturity of greater than 90 days on the date of purchase. The Company classifies debt securities with readily determinable market values as “available-for-sale.” Even though the stated maturity dates of these debt securities may be one year or more beyond the balance sheet date, the Company has classified all debt securities as short-term investments as they are reasonably expected to be realized in cash or sold within one year. These investments are carried at fair market value with unrealized gains and losses considered to be temporary in nature reported as a separate component of other comprehensive income (loss) within stockholders’ equity.
The Company recognizes an impairment charge in the consolidated statement of operations when a decline in value is judged to be other than temporary based on the specific identification method. Other-than-temporary impairment charges may exist when the Company has the intent to sell the security, will more likely than not be required to sell the security, or does not expect to recover the principal.
Property and Equipment
Property is stated at cost and is depreciated using the straight-line method over the estimated useful life of the related asset. The estimated useful lives are typically as follows:
| Computer equipment and purchased software |
3 years | |||
| Machinery and equipment |
3-5 years | |||
| Furniture and fixtures |
5 years |
Leasehold improvements are amortized over the shorter of the lease term or their estimated useful life.
51
Table of Contents
Intangible Assets
Intangible assets with finite useful lives are amortized and intangible assets with indefinite lives are not amortized but rather are tested at least annually for impairment.
The Company has acquired patents and other intangible assets. Costs associated with acquired patents and other intangible assets are capitalized as incurred. These costs are amortized utilizing the straight-line method, which approximates the pattern of consumption over the estimated useful lives of the respective assets, generally ten years.
The Company also internally develops and licenses IP and software, and when possible, it protects its IP and software with patents and trademarks. External patent-related costs are expensed as incurred and classified as general and administrative expenses in the consolidated statement of operations, consistent with the classification of internal legal costs associated with internally developed patents and trademarks.
Long-lived Assets
The Company evaluates its long-lived assets for impairment whenever events or changes in circumstances indicate that the carrying amount of that asset may not be recoverable. An impairment loss would be recognized when the sum of the undiscounted future net cash flows expected to result from the use of the asset and its eventual disposition is less than its carrying amount. Measurement of an impairment loss for long-lived assets and certain identifiable intangible assets that management expects to hold and use is based on the fair value of the asset.
Revenue Recognition
The Company recognizes revenues in accordance with applicable accounting standards, including ASC 605-10-S99, “Revenue Recognition” (“ASC 605-10-S99”); ASC 605-25, “Multiple Element Arrangements” (“ASC 605-25”); and ASC 985-605, “Software-Revenue Recognition” (“ASC 985-605”). The Company derives its revenues from three principal sources: royalty and license fees, development contract and service fees, and, previously, product sales. As described below, management judgments, assumptions, and estimates must be made and used in connection with the revenue recognized in any accounting period. Material differences may result in the amount and timing of revenue for any period based on the judgments and estimates made by management. Specifically, in connection with each transaction, the Company must evaluate whether: (i) persuasive evidence of an arrangement exists, (ii) delivery has occurred, (iii) the fee is fixed or determinable, and (iv) collectibility is probable. The Company applies these criteria as discussed below.
| • | Persuasive evidence of an arrangement exists. For a license arrangement, the Company requires a written contract, signed by both the customer and the Company. For a stand-alone product sale, the Company requires a purchase order or other form of written agreement with the customer. |
| • | Delivery has occurred. The Company delivers software and product to customers physically and also delivers software electronically. For physical deliveries not related to software, the transfer terms typically include transfer of title and risk of loss at the Company’s shipping location. For electronic deliveries, delivery occurs when the Company provides the customer access codes or “keys” that allow the customer to take immediate possession of the software. |
| • | The fee is fixed or determinable. The Company’s arrangement fee is based on the use of standard payment terms which are those that are generally extended to the majority of customers. For transactions involving extended payment terms, the Company deems these fees not to be fixed or determinable for revenue recognition purposes and revenue is deferred until the fees become due and payable. |
52
Table of Contents
| • | Collectibility is probable. To recognize revenue, the Company must judge collectibility of fees, which is done on a customer-by-customer basis pursuant to the Company’s credit review policy. The Company typically sells to customers with whom there is a history of successful collection. For new customers, the Company evaluates the customer’s financial condition and ability to pay. If it is determined that collectibility is not probable based upon the credit review process or the customer’s payment history, revenue is recognized when payment is received. |
Royalty and license revenue — The Company licenses its patents and software to customers in a variety of industries such as mobility, gaming, automotive, and medical devices. Certain of these are variable fee arrangements where the royalties earned by the Company are based on unit or sales volumes of the respective licensees. The Company also enters into fixed license fee arrangements. The terms of the royalty agreements generally require licensees to give notification of royalties due to the Company within 30 – 45 days of the end of the quarter during which their related sales occur. As the Company is unable to reliably estimate the licensees’ sales in any given quarter to determine the royalties due to it, the Company recognizes royalty revenues based on royalties reported by licensees and when all revenue recognition criteria are met. Certain royalties are based upon customer shipments or revenues and could be subject to change and may result in out of period adjustments. The Company recognizes fixed license fee revenue for licenses when earned under the terms of the agreements, which is generally recognized on a straight-line basis over the expected term of the license.
Development, services, and other revenue — Development, services, and other revenue are composed of engineering services (engineering services and/or development contracts), and in limited cases, post contract customer support (“PCS”). Engineering services revenues are recognized under the proportional performance accounting method based on physical completion of the work to be performed or completed performance method. A provision for losses on contracts is made, if necessary, in the period in which the loss becomes probable and can be reasonably estimated. Revisions in estimates are reflected in the period in which the conditions become known. To date, such losses have not been significant. Revenue from PCS is typically recognized over the period of the ongoing obligation, which is generally consistent with the contractual term.
Multiple element arrangements — The Company enters into multiple element arrangements in which customers purchase time-based non-exclusive licenses that cannot be resold to others, which include a combination of software and/or IP licenses, engineering services, and in limited cases PCS. For arrangements that are software based and include software and engineering services, the services are generally not essential to the functionality of the software, and customers may purchase engineering services to facilitate the adoption of the Company’s technology, but they may also decide to use their own resources or appoint other engineering service organizations to perform these services. For arrangements that are in substance subscription arrangements, the entire arrangement fee is recognized ratably over the contract term, subject to any limitations related to extended payment terms. For arrangements involving upfront fees for services and royalties earned by the Company based on unit or sales volumes of the respective licensees, and the services are performed ratably over the arrangement or are front-end loaded, the upfront fees are recognized ratably over the contract term and royalties based on unit or sales volume are recognized when they become fixed and determinable. As the Company is unable to reliably estimate the licensees’ sales in any given quarter to determine the royalties due to it, the Company recognizes per unit or sales volume driven royalty revenues based on royalties reported by licensees and when all revenue recognition criteria are met.
Product sales — The Company recognizes revenue from the sale of products and the license of associated software, if any, and expenses all related costs of products sold, once delivery has occurred and customer acceptance, if required, has been achieved. The Company typically grants to customers a warranty that guarantees the products will substantially conform to the Company’s current specifications for generally three to twelve months from the delivery date pursuant to the terms of the arrangement. Historically, warranty-related costs have not been significant. As of December 31, 2013, the Company ceased selling products.
53
Table of Contents
Advertising
Advertising costs (including obligations under cooperative marketing programs) are expensed as incurred and included in sales and marketing expense. Advertising expense was as follows:
| Year ended December 31, | ||||||||||||
| 2014 |
2013 |
2012 |
||||||||||
| (In thousands) | ||||||||||||
| Advertising expense |
$ | 344 | $ | 322 | $ | 152 | ||||||
|
|
|
|
|
|
|
|||||||
Research and Development
Research and development costs are expensed as incurred. The Company has sometimes generated revenues from development contracts with commercial customers that have enabled it to accelerate its own product development efforts. Such development revenues have only partially funded the Company’s product development activities, and the Company generally retains ownership of the products developed under these arrangements. As a result, the Company classifies all development costs related to these contracts as research and development expenses.
Income Taxes
The Company uses the asset and liability method of accounting for income taxes. Under this method, income tax expense is recognized for the amount of taxes payable or refundable for the current year. In addition, deferred tax assets and liabilities are recognized for the expected future tax consequences of temporary differences between the financial reporting and tax bases of assets and liabilities, and for operating losses and tax credit carryforwards. Valuation allowances are established when necessary to reduce deferred tax assets to the amount expected to be realized and are reversed at such time that realization is believed to be more likely than not.
Software Development Costs
Costs for the development of new software products and substantial enhancements to existing software products are expensed as incurred until technological feasibility has been established, at which time any additional costs would be capitalized. The Company considers technological feasibility to be established upon completion of a working model of the software. Because the Company believes its current process for developing software is essentially completed concurrently with the establishment of technological feasibility, no costs have been capitalized to date.
Stock-based Compensation
Stock-based compensation cost is measured at the grant date based on the fair value of the award and is recognized as expense on a straight-line basis over the requisite service period, which is the vesting period. See Note 9 for further information regarding the Company’s stock-based compensation assumptions and expenses.
Comprehensive Income (Loss)
Comprehensive income (loss) includes net income (loss) as well as other items of comprehensive income or loss. The Company’s other comprehensive income (loss) consists of foreign currency translation adjustments and unrealized gains and losses on available-for-sale securities, net of tax.
54
Table of Contents
Use of Estimates
The preparation of consolidated financial statements and related disclosures in accordance with GAAP and pursuant to the rules and regulations of the U.S. Securities and Exchange Commission (“SEC”) requires management to make estimates and assumptions that affect the reported amounts of assets and liabilities and disclosure of contingent assets and liabilities at the date of the consolidated financial statements and the reported amounts of revenues and expenses during the reporting period. Significant estimates include valuation of short-term investments, income taxes including uncertain tax provisions, revenue recognition, stock-based compensation, contingent liabilities from litigation, and accruals for other liabilities. Actual results may differ materially from those estimates.
Concentration of Credit Risks
Financial instruments that potentially subject the Company to a concentration of credit risk principally consist of cash, cash equivalents, short term investments, and accounts receivable. The Company invests primarily in money market accounts and highly liquid debt instruments purchased with an original or remaining maturity of greater than 90 days on the date of purchase. Deposits held with banks may exceed the amount of insurance provided on such deposits. Generally, these deposits may be redeemed upon demand. The Company licenses technology primarily to companies in North America, Europe, and Asia. To reduce credit risk, management performs periodic credit evaluations of its customers’ financial condition. The Company maintains reserves for estimated potential credit losses, but historically has not experienced any significant losses related to individual customers or groups of customers in any particular industry or geographic area.
Certain Significant Risks and Uncertainties
The Company operates in multiple industries and, accordingly, can be affected by a variety of factors. For example, management of the Company believes that changes in any of the following areas could have a negative effect on the Company in terms of its future financial position and results of operations: the mix of revenues; the loss of significant customers; fundamental changes in the technologies underlying the Company’s and its licensees’ products; market acceptance of the Company’s and its licensees’ products under development; development of sales channels; litigation or other claims in which the Company is involved; the ability to successfully assert its patent rights against others; the impact of changing economic conditions; the hiring, training, and retention of key employees; successful and timely completion of product and technology development efforts; and new product or technology introductions by competitors.
Fair Value of Financial Instruments
Financial instruments consist primarily of cash equivalents, short-term investments, accounts receivable and accounts payable. Cash equivalents and short term investments are stated at fair value based on quoted market prices, broker or dealer quotations, or alternative pricing sources with reasonable levels of price transparency. The recorded cost of accounts receivable and accounts payable approximate the fair value of the respective assets and liabilities.
Foreign Currency Translation
The functional currency of the Company’s foreign subsidiaries is U. S. dollars. Accordingly, gains and losses from the translation of the financial statements of the foreign subsidiaries and foreign currency transaction gains and losses are included in earnings.
55
Table of Contents
Recent Accounting Pronouncements
In May 2014, the Financial Accounting Standards Board (“FASB”) issued Accounting Standards Update (“ASU”) No. 2014-09 “Revenue from Contracts with Customers: Topic 606” (“ASU 2014-09”) which will supersede the current revenue recognition requirements in Topic 605, Revenue Recognition, and most industry-specific guidance. The core principle of ASU 2014-09 is that an entity should recognize revenue to depict the transfer of promised goods or services to customers in an amount that reflects the consideration to which the entity expects to be entitled in exchange for those goods or services. Further, the guidance requires improved disclosures to help users of financial statements better understand the nature, amount, timing, and uncertainty of revenue that is recognized. ASU 2014-09 is effective for reporting periods beginning after December 15, 2016, and permits companies to either apply the requirements retrospectively to all prior periods presented, or apply the requirements in the year of adoption, through a cumulative adjustment. The Company is required to adopt ASU 2014-09 as of January 1, 2017, and is in the process of determining the method of adoption and evaluating the impact on its consolidated financial statements.
2. Fair Value Disclosures
Cash Equivalents and Short-term Investments
The financial instruments of the Company measured at fair value on a recurring basis are cash equivalents and short-term investments.
The Company’s fixed income available-for-sale securities consist of high quality, investment grade securities. The Company values these securities based on pricing from pricing vendors, who may use quoted prices in active markets for identical assets (Level 1) or inputs other than quoted prices that are observable either directly or indirectly (Level 2) in determining fair value.
The types of instruments valued based on quoted market prices in active markets include most money market securities. Such instruments are generally classified within Level 1 of the fair value hierarchy.
The types of instruments valued based on quoted prices in markets that are less active, broker or dealer quotations, or alternative pricing sources with reasonable levels of price transparency are generally classified within Level 2 of the fair value hierarchy and include most U.S. treasury securities and most investment-grade corporate commercial paper.
The types of instruments valued based on unobservable inputs which reflect the reporting entity’s own assumptions or data that market participants would use in valuing an instrument are generally classified within Level 3 of the fair value hierarchy.
56
Table of Contents
Financial instruments measured at fair value on a recurring basis as of December 31, 2014 and December 31, 2013 are classified based on the valuation technique in the table below:
| December 31, 2014 Fair value measurements using |
Total | |||||||||||||||
| Quoted Prices in Active Markets for Identical Assets (Level 1) |
Significant Other Observable Inputs (Level 2) |
Significant Unobservable Inputs
(Level 3) |
||||||||||||||
| (In thousands) | ||||||||||||||||
| Assets: |
||||||||||||||||
| U.S. Treasury securities |
$ | 0 | $ | 42,981 | $ | 0 | $ | 42,981 | ||||||||
| Money market funds |
11,524 | 0 | 0 | 11,524 | ||||||||||||
|
|
|
|
|
|
|
|
|
|||||||||
| Total assets at fair value |
$ | 11,524 | $ | 42,981 | $ | 0 | $ | 54,505 | ||||||||
|
|
|
|
|
|
|
|
|
|||||||||
The above table excludes $2.9 million of cash held in banks.
| December 31, 2013 Fair value measurements using |
Total | |||||||||||||||
| Quoted Prices in Active Markets for Identical Assets (Level 1) |
Significant Other Observable Inputs (Level 2) |
Significant Unobservable Inputs
(Level 3) |
||||||||||||||
| (In thousands) | ||||||||||||||||
| Assets: |
||||||||||||||||
| U.S. Treasury securities |
$ | 0 | $ | 56,976 | $ | 0 | $ | 56,976 | ||||||||
| Money market funds |
10,075 | 0 | 0 | 10,075 | ||||||||||||
|
|
|
|
|
|
|
|
|
|||||||||
| Total assets at fair value |
$ | 10,075 | $ | 56,976 | $ | 0 | $ | 67,051 | ||||||||
|
|
|
|
|
|
|
|
|
|||||||||
The above table excludes $4.1 million of cash held in banks.
Short-term Investments
| December 31, 2014 | ||||||||||||||||
| Amortized Cost |
Gross Unrealized Holding Gains |
Gross Unrealized Holding Losses |
Fair Value | |||||||||||||
| (In thousands) | ||||||||||||||||
| U.S. Treasury securities |
$ | 42,980 | $ | 1 | $ | 0 | $ | 42,981 | ||||||||
|
|
|
|
|
|
|
|
|
|||||||||
| Total |
$ | 42,980 | $ | 1 | $ | 0 | $ | 42,981 | ||||||||
|
|
|
|
|
|
|
|
|
|||||||||
57
Table of Contents
| December 31, 2013 | ||||||||||||||||
| Amortized Cost |
Gross Unrealized Holding Gains |
Gross Unrealized Holding Losses |
Fair Value | |||||||||||||
| (In thousands) | ||||||||||||||||
| U.S. Treasury securities |
$ | 56,966 | $ | 10 | $ | 0 | $ | 56,976 | ||||||||
|
|
|
|
|
|
|
|
|
|||||||||
| Total |
$ | 56,966 | $ | 10 | $ | 0 | $ | 56,976 | ||||||||
|
|
|
|
|
|
|
|
|
|||||||||
The contractual maturities of the Company’s available-for-sale securities on December 31, 2014 and December 31, 2013 were all due within one year.
3. Accounts and Other Receivables
| December 31, | ||||||||
| 2014 | 2013 | |||||||
| (In thousands) | ||||||||
| Trade accounts receivable |
$ | 2,708 | $ | 320 | ||||
| Receivables from vendors and other |
313 | 278 | ||||||
|
|
|
|
|
|||||
| Accounts and other receivables |
$ | 3,021 | $ | 598 | ||||
|
|
|
|
|
|||||
4. Property and Equipment
| December 31, | ||||||||
| 2014 | 2013 | |||||||
| (In thousands) | ||||||||
| Computer equipment and purchased software |
$ | 3,418 | $ | 3,595 | ||||
| Machinery and equipment |
688 | 704 | ||||||
| Furniture and fixtures |
852 | 607 | ||||||
| Leasehold improvements |
1,295 | 938 | ||||||
|
|
|
|
|
|||||
| Total |
6,253 | 5,844 | ||||||
| Less accumulated depreciation |
(5,046 | ) | (4,900 | ) | ||||
|
|
|
|
|
|||||
| Property and equipment, net |
$ | 1,207 | $ | 944 | ||||
|
|
|
|
|
|||||
5. Intangibles and Other Assets
| December 31, | ||||||||
| 2014 | 2013 | |||||||
| (In thousands) | ||||||||
| Purchased patents and other purchased intangible assets |
$ | 4,605 | $ | 5,731 | ||||
| Other assets |
265 | 289 | ||||||
|
|
|
|
|
|||||
| Gross intangibles and other assets |
4,870 | 6,020 | ||||||
| Accumulated amortization of purchased patents and other purchased intangibles |
(4,579 | ) | (5,639 | ) | ||||
|
|
|
|
|
|||||
| Intangibles and other assets, net |
$ | 291 | $ | 381 | ||||
|
|
|
|
|
|||||
58
Table of Contents
The Company amortizes its intangible assets related to purchased patents over their estimated useful lives, generally 10 years from the purchase date. Amortization of intangibles was as follows:
| Year ended December 31, | ||||||||||||
| 2014 |
2013 |
2012 |
||||||||||
| (In thousands) | ||||||||||||
| Amortization of Intangibles |
$ | 67 | $ | 79 | $ | 49 | ||||||
|
|
|
|
|
|
|
|||||||
The table below includes estimated remaining annual amortization expense for purchased patents as of December 31, 2014.
| Estimated Amortization Expense |
||||
| (In thousands) | ||||
| 2015 |
$ | 20 | ||
| 2016 |
6 | |||
|
|
|
|||
| Total |
$ | 26 | ||
|
|
|
|||
6. Other Current Liabilities
| December 31, | ||||||||
| 2014 | 2013 | |||||||
| (In thousands) | ||||||||
| Accrued legal |
$ | 1,065 | $ | 780 | ||||
| Accrued services |
518 | 226 | ||||||
| Income taxes payable |
69 | 41 | ||||||
| Other current liabilities |
573 | 606 | ||||||
|
|
|
|
|
|||||
| Total other current liabilities |
$ | 2,225 | $ | 1,653 | ||||
|
|
|
|
|
|||||
7. Long-term Deferred Revenue
Long-term deferred revenue consisted of the following:
| December 31, | ||||||||
| 2014 | 2013 | |||||||
| (In thousands) | ||||||||
| Deferred revenue for Sony Computer Entertainment |
$ | 7,051 | $ | 12,840 | ||||
| Other deferred revenue |
776 | 601 | ||||||
|
|
|
|
|
|||||
| Long-term deferred revenue |
$ | 7,827 | $ | 13,441 | ||||
|
|
|
|
|
|||||
Deferred revenue for Sony Computer Entertainment represents deferred license revenue where payments have been received in advance of revenue recognition.
59
Table of Contents
8. Commitments
The Company leases several of its facilities under noncancelable operating lease arrangements that expire at various dates through 2023.
On November 12, 2014, the Company entered into an amendment to the lease of its primary facilities. The amendment terminates the lease of the current San Jose, California facility of approximately 33,000 square feet as of May 2015, which was scheduled to expire in December 2016. It also begins the lease of a San Jose, California facility of approximately 42,000 square feet as of February 2015. The lease contains provisions for leasehold improvement incentives and expires as of April 2023 and can be extended to April 2028. Minimum future lease payments obligations are as follows:
| Operating Leases | ||||
| (In thousands) | ||||
| 2015 |
993 | |||
| 2016 |
829 | |||
| 2017 |
865 | |||
| 2018 |
972 | |||
| 2019 |
843 | |||
| Thereafter |
2,991 | |||
|
|
|
|||
| Total |
$ | 7,493 | ||
|
|
|
|||
Rent expense was as follows:
| Year ended December 31, | ||||||||||||
| 2014 |
2013 |
2012 |
||||||||||
| (In thousands) | ||||||||||||
| Rent expense |
$ | 742 | $ | 549 | $ | 550 | ||||||
|
|
|
|
|
|
|
|||||||
9. Stock-based Compensation
The Company’s equity incentive program is a long-term retention program that is intended to attract, retain, and provide incentives for talented employees, consultants, officers, and directors and to align stockholder and employee interests. The Company may grant options, stock appreciation rights, restricted stock, restricted stock units (“RSUs”), performance shares, performance units, and other stock-based or cash-based awards to employees, officers, directors, and consultants. Under these programs, stock options may be granted at prices not less than the fair market value on the date of grant for stock options. These options generally vest over 4 years and expire from 5 to 10 years from the date of grant. Restricted stock generally vests over one year. RSUs generally vest over 3 years. Awards granted other than an option or stock appreciation right shall reduce the common stock shares available for grant by 1.75 shares for every share issued.
| December 31, | ||||
| 2014 |
||||
| Common stock shares available for grant |
2,247,565 | |||
| Common stock options outstanding |
3,536,157 | |||
| Restricted stock awards outstanding |
35,364 | |||
| Restricted stock units outstanding |
564,891 | |||
60
Table of Contents
Employee Stock Purchase Plan
The Company has an Employee Stock Purchase Plan (“ESPP”). Under the ESPP, eligible employees may purchase common stock through payroll deductions at a purchase price of 85% of the lower of the fair market value of the Company’s stock at the beginning of the offering period or the purchase date. Participants may not purchase more than 2,000 shares in a six-month offering period or purchase stock having a value greater than $25,000 in any calendar year as measured at the beginning of the offering period. A total of 1,000,000 shares of common stock have been reserved for issuance under the ESPP. As of December 31, 2014, 557,738 shares had been purchased since the inception of the ESPP in 1999. Under ASC 718-10, the ESPP is considered a compensatory plan and the Company is required to recognize compensation cost related to the fair value of the award purchased under the ESPP. Shares purchased under the ESPP for the year ended December 31, 2014 are listed below. Shares purchased under the ESPP for the year ended December 31, 2013 are 36,921. The intrinsic value listed below is calculated as the difference between the market value on the date of purchase and the purchase price of the shares.
| Year Ended December 31, 2014 |
||||
| Shares purchased under ESPP |
38,298 | |||
| Average price of shares purchased under ESPP |
$ | 9.95 | ||
| Intrinsic value of shares purchased under ESPP |
$ | 107,000 | ||
Summary of Standard Stock Options
The following table sets forth the summary of option activity under the Company’s stock option plans for the years ended December 31, 2014, 2013, and 2012:
| Number of Shares |
Weighted Average Exercise Price |
Weighted Average Fair Value Of Options Granted |
Aggregate Intrinsic Value of Options Exercised (In thousands) |
|||||||||||||
| Outstanding at January 1, 2012 |
3,267,838 | $ | 6.61 | |||||||||||||
| Granted |
425,150 | 6.10 | $ | 3.35 | ||||||||||||
| Exercised |
(231,403 | ) | 4.52 | $ | 443 | |||||||||||
| Forfeited |
(47,959 | ) | 5.89 | |||||||||||||
| Expired |
(257,995 | ) | 7.32 | |||||||||||||
|
|
|
|||||||||||||||
| Outstanding at December 31, 2012 |
3,155,631 | 6.65 | ||||||||||||||
| Granted |
1,058,700 | 10.20 | 5.63 | |||||||||||||
| Exercised |
(956,633 | ) | 6.68 | 5,774 | ||||||||||||
| Forfeited |
(10,531 | ) | 8.24 | |||||||||||||
| Expired |
(20,000 | ) | 9.01 | |||||||||||||
|
|
|
|||||||||||||||
| Outstanding at December 31, 2013 |
3,227,167 | 7.78 | ||||||||||||||
| Granted |
604,620 | 10.32 | 4.93 | |||||||||||||
| Exercised |
(205,744 | ) | 6.34 | 1,125 | ||||||||||||
| Forfeited |
(102,454 | ) | 7.20 | |||||||||||||
| Expired |
(37,432 | ) | 10.19 | |||||||||||||
|
|
|
|||||||||||||||
| Outstanding at December 31, 2014 |
3,486,157 | 8.30 | ||||||||||||||
|
|
|
|||||||||||||||
61
Table of Contents
The aggregate intrinsic value is calculated as the difference between the exercise price of the underlying awards and the quoted price of the Company’s common stock for the options that were in-the-money.
Information regarding standard stock options outstanding at December 31, 2014, 2013, and 2012 is summarized below:
| Number
of Shares |
Weighted Average Exercise Price |
Weighted Average Remaining Contractual Life (years) |
Aggregate Intrinsic Value (In millions) |
|||||||||||||
| December 31, 2012 |
||||||||||||||||
| Options outstanding |
3,155,631 | $ | 6.65 | 5.24 | $ | 3.5 | ||||||||||
| Options vested and expected to vest using estimated forfeiture rates |
3,019,979 | 6.67 | 5.17 | 3.4 | ||||||||||||
| Options exercisable |
2,329,987 | 6.91 | 4.69 | 2.5 | ||||||||||||
| December 31, 2013 |
||||||||||||||||
| Options outstanding |
3,227,167 | $ | 7.78 | 5.46 | $ | 9.9 | ||||||||||
| Options vested and expected to vest using estimated forfeiture rates |
2,994,044 | 7.61 | 5.41 | 9.6 | ||||||||||||
| Options exercisable |
1,774,546 | 6.67 | 4.95 | 7.5 | ||||||||||||
| December 31, 2014 |
||||||||||||||||
| Options outstanding |
3,486,157 | $ | 8.30 | 4.85 | $ | 6.6 | ||||||||||
| Options vested and expected to vest using estimated forfeiture rates |
3,319,308 | 8.21 | 4.80 | 6.6 | ||||||||||||
| Options exercisable |
2,023,024 | 7.18 | 4.26 | 6.0 | ||||||||||||
Additional information regarding standard options outstanding as of December 31, 2014 is as follows:
| Options Outstanding | Options Exercisable | |||||||||||||||||||
| Range of Exercise Prices |
Number Outstanding |
Weighted Average Remaining Contractual Life (Years) |
Weighted Average Exercise Price |
Number Exercisable |
Weighted Average Exercise Price |
|||||||||||||||
| $ 2.70 - $3.81 |
20,297 | 4.21 | $ | 2.88 | 20,297 | $ | 2.88 | |||||||||||||
| 3.85 - 3.85 |
600,000 | 4.87 | 3.85 | 600,000 | 3.85 | |||||||||||||||
| 4.24 - 6.12 |
578,769 | 4.09 | 5.86 | 467,289 | 5.83 | |||||||||||||||
| 6.23 - 8.61 |
453,931 | 4.39 | 7.44 | 366,187 | 7.43 | |||||||||||||||
| 8.71 - 9.20 |
315,030 | 5.47 | 9.16 | 101,572 | 9.10 | |||||||||||||||
| 9.53 - 9.53 |
850,000 | 5.18 | 9.53 | 229,374 | 9.53 | |||||||||||||||
| 9.65 - 13.61 |
355,130 | 6.07 | 11.64 | 18,218 | 12.58 | |||||||||||||||
| 13.65 - 14.80 |
203,000 | 4.80 | 14.15 | 110,087 | 14.31 | |||||||||||||||
| 15.12 - 15.12 |
10,000 | 2.62 | 15.12 | 10,000 | 15.12 | |||||||||||||||
| 16.57 - 16.57 |
100,000 | 2.74 | 16.57 | 100,000 | 16.57 | |||||||||||||||
|
|
|
|
|
|||||||||||||||||
| $2.70 - $16.57 |
3,486,157 | 4.85 | $ | 8.30 | 2,023,024 | $ | 7.18 | |||||||||||||
|
|
|
|
|
|||||||||||||||||
62
Table of Contents
Summary of Market Condition Based Stock Options
In 2014 the Company began granting options that are subject to both time-based vesting and a market condition. For these options, the closing price of the Company stock must exceed a certain level for a number of trading days within a specified timeframe or the options will be cancelled before the seven year life of the options. The following table sets forth the summary of the market-based option activity under the Company’s stock option plans for the year ended December 31, 2014:
| Number of Shares |
Weighted Average Exercise Price |
Weighted Average Fair Value Of Options Granted |
Aggregate Intrinsic Value of Options Exercised (In thousands) |
|||||||||||||
| Outstanding at January 1, 2014 |
0 | $ | 0.00 | |||||||||||||
| Granted |
50,000 | 11.94 | 5.71 | |||||||||||||
| Exercised |
0 | 0.00 | 0 | |||||||||||||
| Forfeited |
0 | 0.00 | ||||||||||||||
| Expired |
0 | 0.00 | ||||||||||||||
|
|
|
|||||||||||||||
| Outstanding at December 31, 2014 |
50,000 | 11.94 | ||||||||||||||
|
|
|
|||||||||||||||
The aggregate intrinsic value is calculated as the difference between the exercise price of the underlying awards and the quoted price of the Company’s common stock for the options that were in-the-money.
Information regarding these market condition based stock options outstanding at December 31, 2014 is summarized below:
| Number of Shares |
Weighted Average Exercise Price |
Weighted Average Remaining Contractual Life (years) |
Aggregate Intrinsic Value (In millions) |
|||||||||||||
| December 31, 2014 |
||||||||||||||||
| Options outstanding |
50,000 | $ | 11.94 | 6.15 | $ | 0.0 | ||||||||||
| Options vested and expected to vest using estimated forfeiture rates |
45,430 | 11.94 | 6.15 | 0.0 | ||||||||||||
| Options exercisable |
0 | 0.00 | 0.00 | 0.0 | ||||||||||||
Additional information regarding market condition based stock options outstanding as of December 31, 2014 is as follows:
| Options Outstanding | Options Exercisable | |||||||||||||||||||
| Range of Exercise Prices |
Number Outstanding |
Weighted Average Remaining Contractual Life (Years) |
Weighted Average Exercise Price |
Number Exercisable |
Weighted Average Exercise Price |
|||||||||||||||
| $ 11.94 - $11.94 |
50,000 | 6.15 | $ | 11.94 | 0 | $ | 0.00 | |||||||||||||
|
|
|
|
|
|||||||||||||||||
63
Table of Contents
Summary of Restricted Stock Units
RSU activity for the years ended December 31, 2014, 2013, and 2012 was as follows:
| Number of Shares |
Weighted Average Grant Date Fair Value |
Fair
Value of Released RSU’s (In thousands) |
||||||||||
| Outstanding at January 1, 2012 |
407,765 | |||||||||||
| Awarded |
555,911 | $ | 6.64 | |||||||||
| Released |
(203,519 | ) | $ | 1,128 | ||||||||
| Forfeited |
(51,506 | ) | ||||||||||
|
|
|
|||||||||||
| Outstanding at December 31, 2012 |
708,651 | |||||||||||
| Awarded |
294,150 | 7.12 | ||||||||||
| Released |
(303,882 | ) | 2,806 | |||||||||
| Forfeited |
(30,863 | ) | ||||||||||
|
|
|
|||||||||||
| Outstanding at December 31, 2013 |
668,056 | |||||||||||
| Awarded |
265,630 | 11.35 | ||||||||||
| Released |
(317,970 | ) | 3,491 | |||||||||
| Forfeited |
(50,825 | ) | ||||||||||
|
|
|
|||||||||||
| Outstanding at December 31, 2014 |
564,891 | |||||||||||
|
|
|
|||||||||||
Information regarding RSU’s at December 31, 2014, 2013, and 2012 is summarized below:
| Number of Shares |
Weighted Average Remaining Contractual Life (years) |
Aggregate Intrinsic Value (In millions) |
Fair
Value (In millions) |
|||||||||||||
| December 31, 2012 |
||||||||||||||||
| RSUs outstanding |
708,651 | 1.09 | $ | 4.9 | $ | 4.9 | ||||||||||
| RSUs vested and expected to vest using estimated forfeiture rates |
588,170 | 1.05 | $ | 4.0 | ||||||||||||
| December 31, 2013 |
||||||||||||||||
| RSUs outstanding |
668,056 | 0.91 | $ | 6.9 | $ | 6.9 | ||||||||||
| RSUs vested and expected to vest using estimated forfeiture rates |
583,711 | 0.89 | $ | 6.1 | ||||||||||||
| December 31, 2014 |
||||||||||||||||
| RSUs outstanding |
564,891 | 0.84 | $ | 5.3 | $ | 5.3 | ||||||||||
| RSUs vested and expected to vest using estimated forfeiture rates |
502,411 | 0.80 | $ | 4.8 | ||||||||||||
The aggregate intrinsic value is calculated as the market value as of the end of the reporting period.
64
Table of Contents
Summary of Restricted Stock Awards
Restricted stock award activity for the years ended December 31, 2014, 2013, and 2012 was as follows:
| Number of Shares |
Weighted Average Grant Date Fair Value |
Total Fair Value of Awards Released (In thousands) |
||||||||||
| Outstanding at January 1, 2012 |
18,000 | $ | 6.61 | |||||||||
| Awarded |
57,750 | 5.70 | ||||||||||
| Released |
(31,750 | ) | 6.72 | $ | 171 | |||||||
| Forfeited |
0 | |||||||||||
|
|
|
|||||||||||
| Outstanding at December 31, 2012 |
44,000 | 5.34 | ||||||||||
| Awarded |
44,000 | 14.09 | ||||||||||
| Released |
(44,000 | ) | 5.34 | 676 | ||||||||
| Forfeited |
0 | |||||||||||
|
|
|
|||||||||||
| Outstanding at December 31, 2013 |
44,000 | 14.09 | ||||||||||
| Awarded |
35,364 | 10.97 | ||||||||||
| Released |
(44,000 | ) | 14.09 | 483 | ||||||||
| Forfeited |
0 | |||||||||||
|
|
|
|||||||||||
| Outstanding at December 31, 2014 |
35,364 | 10.97 | ||||||||||
|
|
|
|||||||||||
Stock-based Compensation
Valuation and amortization methods — The Company uses the Black-Scholes-Merton option pricing model (“Black-Scholes model”), single-option approach to determine the fair value of standard stock options and ESPP shares. All share-based payment awards are amortized on a straight-line basis over the requisite service periods of the awards, which are generally the vesting periods. Stock-based compensation expense recognized at fair value includes the impact of estimated forfeitures. The Company estimates future forfeitures at the date of grant and revises the estimates if necessary, in subsequent periods if actual forfeitures differ from these estimates. The determination of the fair value of share-based payment awards on the date of grant using an option pricing model is affected by the Company’s stock price as well as assumptions regarding a number of complex and subjective variables. These variables include actual and projected employee stock option exercise behaviors that impact the expected term, the Company’s expected stock price volatility over the term of the awards, risk-free interest rate, and expected dividends.
Expected term — The Company estimates the expected term of options granted by calculating the average term from the Company’s historical stock option exercise experience. The expected term of ESPP shares is the length of the offering period. The Company used the simplified method approved by the SEC to determine the expected term for options granted prior to December 31, 2007.
Expected volatility — The Company estimates the volatility of its common stock taking into consideration its historical stock price movement and its expected future stock price trends based on known or anticipated events.
Risk-free interest rate — The Company bases the risk-free interest rate that it uses in the option pricing model on U.S. Treasury zero-coupon issues with remaining terms similar to the expected term on the options.
65
Table of Contents
Expected dividend — The Company does not anticipate paying any cash dividends in the foreseeable future and therefore uses an expected dividend yield of zero in the option-pricing model.
Forfeitures — The Company is required to estimate future forfeitures at the time of grant and revise those estimates in subsequent periods if actual forfeitures differ from those estimates. The Company uses historical data to estimate pre-vesting option forfeitures and records stock-based compensation expense only for those awards that are expected to vest.
The Company uses the Monte-Carlo Simulation model to value the stock options with a market condition. Valuation techniques such as a Monte-Carlo Simulation model have been developed to value path-dependent awards. The Monte-Carlo Simulation model is a generally accepted statistical technique used, in this instance, to simulate a range of future stock prices for the Company.
The assumptions used to value option grants under the Company’s stock plans are as follows:
| Standard Stock Options | ||||||||||||
| 2014 |
2013 |
2012 |
||||||||||
| Expected life (in years) |
4.7 | 4.9 | 4.5 | |||||||||
| Interest rate |
1.4 | % | 0.8 | % | 0.7 | % | ||||||
| Volatility |
57 | % | 70 | % | 70 | % | ||||||
| Dividend yield |
0.0 | % | 0.0 | % | 0.0 | % | ||||||
| Market Condition Based Stock Options | ||||
| 2014 |
||||
| Expected life (in years) |
7.0 | |||
| Interest rate |
2.2 | % | ||
| Volatility |
66 | % | ||
| Dividend yield |
0.0 | % | ||
| Employee Stock Purchase Plan | ||||||||||||
| 2014 |
2013 |
2012 |
||||||||||
| Expected life (in years) |
0.5 | 0.5 | 0.5 | |||||||||
| Interest rate |
0.1 | % | 0.1 | % | 0.1 | % | ||||||
| Volatility |
43 | % | 67 | % | 62 | % | ||||||
| Dividend yield |
0.0 | % | 0.0 | % | 0.0 | % | ||||||
Total stock-based compensation recognized in the consolidated statements of operations is as follows:
| Year Ended December 31, |
||||||||||||
| 2014 |
2013 |
2012 |
||||||||||
| Income Statement Classifications |
(In thousands) | |||||||||||
| Sales and marketing |
$ | 1,117 | $ | 747 | $ | 547 | ||||||
| Research and development |
1,267 | 1,040 | 756 | |||||||||
| General and administrative |
2,911 | 2,857 | 1,843 | |||||||||
|
|
|
|
|
|
|
|||||||
| Total |
$ | 5,295 | $ | 4,644 | $ | 3,146 | ||||||
|
|
|
|
|
|
|
|||||||
66
Table of Contents
As of December 31, 2014, there was $7.4 million of unrecognized compensation cost, adjusted for estimated forfeitures, related to non-vested stock options, restricted stock awards and RSU’s granted to the Company’s employees and directors. This cost will be recognized over an estimated weighted-average period of approximately 2.95 years for standard options, 3.17 years for market condition based options, 0.43 years for restricted stock awards and 1.41 years for RSU’s. Total unrecognized compensation cost will be adjusted for future changes in estimated forfeitures.
10. Stockholders’ Equity
Comprehensive Income (Loss)
The changes in accumulated other comprehensive income (loss) are included in the table below.
| Year Ended December 31, 2014 |
||||||||||||
| Unrealized Gains and Losses on Available-for Sale Securities |
Foreign Currency Items |
Total |
||||||||||
| (In thousands) | ||||||||||||
| Beginning balance |
$ | 11 | $ | 101 | $ | 112 | ||||||
| Other comprehensive income (loss) before reclassifications |
(10 | ) | 0 | (10 | ) | |||||||
| Amounts reclassified from accumulated other comprehensive income (loss) |
0 | 0 | 0 | |||||||||
|
|
|
|
|
|
|
|||||||
| Net current period other comprehensive income (loss) |
(10 | ) | 0 | (10 | ) | |||||||
|
|
|
|
|
|
|
|||||||
| Ending Balance |
$ | 1 | $ | 101 | $ | 102 | ||||||
|
|
|
|
|
|
|
|||||||
In February 2013, the FASB ratified ASU 2013-02 “Comprehensive Income (Topic 220): Reporting of Amounts Reclassified Out of Comprehensive Income” (“ASU 2013-02”). ASU 2013-02 requires entities to disclose additional information about items reclassified out of accumulated other comprehensive income (“AOCI”) including AOCI balances by component and significant items reclassified out of AOCI. This ASU is effective for reporting periods beginning after December 15, 2012, and is being applied prospectively. The impact was not significant on the Company’s consolidated financial statements.
Stock Repurchase Program
On November 1, 2007, the Company announced its board of directors’ authorized the repurchase of up to $50 million of the Company’s common stock. In addition, on October 22, 2014, our board of directors authorized another $30 million under the share repurchase program. The Company may repurchase its stock for cash in the open market in accordance with applicable securities laws. The timing of and amount of any stock repurchase will depend on share price, corporate and regulatory requirements, economic and market conditions, and other factors. The stock repurchase authorization has no expiration date, does not require the Company to repurchase a specific number of shares, and may be modified, suspended, or discontinued at any time.
During the year ended December 31, 2014, the Company repurchased 1,527,647 shares for $15,000,000 at an average cost of $9.82 net of transaction costs through open market repurchases. There were no stock repurchases in 2013 under this stock repurchase program. During the year ended December 31, 2012, the
67
Table of Contents
Company repurchased 1,054,538 shares for $5,721,000 at an average cost of $5.43 net of transaction costs through open market repurchases. These amounts are classified as treasury stock on the Company’s consolidated balance sheet.
11. Discontinued Operations
During 2009, the Company sold all of its 3D product line including inventory, fixed assets, and intangibles and recorded gains on the sale of discontinued operations of $187,000 at the time of the sales. The consideration for the sales was $2.7 million in the form of cash of $320,000 and notes receivable of $2.4 million, for which the proceeds are being recognized when they are received. The Company abandoned all other 3D operations. Accordingly, the operations of the 3D product line were classified as discontinued operations, net of income tax, in the consolidated statement of operations for all periods presented. The assets sold consisted primarily of intangible assets that had no carrying value on the Company’s books at the time of sale. In the years ended December 31, 2014, 2013, and 2012 the Company recorded gains on sales of discontinued operations net of tax of $0, $0, and $153,000 respectively, from the original sale and payments on notes from the sale of the 3D product line.
12. Income Taxes
Income tax benefit (provisions) from continuing operations consisted of the following:
| Years Ended December 31, | ||||||||||||
| 2014 |
2013 |
2012 |
||||||||||
| (In thousands) | ||||||||||||
| Income (loss) from continuing operations before benefit (provision) for income taxes |
$ | 6,319 | $ | 3,672 | $ | (6,558) | ||||||
| Benefit (provision) for income taxes |
(2,196 | ) | 36,483 | (792 | ) | |||||||
| Effective tax rate |
34.8 | % | (993.5 | )% | (12.1 | )% | ||||||
The 2014 provision for income tax resulted primarily from the decrease in deferred tax assets and foreign withholding tax expense. The 2013 benefit for income tax resulted primarily from the partial release of our valuation allowance. The 2012 provision for income tax resulted primarily from foreign withholding tax expense.
The Company reported pre-tax book income (loss) from continuing operations of:
| Years Ended December 31, | ||||||||||||
| 2014 | 2013 | 2012 | ||||||||||
| (In thousands) | ||||||||||||
| Domestic |
$ | 5,867 | $ | 3,349 | $ | (2,175 | ) | |||||
| Foreign |
452 | 323 | (4,383 | ) | ||||||||
|
|
|
|
|
|
|
|||||||
| Total |
$ | 6,319 | $ | 3,672 | $ | (6,558) | ||||||
|
|
|
|
|
|
|
|||||||
68
Table of Contents
The benefit (provision) for income taxes from continuing operations consisted of the following:
| Years Ended December 31, | ||||||||||||
| 2014 | 2013 | 2012 | ||||||||||
| (In thousands) | ||||||||||||
| Current: |
||||||||||||
| United States federal |
$ | (218 | ) | $ | (300 | ) | $ | 91 | ||||
| Foreign |
(12 | ) | (12 | ) | (902 | ) | ||||||
| State and local |
(75 | ) | (55 | ) | 19 | |||||||
|
|
|
|
|
|
|
|||||||
| Total current |
$ | (305) | $ | (367 | ) | $ | (792 | ) | ||||
|
|
|
|
|
|
|
|||||||
| Deferred: |
||||||||||||
| United States federal |
(2,137 | ) | 36,190 | 0 | ||||||||
| Foreign |
0 | 660 | 0 | |||||||||
| State and local |
246 | 0 | 0 | |||||||||
|
|
|
|
|
|
|
|||||||
| Total deferred |
(1,891 | ) | 36,850 | 0 | ||||||||
|
|
|
|
|
|
|
|||||||
| $ | (2,196) | $ | 36,483 | $ | (792 | ) | ||||||
|
|
|
|
|
|
|
|||||||
In 2014, 2013, and 2012 the Company’s income tax payable was not decreased by the tax benefit related to stock options. The Company includes only the direct tax effects of employee stock incentive plans in calculating this benefit, which is recorded to additional paid-in capital.
Deferred tax assets and liabilities are recognized for the temporary differences between the carrying amounts of assets and liabilities for financial reporting purposes and the amounts used for income tax purposes, tax losses, and credit carryforwards. Significant components of the net deferred tax assets and liabilities consisted of:
| December 31, | ||||||||
| 2014 | 2013 | |||||||
| (In thousands) | ||||||||
| Deferred tax assets: |
||||||||
| Net operating loss carryforwards |
$ | 20,627 | $ | 23,652 | ||||
| State income taxes |
1 | 1 | ||||||
| Deferred revenue |
4,723 | 3,588 | ||||||
| Research and development and other credits |
8,898 | 8,201 | ||||||
| Reserves and accruals recognized in different periods |
4,803 | 4,994 | ||||||
| Basis difference in investment |
968 | 967 | ||||||
| Capitalized R&D expenses |
1,576 | 1,535 | ||||||
| Depreciation and amortization |
783 | 887 | ||||||
| Other |
80 | 120 | ||||||
|
|
|
|
|
|||||
| Total deferred tax assets |
42,459 | 43,945 | ||||||
| Valuation allowance |
(7,663 | ) | (7,095 | ) | ||||
|
|
|
|
|
|||||
| Net deferred tax assets |
$ | 34,796 | $ | 36,850 | ||||
|
|
|
|
|
|||||
The Company accounts for deferred taxes under ASC Topic 740, “Income Taxes” (“ASC 740”) which involves weighing positive and negative evidence concerning the realizability of the Company’s deferred tax assets in each jurisdiction. As of December 31, 2014, based on its assessment of the realizability of its deferred tax assets, the Company maintains a partial valuation allowance against certain of its U.S. Federal, state, and foreign deferred tax assets in each jurisdiction. The valuation allowance increased by $568,000.
69
Table of Contents
As of December 31, 2014, the net operating loss carryforwards for federal and state income tax purposes were approximately $57.6 million and $52.3 million, respectively. The federal net operating losses expire between 2028 and 2033 and the state net operating losses begin to expire in 2028. $9.1 million of the Company’s net operating losses are associated with excess benefits related to stock compensation, when realized the amount will be an increase to additional paid in capital. As of December 31, 2014, the Company had federal and state tax credit carryforwards of approximately $9.2 million and $1.1 million, respectively, available to offset future taxable income. The federal credit carryforwards will expire between 2018 and 2034 and the California tax credits will carryforward indefinitely. In addition, as of December 31, 2014, the Company has Canadian research and development credit carryforwards of $1.6 million, which will expire at various dates through 2034. These operating losses and credit carryforwards have not been reviewed by the relevant tax authorities and could be subject to adjustment upon examinations.
Section 382 of the Internal Revenue Code (“IRC Section 382”) imposes limitations on a corporation’s ability to utilize its net operating losses and credit carryforwards if it experiences an “ownership change” as defined by IRC Section 382. Utilization of a portion of the Company’s federal net operating loss carryforward was limited in accordance with IRC Section 382, due to an ownership change that occurred during 1999. This limitation has fully lapsed as of December 31, 2010. As of December 31, 2014, the Company conducted an IRC Section 382 analysis with respect to its net operating loss and credit carryforwards and determined there was no limitation. There can be no assurance that future issuances of the Company’s securities will not trigger limitations under IRC Section 382 which could limit utilization of these tax attributes.
For purposes of the reconciliation between the benefit (provision) for income taxes at the statutory rate and the effective tax rate, a national U.S. 35% rate is applied as follows:
| 2014 | 2013 | 2012 | ||||||||||
| Federal statutory tax rate |
35.0 | % | 35.0 | % | 35.0 | % | ||||||
| State taxes, net of federal benefit |
0.0 | % | 0.1 | % | 2.3 | % | ||||||
| Foreign withholding |
3.5 | % | 8.2 | % | (13.0 | )% | ||||||
| Stock compensation expense |
3.8 | % | 2.5 | % | (2.6 | )% | ||||||
| Meals & entertainment |
0.1 | % | 0.3 | % | (0.2 | )% | ||||||
| Foreign rate differential |
(1.1 | )% | (1.7 | )% | (2.8 | )% | ||||||
| Prior year true-up items |
(0.2 | )% | 0.1 | % | 0.1 | % | ||||||
| Tax reserves |
0.8 | % | 1.3 | % | (0.1 | )% | ||||||
| Benefit of discontinued operations |
0.0 | % | 0.0 | % | 1.5 | % | ||||||
| Credits |
(5.7 | )% | (11.0 | )% | 13.0 | % | ||||||
| Other |
(1.4 | )% | 0.0 | % | 0.3 | % | ||||||
| Valuation allowance |
0.0 | % | (1028.3 | )% | (45.6 | )% | ||||||
|
|
|
|
|
|
|
|||||||
| Effective tax rate |
34.8 | % | (993.5 | )% | (12.1 | )% | ||||||
|
|
|
|
|
|
|
|||||||
Undistributed earnings of the Company’s foreign subsidiaries are considered to be indefinitely reinvested and accordingly, no provision for federal and state income taxes has been provided thereon. Upon distribution of those earnings in the form of dividends or otherwise, the Company would be subject to both U.S. income taxes (subject to an adjustment for foreign tax credits) and withholding taxes payable to various foreign countries.
The Company maintains liabilities for uncertain tax positions. These liabilities involve considerable judgment and estimation and are continuously monitored by management based on the best information
70
Table of Contents
available, including changes in tax regulations, the outcome of relevant court cases, and other information. A reconciliation of the beginning and ending amount of gross unrecognized tax benefits is as follows:
| 2014 Unrecognized Tax Benefits |
2013 Unrecognized Tax Benefits |
2012 Unrecognized Tax Benefits |
||||||||||
| (In thousands) | ||||||||||||
| Balance at beginning of year |
$ | 1,634 | $ | 628 | $ | 628 | ||||||
| Gross increases for tax positions of prior years |
0 | 896 | 0 | |||||||||
| Gross decreases for tax positions of prior years |
(4 | ) | 0 | 0 | ||||||||
| Gross increases for tax positions of current year |
114 | 110 | 0 | |||||||||
| Settlements |
0 | 0 | 0 | |||||||||
| Lapse of statute of limitations |
0 | 0 | 0 | |||||||||
|
|
|
|
|
|
|
|||||||
| Balance at end of year |
$ | 1,744 | $ | 1,634 | $ | 628 | ||||||
|
|
|
|
|
|
|
|||||||
In July 2013, the FASB ratified ASU 2013-11, “Presenting an Unrecognized Tax Benefit (“UTB”) When a Net Operating Loss Carryforward Exists” (“ASU 2013-11”). ASU 2013-02 provides that an UTB, or a portion thereof, should be presented in the financial statements as a reduction to a deferred tax asset for a net operating loss carryforward, a similar tax loss, or a tax credit carryforward, except to the extent that a net operating loss carryforward, a similar tax loss, or a tax credit carryforward is not available at the reporting date to settle any additional income taxes that would result from disallowance of a tax position, or the tax law does not require the entity to use, and the entity does not intend to use, the deferred tax asset for such purpose, then the unrecognized tax benefit should be presented as a liability. ASU 2013-11 was effective for reporting periods beginning after December 15, 2013, and may be applied retrospectively. The impact was not significant on the Company’s condensed consolidated results of operations and financial condition.
The unrecognized tax benefits relate primarily to federal and state research and development credits. The Company’s policy is to account for interest and penalties related to uncertain tax positions as a component of income tax expense. As of December 31, 2014, the Company accrued interest or penalties related to uncertain tax positions in the amount of $73,000. The Company expects to release reserves and record a tax benefit due to the expiration of statutes of limitations during the next 12 months. As of December 31, 2014, the total amount of unrecognized tax benefits that would affect the Company’s effective tax rate, if recognized, is $272,000.
Because the Company has net operating loss and credit carryforwards, there are open statutes of limitations in which federal, state and foreign taxing authorities may examine the Company’s tax returns for all years from 1998 through the current period.
71
Table of Contents
13. Net Income (Loss) Per Share
The following is a reconciliation of the numerators and denominators used in computing basic and diluted net income (loss) per share:
| Years Ended December 31, | ||||||||||||
| 2014 | 2013 | 2012 | ||||||||||
| (In thousands, except per share amounts) | ||||||||||||
| Numerator: |
||||||||||||
| Income (loss) from continuing operations |
$ | 4,123 | $ | 40,155 | $ | (7,350) | ||||||
| Gain from discontinued operations , net of tax |
0 | 0 | 153 | |||||||||
|
|
|
|
|
|
|
|||||||
| Net income (loss) used in computing basic and diluted net income (loss) per share |
$ | 4,123 | $ | 40,155 | $ | (7,197) | ||||||
|
|
|
|
|
|
|
|||||||
| Denominator: |
||||||||||||
| Shares used in computation of basic and diluted net income (loss) per share (weighted average common shares outstanding) |
28,246 | 28,190 | 27,735 | |||||||||
| Dilutive potential common shares: |
||||||||||||
| Restricted Stock and RSUs |
261 | 343 | 0 | |||||||||
| Stock options |
637 | 805 | 0 | |||||||||
|
|
|
|
|
|
|
|||||||
| Shares used in computation of diluted net income (loss) per share |
29,144 | 29,338 | 27,735 | |||||||||
|
|
|
|
|
|
|
|||||||
| Basic net income (loss) per share from: |
||||||||||||
| Continuing operations |
$ | 0.15 | $ | 1.42 | $ | (0.27) | ||||||
| Discontinued operations |
0.00 | 0.00 | 0.01 | |||||||||
|
|
|
|
|
|
|
|||||||
| Total |
$ | 0.15 | $ | 1.42 | $ | (0.26) | ||||||
|
|
|
|
|
|
|
|||||||
| Diluted net income (loss) per share from: |
||||||||||||
| Continuing operations |
$ | 0.14 | $ | 1.37 | $ | (0.27) | ||||||
| Discontinued operations |
0.00 | 0.00 | 0.01 | |||||||||
|
|
|
|
|
|
|
|||||||
| Total |
$ | 0.14 | $ | 1.37 | $ | (0.26) | ||||||
|
|
|
|
|
|
|
|||||||
For the year ended December 31, 2014, options to purchase approximately 1.6 million shares of common stock with an exercise price greater than the average fair market value of the Company’s stock of $10.46 per share were not included in the calculation because the effect would have been anti-dilutive.
For the year ended December 31, 2013, options to purchase approximately 979,521 shares of common stock with an exercise price greater than the average fair market value of the Company’s stock of $11.72 per share were not included in the calculation because the effect would have been anti-dilutive.
72
Table of Contents
As of December 31, 2012, the Company had securities outstanding that could potentially dilute basic earnings per share in the future, but were excluded from the computation of diluted net loss per share in the periods presented since their effect would have been anti-dilutive. These outstanding securities consisted of the following:
| Year Ended December 31, | ||||
| 2012 |
||||
| Outstanding stock options |
3,155,631 | |||
| Unvested restricted stock awards |
44,000 | |||
| Unvested restricted stock units |
708,651 | |||
14. Employee Benefit Plan
The Company has a 401(k) tax-deferred savings plan under which eligible employees may elect to have a portion of their salary deferred and contributed to the 401(k) plan. Contributions may be made by the Company at the discretion of the board of directors. Beginning in January 2008, the Company matched 25% of the employee’s contribution up to $2,000 for the year.
| Year ended December 31, | ||||||||||||
| 2014 |
2013 |
2012 |
||||||||||
| (In thousands) | ||||||||||||
| Company contribution to 401 (k) plan |
$ | 106 | $ | 91 | $ | 77 | ||||||
|
|
|
|
|
|
|
|||||||
15. Contingencies
From time to time, the Company receives claims from third parties asserting that the Company’s technologies, or those of its licensees, infringe on the other parties’ IP rights. Management believes that these claims are without merit. Additionally, periodically, the Company is involved in routine legal matters and contractual disputes incidental to its normal operations. In management’s opinion, the resolution of such matters will not have a material adverse effect on the Company’s consolidated financial condition, results of operations, or liquidity.
In the normal course of business, the Company provides indemnifications of varying scope to customers against claims of IP infringement made by third parties arising from the use of the Company’s IP, technology, or products. Historically, costs related to these guarantees have not been significant, and the Company is unable to estimate the maximum potential impact of these guarantees on its future results of operations.
16. Segment Reporting, Geographic Information, and Significant Customers
Segment Information
The Company develops, licenses, and supports a wide range of software and IP that more fully engage users’ sense of touch when operating digital devices. The Company focuses on the following target application areas: mobile devices, wearables, consumer, mobile entertainment and other content; console gaming; automotive; medical; and commercial. The Company manages these application areas in one operating and reporting segment with one set of management, development, and administrative personnel.
The Company’s chief operating decision maker (“CODM”) is the Chief Executive Officer. The CODM allocates resources to and assesses the performance of the Company using information about its revenue and operating loss. There is only one segment that is reported to management.
73
Table of Contents
Revenue by Market Area
The following is a summary of revenues by market areas. Revenue as a percentage of total revenues by market was as follows:
| Years Ended December 31, | ||||||||||||
| 2014 |
2013 |
2012 |
||||||||||
| Mobile, Wearables, and Consumer |
60 | % | 66 | % | 46 | % | ||||||
| Gaming Devices |
27 | % | 21 | % | 28 | % | ||||||
| Automotive |
5 | % | 5 | % | 6 | % | ||||||
| Medical |
8 | % | 8 | % | 16 | % | ||||||
| Other |
0 | % | 0 | % | 4 | % | ||||||
|
|
|
|
|
|
|
|||||||
| Total |
100 | % | 100 | % | 100 | % | ||||||
|
|
|
|
|
|
|
|||||||
Revenue by Region
The following is a summary of revenues by geographic areas. Revenues are broken out geographically by the ship-to location of the customer. Geographic revenue as a percentage of total revenues by region was as follows:
| Years Ended December 31, | ||||||||||||
| 2014 |
2013 |
2012 |
||||||||||
| North America |
29 | % | 28 | % | 41 | % | ||||||
| Europe |
3 | % | 4 | % | 13 | % | ||||||
| Asia |
68 | % | 68 | % | 46 | % | ||||||
|
|
|
|
|
|
|
|||||||
| Total |
100 | % | 100 | % | 100 | % | ||||||
|
|
|
|
|
|
|
|||||||
Geographic revenue as a percentage of total revenues by country was as follows:
| Years Ended December 31, | ||||||||||||
| 2014 |
2013 |
2012 |
||||||||||
| United States of America |
27 | % | 26 | % | 38 | % | ||||||
| Korea |
51 | % | 58 | % | 36 | % | ||||||
| Japan |
10 | % | 7 | % | * | |||||||
| Countries of which none are more than 10% in a year |
12 | % | 9 | % | 26 | % | ||||||
|
|
|
|
|
|
|
|||||||
| Total |
100 | % | 100 | % | 100 | % | ||||||
|
|
|
|
|
|
|
|||||||
* Represents less than 10% of the Company’s revenue and is included below.
The majority of the Company’s long-lived assets are located in the United States of America. Long-lived assets include net property and equipment, intangibles, long-term investments, and other assets. Long-lived assets that were outside the United States of America constituted less than 10% of the total on December 31, 2014, December 31, 2013, and December 31, 2012.
74
Table of Contents
Significant Customers
Customers comprising 10% or greater of the Company’s net revenues are summarized as follows:
| Years Ended December 31, | ||||||||||||
| 2014 |
2013 |
2012 |
||||||||||
| Samsung Electronics |
38 | % | 47 | % | 24 | % | ||||||
| Customer B |
17 | % | * | * | ||||||||
| Customer C |
12 | % | * | * | ||||||||
| Customer D |
* | * | * | |||||||||
| Customer E |
* | * | * | |||||||||
| Customer F |
* | * | * | |||||||||
| Customer G |
* | * | * | |||||||||
|
|
|
|
|
|
|
|||||||
| Total |
67 | % | 47 | % | 24 | % | ||||||
|
|
|
|
|
|
|
|||||||
* Revenue derived from customer represented less than 10% for the period.
Customers comprising 10% or greater of the Company’s outstanding accounts and other receivable are summarized as follows:
| December 31, | ||||||||||||
| 2014 |
2013 |
2012 |
||||||||||
| Samsung Electronics |
* | * | * | |||||||||
| Customer B |
* | * | * | |||||||||
| Customer C |
66 | % | * | 33 | % | |||||||
| Customer D |
* | * | 38 | % | ||||||||
| Customer E |
* | 11 | % | * | ||||||||
| Customer F |
* | * | 10 | % | ||||||||
| Customer G |
16 | % | 28 | % | * | |||||||
* Represents less than 10% of the Company’s outstanding accounts and other receivables.
75
Table of Contents
17. Quarterly Results of Operations (Unaudited)
The following table presents certain consolidated statement of operations data for the Company’s eight most recent quarters:
| Dec 31, 2014 |
Sept 30, 2014 |
June 30, 2014 |
Mar 31, 2014 |
Dec 31, 2013 |
Sept 30, 2013 |
June 30, 2013 |
Mar 31, 2013 |
|||||||||||||||||||||||||
| (In thousands, except per share data) | ||||||||||||||||||||||||||||||||
| Revenues (1) |
$ | 13,619 | $ | 12,051 | $ | 11,831 | $ | 15,436 | $ | 12,067 | $ | 11,342 | $ | 10,201 | $ | 13,860 | ||||||||||||||||
| Gross profit |
13,484 | 11,947 | 11,730 | 15,316 | 11,991 | 11,231 | 10,074 | 13,712 | ||||||||||||||||||||||||
| Operating income |
1,194 | 1,702 | 117 | 2,954 | 648 | 814 | 448 | 1,694 | ||||||||||||||||||||||||
| Income before provision for taxes |
1,439 | 1,672 | 261 | 2,947 | 636 | 856 | 476 | 1,704 | ||||||||||||||||||||||||
| Benefit (provision) for income taxes |
(422 | ) | (599 | ) | (92 | ) | (1,083 | ) | 36,767 | (257 | ) | (10 | ) | (17 | ) | |||||||||||||||||
| Net income |
1,017 | 1,073 | 169 | 1,864 | 37,403 | 599 | 466 | 1,687 | ||||||||||||||||||||||||
| Basic net income per share (2) |
$ | 0.04 | $ | 0.04 | $ | 0.01 | $ | 0.07 | $ | 1.31 | $ | 0.02 | $ | 0.02 | $ | 0.06 | ||||||||||||||||
| Shares used in calculating basic net income per share |
27,733 | 28,505 | 28,383 | 28,370 | 28,614 | 28,558 | 28,146 | 27,424 | ||||||||||||||||||||||||
| Diluted net income per share (2) |
$ | 0.04 | $ | 0.04 | $ | 0.01 | $ | 0.06 | $ | 1.26 | $ | 0.02 | $ | 0.02 | $ | 0.06 | ||||||||||||||||
| Shares used in calculating diluted net income per share |
28,430 | 29,351 | 29,210 | 29,382 | 29,675 | 29,653 | 29,293 | 28,294 | ||||||||||||||||||||||||
(1) The Company typically experiences seasonally higher revenue in the first calendar quarter due to the reporting of holiday sales from some of our customers.
(2) The quarterly earnings per share information is calculated separately for each period. Therefore, the sum of such quarterly per share amounts may differ from the total for the year.
76
Table of Contents
Item 9. Changes in and Disagreements with Accountants on Accounting and Financial Disclosure
None.
Item 9A. Control and Procedures
Management’s Evaluation of Disclosure Controls and Procedures
Based on their evaluation of our disclosure controls and procedures (as defined in Rules 13a-15(e) and 15d-15(e) under the Exchange Act, as amended) as of December 31, 2014, our management, with the participation of our Chief Executive Officer and Chief Financial Officer, have concluded that our disclosure controls and procedures were effective as of the end of the period covered by this report for the purpose of ensuring that the information required to be disclosed by us in this Annual Report on Form 10-K is made known to them by others on a timely basis, and that the information is accumulated and communicated to our management, including our Chief Executive Officer and Chief Financial Officer, in order to allow timely decisions regarding required disclosure, and that such information is recorded, processed, summarized, and reported by us within the time periods specified in the SEC’s rules and instructions for Form 10-K.
Our management, including our Chief Executive Officer and Chief Financial Officer, does not expect that our disclosure controls and procedures or our internal controls over financial reporting will prevent all error and all fraud. A control system, no matter how well conceived and operated, can provide only reasonable, not absolute, assurance that the objectives of the control system are met. Further, the design of a control system must reflect the fact that there are resource constraints and the benefits of controls must be considered relative to their costs. Because of the inherent limitations in all control systems, no evaluation of controls can provide absolute assurance that all control issues and instances of fraud, if any, within Immersion have been detected.
Management’s Annual Report on Internal Control over Financial Reporting
Our management is responsible for establishing and maintaining adequate internal control over financial reporting (as defined in Rule 13a-15(f) under the Exchange Act). Internal control over financial reporting is a process designed by, or under the supervision of, our Chief Executive Officer and our Chief Financial Officer and affected by our board of directors and management to provide reasonable assurance regarding the reliability of financial reporting and the preparation of financial statements for external purposes in accordance with GAAP. Our management assessed the effectiveness of our internal control over financial reporting as of December 31, 2014. Management’s assessment of internal control over financial reporting was conducted using the criteria in Internal Control — Integrated Framework issued by the Committee of Sponsoring Organizations of the Treadway Commission (“COSO”). In performing the assessment, our management concluded that, as of December 31, 2014, our internal control over financial reporting is effective based on these criteria.
Deloitte and Touche LLP, the independent registered public accounting firm that audited our financial statements included in this Annual Report on Form 10-K, has issued an attestation report on our internal control over financial reporting, which is included herein.
Changes in internal control over financial reporting
There were no changes in our internal control over financial reporting during the three months ended December 31, 2014 that have materially affected or are reasonably likely to materially affect, our internal control over financial reporting.
None.
77
Table of Contents
REPORT OF INDEPENDENT REGISTERED PUBLIC ACCOUNTING FIRM
To the Board of Directors and Stockholders of Immersion Corporation
San Jose, California
We have audited the internal control over financial reporting of Immersion Corporation and subsidiaries (the “Company”) as of December 31, 2014, based on criteria established in Internal Control — Integrated Framework (2013) issued by the Committee of Sponsoring Organizations of the Treadway Commission. The Company’s management is responsible for maintaining effective internal control over financial reporting and for its assessment of the effectiveness of internal control over financial reporting, included in the accompanying Management’s Annual Report on Internal Control over Financial Reporting. Our responsibility is to express an opinion on the Company’s internal control over financial reporting based on our audit.
We conducted our audit in accordance with the standards of the Public Company Accounting Oversight Board (United States). Those standards require that we plan and perform the audit to obtain reasonable assurance about whether effective internal control over financial reporting was maintained in all material respects. Our audit included obtaining an understanding of internal control over financial reporting, assessing the risk that a material weakness exists, testing and evaluating the design and operating effectiveness of internal control based on the assessed risk, and performing such other procedures as we considered necessary in the circumstances. We believe that our audit provides a reasonable basis for our opinion.
A company’s internal control over financial reporting is a process designed by, or under the supervision of, the company’s principal executive and principal financial officers, or persons performing similar functions, and effected by the company’s board of directors, management, and other personnel to provide reasonable assurance regarding the reliability of financial reporting and the preparation of financial statements for external purposes in accordance with generally accepted accounting principles. A company’s internal control over financial reporting includes those policies and procedures that (1) pertain to the maintenance of records that, in reasonable detail, accurately and fairly reflect the transactions and dispositions of the assets of the company; (2) provide reasonable assurance that transactions are recorded as necessary to permit preparation of financial statements in accordance with generally accepted accounting principles, and that receipts and expenditures of the company are being made only in accordance with authorizations of management and directors of the company; and (3) provide reasonable assurance regarding prevention or timely detection of unauthorized acquisition, use, or disposition of the company’s assets that could have a material effect on the financial statements.
Because of the inherent limitations of internal control over financial reporting, including the possibility of collusion or improper management override of controls, material misstatements due to error or fraud may not be prevented or detected on a timely basis. Also, projections of any evaluation of the effectiveness of the internal control over financial reporting to future periods are subject to the risk that the controls may become inadequate because of changes in conditions, or that the degree of compliance with the policies or procedures may deteriorate.
In our opinion, the Company maintained, in all material respects, effective internal control over financial reporting as of December 31, 2014, based on the criteria established in Internal Control — Integrated Framework (2013) issued by the Committee of Sponsoring Organizations of the Treadway Commission.
We have also audited, in accordance with the standards of the Public Company Accounting Oversight Board (United States), the consolidated financial statements and financial statement schedule as of and for the year ended December 31, 2014 of the Company and our report dated February 27, 2015 expressed an unqualified opinion on those financial statements and financial statement schedule.
/s/ DELOITTE & TOUCHE LLP
San Jose, California
February 27, 2015
78
Table of Contents
PART III
The SEC allows us to include information required in this report by referring to other documents or reports we have already or will soon be filing. This is called “Incorporation by Reference.” We intend to file our definitive proxy statement pursuant to Regulation 14A not later than 120 days after the end of the fiscal year covered by this report, and certain information therein is incorporated in this report by reference.
Item 10. Directors, Executive Officers and Corporate Governance
The information required by Item 10 with respect to executive officers is set forth in Part I of this Annual Report on Form 10-K and the remaining information required by Item 10 is incorporated by reference from the sections entitled “Election of Directors,” “Corporate Governance,” “Ownership of Our Equity Securities,” “Section 16(a) Beneficial Ownership Reporting Compliance,” and “Audit Committee Report” in Immersion’s definitive Proxy Statement for its 2015 annual stockholders’ meeting.
Item 11. Executive Compensation
The information required by Item 11 is incorporated by reference from the sections entitled “Election of Directors,” “Director Compensation,” “Corporate Governance,” “Compensation Discussion and Analysis,” “Compensation Committee Report,” “Compensation Committee Interlocks and Insider Participation,” and “Executive Compensation” in Immersion’s definitive Proxy Statement for its 2015 annual stockholders’ meeting.
Item 12. Security Ownership of Certain Beneficial Owners and Management and Related Stockholder Matters
The information required by Item 12 is incorporated by reference from the section entitled “Ownership of Our Equity Securities” and “Equity Compensation Plan Information” in Immersion’s definitive Proxy Statement for its 2015 annual stockholders’ meeting.
Item 13. Certain Relationships and Related Transactions, and Director Independence
The information required by Item 13 is incorporated by reference from the section entitled “Corporate Governance” and “Related Person Transactions” in Immersion’s definitive Proxy Statement for its 2015 annual stockholders’ meeting.
Item 14. Principal Accounting Fees and Services
The information required by Item 14 is incorporated by reference from the section entitled “Ratification of Appointment of Independent Registered Public Accounting Firm” in Immersion’s definitive Proxy Statement for its 2015 annual stockholders’ meeting.
79
Table of Contents
PART IV.
Item 15. Exhibits, Financial Statement Schedules
| (a) | The following documents are filed as part of this Form: |
| 1. | Financial Statements |
| Page | ||||
| Report of Independent Registered Public Accounting Firm |
46 | |||
| Consolidated Balance Sheets |
47 | |||
| Consolidated Statements of Operations |
48 | |||
| Consolidated Statements of Stockholders’ Equity |
49 | |||
| Consolidated Statements of Cash Flows |
50 | |||
| Notes to Consolidated Financial Statements |
51 | |||
| 2. | Financial Statement Schedules |
The following financial statement schedule of Immersion Corporation for the years ended December 31, 2014, 2013, and 2012 is filed as part of this Annual Report and should be read in conjunction with the Consolidated Financial Statements of Immersion Corporation.
| Schedule II—Valuation and Qualifying Accounts |
Page 85 |
Schedules not listed above have been omitted because the information required to be set forth therein is not applicable or is shown in the consolidated financial statements or notes herein.
| 3. | Exhibits: |
The following exhibits are filed herewith:
| Exhibit Number |
Exhibit Description |
Incorporated by Reference | Filed Herewith | |||||||||||||||
| Form | File No. | Exhibit | Filing Date | |||||||||||||||
| 3.1 |
Amended and Restated Bylaws, dated October 31, 2007. | 8-K | 000-27969 | 3.4 | November 1, 2007 | |||||||||||||
| 3.2 |
Amended and Restated Certificate of Incorporation. | 10-Q | 000-27969 | 3.1 | August 14, 2000 | |||||||||||||
| 3.3 |
Certificate of Designation of the Powers, Preferences and Rights of Series A Redeemable Convertible Preferred Stock. | 8-K | 000-27969 | 3.1 | July 29, 2003 | |||||||||||||
| 10.1* |
1997 Stock Option Plan and form of Incentive Stock Option Agreement and form of Nonqualified Stock Option Agreement. | S-1/A | 333-86361 | 10.2 | November 5, 1999 | |||||||||||||
| 10.2* |
1999 Employee Stock Purchase Plan and form of subscription agreement thereunder. | S-1/A | 333-86361 | 10.21 | October 5, 1999 | |||||||||||||
| 10.3* |
Immersion Corporation 2000 HT Non-Officer Nonstatutory Stock Option Plan. | 8-K | 000-27969 | 2.4 | October 13, 2000 | |||||||||||||
| 10.4# |
Settlement Agreement dated July 25, 2003 by and between Microsoft Corporation and Immersion Corporation. | S-3 | 333-108607 | 10.3 | September 8, 2003 | |||||||||||||
| 10.5# |
License Agreement dated July 25, 2003 by and between Microsoft Corporation and Immersion Corporation. | S-3/A | 333-108607 | 10.4 | February 13, 2004 | |||||||||||||
80
Table of Contents
| Exhibit Number |
Exhibit Description |
Incorporated by Reference | Filed Herewith | |||||||||||||||
| Form | File No. | Exhibit | Filing Date | |||||||||||||||
| 10.6 |
Letter Agreement dated March 18, 2004 by and between Microsoft Corporation and Immersion Corporation. | S-3/A | 333-108607 | 10.10 | March 25, 2004 | |||||||||||||
| 10.7* |
Form of Indemnity Agreement. | S-3/A | 333-108607 | 10.11 | March 25, 2004 | |||||||||||||
| 10.8# |
Agreement by and among Sony Computer Entertainment America Inc., Sony Computer Entertainment Inc., and Immersion Corporation dated March 1, 2007. | 10-Q | 000-27969 | 10.37 | May 10, 2007 | |||||||||||||
| 10.9* |
2007 Equity Incentive Plan. | 8-K | 000-27969 | 99.1 | June 12, 2007 | |||||||||||||
| 10.10* |
Form of Stock Option Agreement (U.S. Participant) for 2007 Equity Incentive Plan. | 8-K | 000-27969 | 99.4 | June 12, 2007 | |||||||||||||
| 10.11* |
Form of Stock Option Agreement (Non-U.S. Participant) for 2007 Equity Incentive Plan. | 8-K | 000-27969 | 99.5 | June 12, 2007 | |||||||||||||
| 10.12* |
The Immersion Corporation 2008 Employment Inducement Award Plan dated April 30, 2008. | 10-Q | 000-27969 | 10.38 | August 8, 2008 | |||||||||||||
| 10.13* |
Form of Stock Option Agreement for Immersion Corporation 2008 Employment Inducement Award Plan. | 10-Q | 000-27969 | 10.39 | August 8, 2008 | |||||||||||||
| 10.14* |
Settlement Agreement dated August 25, 2008 by and between Microsoft Corporation and Immersion Corporation. | 10-Q | 000-27969 | 10.45 | November 7, 2008 | |||||||||||||
| 10.15* |
Form of RSU Agreement for Immersion Corporation 2008 Employment Inducement Award Plan. | 8-K | 000-27969 | 99.01 | March 4, 2009 | |||||||||||||
| 10.16* |
Employment Agreement dated October 21, 2009 by and between Immersion Corporation and Victor Viegas. | 10-K | 000-27969 | 10.42 | March 30, 2010 | |||||||||||||
| 10.17* |
Form of 2010 Executive Incentive Plan. | 10-Q | 000-27969 | May 7, 2010 | ||||||||||||||
| 10.18* |
2011 Equity Incentive Plan. | 10-Q | 000-27969 | 10.1 | August 5, 2011 | |||||||||||||
| 10.19* |
Form of Stock Option Award Agreement for Immersion Corporation 2011 Equity Incentive Plan. | 10-Q | 000-27969 | 10.2 | August 5, 2011 | |||||||||||||
| 10.20* |
Form of Award Agreement (Restricted Stock Units) to the Immersion Corporation 2011 Equity Incentive Plan. | 10-Q | 000-27969 | 10.3 | August 5, 2011 | |||||||||||||
| 10.21* |
Form of Restricted Stock Agreement for Immersion Corporation 2011 Equity Incentive Plan. | 10-Q | 000-27969 | 10.4 | August 5, 2011 | |||||||||||||
| 10.22 |
Office Lease between Carr NP Properties, L.L.C., and Immersion Corporation dated September 15, 2011. | 10-Q | 000-27969 | 10.2 | November 7, 2011 | |||||||||||||
81
Table of Contents
| Exhibit Number |
Exhibit Description |
Incorporated by Reference | Filed Herewith |
|||||||||||||||||||
| Form | File No. | Exhibit | Filing Date | |||||||||||||||||||
| 10.23* |
Offer Letter dated April 27, 2012 by and between Immersion Corporation and Paul Norris. | 8-K | 000-27969 | 10.2 | May 3, 2012 | |||||||||||||||||
| 10.24* |
Retention and Ownership Change Event Agreement dated May 11, 2012 by and between Immersion Corporation and Paul Norris. | 10-Q | 000-27969 | 10.2 | August 7, 2012 | |||||||||||||||||
| 10.25# |
Amended and Restated License Agreement by and between Immersion Software Ireland Limited, Immersion Corporation, and Samsung Electronics Co., Ltd. Entered into as of January 1, 2013. | 10-Q/A | 000-27969 | 10.1 | August 23, 2013 | |||||||||||||||||
| 10.26 |
Amendment No. 1, Effective as of August 1, 2013, to Amended and Restated License Agreement by and between Immersion Software Ireland Limited, Immersion Corporation, and Samsung Electronics Co., Ltd. Entered into as of January 1, 2013. | 10-Q | 000-27969 | 10.1 | November 6, 2013 | |||||||||||||||||
| 10.27* |
Letter Agreement dated September 26, 2012 between the Company and Dennis Sheehan | 10-K | 000-27969 | 10.28 | February 27, 2014 | |||||||||||||||||
| 10.28 |
Amendment No. 2, Effective as of January 1, 2013, to Amended and Restated License Agreement by and between Immersion Software Ireland Limited, Immersion Corporation, and Samsung Electronics Co., Ltd. Entered into as of March 19, 2014. | 10-Q | 000-27969 | 10.1 | May 6, 2014 | |||||||||||||||||
| 10.29* |
2011 Equity Incentive Plan (incorporated by reference to Annex A of Schedule 14A, File No. 000-27969, filed on April 22, 2014). | 10-Q | 000-27969 | 10.1 | August 1, 2014 | |||||||||||||||||
| 10.30 |
Revised Offer Letter dated October 27, 2014 by and between Immersion Corporation and Dennis Sheehan | 8-K | 000-27969 | 99.1 | October 30, 2014 | |||||||||||||||||
| 10.31 |
Amendment No. 3, Effective as of January 1, 2013, to Amended and Restated License Agreement by and between Immersion Software Ireland Limited, Immersion Corporation, and Samsung Electronics Co., Ltd. entered into as of August 14, 2014. | 10-Q | 000-27969 | 10.1 | October 31, 2014 | |||||||||||||||||
| 10.32 |
First Amendment to Office Lease dated November 12, 2014 by and between Immersion Corporation and BSREP Rio Robles LLC | 8-K | 000-27969 | 10.1 | November 14, 2014 | |||||||||||||||||
| 10.33* |
Offer Letter dated December 19, 2013 by and between Immersion Corporation and Jason Patton. | X | ||||||||||||||||||||
82
Table of Contents
| Exhibit Number |
Exhibit Description |
Incorporated by Reference | Filed Herewith |
|||||||||||
| Form | File No. | Exhibit | Filing Date | |||||||||||
| 10.34* |
Offer Letter dated November 24, 2014 by and between Immersion Corporation and Mahesh Sundaram. | X | ||||||||||||
| 21.1 |
Subsidiaries of ImmersionCorporation. | X | ||||||||||||
| 23.1 |
Consent of Independent Registered Public Accounting Firm. | X | ||||||||||||
| 31.1 |
Certification of Victor Viegas, Chief Executive Officer, pursuant to Section 302 of the Sarbanes-Oxley Act of 2002. | X | ||||||||||||
| 31.2 |
Certification of Paul Norris, Chief Financial Officer, pursuant to Section 302 of the Sarbanes-Oxley Act of 2002. | X | ||||||||||||
| 32.1+ |
Certification of Victor Viegas, Chief Executive Officer, pursuant to Section 906 of the Sarbanes-Oxley Act of 2002. | X | ||||||||||||
| 32.2+ |
Certification of Paul Norris, Chief Financial Officer, pursuant to Section 906 of the Sarbanes-Oxley Act of 2002. | X | ||||||||||||
| 101.INS |
XBRL Report Instance Document | X | ||||||||||||
| 101.SCH |
XBRL Taxonomy Extension Schema Document | X | ||||||||||||
| 101.CAL |
XBRL Taxonomy Calculation Linkbase Document | X | ||||||||||||
| 101.DEF |
XBRL Taxonomy Extension Definition Linkbase Document | X | ||||||||||||
| 101.LAB |
XBRL Taxonomy Label Linkbase Document | X | ||||||||||||
| 101.PRE |
XBRL Presentation Linkbase Document | X | ||||||||||||
| # | Certain information has been omitted and filed separately with the Commission. Confidential treatment has been granted with respect to the omitted portions. |
| * | Constitutes a management contract or compensatory plan. |
| + | This certification is deemed not filed for purposes of section 18 of the Exchange Act, as amended, or otherwise subject to the liability of that section, nor shall it be deemed incorporated by reference into any filing under the Securities Act, as amended, or the Exchange Act, as amended. |
83
Table of Contents
Pursuant to the requirements of Section 13 or 15(d) of the Exchange Act, the Registrant has duly caused this Report to be signed on its behalf by the undersigned thereunto duly authorized.
Date: February 27, 2015
| IMMERSION CORPORATION | ||
| By |
/s/ PAUL NORRIS | |
| Paul Norris | ||
| Chief Financial Officer and Principal Accounting Officer | ||
POWER OF ATTORNEY
KNOW ALL PERSONS BY THESE PRESENTS, that each person whose signature appears below constitutes and appoints Victor Viegas and Paul Norris, jointly and severally, his or her attorney-in-fact, each with the power of substitution, for him or her in any and all capacities, to sign any amendments to this Annual Report on Form 10-K and to file the same, with exhibits thereto and other documents in connection therewith, with the Securities and Exchange Commission, hereby ratifying and confirming all that each of said attorneys-in-fact, or his or her substitute or substitutes, may do or cause to be done by virtue thereof.
Pursuant to the requirements of the Securities Exchange Act of 1934, this Annual Report on Form 10-K has been signed below by the following persons on behalf of the Registrant and in the capacities and on the dates indicated.
| Name |
Title |
Date | ||
| /S/ VICTOR VIEGAS Victor Viegas |
Chief Executive Officer and Director (Principal Executive Officer) | February 27, 2015 | ||
| /S/ PAUL NORRIS Paul Norris |
Chief Financial Officer (Principal Financial Officer and Principal Accounting Officer) |
February 27, 2015 | ||
| /s/ CARL SCHLACHTE Carl Schlachte |
Director |
February 27, 2015 | ||
| /S/ JACK SALTICH Jack Saltich |
Director |
February 27, 2015 | ||
| /S/ DAVID HABIGER David Habiger |
Director |
February 27, 2015 | ||
| /S/ DAVID SUGISHITA David Sugishita |
Director |
February 27, 2015 | ||
| /S/ JOHN VESCHI John Veschi |
Director |
February 27, 2015 | ||
84
Table of Contents
SCHEDULE II
VALUATION AND QUALIFYING ACCOUNTS
| Balance at Beginning of Period |
Charged to Costs and Expenses |
Deductions/ Write-offs (Recoveries) |
Balance at End of Period |
|||||||||||||
| (In thousands) | ||||||||||||||||
| Year ended December 31, 2014 |
||||||||||||||||
| Allowance for doubtful accounts |
$ | 9 | $ | 16 | $ | (3 | ) | $ | 28 | |||||||
| Year ended December 31, 2013 |
||||||||||||||||
| Allowance for doubtful accounts |
$ | 134 | $ | 8 | $ | 133 | $ | 9 | ||||||||
| Year ended December 31, 2012 |
||||||||||||||||
| Allowance for doubtful accounts |
$ | 21 | $ | 113 | $ | 0 | $ | 134 | ||||||||
85