Attached files
| file | filename |
|---|---|
| EX-31.2 - EX-31.2 - HFF, Inc. | d850459dex312.htm |
| EX-23.1 - EX-23.1 - HFF, Inc. | d850459dex231.htm |
| EX-31.1 - EX-31.1 - HFF, Inc. | d850459dex311.htm |
| EX-32.1 - EX-32.1 - HFF, Inc. | d850459dex321.htm |
| EX-10.13 - EX-10.13 - HFF, Inc. | d850459dex1013.htm |
| EX-10.12 - EX-10.12 - HFF, Inc. | d850459dex1012.htm |
| EX-10.15 - EX-10.15 - HFF, Inc. | d850459dex1015.htm |
| EX-10.14 - EX-10.14 - HFF, Inc. | d850459dex1014.htm |
| EXCEL - IDEA: XBRL DOCUMENT - HFF, Inc. | Financial_Report.xls |
Table of Contents
UNITED STATES SECURITIES AND EXCHANGE COMMISSION
Washington, D.C. 20549
Form 10-K
(Mark One)
| þ | ANNUAL REPORT PURSUANT TO SECTION 13 OR 15(d) OF THE SECURITIES EXCHANGE ACT OF 1934 |
For the fiscal year ended December 31, 2014
OR
| ¨ | TRANSITION REPORT PURSUANT TO SECTION 13 OR 15(d) OF THE SECURITIES EXCHANGE ACT OF 1934 |
For the transition period from to
Commission file number: 001-33280
HFF, INC.
(Exact name of registrant as specified in its charter)
| Delaware | 51-0610340 | |
| (State of incorporation) | (I.R.S. Employer Identification No.) | |
| One Oxford Centre 301 Grant Street, Suite 1100 Pittsburgh, Pennsylvania 15219 |
(412) 281-8714 | |
| (Address of principal executive offices, including zip code) |
(Registrant’s telephone number, including area code) | |
Securities registered pursuant to Section 12(b) of the Act:
| Title of Each Class |
Name of Exchange on Which Registered | |
| Class A Common Stock, par value $.01 per share | New York Stock Exchange |
Securities registered pursuant to Section 12(g) of the Act:
NONE
Indicate by check mark if the registrant is a well-known seasoned issuer, as defined in Rule 405 of the Securities Act. Yes ¨ No þ
Indicate by checkmark if the registrant is not required to file reports pursuant to Section 13 or Section 15(d) of the Act. Yes ¨ No þ
Indicate by check mark whether the registrant (1) has filed all reports required to be filed by Sections 13 or 15(d) of the Securities Exchange Act of 1934 during the preceding 12 months (or for such shorter period that the registrant was required to file such reports), and (2) has been subject to such filing requirements for the past 90 days. Yes þ No ¨
Indicate by check mark whether the registrant has submitted electronically and posted on its corporate Web site, if any, every Interactive Data File required to be submitted and posted pursuant to Rule 405 of Regulation S-T (§ 232.405 of this chapter) during the preceding 12 months (or for such shorter period that the registrant was required to submit and post such files). Yes þ No ¨
Indicate by check mark if disclosure of delinquent filers pursuant to Item 405 of Regulation S-K (§ 229.405) is not contained herein, and will not be contained, to the best of the registrant’s knowledge, in definitive proxy or information statements incorporated by reference in Part III of this Form 10-K or any amendment to this Form 10-K. ¨
Indicate by check mark whether the registrant is a large accelerated filer, an accelerated filer, a non-accelerated filer, or a smaller reporting company. See the definitions of “large accelerated filer,” “accelerated filer” and “smaller reporting company” in Rule 12b-2 of the Exchange Act. (Check one):
|
Large accelerated filer þ Accelerated filer ¨ Non-accelerated filer ¨ Smaller reporting company ¨ | ||
| (Do not check if a smaller reporting company) | ||
Indicate by checkmark whether the registrant is a shell company (as defined in Exchange Act Rule 12b-2). Yes ¨ No þ
As of February 20, 2015, there were 37,677,981 shares of Class A common stock, par value $0.01 per share, of the registrant outstanding.
The aggregate market value of the registrant’s voting stock held by non-affiliates at June 30, 2014 was approximately $1.3 billion, based on the closing price per share of Class A common stock on that date of $37.19 as reported on the New York Stock Exchange. Shares of common stock known by the registrant to be beneficially owned by directors and officers of the registrant subject to the reporting and other requirements of Section 16 of the Securities Exchange Act of 1934 are not included in the computation. The registrant, however, has made no determination that such persons are “affiliates” within the meaning of Rule 12b-2 under the Securities Exchange Act of 1934.
DOCUMENTS INCORPORATED BY REFERENCE
Selected portions of the Proxy Statement for the 2015 Annual Meeting of Stockholders are incorporated by reference into Part III of this Report.
Table of Contents
i
Table of Contents
FORWARD-LOOKING STATEMENTS
This Annual Report on Form 10-K contains forward-looking statements, which reflect our current views with respect to, among other things, our operations and financial performance. You can identify these forward-looking statements by the use of words such as “outlook,” “believes,” “expects,” “potential,” “continues,” “may,” “will,” “should,” “seeks,” “approximately,” “predicts,” “intends,” “plans,” “estimates,” “anticipates” or the negative version of these words or other comparable words. Such forward-looking statements are subject to various risks and uncertainties. Accordingly, there are or will be important factors that could cause actual outcomes or results to differ materially from those indicated in these statements. We believe these factors include, but are not limited to, those described under the caption “Risk Factors” in this Annual Report on Form 10-K. These factors should not be construed as exhaustive and should be read in conjunction with the other cautionary statements that are included in this Annual Report on Form 10-K. We undertake no obligation to publicly update or review any forward-looking statement, whether as a result of new information, future developments or otherwise.
SPECIAL NOTE REGARDING THE REGISTRANT
In connection with our initial public offering, we effected a reorganization of our business into a holding company holding the partnership interests in Holliday Fenoglio Fowler, L.P. and HFF Securities L.P. (together, the “Operating Partnerships”), held through the wholly owned subsidiary HFF Partnership Holdings, LLC, a Delaware limited liability company and all of the outstanding shares of Holliday GP Corp. (“Holliday GP”), the sole general partner of each of the Operating Partnerships. The transactions that occurred in connection with the initial public offering and reorganization are referred to as the “Reorganization Transactions.”
Unless the context otherwise requires, references to (1) “HFF Holdings” refer solely to HFF Holdings LLC, a Delaware limited liability company that was previously the holding company for our consolidated subsidiaries, and not to any of its subsidiaries, (2) “HFF LP” refer to Holliday Fenoglio Fowler, L.P., a Texas limited partnership, (3) “HFF Securities” refer to HFF Securities L.P., a Delaware limited partnership and registered broker-dealer, (4) “Holliday GP” refer to Holliday GP Corp., a Delaware corporation and the general partner of HFF LP and HFF Securities, (5) “HoldCo LLC” refer to HFF Partnership Holdings LLC, a Delaware limited liability company and a wholly-owned subsidiary of HFF, Inc. and (6) “Holdings Sub” refer to HFF LP Acquisition LLC, a Delaware limited liability company and wholly-owned subsidiary of HFF Holdings. Our business operations are conducted by HFF LP and HFF Securities, which are sometimes referred to in this Annual Report on Form 10-K as the “Operating Partnerships.” Also, except where specifically noted, references in this Annual Report on Form 10-K to “the Company,” “we” or “us” mean HFF, Inc., a Delaware corporation and its consolidated subsidiaries after giving effect to the Reorganization Transactions.
ii
Table of Contents
Overview
We are, based on transaction volume, one of the leading providers of commercial real estate and capital markets services to both the users and providers of capital in the U.S. commercial real estate industry and one of the largest full-service commercial real estate financial intermediaries in the country. We operate out of 23 offices nationwide with approximately 721 associates including approximately 277 transaction professionals. During 2014, we advised on approximately $65.0 billion of completed commercial real estate transactions, a 16.6% increase compared to the approximately $55.8 billion of completed transactions we advised on during 2013.
Our fully-integrated national capital markets platform, coupled with our knowledge of the commercial real estate markets, allows us to effectively act as a “one-stop shop” for our clients, providing a broad array of capital markets services including:
| • | Debt placement; |
| • | Investment sales; |
| • | Distressed debt and real estate owned advisory services; |
| • | Equity placement; |
| • | Investment banking and advisory services; |
| • | Loan sales; and |
| • | Commercial loan servicing. |
Substantially all of our revenues are in the form of capital markets services fees collected from our clients, usually negotiated on a transaction-by-transaction basis. We also earn fees from commercial loan servicing activities. We believe that our multiple product offerings and platform services, diverse client mix, expertise in a wide range of property types and national platform have the potential to create a diversified revenue stream within the U.S. commercial real estate sector. Our revenues and net income were $425.9 million and $61.3 million, respectively, for the year ended December 31, 2014, compared to revenues and net income of $355.6 million and $51.4 million, respectively, for the year ended December 31, 2013.
We have established strong relationships with our clients. Our clients are both users of capital, such as property owners, and providers of capital, such as lenders and equity investors. Many of our clients act as both users and providers of capital in different transactions, which enables us to leverage our existing relationships and execute multiple transactions across multiple platform services and product offerings with the same clients.
We believe we have a reputation for high ethical standards, dedicated teamwork and a strong focus on serving the interests of our clients. We take a long-term view of our business and client relationships, and our culture and philosophy are firmly centered on putting the clients’ interests first.
The situation in the global credit markets during late 2007 continuing through today, whereby many world governments (including the U.S., where the Company transacts virtually all of its business) had to take and continue to take unprecedented and uncharted steps to support the financial institutions in their respective countries from collapse was unprecedented in the Company’s history. Restrictions on the availability of capital, both debt and/or equity, during late 2007 through 2010, created significant reductions of liquidity in, and flow of capital to, many global financial markets including the commercial real estate financial markets in the U.S. In addition, such restrictions, coupled with the downturn in the U.S. economy caused commercial real estate prices
1
Table of Contents
to decrease in the U.S. While conditions in 2011 through 2014 were generally improved, unresolved global and domestic credit and liquidity issues, as well as the unresolved downturns in many of the global and domestic economies, could reduce in the future, the number of acquisitions, dispositions and loan originations, as well as the respective number of transactions and transaction volumes in the markets which the Company competes. Further detail regarding the effect of the recent situation in the credit markets and the commercial real estate markets can be found under the headings “Risk Factors” and “Management’s Discussion and Analysis of Financial Conditions and Results of Operations” in this Annual Report on Form 10-K.
HFF, Inc. is a Delaware corporation with its principal executive offices located at 301 Grant Street, One Oxford Centre, Suite 1100, Pittsburgh, Pennsylvania, 15219, telephone number (412) 281-8714.
Reportable Segments
We operate in one reportable segment, the commercial real estate financial intermediary segment, and offer debt placement, investment sales, distressed debt and real estate owned advisory services, equity placement, investment banking and advisory services, loan sales and commercial loan servicing.
Our Competitive Strengths
We attribute our success and distinctiveness to our ability to leverage a number of key competitive strengths, including:
People, Expertise and Culture
We and our predecessor companies have been in the commercial real estate business for over 30 years, and our transaction professionals have significant experience and long-standing relationships with our clients. We employ approximately 277 transaction professionals with an average of 16.9 years of commercial real estate transaction experience. The transaction history accumulated among our transaction professionals ensures a high degree of market knowledge on a macro level, knowledge of commercial real estate markets, long term relationships with the most active investors and a comprehensive understanding of commercial real estate capital markets products. Our employees come from a wide range of real estate related backgrounds, including investment advisors and managers, investment bankers, attorneys, brokers and mortgage bankers.
Our culture is governed by our commitment to high ethical standards, putting the clients’ interests first and treating clients and our own associates fairly and with respect. These distinctive characteristics of our culture are highly evident in our ability to retain and attract employees. The average tenure for our senior transaction professionals is 12.8 years, and the average production tenure for the top 25 senior transaction professionals compiled by initial leads during the last five years was 14.8 years (including tenure with predecessor companies). Furthermore, several of our senior transaction professionals have a personal economic interest in our firm, which further aligns their individual interests with those of the Company and its stockholders, as a whole, and our clients.
Integrated Capital Markets Services Platform
In the competitive commercial real estate and capital markets industry, we believe one of our key differentiators is our ability to analyze all commercial real estate product types and markets as well as our ability to provide clients with comprehensive analysis, advice and execution expertise on all types of debt and equity capital markets solutions. We believe that due to our broad range of execution capabilities, our clients rely on us not only to provide capital markets alternatives but, more importantly, to advise them on how to optimize value by uncovering inefficiencies in the non-public capital markets to maximize their commercial real estate investments. We believe our capabilities provide our clients with the flexibility to pursue multiple capital markets options simultaneously so that, upon conclusion of our efforts, they can choose the best risk-adjusted based solution.
2
Table of Contents
Independent Objective Advice
Unlike many of our competitors, we do not currently offer services that compete with services provided by our clients such as leasing or property management, nor do we currently engage in principal capital investing activities which would compete with a number of our clients. We believe this allows us to offer independent objective advice to our clients. We believe our independence distinguishes us from our competitors, enhances our reputation in the market and allows us to retain and expand our client base.
Extensive Cross-Selling Opportunities
As some participants in the commercial real estate market are frequently buyers, sellers, lenders and borrowers at various times, we believe our relationships with these participants across all aspects of their businesses provide us with multiple revenue opportunities throughout the life cycle of their commercial real estate investments. In addition, we sometimes provide more than one service in a particular transaction, such as in an investment sale where we not only represent the seller of a commercial real estate investment but also represent the buyer in arranging acquisition financing. In 2014, 2013 and 2012, we executed multiple transactions across multiple platform services with 23, 24 and 20, respectively, of our top 25 clients.
Broad and Deep Network of Relationships
We have developed broad and deep-standing relationships with the users and providers of capital in the industry and have completed multiple transactions for many of the top institutional commercial real estate investors in the U.S. as well as several global investors who invest in the U.S. Importantly, our transaction professionals, analysts and closing specialists foster relationships with their respective counterparts within each client’s organization. This provides, in our opinion, a deeper relationship with our firm relative to our competitors. In 2014 and 2013, no one borrower or no one seller client, represented more than 4% of our total capital markets services revenues. The combined fees from our top 10 seller clients for the years 2014 and 2013, were less than 12% of our capital markets services revenues for each year, and the combined fees from our top 10 borrower clients were less than 6% of our capital markets services revenues for each year.
Proprietary Transaction Database
We believe that the extensive volume of commercial real estate transactions that we advise on throughout the U.S. and across multiple property types and capital markets service lines provides our transaction professionals with valuable, real-time market information. We maintain a proprietary database on numerous capital sources and clients and potential capital sources and clients and databases that track key terms and provisions of the majority of all closed and pending transactions for which we are involved as well as historical and current flows and the pricing of debt, structured finance, investment sales, loan sales and equity transactions. Included in the databases are real-time quotes and bids on pipeline transactions, status reports on all current transactions as well as historical information on clients, lenders and buyers. Furthermore, our internal databases maintain current and historical information on our loan servicing portfolio, which we believe enables us to track real-time property level performance and market trends. These internal databases are updated regularly and are available to our transaction professionals, analysts and other internal support groups to share client contact information and real-time market information. We believe this information strengthens our competitive position by enhancing the advice we provide to clients and improving the probability of successfully closing a transaction. We believe our associates also understand the confidential nature of this information, and if it is misused, depending on the circumstances, such misuse can be cause for immediate dismissal from the Company.
3
Table of Contents
Our Strategic Growth Plan
We seek to improve our market position by focusing on the following strategic growth initiatives:
Increase Market Share Across Each of our Capital Markets Services
We believe that we have the opportunity to increase our market share in each of the various capital markets services we provide to our clients by penetrating deeper into our national, regional and local client relationships. We also intend to increase our market share by selectively hiring transaction professionals in our existing offices and in new locations, predicated on finding the most experienced professionals in the market who have the highest integrity, work ethic and reputation, while fitting into our culture and sharing our business philosophy and business practices. Since 2011, in addition to opening offices in Tampa, FL, Austin, TX, Denver, CO, Orlando, FL, Philadelphia, PA and most recently, Charlotte, NC (July 2014), we have significantly added to the platform services and product specialty types in a majority of our offices.
| • | Debt Placement. In 2014, our transaction volume in debt placements was approximately $32.1 billion, an increase of 15.7% from approximately $27.8 billion in 2013. |
| • | Investment Sales. In 2014, we completed investment sales of approximately $29.0 billion, an increase of approximately 11.9% from the approximately $25.9 billion completed in 2013. According to Real Capital Analytics, commercial real estate sales volume for office, industrial, multifamily, retail, hotel properties and land in the U.S. in 2014 and 2013 were $424 billion and $362 billion, respectively. |
| • | Equity Placement and Advisory Services. In 2014, we completed approximately $3.6 billion of equity placement and advisory services transactions (which include amounts that we internally allocate to the structured finance reporting category, even though the transaction may have been funded through a single mortgage note) for our clients, representing an increase of 147.2% from the $1.5 billion completed in 2013. |
| • | Private Equity and Investment Banking and Advisory Services. Our broker-dealer subsidiary, HFF Securities, undertakes both discretionary and non-discretionary private equity raises, select property specific joint ventures and select investment banking activities for our clients. At December 31, 2014 and 2013, we had $3.1 billion and $1.6 billion of active private equity discretionary fund transactions on which HFF Securities was engaged, which may result in additional future revenue. |
| • | Loan Sales. We have consummated $0.2 billion and $0.6 billion in loan sales transactions in 2014 and 2013, respectively, a decrease of 61.4%. This business is based on the desire of lenders seeking to diversify concentration risk (geographic, borrower or product type), manage potential problems in their loan portfolios or sell loans rejected from commercial-mortgage backed securities (CMBS) securitization pools. |
| • | Loan Servicing. The principal balance of HFF’s loan servicing portfolio increased 19.0% to approximately $39.3 billion at December 31, 2014 from approximately $33.1 billion at December 31, 2013. We currently have approximately 31 correspondent lender relationships with life insurers. |
While the volume increases relating to our debt placement, investment sales, and loan servicing services referenced above were principally the effect of improved market conditions and increased activity in the commercial real estate market, we believe that our efforts to open new offices and expand our platform services and product specialties have also aided us in our achievements.
Continue to Capitalize on Cross-Selling Opportunities
Participants in the commercial real estate market increasingly are buyers, sellers, lenders and borrowers at various times. We believe our relationships with these participants across all aspects of their businesses provide us with multiple revenue opportunities throughout the life cycle of their commercial real estate investments.
4
Table of Contents
Many of our clients are both users and providers of capital, and our goal is to attempt to work with our clients to execute transactions throughout the U.S. utilizing the wide spectrum of our services. By maintaining close relationships with these clients, we believe we will continue to generate significant repeat business across all of our business lines.
Our debt transaction professionals originated approximately $5.8 billion and $4.2 billion of debt for clients that purchased properties sold by our investment sales professionals for their clients in 2014 and 2013, respectively. Our investment sales professionals also referred clients to our debt transaction professionals who arranged debt financings totaling approximately $4.4 billion and $3.3 billion in 2014 and 2013, respectively. Our debt transaction professionals also referred clients to our investment sales transaction professionals who sold approximately $6.0 billion and $5.6 billion of properties in 2014 and 2013, respectively. Also, in 2014 and 2013, our subsidiary HFF Securities originated debt volumes of approximately $204.8 million and $170.4 million, respectively, in addition to its other equity placement activities.
Expand Our Geographic Footprint
We believe that opportunities exist to strategically establish and increase our presence in several key domestic, and potentially international, markets. When strategic opportunities present themselves with high quality transaction professionals, it is our intention to capitalize on such opportunities as we recently did in Charlotte, NC in July 2014, Philadelphia, PA in December 2013, Denver, CO in January 2012 and Orlando, FL in May 2012. While our transactional professionals, located in 23 offices throughout the U.S., advised clients on transactions in 44 states (and the District of Columbia) and in more than 630 cities in 2014, there are a number of major metropolitan areas where we do not maintain an office. We have no overseas offices, but do, on a periodic basis, send our transaction professionals overseas to meet with capital sources and global clients. By comparison, a number of our large public competitors have in excess of 100 offices worldwide and some have nearly 100 in the U.S alone. We constantly review key demand drivers of commercial real estate by market, including growth in population, households, employment, commercial real estate inventory by product type, and new construction. By doing so, we can determine not only where future strategic growth should occur, but more importantly, we can also ensure our transaction professionals are constantly calling on the most attractive markets where we do not have offices. Since 2011, we have opened offices in Tampa, FL, Austin, TX Denver, CO and Orlando, FL, Philadelphia, PA and most recently, Charlotte, NC. In addition, during this same period, we have significantly added to the platform services and product specialties in nearly all of our offices.
We expect to achieve future strategic geographic expansion through a combination of recruitment of key transaction professionals, organic growth of analysts to transaction professionals and possible acquisitions of smaller local and regional firms across all services in both new and existing markets as well as the possible expansion into other platform lines of business and product specialties. However, in all cases, our strategic growth will be focused on serving our clients’ interests and predicated on finding the most experienced professionals in the market who have the highest integrity, work ethic and reputation, while fitting into our culture and sharing our business philosophy and business practices.
Align our Leadership and Compensation Structures with Our Long-term Growth
Under the management and leadership structure for our Operating Partnerships that we adopted in December 2010, each Operating Partnership’s existing operating committee was replaced with an executive committee (including ad-hoc members) and a leadership committee which includes in excess of fifty of our senior transaction professionals and managers, which includes the executive committee members. The executive committee for each partnership consists of at least three, but no more than seven, individuals (in addition to ad-hoc members), one of whom is the managing member of the Operating Partnerships. The executive committee currently consists of our two inside directors, Mark Gibson, our chief executive officer, and Jody Thornton, our president and managing member of the Operating Partnerships, and four of our executive managing directors, H. Scott Galloway, Matthew D. Lawton, Gerard T. Sansosti and Manuel A. de Zarraga. The executive committee
5
Table of Contents
is primarily responsible for the day-to-day oversight of the Operating Partnerships’ lines of business and property verticals. The leadership committee is composed of (i) the executive committee members, (ii) individual leaders chosen from each line of business and property vertical, (iii) the office heads from each office and (iv) individuals from other line and support functions at the discretion of the executive committee. The members of the leadership committee are responsible for either overseeing their respective lines of business, property verticals or their office as well as facilitating communication and educating all of our transaction professionals within each office, each line of business and each of the property and/or product specialties to better serve our clients. On November 12, 2013, the board appointed Mr. Gibson as chief executive officer and Mr. Thornton as president of the Company and managing member of the Operating Partnerships, effective April, 1, 2014.
We also aim to ensure continued emphasis on annual production, maintain our partnership culture and continue the alignment of employee, management and stockholder interests through periodic omnibus awards to individuals if the situation warrants and through our profit participation bonus plans. Under our HFF LP and HFF Securities profit participation bonus plans, with respect to each applicable office for each calendar year, if a 14.5% or greater profit margin is generated by such office, an amount equal to 15% of the adjusted operating income (as defined under such plan) generated by such office funds a cash bonus pool payable to selected employees of HFF LP or HFF Securities, as the case may be. These plans were adopted in 2007 in connection with our initial public offering. In December 2010, we amended these plans to provide that our board of directors, or any appropriate committee thereof, may elect to pay up to one-third of the profit participation bonuses payable under the plans in the form of equity-based awards. In December 2010, we also adopted a new HFF, Inc. firm profit participation bonus plan utilized primarily to compensate our business line and property vertical leadership. Under this plan, for each calendar year, if we achieve a 17.5% or greater adjusted operating income margin (as defined under such plan), a bonus pool will be funded by a percentage, ranging from 15% to 25%, of our adjusted operating income (as defined under such plan) beyond predefined adjusted operating income margin thresholds. Our board of directors, or an appropriate committee thereof, may elect to pay up to two-thirds of the profit participation bonuses payable under this plan in the form of equity-based awards.
Our Services
Debt Placement Services
We offer our clients access to a complete range of debt instruments, including construction and construction/mini-permanent loans, adjustable and fixed rate mortgages, entity level debt, mezzanine debt, forward delivery loans, tax exempt financing and sale/leaseback financing.
Our clients are owners of various types of property, including but not limited to office including medical office related product, retail, industrial, hotel, multi-housing, student housing, self-storage, senior living, independent living, assisted living, nursing homes, condominiums and condominium conversions, mixed-use properties and land. Our clients range in size from individual entrepreneurs who own a single property to the largest real estate funds and institutional property owners throughout the world who invest globally, especially in the United States. Debt is or has been placed with major capital funding sources, both domestic and foreign, including life insurance companies, CMBS conduits, investment banks, commercial banks, thrifts, agency lenders, pension funds, pension fund advisors, real estate investment trusts (REITs), credit companies, opportunity funds and individual investors.
Investment Sales Services
We provide investment sales services to commercial real estate owners who are seeking to sell one or more properties or property interests. We seek to maximize proceeds and certainty of closure for our clients through our knowledge of the commercial real estate and capital markets, our extensive database of potential buyers, many of whom we have deep and long-standing relationships, and our experienced transaction professionals. We believe the real time data on comparable transactions, recent financings of similar assets and market trends
6
Table of Contents
enable our transaction professionals to better advise our clients on valuation and certainty of execution based on a prospective buyer’s proposed capital structure and track record for closing transactions.
Equity Placement and Private Equity Services
We offer a wide array of equity placement and private equity alternatives and solutions at both the property and ownership entity level. We believe this allows us to provide financing alternatives at every level of the capital structure, including mezzanine and preferred equity, thereby providing potential buyers and existing owners with the highest appropriate leverage at the lowest blended cost of capital to purchase properties or recapitalize existing ones versus an out-right sale alternative. By focusing on the inefficiencies in the equity placement capital markets, such as mezzanine, preferred equity, participating and/or convertible debt structures, pay and accrual debt structures, pre-sales, stand-by commitments and partial interest sales bridge loans, we believe we are able to access capital for stabilized properties or properties in transition, with predevelopment and/or joint ventures and/or structured debt and/or equity transactions, which provide maximum flexibility for our clients.
Private Equity, Investment Banking and Advisory Services
Through HFF Securities, our licensed broker-dealer subsidiary, we offer our clients the ability to access the private equity markets for an identified commercial real estate asset and discretionary private equity funds, joint ventures, entity-level private placements and advisory services as well as structured finance services. HFF Securities’ services to its clients can include:
| • | Joint Ventures. Equity capital for our commercial real estate clients to establish joint ventures relating to either identified properties or properties to be acquired by a fund sponsor. These joint ventures typically involve the acquisition, development, recapitalization or restructuring of multi-asset commercial real estate portfolios, and include a variety of property types and geographic areas. |
| • | Private Placements. Private placements of common, perpetual preferred and convertible preferred securities. Issuances can involve primary or secondary shares that may be publicly registered, listed and traded. |
| • | Advisory Services. Entity-level advisory services for various types of transactions including mergers and acquisitions, sales and divestitures, management buyouts, and recapitalizations and restructurings. |
| • | Marketing and Fund-Raising. Institutional marketing and fund-raising for public and private commercial real estate companies, with a focus on opportunity and value-added commercial real estate funds. In this capacity, we undertake private equity raises, both discretionary and non-discretionary, and offer advisory services. |
Loan Sales
We assist our clients in their efforts to sell all or portions of their commercial real estate debt note portfolios, which can include performing, non-performing and distressed debt and/or real estate owned properties.
Commercial Loan Servicing
We provide commercial loan servicing (primary and sub-servicing) for life insurance companies, Federal Home Loan Mortgage Corporation (Freddie Mac), Federal National Mortgage Association (Fannie Mae) through strategic relationships with several delegated underwriting and servicing (DUS®) lenders, CMBS originators, mortgage REITS and debt funds, groups that purchase performing and/or non-performing loans as well as owners who sell commercial real estate subject to a purchase money mortgage. Additionally, we are a rated CMBS primary and special servicer by Fitch Ratings. The primary servicer rating reflects our experienced and tenured
7
Table of Contents
management and staff and our long history as a commercial mortgage primary servicer, including with respect to Freddie Mac and CMBS servicing. The special servicer rating is based on our ability to work out, manage and resolve commercial mortgage loans and real estate owned (REO) assets. We believe our servicing platform, experienced personnel and hands-on service allow us to maintain close contact with both borrowers and lenders, and as a result, we are often the first point of contact in connection with refinancing, restructuring or sale of commercial real estate assets. Revenue is earned primarily from servicing fees charged to the lender.
To avoid potential conflicts, our transaction professionals do not directly share in servicing revenue, eliminating conflicts which can occur with serviced versus non-serviced lenders, but they can be compensated, in part for this as well as other activities, through the office profit participation plan, if available and applicable, at the discretion of the office heads in our respective offices. However, throughout the servicing life of a loan, the transaction professional who originated the loan usually remains the main contact for both the borrower and lender, or the master and/or special servicer, as the case may be, to assist our servicing group with annual inspections, operating statement reviews and other major servicing issues affecting a property or properties and in some circumstances, may be compensated for services rendered.
Competition
The commercial real estate services industry, and all of the services that we provide, are highly competitive, and we expect them to remain so. We compete on a national, regional, local basis and in some cases an international basis, as well as on a number of other critical factors, including but not limited to the quality of our people and client service, historical track record and expertise and range of services and execution skills, absence of conflicts and business reputation. Depending on the product or service, we face competition from other international and domestic commercial real estate service providers, institutional lenders, banks and savings and loans, CMBS conduits, insurance companies, investment banking firms, investment managers and accounting firms, some of which may have greater financial resources than we do. Top competitors we face on national, regional and local levels including but not limited to CBRE Capital Markets, Cushman & Wakefield, Eastdil Secured (owned by Wells Fargo), Jones Lang LaSalle, Colliers, Cassidy Turley, Walker Dunlop, Marcus & Milichap, Newmark/Frank, Northmarq Capital (Marquette), Meridian and Berkadia, etc. There are numerous other local and regional competitors in each of the local markets where we are located as well as the markets in which we do business.
Competition to attract and retain qualified employees is also intense in each of the capital markets services we provide our clients. We compete by offering what we believe to be competitive compensation packages to our transaction professionals and our other associates as well as equity-based incentives including but not limited to our office and firm profit participation plans for key associates who lead our efforts in terms of running our offices or lead our efforts in each of our capital markets services and product specialties as well as through periodic omnibus awards to individuals if the situation warrants. Our ability to continue to compete effectively will depend upon our ability to retain, motivate and compensate appropriately our existing transaction professionals and other key associates as well as our ability to attract new ones, all predicated on finding the most experienced professionals in the market who have the highest integrity, work ethic and reputation, while fitting into our culture and sharing our philosophy and business practices.
Regulation
Our U.S. broker-dealer subsidiary, HFF Securities, is subject to regulation. HFF Securities is currently registered as a broker-dealer with the Securities and Exchange Commission (SEC) and the Financial Industry Regulatory Authority (FINRA). HFF Securities is registered as a broker-dealer in 19 states. HFF Securities is subject to regulations governing effectively every aspect of the securities business, including the effecting of securities transactions, minimum capital requirements, record-keeping and reporting procedures, relationships with customers, experience and training requirements for certain employees and business procedures with firms that are not subject to regulatory controls. Violation of applicable regulations can result in the revocation of
8
Table of Contents
broker-dealer licenses, the imposition of censures or fines and the suspension, expulsion or other disciplining of a firm, its officers or employees.
Our broker-dealer subsidiary is also subject to the SEC’s uniform net capital rule, Rule 15c3-1, which may limit our ability to make withdrawals of capital from our broker-dealer subsidiary. The uniform net capital rule sets the minimum level of net capital a broker-dealer must maintain and also requires that a portion of its assets be relatively liquid. FINRA may prohibit a member firm from expanding its business or paying cash dividends if resulting net capital falls below its requirements. In addition, our broker-dealer subsidiary is subject to certain notification requirements related to withdrawals of excess net capital. The USA Patriot Act of 2001 also imposes obligations regarding the prevention and detection of money-laundering activities, including the establishment of customer due diligence and other compliance policies and procedures, and procedures for customer verification. Failure to comply with these requirements may result in monetary, regulatory and, in the case of the USA Patriot Act, criminal penalties.
HFF LP is licensed (in some cases, through our employees or its general partner) as a mortgage broker and a real estate broker in multiple jurisdictions. Generally we are licensed in each state where we have an office as well as where we frequently do business.
Seasonality
We believe our capital markets services revenue is typically seasonal. Historically, we believe during normal economic and capital markets conditions, this seasonality has caused our revenue, operating income, net income and cash flows from operating activities to be lower in the first six months of the year and higher in the second half of the year. We believe the concentration of earnings and cash flows in the last six months of the year has historically been due to an industry-wide focus of clients to complete transactions towards the end of the calendar year. However this historical pattern of seasonality may or may not continue.
Employees
Our total employment was 721 employees as of December 31, 2014, which represents a 13.2% increase from the December 31, 2013 total employment of 637 employees.
History
We have grown through the combination of several prominent commercial real estate brokerage firms. Our namesake dates back to Holliday Fenoglio & Company, which was founded in Houston in 1982. Although our predecessor companies date back to the 1970s, our recent history began in 1994 when Holliday Fenoglio Dockerty & Gibson, Inc. was purchased by AMRESCO, Inc. to create Holliday Fenoglio Inc. In 1998, Holliday Fenoglio, Inc. acquired Fowler Goedecke Ellis & O’Connor to create Holliday Fenoglio Fowler, L.P. Later that year Holliday Fenoglio Fowler, L.P. acquired PNS Realty Partners, LP and Vanguard Mortgage.
In March 2000, AMRESCO sold select assets including portions of its commercial mortgage banking businesses, Holliday Fenoglio Fowler, L.P., to Lend Lease (US) Inc., the U.S. subsidiary of the Australian real estate services company. In June 2003, HFF Holdings completed an agreement for a management buyout from Lend Lease. In April 2004, we established our broker-dealer subsidiary, HFF Securities L.P.
As previously discussed in “Special Note Regarding the Registrant,” in connection with our initial public offering of our Class A common stock in February 2007, we effected a reorganization of our business. In connection with the Reorganization Transactions, HFF, Inc. was incorporated in Delaware in November 2006 and became, and continues to be, a holding company holding partnership units in the Operating Partnerships and all of the outstanding shares of Holliday GP. Following the Reorganization Transaction and prior to August, 31, 2012, HFF Holdings and HFF, Inc., through their wholly-owned subsidiaries, were the only limited partners of
9
Table of Contents
the Operating Partnerships. During the period between November 30, 2009 and August 31, 2012, HFF Holdings exchanged all of the remaining partnership units that it held in each of the Operating Partnerships for shares of Class A common stock of the Company pursuant to the Exchange Right. Following such exchanges and continuing through the filing date of this Annual Report on Form 10-K, HFF, Inc., through its wholly-owned subsidiaries, holds 100% of the partnership units in the Operating Partnerships and is the only equity holder of the Operating Partnerships.
Available Information
Our internet website address is www.hfflp.com. The information on our internet website is not incorporated by reference in this Annual Report on Form 10-K. Our Annual Report on Form 10-K, Quarterly Reports on Form 10-Q, Current Reports on Form 8-K, ownership reports for insiders and any amendments to these reports filed or furnished with the SEC pursuant to Section 13(a) and 15(a) of the Securities Exchange Act of 1934, as amended, are available free of charge through our internet website as soon as reasonably practicable after filing with the SEC. Additionally, we make available free of charge on our internet website:
| • | our Code of Conduct and Ethics; |
| • | the charter of the Nominating and Corporate Governing Committee of our Board of Directors; |
| • | the charter of the Compensation Committee of our Board of Directors; |
| • | the charter of the Audit Committee of our Board of Directors; and |
| • | our Corporate Governance Guidelines. |
| Item 1A. Risk | Factors |
Investing in our securities involves a high degree of risk. You should consider carefully the following risk factors and the other information in this Annual Report on Form 10-K, including our consolidated financial statements and related notes, before making any investment decisions regarding our securities. If any of the following risks actually occur, our business, financial condition and operating results could be adversely affected. As a result, the trading price of our securities could decline and you may lose part or all of your investment.
Risks Related to Our Business
General economic conditions and commercial real estate market conditions, both globally and domestically, have had and may in the future have a negative impact on our business.
We have experienced, in 2010, 2009, 2008 and previous years, and expect in the future to be negatively impacted by, periods of economic slowdowns, recessions and disruptions in the capital markets; credit and liquidity issues in the global and domestic capital markets, including international, national, regional and local markets; and corresponding declines in the demand for commercial real estate and related services within one or more of the markets in which we operate. Historically, commercial real estate markets, and in particular the U.S. commercial real estate market, have tended to be cyclical and related to the flow of capital to the sector, the condition of the economy as a whole and to the perceptions and confidence of the market participants as to the relevant economic outlook as well as the asset class. Negative economic conditions, changes in interest rates, credit and liquidity issues in the global and domestic capital markets, disruptions in capital markets and/or declines in the demand for commercial real estate and related services in international or domestic markets or in significant markets in which we do business as well as negative perceptions about the asset class, have had and could have in the future a material adverse effect on our business, results of operations and/or financial condition, as listed below. Since the latter half of 2009, there has been an improvement in the U.S. financial markets, increasing confidence and stabilization in domestic and some foreign economies as well as in select U.S. cities which has provided increasing demand for high quality core, core plus and value-add commercial real estate assets. However, we can give no assurance that the improvements in the U.S. commercial real estate market are sustainable.
10
Table of Contents
For example:
| • | Slowdowns in economic activity and/or disruptions in capital markets could cause tenant demand for space to decline, which would adversely affect the operation and income of commercial real estate properties and thereby affect investor demand and the supply of capital for debt and equity investments in commercial real estate. |
| • | Declines in the regional or local demand for commercial real estate, or significant disruptions in other segments of the real estate markets and/or capital markets, could adversely affect our results of operations. During 2014, approximately 25.0%, 12.7%, 7.8%, 6.1%, 5.0% and 5.9% of the Company’s capital markets services revenues were derived from transactions involving commercial real estate located in Texas, California, Florida, Illinois, New York and the region consisting of the District of Columbia, Maryland and Virginia, respectively. As a result, a significant portion of our business is dependent on the economic conditions in general and in certain markets for commercial real estate such as in these areas, which, like other commercial real estate markets, have experienced price volatility or economic downturns in the past. |
| • | Global and domestic credit and liquidity issues, significant fluctuations in interest rates as well as steady and protracted increases or decreases of interest rates could adversely affect the operation and income of commercial real estate properties as well as the demand from investors for commercial real estate investments. Any of these events could adversely affect investor demand and the supply of capital for debt and equity investments in commercial real estate. In particular, the lack of debt and/or equity for commercial real estate transactions, the resulting re-pricing of debt and equity risk and/or increased/decreased interest rates may reduce the number of acquisitions, dispositions and loan originations, as well as the Company’s or firm’s respective transaction volumes. These factors and events could also cause prices to decrease due to the reduced amount of financing available as well as the increased cost of obtaining financing, and could lead to a decrease in purchase and sale activity and therefore a decrease in revenue to the Company. |
| • | Significant disruptions or changes in capital market flows, as well as credit and liquidity issues in the global and domestic capital markets, regardless of their duration, could adversely affect the supply of and demand for capital from investors for commercial real estate investments. Changes in the perception that commercial real estate is an accepted asset class for portfolio diversification could also result in a significant reduction in the amount of debt and equity capital available in the commercial real estate sector. |
These and other types of events could lead to a further decline in transaction activity as well as a decrease in values, which would likely in turn lead to a reduction in fees and commissions relating to such transactions. These effects would likely cause us to realize lower revenues from our transaction service fees, including debt placement fees, investment sales commissions, and our private equity and advisory fees, which fees usually are tied to the transaction value and are payable upon the successful completion of a particular transaction. Such declines in transaction activity and value would likely also significantly reduce our loan servicing activities and revenues as a result of increased delinquencies and defaults on the loans we service and the lack of additional loans that we would have otherwise added to our servicing portfolio.
In addition, cyclicality in the commercial real estate markets may result in cyclicality in our results of operation as well as significant volatility in the market price of our Class A common stock. Similar to other providers of commercial real estate and capital markets services, the stock price of our Class A common stock has had significant declines and fluctuations in the past and may decline in the future.
11
Table of Contents
Our business has been and may in the future be adversely affected by restrictions in the availability of debt and/or equity capital as well as a lack of adequate credit and the risk of deterioration of the debt and/or credit markets and commercial real estate markets.
Restrictions on the availability of capital, both debt and/or equity, can create significant reductions in the liquidity and flow of capital to the commercial real estate markets. Severe restrictions in debt and/or equity liquidity as well as the lack of the availability of credit in the markets we serviced in 2010, 2009 and 2008 significantly reduced the volume and pace of commercial real estate transactions compared with past periods. These restrictions also had a general negative effect upon commercial real estate prices themselves. Our business of providing commercial real estate and capital markets services to our clients, who are both users and providers of capital, is particularly sensitive to the volume of activity and pricing in the commercial real estate market. In particular, global and domestic credit and liquidity issues reduced the number of acquisitions, dispositions and loan originations in 2010, 2009 and 2008, compared to prior periods, which may also occur into the future. This has had, and may have in the future, a significant adverse effect on our capital markets services revenues.
Despite the general improvement in the U.S. stock markets that started in the second half of 2009, global and domestic credit restrictions and market uncertainties continue, and we cannot predict with any degree of certainty the magnitude or duration of the recent developments in the credit markets and/or commercial real estate markets as it is inherently difficult to make accurate predictions with respect to such macroeconomic movements that are beyond our control. This uncertainty limits our ability to plan for future developments. In addition, the uncertainty regarding current market conditions may limit the ability of other participants in the credit markets and/or commercial real estate markets to plan for the future. As a result, market participants may act more conservatively than they might in a stabilized market, which may perpetuate and amplify the adverse developments in the markets we service. While business opportunities may emerge from assisting clients with transactions relating to distressed commercial real estate assets, there can be no assurance that the volume of such transactions will be sufficient to meaningfully offset the declines in transaction volumes within the overall commercial real estate market.
If we are unable to retain and attract qualified and experienced transaction professionals and associates, our growth may be limited and our business and operating results could suffer.
Our most important asset is our people, and our continued success is highly dependent upon the efforts of our transaction professionals and other associates, including our analysts and production coordinators as well as our key servicing and company overhead support associates. Our transaction professionals generate a significant majority of our revenues. If any of these key transaction professionals or other important associates leave, or if we lose a significant number of transaction professionals, or if we are unable to attract other qualified transaction professionals, our business, financial condition and results of operations may suffer. We have experienced in the past, and expect to experience in the future, the negative impact of the inability to retain and attract associates, analysts and experienced transaction professionals. Additionally, such events may have a disproportionate adverse effect on our operations if the senior most experienced transaction professionals do not remain with us or if these events occur in geographic areas where substantial amounts of our capital markets services revenues are generated. Moreover, because a significant portion of the compensation paid to our transaction professionals consists of commissions, in general our transaction professionals receive significantly less compensation at times when we have substantial declines in our capital markets services revenues, and may therefore have less incentive to remain with the Company during such challenging periods.
We use a combination of cash compensation, equity, equity-based incentives and other employee benefits rather than solely cash compensation to motivate and retain our transaction professionals. Our compensation mechanisms may not be effective, however, if the market price of our Class A common stock experiences significant declines such as what occurred during 2008 and 2009. Even if we are able to retain our most valuable transaction professionals, we may not be able to retain them at compensation levels that will allow us to achieve our target ratio of compensation expense to operating revenue.
12
Table of Contents
In addition, our competitors may attempt to recruit our transaction professionals. The employment arrangements, non-competition agreements and retention agreements we have entered into with members of HFF Holdings or may enter into with our key associates may not prevent our transaction professionals and other key associates from resigning or competing against us. Any such arrangements and agreements have expired for some members of HFF Holdings and will expire after a certain period of time for other members of HFF Holdings, at which point each such person would be free to compete against us and solicit our clients and employees. In particular, non-competition agreements entered into with 26 of our transaction professionals (including our Chief Executive Officer and President), who consist of the majority of the members of HFF Holdings, terminate on the earlier of March 2015 or two years following the termination of a member’s services with us. After discussion with our transaction professionals, management and review by our independent directors, we decided not to renew these agreements prior to their expiration. Additionally, we currently do not have employment agreements with certain other key associates and there is no assurance that we will be able to retain their services.
A significant component of our growth has also occurred through the recruiting, hiring and retention of key experienced transaction professionals as well as through the recruiting, hiring and retention of associates who have subsequently become transaction professionals. Any future growth through recruiting these types of transaction professionals and associates will be partially dependent upon the continued availability of attractive candidates fitting the culture of our firm at advantageous employment terms and conditions. However, individuals whom we would like to hire may not be available upon advantageous employment terms and conditions. In addition, the hiring of new personnel involves risks that the persons acquired will not perform in accordance with expectations and that business judgments concerning the value, strengths and weaknesses of persons acquired will prove incorrect.
Negative developments in the business of certain of our clients or counterparties could adversely affect our results of operation and financial condition.
Our clients are both users of capital, such as property owners, and providers of capital, such as lenders and equity investors. Defaults or non-performance by, or even rumors or questions about, one or more financial services institutions, or the financial services industry generally, have led to market-wide liquidity crises and could lead to losses or defaults by one or more of our clients, which, in turn, could have a material adverse effect on our results of operations and financial condition. In addition, a client may fail to make payments when due, become insolvent or declare bankruptcy. Any client bankruptcy or insolvency or the failure of any client to make payments when due could result in material losses to our company. In particular, if any of our significant clients becomes insolvent or suffers a downturn in its business, it may seriously harm our business. While in 2014 and 2013 no one borrower or no one seller client represented more than 4% of our total capital markets services revenues, bankruptcy filings by or relating to one of our clients could delay or bar us from collecting pre-bankruptcy debts from that client.
The bankruptcy or insolvency of a significant counterparty (which may include co-brokers, lenders including but not limited to Freddie Mac and/or Fannie Mae which are in conservatorship, insurance companies, banks, hedging counterparties, service providers or other organizations with which we do business), or the failure of any significant counterparty to perform its contractual commitments, may also result in a disruption to our business or material losses to our company.
We have numerous significant competitors and potential future competitors, some of which may have greater resources than we do, and we may not be able to continue to compete effectively.
We compete across a variety of businesses within the commercial real estate industry. In general, with respect to each of our businesses, we cannot give assurance that we will be able to continue to compete effectively or maintain our current fee arrangements or margin levels, or that we will not encounter increased competition. Each of the services we provide to our clients is highly competitive on an international, national,
13
Table of Contents
regional and local level. Depending on the product or service, we face competition from international and domestic groups, commercial real estate service providers, private owners and developers, institutional lenders, insurance companies, banks, CMBS originators, debt funds, hedge funds, investment banking firms, investment managers and accounting firms, some of whom are clients and many of whom may have greater financial resources than we do. In addition, future changes in laws and regulations could lead to the entry of other competitors. Many of our competitors are local, regional, national or international firms. Although some are substantially smaller than we are, some of these competitors are significantly larger on a local, regional, national or international basis. We may face increased competition from even stronger competitors in the future due to a trend toward consolidation, especially in times of severe economic stress such as what we experienced in 2008 through 2010. In recent years, there has been substantial consolidation and convergence among companies in our industry. Our existing and future competitors may choose to undercut our fees, increase the levels of compensation they are willing to pay to their employees and either recruit our employees or cause us to increase our level of compensation necessary to retain our own employees or recruit new employees. These occurrences could cause our revenue to decrease or negatively impact our target ratio of compensation to operating revenue, both of which could have an adverse effect on our business, financial condition and results of operations.
Our business could be hurt if we are unable to retain our business philosophy and partnership culture and efforts to retain our philosophy and culture could adversely affect our ability to maintain and grow our business.
We are deeply committed to maintaining the philosophy and culture which we have built. Our Mission and Vision Statement defines our business philosophy as well as the emphasis that we place on our clients, our people and our culture. We seek to reinforce to each of our associates our commitment to our clients, our culture and values by sharing with everyone in the firm what is expected from each of them. We strive to maintain a work environment that reinforces our owner-operator culture and the collaboration, motivation, alignment of interests and sense of ownership and reward associates based on their value-added performance who adhere to this culture. Our status as a public company, including potential changes in our compensation structure, could adversely affect this culture. If we do not continue to develop and implement the right processes, tools and appropriate compensation, including equity compensation, for our associates in order to manage our changing enterprise and maintain this culture, our ability to compete successfully and achieve our business objectives could be impaired, which could negatively impact our business, financial condition and results of operations.
In addition, in an effort to preserve our strong partnership culture, our process for hiring new transaction professionals is lengthy and highly selective. In the past, we have interviewed a significant number of individuals for each transaction professional that we hired, and we have in the past and may in the future subordinate our growth plans to our objective of hiring transaction professionals whom we think will adhere to and contribute to our culture. Our ability to maintain and grow our business could suffer if we are not able to identify, hire and retain new transaction professionals meeting our high standards, which could negatively impact our business, financial condition and results of operations.
In the event that we experience significant growth in the future, such growth may be difficult to sustain and may place significant demands on our administrative, operational and financial resources.
In the event that we experience significant growth in the future, such growth could place additional demands on our resources and increase our expenses. Our future growth will depend, among other things, on our ability to successfully identify experienced transaction professionals to join our firm and continue to retain, grow and develop the leadership to manage our business. It may take years for us to determine whether new transaction professionals will be profitable or effective. During that time, we may incur significant expenses and expend significant time and resources toward training, integration and business development. If we are unable to hire and retain profitable transaction professionals as well as our leadership, we will not be able to implement our growth strategy, which could adversely affect our business, financial condition and results of operations.
14
Table of Contents
Growth will also require us to commit additional management, operational and financial resources to maintain appropriate operational and financial systems to adequately support expansion. There can be no assurance that we will be able to manage our expanding operations effectively or that we will be able to maintain or accelerate our growth, and any failure to do so could adversely affect our ability to generate revenue and control our expenses, which could adversely affect our business, financial condition and results of operations.
Moreover, we may have to delay, alter or eliminate the implementation of certain aspects of our growth strategy due to events beyond our control, including, but not limited to, changes in general economic conditions, flows in the capital markets and negative changes in commercial real estate market conditions as well as negative perceptions about the commercial real estate asset class. Such delays or changes to our growth strategy may adversely affect our business.
If we acquire companies or significant groups of personnel in the future, we may experience high transaction and integration costs, the integration process may be disruptive to our business and the acquired businesses and/or personnel may not perform as we expect.
Future acquisitions of companies and/or people and any necessary related financings may involve significant transaction-related expenses. Transaction-related expenditures including but not limited to severance costs, lease termination costs, transaction costs, deferred financing costs, possible regulatory costs and merger-related costs, among others. We may also experience difficulties in integrating operations and accounting systems acquired from other companies. These challenges include, but are not limited to, the diversion of management’s attention from the regular operations of our business and the potential loss of our key clients, our key associates or those of the acquired operations, each of which could harm our financial condition and results of operation. We believe that most acquisitions will initially have an adverse impact on revenues, expenses, operating income and net income. Acquisitions also frequently involve significant costs related to integrating culture, people, information technology, accounting, reporting and management services and rationalizing personnel levels. If we are unable to fully integrate the culture, accounting, reporting and other systems of the businesses we acquire, we may not be able to effectively manage them and our financial results may be materially affected. Moreover, the integration process itself may be disruptive to our business as it requires coordination of culture, people and geographically diverse organizations and implementation of new accounting and information technology systems.
In addition, acquisitions of businesses involve risks that the businesses acquired will not perform in accordance with expectations, that the expected synergies associated with acquisitions will not be achieved and that business judgments concerning the value, strengths and weaknesses of the people and the businesses acquired will prove incorrect, which could have an adverse effect on our business, financial condition and results of operations.
Additional indebtedness or an inability to obtain indebtedness may make us more vulnerable to economic downturns and limit our ability to withstand competitive pressures.
We may be required to obtain additional financing to fund our on-going capital needs as well as to fund our working capital needs. Any additional indebtedness that we are able to incur will make us more vulnerable to economic downturns and limit our ability to withstand competitive pressures. In addition, an inability to obtain additional indebtedness will also make us more vulnerable to economic downturns and limit our ability to withstand competitive pressures.
The level of our indebtedness or inability to obtain additional indebtedness could have important consequences, including, but not limited to the following:
| • | a substantial portion of our cash flow from operations may be dedicated to debt service and may not be available for other purposes; |
15
Table of Contents
| • | our cash flow from operations may be insufficient to fund our business operations and our inability to obtain financing will make it more difficult to fund our operations; |
| • | making it more difficult for us to satisfy our obligations; |
| • | limiting our flexibility in planning for, or reacting to, changes in our business and the industry in which we operate; |
| • | obtaining financing in the future for our warehouse lending activities related to our Freddie Mac Program Plus Seller Servicer business, working capital, capital expenditures and general corporate purposes, including acquisitions, and may impede our ability to process our capital markets platform services as well as to secure favorable lease terms; |
| • | making it more difficult to continue to fund our current operations as well as our strategic growth initiatives and retain and attract key individuals; and |
| • | placing us at a competitive disadvantage compared to our competitors with less debt and greater financial resources. |
Our future cash flow may not be sufficient to meet our obligations and commitments. In addition, with the exception of our uncommitted warehouse lines of credit used exclusively in connection with our participation in Freddie Mac’s Program Plus Seller Servicer program, we do not currently maintain a revolving or other credit facility. While we currently believe that cash flows from operating activities and our existing cash balances will be sufficient to meet our working capital needs for the foreseeable future, we cannot make any assurances that we will not be required to incur indebtedness under another source of indebtedness financing in the future. If we are unable to obtain additional financing or generate sufficient cash flow from operations in the future to service our indebtedness and to meet our other commitments, we will be required to adopt one or more alternatives, including but not limited to, closing offices, selling material assets or operations, seeking to raise additional debt or equity capital, eliminating certain lines of our capital markets platforms or terminating significant numbers of key associates. These actions may not be effected on a timely basis or on satisfactory terms or at all, and these actions may not enable us to continue to satisfy our operating and/or capital requirements. As a result, we may not be able to maintain or accelerate our growth, and any failure to do so could adversely affect our ability to generate revenue and control our expenses, which could adversely affect our business, financial condition and results of operations.
The financial institutions with whom we currently do business may be unable or unwilling to provide funding under our current financing arrangements.
A diminution in the ease at which our current financing sources can be drawn upon could negatively impact our liquidity. While we are party to an uncommitted $350 million warehouse line of credit with PNC Bank, National Association (“PNC”) and an uncommitted $125 million warehouse line of credit with The Huntington National Bank (“Huntington”) to fund our Freddie Mac loan closings in connection with our participation in Freddie Mac’s Program Plus Seller Servicer program, such warehouse line of credit arrangements are uncommitted and funded on a transaction-by-transaction basis. In January 2015, the $350 million financing arrangement with PNC was increased by $500 million for a period of 15 days, at which time the arrangement reverts back to $350 million. Additionally, on January 27, 2015, HFF LP entered into an agreement with Huntington to increase the uncommitted financing agreement by $100 million for a period of the lesser of 60 days after the first advance or May 1, 2015. As of December 31, 2014, we had aggregate outstanding borrowings of $185.1 million under the PNC and Huntington arrangements (and a corresponding amount of mortgage notes receivable). Although we believe that our current financing arrangements with PNC and Huntington are sufficient to meet our current needs in connection with our participation in Freddie Mac’s Program Plus Seller Servicer program, in the event we are not able to secure financing for our Freddie Mac loan closings, we will cease originating such Freddie Mac loans until we have available financing.
16
Table of Contents
A failure to appropriately deal with actual or perceived conflicts of interest could adversely affect our businesses.
Outside of our people, our reputation is one of our most important assets. As we have expanded the scope of our businesses, capital market platforms and our client base, we increasingly have to address potential, actual or perceived conflicts of interest relating to the capital markets services we provide to our existing and potential clients. For example, conflicts may arise between our position as an advisor to both the buyer and seller in commercial real estate sales transactions or in instances when a potential buyer requests that we represent it in securing the necessary capital to acquire an asset we are selling for another client or when a capital source takes an adverse action against an owner client that we are representing in another matter. In addition, certain of our employees hold interests in real property as well as invest in pools of funds outside of their capacity as our employees, and their individual interests could be perceived to or actually conflict with the interests of our clients. While we believe we have attempted to adopt various policies, controls and procedures to address or limit actual or perceived conflicts, these policies and procedures may not be adequate or carry attendant costs and may not be adhered to by our employees. Appropriately dealing with conflicts of interest is complex and difficult and our reputation could be damaged and cause us to lose existing clients or fail to gain new clients if we fail, or appear to fail, to deal appropriately with conflicts of interest, which could have an adverse effect on our business, financial condition and results of operations.
A majority of our revenue is derived from capital markets services transaction fees, which are not long-term contracted sources of revenue, are subject to external economic conditions and intense competition, and declines in those engagements could have a material adverse effect on our financial condition and results of operations.
We historically have earned over 90% of our revenue from capital markets services transaction fees. We expect that we will continue to rely heavily on capital markets services transaction fees for a substantial portion of our revenue for the foreseeable future. A decline in our engagements or in the value of the commercial real estate we sell or finance could significantly decrease our capital markets services revenues which would adversely affect our business, financial condition and results of operations. In addition, we operate in a highly competitive environment, which is heavily reliant on a healthy economy and a functioning and fluid global capital market, where typically there are no long-term contracted sources of revenue; each revenue-generating engagement typically is separately awarded and negotiated on a transaction-by-transaction basis, and the inability to continue to be paid for services at the current levels or the loss of clients would adversely affect our business, financial condition and results of operation.
Significant fluctuations in our revenues and net income may make it difficult for us to achieve steady earnings growth on a quarterly or an annual basis, which may make the comparison between periods difficult and may cause the price of our Class A common stock to decline.
We have experienced and continue to experience significant fluctuations in revenues and net income as a result of many factors, including but not limited to economic conditions, capital market disruptions, the timing of transactions, the commencement and termination of contracts, revenue mix and the timing of additional selling, general and administrative expenses to support new business activities. We provide many of our services without written contracts or pursuant to contracts that are terminable at will. Consequently, many of our clients can terminate or significantly reduce their relationships with us on very short notice for any reason.
We plan our capital and operating expenditures based on our expectations of future revenues and, if revenues are below expectations in any given quarter or year, we may be unable to adjust capital or operating expenditures in a timely manner to compensate for any unexpected revenue shortfall, which could have an immediate material adverse effect on our business, financial condition and results of operation.
17
Table of Contents
Our results of operation vary significantly among quarters during each calendar year, which makes comparisons of our quarterly results difficult.
A significant portion of our revenue is typically seasonal. Historically, during normal economic and capital markets conditions, this seasonality has caused our revenue, operating income, net income and cash flows from operating activities to be lower in the first six months of the year and higher in the second half of the year. This variance among periods during each calendar year makes comparison between such periods difficult, and it also makes the comparison of the same periods during different calendar years difficult as well. However, this seasonality did not occur in 2007 or 2008 during the disruptions facing all global capital markets, and in particular the U.S. commercial real estate markets, and this historical pattern of seasonality may or may not continue.
Our existing goodwill and other intangible assets could become impaired, which may require us to take significant non-cash charges.
Under current accounting guidelines, we evaluate our goodwill and other intangible assets for potential impairment annually or more frequently if circumstances indicate impairment may have occurred.
As of December 31, 2014, our recorded goodwill was approximately $3.7 million and our other intangible assets, net, were $20.6 million. The Company performs the required annual goodwill impairment evaluation in the fourth quarter of each year. No impairment of goodwill was determined to exist for the years ended December 31, 2014, 2013 or 2012. Our intangible assets primarily include mortgage servicing rights under agreements with third party lenders. As of December 31, 2014, the fair value and net book value of the Freddie Mac, CMBS and Life Company servicing rights were $26.0 million and $20.5 million, respectively. The most sensitive assumptions in estimating the fair value of the mortgage servicing rights are the level of prepayments, discount rate and cost of servicing. If the assumed level of prepayments increased 106%, the discount rate increased 51% or if there is a 15% increase in the cost of servicing at the stratum level, the estimated fair value of the servicing rights may result in the recorded mortgage servicing rights being potentially impaired and would require management to measure the amount of the impairment charge. The effect of a variation in each of these assumptions on the estimated fair value of the servicing rights is calculated independently without changing any other assumption. For further detail, refer to the discussion under the caption “Management’s Discussion and Analysis of Financial Condition and Results of Operations — Critical Accounting Policies; Use of Estimates” in this Annual Report on Form 10-K. Any impairment of goodwill or other intangible assets would result in a non-cash charge against earnings, which charge could materially adversely affect our reported results of operations and the market price of our Class A common stock in future periods.
Our existing deferred tax assets may not be realizable, which may require us to take significant non-cash charges.
The Company accounts for income taxes under the asset and liability method. Deferred tax assets and liabilities are recognized for future tax consequences attributable to differences between the financial statement carrying amounts of existing assets and liabilities and their respective tax bases, and for tax losses and tax credit carryforwards, if any. Deferred tax assets and liabilities are measured using tax rates expected to apply to taxable income in the years in which those temporary differences are expected to be recovered or settled. The effect on deferred tax assets and liabilities of a change in tax rates are recognized in income in the period of the tax rate change. In assessing the realizability of deferred tax assets, the Company considers whether it is more likely than not that some portion or all of the deferred tax assets will not be realized.
Our effective tax rate is sensitive to several factors including changes in the mix of our geographic profitability. We evaluate our estimated tax rate on a quarterly basis to reflect changes in: (i) our geographic mix of income, (ii) legislative actions on statutory tax rates and (iii) tax planning for jurisdictions affected by double taxation. We continually seek to develop and implement potential strategies and/or actions that would reduce our overall effective tax rate.
18
Table of Contents
The net deferred tax asset of $146.1 million at December 31, 2014 is comprised mainly of a $145.2 million deferred tax asset related to the a tax basis step-up election under Section 754 of the Internal Revenue Code, as amended (“Section 754”), made by HFF, Inc. relating to the initial purchase of units of the Operating Partnerships in connection with the Reorganization Transactions and a tax basis step-up on subsequent exchanges of Operating Partnership units for shares of the Company’s Class A common stock since the date of the Reorganization Transactions. The deferred tax asset related to the Section 754 election tax basis step up of $145.2 million represents annual pre-tax deductions on the Section 754 basis step up and past payments under the tax receivable agreement of approximately $32.6 million in 2015, then increasing to $52.9 million in 2021 then decreasing over the next nine years to approximately $0.1 million in 2030. In order to realize the anticipated pre-tax benefit of approximately $32.6 million in 2015, the Company needs to generate approximately $287 million in revenue, assuming our current cost structure. In the event that the Company cannot realize the annual benefit each year, the shortfall becomes a net operating loss that can be carried back 2 years to offset prior years’ taxable income or carried forward 20 years to offset future taxable income. If it is more likely than not that the Company would not be able to generate a sufficient level of taxable income through the carryforward period, a valuation allowance would be recorded as a charge to income tax expense and a proportional reduction in the payable under the tax receivable agreement which would be recorded as income in the consolidated statements of income.
Employee misconduct, which is difficult to detect and deter, could harm us by impairing our ability to attract and retain clients and subjecting us to significant legal liability and reputational harm.
If our associates engage in misconduct, our business could be adversely affected. For example, our business often requires that we deal with confidential matters of great significance to our clients. It is not always possible to deter employee misconduct, and the precautions we take to deter and prevent this activity may not be effective in all cases. If our associates were improperly to use or disclose confidential information provided by our clients, we could be subject to regulatory sanctions and suffer serious harm to our reputation, financial position and current client relationships and our ability to attract future clients, could be significantly impaired, which could adversely affect our business, financial condition and results of operation.
Compliance failures and changes in regulation could result in an increase in our compliance costs or subject us to sanctions or litigation.
A number of our services are subject to regulation by the SEC, FINRA and state real estate commissions and securities regulators. Our failure to comply with applicable laws or regulations could result in fines, suspensions of personnel or other sanctions, including revocation of the registration of us or any of our subsidiaries as a commercial real estate broker or broker-dealer. Even if a sanction imposed against us or our personnel is small in monetary amount, the adverse publicity arising from the imposition of sanctions against us by regulators could harm our reputation and cause us to lose existing clients or significantly impair our ability to gain new clients. Our broker-dealer operations are subject to periodic examination by the SEC and FINRA. FINRA may identify deficiencies in the procedures and practices of HFF Securities and may require HFF Securities to take remedial action. FINRA may also identify significant violations of law, rules or regulations, resulting in formal disciplinary action and the imposition of sanctions, including potentially the revocation of HFF Securities’ registration as a broker-dealer. We cannot predict the outcome of any such examinations or processes, and any negative regulatory action may have a significant and material adverse effect on our company. In addition, it is possible that the regulatory scrutiny of, and litigation in connection with, conflicts of interest will make our clients less willing to enter into transactions in which such a conflict may occur, and significantly impair our ability to gain new clients, which could adversely affect our business, financial condition and results of operation.
Additionally, changes in risk retention rules related to the Dodd-Frank Act and Basel III global regulations could adversely affect financial institutions and their ability, willingness and competitiveness in providing capital to the commercial real estate industry both globally and domestically. Any of these events could result in a general decline in acquisition, disposition and financing activities, which could lead to a reduction in our fees for
19
Table of Contents
arranging such transactions as well as a reduction in our loan servicing activities due to increased delinquencies and lack of additional loans that we would have otherwise added to our portfolio, all of which could adversely affect our business, financial condition and results of operation.
In addition, we may be adversely affected as a result of new or revised legislation or regulations adopted by the SEC, state, local or national governmental regulatory authorities or self-regulatory organizations that supervise the financial and commercial real estate markets as well as changes in administrations or enforcement priorities of any of these authorities or organizations.
We could be adversely affected if the Terrorism Risk Insurance Act of 2002 is not renewed beyond 2015, or is adversely amended, or if insurance for other natural or manmade disasters is interrupted or constrained
Our business could be adversely affected if the Terrorism Risk Insurance Act of 2002, or TRIA, is not renewed beyond 2015, or is adversely amended, or if insurance for other natural and manmade disasters is interrupted or constrained. In response to the tightening of supply in certain insurance and reinsurance markets resulting from, among other things, the September 11, 2001 terrorist attack, the Terrorism Risk Insurance Act of 2002 was enacted to ensure the availability of commercial insurance coverage for terrorist acts in the United States. This law established a federal assistance program through the end of 2005 to help the commercial property and casualty insurance industry cover claims related to future terrorism-related losses and required that coverage for terrorist acts be offered by insurers. Although TRIA was amended and extended through 2015, it is possible that TRIA will not be renewed beyond 2015, or could be adversely amended, which could adversely affect the commercial real estate markets and capital markets if a material subsequent event occurred. Lenders generally require owners of commercial real estate to maintain terrorism insurance. In the event TRIA is not renewed, terrorism insurance may become difficult or impossible to obtain. Natural disasters and the lack of commercially available wind damage and flood insurance could also have a negative impact on the acquisition, disposition and financing of the commercial properties in certain areas. Any of these events could result in a general decline in acquisition, disposition and financing activities, which could lead to a reduction in our fees for arranging such transactions as well as a reduction in our loan servicing activities due to increased delinquencies and lack of additional loans that we would have otherwise added to our portfolio, all of which could adversely affect our business, financial condition and results of operation.
We could be adversely affected if our executive compensation programs are scrutinized or influenced by shareholder advocacy groups.
In recent years, all public companies in the United States have faced increasing shareholder scrutiny of the executive compensation practices. Through legislation such as the Dodd-Frank Act, shareholders have been given new or stronger rights to approve the pay practices, including the issuance of equity compensation, of public companies. In addition, the influence of independent shareholder advocacy groups on the decisions of institutional investors related to executive compensation matters has increased significantly. In the event that shareholder influence results in a change in our compensation mechanisms, including our ability to issue equity compensation, we may have difficulty in retaining transaction professionals or retaining them at compensation levels that we deem appropriate. In addition, to the extent that shareholder influence prevents us from deducting executive compensation costs, we could experience additional tax costs with respect to our compensation mechanisms.
Risks Related to Our Organizational Structure
Our only material asset is our units in the Operating Partnerships, and we are accordingly dependent upon distributions from the Operating Partnerships to pay our expenses, taxes and dividends (if and when declared by our board of directors).
HFF, Inc. is a holding company and has no material assets other than its ownership of partnership units in the Operating Partnerships. HFF, Inc. has no independent means of generating revenue. We intend to cause the
20
Table of Contents
Operating Partnerships to make distributions to its partners in an amount sufficient to cover all expenses, applicable taxes payable and dividends, if any, declared by our board of directors. To the extent that HFF, Inc. needs funds, and the Operating Partnerships are restricted from making such distributions under applicable law or regulation or under any future debt covenants, or are otherwise unable to provide such funds, it could materially adversely affect our business, liquidity, financial condition and results of operation.
We will be required to pay HFF Holdings for most of the benefits relating to any additional tax depreciation or amortization deductions we may claim as a result of the tax basis step-up we receive and related transactions with HFF Holdings.
As part of the Reorganization Transactions, approximately 45% of the partnership units in each of the Operating Partnerships (including partnership units in the Operating Partnerships held by Holliday GP) held by Holdings Sub, a wholly-owned subsidiary of HFF Holdings, were sold to HoldCo LLC, our wholly-owned subsidiary, for cash raised in the initial public offering. In addition, HFF Holdings gained, through the issuance of one share of HFF, Inc.’s Class B common stock to HFF Holdings, the right to exchange its remaining partnership units in the Operating Partnerships held by HFF Holdings for shares of Class A common stock, subject to certain restrictions (the “Exchange Right”). As of August 31, 2012, all of the 20,355,000 partnership units previously held by Holdings had been exchanged for an equal number of shares of our Class A common stock. Since all the partnership units had been exchanged, the Class B common stock was transferred to us and retired on August 31, 2012 in accordance with our certificate of incorporation. These sales and exchanges have resulted in increases in the tax basis of the assets of HFF LP and HFF Securities that have been allocated to HFF, Inc. These increases in tax basis will likely reduce the amount of tax that we would otherwise be required to pay in the future depending on the amount, character and timing of our taxable income, but there can be no assurances that such treatment will continue in the future.
HFF, Inc. entered into a tax receivable agreement with HFF Holdings that provides for the payment by HFF, Inc. to HFF Holdings of 85% of the amount of cash savings, if any, in U.S. federal, state and local income tax that we actually realize as a result of these increases in tax basis and as a result of certain other tax benefits arising from our entering into the tax receivable agreement and making payments under that agreement. For purposes of the tax receivable agreement, cash savings in income tax will be computed by comparing our actual income tax liability to the amount of such taxes that we would have been required to pay had there been no increase to the tax basis of the assets of HFF LP and HFF Securities as a result of the initial sale and later exchanges and had we not entered into the tax receivable agreement. The term of the tax receivable agreement will continue until all such tax benefits have been utilized or expired, including the tax benefits derived from future exchanges.
While the actual amount and timing of payments under the tax receivable agreement will depend upon a number of factors, including the amount and timing of taxable income we generate in the future, the value of our individual assets, the portion of our payments under the tax receivable agreement constituting imputed interest, changes in the tax rates and increases in the tax basis of our assets resulting in payments to HFF Holdings, we expect that the payments that may be made to HFF Holdings will be substantial. The payments under the tax receivable agreement are not conditioned upon HFF Holdings’ or its affiliates’ ownership of us. We may need to incur debt to finance payments under the tax receivable agreement to the extent our cash resources are insufficient to meet our obligations under the tax receivable agreement as a result of timing discrepancies or otherwise.
In addition, although we are not aware of any issue that would cause the Internal Revenue Service, or IRS, to challenge the tax basis increases or other benefits arising under the tax receivable agreement, HFF Holdings will not reimburse us for any payments previously made if such basis increases or other benefits were later not allowed. As a result, in such circumstances we could make payments to HFF Holdings under the tax receivable agreement in excess of our actual cash tax savings.
21
Table of Contents
Risks Related to Our Class A Common Stock
Ownership by certain of our transaction professionals of substantial voting power in HFF, Inc. may give rise to conflicts of interests and may prevent new investors from influencing significant corporate decisions.
Members of HFF Holdings, who consist of our senior transaction professionals as well as other employees of the Operating Partnerships, held in their individual capacity greater than 16% of the voting power in HFF, Inc. as of February 20, 2015. As a result, and in combination with the fact that our certificate of incorporation does not provide for cumulative voting, these individuals, acting as individuals, collectively, have the ability to exert significant influence in the election of the members of our board of directors and thereby the control of our management and affairs, including determinations with respect to acquisitions, dispositions, borrowings, issuances of common stock or other securities, and the declaration and payment of dividends. In addition, these individuals may be able to significantly influence the outcome of all matters requiring stockholder approval, including a change of control of our company or a change in the composition of our board of directors and could preclude any unsolicited acquisition of our company. We cannot assure you that the interests of these individuals will not conflict with your interests.
The concentration of ownership could deprive our Class A stockholders of an opportunity to receive a premium for their shares as part of a sale of our company and might ultimately affect the market price of our Class A common stock. In addition, as a result of the influence exercised by these individuals over us at any time in the future, we cannot assure you that we would not have received more favorable terms from an unaffiliated party.
If we fail to maintain an effective system of internal controls, we may not be able to accurately report financial results or prevent fraud.
Effective internal controls are necessary to provide reliable financial reports and to assist in the effective prevention of fraud. Any inability to provide reliable financial reports or prevent fraud could harm our business. We must annually evaluate our internal control procedures to satisfy the requirements of Section 404 of the Sarbanes-Oxley Act of 2002, which requires management and auditors to assess the effectiveness of internal controls. If we fail to remedy or maintain the adequacy of our internal controls, as such standards are modified, supplemented or amended from time to time, we could be subject to regulatory scrutiny, civil or criminal penalties or shareholder litigation.
In addition, failure to maintain adequate internal controls could result in financial statements that do not accurately reflect our financial condition. There can be no assurance that we will be able to continue to complete the work necessary to fully comply with the requirements of the Sarbanes-Oxley Act or that our management and external auditors will continue to conclude that our internal controls are effective.
If securities analysts do not publish research or reports about our business or if they downgrade our company or our sector, the price of our Class A common stock could decline.
The trading market for our Class A common stock will depend in part on the research and reports that industry or financial analysts publish about us or our business. We do not control these analysts, nor can we assure that any analysts will continue to follow us and issue research reports. Furthermore, if one or more of the analysts who do cover us downgrades our company or our industry, or the stock of any of our competitors, the price of our Class A common stock could decline. If one or more of these analysts ceases coverage of our company, we could lose visibility in the market, which in turn could cause the price of our Class A common stock to decline.
Our share price may decline due to the large number of shares eligible for future sale and for exchange.
The market price of our Class A common stock could decline as a result of sales of a large number of shares of Class A common stock in the market or the perception that such sales could occur. These sales, or the
22
Table of Contents
possibility that these sales may occur, also might make it more difficult for us to sell equity securities in the future at a time and at a price that we deem appropriate.
In June 2010, following the consultation with our board of directors, 29 members of HFF Holdings agreed to impose resale restrictions on a portion of their shares of Class A common stock in connection with the modification of the Exchange Right and the extension of our employment agreements with such members of HFF Holdings. These modifications to the Exchange Right permitted HFF Holdings to exchange in June 2010 all of its partnership units in the Operating Partnerships that corresponded to the participating members’ interests in HFF Holdings for shares of Class A common stock. During 2010, HFF Holdings exchanged 17,574,374 partnership units for 17,574,374 shares of our Class A common stock. Of these shares of our Class A Common Stock, 4,020,640 shares were subject to the resale restrictions imposed in June 2010. In each of March 2014 and March 2013, 33% or approximately 1.34 million of such restricted shares of Class A common stock became eligible to be freely sold, with a like amount of such restricted shares of Class A common stock being eligible to be freely sold in March 2015.
In addition, as of February 20, 2015, 1,606,071 shares of our Class A common stock were reserved for issuance under outstanding awards of vested and unvested restricted stock or options to purchase our Class A common stock and 1,015,948 shares of our Class A common stock were reserved for future issuance under our 2006 Omnibus Incentive Compensation Plan.
The market price of our Class A common stock may continue to be volatile, which could cause the value of your investment to decline or subject us to litigation.
Our stock price is affected by a number of factors, including but not limited to quarterly and annual variations in our results and those of our competitors; changes to the competitive landscape; estimates and projections by the investment community; the arrival or departure of key personnel, especially the retirement or departure of key senior transaction professionals and management, including members of HFF Holdings and current named executive officers of the Company and senior members of our executive committee and Leadership Team; the introduction of new services by us or our competitors; and acquisitions, strategic alliances or joint ventures involving us or our competitors. Securities markets worldwide experience significant price and volume fluctuations as has been the case in the past, especially since late 2007 and continuing through 2011. This market volatility, as well as general global and domestic economic, credit and liquidity issues, market or political conditions, has reduced and may reduce in the future the market price of our Class A common stock. In addition, our operating results could be below the expectations of public market analysts and investors, and in response, the market price of our Class A common stock could decrease significantly.
When the market price of a company’s common stock drops significantly, stockholders sometimes institute securities class action lawsuits against the company. A securities class action lawsuit against us could cause us to incur substantial costs and could divert the time and attention of our management and other resources from our business.
Anti-takeover provisions in our charter documents and Delaware law could delay or prevent a change in control.
Our certificate of incorporation and bylaws may delay or prevent a merger or acquisition that a stockholder may consider favorable by permitting our board of directors to issue one or more series of preferred stock, requiring advance notice for stockholder proposals and nominations, providing for a classified board of directors, providing for super-majority votes of stockholders for the amendment of the bylaws and certificate of incorporation, and placing limitations on convening stockholder meetings and not permitting written consents of stockholders. In addition, we are subject to provisions of the Delaware General Corporation Law that restrict certain business combinations with interested stockholders. These provisions may also discourage acquisition proposals or delay or prevent a change in control, which could harm the market price of our Class A common stock.
23
Table of Contents
| Item 1B. | Unresolved Staff Comments |
None.
Our principal executive offices are located in leased office space at One Oxford Centre, 301 Grant Street, Suite 1100, Pittsburgh, PA. We also lease or sublease space for our offices at Charlotte, NC; Philadelphia, PA; Boston, MA; Hartford, CT; New York, NY; Florham Park, NJ; Washington, D.C.; Miami, FL; Orlando, FL; Tampa, FL; Atlanta, GA; Indianapolis, IN; Chicago, IL; Houston, TX; Dallas, TX; Austin, TX; San Diego, CA; Orange County, CA; Los Angeles, CA; San Francisco, CA; Denver, CO; and Portland, OR. The Company will no longer maintain an office in Hartford, CT effective April 1, 2015. Hartford has historically been a small office for the Company and the personnel in this office will be transferred to the Company’s Boston, MA office. With this change, the Company will operate 22 offices in the U.S. We do not own any real property. We believe that our existing facilities will be sufficient for the conduct of our business during the next fiscal year.
We are party to various litigation matters, in most cases involving ordinary course and routine claims incidental to our business. We cannot estimate with certainty our ultimate legal and financial liability with respect to any pending matters. However, we believe, based on our examination of such pending matters, that our ultimate liability for these matters will not have a material adverse effect on our business or financial condition.
Item 4. Mine Safety Disclosures
Not applicable.
24
Table of Contents
| Item 5. | Market for Registrant’s Common Equity, Related Stockholder Matters and Issuer Purchases of Equity Securities. |
Market Information
Our Class A common stock, par value $0.01 per share, trades on the New York Stock Exchange (“NYSE”) under the symbol “HF.” In connection with our initial public offering, our Class A common stock was priced for initial sale on January 30, 2007. There was no established public trading market for our common stock prior to that date. On February 20, 2015 the closing sales price, as reported by the NYSE, was $37.90.
The following table sets forth the high and low sale prices for our Class A common stock as reported by the NYSE for the periods indicated:
| 2014 | ||||||||
| High | Low | |||||||
| 1st Quarter |
$ | 34.74 | $ | 25.53 | ||||
| 2nd Quarter |
37.58 | 29.79 | ||||||
| 3rd Quarter |
38.23 | 28.75 | ||||||
| 4th Quarter |
37.22 | 25.78 | ||||||
| 2013 | ||||||||
| High | Low | |||||||
| 1st Quarter |
$ | 20.23 | $ | 14.67 | ||||
| 2nd Quarter |
21.05 | 16.85 | ||||||
| 3rd Quarter |
25.21 | 17.67 | ||||||
| 4th Quarter |
27.30 | 23.31 | ||||||
For equity compensation plan information, please refer to Item 12 in Part III of the Annual Report on Form 10-K.
Holders
On February 20, 2015, we had 103 stockholders of record of our Class A common stock.
Dividends
On January 15, 2014, our board of directors declared a special cash dividend of $1.83 per share of Class A common stock to stockholders of record on January 27, 2014. The aggregate dividend payment was paid on February 6, 2014 and totaled approximately $68.2 million based on the number of shares of Class A common stock then outstanding. Additionally, 42,108 restricted stock units (dividend units) were granted for those unvested and vested but not issued restricted stock units as of the record date of January 27, 2014. These dividend units follow the same vesting terms as the underlying restricted stock units. On January 20, 2015, our board of directors declared a special cash dividend of $1.80 per share of Class A common stock to stockholders of record on February 2, 2015. The aggregate dividend payment was paid on February 13, 2015 and totaled approximately $67.8 million based on the number of shares of Class A common stock then outstanding. Additionally, 49,383 restricted stock units (dividend units) were granted for those unvested and vested but not issued restricted stock units as of the record date of February 2, 2015. These dividend units follow the same vesting terms as the underlying restricted stock units. The declaration and payment of any future dividends will be at the sole discretion of our board of directors.
25
Table of Contents
HFF, Inc. is a holding company and has no material assets other than its ownership of partnership units in the Operating Partnerships. If we declare a dividend at some point in the future, we intend to cause the Operating Partnerships to make distributions to HFF, Inc. in an amount sufficient to cover any such dividends. Our ability to declare and pay a dividend will be limited to the extent that the Operating Partnerships are restricted from making such distributions under applicable law or regulation or under any future debt covenants, or are otherwise unable to provide such funds.
Performance Graph
The following graph shows our cumulative total stockholder return for the period December 31, 2009 and ending on December 31, 2014. The graph also shows the cumulative total returns of the Standard & Poor’s 500 Stock Index, or S&P 500 Index, and an industry peer group for this period.
The comparison below assumes $100 was invested on December 31, 2009 in our Class A common stock and in each of the indices shown and assumes that all dividends were reinvested. Our stock price performance shown in the following graph is not indicative of future stock price performance. The peer group is comprised of the following publicly-traded real estate services companies: CB Richard Ellis Group, Inc. and Jones Lang LaSalle Incorporated. These two companies represent our primary competitors that are publicly traded with business lines reasonably comparable to ours.
COMPARISON OF 60-MONTH CUMULATIVE TOTAL RETURN
Among HFF, Inc., The S&P 500 Index, and a Peer Group
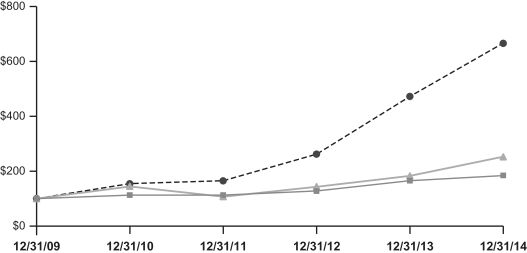
| 12/31/09 | 12/31/10 | 12/31/11 | 12/31/12 | 12/31/13 | 12/31/14 | |||||||||||||||||||
|
|
100.00 | 154.56 | 165.28 | 262.88 | 473.71 | 668.24 | ||||||||||||||||||
|
|
100.00 | 112.78 | 112.78 | 127.90 | 165.76 | 184.64 | ||||||||||||||||||
|
|
100.00 | 145.12 | 107.13 | 143.65 | 183.17 | 253.07 | ||||||||||||||||||
 HFF, Inc.
 S&P 500 Index
 Peer Group
Recent Sales of Unregistered Securities
We did not make any sales of unregistered securities of the Company during 2014.
26
Table of Contents
| Item 6. | Selected Financial Data |
The selected historical consolidated financial data as of and for the years ended December 31, 2014, 2013, and 2012 has been derived from our audited consolidated financial statements included elsewhere in this Annual Report on Form 10-K. The selected historical consolidated financial data for the year ended December 31, 2011 and 2010 was also derived from our audited consolidated financial statements not otherwise included in this Annual Report on Form 10-K. Our historical results are not necessarily indicative of future performance or results of operations. You should read the combined historical financial data together with our consolidated financial statements and related notes thereto included in Item 8 of this Annual Report on Form 10-K and with Item 7 — “Management’s Discussion and Analysis of Financial Condition and Results of Operations” and the consolidated financial statements and the related notes thereto and other financial data included elsewhere in this Annual Report on Form 10-K.
| For The Year Ended December 31, | ||||||||||||||||||||
| 2014 | 2013 | 2012 | 2011 | 2010 | ||||||||||||||||
| Statement of Income Data: |
||||||||||||||||||||
| Total revenue |
$ | 425,918 | $ | 355,605 | $ | 284,974 | $ | 254,679 | $ | 139,972 | ||||||||||
| Operating expenses |
341,091 | 285,628 | 234,857 | 201,307 | 124,607 | |||||||||||||||
|
|
|
|
|
|
|
|
|
|
|
|||||||||||
| Operating income |
84,827 | 69,977 | 50,117 | 53,372 | 15,365 | |||||||||||||||
| Interest and other income, net |
17,926 | 17,100 | 20,049 | 14,968 | 9,487 | |||||||||||||||
| Interest expense |
(41 | ) | (33 | ) | (42 | ) | (29 | ) | (64 | ) | ||||||||||
| (Increase) decrease in payable under the tax receivable agreement |
800 | (1,040 | ) | (17,358 | ) | (3,890 | ) | 813 | ||||||||||||
|
|
|
|
|
|
|
|
|
|
|
|||||||||||
| Income before income taxes |
103,512 | 86,004 | 52,766 | 64,421 | 25,601 | |||||||||||||||
| Income taxes |
42,226 | 34,578 | 8,661 | 22,371 | 8,612 | |||||||||||||||
|
|
|
|
|
|
|
|
|
|
|
|||||||||||
| Net income |
61,286 | 51,426 | 44,105 | 42,050 | 16,989 | |||||||||||||||
| Net income attributable to noncontrolling interest |
— | — | 243 | 2,031 | 6,098 | |||||||||||||||
|
|
|
|
|
|
|
|
|
|
|
|||||||||||
| Net income attributable to controlling interest |
$ | 61,286 | $ | 51,426 | $ | 43,862 | $ | 40,019 | $ | 10,891 | ||||||||||
|
|
|
|
|
|
|
|
|
|
|
|||||||||||
| Diluted earnings per common share |
$ | 1.61 | $ | 1.36 | $ | 1.18 | $ | 1.11 | $ | 0.40 | ||||||||||
|
|
|
|
|
|
|
|
|
|
|
|||||||||||
| Adjusted EBITDA (1) |
$ | 110,110 | $ | 96,948 | $ | 70,002 | $ | 68,995 | $ | 25,554 | ||||||||||
| Balance Sheet Data: |
||||||||||||||||||||
| Total assets |
$ | 604,252 | $ | 488,176 | $ | 589,199 | $ | 478,451 | $ | 333,150 | ||||||||||
| Long term debt, excluding current portion |
$ | 429 | $ | 185 | $ | 279 | $ | 300 | $ | 138 | ||||||||||
| Total liabilities |
$ | 417,807 | $ | 312,602 | $ | 468,177 | $ | 348,051 | $ | 243,467 | ||||||||||
| (1) | The Company defines Adjusted EBITDA as net income attributable to controlling interest before (i) interest expense, (ii) income tax expense, (iii) depreciation and amortization, (iv) net income attributable to the noncontrolling interest, (v) stock-based compensation expense, which is a non-cash charge, (vi) income recognized on the initial recording of mortgage servicing rights that are acquired with no initial consideration, which is also a non-cash income amount that can fluctuate significantly based on the level of mortgage servicing right volumes, and (vii) the increase (decrease) in payable under the tax receivable agreement, which represents changes in a liability recorded on the Company’s consolidated balance sheet determined by the ongoing remeasurement of related deferred tax assets and, therefore, can be income or expense in the Company’s consolidated statement of income in any individual period. The Company uses Adjusted EBITDA in its business operations to, among other things, evaluate the performance of its business, develop budgets and measure its performance against those budgets. The Company also believes that analysts and investors use Adjusted EBITDA as supplemental measures to evaluate its overall operating performance. However, Adjusted EBITDA has material limitations as an analytical tool and should not be considered in isolation, or as a substitute for analysis of the Company’s results as reported under GAAP. The Company finds Adjusted EBITDA as a useful tool to assist in evaluating performance because it eliminates items related to capital structure and taxes, including, the Company’s tax receivable agreement. |
27
Table of Contents
| Note that the Company classifies the interest expense on its warehouse lines of credit as an operating expense and, accordingly, it is not eliminated from net income attributable to controlling interest in determining Adjusted EBITDA. Some of the items that the Company has eliminated from net income attributable to controlling interest in determining Adjusted EBITDA are significant to the Company’s business. For example, (i) interest expense is a necessary element of the Company’s costs and ability to generate revenue because it incurs interest expense related to any outstanding indebtedness, (ii) payment of income taxes is a necessary element of the Company’s costs and (iii) depreciation and amortization are necessary elements of the Company’s costs. |
Any measure that eliminates components of the Company’s capital structure and costs associated with the Company’s operations has material limitations as a performance measure. In light of the foregoing limitations, the Company does not rely solely on Adjusted EBITDA as a performance measure and also considers its GAAP results. Adjusted EBITDA is not a measurement of the Company’s financial performance under GAAP and should not be considered as an alternative to net income, operating income or any other measures derived in accordance with GAAP. Because Adjusted EBITDA is not calculated in the same manner by all companies, it may not be comparable to other similarly titled measures used by other companies.
Set forth below is an unaudited reconciliation of consolidated net income attributable to controlling interest to Adjusted EBITDA for the Company for the periods set forth below:
Adjusted EDITDA for the Company is calculated as follows:
(dollars in thousands)
| For the year ended December 31, | ||||||||||||||||||||
| 2014 | 2013 | 2012 | 2011 | 2010 | ||||||||||||||||
| Net income attributable to controlling interest |
$ | 61,286 | $ | 51,426 | $ | 43,862 | $ | 40,019 | $ | 10,891 | ||||||||||
| Add: |
||||||||||||||||||||
| Interest expense |
41 | 33 | 42 | 29 | 64 | |||||||||||||||
| Income tax expense |
42,226 | 34,578 | 8,661 | 22,371 | 8,612 | |||||||||||||||
| Depreciation and amortization |
7,830 | 6,800 | 5,767 | 4,627 | 3,655 | |||||||||||||||
| Net income attributable to noncontrolling interest |
— | — | 243 | 2,031 | 6,098 | |||||||||||||||
| Stock-based compensation (a) |
9,821 | 8,302 | 3,442 | 2,053 | 970 | |||||||||||||||
| Initial recording of mortgage servicing rights |
(10,294 | ) | (5,231 | ) | (9,373 | ) | (6,025 | ) | (3,923 | ) | ||||||||||
| Increase (decrease) in payable under the tax receivable agreement |
(800 | ) | 1,040 | 17,358 | 3,890 | (813 | ) | |||||||||||||
|
|
|
|
|
|
|
|
|
|
|
|||||||||||
| Adjusted EBITDA |
$ | 110,110 | $ | 96,948 | $ | 70,002 | $ | 68,995 | $ | 25,554 | ||||||||||
|
|
|
|
|
|
|
|
|
|
|
|||||||||||
| (a) | Amounts do not reflect expense associated with the stock component of estimated incentive payouts under the Company’s firm profit participation bonus plan or office profit participation bonus plans that are anticipated to be paid in respect of the applicable year. Such expense is recorded as incentive compensation expense within personnel expenses in the Company’s consolidated statements of income during the year to which the expense relates. Following the award, if any, of the related incentive payout, the stock component expense is reclassified as stock compensation costs within personnel expenses. See Note 2 to the Company’s consolidated financial statements for further information regarding the Company’s accounting policies relating to its firm profit participation bonus plan and office profit participation bonus plans. Stock-based compensation expense for the year ended December 31, 2014 reflects $1.9 million of expense recognized during such period that was associated with restricted stock granted in March 2014 under the Company’s firm profit participation bonus plan or office profit participation bonus plans in respect of 2013. Stock-based compensation expense for the year ended December 31, 2013 reflects $1.2 million of expense recognized during such period that was associated with restricted stock granted in March 2013 under the Company’s firm profit participation bonus plan or office profit participation bonus plans in respect of 2012. Stock-based payments under such plans were first made in 2013 in respect of 2012. See Note 3 to the Company’s consolidated financial statements for further information regarding the Company’s accounting policies relating to its stock compensation. |
28
Table of Contents
| Item 7. | Management’s Discussion and Analysis of Financial Condition and Results of Operations |
The following discussion should be read in conjunction with the Selected Financial Data and our audited consolidated financial statements and the accompanying notes thereto included elsewhere herein. The following discussion is based on the consolidated results of Holliday GP, the Operating Partnerships and HFF, Inc. In addition to historical information, the following discussion also contains forward-looking statements that include risks and uncertainties. Our actual results may differ materially from those anticipated in these forward-looking statements as a result of certain factors, including those factors set forth under Item 1A — “Risk Factors” of this Annual Report on Form 10-K.
Overview
Our Business
We are, based on transaction volume, one of the leading providers of commercial real estate and capital markets services to both the users and providers of capital in the U.S. commercial real estate industry and are one of the largest full-service commercial real estate financial intermediaries in the country. We operate out of 23 offices nationwide with approximately 721 associates and approximately 277 transaction professionals. During 2014, we advised on approximately $65.0 billion of completed commercial real estate transactions, a 16.6% increase compared to the approximately $55.8 billion of completed transactions we advised on in 2013.
Substantially all of our revenues are in the form of capital markets services fees collected from our clients, usually negotiated on a transaction-by-transaction basis. We also earn fees from commercial loan servicing activities. We believe that our multiple product offerings, diverse client mix, expertise in a wide range of property types and national platform have the potential to create a diversified revenue stream within the U.S. commercial real estate sector. Our revenues and net income were $425.9 million and $61.3 million, respectively, for the year ended December 31, 2014, compared to revenues and net income of $355.6 million and $51.4 million, respectively, for the year ended December 31, 2013.
Our business may be significantly affected by factors outside of our control, particularly including:
| • | Economic and commercial real estate market downturns. Our business is dependent on international and domestic economic conditions and the demand for commercial real estate and related services in the markets in which we operate. A slow-down, a significant downturn and/or a recession in either the global economy and/or the domestic economy, including but not limited to even a regional economic downturn, could adversely affect our business. A general decline in acquisition and disposition activity, as well as a general decline in commercial real estate investment activity, can lead to a reduction in fees and commissions for arranging such transactions, as well as in fees and commissions for arranging financing for acquirers and property owners that are seeking to recapitalize their existing properties. Such a general decline can also lead to a significant reduction in our loan servicing activities, due to increased delinquencies and defaults and lack of additional loans that we would have otherwise added to our loan servicing portfolio. |
| • | Global and domestic credit and liquidity issues. Global and domestic credit and liquidity issues have in the recent past led to an economic downturn, including a commercial real estate market downturn. This downturn in turn led to a decrease in transaction activity and lower values. Restrictions on the availability of capital, both debt and/or equity, created significant reductions, and could in the future create further reductions of the liquidity in and flow of capital to the commercial real estate markets. These restrictions also caused, and could in the future cause, commercial real estate prices to decrease due to the reduced amount of equity capital and debt financing available. |
| • | Decreased investment allocation to commercial real estate class. Allocations to commercial real estate as an asset class for investment portfolio diversification may decrease for a number of reasons beyond our control, including but not limited to poor performance of the asset class relative to other asset classes or |
29
Table of Contents
| the superior performance of other asset classes when compared with continued good performance of the commercial real estate asset class or the poor performance of all asset classes. In addition, while commercial real estate is now viewed as an accepted and valid class for portfolio diversification, if this perception changes, there could be a significant reduction in the amount of debt and equity capital available in the commercial real estate sector. |
| • | Fluctuations in interest rates. Significant fluctuations in interest rates as well as steady and protracted movements of interest rates in one direction (increases or decreases) could adversely affect the operation and income of commercial real estate properties, as well as the demand from investors for commercial real estate investments. Both of these events could adversely affect investor demand and the supply of capital for debt and equity investments in commercial real estate. In particular, increased interest rates may cause prices to decrease due to the increased costs of obtaining financing and could lead to decreases in purchase and sale activities, thereby reducing the amounts of investment sales and loan originations and related servicing fees. If our debt placement and investment sales originations and servicing businesses are negatively impacted, it is likely that our other lines of business would also suffer due to the relationship among our various capital markets services. |
The factors discussed above have adversely affected and continue to be a risk to our business, as evidenced by the effects of the significant recent disruptions in the global capital and credit markets, and in particular the domestic capital markets. In particular, global and domestic credit and liquidity issues and reductions in debt and/or equity allocations to commercial real estate reduced, and could in the future reduce, the number of acquisitions, dispositions and loan originations, as well as the respective number of transactions and transaction volumes, which could in turn adversely affect our capital markets services revenues including our servicing revenue. While conditions in 2011 through 2014 have generally improved, the global and domestic credit and liquidity issues, coupled with the global and domestic economic recession/slow down as well as other global and domestic macro events beyond our control, could reduce in the future the number of acquisitions, dispositions and loan originations, as well as the respective number of transactions and transaction volumes. This has had, and could again have in the future, a significant adverse effect on our capital markets services revenues (including but not limited to our servicing revenues). The significant balance sheet issues of many CMBS lenders, banks, life insurance companies, mortgage REITS and debt funds, captive finance companies and other financial institutions have adversely affected, and could again in the future adversely affect, the flow of commercial mortgage debt to the U.S. capital markets, and, in turn, could potentially adversely affect all of our capital markets services platforms and resulting revenues.
Other factors that may adversely affect our business are discussed under the heading “Forward-Looking Statements” and under the caption “Risk Factors” in this Annual Report on Form 10-K.
Key Financial Measures and Indicators
Revenues
Substantially all of our revenues are derived from capital markets services. These capital markets services revenues are in the form of fees collected from our clients, usually negotiated on a transaction-by-transaction basis, which includes origination fees, investment sales fees earned for brokering sales of commercial real estate, loan servicing fees and loan sales and other production fees. We also earn interest on mortgage notes receivable during the period between the origination of the loan and the subsequent sale to Freddie Mac in connection with our participation in the Freddie Mac Program Plus Seller Servicer program. For the year ended December 31, 2014, we had total revenues of $425.9 million, of which approximately 98.4% were attributable to capital markets services revenue, 1.0% were attributable to interest on mortgage notes receivable and 0.6% were attributable to other revenue sources. For the year ended December 31, 2013, our total revenues equaled $355.6 million, of which 98.8% were generated by our capital markets services, 0.6% were attributable to interest on mortgage notes receivable and 0.6% were attributable to other revenue sources.
30
Table of Contents
Total Revenues:
Capital markets services revenues. We earn our capital markets services revenue through the following activities and sources:
| • | Origination fees. Our origination fees are earned through the placement of debt and equity. Debt placements (along with investment sales fees — see below) represent the majority of our business, with approximately $32.1 billion and $27.8 billion of debt transaction volume in 2014 and 2013, respectively. Fees earned by HFF Securities for discretionary and non-discretionary equity capital raises and other investment banking services are also included with capital markets services revenue in our consolidated statements of income. We recognize origination revenues at the closing of the applicable financing and funding of capital, when such fees are generally collected. We recognize fees earned by HFF Securities at the time the capital is funded or committed, based on the underlying fee agreement, unless collectibility of our fee is not reasonably assured, in which case we recognize fees as they are collected. |
| • | Investment sales fees. We earn investment sales fees by acting as a broker for commercial real estate owners seeking to sell a property(ies) or an interest in a property(ies). We recognize investment sales revenues at the close and funding of the sale, when such fees are generally collected. |
| • | Loan servicing fees. We generate loan servicing fees through the provision of collection, remittance, recordkeeping, reporting and other related loan servicing functions, activities and services. We also earn fees through escrow balances maintained as a result of required reserve accounts and tax and insurance escrows for the loans we service. We recognize loan servicing revenues at the time services are rendered, provided the loans are current and the debt service payments are actually made by the borrowers. We recognize the other fees related to escrows and other activities at the time the fees are paid. |
| • | Loan sales and other production fees. We generate loan sales and other production fees through assisting our clients in their efforts to sell all or portions of commercial real estate debt notes. We recognize loan sales and other production revenues at the close and funding of the capital to consummate a sale, when such fees are generally collected. |
Interest on mortgage notes receivable. We recognize interest income on the accrual basis during the approximately one month holding period based on the contract interest rate in the loan that is to be purchased by Freddie Mac in connection with our participation in the Freddie Mac Program Plus Seller Servicer program, provided that the debt service is paid by the borrower.
Other. Our other revenues include expense reimbursements from clients related to out-of-pocket costs incurred, which reimbursements are considered revenue for accounting purposes.
A substantial portion of our transactions are success based, with a small percentage including retainer fees (such retainer fees typically being included in a success-based fee upon the closing of a transaction) and/or break fees. Transactions that are terminated before completion will sometimes generate breakage fees, which are usually calculated as a set amount or a percentage (which varies by deal size and amount of work done at the time of breakage) of the fee we would have received had the transaction closed. The amount and timing of all of the fees paid vary by the type of transaction and are generally negotiated on a transaction-by-transaction basis.
Costs and Expenses
The largest components of our expenses are our operating expenses, which consist of cost of services, personnel expenses not directly attributable to providing services to our clients, occupancy expenses, travel and entertainment expenses, supplies, research and printing expenses and other expenses. For the years ended December 31, 2014 and 2013, our total operating expenses were $341.1 million and $285.6 million, respectively.
31
Table of Contents
Operating Expenses:
Cost of Services. The largest portion of our expenses is cost of services. We consider employee expenses directly attributable to providing services to our clients and certain purchased services to be directly attributable to the generation of our capital markets services revenue, and classify these expenses as cost of services in the consolidated statements of income. These employee expenses include employee-related compensation and benefits. Most of our transaction professionals are paid commissions; however, there are some transaction professionals who are initially paid a salary or draw with commissions credited against the salary or draw. Additionally, some transaction professionals are paid super-commissions (as defined in their respective employment contracts) based on successfully achieved contractual performance based metrics. Analysts, who support transaction professionals in executing transactions, are paid a salary plus a discretionary bonus, which is usually calculated as a percentage of an analyst bonus pool or as direct bonuses for each transaction, depending on the policy of each regional office. All other employees may receive a combination of salary and an incentive bonus based on performance or job function.
Personnel. Personnel expenses include employee-related compensation and benefits that are not directly attributable to providing services to our clients, profit participation bonuses, stock based compensation and any other incentive bonus compensation that is not directly attributable to providing services to our clients. Offices or lines of business that generate profit margins of 14.5% or more are entitled to profit participation bonuses equal to 15% of adjusted operating income (as defined in the HFF LP or HFF Securities profit participation bonus plan, as applicable) generated by the office or line of business. The allocation of the office profit participation bonus payment to the employees is determined by the office head with a review by the managing member of HFF LP or HFF Securities, as the case may be, provided that any profit participation bonuses to be paid to any executive officer or inside director of HFF, Inc. must be approved in advance by our board of directors or an appropriate committee thereof. In 2014 and 2013, total office profit participation bonus expense was approximately 17.7% and 18.1% respectively of operating income before the office and firm profit participation bonus expense. This decreased percentage is due to lower interest and other income components that impact the office profit participation bonus during 2014. Due to vesting conditions within the office profit participation plan, approximately 12% and 2% of the 2014 total bonus amount is expected to be expensed in 2015 and 2016, respectively.
In addition, in January 2011, we adopted the HFF, Inc. firm profit participation bonus plan. For each calendar year, beginning in 2011, if we achieve a 17.5% or greater adjusted operating income margin (as defined under such plan), a bonus pool is funded by a percentage, ranging from 15% to 25%, of our adjusted operating income (as defined under such plan) beyond predefined adjusted operating income margin thresholds ranging from 17.5% to 27.5%. Members of the executive and leadership committees of the Operating Partnerships, as well as others within the Operating Partnerships, are eligible to receive a bonus payment under the firm profit participation bonus plan. The firm profit participation bonus plan is administered by our chief executive officer, provided that any profit participation bonuses to be paid to any executive officer or inside director of HFF, Inc. must be approved in advance by our board of directors or an appropriate committee thereof. In 2014 and 2013, total firm profit participation bonus expense was approximately 4.2% and 4.9% of operating income before the firm profit participation bonus expense. Due to vesting conditions within the firm profit participation plan, approximately 23% and 4% of the 2014 total bonus amount is expected to be expensed in 2015 and 2016, respectively.
Stock Based Compensation. Effective January 1, 2006, the Company adopted ASC 718, Compensation — Stock Compensation (ASC 718), using the modified prospective method. Under this method, the Company recognizes compensation costs based on grant-date fair value for all share-based awards granted, modified or settled after January 1, 2006, as well as for any awards that were granted prior to the adoption for which requisite service has not been provided as of January 1, 2006. The Company did not grant any share-based awards prior to January 31, 2007. ASC 718 requires the measurement and recognition of compensation expense for all stock-based payment awards made to employees and directors, including employee stock options and other forms of
32
Table of Contents
equity compensation based on estimated fair values. The Company estimates the grant-date fair value of stock options using the Black-Scholes option-pricing model. The fair value of the restricted stock awards is calculated as the market value of the Company’s Class A common stock on the date of grant. The Company also had restricted stock awards that were accounted for as liability awards and required remeasurement to fair value at the end of each reporting period, the total expense for which was $3.3 million and $6.4 million in 2014 and 2013, respectively. These liability awards fully vested on March 1, 2014. The Company’s awards are subject to graded or cliff vesting. Compensation expense is adjusted for estimated forfeitures and is recognized on a straight-line basis over the requisite service period of the award. Forfeiture assumptions for all stock-based payment awards are evaluated on a quarterly basis and updated as necessary.
Expense associated with the stock component of estimated incentive payouts under the Company’s firm profit participation bonus plan or office profit participation bonus plans that are anticipated to be paid in respect of the applicable year is recorded as incentive compensation expense within personnel expenses in the Company’s consolidated statements of income during the year to which the expense relates. Following the award, if any, of the related incentive payout, the stock component expense is reclassified as stock compensation costs within personnel expenses. See Note 2 to the Company’s consolidated financial statements for further information regarding the Company’s accounting policies relating to its firm profit participation bonus plan and office profit participation bonus plans.
Occupancy. Occupancy expenses include rental expenses and other expenses related to our 23 offices nationwide.
Travel and entertainment. Travel and entertainment expenses include travel and other entertainment expenses incurred in conducting our business activities.
Supplies, research and printing. Supplies, research and printing expenses represent expenses related to office supplies, market and other research and printing.
Other. The balance of our operating expenses include costs for insurance, professional fees, depreciation and amortization, interest on our warehouse line of credit and other operating expenses. We refer to all of these expenses below as “Other” expenses.
Interest and Other Income, net:
Interest and other income, net consists of income recognized upon the initial recording of mortgage servicing rights for which no consideration is exchanged, gains on the sale of loans, gains on the sale of mortgage servicing rights, securitization compensation from the sale of mortgage servicing rights that were part of a securitization pool, trading profits on certain Fannie Mae loans and interest earned from the investment of our cash and cash equivalents and short-term investments.
Interest Expense:
Interest expense represents the interest on our outstanding debt instruments.
(Increase) Decrease in Payable Under the Tax Receivable Agreement:
The increase or decrease in the payable under the tax receivable agreement represents the increase or decrease in the estimated tax benefits owed to HFF Holdings under the tax receivable agreement due to a change in the effective tax rate used to value the deferred tax benefit and any changes in the valuation allowance on the deferred tax assets. This increase or decrease in tax benefits owed to HFF Holdings represents 85% of the increase or decrease in the related deferred tax asset.
33
Table of Contents
Income Tax Expense:
Following our initial public offering, the Operating Partnerships have operated and will continue to operate in the U.S. as partnerships for U.S. federal income tax purposes. In addition, however, the Company is subject to additional entity-level taxes that are reflected in our consolidated financial statements.
The Company accounts for income taxes under the asset and liability method. Deferred tax assets and liabilities are recognized for future tax consequences attributable to differences between the financial statement carrying amounts of existing assets and liabilities and their respective tax bases, and for tax losses and tax credit carryforwards, if any. Deferred tax assets and liabilities are measured using tax rates expected to apply to taxable income in the years in which those temporary differences are expected to be recovered or settled. The effect on deferred tax assets and liabilities of a change in tax rates will be recognized in income in the period of the tax rate change. In assessing the realizability of deferred tax assets, the Company considers whether it is more likely than not that some portion or all of the deferred tax assets will not be realized.
Our effective tax rate is sensitive to several factors including changes in the mix of our geographic profitability. We evaluate our estimated tax rate on a quarterly basis to reflect changes in: (i) our geographic mix of income, (ii) legislative actions on statutory tax rates and (iii) tax planning for jurisdictions affected by double taxation. We continually seek to develop and implement potential strategies and/or actions that would reduce our overall effective tax rate.
Noncontrolling Interest:
As the sole stockholder of Holliday GP (the sole general partner of the Operating Partnerships), we operate and control all of the business and affairs of the Operating Partnerships. The limited partners in the Operating Partnerships do not have kick-out rights or other substantive participating rights. We consolidate the financial results of the Operating Partnerships, and the prior ownership interest of HFF Holdings in the Operating Partnerships is treated as a noncontrolling interest in our consolidated financial statements. HFF Holdings through its wholly-owned subsidiary (Holdings Sub), and we, through our wholly-owned subsidiaries (Partnership Holdings and Holliday GP), were the only partners of the Operating Partnerships following the Reorganization Transactions. As of August 31, 2012, HFF Holdings had exchanged all of its remaining interests in the Operating Partnerships and therefore we, through our wholly-owned subsidiaries, became and continue to be the only equity holder of the Operating Partnerships.
Results of Operations
Following is a discussion of our results of operation for the years ended December 31, 2014, 2013 and 2012. The tables included in the period comparisons below provide summaries of our results of operations. The period-to-period comparisons of financial results are not necessarily indicative of future results.
34
Table of Contents
Year Ended December 31, 2014 Compared to Year Ended December 31, 2013
| For The Year Ended December 31, | ||||||||||||||||||||||||
| 2014 | 2013 | Total Dollar Change |
Total Percentage Change |
|||||||||||||||||||||
| % of | % of | |||||||||||||||||||||||
| Dollars | Revenue | Dollars | Revenue | |||||||||||||||||||||
| (Dollars in thousands, unless percentages) | ||||||||||||||||||||||||
| Revenues |
||||||||||||||||||||||||
| Capital markets services revenue |
$ | 418,969 | 98.4 | % | $ | 351,253 | 98.8 | % | $ | 67,716 | 19.3 | % | ||||||||||||
| Interest on mortgage notes receivable |
4,603 | 1.0 | % | 2,119 | 0.6 | % | 2,484 | 117.2 | % | |||||||||||||||
| Other |
2,346 | 0.6 | % | 2,233 | 0.6 | % | 113 | 5.1 | % | |||||||||||||||
|
|
|
|
|
|
|
|
|
|
|
|
|
|||||||||||||
| Total revenues |
425,918 | 100.0 | % | 355,605 | 100.0 | % | 70,313 | 19.8 | % | |||||||||||||||
| Operating expenses |
||||||||||||||||||||||||
| Cost of services |
242,393 | 56.9 | % | 202,542 | 57.0 | % | 39,851 | 19.7 | % | |||||||||||||||
| Personnel |
47,390 | 11.1 | % | 40,685 | 11.4 | % | 6,705 | 16.5 | % | |||||||||||||||
| Occupancy |
9,848 | 2.3 | % | 8,909 | 2.5 | % | 939 | 10.5 | % | |||||||||||||||
| Travel and entertainment |
12,304 | 2.9 | % | 9,497 | 2.7 | % | 2,807 | 29.6 | % | |||||||||||||||
| Supplies, research and printing |
6,310 | 1.5 | % | 4,922 | 1.4 | % | 1,388 | 28.2 | % | |||||||||||||||
| Other |
22,846 | 5.4 | % | 19,073 | 5.4 | % | 3,773 | 19.8 | % | |||||||||||||||
|
|
|
|
|
|
|
|
|
|
|
|
|
|||||||||||||
| Total operating expenses |
341,091 | 80.1 | % | 285,628 | 80.3 | % | 55,463 | 19.4 | % | |||||||||||||||
|
|
|
|
|
|
|
|
|
|
|
|
|
|||||||||||||
| Operating income |
84,827 | 19.9 | % | 69,977 | 19.7 | % | 14,850 | 21.2 | % | |||||||||||||||
| Interest and other income, net |
17,926 | 4.2 | % | 17,100 | 4.8 | % | 826 | 4.8 | % | |||||||||||||||
| Interest expense |
(41 | ) | 0.0 | % | (33 | ) | (0.0 | )% | (8 | ) | 24.2 | % | ||||||||||||
| (Increase) decrease in payable under the tax receivable agreement |
800 | 0.2 | % | (1,040 | ) | (0.3 | )% | 1,840 | (176.9 | )% | ||||||||||||||
|
|
|
|
|
|
|
|
|
|
|
|
|
|||||||||||||
| Income before taxes |
103,512 | 24.3 | % | 86,004 | 24.2 | % | 17,508 | 20.4 | % | |||||||||||||||
| Income tax expense |
42,226 | 9.9 | % | 34,578 | 9.7 | % | 7,648 | 22.1 | % | |||||||||||||||
|
|
|
|
|
|
|
|
|
|
|
|
|
|||||||||||||
| Net income |
$ | 61,286 | 14.4 | % | $ | 51,426 | 14.5 | % | $ | 9,860 | 19.2 | % | ||||||||||||
|
|
|
|
|
|
|
|
|
|
|
|
|
|||||||||||||
| Adjusted EBITDA (1) |
$ | 110,110 | 25.9 | % | $ | 96,948 | 27.3 | % | $ | 13,162 | 13.6 | % | ||||||||||||
| (1) | The Company defines Adjusted EBITDA as net income attributable to controlling interest before (i) interest expense, (ii) income tax expense, (iii) depreciation and amortization, (iv) net income attributable to the noncontrolling interest, (v) stock-based compensation expense, which is a non-cash charge, (vi) income recognized on the initial recording of mortgage servicing rights that are acquired with no initial consideration, which is also a non-cash income amount that can fluctuate significantly based on the level of mortgage servicing right volumes, and (vii) the increase (decrease) in payable under the tax receivable agreement, which represents changes in a liability recorded on the Company’s consolidated balance sheet determined by the ongoing remeasurement of related deferred tax assets and, therefore, can be income or expense in the Company’s consolidated statement of income in any individual period. The Company uses Adjusted EBITDA in its business operations to, among other things, evaluate the performance of its business, develop budgets and measure its performance against those budgets. The Company also believes that analysts and investors use Adjusted EBITDA as supplemental measures to evaluate its overall operating performance. However, Adjusted EBITDA has material limitations as an analytical tool and should not be considered in isolation, or as a substitute for analysis of the Company’s results as reported under GAAP. The Company finds Adjusted EBITDA as a useful tool to assist in evaluating performance because it eliminates items related to capital structure and taxes, including, the Company’s tax receivable agreement. Note that the Company classifies the interest expense on its warehouse lines of credit as an operating expense and, accordingly, it is not eliminated from net income attributable to controlling interest in determining Adjusted EBITDA. Some of the items that the Company has eliminated from net income attributable to controlling interest in determining Adjusted EBITDA are significant to the Company’s business. For example, (i) interest expense is a necessary element of the Company’s costs and ability to |
35
Table of Contents
| generate revenue because it incurs interest expense related to any outstanding indebtedness, (ii) payment of income taxes is a necessary element of the Company’s costs and (iii) depreciation and amortization are necessary elements of the Company’s costs. |
| Any measure that eliminates components of the Company’s capital structure and costs associated with the Company’s operations has material limitations as a performance measure. In light of the foregoing limitations, the Company does not rely solely on Adjusted EBITDA as a performance measure and also considers its GAAP results. Adjusted EBITDA is not a measurement of the Company’s financial performance under GAAP and should not be considered as an alternative to net income, operating income or any other measures derived in accordance with GAAP. Because Adjusted EBITDA is not calculated in the same manner by all companies, it may not be comparable to other similarly titled measures used by other companies. |
Revenues. Our total revenues were $425.9 million for the year ended December 31, 2014 compared to $355.6 million for the same period in 2013, an increase of $70.3 million, or 19.8%. Revenues increased primarily as a result of a 16.6% increase in production volumes and related revenues in a majority of our capital markets services platforms. There was one unusually large investment sale transaction during 2014 and two unusually large investment sale transactions during 2013. If we would adjust the 2014 and 2013 production volumes to exclude these transactions, the Company’s production volume would have increased by approximately 22.2% from 2013 to 2014.
| • | The revenues we generated from capital markets services for the year ended December 31, 2014 increased $67.7 million, or 19.3%, to $419.0 million from $351.3 million for the same period in 2013. The increase is primarily attributable to the 16.6% increase in production volumes. |
| • | The revenues derived from interest on mortgage notes receivable was $4.6 million for the year ended December 31, 2014 compared to $2.1 million for the same period in 2013, an increase of $2.5 million, or 117.2 %. The increase is due to a higher average loan value and an increase in the number of loans originated in our participation in Freddie Mac’s Program Plus Seller Servicer® Program during 2014 as compared to 2013. |
| • | The other revenues we earned, which include expense reimbursements from clients related to out-of-pocket costs incurred and vary on a transaction-by-transaction basis, were $2.3 million for the year ended December 31, 2014 compared to $2.2 million for the same period in 2013, an increase of approximately $0.1 million, or 5.1%. |
Total Operating Expenses. Our total operating expenses were $341.1 million for the year ended December 31, 2014 compared to $285.6 million for the same period in 2013, an increase of $55.5 million, or 19.4%. Expenses increased primarily due to increased compensation-related costs within cost of services and personnel costs as a result of increases in commissions and other incentive compensation directly related to the increase in capital markets services revenue, an increase in headcount and an increase in performance-based compensation. Additionally, due to the increased production volume and headcount, we experienced increased expenses for travel and entertainment and occupancy.
| • | The costs of services for the year ended December 31, 2014 increased approximately $39.9 million, or 19.7%, to $242.4 million from $202.5 million for the same period in 2013. The increase is primarily the result of the increase in commissions and other incentive compensation directly related to the 19.3% increase in capital markets services revenues. Additionally, contributing to the increase in cost of services are higher salary and fringe benefit costs from increased headcount to support the increase in production volume. Cost of services as a percentage of capital markets services revenues were approximately 57.9% and 57.7% for the years ended December 31, 2014 and December 31, 2013, respectively. This percentage increase in 2014 is primarily attributable to the fixed portion of cost of services, such as salaries for our analysts and fringe benefit costs, increasing at a higher percentage than the increase in capital markets services revenues. |
36
Table of Contents
| • | Personnel expenses that are not directly attributable to providing services to our clients for the year ended December 31, 2014 increased $6.7 million, or 16.5%, to $47.4 million from $40.7 million for the same period in 2013. The increase is primarily related to an increase in salaries, incentive compensation, stock compensation and benefit costs. Additionally, a portion of the increase is related to a $2.9 million increase in the 2014 firm and office profit participation plan expense resulting from the higher operating income during the year ended December 31, 2014. Personnel expenses are impacted quarterly by the adjustments made to accrue for the estimated expense associated with the performance based firm and office profit participation plans. Both the firm and office profit participation plans allow for payments in the form of both cash and share-based awards based on the decision of the Company’s board of directors. |
The stock compensation cost, which is included in personnel expenses, for the year ended December 31, 2014 was $9.8 million as compared to $8.3 million for the same period in 2013, an increase of $1.5 million. This increase is primarily due to increased expense of $3.9 million for the restricted stock awards granted in January 2014, of which there was no such cost in 2013. This increase was partially offset by a decrease in stock compensation costs of $3.1 million for the mark-to-market adjustment on restricted stock awards accounted for as liability awards which resulted in $3.3 million and $6.4 million of expense in 2014 and 2013, respectively. These liability awards fully vested on March 1, 2014. At December 31, 2014, there was approximately $17.7 million of unrecognized compensation cost related to share-based awards. The weighted average remaining contractual term of the nonvested restricted stock units is 3.5 years as of December 31, 2014.
| • | Occupancy, travel and entertainment, and supplies, research and printing expenses for the year ended December 31, 2014 increased $5.1 million, or 22.0%, to $28.5 million compared to the same period in 2013. This increase is primarily due to increased occupancy costs associated with our increased headcount and increased supplies, research and printing and travel and entertainment costs stemming from the increase in capital markets services revenues. |
| • | Other expenses, including costs for insurance, professional fees, depreciation and amortization, interest on our warehouse line of credit and other operating expenses, were $22.8 million in the year ended December 31, 2014, an increase of $3.8 million, or 19.8%, versus $19.1 million in the year ended December 31, 2013. This increase is primarily related to an increase in our interest expense on our warehouse lines of credit supporting our Freddie Mac Program Plus Seller Servicer business of $1.2 million, an increase of $1.1 million in other operating expenses and an increase of $1.0 million in depreciation and amortization. |
Operating income. Our operating income in 2014 was $84.8 million, an increase of $14.9 million from $70.0 million in 2013 attributable to the factors discussed above.
Interest and other income, net. Interest and other income, net in 2014 increased $0.8 million, or 4.8%, to $17.9 million from $17.1 million in 2013. This increase was primarily due to increased income from a higher number of loans originated in our participation in Freddie Mac’s Program Plus Seller Servicer® Program during 2014 as compared to 2013, partially offset by a decrease in the gain on sale of mortgage servicing rights and securitization compensation from the sale of certain mortgage servicing rights that were part of a securitization pool.
Interest expense. The interest expense we incurred during the year ended December 31, 2014 totaled $41,000, compared to $33,000 of similar expenses incurred in the year ended December 31, 2013.
Net Income. Our net income for the year ended December 31, 2014 was $61.3 million, an increase of $9.9 million, or 19.2%, versus $51.4 million for the same fiscal period in 2013. In addition to the factors affecting operating income, interest and other income, net and interest expense discussed above, other factors impacting net income included:
| • | The decrease in the payable under the tax receivable agreement of $0.8 million and an increase of $1.0 million for the years ended December 31, 2014 and 2013, respectively, primarily reflects the change |
37
Table of Contents
| in the estimated tax benefits owed to HFF Holdings under the tax receivable agreement as we are obligated to pay HFF Holdings 85% of cash savings, if any, in U.S. federal, state and local income tax that we realize as a result of the increase in tax basis pursuant to our election under Section 754. Each year we update the tax rates used to measure the deferred tax assets which resulted in a decrease in deferred tax assets of $0.8 million and an increase of $1.2 million for 2014 and 2013, respectively, as such, 85% of these amounts impacted the amounts anticipated to be paid to HFF Holdings and therefore we decreased the payable under the tax receivable agreement by $0.8 million in 2014 and increased it by $1.0 million in 2013. |
| • | Income tax expense was approximately $42.2 million for the year ended December 31, 2014, an increase of approximately $7.6 million over $34.6 million in the year ended December 31, 2014. This increase is primarily due to the higher income before income taxes in 2014 as compared to 2013. During the year ended December 31, 2014, the Company recorded current income tax expense of $27.2 million and deferred income tax expense of approximately $15.0 million. During the year ended December 31, 2013, the Company recorded current income tax expense of $25.7 million and a deferred income tax expense of $8.8 million. For further detail relating to the Operating Partnerships’ tax basis step-up election under Section 754, refer to Note 13 to our consolidated financial statements. |
Year Ended December 31, 2013 Compared to Year Ended December 31, 2012
| For The Year Ended December 31, | ||||||||||||||||||||||||
| 2013 | 2012 | Total Dollar Change |
Total Percentage Change |
|||||||||||||||||||||
| % of | % of | |||||||||||||||||||||||
| Dollars | Revenue | Dollars | Revenue | |||||||||||||||||||||
| (Dollars in thousands, unless percentages) | ||||||||||||||||||||||||
| Revenues |
||||||||||||||||||||||||
| Capital markets services revenue |
$ | 351,253 | 98.8 | % | $ | 276,907 | 97.2 | % | $ | 74,346 | 26.8 | % | ||||||||||||
| Interest on mortgage notes receivable |
2,119 | 0.6 | % | 5,990 | 2.1 | % | (3,871 | ) | (64.6 | )% | ||||||||||||||
| Other |
2,233 | 0.6 | % | 2,077 | 0.7 | % | 156 | 7.5 | % | |||||||||||||||
|
|
|
|
|
|
|
|
|
|
|
|
|
|||||||||||||
| Total revenues |
355,605 | 100.0 | % | 284,974 | 100.0 | % | 70,631 | 24.8 | % | |||||||||||||||
| Operating expenses |
||||||||||||||||||||||||
| Cost of services |
202,542 | 57.0 | % | 163,937 | 57.5 | % | 38,605 | 23.5 | % | |||||||||||||||
| Personnel |
40,685 | 11.4 | % | 29,062 | 10.2 | % | 11,623 | 40.0 | % | |||||||||||||||
| Occupancy |
8,909 | 2.5 | % | 8,159 | 2.9 | % | 750 | 9.2 | % | |||||||||||||||
| Travel and entertainment |
9,497 | 2.7 | % | 7,825 | 2.7 | % | 1,672 | 21.4 | % | |||||||||||||||
| Supplies, research and printing |
4,922 | 1.4 | % | 5,089 | 1.8 | % | (167 | ) | (3.3 | )% | ||||||||||||||
| Other |
19,073 | 5.4 | % | 20,785 | 7.3 | % | (1,712 | ) | (8.2 | )% | ||||||||||||||
|
|
|
|
|
|
|
|
|
|
|
|
|
|||||||||||||
| Total operating expenses |
285,628 | 80.3 | % | 234,857 | 82.4 | % | 50,771 | 21.6 | % | |||||||||||||||
|
|
|
|
|
|
|
|
|
|
|
|
|
|||||||||||||
| Operating income |
69,977 | 19.7 | % | 50,117 | 17.6 | % | 19,860 | 39.6 | % | |||||||||||||||
| Interest and other income, net |
17,100 | 4.8 | % | 20,049 | 7.0 | % | (2,949 | ) | (14.7 | )% | ||||||||||||||
| Interest expense |
(33 | ) | (0.0 | )% | (42 | ) | (0.0 | )% | 9 | (21.4 | )% | |||||||||||||
| (Increase) decrease in payable under the tax receivable agreement |
(1,040 | ) | (0.3 | )% | (17,358 | ) | (6.1 | )% | 16,318 | (94.0 | )% | |||||||||||||
|
|
|
|
|
|
|
|
|
|
|
|
|
|||||||||||||
| Income before taxes |
86,004 | 24.2 | % | 52,766 | 18.5 | % | 33,238 | 63.0 | % | |||||||||||||||
| Income tax expense |
34,578 | 9.7 | % | 8,661 | 3.0 | % | 25,917 | 299.2 | % | |||||||||||||||
|
|
|
|
|
|
|
|
|
|
|
|
|
|||||||||||||
| Net income |
51,426 | 14.5 | % | 44,105 | 15.5 | % | 7,321 | 16.6 | % | |||||||||||||||
| Net income attributable to noncontrolling interest |
— | 0.0 | % | 243 | 0.1 | % | (243 | ) | (100.0 | )% | ||||||||||||||
|
|
|
|
|
|
|
|
|
|
|
|
|
|||||||||||||
| Net income attributable to controlling interest |
$ | 51,426 | 14.5 | % | $ | 43,862 | 15.4 | % | $ | 7,564 | 17.2 | % | ||||||||||||
|
|
|
|
|
|
|
|
|
|
|
|
|
|||||||||||||
| Adjusted EBITDA (1) |
$ | 96,948 | 27.3 | % | $ | 70,002 | 24.6 | % | $ | 26,946 | 38.5 | % | ||||||||||||
38
Table of Contents
| (2) | The Company defines Adjusted EBITDA as net income attributable to controlling interest before (i) interest expense, (ii) income tax expense, (iii) depreciation and amortization, (iv) net income attributable to the noncontrolling interest, (v) stock-based compensation expense, which is a non-cash charge, (vi) income recognized on the initial recording of mortgage servicing rights that are acquired with no initial consideration, which is also a non-cash income amount that can fluctuate significantly based on the level of mortgage servicing right volumes, and (vii) the increase (decrease) in payable under the tax receivable agreement, which represents changes in a liability recorded on the Company’s consolidated balance sheet determined by the ongoing remeasurement of related deferred tax assets and, therefore, can be income or expense in the Company’s consolidated statement of income in any individual period. The Company uses Adjusted EBITDA in its business operations to, among other things, evaluate the performance of its business, develop budgets and measure its performance against those budgets. The Company also believes that analysts and investors use Adjusted EBITDA as supplemental measures to evaluate its overall operating performance. However, Adjusted EBITDA has material limitations as an analytical tool and should not be considered in isolation, or as a substitute for analysis of the Company’s results as reported under GAAP. The Company finds Adjusted EBITDA as a useful tool to assist in evaluating performance because it eliminates items related to capital structure and taxes, including, the Company’s tax receivable agreement. Note that the Company classifies the interest expense on its warehouse lines of credit as an operating expense and, accordingly, it is not eliminated from net income attributable to controlling interest in determining Adjusted EBITDA. Some of the items that the Company has eliminated from net income attributable to controlling interest in determining Adjusted EBITDA are significant to the Company’s business. For example, (i) interest expense is a necessary element of the Company’s costs and ability to generate revenue because it incurs interest expense related to any outstanding indebtedness, (ii) payment of income taxes is a necessary element of the Company’s costs and (iii) depreciation and amortization are necessary elements of the Company’s costs. |
Any measure that eliminates components of the Company’s capital structure and costs associated with the Company’s operations has material limitations as a performance measure. In light of the foregoing limitations, the Company does not rely solely on Adjusted EBITDA as a performance measure and also considers its GAAP results. Adjusted EBITDA is not a measurement of the Company’s financial performance under GAAP and should not be considered as an alternative to net income, operating income or any other measures derived in accordance with GAAP. Because Adjusted EBITDA is not calculated in the same manner by all companies, it may not be comparable to other similarly titled measures used by other companies.
Revenues. Our total revenues were $355.6 million for the year ended December 31, 2013 compared to $285.0 million for the same period in 2012, an increase of $70.6 million, or 24.8%. Revenues increased primarily as a result of a 33.1% increase in production volumes and related revenues in a majority of our capital markets services platforms. There were two unusually large investment sale transactions during 2013. If we would adjust the 2013 production volumes to exclude these transactions, the Company’s production volume would have increased by approximately 24.8% from 2012 to 2013.
| • | The revenues we generated from capital markets services for the year ended December 31, 2013 increased $74.3 million, or 26.8%, to $351.3 million from $276.9 million for the same period in 2012. The increase is primarily attributable to the 33.1% increase in production volumes. |
| • | The revenues derived from interest on mortgage notes receivable was $2.1 million for the year ended December 31, 2013 compared to $6.0 million for the same period in 2012, a decrease of $3.9 million, or 64.6%. The decrease is due to a lower average loan value and a lower number of loans originated in our participation in Freddie Mac’s Program Plus Seller Servicer® Program during 2013 as compared to 2012. |
| • | The other revenues we earned, which include expense reimbursements from clients related to out-of-pocket costs incurred and vary on a transaction-by-transaction basis, were $2.2 million for the year ended December 31, 2013 compared to $2.1 million for the same period in 2012, an increase of approximately $0.2 million, or 7.5%. |
39
Table of Contents
Total Operating Expenses. Our total operating expenses were $285.6 million for the year ended December 31, 2013 compared to $234.9 million for the same period in 2012, an increase of $50.8 million, or 21.6%. Expenses increased primarily due to increased compensation-related costs within cost of services and personnel costs as a result of increases in commissions and other incentive compensation directly related to the increase in capital markets services revenue, an increase in headcount and an increase in performance-based compensation. Additionally, due to the increased production volume and headcount, we experienced increased expenses for supplies, research and printing, travel and entertainment, occupancy and interest on the warehouse line of credit.
| • | The costs of services for the year ended December 31, 2013 increased approximately $38.6 million, or 23.5%, to $202.5 million from $163.9 million for the same period in 2012. The increase is primarily the result of the increase in commissions and other incentive compensation directly related to the 26.8% increase in capital markets services revenues. Additionally, contributing to the increase in cost of services are higher salary and fringe benefit costs from increased headcount to support the increase in production volume. Cost of services as a percentage of capital markets services revenues were approximately 57.7% and 59.2% for the years ended December 31, 2013 and December 31, 2012, respectively. This percentage decrease in 2013 is primarily attributable to the fixed portion of cost of services, such as salaries for our analysts and fringe benefit costs, increasing at a lower percentage than the increase in capital markets services revenues. |
| • | Personnel expenses that are not directly attributable to providing services to our clients for the year ended December 31, 2013 increased $11.6 million, or 40.0%, to $40.7 million from $29.1 million for the same period in 2012. The increase is primarily related to an increase in salaries, incentive compensation, stock compensation and benefit costs. Additionally, a portion of the increase related to a $5.1 million increase in the 2013 firm and office profit participation plan expense resulting from the higher operating income during the year ending December 31, 2013. Personnel expenses are impacted quarterly by the adjustments made to accrue for the estimated expense associated with the performance-based firm and office profit participation plans. Both the firm and office profit participation plans allow for payments in the form of both cash and share-based awards based on the decision of the Company’s board of directors. |
The stock compensation cost, which is included in personnel expenses, for the year ended December 31, 2013 was $8.3 million as compared to $3.4 million for the same period in 2012, an increase of $4.9 million. This increase is primarily due to increased expense of $4.6 million for the mark-to-market adjustment on the restricted stock awards accounted for as liability awards. At December 31, 2013, there was approximately $1.0 million of unrecognized compensation cost related to share-based awards. The weighted average remaining contractual term of the nonvested restricted stock units is 0.2 years as of December 31, 2013.
| • | Occupancy, travel and entertainment, and supplies, research and printing expenses for the year ended December 31, 2013 increased $2.3 million, or 10.7%, to $23.3 million compared to the same period in 2012. This increase is primarily due to increased occupancy costs associated with our increased headcount and travel and entertainment costs stemming from the increase in capital markets services revenues. |
| • | Other expenses, including costs for insurance, professional fees, depreciation and amortization, interest on our warehouse line of credit and other operating expenses, were $19.1 million in the year ended December 31, 2013, a decrease of $1.7 million, or 8.2%, versus $20.8 million in the year ended December 31, 2012. This decrease is primarily related to a decrease in our interest expense on our warehouse lines of credit supporting our Freddie Mac Program Plus Seller Servicer business of $2.8 million which was partially offset by an increase in depreciation and amortization. |
Operating income. Our operating income in 2013 was $70.0 million, an increase of $19.9 million from $50.1 million in 2012 attributable to the factors discussed above.
40
Table of Contents
Interest and other income, net. Interest and other income, net in 2013 decreased $2.9 million, or 14.7%, to $17.1 million from $20.0 million in 2012. This decrease was primarily due to decreased income from our mortgage servicing rights and securitization compensation from the sale of certain mortgage servicing rights that were part of a securitization pool.
Interest expense. The interest expense we incurred during the year ended December 31, 2013 totaled $33,000, compared to $42,000 of similar expenses incurred in the year ended December 31, 2012.
Net Income. Our net income for the year ended December 31, 2013 was $51.4 million, an increase of $7.3 million, or 16.6%, versus $44.1 million for the same fiscal period in 2012. In addition to the factors affecting operating income, interest and other income, net and interest expense discussed above, other factors impacting net income included:
| • | The increase in the payable under the tax receivable agreement of $1.0 million and $17.4 million for the years ended December 31, 2013 and 2012, respectively, primarily reflects the increase in the estimated tax benefits owed to HFF Holdings under the tax receivable agreement as we are obligated to pay HFF Holdings 85% of cash savings, if any, in U.S. federal, state and local income tax that we realize as a result of the increase in tax basis pursuant to our election under Section 754. Each year we update the tax rates used to measure the deferred tax assets which resulted in an increase in deferred tax assets of $1.2 million and a decrease of $1.2 million for 2013 and 2012, respectively, as such, 85% of these amounts impacted the amounts anticipated to be paid to HFF Holdings and therefore we decreased the payable under the tax receivable agreement by $1.0 million in 2013 and increased it by $1.1 million in 2012. Additionally, during 2012, we reversed the remaining balance of the deferred tax asset valuation allowance of $21.9 million as management believes it is more likely than not that the deferred tax assets will be fully utilized. This reversal of the valuation allowance increased the payable under the tax receivable agreement by $18.6 million. |
| • | Income tax expense was approximately $34.6 million for the year ended December 31, 2013, an increase of approximately $25.9 million over $8.7 million in the year ended December 31, 2012. This increase is primarily due to the reversal of the deferred tax asset valuation allowance of $21.9 million during 2012. During the year ended December 31, 2013, the Company recorded current income tax expense of $25.7 million and deferred income tax expense of approximately $8.8 million. During the year ended December 31, 2012, the Company recorded current income tax expense of $16.3 million and a deferred income tax benefit of $7.7 million. For further detail relating to the Operating Partnerships’ tax basis step-up election under Section 754, refer to Note 13 to our consolidated financial statements. |
Net income attributable to noncontrolling interest was zero for the year ended December 31, 2013, representing the ownership interest of HFF Holdings in the Operating Partnerships, a decrease of $0.2 million from the same period of the prior year, as a result of the exchange of all of the remaining partnership units in the Operating Partnerships owned by HFF Holdings pursuant to the Exchange Right as of August 31, 2012.
Financial Condition
Total assets increased to $604.3 million at December 31, 2014 compared to $488.2 million at December 31, 2013 due primarily to:
| • | An increase in cash and cash equivalents of $30.8 million to $232.1 million at December 31, 2014 from $201.3 million at December 31, 2013, due in part to the increase in revenues and resulting increase in operating income and an increase in client advances relating to our Freddie Mac Program Plus Seller Servicer business of $24.1 million. Partially offsetting this increase in cash was the payment of a dividend of $68.2 million in 2014. |
| • | An increase in mortgage notes receivable of $91.5 million to $185.1 million at December 31, 2014 from $93.6 million at December 31, 2013 due to a higher average balance on loans outstanding related to our |
41
Table of Contents
| Freddie Mac Program Plus Seller Servicer business at December 31, 2014 as compared to December 31, 2013. |
| • | An increase in intangible assets, net of $3.9 million due to an increase in the initial recording of mortgage servicing rights. |
| • | An increase in property and equipment, net of $3.6 million due to the capitalization of assets relating to our increased office space. |
These increases were partially offset by a decrease in deferred tax asset, net of $15.0 million to $146.1 million at December 31, 2014 from $161.1 million at December 31, 2013, primarily due to the amortization of the section 754 step-up in basis.
Total liabilities increased to $417.8 million at December 31, 2014 compared to $312.6 million at December 31, 2013, due primarily to:
| • | An increase in our warehouse lines of credit of $91.5 million due to a higher average balance on loans outstanding related to our Freddie Mac Program Plus Seller Servicer business at December 31, 2014 as compared to December 31, 2013. |
| • | An increase in other current liabilities of $24.5 million primarily due to a $24.1 million increase in client advances relating to our Freddie Mac Program Plus Seller Servicer business at December 31, 2014 as compared to December 31, 2013. |
These increases were partially offset by a decrease in the payable under the tax receivable agreement of $11.5 million primarily due to the payment of $10.7 million to HFF Holdings for the 2013 tax year and a decrease of approximately $0.8 million from the remeasurement of the rates that impact the deferred tax asset.
Stockholders’ equity increased to $186.5 million at December 31, 2014 from $175.6 million at December 31, 2013 primarily due to the $61.3 million of net income earned during the year ended December 31, 2014 and the recording of stock based compensation of $23.1 million in 2014 which were partially offset by a dividend payment of $68.2 million and a payment of $6.3 million to purchase shares of Class A common stock in connection with the minimum employee statutory tax withholdings.
Cash Flows
Our historical cash flows are primarily related to the timing of receipt of transaction fees, the timing of payments under the tax receivable agreement and payment of commissions and bonuses to employees.
2014
Cash and cash equivalents increased $30.8 million in the year ended December 31, 2014. Net cash of $109.6 million was provided by operating activities, primarily resulting from $61.3 million of net income, $25.5 million increase in other accrued liabilities (which includes a $24.1 million increase in client advances), $2.5 million of proceeds from the sale of mortgage servicing rights and an increase in accrued compensation and related taxes of $11.3 million. These increases of cash were partially offset by a $10.7 million payment to HFF Holdings under the tax receivable agreement. Cash of $5.0 million was used for investing in property and equipment. Financing activities used $73.8 million of cash which was primarily due to a $68.2 million dividend payment that we made to holders of our Class A common stock on February 6, 2014. Additionally, payments on certain capital leases used $0.3 million, $6.3 million was used to purchase shares of Class A common stock in connection with the minimum employee statutory tax withholdings and we recognized a $1.0 million excess tax benefit related to share-based award activities.
42
Table of Contents
2013
Cash and cash equivalents increased $74.9 million in the year ended December 31, 2013. Net cash of $79.8 million was provided by operating activities, primarily resulting from $51.4 million of net income, $6.2 million of proceeds from the sale of mortgage servicing rights and an increase in accrued compensation and related taxes of $13.7 million. These increases of cash were partially offset by a $10.4 million payment to HFF Holdings under the tax receivable agreement. Cash of $3.3 million was used for investing in property and equipment. Financing activities used $1.6 million of cash which was primarily due to payments on capital leases of $0.3 million and the purchase shares of Class A common stock in connection with the minimum employee tax statutory withholdings of $1.7 million.
Liquidity and Capital Resources
Our current assets typically have consisted primarily of cash and cash equivalents and accounts receivable in relation to earned transaction fees. At December 31, 2014, our cash and cash equivalents of $232.1 million were invested or held at two financial institutions in a mix of money market funds and bank demand deposit accounts. Our current liabilities have typically consisted of accounts payable and accrued compensation. We regularly monitor our liquidity position, including cash levels, credit lines, interest and payments on debt, capital expenditures and matters relating to liquidity and to compliance with regulatory net capital requirements.
Over the twelve month period ended December 31, 2014, we generated approximately $109.6 million of cash from operations. Our short-term liquidity needs are typically related to compensation expenses and other operating expenses such as occupancy, supplies, marketing, professional fees and travel and entertainment. For the year ended December 31, 2014, we incurred approximately $341.1 million in total operating expenses. A large portion of our operating expenses are variable, highly correlated to our revenue streams and dependent on the collection of transaction fees. During the year ended December 31, 2014, approximately 66.4% of our operating expenses were variable expenses. Our cash flow generated from operations historically has been sufficient to enable us to meet our working capital needs. However, if the economy deteriorates in the future we may be unable to generate enough cash flow from operations to meet our operating needs and therefore we could use all or substantially all of our existing cash reserves on hand to support our operations. As of February 20, 2015, our cash and cash equivalents were $164.2 million. We currently believe that cash flows from operating activities and our existing cash balance will provide adequate liquidity and are sufficient to meet our working capital needs for the foreseeable future.
On January 20, 2015, our board of directors declared a special cash dividend of $1.80 per share of Class A common stock to stockholders of record on February 2, 2015. The aggregate dividend payment was paid on February 13, 2015 and totaled approximately $67.8 million based on the number of shares of Class A common stock then outstanding. Additionally, 49,383 restricted stock units (dividend units) were granted for those unvested and vested but not issued restricted stock units as of the record date of February 2, 2015. These dividend units follow the same vesting terms as the underlying restricted stock units. Additionally, on January 15, 2014, our board of directors declared a special cash dividend of $1.83 per share of Class A common stock to stockholders of record on January 27, 2014. The aggregate dividend payment was paid on February 6, 2014 and totaled approximately $68.2 million based on the number of shares of Class A common stock then outstanding. Additionally, 42,108 restricted stock units (dividend units) were granted for those unvested and vested but not issued restricted stock units as of the record date of January 27, 2014. These dividend units follow the same vesting terms as the underlying restricted stock units. We currently do not intend to pay any additional cash dividends on our Class A common stock. The declaration and payment of any future dividends will be at the sole discretion of our board of directors.
Our tax receivable agreement with HFF Holdings entered into in connection with our initial public offering provides for the payment by us to HFF Holdings of 85% of the amount of cash savings, if any, in U.S. federal, state and local income taxes that we actually realize as a result of the increases in tax basis and as a result of
43
Table of Contents
certain other tax benefits arising from our entering into the tax receivable agreement and making payments under that agreement. We have estimated that the payments that will be made to HFF Holdings will be $134.2 million, of which approximately $10.8 million is anticipated to be paid during 2015. Our liquidity needs related to our long term obligations are primarily related to our facility leases and capital lease obligations. Additionally, for the year ended December 31, 2014, we incurred approximately $9.8 million in occupancy expenses and approximately $41,000 in interest expense.
We are a party to an uncommitted $350 million financing arrangement with PNC Bank, N.A. (PNC) and an uncommitted $125 million financing arrangement with The Huntington National Bank (Huntington) to fund our Freddie Mac loan closings. Pursuant to these arrangements, PNC or Huntington funds the multifamily Freddie Mac loan closings on a transaction-by-transaction basis, with each loan being separately collateralized by a loan and mortgage on a multifamily property that is ultimately purchased by Freddie Mac. The PNC and Huntington National Bank financing arrangements are only for the purpose of supporting our participation in Freddie Mac’s Program Plus Seller Servicer program and cannot be used for any other purpose. In January 2015, the $350 million financing arrangement with PNC was increased by $500 million for a period of 15 days, at which time the arrangement reverts back to $350 million. Additionally, on January 27, 2015, HFF LP entered into an agreement with Huntington to increase the uncommitted financing agreement by $100 million for a period of the lesser of 60 days after the first advance or May 1, 2015. As of December 31, 2014, we had outstanding borrowings of $185.1 million under the PNC/Huntington National Bank arrangements and a corresponding amount of mortgage notes receivable. Non-cash activity totaling $91.5 million increased and $167.7 million decreased these financing arrangements and the corresponding mortgage notes receivable during the years ended December 31, 2014 and 2013, respectively. Although we believe that our current financing arrangements with PNC and Huntington National Bank are sufficient to meet our current needs in connection with our participation in Freddie Mac’s Program Plus Seller Servicer program, in the event we are not able to secure financing for our Freddie Mac loan closings, we will cease originating such Freddie Mac loans until we have available financing.
Critical Accounting Policies; Use of Estimates
We prepare our financial statements in accordance with U.S. generally accepted accounting principles. In applying many of these accounting principles, we make assumptions, estimates and/or judgments that affect the reported amounts of assets, liabilities, revenues and expenses in our consolidated financial statements. We base our estimates and judgments on historical experience and other assumptions that we believe are reasonable under the circumstances. These assumptions, estimates and/or judgments, however, are often subjective and our actual results may change negatively based on changing circumstances or changes in our analyses. If actual amounts are ultimately different from our estimates, the revisions are included in our results of operations for the period in which the actual amounts become known. We believe the following critical accounting policies could potentially produce materially different results if we were to change underlying assumptions, estimates and/or judgments. See the notes to our consolidated financial statements for a summary of our significant accounting policies.
Mortgage Servicing Rights. Our mortgage servicing rights are under agreements with third party lenders. These servicing rights are recorded at the lower of cost or market. Mortgage servicing rights do not trade in an active, open market with readily available observable prices and therefore are considered a Level 3 asset in the fair value hierarchy. Since there is no ready market value for the mortgage servicing rights, such as quoted market prices or prices based on sales or purchases of similar assets, the Company determines the fair value of the mortgage servicing rights by estimating the present value of future cash flows associated with servicing the loans. Management makes certain assumptions and judgments in estimating the fair value of servicing rights. The estimate is based on a number of assumptions, including the benefits of servicing (contractual servicing fees and interest on escrow and float balances), the cost of servicing, prepayment rates (including risk of default), an inflation rate, the expected life of the cash flows and the discount rate. The cost of servicing, prepayment rates and discount rates are the most sensitive factors affecting the estimated fair value of the servicing rights. Management estimates a market participant’s cost of servicing by analyzing the limited market activity and considering the Company’s own internal servicing costs. Management estimates the discount rate by considering
44
Table of Contents
the various risks involved in the future cash flows of the underlying loans which include the cancellation of servicing contracts, concentration in the life company portfolio and the incremental risk related to large loans. Management estimates the prepayment levels of the underlying mortgages by analyzing recent historical experience. Many of the commercial loans being serviced have financial penalties for prepayment or early payoff before the stated maturity date. As a result, the Company has consistently experienced a low level of loan runoff. The estimated value of the servicing rights is impacted by changes in these assumptions. As of December 31, 2014, the fair value and net book value of the Freddie Mac, CMBS and Life Company servicing rights were $26.0 million and $20.5 million, respectively. The most sensitive assumptions in estimating the fair value of the mortgage servicing rights are the level of prepayments, discount rate and cost of servicing. If the assumed level of prepayments increased 106%, the discount rate increased 51% or if there is a 15% increase in the cost of servicing at the stratum level, the estimated fair value of the servicing rights may result in the recorded mortgage servicing rights being potentially impaired and would require management to measure the amount of the impairment charge. The effect of a variation in each of these assumptions on the estimated fair value of the servicing rights is calculated independently without changing any other assumption. As of December 31, 2014, the fair value of the mortgage servicing rights was $26.0 million, or 12.3% of the total assets measured at fair value. Servicing rights are amortized in proportion to and over the period of estimated servicing income which results in an accelerated level of amortization over its expected life. We evaluate amortizable intangible assets on an annual basis, or more frequently if circumstances so indicate, for potential impairment.
Income Taxes. The Company accounts for income taxes under the asset and liability method. Deferred tax assets and liabilities are recognized for future tax consequences attributable to differences between the financial statement carrying amounts of existing assets and liabilities and their respective tax bases, and for tax losses and tax credit carryforwards, if any. Deferred tax assets and liabilities are measured using tax rates expected to apply to taxable income in the years in which those temporary differences are expected to be recovered or settled. The effect on deferred tax assets and liabilities of a change in tax rates are recognized in income in the period of the tax rate change. In assessing the realizability of deferred tax assets, the Company considers whether it is more likely than not that some portion or all of the deferred tax assets will not be realized.
Our effective tax rate is sensitive to several factors including changes in the mix of our geographic profitability. We evaluate our estimated tax rate on a quarterly basis to reflect changes in: (i) our geographic mix of income, (ii) legislative actions on statutory tax rates and (iii) tax planning for jurisdictions affected by double taxation. We continually seek to develop and implement potential strategies and/or actions that would reduce our overall effective tax rate.
The net deferred tax asset of $146.1 million at December 31, 2014 is comprised mainly of a $145.2 million deferred tax asset related to the Section 754 election tax basis step up. The deferred tax asset related to the Section 754 election tax basis step up of $145.2 million represents annual pre-tax deductions on the Section 754 basis step up and past payments under the tax receivable agreement of approximately $32.6 million in 2015 then increasing to $52.9 million in 2021 and then decreasing over the next nine years to approximately $0.1 million in 2030. In order to realize the anticipated pre-tax benefit of approximately $32.6 million in 2015, the Company needs to generate approximately $287 million in revenue, assuming a constant cost structure. In the event that the Company cannot realize the annual pre-tax benefit each year, the shortfall becomes a net operating loss that can be carried back 2 years to offset prior years’ taxable income or carried forward 20 years to offset future taxable income. If it is more likely than not that the Company would not be able to generate a sufficient level of taxable income through the carryforward period, a valuation allowance would be recorded as a charge to income tax expense and a proportional reduction in the payable under the tax receivable agreement which would be recorded as income in the consolidated statements of income. The trend in revenue growth over the next few years and through the amortization and carryforward periods is a key factor in assessing the realizability of the deferred tax assets
Leases. The Company leases all of its facilities under operating lease agreements. These lease agreements typically contain tenant improvement allowances. The Company records tenant improvement allowances as a
45
Table of Contents
leasehold improvement asset, included in property and equipment, net in the Consolidated Balance Sheets, and a related deferred rent liability and amortizes them on a straight-line basis over the shorter of the term of the lease or useful life of the asset as additional depreciation expense and a reduction to rent expense, respectively. Lease agreements sometimes contain rent escalation clauses or rent holidays, which are recognized on a straight-line basis over the life of the lease in accordance with ASC 840, Leases (ASC 840). Lease terms generally range from one to ten years. An analysis is performed on all equipment leases to determine whether a lease should be classified as a capital or an operating lease according to ASC 840.
Firm and Office Profit Participation Plans. The Company’s firm and office profit participation plans provide for payments in cash and share-based awards if certain performance targets are achieved during the year. The expense recorded for these plans is estimated during the year based on actual results at each interim reporting date and an estimate of future results for the remainder of the year. The plans allow for payments to be made in both cash and share-based awards, the composition of which is determined in the first calendar quarter of the subsequent year. Cash and share-based awards issued under these plans are subject to vesting conditions over the subsequent year, such that the total expense measured for these plans is recorded over the period from the beginning of the performance year through the vesting date. Based on an accounting policy election, the expense associated with the share-based component of the estimated incentive payout is recognized before the grant date of the stock due to the fact that the terms of the profit participation plans have been approved by the Company’s board of directors and the employees of the Company understand the requirements to earn the award. Expense associated with the stock component of estimated incentive payouts under the Company’s firm profit participation bonus plan or office profit participation bonus plans that are anticipated to be paid in respect of the applicable year is recorded as incentive compensation expense within personnel expenses in the Company’s consolidated statements of income during the year to which the expense relates. Following the award, if any, of the related incentive payout, the stock component expense is reclassified as stock compensation costs within personnel expenses. See Note 2 to the Company’s consolidated financial statements for further information regarding the Company’s accounting policies relating to its firm profit participation bonus plan and office profit participation bonus plans.
Mortgage Notes Receivable. The Company is qualified with Freddie Mac as a Freddie Mac Multifamily Program Plus® Seller/Servicer. Under this Program, the Company originates mortgages based on commitments from Freddie Mac, and then sells the loans to Freddie Mac approximately one month following the loan origination. The Company recognizes interest income on the accrual basis during this holding period based on the contract interest rate in the loan that will be purchased by Freddie Mac.
The loans are initially recorded and then subsequently sold to Freddie Mac at the Company’s cost. The Company records mortgage loans held for sale at period end at market value in accordance with the provisions of ASC 948, Financial Services-Mortgage Banking, which states that market value for mortgage loans covered by investor commitments shall be based on commitment prices. In the case of loans originated for Freddie Mac, the commitment price is equal to the Company’s cost due to the short time frame from the Company’s origination to the purchase of the loan by the investor, which is approximately 30 days. As a result, the Company does not deem there to be any potential lower of cost or market issues. The fair value of the mortgage notes receivable is considered a Level 2 asset in the fair value hierarchy as it is based on prices observable in the market for similar loans and equaled carrying value at December 31, 2014 and 2013.
Certain Information Concerning Off-Balance Sheet Arrangements
We do not currently invest in any off-balance sheet vehicles that provide liquidity, capital resources, market or credit risk support, or engage in any leasing activities that expose us to any liability that is not reflected in our consolidated financial statements.
46
Table of Contents
Contractual and Other Cash Obligations
The following table summarizes our contractual and other cash obligations at December 31, 2014 (dollars in thousands):
| Payments Due by Period | ||||||||||||||||||||
| Total | Less Than 1 Year |
1-3 Years |
4-5 Years |
More Than 5 Years |
||||||||||||||||
| Warehouse line of credit |
$ | 185,128 | $ | 185,128 | $ | — | $ | — | $ | — | ||||||||||
| Capital lease obligations |
766 | 337 | 429 | — | — | |||||||||||||||
| Operating lease obligations |
41,449 | 7,477 | 12,783 | 11,149 | 10,040 | |||||||||||||||
| Purchase obligations |
— | — | — | — | — | |||||||||||||||
| Employment agreements(1) |
3,340 | — | 3,340 | — | — | |||||||||||||||
|
|
|
|
|
|
|
|
|
|
|
|||||||||||
| Total contractual obligations |
$ | 230,683 | $ | 192,942 | $ | 16,552 | $ | 11,149 | $ | 10,040 | ||||||||||
|
|
|
|
|
|
|
|
|
|
|
|||||||||||
| (1) | From time to time we enter into employment agreements with our transaction professionals. Some of these agreements may include payments to be made to the individual at a specific time, if certain conditions have been met. The Company accrues for these payments over the life of the agreement. |
In connection with the Reorganization Transactions, HFF LP and HFF Securities made an election under Section 754 for 2007 and kept that election in effect for each taxable year in which an exchange of Operating Partnership partnership units for shares of Class A common stock occurred. The initial sale as a result of the Company’s initial public offering increased the tax basis of the assets owned by HFF LP and HFF Securities to their fair market value. This increase in tax basis allows us to reduce the amount of future tax payments to the extent that we have future taxable income. We are obligated, however, pursuant to our Tax Receivable Agreement with HFF Holdings, to pay to HFF Holdings, 85% of the amount of cash savings, if any, in U.S. federal, state and local income tax that we actually realize as a result of these increases in tax basis and as a result of certain other tax benefits arising from entering into the tax receivable agreement and making payments under that agreement. While the actual amount and timing of payments under the tax receivable agreement will depend upon a number of factors, including the amount and timing of taxable income generated in the future, changes in future tax rates, the value of individual assets, the portion of our payments under the tax receivable agreement constituting imputed interest and increases in the tax basis of our assets resulting in payments to HFF Holdings, we have estimated the payments that will be made to HFF Holdings will be $134.2 million, of which $10.8 million is anticipated to be paid in 2015, and have recorded this obligation to HFF Holdings as a liability on the consolidated balance sheets.
Seasonality
Our capital markets services revenue has historically been seasonal during normal economic and capital market conditions, which can affect an investor’s ability to compare our financial condition and results of operation on a quarter-by-quarter basis. This seasonality has caused our revenue, operating income, net income and cash flows from operating activities to be lower in the first six months of the year and higher in the second half of the year. The typical concentration of earnings and cash flows in the last six months of the year has historically been due to an industry-wide focus of clients to complete transactions towards the end of the calendar year. However, given the recent disruptions facing all global capital markets, and in particular the U.S. commercial real estate markets, this historical pattern of seasonality may or may not continue.
Effect of Inflation and/or Deflation
Inflation or deflation, or both, could significantly affect our compensation costs, particularly those not directly tied to our transaction professionals’ compensation, due to factors such as availability of capital and/or increased costs of capital. The rise of inflation could also significantly and adversely affect certain expenses,
47
Table of Contents
such as debt service costs, information technology and occupancy costs. To the extent that inflation and/or deflation results in rising interest rates and has other effects upon the commercial real estate markets in which we operate and, to a lesser extent, the securities markets, it may affect our financial position and results of operations by reducing the demand for commercial real estate and related services, which could have a material adverse effect on our financial condition. See “Risk Factors — General Economic Conditions and Commercial Real Estate Market Conditions.”
New Accounting Pronouncements Adopted
In January 2014, the Company adopted changes issued by the Financial Accounting Standards Board (FASB) that require an entity to net its liability for unrecognized tax positions against a net operating loss carryforward, a similar tax loss, or a tax credit carryforward when settlement in this manner is available under the tax law. The adoption of these changes had no impact on the consolidated financial statements.
Recent Accounting Pronouncements
In May 2014, the FASB issued changes to revenue recognition with customers. This update provides a five-step analysis of transactions to determine when and how revenue is recognized. An entity should recognize revenue to depict the transfer of promised goods or services to customers in an amount that reflects the consideration to which the entity expects to be entitled in exchange for those goods or services. This update will be effective for the Company beginning in fiscal year 2017. This update may be applied retrospectively to each prior reporting period presented or retrospectively with the cumulative effect of initially applying this update recognized at the date of initial application. The Company is currently evaluating the impact of the new guidance on its consolidated financial statements.
| Item 7A. | Quantitative and Qualitative Disclosures about Market Risk |
Due to the nature of our business and the manner in which we conduct our operations, in particular that our financial instruments which are exposed to concentrations of credit risk consist primarily of short-term cash investments, we believe we do not face any material interest rate risk, foreign currency exchange rate risk, equity price risk or other market risk.
48
Table of Contents
| Item 8. | Financial Statements and Supplementary Data |
49
Table of Contents
Management’s Report on Effectiveness of Internal Control Over Financial Reporting
Management is responsible for establishing and maintaining adequate internal control over financial reporting (as defined in Rule 13a-15(f) and 15d-15(f) under the Securities Exchange Act of 1934, as amended). The Company’s system of internal control over financial reporting is designed to provide reasonable assurance regarding the reliability of financial reporting and the preparation of financial statements for external purposes in accordance with generally accepted accounting principles.
Because of the inherent limitations, a system of internal control over financial reporting may not prevent or detect misstatements. Also, projections of any evaluation of effectiveness to future periods are subject to the risk that controls may become inadequate because of changes in conditions, or that the degree of compliance with the policies or procedures may deteriorate.
Management assessed the effectiveness of HFF’s internal control over financial reporting as of December 31, 2014, in relation to criteria for effective internal control over financial reporting as described in “Internal Control — Integrated Framework,” (2013 framework) issued by the Committee of Sponsoring Organizations of the Treadway Commission. Based on this assessment, management concluded that, as of December 31, 2014, its system of internal control over financial reporting is properly designed and operating effectively to achieve the criteria of the “Internal Control — Integrated Framework.” Ernst & Young LLP, our independent registered public accounting firm, has audited the consolidated financial statements included in this Annual Report and has issued an attestation report on HFF’s internal control over financial reporting.
| Dated: February 27, 2015 | /s/ Mark D. Gibson | |||
| Mark D. Gibson | ||||
| Chief Executive Officer | ||||
| Dated: February 27, 2015 | /s/ Gregory R. Conley | |||
| Gregory R. Conley | ||||
| Chief Financial Officer | ||||
50
Table of Contents
Report of Independent Registered Public Accounting Firm
The Board of Directors and Stockholders of
HFF, Inc.
We have audited the accompanying consolidated balance sheets of HFF, Inc. as of December 31, 2014 and 2013, and the related consolidated statements of income, stockholders’ equity, and cash flows for each of the three years in the period ended December 31, 2014. These financial statements are the responsibility of the Company’s management. Our responsibility is to express an opinion on these financial statements based on our audits.
We conducted our audits in accordance with the standards of the Public Company Accounting Oversight Board (United States). Those standards require that we plan and perform the audit to obtain reasonable assurance about whether the financial statements are free of material misstatement. An audit includes examining, on a test basis, evidence supporting the amounts and disclosures in the financial statements. An audit also includes assessing the accounting principles used and significant estimates made by management, as well as evaluating the overall financial statement presentation. We believe that our audits provide a reasonable basis for our opinion.
In our opinion, the financial statements referred to above present fairly, in all material respects, the consolidated financial position of HFF, Inc. at December 31, 2014 and 2013, and the consolidated results of their operations and their cash flows for each of the three years in the period ended December 31, 2014, in conformity with U.S. generally accepted accounting principles.
We also have audited, in accordance with the standards of the Public Company Accounting Oversight Board (United States), HFF, Inc.’s internal control over financial reporting as of December 31, 2014, based on criteria established in Internal Control-Integrated Framework issued by the Committee of Sponsoring Organizations of the Treadway Commission (2013 framework), and our report dated February 27, 2015 expressed an unqualified opinion thereon.
/s/ Ernst & Young LLP
Pittsburgh, Pennsylvania
February 27, 2015
51
Table of Contents
Report of Independent Registered Public Accounting Firm
The Board of Directors and Stockholders of
HFF, Inc.
We have audited HFF, Inc.’s internal control over financial reporting as of December 31, 2014, based on criteria established in Internal Control — Integrated Framework issued by the Committee of Sponsoring Organizations of the Treadway Commission (2013 framework) (the COSO criteria). HFF Inc.’s management is responsible for maintaining effective internal control over financial reporting, and for its assessment of the effectiveness of internal control over financial reporting included in the accompanying Management’s Report on Effectiveness of Internal Control Over Financial Reporting. Our responsibility is to express an opinion on the company’s internal control over financial reporting based on our audit.
We conducted our audit in accordance with the standards of the Public Company Accounting Oversight Board (United States). Those standards require that we plan and perform the audit to obtain reasonable assurance about whether effective internal control over financial reporting was maintained in all material respects. Our audit included obtaining an understanding of internal control over financial reporting, assessing the risk that a material weakness exists, testing and evaluating the design and operating effectiveness of internal control based on the assessed risk, and performing such other procedures as we considered necessary in the circumstances. We believe that our audit provides a reasonable basis for our opinion.
A company’s internal control over financial reporting is a process designed to provide reasonable assurance regarding the reliability of financial reporting and the preparation of financial statements for external purposes in accordance with generally accepted accounting principles. A company’s internal control over financial reporting includes those policies and procedures that (1) pertain to the maintenance of records that, in reasonable detail, accurately and fairly reflect the transactions and dispositions of the assets of the company; (2) provide reasonable assurance that transactions are recorded as necessary to permit preparation of financial statements in accordance with generally accepted accounting principles, and that receipts and expenditures of the company are being made only in accordance with authorizations of management and directors of the company; and (3) provide reasonable assurance regarding prevention or timely detection of unauthorized acquisition, use, or disposition of the company’s assets that could have a material effect on the financial statements.
Because of its inherent limitations, internal control over financial reporting may not prevent or detect misstatements. Also, projections of any evaluation of effectiveness to future periods are subject to the risk that controls may become inadequate because of changes in conditions, or that the degree of compliance with the policies or procedures may deteriorate.
In our opinion, HFF, Inc. maintained, in all material respects, effective internal control over financial reporting as of December 31, 2014, based on the COSO criteria.
We also have audited, in accordance with the standards of the Public Company Accounting Oversight Board (United States), the consolidated balance sheets of HFF, Inc. as of December 31, 2014 and 2013 and the related consolidated statements of income, stockholders’ equity and cash flows for each of the three years in the period ended December 31, 2014 of HFF, Inc. and our report dated February 27, 2015 expressed an unqualified opinion thereon.
/s/ Ernst & Young LLP
Pittsburgh, Pennsylvania
February 27, 2015
52
Table of Contents
HFF, Inc.
| December 31 | ||||||||
| 2014 | 2013 | |||||||
| (Dollars in thousands) | ||||||||
| ASSETS | ||||||||
| Current assets: |
||||||||
| Cash and cash equivalents |
$ | 232,053 | $ | 201,262 | ||||
| Accounts receivable |
1,462 | 1,093 | ||||||
| Receivable from affiliate |
2 | — | ||||||
| Mortgage notes receivable |
185,128 | 93,587 | ||||||
| Prepaid taxes |
729 | 1,000 | ||||||
| Prepaid expenses and other current assets |
3,281 | 2,495 | ||||||
| Deferred tax asset, net |
5,955 | 8,779 | ||||||
|
|
|
|
|
|||||
| Total current assets |
428,610 | 308,216 | ||||||
| Property and equipment, net |
10,173 | 6,586 | ||||||
| Deferred tax asset |
140,095 | 152,320 | ||||||
| Goodwill |
3,712 | 3,712 | ||||||
| Intangible assets, net |
20,647 | 16,776 | ||||||
| Other noncurrent assets |
1,015 | 566 | ||||||
|
|
|
|
|
|||||
| Total assets |
$ | 604,252 | $ | 488,176 | ||||
|
|
|
|
|
|||||
| LIABILITIES AND STOCKHOLDERS’ EQUITY | ||||||||
| Current liabilities: |
||||||||
| Current portion of long-term debt |
$ | 337 | $ | 258 | ||||
| Warehouse line of credit |
185,128 | 93,587 | ||||||
| Accrued compensation and related taxes |
51,335 | 53,253 | ||||||
| Accounts payable |
2,087 | 1,378 | ||||||
| Current portion of payable under the tax receivable agreement |
10,789 | 10,831 | ||||||
| Other current liabilities |
37,031 | 12,524 | ||||||
|
|
|
|
|
|||||
| Total current liabilities |
286,707 | 171,831 | ||||||
| Deferred rent credit |
7,304 | 5,801 | ||||||
| Payable under the tax receivable agreement |
123,367 | 134,785 | ||||||
| Long-term debt, less current portion |
429 | 185 | ||||||
|
|
|
|
|
|||||
| Total liabilities |
417,807 | 312,602 | ||||||
| Stockholders’ equity: |
||||||||
| Class A common stock, par value $0.01 per share, 175,000,000 shares authorized; 38,125,363 and 37,498,796 shares issued, respectively; and 37,677,981 and 37,248,416 outstanding, respectively |
381 | 372 | ||||||
| Treasury stock, 447,382 and 250,380 shares at cost, respectively |
(9,042 | ) | (2,760 | ) | ||||
| Additional paid-in-capital |
101,148 | 76,097 | ||||||
| Retained earnings |
93,958 | 101,865 | ||||||
|
|
|
|
|
|||||
| Total equity |
186,445 | 175,574 | ||||||
|
|
|
|
|
|||||
| Total liabilities and stockholders’ equity |
$ | 604,252 | $ | 488,176 | ||||
|
|
|
|
|
|||||
See accompanying notes to the consolidated financial statements.
53
Table of Contents
HFF, Inc.
Consolidated Statements of Income
| Years Ending December 31, | ||||||||||||
| 2014 | 2013 | 2012 | ||||||||||
| (Dollars in thousands) | ||||||||||||
| Revenues |
||||||||||||
| Capital markets services revenue |
$ | 418,969 | $ | 351,253 | $ | 276,907 | ||||||
| Interest on mortgage notes receivable |
4,603 | 2,119 | 5,990 | |||||||||
| Other |
2,346 | 2,233 | 2,077 | |||||||||
|
|
|
|
|
|
|
|||||||
| 425,918 | 355,605 | 284,974 | ||||||||||
| Expenses |
||||||||||||
| Cost of services |
242,393 | 202,542 | 163,937 | |||||||||
| Personnel |
47,390 | 40,685 | 29,062 | |||||||||
| Occupancy |
9,848 | 8,909 | 8,159 | |||||||||
| Travel and entertainment |
12,304 | 9,497 | 7,825 | |||||||||
| Supplies, research, and printing |
6,310 | 4,922 | 5,089 | |||||||||
| Insurance |
2,036 | 1,973 | 1,849 | |||||||||
| Professional fees |
4,475 | 4,035 | 3,991 | |||||||||
| Depreciation and amortization |
7,830 | 6,800 | 5,767 | |||||||||
| Interest on warehouse line of credit |
2,425 | 1,239 | 4,012 | |||||||||
| Other operating |
6,080 | 5,026 | 5,166 | |||||||||
|
|
|
|
|
|
|
|||||||
| 341,091 | 285,628 | 234,857 | ||||||||||
|
|
|
|
|
|
|
|||||||
| Operating income |
84,827 | 69,977 | 50,117 | |||||||||
| Interest and other income, net |
17,926 | 17,100 | 20,049 | |||||||||
| Interest expense |
(41 | ) | (33 | ) | (42 | ) | ||||||
| Decrease (increase) in payable under the tax receivable agreement |
800 | (1,040 | ) | (17,358 | ) | |||||||
|
|
|
|
|
|
|
|||||||
| Income before taxes |
103,512 | 86,004 | 52,766 | |||||||||
| Income tax expense |
42,226 | 34,578 | 8,661 | |||||||||
|
|
|
|
|
|
|
|||||||
| Net income |
61,286 | 51,426 | 44,105 | |||||||||
| Net income attributable to noncontrolling interest |
— | — | 243 | |||||||||
|
|
|
|
|
|
|
|||||||
| Net income attributable to controlling interest |
$ | 61,286 | $ | 51,426 | $ | 43,862 | ||||||
|
|
|
|
|
|
|
|||||||
| Earnings per share — Basic and Diluted |
||||||||||||
| Income available to HFF, Inc. common stockholders — Basic |
$ | 1.62 | $ | 1.38 | $ | 1.19 | ||||||
|
|
|
|
|
|
|
|||||||
| Weighted average shares outstanding — Basic |
37,758,519 | 37,345,918 | 36,917,096 | |||||||||
|
|
|
|
|
|
|
|||||||
| Income available to HFF, Inc. common stockholders —Diluted |
$ | 1.61 | $ | 1.36 | $ | 1.18 | ||||||
|
|
|
|
|
|
|
|||||||
| Weighted average shares outstanding — Diluted |
37,982,351 | 37,745,685 | 37,151,792 | |||||||||
|
|
|
|
|
|
|
|||||||
See accompanying notes to the consolidated financial statements.
54
Table of Contents
HFF, Inc.
Consolidated Statements of Stockholders’ Equity
| Controlling Interest | ||||||||||||||||||||||||||||||||
| Common Stock | Treasury Stock | Additional Paid in Capital |
Retained Earnings |
Noncontrolling Interest |
Total | |||||||||||||||||||||||||||
| Shares | Amount | Shares | Amount | |||||||||||||||||||||||||||||
| Stockholders’ equity, December 31, 2011 |
35,983,965 | $ | 360 | 118,357 | $ | (490 | ) | $ | 64,049 | $ | 62,914 | $ | 3,567 | $ | 130,400 | |||||||||||||||||
| Issuance of Class A common stock, net(1) |
1,119,139 | 11 | — | — | 2,670 | — | (2,681 | ) | — | |||||||||||||||||||||||
| Repurchase of Class A common stock |
(39,260 | ) | — | 39,260 | (565 | ) | — | — | — | (565 | ) | |||||||||||||||||||||
| Record the adjustment to give effect of the tax receivable agreement with HFF Holdings |
— | — | — | — | 962 | — | — | 962 | ||||||||||||||||||||||||
| Stock compensation and other, net |
— | — | — | — | 3,586 | — | — | 3,586 | ||||||||||||||||||||||||
| Distributions |
— | — | — | — | — | — | (1,129 | ) | (1,129 | ) | ||||||||||||||||||||||
| Dividends paid |
— | — | — | — | — | (56,337 | ) | — | (56,337 | ) | ||||||||||||||||||||||
| Net income |
— | — | — | — | — | 43,862 | 243 | 44,105 | ||||||||||||||||||||||||
|
|
|
|
|
|
|
|
|
|
|
|
|
|
|
|
|
|||||||||||||||||
| Stockholders’ equity, December 31, 2012 |
37,063,844 | $ | 371 | 157,617 | $ | (1,055 | ) | $ | 71,267 | $ | 50,439 | $ | — | $ | 121,022 | |||||||||||||||||
| Issuance of Class A common stock, net(1) |
277,335 | 2 | — | — | — | — | — | 2 | ||||||||||||||||||||||||
| Repurchase of Class A common stock |
(92,763 | ) | (1 | ) | 92,763 | (1,705 | ) | — | — | — | (1,706 | ) | ||||||||||||||||||||
| Record the adjustment to give effect of the tax receivable agreement with HFF Holdings |
— | — | — | — | 494 | — | — | 494 | ||||||||||||||||||||||||
| Stock compensation and other, net |
— | — | — | — | 4,336 | — | — | 4,336 | ||||||||||||||||||||||||
| Net income |
— | — | — | — | — | 51,426 | — | 51,426 | ||||||||||||||||||||||||
|
|
|
|
|
|
|
|
|
|
|
|
|
|
|
|
|
|||||||||||||||||
| Stockholders’ equity, December 31, 2013 |
37,248,416 | $ | 372 | 250,380 | $ | (2,760 | ) | $ | 76,097 | $ | 101,865 | $ | — | $ | 175,574 | |||||||||||||||||
| Issuance of Class A common stock, net |
626,567 | 9 | — | — | (9 | ) | — | — | — | |||||||||||||||||||||||
| Repurchase of Class A common stock |
(197,002 | ) | — | 197,002 | (6,282 | ) | — | — | — | (6,282 | ) | |||||||||||||||||||||
| Excess tax benefits from stock-based award activities |
— | — | — | — | 979 | — | — | 979 | ||||||||||||||||||||||||
| Stock compensation and other, net |
— | — | — | — | 23,054 | — | — | 23,054 | ||||||||||||||||||||||||
| Dividends paid |
— | — | — | — | 1,027 | (69,193 | ) | — | (68,166 | ) | ||||||||||||||||||||||
| Net income |
— | — | — | — | — | 61,286 | — | 61,286 | ||||||||||||||||||||||||
|
|
|
|
|
|
|
|
|
|
|
|
|
|
|
|
|
|||||||||||||||||
| Stockholders’ equity, December 31, 2014 |
37,677,981 | $ | 381 | 447,382 | $ | (9,042 | ) | $ | 101,148 | $ | 93,958 | $ | — | $ | 186,445 | |||||||||||||||||
|
|
|
|
|
|
|
|
|
|
|
|
|
|
|
|
|
|||||||||||||||||
| (1) | Includes the effect of the exchange of the Operating Partnerships units by HFF Holdings and the effect of the timing of the tax distribution payments on the ownership of the Operating Partnerships. |
See accompanying notes to the consolidated financial statements.
55
Table of Contents
HFF, Inc.
Consolidated Statements of Cash Flows
| Year Ended December 31 | ||||||||||||
| 2014 | 2013 | 2012 | ||||||||||
| (Dollars in thousands) | ||||||||||||
| Operating activities |
||||||||||||
| Net income |
$ | 61,286 | $ | 51,426 | $ | 44,105 | ||||||
| Adjustments to reconcile net income to net cash provided by operating activities: |
||||||||||||
| Stock based compensation |
9,820 | 8,302 | 3,442 | |||||||||
| Excess tax benefits from share-based award activities |
(979 | ) | (494 | ) | — | |||||||
| Deferred income taxes |
15,049 | 8,830 | (7,659 | ) | ||||||||
| Payable under the tax receivable agreement |
(800 | ) | 1,040 | 17,358 | ||||||||
| Depreciation and amortization: |
||||||||||||
| Property and equipment |
2,061 | 1,752 | 1,917 | |||||||||
| Intangibles |
5,769 | 5,048 | 3,850 | |||||||||
| Gain on sale or disposition or impairment of assets |
(8,069 | ) | (8,018 | ) | (10,772 | ) | ||||||
| Mortgage service rights assumed |
(4,089 | ) | (2,133 | ) | (2,373 | ) | ||||||
| Proceeds from sale of mortgage servicing rights |
2,546 | 6,215 | 4,576 | |||||||||
| Increase (decrease) in cash from changes in: |
||||||||||||
| Restricted cash |
— | — | 80 | |||||||||
| Accounts receivable |
(369 | ) | 691 | (373 | ) | |||||||
| Payable to/(receivable from) affiliate |
(2 | ) | 124 | 99 | ||||||||
| Payable under the tax receivable agreement |
(10,660 | ) | (10,368 | ) | (17,741 | ) | ||||||
| Mortgage notes receivable |
(91,541 | ) | 167,685 | (106,823 | ) | |||||||
| Net borrowings on warehouse line of credit |
91,541 | (167,685 | ) | 106,823 | ||||||||
| Prepaid taxes, prepaid expenses and other current assets |
(515 | ) | (918 | ) | (293 | ) | ||||||
| Other noncurrent assets |
(449 | ) | 205 | 526 | ||||||||
| Accrued compensation and related taxes |
11,316 | 13,691 | 4,913 | |||||||||
| Accounts payable |
709 | 34 | (326 | ) | ||||||||
| Other accrued liabilities |
25,486 | 3,092 | 2,699 | |||||||||
| Other long-term liabilities |
1,503 | 1,285 | 1,043 | |||||||||
|
|
|
|
|
|
|
|||||||
| Net cash provided by operating activities |
109,613 | 79,804 | 45,071 | |||||||||
| Investing activities |
||||||||||||
| Purchases of property and equipment |
(5,004 | ) | (3,323 | ) | (2,132 | ) | ||||||
|
|
|
|
|
|
|
|||||||
| Net cash used in investing activities |
(5,004 | ) | (3,323 | ) | (2,132 | ) | ||||||
| Financing activities |
||||||||||||
| Payments on long-term debt |
(349 | ) | (339 | ) | (340 | ) | ||||||
| Excess tax benefits from share-based award activities |
979 | 494 | — | |||||||||
| Treasury stock |
(6,282 | ) | (1,705 | ) | (565 | ) | ||||||
| Dividends paid |
(68,166 | ) | — | (56,337 | ) | |||||||
| Distributions to noncontrolling interest holder |
— | — | (1,129 | ) | ||||||||
|
|
|
|
|
|
|
|||||||
| Net cash used in financing activities |
(73,818 | ) | (1,550 | ) | (58,371 | ) | ||||||
|
|
|
|
|
|
|
|||||||
| Net increase (decrease) in cash |
30,791 | 74,931 | (15,432 | ) | ||||||||
| Cash and cash equivalents, beginning of period |
201,262 | 126,331 | 141,763 | |||||||||
|
|
|
|
|
|
|
|||||||
| Cash and cash equivalents, end of period |
$ | 232,053 | $ | 201,262 | $ | 126,331 | ||||||
|
|
|
|
|
|
|
|||||||
| Supplemental disclosure of cash flow information |
||||||||||||
| Cash paid for income taxes |
$ | 26,438 | $ | 23,054 | $ | 14,167 | ||||||
|
|
|
|
|
|
|
|||||||
| Cash paid for interest |
$ | 2,472 | $ | 1,471 | $ | 3,908 | ||||||
|
|
|
|
|
|
|
|||||||
| Supplemental disclosure of non-cash financing activities |
||||||||||||
| Property acquired under capital leases |
$ | 561 | $ | 204 | $ | 353 | ||||||
|
|
|
|
|
|
|
|||||||
| Dividends on unissued restricted stock units |
$ | 1,233 | $ | — | $ | 986 | ||||||
|
|
|
|
|
|
|
|||||||
See accompanying notes to the consolidated financial statements.
56
Table of Contents
HFF, Inc.
Notes to Consolidated Financial Statements
| 1. | Organization and Basis of Presentation |
Organization
HFF, Inc., a Delaware corporation (the “Company”), through its Operating Partnerships, Holliday Fenoglio Fowler, L.P., a Texas limited partnership (“HFF LP”), and HFF Securities L.P., a Delaware limited partnership and registered broker-dealer (“HFF Securities” and together with HFF LP, the “Operating Partnerships”), is a commercial real estate financial intermediary providing commercial real estate and capital markets services including debt placement, investment sales, equity placements, investment banking and advisory services, loan sales and loan sale advisory services, commercial loan servicing, and capital markets advice and maintains offices in 23 cities in the United States. The Company’s operations are impacted by the availability of equity and/or debt as well as credit and liquidity in the domestic and global capital markets especially in the commercial real estate sector. Significant disruptions or changes in domestic and global capital market flows, as well as credit and liquidity issues in the global and domestic capital markets, regardless of their duration, could adversely affect the supply and/or demand for capital from investors for commercial real estate investments which could have a significant impact on all of the Company’s capital market services revenues.
Initial Public Offering and Reorganization
The Company was formed in November 2006 in connection with a proposed initial public offering of its Class A common stock. On November 9, 2006, the Company filed a registration statement on Form S-1 with the United States Securities and Exchange Commission (the “SEC”) relating to a proposed underwritten initial public offering of 14,300,000 shares of Class A common stock of HFF, Inc. On January 30, 2007, the SEC declared the registration statement on Form S-1 effective and the Company priced 14,300,000 shares for the initial public offering at a price of $18.00 per share. On January 31, 2007, the Company’s common stock began trading on the New York Stock Exchange under the symbol “HF.”
On February 5, 2007, the Company closed its initial public offering of 14,300,000 shares of common stock. Net proceeds from the sale of the stock were $236.4 million, net of $18.0 million of underwriting commissions and $3.0 million of offering expenses. The proceeds of the initial public offering were used to purchase from HFF Holdings LLC, a Delaware limited liability company (“HFF Holdings”), all of the shares of Holliday GP Corp. and purchase from HFF Holdings partnership units representing approximately 39% of each of the Operating Partnerships (including partnership units in the Operating Partnerships held by Holliday GP). HFF Holdings used approximately $56.3 million of its proceeds to repay all outstanding indebtedness under HFF LP’s credit agreement. Accordingly, the Company did not retain any of the proceeds from the initial public offering.
On February 21, 2007, the underwriters exercised their option to purchase an additional 2,145,000 shares of Class A common stock (15% of original issuance) at $18.00 per share. Net proceeds of the overallotment were $35.9 million, net of $2.7 million of underwriting commissions and other expenses. These proceeds were used to purchase HFF Holdings partnership units representing approximately 6.0% of each of the Operating Partnerships. Accordingly the Company did not retain any of the proceeds from this purchase of additional shares.
In addition to cash received for its sale of all of the shares of Holliday GP and approximately 45% of partnership units of each of the Operating Partnerships (including partnership units in the Operating Partnerships held by Holliday GP), HFF Holdings also received, through the issuance of one share of HFF, Inc.’s Class B common stock to HFF Holdings, an exchange right that permitted, subject to certain restrictions, HFF Holdings to exchange interests in the Operating Partnerships for shares of (i) the Company’s Class A common stock (the “Exchange Right”) and (ii) rights under a tax receivable agreement between the Company and HFF Holdings (the “TRA”). See Notes 13 and 14 for further discussion of the tax receivable agreement and the exchange right held by HFF Holdings.
57
Table of Contents
HFF, Inc.
Notes to Consolidated Financial Statements — (Continued)
As a result of the reorganization into a holding company structure in connection with the initial public offering, the Company became a holding company through a series of transactions pursuant to a sale and purchase agreement. As a result of the initial public offering and reorganization, the Company’s sole assets are partnership interests in Operating Partnerships (that are held through its wholly-owned subsidiary HFF Partnership Holdings, LLC, a Delaware limited liability company) and all of the shares of Holliday GP, the sole general partner of each of the Operating Partnerships. The transactions that occurred in connection with the initial public offering and reorganization are referred to as the “Reorganization Transactions.”
The Reorganization Transactions were treated, for financial reporting purposes, as a reorganization of entities under common control. As such, these financial statements present the consolidated financial position and results of operations as if HFF, Inc., Holliday GP and the Operating Partnerships (collectively referred to as the Company) were consolidated for all periods presented. Income earned by the Operating Partnerships subsequent to the initial public offering and attributable to the members of HFF Holdings based on their remaining ownership interest (see Note 14) is recorded as noncontrolling interest in the consolidated financial statements. The remaining income attributable to Class A common stockholders is considered in the determination of earnings per share of Class A common stock (see Note 16).
Basis of Presentation
The accompanying consolidated financial statements of the Company as of December 31, 2014 and December 31, 2013 include the accounts of HFF LP, HFF Securities and the Company’s direct wholly-owned subsidiaries, Holliday GP and Partnership Holdings. All significant intercompany accounts and transactions have been eliminated.
The purchase of shares of Holliday GP and partnership units in each of the Operating Partnerships are treated as reorganization under common control for financial reporting purposes. HFF Holdings owned 100% of Holliday GP, HFF LP Acquisition, LLC, a Delaware limited liability company (“Holdings Sub”), and the Operating Partnerships prior to the Reorganization Transactions. The initial purchase of shares of Holliday GP and the initial purchase of units in the Operating Partnerships are accounted for at historical cost, with no change in basis for financial reporting purposes. Accordingly, the net assets of HFF Holdings purchased by the Company are reported in the consolidated financial statements of the Company at HFF Holdings’ historical cost.
As the sole stockholder of Holliday GP (the sole general partner of the Operating Partnerships), HFF, Inc. operates and controls all of the business and affairs of the Operating Partnerships. The Company consolidates the financial results of the Operating Partnerships, and the prior ownership interest of HFF Holdings in the Operating Partnerships is treated as a noncontrolling interest in the Company’s consolidated financial statements. HFF Holdings through its wholly-owned subsidiary (Holdings Sub), and the Company, through its wholly-owned subsidiaries (Partnership Holdings and Holliday GP), were the only partners of the Operating Partnerships following the Reorganization Transactions. As of August 31, 2012, HFF Holdings had exchanged all of its remaining interests in the Operating Partnerships and therefore the Company, through its wholly-owned subsidiaries, became and continues to be the only equity holder of the Operating Partnerships.
| 2. | Summary of Significant Accounting Policies |
Consolidation
HFF, Inc. controls the activities of the Operating Partnerships through its 100% ownership interest of Holliday GP. As such, in accordance with ASC 810 Consolidation, Holliday GP consolidates the Operating Partnerships as Holliday GP is the sole general partner of the Operating Partnerships and the limited partners do
58
Table of Contents
HFF, Inc.
Notes to Consolidated Financial Statements — (Continued)
not have substantive participating rights or kick out rights. The ownership interest of HFF Holdings in the Operating Partnerships that HFF Holdings held prior to the exchange on August 31, 2012 of its final remaining Operating Partnership units is reflected as a noncontrolling interest in the Company’s consolidated financial statements.
The accompanying consolidated financial statements of the Company include the accounts of HFF LP, HFF Securities and HFF, Inc.’s wholly-owned subsidiaries, Holliday GP and Partnership Holdings. The ownership interest in HFF LP and HFF Securities that HFF Holdings held prior to the exchange on August 31, 2012 of its final Operating Partnership units is treated as a noncontrolling interest in the consolidated financial statements of the Company. All significant intercompany accounts and transactions have been eliminated.
Concentrations of Credit Risk
The Company’s financial instruments that are exposed to concentrations of credit risk consist primarily of cash. The Company places its cash with financial institutions in amounts which at times exceed the FDIC insurance limit. The Company has not experienced any losses in such accounts and believes it is not exposed to any credit risk on cash other than as identified herein.
Cash and Cash Equivalents
Cash and cash equivalents include cash on hand and in bank accounts and short-term investments with original maturities of three months or less. At December 31, 2014, our cash and cash equivalents were invested or held in a mix of money market funds and bank demand deposit accounts at two financial institutions.
Revenue Recognition
Capital markets services revenues consist of origination fees, investment sales fees, loan sale fees, placement fees and servicing fees. Origination fees are earned for the placement of debt, equity or structured financing for real estate transactions. Investment sales and loan sales fees are earned for brokering sales of real estate and/or loans. Placement fees are earned by HFF Securities for discretionary and nondiscretionary equity capital raises and other investment banking services. These fees are negotiated between the Company and its clients, generally on a case-by-case basis and are recognized and generally collected at the closing and the funding of the transaction, unless collection of the fee is not reasonably assured, in which case the fee is recognized as collected. The Company’s fee agreements do not include terms or conditions that require the Company to perform any service or fulfill any obligation once the transaction closes. Servicing fees are compensation for providing any or all of the following: collection, remittance, recordkeeping, reporting and other services for either lenders or borrowers on mortgages placed with third-party lenders. Servicing fees are recognized when cash is collected as these fees are contingent upon the borrower making its payments on the loan.
Certain of the Company’s fee agreements provide for reimbursement of transaction-related costs which the Company recognizes as revenue. Certain reimbursements received from clients for out-of-pocket expenses are characterized as revenue in the statement of income rather than as a reduction of expenses incurred. Since the Company is the primary obligor, has supplier discretion, and bears the credit risk for such expenses, the Company records reimbursement revenue for such out-of-pocket expenses. Reimbursement revenue is recognized when billed if collectibility is reasonably assured. Reimbursement revenue is classified as other revenue in the consolidated statements of income.
59
Table of Contents
HFF, Inc.
Notes to Consolidated Financial Statements — (Continued)
Mortgage Notes Receivable
The Company is qualified with the Federal Home Loan Mortgage Corporation (Freddie Mac) as a Freddie Mac Multifamily Program Plus® Seller/Servicer. Under this Program, the Company originates mortgages based on commitments from Freddie Mac, and then sells the loans to Freddie Mac approximately one month following the loan origination. The Company recognizes interest income on the accrual basis during this holding period based on the contract interest rate in the loan that will be purchased by Freddie Mac (see Note 8).
The loans are initially recorded and then subsequently sold to Freddie Mac at the Company’s cost. The Company records mortgage loans held for sale at period end at market value in accordance with the provisions of ASC 948, Financial Services-Mortgage Banking, which states that market value for mortgage loans covered by investor commitments shall be based on commitment prices. In the case of loans originated for Freddie Mac, the commitment price is equal to the Company’s cost due to the short time frame from the Company’s origination to the purchase of the loan by the investor, which is approximately 30 days. As a result, the Company does not deem there to be any potential lower of cost or market issues.
Freddie Mac requires HFF LP to meet minimum net worth and liquid assets requirements and to comply with certain other standards. As of December 31, 2014, HFF LP met Freddie Mac’s minimum net worth and liquid assets requirements.
Advertising
Costs associated with advertising are expensed as incurred. Advertising expense was $0.8 million, $0.6 million and $0.6 million for the years ended December 31, 2014, 2013 and 2012, respectively. These amounts are included in other operating expenses in the accompanying consolidated statements of income.
Property and Equipment
Property and equipment are recorded at cost. The Company depreciates furniture, office equipment and computer equipment on the straight-line method over three to seven years. Software costs are depreciated using the straight-line method over three years, while capital leases and leasehold improvements are depreciated using the straight-line method over the shorter of the term of the lease or useful life of the asset.
Depreciation expense was $2.1 million, $1.8 million and $1.9 million for the years ended December 31, 2014, 2013 and 2012, respectively.
Expenditures for routine maintenance and repairs are charged to expense as incurred. Renewals and betterments which substantially extend the useful life of an asset are capitalized.
Leases
The Company leases all of its facilities under operating lease agreements. These lease agreements typically contain tenant improvement allowances. The Company records tenant improvement allowances as a leasehold improvement asset, included in property and equipment, net in the consolidated balance sheet, and a related deferred rent liability and amortizes them on a straight-line basis over the shorter of the term of the lease or useful life of the asset as additional depreciation expense and a reduction to rent expense, respectively. Lease agreements sometimes contain rent escalation clauses or rent holidays, which are recognized on a straight-line basis over the life of the lease in accordance with ASC 840, Leases (ASC 840). Office lease terms generally range from five to ten years. An analysis is performed on all equipment leases to determine whether they should be classified as a capital or an operating lease according to ASC 840.
60
Table of Contents
HFF, Inc.
Notes to Consolidated Financial Statements — (Continued)
Computer Software Costs
Certain costs related to the development or purchases of internal-use software are capitalized. Internal computer software costs that are incurred in the preliminary project stage are expensed as incurred. Direct consulting costs as well as payroll and related costs, which are incurred during the development stage of a project are capitalized and amortized using the straight-line method over estimated useful lives of three years when placed into production.
Goodwill
Goodwill of $3.7 million represents the excess of the purchase price over the estimated fair value of the acquired net assets of HFF LP on June 16, 2003. The Company does not amortize goodwill, but evaluates goodwill on at least an annual basis for potential impairment.
Prepaid Compensation Under Employment Agreements
The Company entered into employment agreements with certain employees whereby sign-up bonuses and incentive compensation payments were made during 2014, 2013 and 2012. In most cases, the sign-up bonuses and the incentive compensation are to be repaid to the Company upon voluntary termination by the employee or termination by cause (as defined) by the Company prior to the termination of the employment agreement. The total cost of the employment agreements is being amortized by the straight-line method over the term of the agreements and is included in cost of services on the accompanying consolidated statements of income. As of December 31, 2014 and 2013, there was a total of approximately $1.2 million and $0.6 million of unamortized costs related to HFF LP agreements, respectively.
Transaction Professional Draws
As part of the Company’s overall compensation program, the Company offers a new transaction professional a draw arrangement which generally lasts until such time as a transaction professional’s pipeline of business is sufficient to allow the transaction professional to earn sustainable commissions. This program is intended to provide the transaction professional with a minimal amount of cash flow to allow adequate time for the transaction professional to develop business relationships. Similar to traditional salaries, the transaction professional draws are paid irrespective of the actual fees generated by the transaction professional. At times these transaction professional draws represent the only form of compensation received by the transaction professional. It is not the Company’s policy to seek collection of unearned transaction professional draws under this arrangement. Transaction professionals are also entitled to earn a commission on closed revenue transactions. Commissions are calculated as the commission that would have been earned by the broker under one of the Company’s commission programs, less any amount previously paid to the transaction professional in the form of a draw. As a result, the Company has concluded that transaction professional draws are economically equivalent to commissions paid and, accordingly, charges them to commissions as incurred. These amounts are included in cost of services on the accompanying consolidated statements of income.
Intangible Assets
Intangible assets include mortgage servicing rights under agreements with third-party lenders and costs associated with obtaining a FINRA license.
Servicing rights are capitalized for servicing assumed on loans originated and sold to Freddie Mac with servicing retained based on an allocation of the carrying amount of the loan and the servicing right in proportion to the relative fair values at the date of sale. Servicing rights are recorded at the lower of cost or market.
61
Table of Contents
HFF, Inc.
Notes to Consolidated Financial Statements — (Continued)
Mortgage servicing rights do not trade in an active, open market and therefore, do not have readily available observable prices. Since there is no ready market value for the mortgage servicing rights, such as quoted market prices or prices based on sales or purchases of similar assets, the Company determines the fair value of the mortgage servicing rights by estimating the net present value of future cash flows associated with the servicing of the loans. Management makes certain assumptions and judgments in estimating the fair value of servicing rights. The estimate is based on a number of assumptions, including the benefits of servicing (contractual servicing fees and interest on escrow and float balances), the cost of servicing, prepayment rates (including risk of default), an inflation rate, the expected life of the cash flows and the discount rate. The cost of servicing, prepayment rates and discount rates are the most sensitive factors affecting the estimated fair value of the servicing rights. Management estimates a market participant’s cost of servicing by analyzing the limited market activity and considering the Company’s own internal servicing costs. Management estimates the discount rate by considering the various risks involved in the future cash flows of the underlying loans which include the cancellation of servicing contracts, concentration in the life company portfolio and the incremental risk related to large loans. Management estimates the prepayment levels of the underlying mortgages by analyzing recent historical experience. Many of the commercial loans being serviced have financial penalties for prepayment or early payoff before the stated maturity date. As a result, the Company has consistently experienced a low level of loan runoff. The estimated value of the servicing rights is impacted by changes in these assumptions.
Effective January 1, 2007, the Company adopted the provisions of ASC 860, Transfers and Servicing (ASC 860). ASC 860 requires an entity to recognize a servicing asset or servicing liability at fair value each time it undertakes an obligation to service a financial asset by entering into a servicing contract, regardless of whether explicit consideration is exchanged. The statement also permits a company to choose to either subsequently measure servicing rights at fair value and to report changes in fair value in earnings, or to retain the amortization method whereby servicing rights are recorded at the lower of cost or fair value and are amortized over their expected life. The Company retained the amortization method upon adoption of ASC 860, and began recognizing the fair value of servicing contracts involving no consideration assumed after January 1, 2007. The fair value of servicing rights assumed without consideration and recognized as intangible assets and income in 2014 and 2013 was $4.1 million and $2.1 million, respectively. These amounts are recorded in Interest and other income, net in the consolidated statements of income.
HFF Securities has recognized an intangible asset in the amount of $0.1 million for the costs of obtaining and holding a FINRA license as a broker-dealer. The license is determined to have an indefinite useful economic life and is, therefore, not being amortized.
The Company evaluates amortizable intangible assets on an annual basis, or more frequently if circumstances so indicate, for potential impairment. Indicators of impairment monitored by management include a decline in the level of serviced loans.
Earnings Per Share
The Company computes net income per share in accordance with ASC 260, Earnings Per Share. Basic net income per share is computed by dividing income available to Class A common stockholders by the weighted average of common shares outstanding for the period. Diluted net income per share reflects the assumed conversion of all dilutive securities (see Note 16).
Firm and Office Profit Participation Plans
The Company’s firm and office profit participation plans provide for payments in cash and share-based awards if certain performance targets are achieved during the year. The expense recorded for these plans is
62
Table of Contents
HFF, Inc.
Notes to Consolidated Financial Statements — (Continued)
estimated during the year based on actual results at each interim reporting date and an estimate of future results for the remainder of the year. The plans allow for payments to be made in both cash and share-based awards, the composition of which is determined in the first calendar quarter of the subsequent year. Cash and share-based awards issued under these plans are subject to vesting conditions over the subsequent year, such that the total expense measured for these plans is recorded over the period from the beginning of the performance year through the vesting date. Based on an accounting policy election, the expense associated with the share-based component of the estimated incentive payout is recognized before the grant date of the stock due to the fact that the terms of the profit participation plans have been approved by the Company’s board of directors and the employees of the Company understand the requirements to earn the award. Expense associated with the stock component of estimated incentive payouts under the Company’s firm profit participation bonus plan or office profit participation bonus plans that are anticipated to be paid in respect of the applicable year is recorded as incentive compensation expense within personnel expenses in the Company’s consolidated statements of income during the year to which the expense relates. Following the award, if any, of the related incentive payout, the stock component expense is reclassified as stock compensation costs within personnel expenses.
Stock Based Compensation
ASC 718, Compensation — Stock Compensation (ASC 718), requires the measurement and recognition of compensation expense for all stock-based payment awards made to employees and directors, including employee stock options and other forms of equity compensation based on estimated fair values. The Company estimates the grant-date fair value of stock options using the Black-Scholes option-pricing model. The fair value of the restricted stock awards is calculated as the market value of the Company’s Class A common stock on the date of grant. The Company also has restricted stock awards that are accounted for as liability awards and require remeasurement to fair value at the end of each reporting period. The Company’s awards are subject to graded or cliff vesting. Compensation expense is adjusted for estimated forfeitures and is recognized on a straight-line basis over the requisite service period of the award. Forfeiture assumptions for all stock-based payment awards are evaluated on a quarterly basis and updated as necessary.
Income Taxes
HFF, Inc. and Holliday GP are corporations, and the Operating Partnerships are limited partnerships. The Operating Partnerships are subject to state and local income taxes. Income and expenses of the Operating Partnerships have been passed through and are reported on the individual tax returns of the members of HFF Holdings and on the corporate income tax returns of HFF, Inc. and Holliday GP. Income taxes shown on the Company’s consolidated statements of income reflect federal income taxes of the corporation and business and corporate income taxes in various jurisdictions. These taxes are assessed on the net income of the corporations, including its share of the Operating Partnerships’ net income.
The Company accounts for income taxes under the asset and liability method. Deferred tax assets and liabilities are recognized for future tax consequences attributable to differences between the financial statement carrying amounts of existing assets and liabilities and their respective tax bases, and for tax losses and tax credit carryforwards, if any. Deferred tax assets and liabilities are measured using tax rates expected to apply to taxable income in the years in which those temporary differences are expected to be recovered or settled. The effect on deferred tax assets and liabilities of a change in tax rates will be recognized in income in the period of the tax rate change. In assessing the realizability of deferred tax assets, the Company considers whether it is more likely than not that some portion or all of the deferred tax assets will not be realized.
63
Table of Contents
HFF, Inc.
Notes to Consolidated Financial Statements — (Continued)
Cost of Services
The Company considers personnel expenses directly attributable to providing services to its clients, such as salaries, commissions and transaction bonuses to transaction professionals and analysts, and certain purchased services to be directly attributable to the generation of capital markets services revenue and has classified these expenses as cost of services in the consolidated statements of income.
Segment Reporting
The Company operates in one reportable segment, the commercial real estate financial intermediary segment and offers debt placement, investment sales, loan sales, loan servicing, equity placement and investment banking services through its 23 offices. The results of each office have been aggregated for segment reporting purposes as they have similar economic characteristics and provide similar services to a similar class of customer.
Use of Estimates
The preparation of financial statements in conformity with accounting principles generally accepted in the United States requires management to make estimates and assumptions that affect the reported amounts of assets and liabilities and disclosure of contingent assets and liabilities at the date of the financial statements and the reported amounts of revenues and expenses during the reporting period. Actual results could differ from those estimates.
Treasury Stock
The Company records common stock purchased for treasury at cost. At the date of subsequent reissue, the treasury stock account is reduced by the cost of such stock on the first-in, first-out basis.
New Accounting Pronouncements Adopted
In January 2014, the Company adopted changes issued by the Financial Accounting Standards Board (FASB) that require an entity to net its liability for unrecognized tax positions against a net operating loss carryforward, a similar tax loss, or a tax credit carryforward when settlement in this manner is available under the tax law. The adoption of these changes had no impact on the consolidated financial statements.
Pending Accounting Pronouncements
In May 2014, the FASB issued changes to revenue recognition with customers. This update provides a five-step analysis of transactions to determine when and how revenue is recognized. An entity should recognize revenue to depict the transfer of promised goods or services to customers in an amount that reflects the consideration to which the entity expects to be entitled in exchange for those goods or services. This update will be effective for the Company beginning in fiscal year 2017. This update may be applied retrospectively to each prior reporting period presented or retrospectively with the cumulative effect of initially applying this update recognized at the date of initial application. The Company is currently evaluating the impact of the new guidance on its consolidated financial statements.
| 3. | Stock Compensation |
ASC 718 requires the measurement and recognition of compensation expense for all stock-based payment awards made to employees and directors including employee stock options and other forms of equity
64
Table of Contents
HFF, Inc.
Notes to Consolidated Financial Statements — (Continued)
compensation based on estimated fair values. The Company estimates the grant-date fair value of stock options using the Black-Scholes option-pricing model. For stock options, the Company uses the simplified method to determine the expected term of the option. Expected volatility used to value stock options is based on the Company’s historical volatility. The fair value of the restricted stock awards is calculated as the market value of the Company’s Class A common stock on the date of grant. The Company also had restricted stock awards that were accounted for as liability awards and required remeasurement to fair value at the end of each reporting period. These liability awards fully vested on March 1, 2014. The Company’s awards are subject to graded or cliff vesting. Compensation expense is adjusted for estimated forfeitures and is recognized on a straight-line basis over the requisite service period of the award. Forfeiture assumptions for all stock-based payment awards are evaluated on a quarterly basis and updated as necessary. A summary of the cost of the awards granted during the years ended December 31, 2014 and 2013 is provided below.
Omnibus Incentive Compensation Plan
Prior to the effective date of the initial public offering, the stockholder of HFF, Inc. and the Board of Directors adopted the HFF, Inc. 2006 Omnibus Incentive Compensation Plan (the “Plan”). The Plan authorizes the grant of deferred stock, restricted stock, stock options, stock appreciation rights, stock units, stock purchase rights and cash-based awards. Upon the effective date of the registration statement, grants were awarded under the Plan to certain employees and non-employee members of the board of directors. The Plan imposes limits on the awards that may be made to any individual during a calendar year. The number of shares available for awards under the terms of the Plan is 3,500,000 (subject to stock splits, stock dividends and similar transactions). For a full copy of the Plan, see Exhibit 10.9 to the Registration Statement on Form S-1 filed with the SEC on January 8, 2007.
The stock compensation cost that has been charged against income for the years ended December 31, 2014, 2013 and 2012 was $9.8 million, $8.3 million and $3.4 million, respectively, which is recorded in “Personnel” expenses in the consolidated statements of income. At December 31, 2014, there was approximately $17.7 million of unrecognized compensation cost related to share based awards.
The fair value of stock options is estimated on the grant date using a Black-Scholes option-pricing model. The following table presents the weighted average assumptions for the year ended December 31, 2014:
| Dividend yield |
0.0 | % | ||
| Expected volatility |
63.9 | % | ||
| Risk-free interest rate |
3.2 | % | ||
| Expected life (in years) |
6.2 |
65
Table of Contents
HFF, Inc.
Notes to Consolidated Financial Statements — (Continued)
The following table presents options outstanding for the years ended December 31, 2012, 2013 and 2014 and their related weighted average exercise price, weighted average remaining contractual term and intrinsic value:
| Options | Weighted Average Exercise Price |
Weighted Average Remaining Contractual Term |
Aggregate Intrinsic Value (in ‘000’s) |
|||||||||||||
| Balance at January 1, 2012 |
51,586 | $ | 8.92 | 7.0 years | $ | 73 | ||||||||||
| Granted |
— | — | — | — | ||||||||||||
| Exercised |
— | — | — | — | ||||||||||||
| Forfeited or expired |
— | — | — | — | ||||||||||||
|
|
|
|
|
|
|
|
|
|||||||||
| Balance at December 31, 2012 |
51,586 | $ | 8.92 | 6.0 years | $ | 308 | ||||||||||
| Granted |
— | — | — | — | ||||||||||||
| Exercised |
— | — | — | — | ||||||||||||
| Forfeited or expired |
— | — | — | — | ||||||||||||
|
|
|
|
|
|
|
|
|
|||||||||
| Balance at December 31, 2013 |
51,586 | $ | 8.92 | 5.0 years | $ | 925 | ||||||||||
| Granted |
— | — | — | — | ||||||||||||
| Exercised |
— | — | — | — | ||||||||||||
| Forfeited or expired |
— | — | — | — | ||||||||||||
|
|
|
|
|
|
|
|
|
|||||||||
| Balance at December 31, 2014 |
51,586 | $ | 8.92 | 4.0 years | $ | 1,393 | ||||||||||
|
|
|
|
|
|
|
|
|
|||||||||
A summary of option activity and related information during 2012, 2013 and 2014 was as follows:
| Options | Weighted Average Exercise Price |
|||||||
| Nonvested at January 1, 2012 |
15,122 | $ | 6.10 | |||||
| Granted |
— | — | ||||||
| Vested |
(11,017 | ) | 5.55 | |||||
| Forfeited or expired |
— | — | ||||||
|
|
|
|
|
|||||
| Nonvested at December 31, 2012 |
4,105 | $ | 7.58 | |||||
| Granted |
— | — | ||||||
| Vested |
(4,105 | ) | 7.58 | |||||
| Forfeited or expired |
— | — | ||||||
|
|
|
|
|
|||||
| Nonvested at December 31, 2013 and 2014 |
— | $ | 0.00 | |||||
|
|
|
|
|
|||||
No options were granted or exercised during either of the years ended December 31, 2014 and 2013. The option exercises will be settled through the issuance of new shares of Class A common stock.
66
Table of Contents
HFF, Inc.
Notes to Consolidated Financial Statements — (Continued)
A summary of restricted stock units (“RSU”) activity and related information during the period was as follows:
| RSU’s with no vesting period |
RSU’s with graded or cliff vesting period |
Total | ||||||||||
| Balance at January 1, 2012 |
90,833 | 481,095 | 571,928 | |||||||||
| Granted |
20,161 | 238,955 | 259,116 | |||||||||
| Dividend on unissued RSU’s |
11,332 | 57,941 | 69,273 | |||||||||
| Converted to common stock |
(4,822 | ) | (117,228 | ) | (122,050 | ) | ||||||
| Forfeited or expired |
— | (60,043 | ) | (60,043 | ) | |||||||
|
|
|
|
|
|
|
|||||||
| Balance at December 31, 2012 |
117,504 | 600,720 | 718,224 | |||||||||
| Granted |
14,967 | 221,469 | 236,436 | |||||||||
| Converted to common stock |
(5,183 | ) | (272,152 | ) | (277,335 | ) | ||||||
| Forfeited or expired |
— | (2,245 | ) | (2,245 | ) | |||||||
|
|
|
|
|
|
|
|||||||
| Balance at December 31, 2013 |
127,288 | 547,792 | 675,080 | |||||||||
| Granted |
12,877 | 940,007 | 952,884 | |||||||||
| Dividend on unissued RSU’s |
7,900 | 34,208 | 42,108 | |||||||||
| Converted to common stock |
(4,878 | ) | (621,689 | ) | (626,567 | ) | ||||||
| Forfeited or expired |
— | — | — | |||||||||
|
|
|
|
|
|
|
|||||||
| Balance at December 31, 2014 |
143,187 | 900,318 | 1,043,505 | |||||||||
|
|
|
|
|
|
|
|||||||
As of December 31, 2014, there were 1,043,505 RSU’s outstanding. The fair value of vested RSU’s was $5.4 million and $3.5 million at December 31, 2014 and December 31, 2013, respectively. The RSU exercises will be settled through the issuance of new shares of Class A common stock. On December 14, 2010 and March 1, 2013, the Company granted RSU’s that were treated as liability awards, which requires the remeasurement of fair value at the end of each reporting period until settlement. These Liability awards cliff vested on March 1, 2014 with a fair value of $12.7 million for which 398,084 shares of Class A common stock were issued.
The weighted average remaining contractual term of the nonvested restricted stock units is 3.5 years as of December 31, 2014.
On February 18, 2015, the board of directors for the Company granted 250,000 restricted stock units with a fair value of $9.3 million which vest over a five year period with 25% vesting increments starting on the second anniversary of the grant. Additionally, on February 18, 2015, the board of directors for the Company granted 211,597 restricted stock units with a fair value of $7.9 million in connection with the 2014 office and firm profit participation plans. 68,194 of these restricted stock units will vest in 2015.
67
Table of Contents
HFF, Inc.
Notes to Consolidated Financial Statements — (Continued)
| 4. | Property and Equipment |
Property and equipment consist of the following (in thousands):
| December 31 | ||||||||
| 2014 | 2013 | |||||||
| Furniture and equipment |
$ | 8,035 | $ | 5,066 | ||||
| Computer equipment |
1,072 | 970 | ||||||
| Capitalized software costs |
497 | 530 | ||||||
| Leasehold improvements |
9,523 | 7,786 | ||||||
|
|
|
|
|
|||||
| Subtotal |
19,127 | 14,352 | ||||||
| Less accumulated depreciation and amortization |
(8,954 | ) | (7,766 | ) | ||||
|
|
|
|
|
|||||
| $ | 10,173 | $ | 6,586 | |||||
|
|
|
|
|
|||||
At December 31, 2014 and 2013, the Company has recorded capital leased office equipment within furniture and equipment of $1.4 million and $1.1 million, respectively, including accumulated amortization of $0.6 million and $0.7 million, respectively, which is included within depreciation and amortization expense on the accompanying consolidated statements of income. See Note 7 for discussion of the related capital lease obligations.
| 5. | Intangible Assets |
The Company’s intangible assets are summarized as follows (in thousands):
| December 31, 2014 | December 31, 2013 | |||||||||||||||||||||||
| Gross Carrying Amount |
Accumulated Amortization |
Net Book Value |
Gross Carrying Amount |
Accumulated Amortization |
Net Book Value |
|||||||||||||||||||
| Amortizable intangible assets: |
||||||||||||||||||||||||
| Mortgage servicing rights |
$ | 41,041 | $ | (20,494 | ) | $ | 20,547 | $ | 34,100 | $ | (17,424 | ) | $ | 16,676 | ||||||||||
| Unamortizable intangible assets: |
||||||||||||||||||||||||
| FINRA license |
100 | — | 100 | 100 | — | 100 | ||||||||||||||||||
|
|
|
|
|
|
|
|
|
|
|
|
|
|||||||||||||
| Total intangible assets |
$ | 41,141 | $ | (20,494 | ) | $ | 20,647 | $ | 34,200 | $ | (17,424 | ) | $ | 16,776 | ||||||||||
|
|
|
|
|
|
|
|
|
|
|
|
|
|||||||||||||
As of December 31, 2014, 2013 and 2012, the Company serviced $39.3 billion, $33.1 billion and $31.3 billion, respectively, of commercial loans. The Company earned $17.0 million, $15.8 million and $14.0 million in servicing fees and interest on float and escrow balances for the years ended December 31, 2014, 2013 and 2012, respectively. These revenues are recorded as capital markets services revenues in the consolidated statements of income.
The total commercial loan servicing portfolio includes loans for which there is no corresponding mortgage servicing right recorded on the balance sheet, as these servicing rights were assumed prior to January 1, 2007 and involved no initial consideration paid by the Company. The Company has recorded mortgage servicing rights of $20.5 million and $16.7 million on $34.5 billion and $27.0 billion, respectively, of the total loans serviced as of December 31, 2014 and 2013.
68
Table of Contents
HFF, Inc.
Notes to Consolidated Financial Statements — (Continued)
The Company stratifies its servicing portfolio based on the type of loan, including life company loans, commercial mortgage backed securities (CMBS), Freddie Mac and limited-service life company loans.
Changes in the carrying value of mortgage servicing rights for the years ended December 31, 2014 and 2013 (in thousands):
| Category |
12/31/13 | Capitalized | Amortized | Sold / Transferred | 12/31/14 | |||||||||||||||
| Freddie Mac |
$ | 3,730 | $ | 6,205 | $ | (1,571 | ) | $ | (3,165 | ) | $ | 5,199 | ||||||||
| CMBS |
10,978 | 2,208 | (2,676 | ) | 2,511 | 13,021 | ||||||||||||||
| Life company |
1,537 | 1,638 | (1,262 | ) | — | 1,913 | ||||||||||||||
| Life company — limited |
431 | 243 | (260 | ) | — | 414 | ||||||||||||||
|
|
|
|
|
|
|
|
|
|
|
|||||||||||
| Total |
$ | 16,676 | $ | 10,294 | $ | (5,769 | ) | $ | (654 | ) | $ | 20,547 | ||||||||
|
|
|
|
|
|
|
|
|
|
|
|||||||||||
| Category |
12/31/12 | Capitalized | Amortized | Sold / Transferred | 12/31/13 | |||||||||||||||
| Freddie Mac |
$ | 7,641 | $ | 3,098 | $ | (1,310 | ) | $ | (5,699 | ) | $ | 3,730 | ||||||||
| CMBS |
7,838 | 792 | (2,036 | ) | 4,384 | 10,978 | ||||||||||||||
| Life company |
2,021 | 1,013 | (1,497 | ) | — | 1,537 | ||||||||||||||
| Life company — limited |
299 | 328 | (196 | ) | — | 431 | ||||||||||||||
|
|
|
|
|
|
|
|
|
|
|
|||||||||||
| Total |
$ | 17,799 | $ | 5,231 | $ | (5,039 | ) | $ | (1,315 | ) | $ | 16,676 | ||||||||
|
|
|
|
|
|
|
|
|
|
|
|||||||||||
Amounts capitalized represent mortgage servicing rights retained upon the sale of originated loans to Freddie Mac and mortgage servicing rights acquired without the exchange of initial consideration. The Company recorded mortgage servicing rights retained upon the sale of originated loans to Freddie Mac of $6.2 million and $3.1 million on $2.0 billion and $1.1 billion of loans, respectively, during the years ended December 31, 2014 and 2013, respectively. The Company recorded mortgage servicing rights acquired without the exchange of initial consideration on the CMBS and Life company tranches of $4.1 million and $2.1 million on $8.0 billion and $4.9 billion of loans, respectively, during the years ended December 31, 2014 and 2013. These amounts are recorded in interest and other income, net in the consolidated statements of income. During each of 2014 and 2013, certain Freddie Mac loans were securitized and the Company sold the cashiering portion of these Freddie Mac mortgage servicing rights. While the Company transferred the risks and rewards of ownership of the cashiering portion of the relevant mortgage servicing rights, the Company continues to perform limited servicing activities on these securitized loans. Therefore, the remaining servicing rights were transferred to the CMBS servicing tranche. The net result of these transactions was the Company recording a gain in each of the years ended December 31, 2014 and 2013 of $1.9 million and $4.9 million, respectively, within interest and other income, net in the consolidated income statements. The Company also received securitization compensation in relation to the sale of the cashiering portion of certain Freddie Mac mortgage servicing rights in the years ended December 31, 2014 and 2013 of $2.6 million and $4.8 million, respectively. The securitization compensation is recorded within interest and other income, net in the consolidated statements of income.
Amortization expense related to intangible assets was $5.8 million, $5.0 million, and $3.9 million for the years ended December 31, 2014, 2013 and 2012, respectively, and is reported in depreciation and amortization in the consolidated statements of income.
69
Table of Contents
HFF, Inc.
Notes to Consolidated Financial Statements — (Continued)
Estimated amortization expense for the next five years is as follows (in thousands):
| 2015 |
$ | 5,111 | ||
| 2016 |
4,226 | |||
| 2017 |
3,175 | |||
| 2018 |
2,367 | |||
| 2019 |
1,826 |
The weighted-average remaining life of the mortgage servicing rights intangible asset was 6.3 and 5.8 years at December 31, 2014 and 2013, respectively.
| 6. | Fair Value Measurement |
ASC Topic 820, Fair Value Measurement (ASC 820) establishes a valuation hierarchy for disclosure of the inputs to valuation used to measure fair value. This hierarchy prioritizes the inputs into the following three levels: Level 1 inputs which are quoted market prices in active markets for identical assets or liabilities; Level 2 inputs which are observable market-based inputs or unobservable inputs corroborated by market data for the asset or liability; and Level 3 inputs which are unobservable inputs based on our own assumptions that are not corroborated by market data. A financial asset or liability’s classification within the hierarchy is determined based on the lowest level input that is significant to the fair value measurement.
In May 2011, the Financial Accounting Standards Board issued an accounting pronouncement which amends the fair value measurement and disclosure requirements to achieve common disclosure requirements between GAAP and International Financial Reporting Standards. The accounting pronouncement requires certain disclosures about transfers between Level 1 and Level 2 of the fair value hierarchy, sensitivity of fair value measurements categorized within Level 3 of the fair value hierarchy, and categorization by level of items that are reported at cost but are required to be disclosed at fair value. The adoption of this pronouncement had no impact on the Company’s consolidated financial statements.
As of December 31, 2014 and 2013, the Company did not have any assets or liabilities recognized at fair value on a recurring basis.
In accordance with generally accepted accounting principles, from time to time, the Company measures certain assets at fair value on a nonrecurring basis. These assets may include mortgage servicing rights and mortgage notes receivable. The mortgage servicing rights were not remeasured at fair value during 2014 as the Company continues to utilize the amortization method under ASC 860 and the fair value of the mortgage servicing rights exceeds the carrying value at December 31, 2014. See Note 5 for further discussion on the assumptions used in valuing the mortgage servicing rights and impact on earnings during the period. The fair value of the mortgage notes receivable was based on prices observable in the market for similar loans and equaled carrying value at December 31, 2014 and 2013. Therefore, no lower of cost or fair value adjustment was required.
70
Table of Contents
HFF, Inc.
Notes to Consolidated Financial Statements — (Continued)
The following table sets forth the Company’s financial assets that were accounted for at fair value on a nonrecurring basis by level within the fair value hierarchy as of December 31, 2014 (in thousands):
| December 31, 2014 Fair Value Measurements Using: |
||||||||||||||||
| Carrying Value |
Quoted Prices in Active Markets for Identical Assets (Level 1) |
Significant Other Observable Inputs (Level 2) |
Significant Unobservable Inputs (Level 3) |
|||||||||||||
| Nonrecurring fair value measurements |
||||||||||||||||
| Mortgage notes receivable |
$ | 185,128 | $ | — | $ | 185,128 | $ | — | ||||||||
| Mortgage servicing rights |
20,547 | — | — | 25,972 | ||||||||||||
|
|
|
|
|
|
|
|
|
|||||||||
| Total nonrecurring fair value measurements |
$ | 205,675 | $ | — | $ | 185,128 | $ | 25,972 | ||||||||
|
|
|
|
|
|
|
|
|
|||||||||
The following table sets forth the Company’s financial assets that were accounted for at fair value on a nonrecurring basis by level within the fair value hierarchy as of December 31, 2013 (in thousands):
| December 31, 2013 Fair Value Measurements Using: |
||||||||||||||||
| Carrying Value |
Quoted Prices in Active Markets for Identical Assets (Level 1) |
Significant Other Observable Inputs (Level 2) |
Significant Unobservable Inputs (Level 3) |
|||||||||||||
| Nonrecurring fair value measurements |
||||||||||||||||
| Mortgage notes receivable |
$ | 93,587 | $ | — | $ | 93,587 | $ | — | ||||||||
| Mortgage servicing rights |
16,676 | — | — | 20,258 | ||||||||||||
|
|
|
|
|
|
|
|
|
|||||||||
| Total nonrecurring fair value measurements |
$ | 110,263 | $ | — | $ | 93,587 | $ | 20,258 | ||||||||
|
|
|
|
|
|
|
|
|
|||||||||
Mortgage servicing rights do not trade in an active, open market with readily available observable prices. Since there is no ready market value for the mortgage servicing rights, such as quoted market prices or prices based on sales or purchases of similar assets, the Company determines the fair value of the mortgage servicing rights by estimating the present value of future cash flows associated with servicing the loans. Management makes certain assumptions and judgments in estimating the fair value of servicing rights. The estimate is based on a number of assumptions, including the benefits of servicing (contractual servicing fees and interest on escrow and float balances), the cost of servicing, prepayment rates (including risk of default), an inflation rate, the expected life of the cash flows and the discount rate. The significant assumptions utilized to value servicing rights as of December 31, 2014 and 2013 are as follows:
| As of December 31, | ||||
| 2014 | 2013 | |||
| Expected life of cash flows |
3 years to 11 years | 3 years to 10 years | ||
| Discount rate(1) |
14% to 20% | 15% to 20% | ||
| Prepayment rate |
0% to 8% | 0% to 8% | ||
| Inflation rate |
2% | 2% | ||
| Cost of service per loan |
$1,600 to $4,189 | $1,600 to $4,421 | ||
| (1) | Reflects the time value of money and the risk of future cash flows related to the possible cancellation of servicing contracts, transferability restrictions on certain servicing contracts, concentration in the life company portfolio and large loan risk. |
71
Table of Contents
HFF, Inc.
Notes to Consolidated Financial Statements — (Continued)
The above assumptions are subject to change based on management’s judgments and estimates of future changes in the risks related to future cash flows and interest rates. Changes in these factors would cause a corresponding increase or decrease in the prepayment rates and discount rates used in our valuation model.
FASB ASC Topic 825, Financial Instruments also requires disclosure of fair value information about financial instruments, whether or not recognized in the accompanying consolidated balance sheets. Our financial instruments, excluding those included in the preceding fair value tables above, are as follows:
Cash and Cash Equivalents: These balances include cash and cash equivalents with maturities of less than three months. The carrying amount approximates fair value due to the short-term maturities of these instruments; these are considered Level 1 fair values.
Warehouse line of credit: Due to the short-term nature and variable interest rates of this instrument, fair value approximates carrying value; these are considered Level 2 fair values.
| 7. | Capital Lease Obligations |
Capital lease obligations consist of the following at December 31, 2014 and 2013 (in thousands):
| December 31 | ||||||||
| 2014 | 2013 | |||||||
| Capital lease obligations |
$ | 766 | $ | 443 | ||||
| Less current maturities |
337 | 258 | ||||||
|
|
|
|
|
|||||
| $ | 429 | $ | 185 | |||||
|
|
|
|
|
|||||
Capital lease obligations consist primarily of office equipment leases that expire at various dates through April 2017. A summary of future minimum lease payments under capital leases at December 31, 2014 is as follows (in thousands):
| 2015 |
$ | 337 | ||
| 2016 |
286 | |||
| 2017 |
143 | |||
| 2018 |
— | |||
| 2019 |
— | |||
|
|
|
|||
| $ | 766 | |||
|
|
|
| 8. | Warehouse Line of Credit |
HFF LP maintains two uncommitted warehouse revolving lines of credit for the purpose of funding the Freddie Mac mortgage loans that it originates in connection with its services as a Freddie Mac Multifamily Program Plus® Seller/Servicer. The Company is a party to an uncommitted $350 million financing arrangement with PNC Bank, N.A. (PNC) and an uncommitted $125 million financing arrangement with The Huntington National Bank (Huntington). In January 2015, the $350 million financing arrangement with PNC was increased by $500 million for a period of 15 days, at which time the arrangement reverts back to $350 million. Additionally, on January 27, 2015, HFF LP entered into an agreement with Huntington to increase the uncommitted financing agreement by $100 million for a period of the lesser of 60 days after the first advance or May 1, 2015.
72
Table of Contents
HFF, Inc.
Notes to Consolidated Financial Statements — (Continued)
Each funding is separately approved on a transaction-by-transaction basis and is collateralized by a loan and mortgage on a multifamily property that is ultimately purchased by Freddie Mac. The PNC and Huntington National Bank financing arrangements are only for the purpose of supporting the Company’s participation in Freddie Mac’s Program Plus Seller Servicer program and cannot be used for any other purpose. As of December 31, 2014 and December 31, 2013, HFF LP had $185.1 million and $93.6 million, respectively, outstanding on the warehouse lines of credit and a corresponding amount of mortgage notes receivable. Interest on the warehouse lines of credit is at the 30-day LIBOR rate (0.15% and 0.17% at December 31, 2014 and December 31, 2013, respectively) plus a spread. HFF LP is also paid interest on its loans secured by multifamily loans at the rate in the Freddie Mac note.
| 9. | Lease Commitments |
The Company leases various corporate offices (which leases sometimes include parking spaces) and office equipment under noncancelable operating leases. These leases have initial terms of one to ten years. Several of the leases have termination clauses whereby the term may be reduced by two to seven years upon prior notice and payment of a termination fee by the Company. Total rental expense charged to operations was $7.8 million, $7.1 million, and $6.4 million for the years ended December 31, 2014, 2013 and 2012, respectively, and is recorded within occupancy expense in the consolidated statements of income.
Future minimum rental payments for the next five years under operating leases with noncancelable terms in excess of one year and without regard to early termination provisions are as follows (in thousands):
| 2015 |
$ | 7,477 | ||
| 2016 |
6,460 | |||
| 2017 |
6,323 | |||
| 2018 |
5,911 | |||
| 2019 |
5,238 | |||
| Thereafter |
10,040 | |||
|
|
|
|||
| $ | 41,449 | |||
|
|
|
The Company subleases certain office space to subtenants, some of which may be canceled at any time. The rental income received from these subleases is included as a reduction of occupancy expenses in the accompanying consolidated statements of income.
The Company also leases certain office equipment under capital leases that expire at various dates through 2017. See Note 4 and Note 7 for further description of the assets and related obligations recorded under these capital leases at December 31, 2014 and 2013, respectively.
HFF Holdings is not an obligor under, nor does it guarantee, any of the Company’s leases.
| 10. | Retirement Plan |
The Company maintains a retirement savings plan for all eligible employees, in which employees may make deferred salary contributions up to the maximum amount allowable by the IRS. After-tax contributions may also be made up to 50% of compensation. The Company makes matching contributions equal to 50% of the first 6% of both deferred and after-tax salary contributions, up to a maximum of $5,000. The Company’s contributions charged to expense for the plan were $2.1 million, $1.9 million, and $1.6 million for the years ended December 31, 2014, 2013 and 2012, respectively.
73
Table of Contents
HFF, Inc.
Notes to Consolidated Financial Statements — (Continued)
| 11. | Servicing |
The Company services commercial real estate loans for investors. The servicing portfolio totaled $39.3 billion, $33.1 billion, and $31.3 billion at December 31, 2014, 2013 and 2012, respectively.
In connection with its servicing activities, the Company holds funds in escrow for the benefit of mortgagors for hazard insurance, real estate taxes and other financing arrangements. At December 31, 2014, 2013 and 2012, the funds held in escrow totaled $240.3 million, $211.1 million and $172.9 million, respectively. These funds, and the offsetting obligations, are not presented in the Company’s financial statements as they do not represent assets and liabilities of the Company. Pursuant to the requirements of the various investors for which the Company services loans, the Company maintains bank accounts, holding escrow funds, which have balances in excess of the FDIC insurance limit. The fees earned on these escrow funds are reported in capital markets services revenue in the consolidated statements of income.
| 12. | Legal Proceedings |
The Company is party to various litigation matters, in most cases involving ordinary course and routine claims incidental to its business. The Company cannot estimate with certainty its ultimate legal and financial liability with respect to any pending matters. In accordance with ASC 450, Contingencies, a reserve for estimated losses is recorded when the amount is probable and can be reasonably estimated. However, the Company does not believe, based on examination of such pending matters, that a material loss related to these matters is reasonably possible.
| 13. | Income Taxes |
Income tax expense includes current and deferred taxes as follows (in thousands):
| Current | Deferred | Total | ||||||||||
| Year Ended December 31, 2014: |
||||||||||||
| Federal |
$ | 22,439 | $ | 13,102 | $ | 35,541 | ||||||
| State |
4,738 | 1,947 | 6,685 | |||||||||
|
|
|
|
|
|
|
|||||||
| $ | 27,177 | $ | 15,049 | $ | 42,226 | |||||||
|
|
|
|
|
|
|
|||||||
| Current | Deferred | Total | ||||||||||
| Year Ended December 31, 2013: |
||||||||||||
| Federal |
$ | 21,745 | $ | 8,146 | $ | 29,891 | ||||||
| State |
4,003 | 684 | 4,687 | |||||||||
|
|
|
|
|
|
|
|||||||
| $ | 25,748 | $ | 8,830 | $ | 34,578 | |||||||
|
|
|
|
|
|
|
|||||||
The reconciliation between the income tax computed by applying the U.S. federal statutory rate and the effective tax rate on net income is as follows for the year ended December 31, 2014 and 2013 (dollars in thousands):
| Dec. 31, 2014 |
Dec. 31, 2013 |
|||||||
| Pre-tax book income |
$ | 103,512 | $ | 86,004 | ||||
74
Table of Contents
HFF, Inc.
Notes to Consolidated Financial Statements — (Continued)
| December 31, | ||||||||||||||||
| 2014 | 2013 | |||||||||||||||
| Income Tax expense |
Rate | Rate | ||||||||||||||
| Taxes computed at federal rate |
$ | 36,229 | 35.0 | % | $ | 30,101 | 35.0 | % | ||||||||
| State and local taxes, net of federal tax benefit |
4,512 | 4.4 | % | 3,967 | 4.6 | % | ||||||||||
| Effect of deferred tax rate change |
776 | 0.7 | % | (822 | ) | (0.9 | )% | |||||||||
| Change in income tax benefit / payable to stockholder |
(280 | ) | (0.3 | )% | 364 | 0.4 | % | |||||||||
| Return to provision adjustment |
(49 | ) | (0.0 | )% | (285 | ) | (0.3 | )% | ||||||||
| Compensation limitation |
— | 0.0 | % | 525 | 0.6 | % | ||||||||||
| Meals and entertainment |
1,017 | 1.0 | % | 719 | 0.8 | % | ||||||||||
| Other |
21 | 0.0 | % | 9 | 0.0 | % | ||||||||||
|
|
|
|
|
|
|
|
|
|||||||||
| $ | 42,226 | 40.8 | % | $ | 34,578 | 40.2 | % | |||||||||
|
|
|
|
|
|
|
|
|
|||||||||
Deferred income tax assets and liabilities consist of the following at December 31, 2014 and 2013 (in thousands):
| December 31, | ||||||||
| 2014 | 2013 | |||||||
| Deferred income tax assets: |
||||||||
| Section 754 election tax basis step-up |
$ | 145,151 | $ | 158,229 | ||||
| Tenant improvements |
2,800 | 2,522 | ||||||
| Net operating loss carryforward |
36 | 379 | ||||||
| Restricted stock units |
3,762 | 5,271 | ||||||
| Compensation |
5,054 | 3,805 | ||||||
| Intangible asset |
470 | 510 | ||||||
| Tax credits |
— | 123 | ||||||
| Other |
398 | 348 | ||||||
|
|
|
|
|
|||||
| Deferred income tax asset |
157,671 | 171,187 | ||||||
| Deferred income tax liabilities: |
||||||||
| Goodwill |
(1,276 | ) | (1,277 | ) | ||||
| Servicing rights |
(7,815 | ) | (6,332 | ) | ||||
| Deferred rent |
(1,944 | ) | (1,892 | ) | ||||
| Investment in partnership |
(586 | ) | (587 | ) | ||||
|
|
|
|
|
|||||
| Deferred income tax liability |
(11,621 | ) | (10,088 | ) | ||||
|
|
|
|
|
|||||
| Net deferred income tax asset |
$ | 146,050 | $ | 161,099 | ||||
|
|
|
|
|
|||||
The primary deferred tax asset represents a tax basis step-up election under Section 754 of the Internal Revenue Code, as amended (“Section 754”), made by HFF, Inc. relating to the initial purchase of units of the Operating Partnerships in connection with the Reorganization Transactions and a tax basis step-up on subsequent exchanges of Operating Partnership units for the Company’s Class A common stock since the date of the Reorganization Transactions. As a result of the step-up in basis from these transactions, the Company is entitled to annual future tax benefits in the form of amortization for income tax purposes. The annual pre-tax benefit on the Section 754 basis step up and past payments under the tax receivable agreement was approximately $32.6 million at December 31, 2014. To the extent that the Company does not have sufficient taxable income in a year to fully utilize this annual deduction, the unused benefit is recharacterized as a net operating loss and can then be carried back two years or carried forward for twenty years. The Company measured the deferred tax asset
75
Table of Contents
HFF, Inc.
Notes to Consolidated Financial Statements — (Continued)
based on the estimated income tax effects of the increase in the tax basis of the assets owned by the Operating Partnerships utilizing the enacted tax rates at the date of the transaction. In accordance with ASC 740, the tax effects of transactions with shareholders that result in changes in the tax basis of a company’s assets and liabilities are recognized in equity. The Company initially recorded a valuation allowance on a portion of the recognized deferred tax assets recorded in connection with the Reorganization Transactions and the subsequent exercise of exchange rights due to the uncertainty in the timing and level of tax benefits that would be realized when payments are made to HFF Holdings under the Tax Receivable Agreement (see further discussion below). Prior to the fourth quarter of 2012, a valuation allowance was established on a portion of the deferred tax assets from the Section 754 step up. In the fourth quarter of 2012, the Company determined based on its analysis that the valuation allowance on the deferred tax assets was no longer required and therefore reversed this allowance. Changes in the measurement of the deferred tax assets or the valuation allowance due to changes in the enacted tax rates upon the finalization of the income tax returns for the year of the exchange transaction are recorded in equity. All subsequent changes in the measurement of the deferred tax assets due to changes in the enacted tax rates or changes in the valuation allowance are recorded as a component of income tax expense.
In evaluating the realizability of the deferred tax assets, management makes estimates and judgments regarding the level and timing of future taxable income, including projecting future revenue growth and changes to the cost structure. In order to realize the anticipated 2015 pre-tax benefit associated with the Section 754 basis step up and payments under the tax receivable agreement of approximately $32.6 million, the Company needs to generate approximately $287 million in revenue each year, assuming a constant cost structure. In the event that the Company cannot realize the anticipated 2015 pre-tax benefit of $32.6, the shortfall becomes a net operating loss that can be carried back two years to offset prior years’ taxable income or carried forward 20 years to offset future taxable income. Based on this analysis and other quantitative and qualitative factors, management believes that it is currently more likely than not that the Company will be able to generate sufficient taxable income to realize the net deferred tax assets resulting from the basis step up transactions (initial sale of units in the Operating Partnerships and subsequent exchanges of Operating Partnership units since the date of the Reorganization Transactions). The Company has no federal net operating losses at December 31, 2014. The state tax effected net operating loss carryforwards of $36,000 at December 31, 2014 represent the cumulative excess of the Section 754 annual tax deductions over taxable income for 2014 and prior years. The state net operating loss carryforwards expire in 2028.
The Company has analyzed the need for a reserve for unrecognized tax benefits under ASC 740-10 and has determined that any such tax benefits do not have a material impact on the financial statements. It is not expected that there will be a significant increase or decrease in the amount of unrecognized tax benefits within the next 12 months. With few exceptions, the Company is no longer subject to US federal or state and local tax examinations by tax authorities before 2011.
The Company will recognize interest and penalties related to unrecognized tax benefits in interest and other income, net in the consolidated statements of income. There were no interest or penalties recorded in the twelve months ended December 31, 2014 or December 31, 2013.
Tax Receivable Agreement
In connection with the Reorganization Transactions, HFF LP and HFF Securities made an election under Section 754 for 2007 and intend to keep that election in effect for each taxable year in which an exchange of Operating Partnership partnership units for shares of the Company’s Class A common stock occurred. The initial sale as a result of the offering and the subsequent exchanges of partnership units increased the tax basis of the assets owned by HFF LP and HFF Securities to their fair market value. This increase in tax basis allows the
76
Table of Contents
HFF, Inc.
Notes to Consolidated Financial Statements — (Continued)
Company to reduce the amount of future tax payments to the extent that the Company has future taxable income. As a result of the increase in tax basis, the Company is entitled to future tax benefits of $145.2 million and has recorded this amount as a deferred tax asset on its consolidated balance sheet. The Company has updated its estimate of these future tax benefits based on the changes to the estimated annual effective tax rate for 2014 and 2013. The Company is obligated, however, pursuant to its Tax Receivable Agreement with HFF Holdings, to pay to HFF Holdings, 85% of the amount of cash savings, if any, in U.S. federal, state and local income tax that the Company actually realizes as a result of these increases in tax basis and as a result of certain other tax benefits arising from the Company entering into the tax receivable agreement and making payments under that agreement. For purposes of the tax receivable agreement, actual cash savings in income tax will be computed by comparing the Company’s actual income tax liability to the amount of such taxes that it would have been required to pay had there been no increase to the tax basis of the assets of HFF LP and HFF Securities as a result of the initial sale and later exchanges and had the Company not entered into the tax receivable agreement.
The Company accounts for the income tax effects and corresponding tax receivable agreement effects as a result of the initial purchase and the sale of units of the Operating Partnerships in connection with the Reorganization Transactions and exchanges of Operating Partnership units for the Company’s Class A shares by recognizing a deferred tax asset for the estimated income tax effects of the increase in the tax basis of the assets owned by the Operating Partnerships, based on enacted tax rates at the date of the transaction, less any tax valuation allowance the Company believes is required. In accordance with ASC 740, the tax effects of transactions with shareholders that result in changes in the tax basis of a company’s assets and liabilities will be recognized in equity. If transactions with shareholders result in the recognition of deferred tax assets from changes in the company’s tax basis of assets and liabilities, the valuation allowance initially required upon recognition of these deferred assets will be recorded in equity. Subsequent changes in enacted tax rates or any valuation allowance are recorded as a component of income tax expense.
The Company believes it is more likely than not that it will realize the benefit represented by the deferred tax asset, and, therefore, the Company recorded 85% of this estimated amount of the increase in deferred tax assets, as a liability to HFF Holdings under the tax receivable agreement and the remaining 15% of the increase in deferred tax assets directly in additional paid-in capital in stockholders’ equity.
While the actual amount and timing of payments under the tax receivable agreement will depend upon a number of factors, including the amount and timing of taxable income generated in the future, changes in future tax rates, the value of individual assets, the portion of the Company’s payments under the tax receivable agreement constituting imputed interest and increases in the tax basis of the Company’s assets resulting in payments to HFF Holdings, the Company has estimated that the payments that will be made to HFF Holdings will be $134.2 million and has recorded this obligation to HFF Holdings as a liability on the consolidated balance sheet. During the year ended December 31, 2014, the tax rates used to measure the deferred tax assets were updated which resulted in a decrease of deferred tax assets of $0.8 million which resulted in a decrease in the payable under the tax receivable agreement of $0.7 million. The tax rates used to measure the deferred tax assets were also updated during the year ended December 31, 2013, which resulted in an increase of deferred tax assets of $0.8 million which resulted in a decrease in the payable under the tax receivable agreement of $0.7 million. To the extent the Company does not realize all of the tax benefits in future years, this liability to HFF Holdings may be reduced.
In conjunction with filing of the Company’s 2013 federal and state tax returns, the benefit for 2013 relating to the Section 754 basis step-up was finalized resulting in $12.5 million of tax benefits being realized by the Company. As discussed above, the Company is obligated to remit to HFF Holdings 85% of any such cash savings in federal and state tax. As such during 2014, the Company paid $10.7 million to HFF Holdings under the tax receivable
77
Table of Contents
HFF, Inc.
Notes to Consolidated Financial Statements — (Continued)
agreement. In conjunction with the filing of the Company’s 2012 federal and state tax returns, the benefit for 2012 relating to the Section 754 basis step-up was finalized resulting in $12.2 million in tax benefits realized by the Company for 2012. During August 2013, the Company paid $10.4 million to HFF Holdings under this tax receivable agreement. As of December 31, 2014, the Company has made payments to HFF Holdings pursuant to the terms of the tax receivable agreement in an aggregate amount of approximately $52.6 million and the Company anticipates to make a payment of approximately $10.8 million to HFF Holdings in 2015.
| 14. | Noncontrolling Interest |
Noncontrolling interest recorded in the consolidated financial statements of HFF, Inc. relates to the ownership interest of HFF Holdings in the Operating Partnerships that HFF Holdings held prior to August 31, 2012. As a result of the Reorganization Transactions discussed in Note 1, partners’ capital was eliminated from equity and a noncontrolling interest of $6.4 million was recorded representing HFF Holdings remaining interest in the Operating Partnerships following the initial public offering and the underwriters’ exercise of the overallotment option on February 21, 2007, along with HFF Holdings’ proportional share of net income earned by the Operating Partnerships subsequent to the change in ownership. As discussed in Note 1, HFF, Inc. is a holding company and, as such, does not generate income other than through its proportional share of net income earned by the Operating Partnerships. However, HFF, Inc. does incur certain costs which are not allocated or shared with the Operating Partnerships or their direct or indirect partners (including, prior to August 31, 2012, HFF Holdings) and, therefore, the net income as shown on the consolidated statements of income is not proportionately shared between the noncontrolling interest holder and the controlling interest holder.
As a result of the Reorganization Transactions, HFF Holdings beneficially owned 20,355,000 partnership units in each of the Operating Partnerships. Pursuant to the terms of HFF, Inc.’s amended and restated certificate of incorporation, HFF Holdings was entitled from time to time to exchange, subject to certain restrictions, its partnership units in the Operating Partnerships for shares of the Company’s Class A common stock on the basis of two partnership units, one for each Operating Partnership, for one share of Class A common stock, subject to customary conversion rate adjustments for stock splits, stock dividends and reclassifications.
All of the partnership units were exchanged as of August 31, 2012 by members of HFF Holdings for an equal amount of shares of Class A common stock. During the year ending December 31, 2012, 997,089 partnership units were exchanged. The table below sets forth the noncontrolling interest amount recorded during the year ending December 31, 2012, which includes the exchange of 845,947 partnership units for 845,947 shares of Class A common stock during the three months ended March 31, 2012, 18,000 partnership units for 18,000 shares of Class A common stock during the three months ended June 30, 2012 and 133,142 partnership units for 133,142 shares of Class A common stock during the three months ended September 30, 2012 (dollars in thousands).
| Three Months Ended 3/31/12 |
Three Months Ended 6/30/12 |
Three Months Ended 9/30/12 |
Three Months Ended 12/31/12 |
Year Ended 12/31/12 |
||||||||||||||||
| Net income from operating partnerships |
$ | 6,124 | $ | 19,039 | $ | 17,083 | $ | 29,402 | $ | 71,648 | ||||||||||
| Noncontrolling interest ownership percentage |
(A | ) | (B | ) | (C | ) | 0.00 | % | ||||||||||||
|
|
|
|
|
|
|
|
|
|
|
|||||||||||
| Noncontrolling interest |
$ | 121 | $ | 75 | $ | 47 | $ | — | $ | 243 | ||||||||||
|
|
|
|
|
|
|
|
|
|
|
|||||||||||
| (A) | During the three months ending March 31, 2012, the ownership of the Operating Partnerships changed due to the exercise of exchange rights of HFF Holdings. HFF Holdings’ ownership percentage in the Operating Partnerships was 2.71% during January and February 2012 and 0.43% during March 2012. |
78
Table of Contents
HFF, Inc.
Notes to Consolidated Financial Statements — (Continued)
| (B) | During the three months ending June 30, 2012, the ownership of the Operating Partnerships changed due to the exercise of exchange rights of HFF Holdings. HFF Holdings’ ownership percentage in the Operating Partnerships was 0.41% during April 2012, 0.39% during May 2012 and 0.38% during June 2012. |
| (C) | During the three months ending September 30, 2012, the ownership of the Operating Partnerships changed due to the exercise of exchange rights of HFF Holdings. HFF Holdings’ ownership percentage in the Operating Partnerships was 0.36% during July and August 2012 and 0.00% during September 2012. |
On September 30, 2009, a Registration Statement on Form S-3 relating to the offering and sale from time to time by the members of HFF Holdings of the 20,355,000 shares of Class A common stock exchangeable for the 20,355,000 partnership units in each of the Operating Partnerships beneficially owned by members of HFF Holdings immediately following the Reorganization Transactions became effective. At December 31, 2012, all such 20,355,000 partnership units had been exchanged for an equal amount of shares of the Company’s Class A common stock pursuant to the Exchange Right. After giving effect to these changes, HFF Holdings owned 0% of the Operating Partnerships and the Company, through its wholly-owned subsidiaries, became on August 31, 2012, and continues to be, the only equity holder of the Operating Partnerships.
As a result of the Reorganization Transactions, HFF Holdings was issued one share of the Company’s Class B common stock. Class B common stock had no economic rights but entitled the holder to a number of votes that is equal to the total number of shares of Class A common stock for which the partnership units that HFF Holdings held in the Operating Partnerships, as of the relevant record date for the HFF, Inc. stockholder action, were exchangeable. Since all of the partnership units had been exchanged as of August 31, 2012, the Class B common stock was transferred to the Company and retired on August 31, 2012 in accordance with the Company’s certificate of incorporation.
| 15. | Stockholders Equity |
The Company is authorized to issue 175,000,000 shares of Class A common stock, par value $0.01 per share, and one share of Class B common stock, par value $0.01 per share. Each share of Class A common stock entitles its holder to one vote on all matters to be voted on by stockholders generally. As part of the Reorganization Transactions, HFF Holdings was issued one share of Class B common stock. Class B common stock had no economic rights but entitled the holder to a number of votes equal to the total number of shares of Class A common stock for which the partnership units that HFF Holdings held in the Operating Partnerships, as of the relevant record date for the HFF, Inc. stockholder action, were exchangeable. Holders of Class A and Class B common stock voted together as a single class on all matters presented to the stockholders for their vote or approval. Since all of the partnership units have been exchanged as of August 31, 2012, the Class B common stock was transferred to the Company and retired on August 31, 2012 in accordance with the Company’s certificate of incorporation. The Company had issued 38,125,363 and 37,498,796 shares of Class A common stock as of December 31, 2014 and December 31, 2013, respectively.
On January 20, 2015, our board of directors declared a special cash dividend of $1.80 per share of Class A common stock to stockholders of record on February 2, 2015. The aggregate dividend payment was paid on February 13, 2015 and totaled approximately $67.8 million based on the number of shares of Class A common stock then outstanding. Additionally, 49,383 restricted stock units (dividend units) were granted for those unvested and vested but not issued restricted stock units as of the record date of February 2, 2015. These dividend units follow the same vesting terms as the underlying restricted stock units. Additionally, on January 15, 2014, the Company’s board of directors declared a special cash dividend of $1.83 per share of Class A common stock to stockholders of record on January 27, 2014. The aggregate dividend payment was paid on February 6, 2014 and totaled approximately $68.2 million based on the number of shares of Class A common stock then outstanding.
79
Table of Contents
HFF, Inc.
Notes to Consolidated Financial Statements — (Continued)
Additionally, 42,108 restricted stock units (dividend units) were granted for those unvested and vested but not issued restricted stock units as of the record date of January 27, 2014. These dividend units follow the same vesting terms as the underlying restricted stock units.
| 16. | Earnings Per Share |
The Company’s net income and weighted average shares outstanding for the years ended December 31, 2014 and 2013, consists of the following (dollars in thousands):
| Year Ended December 31, 2014 |
Year Ended December 31, 2013 |
|||||||
| Net income |
$ | 61,286 | $ | 51,426 | ||||
| Weighted Average Shares Outstanding: |
||||||||
| Basic |
37,758,519 | 37,345,918 | ||||||
| Diluted |
37,982,351 | 37,745,685 | ||||||
The calculations of basic and diluted net income per share amounts for the years ended December 31, 2014 and 2013 are described and presented below.
Basic Net Income per Share
Numerator — net income for the three and twelve months ended December 31, 2014 and 2013, respectively.
Denominator — the weighted average shares of Class A common stock for the three and twelve months ended December 31, 2014 and 2013, including 149,229 and 130,418 restricted stock units that have vested and whose issuance is no longer contingent as of December 31, 2014 and 2013, respectively.
Diluted Net Income per Share
Numerator — net income for the three and twelve month periods ended December 31, 2014 and 2013 as in the basic net income per share calculation described above.
80
Table of Contents
HFF, Inc.
Notes to Consolidated Financial Statements — (Continued)
Denominator — the weighted average shares of Class A common stock for the three and twelve months ended December 31, 2014 and 2013, including 149,229 and 130,418 restricted stock units that have vested and whose issuance is no longer contingent as of December 31, 2014 and 2013, respectively, plus the dilutive effect of the unrestricted stock units and stock options. There were no anti-dilutive unrestricted stock units and stock options in 2014 and 2013.
| Three Months Ended December 31, 2014 |
Year Ended December 31, 2014 |
Three Months Ended December 31, 2013 |
Year Ended December 31, 2013 |
|||||||||||||
| Basic Earnings Per Share of Class A Common Stock |
||||||||||||||||
| Numerator: |
||||||||||||||||
| Net income |
$ | 26,945 | $ | 61,286 | $ | 22,665 | $ | 51,426 | ||||||||
| Denominator: |
||||||||||||||||
| Weighted average number of shares of Class A common stock outstanding |
37,826,940 | 37,758,519 | 37,378,661 | 37,345,918 | ||||||||||||
| Basic net income per share of Class A common stock |
$ | 0.71 | $ | 1.62 | $ | 0.61 | $ | 1.38 | ||||||||
| Diluted Earnings Per Share of Class A Common Stock |
||||||||||||||||
| Numerator: |
||||||||||||||||
| Net income |
$ | 26,945 | $ | 61,286 | $ | 22,665 | $ | 51,426 | ||||||||
| Denominator: |
||||||||||||||||
| Basic weighted average number of shares of Class A common stock |
37,826,940 | 37,758,519 | 37,378,661 | 37,345,918 | ||||||||||||
| Add — dilutive effect of: |
||||||||||||||||
| Unvested restricted stock units |
357,713 | 198,619 | 537,215 | 378,594 | ||||||||||||
| Stock options |
25,250 | 25,213 | 23,912 | 21,173 | ||||||||||||
| Weighted average common shares outstanding — diluted |
38,209,903 | 37,982,351 | 37,939,788 | 37,745,685 | ||||||||||||
| Diluted earnings per share of Class A common stock |
$ | 0.71 | $ | 1.61 | $ | 0.60 | $ | 1.36 | ||||||||
| 17. | Concentrations |
A significant portion of the Company’s capital markets services revenues is derived from transactions involving commercial real estate located in specific geographic areas. During 2014, approximately 25.0%, 12.7%, 7.8%, 6.1%, 5.0% and 5.9% of the Company’s capital markets services revenues were derived from transactions involving commercial real estate located in Texas, California, Florida, Illinois, New York and the region consisting of the District of Columbia, Maryland and Virginia, respectively. During 2013, approximately 25.2%, 12.9%, 6.3%, 5.5%, 5.0% and 6.1% of the Company’s capital markets services revenues were derived from transactions involving commercial real estate located in Texas, California, Florida, Illinois, Massachusetts and the region consisting of the District of Columbia, Maryland and Virginia, respectively. As a result, a significant portion of the Company’s business is dependent on the economic conditions in general and the markets for commercial real estate in these areas.
81
Table of Contents
HFF, Inc.
Notes to Consolidated Financial Statements — (Continued)
| 18. | Related Party Transactions |
The Company made payments on behalf of two affiliates, HFF Holdings and Holdings Sub (the “Holdings Affiliates”), of $0 and $1,617, respectively during the year ended December 31, 2014. The Holdings Affiliates paid $0 and $172,834 of the intercompany balance to the Company during the year ended December 31, 2014 and 2013, respectively. The Company made payments on behalf of the Holdings Affiliates of $488 and $48,481 during the year ended December 31, 2013. These payments by the Company are primarily for professional services fees and other miscellaneous operating expenses on behalf of the Holdings Affiliates. The Company had a net receivable from the Holdings Affiliates of $2,000 and zero as of December 31, 2014 and 2013, respectively.
As a result of the Company’s initial public offering, the Company entered into a tax receivable agreement with HFF Holdings that provides for the payment by the Company to HFF Holdings of 85% of the amount of the cash savings, if any, in U.S. federal, state and local income tax that the Company actually realizes as a result of the increase in tax basis of the assets owned by HFF LP and HFF Securities and as a result of certain other tax benefits arising from entering into the tax receivable agreement and making payments under that agreement. As members of HFF Holdings, each of Mark Gibson, the Company’s chief executive officer, Jody Thornton, the Company’s president and member of the Company’s board of directors and a transaction professional of the Operating Partnerships, and John Fowler, a current director emeritus of the Company’s board of directors and a transaction professional of the Operating Partnerships, and H. Scott Galloway, Matthew D. Lawton, Gerard T. Sansosti and Manuel A. de Zarraga, each an Executive Managing Director and a transaction professional of the Operating Partnerships, is entitled to participate in such payments, in each case on a pro rata basis based upon such person’s ownership of interests in each series of tax receivable payments created by the initial public offering or subsequent exchange of Operating Partnership units. During the third quarter of 2014, Messrs. Gibson, Thornton, Fowler, Galloway, Lawton, Sansosti and de Zarraga received payments of $0.9 million, $0.9 million, $0.7 million, $0.4 million, $0.3 million, $0.4 million and $0.3 million in connection with the Company’s payment of $10.7 million to HFF Holdings under the tax receivable agreement. During the third quarter of 2013, Messrs. Gibson, Thornton, Fowler, Galloway, Lawton, Sansosti and de Zarraga received payments of $0.9 million, $0.9 million, $0.7 million, $0.4 million, $0.2 million, $0.4 million and $0.2 million in connection with the Company’s payment of $10.4 million to HFF Holdings under the tax receivable agreement. The Company will retain the remaining 15% of cash savings, if any, in income tax that it realizes. For purposes of the tax receivable agreement, cash savings in income tax will be computed by comparing the Company’s actual income tax liability to the amount of such taxes that it would have been required to pay had there been no increase to the tax basis of the assets of HFF LP and HFF Securities allocable to the Company as a result of the initial sale and later exchanges and had the Company not entered into the tax receivable agreement. The term of the tax receivable agreement commenced upon consummation of the offering and will continue until all such tax benefits have been utilized or have expired. See Note 13 for further information regarding the tax receivable agreement and Note 19 for the amount recorded in relation to this agreement.
| 19. | Commitments and Contingencies |
The Company is obligated, pursuant to its tax receivable agreement with HFF Holdings, to pay to HFF Holdings 85% of the amount of cash savings, if any, in U.S. federal, state and local income tax that the Company actually realizes as a result of the increases in tax basis under Section 754 and as a result of certain other tax benefits arising from the Company entering into the tax receivable agreement and making payments under that agreement. During the year ended December 31, 2014, the Company paid HFF Holdings $10.7 million, which represents 85% of the actual cash savings realized by the Company in 2013. During the year ended December 31, 2013, the Company paid HFF Holdings $10.4 million, which represents 85% of the actual cash savings realized by the Company in 2012. The Company has recorded $134.2 million and $145.6 million for this obligation to HFF Holdings as a liability on the consolidated balance sheets as of December 31, 2014 and 2013, respectively. The Company anticipates making a payment to HFF Holdings of approximately $10.8 million in 2015.
82
Table of Contents
HFF, Inc.
Notes to Consolidated Financial Statements — (Continued)
In recent years, the Company has entered into arrangements with newly-hired transaction professionals whereby these transaction professionals would be paid additional compensation if certain performance targets are met over a defined period. These payments will be made to the transaction professionals only if they enter into an employment agreement at the end of the performance period. Payments under these arrangements, if earned, would be paid in fiscal years 2016 through 2018. Currently, the Company cannot reasonably estimate the amounts that would be payable under all of these arrangements. The Company begins to accrue for these payments when it is deemed probable that payments will be made; therefore, on a quarterly basis, the Company evaluates the probability of each of the transaction professionals achieving the performance targets and the probability of each of the transaction professionals signing an employment agreement. As of December 31, 2014 and 2013, $3.3 million and $2.6 million, respectively, have been accrued for these arrangements on the consolidated balance sheet.
| 20. | Selected Quarterly Financial Data (unaudited, in thousands except for per share data) |
| Quarter Ended | ||||||||||||||||
| 2014 |
March 31 | June 30 | September 30 | December 31 | ||||||||||||
| Net revenue |
$ | 76,031 | $ | 94,787 | $ | 112,611 | $ | 142,489 | ||||||||
| Operating income |
3,818 | 18,006 | 25,783 | 37,220 | ||||||||||||
| Interest and other income, net |
2,910 | 3,241 | 4,144 | 7,631 | ||||||||||||
| Decrease in payable under the tax receivable agreement |
501 | — | 299 | — | ||||||||||||
| Net income |
3,707 | 12,608 | 18,026 | 26,945 | ||||||||||||
| Per share data (1) |
||||||||||||||||
| Basic earnings per share |
$ | 0.10 | $ | 0.33 | $ | 0.48 | $ | 0.71 | ||||||||
| Diluted earnings per share |
$ | 0.10 | $ | 0.33 | $ | 0.47 | $ | 0.71 | ||||||||
| Quarter Ended | ||||||||||||||||
| 2013 |
March 31 | June 30 | September 30 | December 31 | ||||||||||||
| Net revenue |
$ | 54,215 | $ | 81,008 | $ | 89,414 | $ | 130,968 | ||||||||
| Operating (loss) income |
(121 | ) | 15,410 | 18,645 | 36,043 | |||||||||||
| Interest and other income, net |
4,187 | 6,424 | 3,546 | 2,943 | ||||||||||||
| Increase in payable under the tax receivable agreement |
— | (339 | ) | (701 | ) | — | ||||||||||
| Net income |
2,316 | 13,100 | 13,345 | 22,665 | ||||||||||||
| Per share data (1) |
||||||||||||||||
| Basic earnings per share |
$ | 0.06 | $ | 0.35 | $ | 0.36 | $ | 0.61 | ||||||||
| Diluted earnings per share |
$ | 0.06 | $ | 0.35 | $ | 0.35 | $ | 0.60 | ||||||||
| (1) | Earnings per share were computed independently for each of the periods presented; therefore, the sum of the earnings per share amounts for the quarters may not equal the total for the year. |
83
Table of Contents
| Item 9. | Changes in and Disagreements with Accountants on Accounting and Financial Disclosure |
None.
| Item 9A. | Controls and Procedures |
Evaluation of Disclosure Controls and Procedures.
The Company maintains disclosure controls and procedures that are designed to ensure that information required to be disclosed in the reports that the Company files or furnishes under the Securities Exchange Act of 1934 is recorded, processed, summarized and reported within the time periods specified in the SEC’s rules and forms, and that such information is accumulated and communicated to the Company’s management, including its Chief Executive Officer and Chief Financial Officer, as appropriate, to allow timely decisions regarding required financial disclosure.
Our Chief Executive Officer and Chief Financial Officer (our principal executive officer and principal financial officer, respectively) have evaluated the effectiveness of our disclosure controls and procedures (as defined in Rule 13a-15(e) under the Securities Exchange Act of 1934, as amended) as of the end of the period covered by this Annual Report on Form 10-K.
Based on this evaluation, our principal executive officer and principal financial officer have concluded that, as of December 31, 2014, our current disclosure controls and procedures are effective to provide reasonable assurance that material information required to be included in our periodic SEC reports is recorded, processed, summarized and reported within the time periods specified in the SEC rules and forms.
Limitations on the Effectiveness of Controls.
The design of any system of control is based upon certain assumptions about the likelihood of future events, and there can be no assurance that any design will succeed in achieving its stated objectives under all future events, no matter how remote, or that the degree of compliance with the policies or procedures may not deteriorate. Because of its inherent limitations, disclosure controls and procedures may not prevent or detect all misstatements. Accordingly, even effective disclosure controls and procedures can only provide reasonable assurance of achieving their control objectives.
Changes in Internal Control Over Financial Reporting.
There have been no changes in our internal controls over financial reporting that occurred during the three month period ended December 31, 2014 that have materially affected, or are reasonably likely to materially affect, the Company’s internal control over financial reporting.
The Company’s report on internal control over financial reporting is included in Item 8 of this Annual Report on Form 10-K.
None.
84
Table of Contents
| Item 10. | Directors, Executive Officers and Corporate Governance |
The information required by this Item is incorporated herein by reference from the Company’s definitive proxy statement for use in connection with the 2015 Annual Meeting of Stockholders (the “Proxy Statement”) to be filed within 120 days after the end of the Company’s fiscal year ended December 31, 2014.
The Company has adopted a code of conduct that applies to its Chief Executive Officer and Chief Financial Officer. This code of conduct as well as periodic and current reports filed with the SEC are available through the Company’s web site at www.hfflp.com. If the Company makes any amendments to this code other than technical, administrative or other non-substantive amendments, or grants any waivers, including implicit waivers, from a provision of this code to the Company’s Chief Executive Officer or Chief Financial Officer, the Company will disclose the nature of the amendment or waiver, its effective date and to whom it applies in a Current Report on Form 8-K filed with the SEC.
| Item 11. | Executive Compensation |
The information required by this Item is incorporated herein by reference from the Proxy Statement.
| Item 12. | Security Ownership of Certain Beneficial Owners and Management and Related Stockholder Matters |
Certain information required by this Item is incorporated herein by reference from the Proxy Statement.
The following table provides information as of December 31, 2014 with respect to shares of the Company’s Class A common stock that may be issued under its 2006 Omnibus Incentive Compensation Plan:
| Equity Compensation Plan Information | ||||||||||||
| Plan category |
Number of Securities to be Issued Upon Exercise of Outstanding Options, Warrants and Rights (a) |
Weighted average Exercise Price of Outstanding Options, Warrants and Rights (b) |
Number of Securities Remaining Available for Future Issuance Under Equity Compensation Plans (excluding Securities Reflected in Column (a)) (c) |
|||||||||
| Equity compensation plans approved by security holders |
1,095,091 | $ | 24.14 | 1,526,928 | ||||||||
| Equity compensation plans not approved by security holders |
N/A | N/A | N/A | |||||||||
|
|
|
|
|
|
|
|||||||
| Total |
1,095,091 | $ | 24.14 | 1,526,928 | ||||||||
|
|
|
|
|
|
|
|||||||
| Item 13. | Certain Relationships, Related Transactions, and Director Independence |
The information required by this Item is incorporated herein by reference from the Proxy Statement.
| Item 14. | Principal Accountant Fees and Services |
The information required by this Item is incorporated herein by reference from the Proxy Statement.
85
Table of Contents
| Item 15. | Exhibits and Financial Statement Schedules |
(a)(1)(2) The financial statements and financial statement schedules filed as part of this Annual Report are set forth under Item 8. Reference is made to the index on page 49. All schedules are omitted because they are not applicable, not required or the information appears in the Company’s consolidated financial statements or notes thereto.
(3) Exhibits
See Exhibit Index.
86
Table of Contents
Pursuant to the requirements of Section 13 or 15(d) of the Securities Exchange Act of 1934, the Registrant has duly caused this report to be signed on its behalf by the undersigned, thereunto duly authorized, on February 27, 2015.
| HFF, INC. | ||
| By: | /s/ Mark D. Gibson | |
| Mark D. Gibson Its: Chief Executive Officer | ||
Pursuant to the requirements of the Securities Exchange Act of 1934, this report has been signed below by the following persons on behalf of the Registrant in the capacities and on the dates indicated.
| Signature |
Capacity |
Date | ||
| /s/ Mark D. Gibson Mark D. Gibson |
Chief Executive Officer, Director
|
February 27, 2015 | ||
| /s/ Gregory R. Conley Gregory R. Conley |
Chief Financial Officer (Principal
|
February 27, 2015 | ||
| /s/ Deborah H. McAneny Deborah H. McAneny |
Director |
February 27, 2015 | ||
| /s/ Susan P. McGalla Susan P. McGalla |
Director |
February 27, 2015 | ||
| /s/ George L. Miles, Jr. George L. Miles, Jr. |
Director |
February 27, 2015 | ||
| /s/ Morgan K. O’Brien Morgan K. O’Brien |
Director |
February 27, 2015 | ||
| /s/ Lenore M. Sullivan Lenore M. Sullivan |
Director |
February 27, 2015 | ||
| /s/ Joe B. Thornton, Jr. Joe B. Thornton, Jr. |
Director |
February 27, 2015 | ||
| /s/ Steven E. Wheeler Steven E. Wheeler |
Director |
February 27, 2015 | ||
87
Table of Contents
| 2.1 | Sale and Merger Agreement, dated January 30, 2007 (incorporated by reference to Exhibit 10.5 to the Registrant’s Registration Statement on Form S-l (File No. 333-138579) (“Form S-l”) filed with the SEC on December 22, 2006) | |
| 3.1 | Amended and Restated Certificate of Incorporation of the Registrant (incorporated by reference to Exhibit 3.1 to the Form S-l filed with the SEC on December 22, 2006) | |
| 3.2 | Amended and Restated Bylaws of the Registrant (incorporated by reference to Exhibit 3.2 to the Form S-1 filed with the SEC on December 22, 2006) | |
| 10.1 | Holliday Fenoglio Fowler, L.P. Partnership Agreement, dated February 5, 2007 (incorporated by reference to Exhibit 10.1 to the Registrant’s Annual Report on Form 10-K for the year ended December 31, 2006 (File No. 001-33280) filed with the SEC on March 16, 2007) | |
| 10.2 | First Amendment to Amended and Restated Texas Limited Partnership Agreement of Holliday Fenoglio Fowler, L.P., dated May 6, 2011 (incorporated by reference to Exhibit 10.2 to the Registrant’s Quarterly Report on Form 10-Q for the quarter ended March 31, 2011 (File No. 001-33280) filed with the SEC on May 6, 2011) | |
| 10.3 | Second Amendment to Amended and Restated Texas Limited Partnership Agreement of Holliday Fenoglio Fowler, L.P., dated November 12, 2013 (incorporated by reference to Exhibit 10.3 to the Registrant’s Annual Report on Form 10-K for the year ended December 31, 2013 (File No. 001-33280) filed with the SEC on March 14, 2014) | |
| 10.4 | HFF Securities L.P. Partnership Agreement, dated February 5, 2007 (incorporated by reference to Exhibit 10.2 to the Registrant’s Annual Report on Form 10-K for the year ended December 31, 2006 (File No. 001-33280) filed with the SEC on March 16, 2007) | |
| 10.5 | First Amendment to Amended and Restated Limited Partnership Agreement of HFF Securities, L.P., dated May 6, 2011 (incorporated by reference to Exhibit 10.1 to the Registrant’s Quarterly Report on Form 10-Q for the quarter ended March 31, 2011 (File No. 001-33280) filed with the SEC on May 6, 2011) | |
| 10.6 | Tax Receivable Agreement, dated February 5, 2007 (incorporated by reference to Exhibit 10.3 to the Form S-1 filed with the SEC on December 22, 2006) | |
| 10.7 | Registration Rights Agreement, dated February 5, 2007 (incorporated by reference to Exhibit 10.4 to the Form S-1 filed with the SEC on December 22, 2006) | |
| 10.8 | HFF, Inc. 2006 Omnibus Incentive Compensation Plan, dated January 30, 2007 (incorporated by reference to Exhibit 10.9 to the Form S-l filed with the SEC on January 8, 2007) | |
| 10.9 | Holliday Fenoglio Fowler, L.P. Amended and Restated Profit Participation Bonus Plan (incorporated by reference to Exhibit 10.1 to the Registrant’s Current Report on Form 8-K (File No. 001-33280), filed with the SEC on January 21, 2011) | |
| 10.10 | HFF Securities, L.P. Amended and Restated Profit Participation Bonus Plan (incorporated by reference to Exhibit 10.2 to the Registrant’s Current Report on Form 8-K (File No. 001-33280), filed with the SEC on January 21, 2011) | |
| 10.11 | HFF, Inc. Firm Profit Participation Bonus Plan (incorporated by reference to Exhibit 10.3 to the Registrant’s Current Report on Form 8-K (File No. 001-33280), filed with the SEC on January 21, 2011) | |
| 10.12 | Employment Agreement between the Registrant and Mark D. Gibson, dated February 5, 2007 | |
88
Table of Contents
| 10.13 | First Amendment to Amended and Restated Employment Agreement, by and between Mark D. Gibson, and Holliday Fenoglio Fowler, L.P. dated June 30, 2010 | |
| 10.14 | Employment Agreement between the Registrant and Joe B. Thornton, Jr., dated February 5, 2007 | |
| 10.15 | First Amendment to Amended and Restated Employment Agreement, by and between Joe B. Thornton, Jr., and Holliday Fenoglio Fowler, L.P. dated June 30, 2010 | |
| 10.16 | Employment Agreement between the Registrant and Gregory R. Conley, dated January 30, 2007 (incorporated by reference to Exhibit 10.9 to the Registrant’s Annual Report on Form 10-K for the year ended December 31, 2006 (File No. 001-33280) filed with the SEC on March 16, 2007) | |
| 10.17 | Employment Agreement between the Registrant and Nancy Goodson, dated January 30, 2007 (incorporated by reference to Exhibit 10.10 to the Registrant’s Annual Report on Form 10-K for the year ended December 31, 2006 (File No. 001-33280) filed with the SEC on March 16, 2007) | |
| 10.18 | Form of Contribution Agreement entered into with each of Mark D. Gibson, Deborah H. McAneny, Susan P. McGalla, George L. Miles, Jr., Morgan K. O’Brien, Lenore M. Sullivan, Joe B. Thornton, Jr. and Steven E. Wheeler (incorporated by reference to Exhibit 10.13 to the Registrant’s Annual Report on Form 10-K for the year ended December 31, 2007 (File No. 001-33280) filed with the SEC on March 17, 2008) | |
| 21.1 | Subsidiaries of the Registrant (incorporated by reference to Exhibit 21.1 to the Registrant’s Annual Report on Form 10-K for the year ended December 31, 2006 (File No. 001-33280) filed with the SEC on March 16, 2007) | |
| 23.1 | Consent of Ernst & Young LLP, Independent Registered Public Accounting Firm | |
| 31.1 | Certificate Pursuant to Section 302 of the Sarbanes-Oxley Act of 2002 | |
| 31.2 | Certificate Pursuant to Section 302 of the Sarbanes-Oxley Act of 2002 | |
| 32.1 | Certifications of Chief Executive Officer and Chief Financial Officer Pursuant to Section 906 of the Sarbanes-Oxley Act of 2002 | |
| 101.INS | XBRL Instance Document | |
| 101.SCH | XBRL Taxonomy Extension Schema | |
| 101.CAL | XBRL Taxonomy Extension Calculation Linkbase | |
| 101.DEF | XBRL Taxonomy Definition Linkbase | |
| 101.LAB | XBRL Taxonomy Extension Label Linkbase | |
| 101.PRE | XBRL Taxonomy Extension Presentation Linkbase | |
89