Attached files
| file | filename |
|---|---|
| EX-32.1 - EX-32.1 - ExlService Holdings, Inc. | d845158dex321.htm |
| EX-31.1 - EX-31.1 - ExlService Holdings, Inc. | d845158dex311.htm |
| EX-32.2 - EX-32.2 - ExlService Holdings, Inc. | d845158dex322.htm |
| EX-21.1 - EX-21.1 - ExlService Holdings, Inc. | d845158dex211.htm |
| EX-31.2 - EX-31.2 - ExlService Holdings, Inc. | d845158dex312.htm |
| EX-23.1 - EX-23.1 - ExlService Holdings, Inc. | d845158dex231.htm |
| EX-10.39 - EX-10.39 - ExlService Holdings, Inc. | d845158dex1039.htm |
| EX-10.40 - EX-10.40 - ExlService Holdings, Inc. | d845158dex1040.htm |
| EXCEL - IDEA: XBRL DOCUMENT - ExlService Holdings, Inc. | Financial_Report.xls |
Table of Contents
UNITED STATES
SECURITIES AND EXCHANGE COMMISSION
WASHINGTON, D.C. 20549
FORM 10-K
(Mark One)
| x | ANNUAL REPORT PURSUANT TO SECTION 13 OR 15(d) OF THE SECURITIES EXCHANGE ACT OF 1934 |
FOR THE FISCAL YEAR ENDED DECEMBER 31, 2014
OR
| ¨ | TRANSITION REPORT PURSUANT TO SECTION 13 OR 15(d) OF THE SECURITIES EXCHANGE ACT OF 1934 |
FOR THE TRANSITION PERIOD FROM TO
COMMISSION FILE NUMBER 001-33089
EXLSERVICE HOLDINGS, INC.
(Exact name of registrant as specified in its charter)
| DELAWARE | 82-0572194 | |
| (State or other jurisdiction of incorporation or organization) |
(I.R.S. Employer Identification No.) | |
| 280 PARK AVENUE, 38 TH FLOOR, NEW YORK, NEW YORK |
10017 | |
| (Address of principal executive offices) | (Zip code) | |
(212) 277-7100
(Registrant’s telephone number, including area code)
Securities registered pursuant to Section 12(b) of the Act:
| Title of Each Class: |
Name of Each Exchange on Which Registered: | |
| Common Stock, par value $0.001 per share | NASDAQ Global Select Market |
Securities registered pursuant to Section 12(g) of the Act:
None
Indicate by check mark if the registrant is a well-known seasoned issuer, as defined in Rule 405 of the Securities Act. Yes ¨ No x
Indicate by check mark if the registrant is not required to file reports pursuant to Section 13 or Section 15(d) of the Act. Yes ¨ No x
Indicate by check mark whether the registrant (1) has filed all reports required to be filed by Section 13 or 15(d) of the Securities Exchange Act of 1934 during the preceding 12 months (or for such shorter period that the registrant was required to file such reports), and (2) has been subject to such filing requirements for the past 90 days. Yes x No ¨
Indicate by check mark whether the registrant has submitted electronically and posted on its corporate Web site, if any, every Interactive Data File required to be submitted and posted pursuant to Rule 405 of Regulation S-T (§232.405 of this chapter) during the preceding 12 months (or for such shorter period that the registrant was required to submit and post such files). Yes x No ¨
Indicate by check mark if disclosure of delinquent filers pursuant to Item 405 of Regulation S-K (§229.405) is not contained herein, and will not be contained, to the best of registrant’s knowledge, in definitive proxy or information statements incorporated by reference in Part III of this Form 10-K or any amendment to this Form 10-K. x
Indicate by check mark whether the registrant is a large accelerated filer, an accelerated filer, a non-accelerated filer, or a smaller reporting company. See the definitions of “large accelerated filer,” “accelerated filer” and “smaller reporting company” in Rule 12b-2 of the Exchange Act. (Check one):
| Large accelerated filer | x | Accelerated filer | ¨ | |||
| Non-accelerated filer | ¨ (Do not check if a smaller reporting company) | Smaller reporting company | ¨ | |||
Indicate by check mark whether the registrant is a shell company (as defined in Rule 12b-2 of the Exchange Act). Yes ¨ No x
As of June 30, 2014, the aggregate market value of common stock held by non-affiliates was approximately $915,216,325.
As of February 23, 2015, there were 33,185,239 shares of the registrant’s common stock outstanding (excluding 1,310,751 shares held in treasury), par value $0.001 per share.
DOCUMENTS INCORPORATED BY REFERENCE
Part III incorporates information from certain portions of the registrant’s definitive proxy statement to be filed with the Securities and Exchange Commission within 120 days after the fiscal year end of December 31, 2014.
Table of Contents
Table of Contents
| ITEM 1. | Business |
ExlService Holdings, Inc. (“EXL” or “we” or “us), incorporated in Delaware in 2002 is a leading provider of business process solutions. Working as a strategic partner, we help our clients simplify and streamline business operations, manage compliance, create new channels for growth, and better adapt to change. Our solutions integrate operations management with analytics and business transformation to deliver actionable business insights and long-term business impact. We help shape our clients’ operating environments through process and technology interventions with the goal of increasing quality and productivity while improving risk management and control.
Our business is divided into two reporting segments: Operations Management (previously Outsourcing Services) and Analytics and Business Transformation (previously Transformation Services). We changed our reporting segment nomenclature for 2014 in order to better describe the nature of our engagements with our clients. The business composition of each reporting segment remains unchanged, and as such, there is no required restatement or reclassification.
Our Operations Management and Analytics and Business Transformation solutions include:
1
Table of Contents
Operations Management
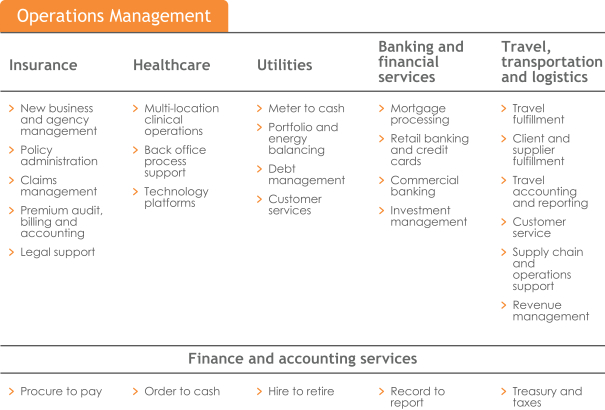
Our Operations Management solutions typically involve the transfer to EXL of select business operations of a client such as claims processing, clinical operations, or financial transaction processing, after which we administer and manage those operations for our client on an ongoing basis. We use a focused industry vertical approach to provide a suite of integrated solutions to organizations in the insurance, healthcare, banking and financial services, utilities, travel, transportation and logistics industries in addition to providing finance and accounting solutions across multiple industries. Our Operations Management solutions represented 78% of EXL’s revenues in 2014.
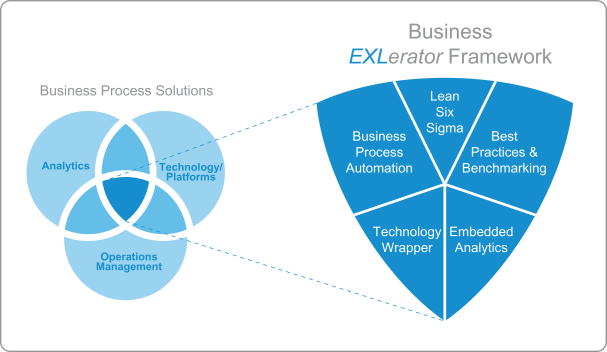
The key differentiators and salient features of our Operations Management solutions include our proprietary delivery model, the Business EXLerator FrameworkTM, our ability to deploy a Business Process-as-a-Service (“BPaaS”) delivery model, and our industry vertical focused approach to operational service delivery.
2
Table of Contents
The Business EXLerator FrameworkTM is our integrated approach to operations management which enables us to drive better customer outcomes by using advanced automation, workflow management, data visualization and embedded analytics. Inbuilt analytics provides superior decision-making and prioritization to facilitate input optimization and better business outcomes. The Business EXLerator FrameworkTM correlates data from multiple sources to create actionable insights for front-line operations and customer service executives and makes use of embedded technology tools, applications and platforms in our clients’ operations. We develop and adopt industry-specific best practices and operational benchmarks to allow us to measure and compare our operation management services to these benchmarks.
While the majority of our Operations Management services are provided to clients using client owned or licensed technology platforms, we increasingly deliver our solutions using a BPaaS delivery model. The BPaaS delivery model includes the provision of a technology platform along with process management services. The service offering is typically priced based on the number of transactions or usage by the client. These solutions may use standardized and shared technology and operational delivery infrastructure enabling us to leverage technology and infrastructure investments across multiple clients.
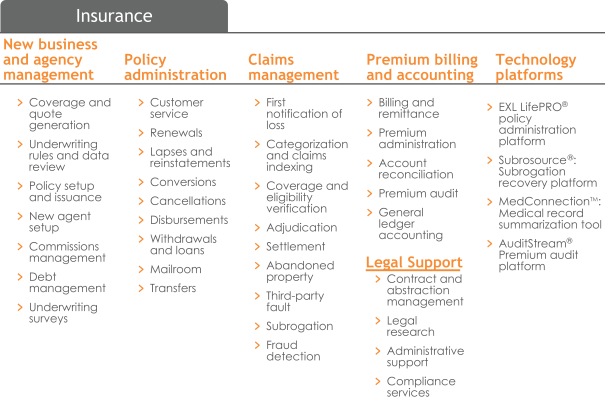
Insurance: We are a leader in servicing the insurance industry and currently serve property and casualty (“P&C”) insurance, life insurance, disability insurance, annuity and retirement services companies. In 2014, the research firm Everest Group ranked EXL as a “Leader” in the U.S. insurance business process outsourcing (“BPO”) market. We have expertise in the areas of claims processing, subrogation, premium and benefit administration, agency management, account reconciliation, policy research, underwriting support, new business processing, policy servicing, premium audit, surveys, billing and collection and customer service.
We have intensified our use of proprietary technology tools and platforms to provide increasingly complex services to the insurance industry. We have invested in creating BPaaS solutions for the insurance industry through several of the acquisitions we have made and by building in-house technology platforms.
For example, in 2014, we acquired Overland Holdings, Inc. (“Overland”) which provides premium audit and underwriting surveys for more than 300 P&C insurers using a BPaaS delivery model. Overland strengthens EXL’s onshore delivery capabilities with approximately 750 U.S.-based employees, multiple regional offices and
3
Table of Contents
a nationwide network of auditors and surveyors. Overland offers services including physical audit, telephone audit, and government inspection and has developed an automated premium audit solution Auditstream®. Overland also offers survey products and services to homeowners and commercial insurance carriers through Castle High Value Surveys®.
We provide subrogation solutions to property and casualty insurers using a BPaaS delivery model and our Subrosource® software platform, the largest commercial end-to-end subrogation platform. Subrosource® integrates with client systems, manages recovery workflow, increases recoveries and reduces costs.
We provide medical record information analysis using a BPaaS delivery model and our MedConnectionTM software platform. MedConnectionTM allows disability insurance and property and casualty insurance companies to empower adjusters, attorneys and medical staff to perform fewer non-core activities to allow them to focus on case closure and cost reduction in file management.
We provide insurance policy administration solutions using a BPaaS delivery model through our LifePRO® platform in order to help clients administer life insurance, health insurance, annuities and credit life and disability insurance policies. More than 40 life and annuities insurers manage policies on EXL’s LifePRO® platform and several administer more than a million contracts on a single database.
Our Insurance solutions include:
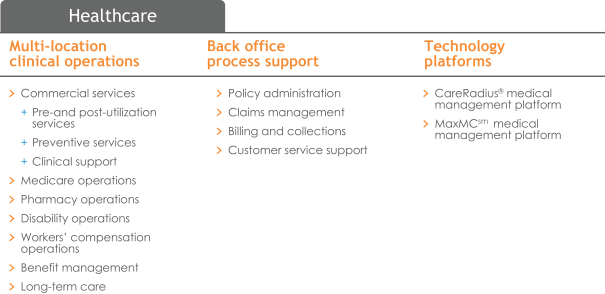
Healthcare: We offer a suite of operations management solutions for the rapidly changing healthcare industry, primarily serving U.S.-based health insurers (payers). Our integrated service offering comprises clinical operations management, healthcare analytics, a care management platform and process management consulting services. Our solutions address the market need for improved healthcare outcomes and reduced costs. To support our client’s organizational objectives, we have over 1,000 global clinical professionals and nearly 400 professionals in our analytics group focused on healthcare.
4
Table of Contents
We provide clinical care management services for our clients’ commercial, Medicare and disability products and programs. We deliver back-office support, such as member enrollment, claims adjudication and finalization, and billing and collections management. Accreditation and training are critical components of our service. Our delivery facility in Manila, Philippines is URAC accredited (Utilization Review Accreditation Commission), and we run an internal Healthcare Academy to assure our clinicians stay up to date on product delivery, health care matters and clinical skill sets’ training. We also employ a Chief Medical Officer and Chief Actuarial Officer in order to further our understanding of the key issues confronting our healthcare clients.
We offer BPaaS solutions designed to serve the healthcare industry as well as proprietary technology platforms. EXL’s CareRadius® application and MaxMCsm applications connect payers, providers and members with critical clinical information, and automates a payer’s operations to increase efficiencies across all aspects of care management. Currently, our CareRadius® application and MaxMCsm applications administer over 49 million lives.
Our Healthcare solutions include:
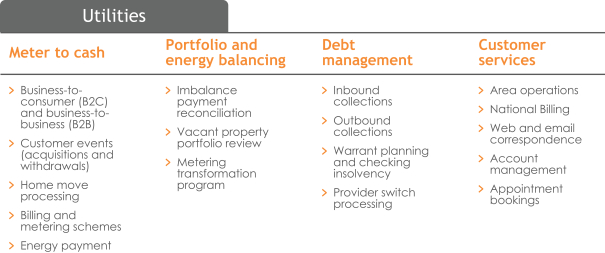
Utilities: We provide utility and energy companies with operational support across the customer life cycle including account setup, home and business moves, billing, meter exchange and recoveries. Our utilities solutions are designed to reduce costs, shorten turnaround times, improve compliance and enhance customer experience. We have supported multiple SAP implementations by designing, testing, piloting and stabilizing these new platforms. In 2014, EXL’s Utilities practice received the Innovation Award from the international consultancy Alsbridge, Inc., for EXL’s use of analytics and automation to improve receivables management processes for a leading energy supplier in the UK.
5
Table of Contents
Our Utilities solutions include:
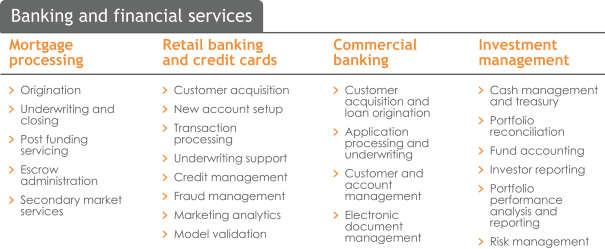
Banking and Financial Services:
We have diverse experience in servicing and processing banking operations for a wide variety of financial services products, including residential mortgage lending, retail banking and credit cards, commercial banking and investment management. EXL has assisted global banking institutions with improving their operations by enabling clients to identify regulatory and compliance gaps, develop remediation plans and solutions, and track ongoing performance. EXL uses proprietary business intelligence tools to provide workflow management, transaction monitoring, and management information and reporting to enhance transparency in regulatory and management reporting.
Our Banking and Financial Services solutions include:
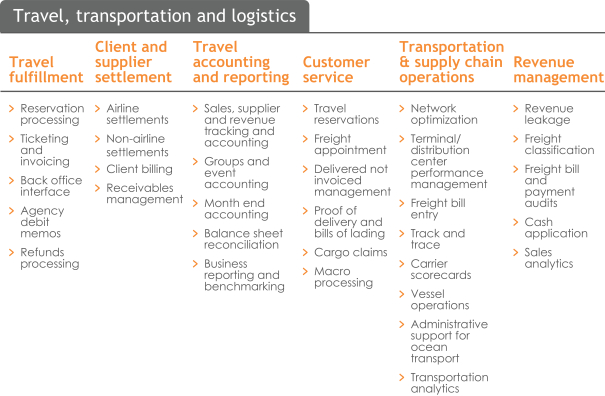
Travel, Transportation and Logistics: We have expertise in managing and improving operational, financial and analytical functions for clients in the travel, transportation and logistics industries. We provide front-, middle- and back-office services to companies in the corporate and leisure travel management industry. In addition, we have expertise in processing transportation and logistics transactions, including supply chain management, warehousing, transportation management and international logistics services. We also provide highly complex operational and analytical services to airlines, trucking and shipping companies, ocean carriers and logistics providers.
6
Table of Contents
Our Travel, Transportation and Logistics solutions include:
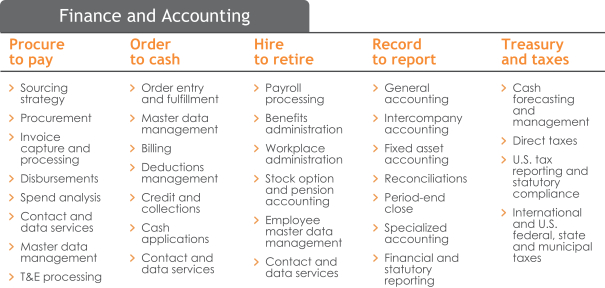
Finance and Accounting: We provide operations management solutions to finance organizations through our finance and accounting (“F&A”) center of excellence. Our F&A operations management solutions are provided to clients across a broad spectrum of industries. We provide integrated end-to-end F&A services across an array of F&A processes including procure to pay, order to cash, hire to retire, record to report and treasury and tax processes. To facilitate transformational F&A engagements with our clients, we provide consulting services, as well as utilize a number of technology applications which are proprietary to EXL or available through strategic partnerships we have established with third parties.
7
Table of Contents
Our Finance and Accounting solutions include:
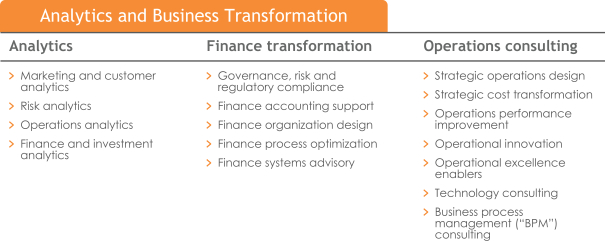
Analytics and Business Transformation
Our Analytics and Business Transformation services include our Analytics, Operations Consulting, and Finance Transformation services. These services focus on improving our clients’ operating environments, through cost reduction, improved operational effectiveness and additional insight into business performance, such as business forecasting, enhanced efficiency and productivity, improved effectiveness of business decisions and creation of an improved risk and control environment. We actively integrate our Analytics and Business Transformation solutions with Operations Management as part of a comprehensive solution for our clients. Our Analytics and Business Transformation team comprises over 1,800 professionals. Analytics and Business Transformation represented 22% of EXL’s revenues in 2014.
Analytics
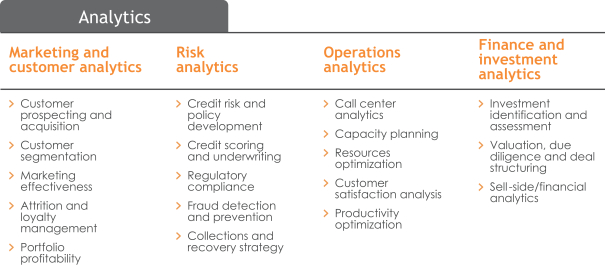
Our Analytics solutions involve accessing and analyzing large volumes of data from multiple data sources to generate insights about past business performance or predict future business outcomes. In order to provide services, we employ a large pool of analytics professionals and data scientists who utilize analytics tools and methodologies in ways designed to help clients better understand their data to generate actionable business insights. These insights generated by our analytics tools, statistical models and data scientists assist clients in making quicker, more accurate and data-driven business decisions. Our Analytics work spans both project work and longer-term annuity services where EXL provides ongoing analytics modeling and services for a year or more.
8
Table of Contents
Our Analytics solutions facilitate the development of a holistic strategy by our clients around the use of structured, semi-structured and unstructured data available both internally to our client’s organization and externally in the public domain. In order to use data more effectively, we provide solutions enabling data visualization and management reporting which a business user can segment, drill-down, and filter in order to derive business insights. Our team assists clients with building predictive models using statistical techniques, that improve our clients’ marketing effectiveness, risk management, collections strategy and fraud detection capabilities. In order to build predictive models that are most effective for our clients, we utilize domain and industry knowledge related to the business problem being considered to validate the drivers of the underlying problem or outcome and provide corresponding solutions or insights. We have established large analytics delivery centers in order to provide dedicated management reporting, advanced analytics, predictive modeling and data management services for our clients. Our Analytics solutions include:
Business Transformation
Our Business Transformation Services, which include Operations Consulting and Finance Transformation, provide industry-specific expertise that helps our clients deliver continuous process innovation, design optimal operating models that deal with rapidly changing market environments, and manage change in the regulatory and compliance landscape. Our services also identify business processes that can be improved by documenting processes, creating standard operating procedures, defining metrics and evaluation criteria as well as generating customized dashboards and reporting using our proprietary methodologies. These services provide insights and help shape our clients’ future financial and operational goals.
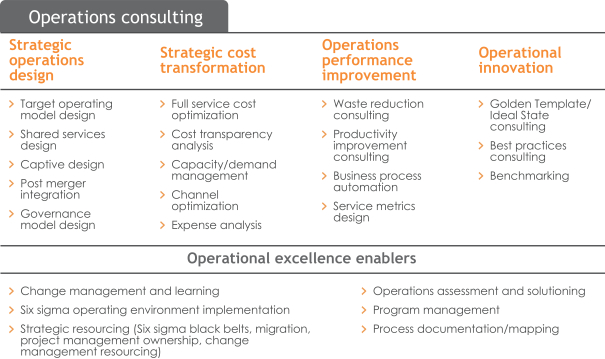
Operations Consulting
Our Operations Consulting practice provides a range of consulting services including operating model design, implementation services and change management. Utilizing Lean and Six Sigma methodologies, we advise our clients on enhancing operational effectiveness, driving cost reduction initiatives and operations innovation and subsequently managing the implementation of our recommendations. In-line with our strategy of embedding process automation and analytics into our solutions, EXL acquired Blue Slate Solutions, LLC (“Blue Slate”) in 2014. Blue Slate is a business process management (“BPM”) and technology solutions consulting company. With professionals located throughout the U.S, Blue Slate specializes in transforming operations through business process automation, use of innovative technologies, data integration and analytics.
9
Table of Contents
Our Operations Consulting solutions include:
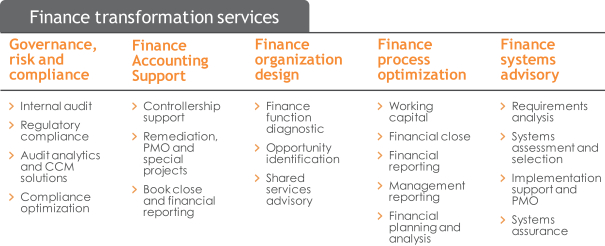
Finance Transformation
Our finance transformation services include governance, risk and compliance, finance accounting support, finance organizational design, finance process optimization, and finance systems advisory. Our Finance Transformation business specializes in serving the finance and accounting function across a range of industries. Many of our professionals who provide these services are certified accountants, internal auditors and process and technology experts.
10
Table of Contents
Our Finance Transformation solutions include:
Geographic and Segment Information
Please see the disclosures in Notes 4 and 15 to our consolidated financial statements for segment and geographic information regarding our business.
Business Strategy
Our goal is to be a leading provider of Operations Management and Analytics and Business Transformation solutions in the industry sectors on which we are focused. Specific elements of our strategy include:
Deploying our Business EXLerator FrameworkTM in Client Engagements
In servicing our clients, we continue to differentiate ourselves by using our proprietary Business EXLerator FrameworkTM. Business EXLerator FrameworkTM is our proprietary delivery model that incorporates benchmarking, business process automation, Lean Six Sigma methodologies, analytics and technology designed to provide superior value to our clients. We build models and templates that help clients achieve a quantifiable return on their engagements with us and build a roadmap for pursuing ongoing improvements. Where we have successfully deployed the Business EXLerator FrameworkTM, we have experienced significant increases in the efficiency, accuracy and effectiveness of client operations while simultaneously mitigating risk, creating value and generating business impact.
Developing Business Process as a Service (“BPaaS”) Solutions
We intend to increase our investment and focus in developing BPaaS and technology-enabled product solutions. We anticipate evolving part of our servicing model in niche operations management services, from our current model to a BPaaS servicing model that offers an integrated technology platform with operations management services. BPaaS services are typically delivered using a transaction-based or outcome-based pricing model and can minimize a client’s initial capital investment on technology. We intend to enter into additional partnerships to facilitate our BPaaS solutions. Currently, we partner with leading software and technology companies to enable our BPaaS solutions and the deployment of our Business EXLerator FrameworkTM.
Building Additional Analytics Capabilities and Solution Offerings
We continue to invest in our Analytics capabilities by expanding our solution offerings, enhancing the skill sets and training of our team, and developing reusable intellectual property that can be incorporated into our
11
Table of Contents
analytics solutions. For example, we are developing new analytics service offerings tailored for each of our focus industry domains. We intend to further increase our investment in our proprietary methodology solutions and algorithms that help us improve our ability to predict outcomes for our clients to help them capture data signals in a more efficient manner. In order to optimize the way in which we deliver analytics solutions to clients and source the highest quality global talent, we intend to further expand our multi-shore delivery capabilities by adding to our team of professionals in the United States, United Kingdom, Europe, India, Singapore and the Philippines. In addition to hiring directly from educational institutions, we expect to hire additional experienced senior team members in order to deepen our industry expertise and thought leadership.
Extending Our Industry Expertise
We intend to further extend our knowledge and capabilities in the industry verticals we serve in order to enhance our reputation as a leading provider of business process solutions. By focusing on transitioning and managing more complex and value-enhancing services we can enhance our capability to serve our clients. For example, we have more than a decade of experience in transitioning and servicing approximately 1,200 operations management processes to our operations centers, including approximately 650 processes in the insurance and healthcare industry. In order to market our base of experience externally, we intend to produce additional primary research and opinion pieces in order to develop our reputation as industry thought leaders.
Recruiting, Training, and Retaining the Most Talented Professionals
We continue to invest in human resources and further refine and supplement the innovative methods we use to recruit, train and retain our skilled employees. We intend to focus on recruiting highly qualified employees and developing our employees’ leadership skills through specialized programs including our learning academies, rigorous promotion standards, industry-specific training and competitive compensation packages that include incentive-based compensation. We supplement our scope of operations experience with several industry-specific training academies to enhance the domain expertise of our employees.
Cultivating Long-term Relationships and Expanding our Client Base
We continue to maintain our focus on cultivating long-term client relationships as well as attracting new clients. We believe there are significant opportunities for additional growth within our existing clients, and we seek to expand these relationships by increasing the depth and breadth of the services we provide. We intend to seek industry-leading clients, targeting Global 2000 companies that have the most complex and diverse processes and, accordingly, stand to benefit significantly from our services. We also intend to initiate long-term relationships with medium-sized companies in our focus industries particularly with our BPaaS offerings.
Expanding our Global Delivery Footprint and Operational Infrastructure
We intend to further expand and invest in our network of delivery centers to service our clients. In 2014, we opened new operations centers in Mumbai, India, Alabang and Cebu, Philippines, and Dallas, Texas. In 2014, the acquisition of Overland added multiple North American regional offices to our delivery network, significantly expanding our U.S.-based services. We anticipate developing a delivery center in Colombia in order to provide Spanish language delivery services to our clients.
Pursuing Strategic Relationships and Acquisitions
We intend to continue making selective acquisitions in our focus industry verticals as well as to add to our capabilities. We intend to selectively consider strategic relationships with industry leaders that add new long-term client relationships, enhance the depth and breadth of our services and complement our business strategy. We also intend to selectively consider partnerships, alliances or investments that will expand the scope and effectiveness of our services by adding proprietary technology assets and intellectual property, adding new clients or allowing us to enter new geographic markets.
12
Table of Contents
Our Industry
Business Process Management (“BPM”) service providers work with clients to transfer their key business processes to reduce costs, improve process quality, handle increased transaction volumes and reduce redundancy. BPM providers can enable organizations to enhance profitability and increase efficiency and reliability, permitting them to concentrate on their core areas of competence. BPM is a long-term strategic commitment for a company that, once implemented, is generally not subject to cyclical spending or information technology budget fluctuations. Increased global demand, cost improvements in international communications and the automation of many business services have created a significant opportunity for BPM providers with offshore delivery capabilities, and many companies are moving select office processes to providers with the capacity to perform these functions from overseas locations. We believe the demand for BPM services will be primarily led by industries that are transaction-driven and that require significant customer interactions. The high cost of servicing a large number of small customer accounts makes BPM a compelling strategic alternative for such industries.
According to India’s National Association of Software and Service Companies (“NASSCOM”), an industry trade organization, exports from India in the information technology and BPM industry are expected to grow between 12% and 14% year-over-year in the fiscal year ending March 31, 2016, to between $112 billion and $114 billion. According to International Data Corporation, (“IDC”), an industry market intelligence advisory firm, BPM should grow at over 14% from 2015-2018.
Companies are increasingly looking to BPM service providers to provide a suite of analytics services including statistical tools, models and techniques to clean, organize and examine structured and unstructured corporate data. This data is then used by companies to generate specific business-related analysis and insights into their business and prospects. The enhanced generation of business data across multiple formats, substantial reduction in data storage costs, growing enterprise demand for data-driven and real-time decision making and availability of sophisticated analytics tools have enabled companies to overcome a local shortage of specialized analytics talent and benefit from global labor markets. BPM service providers who can develop industry-specific analytics expertise are especially well poised to benefit from this global trend.
We believe the demand for Analytics solutions in many of our key verticals including banking and financial services, insurance and healthcare is growing strongly and will continue to do so for the next several years. According to NASSCOM, Analytics services outsourcing growth is expected to be 14.3% from a $42 billion market in 2012 to $71 billion in 2016. India has emerged as a leading delivery location for analytics, driven by a large quantitatively-trained workforce and attractive cost efficiencies, as compared to other locations.
Sales and Marketing and Client Management
We market our services to our existing and prospective clients through our sales and client management teams, which are aligned by industry verticals and cross-industry domains such as finance and accounting. Our sales and client management teams operate from the U.S. and Europe and are supported by our business development team.
Our sales, marketing and business development teams are responsible for new client acquisitions, public relations, relations with outsourcing advisory companies, analyst relations and rankings, lead generation, knowledge management, content development, campaign management, digital/Web presence, brand awareness and participation in industry forums and conferences. As of December 31, 2014, we employed over 100 sales, marketing, business development and client management professionals with the majority of them based in either the U.S. or Europe. Each professional has significant experience in business process solutions, technology, operations, analytics and business transformation. The sales cycle varies depending on the type of service, generally ranging from six months to eighteen months for our Operations Management solutions and shorter time frames for our Analytics and Business Transformation services.
13
Table of Contents
Clients
EXL generated revenues from over 600 clients (including clients acquired as part of the Overland and Blue Slate acquisitions) and 280 clients in 2014 and 2013, respectively.
Our top three, five and ten clients generated 22%, 32% and 50% of our revenues respectively in 2014. Our top three, five and ten clients generated 25%, 37% and 58% of our revenues respectively in 2013. While we have reduced our revenue concentration with our top clients and are developing relationships with new clients to diversify our client base, we believe that the loss of any of our ten largest clients could have a material adverse effect on our financial performance. See “Item 1A. Risk Factors—Risks Related to Our Business—we have a limited number of clients and provide services to a few industries.”
Our long-term relationships with our clients typically evolve from providing a single, discrete solution or process into providing a series of complex, integrated processes across multiple business lines. For Operations Management services, we enter into long-term agreements with our clients with typical initial terms of between three and eight years. Agreements for Analytics and Business Transformation services generally have shorter initial terms, which are typically between one to three years for Analytics engagements and shorter-term fixed price engagements for consulting engagements. Each agreement is individually negotiated with the client.
Competition
Competition in the BPM services industry is intense and growing. See “Item 1A. Risk Factors—Risks Related to Our Business—We face significant competition from U.S.-based and non-U.S.-based BPM and information technology (“IT”) companies and from our clients, who may build shared services centers to perform these services themselves, either in-house, in the U.S. or through offshore groups or other arrangements.” Many companies, including certain of our clients, choose to perform some or all of their customer service, collections and back-office processes internally. Their employees provide these services as part of their regular business operations. Some companies have moved portions of their in-house customer management functions offshore, including to offshore affiliates. We believe our key advantage over in-house business processes is that we give companies the opportunity to focus on their core products and services while we focus on service delivery and operational excellence. We compete primarily against:
| • | BPM service companies with delivery capability in offshore locations, particularly India, such as Genpact Limited and WNS (Holdings) Limited; |
| • | BPM divisions of large global IT service companies, such as Accenture, Cognizant Technology Solutions, Tata Consultancy Services and Infosys; |
| • | Niche providers that provide services in a specific geographic market, industry or service area such as analytics and healthcare; and |
| • | Leading accounting and management consulting firms. |
We compete against these entities by working to establish ourselves as a service provider with deep industry expertise, strong client relationships, leading industry talent, superior operational and process capabilities, differentiated BPaaS solutions, and sophisticated analytic and business transformation capabilities, which enables us to respond rapidly to market trends and the evolving needs of our clients.
Intellectual Property
Our principal intellectual property consists of trademarks, pending trademark applications, one patent and several filed patent applications, copyrighted software and other materials, trade secrets, proprietary and licensed platforms and the know-how of our management and employees. We have several trademarks and logos registered with the U.S. Patent and Trademark Office and certain foreign jurisdictions. We also consider the availability of patent protection for certain proprietary technology, and have filed certain patent applications.
14
Table of Contents
We consider our business processes and implementation methodologies to be trade secrets or confidential, proprietary information that includes trade secrets that are important to our business. Clients and business partners sign nondisclosure agreements requiring confidential treatment of our information. Our employees are also required to sign intellectual property assignments and confidentiality undertakings as a condition to their employment.
In addition to our own proprietary and licensed software, tools and methodologies, we often use software licensed by our clients and available on their systems and third-party software platforms to provide our services. We customarily enter into licensing and nondisclosure agreements with our clients and third parties with respect to the use of their software systems and platforms. Clients typically obtain consents for us to access and use third-party software licenses held by the client so that we may provide our services.
Our contracts usually specify that EXL will use or develop proprietary tools during a client engagement that will be owned by EXL, or may provide that intellectual property created during an engagement for a client will be considered to be work product that is owned by the client or otherwise assigned to that client.
Information Security and Data Privacy
We have a strong focus on information security, data privacy and the protection of our clients’ and their customers’ confidential information. We have made significant investments to strengthen our information security posture and protocols to ensure compliance with the established confidentiality policies and the laws and regulations governing our activities. These investments involve ensuring we have the appropriate people, processes and technology in place to protect information throughout its life cycle.
We seek to protect our clients’ information and adhere to information security and data privacy standards. In 2014, EXL received an award for excellence in information security by industry association NASSCOM and the Data Security Council of India (“DSCI”). This award recognized EXL as an “industry leader” in the BPM category for our industry-first initiatives in information security.
According to the needs of our clients as well as the regulatory requirements of the geographies in which we operate, most of our delivery centers are certified in regard to quality, information security and employee safety, such as the ISO 9001:2008 standard for quality management system, the ISO 27001:2013 standard for our information security management system and the OHSAS 18001:2007 standard for our occupational health and safety management system. Some of our centers in the Philippines and certain client processes in other operation centers in India are certified as compliant with the Payment Card Industry Data Security Standard 3. We have received an unqualified SSAE 16 (SOC I—Type II) report on general controls for several delivery centers and certain client operations processes.
EXL offers managed hosting environments for our BPaaS solutions in the insurance and healthcare verticals. Clients who adopt our BPaaS solutions on a managed hosted basis are offered a highly reliable, scalable, and secure hosting environment. The technology applications are hosted in ISO 27001certified, SSAE16 SOC1 Compliant Tier 4 data centers that are proactively monitored and managed 24 hours a day to meet the client’s business requirements.
We have a robust wide area network and international telecommunications capacity to support our global business operations. Our infrastructure is built to industry standards, leveraging leading technology providers and partners. Our business continuity management includes plans to mitigate and manage operational risks by building resilience and redundancy in our telecommunications and network infrastructure, applications and IT infrastructure, utilities and power, and trained talent across our service delivery locations.
Operational Excellence, Process Compliance and Migrations
We believe our reputation for operational excellence is widely recognized by our clients and is an important competitive advantage. We use Lean and Six Sigma, which are data-driven methodologies for eliminating defects
15
Table of Contents
in any process, to identify process inefficiencies and improve productivity in client and support processes. We have an independent quality compliance team to monitor, analyze, provide feedback on and report process performance and compliance. In addition, we have a customer experience team to assess and improve end-customer experience for all processes. Currently, we have over 600 quality compliance analysts and customer experience analysts.
For most of our operations processes, we report process performance on B-ProMPTTM, our proprietary web-based application. B-ProMPTTM includes process control capabilities such as digital dashboards for evaluating process management and performance at any level within an organization, including tracking the individual performance of agents, supervisors and other employees. B-ProMPTTM includes advanced analytics capacity to provide Six Sigma-based process analysis, including trend analysis, distribution analysis and correlation analysis and tracking.
We combine in-depth knowledge of our core industry sectors with proven expertise in transitioning our clients’ business operations to our offshore and onshore delivery centers, and administering and managing such operations. We have successfully transferred approximately 1,200 processes covering a broad array of products and services to our operations centers, including approximately 130 new processes that were transitioned by EXL in 2014. We have developed proprietary digitally enabled migration platform that automates EXL’s migration methodology and capability. This proprietary migration platform leverages EXL’s vast experience in managing process migrations with industry-best practices and cutting-edge digital tools. The platform is agile, geography-agnostic, customizable and enhances control and auditability.
Employees
As of December 31, 2014, we had a headcount of approximately 22,800 employees, with approximately 17,200 employees based in India and approximately 3,400 employees in the Philippines. We have approximately 1,600 employees in the U.S, 100 employees in the U.K., and 500 employees in the Czech Republic, Bulgaria and Romania. None of our employees are unionized. We have never experienced any work stoppages and believe that we enjoy good employee relations.
Hiring and Recruiting
Our employees are critical to the success of our business. Accordingly, we focus on recruiting, training and retaining our professionals. We have developed effective strategies that enable an efficient recruitment process. We have approximately 100 employees dedicated to recruitment. Some of the strategies we have adopted to increase efficiency in our hiring practices include the utilization of online voice assessments and a centralized hiring center. Our hiring policies focus on identifying high quality employees who demonstrate a propensity for learning, contribution to client services and growth. Candidates must undergo numerous tests and interviews before we extend offers for employment. We also conduct background checks on candidates, including criminal background checks, where permitted and as required by clients or on a sample basis. In addition, where permitted and required for client services, we perform random drug testing on the workforce on a regular basis. In 2014, we hired approximately 7,700 new employees. We also have an employee referral program that provides us with a cost effective way of accessing qualified potential employees.
We offer our employees competitive compensation packages that include incentive-based compensation and offer a variety of benefits that vary by facility, including free transport to and from home in certain circumstances, subsidized meals and free access to recreational facilities that are located within some of our operations centers. Our attrition rate for employees who had been with EXL for more than 180 days was 32.3% and 25.8% for the year ended December 31, 2014 and 2013, respectively. As competition in our industry increases, our turnover rate could increase. See “Item 1A. Risk Factors—Risks Related to Our Business—We may fail to attract and retain enough sufficiently trained employees to support our operations, as competition for highly skilled personnel is intense and we experience significant employee turnover rates.”
16
Table of Contents
Capability Development and Training
We have a strong focus on the capability development and training of our employees. We have built up a world class global learning platform, which we believe acts as a crucial differentiator for us in the marketplace and amongst our employees. Our learning and development teams partner with business units and corporate functions to create an integrated talent development process focusing on skill development, the needs of our clients and industry certification. Our teams of training consultants seek to teach industry-leading capabilities to our employees help us serve our clients better. We provide customized solutions to different businesses based on geography, industry, domain and processes, in close collaboration with our clients. Our team also conducts mandatory legal and compliance related training globally for all of our employees. In 2014, we delivered approximately 75,000 man days of training which resulted in increased employee engagement, better retention and higher client satisfaction.
Regulation
Because of the diverse and highly complex nature of our service offerings, our operations are subject to a variety of rules, regulations and statutes. Several U.S. and foreign federal and state agencies regulate aspects of our business. In addition, our clients may contractually require that we comply with certain rules and regulations that are applicable to their specific industry. Failure to comply with any applicable laws and regulations could result in restrictions on our ability to provide our products and services, as well as the imposition of civil fines and criminal penalties, which could have a material adverse effect on our operations.
We are one of the few service providers that can provide third-party administrator insurance services from India and the Philippines, having been licensed or exempted from, or not subject to, licensing in 45 states and 16 states, respectively. Additionally, we are licensed or otherwise eligible to provide third-party administrator services in all states within the U.S. Certain of our debt collection, utilization review, workers compensation utilization review and telemarketing services require us to maintain licenses in various jurisdictions or require certain categories of our professionals to be individually licensed. Our facility in Manila, Philippines, is accredited by URAC (Utilization Review Accreditation Commission), a leading healthcare and education accreditation organization. We continue to obtain licenses required by our business operations.
Our operations are also subject to compliance with a variety of other laws, including the U.S. federal and state regulations that apply to certain portions of our business such as the Fair Credit Reporting Act, the Gramm-Leach-Bliley Act, the Health Insurance Portability and Accountability Act of 1996, the Health Information Technology for Economics and Clinical Health Act of 2009(“HITECH”), the Truth in Lending Act, the Fair Credit Billing Act, the Federal Trade Commission Act and Federal Deposit Insurance Corporation rules and regulations. We must also comply with applicable regulations relating to health and other personal information that we process as part of our services. Additionally, our client contracts may specify other regulatory requirements we must meet in connection with the services we provide. We provide our employees with training for applicable laws and regulations.
We benefit from tax relief provided by laws and regulations in India and the Philippines. Regulation of our business by the Indian government affects us in several ways. During the last five years, we either established or acquired new centers that are eligible for tax benefits under the Special Economic Zones Act, 2005 (the “SEZ Act”). The SEZ Act introduced a 15-year tax holiday scheme for operations established in designated special economic zones (“SEZs”). Under the SEZ Act, qualifying operations are eligible for a deduction from taxable income equal to (i) 100% of their export profits derived for the first five years from the commencement of operations; (ii) 50% of such export profits for the next five years; and (iii) 50% of the export profits for a further five years, subject to satisfying certain capital investment requirements. The SEZ Act provides, among other restrictions, that this holiday is not available to operations formed by splitting up or reconstructing existing operations or transferring existing plant and equipment (beyond a prescribed limit) to new SEZ locations. We anticipate establishing additional operations centers in SEZs or other tax advantaged locations in the future. See “Item 1A—Risk Factors—Risks
17
Table of Contents
related to the International nature of our business—Our financial condition could be negatively affected if foreign governments introduces new legislation, reduce or withdraw tax benefits and other incentives currently provided to companies within our industry or if we are not eligible for these benefits.”
We also benefit from a corporate tax holiday in the Philippines for our operations centers established there over the last six years. The company registered with the Philippines Economic Zone Authority (“PEZA”) and is, inter-alia, eligible for income tax exemption for four years. This exemption incentive may be extended in certain instances upon fulfillment of certain conditions. Following the expiry of the tax exemption, income generated from centers in Philippines will be taxed at the prevailing annual tax rate, which is currently 5% on the gross income.
Available Information
We file annual, quarterly and current reports, proxy statements and other information with the Securities and Exchange Commission (the “SEC”) under the Securities Exchange Act of 1934, as amended (the “Exchange Act”). You may read and copy this information at the Public Reference Room of the SEC, Room 1580, 100 F Street, N.E., Washington, D.C. 20549. You may obtain information about the Public Reference Room by calling the SEC at 1-800-SEC-0330. In addition, the SEC maintains a website (http://www.sec.gov) that contains reports, proxy and information statements, and other information regarding issuers that file electronically through the EDGAR System.
We also maintain a website at http://www.exlservice.com. Information on our website does not constitute a part of, nor is it incorporated in any way, into this Form 10-K. We make available, free of charge, on our website our annual reports on Form 10-K, quarterly reports on Form 10-Q, proxy statements, current reports on Form 8-K and amendments to those reports filed or furnished pursuant to Section 13(a) or 15(d) of the Exchange Act, as soon as reasonably practicable after such reports are electronically filed with, or furnished to, the SEC.
18
Table of Contents
| ITEM 1A. | Risk Factors |
Risks Related to Our Business
We have a limited number of clients and provide services to a few industries.
We have derived and believe that we will continue to derive a substantial portion of our total revenues from a limited number of large clients. In 2014, our ten largest clients accounted for approximately 50% of our total revenues. We expect that a significant portion of our total revenues will continue to be contributed by a limited number of large clients in the near future. The loss of or financial difficulties at any of our large clients could have a material adverse effect on our business, results of operations, financial condition and cash flows. Moreover, the loss of a major customer could also impact our reputation in the market, making it more difficult to attract and retain customers more generally.
On November 1, 2013, we received a notice of termination from the Travelers Indemnity Company (“Travelers”) under a Professional Services Agreement, dated as of March 7, 2006, between us and Travelers (as amended from time to time, the “Services Agreement”). Travelers represented a significant amount of our total revenues for the year ended December 31, 2013. There was a reduction in 2014 revenues due to certain services being transitioned away from us throughout 2014 and due to our reimbursement to Travelers for certain of their expenses incurred in connection with the termination (the “disentanglement costs”). If the disentanglement between us and Travelers is not completed in a manner that is satisfactory to both parties, it could further increase our expenses and revenue loss due to the termination, thereby negatively impacting our business, results of operations, financial condition and cash flows.
Our results of operations could be adversely affected by economic and political conditions and the effects of these conditions on our clients’ businesses and levels of business activity.
Global economic and political conditions affect our clients’ businesses and the markets they serve. The domestic and international capital and credit markets have been experiencing volatility and disruption for the past several years, resulting in uncertainty in the financial markets in general, which includes companies in the banking, financial services and insurance industries to which we provide services. Although there has been recent improvement in general economic conditions in these industries, there can be no assurance that the economic environment will continue to improve. Our business largely depends on continued demand for our services from clients and potential clients in these industries. Adverse developments in these industries or any other select industries to which we provide services could further unfavorably affect our business. In particular, we currently derive, and are likely to continue to derive, a significant portion of our revenues from clients located in the U.S. Any future decreases in the general level of economic activity, such as decreases in business and consumer spending, could result in a decrease in demand for our services, particularly our analytics and business transformation services, thus reducing our revenues. Continued high unemployment rates in the U.S. could also adversely affect the demand for our services. Other developments in response to economic events, such as consolidations, restructurings or reorganizations, particularly involving our clients, could also cause the demand for our services to decline.
Any future disruptions in the commercial credit markets may impact liquidity in the global credit market as greatly, or even more, than in recent years, and we may not be able to predict the impact such worsening conditions will have on our targeted industries in general, and our results of operations specifically. Future turbulence in global markets and economies may adversely affect our liquidity and financial condition, and the liquidity and financial condition of our clients. Market disruptions may limit our ability to access financing or increase our cost of financing to meet liquidity needs, and affect the ability of our customers to use credit to purchase our services or to make timely payments to us, resulting in adverse effects on our financial condition and results of operations. Changes in global economic conditions could also shift demand to services for which we do not have competitive advantages, and this could negatively affect the amount of business that we are able to obtain.
19
Table of Contents
Our client contracts contain certain termination and other provisions that could have an adverse effect on our business, results of operations and financial condition.
Most of our client contracts may be terminated by our clients without cause and do not commit our clients to provide us with a specific volume of business. Any failure to meet a client’s expectations could result in a cancellation or non-renewal of a contract or a decrease in business provided to us. We may not be able to replace any client that elects to terminate or not renew its contract with us, which would reduce our revenues. The loss of or financial difficulties at any of our large clients would have a material adverse effect on our business, results of operations, financial condition and cash flows.
A number of our contracts allow the client, in certain limited circumstances, to request a benchmark study comparing our pricing and performance with that of an agreed list of other service providers for comparable services. Based on the results of the study and depending on the reasons for any unfavorable variance, we may be required to make improvements in the services we provide or reduce the pricing for services on a prospective basis to be performed under the remaining term of the contract or our client could elect to terminate the contract, which could have an adverse effect on our business, results of operations and financial condition. Many of our contracts contain provisions that would require us to pay penalties to our clients and/or provide our clients with the right to terminate the contract if we do not meet pre-agreed service level requirements or if we do not provide certain productivity benefits. Failure to meet these requirements or accurately estimate the productivity benefits could result in the payment of significant penalties by us to our clients which in turn could have a material adverse effect on our business, results of operations and financial condition. Some of our contracts with clients specify that if a change of control of our company occurs during the term of the contract, the client has the right to terminate the contract. These provisions may result in our contracts being terminated if there is such a change in control, resulting in a potential loss of revenues. In addition, these provisions may act as a deterrent to any attempt by a third party to acquire our company.
We may fail to attract and retain enough sufficiently trained employees to support our operations, as competition for highly skilled personnel is intense and we experience significant employee turnover rates.
Our industry is labor intensive and our success depends to a significant extent on our ability to attract, hire, train and retain qualified employees, including our ability to attract employees with needed skills in the geographic areas in which we operate. The industry, including us, experiences high employee turnover. Our turnover rate for employees with EXL for more than 180 days was 32.3% and 25.8% for the year ended December 31, 2014 and 2013, respectively. There is significant competition for professionals with skills necessary to perform the services we offer to our clients. Increased competition for these professionals could have an adverse effect on us. A significant increase in the turnover rate among our employees, particularly among our higher skilled workforce, would increase our recruiting and training costs and decrease our operating efficiency, productivity and profit margins, and could lead to a decline in demand for our services. High turnover rates generally do not impact our revenues as we factor the attrition rate into our pricing models by maintaining additional employees for each process. However, high turnover rates do increase our cost of revenues and therefore impact our profit margins due to higher recruitment, training and retention costs. High employee turnover increases training, recruitment and retention costs because we must maintain larger hiring, training and human resources departments and it also increases our operating costs due to having to reallocate certain business processes among our operations centers where we have access to the skilled workforce needed for our business. These additional costs could have a material adverse effect on our results of operations and cash flows.
In addition, our ability to maintain and renew existing engagements and obtain new business will depend, in large part, on our ability to attract, train and retain personnel with skills that keep pace with the demand for outsourcing, evolving industry standards and changing client preferences. A lack of sufficiently qualified personnel could also inhibit our ability to establish operations in new markets and our efforts to expand geographically. Our failure to attract, train and retain personnel with the qualifications necessary to fulfill the needs of our existing and future clients or to assimilate new employees successfully could have a material adverse effect on our business, results of operations, financial condition and cash flows.
20
Table of Contents
We have a long selling cycle for our operations management services that requires significant funds and management resources and a long implementation cycle that requires significant resource commitments.
We have a long selling cycle for our operations management services, which requires significant investment of capital, resources and time by both our clients and us. Before committing to use our services, potential clients require us to expend substantial time and resources educating them as to the value of our services, including testing our services for a limited period of time, and assessing the feasibility of integrating our systems and processes with theirs. Our clients then evaluate our services before deciding whether to use them. Therefore, our selling cycle, which generally ranges from six to eighteen months, is subject to many risks and delays over which we have little or no control, including our clients’ decision to choose alternatives to our services (such as other providers or in-house offshore resources) and the timing of our clients’ budget cycles and approval processes. In addition, we may not be able to successfully conclude a contract after the selling cycle is complete.
Implementing our services involves a significant commitment of resources over an extended period of time from both our clients and us. Our clients may also experience delays in obtaining internal approvals or delays associated with technology or system implementations, thereby delaying further the implementation process. Our clients and future clients may not be willing or able to invest the time and resources necessary to implement our services, and we may fail to close sales with potential clients to which we have devoted significant time and resources. These factors could have a material adverse effect on our business, results of operations, financial condition and cash flows.
Once we are engaged by a client, it may take us several months before we start to recognize significant revenues.
When we are engaged by a client after the selling process for our operations management services, it takes from four to six weeks to integrate the client’s systems with ours, and up to three months thereafter to build up our services to the client’s requirements and perform any necessary transformative initiatives. Depending on the complexity of the processes being implemented, these time periods may be significantly longer. Implementing processes can be subject to potential delays similar to certain of those affecting the selling cycle. Therefore, we do not recognize significant revenues until after we have completed the implementation phase.
We typically enter into long-term contracts with our clients, and our failure to accurately estimate the resources and time required for our contracts may negatively affect our profitability.
The initial terms of our operations management contracts typically range from three to five years. In many of our operations management contracts we commit to long-term pricing with our clients and therefore bear the risk of cost overruns, completion delays, wage inflation and adverse movements in exchange rates in connection with these contracts. If we fail to estimate accurately the resources and time required for a contract, future wage inflation rates or currency exchange rates (or fail to accurately hedge our currency exchange rate exposure) or if we fail to complete our contractual obligations within the contracted timeframe, our revenues and profitability may be negatively affected.
Consistency in our revenues from period to period depends in part on our ability to reflect the changing demands and needs of our existing and potential clients. If we are unable to adjust our pricing terms or the mix of products and services we provide to meet the changing demands of our clients and potential clients, our business, results of operations and financial condition may be adversely affected.
A significant portion of our contracts use a pricing model that provides for hourly or annual billing rates. Industry pricing models are evolving, however, and we anticipate that clients may increasingly request transaction-based, outcome-based or other pricing models. If we are unable to obtain operating efficiencies or if we make inaccurate assumptions for contacts with transaction-based pricing, our profitability may be negatively affected. If we are unable to adapt our operations to evolving pricing protocols, our results of operations may be adversely affected or we may not be able to offer pricing that is attractive relative to our competitors.
21
Table of Contents
In addition, the services we provide to our clients and the revenues and income from those services may decline or vary as the type and quantity of services we provide under those contracts changes over time, including as a result of a shift in the mix of products and services we provide. Furthermore, our clients, some of which have experienced significant and adverse changes in their prospects, substantial price competition and pressures on their profitability, have in the past and may in the future demand price reductions, automate some or all of their processes or change their operations management strategy by moving more work in-house or to other providers, any of which could reduce our profitability. Any significant reduction in or the elimination of the use of the services we provide to any of our clients, or any requirement to lower our prices, would harm our business.
Our profitability will suffer if we are not able to appropriately price our services or manage our asset utilization levels.
Our profitability is largely a function of the efficiency with which we utilize our assets, in particular our people and our operations centers, and the pricing that we are able to obtain for our services. Our asset utilization levels are affected by a number of factors, including our ability to transition employees from completed projects to new assignments, attract, train and retain employees, forecast demand for our services and maintain an appropriate headcount in each of our locations, as well as our need to dedicate resources to employee training and development and other typically non-chargeable activities. The prices we are able to charge for our services are affected by a number of factors, including our clients’ perceptions of our ability to add value through our services, substantial price competition, introduction of new services or products by us or our competitors, our ability to accurately estimate, attain and sustain revenues from client engagements, our ability to estimate resources for long-term pricing, margins and cash flows for long-term contracts and general economic and political conditions. Therefore, if we are unable to appropriately price our services or manage our asset utilization levels, there could be a material adverse effect on our business, results of operations and financial condition.
Our analytics and business transformation services are cyclical and based on specific projects involving short-term contracts.
Our analytics and business transformation services, such as our analytics, finance transformation and operations and consulting services, are cyclical and can be significantly affected by variations in business cycles. Changes in the deadlines or the scope of work required for compliance with the requirements of legislation applicable to our clients could have a significant impact on certain service offerings of our analytics and business transformation services business.
In addition, a significant portion of our analytics and business transformation services consist of specific projects with contract terms generally not exceeding one year and may not produce ongoing or recurring business for us once the project is completed. These contracts also usually contain provisions permitting termination of the contract after a short notice period. The short-term nature and specificity of these projects could lead to material fluctuations and uncertainties in the revenues generated from providing analytics and business transformation services.
Our operating results may experience significant variability and as a result it may be difficult for us to make accurate financial forecasts.
Our operating results may vary significantly from period to period. Although our existing agreements with original terms of three or more years provide us with a relatively predictable revenue base for a substantial portion of our business, the long selling cycle for our services and the budget and approval processes of prospective clients make it difficult to predict the timing of entering into definitive agreements with new clients. The timing of revenue recognition under new client agreements also varies depending on when we complete the implementation phase with new clients. The completion of implementation varies significantly based upon the complexity of the processes being implemented.
22
Table of Contents
Our period-to-period results have in the past and may also in the future fluctuate due to other factors, including client losses, delays or failure by our clients to provide anticipated business, variations in employee utilization rates resulting from changes in our clients’ operations, delays or difficulties in expanding our operations centers and infrastructure (including hiring new employees or constructing new operations centers), changes to our pricing structure or that of our competitors, currency fluctuations, seasonal changes in the operations of our clients and other events identified in this Annual Report on Form 10-K. Our revenues are also affected by changes in pricing under our contracts at the time of renewal or by pricing under new contracts. In addition, most of our contracts do not commit our clients to provide us with a specific volume of business. Further, as we increase our capabilities utilizing technology service platforms and other software-based services, we expect that revenues from such services will continue to grow in proportion to our total revenues. Revenues from annual maintenance and support contracts for our software platforms provide us with a relatively predictable revenue base whereas revenues from new license sales and implementation projects have a long selling cycle and it is difficult to predict the timing of when such new contracts will be signed which may lead to fluctuations in our short term revenues. All these factors may make it difficult to make accurate financial forecasts or replace anticipated revenues that we do not receive as a result of delays in implementing our services or client losses. If our actual results do not meet any estimated results that we announce, or if we underperform market expectations as a result of such factors, trading prices for our common stock could be adversely affected.
Our senior management team is critical to our continued success and the loss of one or more members of our senior management team could harm our business.
Our future success substantially depends on the continued services and performance of the members of our management team and other key employees possessing technical and business capabilities, including industry expertise, that are difficult to replace. Specifically, the loss of the services of Rohit Kapoor, our Vice Chairman and Chief Executive Officer, could seriously impair our ability to continue to manage and expand our business. There is intense competition for experienced senior management and personnel with technical and industry expertise in the industry in which we operate, and we may not be able to retain these officers or key employees. Although we have entered into employment and non-competition agreements with all of our executive officers, certain terms of those agreements may not be enforceable and in any event these agreements do not ensure the continued service of these executive officers.
In addition, we currently do not maintain “key person” insurance covering any member of our management team. The loss of any of our key employees, particularly to competitors, could have a material adverse effect on our business, results of operations, financial condition and cash flows.
Our inability to effectively manage our rapid infrastructure and personnel growth could have a material adverse effect on our operations, results of operations and financial condition.
Since we were founded in April 1999, we have experienced rapid growth and significantly expanded our operations. We have nineteen operations centers in India, six operations centers in the U.S., five operations centers in the Philippines and one operations center in each of Bulgaria, Romania, and the Czech Republic. Further, we acquired multiple regional offices as part of over Overland and Blue Slate acquisitions during the year 2014. Our headcount has increased from approximately 1,800 on December 31, 2002 to approximately 22,800 on December 31, 2014. We expect to develop and improve our internal systems in the locations where we operate in order to address the anticipated continued growth of our business. We are also continuing to look for operations centers at additional locations outside of our current operating geographies. We believe expanding our geographic base of operations will provide higher value to our clients by decreasing the risks of operating from a single country (including potential shortages of skilled employees, increases in wage costs during strong economic times and currency fluctuations), while also giving our clients access to a wider talent pool and establishing a base in countries that may be competitive in the future. However, we may not be able to effectively manage our infrastructure and employee expansion, open additional operations centers or hire additional skilled employees as and when they are required to meet the ongoing needs of our clients, and we may not be able to
23
Table of Contents
develop and improve our internal systems. We also need to manage cultural differences between our employee populations and that may create a risk for employment law claims. Our inability to execute our growth strategy, to ensure the continued adequacy of our current systems or to manage our expansion effectively could have a material adverse effect on our business, results of operations, financial condition and cash flows.
We may engage in strategic acquisitions or transactions, which could have a material adverse effect on our business, results of operations and financial condition.
As part of our business strategy, we intend to continue to selectively consider acquisitions or investments, some of which may be material. Through the acquisitions we pursue, we may seek opportunities to expand the scope of our existing services, add new clients or enter new geographic markets. We have completed nine acquisitions since our inception in April 1999. There can be no assurance that we will successfully identify suitable candidates in the future for strategic transactions at acceptable prices, have sufficient capital resources to finance potential acquisitions or be able to consummate any desired transactions. Our failure to close transactions with potential acquisition targets for which we have invested significant time and resources could have a material adverse effect on our financial condition and cash flows.
Acquisitions, including completed acquisitions, involve a number of risks, including diversion of management’s attention, ability to finance the acquisition on attractive terms, failure to retain key personnel or valuable customers, legal liabilities and the need to amortize acquired intangible assets, any of which could have a material adverse effect on our business, results of operations, financial condition and cash flows. Future acquisitions may also result in the incurrence of indebtedness or the issuance of additional equity securities.
The intellectual property of an acquired business may be an important component of the value that we agree to pay for such a business. However, such acquisitions are subject to the risks that the acquired business may not own the intellectual property that we believe we are acquiring, that the intellectual property is dependent upon licenses from third parties, that the acquired business infringes upon the intellectual property rights of others or that the technology does not have the acceptance in the marketplace that we anticipated.
We could also experience financial or other setbacks if transactions encounter unanticipated problems, including problems related to execution, integration or underperformance relative to prior expectations. Our management may not be able to successfully integrate any acquired business into our operations or maintain our standards, controls and policies, which could have a material adverse effect on our business, results of operations and financial condition. Consequently, any acquisition we do complete may not result in long-term benefits to us.
Following the completion of an acquisition, we may have to rely on the seller to provide administrative and other support, including financial reporting and internal controls, and other transition services to the acquired business for a period of time. There can be no assurance that the seller will do so in a manner that is acceptable to us.
We may not be able to realize the entire book value of goodwill and other intangible assets from acquisitions.
As of December 31, 2014, we had $139.6 million of goodwill and $47.0 million of intangible assets. We periodically assess these assets to determine if they are impaired and we monitor for impairment of goodwill relating to all acquisitions. Goodwill is not amortized but is tested for impairment at least once on an annual basis as of October 1 of each year, based on a number of factors including operating results, business plans and future cash flows. Impairment testing of goodwill may also be performed between annual tests if an event occurs or circumstances change that would more likely than not reduce the fair value of goodwill below its carrying amount. We perform an assessment of qualitative factors to determine whether the existence of events or circumstances leads to a determination that it is more likely than not that the fair value of a reporting unit is less than its carrying amount. Based on the results of the qualitative assessment, we perform the quantitative assessment of goodwill impairment if we determine that it is more likely than not that the fair value of a reporting
24
Table of Contents
unit is less than its carrying amount. In the event that the book value of goodwill is impaired, any such impairment would be charged to earnings in the period of impairment. We cannot assure you that future impairment of goodwill will not have a material adverse effect on our business, financial condition or results of operations.
If we are unable to collect our receivables from, or bill our unbilled services to, our clients, our results of operations and cash flows could be adversely affected.
Our business depends on our ability to successfully obtain payment from our clients for work performed. We evaluate the financial condition of our clients and usually bill and collect on relatively short cycles. We maintain allowances against receivables and unbilled services. Actual losses on client balances could differ from those that we currently anticipate and, as a result, we might need to adjust our allowances. There is no assurance that we will accurately assess the creditworthiness of our clients. Macroeconomic conditions, such as the credit crisis that began in 2008 and the related turmoil in the global financial system, could also result in financial difficulties for our clients, including limited access to the credit markets, insolvency or bankruptcy, and, as a result, could cause clients to delay payments to us, request modifications to their payment arrangements that could increase our receivables balance, or default on their payment obligations to us. Timely collection of client balances also depends on our ability to complete our contractual commitments and bill and collect our contracted revenues. If we are unable to meet our contractual requirements, we might experience delays in collection of and/or be unable to collect our client balances, and if this occurs, our results of operations and cash flows could be adversely affected. In addition, if we experience an increase in the time to bill and collect for our services, our cash flows could be adversely affected.
Employee wage increases may prevent us from sustaining our competitive advantage and may reduce our profit margin.
Our most significant costs are the salaries and related benefits of our operations staff and other employees. For example, wage costs in India have historically been significantly lower than wage costs in the U.S. and Europe for comparably skilled professionals, which has been one of our competitive advantages. However, because of rapid economic growth in India, increased demand for outsourcing services from India and increased competition for skilled employees in India, wages for comparably skilled employees in India are increasing at a faster rate than in the U.S. and Europe, which may reduce this competitive advantage. We may need to increase the levels of employee compensation more rapidly than in the past to remain competitive in attracting and retaining the quality and number of employees that our business requires. Wages are generally higher for employees performing analytics and business transformation services than for employees performing operations management services. As the scale of our analytics and business transformation services increases, wages as a percentage of revenues will likely increase. To the extent that we are not able to control or share wage increases with our clients, wage increases may reduce our margins. We will attempt to control such costs by our efforts to add capacity in locations where we consider wage levels of skilled personnel to be satisfactory, but we may not be successful in doing so.
We face significant competition from U.S.-based and non-U.S.-based BPM and IT companies and from our clients, who may build shared services centers to perform these services themselves, either in-house, in the U.S. or through offshore groups or other arrangements.
The market for outsourcing services is highly competitive, and we expect competition to intensify and increase from a number of sources. We believe that the principal competitive factors in our markets are breadth and depth of process expertise, knowledge of industries served, service quality, the ability to attract, train and retain qualified people, compliance rigor, global delivery capabilities, price and sales and client management capabilities. We also face competition from non-U.S.-based outsourcing and IT companies (including those in the U.K. and India) and U.S.-based outsourcing and IT companies. Further, a client may choose to use its own internal resources rather than engage an outside firm to perform the types of services we provide. In addition, the trend toward offshore outsourcing, international expansion by foreign and domestic competitors and continuing
25
Table of Contents
technological changes, such as cloud computing, will result in new and different competition for our services. These competitors may include entrants from the communications, software and data networking industries or entrants in geographic locations with lower costs than those in which we operate. Some of these existing and future competitors have greater financial, personnel and other resources, a broader range of service offerings, greater technological expertise, more recognizable brand names and more established relationships in industries that we currently serve or may serve in the future. In addition, some of our competitors may enter into strategic or commercial relationships among themselves or with larger, more established companies in order to increase their ability to address client needs, or enter into similar arrangements with potential clients. The trend in multi-vendor relationships has been growing, which could reduce our revenues to the extent that we are required to modify the terms of our relationship with clients or that clients obtain services from other vendors. Increased competition, our inability to compete successfully against competitors, pricing pressures or loss of market share could result in reduced operating margins, which could harm our business, results of operations, financial condition and cash flows.
We expect competition to intensify in the future as more companies enter our markets. Increased competition may result in lower prices and volumes, higher costs for resources, especially people, and lower profitability. We may not be able to supply clients with services that they deem superior and at competitive prices and we may lose business to our competitors. Any inability to compete effectively would adversely affect our business, results of operations and financial condition.
We may disrupt our clients’ operations as a result of inadequate service or other factors, including telecommunications or technology downtime or interruptions.
The services we provide are often critical to our clients’ businesses, and any failure to provide those services could result in a reduction in revenues or a claim for substantial damages against us, regardless of whether we are responsible for that failure. Most of our agreements with clients contain service level and performance requirements, including requirements relating to the quality of our services. Failure to consistently meet service requirements of a client or errors made by our employees in the course of delivering services to our clients could disrupt the client’s business and result in a reduction in revenues or a claim for damages against us. Additionally, we could incur certain liabilities if a process we manage for a client were to result in internal control failures or processing errors, or impair our client’s ability to comply with its own internal control requirements.
Our dependence on our offshore operations centers requires us to maintain active voice and data communications among our operations centers, our international technology hubs and our clients’ offices. Although we maintain redundant facilities and communications links, disruptions could result from, among other things, technical breakdowns, computer glitches and viruses and weather conditions. We also depend on certain significant vendors for facility storage and related maintenance of our main technology equipment and data at those technology hubs. Any failure by these vendors to perform those services, any temporary or permanent loss of our equipment or systems, or any disruptions to basic infrastructure like power and telecommunications could impede our ability to provide services to our clients, have a negative impact on our reputation, cause us to lose clients, reduce our revenues and harm our business.
Our contractual limitations on liability with our clients and third parties may not be enforceable.
Under most of our agreements with our clients, our liability for breach of certain of our obligations is generally limited to actual damages suffered by the client and is typically capped at the fees paid or payable to us for a period of time under the relevant agreement. These limitations and caps on liability may be unenforceable or otherwise may not protect us from liability for damages. In addition, certain liabilities, such as claims of third parties for which we may be required to indemnify our clients, including intellectual property infringement claims, or liability for fraud or breaches of confidentiality, are generally not limited under those agreements. Because our agreements are governed by laws of multiple jurisdictions, the interpretation of certain provisions, and the availability of certain defenses to us, may vary, which, in certain circumstances, may contribute to uncertainty as to the scope of our potential liability.
26
Table of Contents
Our business could be negatively affected if we incur legal liability, including with respect to our contractual obligations, in connection with providing our solutions and services.
If we fail to meet our contractual obligations or otherwise breach obligations to our clients, we could be subject to legal liability. We may enter into non-standard agreements because we perceive an important economic opportunity by doing so or because our personnel did not adequately adhere to our guidelines. In addition, the contracting practices of our competitors may cause contract terms and conditions that are unfavorable to us to become standard in the marketplace. If we cannot or do not perform our obligations, we could face legal liability and our contracts might not always protect us adequately through limitations on the scope and/or amount of our potential liability. If we cannot, or do not, meet our contractual obligations to provide solutions and services, and if our exposure is not adequately limited through the enforceable terms of our agreements, we might face significant legal liability and our business could be adversely affected.
Our business could be materially and adversely affected if we do not protect our intellectual property or if our services are found to infringe on the intellectual property of others.
Our success depends in part on certain methodologies, practices, tools and technical expertise we utilize in providing our services. We engage in designing, developing, implementing and maintaining applications and other proprietary materials. In order to protect our rights in these various materials, we may seek protection under trade secret, patent, copyright and trademark laws. We also generally enter into confidentiality and nondisclosure agreements with our clients and potential clients, and third party vendors, and seek to limit access to and distribution of our proprietary information. For our employees and independent contractors, we generally require confidentiality and work-for-hire agreements. These measures may not prevent misappropriation or infringement of our intellectual property or proprietary information and a resulting loss of competitive advantage.
We submit from time to time patent applications for certain proprietary technology. We also have submitted and expect to continue to submit U.S. federal and foreign trademark applications for names and designations of our company and various business lines and service offerings. We may not be successful in obtaining or maintaining patents or trademarks for which we have applied.
We may be unable to protect our intellectual property and proprietary technology effectively, which may allow competitors to duplicate our technology and products and may adversely affect our ability to compete with them. To the extent that we do not protect our intellectual property effectively through patents or other means, other parties, including former employees, with knowledge of our intellectual property may leave and seek to exploit our intellectual property for their own or others’ advantage. We may not be able to detect unauthorized use and take appropriate steps to enforce our rights, and any such steps may not be successful. Infringement by others of our intellectual property, including the costs of enforcing our intellectual property rights, may have a material adverse effect on our business, results of operations and financial condition.
In addition, competitors or others may allege that our systems, processes, marketing or technologies infringe on their intellectual property rights, including patents. Non-practicing entities also have been bringing patent infringement claims on a more frequent basis. We could be required to indemnify our clients if they are sued by a third party for intellectual property infringement arising from materials that we have provided to the clients in connection with our services and deliverables. We may not be successful in defending against any intellectual property claims or in obtaining licenses or an agreement to resolve any intellectual property disputes. Given the complex, rapidly changing and competitive technological and business environment in which we operate, and the potential risks and uncertainties of intellectual property-related litigation, we cannot provide assurances that a future assertion of an infringement claim against us or our clients will not cause us to alter our business practices, lose significant revenues, incur significant license, royalty or technology development expenses, or pay significant monetary damages. Any such claim for intellectual property infringement may have a material adverse effect on our business, results of operations and financial condition.
27
Table of Contents
New and changing corporate governance and public disclosure requirements add uncertainty to our compliance policies and increase our costs of compliance.
Changing laws, regulations and standards relating to accounting, corporate governance and public disclosure, including the Sarbanes-Oxley Act of 2002, the Dodd-Frank Wall Street Reform and Consumer Protection Act, other SEC regulations, Consumer Financial Protection Bureau and the NASDAQ Global Select Market rules, are creating uncertainty for companies like ours. These laws, regulations and standards may lack specificity and are subject to varying interpretations. Their application in practice may evolve over time, as new guidance is provided by regulatory and governing bodies. This could result in continuing uncertainty regarding compliance matters and higher costs of compliance as a result of ongoing revisions to such corporate governance standards.
In particular, our efforts to comply with Section 404 of the Sarbanes-Oxley Act of 2002 and the related regulations regarding our required assessment of our internal controls over financial reporting and our external auditors’ audit of that assessment requires the commitment of significant financial and managerial resources. We consistently assess the adequacy of our internal controls over financial reporting, remediate any control deficiencies that may be identified, and validate through testing that our controls are functioning as documented. While we do not anticipate any material weaknesses, if management or our independent auditor fail in the future to provide us with an unqualified report as to the adequacy and effectiveness, respectively, of our internal controls over financial reporting for future year ends, it could result in adverse consequences to us, including, but not limited to, a loss of investor confidence in the reliability of our financial statements, which could cause the market price of our stock to decline.
We are committed to maintaining high standards of corporate governance and public disclosure, and our efforts to comply with evolving laws, regulations and standards in this regard have resulted in, and are likely to continue to result in, increased general and administrative expenses and a diversion of management time and attention from revenue-generating activities to compliance activities. In addition, the laws, regulations and standards regarding corporate governance may make it more difficult for us to obtain director and officer liability insurance. Further, our board members, chief executive officer and chief financial officer could face an increased risk of personal liability in connection with their performance of duties. As a result, we may face difficulties attracting and retaining qualified board members and executive officers, which could harm our business. If we fail to comply with new or changed laws, regulations or standards of corporate governance, our business and reputation may be harmed.
We may not be fully insured for all losses we may incur.
Although we attempt to limit and mitigate our liability for damages arising from negligent acts, errors or omissions through contractual provisions, limitations of liability set forth in our contracts may not be enforceable in all instances or may not otherwise protect us from liability for damages. In addition, certain liabilities, such as claims of third parties for which we may be required to indemnify our clients, are generally not limited under those agreements. We also could be sued directly for claims that could be significant, such as claims related to breaches of privacy or network security, infringement of intellectual property rights, violation of wage and hour laws, or systemic discrimination. Although we have general liability insurance coverage, including coverage for errors or omissions, property damage or loss and breaches of privacy and network security, that coverage may not continue to be available on reasonable terms or in sufficient amounts to cover one or more large claims, and our insurers may disclaim coverage as to any future claim. Insurance is not available for certain types of claims, including patent infringement, violation of wage and hour laws, failure to provide equal pay in the U.S., and our indemnification obligations to our clients based on employment law. The successful assertion of one or more large claims against us that are excluded from our insurance coverage or exceed available insurance coverage, or changes in our insurance policies (including premium increases, the imposition of large deductible or co-insurance requirements, or our insurers’ disclaimer of coverage as to future claims), could have a material adverse effect on our business, reputation, results of operations, financial condition and cash flows.
28
Table of Contents
We may increase the range of services that we provide to our clients and our business and future prospects are difficult to evaluate.
We are exploring opportunities to provide services that we have not provided to date. Should we decide to expand our service offerings, our results of operations may be negatively affected during any transition or growth period before such offerings achieve profitability. For example, we may need to expand our training of our existing employees or recruit new, specially-trained employees to provide these services, which could increase our costs of revenues disproportionately to the revenues generated by such services. Other challenges we may face include the diversion of our management’s attention, attracting and retaining clients for such services, integrating any new services into our current suite of services and managing any resulting growth in our operations.
Failure to adhere to the regulations that govern our business could have an adverse impact on our operations.
Our clients’ business operations are often subject to regulation, and our clients may require that we perform our services in a manner that will enable them to comply with applicable regulations. Our clients are located around the world, and the laws and regulations that apply include, among others, United States federal laws such as the Gramm-Leach-Bliley Act and the Health Insurance Portability and Accountability Act, state laws on third party administration services and utilization review services or state laws on debt collection in the United States and the Financial Services Act in the United Kingdom as well as similar consumer protection laws in other countries in which our clients’ customers are based. Failure to perform our services in a manner that complies with any such requirements could result in breaches of contracts with our clients. In addition, we are required under various laws to obtain and maintain permits and licenses for the conduct of our business in all jurisdictions in which we have operations, including India, and, in some cases, where our clients receive our services, including the United States and Europe. If we do not maintain our licenses or other qualifications to provide our services or if we do not adapt to changes in legislation or regulation, we may have to cease operations in the relevant jurisdictions and may not be able to provide services to existing clients or be able to attract new clients. In addition, we may be required to expend significant resources in order to comply with laws and regulations in the jurisdictions mentioned above. Any failure to abide by regulations relating either to our business or our clients’ businesses may also, in some limited circumstances, result in civil fines and criminal penalties for us. Any such ceasing of operations or civil or criminal actions may have a material adverse effect on our business, results of operations and financial condition.
We may face difficulties in delivering complex and large projects for our clients that could cause clients to discontinue their work with us, which in turn could harm our business.
We are expanding the nature and scope of our engagements. Our ability to effectively offer a wider breadth of end-to-end business solutions depends on our ability to attract existing or new clients to these expanded service offerings. To obtain engagements for such complex and large projects, we also are more likely to compete with large, well-established international consulting firms, resulting in increased competition and marketing costs. Accordingly, we cannot be certain that our new service offerings will effectively meet client needs or that we will be able to attract existing and new clients to these expanded service offerings. The increased breadth of our service offerings may result in larger and more complex projects with our clients. This will require us to establish closer relationships with our clients and a thorough understanding of their operations. Our ability to establish such relationships will depend on a number of factors, including the proficiency of our employees and management. Our failure to deliver services that meet the requirements specified by our clients could result in termination of client contracts, and we could be liable to our clients for significant penalties or damages. Larger projects may involve multiple engagements or stages, and there is a risk that a client may choose not to retain us for additional stages or may cancel or delay additional planned engagements. These terminations, cancellations or delays may result from factors that have little or nothing to do with the quality of our services, such as the business or financial condition of our clients or the economy generally. Such cancellations or delays make it difficult to plan for project resource requirements and inaccuracies in such resource planning and allocation may have a negative impact on our profitability.
29
Table of Contents
We may be unable to service our debt or obtain additional financing on competitive terms.
Our credit agreement contains covenants which require, among other things, maintenance of certain financial ratios, indebtedness and also, under certain conditions, restrict our ability to pay dividends, repurchase common shares and make other restricted payments as defined in the credit agreement. The credit agreement provides for a $50 million revolving credit facility including a letter of credit sub-facility. We have an option to increase the commitments under the credit facility, subject to certain approvals and conditions as set forth in the credit agreement. Our credit facility has a maturity date of October 24, 2019 and is voluntarily prepayable from time to time without premium or penalty. Our cash flow from operations provides the primary source of funds for our debt service payments. If our cash flow from operations declines, we may be unable to service or refinance our current debt which could adversely affect our business and financial condition. In addition, we have limited ability to increase our borrowings under our existing credit agreement. We may in the future require additional financing to fund one or more acquisitions and may not be able to obtain such additional financing on competitive terms or at all, which could restrict our ability to complete such transactions.
Risks Related to the International Nature of Our Business
We may choose to expand operations to additional countries and may not be successful in maintaining our current profit margins in our new locations due to factors beyond our control.
We are currently continuing to evaluate additional locations outside our current operating geographies in which to invest in operations centers. We cannot predict the extent of government support, availability of qualified workers, or monetary and economic conditions in other countries. Although some of these factors will influence our decision to establish operations in another country, there are inherent risks beyond our control, including exposure to currency fluctuations, political uncertainties, foreign exchange restrictions and foreign regulatory restrictions. One or more of these factors or other factors relating to expanded international operations could result in increased operating expenses and make it more difficult for us to manage our costs and operations, which could harm our business and negatively impact our operating results.
If more stringent labor laws become applicable to us or if our employees unionize, our profitability may be adversely affected.
India has stringent labor legislation that protects employee interests, including legislation that sets forth detailed procedures for dispute resolution and employee removal and legislation that imposes financial obligations on employers upon retrenchment. Though we are exempt from some of these labor laws at present under exceptions in some states for providers of IT-enabled services, there can be no assurance that such laws will not become applicable to us in the future. If these labor laws become applicable to our employees, it may become difficult for us to maintain flexible human resource policies and attract and employ the numbers of sufficiently qualified candidates that we need or discharge employees, and our compensation expenses may increase significantly. Regulations in other countries in which we operate also regulate our relations with our employees.
In addition, our employees may in the future form unions. If employees at any of our operations centers become eligible for union membership, we may be required to raise wage levels or grant other benefits that could result in an increase in our compensation expenses, in which case our profitability may be adversely affected.
The Government of India has recently focused on the occupational health and safety concerns experienced by workers in the outsourcing industry. The introduction of legislation imposing restrictions on working hours or conditions of professionals in the outsourcing industry could have an adverse effect on our business, results of operations and financial condition.
30
Table of Contents
Our financial condition could be negatively affected if foreign governments introduces new legislation, reduce or withdraw tax benefits and other incentives currently provided to companies within our industry or if we are not eligible for these benefits.
We are subject to income taxes in the United States and other foreign jurisdictions. Our tax expense and cash tax liability in the future could be adversely affected by various factors, including, but not limited to, changes in tax laws, regulations, accounting principles or interpretations and the potential adverse outcome of tax examinations. Changes in the valuation of deferred tax assets and liabilities, which may result from a decline in our profitability or changes in tax rates or legislation, could have a material adverse effect on our tax expense.
Under the Indian Income Tax Act, 1961, our operations centers in India, from which we derive a significant portion of our revenues, benefitted up to March 31, 2011, from a ten-year holiday from Indian corporate income taxes in respect of their export profits under the Software Technology Parks of India (“STPI”) Scheme. In the absence of this tax holiday, income derived from our Indian operations is taxed up to the maximum tax rate generally applicable to Indian enterprises, which, as of December 31, 2014, was 33.99%.
During the last five years, we either established or acquired new centers that are eligible for tax benefits under the Special Economic Zones Act (the “SEZ Act”). The SEZ Act introduced a 15-year tax holiday scheme for operations established in designated special economic zones (“SEZs”). Under the SEZ Act, qualifying operations are eligible for a deduction from taxable income equal to (i) 100% of their export profits derived for the first five years from the commencement of operations; (ii) 50% of such export profits for the next five years; and (iii) 50% of the export profits for a further five years, subject to satisfying certain capital investment requirements. The SEZ Act provides, among other restrictions, that this holiday is not available to operations formed by splitting up or reconstructing existing operations or transferring existing plant and equipment (beyond a prescribed limit) to new SEZ locations. We anticipate establishing additional operations centers in SEZs or other tax advantaged locations in the future.
As our SEZ legislation benefits are phasing out, our Indian tax expense may materially increase and our after-tax profitability may be materially reduced, unless we can obtain comparable benefits under new legislation or otherwise reduce our tax liability. Similarly, alternative minimum taxes are imposed by certain jurisdictions on otherwise exempt income, which may increase our tax expense in future years.
We also benefit from a corporate tax holiday in the Philippines for our operations centers established there over the last six years. The tax holiday expired for one of our centers in 2014 and will expire over the next few years for the other centers, which may lead to an increase in our overall tax rate. Following the expiry of the tax exemption, income generated from centers in Philippines will be taxed at the prevailing annual tax rate, which is currently 5% on the gross income.
As a result of the foregoing, our overall tax rate may increase over the next few years and such increase may be material and may have impact on our business, results of operations and financial condition.
If the transfer pricing arrangements we have among our subsidiaries are determined to be inappropriate, our tax liability may increase.
U.S. and Indian transfer pricing regulations, as well as regulations applicable in other countries in which we operate, require that any international transaction involving associated enterprises be at an arm’s-length price. Transactions among the Company’s subsidiaries and the Company may be required to satisfy such requirements. Accordingly, the Company determines the pricing among its associated enterprises on the basis of detailed functional and economic analysis involving benchmarking against transactions among entities that are not under common control. The tax authorities have jurisdiction to review this arrangement and in the event that they determine that the transfer price applied was not appropriate, the Company may incur increased tax liability, including accrued interest and penalties, which would cause our tax expense to increase, possibly materially,
31
Table of Contents
thereby reducing our profitability and cash flows. The Company is currently involved in disputes with the Indian tax authorities over the application of some of its transfer pricing policies for past years. Please see Note 16 to our audited consolidated financial statements for details.
Introduction of tax legislation and disputes with tax authorities may have an adverse effect on our operations and our overall tax rate.
Governments in countries in which we operate or provide services could enact new tax legislation, which could potentially have a material adverse effect on our business, results of operations and financial condition. In addition, our ability to repatriate surplus earnings from our operations centers in a tax-efficient manner is dependent upon interpretations of local laws, possible changes in such laws and the renegotiation of existing double tax avoidance treaties. Changes to any of these may adversely affect our overall tax rate, which would have a material adverse effect on our business, results of operations and financial condition. Additionally, if a tax authority in any jurisdiction reviews any of our tax returns and determines that the transfer prices and terms we have applied are not appropriate, or that other income of our affiliates should be taxed in that jurisdiction, we may incur increased tax liability, including accrued interest and penalties, which would cause our tax expense to increase, possibly materially, thereby reducing our profitability and cash flows.
The Company continues its legal entity rationalization project, which began in 2013, in order to simplify the global legal entity structure and remove redundancies and reduce compliance risks and costs associated with it. Furthermore, we also intend to optimize the tax and financial efficiencies of the group structure. As a result, we may carry out certain re-organizations under the tax laws of various jurisdictions in which we operate and take certain positions to qualify for tax neutrality for such internal re-organization. However, we cannot assure you that this project will be fully implemented or implemented in a manner satisfactory to the Company, or, if it is implemented, that there will not be any adverse actions brought by the tax authorities of certain jurisdictions if this re-organization is implemented.
Our global operations expose us to numerous and sometimes conflicting legal and regulatory requirements, and violations of these regulations could harm our business.
Because we provide services to clients throughout the world, we are subject to numerous, and sometimes conflicting, legal rules on matters as diverse as import/export controls, content requirements, trade restrictions, tariffs, taxation, sanctions, government affairs, internal and disclosure control obligations, data privacy and labor relations. Violations of these laws or regulations in the conduct of our business could result in fines, criminal sanctions against us or our officers, prohibitions on doing business, damage to our reputation and other unintended consequences such as liability for monetary damages, fines and/or criminal prosecution, unfavorable publicity, restrictions on our ability to process information and allegations by our clients that we have not performed our contractual obligations. Due to the varying degrees of development of the legal systems of the countries in which we operate, local laws might be insufficient to protect our rights. Our failure to comply with applicable legal and regulatory requirements could have a material adverse effect on our business, results of operations and financial condition.
It may be difficult to enforce these intellectual property rights both within and outside of the U.S. India is a member of the Berne Convention, an international intellectual property treaty, and has agreed to recognize protections on intellectual property rights conferred under the laws of other foreign countries, including the laws of the U.S. There can be no assurance, however, that the laws, rules, regulations and treaties in effect in the U.S., India and the other jurisdictions in which we operate and the contractual and other protective measures we take, are adequate to protect us from misappropriation or unauthorized use of our intellectual property, or that such laws will not change.
Among other anti-corruption laws and regulations, including the U.K. Bribery Act, we are subject to the United States Foreign Corrupt Practices Act, or FCPA, which prohibits improper payments or offers of improper payments to foreign officials to obtain business or any other benefit. The FCPA also requires covered companies
32
Table of Contents
to make and keep books and records that accurately and fairly reflect the transactions of the company and to devise and maintain an adequate system of internal accounting controls. In many parts of the world, including countries in which we operate, practices in the local business community might not conform to international business standards and could violate these anti-corruption laws or regulations. Although we have policies and procedures in place that are designed to promote legal and regulatory compliance, our employees, subcontractors and agents could take actions that violate these policies or procedures or applicable anti-corruption laws or regulations. Furthermore, the U.S. government may seek to hold us liable for successor liability FCPA violations committed by companies in which we invest or that we acquire. Violations of these laws or regulations could subject us to criminal or civil enforcement actions, including fines and suspension or disqualification from government contracting or contracting with private entities in certain highly regulated industries, any of which could have a material adverse effect on our business.
Currency exchange rate fluctuations in the various currencies in which we do business, especially the Indian rupee and the U.S. dollar, could have a material adverse effect on our results of operations.
A substantial portion of our revenues are denominated in U.S. dollars (73.9% in 2014) or U.K. pounds sterling (20.4% in 2014). A substantial portion of our expenses are incurred and paid in Indian rupees and Philippine peso (46.5% and 11.7% in 2014, respectively). We report our financial results in U.S. dollars. The exchange rates among the Indian rupee and other currencies in which we incur costs or receive revenues and the U.S. dollar have changed substantially in recent years and may fluctuate substantially in the future. See Item 7A—“Quantitative and Qualitative Disclosures about Market Risk.” Additionally, because a majority of our employees are based in India and the Philippines and paid in Indian rupees or Philippine peso while our revenues are primarily reported in U.S. dollars and U.K. pounds sterling, our employee costs as a percentage of revenues may increase or decrease significantly if the exchange rates among the Indian rupee, Philippine peso and the U.S. dollar fluctuate significantly.
Our results of operations could be adversely affected over time by certain movements in exchange rates, particularly if the Indian rupee or other currencies in which we incur expenses or receive revenues, appreciate against the U.S. dollar. Although we take steps to hedge a substantial portion of our Indian rupee/U.S. dollar, U.K pounds sterling/U.S. dollar and Philippine peso/U.S. dollar foreign currency exposures, there is no assurance that our hedging strategy will be successful or that the hedging markets will have sufficient liquidity or depth to allow us to implement our hedging strategy in a cost-effective manner. Any failure by our hedging counterparties to meet their contractual obligations could materially and adversely affect our profitability. We are subject to legal restrictions on hedging activities as well as the convertibility of currencies in India. This could limit our ability to use cash generated in one country in another country and could limit our ability to hedge our exposures.
Terrorist attacks and other acts of violence involving India, the Philippines, the U.S. or other countries could adversely affect the financial markets, result in a loss of client confidence and adversely affect our business, results of operations and financial condition.
Terrorist attacks and other acts of violence or war, including those involving India, the Philippines, the U.S. or other countries, may adversely affect worldwide financial markets and could potentially lead to economic recession, which could adversely affect our business, results of operations and financial condition. These events could adversely affect our clients’ levels of business activity and precipitate sudden significant changes in regional and global economic conditions and cycles. These events also pose significant risks to our people and to our operations centers. South Asia has, from time to time, experienced instances of civil unrest and hostilities among neighboring countries, including Bangladesh, Pakistan and China. In recent years there have been several instances of military confrontations along the Indo-Pakistani border. There continues to be potential for hostilities between India and Pakistan due to recent terrorist activities and the geopolitical climate along the border. Although this has not been the case to date, such political tensions could create a perception that there is a risk of disruption of services provided by companies with operations in India, which could have a material adverse effect on the market for our services. Furthermore, if India were to become engaged in armed hostilities,
33
Table of Contents
particularly hostilities that were protracted or involved the threat or use of nuclear weapons, we might not be able to continue our operations in India. Our insurance policies may not insure us against losses and interruptions caused by terrorist attacks and other acts of violence or war.
We may face difficulties as we expand our operations into countries in which we have no prior operating experience.
We intend to continue to expand our global footprint in order to maintain an appropriate cost structure and meet our clients’ delivery needs. This may involve expanding into countries other than those in which we currently operate. It may involve expanding into less developed countries, which may have less political, social or economic stability and less developed infrastructure and legal systems. As we expand our business into new countries we may encounter regulatory, personnel, technological and other difficulties that increase our expenses or delay our ability to start up our operations or become profitable in such countries. This may affect our relationships with our clients and could have an adverse effect on our business, results of operations and financial condition.
A substantial portion of our assets and operations are located in India, and we are subject to regulatory, economic and political uncertainties in India.
Our principal operating subsidiaries are incorporated in India, and a majority of our assets and our professionals are located in India. We intend to continue to develop and expand our offshore facilities in India. In the early 1990s, India experienced significant inflation, low growth in gross domestic product and shortages of foreign currency reserves. The Indian government, however, has exercised and continues to exercise significant influence over many aspects of the Indian economy. India’s government has provided significant tax incentives and relaxed certain regulatory restrictions in order to encourage foreign investment in specified sectors of the economy, including our industry. Certain of those programs, which have benefited us, include tax holidays, liberalized import and export duties and preferential rules on foreign investment and repatriation. We cannot assure you that liberalization policies will continue. Various factors, such as changes in the current federal government, could trigger significant changes in India’s economic liberalization and deregulation policies and disrupt business and economic conditions in India generally and our business in particular. Any such actions could negatively impact our business.
The choice of India as an outsourcing destination and our financial performance may be adversely affected by general economic conditions and economic and fiscal policy in India, including changes in exchange rates and controls, interest rates and taxation policies, as well as social stability and political, economic or diplomatic developments affecting India in the future. In particular, India has experienced significant economic growth over the last several years, but faces major challenges in sustaining that growth in the years ahead. These challenges include the need for substantial infrastructure development and improving access to healthcare and education. Our ability to recruit, train and retain qualified employees, develop and operate our operations centers, and attract and retain clients could be adversely affected if India does not successfully meet these challenges.
Restrictions on entry visas may affect our ability to compete for and provide services to clients in the U.S., which could have a material adverse effect on future revenues.
The vast majority of our employees are Indian nationals. The ability of some of our executives and employees to work with and meet our U.S. and European clients and our clients from other countries depends on their ability to obtain the necessary visas and entry permits. In response to terrorist attacks, the recent global economic downturn and public sentiments about the high unemployment rates in their respective economies, U.S. and European immigration authorities have increased the level of scrutiny in granting visas. Immigration laws in those countries may also require us to meet certain levels of compensation and comply with other legal requirements as a condition to obtaining or maintaining entry visas. These restrictions have increased the application fees for certain types of visas and have significantly lengthened the time requirements to obtain visas
34
Table of Contents
for our personnel, which has in the past resulted, and may continue to result, in delays in the ability of our personnel to meet with our clients. In addition, immigration laws are subject to legislative change and varying standards of application and enforcement due to political forces, economic conditions or other events, including terrorist attacks. We cannot predict the political or economic events that could affect immigration laws or any restrictive impact those events could have on obtaining or monitoring entry visas for our professionals. If we are unable to obtain the necessary visas for personnel who need to get to our clients’ sites, or if the duration of such visas is shortened or if such visas are delayed, we may not be able to provide services to our clients or to continue to provide these services on a timely and cost effective basis, which could have a material adverse effect on our business, results of operations, financial condition and cash flows.
We are vulnerable to natural disasters, technical disruptions and man-made events that could severely disrupt the normal operation of our business and adversely affect our business, results of operation and financial condition.
Our operations centers and our data and voice communications, particularly in India and the Philippines, may be damaged or disrupted as a result of natural disasters such as earthquakes, floods, heavy rains, epidemics, tsunamis and cyclones, technical disruptions such as electricity or infrastructure breakdowns, including damage to telecommunications cables, computer glitches and electronic viruses or man-made events such as protests, riots and labor unrest. Such events may lead to the disruption of information systems and telecommunication services for sustained periods. They also may make it difficult or impossible for employees to reach our business locations. Damage or destruction that interrupts our provision of services could adversely affect our reputation, our relationships with our clients, our leadership team’s ability to administer and supervise our business or it may cause us to incur substantial additional expenditure to repair or replace damaged equipment or delivery centers. We may also be liable to our clients for disruption in service resulting from such damage or destruction. While we currently have commercial liability insurance, our insurance coverage may not be sufficient. Furthermore, we may be unable to secure such insurance coverage at premiums acceptable to us in the future or at all. Prolonged disruption of our services would also entitle our clients to terminate their contracts with us. Any of the above factors may adversely affect our business, results of operations and financial condition.
Investors may have difficulty effecting service of process or enforcing judgments obtained in the U.S. against our subsidiaries in India or our executive officers.
Our primary operating subsidiaries are organized outside the U.S. and a number of our executive officers reside outside of the U.S. A substantial portion of our assets are located in India. As a result, you may be unable to effect service of process upon our affiliates who reside in India outside their jurisdiction of residence. In addition, you may be unable to enforce against these persons outside the jurisdiction of their residence judgments obtained in courts of the U.S., including judgments predicated solely upon the federal securities laws of the U.S.
Sections 44A and Section 13 of the Indian Civil Procedure Code, 1908 (the “Civil Code”) govern recognition and enforcement of foreign judgments. Section 44A of the Civil Code provides for recognition and enforcement of a foreign judgment without having to file an original suit in India, provided such judgments have been rendered by courts in a country or territory outside India which the Government of India has declared to be a reciprocating territory. We have been advised by our Indian counsel that the U.S. and India do not currently have a treaty providing for reciprocal recognition and enforcement of judgments (other than certain arbitration awards) in civil and commercial matters. Therefore, a final judgment for the payment of money rendered by any federal or state court in the U.S. based on civil liability, whether or not it is predicated upon the federal securities laws of the U.S., would not be enforceable in India as such.
However, if the party in whose favor such final judgment is rendered brings a new suit in a competent court in India based on a final judgment that has been obtained in the U.S., Section 13 of the Civil Code provides that the foreign judgment will be conclusive as to certain matters. The suit must be brought in India within three years of the date of the foreign judgment. It is unlikely, however, that a court in India would award damages on the
35
Table of Contents
same basis as a court in the U.S. if an action is brought in India. It is also unlikely that an Indian court would enforce judgments obtained in the U.S. if it viewed the amount of damages awarded as excessive or inconsistent with Indian practice.
Risks Related to our Common Stock
Delaware law and our amended and restated certificate of incorporation and by-laws contain certain anti-takeover provisions that could delay or discourage business combinations and takeover attempts that stockholders may consider favorable.
Our amended and restated certificate of incorporation and by-laws contain provisions that may make it more difficult, expensive or otherwise discourage a tender offer or a change in control or takeover attempt by a third-party that is opposed by our board of directors. These provisions include classified board provisions, provisions permitting the board of directors to fill vacancies created by its expansion, provisions permitting the removal of directors only for cause and with a 66 2⁄3% stockholder vote, provisions requiring a 66 2⁄3% stockholder vote for certain amendments to our organizational documents, provisions barring stockholders from calling a special meeting of stockholders or requiring one to be called or from taking action by written consent and provisions that set forth advance notice procedures for stockholders’ nominations of directors and proposals for consideration at meetings of stockholders. These provisions may have the effect of delaying or preventing a change of control or changes in management that stockholders consider favorable. Additionally, because we are incorporated in Delaware, we are subject to Section 203 of the Delaware General Corporation Law. Section 203 may prohibit large stockholders, in particular those owning 15.0% or more of our outstanding voting stock, from merging or combining with us. These provisions of our amended and restated certificate of incorporation, by-laws and Delaware law could discourage potential takeover attempts and reduce the price that investors might be willing to pay for shares of our common stock in the future which could reduce the market price of our stock.
We do not intend to pay dividends in the foreseeable future, and, because we are also a holding company, we may be unable to pay dividends.
For the foreseeable future, we intend to retain any earnings to finance the development and expansion of our business, and we do not anticipate paying any cash dividends on our common stock. Any future determination to pay dividends will be at the discretion of our board of directors and will be dependent on then-existing conditions, including our financial condition and results of operations, capital requirements, contractual restrictions, including restrictions under our credit agreement, business prospects and other factors that our board of directors considers relevant. Furthermore, because we are also a holding company, any dividend payments would also depend on the cash flow from our subsidiaries. Accordingly, under certain circumstances, we may not be able to pay dividends even if our board of directors would otherwise deem it appropriate.
Our stock price continues to be volatile.
Our stock has at times experienced substantial price volatility as a result of, among other reasons, variations between our actual and anticipated financial results, announcements by us and our competitors, projections or speculation about our business or that of our competitors by the media or investment analysts or uncertainty about current global economic conditions. The stock market, as a whole, experiences extreme price and volume fluctuations that affect the market price of many companies, including technology companies, in ways that may have been unrelated to these companies’ operating performance. Furthermore, we believe our stock price should reflect future growth and profitability expectations and, if we fail to meet these expectations, our stock price may significantly decline.
36
Table of Contents
Risks Related to our Industry
Our industry is subject to rapid technological change and we may not be successful in addressing these changes.
Our industry is characterized by rapid technological change, evolving industry standards, changing client preferences and new product introductions. The success of our business depends, in part, upon our ability to develop solutions that keep pace with changes in the industry. We may not be successful in addressing these changes on a timely basis, or at all, or successfully marketing any changes that we implement. In addition, products or technologies developed by others may render our services uncompetitive or obsolete. If we do not sufficiently invest in new technology and industry developments or if we do not make the right strategic investments to respond to these developments and successfully drive innovation, our services and solutions, our results of operations, and our ability to develop and maintain a competitive advantage and continue to grow could be negatively affected.
Our industry may not develop in ways that we currently anticipate due to negative public reaction in the U.S. and elsewhere to offshore outsourcing, recently proposed legislation or otherwise.
We have based our strategy of future growth on certain assumptions regarding our industry and future developments in the market for outsourcing services. For example, we believe that there will continue to be changes in product and service requirements, and investments in the products offered by our clients will continue to increase. However, the trend to outsource business processes may not continue and could reverse. Offshore outsourcing is a politically sensitive topic in the U.S. and elsewhere, and many organizations and public figures have publicly expressed concern about a perceived association between offshore outsourcing providers and the loss of jobs in the U.S. and elsewhere. In addition, there has been limited publicity about the negative experience of certain companies that use offshore outsourcing, particularly in India. Current or prospective clients may elect to perform such services themselves or may be discouraged from transferring these services to offshore providers to avoid any negative perception that may be associated with using an offshore provider. Any slowdown or reversal of existing industry trends would harm our ability to compete effectively with competitors that operate out of facilities located in the U.S. and elsewhere.
A variety of U.S. federal and state legislation has been proposed that, if enacted, could restrict or discourage U.S. companies from outsourcing their services to companies with facilities outside the U.S. For example, legislation has been proposed that would require offshore providers to identify where they are located and that would require notice to individuals whose personal information is disclosed to non-U.S. companies. In addition, bills have been proposed that would provide tax and other economic incentives for companies that create employment in the U.S. by reducing their offshore outsourcing. Other bills have proposed requiring call centers to disclose their geographic locations, requiring notice to individuals whose personal information is disclosed to non-U.S. affiliates or subcontractors, requiring disclosures of companies’ foreign outsourcing practices or restricting U.S. private sector companies that have federal government contracts, federal grants or guaranteed loan programs from outsourcing their services to offshore service providers. Because most of our clients are located in the U.S., any expansion of existing laws or the enactment of new legislation restricting offshore outsourcing could adversely impact our ability to do business with U.S. clients and have a material and adverse effect on our business, results of operations, financial condition and cash flows.
In other countries, such as the U.K., there has also been some negative publicity and concern expressed regarding the possible effect of job losses caused by outsourcing. Legislation enacted in the U.K. as well as other European jurisdictions provides that if a company transfers or outsources its business or a part of its business to a transferee or a service provider, the employees who were employed in such business are entitled to become employed by the transferee or service provider on the same terms and conditions as they had been employed before the transfer. The dismissal of such employees as a result of such transfer of business is deemed unfair dismissal and entitles the employees to compensation. As a result, we may become liable for redundancy payments to the employees of our clients who outsource business to us from those jurisdictions. We are generally indemnified in our existing contracts with clients in those jurisdictions to the extent we incur losses or additional
37
Table of Contents
costs due to the application of this legislation to us, and we intend to obtain indemnification in future contracts with clients. However, if we are unable to obtain indemnification in future contracts with clients or if the existing indemnification is not enforceable or available, we may be liable under those agreements we enter into with clients in the U.K. and other European jurisdictions.
Unauthorized disclosure of sensitive or confidential client and customer data, whether through breach of our computer systems or otherwise, could expose us to protracted and costly litigation and cause us to lose clients.
We are typically required to process, and sometimes collect and/or store sensitive data of our clients’ end customers in connection with our services, including names, addresses, social security numbers, personal health information, credit card account numbers, checking and savings account numbers and payment history records, such as account closures and returned checks. In addition, we collect and store data regarding our employees. As a result, we are subject to various data protection and privacy laws in the countries in which we operate. In addition, many of our agreements with our clients do not include any limitation on our liability to them with respect to breaches of our obligation to keep the information we receive from them confidential. We devote substantial resources to maintaining adequate levels of cyber security and to protecting confidential client and customer data.
However, any network infrastructure may be vulnerable to rapidly evolving cyber attacks, and our user data and corporate systems and security measures may be breached due to the actions of outside parties (including cyber attacks), employee error, malfeasance, a combination of these, or otherwise, allowing an unauthorized party to obtain access to our data or our users’ or customers’ data. Additionally, outside parties may attempt to fraudulently induce employees, users, or customers to disclose sensitive information in order to gain access to our data or our users’ or customers’ data. Because the techniques used to obtain unauthorized access, disable or degrade service, or sabotage systems change frequently or may be designed to remain dormant until a predetermined event and often are not recognized until launched against a target, we may be unable to anticipate these techniques or implement adequate preventative measures. If an actual or perceived breach of our security occurs, the market perception of the effectiveness of our security measures could be harmed and we could lose users and customers. Security breaches expose us to a risk of loss of this information, litigation, remediation costs, increased costs for security measures, loss of revenue, damage to our reputation, and potential liability.
If any person, including any of our employees, negligently disregards or intentionally breaches controls or procedures with which we are responsible for complying with respect to such data or otherwise mismanages or misappropriates that data, or if unauthorized access to or disclosure of data in our possession or control occurs, we could be subject to significant liability to our clients or our clients’ customers for breaching contractual confidentiality and security provisions or privacy laws, as well as liability and penalties in connection with any violation of applicable privacy laws and/or criminal prosecution. Unauthorized disclosure of sensitive or confidential client or employee data, whether through breach of computer systems, systems failure, employee negligence, fraud or misappropriation, or otherwise, could damage our reputation and cause us to lose clients. Similarly, unauthorized access to or through our information systems and networks or those we develop or manage for our clients, whether by our employees or third parties, could result in negative publicity, legal liability and damage to our reputation.
If any person, including any of our employees, penetrates our network security or otherwise mismanages or misappropriates sensitive data, discloses or distributes any such data in an unauthorized manner, we could be subject to significant liability and lawsuits from our clients or their own customers for breaching contractual confidentiality provisions or privacy laws, or investigations and penalties from regulators. Under some of our client contracts, we have agreed to pay for the costs of remediation or notice to end users or credit monitoring, as well as other costs.
Cyber attacks penetrating the network security of our data centers or any unauthorized disclosure or access to confidential information and data of our clients or their end customers could also have a negative impact on our reputation and client confidence, which could have a material adverse effect on our business, results of operations, financial condition and cash flows.
38
Table of Contents
| ITEM 1B. | Unresolved Staff Comments |
None.
| ITEM 2. | Properties |
Our corporate headquarters are located in New York, New York. We have nineteen operations centers in India, five operations centers in the Philippines and one operations center in each of Bulgaria, Romania and the Czech Republic, with an aggregate area of approximately 1,610,000 square feet and a current installed capacity of approximately 22,900 workstations, including workstations for our employees in enabling functions. We also have six operations centers in the U.S. and a sales office in London, U.K. Our networking and telecommunication hubs are located in Sunnyvale, California, Jersey City, New Jersey and New York. Further, we acquired multiple regional offices in the U.S as part of our Overland and Blue Slate acquisitions during the year 2014.
All of our operations centers are leased under long-term leases with varying expiration dates, except for an operations center in Pune, India with an area of 86,361 sq. ft. and containing approximately 1,600 agent workstations, which we own. Substantially all of our owned and leased property is used to service both of our operating segments. We believe that our current facilities are adequate to support our existing operations. We also believe that we will be able to obtain suitable additional facilities on commercially reasonable terms on an “as needed basis.”
| ITEM 3. | Legal Proceedings |
In the course of our normal business activities, various lawsuits, claims and proceedings may be instituted or asserted against us. We believe that the disposition of matters currently instituted or asserted will not have a material adverse effect on our consolidated financial position, results of operations or cash flows. Please see Note 16 to our consolidated financial statements contained herein for details regarding our tax proceedings.
| ITEM 4. | Mine Safety Disclosures |
Not applicable.
39
Table of Contents
| ITEM 5. | Market for Registrant’s Common Equity, Related Stockholder Matters and Issuer Purchases of Equity Securities |
Our common stock trades on the Nasdaq Global Select Market under the symbol “EXLS.”
| Price Range | ||||||||
| Calendar Period |
High | Low | ||||||
| 2014 |
||||||||
| First Quarter |
$ | 31.14 | $ | 24.42 | ||||
| Second Quarter |
$ | 31.18 | $ | 27.21 | ||||
| Third Quarter |
$ | 30.49 | $ | 24.38 | ||||
| Fourth Quarter |
$ | 29.27 | $ | 24.20 | ||||
| 2013 |
||||||||
| First Quarter |
$ | 32.97 | $ | 26.90 | ||||
| Second Quarter |
$ | 32.86 | $ | 28.56 | ||||
| Third Quarter |
$ | 30.89 | $ | 26.28 | ||||
| Fourth Quarter |
$ | 31.42 | $ | 22.98 | ||||
As of February 23, 2015, there were 23 holders of record of our outstanding common stock.
We have not paid or declared any cash dividends on our common stock. We currently expect to retain all of our earnings for use in developing our business and do not anticipate paying any cash dividends in the foreseeable future. Future cash dividends, if any, will be paid at the discretion of our board of directors and will depend, among other things, upon our future operations and earnings, capital requirements and surplus, general financial condition, contractual restrictions and such other factors as our board of directors may deem relevant.
Unregistered Sales of Equity Securities
We did not sell any of our equity securities during the fiscal year ended December 31, 2014 that were not registered under the Securities Act of 1933, as amended.
Issuer Purchases of Equity Securities
On December 30, 2014, the Company’s Board of Directors authorized up to an annual $20 million common stock repurchase program (the “2014 Repurchase Program”), under which shares may be purchased by the Company from time to time from the open market and through private transactions during each of the fiscal years 2015 to 2017. The Company expects that open market purchases under the 2014 Repurchase Program will be structured to comply with Rule 10b-18 under the Exchange Act. Repurchases may be discontinued at any time by management.
On November 2013, the Company had announced a similar program, pursuant to which the Board of Directors had authorized a $25 million common stock repurchase program (the “2013 Repurchase Program”), under which shares may be purchased by the Company from time to time from the open market and through private transactions. The remaining authorized balance under the 2013 Repurchase Program was $0.9 million as of December 31, 2014.
Repurchased shares under these programs are recorded as treasury shares and will be held until our Board of Directors designates that these shares be retired or used for other purposes.
During the year ended December 31, 2014, the Company acquired 109,500 shares of common stock from the open market under the 2013 Repurchase Program. The Company paid an aggregate consideration of $2,862,838 for this share repurchase at the weighted average purchase price of $26.14 per share. The Company did not repurchase any shares of its common stock under the stock repurchase program during the three months ended December 31, 2014.
40
Table of Contents
During the year ended December 31, 2014, the Company also acquired 18,256 shares of common stock from employees in connection with withholding tax payments related to the vesting of restricted stock for a total consideration of $458,901. The weighted average purchase price of $25.14 per share was the average of the high and low price of our common stock on the Nasdaq Global Select Market on the trading day prior to the vesting date of the shares of restricted stock. The shares acquired are held as treasury stock.
Equity Compensation Plan Information
The following table provides information as of December 31, 2014 with respect to the shares of our common stock that may be issued under our existing equity compensation plans. For a description of our equity compensation plans, please see Note 14 to our consolidated financial statements.
| Plan Category | Number of Securities to be Issued Upon Exercise/Vesting of Outstanding Equity Awards* |
Weighted Average Exercise Price of Outstanding Options |
Number of Securities Available for Future Issuance Under Equity Compensation Plans |
|||||||||
| Equity compensation plans that have been approved by security holders |
2,893,270 | $ | 16.23 | 1,282,796 | ||||||||
| Equity compensation plans not approved by security holders |
— | — | — | |||||||||
|
|
|
|
|
|
|
|||||||
| Total |
2,893,270 | $ | 16.23 | 1,282,796 | ||||||||
|
|
|
|
|
|
|
|||||||
| * | This includes Outstanding options and unvested Restricted Stock Units. Refer to Note 14 to our consolidated Financial statements for further details. |
41
Table of Contents
Performance Graph
The following graph compares the cumulative total stockholder return on our common stock with the cumulative total return of the Nasdaq 100 Index (capitalization weighted) and our peer group of companies for the period beginning October 20, 2006. Our peer group of companies is comprised of two companies that we believe are our closest reporting issuer competitors: Genpact Limited and WNS (Holdings) Limited. The returns of the component entities of our peer group index are weighted according to the market capitalization of each company as of the beginning of each period for which a return is presented. The returns assume that $100 was invested on October 20, 2006 and that all dividends were reinvested. The stock performance shown on the graph below is not indicative of future price performance.
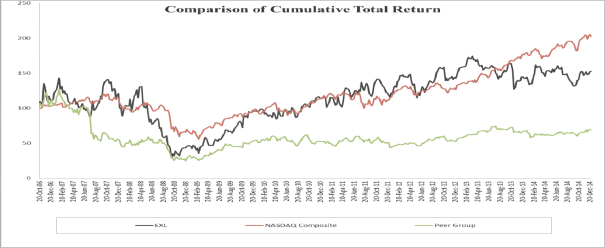
This graph will not be deemed “filed” for purposes of Section 18 of the Exchange Act or otherwise subject to the liability of that section. This graph will not be deemed to be incorporated by reference into any prior or subsequent filing under the Securities Act of 1933, as amended, or the Exchange Act.
42
Table of Contents
| ITEM 6. | Selected Financial Data |
The following table sets forth our selected consolidated historical financial data as of the dates and for the periods indicated. Our selected consolidated financial data set forth below as of December 31, 2014 and 2013 and for each of the three years in the period ended December 31, 2014 has been derived from our consolidated financial statements included elsewhere in this Annual Report on Form 10-K. Our selected consolidated financial data set forth below as of December 31, 2012, 2011 and 2010 and for years ended December 31, 2011 and 2010 is derived from our audited financial statements, which are not included in this Annual Report on Form 10-K. Our selected consolidated financial information for 2014, 2013 and 2012 should be read in conjunction with our consolidated financial statements and the notes thereto and “Item 7. Management’s Discussion and Analysis of Financial Condition and Results of Operations,” which are included elsewhere in this Annual Report on Form 10-K.
| Year ended December 31, | ||||||||||||||||||||
| 2014 | 2013 | 2012 | 2011 | 2010 | ||||||||||||||||
| (in millions, except share and per share data) | ||||||||||||||||||||
| Consolidated Statements of Income Data: |
||||||||||||||||||||
| Revenues, net |
$ | 499.3 | $ | 478.5 | $ | 442.9 | $ | 360.5 | $ | 252.8 | ||||||||||
| Cost of revenues (excluding depreciation and amortization) |
332.6 | 291.0 | 271.9 | 220.0 | 151.3 | |||||||||||||||
|
|
|
|
|
|
|
|
|
|
|
|||||||||||
| Gross profit |
166.7 | 187.5 | 171.0 | 140.5 | 101.5 | |||||||||||||||
| General and administrative expenses |
65.4 | 58.8 | 57.2 | 50.6 | 40.3 | |||||||||||||||
| Selling and marketing expenses |
39.3 | 36.4 | 31.0 | 25.6 | 18.8 | |||||||||||||||
| Depreciation and amortization expenses |
28.0 | 24.9 | 25.6 | 23.0 | 15.9 | |||||||||||||||
|
|
|
|
|
|
|
|
|
|
|
|||||||||||
| Income from operations |
34.0 | 67.4 | 57.2 | 41.3 | 26.5 | |||||||||||||||
| Total other income/ (expense) |
3.6 | (2.4 | ) | (0.5 | ) | 5.4 | 5.6 | |||||||||||||
|
|
|
|
|
|
|
|
|
|
|
|||||||||||
| Income before income taxes |
37.6 | 65.0 | 56.7 | 46.7 | 32.1 | |||||||||||||||
| Income tax expense |
5.2 | 16.9 | 14.9 | 11.9 | 5.5 | |||||||||||||||
|
|
|
|
|
|
|
|
|
|
|
|||||||||||
| Net income |
$ | 32.4 | $ | 48.1 | $ | 41.8 | $ | 34.8 | $ | 26.6 | ||||||||||
|
|
|
|
|
|
|
|
|
|
|
|||||||||||
| Earnings per share: |
||||||||||||||||||||
| Basic: |
$ | 0.99 | $ | 1.47 | $ | 1.31 | $ | 1.15 | $ | 0.91 | ||||||||||
| Diluted: |
$ | 0.96 | $ | 1.42 | $ | 1.26 | $ | 1.10 | $ | 0.88 | ||||||||||
| Weighted-average number of shares used in computing earnings per share: |
||||||||||||||||||||
| Basic |
32,804,606 | 32,750,178 | 31,968,386 | 30,264,805 | 29,281,364 | |||||||||||||||
| Diluted |
33,636,593 | 33,842,938 | 33,171,105 | 31,546,144 | 30,388,520 | |||||||||||||||
| December 31, | ||||||||||||||||||||
| 2014 | 2013 | 2012 | 2011 | 2010 | ||||||||||||||||
| (in millions) | ||||||||||||||||||||
| Consolidated Statements of Balance Sheets Data: |
||||||||||||||||||||
| Cash and cash equivalents |
$ | 176.5 | $ | 148.1 | $ | 103.0 | $ | 82.4 | $ | 111.2 | ||||||||||
| Working capital (1) |
211.4 | 176.6 | 131.8 | 94.6 | 126.4 | |||||||||||||||
| Total assets |
573.6 | 463.4 | 435.9 | 377.4 | 305.7 | |||||||||||||||
| Long-term borrowings |
50.0 | — | — | — | — | |||||||||||||||
| Other long term obligations (2) |
13.4 | 21.2 | 17.0 | 26.7 | 9.2 | |||||||||||||||
| Stockholders’ equity |
419.2 | 366.2 | 344.5 | 278.5 | 248.5 | |||||||||||||||
| (1) | Working capital means total current assets less total current liabilities |
| (2) | Other long term obligations include unrecognized tax benefits, retirement benefits, capital leases obligation, deferred rent, unrealized losses on effective cash flow hedges and other long term liabilities. |
43
Table of Contents
| ITEM 7. | Management’s Discussion and Analysis of Financial Condition and Results of Operations |
You should read the following discussion in connection with our consolidated financial statements and the related notes included elsewhere in this Annual Report on Form 10-K. Some of the statements in the following discussion are forward looking statements. See “—Forward Looking Statements.” Dollar amounts within Item 7 are presented as actual dollar amounts.
Forward Looking Statements
This Annual Report on Form 10-K contains forward looking statements. You should not place undue reliance on these statements because they are subject to numerous uncertainties and factors relating to our operations and business environment, all of which are difficult to predict and many of which are beyond our control. These statements often include words such as “may,” “will,” “should,” “believe,” “expect,” “anticipate,” “intend,” “plan,” “estimate” or similar expressions. These statements are based on assumptions that we have made in light of our experience in the industry as well as our perceptions of historical trends, current conditions, expected future developments and other factors we believe are appropriate under the circumstances. As you read and consider this Annual Report on Form 10-K, you should understand that these statements are not guarantees of performance or results. They involve known and unknown risks, uncertainties and assumptions. Although we believe that these forward looking statements are based on reasonable assumptions, you should be aware that many factors could affect our actual financial results or results of operations and could cause actual results to differ materially from those in the forward looking statements. These factors include but are not limited to:
| • | our dependence on a limited number of clients in a limited number of industries; |
| • | worldwide political, economic or business conditions; |
| • | negative public reaction in the U.S. or elsewhere to offshore outsourcing; |
| • | fluctuations in our earnings; |
| • | our ability to attract and retain clients; |
| • | our ability to successfully consummate or integrate strategic acquisitions; |
| • | restrictions on immigration; |
| • | our ability to hire and retain enough sufficiently trained employees to support our operations; |
| • | our ability to grow our business or effectively manage growth and international operations; |
| • | increasing competition in our industry; |
| • | telecommunications or technology disruptions; |
| • | our ability to withstand the loss of a significant customer and to effectively and efficiently manage any disentanglement relationships |
| • | regulatory, legislative and judicial developments, including changes to or the withdrawal of governmental fiscal incentives; |
| • | technological innovation; |
| • | political or economic instability in the geographies in which we operate; |
| • | unauthorized disclosure of sensitive or confidential client and customer data; and |
| • | adverse outcome of our disputes with the Indian tax authorities. |
These and other factors are more fully discussed elsewhere in this Annual Report on Form 10-K. These and other risks could cause actual results to differ materially from those implied by forward looking statements in this Annual Report on Form 10-K.
The forward looking statements made by us in this Annual Report on Form 10-K, or elsewhere, speaks only as of the date on which they were made. New risks and uncertainties come up from time to time, and it is
44
Table of Contents
impossible for us to predict these events or how they may affect us. We have no obligation to update any forward looking statements in this Annual Report on Form 10-K after the date of this Annual Report on Form 10-K, except as required by federal securities laws.
Executive Overview
We are a leading provider of business process solutions to Fortune 500 and Global 2000 companies. Working as a strategic partner, we help our clients simplify and streamline business operations, manage compliance, create new channels for growth, and better adapt to change. Our solutions integrate operations management with analytics and business transformation to deliver actionable business insights and long-term business impact. We help shape our clients’ operating environments through process and technology interventions and analytics driven insights into business performance with the goal of increasing quality and productivity while improving risk management and control.
We changed our reporting segments nomenclature in 2014 to Operations Management (previously called Outsourcing Services) and Analytics and Business Transformation (previously called Transformation Services) in order to more accurately reflect the changing nature of our engagements with our clients. For comparability with our prior periods, the business composition of each segment remains unchanged.
Our global delivery network spreads across the United States, Europe and Asia. We operate nineteen operations centers in India, six operations centers in the U.S., five operations centers in the Philippines and one operations center in each of Bulgaria, Romania and the Czech Republic. In addition to these operations centers, we acquired multiple regional offices in the U.S. as part of our acquisitions of Blue Slate Solutions, LLC (“Blue Slate”) and Overland Holdings, Inc. (“Overland”) during the year ended December 31, 2014.
On July 1, 2014, we acquired Blue Slate. Prior to its acquisition, Blue Slate was a business process management (“BPM”) and technology solutions company that specializes in transforming operations through business process automation, use of innovative technologies, data integration and analytics. Blue Slate helps clients achieve large productivity improvements, develop an agile and cost-effective operating model, enhance customer satisfaction and deliver measurable return on their investments.
On October 24, 2014, we acquired Overland. Prior to its acquisition, Overland specialized in providing premium audit services, commercial and residential underwriting surveys and loss control services to more than 300 property and casualty (“P&C”) insurers using a BPaaS model. Overland offers services including physical audit, telephone audit, and government inspection and has developed an automated premium audit solution Auditstream®. Overland also offers survey products and services to homeowners and commercial insurance carriers through Castle High Value Surveys®.
Revenues
On November 1, 2013, we received a notice of termination from The Travelers Indemnity Company (“Travelers”) under the Professional Services Agreement, dated as of March 7, 2006, between us and Travelers (as amended from time to time, the “Services Agreement”). Revenues from Travelers were $8.2 million and $46.2 million during the year ended December 31, 2014 and 2013, respectively. The reduction in revenues from Travelers during 2014 was due to $12.0 million related to certain services we used to provide to Travelers being transitioned away from us and we reimbursed Travelers for certain of their expenses incurred in connection with the termination (the “disentanglement costs”) of $26.3 million compared to $0.3 million in 2013.
For the year ended December 31, 2014, we had total revenues of $499.3 million (net of $26.3 million of reimbursement of disentanglement costs to Travelers) compared to total revenues of $478.5 million (net of $0.3 million of reimbursement of disentanglement costs to Travelers) for the year ended December 31, 2013, an increase of $20.8 million or 4.4%. Revenues from operations management services were $388.7 million (net of
45
Table of Contents
$26.3 million of reimbursement of disentanglement costs to Travelers) for the year ended December 31, 2014 compared to $395.0 million (net of $0.3 million of reimbursement of disentanglement costs to Travelers) for the year ended December 31, 2013. Revenues from analytics and business transformation services were $110.6 million for the year ended December 31, 2014 compared to $83.5 million for the year ended December 31, 2013.
We serve clients mainly in the U.S. and the U.K., with these two regions generating approximately 73.9% and 20.4%, respectively, of our total revenues for the year ended December 31, 2014 and approximately 73.8% and 19.4%, respectively, of our total revenues for the year ended December 31, 2013.
In the years ended December 31, 2014 and 2013, our total revenues from our top ten clients accounted for 50.3% and 57.9% of our total revenues, respectively. None of the clients accounted for more than 10% of our total revenues in the year ended December 31, 2014 and 2013. While we have reduced our revenue concentration with our top clients and are developing relationships with new clients to diversify our client base, we believe that the loss of any of our ten largest clients could have a material adverse effect on our financial performance.
We derived revenues from 26 and 22 new clients for our services in the years ended December 31, 2014 and 2013, respectively. Another two clients acquired during the year did not generate revenues in 2014 but are expected to start generating revenues from 2015.
Our Business
Our business is divided into two reporting segments: Operations Management (previously called Outsourcing Services) and Analytics and Business Transformation (previously called Transformation Services). Overland’s results are included in our Operations Management segment and Blue Slate’s results are included in our Analytics and Business Transformation segment. We market our services to our existing and prospective clients through our sales and client management teams, which are aligned by key industry vertical and cross-industry domains such as finance and accounting. Our sales and client management teams operate from the U.S. and Europe.
Operations Management: We provide our clients with a range of operations management solutions principally in the insurance, healthcare, utilities, banking and financial services, and travel, transportation and logistics sectors, as well as cross-industry operations management solutions, such as finance and accounting services.
Our operations management solutions typically involve the transfer to EXL of select business operations of a client such as claims processing, clinical operations, or financial transaction processing, after which we administer and manage the operations for our client on an ongoing basis. As part of this transfer, we hire and train employees to work at our operations centers on the relevant business operations, implement a process migration to these operations centers and then provide services either to the client or directly to the client’s customers. Each client contract has different terms based on the scope, deliverables and complexity of the engagement. The operations management solutions we provide to any of our clients (particularly under our general framework agreements), and the revenues and income that we derive from those services, may decline or vary as the type and quantity of services we provide under those contracts change over time, including as a result of a shift in the mix of products and services we provide. For most BPO engagements we enter into long-term agreements with our clients with typical initial terms ranging from three to eight years. These contracts also usually contain provisions permitting termination of the contract after a short notice period. Although these agreements provide us with a relatively predictable revenue base for a substantial portion of our business, the long selling cycle for our operations management solutions and the budget and approval processes of prospective clients make it difficult to predict the timing of new client acquisitions. Revenues under new client contracts also vary depending on when we complete the selling cycle and the implementation phase.
To the extent our client contracts do not contain provisions to the contrary, we bear the risk of inflation and fluctuations in currency exchange rates with respect to our contracts. We hedge a substantial portion of our Indian rupee/U.S. dollar, Philippine peso/U.S. dollar and U.S. dollar/ U.K. pound sterling foreign currency exposure.
46
Table of Contents
We have been observing a shift in industry pricing models toward transaction-based pricing, outcome-based pricing and other pricing models. We believe this trend will continue and we have begun to use transaction-based, outcome-based and other pricing models with some of our current clients and are seeking to move certain other clients from a billing rate model to a transaction-based or other pricing model. These transaction-based pricing models place the focus on operating efficiency in order to maintain our operating margins. In addition, we have also observed that prospective larger clients are entering into multi-vendor relationships with regard to their outsourcing needs. We believe that the trend toward multi-vendor relationships will continue. A multi-vendor relationship allows a client to seek more favorable pricing and other contract terms from each vendor, which can result in significantly reduced operating margins from the provision of services to such client for each vendor. To the extent our large clients expand their use of multi-vendor relationships and are able to extract more favorable contract terms from other vendors, our operating margins and revenues may be reduced with regard to such clients if we are required to modify the terms of our relationships with such clients.
Within our operations management solutions, we also offer software to provide BPaaS services for our insurance and healthcare clients. We have added these capabilities through acquisitions over the last few years. Depending on the software, the fees derived may be based on licenses, installation, support and maintenance, and/or recoveries from claims. We believe our proprietary software technology will be an important source of growth in the future as clients choose to transfer certain business functions to a third-party-owned technology provider.
As we increase our capabilities utilizing technology service platforms and other software-based services, we expect that revenues from such services will continue to grow in proportion to our total revenues. Revenues from annual maintenance and support contracts for our software platforms provide us with a relatively predictable revenue base and are generally recognized ratably over the terms of the contracts. New license sales and implementation projects have a long selling cycle and it is difficult to predict the timing of when such new contracts will be signed, which may lead to fluctuations in our revenues over the short term.
Analytics and Business Transformation: Our analytics and business transformation solutions include our Analytics, Operations Consulting, and Finance Transformation services. These services focus on improving our clients’ operating environments, whether or not they are managed by us, through cost reduction, additional insight for business forecasting, enhanced efficiency and productivity, improved effectiveness of business decisions and creation of an improved risk and control environment. We actively cross-sell and, where appropriate, integrate our Analytics and Business Transformation solutions with Operations Management as part of a comprehensive solution for our clients. Our Analytics solutions involve accessing and analyzing large volumes of data from multiple data sources to generate insights about past business performance or predict future business outcomes. In order to provide services, we leverage a large pool of analytics professionals and data scientists who deploy our proprietary analytics tools and methodologies to help clients better utilize their data to generate actionable business insights. These insights generated by our analytics tools, statistical models and data scientists assist clients in making quicker, more accurate and data-driven business decisions, which we believe leads to better business outcomes and tangible financial benefits.
Our analytics and business transformation solutions consist of both recurring and specific projects with contract terms generally not exceeding one to three years. These contracts also usually contain provisions permitting termination of the contract after a short notice period. The short-term nature and specificity of these projects could lead to further material fluctuations and uncertainties in the revenues generated from these businesses. Our analytics and business transformation services can be affected by variations in business cycles. We have experienced a significant increase in demand for our annuity-based analytics and business transformation solutions, with the majority of our revenue generated from engagements that are contracted for one- to three-year terms.
We anticipate that revenues from our analytics and business transformation services will grow as we expand our service offerings and client base, both organically and through acquisitions.
47
Table of Contents
Expenses
Cost of Revenues
Our cost of revenues primarily consists of:
| • | employee costs, which include salary, bonus and other compensation expenses; recruitment and training costs; employee insurance; transport and meals; rewards and recognition for certain employees; and non-cash stock compensation expense; and |
| • | costs relating to our facilities and communications network, which include telecommunication and IT costs; facilities and customer management support; operational expenses for our outsourcing centers; rent expenses; and travel and other billable costs to our clients. |
The most significant components of our cost of revenues are employee compensation, recruitment, training, transport, meals, rewards and recognition and employee insurance. Salary levels, employee turnover rates and our ability to efficiently manage and utilize our employees significantly affect our cost of revenues. Salary increases for most of our operations personnel are generally awarded each year effective April 1. Accordingly, employee costs are generally lower in the first quarter of each year compared to the rest of the year. We make every effort to manage employee and capacity utilization and continuously monitor service levels and staffing requirements. Although we generally have been able to reallocate our employees as client demand has fluctuated, a contract termination or significant reduction in work assigned to us by a major client could cause us to experience a higher-than-expected number of unassigned employees, which would increase our cost of revenues as a percentage of revenues until we are able to reduce or reallocate our headcount. A significant increase in the turnover rate among our employees, particularly among the highly skilled workforce needed to execute certain services, would increase our recruiting and training costs and decrease our operating efficiency, productivity and profit margins. In addition, cost of revenues also includes a non-cash amortization of stock compensation expense relating to our issuance of equity awards to employees directly involved in providing services to our clients.
We expect our cost of revenues to continue to increase as we continue to add professionals in our operating centers globally to service additional business and as wages continue to increase globally. In particular, we expect training costs to continue to increase as we continue to add staff to service new clients and provide existing staff with additional skill sets. There is significant competition for professionals with skills necessary to perform the services we offer to our clients. As our existing competitors continue to grow, and as new competitors enter the market, we expect competition for skilled professionals in each of these areas to continue to increase, with corresponding increases in our cost of revenues to reflect increased compensation levels for such professionals. However, a significant portion of our client contracts include inflation-based adjustments to our billing rates year over year which partially offset such increase in cost of revenues. See “Item 1A—Risk Factors—Employee wage increases may prevent us from sustaining our competitive advantage and may reduce our profit margin.”
Cost of revenues is also affected by our long selling cycle and implementation period for our operations management services, which require significant commitments of capital, resources and time by both our clients and us. Before committing to use our services, potential clients require us to expend substantial time and resources educating them as to the value of our services and assessing the feasibility of integrating our systems and processes with theirs. In addition, once a client engages us in a new contract, our cost of revenues may represent a higher percentage of revenues until the implementation phase for that contract, generally three to four months, is completed.
Selling, General and Administrative Expenses
Our general and administrative expenses are comprised of expenses relating to salaries and benefits (including stock based compensation) as well as cost related to recruitment, training and retention of senior management and other support personnel in enabling functions, legal and other professional fees, telecommunications, utilities, travel and other miscellaneous administrative costs. Our general and administrative
48
Table of Contents
costs as a percentage of revenues increased from 12.3% in 2013 to 13.1% in 2014. The increase is primarily due to lower revenues as a result of reimbursements of disentanglement costs to Travelers during the year ended December 31, 2014. We expect our general and administrative costs to increase as we continue to strengthen our support and enabling functions and invest in leadership development, performance management and training programs.
Selling and marketing expenses primarily consist of salaries and benefits (including stock based compensation) and other compensation expenses of sales and marketing and client management personnel, sales commission, travel and brand building, client events and conferences. Our selling and marketing cost as a percentage of revenues increased from 7.6% in 2013 to 7.9% in 2014. The increase is primarily due to lower revenues as a result of reimbursements of disentanglement costs to Travelers during the year ended December 31, 2014. We also expect that sales and marketing expenses will continue to increase as we invest in our sales and client management functions to better serve our clients and in our branding.
SG&A expenses also include acquisition-related costs, professional fees (which represent the costs of third party legal, tax, accounting and other advisors), bad debt allowance and non-cash amortization of stock compensation expenses related to our issuance of equity awards to senior management, members of our board of directors, other support personnel.
Depreciation and Amortization
Depreciation and amortization pertains to depreciation of our tangible assets, including network equipment, cabling, computers, office furniture and equipment, motor vehicles and leasehold improvements and amortization of intangible assets. As we add new facilities and expand our existing operations centers, we expect that depreciation expense will increase, reflecting additional investments in equipment such as desktop computers, servers and other infrastructure. We expect amortization of intangible assets to increase further as we pursue strategic relationships and acquisitions.
Foreign Exchange
Exchange Rates
We report our financial results in U.S. dollars. A significant portion of our total revenues, however, are earned in U.K. pounds sterling (20.4% and 19.4%, respectively, of our total revenues for the years ended December 31, 2014 and 2013) while a significant portion of our expenses are incurred and paid in Indian rupees (46.5% and 51.7%, respectively, of our total costs for the years ended December 31, 2014 and 2013) and the Philippine peso (11.7% and 9.3%, respectively, of our total costs for the years ended December 31, 2014 and 2013). The exchange rates among the Indian rupee, the Philippine peso, the U.K. pound sterling, Czech koruna and the U.S. dollar have changed substantially in recent years and may fluctuate substantially in the future as well. The results of our operations could be substantially impacted as the Indian rupee, the Philippine peso and the U.K. pound sterling appreciate or depreciate against the U.S. dollar. See Notes 2 and 7 to our consolidated financial statements and “Item 7A—Quantitative and Qualitative Disclosures about Market Risk—Foreign Currency Risk.”
Income Taxes
We are subject to income taxes in the United States and other foreign jurisdictions. Our tax expense and cash tax liability in the future could be adversely affected by various factors, including, but not limited to, changes in tax laws, regulations, accounting principles or interpretations and the potential adverse outcome of tax examinations. Changes in the valuation of deferred tax assets and liabilities, which may result from a decline in our profitability or changes in tax rates or legislation, could have a material adverse effect on our tax expense.
49
Table of Contents
Under the Indian Income Tax Act, 1961, our operations centers in India, from which we derive a significant portion of our revenues, benefitted through March 31, 2011 from a ten-year holiday from Indian corporate income taxes in respect of their export profits under the Software Technology Parks of India (“STPI”) Scheme. In the absence of this tax holiday, income derived from our Indian operations is taxed up to the maximum tax rate generally applicable to Indian enterprises, which, as of December 31, 2014, was 33.99%.
During the last five years, we either established or acquired new centers that are eligible for tax benefits under the Special Economic Zones Act (the “SEZ Act”). The SEZ Act introduced a 15-year tax holiday scheme for operations established in designated special economic zones (“SEZs”). Under the SEZ Act, qualifying operations are eligible for a deduction from taxable income equal to (i) 100% of their export profits derived for the first five years from the commencement of operations; (ii) 50% of such export profits for the next five years; and (iii) 50% of the export profits for a further five years, subject to satisfying certain capital investment requirements. The SEZ Act provides, among other restrictions, that this holiday is not available to operations formed by splitting up or reconstructing existing operations or transferring existing plant and equipment (beyond a prescribed limit) to new SEZ locations. We anticipate establishing additional operations centers in SEZs or other tax advantaged locations in the future.
We also benefit from a corporate tax holiday in the Philippines for our operations centers established there over the last six years. The tax holiday expired for one of our centers in 2014 and will expire over the next few years for other centers, which may lead to an increase in our overall tax rate. Following the expiry of the tax exemption, income generated from centers in Philippines will be taxed at the prevailing annual tax rate, which as of December 31, 2014 was 5% of the gross income.
We recognize deferred tax assets and liabilities for temporary differences between the financial statement carrying amounts of existing assets and liabilities and their respective tax bases and operating loss carry forwards. We determine if a valuation allowance is required or not on the basis of an assessment of whether it is more likely than not that a deferred tax asset will be realized.
Critical Accounting Policies and Estimates
The discussion and analysis of our financial condition and results of operations are based upon the financial statements included in this Annual Report on Form 10-K, which have been prepared in accordance with generally accepted accounting principles in the U.S (“US GAAP”). The notes to our consolidated financial statements contain a summary of our significant accounting policies. We consider the policies discussed below to be critical to an understanding of our consolidated financial statements, as their application places the most significant demands on management’s judgment regarding matters that are inherently uncertain. These policies include revenue recognition, estimating tax liabilities, stock-based compensation, goodwill, intangibles and long-lived assets, derivative instruments and assets and obligations related to employee benefit plans. These accounting policies and the associated risks are set out below. Future events may not develop exactly as forecast and estimates routinely require adjustment.
Revenue Recognition
We derive our revenues from operations management and analytics and business transformation services. Revenues from operations management are recognized primarily on a time-and-material, cost-plus, transaction based and outcome-based pricing; revenues from analytics and business transformation services are recognized primarily on a time-and-material, fixed price or contingent fee basis. The services provided within our operations management and analytics and business transformation services contracts generally contain one unit of accounting, except the software and related services contracts involving implementation services and post contract maintenance services. In such multiple element arrangements, revenue is allocated to maintenance based the price charged when that element is sold separately (vendor specific objective evidence or “VSOE”). Revenues are recognized under our contracts generally when four basic criteria are met; persuasive evidence of an arrangement exists, the sales price is fixed or determinable, services have been performed and collection of amounts billed is reasonably assured.
50
Table of Contents
Revenues under time-and-material, transaction-based and outcome-based contracts are recognized as the services are performed. Revenues are recognized on cost-plus contracts on the basis of contractually agreed direct and indirect costs incurred on a client contract plus an agreed-upon profit markup. Such revenues are recognized as the related services are provided in accordance with the client contract. When the terms of the client contract specify service level parameters that must be met (such as turnaround time or accuracy), we monitor such service level parameters to determine if any service credits or penalties have been incurred. Revenues are recognized net of any service credits that are due to a client.
Revenues for our fixed-price analytics and business transformation services contracts are recognized using the proportional performance method when the pattern of performance under the contracts can be reasonably determined. We estimate the proportional performance of a contract by comparing the actual number of hours or days worked to the estimated total number of hours or days required to complete each engagement. The use of the proportional performance method requires significant judgment relative to estimating the number of hours or days required to complete the contracted scope of work, including assumptions and estimates relative to the length of time to complete the project and the nature and complexity of the work to be performed. We regularly monitor our estimates for completion of a project and record changes in the period in which a change in an estimate is determined. If a change in an estimate results in a projected loss on a project, such loss is recognized in the period in which it is first identified.
Our software and related services contracts generally contain software license, related services and maintenance elements. Maintenance revenues are generally recognized on a straight-line basis over the contract term as they are separable and have VSOE. Services related to software licenses are evaluated to determine whether those services are significant or essential to the functionality of the software. When services are not considered essential, software license revenues and the related services are considered as one unit of accounting and recognized on a proportional performance basis or ratably as the services are performed. When services are significant or considered essential, revenues related to license fee and services are recognized as the services are performed using the percentage of completion method of accounting, under which the total value of revenue is recognized on the basis of the percentage that each contract’s total labor hours to date bears to the total expected labor hours (input method).
We accrue revenues for services rendered between the last billing date and the balance sheet date. Accordingly, our accounts receivable include amounts for services that we have performed and for which an invoice has not yet been issued to the client. These are included in accounts receivable on our consolidated balance sheet and the amounts are disclosed in the notes to our consolidated financial statements.
Goodwill, Intangible Assets and Long-lived Assets
The purchase method of accounting is used for all business combinations. We account for our business combinations by recognizing the identifiable tangible and intangible assets and liabilities assumed, and non-controlling interest in the acquired business, measured at their acquisition date fair values. All assets and liabilities of the acquired business including goodwill are assigned to reporting units. Acquisition related costs are expensed as incurred under SG&A expenses. We evaluate goodwill for impairment at least annually, or as circumstances warrant. When determining the fair value of our reporting units, we utilize various assumptions, including projections of future cash flows. Any adverse changes in key assumptions about our businesses and their prospects or an adverse change in market conditions may cause a change in the estimation of fair value and could result in an impairment charge.
We review long-lived assets and certain identifiable intangibles for impairment whenever events or changes in circumstances indicate that the carrying amount of an asset may not be recoverable. In general, we will recognize an impairment loss when the sum of undiscounted expected future cash flows is less than the carrying amount of such asset. The estimate of undiscounted cash flows and the fair value of assets require several assumptions and estimates like the weighted average cost of capital, discount rates, risk-free rates, market rate of
51
Table of Contents
return and risk premiums and can be affected by a variety of factors, including external factors such as industry and economic trends, and internal factors such as changes in our business strategy and our internal forecasts. Although we believe the historical assumptions and estimates we have made are reasonable and appropriate, different assumptions and estimates could materially impact our reported financial results.
Stock-based Compensation
Under the fair value recognition provisions of ASC topic 718, “Compensation—Stock Compensation” (“ASC No. 718”), cost is measured at the grant date, based on the fair value of the award and is amortized on a straight-line basis over the requisite service periods of the awards, which is generally the vesting periods. Determining the fair value of stock-based awards at the grant date requires significant judgment, including estimating the expected term over which the stock awards will be outstanding before they are exercised, the expected volatility of our stock and the number of stock-based awards that are expected to be forfeited. In order to determine the estimated period of time that we expect employees to hold their share-based options, we have used data on the historical exercise pattern of employees. We use the historical volatility of our common stock and the volatility of stocks of our comparative companies in order to estimate future share price trends. We use historical data to estimate pre-vesting option forfeitures and record stock-based compensation expense only for those awards that are expected to vest. The risk-free interest rate that we use in the option valuation model is based on U.S. treasury zero-coupon bonds with a remaining term similar to the expected term of the options. We do not anticipate paying any cash dividends in the foreseeable future and therefore use an expected dividend yield of zero in the option valuation model. If the actual forfeiture rate differs significantly from our estimates, our stock-based compensation expense and our results of operations could be materially impacted.
On February 13, 2014, the Compensation Committee of the Board of Directors of the Company approved the program allowing for the grant of performance-based restricted stock units (“PRSUs”) to executive officers and other specified employees under its existing 2006 Omnibus Award Plan.
Under this program, 50% of the PRSUs will cliff vest at the end of a three-year period based on a revenue target for 2016 (“PUs”). The other 50% shall be based on a market condition (“MUs”) that is contingent on meeting or exceeding the total shareholder return relative to a group of peer companies specified under the program, measured over a three-year performance period. The award recipient may earn up to two hundred percent (200%) of the PRSUs granted based on the actual performance for both kinds of PRSUs.
The fair value of each PU was determined based on the market price of one common share of the Company on the date of grant. The grant date fair value for the MUs was determined using a Monte Carlo simulation model.
The Monte-Carlo simulation model simulates a range of possible future stock prices and estimates the probabilities of the potential payouts. This model also incorporates the following ranges of assumptions:
| • | The historical volatilities are used over the most recent three-year period for the components of the peer group. |
| • | The risk-free interest rate is based on the U.S. Treasury rate assumption commensurate with the three-year performance period. |
| • | Since the plan stipulates that the awards are based upon the total shareholders’ return (the “TSR”) of the Company and the components of the peer group, it is assumed that the dividends get reinvested in the issuing entity on a continuous basis. |
| • | The correlation coefficients are used to model the way in which each entity tends to move in relation to each other are based upon the price data used to calculate the historical volatilities. |
52
Table of Contents
Derivative Instruments and Hedging Activities
In the normal course of business, we actively look to mitigate the exposure of foreign currency market risk by entering into various hedging arrangements, authorized under our policies, with counterparties that are highly rated financial institutions. Our primary exchange rate exposure is with the U.K. pound sterling, the Philippines peso and the Indian rupee. We also have exposure in Czech koruna and other local currencies where we operate. We use derivative instruments for the purpose of mitigating the underlying exposure from foreign currency fluctuation risks associated with forecasted transactions denominated in certain foreign currencies and to minimize earnings and cash flow volatility associated with the changes in foreign currency exchange rates and not for speculative trading purposes.
We hedge anticipated transactions that are subject to foreign exchange exposure with foreign currency exchange contracts that qualify as cash flow hedges. Changes in the fair value of these cash flow hedges which are deemed effective are deferred and recorded as a component of accumulated other comprehensive income/(loss), net of tax until the hedged transactions occur and are then recognized in the consolidated statements of income. Changes in the fair value of cash flow hedges deemed ineffective are recognized in the consolidated statement of income and are included in foreign exchange gain/(loss).
We also use derivatives consisting of foreign currency exchange contracts to economically hedge intercompany balances and other monetary assets or liabilities denominated in currencies other than the functional currency. Changes in the fair value of these derivatives are recognized in the consolidated statements of income and are included in foreign exchange gain/(loss).
We value our derivatives based on market observable inputs including both forward and spot prices for currencies. Derivative assets and liabilities included in Level 2 primarily represent foreign currency forward contracts. The quotes are taken primarily from independent sources, including highly rated financial institutions.
We evaluate hedge effectiveness of cash flow hedges at the time a contract is entered into as well as on an ongoing basis. If during this time a contract is deemed ineffective, the change in the fair value is recorded in the consolidated statements of income and is included in foreign exchange gain/(loss). For hedge relationships that are discontinued because the forecasted transaction is not expected to occur by the end of the originally specified period, any related derivative amounts recorded in equity are reclassified to earnings.
Income Taxes
We utilize the asset and liability method of accounting for income taxes. Under this method, income tax expense is recognized for the amount of taxes payable or refundable for the current year. In addition, deferred tax assets and liabilities are recognized in respect of future tax consequences attributable to differences between the financial statement carrying amounts of existing assets and liabilities and their tax bases and operating losses carried forward, if any. Deferred tax assets and liabilities are measured using the anticipated tax rates for the years in which such temporary differences are expected to be recovered or settled. We recognize the effect of a change in tax rates on deferred tax assets and liabilities during the period in which the new tax rate was enacted or the change in tax status was filed or approved. Deferred tax assets are recognized in full, subject to a valuation allowance that reduces the amount recognized to that which is more likely than not to be realized. In assessing the likelihood of realization, we consider estimates of future taxable income. With respect to any entity that benefits from a corporate tax holiday, deferred tax assets or liabilities for existing temporary differences are recorded only to the extent such temporary differences are expected to reverse following the expiration of the tax holiday.
We also evaluate potential exposures related to tax contingencies or claims made by the tax authorities in various jurisdictions in order to determine whether a reserve may be required. A reserve is recorded if we believe that a loss is more likely than not to occur and if the amount of such loss can be reasonably estimated. Such reserves are based on estimates and, consequently, are subject to changing facts and circumstances, including the progress of ongoing audits, changes in case law and the passage of new legislation. We believe that we have established adequate reserves to cover any current tax assessments.
53
Table of Contents
We generally anticipate that we will indefinitely reinvest the undistributed earnings of our foreign subsidiaries. Accordingly, we do not accrue any material income, distribution or withholding taxes that would otherwise arise if such earnings were repatriated in a taxable manner.
We employ a two-step process for recognizing and measuring uncertain tax positions. The first step is to evaluate the tax position for recognition by determining, based on the technical merits, that the position will, more likely than not, be sustained upon examination. The second step is to measure the tax benefit as the largest amount of the tax benefit that has a greater than 50% likelihood of being realized upon settlement. Our income tax expense also takes into account any interest or penalties related to unrecognized tax benefits.
Employee Benefits
We provide our employees in India and the Philippines with benefits under a defined benefit plan, which we refer to as the Gratuity Plan. The Gratuity Plan provides a lump sum payment to vested employees on retirement or on termination of employment in an amount based on the respective employee’s salary and years of employment with us. We determine our liability under the Gratuity Plan by actuarial valuation using the projected unit credit method. Under this method, we determine our liability based upon the discounted value of salary increases until the date of separation arising from retirement, death, resignation or other termination of services. Critical assumptions used in measuring the plan expense and projected liability under the projected unit credit method include the discount rate, expected return on assets and the expected increase in the compensation rates. We evaluate these critical assumptions at least annually. If actual results differ significantly from our estimates, our gratuity expense and our results of operations could be materially impacted.
Results of Operations
The following table summarizes our results of operations for the years ended December 31, 2014, 2013 and 2012:
| Year ended December 31, | ||||||||||||
| 2014 | 2013 | 2012 | ||||||||||
| (dollars in millions) | ||||||||||||
| Revenues, net |
$ | 499.3 | $ | 478.5 | $ | 442.9 | ||||||
| Cost of revenues (exclusive of depreciation and amortization) |
332.6 | 291.0 | 271.9 | |||||||||
|
|
|
|
|
|
|
|||||||
| Gross profit |
166.7 | 187.5 | 171.0 | |||||||||
|
|
|
|
|
|
|
|||||||
| Operating expenses: |
||||||||||||
| General and administrative expenses |
65.4 | 58.8 | 57.2 | |||||||||
| Selling and marketing expenses |
39.3 | 36.4 | 31.0 | |||||||||
| Depreciation and amortization expenses |
28.0 | 24.9 | 25.6 | |||||||||
|
|
|
|
|
|
|
|||||||
| Total operating expenses |
132.7 | 120.1 | 113.8 | |||||||||
|
|
|
|
|
|
|
|||||||
| Income from operations |
34.0 | 67.4 | 57.2 | |||||||||
| Other income/(expense): |
||||||||||||
| Foreign exchange loss |
— | (5.0 | ) | (2.5 | ) | |||||||
| Interest and other income |
3.6 | 2.6 | 2.0 | |||||||||
|
|
|
|
|
|
|
|||||||
| Income before income taxes |
37.6 | 65.0 | 56.7 | |||||||||
| Income tax expense |
5.2 | 16.9 | 14.9 | |||||||||
|
|
|
|
|
|
|
|||||||
| Net income |
$ | 32.4 | $ | 48.1 | $ | 41.8 | ||||||
|
|
|
|
|
|
|
|||||||
54
Table of Contents
Year Ended December 31, 2014 Compared to Year Ended December 31, 2013
Revenues
| Year ended December 31, | Percentage change |
|||||||||||||||
| 2014 | 2013 | Change | ||||||||||||||
| (dollars in millions) | ||||||||||||||||
| Operations Management |
$ | 388.7 | $ | 395.0 | $ | (6.3 | ) | -1.6 | % | |||||||
| Analytics and Business Transformation |
110.6 | 83.5 | 27.1 | 32.5 | % | |||||||||||
|
|
|
|
|
|
|
|
|
|||||||||
| Total revenues, net |
$ | 499.3 | $ | 478.5 | $ | 20.8 | 4.4 | % | ||||||||
|
|
|
|
|
|
|
|
|
|||||||||
The decrease in revenues from our operations management services of $6.3 million was primarily due to the decrease in revenues from Travelers of $36.4 million ($26.0 million due to the reimbursement of disentanglement costs and $10.4 million due to certain services being transitioned away throughout 2014) during the year ended December 31, 2014 compared to the year ended December 31, 2013, and $4.6 million due to net impact of depreciation of the Indian rupee and appreciation of the U.K. pound sterling against the U.S. dollar during the year ended December 31, 2014 compared to the year ended December 31, 2013. This decrease was offset by an increase in revenues from the Overland acquisition aggregating to $12.2 million and net volume increases from our existing and new clients of $22.5 million.
The increase in revenues from our analytics and business transformation services of $27.1 million was primarily driven by an increase in revenues of $21.4 million in our recurring and project-based engagements in analytics and an increase in revenues of $7.3 million from our finance transformation and operations consulting services, including $4.4 million from the Blue Slate acquisition. This increase was offset by a decrease in revenues from Travelers of $1.6 million due to services being transitioned away in 2014. Revenues from new clients for analytics and business transformation services were $6.6 million and $3.0 million during the year ended December 31, 2014 and 2013, respectively.
Cost of Revenues
| Year ended December 31, | Percentage change |
|||||||||||||||
| 2014 | 2013 | Change | ||||||||||||||
| (dollars in millions) | ||||||||||||||||
| Revenues, net |
$ | 499.3 | $ | 478.5 | $ | 20.8 | 4.4 | % | ||||||||
| Cost of revenues |
332.6 | 291.0 | 41.6 | 14.3 | % | |||||||||||
|
|
|
|
|
|
|
|
|
|||||||||
| Gross profit |
$ | 166.7 | $ | 187.5 | $ | (20.8 | ) | -11.1 | % | |||||||
|
|
|
|
|
|
|
|
|
|||||||||
| As a percentage of revenues |
33.4 | % | 39.2 | % | ||||||||||||
The increase in cost of revenues was primarily due to an increase in employee-related costs of $40.1 million (including $10.5 million of employee-related costs related to the Overland and Blue Slate acquisitions). The increase of $29.6 million in employee-related cost is due to annual wage increments and an increase in our average headcount of personnel directly involved in providing services to our clients. We also experienced an increase in facilities, technology and other operating expenses of $8.8 million (including $1.6 million related to the Overland and Blue Slate acquisitions) in connection with our new operations centers in India and the Philippines and to support business growth. Cost of revenues further increased by $1.0 million due to increase in reimbursable expenses, resulting in corresponding increase in revenues. The increase was partially offset by $8.3 million due to the impact of depreciation of the Indian rupee and the Philippines peso against the U.S. dollar during the year ended December 31, 2014 compared to the year ended December 31, 2013. Cost of revenues as a percentage of revenues increased from 60.8% for the year ended December 31, 2013 to 66.6% for the year ended December 31, 2014.
55
Table of Contents
Gross Profit. Gross profit decreased by $20.8 million, or 11.1% from $187.5 million for the year ended December 31, 2013 to $166.7 million for the year ended December 31, 2014. The decrease was primarily due to the impact of reimbursement of disentanglement cost to Travelers of $26.3 million and higher employee-related costs, partially offset by higher revenues.
Selling, General and Administrative (“SG&A”) Expenses.
| Year ended December 31, | Percentage change |
|||||||||||||||
| 2014 | 2013 | Change | ||||||||||||||
| (dollars in millions) | ||||||||||||||||
| General and administrative expenses |
$ | 65.4 | $ | 58.8 | $ | 6.6 | 11.2 | % | ||||||||
| Selling and marketing expenses |
39.3 | 36.4 | 2.9 | 8.0 | % | |||||||||||
|
|
|
|
|
|
|
|
|
|||||||||
| Selling, general and administrative expenses |
$ | 104.7 | $ | 95.2 | $ | 9.5 | 10.0 | % | ||||||||
|
|
|
|
|
|
|
|
|
|||||||||
| As a percentage of revenues |
21.0 | % | 19.9 | % | ||||||||||||
The increase in SG&A expenses was primarily due to an increase in employee-related costs of $7.9 million (including $2.4 million of employee-related costs related to the Overland and Blue Slate acquisitions). The increase of $5.5 million in employee-related cost is due to annual wage increments and an increase in our average headcount. We also experienced an increase in our other SG&A expenses of $2.6 million (including $0.6 million related to the Overland and Blue Slate acquisitions). The increase in other SG&A was primarily due to an increase in legal and professional fees associated with our acquisitions and other strategic initiatives, increase in our facilities costs in connection with our new operations centers in India and the Philippines and other marketing related costs. This increase was partially offset by a decrease of $1.0 million due to the impact of depreciation of the Indian rupee and the Philippines peso against the U.S. dollar during the year ended December 31, 2014 compared to the year ended December 31, 2013.
Depreciation and Amortization.
| Year ended December 31, | Percentage change |
|||||||||||||||
| 2014 | 2013 | Change | ||||||||||||||
| (dollars in millions) | ||||||||||||||||
| Depreciation and amortization expense |
$ | 21.4 | $ | 18.6 | $ | 2.8 | 15.0 | % | ||||||||
| Intangible amortization expense |
6.6 | 6.3 | 0.3 | 5.1 | % | |||||||||||
|
|
|
|
|
|
|
|
|
|||||||||
| Depreciation and amortization expense |
$ | 28.0 | $ | 24.9 | $ | 3.1 | 12.5 | % | ||||||||
|
|
|
|
|
|
|
|
|
|||||||||
| As a percentage of revenues |
5.6 | % | 5.2 | % | ||||||||||||
Depreciation and amortization expense increased $3.1 million, or 12.5% from $24.9 million for the year ended December 31, 2013 to $28.0 million for the year ended December 31, 2014. The increase in amortization of intangibles of $0.3 million was primarily due to our Overland and Blue Slate acquisitions. Further, there was an increase in our depreciation expense of $3.5 million, primarily due to depreciation related to our new capital investments to support business growth, our new operations centers in India and the Philippines and $0.2 million related to the Overland and Blue Slate acquisitions. These increases were partially offset by a decrease of $0.7 million due to depreciation of the Indian rupee and the Philippine peso against the U.S. dollar during the year ended December 31, 2014.
Income from Operations. Income from operations decreased $33.4 million, or 49.5% from $67.4 million for the year ended December 31, 2013 to $34.0 million for the year ended December 31, 2014. As a percentage of revenues, income from operations decreased from 14.1% for the year ended December 31, 2013 to 6.8% for the year ended December 31, 2014. The decrease in income from operations as a percentage of revenues was primarily due to lower gross profit and higher SG&A expenses as a percentage of revenues during the year ended December 31, 2014 compared to the year ended December 31, 2013.
56
Table of Contents
Other Income/(Expense).
| Year ended December 31, | Percentage change |
|||||||||||||||
| 2014 | 2013 | Change | ||||||||||||||
| (dollars in millions) | ||||||||||||||||
| Foreign exchange loss |
$ | — | $ | (5.0 | ) | $ | 5.0 | 99.9 | % | |||||||
| Net interest and other income |
3.6 | 2.6 | 1.0 | 41.5 | % | |||||||||||
|
|
|
|
|
|
|
|
|
|||||||||
| Other income/(expense) |
$ | 3.6 | $ | (2.4 | ) | $ | 6.0 | 247.3 | % | |||||||
|
|
|
|
|
|
|
|
|
|||||||||
Net foreign exchange losses were attributable to movement of the U.S. dollar against the Indian rupee, the U.K. pound sterling and the Philippine peso during the year ended December 31, 2014. The average exchange rate of the Indian rupee against the U.S. dollar increased from 58.8 during the year ended December 31, 2013 to 61.1 during the year ended December 31, 2014. Increase in net interest and other income of $1.0 million, was primarily due to higher yield on investments as a result of higher average cash balances during the year ended December 31, 2014 compared to the year ended December 31, 2013.
Income Tax Expense. Income tax expense decreased from $16.9 million for the year ended December 31, 2013 to $5.2 million for the year ended December 31, 2014. The effective tax rate decreased from 26.0% for the year ended December 31, 2013 to 13.8% for the year ended December 31, 2014, primarily due to the reversal of an unrecognized tax benefit of $2.2 million and federal losses in the United States related to reimbursement of disentanglement costs to Travelers. The federal losses are expected to be carried back to the prior year tax return and result in a current year tax benefit of $1.9 million (refer to Note 13 to our consolidated financial statements for further details).
Net Income. Net income decreased from $48.1 million for the year ended December 31, 2013 to $32.4 million for the year ended December 31, 2014, primarily due to a decrease in income from operations of $33.4 million, partially offset by an increase in other income of $6.0 million and a decrease in income tax expense of $11.7 million. As a percentage of revenues, net income decreased from 10.1% for the year ended December 31, 2013 to 6.5% for the year ended December 31, 2014.
Year Ended December 31, 2013 Compared to Year Ended December 31, 2012
Revenues.
| Year ended December 31, | Percentage change |
|||||||||||||||
| 2013 | 2012 | Change | ||||||||||||||
| (dollars in millions) | ||||||||||||||||
| Operations Management |
$ | 395.0 | $ | 366.8 | $ | 28.2 | 7.7 | % | ||||||||
| Analytics and Business Transformation |
83.5 | 76.1 | 7.4 | 9.6 | % | |||||||||||
|
|
|
|
|
|
|
|
|
|||||||||
| Total revenues, net |
$ | 478.5 | $ | 442.9 | $ | 35.6 | 8.0 | % | ||||||||
|
|
|
|
|
|
|
|
|
|||||||||
The increase in revenues from operations management services of $28.2 million was primarily driven by increased revenues of $17.2 million from our acquisition of Landacorp Inc. (the “Landacorp acquisition”) in 2012 and net volume increases from existing and new clients aggregating to $22.8 million. These increases were partially offset by a decrease in revenues of $11.4 million, primarily due to the depreciation of the Indian rupee against the U.S. dollar during the year ended December 31, 2013 compared to the year ended December 31, 2012 and $0.3 million due to reimbursement to Travelers for certain of their expenses incurred in connection with the termination.
The increase in revenues from analytics and business transformation services was primarily due to an increase in our recurring and project-based engagements in our decision analytics and finance transformation services. Revenues from new clients for analytics and business transformation services were $3.0 million and $9.4 million during the year ended December 31, 2013 and 2012, respectively.
57
Table of Contents
Cost of Revenues.
| Year ended December 31, | Percentage change |
|||||||||||||||
| 2013 | 2012 | Change | ||||||||||||||
| (dollars in millions) | ||||||||||||||||
| Revenues, net |
$ | 478.5 | $ | 442.9 | $ | 35.6 | 8.0 | % | ||||||||
| Cost of revenues |
291.0 | 271.9 | 19.1 | 7.0 | % | |||||||||||
|
|
|
|
|
|
|
|
|
|||||||||
| Gross profit |
$ | 187.5 | $ | 171.0 | $ | 16.5 | 9.6 | % | ||||||||
|
|
|
|
|
|
|
|
|
|||||||||
| As a percentage of revenues |
39.2 | % | 38.6 | % | ||||||||||||
The increase in cost of revenues was primarily due to an increase in employee-related costs of $30.8 million as a result of an increase in the number of our personnel directly involved in providing services to our clients, including $5.9 million of employee-related costs related to the Landacorp acquisition. We also experienced an increase in facilities, technology and other operating expenses of $6.4 million (primarily due to the Landacorp acquisition and new operations centers to support business growth). These increases were partially offset by a decrease of $17.9 million due to the depreciation of the Indian rupee and the Philippine peso against the U.S. dollar during the year ended December 31, 2013 compared to the year ended December 31, 2012. Cost of revenues as a percentage of revenues decreased from 61.4% for the year ended December 31, 2012 to 60.8% for the year ended December 31, 2013.
Gross Profit. The increase in gross profit as a percentage of revenues was primarily due to higher gross margins from the Landacorp acquisition and depreciation of the Indian rupee and the Philippine peso against the U.S. dollar during the year ended December 31, 2013 compared to the year ended December 31, 2012. This increase was partially offset by the lower gross margins in our analytics and business transformation business segment due to lower utilization resulting from advance hiring for future growth and higher operating expenses.
Selling, General and Administrative (“SG&A”) Expenses.
| Year ended December 31, | Percentage change |
|||||||||||||||
| 2013 | 2012 | Change | ||||||||||||||
| (dollars in millions) | ||||||||||||||||
| General and administrative expenses |
$ | 58.8 | $ | 57.2 | $ | 1.6 | 2.8 | % | ||||||||
| Selling and marketing expenses |
36.4 | 31.0 | 5.4 | 17.3 | % | |||||||||||
|
|
|
|
|
|
|
|
|
|||||||||
| Selling, general and administrative expenses |
$ | 95.2 | $ | 88.2 | $ | 7.0 | 7.9 | % | ||||||||
|
|
|
|
|
|
|
|
|
|||||||||
| As a percentage of revenues |
19.9 | % | 19.9 | % | ||||||||||||
The increase in SG&A expenses was primarily due to an increase in employee-related costs of $9.9 million, including $5.0 million of employee-related costs related to the Landacorp acquisition. We also experienced an increase in other SG&A expenses primarily due to a write-off of an accounts receivable of $2.0 million acquired as part of the Landacorp acquisition. These increases were partially offset by the decrease of $1.8 million in legal and professional expenses incurred during 2012 related to the Landacorp acquisition and the legal entity rationalization project, the Business Employment Incentive Program grants of $0.7 million from the New Jersey government during the year ended December 31, 2013 and by a decrease of $2.7 million due to the depreciation of the Indian rupee and the Philippine peso against the U.S. dollar during the year ended December 31, 2013 compared to the year ended December 31, 2012.
58
Table of Contents
Depreciation and Amortization.
| Year ended December 31, | Percentage change |
|||||||||||||||
| 2013 | 2012 | Change | ||||||||||||||
| (dollars in millions) | ||||||||||||||||
| Depreciation and amortization expense |
$ | 18.6 | $ | 20.0 | $ | (1.4 | ) | -6.8 | % | |||||||
| Intangible amortization expense |
6.3 | 5.6 | 0.7 | 11.7 | % | |||||||||||
|
|
|
|
|
|
|
|
|
|||||||||
| Depreciation and amortization expense |
$ | 24.9 | $ | 25.6 | $ | (0.7 | ) | -2.8 | % | |||||||
|
|
|
|
|
|
|
|
|
|||||||||
| As a percentage of revenues |
5.2 | % | 5.8 | % | ||||||||||||
Depreciation and amortization expense marginally decreased $0.7 million, or 2.8% from $25.6 million for the year ended December 31, 2012 to $24.9 million for the year ended December 31, 2013. The decrease was primarily driven by a decrease of $1.5 million due to depreciation of the Indian rupee and the Philippine peso against the U.S. dollar during the year ended December 31, 2013 compared to the year ended December 31, 2012. This decrease was partially offset by an increase in amortization of acquisition-related intangibles of $0.7 million and depreciation related to the Landacorp acquisition of $0.2 million. As we add more operations centers, we expect that depreciation expense will increase to reflect the additional investment in equipment and operations centers necessary to meet our service requirements.
Income from Operations. Income from operations increased $10.2 million, or 17.8% from $57.2 million for the year ended December 31, 2012 to $67.4 million for the year ended December 31, 2013. As a percentage of revenues, income from operations increased from 12.9% for the year ended December 31, 2012 to 14.1% for the year ended December 31, 2013. The increase in income from operations as a percentage of revenues was primarily due to higher gross profit as a percentage of revenues.
Other Income/(Expense).
| Year ended December 31, | Percentage change |
|||||||||||||||
| 2013 | 2012 | Change | ||||||||||||||
| (dollars in millions) | ||||||||||||||||
| Foreign exchange losses |
$ | (5.0 | ) | $ | (2.5 | ) | $ | (2.5 | ) | -98.9 | % | |||||
| Net interest and other income |
2.6 | 2.0 | 0.6 | 27.5 | % | |||||||||||
|
|
|
|
|
|
|
|
|
|||||||||
| Other income/(expense) |
$ | (2.4 | ) | $ | (0.5 | ) | $ | (1.9 | ) | -377.1 | % | |||||
|
|
|
|
|
|
|
|
|
|||||||||
Net foreign exchange losses were attributable to movement of the U.S. dollar against the Indian rupee, U.K. pound sterling and the Philippine peso during the year ended December 31, 2013. The average exchange rate of the Indian rupee against the U.S. dollar increased from 53.40 during the year ended December 31, 2012 to 58.83 during the year ended December 31, 2013.
Income Tax Expense. Income tax expense increased from $14.9 million for the year ended December 31, 2012 to $16.9 million for the year ended December 31, 2013. The effective tax rate decreased marginally from 26.2% for the year ended December 31, 2012 to 26.0% for the year ended December 31, 2013. Refer to Note 13 to our consolidated financial statements for further details.
Net Income. Net income increased from $41.8 million for the year ended December 31, 2012 to $48.1 million for the year ended December 31, 2013, primarily due to an increase in operating income of $10.2 million, offset by a decrease in other income of $1.9 million and an increase in income tax expense of $2.0 million. As a percentage of revenues, net income increased from 9.4% for the year ended December 31, 2012 to 10.1% for the year ended December 31, 2013.
59
Table of Contents
Liquidity and Capital Resources
| Year ended December 31, | ||||||||
| 2014 | 2013 | |||||||
| (dollars in millions) | ||||||||
| Opening cash and cash equivalents |
$ | 148.1 | $ | 103.0 | ||||
| Net cash provided by operating activities |
66.7 | 82.8 | ||||||
| Net cash used for investing activities |
(88.3 | ) | (17.5 | ) | ||||
| Net cash provided by/(used for) financing activities |
52.9 | (15.7 | ) | |||||
| Effect of exchange rate changes |
(2.9 | ) | (4.5 | ) | ||||
|
|
|
|
|
|||||
| Closing cash and cash equivalents |
$ | 176.5 | $ | 148.1 | ||||
|
|
|
|
|
|||||
As of December 31, 2014 and 2013, we had $188.1 million and $154.1 million, respectively in cash, cash equivalents and short-term investments (including $110.5 million and $67.2 million, respectively held by our foreign subsidiaries). We do not intend to repatriate our overseas funds since our future growth partially depends upon continued infrastructure and technology investments, geographical expansions and acquisitions outside of the U.S. Therefore, we intend to reinvest the earnings generated outside of the U.S. If we were to repatriate our overseas funds, we would accrue and pay applicable taxes.
Operating Activities: Cash flows provided by operating activities decreased by $16.1 million from $82.8 million for the year ended December 31, 2013 to $66.7 million for the year ended December 31, 2014. Generally, factors that affect our earnings—including pricing, volume of services, costs and productivity—affect our cash flows provided by operations in a similar manner. However, while management of working capital, including timing of collections and payments affects operating results only indirectly, the impact on the working capital and cash flows provided by operating activities can be significant.
The decrease in cash flows provided by operations for the year ended December 31, 2014 is due to a decrease in net income adjusted for non-cash expenses by $9.7 million and net decrease in working capital by $6.4 million during the year ended December 31, 2014 compared to the year ended on December 31, 2013.
Investing Activities: Cash flows used for investing activities increased by $70.8 million from $17.5 million for the year ended December 31, 2013 to $88.3 million for the year ended December 31, 2014. The increase was due to net cash paid for the Overland and Blue Slate acquisitions of $51.9 million and $6.3 million, respectively during the year ended December 31, 2014 compared to $1.2 million related to the Landacorp acquisition during the year ended December 31, 2013. Further, there was an increase in capital expenditure by $11.8 million related to networking equipment, computers, software and our new operations centers in India and the Philippines and an increase in short-term investments of $2.0 million during the year ended December 31, 2014 compared to the year ended December 31, 2013.
Financing Activities: Cash flows provided by financing activities was $52.9 million during the year ended December 31, 2014 compared to cash flow used by financing activities of $15.7 million during the year ended December 31, 2014. The increase is primarily due to $50.0 million of borrowings under the Credit Agreement (as described below in “—Financing Arrangements”) and by a decrease in cash flow used for purchase of treasury stock of $18.3 million under the 2013 shares repurchase program during the year ended December 31, 2014 compared to the year ended December 31, 2013.
We expect to use cash from operating activities to maintain and expand our business. As we have focused on expanding our cash flow from operating activities we continue to make capital investments, primarily related to new facilities and capital expenditures associated with leasehold improvements to build our facilities and the purchase of telecommunications equipment and computer hardware and software in connection with managing client operations. We incurred $27.7 million of capital expenditures in the year ended December 31, 2014. We expect to incur capital expenditures of between $20 million to $25 million in the year 2015, primarily to meet our growth requirements, including additions to our facilities as well as investments in technology applications and infrastructure.
60
Table of Contents
In connection with any tax assessment orders that have been issued or may be issued against us or our subsidiaries, we may be required to deposit additional amounts with respect to such assessment orders (refer to Note 16 to our consolidated financial statements for further details). We anticipate that we will continue to rely upon cash from operating activities to finance our smaller acquisitions, capital expenditures and working capital needs. If we have significant growth through acquisitions, we may need to obtain additional financing.
Financing Arrangements (Debt Facility)
We and certain of our subsidiaries entered into a credit agreement with the lenders identified therein and JPMorgan Chase Bank, N.A., as administrative agent, that became effective as of October 27, 2014 (the “Credit Agreement”). The Credit Agreement provides for a $50 million revolving credit facility (the “Credit Facility”) including a letter of credit sub-facility, for a period of five years. We have an option to increase the commitments under the Credit Facility, subject to certain approvals and conditions as set forth in the Credit Agreement. The credit facility has a maturity date of October 24, 2019 and is voluntarily prepayable from time to time without premium or penalty. Depending on the type of borrowing, loans under the Credit Facility bear interest at a rate equal to the specified prime rate (alternate base rate) or adjusted LIBO rate, plus, in each case, an applicable margin. The applicable margin is tied to our leverage ratio and ranges from 0.25% to 0.75% per annum with respect to loans (“ABR Loans”) pegged to the specified prime rate, and 1.25% to 1.75% per annum on loans (“Eurodollar Loans”) pegged to the adjusted LIBO rate (such applicable margin, the “Applicable Rate”). The revolving credit commitments under the Credit Facility are subject to a commitment fee. The commitment fee is also tied to our leverage ratio, and ranges from 0.20% to 0.30% per annum on the average daily amount by which the aggregate revolving commitments exceed the sum of outstanding revolving loans and letter of credit obligations.
The Credit Facility is guaranteed by our domestic subsidiaries and material foreign subsidiaries. The obligations under the Credit Agreement are secured by all or substantially all of the assets of the borrower and its material domestic subsidiaries. The Credit Agreement contains certain covenants including a restriction on our indebtedness. The Company drew the full $50 million under the Credit Agreement during the year ended December 31, 2014 and, as of December 31, 2014; the borrowings under the Credit Agreement are shown as a long-term borrowing in the consolidated balance sheet. The credit facility carried an interest rate of 1.5% per annum during the year ended December 31, 2014.
Borrowings under the Credit Facility may be used for working capital and general corporate purposes of the Company and its subsidiaries.
Off-Balance Sheet Arrangements
As of December 31, 2014, we had no off-balance sheet arrangements or obligations.
Contractual Obligations
The following table sets forth our contractual obligations as of December 31, 2014:
| Payment Due by Period | ||||||||||||||||||||
| Less than | 1-3 | 4-5 | After | |||||||||||||||||
| 1 year | years | years | 5 years | Total | ||||||||||||||||
| (dollars in millions) | ||||||||||||||||||||
| Capital leases |
$ | 0.9 | $ | 0.6 | $ | 0.1 | $ | — | $ | 1.6 | ||||||||||
| Operating leases |
8.5 | 7.7 | 3.1 | 1.1 | 20.4 | |||||||||||||||
| Purchase obligations |
12.2 | — | — | — | 12.2 | |||||||||||||||
| Other obligations (a) |
2.1 | 3.5 | 2.8 | 3.6 | 12.0 | |||||||||||||||
|
|
|
|
|
|
|
|
|
|
|
|||||||||||
| Total contractual cash obligations (b) |
$ | 23.7 | $ | 11.8 | $ | 6.0 | $ | 4.7 | $ | 46.2 | ||||||||||
|
|
|
|
|
|
|
|
|
|
|
|||||||||||
| (a) | Represents estimated payments under the Gratuity Plan. |
| (b) | Excludes $2.8 million related to uncertain tax positions, since the extent of the amount and timing of payment is currently not reliably estimable or determinable. |
61
Table of Contents
Certain units of our Indian subsidiaries were established as 100% Export-Oriented units or under the “STPI” scheme promulgated by the Government of India. These units are exempt from customs, central excise duties, and levies on imported and indigenous capital goods, stores, and spares. We have undertaken to pay custom duties, service taxes, levies, and liquidated damages payable, if any, in respect of imported and indigenous capital goods, stores, and spares consumed duty free, in the event that certain terms and conditions are not fulfilled. We believe, however, that these units have in the past satisfied and will continue to satisfy the required conditions.
Our operations centers in the Philippines are registered with the “PEZA.” The registration provides us with certain fiscal incentives on the import of capital goods and requires that ExlService Philippines, Inc. (“Exl Philippines”) meet certain performance and investment criteria. We believe that these centers have in the past satisfied and will continue to satisfy the required criteria.
Recent Accounting Pronouncements
For a description of recent accounting pronouncements, see Note 2—“Recent Accounting Pronouncements” under Item 1—“Financial Statements” to our consolidated financial statements.
62
Table of Contents
| ITEM 7A. | Quantitative and Qualitative Disclosures About Market Risk |
General
Market risk is the loss of future earnings, fair values or future cash flows that may result from a change in the price of a financial instrument. The value of a financial instrument may change as a result of changes in the interest rates, foreign currency exchange rates, commodity prices, equity prices and other market changes that affect market risk sensitive instruments. Market risk is attributable to all market sensitive financial instruments including foreign currency receivables and payables.
Our exposure to market risk is a function of our expenses and revenue generating activities in foreign currencies. The objective of market risk management is to avoid excessive exposure of our earnings and equity to loss. We manage market risk through our treasury operations. Our senior management and our Board of Directors approve our treasury operations’ objectives and policies. The responsibilities of our treasury operations include management of cash resources, implementing hedging strategies for foreign currency exposures, borrowing strategies, if any, and ensuring compliance with market risk limits and policies.
Components of Market Risk
Foreign Currency Risk. Our exposure to market risk arises principally from exchange rate risk. Although substantially all of our revenues are denominated in U.S. dollars (73.9% in the year ended December 31, 2014) or U.K. pounds sterling (20.4% in the year ended December 31, 2014), a substantial portion of our expenses were incurred and paid in Indian rupees and Philippine peso (46.5% and 11.7%, respectively, in the year ended December 31, 2014). We also incur expenses in U.S. dollars, the Czech koruna and the currencies of the other countries in which we have operations. The exchange rates among the Indian rupee, the Philippine peso, U.K. pound sterling, Czech koruna and the U.S. dollar have changed substantially in recent years and may fluctuate substantially in the future.
Our exchange rate risk primarily arises from our foreign currency revenues, expenses incurred by our foreign subsidiaries and foreign currency accounts receivable and payable. Based upon our level of operations during the year ended December 31, 2014 and excluding any hedging arrangements that we had in place during that period, a 10% appreciation/depreciation in the Indian rupee against the U.S. dollar would have increased/decreased our revenues in the year ended December 31, 2014 by approximately $12.0 million and increased/decreased our expenses incurred and paid in Indian rupees by approximately $20.0 million, respectively.
We have sought to reduce the effect of the Indian rupee and the Philippine peso and certain other local currency exchange rate fluctuations on our operating results by purchasing forward foreign exchange contracts (“cash flow hedges”) to cover a substantial portion of our expected cash flows. Further, a significant number of our customer contracts include protection against foreign exchange rate fluctuations which minimizes the impact of volatility in the exchange rates on our operating results. Cash flow hedges with notional amounts of $218.0 million were outstanding as at December 31, 2014, with maturity periods of one to forty five-months, compared to $187.4 million outstanding as at December 31, 2013. These contracts must be settled on the day of maturity or may be cancelled subject to the receipts or payments of any gains or losses respectively, equal to the difference between the contract exchange rate and the market exchange rate on the date of cancellation. We use these instruments for hedging our future expected cash flows and not for speculative purposes. As such, we may not purchase adequate contracts to insulate ourselves from Indian rupee and Philippine peso foreign exchange currency risks. In addition, any such contracts may not perform adequately as a hedging mechanism. We may, in the future, adopt more active hedging policies, and have done so in the past.
We also enter into foreign currency forward contracts to economically hedge our intercompany balances and other monetary assets and liabilities denominated in currencies other than functional currencies. These derivatives do not qualify as fair value hedges under ASC topic 815, “Derivatives and Hedging” (“ASC No. 815”). Changes in the fair value of these derivatives are recognized in the consolidated statements of income and are included in foreign exchange loss.
63
Table of Contents
These derivative instruments do not subject us to material balance sheet risk due to exchange rate movements because gains and losses on the settlement of these derivatives are intended to offset revaluation losses and gains on the assets and liabilities being hedged. Forward exchange contracts with notional amounts of $58.0 million and GBP 10.9 million were outstanding at December 31, 2014 compared to $74.7 million and GBP 11.0 million outstanding at December 31, 2013. At December 31, 2014, the outstanding derivative instruments had maturities of 31 days or less.
Interest Rate Risk. As described in “Item 7. Management’s Discussion and Analysis of Financial Condition and Results of Operations,” on October 24, 2014 we entered into a Credit Agreement that provides for a $50 million revolving credit facility. Depending on the type of borrowing, loans under the Credit Agreement bear interest at a rate equal to the specified prime rate (alternate base rate) or adjusted LIBO rate, plus, in each case, an applicable margin. The applicable margin is tied to the Company’s leverage ratio and ranges from 0.25% to 0.75% per annum with respect to loans (“ABR Loans”) pegged to the specified prime rate, and 1.25% to 1.75% per annum on loans (“Eurodollar Loans”) pegged to the adjusted LIBO rate (such applicable margin, the “Applicable Rate”). The revolving credit commitments under the Credit Agreement are subject to a commitment fee. The commitment fee is also tied to the Company’s leverage ratio, and ranges from 0.20% to 0.30% per annum on the average daily amount by which the aggregate revolving commitments exceed the sum of outstanding revolving loans and letter of credit obligations
We have cash, cash equivalents and short-term investments totaling $188.1 million and $154.1 million at December 31, 2014 and 2013, respectively. These amounts were invested principally in a short-term investment portfolio primarily comprised of highly-rated mutual funds, money market accounts and time deposits. The cash and cash equivalents are held for potential acquisitions of complementary businesses or assets, working capital requirements and general corporate purposes. We do not enter into these investments for trading or speculative purposes. We believe that we have no material exposure to changes in the fair value of our investment portfolio as a result of changes in interest rates. The interest income from these funds are subject to fluctuations due to changes in interest rates. Declines in interest rates would reduce future investment income. A 50 basis points change in short term rates would impact our interest income for the year ended December 31, 2014 by approximately $0.3 million.
Credit Risk. As of December 31, 2014 and 2013, we have accounts receivable of $80.2 million and $76.1 million, respectively. We believe that our credit policies reflect normal industry terms and business risk. We do not anticipate non-performance by the counterparties and, accordingly, do not require collateral. Credit losses and write-offs of accounts receivable balances have historically not been material, except for a write-off of $2.0 million during the year ended December 31, 2013. No single client owed more than 10% of accounts receivable balance as on December 31, 2014 and 2013.
| ITEM 8. | Financial Statements and Supplementary Data |
The financial statements required to be filed pursuant to this Item 8 are appended to this Annual Report on Form 10-K. A list of the financial statements filed herewith is found at “Item 15. Exhibits and Financial Statement Schedules.”
| ITEM 9. | Changes in and Disagreement with Accountants on Accounting and Financial Disclosure |
None.
64
Table of Contents
| ITEM 9A. | Controls and Procedures |
Evaluation of Disclosure Controls and Procedures
The Company maintains disclosure controls and procedures that are designed to ensure that information required to be disclosed in the reports the Company files under the Exchange Act is recorded, processed, summarized and reported within the time periods specified in the SEC’s rules and forms, and that such information is accumulated and communicated to the Company’s management, including its Chief Executive Officer (“CEO”) and Chief Financial Officer (“CFO”), to allow timely decisions regarding required financial disclosure. In connection with the preparation of this Annual Report on Form 10-K, the Company’s management carried out an evaluation, under the supervision and with the participation of the CEO and CFO, of the effectiveness and operation of the Company’s disclosure controls and procedures as of December 31, 2014. Based upon that evaluation, the CEO and CFO have concluded that the Company’s disclosure controls, as of December 31, 2014, and procedures were effective.
Management’s Responsibility for Financial Statements
Responsibility for the objectivity, integrity and presentation of the accompanying financial statements and other financial information presented in this report rests with our management. The accompanying financial statements have been prepared in accordance with accounting principles generally accepted in the U.S. (“US GAAP”). The financial statements include amounts that are based on estimates and judgments which management believes are reasonable under the circumstances.
Ernst & Young LLP, an independent registered public accounting firm, is retained to audit the Company’s consolidated financial statements and the effectiveness of our internal control over financial reporting. Its accompanying reports are based on audits conducted in accordance with the standards of the Public Company Accounting Oversight Board.
The Audit Committee of the board of directors is composed solely of independent directors and is responsible for recommending to the Board of Directors the independent public accounting firm to be retained for the coming year. The Audit Committee meets regularly and privately with the independent public accountants, with the Company’s internal auditors and with management to review accounting, auditing, internal control and financial reporting matters.
Management’s Annual Report on Internal Control over Financial Reporting
Our management is responsible for establishing and maintaining adequate internal control over financial reporting as defined in Rule 13a-15(f) or 15d-15(f) promulgated under the Exchange Act. Those rules define internal control over financial reporting as a process designed to provide reasonable assurance regarding the reliability of financial reporting and the preparation of financial statements for external purposes in accordance with accounting principles generally accepted in the U.S. The Company’s internal control over financial reporting includes those policies and procedures that:
| • | pertain to the maintenance of records that, in reasonable detail, accurately and fairly reflect our transactions; |
| • | provide reasonable assurance that transactions are recorded as necessary to permit preparation of financial statements in accordance with accounting principles generally accepted in the U.S.; |
| • | provide reasonable assurance that receipts and expenditures are being made only in accordance with the authorization of our management and our board of directors; and |
| • | provide reasonable assurance regarding prevention or timely detection of unauthorized acquisition, use or disposition of our assets that could have a material effect on the consolidated financial statements. |
65
Table of Contents
Because of its inherent limitations, internal control over financial reporting may not prevent or detect misstatements. Also, projections of any evaluation of effectiveness to future periods are subject to the risk that controls may become inadequate because of changes in conditions, or that the degree of compliance with the policies or procedures may deteriorate.
Our management assessed the effectiveness of our internal control over financial reporting as of December 31, 2014. In making this assessment, management used the criteria described in “Internal Control—Integrated Framework” issued by the Committee of Sponsoring Organizations of the Treadway Commission (2013 Framework). Management’s assessment included an evaluation of the design of our internal control over financial reporting and testing of the operational effectiveness of its internal control over financial reporting. Management reviewed the results of its assessment with the Audit Committee of the board of directors. Based on this assessment and those criteria, management concluded that we maintained effective internal control over financial reporting as of December 31, 2014. See Ernst & Young LLP’s accompanying report on their audit of our internal controls over financial reporting.
Changes in Internal Control over Financial Reporting
During the three months ended December 31, 2014, there were no changes in our internal control over financial reporting (as defined in Rules 13a-15(f) and 15d-15(f) under the Exchange Act) that have materially affected, or are reasonably likely to materially affect, our internal control over financial reporting.
In making its assessment of the changes in internal control over financial reporting during the quarter ended December 31, 2014, our management excluded an evaluation of the disclosure controls and procedures of Overland which we acquired on October 24, 2014 and Blue Slate which we acquired on July 1, 2014 and constituted $79,282 thousands and $74,991 thousands of total and net assets, respectively as of December 31, 2014 and $16,624 thousands of revenues for the year then ended. See Note 5 to our consolidated financial statements for details of our acquisitions.
| ITEM 9B. | Other Information |
None.
66
Table of Contents
| ITEM 10. | Directors, Executive Officers and Corporate Governance |
Code of Ethics.
We have adopted a code of conduct and ethics that applies to all of our directors, officers and employees, including our principal executive officer, principal financial officer, principal accounting officer and persons performing similar functions. Our code of conduct and ethics can be found posted in the investor relations section on our website at http://ir.exlservice.com/governance.cfm. We intend to satisfy the disclosure requirement under Item 5.05 of Form 8-K regarding an amendment to, or waiver from, a provision of our code of conduct and ethics by posting such information on our website at the address and the location specified above.
The additional information required by this Item 10 will be set forth in the definitive proxy statement for our 2015 Annual Meeting of Stockholders (the “Proxy Statement”), including under the headings “Our Board of Directors”, “Our Executive Officers” and “Corporate Governance — Committees — Audit Committee”, “— Committees — Nominating and Governance Committee” and “— Section 16(a) Beneficial Ownership Reporting Compliance”, and is incorporated herein by reference. We intend to file the Proxy Statement with the SEC within 120 days after the fiscal year end of December 31, 2014.
| ITEM 11. | Executive Compensation |
We incorporate by reference the information responsive to this Item appearing in our Proxy Statement, including under the headings “Executive Compensation — Compensation Discussion and Analysis”, “— Compensation Committee Report”, “— Summary Compensation Table for Fiscal Year 2014”, “— Grants of Plan-Based Awards Table for Fiscal Year 2014”, “Outstanding Equity Awards at Fiscal 2014 Year-End”, “Option Exercises and Stock Vested During Fiscal Year 2014”, “— Pension Benefits for Fiscal Year 2014”, “— Potential Payments upon Termination or Change in Control at Fiscal 2014 Year-End”, “— Director Compensation for Fiscal Year 2014”, “— Risk and Compensation Policies” and “Corporate Governance — Compensation Committee Interlocks and Insider Participation”.
| ITEM 12. | Security Ownership of Certain Beneficial Owners and Management and Related Stockholder Matters |
We incorporate by reference the information responsive to this Item appearing in our Proxy Statement, including under the heading “Principal Stockholders”.
| ITEM 13. | Certain Relationships and Related Transactions, and Director Independence |
We incorporate by reference the information responsive to this Item appearing in our Proxy Statement, including under the headings “Certain Relationships and Related Person Transactions” and “Corporate Governance — Director Independence”.
| ITEM 14. | Principal Accountant Fees and Services |
We incorporate by reference the information responsive to this Item appearing in our Proxy Statement, including under the heading “Ratification of the Appointment of Independent Registered Public Accounting Firm — Audit and Non-Audit Fees.”
67
Table of Contents
| ITEM 15. | Exhibits and Financial Statement Schedules |
| (a) | 1. Financial Statements. |
The consolidated financial statements are listed under “Item 8. Financial Statements and Supplementary Data” of this Annual Report on Form 10-K.
2. Financial Statement Schedules.
Financial statement schedules as of December 31, 2014 and 2013, have been omitted since they are either not required, not material or the information is otherwise included in our consolidated financial statements or the notes to our consolidated financial statements.
3. Exhibits.
The Exhibits filed as part of this Annual Report on Form 10-K are listed on the Exhibit Index immediately preceding such Exhibits, which Exhibit Index is incorporated in this Annual Report on Form 10-K by reference.
| (b) | Exhibits. See Item 15(a)(3) above. |
| (c) | Financial Statement Schedules. See Item 15(a)(2) above. |
68
Table of Contents
Pursuant to the requirements of Section 13 or 15(d) of the Securities Exchange Act of 1934, as amended, the Registrant has duly caused this Annual Report on Form 10-K to be signed on its behalf by the undersigned hereunto duly authorized.
| Date: February 27, 2015 | EXLSERVICE HOLDINGS, INC. | |||
| By: | /S/ VISHAL CHHIBBAR | |||
| Vishal Chhibbar Chief Financial Officer (Duly Authorized Signatory, Principal Financial and Accounting Officer) | ||||
Pursuant to the requirements of the Securities Exchange Act of 1934, as amended, this Annual Report on Form 10-K has been signed below by the following persons on behalf of the Registrant and in the capacities and on the dates indicated.
| Signature |
Title |
Date | ||
| /S/ ROHIT KAPOOR Rohit Kapoor |
Chief Executive Officer, Vice-Chairman and Director (Principal Executive Officer) |
February 27, 2015 | ||
| /S/ GAREN K. STAGLIN Garen K. Staglin |
Chairman of the Board |
February 27, 2015 | ||
| /S/ VISHAL CHHIBBAR Vishal Chhibbar |
Chief Financial Officer (Principal Financial and Accounting Officer) |
February 27, 2015 | ||
| /S/ ANNE MINTO Anne Minto |
Director | February 27, 2015 | ||
| /S/ SOM MITTAL Som Mittal |
Director | February 27, 2015 | ||
| /S/ DAVID B. KELSO David B. Kelso |
Director | February 27, 2015 | ||
| /S/ CLYDE W. OSTLER Clyde W. Ostler |
Director | February 27, 2015 | ||
| /S/ DR. MOHANBIR SAWHNEY Dr. Mohanbir Sawhney |
Director | February 27, 2015 | ||
| /S/ DEBORAH KERR Deborah Kerr |
Director | February 27, 2015 | ||
69
Table of Contents
The following exhibits are being filed as part of this report or incorporated by reference as indicated therein:
| 2.1* | Merger Agreement, dated as of April 30, 2011, by and among ExlService Holdings, Inc., F&A BPO Merger Sub, Inc., Business Process Outsourcing, Inc. and Shareholder Representative Services LLC (incorporated by reference to Exhibit 2.1 of the Company’s Current Report on Form 8-K filed on June 6, 2011). | |
| 2.2 | Agreement and Plan of Merger, dated October 24, 2014, among ExlService.com, LLC, Heartland Acquisition Sub Corp., Overland Holdings, Inc., New Mountain Affiliated Investors, L.P., and New Mountain Partners, L.P., a New York limited partnership (incorporated by reference to Exhibit 2.1 to the Company’s Quarterly Report on Form 10-Q filed October 30, 2014). | |
| 3.1 | Amended and Restated Certificate of Incorporation of the Company (incorporated by reference to Exhibit 3.1 of the Company’s Current Report on Form 8-K filed on October 25, 2006). | |
| 3.2 | Third Amended and Restated By-laws of the Company (incorporated by reference to Exhibit 3.1 of the Company’s Current Report on Form 8-K filed on May 2, 2011). | |
| 4.1 | Specimen Stock Certificate (incorporated by reference to Exhibit 4.1 of Amendment 5 of the Company’s Registration Statement on Form S-1 (Registration No. 333-121001) filed on October 4, 2006). | |
| 4.2 | Registration Rights Agreement (incorporated by reference to Exhibit 4.1 of the Company’s Current Report on Form 8-K filed on October 25, 2006). | |
| 10.1 | Professional Services Agreement, dated March 7, 2006, between The Travelers Indemnity Company and ExlService Holdings, Inc. as amended by Amendment 3, effective January 1, 2009 (incorporated by reference to Exhibit 10.1 to the Company’s Annual Report on Form 10-K filed on March 16, 2010). | |
| 10.2+ | Employment Agreement, dated May 1, 2009, between exlservice.com (India) Private Limited and Vishal Chhibbar (incorporated by reference to Exhibit 10.2 to the Company’s Annual Report on Form 10-K filed on March 16, 2010). | |
| 10.3+ | Letter Agreement, effective June 1, 2009, between ExlService Holdings, Inc, and Vishal Chhibbar (incorporated by reference to Exhibit 10.3 to the Company’s Annual Report on Form 10-K filed on March 16, 2010). | |
| 10.4+ | Amended and Restated Employment and Non-Competition Agreement entered into by and among ExlService Holdings, Inc. and Vikram Talwar (incorporated by reference to Exhibit 10.10 to Annual Report on Form 10-K filed on March 16, 2009). | |
| 10.5+ | Amendment, effective June 2, 2010, to the Amended and Restated Employment and Non-Competition Agreement, dated December 16, 2008 between Vikram Talwar and ExlService Holdings, Inc. (incorporated by reference to Exhibit 10.1 to the Company’s Quarterly Report on Form 10-Q filed on August 9, 2010). | |
| 10.6+ | Summary of terms of compensation for Vikram Talwar (incorporated by reference to Exhibit 10.1 to the Company’s Quarterly Report on Form 10-Q filed on November 9, 2010). | |
| 10.7+ | Amended and Restated Employment and Non-Competition Agreement entered into by and among ExlService Holdings, Inc. and Rohit Kapoor (incorporated by reference to Exhibit 10.11 to the Company’s Annual Report on Form 10-K filed on March 16, 2009). | |
| 10.8+ | Amendment to the Amended and Restated Employment and Non-Competition Agreement entered into by and among ExlService Holdings, Inc. and Rohit Kapoor (incorporated by reference to Exhibit 10.7 to the Company’s Annual Report on Form 10-K filed on March 16, 2010). | |
70
Table of Contents
| 10.9+ | ExlService Holdings, Inc. 2003 India Employee Stock Option Plan (incorporated by reference to Exhibit 10.16 of Amendment 3 to the Company’s Registration Statement on Form S-1 (Registration No. 333-121001) filed on July 28, 2006). | |
| 10.10+ | ExlService Holdings, Inc. 2003 Stock Option Plan (incorporated by reference to Exhibit 10.18 of Amendment 3 to the Company’s Registration Statement on Form S-1 (Registration No. 333-121001) filed July 28, 2006). | |
| 10.11+ | ExlService Holdings, Inc. 2006 Omnibus Plan (incorporated by reference to Exhibit 10.20 of Amendment 3 to the Company’s Registration Statement on Form S-1 (Registration No. 333-121001) filed July 28, 2006). | |
| 10.12+ | ExlService Holdings, Inc. 2006 Omnibus India Subplan 1 (incorporated by reference to Exhibit 10.21 of Amendment 6 to the Company’s Registration Statement on Form S-1 (Registration No. 333-121001) filed October 17, 2006). | |
| 10.13+ | Form of Stock Option Agreement under the 2006 Omnibus India Subplan 1 (incorporated by reference to Exhibit 10.22 of Amendment 5 to the Company’s Registration Statement on Form S-1 (Registration No. 333-121001) filed October 4, 2006). | |
| 10.14+ | ExlService Holdings, Inc. Management Incentive Plan (incorporated by reference to Exhibit 10.23 of Amendment 5 to the Company’s Registration Statement on Form S-1 (Registration No. 333-121001) filed October 4, 2006). | |
| 10.15+ | Form of Restricted Stock Award Agreement under the 2006 Omnibus Award Plan (incorporated by reference to Exhibit 10.31 of Amendment 5 to the Company’s Registration Statement on Form S-1 (Registration No. 333-121001) filed October 4, 2006). | |
| 10.16+ | Form of Non-Qualified Stock Option Agreement under the 2006 Omnibus Award Plan (incorporated by reference to Exhibit 10.32 of Amendment 5 to the Company’s Registration Statement on Form S-1 (Registration No. 333-121001) filed October 4, 2006). | |
| 10.17+ | Form of Restricted Stock Award Agreement under the 2006 Omnibus India Subplan 1 (incorporated by reference to Exhibit 10.33 of Amendment 5 to the Company’s Registration Statement on Form S-1 (Registration No. 333-121001) filed October 4, 2006). | |
| 10.18+ | ExlService Holdings, Inc. 2006 Omnibus India Subplan 2 (incorporated by reference to Exhibit 10.38 of Amendment 6 to the Company’s Registration Statement on Form S-1 (Registration No. 333-121001) filed October 17, 2006). | |
| 10.19+ | Form of Non-Qualified Stock Option Agreement under the 2006 Omnibus India Subplan 2 (incorporated by reference to Exhibit 10.39 of Amendment 5 to the Company’s Registration Statement on Form S-1 (Registration No. 333-121001) filed October 4, 2006). | |
| 10.20+ | Form of Restricted Stock Award Agreement under the 2006 Omnibus India Subplan 2 (incorporated by reference to Exhibit 10.40 of Amendment 5 to the Company’s Registration Statement on Form S-1 (Registration No. 333-121001) filed October 4, 2006). | |
| 10.21+ | Restricted Stock Award Agreement between Vikram Talwar and the Company dated July 27, 2006 (incorporated by reference to Exhibit 10.41 of Amendment 5 to the Company’s Registration Statement on Form S-1 (Registration No. 333-121001) filed October 4, 2006). | |
| 10.22+ | Non-Qualified Stock Option Agreement between Rohit Kapoor and the Company dated July 27, 2006 (incorporated by reference to Exhibit 10.42 of Amendment 5 to the Company’s Registration Statement on Form S-1 (Registration No. 333-121001) filed October 4, 2006). | |
| 10.23+ | Amendment to ExlService Holdings, Inc. 2006 Omnibus Award Plan (incorporated by reference to Exhibit 10.43 of Amendment 5 to the Company’s Registration Statement on Form S-1 (Registration No. 333-121001) filed October 4, 2006). | |
71
Table of Contents
| 10.24+ | Form of Restricted Stock Unit Agreement 1 under the 2006 Omnibus Award Plan (incorporated by reference to Exhibit 10.44 of Amendment 5 to the Company’s Registration Statement on Form S-1 (Registration No. 333-121001) filed October 4, 2006). | |
| 10.25+ | Form of Restricted Stock Unit Agreement 2 under the 2006 Omnibus Award Plan (incorporated by reference to Exhibit 10.45 of Amendment 5 to the Company’s Registration Statement on Form S-1 (Registration No. 333-121001) filed October 4, 2006). | |
| 10.26+ | Amendment No. 2 to ExlService Holdings, Inc. 2006 Omnibus Award Plan (incorporated by reference to Exhibit 10.46 of Amendment 6 to the Registration Statement on Form S-1 (Registration No. 333-121001) filed October 17, 2006). | |
| 10.27+ | Letter Agreement, dated March 20, 2008, between Exl Service.com, Inc. and Rembert de Villa (incorporated by reference to Exhibit 10.29 to the Company’s Annual Report on Form 10-K filed on March 16, 2011). | |
| 10.28+ | Form of 2010 Restricted Stock Unit Agreement (U.S.) under the 2006 Omnibus Award Plan (incorporated by reference to Exhibit 99.1 to the Company’s Current Report on Form 8-K filed on February 4, 2010). | |
| 10.29+ | Form of 2010 Restricted Stock Unit Agreement (International) under the 2006 Omnibus Award Plan (incorporated by reference to Exhibit 99.2 to the Company’s Current Report on Form 8-K filed on February 4, 2010). | |
| 10.30+ | Form of 2010 Restricted Stock Unit Agreement (U.S.) under the 2006 Omnibus Award Plan (incorporated by reference to Exhibit 99.3 to the Company’s Current Report on Form 8-K filed on February 4, 2010). | |
| 10.31+ | Form of 2010 Restricted Stock Unit Agreement (International) under the 2006 Omnibus Award Plan (incorporated by reference to Exhibit 99.4 to the Company’s Current Report on Form 8-K filed on February 4, 2010). | |
| 10.32+ | Form of 2010 Restricted Stock Unit Agreement (U.S.) under the 2006 Omnibus Award Plan (3 Year Variable Vesting) (incorporated by reference to Exhibit 99.5 to the Company’s Current Report on Form 8-K filed on February 4, 2010). | |
| 10.33 | Framework Agreement, dated July 25, 2005, between Centrica plc, the Company and ExlService.com (India) Private Limited (incorporated by reference to Exhibit 10.37 to the Company’s Annual Report on Form 10-K filed on March 16, 2009). | |
| 10.34 | Notice of Extension between Centrica plc and the Company, dated July 11, 2008 (incorporated by reference to Exhibit 10.1 to the Company’s Quarterly Report on Form 10-Q filed on November 10, 2008). | |
| 10.35 | Amendment No. 6, dated April 1, 2009, to the Framework Agreement between Centrica plc, the Company and ExlService.com (India) Private Limited (incorporated by reference to Exhibit 10.36 to the Company’s Annual Report on Form 10-K filed on March 16, 2010). | |
| 10.36+ | Amendment No. 3 to ExlService Holdings, Inc. 2006 Omnibus Award Plan (incorporated by reference to Exhibit 4.6 to the Company’s Registration Statement on Form S-8 (Registration No. 333-157076) filed February 2, 2009). | |
| 10.37* | Framework Agreement, dated February 29, 2012, by and among Centrica plc, the Company and exl Service.com (India) Private Limited (incorporated by reference to Exhibit 10.39 to the Company’s Annual Report on Form 10-K/A filed on June 1, 2012). | |
| 10.38+ | Form of Restricted Stock Unit Agreement (U.S.) under the 2006 Omnibus Award Plan (incorporated by reference to Exhibit 10.1 to the Company’s Quarterly Report on Form 10-Q filed on May 1, 2014). | |
72
Table of Contents
| 10.39 | Credit Agreement, dated as of October 24, 2014, among ExlService Holdings, Inc., JPMorgan Chase Bank, N.A., as administrative agent and co-lead arranger, Citibank, N.A., as co-lead arranger, and the other Loan Parties and Lenders thereto. | |
| 10.40 | First Amendment to Credit Agreement and Incremental Facility Agreement, dated as of February 23, 2015, by and among ExlService Holdings, Inc., each of its subsidiaries party thereto, the Lenders party thereto and JPMorgan Chase Bank, N.A., as administrative agent for the Lenders. | |
| 21.1 | Subsidiaries of the Company. | |
| 23.1 | Consent of Independent Registered Public Accounting Firm. | |
| 31.1 | Certification of the Chief Executive Officer of ExlService Holdings, pursuant to Rule 13a-14(a) of the Exchange Act, as adopted pursuant to Section 302 of the Sarbanes-Oxley Act of 2002. | |
| 31.2 | Certification of the Chief Financial Officer of ExlService Holdings, pursuant to Rule 13a-14(a) of the Exchange Act, as adopted pursuant to Section 302 of the Sarbanes-Oxley Act of 2002. | |
| 32.1 | Certification of the Chief Executive Officer pursuant to Rule 13a-14(b) of the Exchange Act and 18 U.S.C. Section 1350, as adopted pursuant to Section 906 of the Sarbanes-Oxley Act of 2002. | |
| 32.2 | Certification of the Chief Financial Officer pursuant to Rule 13a-14(b) of the Exchange Act and 18 U.S.C. Section 1350, as adopted pursuant to Section 906 of the Sarbanes-Oxley Act of 2002. | |
| 101.INS | XBRL Instance Document** | |
| 101.SCH | XBRL Taxonomy Extension Schema** | |
| 101.CAL | XBRL Taxonomy Extension Calculation Linkbase** | |
| 101.DEF | XBRL Taxonomy Extension Definition Linkbase** | |
| 101.LAB | XBRL Taxonomy Extension Label Linkbase** | |
| 101.PRE | XBRL Extension Presentation Linkbase** | |
| * | Portions of this exhibit have been omitted pursuant to confidential treatment granted by the SEC. The omitted portions have been filed with the SEC. |
| ** | This exhibit will not be deemed “filed” for purposes of Section 18 of the Exchange Act, or otherwise subject to the liability of that section. Such exhibit will not be deemed to be incorporated by reference into any filing under the Securities Act or the Exchange Act, except to the extent that the Company specifically incorporates it by reference. |
| + | Indicates management contract or compensatory plan required to be filed as an Exhibit. |
73
Table of Contents
INDEX TO CONSOLIDATED FINANCIAL STATEMENTS
F-1
Table of Contents
REPORT OF INDEPENDENT REGISTERED PUBLIC ACCOUNTING FIRM
The Board of Directors and Stockholders of
ExlService Holdings, Inc.
We have audited the accompanying consolidated balance sheets of ExlService Holdings, Inc. and subsidiaries (“Company”) as of December 31, 2014 and 2013, and the related consolidated statements of income, comprehensive income/(loss), stockholders’ equity and cash flows for each of the three years in the period ended December 31, 2014. These financial statements are the responsibility of the Company’s management. Our responsibility is to express an opinion on these financial statements based on our audits.
We conducted our audits in accordance with the standards of the Public Company Accounting Oversight Board (United States). Those standards require that we plan and perform the audit to obtain reasonable assurance about whether the financial statements are free of material misstatement. An audit includes examining, on a test basis, evidence supporting the amounts and disclosures in the financial statements. An audit also includes assessing the accounting principles used and significant estimates made by management, as well as evaluating the overall financial statement presentation. We believe that our audits provide a reasonable basis for our opinion.
In our opinion, the financial statements referred to above present fairly, in all material respects, the consolidated financial position of ExlService Holdings, Inc. and subsidiaries at December 31, 2014 and 2013, and the consolidated results of their operations and their cash flows for each of the three years in the period ended December 31, 2014, in conformity with U.S. generally accepted accounting principles.
We also have audited, in accordance with the standards of the Public Company Accounting Oversight Board (United States), ExlService Holdings, Inc. and subsidiaries’ internal control over financial reporting as of December 31, 2014, based on criteria established in Internal Control—Integrated Framework issued by the Committee of Sponsoring Organizations of the Treadway Commission (2013 Framework) and our report dated February 27, 2015 expressed an unqualified opinion thereon.
/s/ Ernst & Young LLP
New York, New York
February 27, 2015
F-2
Table of Contents
REPORT OF INDEPENDENT REGISTERED PUBLIC ACCOUNTING FIRM
The Board of Directors and Stockholders of ExlService Holdings, Inc.
We have audited ExlService Holdings, Inc. and subsidiaries’ internal control over financial reporting as of December 31, 2014, based on criteria established in Internal Control—Integrated Framework issued by the Committee of Sponsoring Organizations of the Treadway Commission (2013 Framework) (the COSO criteria). ExlService Holdings, Inc. and subsidiaries’ management is responsible for maintaining effective internal control over financial reporting, and for its assessment of the effectiveness of internal control over financial reporting included in the accompanying Management’s Annual Report on Internal Control over Financial Reporting. Our responsibility is to express an opinion on the company’s internal control over financial reporting based on our audit.
We conducted our audit in accordance with the standards of the Public Company Accounting Oversight Board (United States). Those standards require that we plan and perform the audit to obtain reasonable assurance about whether effective internal control over financial reporting was maintained in all material respects. Our audit included obtaining an understanding of internal control over financial reporting, assessing the risk that a material weakness exists, testing and evaluating the design and operating effectiveness of internal control based on the assessed risk, and performing such other procedures as we considered necessary in the circumstances. We believe that our audit provides a reasonable basis for our opinion.
A company’s internal control over financial reporting is a process designed to provide reasonable assurance regarding the reliability of financial reporting and the preparation of financial statements for external purposes in accordance with generally accepted accounting principles. A company’s internal control over financial reporting includes those policies and procedures that (1) pertain to the maintenance of records that, in reasonable detail, accurately and fairly reflect the transactions and dispositions of the assets of the company; (2) provide reasonable assurance that transactions are recorded as necessary to permit preparation of financial statements in accordance with generally accepted accounting principles, and that receipts and expenditures of the company are being made only in accordance with authorizations of management and directors of the company; and (3) provide reasonable assurance regarding prevention or timely detection of unauthorized acquisition, use, or disposition of the company’s assets that could have a material effect on the financial statements.
Because of its inherent limitations, internal control over financial reporting may not prevent or detect misstatements. Also, projections of any evaluation of effectiveness to future periods are subject to the risk that controls may become inadequate because of changes in conditions, or that the degree of compliance with the policies or procedures may deteriorate.
In our opinion, ExlService Holdings, Inc. and subsidiaries maintained, in all material respects, effective internal control over financial reporting as of December 31, 2014, based on the COSO criteria.
As indicated in the accompanying Management’s Annual Report on Internal Control over Financial Reporting, management’s assessment of and conclusion on the effectiveness of internal control over financial reporting did not include the internal controls of Overland Holdings, Inc. and Blue Slate Solutions, LLC., which is included in the 2014 consolidated financial statements of ExlService Holdings, Inc and constituted $79,282 thousands and $74,991 thousands of total and net assets, respectively as of December 31, 2014 and $16,624 thousands of revenues for the year then ended. Our audit of internal control over financial reporting of ExlService Holdings, Inc. also did not include an evaluation of the internal control over financial reporting of Overland Holdings, Inc. and Blue Slate Solutions, LLC.
F-3
Table of Contents
We also have audited, in accordance with the standards of the Public Company Accounting Oversight Board (United States), the consolidated balance sheets of ExlService Holdings, Inc. and subsidiaries as of December 31, 2014 and 2013, and the related consolidated statements of income, comprehensive income/(loss), stockholders’ equity and cash flows for each of the three years in the period ended December 31, 2014 and our report dated February 27, 2015 expressed an unqualified opinion thereon.
/s/ Ernst & Young LLP
New York, New York
February 27, 2015
F-4
Table of Contents
CONSOLIDATED BALANCE SHEETS
(In thousands, except share and per share amounts)
| December 31, | December 31, | |||||||
| 2014 | 2013 | |||||||
| Assets |
||||||||
| Current assets: |
||||||||
| Cash and cash equivalents |
$ | 176,499 | $ | 148,065 | ||||
| Short-term investments |
11,577 | 5,987 | ||||||
| Restricted cash |
1,395 | 423 | ||||||
| Accounts receivable, net |
80,244 | 76,121 | ||||||
| Prepaid expenses |
5,783 | 5,168 | ||||||
| Deferred tax assets, net |
4,455 | 6,958 | ||||||
| Advance income tax, net |
9,905 | 2,024 | ||||||
| Other current assets |
12,533 | 7,881 | ||||||
|
|
|
|
|
|||||
| Total current assets |
302,391 | 252,627 | ||||||
|
|
|
|
|
|||||
| Fixed assets, net |
45,369 | 34,564 | ||||||
| Restricted cash |
3,258 | 3,568 | ||||||
| Deferred tax assets, net |
11,985 | 12,254 | ||||||
| Intangible assets, net |
46,979 | 34,115 | ||||||
| Goodwill |
139,599 | 107,407 | ||||||
| Other assets |
23,975 | 18,897 | ||||||
|
|
|
|
|
|||||
| Total assets |
$ | 573,556 | $ | 463,432 | ||||
|
|
|
|
|
|||||
| Liabilities and Stockholders’ Equity |
||||||||
| Current liabilities: |
||||||||
| Accounts payable |
$ | 4,663 | $ | 4,714 | ||||
| Deferred revenue |
7,690 | 8,618 | ||||||
| Accrued employee cost |
37,606 | 29,405 | ||||||
| Accrued expenses and other current liabilities |
40,206 | 32,219 | ||||||
| Current portion of capital lease obligations |
803 | 1,119 | ||||||
|
|
|
|
|
|||||
| Total current liabilities |
90,968 | 76,075 | ||||||
|
|
|
|
|
|||||
| Long term borrowings |
50,000 | — | ||||||
| Capital lease obligations, less current portion |
560 | 1,371 | ||||||
| Non-current liabilities |
12,870 | 19,812 | ||||||
|
|
|
|
|
|||||
| Total liabilities |
154,398 | 97,258 | ||||||
|
|
|
|
|
|||||
| Commitments and contingencies (See Note 16) |
||||||||
| Preferred stock, $0.001 par value; 15,000,000 shares authorized, none issued |
— | — | ||||||
| Stockholders’ equity: |
||||||||
| Common stock, $0.001 par value; 100,000,000 shares authorized, 34,203,352 shares issued and 32,905,467 shares outstanding as of December 31, 2014 and 33,342,312 shares issued and 32,172,183 shares outstanding as of December 31, 2013 |
34 | 33 | ||||||
| Additional paid-in-capital |
233,173 | 214,522 | ||||||
| Retained earnings |
269,424 | 236,979 | ||||||
| Accumulated other comprehensive loss |
(55,509 | ) | (60,718 | ) | ||||
|
|
|
|
|
|||||
| Total stockholders’ equity including shares held in treasury |
447,122 | 390,816 | ||||||
|
|
|
|
|
|||||
| Less: 1,297,885 shares as of December 31, 2014 and 1,170,129 shares as of December 31, 2013, held in treasury, at cost |
(27,964 | ) | (24,642 | ) | ||||
|
|
|
|
|
|||||
| Total stockholders’ equity |
419,158 | 366,174 | ||||||
|
|
|
|
|
|||||
| Total liabilities and stockholders’ equity |
$ | 573,556 | $ | 463,432 | ||||
|
|
|
|
|
|||||
See accompanying notes to consolidated financial statements.
F-5
Table of Contents
CONSOLIDATED STATEMENTS OF INCOME
(In thousands, except share and per share amounts)
| Year ended December 31, | ||||||||||||
| 2014 | 2013 | 2012 | ||||||||||
| Revenues, net |
$ | 499,278 | $ | 478,452 | $ | 442,930 | ||||||
| Cost of revenues (exclusive of depreciation and amortization) |
332,535 | 290,942 | 271,876 | |||||||||
|
|
|
|
|
|
|
|||||||
| Gross profit |
166,743 | 187,510 | 171,054 | |||||||||
|
|
|
|
|
|
|
|||||||
| Operating expenses: |
||||||||||||
| General and administrative expenses |
65,381 | 58,797 | 57,192 | |||||||||
| Selling and marketing expenses |
39,294 | 36,376 | 31,007 | |||||||||
| Depreciation and amortization |
28,028 | 24,917 | 25,623 | |||||||||
|
|
|
|
|
|
|
|||||||
| Total operating expenses |
132,703 | 120,090 | 113,822 | |||||||||
|
|
|
|
|
|
|
|||||||
| Income from operations |
34,040 | 67,420 | 57,232 | |||||||||
| Other income/(expense) : |
||||||||||||
| Foreign exchange loss |
(5 | ) | (4,990 | ) | (2,509 | ) | ||||||
| Interest and other income, net |
3,603 | 2,547 | 1,997 | |||||||||
|
|
|
|
|
|
|
|||||||
| Income before income taxes |
37,638 | 64,977 | 56,720 | |||||||||
| Income tax expense |
5,193 | 16,880 | 14,884 | |||||||||
|
|
|
|
|
|
|
|||||||
| Net income |
32,445 | 48,097 | 41,836 | |||||||||
|
|
|
|
|
|
|
|||||||
| Earnings per share: |
||||||||||||
| Basic |
$ | 0.99 | $ | 1.47 | $ | 1.31 | ||||||
| Diluted |
$ | 0.96 | $ | 1.42 | $ | 1.26 | ||||||
| Weighted-average number of shares used in computing earnings per share: |
||||||||||||
| Basic |
32,804,606 | 32,750,178 | 31,968,386 | |||||||||
| Diluted |
33,636,593 | 33,842,938 | 33,171,105 | |||||||||
See accompanying notes to consolidated financial statements.
F-6
Table of Contents
CONSOLIDATED STATEMENTS OF COMPREHENSIVE INCOME/(LOSS)
(In thousands)
| Year ended December 31, | ||||||||||||
| 2014 | 2013 | 2012 | ||||||||||
| Net income |
$ | 32,445 | $ | 48,097 | $ | 41,836 | ||||||
| Other comprehensive income/(loss): |
||||||||||||
| Unrealized gain/(loss) on effective cash flow hedges, net of taxes $1,768, ($1,840) and $192, respectively |
5,002 | (7,759 | ) | 516 | ||||||||
| Foreign currency translation adjustment |
(5,462 | ) | (19,605 | ) | (4,149 | ) | ||||||
| Retirement benefits, net of taxes ($28), ($91) and ($65), respectively |
(34 | ) | (331 | ) | (193 | ) | ||||||
| Reclassification adjustments |
||||||||||||
| Realized loss on cash flow hedges, net of taxes $1,571, $1,625 and $2,106, respectively (1) |
5,569 | 3,516 | 6,938 | |||||||||
| Retirement benefits, net of taxes $15, $31 and $26 (2), respectively |
134 | 108 | 99 | |||||||||
|
|
|
|
|
|
|
|||||||
| Total other comprehensive (loss)/income |
5,209 | (24,071 | ) | 3,211 | ||||||||
|
|
|
|
|
|
|
|||||||
| Total comprehensive income |
$ | 37,654 | $ | 24,026 | $ | 45,047 | ||||||
|
|
|
|
|
|
|
|||||||
| (1) | These are reclassified to net income and are included in the foreign exchange loss in the consolidated statements of income. See Note 7 to the consolidated financial statements. |
| (2) | These are reclassified to net income and are included in the computation of net periodic pension costs in the consolidated statements of income. See Note 11 to the consolidated financial statements. |
See accompanying notes to consolidated financial statements.
F-7
Table of Contents
CONSOLIDATED STATEMENTS OF STOCKHOLDERS’ EQUITY
(In thousands, except share and per share amounts)
| Accumulated | ||||||||||||||||||||||||||||||||||||
| Additional | Other | Non - | ||||||||||||||||||||||||||||||||||
| Common Stock | Paid-in | Retained | Comprehensive | Treasury Stock | Controlling | |||||||||||||||||||||||||||||||
| Shares | Amount | Capital | Earnings | Income/(Loss) | Shares | Amount | Interest | Total | ||||||||||||||||||||||||||||
| Balance as of December 31, 2011 |
31,496,461 | $ | 31 | $ | 173,926 | $ | 147,046 | $ | (39,858 | ) | (323,397 | ) | $ | (2,693 | ) | $ | 23 | $ | 278,475 | |||||||||||||||||
| Stock issued on exercise/vesting of equity awards |
1,043,621 | 2 | 9,601 | — | — | — | — | — | 9,603 | |||||||||||||||||||||||||||
| Non-employee stock options |
— | — | 32 | — | — | — | — | — | 32 | |||||||||||||||||||||||||||
| Stock based compensation |
— | — | 9,416 | — | — | — | — | — | 9,416 | |||||||||||||||||||||||||||
| Excess tax benefit from stock based compensation |
— | — | 2,273 | — | — | — | — | — | 2,273 | |||||||||||||||||||||||||||
| Acquisition of treasury stock |
— | — | — | — | — | (12,865 | ) | (331 | ) | — | (331 | ) | ||||||||||||||||||||||||
| Non controlling interest |
— | — | — | — | — | — | — | 2 | 2 | |||||||||||||||||||||||||||
| Other comprehensive income |
— | — | — | — | 3,211 | — | — | — | 3,211 | |||||||||||||||||||||||||||
| Net income |
— | — | — | 41,836 | — | — | — | — | 41,836 | |||||||||||||||||||||||||||
|
|
|
|
|
|
|
|
|
|
|
|
|
|
|
|
|
|
|
|||||||||||||||||||
| Balance as of December 31, 2012 |
32,540,082 | $ | 33 | $ | 195,248 | $ | 188,882 | $ | (36,647 | ) | (336,262 | ) | $ | (3,024 | ) | $ | 25 | $ | 344,517 | |||||||||||||||||
| Stock issued on exercise/vesting of equity awards |
802,230 | — | 5,489 | — | — | — | — | — | 5,489 | |||||||||||||||||||||||||||
| Stock based compensation |
— | — | 11,832 | — | — | — | — | — | 11,832 | |||||||||||||||||||||||||||
| Excess tax benefit from stock based compensation |
— | — | 1,953 | — | — | — | — | — | 1,953 | |||||||||||||||||||||||||||
| Acquisition of treasury stock |
— | — | — | — | — | (833,867 | ) | (21,618 | ) | — | (21,618 | ) | ||||||||||||||||||||||||
| Non controlling interest |
— | — | — | — | — | — | — | (25 | ) | (25 | ) | |||||||||||||||||||||||||
| Other comprehensive loss |
— | — | — | — | (24,071 | ) | — | — | — | (24,071 | ) | |||||||||||||||||||||||||
| Net income |
— | — | — | 48,097 | — | — | — | — | 48,097 | |||||||||||||||||||||||||||
|
|
|
|
|
|
|
|
|
|
|
|
|
|
|
|
|
|
|
|||||||||||||||||||
| Balance as of December 31, 2013 |
33,342,312 | $ | 33 | $ | 214,522 | $ | 236,979 | $ | (60,718 | ) | (1,170,129 | ) | $ | (24,642 | ) | $ | — | $ | 366,174 | |||||||||||||||||
|
|
|
|
|
|
|
|
|
|
|
|
|
|
|
|
|
|
|
|||||||||||||||||||
| Stock issued on exercise/vesting of equity awards |
861,040 | 1 | 6,459 | — | — | — | — | — | 6,460 | |||||||||||||||||||||||||||
| Stock based compensation |
— | — | 11,011 | — | — | — | — | — | 11,011 | |||||||||||||||||||||||||||
| Excess tax benefit from stock based compensation |
— | — | 1,181 | — | — | — | — | — | 1,181 | |||||||||||||||||||||||||||
| Acquisition of treasury stock |
— | — | — | — | (127,756 | ) | (3,322 | ) | — | (3,322 | ) | |||||||||||||||||||||||||
| Other comprehensive income |
— | — | — | — | 5,209 | — | — | — | 5,209 | |||||||||||||||||||||||||||
| Net income |
— | — | — | 32,445 | — | — | — | — | 32,445 | |||||||||||||||||||||||||||
|
|
|
|
|
|
|
|
|
|
|
|
|
|
|
|
|
|
|
|||||||||||||||||||
| Balance as of December 31, 2014 |
34,203,352 | $ | 34 | $ | 233,173 | $ | 269,424 | $ | (55,509 | ) | (1,297,885 | ) | $ | (27,964 | ) | $ | — | $ | 419,158 | |||||||||||||||||
|
|
|
|
|
|
|
|
|
|
|
|
|
|
|
|
|
|
|
|||||||||||||||||||
See accompanying notes to consolidated financial statements
F-8
Table of Contents
CONSOLIDATED STATEMENTS OF CASH FLOWS
(In thousands)
| Year ended December 31, | ||||||||||||
| 2014 | 2013 | 2012 | ||||||||||
| Cash flows from operating activities: |
||||||||||||
| Net income |
$ | 32,445 | $ | 48,097 | $ | 41,836 | ||||||
| Adjustments to reconcile net income to net cash provided by operating activities: |
||||||||||||
| Depreciation and amortization |
28,028 | 24,917 | 25,623 | |||||||||
| Loss on sale of business unit |
149 | 190 | — | |||||||||
| Write-off of accounts receivable |
— | 2,029 | — | |||||||||
| Stock-based compensation expense |
11,011 | 11,832 | 9,416 | |||||||||
| Unrealized foreign exchange gain |
(424 | ) | (7,782 | ) | (943 | ) | ||||||
| Deferred income taxes |
76 | 2,484 | 4,727 | |||||||||
| Excess tax benefit from stock-based compensation |
(1,181 | ) | (1,953 | ) | (2,273 | ) | ||||||
| Others, net |
146 | 153 | 185 | |||||||||
| Change in operating assets and liabilities (net of effect of acquisitions): |
||||||||||||
| Restricted cash |
(747 | ) | (62 | ) | (32 | ) | ||||||
| Accounts receivable |
3,261 | (5,678 | ) | (8,086 | ) | |||||||
| Prepaid expenses and other current assets |
(3,930 | ) | (3,418 | ) | (1,793 | ) | ||||||
| Accounts payable |
(146 | ) | (375 | ) | 3,019 | |||||||
| Deferred revenue |
(947 | ) | 696 | (3,721 | ) | |||||||
| Accrued employee costs |
179 | 3,306 | (570 | ) | ||||||||
| Accrued expenses and other liabilities |
8,426 | 5,565 | (145 | ) | ||||||||
| Advance income tax, net |
(7,841 | ) | 2,106 | (1,313 | ) | |||||||
| Other assets |
(1,846 | ) | 685 | (148 | ) | |||||||
|
|
|
|
|
|
|
|||||||
| Net cash provided by operating activities |
66,659 | 82,792 | 65,782 | |||||||||
|
|
|
|
|
|
|
|||||||
| Cash flows from investing activities: |
||||||||||||
| Purchase of fixed assets |
(27,678 | ) | (15,916 | ) | (18,804 | ) | ||||||
| Business acquisition (net of cash acquired) |
(58,185 | ) | (1,183 | ) | (37,500 | ) | ||||||
| Purchase of short-term investments |
(9,134 | ) | (1,927 | ) | (7,351 | ) | ||||||
| Proceeds from redemption of short-term investments |
6,735 | 1,491 | 8,821 | |||||||||
|
|
|
|
|
|
|
|||||||
| Net cash used for investing activities |
(88,262 | ) | (17,535 | ) | (54,834 | ) | ||||||
|
|
|
|
|
|
|
|||||||
| Cash flows from financing activities: |
||||||||||||
| Principal payments on capital lease obligations |
(967 | ) | (1,511 | ) | (1,640 | ) | ||||||
| Proceeds from long-term borrowings |
50,000 | — | — | |||||||||
| Payment for purchase of non-controlling interest |
— | (27 | ) | — | ||||||||
| Payment of debt issuance costs |
(405 | ) | — | — | ||||||||
| Acquisition of treasury stock |
(3,322 | ) | (21,618 | ) | (331 | ) | ||||||
| Proceeds from exercise of stock options |
6,459 | 5,489 | 9,603 | |||||||||
| Excess tax benefit from stock-based compensation |
1,181 | 1,953 | 2,273 | |||||||||
|
|
|
|
|
|
|
|||||||
| Net cash (used for)/provided by financing activities |
52,946 | (15,714 | ) | 9,905 | ||||||||
|
|
|
|
|
|
|
|||||||
| Effect of exchange rate changes on cash and cash equivalents |
(2,909 | ) | (4,515 | ) | (209 | ) | ||||||
|
|
|
|
|
|
|
|||||||
| Net increase in cash and cash equivalents |
28,434 | 45,028 | 20,644 | |||||||||
| Cash and cash equivalents, beginning of period |
148,065 | 103,037 | 82,393 | |||||||||
|
|
|
|
|
|
|
|||||||
| Cash and cash equivalents, end of period |
$ | 176,499 | $ | 148,065 | $ | 103,037 | ||||||
|
|
|
|
|
|
|
|||||||
| Supplemental disclosure of cash flow information: |
||||||||||||
| Cash paid for interest |
$ | 355 | $ | 592 | $ | 826 | ||||||
| Cash paid for taxes, net of refund |
$ | 11,204 | $ | 8,585 | $ | 13,779 | ||||||
| Assets acquired under capital lease |
$ | 366 | $ | 288 | $ | 243 | ||||||
See accompanying notes to consolidated financial statement.
F-9
Table of Contents
NOTES TO CONSOLIDATED FINANCIAL STATEMENTS
December 31, 2014
(In thousands, except share and per share amounts)
1. Organization and Basis of Presentation
Organization
ExlService Holdings, Inc. (“ExlService Holdings”) is organized as a corporation under the laws of the state of Delaware. ExlService Holdings, together with its subsidiaries (collectively, the “Company”), is a leading provider of business process solutions that integrate operations management with analytics and business transformation to deliver actionable business insights and long-term business impact. The Company’s clients are located principally in the U.S. and the U.K.
2. Summary of Significant Accounting Policies
(a) Basis of Preparation and Principles of Consolidation
The accompanying consolidated financial statements have been prepared in conformity with U.S. generally accepted accounting principles (“US GAAP”). The accompanying financial statements have been prepared on a consolidated basis and reflect the financial statements of ExlService Holdings and all of its subsidiaries. All intercompany balances and transactions have been eliminated in consolidation.
(b) Use of Estimates
The preparation of the consolidated financial statements in conformity with US GAAP requires management to make estimates and assumptions that affect the reported amounts of assets and liabilities and disclosure of contingent assets and liabilities at the date of the consolidated financial statements and the consolidated statements of income during the reporting period. Although these estimates are based on management’s best assessment of the current business environment, actual results may be different from those estimates. The significant estimates and assumptions that affect the financial statements include, but are not limited to, allowance for doubtful receivables, service tax receivables, assets and obligations related to employee benefit plans, deferred tax valuation allowances, income-tax uncertainties and other contingencies, valuation of derivative financial instruments, stock-based compensation expense, depreciation and amortization periods, purchase price allocation, recoverability of long-term assets including goodwill and intangibles, and estimates to complete fixed price contracts.
(c) Foreign Currency Translation
The functional currency of each entity in the Company is its respective local country currency which is also the currency of the primary economic environment in which it operates except for the entities in Mauritius which use the U.S. dollar as its functional currency. Monetary assets and liabilities in foreign currencies are re-measured into functional currency at the rates of exchange prevailing at the balance sheet dates. Transactions in foreign currencies are re-measured into functional currency at the rates of exchange prevailing on the date of the transaction. All transaction foreign exchange gains and losses are recorded in the accompanying consolidated statements of income.
The assets and liabilities of the subsidiaries for which the functional currency is other than the U.S. dollar are translated into U.S. dollars, the reporting currency, at the rate of exchange prevailing on the balance sheet dates. Revenues and expenses are translated into U.S. dollars at the exchange rates prevailing on the last business day of each month, which approximates the average monthly exchange rate. Resulting translation adjustments are included in accumulated other comprehensive loss in the audited consolidated balance sheets.
F-10
Table of Contents
EXLSERVICE HOLDINGS, INC.
NOTES TO CONSOLIDATED FINANCIAL STATEMENTS—(continued)
December 31, 2014
(In thousands, except share and per share amounts)
(d) Revenue Recognition
The Company derives its revenues from Operations Management and Analytics and Business Transformation services. Revenues from Operations Management are recognized primarily on a time-and-material, cost-plus, transaction—based and outcome-based pricing; revenues from Analytics and Business Transformation services are recognized primarily on a time-and-material and fixed price basis. The services provided by the Company under its contracts with the customer generally contain one unit of accounting except the software and related services contracts involving implementation services and post contract maintenance services. In such multiple element arrangements, revenue is allocated to maintenance based the price charged when that element is sold separately (vendor specific objective evidence or “VSOE”). Revenues are recognized under our contracts generally when four basic criteria are met; persuasive evidence of an arrangement exists, the sales price is fixed or determinable, services have been performed and collection of amounts billed is reasonably assured.
Revenues under time-and-material, transaction-based and outcome-based contracts are recognized as the services are performed. Revenues are recognized on cost-plus contracts on the basis of contractually agreed direct and indirect costs incurred on a client contract plus an agreed upon profit mark-up. Such revenues are recognized as the related services are provided in accordance with the client contract. When the terms of the client contract specify service level parameters that must be met (such as turnaround time or accuracy), we monitor such service level parameters to determine if any service credits or penalties have been incurred. Revenues are recognized net of any service credits that are due to a client. Revenue on contingent fee based contracts is recognized when the related contingency has been met to the client’s satisfaction.
Revenues for Company’s fixed-price Analytics and Business Transformation contracts are recognized using the proportional performance method when the pattern of performance under the contracts can be reasonably determined. We estimate the proportional performance of a contract by comparing the actual number of hours or days worked to the estimated total number of hours or days required to complete each engagement. The use of the proportional performance method requires significant judgment relative to estimating the number of hours or days required to complete the contracted scope of work, including assumptions and estimates relative to the length of time to complete the project and the nature and complexity of the work to be performed. We regularly monitor our estimates for completion of a project and record changes in the period in which a change in an estimate is determined. If a change in an estimate results in a projected loss on a project, such loss is recognized in the period in which it is first identified.
The Company’s software and related services contracts generally contain software license, related services and maintenance elements. Maintenance revenues are generally recognized on a straight-line basis over the contract term as they are separable and have VSOE. Services related to software licenses are evaluated to determine whether those services are significant or essential to the functionality of the software. When services are not considered essential, software license revenues and the related services are considered as one unit of accounting and recognized on a proportional performance basis or ratably as the services are performed. When services are significant or considered essential, revenues related to license fee and services are recognized as the services are performed using the percentage of completion method of accounting, under which the total value of revenue is recognized on the basis of the percentage that each contract’s total labor hours to date bears to the total expected labor hours (input method).
The Company accrues revenue for services rendered between the last billing date and the balance sheet date. Accordingly, our accounts receivable include amounts for services that we have performed and for which an invoice has not yet been issued to the client.
F-11
Table of Contents
EXLSERVICE HOLDINGS, INC.
NOTES TO CONSOLIDATED FINANCIAL STATEMENTS—(continued)
December 31, 2014
(In thousands, except share and per share amounts)
On November 1, 2013, the Company received a notice of termination from The Travelers Indemnity Company (“Travelers”) under the Professional Services Agreement, dated as of March 7, 2006, between the Company and Travelers (as amended from time to time, the “Services Agreement”), and is required to provide transition services for a period of up to eighteen months, including reimbursing Travelers for certain of their transition related expenses. The Company recognized $26,347 and $351 of such reimbursements as a reduction of revenues during the year ended December 31, 2014 and 2013, respectively in accordance with Accounting Standards Codification topic 605-50-45, “Revenue Recognition (“ASC No. 605”).”
Reimbursements of out-of-pocket expenses received from clients have been included as part of revenues on a gross basis. Revenues for the following periods include reimbursements of out-of-pocket expenses:
| Year ended December 31, 2014 |
$ | 19,606 | ||
| Year ended December 31, 2013 |
$ | 18,621 | ||
| Year ended December 31, 2012 |
$ | 18,862 |
(e) Cash and Cash Equivalents and Restricted Cash
The Company considers all highly liquid investments purchased with an original maturity of ninety days or less to be cash equivalents. Pursuant to the Company’s investment policy, its surplus funds are kept as cash or cash equivalents and are invested in highly-rated mutual funds, money market accounts and time deposits to reduce its exposure to market risk with regard to these funds.
Current restricted cash represents amounts on deposit with banks against bank guarantees issued through banks for equipment imports that will mature on various dates before December 31, 2015, as well as client funds held in dedicated bank accounts.
Non-current restricted cash represents amounts on deposit with banks against bank guarantees issued through banks for equipment imports and for demands against pending income tax assessments (see Note 16 for details), that will mature on various dates after December 31, 2015.
(f) Investments
The Company’s investments consist of time deposits with financial institutions which are valued at cost and approximate fair value. Interest earned on such investments is included in interest income. Investments with original maturities greater than ninety days but less than twelve months are classified as short-term investments. Investments with maturities greater than twelve months from the balance sheet date are classified as long-term investments.
(g) Accounts Receivable
Accounts receivable are recorded net of allowances for doubtful accounts. Allowances for doubtful accounts are established through the evaluation of the accounts receivable aging and prior collection experience to estimate the ultimate collectability of these receivables. As of December 31, 2014 and 2013, the Company had $120 and $91 of allowance for doubtful accounts, respectively.
Accounts receivable include unbilled accounts receivable which represents revenues for services performed but yet to be billed to the client. As of December 31, 2014 and 2013, the Company had $16,735 and $16,400 of unbilled accounts receivable, respectively.
F-12
Table of Contents
EXLSERVICE HOLDINGS, INC.
NOTES TO CONSOLIDATED FINANCIAL STATEMENTS—(continued)
December 31, 2014
(In thousands, except share and per share amounts)
(h) Fixed Assets
Fixed assets are stated at cost less accumulated depreciation. Equipment held under capital leases are stated at the lower of present value of minimum lease payments at the inception of the leases or its fair value. Advances paid towards acquisition of fixed assets and the cost of fixed assets not yet placed in service before the end of the period are classified as construction in progress.
Fixed assets are reviewed for impairment whenever events or changes in circumstances indicate that the carrying amount may not be recoverable through an assessment of the estimated future undiscounted cash flows related to such assets. In the event that assets are found to be carried at amounts that are in excess of estimated undiscounted future cash flows, the carrying value of the related asset or group of assets is reduced to a level commensurate with fair value based on a discounted cash flow analysis.
Depreciation is computed using the straight-line method over the estimated useful lives of the assets. Depreciation and amortization on equipment held under capital leases and leasehold improvements are computed using the straight-line method over the shorter of the assets’ estimated useful lives or the lease term.
The estimated lives used in determining depreciation are as follows:
| Estimated Useful Life (Years) |
||||
| Network equipment, computers and software |
3-5 | |||
| Buildings |
30 | |||
| Leasehold improvements |
3-8 | |||
| Office furniture and equipment |
3-7 | |||
| Motor vehicles |
2-5 | |||
(i) Software Development Costs
Costs incurred for developing software or enhancements to the existing software products to be sold are capitalized, including the salaries and benefits of employees that are directly involved in the installation and development, once technological feasibility has been established upon completion of a detailed design program or, in its absence, completion of a working model. The capitalized costs are amortized on a straight-line basis over the estimated useful life. Costs associated with preliminary project stage activities, training, maintenance and all post-implementation stage activities are expensed as incurred.
(j) Business Combinations, Goodwill and Other Intangible Assets
ASC topic 805, “Business Combinations” (ASC No. 805), requires that the purchase method of accounting be used for all business combinations. The guidance specifies criteria as to intangible assets acquired in a business combination that must be recognized and reported separately from goodwill. Under ASC topic 350, “Intangibles—Goodwill and Other” (ASC No. 350), all assets and liabilities of the acquired businesses, including goodwill, are assigned to reporting units.
Goodwill represents the cost of the acquired businesses in excess of the fair value of identifiable tangible and intangible net assets purchased. Goodwill is not amortized but is tested for impairment at least on an annual basis, relying on a number of factors including operating results, business plans and estimated future cash flows of the reporting units to which it is assigned. Recoverability of goodwill is evaluated using a two-step process.
F-13
Table of Contents
EXLSERVICE HOLDINGS, INC.
NOTES TO CONSOLIDATED FINANCIAL STATEMENTS—(continued)
December 31, 2014
(In thousands, except share and per share amounts)
The first step involves a comparison of the fair value of a reporting unit with its carrying value. The fair value of the reporting unit is measured by discounting estimated future cash flows. If the carrying amount of the reporting unit exceeds its fair value, the second step of the process involves a comparison of the fair value and carrying value of the goodwill of that reporting unit. If the carrying value of the goodwill of a reporting unit exceeds the fair value of that goodwill, an impairment loss is recognized in an amount equal to the excess. Goodwill of a reporting unit is tested for impairment annually or if an event occurs or circumstances change that would more likely than not reduce the fair value of the reporting unit below its carrying amount.
Intangible assets acquired in a business combination are initially valued and recognized at fair market value using generally accepted valuation methods appropriate for the type of intangible asset. Intangible assets with definite lives are amortized over the estimated useful lives and are reviewed for impairment, if indicators of impairment arise. The evaluation of impairment is based upon a comparison of the carrying amount of the intangible asset to its fair value, which is calculated using the estimated future undiscounted net cash flows expected to be generated by the asset. If the fair value of the intangible assets is less than the carrying amount of the asset, the asset is considered impaired and an impairment expense is recognized equal to any shortfall in the current period.
The Company’s definite lived intangible assets are amortized over their estimated useful lives as listed below using a straight-line method:
| Customer relationships |
3-15 years | |||
| Leasehold benefits |
3-8 years | |||
| Developed technology |
5-10 years | |||
| Non-compete agreements |
1-2 years | |||
| Trade names and trademarks |
3-5 years |
(k) Derivative Financial Instruments.
In the normal course of business, the Company uses derivative instruments for the purpose of mitigating the exposure from foreign currency fluctuation risks associated with forecasted transactions denominated in certain foreign currencies and to minimize earnings and cash flow volatility associated with changes in foreign currency exchange rates, and not for speculative trading purposes. These derivative contracts are purchased within the Company’s policy and are with counterparties that are highly rated financial institutions.
The Company hedges anticipated transactions that are subject to foreign exchange exposure with foreign currency exchange contracts that qualify as cash flow hedges. Changes in the fair value of these cash flow hedges which are deemed effective, are recorded in accumulated other comprehensive income/(loss) (AOCI) until the hedged transactions occur and at that time are recognized in the consolidated statements of income. Changes in the fair value of cash flow hedges deemed ineffective are recognized in the consolidated statement of income and are included in foreign exchange loss. The Company also uses derivatives instruments consisting of foreign currency exchange contracts to economically hedge intercompany balances and other monetary assets or liabilities denominated in currencies other than the functional currency. Changes in the fair value of these derivatives are recognized in the consolidated statements of income and are included in foreign exchange loss.
The Company evaluates hedge effectiveness of cash flow hedges at the time a contract is entered into as well as on an ongoing basis. If during this time, a contract is deemed ineffective, the change in the fair value is recorded in the consolidated statements of income and is included in foreign exchange loss. For hedge
F-14
Table of Contents
EXLSERVICE HOLDINGS, INC.
NOTES TO CONSOLIDATED FINANCIAL STATEMENTS—(continued)
December 31, 2014
(In thousands, except share and per share amounts)
relationships that are discontinued because the forecasted transaction is not expected to occur by the end of the originally specified period, any related derivative amounts recorded in equity are reclassified to earnings.
(l) Employee Benefits
Contributions to defined contribution plans are charged to the consolidated statements of income in the period in which services are rendered by the covered employees. Current service costs for defined benefit plans are accrued in the period to which they relate. The liability in respect of defined benefit plans is calculated annually by the Company using the projected unit credit method. Prior service cost, if any, resulting from an amendment to a plan is recognized and amortized over the remaining period of service of the covered employees. The Company recognizes its liabilities for compensated absences dependent on whether the obligation is attributable to employee services already rendered, relates to rights that vest or accumulate and payment is probable and estimable.
(m) Share-Based Compensation
The Company recognizes stock-based compensation expense in the consolidated financial statements for awards of equity instruments to employees and non-employee directors based on the grant-date fair value of those awards. The Company recognizes these compensation costs, net of an estimated forfeiture rate, over the requisite service period of the award. Forfeitures are estimated at the time of grant and revised, if necessary, in subsequent periods if actual forfeiture differ from those estimates.
On February 13, 2014, the Compensation Committee of the Board of Directors of the Company approved the program allowing for the grant of performance-based restricted stock units (“PRSUs”) to executive officers and other specified employees under its existing 2006 Omnibus Award Plan.
Under this program, 50% of the PRSUs will cliff vest at the end of a three-year period based on a revenue target for 2016 (“PUs”). However, up to one-third of the PUs may be earned based on the Company’s revenue performance in each of 2014 and 2015 against annual revenue targets in those years. The total amount of PUs that the recipient earns based on these performance criteria, will be the greater of (i) the PUs earned in 2016 and (ii) the sum of the earned PUs in 2014 and 2015. The other 50% shall be based on a market condition (“MUs”) that is contingent on meeting or exceeding the total shareholder return relative to a group of peer companies specified under the program, measured over a three-year performance period. The award recipient may earn up to two hundred percent (200%) of the PRSUs granted based on the actual performance for both kinds of PRSUs.
The fair value of each PU was determined based on the market price of one common share of the Company on the date of grant, and the associated compensation expense was calculated on the basis that performance targets to receive 100% of the PUs is probable of being achieved. The compensation expense for the PUs is recognized on a straight-line basis over the service period, which is through the end of 2016. Over this period, the number of shares that will be issued will be adjusted upward or downward based upon the probability of achievement of the performance targets. The ultimate number of shares issued and the related compensation cost recognized as an expense will be based on a comparison of the final performance metrics to the specified targets.
The grant date fair value for the MUs was determined using a Monte Carlo simulation model and the related compensation expense will be expensed on a straight-line basis over the vesting period. All compensation expense related to the MUs will be recognized if the requisite performance period is fulfilled, even if the market condition is not achieved.
F-15
Table of Contents
EXLSERVICE HOLDINGS, INC.
NOTES TO CONSOLIDATED FINANCIAL STATEMENTS—(continued)
December 31, 2014
(In thousands, except share and per share amounts)
(n) Income Taxes
The Company calculates and provides for income taxes in each of the tax jurisdictions in which it operates. The deferred tax assets and liabilities are recognized for future tax consequences attributable to temporary differences between the financial statement carrying values of existing assets and liabilities and their respective tax bases and all operating losses carried forward, if any. Deferred tax assets and liabilities are measured using tax rates expected to apply to taxable income in the years in which the applicable temporary differences are expected to be recovered or settled. The effect on deferred tax assets and liabilities of a change in tax rates or tax status is recognized in the statement of income in the period in which the change is identified. Deferred tax assets are reduced by a valuation allowance if, based on available evidence, it is more likely than not that some portion or all of the deferred tax assets will not be realized.
The Company establishes provisions for uncertain tax provisions and related interest and penalties when the Company believes those tax positions are not more likely than not of being sustained, if challenged.
(o) Financial Instruments and Concentration of Credit Risk
Financial Instruments. For certain financial instruments including cash and cash equivalents, short-term investments, accounts receivable, accounts payable, accrued expenses, and other current liabilities, recorded amounts approximate fair value due to the relatively short maturity periods of such instruments.
Concentration of Credit Risk. Financial instruments that potentially subject the Company to concentrations of credit risk consist principally of cash and cash equivalents, time deposits, accounts receivable and derivative financial instruments. By their nature, all such financial instruments involve risks including the credit risks of non-performance by counterparties. Pursuant to the Company’s investment policy, its surplus funds are maintained as cash or cash equivalents and are invested in highly-rated mutual funds, money market accounts and time deposits, placed with highly rated financial institutions to reduce its exposure to market risk with regard to these funds. Credit losses on accounts receivable have not been material because of a large concentration of revenues with a small number of large, established companies. The Company evaluates the creditworthiness of its clients in conjunction with its revenue recognition processes as well as through its ongoing collectability assessment processes for accounts receivable.
(p) Earnings Per Share
Basic earnings per share is computed by dividing net income to common stockholders by the weighted average number of common shares outstanding during each period. Diluted earnings per share is computed using the weighted average number of common shares plus the potentially dilutive effect of common stock equivalents issued and outstanding at the reporting date, using the treasury stock method. Stock options, restricted stock and restricted stock units that are anti-dilutive are excluded from the computation of weighted average shares outstanding.
F-16
Table of Contents
EXLSERVICE HOLDINGS, INC.
NOTES TO CONSOLIDATED FINANCIAL STATEMENTS—(continued)
December 31, 2014
(In thousands, except share and per share amounts)
The following table sets forth the computation of basic and diluted earnings per share:
| Year ended December 31, | ||||||||||||
| 2014 | 2013 | 2012 | ||||||||||
| Numerators: |
||||||||||||
| Net income |
$ | 32,445 | $ | 48,097 | $ | 41,836 | ||||||
| Denominators: |
||||||||||||
| Basic weighted average common shares outstanding |
32,804,606 | 32,750,178 | 31,968,386 | |||||||||
| Dilutive effect of share based awards |
831,987 | 1,092,760 | 1,202,719 | |||||||||
|
|
|
|
|
|
|
|||||||
| Diluted weighted average common shares outstanding |
33,636,593 | 33,842,938 | 33,171,105 | |||||||||
|
|
|
|
|
|
|
|||||||
| Earnings per share: |
||||||||||||
| Basic |
$ | 0.99 | $ | 1.47 | $ | 1.31 | ||||||
| Diluted |
$ | 0.96 | $ | 1.42 | $ | 1.26 | ||||||
| Weighted average common shares considered anti-dilutive in computing diluted earnings per share |
114,395 | 268,219 | 413,493 | |||||||||
(q) Accumulated Other Comprehensive Loss
For the Company, comprehensive loss consists of net earnings, amortization of actuarial gain/(loss) on retirement benefits and changes in the cumulative foreign currency translation adjustments. In addition, the Company enters into foreign currency exchange contracts, which are designated as cash flow hedges in accordance with ASC No. 815. Changes in the fair values of contracts that are deemed effective are recorded as a component of accumulated other comprehensive loss until the settlement of those contracts. The balances as of December 31, 2014 and 2013 are as follows:
| December 31, | December 31, | |||||||
| 2014 | 2013 | |||||||
| Cumulative currency translation adjustments |
$ | (55,553 | ) | $ | (50,091 | ) | ||
| Unrealized gain / (loss) on cash flow hedges, net of taxes of $603 and ($2,736) |
872 | (9,699 | ) | |||||
| Retirement benefits, net of taxes of ($277) and ($263) |
(828 | ) | (928 | ) | ||||
|
|
|
|
|
|||||
| Accumulated other comprehensive loss |
$ | (55,509 | ) | $ | (60,718 | ) | ||
|
|
|
|
|
|||||
(r) Accrued expenses and other current liabilities
Accrued expenses and other current liabilities consist of the following:
| December 31, | December 31, | |||||||
| 2014 | 2013 | |||||||
| Accrued expenses |
$ | 24,451 | $ | 20,607 | ||||
| Derivative instruments |
2,385 | 7,689 | ||||||
| Client liability account |
9,241 | 426 | ||||||
| Other current liabilities |
4,129 | 3,497 | ||||||
|
|
|
|
|
|||||
| Accrued expenses and other current liabilities |
$ | 40,206 | $ | 32,219 | ||||
|
|
|
|
|
|||||
F-17
Table of Contents
EXLSERVICE HOLDINGS, INC.
NOTES TO CONSOLIDATED FINANCIAL STATEMENTS—(continued)
December 31, 2014
(In thousands, except share and per share amounts)
(s) Non-current liabilities
Non-current liabilities consist of the following:
| December 31, | December 31, | |||||||
| 2014 | 2013 | |||||||
| Derivative instruments |
$ | 576 | $ | 5,606 | ||||
| Unrecognized tax benefits |
2,878 | 4,776 | ||||||
| Deferred rent |
5,977 | 4,973 | ||||||
| Retirement benefits |
1,544 | 3,543 | ||||||
| Other non-current liabilities |
1,895 | 914 | ||||||
|
|
|
|
|
|||||
| Non-current liabilities |
$ | 12,870 | $ | 19,812 | ||||
|
|
|
|
|
|||||
Recent Accounting Pronouncements
In March 2013, the Financial Accounting Standards Board (“the FASB”) issued Accounting Standards Update (“ASU”) No. 2013-05, “Parent’s Accounting for the Cumulative Translation Adjustment upon Derecognition of Certain subsidiaries or Groups of Assets within a Foreign Entity or of an Investment in a Foreign Entity” (“ASU 2013-05”). ASU 2013-05 applies to the release of the currency translation adjustment into net income when a parent either sells a part of all of its investment in a foreign entity or no longer holds a controlling financial interest in a subsidiary or group of assets that is a nonprofit activity or a business within a foreign entity. ASU 2013-05 became effective from January 1, 2014 and the new guidance did not have any material impact on the Company’s consolidated financial statements.
In July 2013, the FASB issued ASU No. 2013-11, “Presentation of an Unrecognized Tax Benefit When a Net Operating Loss Carryforward, a Similar Tax Loss, or a Tax Credit Carryforward Exists” (“ASU 2013-11”). The provisions of the rule require an unrecognized tax benefit to be presented as a reduction to a deferred tax asset in the financial statements for a net operating loss carryforward, a similar tax loss, or a tax credit carryforward except in circumstances when the carryforward or tax loss is not available at the reporting date under the tax laws of the applicable jurisdiction to settle any additional income taxes or the tax law does not require the entity to use, and the entity does not intend to use, the deferred tax asset for such purposes. When those circumstances exist, the unrecognized tax benefit should be presented in the financial statements as a liability and should not be combined with deferred tax assets. ASU No. 2013-11 became effective from January 1, 2014 and the new guidance did not have any material impact on the Company’s consolidated financial statements.
In May 2014, the FASB issued ASU No. 2014-09, “Revenue from Contracts with Customers” (“ASU 2014-09”). The new standard is effective for reporting periods beginning after December 15, 2016 and early adoption is not permitted. The comprehensive new standard will supersede existing revenue recognition guidance and require revenue to be recognized when promised goods or services are transferred to customers in amounts that reflect the consideration to which the Company expects to be entitled in exchange for those goods or services. Adoption of the new rules could affect the timing of revenue recognition for certain transactions of the Company. ASU 2014-09 is effective for the Company in the first quarter of fiscal 2017 using either one of two methods: (i) retrospectively to each prior reporting period presented with the option to elect certain practical expedients as defined within ASU 2014-09; or (ii) retrospectively with the cumulative effect of initially applying ASU 2014-09 recognized at the date of initial application and providing certain additional disclosures as defined per ASU 2014-09. The Company is currently evaluating the impact of adoption and the implementation approach to be used.
F-18
Table of Contents
EXLSERVICE HOLDINGS, INC.
NOTES TO CONSOLIDATED FINANCIAL STATEMENTS—(continued)
December 31, 2014
(In thousands, except share and per share amounts)
In June 2014, the FASB issued ASU No. 2014-12, “Accounting for Share-Based Payments When the Terms of an Award Provide That a Performance Target Could Be Achieved after the Requisite Service Period” (“ASU 2014-12”). The amendments in ASU 2014-12 require that a performance target in a share based payment that affects vesting and that could be achieved after the requisite service period should be accounted for as a performance condition. The amendments in ASU 2014-12 are effective for annual periods beginning after December 15, 2015 and interim periods within those annual periods with early adoption permitted. Entities may apply the amendments in ASU 2014-12 either: (a) prospectively to all awards granted or modified after the effective date; or (b) modified retrospectively to all awards with performance targets that are outstanding on or after the beginning of the first annual period presented as of the adoption date. ASU 2014-12 is not applicable to the Company’s current stock based compensation plan and it does not expect this guidance to have any impact on the consolidated financial statements.
In August 2014, the FASB issued ASU No. 2014-15, “Presentation of Financial Statements (Subtopic 205-40), Disclosure of Uncertainties about an Entity’s Ability to Continue as a Going Concern” (“ASU 2014-15”) . ASU 2014-15 requires management to evaluate whether there are conditions and events that raise substantial doubt about the entity’s ability to continue as a going concern within one year after the financial statements are issued and, if so, disclose that fact. Such evaluation is to be done for both annual and interim reporting periods, if applicable. Management is also required to evaluate and disclose whether its plans alleviate that doubt. The Company adopted the ASU 2014-15 and the new guidance did not have any impact on the Company’s consolidated financial statements.
In November 2014, the FASB issued ASU No. 2014-17, “Business Combinations (Topic 805): Pushdown Accounting, a consensus of the FASB Emerging Issues Task Force (“ASU 2014-17”). The amendments in this Update provide an acquired entity with an option to apply pushdown accounting in its separate financial statements upon occurrence of an event in which an acquirer obtains control of the acquired entity. An acquired entity may elect the option to apply pushdown accounting in the reporting period in which the change-in-control event occurs. An acquired entity should determine whether to elect to apply pushdown accounting for each individual change-in-control event in which an acquirer obtains control of the acquired entity. If pushdown accounting is not applied in the reporting period in which the change-in-control event occurs, an acquired entity will have the option to elect to apply pushdown accounting in a subsequent reporting period to the acquired entity’s most recent change-in-control event. An election to apply pushdown accounting in a reporting period after the reporting period in which the change-in-control event occurred should be considered a change in accounting principle in accordance with Topic 250, Accounting Changes and Error Corrections. If pushdown accounting is applied to an individual change-in-control event, that election is irrevocable. The amendments in this Accounting Standards Update are effective on November 18, 2014. After the effective date, an acquired entity can make an election to apply the guidance to future change-in-control events or to its most recent change-in-control event. However, if the financial statements for the period in which the most recent change-in-control event occurred already have been issued or made available to be issued, the application of this guidance would be a change in accounting principle. The adoption of ASU 2014-17 did not have a material impact on the Company’s consolidated financial statements.
F-19
Table of Contents
EXLSERVICE HOLDINGS, INC.
NOTES TO CONSOLIDATED FINANCIAL STATEMENTS—(continued)
December 31, 2014
(In thousands, except share and per share amounts)
3. Quarterly Financial Data (Unaudited)
Summarized quarterly results for the years ended December 31, 2014 and 2013 are as follows:
| Three months ended | ||||||||||||||||||||
| 2014 | March 31 | June 30 | September 30 | December 31 | Full Year | |||||||||||||||
| Revenues, net |
$ | 121,797 | $ | 119,738 | $ | 122,457 | $ | 135,286 | $ | 499,278 | ||||||||||
| Gross profit |
46,875 | 38,479 | 37,474 | 43,915 | 166,743 | |||||||||||||||
| Net income |
$ | 11,147 | $ | 7,762 | $ | 6,075 | $ | 7,461 | $ | 32,445 | ||||||||||
| Earnings Per Share: |
||||||||||||||||||||
| Basic |
$ | 0.34 | $ | 0.24 | $ | 0.18 | $ | 0.23 | $ | 0.99 | ||||||||||
| Diluted |
$ | 0.33 | $ | 0.23 | $ | 0.18 | $ | 0.22 | $ | 0.96 | ||||||||||
| Weighted-average number of shares used in computing earnings per share: |
||||||||||||||||||||
| Basic |
32,523,490 | 32,812,155 | 32,890,475 | 32,986,276 | 32,804,606 | |||||||||||||||
| Diluted |
33,428,544 | 33,673,669 | 33,676,665 | 33,761,462 | 33,636,593 | |||||||||||||||
| Note: |
||||||||||||||||||||
| Stock compensation expense |
$ | 4,176 | $ | 1,966 | $ | 2,376 | $ | 2,493 | $ | 11,011 | ||||||||||
| Amortization of intangibles |
$ | 1,536 | $ | 1,489 | $ | 1,441 | $ | 2,157 | $ | 6,623 | ||||||||||
| Three months ended | ||||||||||||||||||||
| 2013 | March 31 | June 30 | September 30 | December 31 | Full Year | |||||||||||||||
| Revenues, net |
$ | 116,006 | $ | 116,008 | $ | 122,315 | $ | 124,123 | $ | 478,452 | ||||||||||
| Gross profit |
43,093 | 42,078 | 50,266 | 52,073 | 187,510 | |||||||||||||||
| Net income |
$ | 9,762 | $ | 9,236 | $ | 13,240 | $ | 15,859 | $ | 48,097 | ||||||||||
| Earnings Per Share: |
||||||||||||||||||||
| Basic |
$ | 0.30 | $ | 0.28 | $ | 0.40 | $ | 0.48 | $ | 1.47 | ||||||||||
| Diluted |
$ | 0.29 | $ | 0.27 | $ | 0.39 | $ | 0.47 | $ | 1.42 | ||||||||||
| Weighted-average number of shares used in computing earnings per share: |
||||||||||||||||||||
| Basic |
32,521,481 | 32,778,800 | 32,907,281 | 32,788,489 | 32,750,178 | |||||||||||||||
| Diluted |
33,719,794 | 33,899,097 | 33,955,445 | 33,792,757 | 33,842,938 | |||||||||||||||
| Note: |
||||||||||||||||||||
| Stock compensation expense |
$ | 3,645 | $ | 2,860 | $ | 2,967 | $ | 2,360 | $ | 11,832 | ||||||||||
| Amortization of intangibles |
$ | 1,634 | $ | 1,596 | $ | 1,534 | $ | 1,536 | $ | 6,300 | ||||||||||
4. Segment Information
The Company’s business is divided into two reporting segments: Operations Management (previously called Outsourcing Services) and Analytics and Business Transformation (previously called Transformation Services). The Company changed its reporting segment nomenclature in 2014 in order to more accurately reflect the changing nature of its engagements with the clients. For comparability with the prior periods, the business composition of each segment remains unchanged.
The Company provides various types of business process solutions utilizing Operations Management, analytics and technology. These services are provided in an integrated manner to clients in various industries. The chief operating decision maker (“CODM”) generally reviews financial information at the consolidated statement of income level disaggregated by its two segments, but does not review any information except for
F-20
Table of Contents
EXLSERVICE HOLDINGS, INC.
NOTES TO CONSOLIDATED FINANCIAL STATEMENTS—(continued)
December 31, 2014
(In thousands, except share and per share amounts)
revenues and cost of revenues of these individual segments. Therefore, the Company does not allocate or evaluate operating expenses, interest expense or income, capital expenditures, and income taxes to its operating segments. Consequently, it is not practical to show assets, capital expenditures, depreciation or amortization by segment. The Company’s recent acquisition of Blue Slate Solutions, LLC (“Blue Slate”) and Overland Holdings, Inc. (“Overland”) are classified within the Analytics and Business Transformation and Operations Management, respectively.
Revenues and cost of revenues for each of the years ended December 31, 2014, 2013 and 2012, for Operations Management and Analytics and Business Transformation segments, respectively, are as follows:
| Year ended December 31, 2014 | Year ended December 31, 2013 | |||||||||||||||||||||||
| Operations Management |
Analytics and Business Transformation |
Total | Operations Management |
Analytics and Business Transformation |
Total | |||||||||||||||||||
| Revenues, net |
$ | 388,665 | $ | 110,613 | $ | 499,278 | $ | 394,987 | $ | 83,465 | $ | 478,452 | ||||||||||||
| Cost of revenues (exclusive of depreciation and amortization) |
253,600 | 78,935 | 332,535 | 232,286 | 58,656 | 290,942 | ||||||||||||||||||
|
|
|
|
|
|
|
|
|
|
|
|
|
|||||||||||||
| Gross profit |
$ | 135,065 | $ | 31,678 | $ | 166,743 | $ | 162,701 | $ | 24,809 | $ | 187,510 | ||||||||||||
|
|
|
|
|
|
|
|
|
|
|
|
|
|||||||||||||
| Operating expenses |
132,703 | 120,090 | ||||||||||||||||||||||
| Other income/(expense) |
3,598 | (2,443 | ) | |||||||||||||||||||||
| Income tax expense |
5,193 | 16,880 | ||||||||||||||||||||||
|
|
|
|
|
|||||||||||||||||||||
| Net income |
$ | 32,445 | $ | 48,097 | ||||||||||||||||||||
|
|
|
|
|
|||||||||||||||||||||
| Year ended December 31, 2012 | ||||||||||||
| Operations Management |
Analytics and Business Transformation |
Total | ||||||||||
| Revenues, net |
$ | 366,767 | $ | 76,163 | $ | 442,930 | ||||||
| Cost of revenues (exclusive of depreciation and amortization) |
222,860 | 49,016 | 271,876 | |||||||||
|
|
|
|
|
|
|
|||||||
| Gross profit |
$ | 143,907 | $ | 27,147 | $ | 171,054 | ||||||
|
|
|
|
|
|
|
|||||||
| Operating expenses |
113,822 | |||||||||||
| Other income/(expense) |
(512 | ) | ||||||||||
| Income tax expense |
14,884 | |||||||||||
|
|
|
|||||||||||
| Net income |
$ | 41,836 | ||||||||||
|
|
|
|||||||||||
5. Business Combinations, Goodwill and Intangible Assets
a) Blue Slate Solutions, LLC
On July 1, 2014, the Company entered into a membership interest purchase agreement (the “Agreement”) with Blue Slate, a provider of Business Process Management and Technology Solutions that specializes in transforming operations through business process automation, use of innovative technologies, data integration and analytics. Pursuant to the Agreement, the Company has purchased all of the membership interests of Blue Slate for a cash consideration of $6,986, including working capital adjustments of $751.
F-21
Table of Contents
EXLSERVICE HOLDINGS, INC.
NOTES TO CONSOLIDATED FINANCIAL STATEMENTS—(continued)
December 31, 2014
(In thousands, except share and per share amounts)
Blue Slate’s approach bolsters the Company’s strategy of embedding process automation and operational analytics into client offerings. As the Company pursues this approach through Business EXLerator FrameworkTM, Blue Slate brings the ability to work directly on clients’ core, mission-critical applications inside their IT environments to transform their business processes. This strengthens the Company’s position with regard to IT services providers that have strong technology foundations and enriches the Company’s value proposition to clients in addition to using the Company’s capabilities to deliver greater impact for its client base. Accordingly, the Company paid a premium for the acquisition which is being reflected in the goodwill recognized from the purchase price allocation of the total consideration paid by the Company.
The Company’s purchase price allocation for the acquisition is as follows:
| Amount | ||||
| (In thousands) | ||||
| Net tangible assets |
$ | 1,313 | ||
| Identifiable intangible assets: |
||||
| Customer relationships |
804 | |||
| Non-compete agreement |
48 | |||
| Trade Names & Trademarks |
267 | |||
| Goodwill |
4,554 | |||
|
|
|
|||
| Total purchase price* |
$ | 6,986 | ||
|
|
|
|||
| * | Includes $750 deposited in escrow accounts in connection with the acquisition. |
The customer relationships, non-compete agreements and trade names and trademarks intangibles from the Blue Slate acquisition are being amortized over a useful life of five years, four years and three years, respectively.
During the year ended December 31, 2014 the company recognized $125 of acquisition related costs. Such amounts are included under general and administrative expenses in the consolidated statements of income. The Company’s results of operations for the year ended December 31, 2014 includes $4,378 of revenues of Blue Slate since July 1, 2014, the date on which acquisition was consummated. It is not practicable to disclose the net earnings since management does not allocate or evaluate operating expenses and income taxes to its domestic entities.
The amount of goodwill recognized from the Blue Slate acquisition is deductible for tax purposes.
b) Overland Holdings, Inc.
On October 24, 2014, the Company acquired all of the outstanding shares of Overland Holdings, Inc. (“Overland”) pursuant to a Plan of Merger (the “Merger”).
The aggregate consideration for Overland’s acquisition was $65,940 (“Merger Consideration), including working capital adjustments of $12,940. The Merger Consideration was paid with existing cash on the Company’s balance sheet. A portion of the Merger Consideration otherwise payable in the Merger was placed into escrow as security for post-closing working capital adjustments and the indemnification obligations under the Merger Agreement.
F-22
Table of Contents
EXLSERVICE HOLDINGS, INC.
NOTES TO CONSOLIDATED FINANCIAL STATEMENTS—(continued)
December 31, 2014
(In thousands, except share and per share amounts)
Overland, now as subsidiary of the Company is a leader in underwriting support services for Property & Casualty (“P&C”) insurers. It leverages proprietary workflow and automation technology, alongside transaction-based-pricing models to offer a well client demand aligned Business-process-as-a-service (BPaaS) solutions. Overland’s longstanding client relationships, experienced leadership team and technology-enabled services will enhance Company’s market leading position in Operations Management to P&C insurers and also strengthens Company’s onshore delivery capabilities. Overland’s technology and data directly connects and interfaces with its clients providing a truly integrated Operations Management solution. The acquisition presents an enormous opportunity to leverage Company’s analytics capabilities to enable Overland’s clients to increase the effectiveness of their underwriting. Accordingly, the Company paid a premium for the acquisition which is being reflected in the goodwill recognized from the purchase price allocation of the total consideration paid by the Company.
The Company’s preliminary purchase price allocation for the acquisition is as follows:
| Amount | ||||
| (In thousands) | ||||
| Net tangible assets |
$ | 18,873 | ||
| Identifiable intangible assets: |
||||
| Customer relationships |
12,200 | |||
| Developed Technology |
4,800 | |||
| Trade Names & Trademarks |
1,400 | |||
| Goodwill |
28,667 | |||
|
|
|
|||
| Total purchase price* |
$ | 65,940 | ||
|
|
|
|||
| * | Includes amount of $4,550 deposited in escrow accounts in connection with the acquisition. |
The customer relationships, trade names and trademarks and developed technology from the Overland acquisition are being amortized over a useful life of twelve, ten years and five years, respectively.
Under ASC topic 805, “Business Combinations,” the preliminary allocation of the purchase price to the tangible and intangible assets and liabilities acquired may change up to a period of one year from the date of the acquisition. Accordingly, the Company may adjust the amounts recorded as of December 31, 2014 to reflect any revised valuations of the assets acquired or liabilities assumed. The Company’s purchase accounting as of December 31, 2014 was incomplete primarily due to the valuation of intangibles as of the acquisition date.
During the year ended December 31, 2014 the company recognized $309 of acquisition related costs. Such amounts are included under general and administrative expenses in the consolidated statements of income. The Company’s results of operations for the year ended December 31, 2014 includes $12,246 of revenues of Overland since October 24, 2014, the date on which acquisition was consummated. It is not practicable to disclose the net earnings since management does not allocate or evaluate operating expenses and income taxes to its domestic entities.
The amount of goodwill recognized from the Overland acquisition is deductible for tax purposes.
F-23
Table of Contents
EXLSERVICE HOLDINGS, INC.
NOTES TO CONSOLIDATED FINANCIAL STATEMENTS—(continued)
December 31, 2014
(In thousands, except share and per share amounts)
Goodwill
The following table sets forth details of the Company’s goodwill balance as of December 31, 2014:
| Operations Management |
Analytics and Business Transformation |
Total | ||||||||||
| Balance at January 1, 2013 |
$ | 94,163 | $ | 16,785 | $ | 110,948 | ||||||
| Currency translation adjustments |
(3,291 | ) | — | (3,291 | ) | |||||||
| Allocation on sale of a business unit (1) |
(250 | ) | — | (250 | ) | |||||||
|
|
|
|
|
|
|
|||||||
| Balance at December 31, 2013 |
$ | 90,622 | $ | 16,785 | $ | 107,407 | ||||||
| Goodwill arising from Blue Slate acquisition |
— | 4,554 | 4,554 | |||||||||
| Goodwill arising from Overland acquisition |
28,667 | — | 28,667 | |||||||||
| Currency translation adjustments |
(529 | ) | — | (529 | ) | |||||||
| Allocation on sale of a business unit (1) |
(500 | ) | — | (500 | ) | |||||||
|
|
|
|
|
|
|
|||||||
| Balance at December 31, 2014 |
$ | 118,260 | $ | 21,339 | $ | 139,599 | ||||||
|
|
|
|
|
|
|
|||||||
| (1) | Relates to the sale of a business unit (acquired with the acquisition of Business Process Outsourcing Inc.) during the year ended December 31, 2014 and December 31, 2013. The net loss recognized from the sale of this business unit is $149 and $190 and is included under “other income/ (expense)” in the consolidated statements of income for the year ended December 31, 2014 and 2013 respectively. |
Based on the results of the impairment testing performed during the year ended December 31, 2014, the Company’s goodwill was not impaired. The Company makes every reasonable effort to ensure that it accurately estimates the fair value of the reporting units. However, future changes in the assumptions used to make these estimates could result in the recording of an impairment loss.
Intangible Assets
Information regarding the Company’s intangible assets is set forth below:
| As of December 31, 2014 | ||||||||||||
| Gross Carrying Amount |
Accumulated Amortization |
Net Carrying Amount |
||||||||||
| Customer relationships |
$ | 51,598 | $ | (16,836 | ) | $ | 34,762 | |||||
| Leasehold benefits |
2,927 | (2,004 | ) | 923 | ||||||||
| Developed technology |
10,814 | (2,402 | ) | 8,412 | ||||||||
| Non-compete agreements |
1,365 | (1,323 | ) | 42 | ||||||||
| Trade names and trademarks |
4,990 | (2,150 | ) | 2,840 | ||||||||
|
|
|
|
|
|
|
|||||||
| $ | 71,694 | $ | (24,715 | ) | $ | 46,979 | ||||||
|
|
|
|
|
|
|
|||||||
| As of December 31, 2013 | ||||||||||||
| Gross Carrying Amount |
Accumulated Amortization |
Net Carrying Amount |
||||||||||
| Customer relationships |
$ | 38,614 | $ | (12,201 | ) | $ | 26,413 | |||||
| Leasehold benefits |
2,986 | (1,455 | ) | 1,531 | ||||||||
| Developed technology |
6,013 | (1,458 | ) | 4,555 | ||||||||
| Non-compete agreements |
1,316 | (1,316 | ) | — | ||||||||
| Trade names and trademarks |
3,322 | (1,706 | ) | 1,616 | ||||||||
|
|
|
|
|
|
|
|||||||
| $ | 52,251 | $ | (18,136 | ) | $ | 34,115 | ||||||
|
|
|
|
|
|
|
|||||||
F-24
Table of Contents
EXLSERVICE HOLDINGS, INC.
NOTES TO CONSOLIDATED FINANCIAL STATEMENTS—(continued)
December 31, 2014
(In thousands, except share and per share amounts)
Amortization expense for the years ended December 31, 2014, 2013 and 2012 was $6,623, $6,300 and $5,638, respectively. The weighted average life of intangible assets was 9.6 years for customer relationships, 8.0 years for leasehold benefits, 6.7 years for developed technology, 4.0 years for non-compete agreements and 7.8 years for trade names and trademarks excluding indefinite life trade names and trademarks. The Company had $900 of indefinite lived trade names and trademarks as of December 31, 2014 and 2013.
| Estimated amortization of intangible assets during the year ending December 31, | ||||
| 2015 |
$ | 7,851 | ||
| 2016 |
$ | 7,844 | ||
| 2017 |
$ | 7,767 | ||
| 2018 |
$ | 7,622 | ||
| 2019 |
$ | 6,934 | ||
6. Fair Value Measurements
ASC topic 820, “Fair Value Measurements and Disclosures” (ASC No. 820) defines fair value as the price that would be received upon sale of an asset or paid upon transfer of a liability in an orderly transaction between market participants at the measurement date and in the principal or most advantageous market for that asset or liability. The fair value should be calculated based on assumptions that market participants would use in pricing the asset or liability, not on assumptions specific to the entity. In addition, the fair value of liabilities should include consideration of non-performance risk, including the Company’s own credit risk.
ASC No. 820 establishes a three-level hierarchy of fair value measurements based on whether the inputs to those measurements are observable or unobservable. Observable inputs reflect market data obtained from independent sources, while unobservable inputs reflect the Company’s market assumptions. The fair-value hierarchy requires the use of observable market data when available and consists of the following levels:
| • | Level 1—Quoted prices for identical instruments in active markets; |
| • | Level 2—Quoted prices for similar instruments in active markets; quoted prices for identical or similar instruments in markets that are not active; and model-derived valuations in which all significant inputs are observable in active markets; and |
| • | Level 3—Valuations derived from valuation techniques in which one or more significant inputs are unobservable. |
F-25
Table of Contents
EXLSERVICE HOLDINGS, INC.
NOTES TO CONSOLIDATED FINANCIAL STATEMENTS—(continued)
December 31, 2014
(In thousands, except share and per share amounts)
The following table sets forth the Company’s assets and liabilities that were accounted for at fair value as of December 31, 2014 and 2013. The table excludes short-term investments, accounts receivable, accounts payable and accrued expenses for which fair values approximate their carrying amounts.
Assets and Liabilities Measured at Fair Value
The assets and liabilities measured at fair value on recurring basis are summarized below:
| As of December 31, 2014 | Level 1 | Level 2 | Level 3 | Total | ||||||||||||
| Assets |
||||||||||||||||
| Money market and mutual funds |
$ | 127,347 | $ | — | $ | — | $ | 127,347 | ||||||||
| Derivative financial instruments |
— | 4,579 | — | 4,579 | ||||||||||||
|
|
|
|
|
|
|
|
|
|||||||||
| Total |
$ | 127,347 | $ | 4,579 | $ | — | $ | 131,926 | ||||||||
|
|
|
|
|
|
|
|
|
|||||||||
| Liabilities |
||||||||||||||||
| Derivative financial instruments |
$ | — | $ | 2,961 | $ | — | $ | 2,961 | ||||||||
|
|
|
|
|
|
|
|
|
|||||||||
| Total |
$ | — | $ | 2,961 | $ | — | $ | 2,961 | ||||||||
|
|
|
|
|
|
|
|
|
|||||||||
| As of December 31, 2013 | Level 1 | Level 2 | Level 3 | Total | ||||||||||||
| Assets |
||||||||||||||||
| Money market and mutual funds |
$ | 116,662 | $ | — | $ | — | $ | 116,662 | ||||||||
| Derivative financial instruments |
— | 957 | — | 957 | ||||||||||||
|
|
|
|
|
|
|
|
|
|||||||||
| Total |
$ | 116,662 | $ | 957 | $ | — | $ | 117,619 | ||||||||
|
|
|
|
|
|
|
|
|
|||||||||
| Liabilities |
||||||||||||||||
| Derivative financial instruments |
$ | — | $ | 13,295 | $ | — | $ | 13,295 | ||||||||
|
|
|
|
|
|
|
|
|
|||||||||
| Total |
$ | — | $ | 13,295 | $ | — | $ | 13,295 | ||||||||
|
|
|
|
|
|
|
|
|
|||||||||
Derivative Financial Instruments: The Company’s derivative financial instruments consist of foreign currency forward exchange contracts. Fair values for derivative financial instruments are based on independent sources including highly rated financial institutions and are classified as Level 2. See Note 7 for further details on Derivatives and Hedge Accounting.
7. Derivatives and Hedge Accounting
The Company uses derivative instruments and hedging transactions to mitigate exposure to foreign currency fluctuation risks associated with forecasted transactions denominated in certain foreign currencies and to minimize earnings and cash flow volatility associated with changes in foreign currency exchanges rates. The Company’s derivative financial instruments are largely forward foreign exchange contracts that are designated effective and that qualify as cash flow hedges under ASC No. 815. The Company also enters into foreign currency forward contracts to economically hedge its intercompany balances and other monetary assets and liabilities denominated in currencies other than functional currencies. These derivatives do not qualify as fair value hedges under ASC No. 815. Changes in the fair value of these derivatives are recognized in the consolidated statements of income and are included in foreign exchange loss. The Company’s primary exchange rate exposure is with the Indian Rupee, the U.K. pound sterling and the Philippine peso. The Company also has exposure to Czech koruna and other local currencies in which it operates.
F-26
Table of Contents
EXLSERVICE HOLDINGS, INC.
NOTES TO CONSOLIDATED FINANCIAL STATEMENTS—(continued)
December 31, 2014
(In thousands, except share and per share amounts)
The Company had outstanding foreign exchange contracts totaling $276,018 and GBP 10,889 as of December 31, 2014 and totaling $262,085 and GBP 10,973 as of December 31, 2013. The Company estimates that approximately $1,142 of net derivative losses included in accumulated other comprehensive loss (“AOCI”) could be reclassified into earnings within the next twelve months based on exchange rates prevailing as of December 31, 2014. At December 31, 2014, the maximum outstanding term of the cash flow hedges was forty-five months.
The Company evaluates hedge effectiveness at the time a contract is entered into as well as on an ongoing basis. If during this time, a contract is deemed ineffective, the change in the fair value is recorded in the consolidated statements of income and is included in foreign exchange loss. For hedging positions that are discontinued because the forecasted transaction is not expected to occur by the end of the originally specified period, any related derivative amounts recorded in equity are reclassified to earnings. No such significant amounts of gains or losses were reclassified from AOCI into earnings during the year ended December 31, 2014 and 2013.
The following tables set forth the fair value of the foreign currency exchange contracts and their location on the consolidated financial statements:
Derivatives designated as hedging instruments:
| December 31, | December 31, | |||||||
| 2014 | 2013 | |||||||
| Other current assets: |
||||||||
| Foreign currency exchange contracts |
$ | 1,243 | $ | 437 | ||||
| Other assets: |
||||||||
| Foreign currency exchange contracts |
$ | 3,193 | $ | 423 | ||||
| Accrued expenses and other current liabilities: |
||||||||
| Foreign currency exchange contracts |
$ | 2,385 | $ | 7,689 | ||||
| Other non current liabilities: |
||||||||
| Foreign currency exchange contracts |
$ | 576 | $ | 5,606 | ||||
Derivatives not designated as hedging instruments:
| December 31, | December 31, | |||||||
| 2014 | 2013 | |||||||
| Other current assets: |
||||||||
| Foreign currency exchange contracts |
$ | 143 | $ | 97 | ||||
F-27
Table of Contents
EXLSERVICE HOLDINGS, INC.
NOTES TO CONSOLIDATED FINANCIAL STATEMENTS—(continued)
December 31, 2014
(In thousands, except share and per share amounts)
The following tables set forth the effect of foreign currency exchange contracts on the consolidated statements of income for the years ended December 31, 2014 and 2013:
| Derivatives in Cash Flow Hedging |
Amount of Gain/(Loss) Recognized in AOCI on Derivative (Effective Portion) |
Location of Gain/(Loss) Reclassified from AOCI into Income (Effective Portion) |
Amount of Loss Reclassified from AOCI into Income (Effective Portion) |
Location of Gain/(Loss) Recognized in Income on Derivative (Ineffective Portion and Amount Excluded from Effectiveness Testing) |
Amount of Gain/(Loss) Recognized in Income on Derivative (Ineffective Portion and Amount Excluded from Effectiveness Testing) |
|||||||||||||||||||||||
| 2014 | 2013 | 2014 | 2013 | 2014 | 2013 | |||||||||||||||||||||||
| Foreign exchange contracts |
$ | 6,770 | $ | (9,599 | ) | Foreign exchange loss |
$ | (7,140 | ) | $ | (5,141 | ) | Foreign exchange loss |
$ | — | $ | — | |||||||||||
| Derivatives not designated as Hedging Instruments |
Amount of Gain/(Loss) Recognized in Income on Derivatives |
|||||||||
|
Location of Gain or (Loss) Recognized in |
2014 | 2013 | ||||||||
| Foreign exchange contracts |
Foreign exchange (loss)/gain | $ | 3,685 | $ | (3,149 | ) | ||||
8. Fixed Assets
Fixed assets consist of the following:
| December 31, | December 31, | |||||||
| 2014 | 2013 | |||||||
| Owned Assets: |
||||||||
| Network equipment, computers and software |
$ | 83,140 | $ | 63,428 | ||||
| Buildings |
1,262 | 1,287 | ||||||
| Land |
826 | 842 | ||||||
| Leasehold improvements |
26,416 | 24,382 | ||||||
| Office furniture and equipment |
12,218 | 11,111 | ||||||
| Motor vehicles |
542 | 507 | ||||||
| Capital work in progress |
3,029 | 715 | ||||||
|
|
|
|
|
|||||
| 127,433 | 102,272 | |||||||
| Less: Accumulated depreciation and amortization |
(82,947 | ) | (69,242 | ) | ||||
|
|
|
|
|
|||||
| $ | 44,486 | $ | 33,030 | |||||
|
|
|
|
|
|||||
| Assets under capital leases: |
||||||||
| Network equipment, computers and software |
$ | — | $ | 184 | ||||
| Leasehold improvements |
961 | 1,955 | ||||||
| Office furniture and equipment |
219 | 1,079 | ||||||
| Motor vehicles |
848 | 934 | ||||||
|
|
|
|
|
|||||
| 2,028 | 4,152 | |||||||
| Less: Accumulated depreciation and amortization |
(1,145 | ) | (2,618 | ) | ||||
|
|
|
|
|
|||||
| $ | 883 | $ | 1,534 | |||||
|
|
|
|
|
|||||
| Fixed assets, net |
$ | 45,369 | $ | 34,564 | ||||
|
|
|
|
|
|||||
F-28
Table of Contents
EXLSERVICE HOLDINGS, INC.
NOTES TO CONSOLIDATED FINANCIAL STATEMENTS—(continued)
December 31, 2014
(In thousands, except share and per share amounts)
Depreciation and amortization expense excluding amortization of acquisition related intangibles for the year ended December 31, 2014, 2013 and 2012 was $21,405, $18,617 and $19,985, respectively.
Capital work in progress represents advances paid towards acquisition of fixed assets and cost of fixed assets and internally generated software costs not yet ready to be placed in service.
9. Capital Structure
Common Stock
The Company has one class of common stock outstanding.
During the year ended December 31, 2014 and 2013, the Company acquired 18,256 and 13,018 shares of common stock, respectively from employees in connection with withholding tax payments related to the vesting of restricted stock for a total consideration of $459 and $389, respectively. The weighted average purchase price of $25.14 and $29.89, respectively was the average of the high and low price of the Company’s share of common stock on the Nasdaq Global Select Market on the trading day prior to the vesting date of the shares of restricted stock. The shares acquired are held as treasury stock.
On December 30, 2014, the Company’s Board of Directors authorized up to an annual $20 million common stock repurchase program (the “2014 Repurchase Program”), under which shares may be purchased by the Company from time to time from the open market and through private transactions during each of the fiscal years 2015 to 2017. On November 7, 2013, the Company had announced a similar program, pursuant to which the Board of Directors authorized a $25 million common stock repurchase program (the “2013 Repurchase Program”), under which shares may be purchased by the Company from time to time from the open market and through private transactions. Repurchased shares under these programs are recorded as treasury shares and will be held until the Board of Directors designates that these shares be retired or used for other purposes.
During the year ended December 31, 2014, the Company purchased 109,500 shares of its common stock for an aggregate purchase price of approximately $2,863 including commissions, representing an average purchase price per share of $26.14 under the 2013 Repurchase program.
During the year ended December 31, 2013, the Company purchased 820,849 shares of its common stock for an aggregate purchase price of approximately $21,229 including commissions, representing an average purchase price per share of $25.86 under the 2013 Repurchase program.
10. Borrowings
On October 24, 2014, the Company entered into a credit agreement (the “Credit Agreement”) with certain lenders and JPMorgan Chase Bank, N.A., as Administrative Agent. The Credit Agreement provides for a $50,000 revolving credit facility (the “Credit Facility”), including a letter of credit sub-facility, for a period of five years. The Company has an option to increase the commitments under the Credit Facility by up to an additional $50,000, subject to certain approvals and conditions as set forth in the Credit Agreement. The credit facility has a maturity date of October 24, 2019 and is voluntarily prepayable from time to time without premium or penalty.
Borrowings under the Credit Facility may be used for working capital and general corporate purposes. The Company availed the entire $50,000 under the Credit Facility during the year ended December 31, 2014 and, as
F-29
Table of Contents
EXLSERVICE HOLDINGS, INC.
NOTES TO CONSOLIDATED FINANCIAL STATEMENTS—(continued)
December 31, 2014
(In thousands, except share and per share amounts)
of December 31, 2014, the borrowings under the Credit Facility are shown as a long-term borrowing in the consolidated balance sheet. In connection with the financing, the Company incurred $444 as debt issuance costs, which are deferred and amortized as an adjustment to interest expense over the term of the Credit Facility on a straight line basis.
Borrowings under the Credit Agreement bear interest at a rate equal to the specified prime rate (alternate base rate) or adjusted LIBO rate, plus, an applicable margin. The applicable margin is tied to the Company’s leverage ratio and ranges from 0.25% to 0.75% per annum with respect to loans (“ABR Loans”) pegged to the specified prime rate, and 1.25% to 1.75% per annum on loans (“Eurodollar Loans”) pegged to the adjusted LIBO rate (such applicable margin, the “Applicable Rate”). The revolving credit commitments under the Credit Agreement are subject to a commitment fee. The commitment fee is also tied to the Company’s leverage ratio, and ranges from 0.20% to 0.30% per annum on the average daily amount by which the aggregate revolving commitments exceed the sum of outstanding revolving loans and letter of credit obligations. The credit facility carried an interest rate of 1.5% per annum during the year ended December 31, 2014.
The Credit Facility is guaranteed by the Company’s domestic subsidiaries and material foreign subsidiaries. The obligations under the Credit Agreement are secured by all or substantially all of the assets of the Company and its material domestic subsidiaries. The Credit Agreement contains certain covenants including a restriction on indebtedness of the Company.
11. Employee Benefit Plans
The Company’s Gratuity Plans in India and the Philippines provide for lump sum payment to vested employees on retirement or upon termination of employment in an amount based on the respective employee’s salary and years of employment with the Company. Liabilities with regard to the Gratuity Plans are determined by actuarial valuation using the projected unit credit method. Current service costs for the Gratuity Plan are accrued in the year to which they relate. Actuarial gains or losses or prior service costs, if any, resulting from amendments to the plans are recognized and amortized over the remaining period of service of the employees.
F-30
Table of Contents
EXLSERVICE HOLDINGS, INC.
NOTES TO CONSOLIDATED FINANCIAL STATEMENTS—(continued)
December 31, 2014
(In thousands, except share and per share amounts)
The benefit obligation has been measured as of December 31, 2014. The following table sets forth the activity and the funded status of the Gratuity Plans and the amounts recognized in the Company’s consolidated financial statements at the end of the relevant periods:
| December 31, | ||||||||
| 2014 | 2013 | |||||||
| Change in projected benefit obligation: |
||||||||
| Benefit obligation at the beginning of the year |
$ | 6,567 | $ | 5,491 | ||||
| Service cost |
1,523 | 1,341 | ||||||
| Interest cost |
559 | 444 | ||||||
| Benefits paid |
(749 | ) | (466 | ) | ||||
| Actuarial loss |
161 | 554 | ||||||
| Divestiture |
(350 | ) | (134 | ) | ||||
| Effect of exchange rate changes |
(148 | ) | (663 | ) | ||||
|
|
|
|
|
|||||
| Projected benefit obligation at the end of the year |
$ | 7,563 | $ | 6,567 | ||||
|
|
|
|
|
|||||
| Unfunded amount–non-current |
$ | 1,544 | $ | 3,543 | ||||
| Unfunded amount–current |
1,267 | 868 | ||||||
|
|
|
|
|
|||||
| Total accrued liability |
$ | 2,811 | $ | 4,411 | ||||
|
|
|
|
|
|||||
| Accumulated benefit obligation |
$ | 5,034 | $ | 4,628 | ||||
|
|
|
|
|
|||||
Net gratuity cost includes the following components:
| Year ended December 31, | ||||||||||||
| 2014 | 2013 | 2012 | ||||||||||
| Service cost |
$ | 1,523 | $ | 1,341 | $ | 1,027 | ||||||
| Interest cost |
559 | 444 | 414 | |||||||||
| Expected return on plan assets |
(172 | ) | (164 | ) | (72 | ) | ||||||
| Actuarial loss |
149 | 139 | 125 | |||||||||
|
|
|
|
|
|
|
|||||||
| Net gratuity cost |
$ | 2,059 | $ | 1,760 | $ | 1,494 | ||||||
|
|
|
|
|
|
|
|||||||
The amount in accumulated other comprehensive loss that is expected to be recognized as a component of net periodic benefit cost over the next fiscal year is $215. The components of accumulated other comprehensive loss that have not been recognized as components of net gratuity cost in the statement of income as of December 31, 2014 and 2013 is as follows:
| December 31, | ||||||||
| 2014 | 2013 | |||||||
| Net actuarial loss |
$ | 819 | $ | 917 | ||||
| Net prior service cost |
9 | 11 | ||||||
|
|
|
|
|
|||||
| Accumulated other comprehensive loss, net of tax |
$ | 828 | $ | 928 | ||||
|
|
|
|
|
|||||
F-31
Table of Contents
EXLSERVICE HOLDINGS, INC.
NOTES TO CONSOLIDATED FINANCIAL STATEMENTS—(continued)
December 31, 2014
(In thousands, except share and per share amounts)
The weighted average actuarial assumptions used to determine benefit obligations and net periodic gratuity cost are:
| December 31, | ||||||||||||
| 2014 | 2013 | 2012 | ||||||||||
| Discount rate |
8.0 | % | 8.3 | % | 8.5 | % | ||||||
| Rate of increase in compensation levels |
8.2 | % | 8.2 | % | 8.2 | % | ||||||
| Expected long term rate of return on plan assets per annum |
9.0 | % | 9.0 | % | 8.5 | % | ||||||
The Company evaluates these assumptions annually based on its long-term plans of growth and industry standards. The discount rates are based on current market yields on government securities adjusted for a suitable risk premium.
| Expected benefit payments during the year ending December 31, |
||||
| 2015 |
$ | 2,073 | ||
| 2016 |
$ | 1,856 | ||
| 2017 |
$ | 1,639 | ||
| 2018 |
$ | 1,513 | ||
| 2019 |
$ | 1,317 | ||
| 2020 to 2024 |
$ | 3,599 |
The Gratuity Plans in India are partially funded and are managed and administered by Life Insurance Corporation of India and HDFC Standard Life Insurance Company. They calculate the annual contribution required to be made by the Company and manage the Gratuity Plans, including any required payouts. Fund managers manage these funds on a cash accumulation basis and declare interest retrospectively on March 31 of each year.
| Change in Plan Assets |
||||
| Plan assets at January 1, 2013 |
$ | 2,201 | ||
| Actual return |
206 | |||
| Benefits paid* |
— | |||
| Effect of exchange rate changes |
(251 | ) | ||
|
|
|
|||
| Plan assets at December 31, 2013 |
$ | 2,156 | ||
| Actual return |
259 | |||
| Employer contribution |
2,567 | |||
| Benefits paid* |
(105 | ) | ||
| Effect of exchange rate changes |
(125 | ) | ||
|
|
|
|||
| Plan assets at December 31, 2014 |
$ | 4,752 | ||
|
|
|
| * | Benefits payments of $644 were made directly by the Company and $105 through the plan assets during the year ended December 31, 2014. Benefits payments of $466 were made directly by the Company during the year ended December 31, 2013. |
The Company maintains the Exl Service 401(k) Plan (the “401(k) Plan”) under Section 401(k) of the Internal Revenue Code of 1986 (the “Code”), covering all eligible employees, as defined in the Code. The
F-32
Table of Contents
EXLSERVICE HOLDINGS, INC.
NOTES TO CONSOLIDATED FINANCIAL STATEMENTS—(continued)
December 31, 2014
(In thousands, except share and per share amounts)
Company may make discretionary contributions of up to a maximum of 3% of employee compensation within certain limits. The Company has made provisions for contributions to the 401(k) Plan amounting to $1,503, $1,147 and $942 during the years ended December 31, 2014, 2013 and 2012, respectively.
During the years ended December 31, 2014, 2013 and 2012, the Company contributed the following amounts to various defined contribution plans on behalf of its employees in India, the Philippines, Romania, Bulgaria and the Czech Republic:
| Year ended December 31, 2014 |
$ | 5,802 | ||
| Year ended December 31, 2013 |
$ | 5,448 | ||
| Year ended December 31, 2012 |
$ | 5,626 |
12. Leases
The Company finances its use of certain leasehold improvements, furniture, fixtures, office equipment and motor vehicles under various lease arrangements provided by financial institutions. Future minimum lease payments under these capital leases as of December 31, 2014 are as follows:
| Year ending December 31, |
||||
| 2015 |
$ | 904 | ||
| 2016 |
407 | |||
| 2017 |
154 | |||
| 2018 |
56 | |||
|
|
|
|||
| Total minimum lease payments |
1,521 | |||
| Less: amount representing interest |
158 | |||
|
|
|
|||
| Present value of minimum lease payments |
1,363 | |||
| Less: current portion |
803 | |||
|
|
|
|||
| Long term capital lease obligation |
$ | 560 | ||
|
|
|
The Company conducts its operations using facilities leased under non-cancelable operating lease agreements that expire at various dates. Future minimum lease payments under non-cancelable agreements expiring after December 31, 2014 are set forth below:
| Year ending December 31, |
||||
| 2015 |
$ | 8,541 | ||
| 2016 |
5,371 | |||
| 2017 |
2,330 | |||
| 2018 |
1,860 | |||
| 2019 |
1,280 | |||
| 2020 and thereafter |
1,069 | |||
|
|
|
|||
| $ | 20,451 | |||
|
|
|
The operating leases are subject to renewal periodically and have scheduled rent increases. The Company accounts for scheduled rent on such leases on a straight line basis over the non-cancelable lease period determined under ASC topic 840, “Leases” (“ASC No. 840”). Rent expense under both cancelable and non-
F-33
Table of Contents
EXLSERVICE HOLDINGS, INC.
NOTES TO CONSOLIDATED FINANCIAL STATEMENTS—(continued)
December 31, 2014
(In thousands, except share and per share amounts)
cancelable operating leases was $18,884, $17,384 and $17,860 for the years ended December 31, 2014, 2013 and 2012, respectively. Deferred rent as of December 31, 2014 and 2013 was $6,544 and $5,394, respectively, and is included under “Accrued expenses and other current liabilities” and “Non-current liabilities” in the consolidated balance sheets.
13. Income Taxes
The components of income before income taxes consist of the following:
| Year ended December 31, | ||||||||||||
| 2014 | 2013 | 2012 | ||||||||||
| Domestic |
$ | (4,785 | ) | $ | 24,056 | $ | 22,046 | |||||
| Foreign |
42,423 | 40,921 | 34,674 | |||||||||
|
|
|
|
|
|
|
|||||||
| $ | 37,638 | $ | 64,977 | $ | 56,720 | |||||||
|
|
|
|
|
|
|
|||||||
The income tax expense consists of the following:
| Year ended December 31, | ||||||||||||
| 2014 | 2013 | 2012 | ||||||||||
| Current provision: |
||||||||||||
| Domestic |
$ | (1,069 | ) | $ | 3,466 | $ | 4,519 | |||||
| Foreign |
6,186 | 10,930 | 5,638 | |||||||||
|
|
|
|
|
|
|
|||||||
| $ | 5,117 | $ | 14,396 | $ | 10,157 | |||||||
|
|
|
|
|
|
|
|||||||
| Deferred provision/(benefit): |
||||||||||||
| Domestic |
$ | 535 | $ | 4,183 | $ | 4,371 | ||||||
| Foreign |
(459 | ) | (1,699 | ) | 356 | |||||||
|
|
|
|
|
|
|
|||||||
| $ | 76 | $ | 2,484 | $ | 4,727 | |||||||
|
|
|
|
|
|
|
|||||||
| Income tax expense |
$ | 5,193 | $ | 16,880 | $ | 14,884 | ||||||
|
|
|
|
|
|
|
|||||||
The effective income tax rate differs from the amount computed by applying the U.S. federal statutory income tax rate to income before income taxes approximately as follows:
| December 31, | ||||||||||||
| 2014 | 2013 | 2012 | ||||||||||
| Expected tax expense |
$ | 12,797 | $ | 22,742 | $ | 19,852 | ||||||
| Change in valuation allowance |
64 | — | (254 | ) | ||||||||
| Impact of tax holiday |
(3,208 | ) | (5,531 | ) | (3,219 | ) | ||||||
| Foreign tax rate differential |
(3,327 | ) | (1,412 | ) | (1,071 | ) | ||||||
| Deferred tax (benefit)/provision |
(459 | ) | (433 | ) | 356 | |||||||
| Unrecognized tax benefits and interest |
(1,846 | ) | 2,399 | (2,083 | ) | |||||||
| State taxes, net of Federal taxes |
593 | 601 | 620 | |||||||||
| Non-deductible expenses |
15 | 310 | 591 | |||||||||
| Prior year tax benefit |
— | (875 | ) | — | ||||||||
| Other |
564 | (921 | ) | 92 | ||||||||
|
|
|
|
|
|
|
|||||||
| Tax expense |
$ | 5,193 | $ | 16,880 | $ | 14,884 | ||||||
|
|
|
|
|
|
|
|||||||
F-34
Table of Contents
EXLSERVICE HOLDINGS, INC.
NOTES TO CONSOLIDATED FINANCIAL STATEMENTS—(continued)
December 31, 2014
(In thousands, except share and per share amounts)
The effective tax rate decreased from 26.0% for the year ended December 31, 2013 to 13.8% for the year ended December 31, 2014, primarily due to the reversal of an unrecognized tax benefit of $2,173 in foreign tax jurisdictions during the year ended December 31, 2014 as a result of judicial rulings handed down during the year involving unaffiliated companies regarding similar tax matters. In the Company’s judgment, such rulings increased the level of certainty that its position on these tax adjustments proposed by the tax authorities would more likely than not be resolved in favor of the Company. The effective tax rate was further decreased during the year ended December 31, 2014 due to federal losses in the U.S. related to the reimbursement of disentanglement costs to Travelers under the Services Agreement. The federal losses are expected to be carried back to the prior year tax return and result in a current tax benefit of $1,934 (refer to Item 2—“Management’s Discussion and Analysis of Financial Condition and Results of Operations” for further details).
The Company also benefits from a corporate tax holiday in the Philippines for its operations centers established there over the last six years. The tax holiday expired for one of its centers in 2014 and will expire over the next few years for other centers, which may lead to an increase in our overall effective tax rate of the Company. Following the expiry of the tax exemption, income generated from centers in Philippines will be taxed at the prevailing annual tax rate, which is currently 5% on gross income.
The Company’s operations centers in Jaipur and Noida, India, which were established in Special Economic Zones (“SEZs”) in 2010, are eligible for tax incentives until 2020. These delivery centers are eligible for a 100% income tax exemption till 31 March 2015 and 50% income tax exemption with effect from 1 April 2015 for a period of five years thereafter. As part of the Company’s acquisition of Business Process Outsourcing Inc. in May 2011 (“OPI Acquisition”), the Company also acquired operations centers in Bengaluru and Kochi, India that are also established in SEZs. The operations center in Bengaluru completed its first five years of operations on March 31, 2012 during which such operations were entitled to a 100% tax exemption on export profits. Under Indian tax regulations, the Bengaluru operations center is entitled to a 50% tax exemption on export profits for five years from April 1, 2012. The Company’s tax expense for the Bengaluru center increased after April 1, 2012 and will further increase after the expiration of the current five-year term in 2017. The Company also established new operations centers in Pune, India in 2012 and in Kochi, India in 2013 in SEZs. The Company anticipates establishing additional operations centers in SEZs or other tax advantaged locations in the future.
The diluted earnings per share effect of the tax holiday is $0.10, $0.16 and $0.10 for the years ended December 31, 2014, 2013 and 2012, respectively.
F-35
Table of Contents
EXLSERVICE HOLDINGS, INC.
NOTES TO CONSOLIDATED FINANCIAL STATEMENTS—(continued)
December 31, 2014
(In thousands, except share and per share amounts)
The components of the deferred tax balances as of December 31, 2014 and 2013 are as follows:
| December 31, | ||||||||
| 2014 | 2013 | |||||||
| Deferred tax assets: |
||||||||
| Tax credit carry forward |
$ | 4,442 | $ | 3,332 | ||||
| Depreciation and amortization |
4,371 | 5,745 | ||||||
| Share-based compensation |
5,595 | 5,881 | ||||||
| Accrued employee costs and other expenses |
2,715 | 3,252 | ||||||
| Net operating loss carry forwards |
9,889 | 10,474 | ||||||
| Unrealized exchange loss |
859 | 3,336 | ||||||
| Deferred rent |
1,268 | 984 | ||||||
| Allowance for doubtful accounts |
24 | 15 | ||||||
| Others |
646 | 28 | ||||||
|
|
|
|
|
|||||
| $ | 29,809 | $ | 33,047 | |||||
| Valuation allowance |
(729 | ) | (665 | ) | ||||
|
|
|
|
|
|||||
| Deferred tax assets |
$ | 29,080 | $ | 32,382 | ||||
|
|
|
|
|
|||||
| Deferred tax liabilities: |
||||||||
| Unrealized exchange gain |
$ | 667 | $ | — | ||||
| Intangible assets |
11,973 | 13,170 | ||||||
|
|
|
|
|
|||||
| Deferred tax liabilities: |
$ | 12,640 | $ | 13,170 | ||||
|
|
|
|
|
|||||
| Net deferred tax assets |
$ | 16,440 | $ | 19,212 | ||||
|
|
|
|
|
|||||
Deferred tax assets and liabilities are recognized for future tax consequences attributable to temporary differences between the financial statement carrying values of assets and liabilities and their respective tax bases and operating loss carry forwards. At December 31, 2014 and 2013, the Company performed an analysis of the deferred tax asset valuation allowance for net operating loss carry forward for its domestic entities. Based on this analysis, the Company continues to carry a valuation allowance on the deferred tax assets on certain net operating loss carry forwards. Accordingly, the Company had recorded a valuation allowance of $665 each as of December 31, 2014 and 2013. The Company also recorded a valuation allowance of $64 related to tax credit carry forward during the year ended December 31, 2014.
As a result of the multiple acquisitions over the last few years, the Company acquired federal and state net operating losses in the United States. Thus, as of December 31, 2014 and 2013, the Company has federal net operating loss carry forwards of approximately $25,300 and $26,900 respectively, which expire through various years until 2032. The Company’s federal net operating loss carry forwards are subject to certain annual utilization limitations under Section 382 of the United States Internal Revenue Code. The Company also has state and local net operating loss carry forwards of varying amounts, which are subject to limitations under the applicable rules and regulations of those taxing jurisdictions. The Company estimates that it will be able to utilize all of the losses before their expiration.
At December 31, 2014 and 2013, no deferred income taxes have been provided for the Company’s share of undistributed net earnings of foreign operations due to management’s intent to reinvest such amounts indefinitely. The determination of the amount of such unrecognized deferred taxes is not practicable. Those earnings totaled approximately $222,292 and $185,596 as of December 31, 2014 and 2013, respectively.
F-36
Table of Contents
EXLSERVICE HOLDINGS, INC.
NOTES TO CONSOLIDATED FINANCIAL STATEMENTS—(continued)
December 31, 2014
(In thousands, except share and per share amounts)
The Company’s income tax expense also includes the impact of provisions established for uncertain income tax positions determined in accordance with ASC topic 740, “Income Taxes” (“ASC No. 740”), as well as the related net interest. Tax exposures can involve complex issues and may require an extended resolution period. Although the Company believes that it has adequately reserved for its uncertain tax positions, no assurance can be given that the final tax outcome of these matters will not be different. The Company adjusts these reserves in light of changing facts and circumstances, such as the closing of a tax audit or the refinement of an estimate. To the extent that the final tax outcome of these matters differs from the amounts recorded, such differences will impact the income tax expense in the period in which such determination is made.
The following table summarizes the activity related to the gross unrecognized tax benefits from January 1, 2014 through December 31, 2014:
| Balance as of January 1, 2014 |
$ | 4,913 | ||
| Increases related to prior year tax positions |
— | |||
| Decreases related to prior year tax positions |
(2,173 | ) | ||
| Increases related to current year tax positions |
— | |||
| Decreases related to current year tax positions |
— | |||
| Effect of exchange rate changes |
21 | |||
|
|
|
|||
| Balance as of December 31, 2014 |
$ | 2,761 | ||
|
|
|
The unrecognized tax benefits as of December 31, 2014 of $2,761, if recognized, would impact the effective tax rate.
The Company has recognized interest of $276 and $283 during the year ended December 31, 2014 and 2013, respectively, which is included in the income tax expense in the consolidated statements of income. As of December 31, 2014 and 2013, the Company has accrued interest and penalties of $1,117 and $863 relating to unrecognized tax benefits.
The unrecognized tax benefits may increase or decrease in the next twelve months depending on the Company’s tax positions.
14. Stock Based Compensation
In 2006, the Company instituted the ExlService Holdings, Inc. 2006 Omnibus Award Plan (the 2006 Plan) which replaced the 2003 Plan. The 2006 Plan covers all of the employees of the Company. Under the 2006 Plan, the Compensation Committee (“the Committee”) may grant awards of nonqualified stock options, incentive stock options, stock appreciation rights, restricted stock, restricted stock units, stock bonus awards, performance based compensation awards (including cash bonus awards and market condition based awards) or any combination of the foregoing.
The Committee determines which employees are eligible to receive the equity awards, the number of equity awards to be granted, the exercise price, the vesting period and the exercise period. The vesting period for the equity award issued is determined on the date of the grant and is non-transferable during the life of the equity award. The majority of options expire ten years from the date of grant and generally vest incrementally over a period of four years from the date of grant with 10% vesting at the end of year one, 20% vesting at the end of year two, 30% vesting at the end of year three and 40% vesting at the end of year four. Pursuant to the 2006 Plan,
F-37
Table of Contents
EXLSERVICE HOLDINGS, INC.
NOTES TO CONSOLIDATED FINANCIAL STATEMENTS—(continued)
December 31, 2014
(In thousands, except share and per share amounts)
the Company reserved 3,399,384 shares of common stock (in addition to the available pool of 329,854 shares from the 2003 plan) for the granting of equity awards. If an employee resigns or is terminated, the employee must exercise any vested options within 90 days after termination or the vested options are forfeited. At a special meeting of the Company’s stockholders held on January 29, 2009, the Company’s stockholders approved, among other things, an amendment to the 2006 Plan to increase the number of shares of its common stock issuable there under by 4,000,000 shares, which brought the total number of shares reserved under the plan to 7,729,238.
The Company applies the provisions of ASC No. 718, to account for it’s stock based compensation, using the modified prospective method of transition. Under the provisions of this guidance, the estimated fair value of share-based awards granted under stock incentive plans is recognized as compensation expense over the vesting period.
Stock Options
The following costs related to the Company’s stock-based compensation plan are included in the consolidated statements of income:
| Year ended December 31, | ||||||||||||
| 2014 | 2013 | 2012 | ||||||||||
| Cost of revenue |
$ | 2,290 | $ | 2,413 | $ | 1,893 | ||||||
| General and administrative expenses |
4,350 | 5,077 | 4,551 | |||||||||
| Selling and marketing expenses |
4,371 | 4,342 | 2,972 | |||||||||
|
|
|
|
|
|
|
|||||||
| Total |
$ | 11,011 | $ | 11,832 | $ | 9,416 | ||||||
|
|
|
|
|
|
|
|||||||
The fair value of each stock option granted to employees is estimated on the date of grant using the Black-Scholes option-pricing model with the following weighted average assumptions:
| Year ended December 31, | ||||||||||||
| 2014 | 2013 | 2012 | ||||||||||
| Dividend yield |
0 | % | 0 | % | 0 | % | ||||||
| Expected life (years) |
5.50 | 5.50 | 5.38 | |||||||||
| Risk free interest rate |
1.84 | % | 0.87 | % | 0.97 | % | ||||||
| Volatility |
35 | % | 40 | % | 40 | % | ||||||
The estimated expected term of options granted has been based on historical experience, which is representative of the expected term of the options. Volatility has been calculated based on the volatility of the Company’s common stock and the volatility of stocks of comparative companies. The risk-free interest rate that the Company uses in the option valuation model is based on U.S. treasury zero-coupon bonds with a remaining term similar to the expected term of the options.
The Company does not anticipate paying any cash dividends in the foreseeable future and therefore uses an expected dividend yield of zero in the option valuation model. The Company is required to estimate forfeitures at the time of grant and revise those estimates in subsequent periods if actual forfeitures differ from those estimates. The Company uses historical data to estimate pre-vesting option forfeitures and records stock-based compensation expense only for those awards that are expected to vest. All stock-based payment awards are amortized on a straight-line basis over the requisite service periods of the awards, which are generally the vesting periods.
F-38
Table of Contents
EXLSERVICE HOLDINGS, INC.
NOTES TO CONSOLIDATED FINANCIAL STATEMENTS—(continued)
December 31, 2014
(In thousands, except share and per share amounts)
Stock option activity under the Company’s stock plans is shown below:
| Number of Options |
Weighted- Average Exercise Price |
Aggregate Intrinsic Value |
Weighted- Average Remaining Contractual Life (Years) |
|||||||||||||
| Outstanding at December 31, 2011 |
3,030,128 | $ | 13.22 | |||||||||||||
| Granted |
416,129 | 25.36 | ||||||||||||||
| Exercised |
(793,053 | ) | 12.11 | |||||||||||||
| Forfeited |
(198,570 | ) | 17.35 | |||||||||||||
|
|
|
|
|
|||||||||||||
| Outstanding at December 31, 2012 |
2,454,634 | $ | 15.30 | |||||||||||||
| Granted |
14,301 | 26.76 | ||||||||||||||
| Exercised |
(485,141 | ) | 11.32 | |||||||||||||
| Forfeited |
(27,279 | ) | 24.13 | |||||||||||||
|
|
|
|
|
|||||||||||||
| Outstanding at December 31, 2013 |
1,956,515 | $ | 16.25 | |||||||||||||
| Granted |
9,794 | 27.62 | ||||||||||||||
| Exercised |
(440,380 | ) | 14.67 | |||||||||||||
| Forfeited |
(92,750 | ) | 25.20 | |||||||||||||
|
|
|
|
|
|
|
|
|
|||||||||
| Outstanding at December 31, 2014 |
1,433,179 | $ | 16.23 | $ | 17,889 | 4.47 | ||||||||||
|
|
|
|
|
|
|
|
|
|||||||||
| Vested and exercisable at December 31, 2014 |
1,211,570 | $ | 14.95 | $ | 16,672 | 4.04 | ||||||||||
|
|
|
|||||||||||||||
| Available for grant at December 31, 2014 |
1,282,796 | |||||||||||||||
|
|
|
|||||||||||||||
The unrecognized compensation cost for unvested options as of Dec 31, 2014 is $888 which is expected to be expensed over a weighted average period of 0.98 years. The weighted-average fair value of options granted during the years ended December 31, 2014, 2013 and 2012 was $9.77, $10.07 and $9.43, respectively. The total grant date fair value of options vested during the years ended December 31, 2014, 2013 and 2012 was $2,112, $3,061 and $3,000, respectively. The aggregate intrinsic value of options exercised during the years ended December 31, 2014, 2013 and 2012 was $5,757, $8,960 and $12,020, respectively.
The following table summarizes the status of the Company’s stock options outstanding and stock options vested and exercisable at December 31, 2014:
| Options Outstanding | Options Vested and Exercisable | |||||||||||||||
| Range of Exercise Prices |
Shares | Weighted- Average Exercise Price |
Shares | Weighted- Average Exercise Price |
||||||||||||
| $8.00 to $15.00 |
666,093 | 10.19 | 666,093 | 10.19 | ||||||||||||
| $15.01 to $21.00 |
373,644 | 18.51 | 305,893 | 18.24 | ||||||||||||
| $21.01 to $28.00 |
393,442 | 24.29 | 239,584 | 23.99 | ||||||||||||
|
|
|
|
|
|
|
|
|
|||||||||
| Total |
1,433,179 | $ | 16.23 | 1,211,570 | $ | 14.95 | ||||||||||
|
|
|
|
|
|
|
|
|
|||||||||
F-39
Table of Contents
EXLSERVICE HOLDINGS, INC.
NOTES TO CONSOLIDATED FINANCIAL STATEMENTS—(continued)
December 31, 2014
(In thousands, except share and per share amounts)
Restricted Stock and Restricted Stock Units
An award of restricted stock is a grant of shares subject to conditions and restrictions set by the Committee. The grant or the vesting of an award of restricted stock may be conditioned upon service to the Company or its affiliates or upon the attainment of performance goals or other factors, as determined in the discretion of the Committee. The Committee may also, in its discretion, provide for the lapse of restrictions imposed upon an award of restricted stock. Holders of an award of restricted stock may have, with respect to the restricted stock granted, all of the rights of a stockholder, including the right to vote and to receive dividends.
The Committee is authorized to award restricted stock units to participants. The Committee establishes the terms, conditions and restrictions applicable to each award of restricted stock units, including the time or times at which restricted stock units will be granted or vested and the number of units to be covered by each award. The terms and conditions of each restricted stock award will be reflected in a restricted stock unit agreement.
Any cash or in-kind dividends paid with respect to unvested shares of restricted stock and restricted stock units are withheld by the Company and paid to the holder of such shares of restricted stock, without interest, only if and when such shares of restricted stock and restricted stock units vest. Any unvested shares of restricted stock and restricted stock units are immediately forfeited without consideration upon the termination of holder’s employment with the Company or its affiliates. Accordingly, the Company’s unvested restricted stock and restricted stock units do not include non-forfeitable rights to dividends or dividend equivalents and are therefore not considered as participating securities for purposes of earnings per share calculations pursuant to the two-class method.
Restricted stock and restricted stock unit activity under the Company’s stock plans is shown below:
| Restricted Stock | Restricted Stock Units | |||||||||||||||
| Number | Weighted- Average Intrinsic Value |
Number | Weighted- Average Intrinsic Value |
|||||||||||||
| Outstanding at December 31, 2011 |
63,834 | $ | 18.41 | 939,659 | $ | 19.40 | ||||||||||
| Granted |
— | — | 389,050 | 25.07 | ||||||||||||
| Vested |
(55,726 | ) | 18.26 | (198,842 | ) | 19.27 | ||||||||||
| Forfeited |
(2,901 | ) | 23.82 | (103,956 | ) | 21.41 | ||||||||||
|
|
|
|
|
|
|
|
|
|||||||||
| Outstanding at December 31, 2012 |
5,207 | $ | 17.58 | 1,025,911 | $ | 21.36 | ||||||||||
| Granted |
— | — | 522,130 | 29.37 | ||||||||||||
| Vested |
(4,807 | ) | 17.56 | (300,316 | ) | 20.35 | ||||||||||
| Forfeited |
(400 | ) | 17.72 | (103,283 | ) | 25.04 | ||||||||||
|
|
|
|
|
|
|
|
|
|||||||||
| Outstanding at December 31, 2013* |
— | $ | — | 1,144,442 | $ | 24.95 | ||||||||||
| Granted |
46,950 | 29.29 | 634,054 | 26.26 | ||||||||||||
| Vested |
— | — | (436,660 | ) | 22.04 | |||||||||||
| Forfeited |
— | — | (152,145 | ) | 26.28 | |||||||||||
|
|
|
|
|
|
|
|
|
|||||||||
| Outstanding at December 31, 2014* |
46,950 | $ | 29.29 | 1,189,691 | $ | 26.54 | ||||||||||
|
|
|
|
|
|
|
|
|
|||||||||
| * | Excludes 28,000 and 20,000 restricted stock units vested during the years ended December 31, 2014 and 2013, respectively (128,000 and 112,000 as of December 31, 2014 and 2013, respectively) for which the underlying common stock is yet to be issued. |
F-40
Table of Contents
EXLSERVICE HOLDINGS, INC.
NOTES TO CONSOLIDATED FINANCIAL STATEMENTS—(continued)
December 31, 2014
(In thousands, except share and per share amounts)
The fair value of restricted stock and restricted stock units is generally the market price of the Company’s shares on the date of grant. As of December 31, 2014, unrecognized compensation cost of $24,712 is expected to be expensed over a weighted average period of 2.56 years. The weighted-average fair value of restricted stock and restricted stock units granted during the years ended December 31, 2014, 2013 and 2012 was $26.47, $29.37 and $25.07, respectively. The total grant date fair value of restricted stock and restricted stock units vested during the years ended December 31, 2014, 2013 and 2012 was $11,393, $9,126 and $7,010, respectively.
During the year ended December 31, 2014, the Company granted 46,950 restricted stock and 87,650 restricted stock units in connection with the Blue Slate and Overland acquisitions, respectively. The fair value of these grants will be recognized as compensation expense over the vesting period.
Performance Based Stock Awards
On February 13, 2014, the Compensation Committee of the Board of Directors of the Company approved the program allowing for the grant of performance-based restricted stock units (“PRSUs”) to executive officers and other specified employees under its existing 2006 Omnibus Award Plan.
Under this program, 50% of the PRSUs will cliff vest at the end of a three-year period based on a revenue target for 2016 (“PUs”). However, up to one-third of the PUs may be earned based on the Company’s revenue performance in each of 2014 and 2015 against annual revenue targets in those years. The total amount of PUs that the recipient earns based on these performance criteria, will be the greater of (i) the PUs earned in 2016 and (ii) the sum of the earned PUs in 2014 and 2015. The other 50% shall be based on a market condition (“MUs”) that is contingent on meeting or exceeding the total shareholder return relative to a group of peer companies specified under the program, measured over a three-year performance period. The award recipient may earn up to two hundred percent (200%) of the PRSUs granted based on the actual performance for both kinds of PRSUs.
The fair value of each PU was determined based on the market price of one common share of the Company on the date of grant, and the associated compensation expense was calculated on the basis that performance targets to receive 100% of the PUs is probable of being achieved. The compensation expense for the PUs is recognized on a straight-line basis over the service period, which is through the end of 2016. Over this period, the number of shares that will be issued will be adjusted upward or downward based upon the probability of achievement of the performance targets. The ultimate number of shares issued and the related compensation cost recognized as an expense will be based on a comparison of the final performance metrics to the specified targets.
The grant date fair value for the MUs was determined using a Monte Carlo simulation model and the related compensation expense will be expensed on a straight-line basis over the vesting period. All compensation expense related to the MUs will be recognized if the requisite performance period is fulfilled, even if the market condition is not achieved.
The Monte-Carlo simulation model simulates a range of possible future stock prices and estimates the probabilities of the potential payouts. This model also incorporates the following ranges of assumptions:
| • | The historical volatilities are used over the most recent three-year period for the components of the peer group. |
| • | The risk-free interest rate is based on the U.S. Treasury rate assumption commensurate with the three-year performance period. |
F-41
Table of Contents
EXLSERVICE HOLDINGS, INC.
NOTES TO CONSOLIDATED FINANCIAL STATEMENTS—(continued)
December 31, 2014
(In thousands, except share and per share amounts)
| • | Since the plan stipulates that the awards are based upon the TSR of the Company and the components of the peer group, it is assumed that the dividends get reinvested in the issuing entity on a continuous basis. |
| • | The correlation coefficients are used to model the way in which each entity tends to move in relation to each other are based upon the price data used to calculate the historical volatilities. |
Performance restricted stock unit activity under the Company’s stock plans is shown below:
| Revenue Based PRSUs | Market Condition Based PRSUs | |||||||||||||||
| Number | Weighted Avg Fair Value |
Number | Weighted Avg Fair Value |
|||||||||||||
| Outstanding at December 31, 2013 |
— | $ | — | — | $ | — | ||||||||||
| Granted |
55,475 | 25.63 | 55,475 | 33.60 | ||||||||||||
| Vested |
— | — | — | — | ||||||||||||
| Forfeited |
(7,750 | ) | 25.63 | (7,750 | ) | 33.60 | ||||||||||
|
|
|
|
|
|
|
|
|
|||||||||
| Outstanding at December 31, 2014 |
47,725 | $ | 25.63 | 47,725 | $ | 33.60 | ||||||||||
|
|
|
|
|
|
|
|
|
|||||||||
As of December 31, 2014, unrecognized compensation cost of $2,086 is expected to be expensed over a weighted average period of two years.
Subsequent to December 31, 2014, the Company granted approximately 127,000 PRSUs and 336,000 restricted stock units to its employees.
15. Geographical Information
The Company attributes the revenues to regions based upon location of its customers.
| Year ended December 31, | ||||||||||||
| 2014 | 2013 | 2012 | ||||||||||
| Revenues, net |
||||||||||||
| United States |
$ | 368,870 | $ | 353,274 | $ | 320,246 | ||||||
| United Kingdom |
101,789 | 92,601 | 89,483 | |||||||||
| Rest of World |
28,619 | 32,577 | 33,201 | |||||||||
|
|
|
|
|
|
|
|||||||
| $ | 499,278 | $ | 478,452 | $ | 442,930 | |||||||
|
|
|
|
|
|
|
|||||||
| December 31, 2014 |
December 31, 2013 |
|||||||
| Fixed assets, net |
||||||||
| India |
$ | 24,186 | $ | 21,433 | ||||
| United States |
8,293 | 3,981 | ||||||
| Philippines |
12,391 | 8,409 | ||||||
| Rest of World |
499 | 741 | ||||||
|
|
|
|
|
|||||
| $ | 45,369 | $ | 34,564 | |||||
|
|
|
|
|
|||||
F-42
Table of Contents
EXLSERVICE HOLDINGS, INC.
NOTES TO CONSOLIDATED FINANCIAL STATEMENTS—(continued)
December 31, 2014
(In thousands, except share and per share amounts)
16. Commitments and Contingencies
Fixed Asset Commitments
At December 31, 2014, the Company has committed to spend approximately 12,200 under agreements to purchase fixed assets. This amount is net of capital advances paid in respect of these purchases.
Other Commitments
Certain units of the Company’s Indian subsidiaries were established as 100% Export-Oriented units or under the Software Technology Parks of India (“STPI”) scheme promulgated by the Government of India. These units are exempt from customs, central excise duties, and levies on imported and indigenous capital goods, stores, and spares. The Company has undertaken to pay custom duties, service taxes, levies, and liquidated damages payable, if any, in respect of imported and indigenous capital goods, stores and spares consumed duty free, in the event that certain terms and conditions are not fulfilled. The Company’s management believes, however, that these units have in the past satisfied and will continue to satisfy the required conditions.
The Company’s operations centers in the Philippines are registered with the Philippine Economic Zone Authority (“PEZA”). The registration provides the Company with certain fiscal incentives on the import of capital goods and requires Exl Philippines to meet certain performance and investment criteria. The Company’s management believes that these centers have in the past satisfied and will continue to satisfy the required criteria.
Contingencies
U.S. and Indian transfer pricing regulations require that any international transaction involving associated enterprises be at an arm’s-length price. Accordingly, the Company determines the appropriate pricing for the international transactions among its associated enterprises on the basis of a detailed functional and economic analysis involving benchmarking against transactions among entities that are not under common control. The tax authorities have jurisdiction to review this arrangement and in the event that they determine that the transfer price applied was not appropriate, the Company may incur increased tax liability, including accrued interest and penalties. The Company is currently involved in disputes with the Indian tax authorities over the application of some of its transfer pricing policies for some of its subsidiaries. Further, the Company and its U.S. subsidiary, ExlService.com LLC are engaged in tax litigation with the income-tax authorities in India on the issue of permanent establishment.
The aggregate disputed amount demanded by Income tax authorities from the Company related to its transfer pricing issues for various years ranging from tax years 2003 to 2011 and its permanent establishment issues ranging from tax years 2003 to 2007 as of December 31, 2014 and 2013 is $22,866 and $14,742, respectively of which the Company has already made payment or provided bank guarantee to the extent $14,666 and $13,797, respectively. Subsequent to December 31, 2014, the Company received tax demands from the Income tax authorities of $1,235 related to the tax year 2011 for some of its foreign subsidiaries. Amounts paid as deposits in respect of such assessments aggregating to $12,564 and $11,653 as of December 31, 2014 and 2013, respectively, are included in “Other assets” and amounts deposited for bank guarantees aggregating to $2,102 and $2,144 as of December 31, 2014 and 2013, respectively, are included in “Restricted cash” in the non-current assets section of the Company’s consolidated balance sheets as of December 31, 2014 and 2013.
Based on advice from its Indian tax advisors, the facts underlying the Company’s position and its experience with these types of assessments, the Company believes that the probability that it will ultimately be found liable
F-43
Table of Contents
EXLSERVICE HOLDINGS, INC.
NOTES TO CONSOLIDATED FINANCIAL STATEMENTS—(continued)
December 31, 2014
(In thousands, except share and per share amounts)
for these assessments is remote and accordingly has not accrued any amount with respect to these matters in its consolidated financial statements. The Company does not expect any impact from these assessments on its future income tax expense. It is possible that the Company might receive similar orders or assessments from tax authorities for subsequent years. Accordingly even if these disputes are resolved, the Indian tax authorities may still serve additional orders or assessments.
17. Subsequent Events
Acquisition of RPM Direct LLC and RPM Data Solutions, LLC.
On February 23, 2015, the Company together with its wholly-owned subsidiary ExlService.com LLC (“ExlService.com”), entered into a Securities Purchase Agreement dated February 23, 2015 (the “Purchase Agreement”), with RPM Direct LLC (“RPM”), RPM Data Solutions, LLC (“RDS” and, with RPM, each a “Target Company” and together the “Target Companies”) and the security holders of each of RPM and RDS (collectively, the “Sellers”), pursuant to which ExlService.com agreed to acquire all of the issued and outstanding limited liability company membership interests or other equity securities of the Target Companies (the “Securities”), subject to customary closing conditions (the “Acquisition”).
The aggregate purchase price for all of the Securities, payable in accordance with the terms and conditions of the Purchase Agreement, shall be an amount equal to $47,000 in cash at closing plus the ability to earn up to an additional $23,000 based on the achievement of certain performance goals by the Target Companies during the 2015 and 2016 calendar years, plus $4,150 of restricted stock. The purchase price is subject to adjustment based on the Target Companies’ and its Subsidiary’s working capital position as of the closing of the Acquisition and as otherwise set forth in the Purchase Agreement.
RPM specializes in analyzing large consumer data sets to segment populations, predict response rates, forecast customer lifetime value and design targeted, multi-channel marketing campaigns. RPM has focused on the insurance industry, including property & casualty, life and health, since its inception in 2001.
First Amendment to Credit Agreement and Incremental Facility Agreement
As described above in Note 10, the Company and certain of its subsidiaries entered into a Credit Agreement with certain lenders and JPMorgan Chase Bank, N.A., as administrative agent, on October 24, 2014. The Credit Agreement provides for a $50,000 revolving credit facility. The Company had an option to increase the commitments under the Credit Agreement, subject to certain approvals and conditions as set forth in the Credit Agreement. On February 23, 2015, the Company exercised its option to increase credit commitments by another $50,000 with the same terms and conditions which were available in the Credit Agreement.
Borrowings under the Credit Agreement may be used for working capital, general corporate purposes of the Company and its subsidiaries and for acquisitions.
F-44