Attached files
| file | filename |
|---|---|
| EXCEL - IDEA: XBRL DOCUMENT - Borderfree, Inc. | Financial_Report.xls |
| EX-23.1 - EXHIBIT 23.1 - Borderfree, Inc. | ex231consent.htm |
| EX-32.1 - EXHIBIT 32.1 - Borderfree, Inc. | section906certs-20141231.htm |
| EX-31.1 - EXHIBIT 31.1 AND 31.2 - Borderfree, Inc. | section302certs-20141231.htm |
UNITED STATES
SECURITIES AND EXCHANGE COMMISSION
WASHINGTON, D.C. 20549
FORM 10-K
(Mark One)
x ANNUAL REPORT PURSUANT TO SECTION 13 OR 15(d) OF THE SECURITIES EXCHANGE ACT OF 1934
For the Fiscal Year Ended December 31, 2014
OR
¨ TRANSITION REPORT PURSUANT TO SECTION 13 OR 15(d) OF THE SECURITIES EXCHANGE ACT OF 1934
Commission File Number: 001-36359
BORDERFREE, INC.
(Exact name of registrant as specified in its charter)
Delaware | 52-2216062 | |||
(State or other jurisdiction of incorporation or organization) | (I.R.S. Employer Identification Number) | |||
292 Madison Avenue, 5th Floor
New York, New York 10017
(Address of principal executive offices) (Zip Code)
Registrant's telephone number, including area code:
(212) 299-3500
Securities Registered pursuant to Section 12(b) of the Act:
Title of each class | Name of each exchange on which registered | |
Common Stock, $0.01 par value per share | The NASDAQ Stock Market LLC | |
Securities registered pursuant to Section 12(g) of the Act: None
Indicate by check mark if the registrant is a well-known seasoned issuer, as defined in Rule 405 of the Securities Act. Yes ¨ No x
Indicate by check mark if the registrant is not required to file reports pursuant to Section 13 or Section 15(d) of the Act. Yes ¨ No x
Indicate by check mark whether the registrant (1) has filed all reports required to be filed by Section 13 or 15(d) of the Securities Exchange Act of 1934 during the preceding 12 months (or for such shorter period that the registrant was required to file such reports), and (2) has been subject to such filing requirements for the past 90 days. Yes x No ¨
Indicate by check mark whether the registrant has submitted electronically and posted on its corporate Web site, if any, every Interactive Data File required to be submitted and posted pursuant to Rule 405 of Regulation S-T during the preceding 12 months (or for such shorter period that the registrant was required to submit and post such files). Yes x No ¨
Indicate by check mark if disclosure of delinquent filers pursuant to Item 405 of Regulation S-K is not contained herein, and will not be contained, to the best of registrant’s knowledge, in definitive proxy or information statements incorporated by reference in Part III of this Form 10-K or any amendment to this Form 10-K. x
Indicate by check mark whether the registrant is a large accelerated filer, an accelerated filer, a non-accelerated filer, or a smaller reporting company. See the definitions of "large accelerated filer," "accelerated filer" and "smaller reporting company" in Rule 12b-2 of the Exchange Act.
Large accelerated filer | ¨ | Accelerated filer | ¨ | |
Non-accelerated filer | x | (Do not check if a smaller reporting company) | Smaller reporting company | ¨ |
Indicate by check mark whether the registrant is a shell company (as defined in Rule 12b-2 of the Exchange Act). Yes ¨ No x
The aggregate market value of common stock held by non-affiliates of the registrant based on the closing price of the registrant’s common stock as reported on NASDAQ on June 30, 2014, was $167.5 million. Shares of voting and non-voting stock held by executive officers, directors and holders of more than 5% of the outstanding stock have been excluded from this calculation because such persons or institutions may be deemed affiliates. This determination of affiliate status is not a conclusive determination for other purposes.
The number of shares of common stock, par value $0.01 per share, outstanding as of February 25, 2014 was 31,961,225.
Documents Incorporated by Reference
Portions of the registrant’s definitive proxy statement for its annual meeting of stockholders, which the registrant intends to file pursuant to Regulation 14A with the Securities and Exchange Commission not later than 120 days after the registrant’s fiscal year end of December 31, 2014, are incorporated by reference into Part III of this Form 10-K.
BORDERFREE, INC.
INDEX TO FORM 10-K
Part I | Page | |
Item 1. | ||
Item 1A. | ||
Item 1B. | ||
Item 2. | ||
Item 3. | ||
Item 4. | ||
Part II | ||
Item 5. | ||
Item 6. | ||
Item 7. | ||
Item 7A. | ||
Item 8. | ||
Item 9. | ||
Item 9A. | ||
Item 9B. | ||
Part III | ||
Item 10. | ||
Item 11. | ||
Item 12. | ||
Item 13. | ||
Item 14. | ||
Part IV | ||
Item 15. | ||
1
SPECIAL NOTE REGARDING FORWARD-LOOKING STATEMENTS
This Annual Report on Form 10-K contains forward-looking statements within the meaning of Section 27A of the Securities Act of 1933, as amended, and Section 21E of the Securities Exchange Act of 1934, as amended, or the Exchange Act. All statements other than statements relating to historical matters should be considered forward-looking statements. In addition, forward-looking statements may consist of statements including such words as “may,” “believe,” “could,” “anticipate,” “would,” “might,” “plan,” “expect,” and similar expressions or the negative of such terms or other comparable terminology. These forward-looking statements speak only as of the date of this Annual Report on Form 10-K and are subject to business and economic risks. These statements are not guarantees of future performance and involve certain risks, uncertainties, and assumptions that are difficult to predict, and you should not place undue reliance on our forward-looking statements. Our actual results could differ materially from those set forth in the forward-looking statements as a result of a number of important factors, including the factors set forth in Part I, Item 1A, “Risk Factors,” and elsewhere in this Annual Report on Form 10-K and in our other reports filed with the Securities and Exchange Commission, or SEC. We expressly disclaim any obligation to update the forward-looking statements to reflect events or circumstances that arise after the date hereof.
ITEM 1. BUSINESS
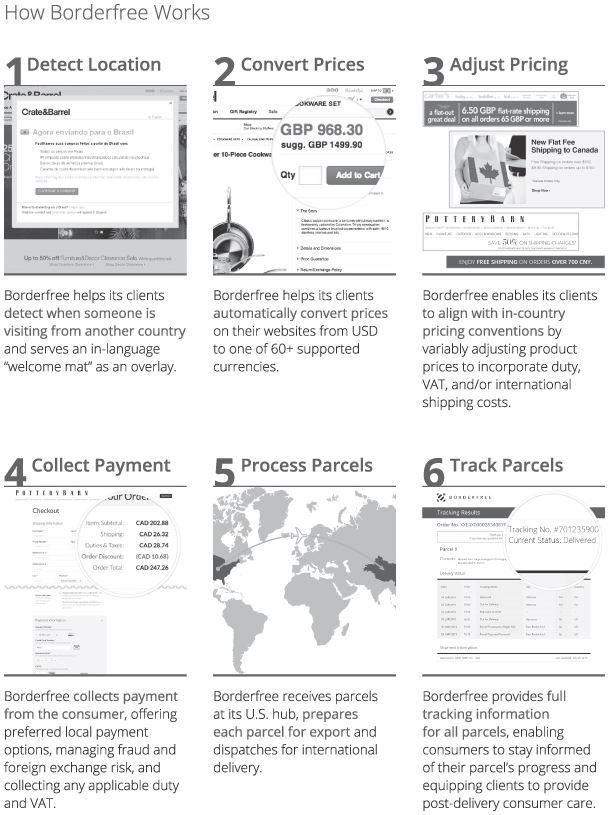
We are a market leader in global ecommerce, operating a proprietary technology and services platform to enable U.S. retailers to transact with consumers in more than 100 countries and territories worldwide. Borderfree delivers a comprehensive cross-border ecommerce solution available through a single unified platform enabling retailers to capitalize on the large cross-border market opportunity. Our customers, comprised of the retailers and brands that integrate our solution, use our highly scalable Borderfree platform to develop a seamless global ecommerce business across web, mobile and in-store channels to transact with international shoppers, who we refer to as consumers. Borderfree manages all aspects of the international shopping experience, including site localization, multi-currency pricing, payment processing, fraud management, landed cost calculation, customs clearance and brokerage, and global logistics services while maintaining the integrity of our customers’ brands and the consumer experience. Our integrated cross-border solution enables retailers to begin selling internationally typically within 90 days without the need to invest in expensive infrastructure, software, in-house compliance expertise or international vendor relationships. In addition, as a result of our scale and experience in international ecommerce, we have amassed a substantial amount of data that enables us to provide actionable marketing and merchandising insights to our customers to help grow their global sales.
Today, we are enabling the online international expansion initiatives of some of the largest U.S. retailers and brands, including J. Crew, Lands’ End, Macy’s, Neiman Marcus, Sephora, Under Armour, and Williams-Sonoma. We refer to U.S. retailers and brands as our customers and the shoppers transacting with them as consumers. As of December 31, 2014, our platform was powering the global expansion of 171 ecommerce sites for 96 customers.
We derive ecommerce revenue from fees paid to us by our customers based on a percentage of their sales generated through our platform and foreign exchange and other transaction related fees payable by consumers. We generate additional revenue from fulfillment services. We operate our business through an asset-light model, requiring minimal capital investment, which allows us to scale our business in a cost effective and efficient manner. Our customer contracts typically have multi-year initial terms ranging from one to four years, followed by one-year renewal periods.
Founded in 1999, we initially came to market with a patented foreign exchange technology solution that allowed ecommerce retailers to automatically present and settle transactions in the preferred currencies of their global consumers. As our business evolved, we realized that the problems retailers faced selling internationally went beyond foreign exchange to include localization, payments and logistical complexities. In response to these challenges we developed a comprehensive global ecommerce technology and service offering and renamed our company FiftyOne. The commercial launch of our global ecommerce platform occurred in 2008. In 2013, following the 2012 acquisition of the Borderfree business unit of Canada Post Corporation, we changed our name to Borderfree. In January 2015, we acquired Bundle Tech Limited, the operator of DutyCalculator, a provider of cloud-based global trade and customs compliance data services.
2
We processed $547 million, $448 million and $302 million of gross merchandise volume, or GMV, on our platform during 2014, 2013, and 2012, representing period over period growth of 22%, 48% and 120%, respectively. We experienced similar growth in revenue, generating revenue of $125 million, $110 million and $81 million in the same periods, representing period over period revenue growth of 14%, 36%, and 114% respectively. Additionally, global ecommerce services revenue grew 23%, 52%, and 111% over the same periods, respectively. We had net loss of $3.1 million and $0.7 million for the year ended December 31, 2014 and 2013, respectively, and net income of $0.2 million in 2012. For a definition of GMV see "Management's Discussion and Analysis of Financial Condition and Results of Operations" under Item 7 of this Annual Report on Form 10-K.
Market Opportunity
As a global ecommerce platform for online retailers, we benefit from international trends in ecommerce.
Ecommerce: a Large and Growing Global Market
The global mass migration of consumers from physical to online retail channels provides ecommerce retailers significant opportunities to serve markets outside the traditional scope of their business. Increasingly, consumers expect the ability to easily and seamlessly make online purchases from retailers without having to give much thought or consideration as to where that retailer is located, where the product is located, or how it will get to the consumer as long as the shopping experience is comfortable and the act of fulfilling the transaction is secure, timely, and problem free.
Strong demand for U.S. brands from global consumers provides U.S. retailers significant opportunities to serve markets outside the United States. Many U.S. brands have strong reputations internationally, with U.S. brands accounting for 54% of Interbrand’s Top 100 global brands in 2014. Prestige, product selection, price, and quality are just a few of the factors driving demand for U.S. brands by global consumers across the world. At the same time, technology trends such as broadband penetration and mobile device proliferation are making it easier for global consumers to purchase from brands located in the U.S. or other parts of the world.
While Canada, Australia, the U.S. (for U.K. retailers) and the U.K. (for U.S. retailers) are natural markets for U.S. and U.K. retailers looking to expand internationally given the common language, cultural similarities, and an established ecommerce market, demand for goods from retailers based in these countries is significant throughout the world. Additional markets for our retailers include major non-English speaking developed economies such as France, Germany and Japan, and fast growing, emerging markets including China, Mexico, South Korea and the Middle East.
Given our focus on cross-border ecommerce, our addressable market is comprised of physical goods which can be shipped cost effectively, like apparel, handbags, jewelry, sporting goods, home décor, and toys, and therefore does not include digital goods and services, such as music downloads and travel. Many U.S. retailers are targeting faster growing international markets to boost the growth of their ecommerce businesses and take a larger share of the global ecommerce market.
The Under-monetized Cross Border Ecommerce Opportunity
We believe that the current cross-border ecommerce market is under-monetized and that U.S. and U.K. retailers not selling internationally today, or doing so in a non-optimized way, are missing out on significant demand from international consumers that, if served, could generate significant incremental ecommerce revenues for those retailers. We believe that the percentage of visitor traffic from international consumers will grow as internet penetration increases internationally, driving more global consumers to shop online with foreign retailers for the greater product selection from their favorite international brands.
We believe that a large opportunity exists globally for retailers and brands seeking to sell products to consumers outside of their home markets, which could represent an expansion of our total addressable market. We believe that by helping retailers everywhere export to anywhere in the world, we can tap into this large global market opportunity.
3
Challenges of Selling to Global Consumers
Challenges for Retailers
Selling globally can be expensive and complicated. There are currently two in-house alternatives to sell to global consumers, cross-border trading and establishing an in-country presence.
Cross-border Trading
Retailers selling to global consumers directly from their domestic website face challenges and risks including:
• | complicated import and export regulations and restrictions, which vary by country, product and quantity, and require costly resources to ensure compliance; |
• | an increased risk of credit card fraud; |
• | lower sales conversion rates due to factors including higher shipping costs, unexpected customs and duties, limited local currency payment options and narrower product selection; |
• | difficulty in tailoring the product offerings on its domestically-based website to global consumers in different markets; |
• | damage to their overall brand image if they provide a frustrating consumer experience; and |
• | foreign exchange volatility. |
Establishing an In-country Presence
Retailers setting up local operations face challenges and risks including:
• | investment of significant amounts of time and money to establish and maintain country-specific websites, order management systems, distribution centers, call centers, inventory, subsidiaries and other infrastructure such as local banking relationships and international shipping relationships; |
• | significant upfront investment with limited ability to assess local consumer demand before entering the market; |
• | exposure to foreign exchange and tax risk due to their investment and operations in the market; and |
• | inability to scale effectively, as each new market typically requires unique solutions which are not easily replicated from solutions in other markets. |
The challenges and risks posed by these alternatives cause many retailers to delay global expansion and miss the opportunity to generate additional revenue and further expand their brand awareness around the world.
4
Challenges for the Global Consumer
Global consumers are often faced with a disappointing customer experience whether they buy from a retailer’s local in-country website or a foreign website. In the case of local in-country websites of retailers, consumers are often faced with narrower product selection compared with what is available on the retailer’s domestic website. When ordering from a domestic website, international consumers often have to deal with high shipping costs, additional unexpected fees at the time of delivery related to taxes, customs and duties and long delivery times. They may also find that the domestic website does not translate the product prices into their local currency, has restrictive return policies, and lacks support for foreign credit cards or payment methods. In addition, many retailers fail to tailor their product catalogs to comply with export and import restrictions, presenting global consumers with products they cannot ultimately buy. We believe all of these limitations make it frustrating for the consumer and ultimately more difficult for an international consumer to buy from domestic retailers, thus contributing to the significant disparity between websites visited and transactions consummated by consumers outside the United States and the United Kingdom.
As a result, we believe the combination of the large international cross-border ecommerce opportunity and challenges of implementing an in-house solution create a significant opportunity for a differentiated third party solution.
The Borderfree Solution
The Borderfree solution is a proprietary ecommerce technology and services platform designed to remove the barriers to international cross-border ecommerce.
5
6
Key benefits of our platform include:
Comprehensive Solution. We believe Borderfree delivers the most comprehensive international ecommerce solution available through a single unified platform. Borderfree manages all aspects of the international sales process, including site localization, multi-currency pricing, payment processing, fraud management, landed cost calculation, customs clearance and brokerage and global logistics services while providing a high quality consumer experience throughout. In addition, our solution eliminates foreign exchange and credit card fraud exposure for our customers. Our solution combined with our experience in facilitating millions of international ecommerce transactions allows us to successfully navigate these challenges on behalf of our customers at low cost and risk to them.
High Return on Investment. We believe that the Borderfree platform offers a capital efficient, cost-effective and low-risk solution for retailers to compete in international markets. After a minimal initial investment for integration with our platform, which enables retailers to launch in all or select markets without any incremental cost, customers then pay us a percentage of the sales they generate through our platform. Retailers are typically able to start selling within 90 days in over 100 countries and territories and in more than 60 currencies. Retailers who implement our platform have the flexibility to launch in all or select markets, without any incremental cost or effort to activate additional markets. As we expand the available countries on our platform, our customers will gain access to these countries at no additional cost.
High Quality Consumer Experience. Our platform enables our customers to provide a localized experience that maintains their brand integrity. Our platform geo-locates global consumers, and welcomes them in the local language to instill confidence at the outset of the shopping experience. All merchandise prices are converted to the consumer’s preferred currencies site-wide, and the consumer is presented with a landed cost calculation which is the transaction cost inclusive of all tariffs, value added tax, shipping costs, and clearance fees to ensure there are no surprise charges. In addition, the consumer can select from relevant local payment options, track purchases online with order update emails and a consolidated tracking link and benefit from the retailers’ international returns and other consumer service initiatives.
Customizable Pricing and Promotion Strategies. In addition to providing our market specific knowledge to retailers, we aggregate and analyze the data generated from the transactions processed on our platform. Our customers are able to leverage this data to create, test and deploy country-specific pricing and promotion strategies to maximize checkout conversion. For example, using our platform retailers can create and manage country specific pricing rules that optimize landed cost for conversion by adding margin into product prices to offset the cost of any combination of any shipping, duty or value added tax related promotions at checkout. Retailers can also display location based offers tailored to consumers visiting from specific countries such as dollar and percentage off discounts for merchandise product, shipping costs and duty and value added tax, order and item level discounts, coupons, as well as other specialized promotions.
Access to New Sales and Marketing Channels. We have formed strategic partnerships with global marketing partners, including those with payment processors. These partnerships can expand the marketing reach of retailers to many millions of qualified consumers through the variety of marketing channels offered by these partners. Additionally, these partnerships typically leverage our existing customer integration into our platform.
7
Our Competitive Strengths
As a result of our extensive experience in cross-border ecommerce and substantial data asset resulting from consumer interactions on our platform, we enjoy a strategic relationship with our customers. Our customers look to us for a technology solution to enable international ecommerce expansion as well as for strategic advice on how to best expand in markets around the world.
Our competitive strengths include:
Comprehensive and Scalable Platform. Our ecommerce platform enables retailers to begin selling internationally without requiring significant investment of time or resources. As the retailer’s global sales grow, our platform has the features and functionality to scale with them and effectively address their needs. As a result, we believe that we possess the most comprehensive platform for retailers looking to expand their ecommerce sales internationally, quickly and cost effectively.
Global Reach and Scale. In 2014 we facilitated approximately $547 million of GMV, shipping to over 100 countries and territories, and settling transactions in more than 60 currencies. We have a network of global and market-specific logistics vendors and payment providers. This network enables us to execute transactions and deliver products to both established markets and difficult to reach locations around the world. As a result of our scale and ability to consolidate volume we enjoy lower fulfillment costs and access to competitive foreign exchange rates.
Asset-light Business Model. Our model allows us to scale our business to serve additional customers, markets and GMV with minimal capital expenditures. We do not own or operate any distribution centers or warehouses. We work with third-party logistics providers for hub processing and international delivery services to process and transport products to the consumer, paying only a volume-based fee which varies in line with our customers’ sales volume. We also do not own or operate any consumer support centers, as our customers handle consumer service calls directly.
Branded Consumer Experience. We enable the retailer to provide a localized shopping experience that instills in international consumers the same level of trust and confidence in their brand as their U.S. consumers. Retailers who use our solution maintain full control of the consumer experience including the website presentation, customer service, product packaging and pre and post order related communications. All of these interactions are done in accordance with the brand and product objectives of our customers. By focusing on the immediacy, prominence and visibility of our customers’ brands, our solution is appealing to retailers who acquire and maintain customers through brand equity and customer service, especially large and iconic lifestyle and department store brands.
Substantial and Growing Data Asset. As the processor of consumer transactions on our platform, Borderfree possesses a substantial amount of data related to international consumer demand and purchasing behavior. With the growth in the number of customers operating their ecommerce sites on our platform, we have processed more than 7.0 million transactions since the launch of the Borderfree solution in the beginning of 2008. We collect data from the time a consumer initiates the check-out process to the time a consumer completes the transaction, providing retailers with a unique holistic view of the consumer’s preferences down to the SKU-level across multiple brands. This data, coupled with investment in advanced analytics and CRM capabilities, produces meaningful insights into international ecommerce marketing, merchandising and conversion strategies. In the years ended 2014, 2013 and 2012, we saw 2.6 million, 2.1 million and 1.4 million transactions on our platform, respectively.
Growing and Loyal Customer Base. Since we launched the Borderfree solution, we have experienced significant growth in our customer base, growing from a single customer in the beginning of 2008 to 96 as of December 31, 2014. We believe that our ability to retain customers is an indicator of the stability of our revenue base and the long-term value of our customer relationships. We assess our performance in this area using a metric we refer to as our global ecommerce services retention rate. We define this retention rate with respect to a given twelve-month period as (i) global ecommerce services revenue recognized within such period from customers that contributed global ecommerce services revenue in the prior twelve month period divided by (ii) global ecommerce services revenue recognized in such prior twelve month period. Our global ecommerce services retention rate was 122%, 144% and 197% for the years ended December 31, 2014, 2013 and 2012, respectively. We also gain valuable feedback from our existing customers, which helps enhance our platform with the most relevant features and functionality to stay current with our customers’ needs and attract prospective customers. As of December 31, 2014, we had 11 of the Internet Retailer Top 50 as our customers, and 61 of the Top 500. This loyal customer base of high profile retailers also serves to attract new customers as they see the tangible benefits realized by implementing our solution. In addition, once the Borderfree solution is deployed, GMV processed on customers’ collective ecommerce sites and average GMV per customer typically grows over time.
8
International Experience. We have developed market specific knowledge about ecommerce across a diverse group of markets and cultures. Our expertise helps our customers navigate local rules, regulations and compliance to sell to consumers in local markets more quickly and optimize market specific merchandising and marketing strategies to sell to these consumers more effectively.
9
Our Growth Strategy
Our mission is to be the leading provider of global ecommerce services, enabling retailers and brands located anywhere in the world to easily market and sell to consumers in every corner of the globe. Our strategies to achieve this goal include:
Grow GMV with our Existing Customers. While customers on our platform have rapidly grown their international ecommerce sales, international sales still represent only a small percentage of their domestic sales and international conversion on many sites remains a fraction of conversion on domestic sites. Therefore, we believe that there remains a significant opportunity for these customers to continue to grow their international sales volumes. We are pursuing a number of key initiatives to drive this growth including:
• | Improving Sales Conversion Through an Enhanced Shopping Experience for International Consumers. The cost of shipping is one of the largest obstacles to a global consumer completing an online purchase. Leveraging our scale, we have negotiated more favorable rates with our existing carriers to reduce shipping costs, which we believe has contributed to the improvement in our order submit rate. We intend to continue reducing the cost of logistics by expanding the number of hubs and carriers in our logistics network and introducing new lower cost delivery options, which we believe will improve our order submit rate. In addition to lower logistics costs, we are improving the localization capabilities of our technology platform, incorporating a variety of language, payment and cultural variables to provide as local a shopping experience as possible, no matter from where the consumer originates. |
• | Acquiring New Consumers and Driving Qualified Site Traffic Through Strategic Partnerships. By developing and leveraging in-market strategic partnerships with organizations that have deep relationships with global consumers, we believe we have a considerable opportunity to expand our business with our customers by deploying marketing solutions that acquire new consumer relationships and drive incremental international traffic to their ecommerce sites. We are partnering with our customers across a wide spectrum of marketing and promotional strategies including shipping promotions, e-mail marketing, search engine marketing, contextually relevant display advertising and social media. In addition, we plan to expand and strengthen our strategic alliances with loyalty, shopping comparison, and payment providers to provide our clients with new customer acquisition channels. For example we have strategic partnerships with payment processors that serve to expand the marketing reach of our customers. |
• | Leveraging Our Data Assets. We have recently invested in new business intelligence and database platforms to expand our analytics capabilities and enhance our own and our customers’ ability to analyze the aggregated information, and leverage it to formulate data driven marketing and merchandising strategies. Through our analytics capabilities and consumer information we expect to deliver insights on, and access to, the global consumer to help our clients increase international sales. We do not currently monetize our data asset beyond making our core products and services more attractive to our customers although we may attempt to do so in the future. |
Acquire More Customers. We believe there is significant opportunity for a variety of merchants to target global consumers. Currently, we target U.S. and U.K. retail brands with significant global appeal such as large department stores, established and emerging consumer brands, specialty retailers and online only retailers. We intend to expand our sales and marketing investments to focus on acquiring these customers and expand the geographic scope in which we operate to other parts of Europe and Asia. In addition, we believe that our addressable market opportunity includes many mid-size to smaller retailers based in these markets in which we plan to acquire by developing self-service options requiring limited integration time, effort and investment.
Continue to Innovate and Add New Functionality to Our Platform. We continually invest in additional platform features and functionality to address our customers’ current and long-term needs. Specifically, we are investing in enhanced integration technology to make it easier for new customers to come onto the platform, an upgraded customs classification and tariff quotation engine, new carrier and payment provider integrations, streamlining browsing and purchasing on mobile devices, supporting in-country multi-channel pricing strategies and fulfilling orders using regional inventory.
Pursue Strategic Acquisitions. We plan to pursue acquisitions that complement our existing business, represent a strong strategic fit and are consistent with our overall growth strategy. We may also target future acquisitions to expand or add functionality and capabilities to our platform.
10
Products and Services
Borderfree Ecommerce Platform
The Borderfree platform is comprised of technology, data, expertise and services that span:
• | consumer experience localization, |
• | payments, compliance and risk management, |
• | global transportation and logistics, |
• | post-delivery customer care, and |
• | global consumer insights and marketing. |
Our platform enables our customers to provide a localized shopping experience for global consumers based on the consumer’s IP geolocation. Conditional page manipulation based upon the consumer’s IP geolocation occurs within our customer’s IT environment and website. This is an alternative to the creation and hosting by Borderfree of international versions of the customer’s website or the customer building, hosting and maintaining separate country-specific websites. The effects of localization on transactions processed on our platform include the conversion of product prices to the appropriate currency, the suppression or filtering of merchandise subject to import or export restrictions, the substitution of the domestic checkout path with our international checkout and the introduction of visual welcoming elements such as flag icons, welcome messaging in the consumer’s language and international frequently asked questions.
Consumer Experience Localization
Localizing a consumer’s experience starts with the synchronization of Borderfree’s localization data with the retailer’s website environment. Localization data is comprised of IP geolocation tables, country-currency pairs, currency code information, country-specific price multipliers, customizable by a retailer based on their pricing strategy, currency rounding methods and foreign exchange rates. A retailer can either schedule the download of this localization data via application programming interfaces, or APIs, provided by Borderfree, or install our proprietary software tool called the Ambassador. The Ambassador automatically downloads new localization data sets and persists the data into the retailer’s website environment, transmits the retailer’s full or incremental product catalog updates to Borderfree, for estimating the duty of each new product, and screens for products that may be subject to import, export or shipping service restrictions. With localization data easily accessible by a retailer’s ecommerce website, the IP address of an incoming consumer’s location is identified, and the presentation of a retailer’s ecommerce pages are altered to be “localized” as they are delivered to the consumer’s browser.
11
Retailers have the flexibility with our solution to modify a variety of elements and features on their site to localize pages for international consumers, including:
• | Dynamic Suppression or Filtering of Restricted Merchandise. The retailer can automatically suppress or otherwise make unavailable from browse or search results any products or categories that are subject to licensing, shipping, export or import restrictions. |
• | Localized Greetings and International Icons. Upon detecting a first-time global consumer, the retailer can display Borderfree’s localized and customizable “Welcome Mat” in the consumer’s preferred language, and a flag icon corresponding to the country of the consumer in a prominent location within the global site header. |
• | Product Pricing Displayed in the Buyer’s Preferred Currency. Products are presented in the consumer’s preferred currency at the current exchange rate. |
• | Customizable Country-specific Price and Promotion Strategies. Retailers can create and manage country-specific pricing rules that optimize landed costs for conversion by adding margin into product prices to offset the cost of any combination of shipping, duty or VAT related promotions at checkout. Retailers can also display location-based offers tailored to consumers visiting from specific countries. |
• | International Checkout. We provide our customers with two convenient ways to integrate our international checkout capability. We offer a responsively designed HTML checkout hosted by Borderfree that is faster to implement, requires very little customization and which inherits new checkout features that may be introduced over time. We also offer an API-based checkout for retailers looking to control the entire presentation layer and unify their international and domestic checkout process. |
12
Payments, Compliance and Risk Management
Regardless of the international checkout method chosen, our platform offers preferred local payment options, fraud and foreign exchange risk management, VAT and duty collection and remittance and the management of all import and export restrictions.
• | Local Payment Options. We obtain international shipping information, billing information, and payment details from the consumer. International credit cards and other popular international tender forms are accepted. |
• | Fraud Prevention. When the consumer places an order, we authenticate and authorize their international payment information, perform an automated, real time fraud assessment using a payment gateway and denied party screening and fraud management tools incorporated into our platform from CyberSource Corporation, a wholly-owned subsidiary of Visa Inc. We can automatically accept or reject the order based on this assessment, or queue an order for manual review. |
• | Foreign Exchange Risk Management. We bill the consumer in their preferred currency, using real-time exchange rates, fixed at the time of the transaction, with no risk to the consumer. The retailer bills a Borderfree credit card or Borderfree account, in U.S. dollars, and therefore assumes no foreign exchange risk in the transaction. |
• | VAT and Duty Collection. We charge the consumer a guaranteed fully landed cost, covering payment of all duties, taxes and charges required to deliver the product, except when the consumer elects to pay the duties upon delivery. We contract with licensed customs brokers to manage the related VAT and duty collection related to our transactions with international consumers. All applicable local duties and VAT are calculated by the licensed customs broker and submitted for review and approval by the destination country’s customs authority. Upon approval by the destination country’s customs authority, the licensed customs broker pays the amounts due related to the parcel entry. The actual amount is billed back to us by the licensed customs broker. The consumer is the importer of record and, therefore, we do not have nexus in any foreign jurisdiction. |
• | Import and Export Restrictions Management. We use a combination of merchant provided data, internal import and external export compliance expertise and licensed compliance and restrictions data services to prevent a consumer from purchasing U.S. export restricted products or products that are restricted from import into the consumers’ country prior to checkout. |
• | Support for Split Shipments, Cancels, Backorders and Pre-orders. Funds are captured from consumers once parcels are shipped, and only for pro-rated amounts based on the value of a single parcel in the case of a partially shipped order or split shipment. Additionally, Borderfree guarantees its foreign exchange rates in pre-order scenarios. |
13
Global Transportation and Logistics Coordination
We contract with third-party hub facilities in Romulus, Michigan, Franklin Park, Illinois, Fort Worth, Texas, Carlstadt, New Jersey, and Etobicoke, Ontario, where we receive inbound parcels from customers and process them for export and international delivery. We also contract with a U.K.-based third-party hub facility in Colnbrook, U.K. We intend to contract with additional hub facilities to support the growing scale of our business, including international hub facilities to support geographical expansion. Our logistics platform provides significant advantages to our customers:
• | Simple for the Retailer. At its U.S. warehouse, the retailer picks and packs the parcel as a domestic shipment, with minimal change from its existing processes, and using its preferred U.S. carrier. Although the option exists to tender parcels to U.S. carriers as individual parcels, the retailer can also consolidate the parcel with other international orders bound for our hubs, which reduces shipping costs. |
• | Product Sorting and Classification. Once a shipment arrives at our hubs, it is sorted and an operator scans individual parcels. The operator inspects the merchandise for country of origin if it has not been provided from the merchant electronically, prints an international packing slip and commercial invoice, overlabels the parcel with a shipping label specific to the international destination, then aggregates freight by carrier and shipping method. Customs brokers perform item classification and assign the merchandise any and all harmonized systems codes required for efficient customs clearance. |
• | Error Reduction. Exceptions are also managed at our hubs, with operators separating out any parcels that are damaged, appear to contain an incorrect quantity or appear to contain the incorrect items. In the event that a parcel contains restricted items or an incorrect quantity of items, we coordinate with the retailer to either arrange for the timely return of the damaged or incorrect merchandise, or to resolve the exception while the merchandise is still at the hub so that it can continue to its destination. |
• | Full Track and Trace. As the parcel leaves our hubs, we send the consumer an international shipment confirmation e-mail, which includes a link to a page where the consumer can track his or her parcel’s progress and receive periodic delivery updates. |
• | Electronic Customs Declaration and Clearance. While the parcel is in transit, a customs declaration is electronically sent to customs officers in the receiving country, and duty and VAT are paid or remitted in the consumer’s name. Pre-clearance of shipments while in transit allows many shipments to be inducted directly into the local delivery network. |
• | Parcel Protection and Replacement Guarantee. Local, trusted delivery services are used in each international market to ensure a positive experience by the consumer. All parcels shipped by us have a parcel protection and replacement guarantee in case of any logistics issues that result in a lost or damaged parcel. |
• | Returns Managements. We process consumer returns in accordance with our retailers’ return policies and automatically refund to the consumer original landed costs upon receipt at one of our third-party hubs or upon final receipt at our retailers’ return centers. All returns that are consolidated at our third-party hubs are then returned to our retailers’ designated returns centers. |
Post-Delivery Consumer Care
We provide a web-based customer care and order management tool to a retailer’s consumer care representatives that allows them to provide international consumer service. These tools include international order data and search functionality, billing and crediting history, fraud disposition insights, and parcel-level tracking detail for consumers that make inquiries about delivery of their package. Also included are tools to allow a retailer to manage international returns and appeasements, as well as support case management and ticketing functionality. Together, our tools allow retailers to provide the same level of after-sales service to their global consumers as to their domestic consumers.
14
Global Consumer Insights and Marketing
As more international transactions flow through our platform, and more brands and retailers integrate with the platform, we are strategically positioned to provide data-driven marketing and merchandising expertise to our clients. Some of the services that we offer include:
• | Sales Reports, Consumer Insights and Best Practices. We leverage our proprietary data, consumer surveys, in-country focus groups and global research to spot emerging trends and identify best practices to help our customers grow their international business. |
• | Localized SEM / SEO Strategies. Through our data and analytics tools, our customers can develop local search engine marketing, or SEM, and search engine optimization, or SEO, strategies. |
• | Marketing Strategies. We work with our customers and third parties to create promotions tailored specifically for the customer’s brand and target markets, and provide greater visibility to their products. |
• | Promotion Campaigns. We can create country-specific coupons and promotions to engage and retain consumers. We also have percent and dollar off discount capabilities. With flexible options, a retailer can initiate multiple opportunities to keep consumers engaged. |
• | Localized Messaging. Retailers can personalize the consumer experience with localized checkout messages that connect consumers to a retailer’s brand. |
15
Customers
Our customers are U.S.-based retailers, department stores, apparel brands and lifestyle brands selling a variety of physical goods online including apparel, handbags, beauty and cosmetics, jewelry, sporting goods, home décor, and toys. As of December 31, 2014, we had 96 customers using our ecommerce platform, as compared to 91, 84 and 78 as of December 31, 2013, 2012 and 2011, respectively.
Some of our customers have multiple brands within their brand portfolio and/or multiple online ecommerce sites. As of December 31, 2014, there were 171 ecommerce sites on our platform, as compared to 158, 133 and 94 as of December 31, 2013, 2012 and 2011, respectively.
The following is a representative list of our customers by category:
• | Department Stores: Barneys New York, Bloomingdale’s, Macy’s, Neiman Marcus, Sears |
• | Brands: Aeropostale, Carter’s–OshKosh B’gosh, J.Crew, John Varvatos, Juicy, Lands' End, True Religion Brand Jeans, Under Armour, |
• | Specialty Retailers: Bed Bath & Beyond, Motosport, Orchard Brands, Pottery Barn, Pottery Barn Kids, Sephora, Tilly’s, Williams-Sonoma |
• | Online-only Retailers: Gilt Groupe, Shoes.com |
Our customer contracts typically have multi-year initial terms ranging from one to four years, followed by one-year renewal periods.
16
Sales and Marketing
We sell our solution and services primarily through our direct sales force. Our direct sales force is based in New York and is organized by prospect size and merchandise category. We target retailers and brands with global ambition, iconic and coveted merchandise, global brand recognition, high customer experience standards and who sell merchandise that is both cost-effective to ship worldwide and subject to limited licensing, export, import or other transportation restrictions. Our sales cycle can vary from customer to customer, but typically requires four to six months depending on the size of the organization and complexity of the opportunity.
We generate customer leads, accelerate sales opportunities and build brand awareness through our marketing programs. Our marketing programs target ecommerce executives, technology professionals and senior strategy leaders. Our principal marketing programs include:
• | our annual Global Ecommerce Forum; |
• | participation in, and sponsorship of, trade shows and industry events; |
• | public relations and social media; |
• | customer acquisition announcements; |
• | customer case studies; and |
• | email campaigns and newsletters. |
In April 2014, over 200 attendees representing more than 100 existing and potential customers attended our sixth annual Global Ecommerce Forum. We presented marketing, innovation, and strategic insights at this invite-only event.
17
Technology, Operations, and Development
Technology
Our platform has been designed to support many merchants on a single service architecture across mobile and web technologies. We have a common distributed deployment of our core platform supporting all current merchants over a variety of integration methods. Some key considerations of our platform include:
• | Scalability. All components of the Borderfree platform were built to scale horizontally, allowing for additional capacity to handle large traffic events. We offload significant amounts of workload from our core infrastructure to third-parties. Additionally, we utilize virtualization technologies from VMWare to allow for rapid infrastructure adjustments in the case of unexpected workload. |
• | Reliability. We utilize nationally recognized third-parties for all areas of infrastructure, network, and software. We constantly invest in both internal and external monitoring capabilities to provide a complete picture of platform health. |
• | Security. We are a PCI-DSS Level 1 certified merchant, adhering to a set of standards that ensure that proper measures are in place to secure networks, data, architecture, and access to systems while also ensuring controls and process around cadence of testing, policy development, and change control are followed. This certification is a multifaceted security standard, monitored by the payment card industry, and includes external audits of business and technology functions to ensure compliance and maintain a company’s certification rating. We have an external certified PCI Qualified Security Assessor who performs a full audit annually and as needed support continuously. |
• | Ease of Deployment. Merchants can choose between prebuilt plugins for major platforms, hosted services, or deep API integrations depending on needs. Individual customer integrations do not require changes or releases in our core platform which means our platform can be easily deployed. We also have strong documentation and a hands-on approach to implementation with a dedicated technical implementations team to ensure high quality and efficient deployment. |
• | Open Platform. We built our platform with a modular, API driven approach. This model enables both internal teams and customers to build novel functionality extending our core platform to serve our customers’ business objectives. |
Operations
We operate and host our platform in two secure facilities located in New Jersey and California. We contract with Equinix Operating Co. and Atlantic Metro Communications for these facilities. We operate a 24 hour a day, seven day a week operations center from Tel Aviv, Israel and New York, New York to monitor and respond to automated alerts and customer support issues. Our operations group also provides ongoing administration, security, and deployment capabilities to the rest of the organization. As of December 31, 2014 we had 53 employees in our operations group, an increase from 47 employees as of December 31, 2013 and 46 employees as of December 31, 2012.
Research and Development
Our research and development organization is responsible for all new product development, quality assurance, and core platform improvements. We operate under an agile methodology and perform test-driven development, allowing for rapid product development while maintaining a high level of quality. Our research and development organization is located in both Tel Aviv, Israel, and New York, New York. We typically release new versions of our software monthly which our customers can easily access through web-based APIs. As of December 31, 2014 we had 67 employees in our product and research and development groups, an increase from 49 employees as of December 31, 2013 and 40 employees as of December 31, 2012.
18
Competition
The market for ecommerce technology and services is intensely competitive, subject to rapid technological change and significantly affected by new product introductions and other market activities. Our primary competition are retailers who choose to develop an in-house solution working directly with international third party payment partners, carriers and distribution center operators. The market for international ecommerce software and fulfillment services is highly fragmented and contains well-funded competitors. The market includes companies of various sizes, as well as large companies, that specialize in third-party point solutions or freight forwarding services, full-service ecommerce business process outsourcers and online marketplaces with international logistics support.
• | Third-party Point Solutions or Freight Forwarding Services. Our competitors in this category are typically not integrated with U.S. retailer websites, but instead offer international customers freight forwarding, consolidation, repackaging and temporary storage services as well as give member consumers the ability to purchase products from many U.S. websites, consolidate or repackage resulting parcels and have the service export the products to them at a later date. We compete with this category of competitors by focusing on an integrated and elevated consumer experience, providing visibility into consumer buying activity and our comprehensive set of merchandising and pricing capabilities that allows our customers to provide the international consumer with a localized experience and the ability to ship direct. |
• | Full-service Ecommerce Business Process Outsourcers. Our competitors in this category are integrated with U.S. retailer websites as we are, with landed cost calculation, payment management and logistics orchestration being core elements of the service, but with the international consumer generally having to leave the retailer’s website to complete the transaction. We compete primarily with this category of competitors by focusing on letting the retailer control the entire order life cycle without disintermediation, the protection of the prominence of the retailer’s brand at all times, the reliability and scalability of our platform, our comprehensive set of merchandising and pricing capabilities and reduced shipping and other transactional costs that we are able to take advantage of as a result of our scale, volume and customer relationships. |
• | Large Online Marketplaces Which Provide Retailers with International Logistics Support. Our competitors in this category offer expansive marketplaces for retailers to create storefronts within certain markets with access to consumers that have previously frequented or purchased through that marketplace. These marketplaces are generally localized and tailored to the respective markets. We compete with these competitors by maintaining our customer’s brand and logo throughout the international order lifecycle and allow our customers to control the consumer’s experience. |
We compete primarily on the basis of the comprehensiveness of our platform and services, our focus on the consumer experience and maintaining the retailer’s brand identity, our robust set of merchandising capabilities and features, the reliability and scalability of our platform, and the speed and cost of deploying our solution.
19
Intellectual Property and Proprietary Rights
Our intellectual property and proprietary rights are important to our business. To safeguard them, we rely on a combination of patent, copyright, trade secret, trademark and other rights in the United States and other jurisdictions, as well as confidentiality procedures and contractual provisions to protect our proprietary technology, processes and other intellectual property. We have one issued U.S. patent. We have confidentiality and license agreements with employees, contractors, customers, distributors and other third parties, which limit access to and use of our proprietary information and software. Though we rely in part upon these legal and contractual protections, we believe that factors such as the skills and ingenuity of our employees and the functionality and frequent enhancements to our solutions are larger contributors to our success in the marketplace.
Despite our efforts to preserve and protect our intellectual property and proprietary rights, unauthorized third parties may attempt to copy, reverse engineer, or otherwise obtain portions of our solutions. Competitors may attempt to develop similar products that could compete in the same market as our product. Unauthorized disclosure of our confidential information by our employees or third parties could occur. Laws of other jurisdictions may not protect our intellectual property and proprietary rights from unauthorized use or disclosure in the same manner as the United States. The risk of unauthorized use of our proprietary and intellectual property rights may increase as our company continues to expand outside of the United States.
Third-party infringement claims are also possible in our industry, especially as software functionality and features expand, evolve, and overlap with other industry segments. Third parties, including non-practicing patent holders, have from time to time claimed, and could claim in the future, that our activities or our customers’ ecommerce sites infringe patents they now hold or might obtain in the future, and, in most cases, we have agreed to indemnify our customers against claims that our products or the use of our products infringe the intellectual property rights of third parties. See “Risk Factors—We could be required to stop selling or using a product or service and/or incur substantial costs as a result of any claim of violation of another party’s intellectual property or proprietary rights.”
Employees
As of December 31, 2014 we had 231 employees of which 28 were in transaction processing, 53 were in technology and operations, 67 were in research and development, 45 were in sales and marketing and 38 were in general and administrative positions. None of our employees are covered by a collective bargaining agreement. We have never experienced a strike or similar work stoppage, and we consider our relations with our employees to be good.
Properties
Our principal corporate offices are located in New York, New York. We currently occupy three floors in New York approximating 28,000 square feet of space under an agreement that expires in November 2020. We occupy an additional leased facility, approximating 12,000 square feet of space, in Tel Aviv, Israel for our research and development operations. We also lease office space in Dublin, Ireland and Shanghai, China. We believe that our facilities are suitable for our current needs and that additional or substitute space will be readily available, on commercially reasonable terms, as needed to support the expansion of our business.
Legal Proceedings
We are subject to various legal proceedings that have arisen or may arise in the ordinary course of business. Although some of these proceedings may result in adverse decisions or settlements, we believe that the final disposition of such matters will not have a material effect on our business or consolidated financial statements. For information concerning our indemnification obligations to customers against which patent infringement claims have been or may be asserted, see “Risk Factors under Item 1A of this Annual Report on Form 10-K—We could be required to stop selling or using a product or service and/or incur substantial costs as a result of any claim of violation of another party’s intellectual property or proprietary rights.”
20
Available Information
We maintain an internet website at www.borderfree.com. The information on our website is not incorporated by reference into this Annual Report on Form 10-K and should not be considered to be a part of this Annual Report on Form 10-K. Our website address is included in this Annual Report on Form 10-K as an inactive technical reference only. Our reports filed or furnished pursuant to Section 13(a) or 15(d) of the Exchange Act, including our Annual Reports on Form 10-K, our Quarterly Reports on Form 10-Q and our Current Reports on Form 8-K, and amendments to those reports, are accessible through our website, free of charge, as soon as reasonably practicable after these reports are filed electronically with, or otherwise furnished to, the SEC. We also make available on our website the charters of our audit committee, compensation committee and nominating and corporate governance committee, as well as our corporate governance guidelines
21
ITEM 1A—Risk Factors
You should carefully consider the risks described below and the other information in this Annual Report on Form 10-K and in our other public filings. Our business, prospects, financial condition, or operating results could be harmed by any of these risks, as well as other risks not currently known to us or that we currently consider immaterial. If any of such risks and uncertainties actually occurs, our business, financial condition or operating results could differ materially from the plans, projections and other forward-looking statements included in the section titled "Management's Discussion and Analysis of Financial Condition and Results of Operations" and elsewhere in this report and in our other public filings. The trading price of our common stock could decline due to any of these risks, and, as a result, you may lose all or part of your investment.
Risks Related to Our Business and Our Industry
We have incurred operating losses in recent fiscal periods and may be unable to sustain profitability, which may negatively impact our ability to achieve our business objectives.
We incurred operating losses in certain recent fiscal periods. We reported net loss of $3.1 million and $0.7 million for 2014 and 2013, respectively, however, we cannot assure you that we will be profitable in the future. As of December 31, 2014, our accumulated deficit was $19.5 million. We expect to continue to make future expenditures to develop and expand our business that may result in us incurring future losses. In addition, as a public company we will incur significant legal, accounting and other expenses that we did not incur as a private company. These increased expenditures will make it harder for us to sustain future profitability. Our recent growth in revenue and number of customers may not be sustainable, and we may not achieve sufficient revenue to maintain profitability if our growth slows or we lose customers or have customers reduce their sales volume on our platform. We may incur significant losses in the future for a number of reasons, including the other risks described in these Risk Factors, and we may encounter unforeseen expenses, difficulties, complications and delays and other unknown events. For example, one of our strategies is to substantially increase the number of carriers and logistics hubs. If we fail to manage growth and additional complexity in our logistics network, our ability to reduce our fulfillment costs and increase sales conversion could be adversely affected. Additionally, we may experience fluctuations in foreign currencies which could reduce cross-border trade which in turn could adversely affect the sales volume on our platform. Accordingly, we may not be able to maintain profitability and we may incur significant losses for the foreseeable future.
Our limited history as a comprehensive global ecommerce platform makes it difficult to evaluate our current business and future prospects.
In 2008, we changed our business and began offering a comprehensive solution that allows U.S. retailers to transact with consumers worldwide. We have a limited operating history with respect to our current business, which may make it difficult for you to evaluate our current business and our future prospects. For example, the results for the set of customers that we launch each year inherently reflect a distinct group of retailers and consumers and may not be representative of our current or future composite group of retailers and consumers, particularly as we grow and our customer base broadens. In addition, the results for each such customer cohort may reflect unique market and consumer dynamics during the periods covered and may not be indicative of the future performance of such cohort or other cohorts. In recent periods we have experienced significant growth, and have encountered, and will continue to encounter, risks and difficulties frequently experienced by growing companies in rapidly changing industries, including increasing and unforeseen expenses as we continue to grow our business. If we do not manage these risks successfully, our business may be adversely impacted.
22
We depend on a limited number of customers for a substantial portion of our revenue. The loss of a key customer or the significant reduction of business from our largest customers could significantly reduce our revenue.
We have derived, and we believe that we will continue to derive, a substantial portion of our revenue from a limited number of customers, many of whom can terminate their agreements with us upon 30 to 90 days prior written notice. For example, for the year ended December 31, 2014 transactions with our largest ten customers accounted for an aggregate of approximately 67% our global ecommerce revenue. No individual customer accounted for more than 10% of our total revenue for the years ended December 31, 2014, 2013 and 2012. Additionally, transactions with our top three customers generated approximately 26% of our global ecommerce revenue for the year ended December 31, 2014, approximately 27% for the year ended December 31, 2013 and approximately 31% for the year ended December 31, 2012.
Because the primary driver of global ecommerce services and fulfillment services revenue are the international cross-border sales processed through our platform, our total revenue is dependent on a relatively small number of customers and their end consumers who will continue to account for a significant portion of our revenue for the foreseeable future. As a result, our operating results for the foreseeable future will continue to depend on our ability to provide our ecommerce solutions to this small number of customers. Any revenue growth will depend on our success in retaining our customers, growing our customers’ sales processed on our platform and acquiring additional customers. The loss of one or more of our customers, particularly the loss of any of our larger customers, whether through change in customer strategy, acquisitions, consolidations, bankruptcies, terminations for convenience or otherwise, or the failure to retain a significant amount of business from our customers, could harm our business, growth prospects, operating results and financial condition.
If we are unable to retain our existing customers, or the sales volumes generated by them on our platform decline, or does not increase, our business, operating results and financial condition would be adversely affected.
Our customer contracts typically have initial multi-year terms ranging from one to four years, followed by one-year renewal periods. We generate a significant portion of revenue from fees paid to us by our customers based on a percentage of their total gross international sales revenue processed through our platform. We also generate revenue from consumers for fulfillment services, including revenue related to international shipping, handling, and other efforts associated with delivering global logistics services, and foreign exchange and other transaction related fees. These contributors to our revenue are driven by international ecommerce sales generated on our platform.
Our customers often have the right to terminate their agreements for convenience by providing 30 to 90 days prior written notice, and have no obligation to renew their agreements with us after their terms expire. Even if these agreements are renewed, they may not be renewed on the same or on more profitable terms. We expect to continue to derive a significant portion of our revenue from our existing customers’ total sales on our platform and we expect our future revenue growth to be driven by increases in our existing customers’ sales. Despite such expectations, we cannot guarantee that our customers process a minimum volume of sales using our ecommerce solutions. As a result, if existing customers terminate their agreements with us, elect to operate their cross-border trading in certain markets by setting up local operations, do not renew their agreements with us, renew on less favorable terms, do not generate their current volume of sales using our solutions, or demand a fixed pricing per transaction model, our operating results and financial condition will suffer. In addition, the rate at which our customers increase their sales volumes on our platform, and the rate at which new customers adopt our ecommerce solutions is critical to our future growth. Factors that may affect sales volumes processed on our platform, and the adoption rate for our solution include:
• | the price, performance and functionality of our solutions; |
• | the availability, price performance and functionality of competing solutions; |
• | the effectiveness of our logistics and customer support services; |
• | the degree and the rate to which our customers adopt our marketing programs and solutions to drive additional traffic to their ecommerce sites; and |
• | the strengthening of the U.S. dollar against other currencies, which may affect international end consumers' ability or willingness to purchase our customers' products |
23
If our efforts to attract new customers are not successful, our revenue growth will be adversely affected, and the new customers we do attract may not generate revenue comparable to our current or historical customers.
One of our growth strategies is to acquire new customers. There is no guarantee that we can sustain our historical acquisition rates. Our ability to attract new customers will depend in large part on the success of our sales and marketing efforts, which may not be successful. Our prospective customers may not be familiar with our solution, or may have traditionally used other products and services for their international ecommerce needs. Our prospective customers may develop their own solutions to address their international ecommerce needs, purchase competitive product offerings, or engage third-party providers of services that do not use our solution to provide their services. In addition, attracting new customers requires substantial time and expense. It may be difficult to identify, engage and market to customers who do not currently have ecommerce needs or are unfamiliar with our solution, and many of our customers typically require input from one or more internal levels of approval. This requires us to spend substantial time and effort assisting potential customers in evaluating our solution including providing demonstrations. If our prospective customers do not perceive our solution to be of sufficiently high value and quality, we may not be able to attract new customers and our business, operating results and financial condition would be adversely affected. Additionally, even if we are successful in attracting new customers, such new customers may not generate comparable revenue relative to our current or historical customers, which could materially adversely affect our operating results and our growth.
24
Fluctuations in exchange rates of foreign currencies, which may reduce cross-border trade, could harm our business.
International sales generated by our customers processing transactions through our platform are the primary source of both revenue and profit for us. The operating results of, and sales generated from, many of our customers’ internationally focused websites running on our platform are exposed to foreign exchange rate fluctuations. For example, for a U.S. retailer running on our platform, if the U.S. dollar weakens against foreign currencies, the translation of the prices of the retailer’s products into foreign currency denominated transactions would decrease, which may result in increased international sales volumes, revenue and net income for us. Conversely, to the extent the U.S. dollar strengthens against foreign currencies, as experienced in 2014 with the Canadian dollar, Australian dollar, euro and Russian Ruble, and in 2013 with the Australian dollar and the Japanese yen, cross-border trade related to purchases of dollar-denominated goods from our U.S.-based retailers running on our platform by non-U.S. purchasers will likely decrease, which would adversely affect our business, operating results and financial condition. As exchange rates in foreign currencies vary, our net revenue and other operating results may differ materially from expectations. For example, during the second half of 2014, our sales volumes were negatively impacted by the U.S. dollar which strengthened against most major currencies, including the Canadian dollar and Australian dollar, our two largest individual markets in terms of international sales volumes. In addition, if the U.S. dollar continues to strengthen against major currencies (for example, the Canadian dollar, Australian dollar, euro and pound sterling), due to worsening economic conditions, divergence in monetary policies or for any other reasons, our revenue and operating results would be adversely impacted.
Our operating results are subject to seasonal fluctuations that could adversely affect the market price of our common stock.
Our business is seasonal in nature and the fourth quarter is a significant period for our operating results due to the holiday season. In 2014, 2013 and 2012, fourth quarter revenue represented approximately 29%, 32% and 36% of our total annual revenue, respectively. As a result, revenue and income (loss) from operations generally decline (increase) in the first quarter sequentially from the fourth quarter of the previous year.
Any disruption in our ability to process and fulfill consumer orders in the fourth quarter could have a negative effect on our quarterly and annual operating results. For example, if a large number of end consumers access our customers’ websites that operate on our platform in a short period of time due to increased holiday demand, we may experience system interruptions that prevent us from efficiently fulfilling orders, which may reduce the volume of goods we sell through, and the attractiveness of, our platform. In addition, we may experience an increase in our net shipping cost due to complimentary upgrades, split-shipments, and additional long-zone shipments necessary to ensure timely delivery for the holiday season. Additionally, any disruption in our business operations or the operations of our customers or logistics providers or other factors that could lead to a material shortfall compared with our expectations for the fourth quarter could result in a significant shortfall in revenue and operating cash flows for the full year.
If we do not successfully optimize and operate our logistics network, our business and growth strategy could be harmed.
The cost of shipping is one of the largest obstacles to a global consumer completing an online purchase. An important part of our strategy is to improve order submit rates through our efficiencies and cost reductions via improvements and expansion of our logistics and distribution infrastructure and our supply chain. As part of this strategy, we intend to continue reducing the cost of logistics by expanding the number of hubs and carriers in our logistics network. As we continue to expand the number of hubs and carriers, our logistics network will become increasingly complex and operating it may become more challenging. If one or more service providers in our logistics network on whom we rely fail to perform adequately, our ability to optimize and operate our logistics network will be impaired. If we are unsuccessful in continuing to optimize and operate, our logistics network, our fulfillment costs, operating results, financial condition and growth prospects will be adversely affected.
25
If we experience delays in the customer implementation process, it could delay our ability to recognize revenue, increase our costs and otherwise negatively impact our business.
In the initial stage of implementation our ecommerce solution is configured and integrated based on the customer’s needs. It may be difficult for us to manage the timeliness of these implementations and the allocation of personnel and resources by us or our customers. If our infrastructure capacity is insufficient to meet our needs, we may experience delays in deploying our solution to new customers, or expanding the solutions we offer to existing customers. We do not recognize significant revenue from customers until their ecommerce solution is launched. If the launch of our solution with a new customer is delayed or an expansion of our solution with an existing customer is delayed due to complications in the implementation process caused by us or our customers, our recognition of revenue for the deployment or expansion with such customer will be delayed. Therefore, failure to successfully manage customer implementations could result in a delay in our ability to recognize revenue. In the past, delays in customer implementation have also resulted in unexpected variances in our results. Delays in implementation could also increase costs, harm our reputation, cause us to lose existing customers, lead to potential customer disputes or limit the adoption rate of our solutions, and our business, operating results and financial condition could be materially and adversely affected.
26
Our lengthy sales cycle makes it difficult to predict our future revenue and causes variability in our operating results.
Our sales cycle can vary substantially from customer to customer, but typically requires four to six months and, in some cases, even longer depending on the size and complexity of the opportunity. A number of factors influence the length and variability of our sales cycles, including, for example:
• | the need to educate potential customers about the uses and benefits of our solutions; |
• | the discretionary nature of potential customers' purchasing and budget cycles and decisions; |
• | the competitive nature of potential customers' evaluation and purchasing processes; |
• | evolving ecommerce needs and functionality demands of potential customers; |
• | announcements or planned introductions of new products by us or our competitors; and |
• | lengthy purchasing approval processes of potential customers, who frequently need to obtain approvals from multiple decision-makers before making purchasing decisions |
Our ability to accurately forecast revenue is affected by our ability to forecast new customer acquisition. Lengthy sales cycles make it difficult to predict the quarter in which revenue from a new customer may first be recognized. If we overestimate new customer growth, our revenue will not grow as we forecast, our costs and expenses may continue to exceed our revenue and our profitability will be harmed. In addition, we plan our operating expenses, including sales and marketing expenses, and our hiring needs in part on our forecasts of new customer growth and future revenue. If new customer growth or revenue for a particular period is lower than expected, we may not be able to proportionately reduce our operating expenses for that period, which would harm our operating results for that period and our stock price may decline. Delays in our sales cycles could cause significant variability in our revenue and operating results for any particular period.
27
We may not be able to compete successfully against current and future competitors, including internally-developed solutions.
We face intense competition in the market for ecommerce applications and services, and we expect competition to intensify in the future. Increased competition may result in reduced pricing for our solutions, longer sales cycles or a decrease of our market share, any of which could negatively affect our business, operating results and financial condition. A number of competitive factors could cause us to lose potential sales or to sell our solutions at lower prices or at reduced margins, including, among others:
• | existing and potential customers may choose to develop ecommerce applications in-house, rather than pay for our solutions. For example, when they reach sufficient scale and presence in a market to develop an in-country ecommerce solution and house local inventory to make cross-border transactions unnecessary; |
• | we may lose customers that merge with or are acquired by companies using a competitor’s or an internally-developed solution; |
• | some of our current and potential competitors have greater financial, marketing and technical resources than we do, allowing them to leverage a larger installed customer base and distribution network, adopt more aggressive pricing policies and offer more attractive sales terms, adapt more quickly to new technologies and changes in customer requirements, and devote greater resources to the promotion and sale of their products and services than we can; |
• | current and potential competitors may merge, have established or may establish cooperative relationships among themselves or with third parties to enhance their products and expand their markets, and consolidation in our industry is likely to intensify. Accordingly, new competitors or alliances among competitors may emerge and rapidly acquire significant market share; |
• | current and potential competitors may offer software that addresses one, or a limited number, of ecommerce functions at a lower price point or with greater depth than our solutions; and |
• | software vendors could bundle ecommerce solutions or offer such products at a lower price as part of a larger product sale. |
We cannot assure you that we will be able to compete successfully against current and future competitors. In addition, competition may intensify as our competitors enter into business combinations or alliances or raise additional capital and established companies in other market segments or geographic markets expand into our market segments or geographic markets. If we cannot compete successfully against our competitors, our business, operating results and financial condition could be negatively impacted.
28
If we fail to develop or acquire new functionality or enhance our existing solution to meet the needs of our existing and future customers or if we fail to estimate the impact of developing and introducing new functionality and enhanced solutions on our business in response to rapid technological changes, our revenue will decline and our expenditures could increase significantly.
The ecommerce market is characterized by rapid technological change, frequent new product and service introductions and evolving industry standards. To keep pace with technological developments, satisfy increasingly sophisticated customer requirements and achieve market acceptance, we must continue to enhance and improve our existing solution and we must also continue to introduce new solutions. Any new solutions we develop or acquire may not be introduced in a timely manner and may not achieve the broad market acceptance necessary to generate significant revenue. If we are unable to successfully develop or acquire new solutions or enhance our existing solutions or if we fail to price our solutions to meet market demand, our business, operating results and financial condition will be adversely affected. For example, we intend to expand our sales and marketing investments to focus on acquiring mid-size to smaller U.S. retailers by offering self-service options requiring limited integration time, effort and investment. Our efforts to expand our solution to new organization sizes or beyond existing solutions may divert management resources from existing operations and require us to commit significant financial resources to an unproven business, which could in turn harm our existing business.
We expect to incur significant expense to develop additional solutions and functionalities and to integrate acquired solutions or functionalities into our existing platform to maintain our competitive position. These efforts may not result in commercially viable solutions. We may experience difficulties with software development, industry standards, design, manufacturing or marketing that could delay or prevent our development, introduction or implementation of new solutions and enhancements. If we do not receive significant revenue from these investments, our business, operating results and financial condition could be adversely affected. Additionally, we intend to maintain a single version of each release of our software applications that is configurable to meet the needs of our customers. Customers may require customized solutions, or features and functions that we do not yet offer and do not intend to offer in future releases, which may cause them to choose a competing solution. If we fail to develop solutions that satisfy customer preferences in a timely and cost-effective manner, our ability to renew our contracts with existing customers and our ability to create or increase demand for our solutions will be harmed, and our business, operating results and financial condition could be materially adversely affected.
Our business and operations have experienced rapid growth and organizational change in recent periods, which has placed, and may continue to place, significant demands on our management and infrastructure. If we fail to manage our growth effectively, we may be unable to execute our business plan, maintain high levels of service or address competitive challenges adequately.
Our growth has placed, and may continue to place, a significant strain on our managerial, administrative, operational, financial and other resources. We increased our number of full-time employees from 81 as of December 31, 2010 to 231 as of December 31, 2014. We intend to further expand our overall business, customer base, headcount and operations, both domestically and internationally, with no assurance that our business or revenue will continue to grow. Our plan to expand our business will substantially increase the complexity of our efforts to optimize and operate our logistics network, and if we fail to do so, our business and growth strategy will be adversely affected. Creating a global organization and managing a geographically dispersed workforce will continue to require substantial management effort, the allocation of valuable management resources and significant additional investment in our infrastructure. We will be required to continue to improve our operational, financial and management controls and our reporting procedures and we may not be able to do so effectively. As such, we may be unable to manage our expenses effectively in the future, which may negatively impact our gross margins or operating expenses in any particular quarter, and our operating results. If we fail to manage our anticipated growth and change in a manner that preserves the key aspects of our corporate culture, the quality of our solutions may suffer, which could negatively affect our brand and reputation and harm our ability to retain and attract customers.
29
Our business is sensitive to consumer spending and general economic conditions in the global economy and in the regional markets in which our customers have significant sales.
Consumer purchases of discretionary items may be adversely affected by economic conditions such as employment levels, wage and salary levels, trends in consumer confidence and spending, reductions in consumer net worth, interest rates, inflation, the availability of consumer credit and taxation policies. Consumer purchases in general may decline during recessions, periods of prolonged declines in the equity markets or housing markets and periods when disposable income and perceptions of consumer wealth are lower, and these risks may be exacerbated for us due to our focus on facilitating the sale of discretionary items. In addition, international end consumers of our customers’ products are concentrated in a limited number of regional markets. Sales originating from our top five international markets, Canada, Australia, the U.K., Russia and Hong Kong, accounted for approximately 61% of our sales volume in 2014. A downturn in the global economy, or in a regional market in which our customers have significant sales, could have a material, adverse effect on consumer purchases, our operating results and our financial position, and a downturn adversely affecting our consumer base could have a disproportionate impact on our business. In addition, fluctuations in the foreign exchange rates of the currencies of one or more of our top five international markets against the U.S. dollar could adversely impact end consumer purchases in those markets and affect our business. See “-Fluctuations in exchange rates of foreign currencies, which may reduce cross-border trade, could harm our business” for further information. There continues to be significant volatility and uncertainty in the global economy. In particular, the current uncertainty in Europe (including concerns that certain European countries may default in payments due on their national debt) and Russia (including concerns over the lack of economic growth spurred by falling oil prices, increased geopolitical risks, and imposed sanctions) and any resulting disruption could adversely impact our net sales revenue derived from these regions and elsewhere unless and until economic conditions improve. Further or future economic downturns may adversely affect traffic at merchant websites and could materially and adversely affect our business, operating results and financial condition.
We are dependent upon consumers’ willingness to use the internet for commerce.
Our solution is focused on enabling international, cross-border ecommerce, and the ecommerce market is less developed in many jurisdictions outside of the United States. Our success depends upon consumers’ continued willingness to use the Internet as a means to purchase goods, communicate, and conduct and research commercial transactions, particularly in markets outside of the United States, where adoption of the Internet and electronic commerce may evolve slowly or may not evolve at all. If consumers became unwilling, less willing or unable to use the Internet for commerce for any reason, including lack of access to high-speed communications equipment, congestion of traffic on the Internet, Internet outages or delays, disruptions or other damage to users’ computers, governmental restrictions, increases in the cost of accessing the Internet and security and privacy risks or the perception of such risks, our business, operating results and financial condition could be materially adversely affected. In addition, because our services depend to a significant extent on usage of the Internet by consumers, restrictions on such use by certain countries, such as China and those in the Middle East, may adversely affect our business, operating results and financial condition.
Even if demand for ecommerce products and services increases generally, there is no guarantee that demand for a solution like ours will increase to a corresponding degree.
For our customers and potential customers to be willing to invest in our ecommerce solutions, the Internet must continue to be accepted and widely used for commerce and communication. If ecommerce does not grow or grows more slowly than expected, then our future revenue and profits may not meet our expectations or those of analysts. The widespread adoption of our solutions depends not only on strong demand for ecommerce products and services generally, but also for products and services delivered via a platform and services business model in particular. Many companies continue to rely primarily or exclusively on traditional means of commerce that are not Internet-based and may be reluctant to change their patterns of commerce. Even if such companies do adopt ecommerce solutions, it is unclear whether they will desire ecommerce solutions like ours. As a result, we cannot assure you that our ecommerce solutions will achieve and sustain the high level of market acceptance that is critical for the future success of our business.
30
Any significant disruption in our hosting network infrastructure delivered by a limited number of data centers could harm our reputation, require us to provide credits or refunds, result in early termination of customer agreements or loss of customers, and negatively affect our business, operating results and financial condition.
Our hosting network infrastructure is a critical part of our business operations. End consumers of our customers depend on us for fast and reliable access to our solution through the Internet. Our software is proprietary, and we rely on the expertise of members of our engineering and software development teams for the continued performance of our solution. We have experienced, and may in the future experience, disruptions in our computing and communications infrastructure. Factors that may cause such disruptions include:
• | human error; |
• | security breaches; |
• | telecommunications outages from third-party bandwidth, Internet service, mobile network, electricity and other providers; |
• | computer viruses; |
• | acts of terrorism, sabotage or other intentional acts of vandalism; |
• | unforeseen interruption or damages experienced in moving hardware to a new location; |
• | fire, earthquake, flood and other natural disasters; and |
• | power loss. |
Interruptions in our services could reduce our revenue, cause us to issue credits to customers, subject us to potential liability, damage our brand and our reputation and cause customers to terminate their agreements or harm our renewal rates.
We manage our services and serve all of our customers from multiple third-party data center facilities. While we engineer and architect the actual computer and storage systems upon which our platform runs and deploy them to the data center facilities, we do not control the operation of these facilities. Our data centers are vulnerable to damage or interruption from human error, intentional bad acts, earthquakes, hurricanes, floods, fires, war, terrorist attacks, power losses, hardware failures, systems failures, telecommunications failures and similar events. At least one of our data facilities is located in an area known for seismic activity, increasing our susceptibility to the risk that an earthquake could significantly harm the operations of these facilities. The occurrence of a natural disaster or an act of terrorism, or vandalism or other misconduct, a decision to close the facilities without adequate notice or other unanticipated problems could result in lengthy interruptions in our services. In addition, the owners of our data facilities have no obligation to renew their agreements with us on commercially reasonable terms, or at all. If we are unable to renew these agreements on commercially reasonable terms, we may be required to transfer to new data center facilities, and we may incur significant costs and possible service interruption in connection with doing so. Any changes in third-party service levels at our data centers or any errors, defects, disruptions or other performance problems with our services could harm our reputation and may damage our customers’ businesses.
We have experienced significant growth in the number of users, transactions and data that our hosting infrastructure supports. We work with our third-party hosting providers to maintain sufficient excess capacity in our hosting network infrastructure to meet the needs of all of our customers. We also work with our third-party hosting providers to maintain excess capacity to facilitate the rapid provision of new customer deployments and the expansion of existing customer deployments. However, the provision of new hosting infrastructure requires significant lead time. If we do not accurately predict our infrastructure capacity requirements, particularly in the fourth quarter when we might experience significant increases in traffic on our customers’ ecommerce sites, our platform could experience service outages that may subject us to financial penalties and financial liabilities and result in customer losses. If our hosting infrastructure capacity fails to keep pace with increased sales, customers may experience delays as we seek to obtain additional capacity, which could harm our reputation and adversely affect our business, operating results and financial condition.
31
If we fail to maintain our reputation and brand cost-effectively, our business may suffer.
We believe that maintaining our reputation and brand in a cost-effective manner is critical to achieving widespread acceptance of our existing and future solutions and is an important element in attracting new customers. Our reputation and brand may be impaired by a number of factors, including product malfunctions, data security breaches, network outages and other events as described elsewhere in these risk factors. Furthermore, we believe that the importance of brand recognition will increase as competition in our market increases. Successful maintenance of our reputation and brand will depend largely on our ability to provide reliable and useful services at competitive prices to our customers. To date, we have engaged in relatively little direct brand promotion activities, which may enhance the risk that we may not successfully implement brand enhancement efforts in the future. Brand promotion activities may not yield increased revenue, and even if they do, any increased revenue may not offset the expenses we incurred in building our brand. If we fail to successfully promote and maintain our brand, or incur substantial expenses in an unsuccessful attempt to promote and maintain our brand, we may fail to attract enough new customers or retain our existing customers to the extent necessary to realize a sufficient return on our brand-building efforts, and our business could suffer.
Our growth depends in part on the success of our strategic relationships with third parties, such as global marketing partners.
We have formed strategic partnerships with global marketing partners, including payment processors, to expand the reach of our customers to end consumers through the variety of marketing channels offered by these partners. If we are unsuccessful in maintaining our relationships with these third parties or establishing relationships with others in the future, our ability to compete in the marketplace or to grow our revenue could be impaired and our operating results would suffer. Even if we are successful, we cannot assure you that these relationships will result in improved operating results.
We rely on third-party services, such as shipping and transportation, and payment and foreign exchange providers, in our ecommerce solutions.
We rely on third parties, such as shipping and transportation providers, to deliver our customers’ products to end consumers. Shortages of transportation vessels, transportation disruptions or other adverse conditions in the transportation industry due to shortages of truck drivers, strikes, slowdowns, piracy, terrorism, disruptions in rail service, closures of shipping routes, unavailability of ports and port service for other reasons, increases in fuel prices and adverse weather conditions could increase our costs and disrupt our operations and our ability to deliver our customers’ products to end consumers. The failure of our third-party transportation providers to provide high quality customer service when delivering our customers’ product to end consumers would adversely affect our customers’ and our reputation and our relationship with our customers and could negatively impact our business and operating results. In addition, we rely on our third-party service providers to execute our growth strategy of reducing the cost of logistics by expanding the number of hubs and carriers in our logistics network. If we fail to successfully integrate our third-party service providers into these efforts, our growth will be adversely affected. Furthermore, we rely on third parties to provide payment, remittance and worldwide currency exchange services, and we cannot guarantee that such providers will perform adequately. Errors made by, or delays in service from, such third party payment and currency exchange providers could adversely affect our ability to process purchases by consumers on our platform or convert local currencies to U.S. dollars in a timely manner or at all, which could affect our business, operating results and financial condition.
Our success will depend on our ability to build and maintain relationships with these and other third party service providers on commercially reasonable terms. If we are unable to build and maintain such relationships on commercially reasonable terms, we may have to suspend or cease operations. Even if we are able to build and maintain such relationships, if these third parties are unable to deliver their services on a timely basis, end consumers could become dissatisfied and decline to make future purchases from our customers, which would adversely affect our revenue derived from our customers’ ecommerce sites operating on our platform. If our customers become dissatisfied with the services provided by these third parties, our reputation and our company could suffer.
32
Our use of and reliance on research and development resources in Israel may expose us to unanticipated costs or events.
Our principal research and development operations are located in Israel. Accordingly, political, economic and military conditions in Israel may affect our business. Since the establishment of the State of Israel in 1948, a number of armed conflicts have occurred between Israel and its neighboring countries. Acts of terrorism periodically occur which could affect our operations or personnel. Ongoing or revived hostilities or other factors related to Israel could harm our operations and research and development process and could impede our ability to execute our plan of operations, and wars and acts of terrorism have resulted in damage to the Israeli economy, including reducing the level of foreign and local investment. Most recently, in July 2014, an armed conflict, which included rocket strikes against civilian targets in various parts of Israel, occurred between Israel and Hamas. Furthermore, certain of our officers and employees may be obligated to perform annual reserve duty in the Israel Defense Forces and are subject to being called up for active military duty at any time. Israeli citizens who have served in the army may be subject to an obligation to perform reserve duty until they are between 40 and 49 years old, depending upon the nature of their military service.
There can be no assurance that our reliance upon research and development resources in Israel will enable us to achieve meaningful cost reductions or greater resource efficiency. Further, our research and development efforts and other operations in Israel involve other significant risks, including:
• | difficulty hiring and retaining appropriate engineering personnel because of intense competition for engineers and resulting wage inflation; |
• | difficulties regarding the transfer of knowledge related to our technology and resulting exposure to misappropriation of intellectual property or information that is proprietary to us, our customers and other third parties; |
• | heightened exposure to change in the economic, security and political conditions in Israel; and |
• | fluctuations in currency exchange rates and difficulties of regulatory compliance in Israel. |
Difficulties resulting from the factors above and other risks related to our operations in Israel could expose us to increased expense, impair our development efforts and harm our competitive position.
If our platform contains serious errors or defects, then we may lose revenue and market acceptance and may incur costs to defend or settle product liability claims.
Complex software applications such as our platform often contain errors or defects, particularly when first introduced or when new versions or enhancements are released. Despite internal testing and testing by our customers, our current and future products may contain serious defects, which could result in lost revenue, financial penalties or a delay in market acceptance.
Since our customers use our platform for critical business applications, errors, defects or other performance problems could result in damage to our customers. They could seek significant compensation from us for the losses they suffer. Although our customer agreements typically contain provisions designed to limit our exposure to product liability claims, existing or future laws or unfavorable judicial decisions could negate these limitations. Even if not successful, a product liability claim brought against us would likely be time-consuming and costly and could seriously damage our reputation in the marketplace, making it harder for us to sell our solutions.
33
Government and industry regulation of the internet is evolving and could directly restrict our business or indirectly affect our business by limiting the growth of ecommerce. Unfavorable changes in government regulation or our failure to comply with regulations could harm our business and operating results.
As ecommerce continues to evolve, federal and state lawmakers in the US and around the world have adopted and could in the future adopt laws and/or regulations or revise existing regulations covering issues such as user privacy, data security, content, and taxation of products and services. Government regulations could limit the market for our products and services or impose burdensome requirements that render significant costs on our business or even make our business unprofitable. Our ecommerce solutions enable our customers to collect, manage and store a wide range of consumer data, including, without limitation, personal information. The United States and various state governments have adopted or proposed laws that regulate in various ways the collection, distribution, storage, security and/or use of personal information. Many foreign jurisdictions, including, without limitation, member states of the European Union, Canada, Israel, Australia, New Zealand, Japan and many other countries have adopted legislation that regulate the collection, distribution, storage, security and/or use, of personal information and other data. If our privacy or data security measures fail to comply with current or future laws and regulations, we may be subject to litigation, regulatory investigations or other liabilities, or our customers may terminate their relationships with us.
In addition, although many regulations might not apply to our business directly, we expect that laws regulating the solicitation, collection or processing of personal and consumer information could affect our customers’ ability to use and share certain data with us, potentially reducing demand for our services. Moreover, if future laws and regulations limit our customers’ ability to use and share consumer data or our ability to store, process and share data with our customers over the Internet, demand for our solutions could decrease, our costs could increase, and our operating results and financial condition could be harmed.
In addition, taxation of services provided over the Internet (including potentially in jurisdictions in which we do not have a physical presence) or other charges imposed by government agencies or by private organizations for accessing the Internet may also be imposed. In the United States for example, the U.S. Senate recently passed the Marketplace Fairness Act, which, if approved by the U.S. House of Representatives, would require all online retailers to collect sales taxes for the states where they ship goods. Any regulation imposing taxes, fees for Internet use or restricting information exchange over the Internet could increase our costs or result in a decline in the use of the Internet and the viability of Internet-based services, which could harm our business and operating results.
34
Our quarterly operating results may fluctuate in the future. As a result, we may fail to meet or exceed the expectations of research analysts or investors, which could cause our stock price to decline.
Our quarterly operating results may fluctuate as a result of a variety of factors, many of which are outside of our control. Fluctuations in our quarterly operating results could cause the price of our common stock to decline rapidly and significantly, may lead research analysts to change their long-term models for valuing our common stock, could cause short-term liquidity issues, may impact our ability to retain or attract key personnel or cause other unanticipated issues. If our quarterly operating results or guidance fall below the expectations of research analysts or investors, the price of our common stock could decline substantially. Fluctuations in our quarterly operating results or guidance may be due to a number of factors, including, but not limited to, those listed below:
• | factors affecting our existing customers’ sales processed on our platform, including seasonal factors and fluctuating foreign exchange rates affecting international end consumer demand; |
• | the extent to which our existing customers renew their agreements to use our solutions and the timing and terms of those renewals; |
• | the extent to which new customers are attracted to our solutions to satisfy their ecommerce needs and the timing and rate at which we acquire new customers and implement our solutions; |
• | the addition or loss of customers, including through acquisitions or consolidations and development of their own in-house international ecommerce solutions; |
• | the number of, and revenue generated by, new customers and the number of, and revenue generated by, renewal customers in a particular period on our platform; |
• | the amount and timing of operating expenses, including those related to the maintenance and expansion of our business, operations and infrastructure, including the development of new products, technologies and enhancements to our solutions; |
• | the timing and success of new solutions introduced by us, and those of current and new products and services introduced by our competitors; |
• | other changes in the competitive dynamics of our industry, including consolidation among competitors, customers, strategic partners or logistics providers; |
• | our ability to manage our existing business and future growth, including increases in the number of customers on our platform, additional customer ecommerce sites, new geographic regions, and our existing and future logistics providers; |
• | various factors related to disruptions in our hosting network infrastructure, defects in our solutions, privacy and data security compliance challenges and exchange rate fluctuations, each of which is described elsewhere in these risk factors; and |
• | general economic, industry and market conditions. |
We believe that our quarterly revenue and operating results may vary significantly in the future and that period-to-period comparisons of our operating results may not be meaningful. You should not rely on the results of one quarter as an indication of future performance.
35
Our long-term success depends on our ability to operate internationally and, in part, on our ability to reach our customers’ end consumers located outside of the United States, making us susceptible to risks associated with international sales and operations.
We currently ship our customers’ products to end consumers in over 100 countries and territories and settle transactions in more than 60 currencies, and we intend to expand our operations to reach new markets and localities. Conducting international operations subjects us to risks which include:
• | localization of our solutions, including translation into foreign languages and adaptation for local practices and regulatory requirements; |
• | lack of familiarity and burdens of complying with foreign laws, legal standards, regulatory requirements, tariffs, and other barriers, including restrictions on advertising practices, regulations governing online services, restrictions on importation of specified or proscribed items, importation quotas, consumer protection laws, enforcement of intellectual property rights, laws dealing with consumer privacy, data security and data protection, encryption, and restrictions on pricing or discounts; |
• | heightened exposure to credit card fraud; |
• | legal uncertainty in foreign countries with less developed legal systems; |
• | unexpected changes in regulatory requirements, taxes, trade laws, tariffs, export quotas, custom duties, embargoes, exchange controls, government controls or other trade restrictions; |
• | differing technology standards; |
• | difficulties in managing and staffing international operations and differing employer/employee relationships; |
• | fluctuations in exchange rates that may increase the volatility of our foreign based revenue; |
• | potentially adverse tax consequences, including the complexities of foreign tax laws (including with respect to value added taxes) and restrictions on the repatriation of earnings; |
• | likelihood of potential or actual violations of domestic and international anticorruption laws, such as the U.S. Foreign Corrupt Practices Act and the U.K. Bribery Act, increases with the increase of sales and operations in foreign jurisdictions and operations in certain industries; |
• | uncertain political and economic climates in foreign markets; and |
• | reduced or varied protection for intellectual property rights in some countries. |
These factors may cause our international costs of doing business to exceed our comparable domestic costs. Operating in international markets also requires significant management attention and financial resources. Any negative impact from our international business efforts could negatively impact our business, operating results and financial condition as a whole.
Fluctuations in the exchange rate of foreign currencies could result in currency transactions losses.
We currently have foreign sales denominated in Canadian dollars, Australian dollars, pounds sterling, euros, Japanese yen and other foreign currencies and, may in the future, have sales denominated in the currencies of additional countries. In addition, we incur a portion of our operating expenses in Israeli new shekels and, to a lesser extent, other foreign currencies. Effective December 2012, we entered into a contract with a third party foreign exchange services provider for currency exchange and remittance services for major currencies, including Canadian dollars, Australian dollars, pounds sterling, euros and Japanese yen, whereby the risk of loss on fluctuation in foreign exchange rates is borne by the third party provider. Although we have limited our risk of loss for major currencies we still may experience losses from fluctuations in exchange rates for sales in other foreign currencies, or upon translation to U.S. dollars expenses incurred in Israeli new shekels for our subsidiary operations, which may negatively impact our operating results.
36
We are subject to governmental export and import controls that could impair our ability to compete in international markets and subject us to liability if we are not in full compliance with applicable laws.
We are responsible for all aspects of the international order lifecycle for the products we ship for our customers, including compliance with export control and economic sanctions laws, which include the Commerce Department’s Export Administration Regulations, or EAR, and various economic and trade sanctions regulations established by the Treasury Department’s Office of Foreign Assets Controls. Further, our solutions are subject to these export control and economic sanctions laws, including laws related to transfers of technology, software and source code to non-U.S. persons. If we fail to comply with these U.S. export control laws and import laws, including U.S. Customs regulations, we and certain of our employees could be subject to substantial civil or criminal penalties, including the possible loss of export or import privileges; fines, which may be imposed on us and responsible employees or managers; and, in extreme cases, the incarceration of responsible employees or managers. In addition, if we, our customers or our carriers fail to obtain appropriate import, re-import, export or re-export licenses or authorizations, we may also be adversely affected through reputational harm and penalties. Furthermore, the U.S. export control laws prohibit the shipment of certain products and services to U.S.-embargoed or sanctioned countries, governments and persons. Even though we take precautions to prevent any shipments we make from being shipped or provided to U.S. sanctions targets, our customers’ products could be shipped to those targets or provided by our carriers despite such precautions. Any such shipment could have negative consequences, including government investigations, penalties and reputational harm. Any change in export or import regulations, economic sanctions or related laws, shift in the enforcement or scope of existing regulations, or change in the countries, governments, persons or technologies targeted by such regulations could result in decreased use of our solutions, or the decreased ability to make shipments of our customers’ products. Any decreased use of our solutions would likely adversely affect our business, operating results and financial condition. In addition, the U.S. Federal Aviation Administration, or the FAA, exercises regulatory jurisdiction over transporting hazardous materials and contraband. Shippers of hazardous materials share responsibility with the air and ground carrier for compliance with these regulations and are primarily responsible for proper packaging and labeling. Customers may fail to inform us about hazardous or illegal cargo even though they are required to do so. If we fail to discover any hazardous or illegal cargo or mislabel or otherwise improperly ship hazardous materials, we may suffer liability, fines and other significant penalties, our relationships with our carriers on whom we rely may be harmed, and we may attract closer regulatory scrutiny from the FAA and other regulatory agencies, which will have a material adverse effect on our operating results.
We have in the past been subject to registration as a money services business as a result of offering certain features with our GSS business. While we no longer offer such features with our products as a result of the sale of the GSS business, we may face continuing scrutiny from regulatory authorities as a result of our past conduct or because they have determined that we are still subject to such requirements.
We were previously registered as a money services business, or MSB, pursuant to the Bank Secrecy Act regulations administered by the Financial Crimes Enforcement Network, or FinCEN. We provided currency risk management services for online merchants and internet payment processors and enabled customers to keep account balances with us, and FinCEN had determined that we were acting as a dealer in foreign exchange and engaged in the transmission of funds. We are no longer registered as an MSB with FinCEN because we ceased offering such services, commensurate with the sale of the GSS business, which caused us to register. While we no longer offer those services, we may face continuing scrutiny from regulatory authorities as a result of our past conduct or because our current activities may be determined to subject us to registration as an MSB or licensure as a money transmitter.
Many people use smartphones and other mobile devices to access information on the internet and if we are not successful in developing effective mobile solutions, or those solutions are not widely adopted, our business could be harmed.
The number of people who access the Internet through mobile devices, including smartphones and handheld tablets or computers, has increased significantly in the past few years and is expected to continue to increase. Mobile devices provide our customers an additional channel to offer their products to end-consumers. If we are not able to successfully offer mobile ecommerce solutions to our customers, our ability to grow our business could be harmed.
Additionally, as new mobile devices and platforms are released, it is difficult to predict the problems we may encounter in developing features for these alternative devices and platforms, and we may need to devote significant resources to the creation, support and maintenance of such features. In addition, if we experience difficulties in the future in integrating our ecommerce solutions into mobile devices or if problems arise with our relationships with providers of mobile operating systems or mobile application download stores, our future growth and operating results could suffer. In addition, our customers may face different fraud risks from transactions sent from mobile devices than they do from personal computers. If we are unable to effectively anticipate and manage these fraud risks in our ecommerce solutions, our business and operating results may be harmed.
37
Our management team has limited experience managing a public company, and regulatory compliance may divert its attention from the day-to-day management of our business.
The individuals who now constitute our management team have limited experience managing a publicly-traded company and limited experience complying with the increasingly complex laws pertaining to public companies. Our management team may not successfully or efficiently manage our operations as a public company that is subject to significant regulatory oversight and reporting obligations under the federal securities laws. In particular, these new obligations require substantial attention from our senior management and could divert their attention away from the day-to-day management of our business.
If we fail to maintain an effective system of internal control over financial reporting, our ability to produce timely and accurate financial statements or comply with applicable regulations could be impaired.
Ensuring that we have adequate internal financial and accounting controls and procedures in place so that we can produce accurate financial statements on a timely basis is a costly and time-consuming effort that needs to be re-evaluated frequently. Our internal control over financial reporting is a process designed to provide reasonable assurance regarding the reliability of financial reporting and the preparation of financial statements in accordance with generally accepted accounting principles. In connection with our initial public offering, we began the process of documenting, reviewing and improving our internal controls and procedures for compliance with Section 404 of the Sarbanes-Oxley Act of 2002, or the Sarbanes-Oxley Act, which will require annual management assessment of the effectiveness of our internal control over financial reporting. We are testing our internal controls in connection with management’s certification related to internal controls as of December 31, 2014 and, as part of that documentation and testing, identifying areas for further attention and improvement. We have been recruiting additional finance and accounting personnel with certain skill sets that we need as a public company.
Implementing any appropriate changes to our internal controls may distract our officers and employees, entail substantial costs to modify our existing processes and take significant time to complete. These changes may not, however, be effective in maintaining the adequacy of our internal controls, and any failure to maintain that adequacy, or consequent inability to produce accurate financial statements on a timely basis, could increase our operating expenses and harm our business. In addition, investors’ perceptions that our internal controls are inadequate or that we are unable to produce accurate financial statements on a timely basis may harm our stock price and make it more difficult for us to effectively market and sell our service to new and existing customers.
38
We may expand by acquiring or investing in other companies, which may divert our management’s attention, result in additional dilution to our stockholders and consume resources that are necessary to sustain our business.
We may acquire complementary services, technologies or businesses as part of our business strategy. We also may enter into relationships with other businesses to expand our service offerings or our ability to provide service in foreign jurisdictions, which could involve preferred or exclusive licenses, additional channels of distribution, discount pricing or investments in other companies. For example, in January 2015 we completed an acquisition of Bundle Tech Limited. Negotiating these types of transactions is often time-consuming, difficult and expensive, and our ability to close these transactions may often be subject to conditions or approvals that are beyond our control. Consequently, transactions, even if undertaken and announced, may not close.
An acquisition, investment or new business relationship may result in unforeseen operating difficulties and expenditures. In particular, we may encounter difficulties assimilating or integrating the businesses, technologies, products, personnel or operations of the acquired companies, particularly if the key personnel of the acquired company choose not to work for us, the company’s software is not easily adapted to work with ours or we have difficulty retaining the customers of any acquired business due to changes in management or otherwise. Acquisitions may also disrupt our business, divert our resources and require significant management attention that would otherwise be available for development of our business. Moreover, the anticipated benefits of any acquisition, investment or business relationship may not be realized or we may be exposed to unknown liabilities. For one or more of those transactions, we may:
• | issue additional equity securities that would dilute our stockholders; |
• | use cash that we may need in the future to operate our business; |
• | incur debt on terms unfavorable to us or that we are unable to repay; |
• | incur large charges or substantial liabilities; |
• | encounter difficulties retaining key employees of the acquired company or integrating diverse software codes or business cultures; and |
• | become subject to adverse tax consequences, substantial depreciation or deferred compensation charges. |
Any of these risks could harm our business and operating results.
39
We depend on existing members of management and key employees to implement key elements in our strategy for growth, and the failure to retain them or to attract appropriately qualified new personnel could affect our ability to implement our growth strategy successfully.
The successful implementation of our growth strategy depends in part on our ability to retain our experienced management team and key employees and on our ability to attract appropriately qualified new personnel. We are highly dependent upon the continued service and performance of our senior management team and key technical and sales personnel, such as our president and chief executive officer, our chief financial officer, our chief strategy officer and our chief technology officer. These key employees may terminate employment with us at any time with no advance notice. We currently do not maintain key-person insurance on any members of our management and key employees. The loss of any key member of our management team or other key employees could hinder or delay our ability to implement our growth strategy effectively, and the replacement of these officers likely would involve significant time and costs, and the loss of these officers may significantly delay or prevent the achievement of our business objectives.
Further, if we are unable to attract appropriately qualified new personnel, including in the technical, research and development, and products fields, as we expand over the next few years, we may not be successful in implementing our growth strategy. We face intense competition for qualified individuals from numerous technology, software, ecommerce and Internet-related companies. For example, our competitors may be able to attract and retain a more qualified engineering team by offering more competitive compensation packages. If we are unable to attract new engineers and retain our current engineers, we may not be able to develop and maintain our services at the same levels as our competitors and we may, therefore, lose potential customers and sales penetration in certain markets. Our failure to attract and retain suitably qualified individuals could have an adverse effect on our ability to implement our business plan and, as a result, our ability to compete would decrease, and our operating results would suffer. In addition, if any of our key employees joins a competitor or decides to otherwise compete with us, we may experience a material disruption of our operations and development plans, which may cause us to lose customers or increase operating expenses as the attention of our remaining senior managers is diverted to recruit replacements for the departed key employees.
Provisions of our debt instruments may restrict our ability to pursue our business strategies.
Our credit facility requires us, and any debt instruments we may enter into in the future may require us, to comply with various covenants that limit our ability to, among other things:
• | dispose of assets; |
• | complete mergers or acquisitions; |
• | incur indebtedness; |
• | encumber assets; |
• | pay dividends or make other distributions to holders of our capital stock; |
• | make specified investments; |
• | change certain key management personnel; and |
• | engage in transactions with our affiliates. |
These restrictions could inhibit our ability to pursue our business strategies. If we default under our credit facility, and such event of default was not cured or waived, the lenders could terminate commitments to lend and cause all amounts outstanding with respect to the debt to be due and payable immediately, which in turn could result in cross defaults under other debt instruments. Our assets and cash flow may not be sufficient to fully repay borrowings under all of our outstanding debt instruments if some or all of these instruments are accelerated upon a default.
We may incur additional indebtedness in the future. The debt instruments governing such indebtedness could contain provisions that are as, or more, restrictive than our existing debt instruments. If we are unable to repay, refinance or restructure our indebtedness when payment is due, the lenders could proceed against the collateral granted to them to secure such indebtedness or force us into bankruptcy or liquidation.
40
We rely on insurance to mitigate some risks facing our business, and to the extent our insurance does not mitigate the risks facing our business or our insurers are unable to meet their obligations, our operating results may be negatively impacted.
We contract for insurance to cover certain potential risks and liabilities, such as general liability, directors' and officers' liability and marine cargo and warehouse losses. It is possible that we may not be able to obtain enough insurance to meet our needs, may have to pay very high prices for the coverage we do obtain, have very high deductibles, may not be able to, or may choose not to, acquire any insurance for certain types of business risk. For example, while we maintain standard marine cargo and warehouse insurance that is intended to cover shipping and transportation losses, many events, such as downtime of our platform resulting in significant losses for us and our customers, are not insured and may not be insurable. This could leave us exposed to potential claims. If we were found liable for a significant claim in the future, our business, operating results and financial condition could be negatively impacted. Also, to the extent the cost of maintaining insurance increases, our business, operating results and financial condition could be negatively affected. Additionally, we are subject to the risk that one or more of our insurers may become insolvent and would be unable to pay a claim that may be incurred in the future. There can be no assurance that our insurance will be adequate to protect us from pending and future claims. In addition, we are required to maintain insurance coverage under some of our agreements with our clients. If we are not able to or do not maintain the required insurance coverage, we could breach those agreements.
We are subject to the rules and regulations adopted by the payment card networks, such as Visa and MasterCard, and if we fail to adhere to their rules and regulations, we would be in breach of our contractual obligations to payment processors and merchant banks, which could subject us to damages and liability and could eventually prevent us from processing or accepting credit card payments.
The payment card networks, such as Visa and MasterCard have adopted rules and regulations that apply to all merchants who process and accept credit cards for payment of goods and services. We are obligated to comply with these rules and regulations as part of the contracts we enter into with payment processors and merchant banks. The rules and regulations adopted by the payment card networks include the Payment Card Industry Data Security Standards, or PCI DSS. Under the PCI DSS, we are required to adopt and implement internal controls over the use, storage and security of payment card data to help prevent fraud. If we fail to comply with the rules and regulations adopted by the payment card networks, including the PCI DSS, we would be in breach of our contractual obligations to payment processors and merchant banks. Such failure to comply may subject us to fines, penalties, damages, higher transaction fees, and civil liability, loss of certification and could eventually prevent us from processing or accepting debit and credit cards or could lead to a loss of payment processor partners. Further, there is no guarantee that even if we comply with the rules and regulations adopted by the payment card networks, we will be able to maintain our compliance. We also cannot guarantee that such compliance will prevent illegal or improper use of our payments systems or the theft, loss or misuse of the debit or credit card data of customers or participants or regulatory or criminal investigations. A failure to adequately control fraudulent credit card transactions would result in significantly higher credit card-related costs and any increases in our credit card and debit card fees could adversely affect our business, operating results and financial condition. Moreover, any such illegal or improper payments could harm our reputation and may result in a loss of service for our customers, which would adversely affect our business, operating results and financial condition.
41
We are an “emerging growth company” and we cannot be certain if the reduced disclosure requirements applicable to emerging growth companies will make our common stock less attractive to investors.
We are an “emerging growth company,” as defined in the JOBS Act, and, for as long as we continue to be an “emerging growth company,” we may take advantage of certain exemptions from various reporting requirements that are applicable to other public companies but not to “emerging growth companies” including, but not limited to, not being required to have our independent registered public accounting firm audit our internal control over financial reporting under Section 404 of the Sarbanes-Oxley Act, reduced disclosure obligations regarding executive compensation in our periodic reports and proxy statements and exemptions from the requirements of holding a nonbinding advisory vote on executive compensation and shareholder approval of any golden parachute payments not previously approved.
As an “emerging growth company” under the JOBS Act, we are permitted to delay the adoption of new or revised accounting pronouncements applicable to public companies until such pronouncements are made applicable to private companies. However, we are electing not to take advantage of such extended transition period, and as a result, we will comply with new or revised accounting standards on the relevant dates on which adoption of such standards is required for non-emerging growth companies. Section 107 of the JOBS Act provides that our decision to not take advantage of the extended transition period for complying with new or revised accounting standards is irrevocable.
We could be an “emerging growth company” for up to five years following completion of our initial public offering, which occurred in March 2014, although if we have more than $1.0 billion in annual revenue, if the market value of our common stock that is held by non-affiliates exceeds $700 million as of June 30 of any year, or we issue more than $1.0 billion of non-convertible debt over a three-year period before the end of that five-year period, we would cease to be an “emerging growth company” as of the following December 31.
We cannot predict if investors will find our common stock less attractive if we choose to rely on these exemptions. If some investors find our common stock less attractive as a result of any choices to reduce future disclosure, there may be a less active trading market for our common stock and our stock price may be more volatile.
42
Complying with public company reporting and other obligations may strain our financial and managerial resources, particularly after we cease to be an "emerging growth company."
Public company reporting, compliance and corporate governance requirements result in significant initial and continuing legal, accounting, administrative and other costs and expenses. For example, the Sarbanes-Oxley Act and rules subsequently implemented by the SEC and NASDAQ impose numerous requirements on public companies, including mandated corporate governance practices such as director independence, distributing annual and interim reports, stockholder meetings, approvals and voting, soliciting proxies, conflicts of interest and a code of conduct. In addition, the Exchange Act requires, among other things, that we file annual, quarterly and current reports with respect to our business and operating results. Our management and other personnel will need to devote a substantial amount of time to compliance with these laws and regulations. As a relatively new public company, these requirements have increased and will continue to increase our legal, accounting and financial compliance costs and have made and will continue to make some activities more time consuming and costly. For example, we expect these rules and regulations to make it more difficult and more expensive for us to obtain director and officer liability insurance, and we may be required to accept reduced policy limits and coverage or incur substantially higher costs to maintain the same or similar coverage. As a result, it may be more difficult for us to attract and retain qualified individuals to serve on our board of directors or as our executive officers.
The Sarbanes-Oxley Act requires, among other things, that we assess the effectiveness of our internal control over financial reporting annually and the effectiveness of our disclosure controls and procedures quarterly. In particular, beginning December 31, 2014, Section 404 of the Sarbanes-Oxley Act, or Section 404, will require us to perform system and process evaluation and testing of our internal control over financial reporting to allow management to report on, and our independent registered public accounting firm potentially to attest to, the effectiveness of our internal control over financial reporting. As an “emerging growth company,” we expect to avail ourselves of the exemption from the requirement that our independent registered public accounting firm attest to the effectiveness of our internal control over financial reporting under Section 404. However, we may no longer avail ourselves of this exemption when we cease to be an “emerging growth company.” When our independent registered public accounting firm is required to undertake an assessment of our internal control over financial reporting, the cost of our compliance with Section 404 will correspondingly increase. Our compliance with applicable provisions of Section 404 will require that we incur substantial accounting expense and expend significant management time on compliance-related issues as we implement additional corporate governance practices and comply with reporting requirements. Moreover, if we are not able to comply with the requirements of Section 404 applicable to us in a timely manner, or if we or our independent registered public accounting firm identifies deficiencies in our internal control over financial reporting that are deemed to be material weaknesses, the market price of our stock could decline and we could be subject to sanctions or investigations by the SEC or other regulatory authorities, which would require additional financial and management resources.
Furthermore, investor perceptions of our company may suffer if deficiencies are found, and this could cause a decline in the market price of our stock. Irrespective of compliance with Section 404, any failure of our internal control over financial reporting could have a material adverse effect on our stated operating results and harm our reputation. If we are unable to implement these requirements effectively or efficiently, it could harm our operations, financial reporting, or financial results and could result in an adverse opinion on our internal controls from our independent registered public accounting firm.
After we are no longer an “emerging growth company,” or sooner if we choose not to take advantage of certain exemptions set forth in the JOBS Act, we expect to incur significant expenses and devote substantial management effort toward ensuring compliance with the auditor attestation requirements of Section 404 of the Sarbanes-Oxley Act. In that regard, we will need to hire additional accounting and financial staff with appropriate public company experience and technical accounting knowledge.
We are faced with increasingly complex tax issues in many jurisdictions, and we could be obligated to pay additional taxes in various jurisdictions.
We may be subject to taxation in many jurisdictions in the United States and around the world with increasingly complex tax laws, the application of which can be uncertain. The amount of taxes we pay in these jurisdictions could increase substantially as a result of changes in the applicable tax laws, including increased tax rates or revised interpretations of existing tax laws and precedents, which could have a material adverse effect on our liquidity and operating results. In addition, the taxing authorities in these jurisdictions could review our tax returns, or authorities in jurisdictions in which we do not file tax returns could assert that we are subject to tax in such jurisdiction, and in either case could impose additional tax, interest and penalties. Further, the authorities could claim that various withholding requirements apply to us or our subsidiaries or assert that benefits of tax treaties are not available to us or our subsidiaries, any of which could have a material impact on us and the results of our operations.
43
Taxing authorities could reallocate our taxable income among our subsidiaries, which could increase our consolidated tax liability.
We conduct global operations through subsidiaries in various tax jurisdictions pursuant to transfer pricing arrangements among our affiliated entities. If two or more affiliated companies are located in different countries, the tax laws or regulations of each country generally will require that transfer prices be the same as those between unrelated companies dealing at arms’ length and that contemporaneous documentation is maintained to support the transfer prices. While we believe that we operate in compliance with applicable transfer pricing laws and intend to continue to do so, our transfer pricing procedures are not binding on applicable tax authorities. If tax authorities in any of these countries were to successfully challenge our transfer prices, they could require us to adjust our transfer prices and thereby reallocate our income to reflect these revised transfer prices, which could result in a higher tax liability to us. In addition, if the country from which the income is reallocated does not agree with the reallocation, both countries could tax the same income, resulting in double taxation. If tax authorities were to allocate income to a higher tax jurisdiction, subject our income to double taxation or assess interest and penalties, it would increase our consolidated tax liability, which could adversely affect our business, operating results and financial condition.
Our ability to use net operating loss carryforwards to reduce future tax payments may be limited if we have or have had a change in ownership, or if taxable income does not reach sufficient levels.
As of December 31, 2014, we had net operating loss carryforwards for federal and state income tax purposes of approximately $7.6 million and $3.7 million, respectively. The annual use of our net operating losses may be limited following certain ownership changes under provisions of the Internal Revenue Code of 1986, as amended, and applicable state tax law. We have not completed a study to assess whether an ownership change occurred as a result of our initial public offering, or whether there have been one or more ownership changes since our inception, due to the costs and complexities associated with such study. Accordingly, our ability to use our net operating loss carryforwards to reduce future tax payments may be currently limited or may be limited as a result of our initial public offering or any future issuance of shares of our stock.
44
Risks Related to Data Security and Our Intellectual Property
Security and privacy breaches may hurt our business.
In connection with our business, we collect certain personally identifiable information, or personal information, from our customers. Some of this information includes sensitive and/or regulated information, such as credit card information or other payment details. We believe that we take reasonable steps to protect the privacy, security, integrity and confidentiality of the information we collect, use, store, and disclose, but there is no guarantee that inadvertent or unauthorized data access or use will not occur despite our efforts. For example, the personal information and other data that we collect may be subject to unauthorized access, as a result of software bugs, hacking, technical malfunctions, employee error or malfeasance, and/or other factors. Any unauthorized access or use of personal information and other customer data, virus or similar breach or disruption to our, our customers’, or our partners’ systems and security measures as a result of third-party action, employee error, malfeasance or otherwise could result in loss of personal information or other confidential information, damage to our reputation and customer relationships, early termination of our contracts and other business losses, the triggering of obligations to indemnify our customers for any losses that they sustain, financial penalties, litigation, regulatory investigations, and other significant liabilities.
Techniques used to obtain unauthorized access to personal information, confidential information and/or the systems on which such information are stored and/or to sabotage systems change frequently and generally are not recognized until launched against a target. As a result, we may be unable to anticipate these techniques or to implement adequate preventative measures. If an actual or perceived security breach occurs, the market perception of our security measures could be harmed and we could lose sales and customers or suffer other negative consequences to our business. In addition, the vast majority of U.S. states and a number of foreign jurisdictions impose detailed breach notification obligations that would apply in the event of unauthorized access to certain personally identifiable information. In the event we experience a data breach, we could be subject to one or more of these laws which could require us to undertake costly and burdensome notification obligations. Any data breach incidents could also have a material and adverse effect on our business, reputation, or financial results.
Any significant violations of data privacy and/or information security could result in the loss of business, litigation and regulatory investigations and penalties that could damage our reputation and adversely impact our operating results and financial condition. Moreover, if a high profile security breach occurs with respect to another ecommerce technology services provider, our customers and potential customers may lose trust in the security of our business model generally, which could adversely impact our ability to retain existing customers or attract new ones. We maintain coverage for third party “Cyber Liability” claims. However, in the event of a major third party security incident, we may incur losses in excess of the insurance coverage. Further, certain incidents that we can experience may not be covered by the insurance that we carry.
45
We collect, use, store, and disclose personal information and other data, which subjects us to governmental regulation and other legal obligations related to privacy and data security. Our actual or perceived failure to comply with such obligations could harm our business.
As part of our ecommerce solution that we offer to our customers, we collect, use, store, and disclose personal information and other customer data, including consumers’ mailing addresses, email addresses, phone numbers and other contact information, bank account numbers, credit and debit card information, identification numbers and images of government identification cards. We use this data to provide our services to our customers. We also aggregate this data and conduct data analytics based on this aggregated data to gain insights on the global consumer and formulate data-driven marketing and merchandising strategies. As a result, we are required to comply with certain privacy and data security requirements, including the Payment Card Industry Data Security Standards and U.S. state laws concerning privacy and security of personal information. In addition, the European Union, or EU, has traditionally taken a broader view as to what is considered personal information and has imposed greater obligations under data privacy regulations. There are also numerous other federal, state and local laws around the world regarding privacy and the collection, usage, storage, disclosure and protection of personal information and other data, the scope of which are changing, subject to differing interpretations, and may be inconsistent between countries or conflict with other applicable rules. It is possible that these obligations may be interpreted and applied in a manner that is inconsistent from one jurisdiction to another and may conflict with other rules, our business practices, or our contractual commitments to our customers.
The regulatory framework for privacy and data security issues worldwide is evolving. The U.S. federal government and various state governments have adopted or proposed limitations on the collection, use, storage and disclosure of personally identifiable information. Numerous foreign jurisdictions, including all countries that are member states of the EU, have adopted legislation that impose stringent restrictions on the collection, usage, storage, disclosure, security and deletion of personal information. In addition, individual EU member states have had discretion with respect to their interpretation and implementation of certain requirements of European Directives. This has resulted in variation of privacy and data security standards from country to country within the European Union. Foreign data protection, privacy, and other laws and regulations are often more restrictive than those in the United States. A failure to comply fully with applicable foreign legal requirements could result in fines and other liabilities, negative publicity and loss of business.
U.S. federal and state and foreign laws and regulations are constantly evolving and can be subject to significant change. A number of proposals are pending before federal, state, and foreign legislative and regulatory bodies that could significantly affect our business. Within the EU, for example, legislators have proposed a new data protection regulation that would substantially overhaul the 1995 European Union Data Protection Directive. European lawmakers are continuing to evaluate the numerous amendments that have been proposed to the regulation and, as a result, implementation of the new measure may be delayed to 2016 or later. Once implemented, however, the new regulation is expected to introduce stringent operational requirements for processors and controllers of personal information and impose significant penalties for non-compliance. If our privacy or data security measures fail to comply with current or future laws and regulations or our policies, we may be subject to litigation, regulatory investigations, fines, defense costs and other liabilities, as well as negative publicity and a potential loss of business. Moreover, if future laws and regulations limit our customers’ ability to collect, use, store and share consumer data or our ability to use, store and disclose personal information and/or other data with our customers over the Internet, demand for our solution could decrease, our costs could increase, and our business, operating results and financial condition could be harmed.
46
We could be required to stop selling or using a product or service and/or incur substantial costs as a result of any claim of violation of another party’s intellectual property or proprietary rights.
In recent years, there has been significant litigation in the United States involving patents and other intellectual property and proprietary rights. Companies providing Internet-related products and services are increasingly bringing and becoming subject to suits alleging infringement of proprietary rights, particularly patent rights. These risks have been amplified by the increase in third parties, which we refer to as non-practicing entities, whose primary business is to assert such claims. We could incur substantial costs in prosecuting or defending any intellectual property litigation. If we sue to enforce our rights or are sued by a third party that claims that our business violates its rights, the litigation could be expensive and could divert our management resources.
In addition, in most instances, we have agreed to indemnify our customers against certain claims that our products and services violate the intellectual property rights of third parties. Our business could be adversely affected by any significant disputes between us and our customers as to the applicability or scope of our indemnification obligations to them. The results of any litigation to which we might become a party, or for which we are required to provide indemnification, may require us to do one or more of the following:
• | cease making, selling offering for sale or using products or services that incorporate the challenged intellectual property; |
• | make substantial payments for legal fees, settlement payments or other costs or damages; |
• | obtain a license, which may not be available on reasonable terms, to sell or use the relevant technology; or |
• | redesign those products or services to avoid infringement. |
If we are required to make substantial payments or undertake any of the other actions noted above as a result of any intellectual property infringement claims against us or any obligation to indemnify our customers for such claims, such payments or costs could have a material adverse effect upon our business and financial results.
47
We could incur substantial costs in protecting our intellectual property from infringement, and any failure to protect our intellectual property could impair our business.
We seek to protect the source code for our proprietary software under a combination of patent, copyright and trade secrets law. Our ability to stop unauthorized third parties from making, using, selling, offering to sell or importing our proprietary software is dependent upon the extent to which we have rights under valid and enforceable patents, copyrights or trade secrets that cover these activities. However, because we make some of the source code available to some customers, third parties may be more likely to misappropriate it. Our policy is to enter into confidentiality agreements with our employees, consultants, vendors and customers and to control access to our software, documentation and other proprietary information. Despite these precautions, it may be possible for someone to copy our software or other proprietary information without authorization or to develop similar software independently.
Despite our efforts to protect our proprietary rights, unauthorized parties may attempt to copy aspects of our platform or to obtain and use information that we regard as proprietary. Policing unauthorized use of our platform is difficult, and while we are unable to determine the extent to which piracy of our software exists, we expect software piracy to be a persistent problem. Litigation may be necessary in the future to enforce our intellectual property rights, to protect our trade secrets, to determine the validity and scope of the proprietary rights of others or to defend against claims of infringement or invalidity. Such litigation could be costly, time-consuming and distracting to management, result in a diversion of resources, the impairment or loss of portions of our intellectual property and have a material adverse effect on our business, operating results and financial condition. Furthermore, our efforts to enforce our intellectual property rights may be met with defenses, counterclaims and countersuits attacking the validity and enforceability of our intellectual property rights. These steps may be inadequate to protect our intellectual property. We will not be able to protect our intellectual property if we are unable to enforce our rights or if we do not detect unauthorized use of our intellectual property. Despite our precautions, it may be possible for unauthorized third parties to copy our platform and use information that we regard as proprietary to create products and services that compete with ours. Some license provisions protecting against unauthorized use, copying, transfer and disclosure of our platform may be unenforceable under the laws of certain jurisdictions and foreign countries. Further, the laws of some countries do not protect proprietary rights to the same extent as the laws of the United States. To the extent we expand our international activities, our exposure to unauthorized copying and use of our platform and proprietary information may increase.
There can be no assurance that our means of protecting our proprietary rights will be adequate or that our competitors will not independently develop similar technology. If we fail to meaningfully protect our intellectual property, then our business, brand, operating results and financial condition could be materially harmed.
Our use of “open source” software could negatively affect our ability to sell our services and subject us to possible litigation.
A portion of the technologies licensed by us incorporate so-called “open source” software, and we may incorporate open source software in the future. Such open source software is generally licensed by its authors or other third parties under open source licenses. If we fail to comply with these licenses, we may be subject to certain conditions, including requirements that we offer our solutions that incorporate the open source software for no cost, that we make available source code for modifications or derivative works we create based upon, incorporating or using the open source software or that we license such modifications or derivative works under the terms of the particular open source license. If an author or other third party that distributes such open source software were to allege that we had not complied with the conditions of one or more of these licenses, we could be required to incur significant legal expenses defending against such allegations and could be subject to significant damages, enjoined from the sale of our solutions that contained the open source software and required to comply with the foregoing conditions, which could disrupt the distribution and sale of some of our solutions. In addition, there have been claims challenging the ownership of open source software against companies that incorporate open source software into their products. As a result, we could be subject to suits by parties claiming ownership of what we believe to be open source software. Litigation could be costly for us to defend, have a negative effect on our operating results and financial condition or require us to devote additional research and development resources to change our products.
48
We rely on third-party software, including server software and licenses from third parties to use patented intellectual property that is required for the development of our solutions, which may be difficult to obtain or which could cause errors or failures of our solutions.
We rely on software licensed from or hosted by third parties to offer our solutions. In addition, we may need to obtain future licenses from third parties to use intellectual property associated with the development of our solutions, which might not be available to us on acceptable terms, or at all. Any inability to obtain or loss of the right to use any software required for the development and maintenance of our solutions could prevent us from providing our solutions or result in delays in the provision of our solutions until equivalent technology is either developed by us, or, if available, is identified, obtained and integrated, which could harm our business. Any errors or defects in third-party software could result in errors or a failure of our solutions which could harm our business.
49
Risks Related to Ownership of Our Common Stock
The market price of our common stock has been and may be volatile in the future.
The market price of our common stock could be subject to significant fluctuations, and it may decline below the price at which you purchased your shares, in response to various factors, some of which are beyond our control. These factors include:
• | price and volume fluctuations in the overall stock market from time to time; |
• | significant volatility in the market price and trading volume of comparable companies; |
• | actual or anticipated changes or fluctuations in our operating results or financial guidance or in the expectations of securities analysts; |
• | announcements of technological innovations, new products, strategic alliances or significant agreements by us or by our competitors; |
• | litigation involving us or developments or disputes concerning our intellectual property or other rights; |
• | changes in general economic, industry and market conditions and trends; |
• | issuance of new or changed securities analysts’ reports or recommendations with respect to our stock; |
• | future sales of our common stock or securities; |
• | expiration of contractual lock-up agreements; |
• | recruitment or departure of key personnel; and |
• | the other factors discussed in these Risk Factors. |
In the past, following periods of volatility in the market price of a company’s securities, securities class action litigation has often been brought against that company. Because of the past and potential future volatility of our stock price, we may become the target of securities litigation in the future. Securities litigation could result in substantial costs and divert management’s attention and resources from our business.
We may need financing in the future, and any additional financing may result in restrictions on our operations or substantial dilution to our stockholders.
We may need to raise funds in the future, for example, to develop new technologies, expand our business, respond to competitive pressures, acquire complementary businesses, or respond to unanticipated situations. We may try to raise additional funds through public or private financings, strategic relationships, or other arrangements. Our ability to obtain debt or equity funding will depend on a number of factors, including market conditions, our operating performance, and investor interest. Additional funding may not be available to us on acceptable terms or at all. If adequate funds are not available, we may be required to reduce expenditures, including curtailing our growth strategies, foregoing acquisitions, or reducing our product development efforts. If we succeed in raising additional funds through the issuance of equity or equity-based securities, then the issuance could result in substantial dilution to existing stockholders. If we raise additional funds through the issuance of debt securities or preferred stock, these new securities would have rights, preferences, and privileges senior to those of the holders of our common stock. The terms of these securities, as well as any borrowings under our credit agreement, could impose restrictions on our operations.
50
If securities or industry analysts cease publishing research or reports about us, our business or our market, or if they publish negative evaluations of our stock, the price of our stock and trading volume could decline.
The trading market for our common stock will be influenced by the research and reports that industry or securities analysts may publish about us, our business, our market or our competitors. If one or more of the analysts covering our business downgrade their evaluations of our stock, the price of our stock could decline. If one or more of these analysts cease to cover our stock, we could lose visibility in the market for our stock, which in turn could cause our stock price to decline.
Future sales of our common stock may cause our stock price to decline.
Sales of a substantial number of shares of our common stock in the public market, or the perception that these sales might occur, could significantly reduce the market price of our common stock and impair our ability to raise additional capital through the sale of additional equity securities.
The concentration of ownership of our capital stock limits your ability to influence corporate matters.
As of December 31, 2014, our executive officers, directors and greater than 5% stockholders, together with their affiliates, beneficially owned, in the aggregate, approximately 64.6% of our outstanding common stock. As a result, these stockholders, if they act together, could have significant influence over the outcome of matters submitted to our stockholders for approval, including the election of directors and any merger, consolidation or sale of all or substantially all of our assets, and over the management and affairs of our company. This concentration of ownership may have the effect of delaying or preventing a change in control of our company and might affect the market price of our common stock.
51
Anti-takeover provisions in our certificate of incorporation and our bylaws, as well as provisions of Delaware law, may discourage, delay or prevent an acquisition of our company or changes in our management and, therefore, depress the trading price of our common stock.
Our certificate of incorporation and bylaws and Delaware law contain provisions that may discourage, delay or prevent a merger, acquisition or other change in control that stockholders may consider favorable, including transactions in which you might otherwise receive a premium for your shares of our common stock. These provisions may also prevent or frustrate attempts by our stockholders to replace or remove our management and may limit the price that investors might be willing to pay for our common stock. Our corporate governance documents include provisions:
• | establishing a classified board of directors with staggered three-year terms so that not all members of our board are elected at one time; |
• | providing that directors may be removed by stockholders only for cause; |
• | limiting the ability of our stockholders to call and bring business before special meetings and to take action by written consent in lieu of a meeting; |
• | requiring advance notice of stockholder proposals for business to be conducted at meetings of our stockholders and for nominations of candidates for election to our board of directors; |
• | authorizing blank check preferred stock, which could be issued with voting, liquidation, dividend and other rights superior to our common stock; |
• | limiting the liability of, and providing indemnification to, our directors and officers; |
• | providing that vacancies may only be filled by the remaining directors; |
• | preventing the ability of our stockholders to call and bring business before special meetings and to take action by written consent in lieu of a meeting; |
• | providing for a supermajority requirement to amend our bylaws; and |
• | establishing the Court of Chancery of the State of Delaware as the sole and exclusive forum for any legal actions. |
As a Delaware corporation, we are also subject to provisions of Delaware law, including Section 203 of the General Corporation Law of the state of Delaware, which prevents some stockholders holding more than 15% of our outstanding common stock from engaging in certain business combinations without approval of the holders of substantially all of our outstanding common stock. Any provision of our certificate of incorporation or bylaws or Delaware law that has the effect of delaying or deterring a change in control could limit the opportunity for our stockholders to receive a premium for their shares of our common stock, and could also affect the price that some investors are willing to pay for our common stock.
We do not intend to pay dividends for the foreseeable future.
We have never declared or paid any cash dividends on our common stock and do not intend to pay any cash dividends in the foreseeable future. We anticipate that we will retain all of our future earnings for use in the operation of our business and for general corporate purposes. Any determination to pay dividends in the future will be at the discretion of our board of directors. Accordingly, investors must rely on sales of their common stock after price appreciation, which may never occur, as the only way to realize any future gains on their investments. In addition, our credit facility prohibits, and future debt instruments may materially restrict, us from declaring or paying cash dividends on our capital stock.
52
ITEM 1B. UNRESOLVED STAFF COMMENTS
None.
ITEM 2. PROPERTIES
Our principal corporate offices are located in New York, New York. We currently occupy three floors in New York approximating 28,000 square feet of space under a lease that expires in November 2020. We occupy an additional leased facility, approximating 12,000 square feet of space, in Tel Aviv, Israel for our research and development operations. We also lease office space in Dublin, Ireland and Shanghai, China. We believe that our facilities are suitable for our current needs and that additional or substitute space will be readily available, on commercially reasonable terms, as needed to support the expansion of our business.
ITEM 3. LEGAL PROCEEDINGS
From time to time, we are subject to various legal proceedings that arise in the normal course of our business activities. In addition, from time to time, third parties may assert intellectual property infringement claims against us or our customers in the form of letters and other forms of communication. As of the date of this Annual Report on Form 10-K, we are not a party to any litigation the outcome of which, if determined adversely to us, would individually or in the aggregate be reasonably expected to have a material adverse effect on our results of operations, prospects, cash flows, financial position or brand.
ITEM 4. MINE SAFETY DISCLOSURES
Not applicable.
53
ITEM 5. MARKET FOR THE REGISTRANT'S COMMON EQUITY, RELATED STOCKHOLDER MATTERS, AND ISSUER PURCHASES OF EQUITY SECURITIES
Market for Our Common Stock and Price Range of Our Common Stock
Our common stock has traded on NASDAQ under the symbol "BRDR" since March 21, 2014. Prior to that time, there was no public market for our common stock. The following table sets forth for the periods indicated the high and low closing sale prices for our common stock as reported on NASDAQ since our initial public offering.
Fiscal 2014 | |||||||
High | Low | ||||||
First Quarter* | $ | 20.00 | $ | 17.54 | |||
Second Quarter | 18.08 | 11.01 | |||||
Third Quarter | 17.02 | 12.90 | |||||
Fourth Quarter | 12.72 | 6.97 | |||||
* First quarter is from March 21, 2014.
On February 25, 2015, the last reported sale price of our common stock on NASDAQ was $7.51 per share.
Holders of Record
As of February 25, 2014 there were 32 stockholders of record of our common stock (not including beneficial holders of stock held in street name). Because many of our common stock are held of record by brokers and other institutions on behalf of stockholders, we are unable to estimate the total number of stockholders represented by such record holders.
Dividends
We have never declared or paid, and do not anticipate declaring or paying, any cash dividends on our common stock. Any future determination as to the declaration and payment of dividends will be at the discretion of our board of directors and will depend on then-existing conditions, including our financial condition, operating results, contractual restrictions, capital requirements, business prospects and other factors our board of directors may deem relevant. In addition, our credit facility prohibits, and future debt instruments may materially restrict, us from declaring or paying cash dividends on our capital stock.
Use of Proceeds from Public Offering of Common Stock
On March 20, 2014, our registration statement on Form S-1 (File No. 333-193988) was declared effective for our initial public offering. On March 26, 2014, we closed our initial public offering of 5,750,000 shares of common stock, including 750,000 shares of common stock sold pursuant to the underwriters’ option to purchase additional shares, at an offering price of $16.00 per share, for aggregate gross proceeds to us of $92.0 million. The managing underwriters for the offering were Credit Suisse Securities (USA) LLC and RBC Capital Markets, LLC.
The net offering proceeds to us, after deducting underwriting discounts totaling approximately $6.4 million and offering expenses totaling approximately $3.2 million, were approximately $82.3 million. No offering expenses were paid directly or indirectly to any of our directors or officers (or their associates) or persons owning ten percent or more of any class of our equity securities or to any other affiliates. As of December 31, 2014, we have invested $60.0 million of the proceeds in money market funds and fixed income securities. In January 2015, we used a portion of the net proceeds from our initial public offering to acquire 100% of the equity of Bundle Tech Limited for $22 million cash consideration (See Note 2 of our Consolidated Financial Statements). If we decide in the future to pursue additional strategic acquisitions, we may use our initial public offering proceeds to fund those types of investments.
There has been no material change in the planned use of proceeds from our initial public offering as described in our final prospectus filed with the SEC on March 21, 2014 pursuant to Rule 424(b)(4) under the Securities Act.
Unregistered Sales of Securities
None.
54
Issuer Purchases of Equity Securities
None.
Stock Price Performance Graph
The following performance graph and related information shall not be deemed “soliciting material” or “filed” for purposes of Section 18 of the Securities Exchange Act of 1934, as amended, or the Exchange Act, or incorporated by reference into any filing of Borderfree, Inc. under the Securities Act of 1933, as amended, or the Exchange Act, except to the extent we specifically incorporate it by reference in such filing.
The following comparative stock performance graph compares the cumulative total stockholder return on our common stock from March 21, 2014 through December 31, 2014 with the cumulative total return of the Russell 2000 Index and the NASDAQ Computer Index over the same period, assuming the investment of $100 in our common stock and in both of the other indices on March 21, 2014 and the reinvestment of all dividends, if any. The comparisons shown in the graph are based upon historical data. The stock price performance reflected on the graph below is not necessarily indicative of future price performance. See the disclosure in Part I, Item 1A. “Risk Factors.”
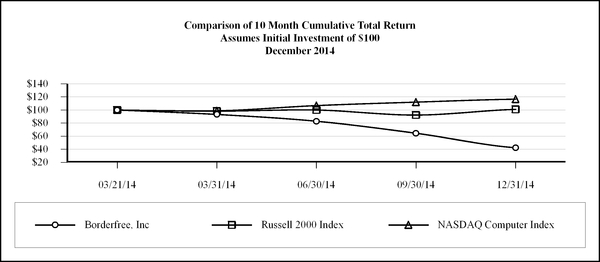
Securities Authorized for Issuance under Equity Compensation Plans
See Part III, Item 12 of this Annual Report on Form 10-K for disclosure relating to our equity compensation plans.
55
ITEM 6. SELECTED CONSOLIDATED FINANCIAL DATA
We have derived the selected consolidated statements of operations data for the years ended December 31, 2014, 2013 and 2012 and selected consolidated balance sheet data as of December 31, 2014 and 2013 from our audited consolidated financial statements included elsewhere in this Annual Report on Form 10-K. We have derived the selected consolidated balance sheet data as of December 31, 2014 from our audited consolidated financial statements not included in this Annual Report on Form 10-K.
The following selected consolidated financial data should be read in conjunction with “Management’s Discussion and Analysis of Financial Condition and Results of Operations” and our consolidated financial statements and related notes included elsewhere in this Annual Report on Form 10-K.
Years Ended December 31, | |||||||||||
2014 | 2013 | 2012 | |||||||||
(In thousands, except share and per share data) | |||||||||||
Consolidated Statements of Operations Data: | |||||||||||
Revenue | $ | 125,492 | $ | 110,457 | $ | 81,384 | |||||
Operating expenses(1): | |||||||||||
Cost of revenue | 79,287 | 75,070 | 55,632 | ||||||||
Technology and operations | 14,190 | 9,366 | 7,601 | ||||||||
Research and development | 8,936 | 6,656 | 4,545 | ||||||||
Sales and marketing | 11,847 | 10,028 | 5,729 | ||||||||
General and administrative | 13,565 | 9,567 | 6,754 | ||||||||
Total operating expenses | 127,825 | 110,687 | 80,261 | ||||||||
Income (loss) from operations | (2,333 | ) | (230 | ) | 1,123 | ||||||
Interest and other income, net | 586 | 1,406 | 1,205 | ||||||||
Loss on change in fair value of warrants | (964 | ) | (1,496 | ) | (1,828 | ) | |||||
Income (loss) before income taxes | (2,711 | ) | (320 | ) | 500 | ||||||
Provision for income taxes | 397 | 334 | 308 | ||||||||
Net income (loss) | $ | (3,108 | ) | $ | (654 | ) | $ | 192 | |||
Excess consideration paid for convertible preferred stock repurchases | — | — | (250 | ) | |||||||
Net loss attributable to common stockholders —basic and diluted | $ | (3,108 | ) | $ | (654 | ) | $ | (58 | ) | ||
Net loss per share attributable to common stockholders: | |||||||||||
Basic | $ | (0.12 | ) | $ | (0.15 | ) | $ | (0.02 | ) | ||
Diluted | $ | (0.12 | ) | $ | (0.15 | ) | $ | (0.02 | ) | ||
Weighted average common shares outstanding: | |||||||||||
Basic | 25,765,819 | 4,255,775 | 3,598,507 | ||||||||
Diluted | 25,765,819 | 4,255,775 | 3,598,507 | ||||||||
(1) Stock-based compensation included in the consolidated statements of operations data above was as follows:
Years Ended December 31, | |||||||||||
2014 | 2013 | 2012 | |||||||||
(In thousands) | |||||||||||
Cost of revenue | $ | 23 | $ | 8 | $ | — | |||||
Technology and operations | 557 | 210 | 60 | ||||||||
Research and development | 613 | 350 | 55 | ||||||||
Sales and marketing | 1,262 | 469 | 101 | ||||||||
General and administrative | 1,612 | 370 | 107 | ||||||||
Total stock-based compensation | $ | 4,067 | $ | 1,407 | $ | 323 | |||||
56
As of December 31, | ||||||||
2014 | 2013 | |||||||
(In thousands) | ||||||||
Consolidated Balance Sheet Data: | ||||||||
Cash and cash equivalents | $ | 99,188 | $ | 43,599 | ||||
Working capital (2) | 105,065 | 19,276 | ||||||
Total assets | 161,717 | 72,313 | ||||||
Total liabilities | 45,290 | 43,653 | ||||||
Convertible preferred stock | — | 41,937 | ||||||
Total stockholders’ equity (deficit) | 116,427 | (13,277 | ) | |||||
(2) We define working capital as current assets less current liabilities
57
ITEM 7. MANAGEMENT'S DISCUSSION AND ANALYSIS OF FINANCIAL CONDITION AND RESULTS OF OPERATIONS
The following discussion should be read in conjunction with “Selected Consolidated Financial Data” and our consolidated financial statements and notes thereto included elsewhere in this Annual Report on Form 10-K. In addition to historical information, this discussion contains forward-looking statements that involve risks, uncertainties and assumptions that could cause actual results to differ materially from management’s expectations. Factors that can cause actual results to differ materially from those reflected in the forward-looking statements include, among others, those discussed in “Risk Factors,” “Special Note Regarding Forward-Looking Statements” and elsewhere in this Annual Report on Form 10-K.
Overview
We are a market leader in global ecommerce, operating a proprietary technology and services platform to enable U.S. retailers to transact with consumers in more than 100 countries and territories worldwide. The market opportunity for international cross-border ecommerce is large and significantly under-monetized by U.S. retailers today. Many U.S.-based online retailers view international expansion as important to their overall business strategies, yet international ecommerce revenues are limited today for many of these retailers.
We believe Borderfree delivers the most comprehensive cross-border ecommerce solution available through a single unified platform enabling retailers to capitalize on the large cross-border market opportunity. Our customers, the retailers and brands that integrate our solution, use our highly scalable Borderfree platform to develop a seamless global ecommerce business across web, mobile and in-store channels to transact with international shoppers, who we refer to as consumers. Borderfree manages all aspects of the international shopping experience, including site localization, multi-currency pricing, payment processing, fraud management, landed cost calculation, customs clearance and brokerage, and global logistics services while maintaining the integrity of our customers’ brands and the consumer experience. Our integrated cross-border solution enables retailers to begin selling internationally typically within 90 days without the need to invest in expensive infrastructure, software, in-house compliance expertise or international vendor relationships. In addition, as a result of our scale and experience in international ecommerce, we have amassed a substantial amount of data that enables us to provide actionable marketing and merchandising insights to our customers to help grow their global sales.
Key milestones in our history include:
• | in 1999 our company was founded and we began offering a patented foreign exchange technology solution that allowed ecommerce retailers to automatically present and settle transactions in the preferred currencies of their global consumers, which we refer to as our Global Settlement Services, or GSS, business; |
• | in 2008, we developed and launched a comprehensive global ecommerce technology and service offering that forms our platform today and in 2009 renamed our company FiftyOne; |
• | in August 2011, we sold our GSS business; |
• | in March 2012 we acquired the Borderfree business unit of Canada Post Corporation which we refer to as CPBF; |
• | in 2013 we renamed our company Borderfree; |
• | in March 2014 we closed our IPO whereby our shares became publicly available for trade on NASDAQ; and |
• | in January 2015 we acquired Bundle Tech Limited. |
58
We generate revenue from the provision of ecommerce and fulfillment services which are directly attributable to the GMV processed through our platform. We derive ecommerce revenue from fees paid to us by our customers based on a percentage of their total gross international sales, which represents the portion of GMV related to retail product volume processed through our technology and services platform. At December 31, 2014, substantially all of our customers were U.S.-based retailers engaged in international cross-border ecommerce. Substantially all of the customers acquired in our 2012 acquisition of CPBF were U.S.-based retailers and have been integrated into our existing platform as of December 31, 2014. Our primary goal of the acquisition was to expand our customer base. Our acquisition of CPBF did not materially alter our existing business. Our revenue increased from $81.4 million for the year ended December 31, 2012 to $110.5 million for the year ended December 31, 2013, an increase of $29.1 million, or 36%. Our revenue increased from $110.5 million for the year ended December 31, 2013 to $125.5 million for the year ended December 31, 2014, an increase of $15.0 million, or 14%. Our customer contracts typically have multi-year initial terms ranging from one to four years, followed by one-year renewal periods. We generate additional ecommerce revenue from foreign exchange services and consumer service fees for transactional related activity from consumers who visit our customers’ websites and make a purchase. We also derive, from the consumer, fulfillment services revenue from international shipping, handling, and other global logistics services resulting from the ecommerce transactions processed through our platform.
We provide our ecommerce and fulfillment services using an asset-light model that allows us to scale our business to serve additional customers and markets and process additional GMV with minimal capital expenditures. We do not own or operate any distribution centers or warehouses. We work with third-party logistics providers for hub processing and international delivery services to process and transport products to the consumer, paying only a volume-based fee which varies with our customers’ sales volume. We also do not own or operate any consumer support centers, as our customers handle consumer service calls.
Our strategy is to continue to grow GMV with our existing customers by (1) improving sales conversion through an enhanced experience for international consumers, (2) acquiring new consumers and driving qualified site traffic through strategic partnerships, and (3) further leveraging our data asset, consumer insights and analytics capabilities to drive marketing and merchandising strategies for our customers. We intend to continue to reduce our cost of revenue by expanding our third-party logistics hub and carrier network to improve efficiency and reduce costs and introducing new lower cost delivery options. Additionally, we plan to acquire more customers by proactively targeting U.S. and U.K. retail brands with global appeal such as large department stores, branded retailers and emerging consumer brands, and by expanding our addressable market to a wider range of customers, including smaller retailers, that are adopting a cross-border sales strategy. As we execute this strategy, we plan to make continued investments in our technology and services platform, logistics infrastructure and services and sales and marketing initiatives.
59
Initial Public Offering
In March 2014, we closed our IPO, of 5,750,000 shares of common stock, which included 750,000 shares sold pursuant to the underwriters’ option to purchase additional shares, at an offering price of $16.00 per share. All outstanding shares of our convertible preferred stock converted to 20,872,628 shares of common stock at the closing of the IPO. Our shares are traded on NASDAQ. We received proceeds from the IPO of $85.6 million, net of underwriting discounts and commissions but before offering expenses of $3.2 million. Offering expenses at December 31, 2013 of $1.8 million were recorded as current assets. These offering expenses, and additional expenses incurred from January 1, 2014 through the closing of the IPO of approximately $1.4 million, have been recorded as additional paid-in capital.
60
Key Metrics
Years Ended December 31, | |||||||||||
2014 | 2013 | 2012 | |||||||||
(In thousands) | |||||||||||
Gross merchandise volume | $ | 546,734 | $ | 447,836 | $ | 301,696 | |||||
Adjusted EBITDA | 5,846 | 3,462 | 2,890 | ||||||||
Adjusted EBITDA as a percentage of revenue | 4.7 | % | 3.1 | % | 3.6 | % | |||||
As of December 31, | |||||
2014 | 2013 | ||||
Number of customers | 96 | 91 | |||
Number of customer ecommerce sites | 171 | 158 | |||
We monitor and analyze a number of key metrics to measure our operating performance, evaluate growth trends, establish budgets and financial projections, and formulate strategic plans.
Gross Merchandise Volume
For the year ended December 31, 2014 we processed $546.7 million of GMV on our platform, representing an increase of 22.1% as compared to the year ended December 31, 2013. We define GMV as the total dollar value of orders, net of returns, inclusive of product value, shipping and handling, and duty and value added taxes, processed through our platform, and shipped to international consumers. Since our revenue and cost of revenue are directly attributable to the level of GMV processed through our platform we believe that GMV is an indicator of the growth and scale of our business, customer acquisition and retention, existing customer sales growth, the value of executing our strategic initiatives and our ability to project future operating results.
Number of Customers
Our customers are U.S.-based brands, such as large department stores, established and emerging consumer brands, specialty retailers and online only retailers. We believe that our ability to increase our customer base is an indicator of our market penetration and growth of our business as we continue to expand our sales force and invest in marketing efforts. We define our number of customers at the end of a particular period as the number of customers that are under contract with us, and processing international cross-border sales volumes on our platform during such period. As of December 31, 2014 we had 96 customers operating on our platform.
Number of Customer Ecommerce Sites
Many of our customers operate multiple ecommerce sites. Since we derive a portion of our global ecommerce services revenue from fees paid to us by our customers based on a percentage of their sales generated through our platform we believe the total number of customer ecommerce sites operating on our platform in a particular period is an indicator of the growth of our business and the diversification of our customer and revenue base. As of December 31, 2014, our platform was powering the global expansion of 171 ecommerce sites for our 96 customers.
Adjusted EBITDA
We present and evaluate Adjusted EBITDA because we believe it is a useful measure to assess the operating performance of our business without the effect of depreciation and amortization, interest expense, provision for income taxes, stock-based compensation expense, loss on change in fair value of warrants, forgiveness of notes receivable from stockholders, other income related to GSS, acquisition costs and the recognition of non-recurring duty drawback claims earned in the current period as a result of gaining approval from a governmental agency in 2014 to submit duty drawback claims related to certain consumer returns. Our use of Adjusted EBITDA as a key metric permits a comparative assessment of our operating performance, relative to our performance based on GAAP results, while isolating the effects of certain items that vary from period to period without any correlation to our operating performance.
61
Non-GAAP Financial Measures
We present and evaluate non-GAAP financial measures of Adjusted EBITDA and non-GAAP net loss because we believe they are useful measures to assess the operating performance of our business. Our use of non-GAAP net loss and Adjusted EBITDA permits a comparative assessment of our operating performance, relative to our performance based on GAAP results, while isolating the effects of certain items that vary from period to period without any correlation to our operating performance. Non-GAAP net loss and Adjusted EBITDA as presented may not be comparable to other similarly-titled measures of other companies, and our presentation of non-GAAP net loss and Adjusted EBITDA should not be construed as an inference that our future operating results will be unaffected by excluded or unusual items.
The following table presents a reconciliation of net loss to non-GAAP net loss for each of the periods indicated:
Years Ended December 31, | |||||||||||
Reconciliation of Net Income (Loss) to Non-GAAP Net Income | 2014 | 2013 | 2012 | ||||||||
(In thousands) | |||||||||||
Net income (loss) | $ | (3,108 | ) | $ | (654 | ) | $ | 192 | |||
Stock-based compensation expense | 4,067 | 1,407 | 323 | ||||||||
Forgiveness of notes receivable from stockholders | 629 | — | — | ||||||||
Loss on change in fair value of warrants | 964 | 1,496 | 1,828 | ||||||||
Other income-GSS | (701 | ) | (1,380 | ) | (1,023 | ) | |||||
Acquisition costs | 338 | — | — | ||||||||
Non-recurring duty drawback | (781 | ) | — | — | |||||||
Non-GAAP net income | $ | 1,408 | $ | 869 | $ | 1,320 | |||||
The following table presents a reconciliation of net loss to Adjusted EBITDA for each of the periods indicated:
Years Ended December 31, | |||||||||||
Reconciliation of Net Income (Loss) to Adjusted EBITDA | 2014 | 2013 | 2012 | ||||||||
(In thousands) | |||||||||||
Net income (loss) | $ | (3,108 | ) | $ | (654 | ) | $ | 192 | |||
Depreciation and amortization | 3,926 | 2,285 | 1,444 | ||||||||
Interest expense (income) | 115 | (26 | ) | (182 | ) | ||||||
Provision for income taxes | 397 | 334 | 308 | ||||||||
Stock-based compensation expense | 4,067 | 1,407 | 323 | ||||||||
Forgiveness of notes receivable from stockholders | 629 | — | — | ||||||||
Loss on change in fair value of warrants | 964 | 1,496 | 1,828 | ||||||||
Other income-GSS | (701 | ) | (1,380 | ) | (1,023 | ) | |||||
Acquisition costs | 338 | — | — | ||||||||
Non-recurring duty drawback | (781 | ) | — | — | |||||||
Adjusted EBITDA | $ | 5,846 | $ | 3,462 | $ | 2,890 | |||||
62
Components of Results of Operations
We operate in one segment, which is international cross-border ecommerce. The key components of our results of operations include:
Revenue
We generate revenue from the provision of ecommerce and fulfillment services which are directly attributable to the GMV processed through our platform. We derive ecommerce revenue from fees paid to us by our customers based on a percentage of their total gross international sales revenue processed through our technology and services platform. In 2014, this revenue driven by customers represented 42% of global ecommerce services revenue. Our customer contracts typically have multi-year initial terms ranging from one to four years, followed by one-year renewal periods. Revenue derived from our customers is recognized upon the delivery of the agreed upon service to the customer.
We generate additional ecommerce revenue from foreign exchange services and consumer service fees for transactional related activity from consumers who transact on our customers’ websites and mobile applications. In 2014, this revenue driven by consumers represented 58% of our global ecommerce services revenue. We derive fulfillment services revenue from international shipping, handling, and other global logistics services resulting from the ecommerce transactions processed through our platform. Revenue related to fulfillment services, foreign exchange and consumer service fees are a function of customer sales and is recognized upon delivery when the risk of loss is transferred to the consumer.
Fulfillment services revenue is paid by both the consumer and our customers for international shipping, handling and other global logistics services based on a price determined by us. In arriving at the price charged, we consider a number of variables including the estimated costs to be incurred, desired margins and promotional considerations to drive GMV. We have latitude in establishing the price charged for fulfillment services to consumers. Incentives may be offered to the consumer including free shipping and flat rate shipping promotions in an effort to drive sales conversion. Typically, when free or discounted shipping is offered, our customer is paying us for the shipping on behalf of the consumer and there is no impact on the overall revenue per order or to the margin per order. Additionally, we may offer free or discounted shipping as an incentive to drive increased volume. These promotions may negatively impact overall pricing per order and margin per order. It is our intention, and our customer’s intention, that such promotions will drive increased order completion rates and greater overall volume. Average fulfillment revenue per order is expected to continue to decrease in subsequent periods as we optimize logistics and pass our savings to the consumer. Given our focus on driving GMV, we have historically managed our business so that the margin impact of fulfillment services is relatively neutral.
We evaluate whether it is appropriate to record ecommerce services and fulfillment services revenue on a gross or net basis. When making this evaluation, if we are not primarily obligated in a transaction, are not subject to inventory risk with respect to markdowns and obsolescence, and do not have latitude in establishing product retail prices or selecting merchandise suppliers, or several but not all of these indicators are not present, revenue is recorded on a net basis. With the exception of fulfillment services revenue, we record all revenue on a net basis. We entered into new fulfillment arrangements with our logistic providers during the first quarter of 2011. Pursuant to these arrangements, we act as the primary obligor to the consumer and we have latitude in establishing pricing and selecting suppliers. As a result, we began reporting fulfillment services revenue and fulfillment costs on a gross basis beginning in 2011.
If a consumer returns their purchase to our customer, we typically refund certain ecommerce services fees related to foreign exchange services to the consumer. At the time of sale, we record a reserve for refunds based upon historical experience. Ecommerce services fees related to transactional related activity which is charged to the consumer are not refunded. Fulfillment costs are typically paid for by the consumer in the event of a return or an exchange.
No individual customer accounted for more than 10% of revenue for the years ended December 31, 2014, 2013 and 2012. The Company’s top 10 customers accounted for approximately 67% of global ecommerce revenue for the years ended December 31, 2014 and 2013, and 71% for the year ended December 31, 2012.
Canada accounted for 32%, 31% and 26% of revenue for the years ended December 31, 2014, 2013 and 2012, respectively. Australia accounted for 14%, 16% and 22% of revenue for the years ended December 31, 2014, 2013 and 2012, respectively. No other individual foreign country accounted for more than 10% of our revenue during these periods. For additional information on revenue by geographic region, see Note 20 to our consolidated financial statements.
63
Prior to August 2011 we derived multi-currency services revenue from our GSS business. In August 2011, we sold our GSS business and granted the buyer a non-exclusive license to use our GSS software and related patents, as well as an exclusive right to the E4X trademark solely for the purposes of operating the GSS business. We retained all ownership and other rights not specifically granted. We earn an ongoing royalty fee and outsourcing services fees from the buyer that are recognized in the statement of operations as interest and other income, net.
64
Operating Expenses
Operating expenses consist of cost of revenue, technology and operations, research and development, sales and marketing, and general and administrative expenses. Salaries, incentive compensation, stock-based compensation and other personnel-related costs are the most significant portions of each of technology and operations, research and development, sales and marketing, and general and administrative expenses. We grew from 81 employees at January 1, 2011 to 231 employees at December 31, 2014, and expect to continue hiring new employees to support our anticipated growth. We include stock-based compensation expense in connection with the grant of stock options in the applicable operating expense category based on the respective equity award recipient’s function. In addition, amortization expense related to the customer relationships and technology acquired as part of our 2012 acquisition of CPBF is allocated within sales and marketing and technology and operations, respectively.
Cost of Revenue
Cost of revenue consists primarily of fulfillment costs, as well as payment processing costs, transaction processing personnel salaries and benefits (fraud prevention, logistics and client service), foreign exchange gain (loss), depreciation expenses for hardware, allocated overhead, allowances related to consumer fraud, chargebacks, parcel losses and other consumer service costs. Fulfillment costs and payment processing costs are driven by the sales made by our customers using our platform and the related GMV. Specifically, fulfillment costs include international shipping, handling and other costs associated with delivering global logistics services. Given our focus on driving GMV, we have historically managed our business so that the margin impact of fulfillment services is relatively neutral. Payment processing costs include fees paid to credit card and other payment service providers for processing consumer payments. Foreign exchange gain (loss) relates to expenses associated with managing the conversion of foreign denominated currencies into U.S. dollars. Consumer fraud, chargebacks, parcel losses and other transactional service costs are provided for at the same time the related revenue is recognized based on historical experience. The number of transaction processing personnel grew from 11 at January 1, 2011 to 28 at December 31, 2014.
We expect that the cost of revenue in absolute dollars may increase in the future depending on the growth rate of our customer’s sales to new and existing consumers and our need to fulfill those sales. We have implemented certain initiatives, including expanding our third-party logistics hub network to improve efficiency and leveraging our scale to negotiate lower shipping and handling costs with our carrier base, to reduce our cost of revenue as a percentage of revenue. However, we expect that the cost of revenue as a percentage of revenue may fluctuate from period to period.
Technology and Operations
Technology and operations expenses consist primarily of personnel and related expenses for our operations staff which includes information technology infrastructure support and platform integration services, amortization expenses associated with capitalized software and definite-lived intangible assets, and allocated overhead. The number of employees in technology and operations grew from 28 at January 1, 2011 to 53 at December 31, 2014.
We expect technology and operations expenses to increase in absolute dollars as we scale our business, although they may fluctuate as a percentage of revenue.
Research and Development
Research and development expenses consist primarily of personnel and related expenses for our product development and research and development staff including salaries, benefits, bonuses and stock-based compensation, the cost of certain third-party contractors, and depreciation expenses for hardware and allocated overhead. The number of employees in research and development functions grew from 17 at January 1, 2011 to 67 at December 31, 2014. The majority of our research and development employees are located in Israel. Therefore, a majority of research and development expense is subject to fluctuations in foreign exchange rates. Research and development costs, excluding certain internal use software development costs that qualify for capitalization, are expensed as incurred.
We have focused our research and development efforts on continuously improving our platform, including feature innovation, platform extension and accelerating customer implementations. We believe that continued investment in our technology is important for our future growth, and as a result, we expect research and development expenses to increase in absolute dollars, although they may fluctuate as a percentage of revenue.
65
Sales and Marketing
Sales and marketing expenses consist primarily of personnel and related expenses for our sales, marketing, customer account management and consumer research and analytics staff, including salaries, benefits, bonuses, stock-based compensation and sales commissions, costs of marketing and promotional events, corporate communications, online marketing, product marketing and other brand-building activities, amortization expenses associated with definite-lived intangible assets, depreciation expenses for hardware and allocated overhead. The number of employees in sales and marketing functions grew from nine at January 1, 2011 to 45 at December 31, 2014.
We plan to continue to invest in sales and marketing to acquire new customers, drive increases in GMV for our existing customer base and to expand our consumer growth related initiatives. We expect spending in these areas to increase in absolute dollars, although they may fluctuate as a percentage of revenue.
General and Administrative
General and administrative expenses consist primarily of personnel and related expenses for administrative, finance, legal and human resource staffs, including salaries, benefits, bonuses and stock-based compensation, professional fees, insurance premiums, other corporate expenses, and depreciation expenses for hardware and allocated overhead. The number of employees in general and administrative functions grew from 16 at January 1, 2011 to 38 at December 31, 2014.
We expect our general and administrative expenses to increase as we continue to expand our operations, hire additional personnel to meet the added needs we have as a public company. As a public company, we expect to continue to incur additional expenses related to increased outside legal counsel assistance, accounting and auditing activities, compliance with SEC requirements and enhancing our internal control environment through the adoption and administration of new corporate policies.
66
Gain from Sale of Business
In March 2011, we sold our GSS business and we granted the buyer a non-exclusive license to use our GSS software and related patents, as well as an exclusive right to the E4X trademark solely for the purposes of operating the GSS business. We retained all ownership and other rights not specifically granted. We earn an ongoing royalty fee and outsourcing services fees from the buyer that are recognized in the statements of operations as interest and other income, net.
Interest and Other Income, Net
Interest and other income, net primarily consists of interest income, interest expense, foreign exchange gain (loss) and other financial income (expense). Interest income represents interest received on our cash and cash equivalents and notes receivable from stockholders. Interest expense is associated with our term loan, revolving credit facility and capital leases. Foreign exchange gain (loss) relates to currency translation adjustments of our foreign subsidiaries. Other financial income relates to ongoing royalty fees earned and outsourcing services fees related to GSS.
Provision for Income Taxes
We file income tax returns in the U.S. federal jurisdiction and various states and foreign jurisdictions.
At December 31, 2014, we had federal net operating loss carryforwards of $7.6 million and state net operating loss carryforwards of $3.7 million. The federal and state net operating loss carryforwards are subject to limitations of the Internal Revenue Code and applicable state tax law. If not utilized, a portion of the federal and state net operating loss carryforwards will begin to expire in 2027.
Deferred income taxes reflect the net tax effects of temporary differences between the carrying amounts of assets and liabilities for financial reporting purposes and the amounts used for income tax purposes. In assessing the realization of deferred tax assets, management considers whether it is more likely than not that some portion or all of deferred tax assets will not be realized. The realization of deferred tax assets is based on several factors, including our past earnings and the scheduling of deferred tax liabilities and projected income from operating activities. As of December 31, 2014 and 2013, our management does not believe it is more likely than not that the net deferred tax assets relating to U.S. federal and state operations are realizable. As a result, a valuation allowance has been recognized at December 31, 2014 and 2013 to offset the deferred tax assets, as it has been determined that it is more likely than not that all or a portion of the deferred tax assets may not be realized. Given the estimate of future financial results, positive evidence may exist within the next 12 months to support an adjustment to the valuation allowance. We intend to maintain the valuation allowance until sufficient positive evidence exists to support reversal of some or all of the allowance.
The difference between our U.S. federal statutory income tax rate and our effective tax rate is primarily related to non-deductible amounts related to stock compensation expense, (27.7)%, and loss on change in fair value of warrants, (12.1 )%, partially offset by the change in our valuation allowance, 15.9%, and foreign taxes paid, (13.0)%, for the year ended December 31, 2014. Our effective tax rate was (14.7)% and (104.4)% for the years ended December 31, 2014 and 2013, respectively.
Loss on Change in Fair Value of Warrants
The fair value of our convertible preferred stock warrant liability is re-measured at the end of each reporting period and any changes in fair value are recognized on our statements of operations. In March 2014, the fair value of the warrant liability was $3.6 million upon the closing of the IPO and was reclassified as a component of additional paid-in capital.
67
Critical Accounting Policies and Estimates
Our consolidated financial statements and the related notes included elsewhere in this Form 10-K are prepared in accordance with generally accepted accounting principles in the United States. The preparation of these consolidated financial statements requires us to make estimates and assumptions that affect the reported amounts of assets, liabilities, revenue, operating expenses, interest and other income (expense), net, provision for income taxes and related disclosures. We base our estimates on historical experience and on various other assumptions that we believe to be reasonable under the circumstances. Changes in accounting estimates are reasonably likely to occur from period to period. Accordingly, actual results could differ significantly from our estimates. We evaluate our estimates and assumptions on an ongoing basis. To the extent that there are material differences between our estimates and our actual results, our future financial statement presentation, financial condition, results of operations and cash flows will be affected.
We believe that our critical accounting policies and estimates require us to make difficult, subjective or complex judgments about matters that are inherently uncertain. See Note 1 to our consolidated financial statements for a complete discussion of our significant accounting policies. The following reflect the critical accounting policies used in the preparation of our consolidated financial statements.
Revenue Recognition
Revenue is recognized when the following conditions are satisfied: (1) persuasive evidence of an arrangement exists; (2) delivery has occurred, title has transferred or services are rendered; (3) price is fixed or determinable; and (4) collectability is reasonably assured.
We derive revenue from transactions with our customers and through separate arrangements with the consumers who shop our customers’ websites.
Global ecommerce services revenue includes a fee paid to us by our customers based on a percentage of our customers’ total gross international sales revenue processed through our platform, as well as a fee paid by the consumer related to foreign exchange and other transactional related consumer service fees.
Fulfillment services revenue is paid by both the consumer and our customers for international shipping, handling and other global logistics services.
Multi-currency services revenue includes a fee earned from customers who utilized our foreign exchange settlement solution.
Revenue derived from our customers is recognized upon the completion of the agreed upon service to the customer, which occurs upon the shipment of the parcel from our third-party hub facilities to the consumer. Revenue related to fulfillment services, foreign exchange and other transactional related consumer service fees, is recognized upon delivery when the risk of loss is transferred to the consumer.
We evaluate whether it is appropriate to record revenue on a gross or net basis. When making this evaluation, we consider if we are primarily obligated in a transaction, are subject to inventory risk with respect to markdowns and obsolescence, and have latitude in establishing prices or selecting suppliers. When several, but not all of these indicators are not present, revenue is recorded on a net basis. With the exception of fulfillment services revenue, we record all revenue on a net basis. We entered into new fulfillment arrangements with our logistic providers during the first quarter of 2011. Pursuant to these arrangements, we act as the primary obligor to the consumer and we have latitude in establishing pricing and selecting suppliers. As a result, we began reporting fulfillment services revenue and fulfillment costs on a gross basis in 2011.
We evaluate transactions with customers and consumers for multi-element arrangements and determined that there is a single unit of accounting for transactions with our customers as well as the separate transactions with the consumers. Revenue therefore is recorded upon the deliverable being satisfied with the customer or consumer.
Billings received in advance for services are deferred and recognized as revenue when the conditions noted above are satisfied.
68
When a consumer returns their purchase to our customer, we typically refund certain ecommerce fees related to foreign exchange services to the consumer. Reserves for such refunds are recorded at the time of sale based upon historical experience. Ecommerce fees paid to us based on a percentage of customer sales generated through our platform are generally not refunded to our customer. Ecommerce fees related to transactional driven consumer service fees are not refunded. Fulfillment costs are typically paid for by the consumer in the event of a return or exchange and are not refunded by us.
Trade Receivables and Allowance for Doubtful Accounts
Trade receivables are carried at their original invoice amounts less an allowance for doubtful accounts based on estimated losses resulting from the inability or unwillingness of customers to make required payments. We determine our allowance for doubtful accounts by considering a number of factors, including the length of time trade receivables are past due, our previous loss history, the customer’s current ability to pay its obligation and the condition of the general economy and the industry as a whole. Unanticipated events and circumstances may occur that affect the accuracy or validity of such assumptions, estimates or actual results.
Goodwill, Intangibles and Long-Lived Assets
Goodwill represents the excess of the cost of net assets acquired in business combinations over the fair value of the identifiable tangible and intangible assets acquired and liabilities assumed in a business combination. As of December 31, 2014, we have a single reporting unit. Goodwill is not amortized. As required under GAAP, goodwill and indefinite-lived intangibles are reviewed for impairment annually, for us as of October 1, or more frequently whenever events or changes indicate that the carrying value of an asset may not be recoverable. These events or circumstances could include, but are not limited to, a significant change in the business climate, legal factors, operating performance indicators, competition, or sale or disposition of significant assets. The testing of goodwill and indefinite-lived intangible assets for impairment involves significant use of judgment and assumptions in the determination of fair market value.
In September 2011, the Financial Accounting Standards Board, or FASB, issued accounting guidance that allows an entity to first assess qualitative factors to determine whether it is necessary to perform the two-step quantitative impairment testing of goodwill. We adopted this newly issued authoritative guidance effective January 1, 2012. Among the factors included in the qualitative assessment were general economic conditions and the competitive environment, actual and expected financial performance, including consideration of our revenue growth and improved operating results year-over-year, forward-looking business measurements, external market conditions and other relevant entity-specific events. Based on the results of the qualitative assessment, we concluded that performance of the two-step quantitative impairment test was not necessary. The goodwill on the balance sheet is related to the 2012 acquisition of CPBF. There were no impairments of goodwill in any of the periods presented in the consolidated financial statements.
Long-lived assets include property and equipment and long-lived amortizable intangible assets, such as customer relationships, technology, patent rights costs and intellectual property license. We amortize customer relationships and technology over their estimated useful lives, which range from one to eight years, based on the pattern over which we expect to consume the economic benefit of each asset, which in general reflects the expected cash flow from each asset. We amortize patent rights costs and intellectual property license over their useful lives, which range from four to twenty years, on a straight-line basis, as the pattern of consumption of the economic benefit of the asset cannot be reliably determined. We evaluate long-lived assets for recoverability whenever events or changes in circumstances indicate that their carrying values may not be recoverable. Factors that we consider in deciding when to perform an impairment review include significant underperformance of the business in relation to expectations, significant negative industry or economic trends, and significant changes or planned changes in the use of assets. To evaluate a long-lived asset for recoverability, we compare forecasts of undiscounted cash flows expected to result from the use and eventual disposition of the long-lived asset to its carrying value.
If the carrying value exceeds the sum of the expected undiscounted cash flows, an impairment loss on the long-lived asset to be held and used is recognized based on the excess of the asset’s carrying value over its fair value, determined based on discounted cash flows. Long-lived assets to be disposed of are reported at the lower of carrying value or fair value less cost to sell. There were no impairments of long-lived assets or amortizable intangible assets in any of the periods presented in the consolidated financial statements.
69
Accounting for Income Taxes
We are subject to income taxes in both the United States and various foreign jurisdictions. As a global taxpayer, significant judgments and estimates are required in determining our provision for income taxes on earnings. Income tax expense, deferred tax assets and liabilities, and reserves for unrecognized tax benefits reflect management’s best assessment of estimated future taxes to be paid.
We use the asset and liability method of accounting for income taxes. Under this method, deferred tax assets and liabilities are recognized for the future tax consequences attributable to the differences between the financial statement carrying amounts of existing assets and liabilities and their respective tax bases and to operating loss and tax credit carry forwards. Deferred tax assets and liabilities are measured using enacted statutory tax rates expected to apply in the years in which the differences are expected to be recovered and settled. The effect on deferred taxes due to a change in tax rates is recognized in income tax expense in the period that includes the enactment date. Deferred tax assets are recognized only when it is probable that such assets will be utilized in the future against taxable income, and reduced by a valuation allowance to the extent we believe a portion will not be realized.
We consider many factors when assessing the likelihood of future realization of deferred tax assets, including the cumulative earnings experience and expectations of future taxable income, the carry forward periods available to us for tax reporting purposes and other relevant factors. In evaluating the ability to recover deferred tax assets, we considered available positive and negative evidence, giving greater weight to our recent cumulative losses, and lesser weight to our projected financial results due to the challenges of forecasting future periods. Due to the uncertainty surrounding our ability to recognize the reversal of temporary differences, we determined that such deferred tax assets are not more-likely-than-not realizable, thus a full valuation allowance has been established.
We recognize benefits associated with an uncertain tax position in our consolidated financial statements on the basis of a two-step process whereby (1) we determine, based on the technical merits of the position, it is more-likely-than-not that the tax position will be sustainable upon audit and (2) those tax positions that meet the more-likely-than-not threshold are recognized at the largest amount of tax benefit that is greater than 50 percent likely to be realized upon ultimate settlement with the related tax authority. This involves the identification of potential uncertain tax positions and the evaluation of tax law and an assessment of whether a liability for each uncertain tax position is necessary. When applicable, we record interest expense and penalties on uncertain tax positions as part of income tax expense. There were no uncertain tax positions as of December 31, 2014 and 2013.
70
Stock-based Compensation
The fair value of each option granted from our various stock option and grant plans was estimated on the date of grant using the Black-Scholes option-pricing model. Using this model, fair value is calculated based on assumptions with respect to (1) expected volatility, (2) the expected term of the award, which for options is the period of time over which employees and directors are expected to hold their options prior to exercise, (3) expected dividend yield, (4) a risk-free interest rate and (5) estimated fair value of the underlying common stock.
In determining the fair value of stock-based awards, we used the average volatility of similar publicly traded companies to determine the expected volatility. The expected term of options has been determined using the simplified method which uses the midpoint between the vesting date and the end of the contractual term. The simplified method has been used since we do not have sufficient historical exercise data to provide a reasonable basis upon which to estimate expected term due to a limited period of the Company’s life. The expected term of options for the years ended December 31, 2014, 2013 and 2012 was 6.25 years. The expected dividend yield is zero as we have never paid dividends and do not currently anticipate paying any in the foreseeable future. The risk-free interest rate for periods within the expected life of an award, as applicable, is based on quoted U.S. Treasury rates for securities with maturities approximating the expected term. The weighted-average assumptions for dividend yield, expected volatility, risk-free interest rate and expected term are presented in the following table:
Years ended December 31, | ||||||||
2014 | 2013 | 2012 | ||||||
Dividend yield | — | % | — | % | — | % | ||
Expected volatility | 51.90% - 52.69% | 48.99 | % | 50.02 | % | |||
Risk-free interest rate | 1.7% - 2.0% | 1.4% - 1.8% | 0.9% - 1.2% | |||||
Expected term—in years | 6.25 | 6.25 | 6.25 | |||||
These assumptions represent our best estimates, based on management’s judgment and subjective future expectations. These estimates involve inherent uncertainties. If any of the assumptions used in the model change significantly, stock-based compensation recorded for future awards may differ materially from that recorded for awards granted previously.
Once we have determined the estimated fair value of our stock-based awards, we recognize the portion of that value that is ultimately expected to vest, taking estimated forfeitures into account. This amount is recognized as an expense over the vesting period of the award using the accelerated method based on the multiple-option award approach. We estimate forfeitures based upon our historical experience and, at each period, review the estimated forfeiture rate and make changes as factors affecting the forfeiture rate calculations and assumptions change. If our actual forfeiture rate is materially less than the estimate, our stock-based compensation expense could be significantly misstated from what we have recorded in the current period and we may be required to adjust the expense.
71
Emerging Growth Company Status
Section 107 of the Jumpstart Our Small Business Startups Act, or JOBS Act, provides that an “emerging growth company” can take advantage of the extended transition period afforded by the JOBS Act for the implementation of new or revised accounting standards. However, we are choosing to “opt out” of such extended transition period, and as a result, we will comply with new or revised accounting standards on the relevant dates on which adoption of such standards is required for non-emerging growth companies. Section 107 of the JOBS Act provides that our decision to not take advantage of the extended transition period for complying with new or revised accounting standards is irrevocable.
Recent Accounting Pronouncements
In April 2014, the FASB issued accounting guidance which changes the criteria for determining which disposal transactions can be presented as discontinued operations and modifies related disclosure requirements. Under the new guidance, a discontinued operation is defined as a disposal of a component or group of components that is disposed of or is classified as held for sale and represents a strategic shift that has (or will have) a major effect on an entity’s operations and financial results. The guidance states that a strategic shift could include a disposal of (i) a major geographical area of operations, (ii) a major line of business, (iii) a major equity method investment, or (iv) other major parts of an entity. Although major is not defined, the guidance provides examples of when a disposal qualifies as a discontinued operation. A business activity that upon acquisition qualifies as held for sale will also be a discontinued operation. The guidance no longer precludes presentation as a discontinued operation if (i) there are operations and cash flows of the component that have not been eliminated from the reporting entity’s ongoing operations, or (ii) there is significant continuing involvement with a component after its disposal. The guidance also introduces new disclosure requirements. The new accounting rules will be effective for us on January 1, 2015 and are not expected to have a material effect on our financial condition or results of operations unless there is a future disposal transaction within the scope of the guidance.
In May 2014, the FASB issued accounting guidance which stipulates that an entity should recognize revenue to depict the transfer of promised goods or services to customers in an amount that reflects the consideration to which the entity expects to be entitled in exchange for those goods or services. To achieve this core principle, an entity should apply the following steps: (i) identify the contract(s) with a customer; (ii) identify the performance obligations in the contract; (iii) determine the transaction price; (iv) allocate the transaction price to the performance obligations in the contract; and (v) recognize revenue when (or as) the entity satisfies a performance obligation. The new accounting rules will be effective for us on January 1, 2017. We are currently assessing the impact that this standard will have on our consolidated financial statements.
In August 2014, the FASB issued guidance on disclosure of uncertainties about an entity’s ability to continue as a going concern. This guidance addresses management’s responsibility in evaluating whether there is substantial doubt about a company’s ability to continue as a going concern and to provide related footnote disclosures. Management’s evaluation should be based on relevant conditions and events that are known and reasonably knowable at the date that the financial statements are issued. The guidance is effective for fiscal years ending after December 15, 2016 and for interim periods within those fiscal years, with early adoption permitted. We will adopt this guidance on January 1, 2015, and we believe the adoption of this guidance will not have a material impact on our consolidated financial statements.
We have implemented all new accounting pronouncements that are in effect and that may impact our consolidated financial statements and do not believe that there are any other new accounting pronouncements that have been issued that might have a material impact on our financial position or results of operations.
72
Results of Operations
The following table sets forth our consolidated statements of operations data for each of the periods indicated as a percentage of revenue. The period-to-period comparison of financial results is not necessarily indicative of future results.
Years Ended December 31, | Years Ended December 31, | |||||||||||||||||||
2014 | 2013 | 2012 | 2014 | 2013 | 2012 | |||||||||||||||
(In thousands) | ||||||||||||||||||||
Revenue: | ||||||||||||||||||||
Global ecommerce services | 52.4 | % | 48.2 | % | 43.1 | % | $ | 65,748 | $ | 53,268 | $ | 35,044 | ||||||||
Fulfillment services | 47.6 | 51.8 | 56.9 | 59,744 | 57,189 | 46,340 | ||||||||||||||
Revenue | 100.0 | 100.0 | 100.0 | 125,492 | 110,457 | 81,384 | ||||||||||||||
Operating Expenses: | ||||||||||||||||||||
Cost of revenue | 63.2 | 68.0 | 68.4 | 79,287 | 75,070 | 55,632 | ||||||||||||||
Technology and operations | 11.3 | 8.5 | 9.3 | 14,190 | 9,366 | 7,601 | ||||||||||||||
Research and development | 7.1 | 6.0 | 5.6 | 8,936 | 6,656 | 4,545 | ||||||||||||||
Sales and marketing | 9.4 | 9.1 | 7.0 | 11,847 | 10,028 | 5,729 | ||||||||||||||
General and administrative | 10.8 | 8.7 | 8.3 | 13,565 | 9,567 | 6,754 | ||||||||||||||
Total operating expenses | 101.9 | 100.2 | 98.6 | 127,825 | 110,687 | 80,261 | ||||||||||||||
Income (loss) from operations | (1.9 | ) | (0.2 | ) | 1.4 | (2,333 | ) | (230 | ) | 1,123 | ||||||||||
Interest and other income, net | 0.5 | 1.3 | 1.5 | 586 | 1,406 | 1,205 | ||||||||||||||
Loss on change in fair value of warrants | (0.8 | ) | (1.4 | ) | (2.2 | ) | (964 | ) | (1,496 | ) | (1,828 | ) | ||||||||
Income (loss) before income taxes | (2.2 | ) | (0.3 | ) | 0.6 | (2,711 | ) | (320 | ) | 500 | ||||||||||
Provision for income taxes | 0.3 | 0.3 | 0.4 | 397 | 334 | 308 | ||||||||||||||
Net income (loss) | (2.5 | )% | (0.6 | )% | 0.2 | % | $ | (3,108 | ) | $ | (654 | ) | $ | 192 | ||||||
73
Comparison of Years Ended December 31, 2014, 2013 and 2012
Revenue for the three years ended December 31, 2014, 2013 and 2012 was $125.5 million, $110.5 million and $81.4 million, respectively. Net loss attributable to common stockholders was $3.1 million, or $0.12 per basic and diluted share for the year ended December 31, 2014 compared to net loss attributable to common stockholders of $0.7 million, or $0.15 per basic and diluted share for the year ended December 31, 2013 versus net loss attributable to common stockholders of $0.1 million, or $0.02 per basic and diluted share for the year December 31, 2012.
Revenue
Years Ended December 31, | Change from 2013 to 2014 | Change from 2012 to 2013 | |||||||||||||||||||||||
2014 | 2013 | 2012 | $ | % | $ | % | |||||||||||||||||||
(Dollars in thousands) | |||||||||||||||||||||||||
Global ecommerce services | $ | 65,748 | $ | 53,268 | $ | 35,044 | $ | 12,480 | 23.4 | % | $ | 18,224 | 52.0 | % | |||||||||||
Percentage of revenue | 52.4 | % | 48.2 | % | 43.1 | % | |||||||||||||||||||
Fulfillment services | 59,744 | 57,189 | 46,340 | 2,555 | 4.5 | % | 10,849 | 23.4 | % | ||||||||||||||||
Percentage of revenue | 47.6 | % | 51.8 | % | 56.9 | % | |||||||||||||||||||
Revenue | $ | 125,492 | $ | 110,457 | $ | 81,384 | $ | 15,035 | 13.6 | % | $ | 29,073 | 35.7 | % | |||||||||||
The increase in global ecommerce services revenue from 2013 to 2014 is primarily attributable to the increase in GMV from $447.8 million for the year ended December 31, 2013 to $546.7 million for the year ended December 31, 2014, an increase of 22.1%. Of this increase in GMV, $53.4 million was attributable to volumes associated with customers operating on our platform during the same comparable periods in the prior year, while the remaining net increase in GMV of $45.5 million represented customer volumes that were not on a comparable basis to the prior year and new volumes from customers launched on our platform during the current year. The increase in fulfillment services revenue was due to an increase in the volume and growth of our business, including an increase in the number of transactions over the prior period as a result of increased GMV and the recognition of $0.8 million related to non-recurring duty drawback claims earned in the current period. The increase in fulfillment services revenue was offset by a reduction in average fulfillment services revenue per order as we have negotiated more favorable rates with our shipping carriers and added shipping options resulting in reduced costs to the consumer. Fulfillment services revenue per order is expected to continue to decrease in subsequent periods as we optimize logistics and pass on our savings to the consumer to increase sales order conversion. Additionally, we had 96 customers and 171 ecommerce sites operating on our ecommerce platform as of December 31, 2014, an increase from 91 customers and 158 ecommerce sites as of December 31, 2013.
The increase in global ecommerce services revenue and fulfillment services revenue in 2013 was primarily attributable to the increase in GMV from $301.7 million for the year ended December 31, 2012 to $447.8 million for the year ended December 31, 2013, an increase of 48.4%. Of this increase in GMV, $80.1 million was attributable to volumes associated with customers operating on our platform during the same comparable periods in the prior year, while the remaining net increase in GMV of $66.0 million represented customer volumes that were not on a comparable basis to the prior year and new volumes from customers launched on our platform during the current year. The growth in fulfillment services revenue, resulting from increases to GMV and the number of orders shipped, was offset by a reduction in average fulfillment revenue per order as we have negotiated more favorable rates with our shipping carriers and added shipping options resulting in reduced costs to the consumer. Additionally, we had 91 customers and 158 ecommerce sites operating on our ecommerce platform as of December 31, 2013, an increase from 84 customers and 133 ecommerce sites as of December 31, 2012.
74
Operating Expenses
Cost of Revenue
Years Ended December 31, | Change from 2013 to 2014 | Change from 2012 to 2013 | |||||||||||||||||||||||
2014 | 2013 | 2012 | $ | % | $ | % | |||||||||||||||||||
(Dollars in thousands) | |||||||||||||||||||||||||
Cost of revenue | $ | 79,287 | $ | 75,070 | $ | 55,632 | $ | 4,217 | 5.6 | % | $ | 19,438 | 34.9 | % | |||||||||||
Percentage of revenue | 63.2 | % | 68.0 | % | 68.4 | % | |||||||||||||||||||
The increase in cost of revenue from 2013 to 2014 was primarily attributable to an increase in fulfillment costs of approximately $3.8 million due to increased volumes. Additionally, we incurred higher payment processing costs of approximately $0.8 million associated with higher volumes. We also incurred $0.5 million of increased personnel and related expenses to support our growth. The increase in cost of revenue was partially offset by a $0.9 million decrease in other costs primarily related to consumer fraud and parcel losses. Although total cost of revenue increased, cost of revenue as a percentage of revenue decreased from 68.0% for the year ended December 31, 2013 to 63.2% for the year ended December 31, 2014 as we continue to optimize logistics and further execute other cost reduction initiatives. Total headcount within cost of revenue increased from 22 at December 31, 2013 to 28 at December 31, 2014.
The increase in cost of revenue from 2012 to 2013 was primarily attributable to $11.7 million of increased fulfillment costs, $4.4 million of increased payment processing costs and $3.3 million of increased consumer fraud, chargebacks, parcel losses, foreign exchange servicing costs and other consumer service costs. These increases were driven by increased GMV primarily resulting from an increase in the number of orders processed and shipped through our platform. Total headcount within cost of revenue increased from 11 at December 31, 2012 to 22 at December 31, 2013.
Technology and Operations
Years Ended December 31, | Change from 2013 to 2014 | Change from 2012 to 2013 | |||||||||||||||||||||||
2014 | 2013 | 2012 | $ | % | $ | % | |||||||||||||||||||
(Dollars in thousands) | |||||||||||||||||||||||||
Technology and operations | $ | 14,190 | $ | 9,366 | $ | 7,601 | $ | 4,824 | 51.5 | % | $ | 1,765 | 23.2 | % | |||||||||||
Percentage of revenue | 11.3 | % | 8.5 | % | 9.3 | % | |||||||||||||||||||
The increase in technology and operations from 2013 to 2014 was primarily attributable to $2.0 million of increased personnel and related expenses for information technology, platform integration and logistics management personnel, and increase of $1.5 million of amortization of capitalized software. Stock-based compensation expense attributable to technology and operations increased $0.3 million. Consulting expenses increased by $0.7 million as a result of costs related to software, business analytics and content delivery networks. Additionally, travel costs and allocated facilities both increased $0.2 million, respectively. Total headcount within technology and operations increased from 47 at December 31, 2013 to 53 at December 31, 2014.
The increase in technology and operations from 2012 to 2013 was primarily attributable to $0.2 million of increased personnel and related expenses for information technology, platform integration and logistics management personnel, $0.9 million of operating infrastructure costs related to our 2012 acquisition of CPBF and $0.6 million of amortization of capitalized software. Stock-based compensation expense increased $0.2 million. Total headcount within technology and operations increased from 46 at December 31, 2012 to 47 at December 31, 2013.
75
Research and Development
Years Ended December 31, | Change from 2013 to 2014 | Change from 2012 to 2013 | |||||||||||||||||||||||
2014 | 2013 | 2012 | $ | % | $ | % | |||||||||||||||||||
(Dollars in thousands) | |||||||||||||||||||||||||
Research and development | $ | 8,936 | $ | 6,656 | $ | 4,545 | $ | 2,280 | 34.3 | % | $ | 2,111 | 46.4 | % | |||||||||||
Percentage of revenue | 7.1 | % | 6.0 | % | 5.6 | % | |||||||||||||||||||
The increase in research and development expense from 2013 to 2014 was primarily attributable to $1.2 million of increased personnel and related expenses to improve our platform, including feature innovation and platform extension. Stock-based compensation increased $0.3 million. Rent expense and depreciation expense increased $0.3 million and $0.2 million, respectively. Allocated expenses such as computer accessories, communication expenses and office supplies increased $0.3 million due to an increase in headcount. Total headcount within research and development increased from 49 at December 31, 2013 to 67 at December 31, 2014.
The increase in research and development expense from 2012 to 2013 was primarily attributable to $1.8 million of increased personnel and related expenses to improve our platform, including feature innovation, platform extension and accelerating customer implementations. Stock-based compensation expense increased $0.3 million. Total headcount within research and development increased from 40 at December 31, 2012 to 49 at December 31, 2013.
Sales and Marketing
Years Ended December 31, | Change from 2013 to 2014 | Change from 2012 to 2013 | |||||||||||||||||||||||
2014 | 2013 | 2012 | $ | % | $ | % | |||||||||||||||||||
(Dollars in thousands) | |||||||||||||||||||||||||
Sales and marketing | $ | 11,847 | $ | 10,028 | $ | 5,729 | $ | 1,819 | 18.1 | % | $ | 4,299 | 75.0 | % | |||||||||||
Percentage of revenue | 9.4 | % | 9.1 | % | 7.0 | % | |||||||||||||||||||
The increase in sales and marketing expenses from 2013 to 2014 was driven primarily by increased personnel for our customer account management and consumer research and analytics staff of $1.3 million. Stock-based compensation expense attributable to sales and marketing increased $0.8 million. Marketing and promotional related expenses also increased approximately $0.5 million. The overall increase was partially offset by a decrease of approximately $0.6 million in consulting expenses as our internal sales and marketing efforts were supplemented with third-party consultants in the prior year. Total headcount within sales and marketing increased from 40 at December 31, 2013 to 45 at December 31, 2014.
The increase in sales and marketing expense from 2012 to 2013 was attributable to $2.9 million of increased investments we made to expand our customer account management, consumer research, and analytics staff to support the increase in the number of customers and related ecommerce sites operating on our platform and to enhance our research and analytics capabilities. In addition, we incurred an additional $1.1 million of increased expense as we supplemented our internal sales and marketing efforts with third-party consultants and increased the use of such resources in 2013 for consumer research, analytics, and growth-related initiatives, such as deploying new business intelligence and database platforms to expand our analytics capabilities. Stock-based compensation expense increased $0.4 million. Total headcount within sales and marketing increased from 31 at December 31, 2012 to 40 at December 31, 2013.
76
General and Administrative
Years Ended December 31, | Change from 2013 to 2014 | Change from 2012 to 2013 | |||||||||||||||||||||||
2014 | 2013 | 2012 | $ | % | $ | % | |||||||||||||||||||
(Dollars in thousands) | |||||||||||||||||||||||||
General and administrative | $ | 13,565 | $ | 9,567 | $ | 6,754 | $ | 3,998 | 41.8 | % | $ | 2,813 | 41.6 | % | |||||||||||
Percentage of total revenue | 10.8 | % | 8.7 | % | 8.3 | % | |||||||||||||||||||
The increase in general and administrative expense from 2013 to 2014 was driven primarily by increased personnel related expenses and other costs to support our transition to a public company. Salaries expense increased approximately $1.9 million as a result of increased headcount. Stock-based compensation expense attributable to general and administrative increased $1.2 million. Public company fees and professional fees increased approximately $0.6 million due to our transition to a public company in 2014. Allocated rent expense and depreciation expense increased $0.2 million and $0.1 million, respectively. Total headcount within general and administrative increased from 31 at December 31, 2013 to 38 at December 31, 2014.
The increase in general and administrative expense from 2012 to 2013 was driven primarily by increased professional fees, consulting, and personnel and related expenses to support our growing business. We incurred increased professional fees and consulting of $1.2 million for accounting, audit, legal and tax services and increased personnel and related costs of $1.3 million as a result of our growth and our pending transition from a private company to a public company. Stock-based compensation expense increased $0.3 million. Total headcount within general and administrative increased from 24 at December 31, 2012 to 31 at December 31, 2013.
Interest and Other Income, Net
Years Ended December 31, | Change from 2013 to 2014 | Change from 2012 to 2013 | |||||||||||||||||||||||
2014 | 2013 | 2012 | $ | % | $ | % | |||||||||||||||||||
(Dollars in thousands) | |||||||||||||||||||||||||
Interest and other income, net | $ | 586 | $ | 1,406 | $ | 1,205 | $ | (820 | ) | (58.3 | )% | $ | 201 | 16.7 | % | ||||||||||
Percentage of revenue | 0.5 | % | 1.3 | % | 1.5 | % | |||||||||||||||||||
The fluctuation in interest and other income, net, was driven primarily by a change in royalties and outsourcing servicing fees earned as a result of our sale of the GSS business.
Provision for Income Taxes
Years Ended December 31, | Change from 2013 to 2014 | Change from 2012 to 2013 | |||||||||||||||||||||||
2014 | 2013 | 2012 | $ | % | $ | % | |||||||||||||||||||
(Dollars in thousands) | |||||||||||||||||||||||||
Provision for income taxes | $ | 397 | $ | 334 | $ | 308 | $ | 63 | 18.9 | % | $ | 26 | 8.4 | % | |||||||||||
Percentage of revenue | 0.3 | % | 0.3 | % | 0.4 | % | |||||||||||||||||||
The difference between our U.S. federal statutory income tax rate and our effective tax rate is primarily related to non-deductible amounts related to stock compensation expense, (27.7)%, and loss on change in fair value of warrants, (12.1 )%, partially offset by the change in our valuation allowance, 15.9%, and foreign taxes paid, (13.0)%, for the year ended December 31, 2014. Our effective tax rate was (14.7)% and (104.4)% for the years ended December 31, 2014 and 2013, respectively.
77
Liquidity and Capital Resources
Working Capital
The following table summarizes our cash and cash equivalents, trade receivables and working capital:
As of December 31, | |||||||
2014 | 2013 | ||||||
Consolidated Balance Sheet Data: | (In thousands) | ||||||
Cash and cash equivalents | $ | 99,188 | $ | 43,599 | |||
Investments | 27,555 | — | |||||
Trade receivables, net | 18,031 | 13,785 | |||||
Working capital | 105,065 | 19,276 | |||||
As of December 31, 2014, we had $99.2 million of cash and cash equivalents, of which $2.9 million was held in foreign bank accounts, and $27.6 million in investments in marketable securities. The majority of cash and cash equivalents held in domestic and foreign bank accounts are in excess of government deposit insurance. As a result of the initial public offering, we received net cash proceeds in March 2014 of approximately $85.6 million.
Our cash and cash equivalents at December 31, 2014 were held for working capital purposes. We believe we have sufficient working capital and liquidity to support our operations, growth strategies and the associated capital investments needed to expand our operations for at least the next 12 months. In January 2015, we used a portion of the net proceeds from our initial public offering to fund our acquisition of Bundle Tech Limited. If we decide in the future to pursue additional strategic acquisitions, we may use our initial public offering proceeds to fund those types of investments.
Sources of Liquidity
On April 18, 2013, we entered into an amended and restated loan and security agreement (the "Credit Facility") with Silicon Valley Bank, or SVB. Pursuant to the Credit Facility we can incur revolver borrowings up to the lesser of $12.0 million or a borrowing base equal to 80% of eligible merchant receivables plus 75% of eligible credit card receivables. We have an incremental $6.0 million of non-formula based availability during the fourth quarter retail holiday season. The Credit Facility also provides for letters of credit. Interest accrues at a floating rate equal to SVB’s prime rate plus 1.0% and is payable monthly.
On October 29, 2013, we modified the terms of the Credit Facility with SVB to adjust the financial covenant requirements for future quarters to levels that are aligned with our operating and financial targets. Financial covenants include maintenance of an adjusted quick ratio, defined as the ratio of current assets to current liabilities, inclusive of outstanding letters of credit, and minus the current portion of deferred revenue, of at least 1.20 to 1.00 and a minimum net income. As of December 31, 2014, we were in compliance with the terms and covenants of the Credit Facility. There were no revolver borrowings and there was $1.6 million of letters of credit outstanding as of December 31, 2014.
On July 24, 2014, we entered into a Second Amended and Restated Loan and Security Agreement (the "Amended Agreement") with SVB. Pursuant to the Amended Agreement, the Credit Facility is extended for two years through July 24, 2016 and will bear interest at a rate equal to the Wall Street Journal Prime Rate. Borrowings under the Amended Agreement are subject to financial reporting obligations, including minimum profitability/maximum loss parameters.
The Credit Facility contains customary conditions to borrowings, events of default and negative covenants, including covenants that restrict our ability to dispose of assets, merge with or acquire other entities, incur indebtedness, incur encumbrances on our assets, make distributions to holders of our capital stock, make investments or engage in transactions with our affiliates. We are also required to maintain certain financial covenants including an adjusted quick ratio and a minimum net income. Except for our intellectual property, our obligations are secured by substantially all of our assets.
78
Historical Cash Flows
Years Ended December 31, | |||||||||||
2014 | 2013 | 2012 | |||||||||
(In thousands) | |||||||||||
Net cash provided by operating activities | $ | 4,547 | $ | 21,237 | $ | 5,933 | |||||
Net cash used in investing activities | (33,377 | ) | (3,801 | ) | (2,834 | ) | |||||
Net cash provided by (used in) financing activities | 84,419 | (1,313 | ) | 12,065 | |||||||
Net increase in cash and cash equivalents | $ | 55,589 | $ | 16,123 | $ | 15,164 | |||||
Net Cash Provided by Operating Activities
Cash flows provided by operating activities consist primarily of net loss adjusted for certain non-cash items, including stock-based compensation, depreciation and amortization and other non-cash charges, net. Our cash flows from operations are largely dependent on increased GMV generated from our customers’ ecommerce sites. We believe we have the ability to conserve liquidity when economic conditions become less favorable through any number of initiatives including curtailment of expansion and cutting discretionary spending.
Cash flows provided by operating activities during the year ended December 31, 2014 were $4.5 million, consisting of net loss of $3.1 million offset by non-cash items which included stock-based compensation of $4.1 million, depreciation and amortization of $3.9 million, change in the fair value of warrants of $1.0 million and forgiveness of notes receivable from stockholders of $0.4 million. Working capital sources of cash included (1) a $2.0 million increase in trade payables, and (2) a $2.2 million increase in accrued expenses and other, and (3) a $0.2 million increase in liability for employee rights upon retirement. The working capital sources of cash were offset by a $4.2 million increase in trade receivables primarily due to increases in volume across merchant receivables and credit card receivables and $1.8 million due to increases in other assets.
Cash flows provided by operating activities during the year ended December 31, 2013 were $21.2 million, consisting of net loss of $0.7 million and non-cash items which included a change in the fair value of warrants of $1.5 million, stock-based compensation of $1.4 million and depreciation and amortization of $2.3 million. Working capital sources of cash during the year ended December 31, 2013 included (1) a $12.3 million increase in trade payable, accrued expenses and other liabilities primarily attributable to increased fulfillment, duty and VAT costs, (2) a $1.5 million decrease in trade receivables primarily driven by accelerated collections from merchants, (3) a $3.0 million decrease in other current assets primarily attributable to a decrease in advance payment processors, net of, (4) a $0.1 million decrease in Israeli employee obligations.
Cash flows provided by operating activities for the year ended December 31, 2012 were $5.9 million, consisting of net income of $0.2 million partially offset by non-cash items including a change in the fair value of warrants of $1.8 million, stock-based compensation of $0.3 million, and depreciation and amortization of $1.4 million. Working capital sources of cash for 2012 were related to an increase in accounts payable, accrued expenses and other liabilities of $12.4 million primarily related to costs incurred but not paid for logistics related fulfillment costs incurred during the three months ended December 31, 2012 and a $0.4 million increase in Israeli employee obligations. These sources of cash were partially offset by (1) an increase in trade receivables of $7.7 million primarily attributable to GMV growth and (2) an increase in other current assets of $2.9 million primarily attributable to advance payments with payment processors.
79
Net Cash Used in Investing Activities
Cash flows used in investing activities consist primarily of capital expenditures for information technology infrastructure and capitalized software development as well as purchases of marketable securities. Cash flows provided by investing activities consist primarily of proceeds from the sale of the GSS business.
Cash flows used in investing activities during the year ended December 31, 2014 were $33.4 million, primarily consisting of purchases of investments of $27.6 million, $6.1 million of capitalized software development and equipment costs, restricted cash of $0.1 million, and amounts funded for employee retirement fund of $0.1 million partially offset by $0.5 million of proceeds related to the receivable from the sale of the GSS business.
Cash flows used in investing activities during the year ended December 31, 2013 were $3.8 million. This consisted of $1.6 million of purchased property and equipment and $3.3 million of capitalized software development costs, and $0.1 million of cost related to a patent licensing agreement. The overall usage of cash was partially offset by $1.0 million of proceeds related to the receivable from the sale of the GSS business and $0.2 million for Israeli employee obligations.
Cash flows used in investing activities for the year ended December 31, 2012 were $2.8 million. The source of cash is related to $3.0 million of payments related to the receivable from the sale of the GSS business. This was partially offset by $2.0 million for the acquisition of CPBF, $1.9 million to purchase property and equipment, $1.7 million of capitalized software development cost, $0.2 million for Israeli employee obligations, and $0.1 million of expenditure related to a patent licensing agreement.
Net Cash Provided by (Used in) Financing Activities
During 2014, cash flows provided by financing activities consist primarily of the net proceeds from the closing of the IPO. Cash flows used for financing activities consist primarily of offering costs related to the IPO.
Cash flows provided by financing activities during the year ended December 31, 2014 were $84.4 million, consisting primarily of $85.6 million of proceeds from the IPO, net of underwriting discounts and commissions, as well as $0.4 million of proceeds from exercises of stock options, offset by $1.6 million of cash payments related to offering costs for accounting, legal and printing expenses.
Cash flows used in financing activities during the year ended December 31, 2013 were $1.3 million. This primarily consisted of $1.6 million of deferred offering costs. Additionally, proceeds from exercises of stock options were $0.4 million partially offset by payments on capital leases of $0.1 million. During the fourth quarter of 2013, we drew down $10.0 million from the revolving credit facility to support working capital needs during the fourth quarter holiday season and subsequently repaid the $10.0 million prior to the end of the year.
Cash flows provided by financing activities for the year ended December 31, 2012 were $12.1 million. Sources of cash included (1) $12.4 million from the issuance of 2,942,978 shares of Series E convertible preferred stock, (2) proceeds of $2.0 million from the revolving credit facility to consummate the CPBF acquisition, (3) $0.4 million of proceeds from the exercise of warrants in full issued to Plenus Technologies Ltd. allowing for the purchase of 575,283 shares of our Series C preferred stock, and (4) $0.1 million from the exercise of stock options. This was partially offset by (1) a $2.4 million repayment of long-term debt and (2) a $0.4 million aggregate repurchase of portions of Series A and Series C preferred stock.
80
Seasonality and Quarterly Fluctuations
Our businesses can experience fluctuations in quarterly performance. Our business is seasonal in nature and, as a result, operating expenses and working capital requirements fluctuate from quarter to quarter. Our fourth quarter is a significant period for our results of operations due to higher GMV during the holiday season and corresponding higher global ecommerce and fulfillment services revenue. As a result, revenue and operating income generally decline in the first quarter sequentially from the fourth quarter of the previous year.
Contractual Obligations and Commitments
Our principal commitments consist of obligations under leases for our office space. The following table summarizes these contractual obligations at December 31, 2014:
Payment Due by Period | ||||||||||||||||||||
Total | Less than 1 year | 1-3 years | 3-5 years | More than 5 years | ||||||||||||||||
Operating lease obligations | $ | 25,887 | $ | 1,893 | $ | 6,834 | $ | 7,202 | $ | 9,958 | ||||||||||
Off-Balance Sheet Arrangements
During the periods presented, we did not have any relationships with unconsolidated entities or financial partnerships, such as entities often referred to as structured finance or special purpose entities, which would have been established for the purpose of facilitating off-balance sheet arrangements or other contractually narrow or limited purposes.
81
ITEM 7A. QUANTITATIVE AND QUALITATIVE DISCLOSURES ABOUT MARKET RISK
Market risk represents the risk of loss that may impact our financial position due to adverse changes in financial market prices and rates. We have operations both within the United States and internationally, and we are exposed to market risks in the ordinary course of our business. These risks include primarily foreign currency exchange risks, interest rate risk and inflation risk.
Foreign Currency Exchange Risk
We are exposed to risks from changes in foreign exchange rates due to the nature of our business. The results of operations of, and sales volumes generated from, our customers’ ecommerce sites running on our platform are exposed to foreign exchange rate fluctuations for international sales. If the U.S. dollar weakens against foreign currencies, the translation of the prices of the customer’s products into foreign currency denominated transactions would decrease, which may result in increased international sales volumes, revenue and net income for us. Conversely, to the extent the U.S. dollar strengthens against foreign currencies, cross-border sales related to purchases of dollar-denominated goods on our platform by consumers may decrease, which could adversely affect international sales volumes, revenue and net income. Foreign exchange gains or losses related to international sales are recorded within cost of revenue. Additionally, upon revaluing our foreign subsidiaries’ activities that are denominated in currencies that are different from their functional currency, which is the U.S. dollar, foreign currency gains or losses are recorded within interest and other income, net, as appropriate, on the balance sheet date.
Our primary exposure to fluctuations in foreign currency exchange rates pertains to the major currencies in which our customers generate international sales, including Canadian dollars, Australian dollars, pounds sterling, euros and Japanese yen. Prior to 2013, we entered into foreign forward exchange and option contracts in order to protect us from the risk that the fair value of existing receivables, payables and the cash flows resulting from firm or anticipated transactions of services in foreign currencies, would be affected by fluctuations in exchange rates. Effective December 2012, we entered into a contract with a third party foreign exchange services provider for currency exchange and remittance services for our major currencies, including Canadian dollars, Australian dollars, pounds sterling, euros and Japanese yen, whereby the risk of loss on fluctuation in foreign exchange rates is borne by the third party provider. Although we have limited our risk of loss for major currencies we still may experience losses from fluctuations in exchange rates for sales in other foreign currencies, or upon translation to U.S. dollars expenses incurred in Israeli new shekels for our subsidiary operations, which may negatively impact our operating results.
Interest Rate Risk
At December 31, 2014 we had cash and cash equivalents of $99.2 million and $27.6 million of investments in marketable securities. We do not believe our cash and cash equivalents and investments have significant risk of default or illiquidity. We maintain significant amounts of cash and cash equivalents at one or more financial institutions that are in excess of government deposit insurance. We cannot be assured that we will not experience losses on these deposits.
The primary objectives of our investment activities are the preservation of capital, the fulfillment of liquidity needs and the fiduciary control of cash and investments. We do not enter into investments for trading or speculative purposes. Our investments are exposed to market risk due to a fluctuation in interest rates, which may affect our interest income and the fair market value of our investments. Due to the short-term nature of our investment portfolio, however, we do not believe an immediate 10% increase or decrease in interest rates would have a material effect on the fair market value of our portfolio. We therefore do not expect our operating results or cash flows to be materially affected by a sudden change in market interest rates.
Our existing credit facility accrues interest at a variable rate and we are exposed to market risks relating to changes in interest rates if we have a meaningful large outstanding balance. At December 31, 2014, the interest rate on our credit facility was 5.0% which, in accordance with the terms of our existing credit facility, was based on the lender’s prime rate plus 1.0%. There were no borrowings outstanding under our credit facility as of December 31, 2014. We do not currently have any interest rate hedging activities in place but may in the future engage in hedging activities if market conditions change. We do not, and do not intend to, engage in the practice of trading derivative securities for profit. A 10% increase or decrease in our current interest rate would not have a material effect on our interest expense.
82
Inflation Risk
We do not believe that inflation has had a material effect on our business, financial condition or results of operations. Nonetheless, if our costs were to become subject to significant inflationary pressures, we may not be able to fully offset such higher costs through price increases. Our inability or failure to do so could harm our business, financial condition and results of operations.
83
ITEM 8. FINANCIAL STATEMENTS AND SUPPLEMENTARY DATA
The information required by this Item is set forth on pages F-1 through F-38 of this Annual Report on Form 10-K and is incorporated by reference herein.
ITEM 9. CHANGES IN AND DISAGREEMENTS WITH ACCOUNTANTS ON ACCOUNTING AND FINANCIAL DISCLOSURE
None.
ITEM 9A. CONTROLS AND PROCEDURES
Evaluation of Disclosure Controls and Procedures
The term “disclosure controls and procedures,” as defined in Rules 13a-15(e) and 15d-15(e) under the Securities Exchange Act of 1934, as amended (the “Exchange Act”), refers to controls and procedures that are designed to ensure that information required to be disclosed by a company in the reports that it files or submits under the Exchange Act is recorded, processed, summarized and reported, within the time periods specified in the SEC’s rules and forms. Disclosure controls and procedures include, without limitation, controls and procedures designed to ensure that such information is accumulated and communicated to a company’s management, including its principal executive and principal financial officers, as appropriate to allow timely decisions regarding required disclosure.
Our management, with the participation of our Chief Executive Officer and our Chief Financial Officer, has evaluated the effectiveness of our disclosure controls and procedures as of December 31, 2014, the end of the period covered by this report on Form 10-K. Based upon such evaluation, our Chief Executive Officer and our Chief Financial Officer have concluded that our disclosure controls and procedures were effective as of such date.
Management’s Annual Report on Internal Control Over Financial Reporting
This Annual Report on Form 10-K does not include a report of management’s assessment regarding internal control over financial reporting or an attestation report of our registered public accounting firm due to a transition period established by the rules of the SEC for newly public companies.
Inherent Limitations of Internal Controls
Our management, including our Chief Executive Officer and Chief Financial Officer, does not expect that our disclosure controls and procedures or our internal controls will prevent all errors and all fraud. A control system, no matter how well conceived and operated, can provide only reasonable, not absolute, assurance that the objectives of the control system are met. Because of the inherent limitations in all control systems, no evaluation of controls can provide absolute assurance that all control issues and instances of fraud, if any, within the Company have been detected. These inherent limitations include the realities that judgments in decision-making can be faulty, and that breakdowns can occur because of a simple error or mistake. Additionally, controls can be circumvented by the individual acts of some persons, by collusion of two or more people, or by management override of the control. The design of any system of controls also is based in part upon certain assumptions about the likelihood of future events, and there can be no assurance that any design will succeed in achieving its stated goals under all potential future conditions. Over time, controls may become inadequate because of changes in conditions, or the degree of compliance with the policies or procedures may deteriorate. Because of the inherent limitations in a cost-effective control system, misstatements due to error or fraud may occur and not be detected.
Changes in Internal Controls
There was no change in our internal control over financial reporting that occurred during the period covered by this Annual Report on Form 10-K that has materially affected, or is reasonably likely to materially affect, our internal control over financial reporting.
84
ITEM 9B. OTHER INFORMATION
Not applicable.
ITEM 10. DIRECTORS, EXECUTIVE OFFICERS AND CORPORATE GOVERNANCE
This information required by this item is incorporated by reference to the information disclosed under the caption "Board of Directors and Management" in our Proxy Statement for the 2015 Annual Meeting of Stockholders, which we intend to file with the SEC within 120 days of the end of the fiscal year to which this report relates.
ITEM 11. EXECUTIVE COMPENSATION
The information required by this item is incorporated by reference to the information disclosed under the caption “Executive and Director Compensation and Related Matters” in our Proxy Statement for the 2015 Annual Meeting of Stockholders, which we intend to file with the SEC within 120 days of the end of the fiscal year to which this report relates.
ITEM 12. SECURITY OWNERSHIP OF CERTAIN BENEFICIAL OWNERS AND MANAGEMENT AND RELATED STOCKHOLDER MATTERS
The information required by this item is incorporated by reference to the information disclosed under the caption “Executive and Director Compensation and Related Matters” in our Proxy Statement for the 2015 Annual Meeting of Stockholders, which we intend to file with the SEC within 120 days of the end of the fiscal year to which this report relates.
ITEM 13. CERTAIN RELATIONSHIPS AND RELATED TRANSACTIONS, AND DIRECTOR INDEPENDENCE
The information required by this item is incorporated by reference to the information disclosed under the caption “Board of Directors and Management” in our Proxy Statement for the 2015 Annual Meeting of Stockholders, which we intend to file with the SEC within 120 days of the end of the fiscal year to which this report relates.
ITEM 14. PRINCIPAL ACCOUNTANT FEES AND SERVICES
The information required by this item is incorporated by reference to the information disclosed under the caption “Ratification of Appointment of Independent Registered Public Accounting Firm” in our Proxy Statement for the 2015 Annual Meeting of Stockholders, which we intend to file with the SEC within 120 days of the end of the fiscal year to which this report relates.
ITEM 15. EXHIBITS AND FINANCIAL STATEMENT SCHEDULE
Financial Statements and Schedule: See page F-1 of this Annual Report on Form 10-K
Exhibits: See the Exhibit Index immediately following the signature page of this Annual Report on Form 10-K. The exhibits listed in the Exhibit Index below are filed or incorporated by reference as part of this Annual Report on Form 10-K.
85
SIGNATURES
Pursuant to the requirements of the Securities Exchange Act of 1934, the Registrant has duly caused this Annual Report on Form 10-K to be signed on its behalf by the undersigned, thereunto duly authorized, on February 27, 2015.
BORDERFREE, INC. | ||
Date: | February 27, 2015 | |
By: | /s/ Michael DeSimone | |
Name | Michael A. DeSimone | |
Title: | Chief Executive Officer (Principal Executive Officer) | |
86
POWER OF ATTORNEY
We, the undersigned officers and directors of Borderfree, Inc., hereby severally constitute and appoint Michael A. DeSimone and Edwin A. Neumann, and each of them singly, our true and lawful attorneys, with full power to them and each of them singly, to sign for us and in our names in the capacities indicated below, any amendments to this Annual Report on Form 10-K, and generally to do all things in our names and on our behalf in such capacities to enable Borderfree, Inc. to comply with the provisions of the Securities Act of 1934, as amended, and all the requirements of the Securities Exchange Commission.
Pursuant to the requirements of the Securities Exchange Act of 1934, this report has been signed below by the following persons on behalf of the Registrant and in the capacities indicated on the respective dates below.
Signature | Title | Date | ||
/s/ Michael A. DeSimone | February 27, 2015 | |||
Michael A. DeSimone | Director and Chief Executive Officer | |||
(Principal Executive Officer) | ||||
/s/ Edwin A. Neumann | February 27, 2015 | |||
Edwin A. Neumann | Chief Financial Officer | |||
(Principal Financial and Accounting Officer) | ||||
/s/ Daniel T. Ciporin | February 27, 2015 | |||
Daniel T. Ciporin | Chairman of the Board of Directors | |||
/s/ William G. Bock | February 27, 2015 | |||
William G. Bock | Director | |||
/s/ Stephen J. Getsy | February 27, 2015 | |||
Stephen J. Getsy | Director | |||
/s/ Isaac Hillel | February 27, 2015 | |||
Isaac Hillel | Director | |||
/s/ Beth Pritchard | February 27, 2015 | |||
Beth Pritchard | Director | |||
/s/ George H. Spencer, III | February 27, 2015 | |||
George H. Spencer, III | Director | |||
/s/ Ofer Timor | February 27, 2015 | |||
Ofer Timor | Director | |||
87
EXHIBIT INDEX
Exhibit Number | Exhibit Title | |
3.1 (1) | Amended and Restated Certificate of Incorporation of the Registrant | |
3.2 (2) | Amended and Restated Bylaws of the Registrant | |
4.1 (3) | Form of Common Stock certificate of the Registrant | |
4.2 (4) | Fifth Amended and Restated Investors’ Rights Agreement, dated March 10, 2014 | |
10.1 (5)# | Forms of Director Indemnification Agreement and Executive Officer Indemnification Agreement | |
10.2 (6)# | 2011 Stock Option and Grant Plan and forms of option agreements thereunder | |
10.3 (7)# | 2014 Stock Option and Incentive Plan and forms of option agreements thereunder | |
10.4 (8)# | Non-Employee Director Compensation Policy | |
10.5 (9)# | Senior Executive Cash Incentive Bonus Plan | |
10.6 (10) | Agreement of Lease, dated February 14, 2012, as amended on March 20, 2013, between the Registrant and 292 Madison Avenue Leasehold LLC | |
10.7 (11) | Second Amended and Restated Loan and Security Agreement, dated July 24, 2014, between the Registrant and Silicon Valley Bank | |
21.1 (12) | List of Subsidiaries of the Registrant | |
23.1 | Consent of PricewaterhouseCoopers LLP, Independent Registered Public Accounting Firm | |
24.1 | Power of Attorney (included on signature page) | |
31.1 | Certification of Principal Executive Officer pursuant to Rule 13a-14(a) or Rule 15d-14(a) of the Securities Exchange Act of 1934, as amended | |
31.2 | Certification of Principal Financial Officer pursuant to Rule 13a-14(a) or Rule 15d-14(a) of the Securities Exchange Act of 1934, as amended | |
32.1* | Certification of Principal Executive Officer and Principal Financial Officer pursuant to 18 U.S.C. 1350 | |
101.INS | XBRL Instance Document | |
101.SCH | XBRL Taxonomy Extension Schema Document | |
101.CAL | XBRL Taxonomy Extension Calculation Linkbase Document | |
101.DEF | XBRL Taxonomy Extension Definition Linkbase Document | |
101.LAB | XBRL Taxonomy Extension Label Linkbase Document | |
101.PRE | XBRL Taxonomy Extension Presentation Linkbase Document | |
(1) Filed as Exhibit 3.2 to Amendment No. 1 to Registrant’s Registration Statement on Form S-1 filed with the Securities and Exchange Commission on March 11, 2014, and incorporated herein by reference. | ||
(2) Filed as Exhibit 3.3 to Amendment No. 1 to Registrant’s Registration Statement on Form S-1 filed with the Securities and Exchange Commission on March 11, 2014, and incorporated herein by reference. | ||
(3) Filed as Exhibit 4.1 to Amendment No. 1 to Registrant’s Registration Statement on Form S-1 filed with the Securities and Exchange Commission on March 11, 2014, and incorporated herein by reference. | ||
(4) Filed as Exhibit 4.2 to Amendment No. 1 to Registrant’s Registration Statement on Form S-1 filed with the Securities and Exchange Commission on March 11, 2014, and incorporated herein by reference. | ||
(5) Filed as Exhibit 10.1 to Amendment No. 1 to Registrant’s Registration Statement on Form S-1 filed with the Securities and Exchange Commission on March 11, 2014, and incorporated herein by reference. | ||
(6) Filed as Exhibit 10.2 to Registrant’s Registration Statement on Form S-1 filed with the Securities and Exchange Commission on February 18, 2014, and incorporated herein by reference. | ||
88
(7) Filed as Exhibit 10.3 to Amendment No. 1 to Registrant’s Registration Statement on Form S-1 filed with the Securities and Exchange Commission on March 11, 2014, and incorporated herein by reference. | ||
(8) Filed as Exhibit 10.4 to Amendment No. 1 to Registrant’s Registration Statement on Form S-1 filed with the Securities and Exchange Commission on March 11, 2014, and incorporated herein by reference. | ||
(9) Filed as Exhibit 10.5 to Amendment No. 1 to Registrant’s Registration Statement on Form S-1 filed with the Securities and Exchange Commission on March 11, 2014, and incorporated herein by reference. | ||
(10) Filed as Exhibit 10.4 to Registrant’s Registration Statement on Form S-1 filed with the Securities and Exchange Commission on February 18, 2014, and incorporated herein by reference. | ||
(11) Filed as Exhibit 10.5 to Registrant’s Registration Statement on Form S-1 filed with the Securities and Exchange Commission on February 18, 2014, and incorporated herein by reference. | ||
(12) Filed as Exhibit 21.1 to Registrant’s Registration Statement on Form S-1 filed with the Securities and Exchange Commission on February 18, 2014, and incorporated herein by reference. | ||
* | The certifications furnished in Exhibit 32.1 hereto are deemed to accompany this Annual Report on Form 10-K and will not be deemed “filed” for purposes of Section 18 of the Securities Exchange Act of 1934, as amended, except to the extent that the Registrant specifically incorporates it by reference. Such certifications will not be deemed to be incorporated by reference into any filings under the Securities Act of 1933, as amended, or the Securities Exchange Act of 1934, as amended, except to the extent that the Registrant specifically incorporates it by reference. | |
# | Management contract or compensatory plan or arrangement. | |
89
INDEX TO CONSOLIDATED FINANCIAL STATEMENTS
Page | ||
F-1
REPORT OF INDEPENDENT REGISTERED PUBLIC ACCOUNTING FIRM
To the Board of Directors and Stockholders
of Borderfree, Inc.:
In our opinion, the consolidated financial statements listed in the accompanying index present fairly, in all material respects, the financial position of Borderfree, Inc. and its subsidiaries at December 31, 2014 and 2013, and the results of their operations and their cash flows for each of the three years in the period ended December 31, 2014 in conformity with accounting principles generally accepted in the United States of America. In addition, in our opinion, the financial statement schedule listed in the accompanying index presents fairly, in all material respects, the information set forth therein when read in conjunction with the related consolidated financial statements. These financial statements and financial statement schedule are the responsibility of the Company’s management. Our responsibility is to express an opinion on these financial statements and financial statement schedule based on our audits. We conducted our audits of these statements in accordance with the standards of the Public Company Accounting Oversight Board (United States). Those standards require that we plan and perform the audit to obtain reasonable assurance about whether the financial statements are free of material misstatement. An audit includes examining, on a test basis, evidence supporting the amounts and disclosures in the financial statements, assessing the accounting principles used and significant estimates made by management, and evaluating the overall financial statement presentation. We believe that our audits provide a reasonable basis for our opinion.
/s/ PricewaterhouseCoopers LLP
New York, New York
February 27, 2015
F-2
BORDERFREE, INC.
CONSOLIDATED BALANCE SHEETS
(in thousands except par value and share data)
At December 31, | ||||||||
2014 | 2013 | |||||||
Assets | ||||||||
Current assets: | ||||||||
Cash and cash equivalents | $ | 99,188 | $ | 43,599 | ||||
Investments | 27,555 | — | ||||||
Trade receivables, net of allowances of $40 and $71 at December 31, 2014 and 2013, respectively | 18,031 | 13,785 | ||||||
Short term receivable from sale of business | 629 | 742 | ||||||
Prepaid expenses and other | 3,107 | 3,056 | ||||||
Total current assets | 148,510 | 61,182 | ||||||
Restricted cash and deposits | 482 | 288 | ||||||
Employee rights upon retirement funds | 896 | 897 | ||||||
Receivable from sale of business | 77 | 476 | ||||||
Property and equipment, net | 10,310 | 7,667 | ||||||
Goodwill | 265 | 265 | ||||||
Intangible assets, net | 957 | 1,262 | ||||||
Other assets | 220 | 276 | ||||||
Total assets | $ | 161,717 | $ | 72,313 | ||||
Liabilities, convertible preferred stock and stockholders’ equity (deficit) | ||||||||
Current liabilities: | ||||||||
Trade payables | $ | 30,483 | $ | 28,508 | ||||
Deferred revenue | 1,781 | 1,080 | ||||||
Current maturity of long term debt | 14 | 32 | ||||||
Accrued expenses and other | 11,167 | 12,286 | ||||||
Total current liabilities | 43,445 | 41,906 | ||||||
Liability for employee rights upon retirement | 1,514 | 1,454 | ||||||
Long term debt | — | 14 | ||||||
Other long term liabilities | 331 | 279 | ||||||
Total liabilities | 45,290 | 43,653 | ||||||
Commitments and contingencies - See Note 11 | ||||||||
Convertible preferred stock: | ||||||||
Series A, convertible preferred stock, $0.01 par value; 0 and 2,108,107 shares authorized at December 31, 2014 and December 31, 2013, respectively; 0 and 1,999,438 shares issued and outstanding at December 31, 2014 and December 31, 2013, respectively | — | 7,004 | ||||||
Series B, convertible preferred stock, $0.01 par value; 0 and 2,654,307 shares authorized at December 31, 2014 and December 31, 2013, respectively; 0 and 2,413,006 shares issued and outstanding at December 31, 2014 and December 31, 2013, respectively | — | 2,573 | ||||||
Series C, convertible preferred stock, $0.01 par value; 0 and 14,400,000 shares authorized at December 31, 2014 and December 31, 2013, respectively; 0 and 14,089,918 shares issued and outstanding at December 31, 2014 and December 31, 2013, respectively | — | 15,095 | ||||||
Series D, convertible preferred stock, $0.01 par value; 0 and 9,500,000 shares authorized at December 31, 2014 and December 31, 2013, respectively; 0 and 8,822,063 shares issued and outstanding at December 31, 2014 and December 31, 2013, respectively | — | 4,859 | ||||||
Series E, convertible preferred stock, $0.01 par value; 0 and 2,942,978 shares authorized at December 31, 2014 and December 31, 2013, respectively; 0 and 2,942,978 shares issued and outstanding at December 31, 2014 and December 31, 2013, respectively | — | 12,406 | ||||||
Total convertible preferred stock | — | 41,937 | ||||||
Stockholders’ equity (deficit): | ||||||||
Common stock, $0.01 par value; 200,000,000 and 49,500,000 shares authorized at December 31, 2014 and December 31, 2013, respectively; 32,187,236 and 4,843,612 shares issued at December 31, 2014 and December 31, 2013, respectively; 31,947,716 and 4,604,092 shares outstanding at December 31, 2014 and December 31, 2013, respectively | 322 | 48 | ||||||
Additional paid in capital | 136,260 | 4,132 | ||||||
Notes receivable from stockholders | — | (429 | ) | |||||
Accumulated other comprehensive loss | (19 | ) | — | |||||
Treasury stock, at cost | (600 | ) | (600 | ) | ||||
Accumulated deficit | (19,536 | ) | (16,428 | ) | ||||
Total stockholders’ equity (deficit) | 116,427 | (13,277 | ) | |||||
Total liabilities, convertible preferred stock and stockholders’ equity (deficit) | $ | 161,717 | $ | 72,313 | ||||
The accompanying notes to consolidated financial statements are an integral part of these statements.
F-3
BORDERFREE, INC.
CONSOLIDATED STATEMENTS OF OPERATIONS
(in thousands except share and per share data)
Years Ended December 31, | |||||||||||
2014 | 2013 | 2012 | |||||||||
Revenue | $ | 125,492 | $ | 110,457 | $ | 81,384 | |||||
Operating expenses: | |||||||||||
Cost of revenue | 79,287 | 75,070 | 55,632 | ||||||||
Technology and operations | 14,190 | 9,366 | 7,601 | ||||||||
Research and development | 8,936 | 6,656 | 4,545 | ||||||||
Sales and marketing | 11,847 | 10,028 | 5,729 | ||||||||
General and administrative | 13,565 | 9,567 | 6,754 | ||||||||
Total operating expenses | 127,825 | 110,687 | 80,261 | ||||||||
Income (loss) from operations | (2,333 | ) | (230 | ) | 1,123 | ||||||
Interest and other income, net | 586 | 1,406 | 1,205 | ||||||||
Loss on change in fair value of warrants | (964 | ) | (1,496 | ) | (1,828 | ) | |||||
Income (loss) before income taxes | (2,711 | ) | (320 | ) | 500 | ||||||
Provision for income taxes | 397 | 334 | 308 | ||||||||
Net income (loss) | $ | (3,108 | ) | $ | (654 | ) | $ | 192 | |||
Excess consideration paid for convertible preferred stock repurchases | — | — | (250 | ) | |||||||
Net loss attributable to common stockholders — basic and diluted | $ | (3,108 | ) | $ | (654 | ) | $ | (58 | ) | ||
Net loss per share attributable to common stockholders — basic and diluted | $ | (0.12 | ) | $ | (0.15 | ) | $ | (0.02 | ) | ||
Weighted average common shares outstanding: | |||||||||||
Basic | 25,765,819 | 4,255,775 | 3,598,507 | ||||||||
Diluted | 25,765,819 | 4,255,775 | 3,598,507 | ||||||||
The accompanying notes to consolidated financial statements are an integral part of these statements.
F-4
BORDERFREE, INC.
CONSOLIDATED STATEMENTS OF COMPREHENSIVE LOSS
(in thousands)
Years Ended December 31, | |||||||||||
2014 | 2013 | 2012 | |||||||||
Net income (loss) | $ | (3,108 | ) | $ | (654 | ) | $ | 192 | |||
Other comprehensive loss: | |||||||||||
Net unrealized losses on investments on available-for-sale securities occurring during the period | (19 | ) | — | — | |||||||
Comprehensive income (loss) | $ | (3,127 | ) | $ | (654 | ) | $ | 192 | |||
The accompanying notes to consolidated financial statements are an integral part of these statements.
F-5
BORDERFREE, INC.
CONSOLIDATED STATEMENT OF STOCKHOLDERS' EQUITY (DEFICIT)
(in thousands except share data)
Common Stock | Additional paid-in capital | Notes receivable from stockholders | Treasury Stock | Accumulated other comprehensive loss | Accumulated deficit | Total | ||||||||||||||||||||||||||||
Amount | Shares | Amount | Shares | |||||||||||||||||||||||||||||||
Balance at January 1, 2012 | $ | 28 | 2,827,052 | $ | 1,843 | $ | (146 | ) | $ | (600 | ) | (239,520 | ) | $ | — | $ | (15,966 | ) | $ | (14,841 | ) | |||||||||||||
Net income | 192 | 192 | ||||||||||||||||||||||||||||||||
Exercise of stock options | 14 | 1,372,306 | 420 | (301 | ) | 133 | ||||||||||||||||||||||||||||
Accrued interest on notes | (5 | ) | (5 | ) | ||||||||||||||||||||||||||||||
Stock-based compensation | 323 | 323 | ||||||||||||||||||||||||||||||||
Repurchase of preferred stock | (250 | ) | (250 | ) | ||||||||||||||||||||||||||||||
Balance at December 31, 2012 | $ | 42 | 4,199,358 | $ | 2,336 | $ | (452 | ) | $ | (600 | ) | (239,520 | ) | $ | — | $ | (15,774 | ) | $ | (14,448 | ) | |||||||||||||
Net loss | (654 | ) | (654 | ) | ||||||||||||||||||||||||||||||
Exercise of stock options | 6 | 644,254 | 389 | 395 | ||||||||||||||||||||||||||||||
Accrued interest on notes | (5 | ) | (5 | ) | ||||||||||||||||||||||||||||||
Payment of stockholders' note receivable | 28 | 28 | ||||||||||||||||||||||||||||||||
Stock-based compensation | 1,407 | 1,407 | ||||||||||||||||||||||||||||||||
Balance at December 31, 2013 | $ | 48 | 4,843,612 | $ | 4,132 | $ | (429 | ) | $ | (600 | ) | (239,520 | ) | $ | — | $ | (16,428 | ) | $ | (13,277 | ) | |||||||||||||
Net loss | (3,108 | ) | (3,108 | ) | ||||||||||||||||||||||||||||||
Other comprehensive loss | (19 | ) | (19 | ) | ||||||||||||||||||||||||||||||
Exercise of stock options | 4 | 485,808 | 415 | 419 | ||||||||||||||||||||||||||||||
Exercise of warrants | 3 | 235,188 | (3 | ) | — | |||||||||||||||||||||||||||||
Conversion of convertible preferred stock to common stock | 209 | 20,872,628 | 41,728 | 41,937 | ||||||||||||||||||||||||||||||
Reclassification of convertible preferred stock warrant liability to common stock warrants | 3,627 | 3,627 | ||||||||||||||||||||||||||||||||
Issuance of common stock in connection with initial public offering, net of issuance costs of $3,209 | 58 | 5,750,000 | 82,294 | 82,352 | ||||||||||||||||||||||||||||||
Forgiveness and repayment of notes receivable | 429 | 429 | ||||||||||||||||||||||||||||||||
Stock-based compensation | 4,067 | 4,067 | ||||||||||||||||||||||||||||||||
Balance at December 31, 2014 | $ | 322 | 32,187,236 | $ | 136,260 | $ | — | $ | (600 | ) | (239,520 | ) | $ | (19 | ) | $ | (19,536 | ) | $ | 116,427 | ||||||||||||||
The accompanying notes to consolidated financial statements are an integral part of these statements.
F-6
BORDERFREE, INC.
CONSOLIDATED STATEMENTS OF CASH FLOWS
(in thousands)
Years Ended December 31, | |||||||||||
2014 | 2013 | 2012 | |||||||||
Cash flows from operating activities | |||||||||||
Net income (loss) | $ | (3,108 | ) | $ | (654 | ) | $ | 192 | |||
Adjustments to reconcile net loss to net cash from operating activities: | |||||||||||
Stock-based compensation | 4,067 | 1,407 | 323 | ||||||||
Forgiveness of notes receivable from stockholders | 396 | — | — | ||||||||
Loss on change in fair value of warrants | 964 | 1,496 | 1,828 | ||||||||
Depreciation and amortization | 3,926 | 2,285 | 1,444 | ||||||||
Gain on sale of property and equipment | — | — | (2 | ) | |||||||
Loss (gain) on employee rights upon retirement funds | (67 | ) | 8 | (33 | ) | ||||||
Interest income on notes receivable from stockholders | — | (5 | ) | (5 | ) | ||||||
Changes in operating assets and liabilities: | |||||||||||
(Increase) decrease in trade receivables | (4,246 | ) | 1,500 | (7,676 | ) | ||||||
(Increase) decrease in prepaid expenses and other | (1,753 | ) | 3,019 | (2,877 | ) | ||||||
Increase in trade payables | 1,975 | 12,191 | 6,398 | ||||||||
Increase in accrued expenses and other | 2,163 | 88 | 5,978 | ||||||||
Increase (decrease) in liability for employee rights upon retirement | 230 | (98 | ) | 363 | |||||||
Net cash provided by operating activities | 4,547 | 21,237 | 5,933 | ||||||||
Cash flows from investing activities | |||||||||||
Purchases of investments | (27,587 | ) | — | — | |||||||
Restricted cash and deposits | (94 | ) | 29 | (28 | ) | ||||||
Purchase of property and equipment | (2,143 | ) | (1,603 | ) | (1,874 | ) | |||||
Acquired business | — | — | (2,000 | ) | |||||||
Capitalized internal use software | (3,962 | ) | (3,295 | ) | (1,680 | ) | |||||
(Increase) decrease in funds in respect of employee rights upon retirement | (103 | ) | 161 | (219 | ) | ||||||
Payment for intangible asset | — | (81 | ) | (58 | ) | ||||||
Proceeds from sale of business | 512 | 988 | 3,025 | ||||||||
Net cash used in investing activities | (33,377 | ) | (3,801 | ) | (2,834 | ) | |||||
Cash flows from financing activities | |||||||||||
Proceeds from initial public offering, net of underwriting discounts and commissions | 85,561 | — | — | ||||||||
Issuance of convertible preferred stock, net of issuance costs | — | — | 12,406 | ||||||||
Offering costs | (1,562 | ) | (1,647 | ) | — | ||||||
Proceeds from exercise of stock options | 419 | 395 | 133 | ||||||||
Proceeds from exercise of warrants | — | — | 350 | ||||||||
Repurchase of convertible preferred stock | — | — | (400 | ) | |||||||
Repayments of notes receivable from stockholder | 33 | 28 | — | ||||||||
Proceeds from line of credit | — | 10,000 | 2,000 | ||||||||
Repayment of line of credit | — | (10,000 | ) | (2,000 | ) | ||||||
Repayment of long term debt | — | — | (364 | ) | |||||||
Payments of capital leases | (32 | ) | (89 | ) | (60 | ) | |||||
Net cash provided by (used in) financing activities | 84,419 | (1,313 | ) | 12,065 | |||||||
Increase in cash and cash equivalents | 55,589 | 16,123 | 15,164 | ||||||||
Balance of cash and cash equivalents at beginning of period | 43,599 | 27,476 | 12,312 | ||||||||
Balance of cash and cash equivalents at end of period | $ | 99,188 | $ | 43,599 | $ | 27,476 | |||||
Supplemental disclosure of cash flow information | |||||||||||
Cash paid for interest | $ | — | $ | 13 | $ | 39 | |||||
Cash paid for taxes | $ | 447 | $ | 451 | $ | 377 | |||||
Non-cash capital expenditures | $ | 159 | $ | 577 | $ | — | |||||
Non-cash financing activities | |||||||||||
Cashless exercise of warrants | $ | 3 | $ | — | $ | — | |||||
The accompanying notes to consolidated financial statements are an integral part of these statements.
F-7
BORDERFREE, INC.
NOTES TO CONSOLIDATED FINANCIAL STATEMENTS
Note 1—Description of Business and Summary of Significant Accounting Policies
Description of Business
Borderfree, Inc. (the “Company” or “Borderfree”), formerly known as FiftyOne, Inc., was incorporated on November 3, 1999 and commenced operations on January 1, 2000. The Company is a market leader in global ecommerce, operating a proprietary technology and services platform to enable U.S. retailers to transact with international shoppers, which the Company refers to as consumers, in more than 100 countries and territories worldwide. The retailers and brands, which the Company refers to as their customers, that integrate the Company’s solution use the highly scalable Borderfree platform to develop a seamless global ecommerce business across web, mobile and in-store channels. Borderfree manages all aspects of the international shopping experience, including site localization, multi-currency pricing, payment processing, fraud management, landed cost calculation, customs clearance and brokerage, and global logistics services while maintaining the integrity of the customers’ brand and consumer experience.
During 2012, the Company acquired certain assets of the Canada Post—Borderfree business unit (“CPBF”) of Canada Post Corporation (“Canada Post”). In January 2015, the Company acquired 100% equity interest in Bundle Tech Limited ("Bundle Tech") (see Note 2-Acquisitions).
Accounting Principles
The consolidated financial statements are prepared in accordance with generally accepted accounting principles in the United States of America (“GAAP”).
The consolidated financial statements include the accounts of the Company and its wholly-owned subsidiaries which include Borderfree Canada, Inc., FiftyOne China, Co., Ltd., Borderfree Research and Development Ltd. (organized in Israel) and Borderfree Limited (organized in Ireland). Intercompany accounts and transactions have been eliminated on consolidation.
Use of Estimates in Preparation of the Financial Statements
The preparation of consolidated financial statements in conformity with GAAP requires management to make estimates and assumptions that affect the reported amounts of assets and liabilities; the disclosure of contingent assets and liabilities at the dates of the consolidated financial statements and the reported amounts of revenue and expenses during the reporting periods. Significant estimates and assumptions made by management include the fair value of stock options, valuation of goodwill and intangible assets, useful lives associated with depreciation and amortization of intangible assets, warrant liability, certain components of the income tax provisions, including valuation allowances on the Company’s deferred tax assets, and accruals for refunds and chargebacks. The Company bases estimates and assumptions on historical experience and on various other factors that it believes to be reasonable under the circumstances. The Company evaluates its estimates and assumptions on an ongoing basis. Actual results could vary from those estimates.
F-8
Functional Currency and Translation
The functional currency of the Company and its subsidiaries is the U.S. dollar (“dollar”).
Transactions and balances originally denominated in dollars are presented at their original amounts. Balances in non-dollar currencies are translated into dollars using historical and current exchange rates for non-monetary and monetary balances, respectively. For non-dollar transactions reflected in the statements of operations, the average exchange rates during the period are used. Depreciation, amortization and other changes deriving from non-monetary items are based on historical exchange rates. The resulting transaction gains or losses are recorded within interest and other income, net, on the consolidated statements of operations.
The transaction gains and losses for the years ended December 31, 2014, 2013 and 2012 were not significant.
Cash and Cash Equivalents
The Company considers all highly-liquid investments, which include short term bank deposits with original maturities of less than three months that are not restricted to withdrawal or use, to be cash equivalents. Cash amounts held in foreign bank accounts amounted to $2.9 million and $2.1 million at December 31, 2014 and 2013, respectively. The majority of cash and cash equivalents held in domestic and foreign bank accounts are in excess of government deposit insurance.
Restricted cash and deposits represent amounts held as collateral for a long term lease and as collateral for credit.
Trade Receivables and Allowance for Doubtful Accounts
Trade receivables are carried at their original invoice amounts less an allowance for doubtful accounts based on estimated losses resulting from the inability or unwillingness of customers to make required payments. The Company determines the allowance for doubtful accounts by considering a number of factors, including the length of time trade receivables are past due, its previous loss history, the customer’s current ability to pay its obligation and the condition of the general economy and the industry as a whole. Unanticipated events and circumstances may occur that affect the accuracy or validity of such assumptions, estimates or actual results.
Employee Rights Upon Retirement
The Company is obligated to make pension and severance liability contributions for the benefit of certain Israeli employees based on labor laws in Israel, subject to certain conditions. The Company’s liability is fully provided for by regular deposits to funds administered by financial institutions and by an accrual for the amount of the liability which has not yet been deposited.
Pension and severance expenses for the years ended December 31, 2014, 2013 and 2012 were $1.0 million, $0.7 million, and $0.5 million, respectively.
Property and Equipment
Property and equipment are recorded at cost. Depreciation expense is calculated using the straight-line method over the estimated useful lives of the assets less estimated residual value, if any.
Estimated useful lives for property and equipment are as follows: (1) computer and peripheral equipment, three to five years; (2) furniture and office equipment, five to sixteen years; and (3) leasehold improvements, over the term of the lease or expected useful life of the improvement, whichever is shorter.
Repairs and maintenance costs are expensed as incurred; major renewals or betterments are capitalized.
F-9
Internal Use Software
The Company accounts for the cost of computer software developed for internal use by capitalizing qualifying costs which are incurred during the development stage. Capitalized internal use software is included in property and equipment, net and is amortized straight-line over the expected period of benefit, which is three years, beginning when the software is ready for its intended use. Amortization expense related to capitalized internal use software costs is included in technology and operations.
Acquisitions
Acquired businesses are accounted for using the acquisition method of accounting which requires, among other things, that assets acquired and liabilities assumed be recognized at their fair values as of the acquisition date. Related transaction costs are expensed as incurred. Any excess of the purchase price over the assigned values of the net assets acquired is recorded as goodwill.
Goodwill, Long-Lived Intangible Assets and Impairment
Goodwill represents the excess of the cost of net assets acquired in business combinations over the fair value of the identifiable tangible and intangible assets acquired and liabilities assumed in a business combination. As of December 31, 2014, the Company has a single reporting unit. Goodwill is not amortized. As required under GAAP, goodwill and indefinite-lived intangibles are reviewed for impairment annually, for the Company as of October 1, or more frequently whenever events or changes indicate that the carrying value of an asset may not be recoverable. These events or circumstances could include, but are not limited to, a significant change in the business climate, legal factors, operating performance indicators, competition, or sale or disposition of significant assets. The testing of goodwill and indefinite-lived intangible assets for impairment involves significant use of judgment and assumptions in the determination of fair market value.
In September 2011, the Financial Accounting Standards Board (“FASB”) issued accounting guidance that allows an entity to first assess qualitative factors to determine whether it is necessary to perform the two-step quantitative impairment testing of goodwill. The Company adopted this newly issued authoritative guidance effective January 1, 2012. Among the factors included in the qualitative assessment were general economic conditions and the competitive environment, actual and expected financial performance, including consideration of the Company’s revenue growth and improved operating results year-over-year, forward-looking business measurements, external market conditions and other relevant entity-specific events. Based on the results of the qualitative assessment, the Company concluded that performance of the two-step quantitative impairment test was not necessary. The goodwill on the balance sheet is related to the 2012 acquisition of CPBF. There were no impairments of goodwill in any of the periods presented in the consolidated financial statements.
Long-lived assets include property and equipment and long-lived amortizable intangible assets, such as customer relationships, technology, patent rights costs and intellectual property license. The Company amortizes customer relationships and technology over their estimated useful lives, which range from one to eight years, based on the pattern over which the Company expects to consume the economic benefit of each asset, which in general reflects the expected cash flow from each asset. The Company amortizes patent rights costs and intellectual property license over their useful lives, which range from four to twenty years, on a straight-line basis, as the pattern of consumption of the economic benefit of the asset cannot be reliably determined. The Company evaluates long-lived assets for recoverability whenever events or changes in circumstances indicate that their carrying values may not be recoverable. Factors that the Company considers in deciding when to perform an impairment review include significant underperformance of the business in relation to expectations, significant negative industry or economic trends, and significant changes or planned changes in the use of assets. To evaluate a long-lived asset for recoverability, the Company compares forecasts of undiscounted cash flows expected to result from the use and eventual disposition of the long-lived asset to its carrying value.
If the carrying value exceeds the sum of the expected undiscounted cash flows, an impairment loss on the long-lived asset to be held and used is recognized based on the excess of the asset’s carrying value over its fair value, determined based on discounted cash flows. Long-lived assets to be disposed of are reported at the lower of carrying value or fair value less cost to sell. There were no impairments of long-lived assets or amortizable intangible assets in any of the periods presented in the consolidated financial statements.
F-10
Operating and Capital Leases
The Company leases furniture and computer equipment under capital lease agreements. Assets acquired under capital leases are amortized over the shorter of the remaining lease term or estimated useful life net of any residual value. The Company leases office facilities under operating lease agreements.
Revenue Recognition
Revenue is recognized when the following conditions are satisfied: (1) persuasive evidence of an arrangement exists; (2) delivery has occurred, title has transferred or services are rendered; (3) price is fixed or determinable; and (4) collectability is reasonably assured.
The Company derives revenue from transactions with its customers and through separate arrangements with the consumers who shop the Company’s customers’ websites.
Global ecommerce services revenue includes a fee paid to the Company by their customers based on a percentage of their customer’s total gross international sales revenue processed through the Company’s platform, as well as a fee paid by the consumer related to foreign exchange and other transactional services, including consumer service fees.
Fulfillment services revenue is paid by both the consumer and the Company's customers for international shipping, handling and other global logistics services.
Revenue derived from the Company’s customers is recognized upon the completion of the agreed upon service to the customer, which occurs upon the shipment of the parcel from the Company’s third-party hub facilities to the consumer. Revenue related to fulfillment services, foreign exchange and other transactional services, including consumer service fees, is recognized upon delivery when the risk of loss is transferred to the consumer.
The Company evaluates whether it is appropriate to record revenue on a gross or net basis. When making this evaluation, the Company considers if it is primarily obligated in a transaction, is subject to inventory risk with respect to markdowns and obsolescence, and has latitude in establishing prices or selecting suppliers, among other factors. When several, but not all of these indicators are not present, revenue is recorded on a net basis. With the exception of fulfillment services revenue, the Company records all revenue on a net basis. The Company enters into fulfillment arrangements with their logistic providers. Pursuant to these arrangements, the Company acts as the primary obligor to the consumer and the Company has latitude in establishing pricing and selecting suppliers, among other factors. As a result, the Company reports fulfillment services revenue and fulfillment costs on a gross basis.
The Company evaluates transactions with customers and consumers for multi-element arrangements and determined that there is a single unit of accounting for transactions with the Company’s customers as well as the separate transactions with the consumers. Revenue is therefore recorded upon the final deliverable being satisfied with the customer or consumer.
Billings received in advance for services are deferred and recognized as revenue when the conditions noted above are satisfied.
When a consumer returns their purchase to the Company’s customer, the Company typically refunds certain ecommerce fees related to foreign exchange services to the consumer. Reserves for such refunds are recorded at the time of sale based upon historical experience. Ecommerce fees paid to the Company based on a percentage of customer sales generated through the Company’s platform are generally not refunded to the Company’s customer. Consumer service fees related to transactional activity are not refunded. Fulfillment costs are typically paid for by the consumer in the event of a return or exchange and are not refunded by the Company.
F-11
The following table summarizes revenue by type of service (in thousands):
Years Ended December 31, | |||||||||||
2014 | 2013 | 2012 | |||||||||
Global ecommerce services | $ | 65,748 | $ | 53,268 | $ | 35,044 | |||||
Fulfillment services | 59,744 | 57,189 | 46,340 | ||||||||
Revenue | $ | 125,492 | $ | 110,457 | $ | 81,384 | |||||
No individual customer accounted for more than 10% of revenue for the years ended December 31, 2014, 2013 and 2012. The Company’s top 10 customers accounted for approximately 67% of global ecommerce revenue for the years ended December 31, 2014 and 2013, and 71% for the year ended December 31, 2012.
Cost of Revenue
Cost of revenue consists primarily of fulfillment costs, as well as payment processing costs, transaction processing personnel salaries and benefits (fraud prevention, logistics and client service), foreign exchange gain (loss), depreciation expenses for hardware, allocated overhead, and allowances related to consumer fraud, chargebacks, parcel losses and other consumer service costs. Fulfillment costs and payment processing costs are driven by the sales generated by the Company’s customers using the Borderfree platform and the related gross merchandise volume. Specifically, fulfillment costs include international shipping, handling and other costs associated with delivering global logistics services. Payment processing costs include fees paid to credit card and other payment providers for processing consumer payments. Foreign exchange gain (loss) relates to expenses associated with managing the conversion of foreign denominated currencies into dollars. The Company assumes the customer’s risk of loss and incurs direct costs related to consumer fraud, chargebacks, parcel losses and other consumer service costs. These costs are provided for at the same time the related revenue is recognized based on historical experience. The Company does not record revenue for the retail value of the customer’s products sold.
Research and Development
Research and development expenses consist primarily of personnel and related expenses for the Company’s product development and research and development staff including salaries, benefits, bonuses and stock-based compensation; the cost of certain third-party contractors; and depreciation expenses for hardware and allocated overhead.
Research and development costs, excluding qualifying costs which are capitalized, are charged to expense as incurred.
Advertising
Advertising costs are charged to expense as incurred and approximated $0.7 million, $0.3 million and $0.5 million for the years ended December 31, 2014, 2013 and 2012, respectively.
Fair Value of Financial Instruments
The carrying amounts of the Company’s financial instruments, including cash, cash equivalents, investments, trade receivables and payables, and credit facility, approximate fair value, due to their short maturities or the fact that the interest rate of the revolving credit facility is based upon current market rates (see Note 4).
Forward Currency Contracts
Forward currency contracts are recognized as assets or liabilities and are measured at fair value.
Gains and losses on forward currency contracts that are hedging forecasted transactions or cash flows, that are to be received or paid in multiple currencies, are recognized in cost of revenue as they are deemed not to be effective hedges. Open contracts are marked to market based upon the current forward contract rate at the end of each period.
Gains and losses on forward currency contracts for the years ended December 31, 2014, 2013 and 2012 were not significant. There were no open contracts as of December 31, 2014.
F-12
Income Taxes
The Company is subject to income taxes in both the United States and various foreign jurisdictions. As a global taxpayer, significant judgments and estimates are required in determining the provision for income taxes on earnings. Income tax expense, deferred tax assets and liabilities, and reserves for unrecognized tax benefits reflect management’s best assessment of estimated future taxes to be paid.
The Company uses the asset and liability method of accounting for income taxes. Under this method, deferred tax assets and liabilities are recognized for the future tax consequences attributable to the differences between the financial statement carrying amounts of existing assets and liabilities and their respective tax bases and to operating loss and tax credit carry forwards. Deferred tax assets and liabilities are measured using enacted statutory tax rates expected to apply in the years in which the differences are expected to be recovered and settled. The effect on deferred taxes due to a change in tax rates is recognized in income tax expense in the period that includes the enactment date. Deferred tax assets are recognized only when it is probable that such assets will be utilized in the future against taxable income, and reduced by a valuation allowance to the extent the Company believes a portion will not be realized.
The Company considers many factors when assessing the likelihood of future realization of deferred tax assets, including the cumulative earnings experience and expectations of future taxable income, the carry forward periods available to the Company for tax reporting purposes and other relevant factors. In evaluating the ability to recover deferred tax assets, the Company considered available positive and negative evidence, giving greater weight to recent cumulative losses, and lesser weight to projected financial results due to the challenges of forecasting future periods. Due to the uncertainty surrounding the Company’s ability to recognize the reversal of temporary differences, the Company determined that such deferred tax assets are not more-likely-than-not realizable, thus a full valuation allowance has been established.
The Company recognizes benefits associated with an uncertain tax position in its financial statements on the basis of a two-step process whereby (1) the Company determines, based on the technical merits of the position, it is more-likely-than-not that the tax position will be sustainable upon audit and (2) those tax positions that meet the more-likely-than-not threshold are recognized at the largest amount of tax benefit that is greater than 50 percent likely to be realized upon ultimate settlement with the related tax authority. This involves the identification of potential uncertain tax positions and the evaluation of tax law and an assessment of whether a liability for each uncertain tax position is necessary. When applicable, the Company records interest expense and penalties on uncertain tax positions as part of income tax expense. There are no uncertain tax positions as of December 31, 2014 and 2013.
The Company files income tax returns in the U.S. federal jurisdiction and various states and foreign jurisdictions.
At December 31, 2014, the Company had federal net operating loss carryforwards of $7.6 million and state net operating loss carryforwards of $3.7 million. The federal and state net operating loss carryforwards are subject to limitations of the Internal Revenue Code and applicable state tax law. If not utilized, a portion of the federal and state net operating loss carryforwards will begin to expire in 2027.
As of December 31, 2014 and December 31, 2013, there are no ongoing federal, state or local examinations.
Stock-based Compensation
The fair value of each option granted from various stock option and grant plans was estimated on the date of grant using the Black-Scholes option pricing model. Using this model, fair value is calculated based on assumptions with respect to (1) expected volatility, (2) the expected term of the award, which for options is the period of time over which employees and directors are expected to hold their options prior to exercise, (3) expected dividend yield, (4) a risk-free interest rate and (5) estimated fair value of the underlying equity instrument.
In determining the fair value of stock-based awards, the Company used the average volatility of similar publicly traded companies to determine the expected volatility. The expected term of options has been determined using the simplified method which uses the midpoint between the vesting date and the end of the contractual term. The simplified method has been used since the Company does not have sufficient historical exercise data to provide a reasonable basis upon which to estimate expected term due to a limited period of the Company’s life.
The expected term of options for the years ended December 31, 2014, 2013 and 2012 was 6.25 years. The expected dividend yield is zero as the Company has never paid dividends and does not currently anticipate paying any in the foreseeable future. The risk-free interest rate for periods within the expected life of an award, as applicable, is based on quoted U.S. Treasury rates for securities with maturities approximating the expected term.
F-13
These assumptions represent our best estimates, based on management’s judgment and subjective future expectations. These estimates involve inherent uncertainties. If any of the assumptions used in the model change significantly, stock-based compensation recorded for future awards may differ materially from that recorded for awards granted previously.
Once the Company has determined the estimated fair value of stock-based awards, the Company recognizes the portion of that value that is ultimately expected to vest, taking estimated forfeitures into account. This amount is recognized as an expense over the vesting period of the award using the accelerated method based on the multiple-option award approach. The Company estimates forfeitures based upon historical experience and, at each period, review the estimated forfeiture rate and make changes as factors affecting the forfeiture rate calculations and assumptions change. If our actual forfeiture rate is materially less than the estimate, our stock-based compensation expense could be significantly misstated from what we have recorded in the current period and we may be required to adjust the expense.
Warrants
Warrants that are exercisable into the Company’s convertible preferred stock are treated as liabilities and are marked to fair value at each balance sheet date. The fair value of each warrant issued by the Company was determined by using the Black-Scholes option pricing model. The corresponding warrant liability is recorded within current liabilities as the warrants are fully vested. The fair value of the warrant liability is $0 and $2.7 million as of December 31, 2014 and 2013, respectively. The change in the liability for the warrants is reflected in the consolidated statements of operations.
Warrants that are exercisable into the Company’s common stock have been classified in additional paid-in capital within stockholders’ equity (deficit).
Treasury Stock
Treasury stock is presented as a reduction of stockholders’ deficit at the amount paid by the Company to repurchase common stock.
Net income (loss) Per Share
Basic net income (loss) per share is computed by dividing the net income (loss) by the weighted average number of common shares outstanding for the period. Diluted net income (loss) is computed by adjusting net income (loss) to reallocate undistributed earnings based on the potential impact of dilutive securities, including outstanding common stock options, convertible preferred stock and warrants to purchase common stock and convertible preferred stock. Diluted net income (loss) per share is computed by dividing the diluted net income (loss) by the weighted average number of common shares, including potential dilutive common shares assuming the dilutive effect of outstanding common stock options, convertible preferred stock and warrants to purchase common stock and convertible preferred stock. For periods in which the Company has reported net losses, diluted net loss per common share is the same as basic net loss per common share, since dilutive common shares are not assumed to have been issued if their effect is anti-dilutive. Diluted net loss per common share is the same as basic net loss per common share for the years ended December 31, 2014, 2013 and 2012.
Segment Data
The Company identifies operating segments as components of an entity for which discrete financial information is available and is regularly reviewed by the chief operating decision maker, or decision-making group, in making decisions regarding resource allocation and performance assessment. The Company defines the term “chief operating decision maker” to be its chief executive officer. The Company has determined it operates in one operating segment and one reportable segment, international cross-border ecommerce, as its chief operating decision maker reviews financial information presented on only a consolidated basis for purposes of allocating resources and evaluating financial performance.
F-14
Investments
The Company’s investments in marketable securities are recorded at fair value, with any unrealized gains and losses, reported as a component of stockholders’ equity until realized. The Company’s investments are classified as available-for-sale securities as they represent investments available for current operations and may be sold prior to their stated maturities for strategic or operational reasons.
Comprehensive Loss
Accumulated other comprehensive loss, included as a component of shareholders' equity (deficit), consists of unrealized gains and losses affecting equity that, under GAAP, are excluded from net loss. For the Company, accumulated other comprehensive loss is impacted by unrealized losses on available-for-sale securities as of the reporting period date and by reclassification adjustments resulting from sales or maturities of available-for-sale securities. Amounts reclassified for previously unrealized gains or losses on available-for-sale securities are included in interest and other income, net, on the consolidated statements of operations. There were $19 thousand of unrealized losses and no amounts reclassified to the consolidated statements of operations for the year ended December 31, 2014. There were no unrealized losses and no amounts reclassified to the consolidated statements of operations for the year ended December 31, 2013.
Initial Public Offering
In March 2014, the Company closed its initial public offering, or IPO, of 5,750,000 shares of common stock, which included 750,000 shares sold pursuant to the underwriters' option to purchase additional shares, at an offering price of $16.00 per share. All outstanding shares of the Company's convertible preferred stock converted to 20,872,628 shares of common stock at the closing of the IPO. The Company's shares are traded on NASDAQ under the symbol "BRDR". The Company received proceeds from the IPO of $85.6 million, net of underwriting discounts and commissions, but before offering expenses of $3.2 million. Offering expenses at December 31, 2013 of $1.8 million were recorded as current assets. These offering expenses, and additional expenses incurred from January 2014 through the closing of the IPO of approximately $1.4 million, have been reclassified as additional paid-in capital.
Reverse Stock Split
In March 2014, the Company’s board of directors and stockholders approved an amendment to the Company's then-current Certificate of Incorporation (the "Prior Charter"), which effected a 1-for-1.67 reverse stock split of the Company’s common stock. The reverse stock split became effective upon filing the amendment to the Prior Charter on March 10, 2014. Upon the effectiveness of the reverse stock split, (i) every 1.67 shares of outstanding common stock was decreased to one share of common stock, (ii) the number of shares of common stock into which each outstanding warrant or option to purchase common stock is exercisable was proportionally decreased, (iii) the exercise price of each outstanding warrant or option to purchase common stock was proportionately increased, and (iv) the conversion ratio for each share of preferred stock outstanding was proportionately reduced. Unless otherwise indicated, all of the share numbers, share prices and exercise prices in these financial statements have been adjusted, on a retroactive basis, to reflect this 1-for-1.67 reverse stock split.
F-15
Recently Issued Accounting Pronouncements
Under the Jumpstart Our Business Startups Act ("JOBS Act"), the Company meets the definition of an emerging growth company. The Company has irrevocably elected to opt out of the extended transition period for complying with new or revised accounting standards pursuant to Section 107(b) of the JOBS Act.
In April 2014, the FASB issued accounting guidance which changes the criteria for determining which disposal transactions can be presented as discontinued operations and modifies related disclosure requirements. Under the new guidance, a discontinued operation is defined as a disposal of a component or group of components that is disposed of or is classified as held for sale and represents a strategic shift that has (or will have) a major effect on an entity’s operations and financial results. The guidance states that a strategic shift could include a disposal of (i) a major geographical area of operations, (ii) a major line of business, (iii) a major equity method investment, or (iv) other major parts of an entity. Although major is not defined, the guidance provides examples of when a disposal qualifies as a discontinued operation. A business activity that upon acquisition qualifies as held for sale will also be a discontinued operation. The guidance no longer precludes presentation as a discontinued operation if (i) there are operations and cash flows of the component that have not been eliminated from the reporting entity’s ongoing operations, or (ii) there is significant continuing involvement with a component after its disposal. The guidance also introduces new disclosure requirements. The new accounting rules will be effective for the Company on January 1, 2015 and are not expected to have a material effect on the Company’s financial condition or results of operations unless there is a future disposal transaction within the scope of the guidance.
In May 2014, the FASB issued accounting guidance which stipulates that an entity should recognize revenue to depict the transfer of promised goods or services to customers in an amount that reflects the consideration to which the entity expects to be entitled in exchange for those goods or services. To achieve this core principle, an entity should apply the following steps: (i) identify the contract(s) with a customer; (ii) identify the performance obligations in the contract; (iii) determine the transaction price; (iv) allocate the transaction price to the performance obligations in the contract; and (v) recognize revenue when (or as) the entity satisfies a performance obligation. The new accounting rules will be effective for the Company on January 1, 2017. The Company is currently assessing the impact that this standard will have on its consolidated financial statements.
In August 2014, the FASB issued guidance on disclosure of uncertainties about an entity’s ability to continue as a going concern. This guidance addresses management’s responsibility in evaluating whether there is substantial doubt about a company’s ability to continue as a going concern and to provide related footnote disclosures. Management’s evaluation should be based on relevant conditions and events that are known and reasonably knowable at the date that the financial statements are issued. The guidance is effective for fiscal years ending after December 15, 2016 and for interim periods within those fiscal years, with early adoption permitted. The Company will adopt this guidance on January 1, 2015, and it believes the adoption of this guidance will not have a material impact on the consolidated financial statements.
The Company has implemented all new accounting pronouncements that are in effect and that may impact its consolidated financial statements and does not believe that there are any other new accounting pronouncements that have been issued that might have a material impact on its financial position or results of operations.
F-16
Note 2—Acquisitions
Bundle Tech Limited Acquisition
On January 26, 2015, the Company acquired 100% of the equity of Bundle Tech, the operator of DutyCalculator, a provider of cloud-based global trade and customs compliance data services, for total cash consideration of $22.0 million. The Company is evaluating the purchase price allocation related to the fair value of certain assets and liabilities associated with the acquisition. The final determination of these fair values will be completed as soon as possible but no later than one year from the acquisition date.
During the year ended December 31, 2014, $0.4 million of acquisition-related costs were incurred related to the Bundle Tech acquisition, which is included in the Company’ general and administrative expenses. No such expenses were incurred during the year ended December 31, 2013.
Canada Post Acquisition
On March 1, 2012, the Company acquired certain assets of CPBF for $2.0 million in cash. The transaction has been accounted for as a purchase of a business. The acquisition of CPBF expanded the Company’s customer base and resulting sales volumes, and further optimized the Company’s fulfillment process by leveraging the infrastructure, service levels and cost structure of Canada Post’s logistics model. The acquired assets, after adjustments to reflect fair market values assigned to assets purchased from CPBF, have been included in the Company’s consolidated financial statements from the date of acquisition. CPBF had revenue of approximately $5.9 million for the year ended December 31, 2012. Pro forma information has not been provided, as the impact to prior periods is immaterial.
The following table summarizes the fair values of the assets acquired as of the date of the acquisition and the amounts assigned to goodwill and intangible asset classifications (in thousands):
Property and equipment | $ | 65 | |
Goodwill | 265 | ||
Amortizable intangible assets | 1,670 | ||
Total assets acquired | $ | 2,000 | |
The amounts assigned to goodwill and major intangible asset classifications, all of which are tax deductible, for the CPBF acquisition are as follows (in thousands):
Amortization Period (Years) | |||||
Goodwill | $ | 265 | N/A | ||
Customer relationships | 1,180 | 8.0 | |||
Technology | 490 | 1.0 | |||
$ | 1,935 | ||||
Goodwill recorded in connection with the acquisition was primarily attributable to the acquired workforce and the synergies expected to arise when the business is combined with the Company’s operations.
F-17
Note 3—Cash Equivalents and Investments
At December 31, 2014 the Company held $37.5 million of cash equivalents in money market funds whose carrying value approximates fair value. The Company did not hold any money market funds as of December 31, 2013.
The Company's investments consist of marketable debt securities that are classified as available-for-sale and presented as "investments," a component of current assets on the consolidated balance sheets. The Company's available-for-sale securities represent investments available for current operations and may be sold prior to their stated maturities for strategic or operational reasons. The available-for-sale debt securities are carried at fair value, with the unrealized gains and losses reported in "Accumulated other comprehensive loss." The amortized cost of the available-for-sale debt securities is adjusted for amortization of premiums and accretion of discounts to maturity computed under the effective interest method.
A summary of the Company’s available-for-sale investments at December 31, 2014 is as follows (in thousands):
Amortized Cost | Unrealized Gains | Unrealized Losses | Fair Value | ||||||||||||
Investments: | |||||||||||||||
Corporate bonds | $ | 23,578 | $ | 2 | $ | (23 | ) | $ | 23,557 | ||||||
U.S. government and agency securities | 2,997 | 2 | — | 2,999 | |||||||||||
Commercial paper | 999 | — | — | 999 | |||||||||||
$ | 27,574 | $ | 4 | $ | (23 | ) | $ | 27,555 | |||||||
The Company did not hold any available-for-sale investments at December 31, 2013.
Realized gains and losses are included in interest and other income, net, on the consolidated statements of operations. The cost of securities sold is based on the specific identification method. There were no realized gains and losses on the available-for-sale investments for the year ended December 31, 2014. Interest and dividends earned on available-for-sale securities are also included in interest and other income, net, on the consolidated statements of operations.
When the Company determines that an other-than-temporary decline has occurred for debt securities that the Company does not then intend to sell, the Company recognizes the credit loss component of an other-than-temporary impairment in interest and other income, net, and the remaining portion in other comprehensive income. The credit loss component is identified as the amount of the present value of cash flows not expected to be received over the remaining term of the security, based on cash flow projections. In determining whether an other-than-temporary impairment exists, the Company considers: (i) the length of time and the extent to which the fair value has been less than cost; (ii) the financial condition and near-term prospects of the issuer of the securities; and (iii) the Company’s intent and ability to retain the security for a period of time sufficient to allow for any anticipated recovery in fair value. The Company considered the declines in market value of its marketable available-for-sale securities investment portfolio to be temporary in nature and did not consider any of its investments other-than-temporarily impaired as of December 31, 2014. Contractual maturities for the Company's available-for-sale securities are within two years of December 31, 2014.
F-18
Note 4—Fair Value of Financial Instruments
The carrying amounts of the Company’s financial instruments, including cash, cash equivalents, trade receivables and payables, and credit facility, approximate fair value, due to their short maturities or the fact that the interest rate of the revolving credit facility is based upon current market rates. The receivable from the sale of the Global Settlement Services business was initially recorded based on estimated fair value and management does not believe that changes to the underlying assumptions used since August 2011 would result in a material change to fair value on the remaining balance as of the balance sheet dates.
The fair value framework under the FASB guidance requires the categorization of assets and liabilities into three levels based upon the assumptions used to measure the assets or liabilities. Level 1 provides the most reliable measure of fair value, whereas Level 3, if applicable, generally would require significant management judgment. The three levels for categorizing assets and liabilities under the fair value measurement requirements are as follows:
• | Level 1: Fair value measurement of the asset or liability using observable inputs such as quoted prices in active markets for identical assets or liabilities; |
• | Level 2: Fair value measurement of the asset or liability using inputs other than quoted prices that are observable for the applicable asset or liability, either directly or indirectly, such as quoted prices for similar (as opposed to identical) assets or liabilities in active markets and quoted prices for identical or similar assets or liabilities in markets that are not active; and |
• | Level 3: Fair value measurement of the asset or liability using unobservable inputs that reflect the Company's own assumptions regarding the applicable asset or liability. |
During the year ended December 31, 2014 and the year ending December 31, 2013 there were no transfers between the assets and liabilities categorized as Level 1, Level 2 and Level 3.
The following table summarizes those assets and liabilities measured at fair value on a recurring basis as of (in thousands):
December 31, 2014 | |||||||||||||||
Total | Level 1 | Level 2 | Level 3 | ||||||||||||
Cash Equivalents: | |||||||||||||||
Money market funds | $ | 37,481 | $ | 37,481 | $ | — | $ | — | |||||||
Assets: | |||||||||||||||
Investments | $ | 27,555 | $ | — | $ | 27,555 | $ | — | |||||||
December 31, 2013 | |||||||||||||||
Total | Level 1 | Level 2 | Level 3 | ||||||||||||
Liabilities: | |||||||||||||||
Warrant liabilities | $ | 2,663 | $ | — | $ | — | $ | 2,663 | |||||||
When developing fair value estimates, the Company maximizes the use of observable inputs and minimizes the use of unobservable inputs. When available, the Company uses quoted market prices to measure fair value. If market prices are not available, the fair value measurement is based on models that use primarily market based parameters including yield curves, volatilities, credit ratings and currency rates. In certain cases where market rate assumptions are not available, the Company is required to make judgments about assumptions market participants would use to estimate the fair value of a financial instrument.
F-19
The following table reflects the activity for the Company’s classes of liabilities measured at fair value using Level 3 inputs (in thousands):
Years Ended December 31, | |||||||
2014 | 2013 | ||||||
Balance at January 1, | $ | 2,663 | $ | 1,167 | |||
Loss on change in fair value of warrants | 964 | 1,496 | |||||
Reclassification of warrant liability to equity | (3,627 | ) | — | ||||
Balance as of December 31, | $ | — | $ | 2,663 | |||
The Company used a methodology for estimating the fair value of the warrant liabilities based on an allocation of the total equity fair value to the various classes of securities in the Company’s equity structure. This method provided an estimate of fair value based upon the equity holders’ respective share of the value of a series of call options on the equity. The value of the call option was determined using the Black Scholes option pricing model, based on the fair value of the underlying equity and other assumptions. These included expected volatility of 37.5%, a risk free interest rate of 0.4%, time to maturity based upon an expected future liquidity event of one year and no expected dividend yield. The fair value of the warrant liability was $3.6 million upon the closing of the IPO and was reclassified as a component of additional paid-in capital.
The Company’s non-financial assets, such as goodwill, intangible assets and property and equipment, are initially measured at fair value. In the event there is an indicator of impairment, such asset's carrying value is adjusted to current fair value only when an impairment charge is recognized. Such impairment charges incorporate fair value measurements based on Level 3 inputs.
Note 5—Trade Receivables
Trade receivables, net of allowances of $40 thousand and $71 thousand at December 31, 2014 and December 31, 2013, respectively, consisted of the following (in thousands):
At December 31, | |||||||
2014 | 2013 | ||||||
Credit Cards | $ | 6,603 | $ | 5,727 | |||
Merchants and other | 11,428 | 8,058 | |||||
$ | 18,031 | $ | 13,785 | ||||
Note 6—Prepaid expenses and other
Prepaid expenses and other consisted of the following (in thousands):
At December 31, | |||||||
2014 | 2013 | ||||||
Prepaid expenses | $ | 2,583 | $ | 2,388 | |||
Other | 524 | 668 | |||||
$ | 3,107 | $ | 3,056 | ||||
F-20
Note 7—Property and Equipment
Property and equipment consisted of the following (in thousands):
At December 31, | |||||||
2014 | 2013 | ||||||
Computer and peripheral equipment | $ | 7,197 | $ | 5,097 | |||
Internal use software | 9,287 | 5,325 | |||||
Furniture and office equipment | 1,195 | 1,040 | |||||
Leasehold improvement | 603 | 556 | |||||
Total property and equipment | 18,282 | 12,018 | |||||
Less: Accumulated depreciation and amortization | (7,972 | ) | (4,351 | ) | |||
Property and equipment, net | $ | 10,310 | $ | 7,667 | |||
Depreciation expense, which includes amortization of assets under capital leases and software development costs, for the year ended December 31, 2014, 2013, and 2012 was $3.6 million, $1.8 million, and $0.8 million respectively. Amortization expense of software development costs for the year ended December 31, 2014, 2013 and 2012 was $2.1 million, $0.7 million, and $0.1 million respectively.
No event or indicator of impairment occurred during the year ended December 31, 2014, which would require impairment testing of property and equipment.
F-21
Note 8—Goodwill and Intangibles
The gross carrying amount of goodwill as of December 31, 2014 and December 31, 2013 is $0.3 million.
The following table provides the gross carrying amount, accumulated amortization and net carrying amount for each major class of long-lived amortizable intangible assets (in thousands):
At December 31, | ||||||||||||||||||||||||
2014 | 2013 | |||||||||||||||||||||||
Average Life (years) | Gross Carrying Amount | Accumulated Amortization | Net Carrying Amount | Gross Carrying Amount | Accumulated Amortization | Net Carrying Amount | ||||||||||||||||||
Patents | 10 | $ | 752 | $ | (443 | ) | $ | 309 | $ | 752 | $ | (338 | ) | $ | 414 | |||||||||
Customer relationships | 8 | 1,261 | (613 | ) | 648 | 1,261 | (413 | ) | 848 | |||||||||||||||
Technology | 1 | 490 | (490 | ) | — | 490 | (490 | ) | — | |||||||||||||||
$ | 2,503 | $ | (1,546 | ) | $ | 957 | $ | 2,503 | $ | (1,241 | ) | $ | 1,262 | |||||||||||
Amortization expense corresponding to the long-lived amortizable intangible assets for the year ended December 31, 2014, 2013, and 2012 was $0.3 million, $0.5 million, and $0.6 million, respectively.
The estimated aggregate amortization expense for each of the next five years and thereafter will approximate $0.3 million in 2015,$0.2 million in 2016, $0.2 million in 2017, $0.1 million in 2018, and $0.1 million thereafter.
No event or indicator of impairment occurred during the year ended December 31, 2014, which would require impairment testing of long-lived intangible assets including goodwill.
Note 9—Accrued Expenses and Other
Accrued expenses and other consisted of the following (in thousands):
At December 31, | |||||||
2014 | 2013 | ||||||
Fulfillment, duty and VAT costs | $ | 3,716 | $ | 3,573 | |||
Compensation | 3,063 | 2,873 | |||||
Warrant liability | — | 2,663 | |||||
Other | 4,388 | 3,177 | |||||
$ | 11,167 | $ | 12,286 | ||||
F-22
Note 10—Long Term Debt and Revolving Credit Facility
Long term debt is summarized as follows (in thousands):
At December 31, | |||||||
2014 | 2013 | ||||||
Lease commitments | $ | 14 | $ | 46 | |||
Current maturities of lease commitment | (14 | ) | (32 | ) | |||
Long term debt | $ | — | $ | 14 | |||
On April 18, 2013, the Company entered into an amended and restated loan and security agreement (the "Credit Facility") with Silicon Valley Bank ("SVB"). Pursuant to the Credit Facility the Company can incur revolver borrowings up to the lesser of $12.0 million or a borrowing base equal to 80% of eligible merchant receivables plus 75% of eligible credit card receivables. The Company has an additional $6.0 million of non-formula based availability during the fourth quarter retail holiday season. The Credit Facility also provides for letters of credit. Interest accrues at a floating rate equal to SVB’s prime rate plus 1.0% and is payable monthly.
On October 29, 2013, the Company and SVB modified the terms of the Credit Facility to adjust the financial covenant requirements for future quarters to levels that are aligned with the Company’s operating and financial targets. Financial covenants include maintenance of an adjusted quick ratio, defined as the ratio of current assets to current liabilities, inclusive of outstanding letters of credit and minus the current portion of deferred revenue, of at least 1.20 to 1.00 and a minimum net income. As of December 31, 2014, the Company was in compliance with the terms and covenants of the Credit Facility. There were no revolver borrowings during 2014 and there were $1.6 million letters of credit outstanding as of December 31, 2014.
On July 24, 2014, the Company entered into a Second Amended and Restated Loan and Security Agreement (the "Amended Agreement") with SVB. Pursuant to the Amended Agreement, the Credit Facility is extended for two years through July 24, 2016 and will bear interest at a floating rate equal to the Wall Street Journal Prime Rate. Borrowings under the Amended Agreement are subject to financial reporting obligations including minimum profitability/maximum loss parameters. Except for the Company's intellectual property, obligations of the Company under the Credit Facility are secured by a first priority lien on substantially all assets of the Company.
Note 11—Commitments and Contingencies
The Company leases all of its office space under non-cancellable operating lease agreements. These leases generally have initial periods of three to seven years and contain provisions for renewal options, sublease and payment of real estate taxes and common area charges. The Company also leases vehicles and certain furniture and equipment. Rent expense for all operating leases, net of sublease income, for the years ended December 31, 2014, 2013 and 2012, was $1.4 million, $0.9 million, and $1.0 million, respectively.
Aggregate future minimum lease payments for operating leases at December 31, 2014 are $1.9 million in 2015, $2.2 million in 2016, $2.3 million in 2017, $2.3 million in 2018, $2.3 million in 2019 and $14.8 million thereafter.
During 2012, the Company entered into a sublease related to a certain operating lease. The Company recognized sublease income of $0.3 million and $0.3 million in 2014 and 2013, respectively. Future minimum lease payments for operating leases of $25.9 million have been reduced by minimum sublease rental income of approximately $0.2 million.
F-23
Capital lease obligations are as follows (in thousands):
At December 31, | |||||||
2014 | 2013 | ||||||
Gross capital lease obligations | $ | 14 | $ | 49 | |||
Less: imputed interest | — | (3 | ) | ||||
Present value of net minimum lease payments | 14 | 46 | |||||
Less: current portion of capital lease obligation | (14 | ) | (32 | ) | |||
Total long term capital lease obligations | $ | — | $ | 14 | |||
Minimum payments under the current capital lease for the next five years are as follows: $14 thousand in 2015, and $0 thereafter. The capitalized lease carries interest rate of 0.83% and matures in 2015.
The Company is subject to various claims, charges, disputes and litigation that have arisen in the ordinary course of business. Although there can be no assurance in this regard, the Company does not believe these other matters will have a material adverse effect on the Company’s results of operations, cash flows or its financial condition.
F-24
Note 12—Common Stock, Preferred Stock and Stock Plans
Holders of common stock are entitled to one vote per share. Holders of common stock are not entitled to receive dividends unless declared by the board of directors. The voting, dividend and liquidation rights of the holders of common stock are subject to and qualified by the rights and preferences of the holders of Preferred Stock. No dividends have been declared through December 31, 2014. The common stock has a $0.01 par value.
Common stock consisted of the following shares:
At December 31, | ||||||||||||||||||
2014 | 2013 | |||||||||||||||||
Authorized | Issued | Outstanding | Authorized | Issued | Outstanding | |||||||||||||
Common Stock | 200,000,000 | 32,187,236 | 31,947,716 | 49,500,000 | 4,843,612 | 4,604,092 | ||||||||||||
Option Plans
In March 2014, the board of directors adopted the 2014 Stock Option and Incentive Plan (the "2014 Plan") which was subsequently approved by the Company's stockholders. The 2014 Plan became effective upon the closing of the IPO. The 2014 Plan will replace the Company's 2011 Stock Option and Grant Plan (the "2011 Plan") as the board of directors has determined not to make additional awards under the 2011 Plan following the closing of the IPO. The Company initially reserved 1,920,000 shares of common stock for the issuance of awards under the 2014 Plan. This number is subject to adjustment in the event of a stock split, stock dividend or other change in the Company's capitalization.
The Company's board of directors has the authority, without further action by the stockholders, to designate and issue up to 25,000,000 shares of preferred stock in one or more series. The board of directors may also designate the rights, preferences and privileges of the holders of each such series of preferred stock, any or all of which may be greater than or senior to those granted to the holders of common stock. Though the actual effect of any such issuance on the rights of the holders of common stock will not be known until such time as the Company's board of directors determines the specific rights of the holders of preferred stock, of which the potential effects of such an issuance include diluting the voting power of the holders of common stock, reducing the likelihood that holders of common stock will receive dividend payments and reducing the likelihood that holders of common stock will receive payments in the event of the Company's liquidation, dissolution, or winding up, and delaying, deterring or preventing a change-in-control or other corporate takeover.
The Company’s 2011 Plan was approved by the board of directors and the Company’s stockholders on October 31, 2011 and was most recently amended in June 2013. The Company has reserved an aggregate of 7,610,968 shares of common stock for the issuance of options and other equity awards under the 2011 Plan. This number is subject to adjustment in the event of a stock split, stock dividend or other change in the Company’s capitalization. Effective upon the closing of the anticipated initial public offering, the board of directors has determined not to grant any further awards under the 2011 Plan.
The Company’s U.S. Share Option Plan (the “U.S. Plan”) was approved by the board of directors in August 2001 and was subsequently approved by the Company’s stockholders. The U.S. Plan was most recently amended in December 2010. The Company has reserved an aggregate of 4,758,041 shares of common stock for the issuance of options under the U.S. Plan. This number is subject to adjustment in the event of a stock split, stock dividend or other change in the Company’s capitalization. The Company has not made any grants under the U.S. Plan since the adoption of the 2011 Plan and the Company does not plan to make any further awards under the U.S. Plan.
The U.S. Plan permits the Company to make grants of incentive stock options and non-qualified stock options to the Company’s employees, directors, consultants and contractors. The shares underlying options granted under the U.S. Plan that terminate, expire or otherwise cease to exist are added to the shares of common stock available for issuance under the U.S. Plan.
F-25
The Company’s Israeli Share Option Plan (the “Israeli Plan”) was approved by the board of directors in September 2001. The Israeli Plan was most recently amended in July 2006. The Company has reserved an aggregate of 1,856,287 shares of common stock for the issuance of options and other equity awards under the Israeli Plan. This number is subject to adjustment in the event of a stock split, stock dividend or other change in the Company’s capitalization. The Company has not made any grants under the Israeli Plan since it terminated in July 2011 and does not plan to make any further awards under the Israeli Plan.
Common Stock Warrants
On March 29, 2002, the Company issued to Paymentech L.P. warrants to purchase 78,086 shares of the Company’s common stock at a purchase price of $1.22 per share. The vesting and the ability to exercise these warrants was contingent upon performance based criteria which Paymentech L.P. did not meet. Accordingly the Company has not recognized any warrant expense or liability as of December 31, 2011 and 2012 related to these warrants. These warrants expired on March 29, 2012.
On April 1, 2004, the Company issued to American Friend of Tmura, Inc. as a donation, a warrant to purchase up to aggregate 32,076 shares of the Company’s common stock, at a purchase price of par value per share. This warrant was exercisable upon the closing of a Sale Event, as defined in the warrant, or the closing of an initial public offering. This warrant shall expire on the earlier of the closing of a Sale Event or one year following the closing of an initial public offering. In June 2014, the warrant was exercised in full by means of a cashless exercise resulting in a net purchase of 32,041 shares.
Stock Options
In March 2014, the compensation committee of the Company's board of directors approved stock option grants covering a total of 445,176 shares to certain employees and directors. Of these awards, stock option grants covering 255,087 shares were issued to named executive officers, including the Company's chief executive officer.
In June 2014, the compensation committee of the Company's board of directors approved stock option grants covering a total of 48,521 shares to certain employees. Of these awards, stock options grants covering 39,521 shares were issued to a named executive officer.
In August 2014, the Company granted stock option grants covering a total of 139,300 shares to certain employees.
In December 2014, the Company granted stock option grants covering a total 77,700 shares to certain employees.
The fair value of the outstanding options granted during 2014, 2013 and 2012 was $5.3 million, $4.1 million and $0.9 million, respectively. Options granted under the Borderfree, Inc. 2011 Plan expire ten years after the date of grant and are granted at an exercise price of not less than 100% of the fair market value at the date of grant. Substantially all options currently outstanding vest over a period of four years. There have been no options granted with performance-based vesting.
The assumptions used to determine the fair value of stock options granted are as follows:
Years ended December 31, | ||||||||
2014 | 2013 | 2012 | ||||||
Dividend yield | — | % | — | % | — | % | ||
Expected volatility | 51.90% - 52.69% | 48.99 | % | 50.02 | % | |||
Risk-free interest rate | 1.7% - 2.0% | 1.4% - 1.8% | 0.9% - 1.2% | |||||
Expected term—in years | 6.25 | 6.25 | 6.25 | |||||
F-26
The following table contains additional information with respect to options outstanding and exercisable at December 31, 2014:
Options outstanding | Options exercisable | |||||||||||
Exercise price | Number of options outstanding | Remaining weighted average life | Number of options exercisable | Remaining weighted average life | ||||||||
$ | 0.28 | 1,100,560 | 3.78 | 1,100,560 | 3.78 | |||||||
0.38 | 152,266 | 6.30 | 107,344 | 5.98 | ||||||||
0.50 | 26,787 | 4.53 | 26,787 | 4.53 | ||||||||
2.17 | 313,972 | 7.75 | 190,447 | 7.75 | ||||||||
6.71 | 572,539 | 8.44 | 247,480 | 8.44 | ||||||||
8.29 | 147,360 | 8.74 | 46,050 | 8.74 | ||||||||
9.80 | 77,700 | 9.92 | — | 0 | ||||||||
10.50 | 248,848 | 8.93 | 71,166 | 8.93 | ||||||||
13.13 | 121,900 | 9.58 | — | 0 | ||||||||
15.02 | 48,521 | 9.42 | 7,014 | 9.42 | ||||||||
16.00 | 440,676 | 9.22 | 83,833 | 9.22 | ||||||||
3,251,129 | 1,880,681 | |||||||||||
The following table summarizes employee non-vested stock option activity for the year ended December 31, 2014:
Number of options | Weighted average grant date fair value | |||||
Non-vested options outstanding at January 1, 2014 | 1,426,026 | $ | 2.94 | |||
Granted | 710,697 | 7.67 | ||||
Vested | (611,881 | ) | 3.55 | |||
Forfeited | (154,394 | ) | 3.26 | |||
Non-vested options outstanding at December 31, 2014 | 1,370,448 | $ | 5.09 | |||
At December 31, 2014, there was $4.2 million of total unrecognized compensation cost related to non-vested stock options, net of estimated forfeitures, which is expected to be recognized over a weighted average period of 3.08 years.
Stock-based compensation expense for the Company’s stock options under the equity incentive plan included in the consolidated statements of operations is as follows (in thousands):
Years Ended December 31, | |||||||||||
2014 | 2013 | 2012 | |||||||||
Cost of revenue | $ | 23 | $ | 8 | $ | — | |||||
Technology and operations | 557 | 210 | 60 | ||||||||
Research and development | 613 | 350 | 55 | ||||||||
Sales and marketing | 1,262 | 469 | 101 | ||||||||
General and administrative | 1,612 | 370 | 107 | ||||||||
Total stock-based compensation expense | $ | 4,067 | $ | 1,407 | $ | 323 | |||||
F-27
A summary of the Company’s stock options as of December 31, 2014 and 2013, and changes during the year then ended are presented below:
Employees: | 2014 | 2013 | |||||||||||
Number of options | Weighted- average exercise price | Number of options | Weighted- average exercise price | ||||||||||
Outstanding at January 1, | 3,192,351 | $ | 3.13 | 3,079,217 | $ | 0.78 | |||||||
Changes during the year: | |||||||||||||
Granted | 710,697 | 14.69 | 1,131,793 | 7.85 | |||||||||
Exercised | (485,808 | ) | 0.90 | (644,254 | ) | 0.58 | |||||||
Expired / Forfeited | (166,111 | ) | 6.47 | (374,405 | ) | 2.64 | |||||||
Outstanding at December 31, | 3,251,129 | 5.81 | 3,192,351 | 3.13 | |||||||||
Options exercisable at December 31, | 1,880,681 | $ | 2.66 | 1,766,325 | $ | 0.78 | |||||||
The weighted average remaining contractual life at December 31, 2014, 2013 and 2012 for options outstanding was approximately 6.91 years, 7.00 years and 6.34 years respectively. The weighted average remaining contractual life at December 31, 2014, 2013 and 2012 for options exercisable was approximately 5.51 years, 5.24 years and 4.61 years , respectively.
At December 31, 2014, the aggregate intrinsic values of stock options outstanding and exercisable for employees were $29.1 million and $16.9 million, respectively. At December 31, 2013, the aggregate intrinsic values of stock options outstanding and exercisable for employees were $34.5 million and $23.3 million, respectively. At December 31, 2012, the aggregate intrinsic values of stock options outstanding and exercisable for employees were $14.2 million and $9.4 million, respectively.
There were no stock options outstanding or exercisable related to non-employees during the years ended December 31, 2014 and 2013.
The intrinsic value for stock options is calculated based on the exercise price of the underlying awards and the calculated fair value of such awards as of each respective period-end date. The total intrinsic value of options exercised by employees approximated $0.4 million, $0.4 million and $0.6 million for the years ended December 31, 2014, 2013 and 2012, respectively.
Prior to December 2002, we issued 969,161 shares of our common stock, 815,095 options for common stock and 2,413,006 shares of our Series B preferred stock prior to receiving all of the required corporate approvals. Of the 815,095 options for common stock, 185,745 were exercised prior to January 1, 2011 and 118,500 were outstanding as of January 1, 2011. An additional 15,037 and 68,840 were exercised and cancelled during 2011 and 20,359 were cancelled during 2012. The remaining 18,263 outstanding options as of December 31, 2012 were exercised in February of 2013. In order to resolve any uncertainty regarding the validity of these shares, during 2013 stockholders holding these shares have exchanged them for an equivalent number of identical shares of our common stock and Series B preferred stock, as applicable. The holders of these shares have the same rights and preferences as the corresponding shares described in this note, and had the Company been aware of this matter would have had the ability to remediate these matters, but was previously unaware of the uncertainty. The Company has at all times treated these shares as issued and outstanding. All of these issued and outstanding shares of common stock and all of these issued and outstanding shares of Series B Preferred Stock have been exchanged for an equivalent number of identical shares of our common stock and Series B preferred stock, as applicable.
F-28
Reverse Stock Split
In March 2014, the Company’s board of directors and stockholders approved an amendment to the Company's then-current Certificate of Incorporation (the "Prior Charter"), which effected a 1-for-1.67 reverse stock split of the Company’s common stock. The reverse stock split became effective upon filing the amendment to the Prior Charter on March 10, 2014. Upon the effectiveness of the reverse stock split, (i) every 1.67 shares of outstanding common stock was decreased to one share of common stock, (ii) the number of shares of common stock into which each outstanding warrant or option to purchase common stock is exercisable was proportionally decreased, (iii) the exercise price of each outstanding warrant or option to purchase common stock was proportionately increased, and (iv) the conversion ratio for each share of preferred stock outstanding was proportionately reduced. Unless otherwise indicated, all of the share numbers, share prices and exercise prices in these financial statements have been adjusted, on a retroactive basis, to reflect this 1-for-1.67 reverse stock split.
RSU Award
In connection with the Company's acquisition of Bundle Tech in January 2015, the Company made an inducement equity award to an employee of Bundle Tech. The inducement award covers an aggregate of 388,099 shares of common stock in the form of restricted stock units, or RSUs, and are being made as a material inducement to the employee entering into employment with Borderfree in connection with the acquisition transaction. This award is contingent compensation based on the employee's future service and is not considered to be part of the purchase price.
F-29
Note 13—Capitalization
On March 21, 2014, upon the closing of the IPO, all outstanding shares of convertible preferred stock were automatically converted into 20,872,628 shares of common stock.
The following table summarizes the number of shares of convertible preferred stock for the year ended December 31, 2014 (in thousands except share data):
Convertible Preferred Stock | |||||||||||||||||||||||||||||||||
Series A | Series B | Series C | Series D | Series E | |||||||||||||||||||||||||||||
Shares | Amount | Shares | Amount | Shares | Amount | Shares | Amount | Shares | Amount | Total | |||||||||||||||||||||||
Balance at December 31, 2013 | 1,999,438 | $ | 7,004 | 2,413,006 | $ | 2,573 | 14,089,918 | $ | 15,095 | 8,822,063 | $ | 4,859 | 2,942,978 | $ | 12,406 | $ | 41,937 | ||||||||||||||||
Conversion of convertible preferred stock to common stock | (1,999,438 | ) | (7,004 | ) | (2,413,006 | ) | (2,573 | ) | (14,089,918 | ) | (15,095 | ) | (8,822,063 | ) | (4,859 | ) | (2,942,978 | ) | (12,406 | ) | (41,937 | ) | |||||||||||
Balance at December 31, 2014 | — | $ | — | — | $ | — | — | $ | — | — | $ | — | — | $ | — | $ | — | ||||||||||||||||
Note 14—Warrants
On April 1, 2004, the Company issued to American Friends of Tmura, Inc. as a donation, a warrant to purchase up to aggregate 32,076 shares of the Company’s common stock, at a purchase price of $0.02 per share. This warrant was exercisable upon the closing of a Sale Event, as defined in the warrant, or the closing of an initial public offering. This warrant shall expire on the earlier of the closing of a Sale Event or one year following the close of the Company's IPO. On June 10, 2014, the warrant was exercised in full by means of a cashless exercise resulting in a net purchase of 32,041 shares.
On September 17, 2009, the Company issued to SVB a warrant to purchase up to aggregate 139,212 shares of the Company’s Series C Preferred Stock, which, at the closing of the IPO, automatically converted into a warrant to purchase 83,360 shares of common stock at a purchase price of $1.80 per share. On April 29, 2014, the warrant was exercised in full by means of a cashless exercise resulting in a net purchase of 73,406 shares.
On October 19, 2010, the Company issued to SVB a warrant to purchase up to aggregate 220,552 shares of the Company’s Series D Preferred Stock, which, at the closing of the IPO, automatically converted into a warrant to purchase 132,067 shares of common stock at a purchase price of $0.95 per share. On April 29, 2014, the warrant was exercised in full by means of a cashless exercise resulting in a net purchase of 123,772 shares.
On March 29, 2012, the Company issued to SVB a warrant to purchase up to aggregate 18,835 shares of the Company’s Series E Preferred Stock, which, at the closing of the IPO, automatically converted into a warrant to purchase 11,278 shares of common stock at a purchase price of $7.10 per share. On April 29, 2014, the warrant was exercised in full by means of a cashless exercise resulting in a net purchase of 5,969 shares.
The Company recorded a loss on change in fair value of warrants of $1.0 million and $1.5 million during the year ended December 31, 2014 and 2013, respectively. The fair value of the warrant liability was $3.6 million upon the closing of the IPO and was reclassified as a component of additional paid-in capital.
F-30
Note 15—Income Taxes
The components of U.S. and foreign income (loss) before income taxes were as follows (in thousands):
Years Ended December 31, | |||||||||||
2014 | 2013 | 2012 | |||||||||
United States | $ | (2,630 | ) | $ | (775 | ) | $ | 51 | |||
Foreign | (81 | ) | 455 | 449 | |||||||
Total | $ | (2,711 | ) | $ | (320 | ) | $ | 500 | |||
The provision for income taxes is as follows (in thousands):
Years Ended December 31, | |||||||||||
2014 | 2013 | 2012 | |||||||||
Current provision | |||||||||||
Federal | $ | 3 | $ | 53 | $ | 165 | |||||
State | 71 | 78 | 19 | ||||||||
Foreign | 371 | 203 | 124 | ||||||||
Total | 445 | 334 | 308 | ||||||||
Deferred provision | |||||||||||
Federal | — | — | — | ||||||||
State | — | — | — | ||||||||
Foreign | (48 | ) | — | — | |||||||
Total | — | — | — | ||||||||
Provision for income taxes | $ | 397 | $ | 334 | $ | 308 | |||||
The differences between the U.S. federal statutory income tax rate to the Company’s effective tax rate are as follows (in thousands):
Years Ended December 31, | |||||||||||
2014 | 2013 | 2012 | |||||||||
Income tax expense (benefit) at federal statutory rate | $ | (922 | ) | $ | (108 | ) | $ | 170 | |||
State and local income taxes, net of federal tax benefit | 45 | 61 | 12 | ||||||||
Nondeductible items | 27 | 30 | 11 | ||||||||
Stock-based compensation | 751 | 404 | 103 | ||||||||
Loss on change in fair value of warrants | 328 | 508 | 632 | ||||||||
Foreign rate differential | 351 | 49 | (28 | ) | |||||||
Prior year true-ups | 205 | 66 | (25 | ) | |||||||
Change in valuation allowance | (430 | ) | (600 | ) | (517 | ) | |||||
Other | 42 | (76 | ) | (50 | ) | ||||||
Provision for income taxes | $ | 397 | $ | 334 | $ | 308 | |||||
F-31
Net deferred tax assets (liabilities) consist of the following (in thousands):
At December 31, | |||||||
2014 | 2013 | ||||||
Deferred tax assets: | |||||||
Net operating loss carryforwards | $ | 2,449 | $ | 3,344 | |||
Accrued expenses and other | 1,147 | 521 | |||||
Credit carryforward | 214 | 211 | |||||
Total deferred tax assets | 3,810 | 4,076 | |||||
Less: Valuation allowance | (3,351 | ) | (3,897 | ) | |||
Deferred tax assets, net of valuation allowance | 459 | 179 | |||||
Deferred tax liabilities: | |||||||
Gain on sale of business | (269 | ) | (96 | ) | |||
Property and equipment | (27 | ) | (100 | ) | |||
Other | (115 | ) | 17 | ||||
Total deferred tax liabilities | (411 | ) | (179 | ) | |||
Net deferred tax assets | $ | 48 | $ | — | |||
A valuation allowance has been recognized at December 31, 2014, 2013 and 2012 to offset the deferred tax assets, as it has been determined that it is more likely than not that all of the deferred tax assets may not be realized. Management assesses the available positive and negative evidence to estimate if sufficient future taxable income will be generated to use the existing deferred tax assets. A significant piece of objective negative evidence evaluated was the cumulative loss incurred, after adjustments for non-recurring items, over the three-year period ended December 31, 2014. Such objective evidence limits the ability to consider other subjective evidence such as projections for future growth. On the basis of this evaluation, as of December 31, 2014, a valuation allowance of $3.4 million has been recorded. The Company intends to maintain the valuation allowance until sufficient positive evidence exists to support reversal of some or all of the valuation allowance.
At December 31, 2014, the Company had federal net operating loss carryforwards of $7.6 million and state net operating loss carryforwards of $3.7 million. The federal and state net operating loss carryforwards are subject to limitations of the Internal Revenue Code and applicable state tax law. If not utilized, a portion of the federal and state net operating loss carryforwards will begin to expire in 2027.
The Company evaluated all potential uncertain tax positions and identified no significant uncertain tax positions at December 31, 2014, 2013 and 2012. The Company’s total unrecognized tax benefits that, if recognized, would affect its effective tax rate were $0 as of December 31, 2014, 2013 and 2012. The Company has not accrued any interest or penalties as of December 31, 2011, 2012 and 2013. The Company expects that the amount of unrecognized tax benefits will not change within the next 12 months.
The Company’s policy with respect to undistributed foreign subsidiaries earnings is to consider those earnings to be indefinitely reinvested and, accordingly, no related provision for U.S. federal and state income taxes has been provided. Upon distribution of those earnings’ in the form of dividends or otherwise, the Company may be subject to both U.S. income taxes (subject to an adjustment for foreign tax credits) and withholding taxes in the various countries. As of December 31, 2014 and December 31, 2013, the undistributed earnings approximated $0.8 million and $1.0 million, respectively. The determination of the future tax consequences of the remittance of these earnings is not practicable.
The Company files income tax returns in the U.S. federal jurisdiction and various states and foreign jurisdictions. As of December 31, 2014, the Company’s federal income tax returns for the years ended 2010 through the current period and most state and foreign income tax returns for the years ended 2009 through the current period are still open to examination. In addition, all of the net operating losses and research and development credit carryforwards that may be utilized in future years are still subject to examination. The Company is not currently subject to U.S. federal, state and local, or non-U.S. income tax examinations by any tax authorities.
F-32
Note 16—Sale of Global Settlement Services Business
In March 2011, the Company entered into a definitive agreement with Cambridge Mercantile Corp. (“Cambridge”) to transfer its GSS business. The term of the agreement is indefinite, with certain termination rights, for cause and for convenience, for both parties.
The receivable from the sale of GSS is as follows (in thousands):
At December 31, | |||||||
2014 | 2013 | ||||||
Short term receivable from sale of business | $ | 629 | $ | 742 | |||
Receivable from sale of business - non-current | 77 | 476 | |||||
$ | 706 | $ | 1,218 | ||||
Note 17—Employee Benefit Plan
The Company is part of a multiple employer defined contribution plan (the “Plan”). Under the Plan, eligible employees may contribute 1% to 100% of their eligible compensation not to exceed the limit of elective deferrals as defined by the applicable regulations. The Plan provides for a discretionary match of an eligible employee’s compensation and is subject to a five year vesting schedule.
Effective January 1, 2013, the Company withdrew from the Plan and established the Borderfree, Inc. 401(k) Plan, formerly the FiftyOne, Inc. 401(k) Plan. Company contributions for the years ended December 31, 2014 and 2013 were $0.1 million, respectively. The Company did not make contributions for the year ended December 31, 2012.
F-33
Note 18—Related Parties
Notes receivable from stockholders include full recourse promissory notes issued in conjunction with the exercise of options by certain Company executives and a member of the board of directors. The notes bear interest rates at 1.17% and 1.19% compounded annually. Accrued interest and principal are due and payable upon the earlier of the termination of the employees, sale of the corresponding shares, the maturity of the notes or preceding the effective date of the Company’s filing of a registration statement under the Securities Act. The notes have a term of seven years. Company executives repaid $28 thousand of the notes receivable from stockholders in April 2013. On February 14, 2014, the Company forgave notes receivable from stockholders and related accrued interest totaling $0.4 million for certain Company executives. The Company also agreed to fund the tax liability on behalf of the executives associated with the loan forgiveness, and as a result incurred additional expense of $0.4 million. On February 14, 2014, a member of the board of directors repaid the full amount of principal and related accrued interest related to a note receivable from stockholder totaling $33 thousand. As of December 31, 2014, all outstanding principal and accrued interest related to the notes receivable from stockholders have been forgiven or repaid.
F-34
Note 19—Net Loss Per Share
The Company calculates basic and diluted net loss per share by dividing the net loss by the weighted average number of shares outstanding during the period. The Company has excluded all potentially dilutive shares, which include outstanding common stock options, common stock warrants, convertible preferred stock and convertible preferred stock warrants from the weighted average number of shares outstanding as their inclusion in the computation for all respective periods would be anti-dilutive due to net losses.
Basic and diluted net loss per share was calculated as follows for the years ended December 31, 2014, 2013 and 2012 (in thousands, except share and per share data):
Years Ended December 31, | |||||||||||
2014 | 2013 | 2012 | |||||||||
Numerator: | |||||||||||
Net income (loss) | $ | (3,108 | ) | $ | (654 | ) | $ | 192 | |||
Excess consideration paid for convertible preferred stock repurchases | — | — | (250 | ) | |||||||
Net loss attributable to common stockholders—basic and diluted | $ | (3,108 | ) | $ | (654 | ) | $ | (58 | ) | ||
Denominator: | |||||||||||
Weighted average common shares outstanding: | |||||||||||
Basic and diluted | 25,765,819 | 4,255,775 | 3,598,507 | ||||||||
Net loss per share attributable to common stockholders: | |||||||||||
Basic | $ | (0.12 | ) | $ | (0.15 | ) | $ | (0.02 | ) | ||
Diluted | $ | (0.12 | ) | $ | (0.15 | ) | $ | (0.02 | ) | ||
Anti-dilutive shares excluded from diluted EPS computation: | |||||||||||
Common stock options | 3,251,129 | 3,192,351 | 3,079,217 | ||||||||
Common stock warrants | 14,061 | 32,076 | 32,076 | ||||||||
Convertible preferred stock | 4,460,666 | 20,872,628 | 20,872,628 | ||||||||
Convertible preferred stock warrants | 72,670 | 226,705 | 226,705 | ||||||||
F-35
Note 20—Segment Reporting and Geographic Data
The Company has determined that it operates in one reportable segment, which is global ecommerce (see Note 1). Revenue by country or geographic region is based upon the country of the consumer.
The following table summarizes revenue by country or geographic region (in thousands):
Years Ended December 31, | |||||||||||
2014 | 2013 | 2012 | |||||||||
Canada | $ | 40,561 | $ | 34,306 | $ | 20,920 | |||||
Australia | 17,044 | 17,624 | 18,028 | ||||||||
Europe, Middle East and Africa | 40,659 | 35,864 | 25,137 | ||||||||
Asia-Pacific | 21,268 | 17,044 | 12,486 | ||||||||
Rest of World | 5,960 | 5,619 | 4,813 | ||||||||
Revenue | $ | 125,492 | $ | 110,457 | $ | 81,384 | |||||
Canada accounted for 32%, 31%, and 26% of total revenue for the years ended December 31, 2014, 2013 and 2012, respectively. Australia accounted for 14%, 16% and 22% of total revenue for the years ended December 31, 2014, 2013 and 2012, respectively. No other individual foreign country accounted for more than 10% of the Company’s revenue during these periods.
All of the Company’s trade receivables are due from customers located in the United States. No individual customer accounted for more than 10% of the Company’s trade receivables at December 31, 2014 and 2013.
All significant long-lived assets are located in the United States.
F-36
Note 21—Selected Quarterly Information (Unaudited)
2014 | |||||||||||||||
(in thousands, except per share amounts) | 1st Quarter | 2nd Quarter | 3rd Quarter | 4th Quarter | |||||||||||
Revenue | $ | 26,514 | $ | 30,964 | $ | 31,296 | $ | 36,718 | |||||||
Income (loss) from operations | (1,162 | ) | (752 | ) | (990 | ) | 571 | ||||||||
Net income (loss) | (2,041 | ) | (663 | ) | (898 | ) | 494 | ||||||||
Net income (loss) per share—basic | (0.27 | ) | (0.02 | ) | (0.03 | ) | 0.02 | ||||||||
Net income (loss) per share—diluted | (0.27 | ) | (0.02 | ) | (0.03 | ) | 0.01 | ||||||||
2013 | |||||||||||||||
(in thousands, except per share amounts) | 1st Quarter | 2nd Quarter | 3rd Quarter | 4th Quarter | |||||||||||
Revenue | $ | 25,772 | $ | 25,583 | $ | 23,216 | $ | 35,886 | |||||||
Income (loss) from operations | 238 | (955 | ) | (1,994 | ) | 2,481 | |||||||||
Net income (loss) | 361 | (814 | ) | (2,009 | ) | 1,808 | |||||||||
Net income (loss) per share—basic | 0.01 | (0.20 | ) | (0.45 | ) | 0.39 | |||||||||
Net income (loss) per share—diluted | 0.01 | (0.20 | ) | (0.45 | ) | 0.25 | |||||||||
F-37
SCHEDULE II—VALUATION AND QUALIFYING ACCOUNTS
Activity in allowance accounts related to accounts receivable and deferred tax assets consisted of the following (in thousands):
Balance at beginning of year | Charged to operations | Deductions | Balance at end of year | ||||||||||
Year ended December 31, 2012 | |||||||||||||
Accounts receivable allowances | $ | 23 | 83 | (34 | ) | $ | 72 | ||||||
Refunds, chargebacks, parcel losses and other consumer service costs | $ | 73 | 1,890 | (1,561 | ) | $ | 402 | ||||||
Deferred tax asset valuation allowance | $ | 5,383 | — | (1,031 | ) | $ | 4,352 | ||||||
Year ended December 31, 2013 | |||||||||||||
Accounts receivable allowances | $ | 72 | 2 | (3 | ) | $ | 71 | ||||||
Refunds chargebacks, parcel losses and other consumer service costs | $ | 402 | 2,637 | (2,455 | ) | $ | 584 | ||||||
Deferred tax asset valuation allowance | $ | 4,352 | — | (455 | ) | $ | 3,897 | ||||||
Year ended December 31, 2014 | |||||||||||||
Accounts receivable allowances | $ | 71 | 48 | (79 | ) | $ | 40 | ||||||
Refunds chargebacks, parcel losses and other consumer service costs | $ | 584 | 257 | (498 | ) | $ | 343 | ||||||
Deferred tax asset valuation allowance | $ | 3,897 | 703 | (1,249 | ) | $ | 3,351 | ||||||
F-38