Attached files
| file | filename |
|---|---|
| EX-23.1 - EX-23.1 - CEPHEID | d852874dex231.htm |
| EX-32.1 - EX-32.1 - CEPHEID | d852874dex321.htm |
| EX-32.2 - EX-32.2 - CEPHEID | d852874dex322.htm |
| EX-31.2 - EX-31.2 - CEPHEID | d852874dex312.htm |
| EX-31.1 - EX-31.1 - CEPHEID | d852874dex311.htm |
| EX-21.1 - EX-21.1 - CEPHEID | d852874dex211.htm |
| EX-10.23 - EX-10.23 - CEPHEID | d852874dex1023.htm |
| EXCEL - IDEA: XBRL DOCUMENT - CEPHEID | Financial_Report.xls |
Table of Contents
UNITED STATES
SECURITIES AND EXCHANGE COMMISSION
Washington, DC 20549
Form 10-K
(Mark One)
| x | ANNUAL REPORT PURSUANT TO SECTION 13 OR 15(d) OF THE SECURITIES EXCHANGE ACT OF 1934 |
For the fiscal year ended December 31, 2014
or
| ¨ | TRANSITION REPORT PURSUANT TO SECTION 13 OR 15(d) OF THE SECURITIES EXCHANGE ACT OF 1934 |
For the transition period from to
Commission file number 000-30755
CEPHEID
(Exact name of Registrant as Specified in its Charter)
| California | 77-0441625 | |
| (State or Other Jurisdiction | (I.R.S. Employer | |
| of Incorporation or Organization) | Identification Number) | |
| 904 Caribbean Drive, Sunnyvale, California | 94089-1189 | |
| (Address of Principal Executive Office) | (Zip Code) | |
(408) 541-4191
(Registrant’s Telephone Number, Including Area Code)
Securities registered pursuant to Section 12(b) of the Act:
Common Stock, no par value
(Title of Class)
Securities registered pursuant to Section 12(g) of the Act: None
Indicate by check mark if the registrant is a well-known seasoned issuer, as defined in Rule 405 of the Securities Act. Yes x No ¨
Indicate by check mark if the registrant is not required to file reports pursuant to Section 13 or Section 15(d) of the Act. Yes ¨ No x
Indicate by check mark whether the registrant (1) has filed all reports required to be filed by Section 13 or 15(d) of the Securities Exchange Act of 1934 during the preceding 12 months (or for such shorter period that the registrant was required to file such reports), and (2) has been subject to such filing requirements for the past 90 days. Yes x No ¨
Indicate by check mark whether the registrant has submitted electronically and posted on its corporate Web site, if any, every Interactive Data File required to be submitted and posted pursuant to Rule 405 of Regulation S-T (232.405 of this chapter) during the preceding 12 months (or for such shorter period that the registrant was required to submit and post such files). Yes x No ¨
Indicate by check mark if disclosure of delinquent filers pursuant to Item 405 of Regulation S-K (229.405 of this chapter) is not contained herein, and will not be contained, to the best of Registrant’s knowledge, in definitive proxy or information statements incorporated by reference in Part III of this Form 10-K, or any amendment to this Form 10-K. ¨
Indicate by check mark whether the registrant is a large accelerated filer, an accelerated filer, a non-accelerated filer, or a smaller reporting company. See the definitions of “large accelerated filer,” “accelerated filer” and “smaller reporting company” in Rule 12b-2 of the Exchange Act. (Check one):
| Large Accelerated Filer | x | Accelerated Filer | ¨ | |||
| Non-accelerated Filer | ¨ (Do not check if a Smaller Reporting Company) | Smaller Reporting Company | ¨ | |||
Indicate by check mark whether the registrant is a shell company (as defined in Rule 12b-2 of the Exchange Act). Yes ¨ No x
As of June 30, 2014, the last business day of the Registrant’s most recently completed second fiscal quarter, the aggregate market value of the common stock held by non-affiliates of the registrant was approximately $3.4 billion based on the closing sale price for the registrant’s common stock on The NASDAQ Global Select Market on that date of $47.94 per share. This number is provided only for the purpose of this report on Form 10-K and does not represent an admission by either the registrant or any such person as to the status of such person.
As of February 12, 2015 there were 71,271,395 shares of the registrant’s common stock outstanding.
DOCUMENTS INCORPORATED BY REFERENCE
| Document Description |
10-K Part | |
| Portions of the Proxy Statement for the Annual Meeting of Shareholders (the “Proxy Statement”) to be held on April 28, 2015, and to be filed pursuant to Regulation 14A within 120 days after registrant’s fiscal year ended December 31, 2014 are incorporated by reference into Part III of this Report. |
III |
Table of Contents

2014 ANNUAL REPORT ON FORM 10-K
Cepheid® , the Cepheid logo, GeneXpert®, Xpert® and SmartCycler are trademarks of Cepheid.
Table of Contents
FORWARD-LOOKING STATEMENTS
The following discussion of our business, and other parts of this report, contain forward-looking statements within the meaning of Section 27A of the Securities Act of 1933 and Section 21E of the Securities Exchange Act of 1934 that relate to future events or our future financial performance. In some cases, you can identify forward-looking statements by terminology such as “may”, “will”, “should”, “expect”, “plan”, “anticipate”, “believe”, “estimate”, “intend”, “potential”, “project” or “continue” or the negative of these terms or other comparable terminology. Forward-looking statements are based upon current expectations that involve risks and uncertainties. Our actual results and the timing of events could differ materially from those anticipated in our forward-looking statements as a result of many factors, including, but not limited to, the following: consistency of product availability and delivery; sales organization productivity; speed and extent of test menu expansion and utilization; improving gross margins; execution of manufacturing operations; our success in increasing product sales under the High Burden Developing Country (“HBDC”) program; our success in commercial test and commercial system sales and our ability to sell directly to the smaller hospital market and the independent reference laboratory market; the performance and market acceptance of our new products; test performance in the field; testing volumes for our products; unforeseen supply, development and manufacturing problems; our ability to manage our inventory levels; our ability to scale up manufacturing; our research and development budget; the potential need for intellectual property licenses for tests and other products and the terms of such licenses; the environment for capital spending by hospitals and other customers for our diagnostic systems; the effectiveness of our sales personnel and our ability to successfully expand and effectively manage increased sales and marketing operations, including expansion of our direct sales force to address the smaller hospital market and the independent reference laboratory market; lengthy sales cycles in certain markets, including the HBDC and smaller hospital market program; long sales cycles and variability in systems placements and reagent pull-through in our HBDC program and the smaller hospital market; the impact of competitive products and pricing; sufficient customer demand; customer confidence in product availability and available customer budgets; the level of testing at clinical customer sites, including for healthcare-associated infections; our ability to consolidate customer demand through volume pricing; our ability to develop new products and complete clinical trials successfully in a timely manner for new products; our ability to obtain regulatory approvals and introduce new products; uncertainties related to FDA regulatory and international regulatory processes; our ability to respond to changing laws and regulations affecting our industry and changing enforcement practices related thereto; our reliance on distributors in some regions to market, sell and support our products in certain geographic locations; the occurrence of unforeseen expenditures, asset impairments, acquisitions or other transactions; costs of litigation, including settlement costs; our ability to manage geographically-dispersed operations; the scope and timing of actual United States Postal Service (“USPS”) funding of the Biohazard Detection System (“BDS”) in its current configuration; the rate of environmental testing using the BDS conducted by the USPS, which will affect the amount of consumable products sold; underlying market conditions worldwide; and the other risks set forth under “Risk Factors” and elsewhere in this report. We neither undertake, nor assume any obligation to update any of the forward-looking statements after the date of this report or to conform these forward-looking statements to actual results.
| ITEM 1. | BUSINESS |
OVERVIEW
We are a molecular diagnostics company that develops, manufactures and markets fully-integrated systems for testing in the Clinical market and Non-Clinical markets. Our systems enable rapid, sophisticated molecular testing for organisms and genetic-based diseases by automating otherwise complex manual laboratory procedures. Molecular testing historically has involved a number of complicated and time-intensive steps, including sample preparation, DNA amplification and detection. Our easy-to-use systems integrate these steps and analyze complex biological samples in our proprietary test cartridges. We were first to the U.S. market with a Clinical Laboratory Improvement Amendments (“CLIA”) moderate complexity categorization for an amplified molecular test and the majority of our products are moderately complex, expanding our market opportunity beyond high complexity laboratories.
Our primary offering is the GeneXpert system, which integrates sample preparation in addition to DNA amplification and detection. The GeneXpert system is designed for a broad range of user types ranging from reference laboratories and hospital central laboratories to satellite testing locations, such as emergency departments and intensive care units within hospitals as well as physician offices and other alternate site laboratories. We also offer the SmartCycler system, which integrates DNA amplification and detection to allow rapid analysis of a sample.
In September 2009, we launched the GeneXpert Infinity-48 system (“Infinity”) for high volume testing. The Infinity uses robotic cartridge handling and a full touch screen driven menu to run up to 1,300 independent molecular tests during any 24-hour period, depending on test selection. In July 2011, we introduced the GeneXpert Infinity-80 (“Infinity-80”), our highest throughput system, comprised of up to 80 modules, enabling more than 2,000 tests to be run during a 24-hour period, yet occupying the same footprint as the GeneXpert Infinity-48. In July 2012, we introduced the GeneXpert Infinity-48s, comprised of up to 48 modules in a footprint that is almost two feet less in width than the original Infinity-48 and still enables up to 1,300 tests to be run during a 24-hour period.
3
Table of Contents
The GeneXpert system, including the Infinity systems, represents a paradigm shift in molecular diagnostics in terms of ease-of-use, flexibility and scalability, producing accurate results in a timely manner with minimal risk of contamination. Our Xpert tests for use on the GeneXpert system are unique in that they typically require less than two minutes of hands-on time for unprecedented ease of use, rapid results, in most cases approximately one hour, and the ability to do testing in any workflow environment: full random access; on-demand; or traditional batch testing.
The paradigm shift represented by the GeneXpert system includes: 1) the ability to perform multiple, highly accurate and fast time-to-result molecular diagnostic tests, at any time, even if the system is simultaneously performing other tests, either in a batch or on-demand mode; 2) the system’s ease-of-use, which enables it to be operated without the need for highly-trained laboratory technologists; and 3) the scalability of the instrument, currently from one to 80 modules, enabling it to serve high volume testing requirements as well as lower volume requirements for smaller institutions or for testing at the point of patient care. Our GeneXpert system can provide rapid results with frequently superior test sensitivity and specificity over comparable systems on the market today that are integrated but have open architectures. Our GeneXpert system operates with an entirely closed cartridge, reducing the likelihood of human error and contamination. As a result, the system is particularly well suited to perform “nested” PCR, a detection method that can provide an enhanced level of sensitivity, but that has historically been discouraged because of the high risk of cross-contamination during processing in an open lab environment. This method performs an additional amplification of the target sequence after the first PCR amplification.
We currently have available a broad and expanding menu of tests for use on our systems, spanning healthcare-associated infections, critical infectious disease, sexual health, women’s health, virology, oncology and genetics. Our reagents and tests are marketed along with our systems on a worldwide basis.
OUR STRATEGY
Our objective is to become the leading supplier of integrated systems and tests for molecular diagnostics. Key elements of our strategy to achieve this objective include:
| • | Provide a fully-integrated molecular testing solution to the Clinical market. We are focusing our investments on selling our systems and tests to the Clinical market and we believe our GeneXpert system will continue to significantly expand our presence in the Clinical market due to its ability to deliver accurate and rapid results, ease of use, flexibility and scalability. Features of the GeneXpert system and Xpert tests include: |
| • | an approach by which the reagents are typically prepackaged in a single vessel (the test cartridge) into which the specimen is added; |
| • | no further user intervention once the Xpert cartridge is loaded into the GeneXpert system; |
| • | all three phases of PCR: 1) sample preparation, 2) amplification and 3) detection, are performed within the single sealed test cartridge automatically; |
| • | primarily moderate complexity Clinical Laboratory Improvement Amendments (“CLIA”) categorized, amplified molecular tests, which means the GeneXpert system can be operated without the need for highly-trained laboratory technologists; |
| • | commercial availability in a variety of configurations ranging from one to 80 individual test modules, which enables testing in environments ranging from low volume testing to high volume, near-patient, core or central lab testing, and system capacity that can be expanded in support of growing test volumes by adding additional modules; |
| • | notably, to our knowledge, the only truly scalable real-time PCR system that operates entirely within a closed system architecture, reducing hands-on time, reducing the likelihood of human error and contamination, and enabling nested PCR capability, a proven process for maximizing real-time PCR sensitivity; and |
| • | full random access whereby different tests for different targets may be run simultaneously in different modules in the same GeneXpert system, which increases potential utilization and throughput of the system and also enables on-demand or “STAT” testing, whereby the user can add a new test to the system at any time without regard to the stage of processing of any other test on the system. |
4
Table of Contents
| • | Continue to develop and market new tests. We plan to capitalize on our strengths in nucleic acid chemistry and molecular biology to continue to develop new tests for our systems and offer our customers the broadest menu of Xpert tests designed to address many of the highest volume molecular test opportunities. Our strategy is to offer a portfolio of Xpert tests spanning healthcare-associated infections, critical infectious disease, sexual health, women’s health, virology, oncology and genetics. For example, Xpert CT/NG and Xpert MTB/RIF were made commercially available in the United States in 2013 and Xpert Norovirus and Xpert Flu/RSV XC were made commercially available in the United States in 2014. Xpert HPV, Xpert Carba-R, Xpert Norovirus, Xpert Flu/RSV XC, and Xpert Trichomonas were all made commercially available in all markets that recognize CE Marks during 2014 and Xpert HIV-1 Viral Load achieved CE Mark in December 2014. |
| • | Obtain additional target rights. We expect to continue to expand our collaborations with academic institutions and commercial organizations to develop and obtain target rights to various infectious disease and oncology targets. In addition, we expect to focus key business development activities on identifying infectious disease and oncology targets held by academic institutions or commercial organizations for potential license or acquisition. |
| • | Extend geographic reach. Our European sales and marketing operations are headquartered in France. As of December 31, 2014, we had direct sales forces in Australia, the Benelux region, France, Germany, Hong Kong, Italy, South Africa and the United Kingdom, and we have offices in Brazil, China, Dubai, India, Japan and Singapore. We expect to continue to expand our international commercial operations capability on both a direct and distributor basis in 2015 and future years. |
| • | Extend High Burden Developing Countries sales programs. We are developing and expect to continue to expand our presence in HBDCs following the World Health Organization’s endorsement of the Xpert MTB/RIF test in late 2010 to deliver GeneXpert systems and Xpert tests to HBDCs at a discount to our standard commercial prices. We believe that participation in the HBDC program considerably broadens the geographic reach of our products and increases recognition of the Cepheid brand and product portfolio. |
PRODUCTS
Our product portfolio consists of tests, reagents and systems for the Clinical market and Non-Clinical markets. Our main system is the GeneXpert system, including the Infinity systems, which incorporates sample preparation, nucleic acid extraction and purification, DNA amplification, and detection into a small, self-contained cartridge, enabling rapid molecular testing 24 hours a day, 7 days a week, offering medically relevant results when and where they are needed most. We also offer our first generation system, the SmartCycler, which integrates DNA amplification and detection for rapid batch or random access analysis in “real-time.”
In the Clinical market, we offer tests for the GeneXpert system in the areas of healthcare-associated infections, critical infectious disease, sexual health, women’s health, virology, oncology and genetics. These tests include U.S. Food and Drug Administration (“FDA”) cleared products, such as IVD medical devices, CE Marked products (“CE IVD”) and Research Use Only (“RUO”) tests. As of December 31, 2014, our Xpert menu includes the following FDA and CE IVD approved tests:
5
Table of Contents
In the Non-Clinical market, the GeneXpert modules have been integrated into the BDS purchased by the USPS, utilizing our Bacillus anthracis test.
We also sell our SmartCycler system along with general use PCR reagents and reaction tubes.
RESEARCH AND DEVELOPMENT
The principal objective of our research and development program is to develop high-value clinical diagnostic products for the GeneXpert system. We focus our efforts on four main areas: 1) assay development efforts to design, optimize and produce specific tests that leverage the systems and chemistry we have developed and extend our product offering to customers; 2) chemistry research to develop innovative and proprietary methods to design and synthesize oligonucleotide primers, probes and dyes to optimize the speed, performance and ease-of-use of our assays; 3) engineering efforts to extend the capabilities of our systems and to develop new low and high throughput systems and 4) target discovery research to identify novel micro RNA targets to be used in the development of future assays. Total research and development expense was $96.9 million, $80.2 million and $71.7 million for the years ended December 31, 2014, 2013 and 2012, respectively.
SALES
Sales for products within our specific markets are conducted through both direct sales and indirect distribution channels worldwide. Clinical market sales in the United States, United Kingdom, Australia, France, the Benelux region, Germany, Hong-Kong, Italy and South Africa are handled primarily through our direct sales force, while sales in all other markets are handled primarily through distributors. In October 2014, we re-acquired certain product distribution rights and customer relationships from a former distributor that served hospitals with fewer than 150 beds in the United States. We continue to expand our direct sales capability, including in the international markets. Some of our customers are members of Group Purchasing Organizations (“GPOs”) and purchase products under GPO contracts. Sales to end customers who are part of GPOs represented 36%, 41%, and 43% of total sales for the years ended December 31, 2014, 2013 and 2012, respectively. There were no direct customers that accounted for 10% or more of the total sales for the years ended December 31, 2014, 2013 or 2012.
Distribution and collaboration arrangements
Life Technology Corporation. In October 2002, we entered into a collaboration agreement with Life Technologies Corporation previously known as Applied Biosystems Group (“LIFE”), to develop reagents for use in the USPS BDS program, which was developed by the consortium led by Northrop Grumman Corporation. Under the agreement, reagents are manufactured by LIFE for packaging by us into our GeneXpert test cartridges and sold by us for use in the BDS. This agreement calls for the computed gross margin on sales of anthrax cartridges for the USPS BDS program to be equally shared between the two parties.
USPS BDS Program. In 2003, a Northrop Grumman-led consortium that included us and other subcontractors developed the BDS for the USPS. This consortium was awarded a production contract, and installations were completed at the end of 2005. In August 2007, Northrop Grumman entered into a five-year master purchase agreement with us for the purchase of up to $200 million in anthrax test cartridges and associated materials used in BDS. The agreement, and subsequent purchase orders, covered the period through September 30, 2011. In the fourth quarter of 2011, Northrop Grumman entered into another five-year master purchase agreement with us for the purchase of up to $112 million of anthrax test cartridges and associated materials used in BDS. The agreement and subsequent purchase orders cover the period through September 30, 2016. In the fourth quarter of 2012, we entered into an agreement directly with the USPS to sell the anthrax test cartridges and associated materials used in BDS directly to USPS through the period ending September 30, 2016.
Foundation for Innovative New Diagnostics. In May 2006, we entered into an agreement with FIND to develop a simple, rapid test that can detect mycobactrium tuberculosis and associated rifampin resistance from human sputum samples. Under the agreement, we were responsible for the development of a 6-color GeneXpert instrument to accomplish such a test and the development of an enhanced manufacturing line for the manufacture of test cartridges used in the test. FIND reimbursed us at agreed upon amounts. The term of the development portion of the agreement was 30 months, which was subsequently extended an additional five months. In July
6
Table of Contents
2009, the agreement was extended for another year for further specified enhancements. The supply term of the agreement is for 12 years, unless terminated by either party in accordance with relevant provisions of the agreement. In January 2011, the agreement was extended for another year and a new agreement was signed for the development of our Xpert HIV Viral Load test. In December 2014, the Xpert HIV-1 Viral Load achieved CE-IVD status under the European Directive on In Vitro Diagnostic Medical Devices which was the final milestone of the agreement. Under the Xpert HIV agreement, FIND funded $5.1 million in development costs during the term of the two-year contract.
MTB/RIF Buy-Down Program for the HBDC Market. Beginning in August 2012, we announced the first in a series of agreements with the Bill & Melinda Gates Foundation (“BMGF”), the United States President’s Emergency Plan for AIDS Relief (PEPFAR), the United States Agency for International Development (USAID) and UNITAID to buy-down the price of the Xpert MTB/RIF test in an effort to drive adoption of the technology as a critical tool in interrupting the transmission cycle of tuberculosis in HBDCs. The purpose of the buy-down program is to decrease the price per test of Xpert MTB/RIF for HBDC customers to $9.98. Under the agreements, BMGF funded $3.5 million, USAID/PEPFAR funded $3.5 million and UNITAID funded $3.2 million.
Xpert Carba-R. In June 2014, we announced a collaboration with AstraZeneca plc, Cubist Pharmaceuticals, Inc., GlaxoSmithKline plc and others to develop Xpert Carba-R, a rapid diagnostic test that can target multi-drug resistant pathogens and support the appropriate use of antibiotics.
MTB/RIF Ultra. In October 2014, we announced a collaboration to develop Xpert MTB/RIF Ultra with FIND and Rutgers New Jersey Medical School to develop a next-generation test for Mycobacterium tuberculosis (TB) with increased sensitivity to aid in detection of patients with smear-negative TB, which is often associated with HIV co-infection. Xpert MTB/RIF Ultra will run on our existing 6-color GeneXpert Systems. FIND agreed to fund up to $3.0 million in development costs throughout the two-year contract.
Xpert Ebola. In November 2014, we announced a grant award of up to $3.4 million co-financed by the Paul G. Allen Family Foundation and the BMGF to develop Xpert Ebola, a rapid test that could be run on our installed base of GeneXpert Systems in developing countries.
MANUFACTURING
Our facilities and manufacturing processes are designed to comply with the quality standard set by the International Organization for Standardization and the FDA’s Quality System Regulations, enabling us to market our systems in the Clinical market and Non-Clinical markets worldwide. In our manufacturing facilities, we assemble our systems and produce reagents and tests for use on our GeneXpert and SmartCycler systems. We assemble our disposable reaction tubes and cartridges on custom, automated assembly lines that are designed with expandable capacity. We depend on suppliers for various components used in the manufacture of the GeneXpert and SmartCycler systems, and our disposable reaction tubes and cartridges, some of which are our sole source for such components.
BACKLOG
Our aggregate backlog of $31.7 million as of December 31, 2014 is comprised of firm orders, all of which are expected to be converted into sales in 2015. Some of our customers may cancel or reschedule orders without substantial penalty. Our aggregate backlog of $42.9 million as of December 31, 2013 was comprised of firm orders which were expected to be converted into sales in 2014. We do not believe that aggregate backlog as of any particular date is necessarily indicative of future results.
COMPETITION
We face intense competition from a number of companies that offer products in our target markets, some of which have substantially greater financial resources and larger, more established marketing, sales and service organizations than we do. These competitors include:
| • | companies developing and marketing sequence detection systems for industrial research products; |
| • | diagnostic and pharmaceutical companies; |
| • | companies developing drug discovery technologies; and |
| • | companies developing or offering biothreat detection technologies. |
Several companies provide systems and reagents for DNA amplification or detection. Life Technologies Corporation (acquired by Thermo Fisher Scientific) and F. Hoffmann-La Roche Ltd. (“Roche”) sell systems integrating DNA amplification and detection (sequence detection systems) to the commercial market. Roche, Abbott Laboratories (“Abbott”), Becton, Dickinson and Company (“BD”), Qiagen N.V., Hologic Inc., Luminex Corporation, Meridian Bioscience, Inc., bioMerieux SA, and Quidel Corporation sell
7
Table of Contents
sequence detection systems, some with separate robotic batch DNA purification systems and sell reagents to the Clinical market. Other companies, such as Nanosphere Inc., Alere Inc., and GenMark Diagnostics, Inc., offer molecular tests. Additionally, we anticipate that in the future, additional competitors will emerge that offer a broad range of competing products.
The life sciences industry is characterized by rapid and continuous technological innovation. We may need to develop new technologies for our products to remain competitive. One or more of our current or future competitors could render our present or future products technologically obsolete or uneconomical by reducing the prices of their competing products or could develop proprietary positions that prevent us from successfully commercializing our products. In addition, the introduction or announcement of new products by us or others could result in a delay of or decrease in sales of existing products, as we await regulatory approvals and as customers evaluate these new products. We may also encounter other problems in the process of delivering new products to the marketplace such as problems related to design, development or manufacturing of such products, and as a result we may be unsuccessful in selling such products. Our future success depends on our ability to compete effectively against current technologies, as well as to respond effectively to technological advances by developing and marketing products that are competitive in the continually changing technological landscape.
In order to compete effectively, we need to demonstrate the advantages of our products over alternative well-established technologies and products. We also need to demonstrate the potential economic value of our products relative to these technologies and products.
In many instances, particularly in the clinical genetics assessment area, our competitors have substantially greater financial, technical, research and other resources, and larger, more established marketing, sales, distribution and service organizations than we have. Moreover, these competitors may offer broader product lines and tactical discounts and have greater name recognition. If we fail to compete effectively against these and other competitors, we could lose sales, and our business will be harmed.
We believe that the principal competitive factors affecting sales of genetic and DNA analysis systems include the speed, integrated functionality and portability of the equipment, ease of use, the quality of the test results, price, market acceptance of the technology, regulatory approvals, particularly in the Clinical market, possession of the necessary intellectual property licenses for specific markets, collaborations and distributor relationships for specific markets and tests, and the selection of tests available for the system. We believe our products better integrate the various processes associated with DNA and RNA analysis than other currently available equipment, and that the speed, portability, flexibility, reliability and ease of use of our products are competitive.
GOVERNMENT REGULATION
In the Clinical market, our products are regulated as medical device products by the FDA and comparable agencies in other countries. In particular, FDA regulations govern activities such as product development, product testing, product labeling, product storage, premarket clearance or approval, manufacturing, advertising, promotion, product sales, reporting of certain product failures and distribution. Some of our products, depending on their intended use, will require premarket approval (“PMA”) or 510(k) clearance from the FDA prior to marketing in the United States. The 510(k) clearance process usually takes approximately 90 days from submission but can take longer. Products for the non-waived physician office laboratory market will require an additional submission known as a CLIA waiver from FDA. The CLIA waiver approval process usually takes approximately 180 days.
For the Non-Clinical market, some of our products may not need FDA or other regulatory approval; however, all of our products are being produced under ISO 13485 and Quality System Regulations.
INTELLECTUAL PROPERTY
We integrate capabilities in system design, development, production and DNA amplification technologies, along with design, development and manufacture of primers, probes, dyes, quenchers and other individual reagent components. We have and are continuing to develop our own proprietary intellectual property along with licensing specific third-party technologies.
Our competitive success will be affected in part by our continued ability to obtain and maintain patent protection for our inventions, technologies and discoveries, including intellectual property that includes technologies that we license. We have patents covering technologies of our own and have licensed technologies from others. Our pending patent applications may lack priority over applications submitted by third parties or may not result in the issuance of patents. Even if issued, our patents may not be sufficiently broad to provide protection against competitors with similar technologies and may be challenged, invalidated or circumvented.
In addition to patents, we rely on a combination of trade secrets, copyright and trademark laws, nondisclosure agreements, licenses and other contractual provisions and technical measures to maintain and develop our competitive position with respect to intellectual property. Nevertheless, these measures may not be adequate to safeguard the technology underlying our products. For
8
Table of Contents
example, employees, consultants and others who participate in the development of our products may breach their agreements with us regarding our intellectual property, and we may not have adequate remedies for the breach. We also may not be able to effectively protect our intellectual property rights in some foreign countries, as many countries do not offer the same level of legal protection for intellectual property as the United States. Furthermore, for a variety of reasons, we may decide not to file for patent, copyright or trademark protection outside of the United States. Our trade secrets could become known through other unforeseen means. Notwithstanding our efforts to protect our intellectual property, our competitors may independently develop similar or alternative technologies or products that are equal or superior to our technology. Our competitors may also develop similar products without infringing on any of our intellectual property rights or design around our proprietary technologies. Furthermore, any efforts to enforce our proprietary rights could result in disputes and legal proceedings that could be costly and divert attention from our business. We could also be subject to third-party claims that we require additional licenses for our products, and such claims could interfere with our business. From time to time, third parties have contacted us regarding their intellectual property, whether to license intellectual property, or in some instances, alleging potential infringement. If our products infringe the intellectual property rights of others, we could face costly litigation, which could cause us to pay substantial damages and limit our ability to sell some or all of our products. Even if our products were determined not to infringe the intellectual property rights of others, we could incur substantial costs in defending any such claims. Please refer to Part I, Item 3 “Legal Proceedings” for a discussion of current litigation surrounding intellectual property rights.
We hold an exclusive license to key technologies from Lawrence Livermore National Laboratory (“LLNL”) related to thermal cycling with integrated optical detection. This license is limited to the fields of nucleic acid analysis and ligand binding tests and contains diligence and U.S. preference provisions. The LLNL technologies are the basis of our I-CORE module and encompass the key I-CORE features. In September 2006, we entered into a sublicense agreement with Abbott, pursuant to which Abbott granted us a non-exclusive, world-wide, non-transferable right to Abbott’s exclusive license to certain patents from the Baylor College of Medicine. Under the sublicense agreement, we will be able to make, use, distribute and sell products incorporating the patented technology generally characterized as multiple genomic DNA amplification. In September 2006, we also entered into a license agreement with Abbott, pursuant to which Abbott granted us a non-exclusive, world-wide, non-transferable right to a certain Abbott patent. Under the license agreement, we will be able to make, use, distribute and sell products incorporating the patented technology generally characterized as detection of cervical chlamydia trachomatis infection.
In January 2007, we entered into a sublicense agreement with bioMerieux SA, pursuant to which bioMerieux SA granted us a non-exclusive, worldwide, irrevocable sublicense to certain patents that relate to the diagnosis of MRSA. The patents are owned by Kainos Laboratories Inc. and Professor Keiichi Hiramatsu and have been exclusively licensed to bioMerieux SA with the right for bioMerieux SA to sublicense. Under the sublicense agreement, and subject to certain limitations set forth therein, we will be able to use the licensed rights to develop and sell products for use with our GeneXpert and SmartCycler systems.
In February 2013, we entered into an exclusive license agreements with Oregon Health and Science University related to breast and prostate cancer detection. Under the license agreements, we will be able to make, use, distribute and sell products incorporating their patented technology for use with our GeneXpert system.
We intend to actively pursue acquisitions of additional molecular markers and/or complementary products, technologies or companies in the fields of oncology, infectious diseases and other fields appropriate for molecular diagnostics.
ACQUISITIONS
In October 2014 we re-acquired certain product distribution rights and acquired customer relationship assets from a former distributor for $21.0 million, of which $18.0 million was paid in cash in 2014, and $3.0 million was retained subject to certain final price adjustments. This retained amount was recorded in “Accrued and other liabilities” in the Balance Sheet at December 31, 2014 and was paid in January, 2015. In 2013, we acquired local distributors’ businesses and assets in foreign markets for total consideration of $3.7 million, net of cash received.
EMPLOYEES
As of December 31, 2014, we had approximately 1,400 full-time equivalent employees worldwide. At December 31, 2014, none of our U.S. employees were represented by a labor union. Many of our employees in Sweden are employed under a collective bargaining agreement. We consider our employee relations to be good.
SEASONALITY
Worldwide sales, including U.S. sales, do not reflect any significant degree of seasonality; however, sales of our Xpert Flu, Xpert Flu/RSV XC and Xpert EV for Enterovirus products have demonstrated seasonal fluctuations consistent with the onset and decline of respective illnesses.
9
Table of Contents
EXECUTIVE OFFICERS OF THE REGISTRANT
The following table and discussion set forth certain information with regard to our current executive officers as of February 26, 2015:
| Name |
Age | Position | ||
| John L. Bishop | 70 | Chairman and Chief Executive Officer | ||
| Michael Fitzgerald | 55 | Executive Vice President, Global Human Resources | ||
| Kerry J. Flom, Ph.D. | 63 | Executive Vice President, Chief Regulatory Officer | ||
| Warren Kocmond | 55 | Executive Vice President, Chief Operating Officer | ||
| Daniel E. Madden | 47 | Vice President, Corporate Controller and Acting Chief Financial Officer | ||
| David H. Persing, M.D., Ph.D. | 59 | Executive Vice President, Chief Medical and Technology Officer, and Director | ||
| Peter Farrell | 50 | Executive Vice President of Worldwide Commercial Operations | ||
| Joseph H. Smith | 70 | Executive Vice President, Corporate Development and General Counsel |
John L. Bishop. Mr. Bishop joined us as Chief Executive Officer and as a director in April 2002 and became the Chairman of the Board of Directors in February 2013. Mr. Bishop served as President and a director of Vysis, Inc., a genomic disease management company that was acquired by Abbott, from 1993 to 2002 and as Chief Executive Officer from 1996 to 2002. From 1991 until 1993, Mr. Bishop was Chairman and Chief Executive Officer of MicroProbe Corporation, a biotechnology company, and, from 1987 until 1991, of Source Scientific Systems, a biomedical instrument manufacturing company. From 1984 to 1986, Mr. Bishop was President and Chief Operating Officer of Gen-Probe From 1968 to 1984, Mr. Bishop held various management positions with American Hospital Supply Company and its affiliates, including a three-year assignment in Japan as an Executive Vice President and Chief Executive Officer of International Reagents Corp., a joint venture between American Hospital Supply Company and Green Cross Corporation. Mr. Bishop served as a director of Conceptus, Inc. and a member of its compensation committee until its acquisition by Bayer HealthCare LLC in June 2013. In addition, he has been a member of the AdvaMed Dx Board, since 2010, was elected Chairman of the Board in December, 2013, and has served as a director of Veracyte, Inc., since November 2014.
Michael Fitzgerald. Mr. Fitzgerald was promoted to Executive Vice President, Global Human Resources in January 2014, after serving as our Senior Vice President, Human Resources from January 2012 until January 2014. Prior to joining us, Mr. Fitzgerald was Senior Vice President of Human Resources at Verigy, Ltd (now a part of Advantest Corp.) from 2010 to 2012. Prior to Verigy, Mr. Fitzgerald was Vice President of Human Resources at Varian, Inc. (acquired by Agilent Technologies) from 2007 to 2010, and prior to that, he held various HR roles culminating in becoming the Global Director of HR Strategy and Planning for Vodafone Group, PLC from 1995 to 2006. He earned a bachelor’s degree in Political Science from the University of California, Berkeley, and a master’s degree in Industrial Relations and Personnel Management from the University of London’s London School of Economics and Political Science. He is currently a participant in the International Masters in Practicing Management program under the auspices of McGill University of Montreal, Canada.
Kerry J. Flom, Ph.D. Dr. Flom was promoted to Executive Vice President, Chief Regulatory Officer in January 2013, and was our Senior Vice President, Clinical Affairs & Regulatory Submissions from January 2010 until December 2012, after having joined us in May 2004 as Vice President, Clinical Affairs & Regulatory Submissions. Prior to joining us, Dr. Flom was Senior Director, Clinical Affairs and Regulatory Submission for Abbott Molecular Diagnostics from 2001 to 2004. Prior to Abbott, Dr. Flom directed the clinical affairs departments at Vysis, Inc., Baxter Health Corporation – Cardiovascular Group (presently Edwards Lifesciences), and Oncor, Inc. Before joining Oncor, Dr. Flom held clinical and R&D positions at Boehringer Mannheim Corporation (presently Roche Diagnostics), Behring Diagnostics, and Corning Corporation.
Warren Kocmond. Mr. Kocmond joined us as Executive Vice President, Global Operations in May of 2013 and was promoted to Executive Vice President and Chief Operating Officer in October 2014. Prior to joining us, Mr. Kocmond served as Vice President of Global Operations at Lam Research Corporation, a wafer fabrication equipment and services supplier, from February 2012 until April 2013, where he was responsible for globally dispersed operations including a multi-billion dollar supply chain. From August 2009 until October 2011, Mr. Kocmond served as Executive Vice President of Global Operations and Quality at Verigy, Ltd., now a wholly owned subsidiary of Advantest Corp., a provider of semiconductor automatic test equipment. Mr. Kocmond served as the Chief Operating Officer of Electroglas, Inc., a supplier of semiconductor manufacturing equipment and software, from May 2008 until February 2009 when he was promoted to Chief Executive Officer and served in that role until July 2009. Prior to that, from May 2007 until May 2008, Mr. Kocmond served as the Senior Vice President of Global Operations for Affymetrix, Inc., a manufacturer of DNA microarrays.
10
Table of Contents
Daniel E. Madden. Mr. Madden joined us as Vice President and Corporate Controller in June 2014 and assumed the role of Acting Chief Financial Officer on February 3, 2015 for an interim period, in connection with the resignation of our Chief Financial Officer. Prior to joining us, from November 2012 through January 2014, Mr. Madden served as Vice President Finance and Corporate Controller of Symmetricom, Inc., a timekeeping technology developer, manufacturer and supplier, which was acquired by Microsemi Corporation in November 2013. From March 2008 through November 2012, Mr. Madden served as Vice President, Finance and Investor Relations of Symmetricom, Inc. From September 2005 through March 2008, Mr. Madden served as Vice President and Corporate Controller of Sonic Solutions, a computer software company. Mr. Madden began his career with Ernst & Young and is a Certified Public Accountant.
David H. Persing, M.D., Ph.D. Dr. Persing first joined us as a director in May 2004, and became our Executive Vice President and Chief Medical and Technology Officer in August 2005. From 1999 to 2005, Dr. Persing was a research executive and Chief Scientific Officer at Corixa Corporation, a Seattle-based biotechnology company, until its acquisition by GlaxoSmithKline. From 1990 to 1999 he was a member of the Clinical and Research Faculty of the Mayo Clinic in Rochester, Minnesota where he conducted research on hepatitis viruses, tick-borne infections and molecular diagnostics. In 1992 he founded and directed the Molecular Microbiology Laboratory at Mayo Clinic. He has authored over 270 peer-reviewed articles and has served as Editor in Chief for four textbooks on Molecular Diagnostics, the most recent of which was published by ASM press in 2011.
Peter Farrell. Mr. Farrell first joined us as Executive Vice President, International Commercial Operations in June 2014. In October 2014, he was promoted to Executive Vice President, Worldwide Commercial Operations. Prior to joining us, Mr. Farrell served as Divisional Vice President and General Manager at Abbott Point of Care, a division of Abbott Laboratories and a developer of handheld point of care testing products, from January 2012 until January 2014. From June 2006 until December 2011, Mr. Farrell served as the Divisional Vice President, Commercial Operations, managing numerous departments of Abbott Point of Care.
Joseph H. Smith. Mr. Smith joined us in June 2003 as Vice President, General Counsel, served as our Senior Vice President of Business Development and General Counsel from April 2004 until December 2012 and was promoted to Executive Vice President, Corporate Development and General Counsel in January 2013. He has been Secretary since March 2004. From 1989 to 2002, Mr. Smith was Vice President of Intellectual Property at Applied Biosystems (now Life Technologies Corporation) and its predecessors, a biotechnology research equipment company, and from 2002 to 2003 was its Senior Vice President for Business Development. Prior to Applied Biosystems, Mr. Smith was a partner in the law firm of Wiseman, Jones, and Smith; and prior to that he was a member of the Technical Legal Department of Hewlett-Packard.
11
Table of Contents
AVAILABLE INFORMATION
Our website is located at www.cepheid.com. We make available free of charge on our web site our Annual Reports on Form 10-K, our Quarterly Reports on Form 10-Q, our Current Reports on Form 8-K and amendments to those reports filed or furnished pursuant to Section 13(a) or 15(d) of the Securities Exchange Act of 1934, as amended, as soon as reasonably practicable after we electronically file them with or furnish them to the SEC. Information contained on our web site is not part of this Annual Report on Form 10-K or our other filings with the SEC. The public may read and copy any materials that we file with the SEC at the SEC’s Public Reference Room at 100 F Street, NE, Washington, DC 20549. The public may obtain information on the operation of the Public Reference Room by calling the SEC at 1-800-SEC-0330. The SEC also maintains an internet site that contains reports, proxy and information statements, and other information regarding issuers that file electronically with the SEC at www.sec.gov.
The charters of our Audit Committee, our Compensation and Organizational Development Committee and our Nominating and Governance Committee, are available on the Investor Relations section of our website under “Corporate Governance”. Also available on that section of our website is our Code of Business Conduct and Ethics, which we expect every employee, officer, director, staffing agency worker and consultant to read, understand and abide by. This information is also available by writing to us at the address on the cover of this Annual Report on Form 10-K.
| ITEM 1A. | RISK FACTORS |
You should carefully consider the risks and uncertainties described below, together with all of the other information included in this Report, in considering our business and prospects. The risks and uncertainties described below are not the only ones facing us. Additional risks and uncertainties not presently known to us or that we currently deem immaterial also may impair our business operations. The occurrence of any of the following risks could harm our business, financial condition or results of operations.
We have a history of operating losses and may not achieve profitability again.
We incurred operating losses in each annual fiscal year since our inception, except for 2011. For 2014 and 2013, we reported a net loss of $50.1 million and $18.0 million, respectively. As of December 31, 2014, we had an accumulated deficit of approximately $293.7 million. We do not expect to be profitable for fiscal 2015 and our ability to be profitable in the future will likely depend on our ability to continue to increase our revenues, which is subject to a number of factors including our ability to continue to successfully penetrate the Clinical market, our ability to successfully market the GeneXpert system and develop and market additional GeneXpert tests, our ability to sell directly to the smaller hospital (hospitals with less than 150 beds) and independent reference laboratory markets, our ability to secure regulatory approval of additional GeneXpert tests, our ability to gain FDA regulatory and international regulatory clearance for our new products, our ability to continue to grow sales of GeneXpert tests, our ability to compete effectively against current and future competitors, the increasing number of competitors in our market that could reduce the average selling price of our products, the development of our HBDC sales program, the amount of products sold through the HBDC program and the extent of global funding for such program, our ability to penetrate new geographic markets, global economic and political conditions and our ability to increase manufacturing throughput. Our ability to be profitable also depends on our expense levels and product gross margin, which are also influenced by a number of factors, including: the mix of revenues from Clinical reagent sales and GeneXpert system sales as opposed to GeneXpert Infinity system sales and sales under our HBDC program, both of which have lower gross margins; the resources we devote to developing and supporting our products; increases in manufacturing costs associated with our operations; our ability to improve manufacturing efficiencies, our ability to manage our inventory levels; third-party freight costs; the resources we devote to our research and development of and compliance with regulatory processes for potential products; license fees or royalties we may be required to pay; the potential need to acquire licenses to new technology or to use our technology in new markets, which could require us to pay unanticipated license fees and royalties in connection with these licenses; and the prices at which we are able to sell our GeneXpert systems and tests. Our manufacturing expansion efforts may prove more expensive than we currently anticipate, and we may not succeed in increasing our revenues to offset higher expenses These expenses or a reduction in the prices at which we are able to sell our products, among other things, may cause our net income and working capital to decrease. If we fail to grow our revenue, manage our expenses and improve our gross margin, we may never achieve profitability again. If we fail to do so, the market price of our common stock will likely decline.
12
Table of Contents
Our operating results may fluctuate significantly, our customers’ future purchases are difficult to predict and any failure to meet financial expectations may result in a decline in our stock price.
Our quarterly operating results may fluctuate in the future as a result of many factors, such as those described elsewhere in this section, many of which are beyond our control. Because our revenue and operating results are difficult to predict, we believe that period-to-period comparisons of our results of operations are not a good indicator of our future performance. Our operating results may be affected by the inability of some of our customers to consummate anticipated purchases of our products, whether due to adverse economic conditions, changes in internal priorities or, in the case of governmental customers, problems with the appropriations process, concerns over future United States federal government budgetary negotiations, variability and timing of orders and delays in our customer billing and collection processes related to our ongoing implementation of an enterprise resource planning system. Additionally, we have experienced, and expect to continue to experience, meaningful variability in connection with our commercial system placements and system placements and reagent pull-through in our HBDC program. This variability may cause our revenues and operating results to fluctuate significantly from quarter to quarter. Additionally, because of the limited visibility into the actual timing of future system placements, our operating results are difficult to forecast from quarter to quarter. Additionally, we expect moderate fluctuations from quarter to quarter in gross margin depending on product, geography and channel mix, as well as the revenue contribution from our HBDC program, which has lower margin than our other products. If revenue declines in a quarter, whether due to a delay in recognizing expected revenue, adverse economic conditions and unexpected costs or otherwise, our results of operations will be harmed because many of our expenses are relatively fixed. In particular, research and development, sales and marketing and general and administrative expenses are not significantly affected by variations in revenue. However, if we have an unexpected increase in costs and expenses in a quarter, our quarterly operating results will be affected. For example, for the year ended December 31, 2013, we incurred certain costs and inventory reserve provisions related to our manufacturing scale up and restructuring activities. Additionally, in July 2014, we began to self-insure for a portion of employee health insurance coverage and we estimate the liabilities associated with the risks retained by us, in part, by considering actuarial assumptions which, by their nature, are subject to a high degree of variability. If the number or severity of claims for which we are self-insured increases, or if we are required to accrue or pay additional amounts because the claims prove to be more severe than our original assessments, our operating results may be affected. If our quarterly operating results fail to meet or exceed the expectations of securities analysts or investors, our stock price could drop suddenly and significantly.
If we are unable to manufacture our products in sufficient quantities and in a timely manner, our operating results will be harmed, our ability to generate revenues could be diminished, and our gross margin may be negatively impacted.
Our revenues and other operating results will depend in large part on our ability to manufacture and assemble our products in sufficient quantities and in a timely manner. In the past, we have experienced lower than expected revenue due to intermittent interruptions in our supply chain, which also negatively impacted the efficiency of our manufacturing operations and our resulting gross margin. Any future interruptions we experience in the manufacturing or shipping of our products could delay our ability to recognize revenues in a particular quarter and could also adversely affect our relationships with our customers and erode customer confidence in our product availability. Manufacturing problems can and do arise, and as demand for our products increases, any such problems could have an increasingly significant impact on our operating results. In the past, we have experienced problems and delays in production that have impacted our product yield and the efficiency of our manufacturing operations and caused delays in our ability to ship finished products, and we may experience such delays in the future. We may not be able to react quickly enough to ship products and recognize anticipated revenues for a given period if we experience significant delays in the manufacturing process. In addition, we must maintain sufficient production capacity in order to minimize such delays, which carries fixed costs that we may not be able to offset if orders slow, which would adversely affect our operating margins. If we are unable to manufacture our products consistently, in sufficient quantities, and on a timely basis, our revenues from product sales, gross margins and our other operating results will be materially and adversely affected.
We have a limited number of suppliers for critical product components, and if such suppliers fail to deliver key product components in a timely manner, our manufacturing ability would be impaired and our product sales could suffer.
We depend on a limited number of suppliers that supply some of the components used in the manufacture of our systems and our disposable reaction tubes and cartridges. Strategic purchases of components are necessary for our business. If we need alternative sources for key component parts for any reason, these component parts may not be immediately available to us. If alternative suppliers are not immediately available, we will have to identify and qualify alternative suppliers, and production of these components may be delayed. We may not be able to find an adequate alternative supplier in a reasonable time period or on commercially acceptable terms, if at all. Shipments of affected products have been limited or delayed as a result of such problems in the past, and similar problems could occur in the future. For example, in the past, we have experienced intermittent interruptions in the supply of Xpert cartridge parts, which negatively impacted our product sales. In addition, some companies continue to experience financial difficulties, partially resulting from continued economic uncertainty. We cannot be assured that our suppliers will not be adversely affected by this uncertainty or that they will be able to continue to provide us with the components we need. Our inability to obtain our key source supplies for the manufacture of our products may require us to delay shipments of products, harm customer relationships or force us to curtail or cease operations.
13
Table of Contents
Our sales cycle can be lengthy, which can cause variability and unpredictability in our operating results.
The sales cycles for our systems can be lengthy, particularly during uncertain economic and political conditions, which makes it more difficult for us to accurately forecast revenues in a given period, and may cause revenues and operating results to vary significantly from period to period. For example, sales of our products often involve purchasing decisions by large public and private institutions and any purchases can require many levels of pre-approval. Additionally, because we only recently began selling directly to independent reference laboratories, the sales cycle to independent reference laboratories may be unpredictable for a period of time. In addition, certain Non-Clinical sales may depend on these institutions receiving research grants from various federal agencies, which grants vary considerably from year to year, in both amount and timing, due to the political process. Additionally, participants in our HBDC program may be dependent on funding from governmental agencies and/or non-governmental organizations and, accordingly, such customers’ purchase decisions may not be within their direct control and may be subject to lengthy administrative processes, the result of which is that the sales cycle in our HBDC program is lengthy and unpredictable. As a result, we may expend considerable resources on unsuccessful sales efforts or we may not be able to complete transactions on the schedule anticipated.
If we cannot successfully commercialize our products, our business could be harmed.
If our tests for use on our systems do not continue to gain market acceptance, we will be unable to generate significant sales, which will prevent us from achieving profitability. While we have received FDA clearance for a number of tests, these products may not experience increased sales. Many factors may affect the market acceptance and commercial success of our products, including:
| • | the timely expansion of our menu of tests; |
| • | our ability to fulfill orders; |
| • | the results of clinical trials needed to support any regulatory approvals of our tests; |
| • | our ability to obtain requisite FDA or other regulatory clearances or approvals for our tests under development on a timely basis; |
| • | the demand for the tests we introduce; |
| • | the timing of market entry for various tests for the GeneXpert systems; |
| • | our ability to convince our potential customers of the advantages and economic value of our systems and tests over competing technologies and products; |
| • | the breadth of our test menu relative to competitors; |
| • | changes to policies, procedures or what are considered best practices in clinical diagnostics, including practices for detecting and preventing healthcare-associated infections; |
| • | the extent and success of our marketing and sales efforts; |
| • | the functionality of new products that address market requirements and customer demands; |
| • | the pricing of our products; |
| • | the level of reimbursement for our products by third-party payers; and |
| • | the publicity concerning our systems and tests. |
In particular, we believe that the success of our business will depend in large part on our ability to continue to increase sales of our Xpert tests and our ability to introduce additional tests for the Clinical market. We believe that successfully expanding our business in the Clinical market is critical to our long-term goals and success. We have limited ability to forecast future demand for our products in this market. In addition, we have committed substantial funds to licenses that are required for us to compete in the Clinical market. If we cannot successfully penetrate the Clinical market to fully exploit these licenses, these investments may not yield significant returns, which could harm our business.
14
Table of Contents
The regulatory processes applicable to our products and operations are expensive, time-consuming and uncertain, and may prevent us from obtaining required approvals for the commercialization of some of our products.
In the Clinical market, our products are regulated as medical device products by the FDA and comparable agencies of other countries. In particular, FDA regulations govern activities such as product development, product testing, product labeling, product storage, premarket clearance or approval, manufacturing, advertising, promotion, product sales, reporting of certain product failures and distribution. Some of our products, depending on their intended use, will require premarket approval (“PMA”) or 510(k) clearance from the FDA prior to marketing. The 510(k) clearance process usually takes approximately 90 days from submission but can take longer. The PMA process is much more costly, lengthy and uncertain, and generally takes from six months to one year or longer from submission, depending on whether an advisory panel meeting is necessary. Clinical studies are generally required to support both PMA and 510(k) submissions. Certain of our products for use on our GeneXpert and SmartCycler systems, when used for clinical purposes in the United States, may require PMA, and all such tests will most likely, at a minimum, require 510(k) clearance. We are planning clinical studies for other proposed products. Products intended for use in a non-waived physician office laboratory will require an additional submission known as a CLIA waiver. CLIA waiver applications typically take approximately 180 days for approval, and require additional studies. Clinical trials are expensive and time-consuming, as are human factors studies required for CLIA waiver. In addition, the commencement or completion of any clinical trials may be delayed or halted for any number of reasons, including product performance, changes in intended use, changes in medical practice and the opinion of evaluator Institutional Review Boards. Additionally, since 2009, the FDA has significantly increased the scrutiny applied to its oversight of companies subject to its regulations, including 510(k) submissions, by hiring new investigators and increasing inspections of manufacturing facilities. We continue to monitor the CDRH’s implementation of its plan of action and analyze how its decisions will impact the approval or clearance of our products and our ability to improve our systems and tests. The CDRH also deferred action on several other initiatives, including the creation of a new class of devices that would be subject to heightened review processes, until the Institute of Medicine issues a related report on the 510(k) regulatory process, which was released in late July 2011. Many of the actions proposed by the CDRH could result in significant changes to the 510(k) process, which could complicate the product approval process, although we cannot predict the effect of such changes and cannot ascertain if such changes will have a substantive impact on the approval of our products. If we fail to adequately respond to the increased scrutiny and streamlined 510(k) submission process, our business may be adversely impacted. In 2014, the FDA issued several important guidance documents on assessing risks and benefits associated with use of 510(k) for PMA products, pre- and post-market balance, expedited PMA, and on oversight of laboratory developed tests. While the overall goal of these guidance documents was to streamline the regulatory process by applying a risk-based approach to the requirements for data collection in the pre- and post-market periods, it is uncertain how the guidance documents will actually be implemented. Likewise, the oversight of laboratory developed tests would require laboratories that compete with high risk (PMA) tests to go through FDA review. It is unclear if this guidance will be finalized. If it is, competition for PMA tests from laboratories would be reduced.
Failure to comply with the applicable requirements can result in, among other things, warning letters, administrative or judicially imposed sanctions such as injunctions, civil penalties, recall or seizure of products, total or partial suspension of production, refusal to grant premarket clearance or PMA for devices, withdrawal of marketing clearances or approvals, or criminal prosecution. With regard to future products for which we seek 510(k) clearance, PMA approval, or CLIA waiver from the FDA, any failure or material delay to obtain such clearance or approval could harm our business. If the FDA were to disagree with our regulatory assessment and conclude that approval or clearance is necessary to market the products, we could be forced to cease marketing the products and seek approval or clearance. In addition, it is possible that the current regulatory framework could change or additional regulations could arise at any stage during our product development or marketing, which may adversely affect our ability to obtain or maintain approval of our products and could harm our business.
Our manufacturing facilities located in Sunnyvale and Lodi, California, Seattle, Washington and Stockholm, Sweden, where we assemble and produce the GeneXpert and SmartCycler systems, cartridges and other molecular diagnostic kits and reagents, are subject to periodic regulatory inspections by the FDA and other federal and state and foreign regulatory agencies. For example, these facilities are subject to Quality System Regulations (“QSR”) of the FDA and are subject to annual inspection and licensing by the States of California and Washington and European regulatory agencies. If we fail to maintain these facilities in accordance with the QSR requirements, international quality standards or other regulatory requirements, our manufacturing process could be suspended or terminated, which would prevent us from being able to provide products to our customers in a timely fashion and therefore harm our business.
Recently enacted healthcare legislation reforming the U.S. healthcare system, as well as future reforms, may have a material adverse effect on our financial condition and results of operations.
In March 2010, the U.S. President signed the Patient Protection and Affordable Care Act, as amended by the Health Care and Education Reconciliation Act (collectively, the “PPACA”), which makes changes that are expected to significantly impact the pharmaceutical and medical device industries. One of the principal aims of the PPACA as currently enacted is to expand health insurance coverage to approximately 32 million Americans who were previously uninsured. The PPACA contains a number of
15
Table of Contents
provisions designed to generate the revenues necessary to fund the coverage expansions among other things. This includes new fees or taxes on certain health-related industries, including medical device manufacturers. Beginning in 2013, medical device manufacturers were required to pay an excise tax (or sales tax) of 2.3% of certain U.S. medical device revenues. Though there are some exceptions to the excise tax, this excise tax does apply to all or most of our products sold within the United States.
The taxes imposed by the PPACA and the expansion in the government’s role in the U.S. healthcare industry may result in decreased profits to us, lower reimbursement by payors for our products, and/or reduced medical procedure volumes, all of which may adversely affect our business, financial condition and results of operations.
In addition, other legislative changes have been proposed and adopted since the PPACA was enacted. More recently, on August 2, 2011, the U.S. President signed into law the Budget Control Act of 2011, which, among other things, creates the Joint Select Committee on Deficit Reduction to recommend proposals in spending reductions to Congress. The Joint Select Committee did not achieve a targeted deficit reduction of at least $1.2 trillion for the years 2013 through 2021, triggering the legislation’s automatic reduction to several government programs. This included aggregate reductions to Medicare payments to providers of 2% per fiscal year, which went into effect on April 1, 2013, and will remain in effect through 2024 unless additional Congressional action is taken. On January 2, 2013, the American Taxpayer Relief Act of 2012 was signed into law, which, among other things, further reduced Medicare payments to several providers, including hospitals, imaging centers and cancer treatment centers, , which as a result could mean that such providers have less available funds with which to purchase our products.
We expect that additional state and federal health care reform measures may be adopted in the future, any of which could have a material adverse effect on our industry generally and our ability to successfully commercialize our products. For example, the U.S. government has in the past considered, is currently considering and may in the future consider healthcare policies and proposals intended to curb rising healthcare costs, including those that could significantly affect both private and public reimbursement for healthcare services. Further, state and local governments, as well as a number of foreign governments, are also considering or have adopted similar types of policies. Future significant changes in the healthcare systems in the United States or elsewhere, and current uncertainty about whether and how changes may be implemented, could have a negative impact on the demand for our products. We are unable to predict whether other healthcare policies, including policies stemming from legislation or regulations affecting our business may be proposed or enacted in the future; what effect such policies would have on our business; or the effect ongoing uncertainty about these matters will have on the purchasing decisions of our customers.
Our HBDC program exposes us to increased risks of variability and unpredictable operating results.
Our HBDC program exposes us to risks that are additional and different from the risks associated with our commercial operations, including among other things:
| • | the participants in our HBDC program are located in less developed countries, exposing us to customers in countries that may have less political, social or economic stability and less developed infrastructure and legal systems; |
| • | the sales cycle in our HBDC program is lengthy and unpredictable, as HBDC program participants are frequently dependent upon governmental agencies and/or non-governmental organizations with additional administrative processes, causing variability and unpredictability in our operating results and timing of cash collection; |
| • | our HBDC business has lower gross margins and, therefore, growth in our HBDC business negatively impacts our gross margins as a whole; and |
| • | our collaborative partners and other supporters, such as FIND, BMGF, USAID, UNITAID and the World Health Organization, may cease to devote financial resources to or otherwise cease to support our HBDC program. |
Continued unpredictable sales cycle and lower gross margins and/or an adverse development relating to one or more of these risks could negatively impact our business, results of operations and financial condition. Additionally, our HBDC program facilitates the expansion of our commercial operations into additional geographic locations and, to the extent that our HBDC program is ineffective as a result of one or more of these risks, the international expansion of our commercial operations could suffer.
We rely on licenses of key technology from third parties and may require additional licenses for many of our new product candidates.
We rely on third-party licenses to be able to sell many of our products, and we could lose these third-party licenses for a number of reasons, including, for example, early terminations of such agreements due to breaches or alleged breaches by either party to the agreement. If we are unable to enter into a new agreement for licensed technologies, either on terms that are acceptable to us or at all, we may be unable to sell some of our products or access some geographic or industry markets. We also need to introduce new products and product features in order to market our products to a broader customer base and grow our revenues, and many new products and product features could require us to obtain additional licenses and pay additional license fees and royalties. Furthermore,
16
Table of Contents
for some markets, we intend to manufacture reagents and tests for use on our systems. We believe that manufacturing reagents and developing tests for our systems is important to our business and growth prospects but may require additional licenses, which may not be available on commercially reasonable terms or at all. Our ability to develop, manufacture and sell products, and our strategic plans and growth, could be impaired if we are unable to obtain these licenses or if these licenses are terminated or expire and cannot be renewed. We may not be able to obtain or renew licenses for a given product or product feature or for some reagents on commercially reasonable terms, if at all. Furthermore, some of our competitors have rights to technologies and reagents that we do not have which may put us at a competitive disadvantage in certain circumstances and could adversely affect our performance.
We may face risks associated with acquisitions of companies, products and technologies and our business could be harmed if we are unable to address these risks.
In order to remain competitive, obtain key competencies, consolidate our supply chain or sales force, acquire complementary products or technologies, or for other reasons, we may seek to acquire additional businesses, products or technologies. Even if we identify an appropriate acquisition or are presented with appropriate opportunities to acquire or make other investments, we may not be successful in negotiating the terms of the acquisition, financing the acquisition, consummating the acquisition or effectively integrating the acquired business, product or technology into our existing business and operations. For example, in 2012, we acquired one of our plastic molders, in 2013, we acquired distributors in two of our international locations, and in 2014, we re-acquired certain product distribution rights and acquired customer relationship assets from a former distributor in the United States. We have limited experience in successfully acquiring and integrating businesses, products and technologies, and even if we are able to consummate an acquisition or other investment, we may not realize the anticipated benefits of such acquisitions or investments, including our recent acquisitions. We may face risks, uncertainties and disruptions, including difficulties in the integration of the operations and services of these acquisitions or any other acquired company, integration of acquired technology with our products, diversion of our management’s attention from other business concerns, the potential loss of key employees or customers of the acquired businesses and impairment charges if future acquisitions are not as successful as we originally anticipate. If we fail to successfully integrate companies, assets, products or technologies that we acquire or if we fail to successfully exploit acquired product distribution rights and maintain acquired relationships with customers, our business could be harmed. Furthermore, we may have to incur debt or issue equity securities to pay for any additional future acquisitions or investments or issue shares of common stock as consideration in the acquisition, the issuance of which could be dilutive to our existing shareholders. In addition, our operating results may suffer because of acquisition-related costs or amortization expenses or charges relating to acquired intangible assets. Furthermore, identifying, contemplating, negotiating or completing an acquisition and integrating an acquired business, product or technology could significantly divert management and employee time and resources.
The current uncertainty in global economic conditions makes it particularly difficult to predict product demand and other related matters and makes it more likely that our actual results could differ materially from expectations.
Our operations and performance depend on global economic conditions, which have been adversely impacted by continued global economic uncertainty, political instability and military hostilities in multiple geographies, the recent rapid strengthening of the U.S. Dollar compared to foreign currencies and monetary and international financial uncertainties. These conditions have and may continue to make it difficult for our customers and potential customers to accurately forecast and plan future business activities, and have caused our customers and potential customers to slow or reduce spending, particularly for systems. Furthermore, during economic uncertainty, our customers have experienced and may continue to experience issues gaining timely access to sufficient credit, which could result in their unwillingness to purchase products or an impairment of their ability to make timely payments to us. If that were to continue to occur, we might experience decreased sales, be required to increase our allowance for doubtful accounts and our days sales outstanding would be negatively impacted. Even with improved global economic conditions, it may take time for our customers to establish new budgets and return to normal purchasing patterns. We cannot predict the reoccurrence of any economic slowdown or the sustainability of improved economic conditions, worldwide, in the United States or in our industry. These and other economic factors could have a material adverse effect on demand for our products and on our financial condition and operating results.
If certain of our products fail to obtain an adequate level of reimbursement from third-party payers, our ability to sell products in the Clinical market would be harmed.
Our ability to sell our products in the Clinical market will depend in part on the extent to which reimbursement for tests using our products will be available from government health administration authorities, private health coverage insurers, managed care organizations and other organizations. There are efforts by governmental and third-party payers to contain or reduce the costs of
17
Table of Contents
healthcare through various means and the continuous growth of managed care, together with efforts to reform the healthcare delivery system in the United States and Europe, has increased pressure on healthcare providers and participants in the healthcare industry to reduce costs. Consolidation among healthcare providers and other participants in the healthcare industry has resulted in fewer, more powerful healthcare groups, whose purchasing power gives them cost containment leverage. Additionally, third-party payers are increasingly challenging the price of medical products and services. If purchasers or users of our products are not able to obtain adequate reimbursement for the cost of using our products, they may forego or reduce their use. Significant uncertainty exists as to the reimbursement status of newly approved healthcare products and whether adequate third-party coverage will be available.
The life sciences industry is highly competitive and subject to rapid technological change, if our competitors and potential competitors develop superior products and technologies, our competitive position and results of operations would suffer.
We face intense competition from a number of companies that offer products in our target markets, some of which have substantially greater financial resources and larger, more established marketing, sales and service organizations than we do. These competitors include:
| • | companies developing and marketing sequence detection systems for industrial research products; |
| • | diagnostic and pharmaceutical companies; |
| • | companies developing drug discovery technologies; and |
| • | companies developing or offering biothreat detection technologies. |
Several companies provide systems and reagents for DNA amplification or detection. Life Technologies Corporation (acquired by Thermo Fisher Scientific) and Roche sell systems integrating DNA amplification and detection (sequence detection systems) to the commercial market. Roche, Abbott, Becton Dickinson, Qiagen, Hologic, Luminex, Meridian, bioMerieux, and Quidel sell sequence detection systems, some with separate robotic batch DNA purification systems and sell reagents to the Clinical market. Other companies such as Nanosphere Inc., Alere Inc., and GenMark Diagnostics, Inc. offer molecular tests. Additionally, we anticipate that in the future, additional competitors will emerge that offer a broad range of competing products.
The life sciences industry is characterized by rapid and continuous technological innovation. We may need to develop new technologies for our products to remain competitive. One or more of our current or future competitors could render our present or future products technologically obsolete or uneconomical by reducing the prices of their competing products. In addition, the introduction or announcement of new products by us or others could result in a delay of or decrease in sales of existing products, as we await regulatory approvals and as customers evaluate these new products. We may also encounter other problems in the process of delivering new products to the marketplace such as problems related to design, development or manufacturing of such products, and as a result we may be unsuccessful in selling such products. Our future success depends on our ability to compete effectively against current technologies, as well as to respond effectively to technological advances by developing and marketing products that are competitive in the continually changing technological landscape.
If our products do not perform as expected or the reliability of the technology on which our products are based is questioned, we could experience lost revenue, delayed or reduced market acceptance of our products, increased costs and damage to our reputation.
Our success depends on the market’s confidence that we can provide reliable, high-quality molecular test systems. We believe that customers in our target markets are likely to be particularly sensitive to product defects and errors. Our reputation and the public image of our products or technologies may be impaired if our products fail to perform as expected or our products are perceived as difficult to use. Despite testing, defects or errors could occur in our products or technologies. Furthermore, with respect to the USPS BDS program, our products are incorporated into larger systems that are built and delivered by others and we cannot control many aspects of the final system.
In the future, if our products experience a material defect or error, this could result in loss or delay of revenues, delayed market acceptance, damaged reputation, diversion of development resources, legal claims, increased insurance costs or increased service and warranty costs, any of which could harm our business. Such defects or errors could also prompt us to amend certain warning labels or narrow the scope of the use of our products, either of which could hinder our success in the market. Furthermore, any product failure in the overall USPS BDS program, even if it is unrelated to our products, could harm our business. Even after any underlying concerns or problems are resolved, any widespread concerns regarding our technology or any manufacturing defects or performance errors in our products could result in lost revenue, delayed market acceptance, damaged reputation, increased service and warranty costs and claims against us.
18
Table of Contents
If product liability lawsuits are successfully brought against us, we may face reduced demand for our products and incur significant liabilities.
We face an inherent risk of exposure to product liability claims if our technologies or systems are alleged to have caused harm or do not perform in accordance with specifications, in part because our products are used for sensitive applications. We cannot be certain that we would be able to successfully defend any product liability lawsuit brought against us. Regardless of merit or eventual outcome, product liability claims may result in:
| • | decreased demand for our products; |
| • | injury to our reputation; |
| • | increased product liability insurance costs; |
| • | costs of related litigation; and |
| • | substantial monetary awards to plaintiffs. |
Although we carry product liability insurance, if we become the subject of a successful product liability lawsuit, our insurance may not cover all substantial liabilities, which could harm our business.
If our direct selling efforts for our products fail, our business expansion plans could suffer and our ability to generate sales will be diminished.
We have a relatively small sales force compared to some of our competitors. Further, we recently consolidated our global commercial operations under a single executive to emphasize end-to-end accountability, eliminate duplication and clarify decision responsibilities, and reduce organizational complexity. Our former Executive Vice President, International Commercial Operations, who joined us in June 2014, transitioned into the new role of Executive Vice President, Worldwide Commercial Operations in October 2014, where he is responsible for his prior duties and for our North American commercial operations, including the planned expansion of our U.S. sales organization. Our former Executive Vice President, North American Commercial Operations transitioned out of Cepheid in October 2014.
If our distributor relationships are not successful, our ability to market and sell our products would be harmed and our financial performance will be adversely affected.
We depend on relationships with distributors for the marketing and sales of our products in the Clinical and Non-Clinical markets in various geographic regions, and we have a limited ability to influence their efforts. We expect to continue to rely substantially on our distributor relationships for sales into other markets or geographic regions, that are key to our long-term growth strategy. Relying on distributors for our sales and marketing could harm our business for various reasons, including:
| • | agreements with distributors may terminate prematurely due to disagreements or may result in litigation between the partners; |
| • | we may not be able to renew existing distributor agreements on acceptable terms; |
| • | our distributors may not devote sufficient resources to the sale of our products; |
| • | our distributors may be unsuccessful in marketing our products; |
| • | our existing relationships with distributors may preclude us from entering into additional future arrangements with other distributors; and |
| • | we may not be able to negotiate future distributor agreements on acceptable terms. |
If any of our distribution agreements are terminated or if we elect to distribute new products directly, we will have to invest in additional sales resources, including additional field sales personnel, which would increase future selling, general and administrative expenses. For example, in October 2014, we terminated our distribution agreement with the Laboratory Supply Company and transitioned the smaller hospital market from a distributor sales model to a direct sales model. As a result, we are investing in additional sales resources to sell directly to the smaller hospital market and are exposed to risks as a result of transitioning the smaller hospital market from a distributor sales model to a direct sales model, such as difficulties maintaining relationships with specific customers and hiring appropriately trained personnel, any of which could result in lower revenues than we previously received from our distributor in that market. If we elect to distribute new products directly in other markets or in new geographic regions, then we would be exposed to similar risks.
19
Table of Contents
If we desire to enter into other distribution arrangements, we may not be able to enter into new distribution agreements on satisfactory terms, or at all. If we fail to enter into acceptable distribution agreements or fail to successfully market our products, our product sales may decrease.
We may be subject to third-party claims that require additional licenses for our products and we could face costly litigation, which could cause us to pay substantial damages and limit our ability to sell some or all of our products.
Our industry is characterized by a large number of patents, claims of which appear to overlap in many cases. As a result, there is a significant amount of uncertainty regarding the extent of patent protection and infringement. Companies may have pending patent applications, which are typically confidential for the first eighteen months following filing that cover technologies we incorporate in our products. Accordingly, we may be subjected to substantial damages for past infringement or be required to modify our products or stop selling them if it is ultimately determined that our products infringe a third party’s proprietary rights. Moreover, from time to time, we are subject to patent litigation and receive correspondence and other communications from companies that ask us to evaluate the need for a license of patents they hold, and indicating or suggesting that we need a license to their patents in order to offer our products and services or to conduct our business operations. For example, we are currently engaged in litigation as further described in Part I, Item 3 “Legal Proceedings.” At this point in time we believe that it is probable that the Roche arbitration proceeding disclosed in Part I, Item 3 “Legal Proceedings” could result in a material loss. Accordingly, we recorded an estimated charge of $20 million as our best estimate of the potential loss as of December 31, 2014, which was included in our consolidated balance sheet. Given the inherent uncertainty of arbitration and the nature of the claims in this matter, it is possible that we may incur additional material losses but an estimate of such a charge cannot be made at this time. Additionally, in September 2012, we entered into an agreement with Abaxis pursuant to which, in exchange for a one-time payment by us to Abaxis of $17.3 million, all present and future litigation relating to the alleged infringement of certain Abaxis patents by us and our counterclaims against Abaxis were resolved. Even if we are successful in defending against any current or future patent claims, we would likely incur substantial costs in doing so. Any litigation related to existing claims and others that may arise in the future would likely consume our resources and could lead to significant damages, royalty payments or an injunction on the sale of certain products. Any additional licenses to patented technology could obligate us to pay substantial additional royalties, which could adversely impact our product costs and harm our business.
If we fail to maintain and protect our intellectual property rights, our competitors could use our technology to develop competing products and our business will suffer.
Our competitive success will be affected in part by our continued ability to obtain and maintain patent protection for our inventions, technologies and discoveries, including our intellectual property that includes technologies that we license. Our ability to do so will depend on, among other things, complex legal and factual questions. We have patents related to some of our technology and have licensed some of our technology under patents of others. Our patents and licenses may not successfully preclude others from using our technology. Our pending patent applications may lack priority over applications submitted by third parties or may not result in the issuance of patents. Even if issued, our patents may not be sufficiently broad to provide protection against competitors with similar technologies and may be challenged, invalidated or circumvented.
In addition, there are numerous recent changes to the patent laws and proposed changes to the rules of the United States Patent and Trademark Office, which may have a significant impact on our ability to protect our technology and enforce our intellectual property rights. For example, in September 2011, the United States enacted sweeping changes to the United States patent system under the Leahy-Smith America Invents Act, including changes that would transition the United States from a “first-to-invent” system to a “first-to-file” system and alter the processes for challenging issued patents. These changes could increase the uncertainties and costs surrounding the prosecution of our patent applications and the enforcement or defense of our issued patents. In addition to patents, we rely on a combination of trade secrets, copyright and trademark laws, nondisclosure agreements, licenses and other contractual provisions and technical measures to maintain and develop our competitive position with respect to intellectual property. Nevertheless, these measures may not be adequate to safeguard the technology underlying our products. For example, employees, consultants and others who participate in the development of our products may breach their agreements with us regarding our intellectual property, and we may not have adequate remedies for the breach. We also may not be able to effectively protect our intellectual property rights in some foreign countries, as many countries do not offer the same level of legal protection for intellectual property as the United States. Furthermore, for a variety of reasons, we may decide not to file for patent, copyright or trademark protection outside of the United States. Our trade secrets could become known through other unforeseen means. Notwithstanding our efforts to protect our intellectual property, our competitors may independently develop similar or alternative technologies or products that are equal or superior to our technology. Our competitors may also develop similar products without infringing on any of our intellectual property rights or design around our proprietary technologies. Furthermore, any efforts to enforce our proprietary rights could result in disputes and legal proceedings that could be costly and divert attention from our business.
20
Table of Contents
The United States Government has certain rights to use and disclose some of the intellectual property that we license and could exclusively license it to a third party if we fail to achieve practical application of the intellectual property.
Aspects of the technology licensed by us under agreements with third party licensors may be subject to certain government rights. Government rights in inventions conceived or reduced to practice under a government-funded program may include a non-exclusive, royalty-free worldwide license to practice or have practiced such inventions for any governmental purpose. In addition, the United States federal government has the right to require us or our licensors (as applicable) to grant licenses which would be exclusive under any of such inventions to a third party if they determine that: (1) adequate steps have not been taken to commercialize such inventions in a particular field of use; (2) such action is necessary to meet public health or safety needs; or (3) such action is necessary to meet requirements for public use under federal regulations. Further, the government rights include the right to use and disclose, without limitation, technical data relating to licensed technology that was developed in whole or in part at government expense. At least one of our technology license agreements contains a provision recognizing these government rights.
We may need to initiate lawsuits to protect or enforce our patents, which would be expensive and, if we lose, may cause us to lose some, if not all, of our intellectual property rights and thereby impair our ability to compete.
We rely on patents to protect a large part of our intellectual property. To protect or enforce our patent rights, we may initiate patent litigation against third parties, such as infringement suits or interference proceedings. These lawsuits could be expensive, take significant time and divert management’s attention from other business concerns. They would also put our patents at risk of being invalidated or interpreted narrowly, and our patent applications at risk of not issuing. We may also provoke these third parties to assert claims against us. Patent law relating to the scope of claims in the technology fields in which we operate is still evolving and, consequently, patent positions in our industry are generally uncertain. We cannot be assured that we would prevail in any of these suits or that the damages or other remedies awarded, if any, would be commercially valuable. During the course of these suits, there may be public announcements of the results of hearings, motions and other interim proceedings or developments in the litigation. Any public announcements related to such patent suits could cause our stock price to decline.
Our international operations subject us to additional risks and costs.
We conduct operations on a global basis. These operations are subject to a number of difficulties and special costs, including:
| • | compliance with multiple, conflicting and changing governmental laws and regulations, including United States laws such as the Foreign Corrupt Practices Act and local laws that prohibit bribes and certain payments to governmental officials such as the UK Bribery Act 2010, data privacy requirements, labor relations laws, tax laws, anti-competition regulations, import and trade restrictions, and export requirements; |
| • | increased regulatory risk, including additional regulatory requirements different or more stringent than those in the United States; |
| • | laws and business practices favoring local competitors; |
| • | foreign exchange and currency risks; |
| • | exposure to risks associated with sovereign debt uncertainties in Europe and other foreign countries; |
| • | difficulties in collecting accounts receivable or longer payment cycles; |
| • | import and export restrictions and tariffs; |
| • | difficulties staffing and managing foreign operations; |
| • | difficulties and expense in enforcing intellectual property rights; |
| • | business risks, including fluctuations in demand for our products and the cost and effort to conduct international operations and travel abroad to promote international distribution and overall global economic conditions; |
| • | multiple conflicting tax laws and regulations; and |
| • | political and economic instability and outbreak of military hostilities. |
We intend to expand our international sales and marketing activities, including through our direct sales operations and through relationships with additional international distribution partners. We may not be able to attract international distribution partners that will be able to market our products effectively or may have trouble entering geographic markets that are less receptive to sales from foreign entities.
21
Table of Contents
Additionally, our continued expansion into less developed countries in connection with our HBDC program, which may have less political, social or economic stability and less developed infrastructure and legal systems, heightens the exposure of the risks set forth above. An adverse development relating to one or more of these risks, or any other risks associated with our operations in less developed countries, could adversely affect our ability to conduct and expand our business, which could negatively impact our business, results of operations and financial condition.
Our international operations could also increase our exposure to international laws and regulations. If we cannot comply with foreign laws and regulations, which are often complex and subject to variation and unexpected changes, we could incur unexpected costs and potential litigation. For example, the governments of foreign countries might attempt to regulate our products and services or levy sales or other taxes relating to our activities. In addition, foreign countries may impose tariffs, duties, price controls or other restrictions on foreign currencies or trade barriers, any of which could make it more difficult for us to conduct our business.
Further, as we continue to expand our operations worldwide and potentially sell our products and services to governmental institutions, compliance with Foreign Corrupt Practices Act and local laws that also prohibit corrupt payments to governmental officials such as the UK Bribery Act 2010 will become more important and we will need to continue to enhance our internal controls to ensure compliance with applicable laws and regulations.
A significant portion of our sales are denominated in foreign currencies and currency fluctuations and hedging expenses may cause our revenue and earnings to fluctuate and our foreign currency hedging program may not adequately offset foreign currency exposure.
A significant percentage of our product sales are denominated in foreign currencies, primarily the Euro. When the U.S. dollar strengthens against these foreign currencies, as it has recently, the relative value of sales made in the respective foreign currency decreases. Overall, we are a net receiver of foreign currencies and, therefore, benefit from a weaker U.S. dollar and are adversely affected by a stronger U.S. dollar relative to those foreign currencies in which we transact significant amounts of business.
We use foreign currency exchange forward contracts to hedge a portion of our forecasted revenue. We also hedge certain monetary assets and liabilities denominated in foreign currencies, which reduces but does not eliminate our exposure to currency fluctuations between the date a transaction is recorded and the date that cash is collected or paid. We cannot predict future fluctuations in the foreign currency exchange rate. If the U.S. dollar appreciates significantly against certain currencies and our hedging program does not sufficiently offset the effects of such appreciation, our results of operations will be adversely affected and our stock price may decline.
Additionally, the expenses that we recognize in relation to our hedging activities can cause our earnings to fluctuate. The changes in interest rate spreads between the foreign currencies that we hedge and the U.S. dollar impact the level of hedging expenses that we recognize in a particular period.
We intend to expand our business into new geographic markets, and this expansion may be costly and may not be successful.
We plan to make substantial investments of both time and money as part of our continued and existing expansion into new geographic markets. When we expand into new geographic markets, we incur set up costs for new personnel, facilities, travel, inventory and related expenses in advance of securing new customer contracts. We may face challenges operating in new business climates with which we are unfamiliar, including facing difficulties in staffing and managing our new operations, fluctuations in currency exchange rates, exposure to additional regulatory requirements including additional regulatory filing and approval requirements for our products, changes in political and economic conditions, and exposure to additional and potentially adverse tax regimes. Our success in any new markets will depend, in part, on our ability to anticipate and effectively manage these and other risks. It is also possible that we will face increased competition in any new markets as other companies attempt to take advantage of the new market opportunities, and any such competitors could have substantially more resources than we do and may have better relationships and a greater understanding of the region. If we fail to manage the risks inherent in our geographic expansion, we could incur substantial capital and operating costs without any related increase in revenue, which would harm our operating results. Further, even if our geographic expansion is successful, failure to effectively manage our growth in a cost-effective manner could result in declines in customer satisfaction, increased costs or disruption of our operations.
22
Table of Contents
The nature of some of our products may also subject us to export control regulation by the United States Department of State and the Department of Commerce. Violations of these regulations can result in monetary penalties and denial of export privileges.
Our sales to customers outside the United States are subject to government export regulations that require us to obtain licenses to export such products. If the United States government was to amend its export control regulations, such amendments could create uncertainty in our industry, result in increased costs of compliance, and further restrict our ability to sell our products abroad. In particular, we are required to obtain a new license for each purchase order of our biothreat products that are exported outside the United States. Delays or denial of the grant of any required license, or changes to the regulations that make such delays or denials more likely or frequent, could make it difficult to make sales to foreign customers and could adversely affect our revenue. In addition, we could be subject to fines and penalties for violation of these export regulations if we were found in violation. Such violation could result in penalties, including prohibiting us from exporting our products to one or more countries, and could materially and adversely affect our business.
If we fail to retain key members of our staff, our ability to conduct and expand our business would be impaired.
We are highly dependent on the principal members of our management and scientific staff and on the development of adequate succession plans for such employees. If we lose the services of any of these persons and we are unable to find a suitable replacement in a timely manner, we may be challenged to effectively manage our business and execute our strategy, which could seriously harm our product development and commercialization efforts. In addition, we require skilled personnel in areas such as microbiology, clinical, sales, marketing and finance. We generally do not enter into employment agreements requiring these employees to continue in our employment for any period of time. Attracting, retaining, developing and training personnel, including management, with the requisite skills remains challenging, particularly in the Silicon Valley, where our main office is located. For example, in February 2015, our Chief Financial Officer since April 2008 left our company to pursue an opportunity with another company and we are currently conducting a formal search for a new permanent Chief Financial Officer. If at any point we are unable to hire, train, develop and retain a sufficient number of qualified employees to match our growth, our ability to conduct and expand our business could be seriously reduced.
We may face issues in connection with our implementation of an enterprise resource planning (or ERP) system.
In order to support our growth, we are currently in the process of implementing an enterprise resource planning, or ERP, system. This is a lengthy and expensive process. We have incurred and expect to continue to incur additional expenses in connection with our implementation of an ERP system. Our anticipated ERP system implementation may not result in improvements that outweigh its costs and may disrupt our operations. Many companies have experienced delays and difficulties with the implementation of new or changed ERP systems that have had a negative effect on their business. If we are unable to successfully plan, design or implement the new ERP system, it could have a material adverse effect on our financial position, results of operations and cash flows. There are many costs and risks associated with ERP system implementation, including:
| • | inability to fill customer orders accurately and on a timely basis, or at all; |
| • | delays in our billing and collection processes; |
| • | inability to process payments to vendors accurately and in a timely manner; |
| • | disruption of our internal control structure; |
| • | inability to fulfill our SEC or other governmental reporting requirements in a timely or accurate manner; |
| • | inability to fulfill federal, state and local tax filing requirements in a timely or accurate manner; |
| • | increased demands on management and staff time to the detriment of other corporate initiatives; and |
| • | significant capital and operating expenditures. |
23
Table of Contents
If we become subject to claims relating to improper handling, storage or disposal of hazardous materials, we could incur significant cost and time to comply.
Our research and development processes involve the controlled storage, use and disposal of hazardous materials, including biological hazardous materials. We are subject to foreign, federal, state and local regulations governing the use, manufacture, storage, handling and disposal of materials and waste products. We may incur significant costs complying with both existing and future environmental laws and regulations. In particular, we are subject to regulation by the Occupational Safety and Health Administration (“OSHA”) and the Environmental Protection Agency (“EPA”), and to regulation under the Toxic Substances Control Act and the Resource Conservation and Recovery Act in the United States OSHA or the EPA may adopt regulations that may affect our research and development programs. We are unable to predict whether any agency will adopt any regulations that would have a material adverse effect on our operations.
The risk of accidental contamination or injury from hazardous materials cannot be eliminated completely. In the event of an accident, we could be held liable for any damages that result, and any liability could exceed the limits or fall outside the coverage of our workers’ compensation insurance. We may not be able to maintain insurance on acceptable terms, if at all.
If a catastrophe strikes our manufacturing or warehousing facilities, we may be unable to manufacture or distribute our products for a substantial amount of time and we may experience inventory shortfalls, which would cause us to experience lost revenues.
Our manufacturing facilities are located in Sunnyvale and Lodi, California, Seattle, Washington, and Stockholm, Sweden. Although we have business interruption insurance, our facilities and some pieces of manufacturing equipment are difficult to replace and could require substantial replacement lead-time. Various types of disasters, including earthquakes, fires, floods and acts of terrorism, may affect our manufacturing facilities. Earthquakes are of particular significance since our primary manufacturing facilities in California are located in an earthquake-prone area. In the event our existing manufacturing facilities or equipment are affected by man-made or natural disasters, we may be unable to manufacture products for sale or meet customer demands or sales projections. If our manufacturing operations were curtailed or ceased, it would seriously harm our business.
We might require additional capital to respond to business challenges or acquisitions, and such capital might not be available.
Though we completed a sale of $345 million of convertible senior notes in February 2014, we may in the future need to obtain additional equity or debt financing to respond to business challenges or acquire complementary businesses and technologies. Any additional equity or debt financing, however, might not be available when needed or, if available, might not be available on terms satisfactory to us. In addition, to the extent that additional capital is raised through the sale of equity or convertible debt securities, the issuance of these securities could result in dilution to our shareholders. In addition, these securities may be sold at a discount from the market price of our common stock and may include rights, preferences or privileges senior to those of our common stock. If additional equity or debt financing is needed and we are unable to obtain adequate financing or financing on terms satisfactory to us, our ability to continue to support our business growth and to respond to business challenges could be significantly limited.
We rely on relationships with collaborative partners and other third parties for development, supply and marketing of certain products and potential products, and such collaborative partners or other third parties could fail to perform sufficiently.
We believe that our success in penetrating our target markets depends in part on our ability to develop and maintain collaborative relationships with other companies. Relying on collaborative relationships is risky to our future success for our products because, among other things:
| • | our collaborative partners may not devote sufficient resources to the success of our collaborations; |
| • | our collaborative partners may not obtain regulatory approvals necessary to continue the collaborations in a timely manner; |
| • | our collaborative partners may be acquired by other companies and decide to terminate our collaborative partnership or become insolvent; |
| • | our collaborative partners may develop technologies or components competitive with our products; |
| • | components developed by collaborators could fail to meet specifications, possibly causing us to lose potential projects and subjecting us to liability; |
| • | disagreements with collaborators could result in the termination of the relationship or litigation; |
| • | collaborators may not have sufficient capital resources; |
| • | collaborators may pursue tests or other products that will not generate significant volume for us, but may consume significant research and development and manufacturing resources; and |
| • | we may not be able to negotiate future collaborative arrangements, or renewals of existing collaborative agreements, on acceptable terms. |
24
Table of Contents
Because these and other factors may be beyond our control, the development or commercialization of our products involved in collaborative partnerships may be delayed or otherwise adversely affected.
If we or any of our collaborative partners terminate a collaborative arrangement, we may be required to devote additional resources to product development and commercialization or we may need to cancel some development programs, which could adversely affect our product pipeline and business.
We enter into collaborations with third parties that may not result in the development of commercially viable products or the generation of significant future revenues.
In the ordinary course of our business, we enter into collaborative arrangements to develop new products or to pursue new markets. These collaborations may not result in the development of products that achieve commercial success, and these collaborations could be terminated prior to developing any products. In addition, our collaboration partners may not necessarily purchase the volume of products that we expect. Accordingly, we cannot be assured that any of our collaborations will result in the successful development of a commercially viable product or result in significant additional revenues in the future.
The “conflict minerals” rule of the Securities and Exchange Commission, or SEC, has caused us to incur additional expenses, could limit the supply and increase the cost of certain metals used in manufacturing our products, and could make us less competitive in our target markets.
On August 22, 2012, the SEC adopted a rule requiring disclosure by public companies of the origin, source and chain of custody of specified minerals, known as conflict minerals, that are necessary to the functionality or production of products manufactured or contracted to be manufactured. The rule requires companies to obtain sourcing data from suppliers, engage in supply chain due diligence, and file annually with the SEC a specialized disclosure report on Form SD covering the prior calendar year. The rule could limit our ability to source at competitive prices and to secure sufficient quantities of certain minerals used in the manufacture of our products, specifically tantalum, tin, gold and tungsten, as the number of suppliers that provide conflict-free minerals may be limited. We may incur material costs associated with complying with the rule, such as costs related to the determination of the origin, source and chain of custody of the minerals used in our products, the adoption of conflict minerals-related governance policies, processes and controls, and possible changes to products or sources of supply as a result of such activities. Within our supply chain, we may not be able to sufficiently verify the origins of the relevant minerals used in our products through the data collection and due diligence procedures that we implement, which may harm our reputation. Furthermore, we may encounter challenges in satisfying those customers that require that all of the components of our products be certified as conflict free, and if we cannot satisfy these customers, they may choose a competitor’s products. We continue to investigate the presence of conflict materials within our supply chain.
We maintain cash balances in our bank accounts that exceed the FDIC insurance limitation.
We maintain our cash assets at commercial banks in amounts in excess of the Federal Deposit Insurance Corporation insurance limit of $250,000. In the event of the commercial banks failing, we may lose the amount of our deposits over any federally-insured amount, which could have a material adverse effect on our financial conditions and our results of operations.
Our participation in the USPS BDS program may not result in predictable revenues in the future.
Our participation in the USPS BDS program involves significant uncertainties related to governmental decision-making and timing of purchases and is highly sensitive to changes in national priorities and budgets. The USPS continued to report significant losses for the 2014 and 2013 fiscal years. Budgetary pressures may result in reduced allocations to projects such as the BDS program, sometimes without advance notice. We cannot be certain that actual funding and operating parameters, or product purchases, will occur at currently expected levels or in the currently expected timeframe.
Compliance with laws and regulations governing public company corporate governance and reporting is complex and expensive.
We are subject to laws and regulations affecting our domestic and international operations in a number of areas. Many laws and regulations, notably those adopted in connection with the Sarbanes-Oxley Act of 2002 by the SEC, the Dodd-Frank Wall Street Reform and Consumer Protection Act and The NASDAQ Stock Market, impose obligations on public companies, such as ours, which have increased the scope, complexity, and cost of corporate governance, reporting, and disclosure practices. Compliance with these laws, regulations and similar requirements can be onerous and inconsistent from jurisdiction to jurisdiction, which has required and will continue to require substantial management time and oversight and requires us to incur significant additional accounting, legal and compliance costs. Any such costs, that may arise in the future as a result of changes in these laws and regulations or in their interpretation could individually or in the aggregate make our products and services more expensive to our customers, delay the
25
Table of Contents
introduction of new products in one or more regions or cause us to change or limit our business practices. We have implemented policies and procedures designed to ensure compliance with applicable laws and regulations, but there can be no assurance that our employees, contractors, or agents will not violate such laws and regulations or our policies and procedures.
Additionally, changes to existing accounting rules and standards and the implementation of new accounting rules or standards, such as the new lease accounting or revenue recognition rules, may adversely impact our reported financial results and business, and may further require us to incur greater accounting fees.
Our operating results could be materially affected by unanticipated changes in our tax provisions or exposure to additional income tax liabilities.
Our determination of our tax liability (like any company’s determination of its tax liability) is subject to review by applicable tax authorities. Any adverse outcome of such a review could have an adverse effect on our operating results and financial condition. In addition, the determination of our provision for income taxes and other tax liabilities requires significant judgment including our determination of whether a valuation allowance against deferred tax assets is appropriate. We expect to maintain such valuation allowance as long as there is insufficient evidence that we will be able to realize the benefit of our deferred tax assets. We reassess the realizability of the deferred tax assets as facts and circumstances dictate. If after future assessments of the realizability of the deferred tax assets, we determine that a lesser or greater allowance is required, or that no such allowance is appropriate, we will record a corresponding change to the income tax expense and the valuation allowance in the period of such determination. The uncertainty surrounding the future realization of our net deferred tax assets could adversely impact our results of operations. Although we believe our estimates and judgments are reasonable, including those related to our valuation allowance, the ultimate tax outcome may differ from the amounts recorded in our financial statements and may materially affect our financial results in the period or periods for which such determination is made.
Changes in accounting standards and subjective assumptions, estimates, and judgments by management related to complex accounting matters could significantly affect our financial results or financial condition.
Generally accepted accounting principles and related accounting pronouncements, implementation guidelines, and interpretations with regard to a wide range of matters that are relevant to our business, such as revenue recognition, asset impairment and fair value determinations, inventories, convertible debt, business combinations and intangible asset valuations, and litigation, are highly complex and involve many subjective assumptions, estimates, and judgments. Changes in these rules or their interpretation or changes in underlying assumptions, estimates, or judgments could significantly change our reported or expected financial performance or financial condition.
We have indebtedness in the form of convertible senior notes.
In February 2014, we completed an offering of $345 million of convertible senior notes due in 2021 (the “Notes”).
As a result of the issuance of the Notes, we incurred $345 million principal amount of indebtedness, the principal amount of which we may be required to pay at maturity in 2021, or upon the occurrence of a make-whole fundamental change (as defined in the applicable indenture). There can be no assurance that we will be able to repay this indebtedness when due, or that we will be able to refinance this indebtedness on acceptable terms or at all. In addition, this indebtedness could, among other things:
| • | make it difficult for us to pay other obligations; |
| • | make it difficult to obtain favorable terms for any necessary future financing for working capital, capital expenditures, debt service requirements or other purposes; |
| • | require us to dedicate a substantial portion of our cash flow from operations to service the indebtedness, reducing the amount of cash flow available for other purposes; and |
| • | limit our flexibility in planning for and reacting to changes in our business. |
Conversion of the Notes may affect the price of our common stock.
The conversion of some or all of our Notes may dilute the ownership interest of existing shareholders to the extent we deliver shares of common stock upon conversion. Holders of the outstanding Notes will be able to convert them only upon the satisfaction of certain conditions prior to August 1, 2020. Upon conversion, holders of the Notes will receive cash, shares of common stock or a combination of cash and shares of common stock, at our election. Any sales in the public market of shares of common stock issued upon conversion of such notes could adversely affect the trading price of our common stock.
26
Table of Contents
We have broad discretion in the use of the net proceeds from the issuance of our Notes and may not use them effectively.
We have broad discretion in the application of the net proceeds that we received from the issuance of the Notes, including working capital, possible acquisitions, and other general corporate purposes, and we may spend or invest these proceeds in a way with which our investors disagree. The failure by our management to apply these funds effectively could adversely affect our business and financial condition. We may invest the net proceeds from our Notes in a manner that does not produce income or that loses value. These investments may not yield a favorable return to our investors, and may negatively impact the price of our securities.
Servicing our debt requires a significant amount of cash, and we may not have sufficient cash flow from our business to pay our substantial debt.
Our ability to make scheduled payments of the principal, to pay interest on or to refinance our indebtedness, including the Notes, depends on our future performance, which is subject to economic, financial, competitive and other factors beyond our control. Our business may not generate cash flow from operations in the future sufficient to service our debt obligations and make necessary capital expenditures. If we are unable to generate the necessary cash flow, we may be required to adopt one or more alternatives, such as selling assets, restructuring debt or obtaining additional capital on terms that may be onerous or highly dilutive. Our ability to refinance our indebtedness will depend on the capital markets and our financial condition at such time. We may not be able to engage in any of these activities or engage in these activities on desirable terms, which could result in a default on our debt obligations.
We may not have the ability to raise the funds necessary to settle conversions of the Notes or to repurchase the Notes upon a fundamental change, and our future debt may contain limitations on our ability to pay cash upon conversion or repurchase of the Notes.
Holders of the Notes will have the right to require us to repurchase their Notes upon the occurrence of a fundamental change at a fundamental change repurchase price equal to 100% of the principal amount of the Notes to be repurchased, plus accrued and unpaid interest, if any. In addition, upon conversion of the Notes, unless we elect to deliver solely shares of our common stock to settle such conversion (other than paying cash in lieu of delivering any fractional share), we will be required to make cash payments in respect of the Notes being converted. However, we may not have enough available cash or be able to obtain financing at the time we are required to make repurchases of Notes surrendered therefor or Notes being converted. In addition, our ability to repurchase the Notes or to pay cash upon conversions of the Notes may be limited by law, by regulatory authority or by agreements governing our future indebtedness. Our failure to repurchase Notes at a time when the repurchase is required by the indenture governing the Notes or to pay any cash payable on future conversions of the Notes as required by the indenture governing the Notes would constitute a default under the indenture governing the Notes. A default under the indenture governing the Notes or the fundamental change itself could also lead to a default under agreements governing our future indebtedness. If the repayment of the future indebtedness were to be accelerated after any applicable notice or grace periods, we might not have sufficient funds to repay the indebtedness and repurchase the Notes or make cash payments upon conversions thereof.
The Notes contain a conditional conversion feature, which, if triggered, may adversely affect our financial condition and operating results.
The Notes contain a conditional conversion feature. If such feature is triggered, holders of Notes will be entitled to convert the Notes at any time during specified periods at their option. If one or more holders elect to convert their Notes, unless we elect to satisfy our conversion obligation by delivering solely shares of our common stock (other than paying cash in lieu of delivering any fractional share), we would be required to settle a portion or all of our conversion obligation through the payment of cash, which could adversely affect our liquidity. In addition, even if holders do not elect to convert their Notes, we could be required under applicable accounting rules to reclassify all or a portion of the outstanding principal of the Notes as a current rather than non-current liability, which would result in a material reduction of our net working capital.
Our stock price is highly volatile and investing in our stock involves a high degree of risk, which could result in substantial losses for investors.
The market price of our common stock, like the securities of many other medical product companies, fluctuates over a wide range, and will continue to be highly volatile in the future. During fiscal year 2014, the closing sale price of our common stock on The NASDAQ Global Select Market ranged from $37.64 to $55.41 per share. Because our stock price has been volatile, investing in our
27
Table of Contents
common stock is risky. Furthermore, volatility in the stock price of other companies has often led to securities class action litigation against those companies. Any future securities litigation against us could result in substantial costs and divert management’s attention and resources, which could seriously harm our business, financial condition and results of operations.
Our charter documents may impede or discourage a takeover, which could reduce the market price of our common stock.
Our board of directors or a committee thereof has the power, without shareholder approval, to designate the terms of one or more series of preferred stock and issue shares of preferred stock. The ability of our board of directors or a committee thereof to create and issue a new series of preferred stock and certain provisions of our articles of incorporation and bylaws, including, without limitation, a classified board, advance notice requirements for shareholder proposals and nominations, and no cumulative voting, could impede a merger, takeover or other business combination involving us or discourage a potential acquiror from making a tender offer for our common stock, which, under certain circumstances, could reduce the market price of our common stock.
Data breaches and cyber-attacks could compromise our intellectual property or other sensitive information and cause significant damage to our business and reputation.
In the ordinary course of our business, we maintain sensitive data on our networks, including our intellectual property and proprietary or confidential information relating to our business and that of our customers and business partners. The secure maintenance of this information is critical to our business and reputation. We believe that companies have been increasingly subject to a wide variety of security incidents, cyber-attacks and other attempts to gain unauthorized access. These threats can come from a variety of sources, ranging in sophistication from an individual hacker to a state-sponsored attack. Cyber threats may be generic, or they may be custom-crafted against our information systems. Over the past year, cyber-attacks have become more prevalent and much harder to detect and defend against. Our network and storage applications may be subject to unauthorized access by hackers or breached due to operator error, malfeasance or other system disruptions. It is often difficult to anticipate or immediately detect such incidents and the damage caused by such incidents. These data breaches and any unauthorized access or disclosure of our information or intellectual property could compromise our intellectual property and expose other confidential information and sensitive business information. There can be no assurance that our systems and data protection efforts will prevent future business interruptions or loss of data. Cyber-attacks could also cause us to incur significant remediation costs, result in product development delays, disrupt key business operations and divert attention of management and key information technology resources. These incidents could also subject us to liability, expose us to significant expense and cause significant harm to our reputation and business.
| ITEM 1B. | UNRESOLVED STAFF COMMENTS |
None.
| ITEM 2. | PROPERTIES |
Our headquarters are located in Sunnyvale, California. As of January 30, 2015, we owned or leased approximately 680,000 square feet of building space, primarily in the United States. We own a building in Toulouse, France, and the remaining building space we occupy is pursuant to leases expiring through May 2029. Our manufacturing sites are located in the United States and Sweden.
We believe our existing facilities and equipment are in good operating condition and are suitable for the conduct of its business.
| ITEM 3. | LEGAL PROCEEDINGS |
In May 2005, we entered into a license agreement with F. Hoffmann-La Roche Ltd. and Roche Molecular Systems, Inc. (“Roche”) that provided us with rights under a broad range of Roche patents, including patents relating to the PCR process, reverse transcription-based methods, nucleic acid quantification methods, real-time PCR detection process and composition, and patents relating to methods for detection of viral and cancer targets. A number of the licensed patents expired in the United States prior to the end of August of 2010 and in Europe prior to the end of August of 2011. In August 2010, we terminated our license to United States Patent No. 5,804,375 (the “375 Patent”) and ceased paying United States-related royalties. We terminated the entire license agreement in the fourth quarter of 2011. In August 2011, Roche initiated an arbitration proceeding against us in the International Chamber of Commerce pursuant to the terms of the terminated agreement. We filed an answer challenging arbitral jurisdiction over the issues submitted by Roche and denying that we violated any provision of the agreement. A three-member panel has been convened to address these issues in confidential proceedings. On July 30, 2013, the panel determined that it had jurisdiction to decide the claims, a determination that we appealed to the Swiss Federal Supreme Court. On October 2, 2013, the arbitration panel determined that it would proceed with the arbitration while this appeal was pending. On February 27, 2014 the Swiss Federal Supreme Court upheld the jurisdiction of the arbitration panel to hear the case, and the case is continuing. We believe that we have not violated any provision of the agreement and that the asserted claim of the 375 Patent is expired, invalid, unenforceable and not infringed.
28
Table of Contents
Based on our ongoing evaluation of the facts and circumstances of the case, we believe that it is probable that this arbitration proceeding could result in a material loss to Cepheid. Accordingly, we recorded an estimated charge of $20 million as our best estimate of the potential loss as of December 31, 2014, which was included in accrued and other liabilities in our consolidated balance sheet. However, given the inherent uncertainty of arbitration and the nature of the claims in this matter, it is possible that we may incur an additional material charge, but an estimate of such a charge cannot be made at this time. We continue to strongly dispute Roche’s claims and intend to vigorously defend against them.
On August 21, 2012, we filed a lawsuit against Roche in the United States District Court for the Northern District of California (“the Court”), for a declaratory judgment of (a) invalidity, expiration, and non-infringement of the 375 Patent; and (b) invalidity, unenforceability, expiration and non-infringement of United States Patent No. 6,127,155 (the “155 Patent”). On January 17, 2013, the Court issued an order granting a motion by Roche to stay the suit with respect to the 375 Patent pending resolution of the above noted arbitration proceeding. In the same order, the Court dismissed our suit with respect to the 155 Patent for lack of subject matter jurisdiction, without considering or ruling on the merits of our case. The Court left open the possibility that we could re-file our case against the 155 Patent in the future. We believe that the possibility that these legal proceedings will result in a material adverse effect on our business is remote.
On July 16, 2014, Roche filed a lawsuit in the Court, alleging that our Xpert MTB-RIF product infringes United States Patent No. 5,643,723 (the “723 Patent”), which expired on July 1, 2014. On September 15, 2014, we filed our answer and counterclaims denying Roche’s allegations of infringement and asking the Court to find the 723 Patent invalid, unenforceable and not infringed. On November 10, 2014, we filed a petition for inter partes review (“IPR”) of the 723 Patent in the United States Patent and Trademark Office and the Company filed a motion with the Court to stay this lawsuit pending the outcome of the IPR. On January 7, 2015, the Court issued an order staying the lawsuit pending the outcome of the IPR. We believe that the possibility that these legal proceedings will result in a material loss is remote.
We may be subject to additional various claims, complaints and legal actions that arise from time to time in the normal course of business. Other than as described above, we do not believe we are party to any currently pending legal proceedings that will result in a material adverse effect on our business. There can be no assurance that existing or future legal proceedings arising in the ordinary course of business or otherwise will not have a material adverse effect on our business, consolidated financial position, results of operations or cash flows.
| ITEM 4. | MINE SAFETY DISCLOSURES |
Not Applicable.
| ITEM 5. | MARKET FOR REGISTRANT’S COMMON EQUITY, RELATED SHAREHOLDER MATTERS AND ISSUER PURCHASES OF THE EQUITY SECURITIES |
PRICE RANGE OF COMMON STOCK
Our common stock trades on The NASDAQ Global Select Market under the symbol “CPHD.” The high and low prices for our common stock for each quarter of our two most recent fiscal years, as reported on The NASDAQ Global Select Market, were as follows:
| High | Low | |||||||
| Fiscal year ended December 31, 2014 |
||||||||
| First Quarter |
$ | 55.89 | $ | 44.20 | ||||
| Second Quarter |
54.51 | 40.15 | ||||||
| Third Quarter |
50.46 | 36.94 | ||||||
| Fourth Quarter |
56.47 | 42.26 | ||||||
| Fiscal year ended December 31, 2013 |
||||||||
| First Quarter |
$ | 39.52 | $ | 32.25 | ||||
| Second Quarter |
40.31 | 31.56 | ||||||
| Third Quarter |
39.62 | 30.95 | ||||||
| Fourth Quarter |
47.21 | 36.17 | ||||||
29
Table of Contents
On February 12, 2015, the last reported sale price of our common stock on The NASDAQ Global Select Market was $58.90 per share. On February 12, 2015, there were approximately 108 holders of record of our common stock. The actual number of shareholders is greater than the number of record holders, and includes shareholders who are beneficial owners, but whose shares are held in street name by brokers and other nominees. The number of holders of record also does not include shareholders whose shares may be held in trust by other entities.
We have never declared or paid any cash dividends on our common stock. We currently intend to retain any future earnings and do not expect to pay cash dividends on our common stock for the foreseeable future. Any determination to pay dividends in the future will be at the discretion of our board of directors and will be dependent on a number of factors, including our earnings, capital requirements and overall financial condition.
EQUITY COMPENSATION PLAN INFORMATION
The following table summarizes information about our equity compensation plans as of December 31, 2014. All outstanding awards relate to our common stock.
| Plan Category |
Number of Securities to be Issued upon Exercise of Outstanding Options, Warrants and Rights |
Weighted Average Exercise Price of Outstanding Options, Warrants and Rights |
Number
of Securities Remaining Available for Future Issuances under Equity Compensation Plans (Excluding Securities Reflected in Column (a)) |
|||||||||
| (a) | (b) | (c) | ||||||||||
| Equity compensation plans approved by security holders (1)(2)(3) |
6,051,998 | $ | 32.88 | 6,156,000 | ||||||||
| Equity compensation plans not approved by security holders (4) |
226,002 | $ | 41.57 | — | ||||||||
|
|
|
|
|
|||||||||
| Total |
6,278,000 | $ | 33.20 | 6,156,000 | ||||||||
|
|
|
|
|
|||||||||
| (1) | The number of securities remaining available for future issuance in column (c) includes (1) 2,210,000 shares of common stock authorized and available for issuance under our 2012 Employee Stock Purchase Plan (“2012 ESPP”) and (2) 3,946,000 shares of common stock authorized and available for issuance under out 2006 Equity Incentive Plan (“2006 Plan”). The number of shares authorized for issuance under the ESPP is subject to an annual increase equal to the lesser of (i) 500,000 shares or (ii) an amount determined by the Compensation and Organizational Development Committee of the Board of Directors. The number of securities to be issued to participants in column (a) does not include shares of common stock to be issued to participants in consideration of aggregate participant contributions under the 2012 ESPP as of December 31, 2014. |
| (2) | We issue securities under our 2006 Plan in forms other than options, warrants or rights. We may issue stock awards, including but not limited to restricted stock awards, restricted stock units, stock bonus awards, stock appreciation rights and performance share awards. Under the terms of our 2006 Plan, each award other than a stock option or stock appreciation right will reduce the number of shares remaining available for future issuance in column (c) by 1.75 shares for each share subject to such award. |
| (3) | We have made awards of restricted stock under our 2006 Plan in forms, such as restricted stock units, that do not require a payment by the recipient to us at the time of exercise or vesting. Accordingly, the weighted average exercise price in column (b) does not take these awards into consideration. |
| (4) | Includes 59,125 shares of common stock issuable to Michael Fitzgerald, an executive officer of the Company, 56,771 shares of common stock issuable to Warren Kocmond, an executive officer of the Company, and 110,106 shares of common stock issuable to Peter Farrell, an executive officer of the Company, each made as a non-plan inducement grants pursuant to Section 5635(c)(4) of The NASDAQ Stock Market Rules. |
30
Table of Contents
STOCK PRICE PERFORMANCE GRAPH
The following graph compares the cumulative 5-year total shareholder return on Cepheid’s common stock relative to the cumulative total returns of the NASDAQ Composite index and the NASDAQ Biotechnology index. An investment of $100 (with reinvestment of all dividends) is assumed to have been made in our common stock and in each of the indexes on 12/31/2009 and its relative performance is tracked through 12/31/2014.
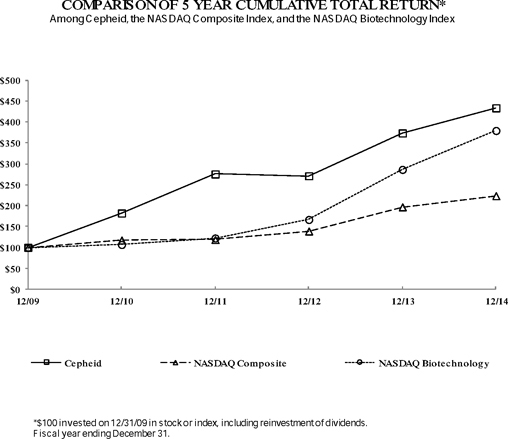
| 12/09 | 12/10 | 12/11 | 12/12 | 12/13 | 12/14 | |||||||||||||||||||
| Cepheid |
100.00 | 182.29 | 275.72 | 271.31 | 373.97 | 433.81 | ||||||||||||||||||
| NASDAQ Composite |
100.00 | 117.61 | 118.70 | 139.00 | 196.83 | 223.74 | ||||||||||||||||||
| NASDAQ Biotechnology |
100.00 | 106.73 | 122.40 | 166.72 | 286.55 | 379.71 | ||||||||||||||||||
The stock price performance included in this graph is not necessarily indicative of future stock price performance.
31
Table of Contents
| ITEM 6. | SELECTED CONSOLIDATED FINANCIAL DATA |
The following selected consolidated financial data have been derived from our audited consolidated financial statements. The information below is not necessarily indicative of the results of future operations, and should be read in conjunction with Item 7, “Management’s Discussion and Analysis of Financial Condition and Results of Operations” of this Form 10-K and the consolidated financial statements and related notes thereto included in Item 8 of this Form 10-K in order to fully understand factors that may affect the comparability of the information presented below.
| Years Ended December 31, | ||||||||||||||||||||
| 2014 | 2013 | 2012 | 2011 | 2010 | ||||||||||||||||
| (In thousands, except per share data) | ||||||||||||||||||||
| Consolidated Statements of Operations Data: |
||||||||||||||||||||
| Revenue |
$ | 470,141 | $ | 401,292 | $ | 331,212 | $ | 277,575 | $ | 212,468 | ||||||||||
|
|
|
|
|
|
|
|
|
|
|
|||||||||||
| Cost of sales |
229,327 | 207,933 | 153,365 | 122,840 | 105,135 | |||||||||||||||
| Gross profit on revenue |
240,814 | 193,359 | 177,847 | 154,735 | 107,333 | |||||||||||||||
| Income (loss) from operations |
(34,086 | ) | (16,010 | ) | (21,324 | ) | 3,815 | (5,344 | ) | |||||||||||
| Net income (loss) |
$ | (50,149 | ) | $ | (17,965 | ) | $ | (20,043 | ) | $ | 2,627 | $ | (5,917 | ) | ||||||
| Basic net income (loss) per common share |
$ | (0.72 | ) | $ | (0.27 | ) | $ | (0.30 | ) | $ | 0.04 | $ | (0.10 | ) | ||||||
| Diluted net income (loss) per common share |
$ | (0.72 | ) | $ | (0.27 | ) | $ | (0.30 | ) | $ | 0.04 | $ | (0.10 | ) | ||||||
| Shares used in computing basic net income (loss) per share |
70,069 | 67,485 | 65,812 | 62,735 | 59,712 | |||||||||||||||
| Shares used in computing diluted net income (loss) per share |
70,069 | 67,485 | 65,812 | 66,750 | 59,712 | |||||||||||||||
| December 31, | ||||||||||||||||||||
| 2014 | 2013 | 2012 | 2011 | 2010 | ||||||||||||||||
| (In thousands) | ||||||||||||||||||||
| Consolidated Balance Sheet Data: |
||||||||||||||||||||
| Cash, cash equivalents, short-term investments |
$ | 293,392 | $ | 74,909 | $ | 95,779 | $ | 115,008 | $ | 79,538 | ||||||||||
| Working capital |
381,264 | 148,528 | 147,090 | 148,153 | 95,565 | |||||||||||||||
| Total assets |
793,574 | 394,604 | 331,544 | 286,670 | 220,611 | |||||||||||||||
| Short-term obligations: |
||||||||||||||||||||
| Current portion of note payable |
175 | 194 | 183 | — | 1,679 | |||||||||||||||
| Current portion of deferred revenue |
13,447 | 8,183 | 9,599 | 8,176 | 8,207 | |||||||||||||||
| Long-term obligations: |
||||||||||||||||||||
| Note payable, less current portion |
1,073 | 1,479 | 1,685 | — | 4,991 | |||||||||||||||
| Convertible senior notes, net |
278,213 | — | — | — | — | |||||||||||||||
| Accumulated deficit |
(293,712 | ) | (243,563 | ) | (225,598 | ) | (205,555 | ) | (208,182 | ) | ||||||||||
| Total shareholders’ equity |
$ | 354,215 | $ | 285,240 | $ | 247,542 | $ | 211,833 | $ | 153,662 | ||||||||||
32
Table of Contents
ITEM 7. MANAGEMENT’S DISCUSSION AND ANALYSIS OF FINANCIAL CONDITION AND RESULTS OF OPERATIONS
STRATEGY
We are a molecular diagnostics company that develops, manufactures and markets fully-integrated systems for testing in the Clinical market and Non-Clinical markets. Our systems enable rapid, sophisticated molecular testing for organisms and genetic-based diseases by automating otherwise complex manual laboratory procedures. Our objective is to become the leading supplier of integrated systems and tests for molecular diagnostics. Key elements of our strategy to achieve this objective include:
| • | Provide a fully-integrated molecular testing solution to the Clinical market. We are focusing our investments on selling our systems and tests to the Clinical market and we believe our GeneXpert system will continue to significantly expand our presence in the Clinical market due to its ability to deliver accurate and rapid results, ease of use, flexibility and scalability. Features of the GeneXpert system and Xpert tests include: |
| • | an approach by which the reagents are typically prepackaged in a single vessel (the test cartridge) into which the specimen is added; |
| • | no further user intervention once the Xpert cartridge is loaded into the GeneXpert system; |
| • | all three phases of PCR: 1) sample preparation, 2) amplification and 3) detection, are performed within the single sealed test cartridge automatically; |
| • | primarily moderate complexity Clinical Laboratory Improvement Amendments (“CLIA”) categorized, amplified molecular tests, which means the GeneXpert system can be operated without the need for highly-trained laboratory technologists; |
| • | commercial availability in a variety of configurations ranging from one to 80 individual test modules, which enables testing in environments ranging from low volume testing to high volume, near-patient, core or central lab testing, and system capacity that can be expanded in support of growing test volumes by adding additional modules; |
| • | notably, to our knowledge, the only truly scalable real-time PCR system that operates entirely within a closed system architecture, reducing hands-on time, reducing the likelihood of human error and contamination, and enabling nested PCR capability, a proven process for maximizing real-time PCR sensitivity; and |
| • | full random access whereby different tests for different targets may be run simultaneously in different modules in the same GeneXpert system, which increases potential utilization and throughput of the system and also enables on-demand or “STAT” testing, whereby the user can add a new test to the system at any time without regard to the stage of processing of any other test on the system. |
| • | Continue to develop and market new tests. We currently plan to capitalize on our strengths in nucleic acid chemistry and molecular biology to continue to develop new tests for our systems and offer our customers the broadest menu of Xpert tests designed to address many of the highest volume molecular test opportunities. Our strategy is to offer a portfolio of Xpert tests spanning healthcare-associated infections, critical infectious disease, sexual health, women’s health, virology, oncology and genetics. For example, Xpert CT/NG and Xpert MTB/RIF were made commercially available in the United States in 2013 and Xpert Norovirus and Xpert Flu/RSV XC were made commercially available in the United States in 2014. Xpert HPV, Xpert Carba-R, Xpert Norovirus, Xpert Flu/RSV XC and Xpert Trichomonas were all made commercially available in all markets that recognize CE Marks during 2014 and Xpert HIV-1 Viral Load achieved CE Mark in December 2014. |
| • | Obtain additional target rights. We expect to continue to expand our collaborations with academic institutions and commercial organizations to develop and obtain rights to various infectious disease and oncology targets. In addition, we expect to focus key business development activities on identifying infectious disease and oncology targets held by academic institutions or commercial organizations for potential license or acquisition. |
| • | Extend geographic reach. Our European sales and marketing operations are headquartered in France. As of December 31, 2014, we had direct sales forces in Australia, the Benelux region, France, Germany, Hong Kong, Italy, South Africa and the United Kingdom, and we have offices in Brazil, China, Dubai, India, Japan and Singapore. We expect to continue to expand our international commercial operations capability on both a direct and distributor basis in 2015 and future years. |
33
Table of Contents
| • | Extend High Burden Developing Countries sales programs. We are developing and expect to continue to expand our presence in HBDCs following the World Health Organization’s endorsement of the Xpert MTB/RIF test in late 2010 to deliver GeneXpert systems and Xpert tests to HBDCs at a discount to our standard commercial prices. We believe that participation in the HBDC program considerably broadens the geographic reach of our products and increases recognition of the Cepheid brand and product portfolio. |
CRITICAL ACCOUNTING POLICIES, ESTIMATES AND ASSUMPTIONS
We consider our accounting policies related to revenue recognition, impairment of long-lived assets, inventory valuation, warranty accrual, stock-based compensation, litigation settlement, foreign currency hedging and income taxes to be critical accounting policies. A number of significant estimates, assumptions and judgments are inherent in our determination of when to recognize revenue, how to evaluate our long-lived-assets, the calculation of our inventory valuation adjustments, warranty accrual, settlements related to litigation, valuation of our foreign currency hedges and stock-based compensation expense. We base our estimates and judgments on historical experience and on various other assumptions that we believe to be reasonable under the circumstances. Actual results could differ materially from these estimates.
Recent Accounting Pronouncements
Please refer to Note 1 of our Consolidated Financial Statements, “Organization and Summary of Significant Account Policies—Recent Accounting Pronouncements” for a discussion of new and recently adopted accounting guidance
Revenue Recognition
We recognize revenue from sales when there is persuasive evidence that an arrangement exists, delivery has occurred, the price is fixed or determinable, and collectability is reasonably assured. No right of return exists for our products except in the case of damaged goods. We have not experienced any significant returns of our products. Shipping and handling costs are expensed as incurred and included in cost of sales. In those cases where we bill shipping and handling costs to customers, the amounts billed are classified as revenue.
When we enter into revenue arrangements that may consist of multiple deliverables of our products and services, we recognize revenue as each separate element is delivered. We sell service contracts for which revenue is deferred and recognized ratably over the contract period.
We may place an instrument at a customer site under a reagent rental agreement (“reagent rental”). Under a reagent rental, we retain title to the instrument and earn revenue for the usage of the instrument and related maintenance services through the amount charged for reagents and other disposables. Under a reagent rental agreement, a customer may commit to purchasing minimum quantities of reagents at stated prices over a defined contract term, which is typically between three and five years. Revenue is recognized over the term of a reagent rental as reagents and other disposables are shipped and all other revenue recognition criteria have been met. All revenue recognized from reagent rentals are included in reagent and disposable sales. Please see Note 12 of our Consolidated Financial Statements “Segment and Significant Concentrations”.
For multiple element arrangements, the total consideration for an arrangement is allocated among the separate elements in the arrangement based on a selling price hierarchy. The selling price hierarchy for a deliverable is based on: (1) vendor specific objective evidence (“VSOE”), if available; (2) third party evidence of selling price if VSOE is not available; or (3) an estimated selling price, if neither VSOE nor third party evidence is available. Estimated selling price is our best estimate of the selling price of an element in a transaction. We limit the amount of revenue recognized for delivered elements to the amount that is not contingent on the future delivery of products or services or other future performance obligations. We recognize revenue for delivered elements only when we determine there are no uncertainties regarding customer acceptance.
Revenue includes fees for research and development services, including research and development under grants and government sponsored research and collaboration agreements. Revenue is derived from cost-type contracts with the U.S. government. Revenue and profit under cost-plus service contracts is recognized as costs are incurred plus negotiated fees. Fixed fees on cost-plus service contracts are recognized ratably over the contract performance period as services are performed. Contract costs include labor and related employee benefits, subcontracting costs and other direct costs, as well as allocations of allowable indirect costs. For contract change orders, claims or similar items, judgment is required for estimating the amounts, assessing the potential for realization, and determining whether realization is probable. From time to time, facts develop that require revisions of revenue recognized or cost estimates. To the extent that a revised estimate affects the current or an earlier period, the cumulative effect of the revision is recognized in the period in which the facts requiring the revision become known. Advance payments received in excess of amounts earned, such as funds received in advance of products to be delivered or services to be performed, are classified as deferred revenue until earned.
34
Table of Contents
During 2012, we entered into agreements with The Bill and Melinda Gates Foundation (“BMGF”), The United States Agency for International Development (“USAID”) and UNITAID to reduce the price of our Multi-Drug Resistant Tuberculosis test to $9.98 for customers in the HBDC program. We received one-time payments of $3.5 million each from BMGF and USAID in 2012 and $3.2 million from UNITAID during 2013. Based on the terms of the agreements, we recognized revenue related to the BMGF and USAID agreements on a per-unit basis. Under the UNITAID agreement, we are recognizing the $3.2 million of revenue on a straight line basis over a period of ten years. For the years ended December 31, 2014 and 2013, we recognized revenue of $0.3 million and $2.7 million, respectively, related to these three agreements.
Intangible Assets and Goodwill
Intangible assets related to licenses are recorded at cost, less accumulated amortization. Intangible assets related to technology and other intangible assets acquired in acquisitions are recorded at their estimated fair value at the date of acquisition, less accumulated amortization. Intangible assets are amortized over their estimated useful lives, ranging from three to 15 years, on a straight-line basis. Amortization of intangible assets is primarily included in cost of sales, research and development and sales and marketing in the Consolidated Statements of Operations.
We review our intangible assets for impairment and conduct the impairment review when events or circumstances indicate the carrying value of a long-lived asset may be impaired by estimating the future undiscounted cash flows to be derived from an asset to assess whether or not a potential impairment exists. If the carrying value exceeds our estimate of future undiscounted cash flows, an impairment value is calculated as the excess of the carrying value of the asset over our estimate of its fair market value. Events or circumstances which could trigger an impairment review include a significant adverse change in the business climate, an adverse action or assessment by a regulator, unanticipated competition, significant changes in our use of acquired assets, our overall business strategy, or significant negative industry or economic trends. In 2014, 2013 and 2012, we recorded an impairment charge of $0.1 million, $1.3 million and $1.4 million, respectively, to cost of sales primarily related to acquired technology for one of our legacy products.
Goodwill and intangible assets with indefinite useful lives are not amortized, but are tested for impairment at least annually during the fourth fiscal quarter, or as circumstances indicate their value may no longer be recoverable. Goodwill represents the excess of the purchase price over the fair value of net tangible and identifiable intangible assets. We continue to operate in one segment, which is considered to be the sole reporting unit and therefore, goodwill was tested for impairment at the enterprise level. As of December 31, 2014, there has been no impairment of goodwill. We do not have intangible assets with indefinite useful lives other than goodwill.
Cash, Cash Equivalents, Restricted Cash, Short-Term Investments and Non-Current Investments
Cash and cash equivalents consist of cash on deposit with banks and money market instruments. Interest and other income, net includes interest, dividends, amortization of purchase premiums and discounts and realized gains and losses on sales of securities.
Restricted cash consists of cash contractually restricted for use to develop the Xpert Ebola test in accordance with our agreement with BMGF. At December 31, 2014, prepaid expense and other current assets include $1.9 million of restricted cash.
Our marketable debt securities have been classified and accounted for as available-for-sale. We determine the appropriate classification of our investments at the time of purchase and re-evaluate the designations at each balance sheet date. We classify our marketable debt securities as cash equivalents, short-term investments or non-current investments based on each instrument’s underlying effective maturity date. All highly liquid investments with maturities of three months or less at the date of purchase are classified as cash equivalents. Marketable debt securities with effective maturities of 12 months or less are classified as short-term, and marketable debt securities with effective maturities greater than 12 months are classified as non-current. Our marketable debt securities are carried at fair value, with the unrealized gains and losses reported as a component of shareholders’ equity. The cost of securities sold is based upon the specific identification method.
We assess whether an other-than-temporary impairment loss on our investments has occurred due to declines in fair value or other market conditions. With respect to the our debt securities, this assessment takes into account the severity and duration of the decline in value, our intent to sell the security, whether it is more likely than not that we will be required to sell the security before recovery of its amortized cost basis, and whether or not we expect to recover the entire amortized cost basis of the security (that is, a credit loss exists).
35
Table of Contents
Litigation
We are involved in certain legal proceedings, as discussed in Note 9 of our Consolidated Financial Statements, “Commitments, Debt obligations, Contingencies and Legal Matters”. In connection with these matters, we assess, on a regular basis, the probability and range of possible loss based on the developments in these matters. A liability is recorded in the financial statements if it is believed to be probable that a loss has been incurred and the amount of the loss can be reasonably estimated. If a reasonable estimate of a known or probable loss cannot be made, but a range of probable losses can be estimated, the low-end of the range of losses is recognized if no amount within the range is a better estimate than any other amount. If a loss is reasonably possible, but not probable and can be reasonably estimated, the estimated loss or range of loss is disclosed in the notes to the consolidated financial statements. We expense legal fees as incurred.
Inventory and Warranty Provisions
Inventory is stated at the lower of standard cost (which approximates actual cost) or market value, with cost determined on the first-in-first-out method. Allocation of fixed production overheads to conversion costs is based on normal capacity of production. Abnormal amounts of idle facility expense, freight, handling costs, and spoilage are expensed as incurred, and not included in overhead. We maintain provisions for excess and obsolete inventory based on our estimates of forecasted demand and, where applicable, product expiration. A substantial decrease in demand for our products or the introduction of new products could lead to excess inventories and could require us to increase our provision for inventory obsolescence.
We warrant our systems to be free from defects for a period of generally 12 to 24 months from the date of sale and for certain products our disposable products to be free from defects, when handled according to product specifications, for the stated life of such products. Accordingly, a provision for the estimated cost of warranty repair or replacement is recorded at the time revenue is recognized. Our warranty provision is established using our estimate of future failure rates and of the future costs of repairing any system failures during the warranty period or replacing any disposable products with defects. Significant increases in the failure rates of our products could lead to increased warranty costs and require us to increase our warranty provision.
Stock-Based Compensation
We account for stock-based compensation cost in accordance with Financial Accounting Standards Board (“FASB”) Accounting Standards Codification (“ASC”) 718-25. Stock-based compensation cost is measured at the grant date based on the fair value of the award and is recognized as expense on a straight-line basis over the requisite service period, which is generally the vesting period. The value of the portion of the award that is ultimately expected to vest is recognized as expense over the requisite service periods in our consolidated statements of operations. We recognize the fair value of our stock option awards as compensation expense over the requisite service period of each award, which is generally four years.
In determining fair value of the stock-based compensation payments, we use the Black–Scholes model and a single option award approach, which requires the input of subjective assumptions. These assumptions include: estimating the length of time employees will retain their vested stock options before exercising them (expected term), the estimated volatility of our common stock price over the expected term (expected volatility), the risk-free interest rate (interest rate), expected dividends and the number of shares subject to options that will ultimately not complete their vesting requirements (forfeitures). Changes in the following assumptions can materially affect the estimate of fair value of stock–based compensation.
| • | Expected term is determined based on historical experience, giving consideration to the contractual terms of the stock-based awards, vesting schedules and expectations of future employee behavior as influenced by changes to the terms of its stock-based awards. |
| • | Expected volatility is based on the blend of historical volatility of the past period equal to our expected term and the current implied volatility. |
| • | Risk-free interest rate is based on the implied yield currently available on U.S. Treasury zero-coupon issues with a remaining term equivalent to the expected term of a stock award. |
| • | Expected dividend is based on our expectation of issuing a dividend over the expected term. We have never issued dividends. |
| • | Estimated forfeitures are based on voluntary termination behavior as well as analysis of actual option forfeitures. |
36
Table of Contents
Income Taxes
We account for income taxes using an asset and liability approach, which requires recognition of deferred tax assets and liabilities for the expected future tax consequences of events that have been recognized in our consolidated financial statements, but have not been reflected in our taxable income. A valuation allowance is established to reduce deferred tax assets to their estimated realizable value. Therefore, we provide a valuation allowance to the extent that we do not believe it is more likely than not that it will generate sufficient taxable income in future periods to realize the benefit of its deferred tax assets.
We recognize interest and penalties related to uncertain tax positions in income tax expense. For the year ended December 31, 2014, 2013 and 2012, we did not recognize significant interest or penalties related to uncertain tax positions in the consolidated statements of operations, and at December 31, 2014 and 2013, we had no significant accrued interest or penalties.
Foreign Currency Hedging
We use forward contracts designated as cash flow hedges to protect against the foreign currency exchange rate risks inherent in forecasted net revenue, cost of sales and operating expense denominated in currencies other than the U.S. dollar. Our foreign currency cash flow hedges generally mature within twelve months. For derivative instruments that are designated and qualify as cash flow hedges, we initially record the effective portion of the gain or loss on the derivative instrument in accumulated other comprehensive income or loss, a separate component of shareholders’ equity and subsequently reclassify these amounts into earnings within the same financial statement line item as the hedged item in the period during which the hedged transaction is realized. The notional principle amounts of our outstanding derivative instruments designated as cash flow hedges are $117.2 million and $96.6 million as of December 31, 2014 and 2013, respectively. The notional principle amounts of our outstanding derivative instruments not designated as cash flow hedges is $30.4 million and $24.2 million as of December 31, 2014 and 2013, respectively. During fiscal year 2014, there was no significant impact to results of operations as a result of discontinued cash flow hedges. Our exposures to foreign currency risks may change over time and could have a material adverse impact on our financial results.
37
Table of Contents
Results of Operations
Comparison of Years Ended December 31, 2014, 2013 and 2012
Revenue
The following table illustrates the components of revenue (in thousands):
| Years Ended December 31, | Years Ended December 31, | |||||||||||||||||||||||||||||||
| 2014 | 2013 | $ Change | % Change | 2013 | 2012 | $ Change | % Change | |||||||||||||||||||||||||
| Revenue: |
||||||||||||||||||||||||||||||||
| System and other revenue |
$ | 90,849 | $ | 76,763 | $ | 14,086 | 18 | % | $ | 76,763 | $ | 65,111 | $ | 11,652 | 18 | % | ||||||||||||||||
| Reagent and disposable revenue |
379,292 | 324,529 | 54,763 | 17 | % | 324,529 | 266,101 | 58,428 | 22 | % | ||||||||||||||||||||||
|
|
|
|
|
|
|
|
|
|
|
|
|
|||||||||||||||||||||
| Total revenue |
$ | 470,141 | $ | 401,292 | $ | 68,849 | 17 | % | $ | 401,292 | $ | 331,212 | $ | 70,080 | 21 | % | ||||||||||||||||
|
|
|
|
|
|
|
|
|
|
|
|
|
|||||||||||||||||||||
Revenue
The following table illustrates revenue in the Clinical and Non-Clinical markets (in thousands):
| Years Ended December 31, | Years Ended December 31, | |||||||||||||||||||||||||||||||
| 2014 | 2013 | $ Change | % Change | 2013 | 2012 | $ Change | % Change | |||||||||||||||||||||||||
| Revenue by market: |
||||||||||||||||||||||||||||||||
| Clinical Systems |
$ | 84,695 | $ | 66,980 | $ | 17,715 | 26 | % | $ | 66,980 | $ | 52,805 | $ | 14,175 | 27 | % | ||||||||||||||||
| Clinical Reagents |
356,427 | 292,941 | 63,486 | 22 | % | 292,941 | 233,503 | 59,438 | 25 | % | ||||||||||||||||||||||
|
|
|
|
|
|
|
|
|
|
|
|
|
|||||||||||||||||||||
| Total Clinical |
$ | 441,122 | $ | 359,921 | $ | 81,201 | 23 | % | $ | 359,921 | $ | 286,308 | $ | 73,613 | 26 | % | ||||||||||||||||
|
|
|
|
|
|
|
|
|
|
|
|
|
|||||||||||||||||||||
| Non-Clinical |
29,019 | 41,371 | (12,352 | ) | -30 | % | 41,371 | 44,904 | (3,533 | ) | -8 | % | ||||||||||||||||||||
|
|
|
|
|
|
|
|
|
|
|
|
|
|||||||||||||||||||||
| Total revenue |
$ | 470,141 | $ | 401,292 | $ | 68,849 | 17 | % | $ | 401,292 | $ | 331,212 | $ | 70,080 | 21 | % | ||||||||||||||||
|
|
|
|
|
|
|
|
|
|
|
|
|
|||||||||||||||||||||
Total Clinical revenue increased $81.2 million, or 23%, in 2014 as compared to 2013. Clinical Systems revenue increased $17.7 million, or 26%, driven by higher system shipments to commercial and HBDC customers. Clinical Reagents revenue grew $63.5 million or 22% due to our growing installed base of GeneXpert instruments and our expanding menu of Xpert tests.
Total Clinical revenue increased $73.6 million, or 26%, in 2013 as compared to 2012. The increase in Clinical revenues for 2013 was led by growth in Clinical Reagents associated with new GeneXpert instrument placements to new and existing customers and broader test menu adoption among existing customers. Clinical Reagent revenue growth was driven by an increase of $18.3 million, or 77%, in our HBDC tests, primarily our Xpert MTB/RIF test. Commercial Clinical Reagents revenue grew by $41.1 million, or 20%, due to the 22% increase in Xpert test revenues, driven by growth in our healthcare-associated infection tests, Xpert CT/NG, Xpert MTB/RIF, and Xpert Flu. Clinical Systems revenue increased by $14.2 million, or 27%, primarily driven by an increase in shipments to customers in our HBDC program, along with increased Commercial Clinical placements.
Non-Clinical revenue decreased $12.4 million, or 30% in 2014 compared to 2013. The decrease was primarily due to decreased revenue from anthrax test cartridges under the USPS BDS program and decreases in contract, grant and research revenue. Non-Clinical revenue decreased $3.5 million, or 8% in 2013 compared to 2012. The decrease was primarily due to decreases in industrial revenue and contract, grant and research revenue.
We expect our Clinical revenue to continue to increase in 2015 with the growth of our installed base of GeneXpert systems, the continued expansion of our test menu, and the adoption of additional tests within our customer base. We expect Non-Clinical market revenue will decline in 2015 compared to 2014.
38
Table of Contents
The following table provides a breakdown of our revenue by geographic regions (in thousands):
| Years Ended December 31, | Years Ended December 31, | |||||||||||||||||||||||||||||||
| 2014 | 2013 | $ Change | % Change | 2013 | 2012 | $ Change | % Change | |||||||||||||||||||||||||
| Geographic revenue information: |
||||||||||||||||||||||||||||||||
| North America |
||||||||||||||||||||||||||||||||
| Clinical |
$ | 247,120 | $ | 212,362 | $ | 34,758 | 16 | % | $ | 212,362 | $ | 190,021 | $ | 22,341 | 12 | % | ||||||||||||||||
| Non-Clinical |
24,905 | 36,998 | (12,093 | ) | -33 | % | 36,998 | 38,632 | (1,634 | ) | -4 | % | ||||||||||||||||||||
|
|
|
|
|
|
|
|
|
|
|
|
|
|||||||||||||||||||||
| Total North America |
272,025 | 249,360 | 22,665 | 9 | % | 249,360 | 228,653 | 20,707 | 9 | % | ||||||||||||||||||||||
|
|
|
|
|
|
|
|
|
|
|
|
|
|||||||||||||||||||||
| International |
||||||||||||||||||||||||||||||||
| Clinical |
$ | 194,002 | $ | 147,559 | $ | 46,443 | 31 | % | $ | 147,559 | $ | 96,286 | $ | 51,273 | 53 | % | ||||||||||||||||
| Non-Clinical |
4,114 | 4,373 | (259 | ) | -6 | % | 4,373 | 6,273 | (1,900 | ) | -30 | % | ||||||||||||||||||||
|
|
|
|
|
|
|
|
|
|
|
|
|
|||||||||||||||||||||
| Total International |
198,116 | 151,932 | 46,184 | 30 | % | 151,932 | 102,559 | 49,373 | 48 | % | ||||||||||||||||||||||
|
|
|
|
|
|
|
|
|
|
|
|
|
|||||||||||||||||||||
| Total revenue |
$ | 470,141 | $ | 401,292 | $ | 68,849 | 17 | % | $ | 401,292 | $ | 331,212 | $ | 70,080 | 21 | % | ||||||||||||||||
North American Clinical revenue increased $34.8 million, or 16%, in 2014 as compared to 2013. The increase in North American Clinical revenue in 2014 was driven by driven by higher revenue of Xpert tests and higher systems revenue. North American Non-Clinical revenue decreased $12.1 million, or 33%, due to decreased revenue from anthrax test cartridges under the USPS BDS program and decreases in contract, grant and research revenue. North American Clinical revenue increased $22.3 million, or 12%, in 2013 as compared to 2012. This increase in North American revenue in 2013 was driven by a 16% increase in Xpert test revenue, primarily due to growth in revenue from our healthcare-associated infection tests (including Xpert MRSA and Xpert C.difficile) and our Xpert CT/NG test to new and existing customers, partially offset by a decrease in non-Xpert system and test revenue.
International revenue increased $46.2 million, or 30%, in 2014 as compared to 2013. This increase was primarily driven by higher revenue from GeneXpert systems and clinical reagents to both commercial and HBDC customers. International revenue increased $49.4 million, or 48%, in 2013 as compared to 2012. This increase was primarily driven by 44% growth in Commercial Xpert tests, Commercial Clinical system placements and growth in HBDC revenue, both systems and our Xpert MTB/RIF test.
Costs and Operating Expenses
The following table illustrates the changes in our operating expenses for the years ended December 31, 2014, 2013 and 2012 (in thousands):
| Years Ended December 31, | Years Ended December 31, | |||||||||||||||||||||||||||||||
| 2014 | 2013 | $ Change | % Change | 2013 | 2012 | $ Change | % Change | |||||||||||||||||||||||||
| Costs and operating expenses: |
||||||||||||||||||||||||||||||||
| Cost of sales |
$ | 229,327 | $ | 207,933 | $ | 21,394 | 10 | % | $ | 207,933 | $ | 153,365 | $ | 54,568 | 36 | % | ||||||||||||||||
| Collaboration profit sharing |
5,154 | 7,512 | (2,358 | ) | -31 | % | 7,512 | 7,183 | 329 | 5 | % | |||||||||||||||||||||
| Research and development |
96,851 | 80,197 | 16,654 | 21 | % | 80,197 | 71,673 | 8,524 | 12 | % | ||||||||||||||||||||||
| Sales and marketing |
97,848 | 79,941 | 17,907 | 22 | % | 79,941 | 61,907 | 18,034 | 29 | % | ||||||||||||||||||||||
| General and administrative |
55,047 | 41,719 | 13,328 | 32 | % | 41,719 | 43,298 | (1,579 | ) | -4 | % | |||||||||||||||||||||
| Litigation contingencies and settlement |
20,000 | — | 20,000 | 100 | % | — | 15,110 | (15,110 | ) | -100 | % | |||||||||||||||||||||
|
|
|
|
|
|
|
|
|
|
|
|
|
|||||||||||||||||||||
| Total costs and operating expenses |
$ | 504,227 | $ | 417,302 | $ | 86,925 | 21 | % | $ | 417,302 | $ | 352,536 | $ | 64,766 | 18 | % | ||||||||||||||||
|
|
|
|
|
|
|
|
|
|
|
|
|
|||||||||||||||||||||
Cost of Sales
Cost of sales consists of raw materials, direct labor and stock-based compensation expense, manufacturing overhead, facility costs and warranty costs. Cost of sales also includes royalties on sales and amortization of intangible assets related to technology licenses and intangibles assets acquired in business combinations.
Cost of sales increased $21.4 million, or 10%, in 2014 as compared to 2013. The increase was primarily attributable to increased shipments of our Clinical System and Clinical Reagent products, partially offset by reduced manufacturing costs. Cost of sales increased $54.6 million, or 36%, in 2013 as compared to 2012. The increase was primarily attributed to increased shipments of our Clinical System and Clinical Reagent products.
39
Table of Contents
Our gross margin percentage increased to 51% in 2014 as compared to 48% in 2013. The increase was primarily attributable to reduced manufacturing costs, partially offset by higher sales under our HBDC program which have lower margins.
Our gross margin percentage decreased to 48% in 2013 as compared to 54% in 2012. The decrease was primarily attributable to manufacturing inefficiencies resulting from challenges in scaling our manufacturing capacity, including intermittent interruptions in the supply of Xpert cartridge parts, as well as an increase in our HBDC sales, which has lower gross margins, and the U.S. medical device tax under the Affordable Care Act.
We currently expect that our gross margin will increase modestly in 2015 driven by lower Clinical Reagent unit costs due to manufacturing efficiencies and higher volume of sales, partially offset by the unfavorable impact of the foreign currency exchange rates, principally the currency exchange rate for the Euro and the U.S. dollar.
Collaboration Profit Sharing
Collaboration profit sharing represents the amount that we pay to LIFE under our collaboration agreement to develop and manufacture reagents for use in the USPS BDS program. Under the agreement, computed gross margin on anthrax cartridge sales are shared equally between the two parties. The decrease in collaboration profit sharing in 2014 is attributable to reduced anthrax cartridge sales under the USPS BDS program. The increase in collaboration profit sharing in 2013 was the result of increased anthrax cartridge sales under the USPS BDS program. We currently expect our collaboration profit sharing expenses will decrease in 2015 due to an expected decrease in anthrax cartridge sales to the USPS.
Research and Development Expenses
Research and development expenses consist of salaries and employee-related expenses, including stock-based compensation, clinical trials, research and development materials, facility costs, and depreciation and amortization of certain intangible assets. Research and development expenses increased $16.7 million, or 21%, in 2014 as compared to 2013. This increase is primarily due to an increase in our clinical trial costs for products released in 2014 and currently under development, increased headcount and an increase in engineering costs related primarily to our high-level multiplexing initiative.
Research and development expenses increased $8.5 million, or 12%, in 2013 as compared to 2012. This increase is primarily due to an increase in headcount and restructuring expenses, offset by a decrease in clinical trial costs.
We currently expect an increase in our research and development expenses as a percentage of sales in 2015 driven primarily by an increase in our clinical trial costs for products currently under development, and an increase in engineering costs related primarily to our high-level multiplexing initiative.
Sales and Marketing Expenses
Sales and marketing expenses consist primarily of salaries and employee-related expenses, including commissions and stock-based compensation, travel, facility-related costs and marketing and promotion expenses. Sales and marketing expenses increased $17.9 million, or 22%, in 2014 as compared to 2013. The increase is primarily due to increased headcount, increased travel, and higher commissions driven by increase in revenue and sales and marketing program costs.
Sales and marketing expenses increased $18.0 million, or 29%, in 2013 as compared to 2012. The increase is primarily due to increased headcount and sales and marketing program costs.
We currently expect an increase in our sales and marketing expenses as a percentage of revenues in 2015 to support the ongoing expansion of our sales force and commercial operations.
General and Administrative Expenses
General and administrative expenses consist primarily of salaries and employee-related expenses, which include stock-based compensation, travel, facility costs and legal, accounting and other professional fees. General and administrative expenses increased $13.3 million, or 32%, in 2014 as compared to 2013, which was primarily due to increased headcount and higher legal fees.
General and administrative expenses decreased $1.6 million, or 4%, in 2013 as compared to 2012. The decrease is primarily due to decreased legal expenses due to a litigation settlement that was reached during 2012.
We currently expect our general and administrative expenses to grow commensurate with our revenue growth in 2015.
40
Table of Contents
Legal contingencies and settlements
As further described in Part I, Item 3 “Legal Proceedings”, based on our ongoing evaluation of the facts and circumstances of our on-going arbitration with Roche we believe that it is probable that the arbitration proceeding could result in a material loss to Cepheid. Accordingly, we recorded an estimated charge of $20 million as our best estimate of such potential loss as of December 31, 2014, which was included in Accrued and other liabilities in our consolidated balance sheet. However, given the inherent uncertainty of arbitration and the nature of the claims in this matter, it is possible that we may incur an additional material charge, but an estimate of such a charge cannot be made at this time. We continue to strongly dispute Roche’s claims and intend to vigorously defend against them. The legal contingencies and settlements are explained further in Note 9 of these Consolidated Financial Statements.
Litigation contingencies and settlements decreased by $15.1 million or 100%, in 2013 as compared to 2012. During 2012, we entered into a settlement regarding certain issues under a license agreement. Pursuant to the settlement, we paid $17.3 million in cash, of which $15.1 million was recorded as Litigation settlement.
Other Income (Expense)
The following table illustrates the changes in our other expense, net for the years ended December 31, 2014, 2013 and 2012 (in thousands):
| 2014 | 2013 | $ Change | 2013 | 2012 | $ Change | |||||||||||||||||||
| Other expense, net |
||||||||||||||||||||||||
| Interest income |
$ | 1,119 | $ | 45 | $ | 1,074 | $ | 45 | $ | 26 | $ | 19 | ||||||||||||
| Interest expense |
(12,609 | ) | (137 | ) | (12,472 | ) | (137 | ) | (147 | ) | 10 | |||||||||||||
| Foreign currency exchange gain/(loss) and other, net |
(2,016 | ) | (715 | ) | (1,301 | ) | (715 | ) | 117 | (832 | ) | |||||||||||||
|
|
|
|
|
|
|
|
|
|
|
|
|
|||||||||||||
| Total other expense, net |
$ | (13,506 | ) | $ | (807 | ) | $ | (12,699 | ) | $ | (807 | ) | $ | (4 | ) | $ | (803 | ) | ||||||
|
|
|
|
|
|
|
|
|
|
|
|
|
|||||||||||||
Other income (expense) primarily consists of interest income earned from our cash, cash equivalent or investment balances, interest expense related to senior convertible notes, loans, or notes payable balances outstanding during the period and the net effect of foreign currency exchange transactions, including the net effect of non-qualifying derivative activities. Interest income increased by $1.1 million in 2014 as compared to 2013, this increase is primarily a result of increased cash, cash equivalent and investments resulting from the issuance of the senior convertible notes in February 2014. Interest expense increased by $12.5 million in 2014 as compared to 2013, primarily driven by the interest expense from the issuance of senior convertible notes. Foreign currency exchange loss and other, net increased by $1.3 million in 2014 as compared to 2013, the increase primarily relates to strengthening of the U.S. dollar.
Other expense, net increased by $0.8 million in 2013 as compared to 2012, the increase primarily relates to strengthening of the US Dollar.
LIQUIDITY AND CAPITAL RESOURCES
| Years Ended December 31, | ||||||||||||
| 2014 | 2013 | 2012 | ||||||||||
| (In thousands) | ||||||||||||
| Net cash provided by operating activities |
$ | 9,194 | $ | 15,012 | $ | 2,928 | ||||||
| Net cash used in investing activities |
(325,725 | ) | (70,981 | ) | (49,311 | ) | ||||||
| Net cash provided by financing activities |
349,208 | 26,638 | 27,163 | |||||||||
As of December 31, 2014, we had $96.7 million in cash, cash equivalents, $196.7 million in short-term investments, $1.9 million in restricted cash (recorded as prepaid expenses and other current assets) and $79.7 million in non-current investments. The increases in cash and cash equivalents, short-term investments, and non-current investments from December 31, 2013 were a result of the net proceeds from issuance of senior convertible notes in 2014. Our short-term and non-current securities investment portfolio is invested primarily in highly-rated securities and its investment policy generally limits the amount of credit exposure to any one issuer. The policy requires investments generally to be investment grade with the objective of minimizing the potential risk of principal loss.
41
Table of Contents
The net cash provided by operating activities was $9.2 million for the year ended December 31, 2014. It was primarily comprised of net loss and the net effect of cash provided by non-cash expenses partially offset by working capital uses of cash. Non-cash expenses are comprised of stock-based compensation expense, depreciation and amortization expenses, impairment of acquired intangible assets and licenses and amortization of debt discount and transaction costs and unrealized foreign exchange differences. Cash used by changes in working capital for the year ended December 31, 2014 was primarily driven by increases in inventory, accounts receivables and prepaid expenses and other current assets, partially offset by increases in accounts payable, accrued expense for estimated legal contingency, accrued compensation and deferred revenue.
The net cash provided by operating activities was $15.0 million for the year ended December 31, 2013. It was primarily comprised of net loss and the net effect of cash provided by non-cash expenses partially offset by working capital uses of cash. Non-cash expenses are comprised of stock-based compensation, depreciation and amortization expenses, amortization of intangible assets, and impairment of acquired intangible assets and licenses. Cash used by changes in working capital for the year ended December 31, 2013 was primarily driven by increases in inventory, accounts receivables and prepaid expenses and other current assets partially offset by increases in accounts payable, accrued compensation and deferred revenue.
The net cash used in investing activities was $325.7 million for the year ended December 31, 2014. It was primarily comprised of the purchase of marketable securities after the issuance of our senior convertible notes, capital expenditures mainly related to our new ERP system, leasehold improvements of our buildings under operating lease and the purchase of additional manufacturing equipment and the cost of an acquisition, partially offset by proceeds from the sales and maturities of marketable securities.
The net cash used in investing activities was $71.0 million for the year ended December 31, 2013. It was primarily comprised of the purchase of fixed assets, mainly related to leasehold improvements of our buildings under operating lease and the purchase of additional manufacturing equipment, the purchase of marketable securities and investments and the cost of acquisitions, net of cash, partially offset by the proceeds from the sales and maturities of marketable securities and investments.
We currently expect a moderate decrease in our capital expenditures in 2015; however, we will continue to invest in the capacity and continued automation of our manufacturing operations to support the growth in our GeneXpert test revenue.
The net cash provided by financing activities was $349.2 million for the year ended December 31, 2014. It was primarily comprised of proceeds from the issuance of the senior convertible notes in February 2014 net of cash used to purchase capped call contracts and net proceeds from the issuance of common shares and exercise of stock options.
The net cash provided by financing activities was $26.6 million for the year ended December 31, 2013. It was primarily comprised of net proceeds from the issuance of common shares and exercise of stock options.
Lease, Purchase and Minimum Royalty Commitments and Debt Obligations
The following table summarizes our lease, purchase and minimum royalty commitments and debt obligations at December 31, 2014 (in thousands):
| Payments Due by Period | ||||||||||||||||||||
| Total | Less Than 1 Year |
1-3 Years |
3-5 Years |
More Than 5 Years |
||||||||||||||||
| Operating leases |
$ | 79,042 | $ | 11,411 | $ | 23,597 | $ | 19,706 | $ | 24,328 | ||||||||||
| Purchase obligations |
43,271 | 43,271 | — | — | — | |||||||||||||||
| Minimum royalties |
3,395 | 559 | 1,183 | 295 | 1,358 | |||||||||||||||
| Debt obligations |
373,031 | 4,313 | 8,625 | 8,625 | 351,468 | |||||||||||||||
|
|
|
|
|
|
|
|
|
|
|
|||||||||||
| $ | 498,739 | $ | 59,554 | $ | 33,405 | $ | 28,626 | $ | 377,154 | |||||||||||
|
|
|
|
|
|
|
|
|
|
|
|||||||||||
Lease Commitments
We lease office space under arrangements expiring through 2029. Certain of these lease arrangements contain escalation clauses whereby monthly rent increases over time. Rent expense is recognized on a straight-line basis over the lease period. Net rent expense for all operating leases for the years ended December 31, 2014, 2013 and 2012 was $11.6 million, $10.2 million and $8.4 million, respectively.
42
Table of Contents
Purchase Obligations
Purchase commitments include non-cancellable purchase orders or contracts for the purchase of raw materials used to manufacture our systems and reagents.
Minimum Royalty Commitments
Some of our licensing arrangements provide for a minimum royalty commitment. Royalty expense is generally based on a fee per unit shipped or a percent of revenue received for the products containing the licensed technology.
The expected timing of payment of the obligations discussed above is estimated based on current information. Timing of payments and actual amounts paid could vary in some circumstances depending on the timing of receipt of goods or services or changes to agreed-upon amounts for some obligations.
Debt Obligations
Debt obligations include the principal amount of our convertible senior notes due 2021, as well as interest payments to be made under the notes. Although these notes mature in 2021, they can be converted into cash and shares of our common stock prior to maturity if certain conditions are met. Any conversion prior to maturity can result in repayments of the principal amounts sooner than the scheduled repayments as indicated in the table. Please see Note 8 (“Convertible Senior Notes and Notes Payable”) of our Consolidated Financial Statements for further discussion of the terms of the convertible senior notes.
Off-Balance-Sheet Arrangements
As of December 31, 2014, we did not have any off-balance-sheet arrangements, as defined in Item 303(a)(4)(ii) of Regulation S-K promulgated under the Securities Act of 1933.
Financial Condition Outlook
We plan to continue to make expenditures to expand our manufacturing capacity and to support our activities in sales and marketing and research and development. These expenditures may vary from quarter to quarter. We plan to continue to support our working capital needs and anticipate that our existing cash resources will enable us to maintain currently planned operations. Based on past performance and current expectations, we believe that our current available sources of funds will be adequate to finance our operations for at least the next year. This expectation is based on our current and long-term operating plan and may change as a result of many factors, including our future capital requirements and our ability to increase revenues and reduce expenses, which depend on a number of factors outside our control, including general global economic conditions. For example, our future cash use will depend on, among other things, market acceptance of our new products, the resources we devote to developing and supporting our products, continued progress of our research and development of potential products, our ability to gain FDA clearance for our new products, the need to acquire licenses to new technology or to use our technology in new markets, expansion through acquisitions and the availability of other financing.
In the future, we may seek additional funds to support our strategic business needs and may seek to raise such additional funds through private or public sales of securities, strategic relationships, bank debt, lease financing arrangements, or other available means. If additional funds are raised through the issuance of equity or equity-related securities, shareholders may experience additional dilution, or such equity securities may have rights, preferences, or privileges senior to those of the holders of our common stock. If adequate funds are not available or are not available on acceptable terms to meet our business needs, our business may be harmed.
ITEM 7A. QUANTITATIVE AND QUALITATIVE DISCLOSURES ABOUT MARKET RISKS
Interest Rate Sensitivity
Our investment portfolio is exposed to market risk from changes in interest rates. The fair market value of fixed rate securities may be adversely impacted by fluctuations in interest rates while income earned on floating rate securities may decline as a result of decreases in interest rates. Under our current policies, we do not use interest rate derivative instruments to manage exposure to interest rate changes. We attempt to ensure the safety and preservation of our invested principal funds by limiting default risk, market risk and reinvestment risk. We mitigate default risk by investing in investment grade securities. We have historically maintained a relatively short average maturity for our investment portfolio, and we believe a hypothetical 100 basis point adverse move in interest rates along the entire interest rate yield curve would change the fair value of our interest sensitive financial instruments by approximately $1.5 million. In addition, if a 100 basis point change in overall interest rates were to occur in 2015, our interest income would not change significantly in relation to amounts we would expect to earn, based on our cash, cash equivalents, and investments as of December 31, 2014.
43
Table of Contents
Changes in interest rates may also impact gains or losses from the conversion of our outstanding convertible senior notes. In February 2014, we issued $345 million in aggregate principal amount of our 1.25% convertible senior notes due 2021. At our election, the notes are convertible into cash, shares of our common stock, or a combination of cash and shares of our common stock in each case under certain circumstances, including trading price conditions related to our common stock. If the trading price of our common stock reaches a price for a sustained period at 130% above the conversion price of $65.10, the notes will become convertible. Upon conversion, we are required to record a gain or loss for the difference between the fair value of the debt to be extinguished and its corresponding net carrying value. The fair value of the debt to be extinguished depends on our then-current incremental borrowing rate. If our incremental borrowing rate at the time of conversion is higher or lower than the implied interest rate of the notes, we will record a gain or loss in our consolidated statement of operations during the period in which the notes are converted. The implicit interest rate for the notes is 5.0%. An incremental borrowing rate that is a hypothetical 100 basis points lower than the implicit interest rate upon conversion of $100 million aggregate principal amount of the notes would result in a loss of approximately $5.3 million.
Foreign currency risk
We operate primarily in the United States and a majority of our revenue, cost, expense and capital purchasing activities for the year ended December 31, 2014 were transacted in U.S. dollars. As a corporation with international and domestic operations, we are exposed to changes in foreign exchange rates. In our international operations, we pay payroll and other expenses in local currencies. For the years ended December 31, 2014, 2013, and 2012, international sales were 42%, 38%, and 32%, respectively, of our sales. Our international sales are predominantly in Europe and South Africa. Our exposures to foreign currency risks may change over time and could have a material adverse impact on our financial results.
We will continue to use foreign currency hedging programs in the future and may use currency forward contracts, currency options, and/or other derivative financial instruments commonly utilized to reduce financial market risks if it is determined that such hedging activities are appropriate to reduce risk. A 10% change in the exchange rates upward or downward in our portfolio of foreign currency contracts would have decreased or increased, respectively, our unrealized loss by approximately $5.0 million at December 31, 2014. We do not hold or purchase any currency contracts for trading purposes.
ITEM 8. CONSOLIDATED FINANCIAL STATEMENTS AND SUPPLEMENTARY DATA
The following consolidated financial statements and the related notes thereto, of Cepheid and the Reports of Independent Registered Public Accounting Firm, Ernst and Young LLP, are filed as a part of this Form 10-K.
| Page | ||||
| Management’s Report on Internal Control Over Financial Reporting |
45 | |||
| 46 | ||||
| 48 | ||||
| 49 | ||||
| 50 | ||||
| 51 | ||||
| 52 | ||||
| 53 | ||||
| 83 | ||||
44
Table of Contents
MANAGEMENT’S REPORT ON INTERNAL CONTROL OVER FINANCIAL REPORTING
Our management is responsible for establishing and maintaining adequate internal control over financial reporting, as such term is defined in Exchange Act Rules 13a-15(f). Our internal control system is designed to provide reasonable assurance regarding the preparation and fair presentation of financial statements for external purposes in accordance with generally accepted accounting principles. All internal control systems, no matter how well designed, have inherent limitations and can provide only reasonable assurance that the objectives of the internal control system are met.
Under the supervision and with the participation of management, including the principal executive officer and principal financial officer, management conducted an evaluation of the effectiveness of our internal control over financial reporting based on the criteria established in Internal Control – Integrated Framework issued by the Committee of Sponsoring Organizations of the Treadway Commission (2013 framework).
Based on our evaluation under the framework in Internal Control – Integrated Framework, management has concluded that our internal control over financial reporting was effective as of December 31, 2014. Ernst & Young LLP, an independent registered public accounting firm, has audited the consolidated financial statements included in this Annual Report on Form 10-K and, as part of its audit, has issued an attestation report, included herein, on the effectiveness of the our internal control over financial reporting.
February 26, 2015
| /S/ JOHN L. BISHOP |
/S/ DANIEL E. MADDEN | |||
| John L. Bishop | Daniel E. Madden | |||
| Chairman and Chief Executive Officer | Vice President, Corporate Controller and Acting Chief Financial Officer |
45
Table of Contents
REPORT OF INDEPENDENT REGISTERED PUBLIC ACCOUNTING FIRM
The Board of Directors and Shareholders
Cepheid
We have audited Cepheid’s internal control over financial reporting as of December 31, 2014, based on criteria established in Internal Control-Integrated Framework issued by the Committee of Sponsoring Organizations of the Treadway Commission (2013 framework) (the COSO criteria). Cepheid’s management is responsible for maintaining effective internal control over financial reporting, and for its assessment of the effectiveness of internal control over financial reporting included in the accompanying Management’s Report on Internal Control Over Financial Reporting. Our responsibility is to express an opinion on the Company’s internal control over financial reporting based on our audit.
We conducted our audit in accordance with the standards of the Public Company Accounting Oversight Board (United States). Those standards require that we plan and perform the audit to obtain reasonable assurance about whether effective internal control over financial reporting was maintained in all material respects. Our audit included obtaining an understanding of internal control over financial reporting, assessing the risk that a material weakness exists, testing and evaluating the design and operating effectiveness of internal control based on the assessed risk, and performing such other procedures as we considered necessary in the circumstances. We believe that our audit provides a reasonable basis for our opinion.
A company’s internal control over financial reporting is a process designed to provide reasonable assurance regarding the reliability of financial reporting and the preparation of financial statements for external purposes in accordance with generally accepted accounting principles. A company’s internal control over financial reporting includes those policies and procedures that (1) pertain to the maintenance of records that, in reasonable detail, accurately and fairly reflect the transactions and dispositions of the assets of the company; (2) provide reasonable assurance that transactions are recorded as necessary to permit preparation of financial statements in accordance with generally accepted accounting principles, and that receipts and expenditures of the company are being made only in accordance with authorizations of management and directors of the company; and (3) provide reasonable assurance regarding prevention or timely detection of unauthorized acquisition, use, or disposition of the company’s assets that could have a material effect on the financial statements.
Because of its inherent limitations, internal control over financial reporting may not prevent or detect misstatements. Also, projections of any evaluation of effectiveness to future periods are subject to the risk that controls may become inadequate because of changes in conditions, or that the degree of compliance with the policies or procedures may deteriorate.
In our opinion, Cepheid maintained, in all material respects, effective internal control over financial reporting as of December 31, 2014, based on the COSO criteria.
We also have audited, in accordance with the standards of the Public Company Accounting Oversight Board (United States), the consolidated balance sheets of Cepheid as of December 31, 2014 and 2013, and the related consolidated statements of operations, comprehensive loss, shareholders’ equity, and cash flows for each of the three years in the period ended December 31, 2014 of Cepheid and our report dated February 26, 2015 expressed an unqualified opinion thereon.
| /s/ Ernst & Young LLP |
San Jose, California
February 26, 2015
46
Table of Contents
REPORT OF INDEPENDENT REGISTERED PUBLIC ACCOUNTING FIRM
The Board of Directors and Shareholders
Cepheid
We have audited the accompanying consolidated balance sheets of Cepheid as of December 31, 2014 and 2013, and the related consolidated statements of operations, comprehensive loss, shareholders’ equity, and cash flows for each of the three years in the period ended December 31, 2014. Our audits also included the financial statement schedule listed in the Index at Part IV Item 15(b). These financial statements and schedule are the responsibility of Cepheid’s management. Our responsibility is to express an opinion on these financial statements and schedule based on our audits.
We conducted our audits in accordance with the standards of the Public Company Accounting Oversight Board (United States). Those standards require that we plan and perform the audit to obtain reasonable assurance about whether the financial statements are free of material misstatement. An audit includes examining, on a test basis, evidence supporting the amounts and disclosures in the financial statements. An audit also includes assessing the accounting principles used and significant estimates made by management, as well as evaluating the overall financial statement presentation. We believe that our audits provide a reasonable basis for our opinion.
In our opinion, the financial statements referred to above present fairly, in all material respects, the consolidated financial position of Cepheid at December 31, 2014 and 2013, and the consolidated results of its operations, comprehensive loss and its cash flows for each of the three years in the period ended December 31, 2014, in conformity with U.S. generally accepted accounting principles. Also in our opinion, the related financial statement schedule, when considered in relation to the basic financial statements taken as a whole, presents fairly in all material respects, the information set forth therein.
We also have audited, in accordance with the standards of the Public Company Accounting Oversight Board (United States), Cepheid’s internal control over financial reporting as of December 31, 2014, based on criteria established in Internal Control-Integrated Framework issued by the Committee of Sponsoring Organizations of the Treadway Commission (2013 framework) and our report dated February 26, 2015 expressed an unqualified opinion thereon.
| /s/ Ernst & Young LLP |
San Jose, California
February 26, 2015
47
Table of Contents
CEPHEID
| December | ||||||||
| 2014 | 2013 | |||||||
| (In thousands, except share data) | ||||||||
| ASSETS | ||||||||
| Current assets: |
||||||||
| Cash and cash equivalents |
$ | 96,663 | $ | 66,072 | ||||
| Short-term investments |
196,729 | 8,837 | ||||||
| Accounts receivable, less allowance for doubtful accounts of $237 and $198 as of December 31, 2014 and 2013, respectively |
68,809 | 52,202 | ||||||
| Inventory, net |
132,635 | 103,866 | ||||||
| Prepaid expenses and other current assets |
24,274 | 13,037 | ||||||
|
|
|
|
|
|||||
| Total current assets |
519,110 | 244,014 | ||||||
| Property and equipment, net |
115,765 | 84,886 | ||||||
| Investments |
79,731 | 9,820 | ||||||
| Other non-current assets |
7,847 | 958 | ||||||
| Intangible assets, net |
31,440 | 15,245 | ||||||
| Goodwill |
39,681 | 39,681 | ||||||
|
|
|
|
|
|||||
| Total assets |
$ | 793,574 | $ | 394,604 | ||||
|
|
|
|
|
|||||
| LIABILITIES AND SHAREHOLDERS’ EQUITY | ||||||||
| Current liabilities: |
||||||||
| Accounts payable |
$ | 50,435 | $ | 52,609 | ||||
| Accrued compensation |
33,760 | 22,009 | ||||||
| Accrued royalties |
5,443 | 5,245 | ||||||
| Accrued and other liabilities |
34,761 | 7,440 | ||||||
| Current portion of deferred revenue |
13,447 | 8,183 | ||||||
|
|
|
|
|
|||||
| Total current liabilities |
137,846 | 95,486 | ||||||
| Long-term portion of deferred revenue |
4,532 | 3,424 | ||||||
| Convertible senior notes, net |
278,213 | — | ||||||
| Other liabilities |
18,768 | 10,454 | ||||||
|
|
|
|
|
|||||
| Total liabilities |
439,359 | 109,364 | ||||||
|
|
|
|
|
|||||
| Commitments and contingencies (Note 8) |
||||||||
| Shareholders’ equity: |
||||||||
| Preferred stock, no par value; 5,000,000 shares authorized, none issued or outstanding |
— | — | ||||||
| Common stock, no par value; 150,000,000 and 100,000,000 shares authorized, 70,904,388 and 68,556,392 shares issued and outstanding at December 31, 2014 and 2013, respectively |
422,151 | 383,379 | ||||||
| Additional paid-in capital |
225,529 | 145,900 | ||||||
| Accumulated other comprehensive income (loss) |
247 | (476 | ) | |||||
| Accumulated deficit |
(293,712 | ) | (243,563 | ) | ||||
|
|
|
|
|
|||||
| Total shareholders’ equity |
354,215 | 285,240 | ||||||
|
|
|
|
|
|||||
| Total liabilities and shareholders’ equity |
$ | 793,574 | $ | 394,604 | ||||
|
|
|
|
|
|||||
The accompanying notes are an integral part of these consolidated financial statements.
48
Table of Contents
CEPHEID
CONSOLIDATED STATEMENTS OF OPERATIONS
| Years Ended December 31 | ||||||||||||
| 2014 | 2013 | 2012 | ||||||||||
| (In thousands, except per share data) | ||||||||||||
| Revenue |
$ | 470,141 | $ | 401,292 | $ | 331,212 | ||||||
| Costs and operating expenses: |
||||||||||||
| Cost of sales |
229,327 | 207,933 | 153,365 | |||||||||
| Collaboration profit sharing |
5,154 | 7,512 | 7,183 | |||||||||
| Research and development |
96,851 | 80,197 | 71,673 | |||||||||
| Sales and marketing |
97,848 | 79,941 | 61,907 | |||||||||
| General and administrative |
55,047 | 41,719 | 43,298 | |||||||||
| Legal contingencies and settlements |
20,000 | — | 15,110 | |||||||||
|
|
|
|
|
|
|
|||||||
| Total costs and operating expenses |
504,227 | 417,302 | 352,536 | |||||||||
|
|
|
|
|
|
|
|||||||
| Loss from operations |
(34,086 | ) | (16,010 | ) | (21,324 | ) | ||||||
| Other income (expense): |
||||||||||||
| Interest income |
1,119 | 45 | 26 | |||||||||
| Interest expense |
(12,609 | ) | (137 | ) | (147 | ) | ||||||
| Foreign currency exchange gain (loss) and other, net |
(2,016 | ) | (715 | ) | 117 | |||||||
|
|
|
|
|
|
|
|||||||
| Other expense, net |
(13,506 | ) | (807 | ) | (4 | ) | ||||||
|
|
|
|
|
|
|
|||||||
| Loss before income taxes |
(47,592 | ) | (16,817 | ) | (21,328 | ) | ||||||
| Benefit from (provision for) income taxes |
(2,557 | ) | (1,148 | ) | 1,285 | |||||||
|
|
|
|
|
|
|
|||||||
| Net loss |
$ | (50,149 | ) | $ | (17,965 | ) | $ | (20,043 | ) | |||
|
|
|
|
|
|
|
|||||||
| Basic net loss per share |
$ | (0.72 | ) | $ | (0.27 | ) | $ | (0.30 | ) | |||
|
|
|
|
|
|
|
|||||||
| Diluted net loss per share |
$ | (0.72 | ) | $ | (0.27 | ) | $ | (0.30 | ) | |||
|
|
|
|
|
|
|
|||||||
| Shares used in computing basic net loss per share |
70,069 | 67,485 | 65,812 | |||||||||
|
|
|
|
|
|
|
|||||||
| Shares used in computing diluted net loss per share |
70,069 | 67,485 | 65,812 | |||||||||
|
|
|
|
|
|
|
|||||||
The accompanying notes are an integral part of these consolidated financial statements.
49
Table of Contents
CEPHEID
CONSOLIDATED STATEMENTS OF COMPREHENSIVE LOSS
| 2014 | 2013 | 2012 | ||||||||||
| (In thousands) | ||||||||||||
| Net loss |
$ | (50,149 | ) | $ | (17,965 | ) | $ | (20,043 | ) | |||
| Other comprehensive loss, net of taxes of $0: |
||||||||||||
| Foreign currency translation adjustments |
— | — | 140 | |||||||||
| Change in unrealized gains and losses related to cash flow hedges: |
||||||||||||
| Gain (loss) recognized in other comprehensive loss, net |
146 | (118 | ) | (401 | ) | |||||||
| (Gain) loss reclassified from accumulated comprehensive loss to the statement of operations, net |
735 | (427 | ) | 285 | ||||||||
| Change in unrealized gains and losses related to available-for-sale investments, net: |
||||||||||||
| Gain (loss) recognized in other comprehensive loss, net |
(159 | ) | 15 | — | ||||||||
| (Gain) reclassified from accumulated comprehensive loss to the statement of operations, net |
(36 | ) | (2 | ) | — | |||||||
|
|
|
|
|
|
|
|||||||
| Comprehensive loss |
$ | (49,463 | ) | $ | (18,497 | ) | $ | (20,019 | ) | |||
|
|
|
|
|
|
|
|||||||
The accompanying notes are an integral part of these consolidated financial statements.
50
Table of Contents
CEPHEID
CONSOLIDATED STATEMENTS OF SHAREHOLDERS’ EQUITY
| Common Stock | ||||||||||||||||||||||||
| (In thousands) | Shares | Amount | Additional Paid-In Capital |
Accumulated Other Comprehensive Income (Loss) |
Accumulated Deficit |
Total Share- holders’ Equity |
||||||||||||||||||
| Balance at December 31, 2011 |
64,157 | $ | 324,211 | $ | 93,144 | $ | 33 | $ | (205,555 | ) | $ | 211,833 | ||||||||||||
| Net loss |
(20,043 | ) | (20,043 | ) | ||||||||||||||||||||
| Unrealized gain (loss) related to cash flow hedging |
— | — | — | (117 | ) | — | (117 | ) | ||||||||||||||||
| Foreign currency translation adjustment |
— | — | — | 140 | — | 140 | ||||||||||||||||||
| Issuance of shares of common stock under employee and director option plans |
2,060 | 22,373 | — | — | — | 22,373 | ||||||||||||||||||
| Shares issued for purchase of a business |
157 | 4,577 | — | — | — | 4,577 | ||||||||||||||||||
| Stock-based compensation related to stock options and awards and employee stock purchase plans |
— | — | 24,073 | — | — | 24,073 | ||||||||||||||||||
| Issuance of shares of common stock under employee stock purchase plans |
230 | 4,706 | — | — | — | 4,706 | ||||||||||||||||||
|
|
|
|
|
|
|
|
|
|
|
|
|
|||||||||||||
| Balance at December 31, 2012 |
66,604 | 355,867 | 117,217 | 56 | (225,598 | ) | 247,542 | |||||||||||||||||
| Net loss |
(17,965 | ) | (17,965 | ) | ||||||||||||||||||||
| Unrealized gain (loss) related to cash flow hedging |
— | — | — | (545 | ) | — | (545 | ) | ||||||||||||||||
| Unrealized gain (loss) related to available-for-sale investments, net |
— | — | — | 13 | — | 13 | ||||||||||||||||||
| Issuance of shares of common stock under employee and director option plans |
1,740 | 22,159 | — | — | — | 22,159 | ||||||||||||||||||
| Stock-based compensation related to stock options and awards and employee stock purchase plans |
— | — | 28,683 | — | — | 28,683 | ||||||||||||||||||
| Issuance of shares of common stock under employee stock purchase plans |
212 | 5,353 | — | — | 5,353 | |||||||||||||||||||
|
|
|
|
|
|
|
|
|
|
|
|
|
|||||||||||||
| Balance at December 31, 2013 |
68,556 | 383,379 | 145,900 | (476 | ) | (243,563 | ) | 285,240 | ||||||||||||||||
| Net loss |
(50,149 | ) | (50,149 | ) | ||||||||||||||||||||
| Unrealized gain related to cash flow hedging |
— | — | — | 881 | — | 881 | ||||||||||||||||||
| Unrealized loss related to available-for-sale investments, net |
— | — | — | (158 | ) | — | (158 | ) | ||||||||||||||||
| Issuance of shares of common stock under employee and director option plans |
2,144 | 32,733 | — | — | — | 32,733 | ||||||||||||||||||
| Stock-based compensation related to stock options and awards and employee stock purchase plans |
— | — | 31,632 | — | — | 31,632 | ||||||||||||||||||
| Equity component of convertible senior notes |
73,013 | 73,013 | ||||||||||||||||||||||
| Purchase of convertible note capped call hedge |
(25,082 | ) | (25,082 | ) | ||||||||||||||||||||
| Excess tax benefits from stock-based compensation |
— | — | 66 | — | — | 66 | ||||||||||||||||||
| Issuance of shares of common stock under employee stock purchase plans |
204 | 6,039 | — | — | — | 6,039 | ||||||||||||||||||
|
|
|
|
|
|
|
|
|
|
|
|
|
|||||||||||||
| Balance at December 31, 2014 |
70,904 | 422,151 | 225,529 | 247 | (293,712 | ) | 354,215 | |||||||||||||||||
|
|
|
|
|
|
|
|
|
|
|
|
|
|||||||||||||
The accompanying notes are an integral part of these consolidated financial statements.
51
Table of Contents
CEPHEID
CONSOLIDATED STATEMENTS OF CASH FLOWS
| Years Ended December 31, | ||||||||||||
| 2014 | 2013 | 2012 | ||||||||||
| (In thousands) | ||||||||||||
| Cash flows from operating activities: |
||||||||||||
| Net loss |
$ | (50,149 | ) | $ | (17,965 | ) | $ | (20,043 | ) | |||
| Adjustments to reconcile net loss to net cash provided by operating activities: |
||||||||||||
| Depreciation and amortization of property and equipment |
21,604 | 17,769 | 13,446 | |||||||||
| Amortization of intangible assets |
4,739 | 5,418 | 4,965 | |||||||||
| Unrealized foreign exchange differences |
1,836 | 419 | — | |||||||||
| Amortization of debt discount and transaction costs |
8,600 | — | — | |||||||||
| Impairment of acquired intangible assets, licenses, property and equipment |
— | 2,855 | 1,399 | |||||||||
| Stock-based compensation expense |
32,207 | 27,635 | 24,496 | |||||||||
| Excess tax benefits from stock-based compensation |
(66 | ) | — | — | ||||||||
| Changes in operating assets and liabilities: |
||||||||||||
| Accounts receivable |
(16,606 | ) | (6,960 | ) | (6,443 | ) | ||||||
| Inventory |
(29,346 | ) | (32,638 | ) | (5,105 | ) | ||||||
| Prepaid expenses and other current assets |
(5,184 | ) | (5,263 | ) | (2,714 | ) | ||||||
| Other non-current assets |
(2 | ) | 150 | (172 | ) | |||||||
| Accounts payable and other current and non-current liabilities |
3,438 | 17,334 | (5,740 | ) | ||||||||
| Accrued expense for estimated legal contingency |
20,000 | — | — | |||||||||
| Accrued compensation |
11,751 | 5,421 | (1,736 | ) | ||||||||
| Deferred revenue |
6,372 | 837 | 575 | |||||||||
|
|
|
|
|
|
|
|||||||
| Net cash provided by operating activities |
9,194 | 15,012 | 2,928 | |||||||||
| Cash flows from investing activities: |
||||||||||||
| Capital expenditures |
(46,979 | ) | (47,526 | ) | (23,150 | ) | ||||||
| Payments for technology licenses |
— | (1,125 | ) | (2,140 | ) | |||||||
| Cost of acquisitions, net |
(18,000 | ) | (3,669 | ) | (24,021 | ) | ||||||
| Proceeds from sales of marketable securities and investments |
115,881 | 2,503 | — | |||||||||
| Proceeds from maturities of marketable securities and investments |
102,733 | 1,347 | — | |||||||||
| Purchases of marketable securities and investments |
(477,485 | ) | (22,511 | ) | — | |||||||
| Transfer to restricted cash |
(1,875 | ) | — | — | ||||||||
|
|
|
|
|
|
|
|||||||
| Net cash used in investing activities |
(325,725 | ) | (70,981 | ) | (49,311 | ) | ||||||
| Cash flows from financing activities: |
||||||||||||
| Net proceeds from the issuance of common shares and exercise of stock options |
38,615 | 27,512 | 27,079 | |||||||||
| Excess tax benefits from stock-based compensation |
66 | — | — | |||||||||
| Proceeds from bank borrowing |
— | — | 156 | |||||||||
| Proceeds from borrowings of convertible senior notes, net of issuance costs |
335,789 | — | — | |||||||||
| Purchase of convertible note capped call hedge |
(25,082 | ) | — | — | ||||||||
| Principal payments of notes payable |
(180 | ) | (874 | ) | (72 | ) | ||||||
|
|
|
|
|
|
|
|||||||
| Net cash provided by financing activities |
349,208 | 26,638 | 27,163 | |||||||||
| Effect of foreign exchange rate change on cash and cash equivalents |
(2,086 | ) | (376 | ) | (9 | ) | ||||||
|
|
|
|
|
|
|
|||||||
| Net increase (decrease) in cash and cash equivalents |
30,591 | (29,707 | ) | (19,229 | ) | |||||||
| Cash and cash equivalents at beginning of period |
66,072 | 95,779 | 115,008 | |||||||||
|
|
|
|
|
|
|
|||||||
| Cash and cash equivalents at end of period |
$ | 96,663 | $ | 66,072 | $ | 95,779 | ||||||
|
|
|
|
|
|
|
|||||||
The accompanying notes are an integral part of these consolidated financial statements.
52
Table of Contents
CEPHEID
NOTES TO CONSOLIDATED FINANCIAL STATEMENTS
December 31, 2014
1. Organization and Summary of Significant Accounting Policies
Organization and Business
Cepheid (the “Company”) was incorporated in the State of California on March 4, 1996. The Company is a molecular diagnostics company that develops, manufactures, and markets fully-integrated systems for testing in the Clinical market, as well as for application in the Company’s legacy Non-Clinical market. The Company’s systems enable rapid, sophisticated molecular testing for organisms and genetic-based diseases by automating otherwise complex manual laboratory procedures.
Principles of Consolidation
The consolidated financial statements include the accounts of the Company and its wholly-owned subsidiaries after elimination of intercompany transactions and balances. On July 1, 2012, the Company changed the functional currency for certain foreign subsidiaries from the local currency to the U.S. dollar due to changes in the way these businesses and their operations are structured and managed. As a result, all foreign subsidiaries are using the U.S. dollar as the functional currency effective July 1, 2012. Prior to this change, adjustments resulting from translating the foreign currency financial statements of these subsidiaries into the U.S. dollar had been included as a separate component of accumulated other comprehensive income (loss). Upon the change of the functional currency, these subsidiaries no longer generate further translation adjustments, and the accumulated translation adjustments from prior periods will continue to remain a component of accumulated other comprehensive income (loss).
Net loss includes the gains and losses arising from transactions denominated in a currency other than the functional currency of a location, the remeasurement of assets and liabilities of foreign subsidiaries using U.S. dollars as their functional currency, and the realized results of the Company’s foreign currency hedging activities.
Use of Estimates
The preparation of consolidated financial statements in conformity with U.S. generally accepted accounting principles (“GAAP”) requires the Company to make estimates and assumptions that affect the amounts reported in the consolidated financial statements and accompanying notes. Actual results could differ from these estimates.
Fair Value of Financial Instruments
The Company defines fair value as the exchange price that would be received for an asset or paid to transfer a liability (an exit price) in the principal or most advantageous market for the asset or liability in an orderly transaction between market participants on the measurement date. The Company’s valuation techniques used to measure fair value maximized the use of observable inputs and minimized the use of unobservable inputs. The fair value hierarchy is based on the following three levels of inputs:
| • | Level 1—Quoted prices in active markets for identical assets or liabilities. |
| • | Level 2—Inputs other than Level 1 that are observable, either directly or indirectly, such as quoted prices for similar assets or liabilities; quoted prices in markets that are not active; or other inputs that are observable or can be corroborated by observable market data for substantially the full term of the assets or liabilities. |
| • | Level 3—Unobservable inputs that are supported by little or no market activity and that are significant to the fair value of the assets or liabilities. |
See Note 2, “Fair Value”, for information and related disclosures regarding the Company’s fair value measurements.
Cash, Cash Equivalents, Restricted Cash, Short-Term Investments and Non-Current Investments
Cash and cash equivalents consist of cash on deposit with banks and money market instruments. Interest and other income, net includes interest, dividends, amortization of purchase premiums and discounts and realized gains and losses on sales of securities.
Restricted cash consists of cash contractually restricted for use to develop the Xpert Ebola test in accordance with the Company’s agreement with BMGF. At December 31, 2014, prepaid expense and other current assets include $1.9 million of restricted cash.
53
Table of Contents
The Company’s marketable debt securities have been classified and accounted for as available-for-sale. The Company determines the appropriate classification of its investments at the time of purchase and re-evaluates the designations at each balance sheet date. The Company classifies its marketable debt securities as cash equivalents, short-term investments or non-current investments based on each instrument’s underlying effective maturity date. All highly liquid investments with maturities of three months or less at the date of purchase are classified as cash equivalents. Marketable debt securities with effective maturities of 12 months or less are classified as short-term, and marketable debt securities with effective maturities greater than 12 months are classified as non-current. The Company’s marketable debt securities are carried at fair value, with the unrealized gains and losses reported within accumulated other comprehensive loss, a component of shareholders’ equity. The cost of securities sold is based upon the specific identification method.
The Company assesses whether an other-than-temporary impairment loss on its investments has occurred due to declines in fair value or other market conditions. With respect to the Company’s debt securities, this assessment takes into account the severity and duration of the decline in value, the Company’s intent to sell the security, whether it is more likely than not that the Company will be required to sell the security before recovery of its amortized cost basis, and whether or not the Company expects to recover the entire amortized cost basis of the security (that is, a credit loss exists).
See Note 3, “Investments”, for information and related disclosures regarding the Company’s investments.
Supplemental cash flow information
| Years Ended December 31, | ||||||||||||
| 2014 | 2013 | 2012 | ||||||||||
| (In thousands) | ||||||||||||
| Supplemental Cash Flow Information |
||||||||||||
| Cash paid for interest |
$ | 2,145 | $ | 109 | $ | 124 | ||||||
| Cash paid for taxes |
$ | 572 | $ | 632 | $ | 1,051 | ||||||
| Property and equipment and intangible assets acquired included in accounts payable, other accrued expense and other current liabilities |
$ | 8,506 | $ | 674 | $ | 1,031 | ||||||
Concentration of Credit Risks and Other Uncertainties
The carrying amounts for financial instruments consisting of cash and cash equivalents, restricted cash, accounts receivable, accounts payable, and accrued and other liabilities approximate fair value due to their short maturities. Derivative instruments and investments are stated at their estimated fair values, based on quoted market prices for the same or similar instruments. The counterparties to the agreements relating to the Company’s derivative instruments consist of large financial institutions of high credit standing.
The Company’s main financial institution for banking operations held 58% and 55% of the Company’s cash and cash equivalents as of December 31, 2014 and 2013, respectively.
The Company’s accounts receivable are derived from net revenue to customers and distributors located in the United States and other countries. The Company performs credit evaluations of its customers’ financial condition. The Company provides reserves for potential credit losses but has not experienced significant losses to date. There was one direct customer whose accounts receivable balance represented 26% and 14% of total accounts receivable as of December 31, 2014 and 2013, respectively.
The Company currently sells products through its direct sales force and distributors. There were no direct customers that accounted for 10% or more of total sales for the years ended December 31, 2014, 2013 and 2012. No single country outside of the United States or South Africa represented more than 10% of the Company’s total revenues or total assets in any period presented.
Inventory
Inventory is stated at the lower of standard cost (which approximates actual cost) or market value, with cost determined on the first-in-first-out method. Allocation of fixed production overheads to conversion costs is based on normal capacity of production. Abnormal amounts of idle facility expense, freight, handling costs, and spoilage are expensed as incurred, and not included in overhead. The Company maintains provisions for excess and obsolete inventory based on management’s estimates of forecasted demand and, where applicable, product expiration. A substantial decrease in demand for the Company’s products or the introduction of new products could lead to excess inventories and could require the Company to increase its provision for inventory obsolescence.
54
Table of Contents
The components of inventories were as follows (in thousands):
| December 31 | ||||||||
| 2014 | 2013 | |||||||
| Raw Materials |
$ | 36,287 | $ | 35,760 | ||||
| Work in Process |
51,691 | 36,580 | ||||||
| Finished Goods |
44,657 | 31,526 | ||||||
|
|
|
|
|
|||||
| Inventory |
$ | 132,635 | $ | 103,866 | ||||
|
|
|
|
|
|||||
In addition, capitalized stock-based compensation expense of $1.6 million and $2.1 million were included in inventory as of December 31, 2014 and 2013, respectively.
Property and Equipment
Property and equipment are stated at cost less accumulated depreciation and amortization. Depreciation and amortization are calculated using the straight-line method based on the estimated useful lives of the assets, which range from 3 to 7 years. Leasehold improvements are amortized over the shorter of the estimated useful lives of the assets or the remaining lease term. During 2014, there was no indication of impairment of property and equipment. In 2013, the Company concluded that certain manufacturing capital assets would not be utilized and therefore had no future realizable value and thus an impairment was recorded of approximately $1.3 million as cost of sales.
Property and equipment consisted of the following (in thousands):
| December 31 | ||||||||
| 2014 | 2013 | |||||||
| Land |
$ | 21 | $ | 21 | ||||
| Building |
3,364 | 3,970 | ||||||
| Scientific equipment |
52,619 | 42,845 | ||||||
| Manufacturing equipment |
56,426 | 45,339 | ||||||
| Computers and software |
24,402 | 13,923 | ||||||
| Office furniture |
9,929 | 7,887 | ||||||
| Leasehold improvements |
66,842 | 48,879 | ||||||
|
|
|
|
|
|||||
| $ | 213,603 | $ | 162,864 | |||||
|
|
|
|
|
|||||
| Less accumulated depreciation and amortization |
(97,838 | ) | (77,978 | ) | ||||
|
|
|
|
|
|||||
| $ | 115,765 | $ | 84,886 | |||||
|
|
|
|
|
|||||
Total depreciation and amortization expense on our property and equipment in the years ended December 31, 2014, 2013 and 2012 totaled $21.6 million, $17.8 million and $13.4 million, respectively.
Capitalized Software Costs for Internal Use
Internally developed software primarily includes enterprise-level business software that the Company customizes to meet its specific operational needs. The Company capitalized costs for a new enterprise resource planning software system and other internal use software of $10.3 million and $1.9 million during the years ended December 31, 2014 and 2013, respectively. Upon being placed in service, these assets are depreciated over an estimated useful life of 3 to 5 years.
55
Table of Contents
Intangible Assets and Goodwill
Intangible assets related to licenses are recorded at cost, less accumulated amortization. Intangible assets related to technology and other intangible assets acquired in acquisitions are recorded at fair value at the date of acquisition, less accumulated amortization. Intangible assets are amortized on a straight line basis over their estimated useful lives, ranging from three to 15 years. Amortization of intangible assets is primarily included in cost of sales, research and development and sales and marketing in the Consolidated Statements of Operations.
The Company reviews its intangible assets for impairment and conducts the impairment review when events or circumstances indicate the carrying value of a long-lived asset may be impaired by estimating the future undiscounted cash flows to be derived from an asset to assess whether or not a potential impairment exists. If the carrying value exceeds the Company’s estimate of future undiscounted cash flows, an impairment value is calculated as the excess of the carrying value of the asset over the Company’s estimate of its fair market value. Events or circumstances which could trigger an impairment review include a significant adverse change in the business climate, an adverse action or assessment by a regulator, unanticipated competition, significant changes in the Company’s use of acquired assets, the Company’s overall business strategy, or significant negative industry or economic trends. In 2014, 2013 and 2012, the Company recorded an impairment charge of $0.1 million, $1.3 million and $1.4 million, respectively, to cost of sales primarily related to acquired technology for one of its legacy products.
Goodwill and intangible assets with indefinite useful lives are not amortized, but are tested for impairment at least annually during the fourth fiscal quarter, or as circumstances indicate their value may no longer be recoverable. Goodwill represents the excess of the purchase price over the fair value of net tangible and identifiable intangible assets. The Company continues to operate in one segment, which is considered to be the sole reporting unit and therefore, goodwill was tested for impairment at the enterprise level. As of December 31, 2014, there has been no impairment of goodwill. The Company does not have intangible assets with indefinite useful lives other than goodwill.
56
Table of Contents
Warranty Reserve
The Company generally warrants its systems to be free from defects for a period of 12 to 24 months from the date of sale and certain disposable products to be free from defects, when handled according to product specifications, for the stated life of such products. Accordingly, a provision for the estimated cost of warranty repair or replacement is recorded at the time revenue is recognized. The Company’s warranty provision is established using management’s estimate of future failure rates and future costs of repairing any failures during the warranty period or replacing any disposable products with defects. The activities in the warranty provision consisted of the following (in thousands):
| 2014 | 2013 | 2012 | ||||||||||
| Balance at beginning of year |
$ | 3,326 | $ | 1,953 | $ | 1,981 | ||||||
| Costs incurred and charged against reserve |
(1,310 | ) | (783 | ) | (690 | ) | ||||||
| Accrual related to current year product sales |
1,768 | 2,156 | 662 | |||||||||
|
|
|
|
|
|
|
|||||||
| Balance at end of year |
$ | 3,784 | $ | 3,326 | $ | 1,953 | ||||||
|
|
|
|
|
|
|
|||||||
Accrued and other liabilities
Accrued and other liabilities consisted of the following (in thousands):
| December 31 | ||||||||
| 2014 | 2013 | |||||||
| Accrued expense for estimated legal contingency |
$ | 20,000 | $ | — | ||||
| Derivative liabilities |
3,812 | 1,555 | ||||||
| Accrued warranty reserve |
3,784 | 3,326 | ||||||
| Accrued payment related to asset acquisition |
3,000 | — | ||||||
| Income tax payable |
1,028 | 559 | ||||||
| Other |
3,137 | 2,000 | ||||||
|
|
|
|
|
|||||
| Accrued and other liabilities |
$ | 34,761 | $ | 7,440 | ||||
|
|
|
|
|
|||||
Other liabilities
Other liabilities consisted of the following (in thousands):
| December 31 | ||||||||
| 2014 | 2013 | |||||||
| Deferred tax liabilities |
$ | 6,261 | $ | 921 | ||||
| Deferred rent |
7,721 | 5,908 | ||||||
| Non-current income tax payable |
2,150 | 877 | ||||||
| Other |
2,636 | 2,748 | ||||||
|
|
|
|
|
|||||
| Other liabilities |
$ | 18,768 | $ | 10,454 | ||||
|
|
|
|
|
|||||
Revenue Recognition
The Company recognizes revenue from sales when there is persuasive evidence that an arrangement exists, delivery has occurred, the price is fixed or determinable, and collectability is reasonably assured. No right of return exists for the Company’s products except in the case of damaged goods. The Company has not experienced any significant returns of its products. Shipping and handling costs are expensed as incurred and included in cost of sales. In those cases where the Company bills shipping and handling costs to customers, the amounts billed are classified as revenue.
The Company enters into revenue arrangements that may consist of multiple deliverables of its products and services. In situations with multiple deliverables, revenue is recognized upon the delivery of the separate elements. The Company sells service contracts for which revenue is deferred and recognized ratably over the contract period.
57
Table of Contents
The Company may place an instrument at a customer site under a reagent rental. Under a reagent rental, the Company retains title to the instrument and earns revenue for the usage of the instrument and related maintenance services through the amount charged for reagents and other disposables. Under a reagent rental, a customer may commit to purchasing minimum quantities of reagents at stated prices over a defined contract term, which is typically between three and five years. Revenue is recognized over the term of a reagent rental as reagents and other disposables are shipped and all other revenue recognition criteria have been met. All revenue recognized from reagent rental are included in reagent and disposable sales in Note 12, “Segment and Significant Concentrations”.
For multiple element arrangements, the total consideration for an arrangement is allocated among the separate elements in the arrangement based on a selling price hierarchy. The selling price hierarchy for a deliverable is based on: (1) vendor specific objective evidence (“VSOE”), if available; (2) third party evidence of selling price if VSOE is not available; or (3) an estimated selling price, if neither VSOE nor third party evidence is available. Estimated selling price is the Company’s best estimate of the selling price of an element in a transaction. The Company limits the amount of revenue recognized for delivered elements to the amount that is not contingent on the future delivery of products or services or other future performance obligations. The Company recognizes revenue for delivered elements only when it determines there are no uncertainties regarding customer acceptance.
Revenue includes fees for research and development services, including research and development under grants and government sponsored research and collaboration agreements. Revenue is derived from cost-type contracts with the U.S. government. Revenue and profit under cost-plus service contracts is recognized as costs are incurred plus negotiated fees. Fixed fees on cost-plus service contracts are recognized ratably over the contract performance period as services are performed. Contract costs include labor and related employee benefits, subcontracting costs and other direct costs, as well as allocations of allowable indirect costs. For contract change orders, claims or similar items, judgment is required for estimating the amounts, assessing the potential for realization, and determining whether realization is probable. From time to time, facts develop that require revisions of revenue recognized or cost estimates. To the extent that a revised estimate affects the current or an earlier period, the cumulative effect of the revision is recognized in the period in which the facts requiring the revision become known. Advance payments received in excess of amounts earned, such as funds received in advance of products to be delivered or services to be performed, are classified as deferred revenue until earned.
During 2012, the Company entered into agreements with BMGF, The United States Agency for International Development (“USAID”) and UNITAID to reduce the price of the Company’s Multi-Drug Resistant Tuberculosis test to $9.98 for customers in the HBDC program. The Company received one-time payments of $3.5 million each from BMGF and USAID in 2012 and $3.2 million from UNITAID during 2013. Based on the terms of the agreements, the Company recognized revenue related to the BMGF and USAID agreements on a per-unit basis. Under the UNITAID agreement, the Company is recognizing the $3.2 million of revenue on a straight line basis over a period of ten years. For the years ended December 31, 2014, 2013 and 2012, the Company recognized revenue of $0.3 million, $2.7 million, and $4.8 million, respectively, related to these three agreements.
Research and Development
Research and development expenses consist of costs incurred for company-sponsored and collaborative research and development activities. These costs include direct and research-related overhead expenses, amortization of certain intangible assets, and the costs of clinical studies. Research and development costs are expensed as incurred.
Stock-Based Compensation
Stock-based compensation cost is measured at the grant date based on the fair value of the award and is recognized as expense on a straight-line basis over the requisite service period, which is generally the vesting period. The value of the portion of the award that is ultimately expected to vest is recognized as expense over the requisite service periods in the Company’s consolidated statements of operations. The Company recognizes the fair value of the Company’s stock option awards as compensation expense over the requisite service period of each award, which is generally four years.
In determining fair value of the stock-based compensation expense, the Company uses the Black–Scholes model and a single option award approach, which requires the input of subjective assumptions. These assumptions include: estimating the length of time employees will retain their vested stock options before exercising them (expected term), the estimated volatility of the Company’s common stock price over the expected term (expected volatility), the risk-free interest rate (interest rate), expected dividends and the number of shares subject to options that will ultimately not complete their vesting requirements (forfeitures). Changes in the following assumptions can materially affect the estimate of the fair value of stock–based compensation.
58
Table of Contents
| • | Expected term is determined based on historical experience, giving consideration to the contractual terms of the stock-based awards, vesting schedules and expectations of future employee behavior as influenced by changes to the terms of its stock-based awards. |
| • | Expected volatility is based on the blend of historical volatility of the past period equal to the Company’s expected term and the current implied volatility. |
| • | Risk-free interest rate is based on the implied yield currently available on U.S. Treasury zero-coupon issues with a remaining term equivalent to the expected term of a stock award. |
| • | Expected dividend is based on the Company’s expectation of issuing a dividend over the expected term. The Company has never issued dividends. |
| • | Estimated forfeitures are based on voluntary termination behavior as well as analysis of actual option forfeitures. |
Foreign Currency Hedging
The Company uses forward contracts designated as cash flow hedges to protect against the foreign currency exchange rate risks inherent in its forecasted net revenue, cost of sales and operating expenses denominated in currencies other than the U.S. dollar. The Company also enters into non-qualifying foreign currency forward contracts to partially offset the foreign currency exchange gains and losses generated by the re-measurement of certain assets and liabilities. The Company’s foreign currency cash flow hedges mature generally within twelve months. For derivative instruments that are designated and qualify as cash flow hedges, the Company initially records the effective portion of the gain or loss on the derivative instrument in accumulated other comprehensive income or loss, a separate component of shareholders’ equity and subsequently reclassify these amounts into earnings within the same financial statement line item as the hedged item in the period during which the hedged transaction is realized. For non-qualifying derivative instruments, the Company records the gain or loss for each period in earnings. During years ended December 31, 2014 and 2013, there was no significant impact to the results of operations as a result of ineffective cash flow hedges.
Earnings Per Share
Basic earnings per share is computed by dividing net income or loss for the period by the weighted average number of common shares outstanding during the period. Diluted net income per share is computed by dividing net income for the period by the weighted average number of common shares outstanding and common equivalent shares from dilutive stock options, employee stock purchases, restricted stock awards, restricted stock units and shares issuable upon a potential conversion of the convertible senior notes using the treasury stock method. In loss periods, the earnings per share calculation excludes common equivalents shares because their inclusion would be antidilutive. Common stock equivalent shares totaled 9,392,000, 5,267,000 and 4,145,000 for the years ended December 31, 2014, 2013 and 2012, respectively.
59
Table of Contents
The following summarizes the computation of basic and diluted loss per share (in thousands, except for per share amounts):
| Years ended December 31, | ||||||||||||
| 2014 | 2013 | 2012 | ||||||||||
| Basic: |
||||||||||||
| Net loss |
$ | (50,149 | ) | $ | (17,965 | ) | $ | (20,043 | ) | |||
|
|
|
|
|
|
|
|||||||
| Basic weighted shares outstanding |
70,069 | 67,485 | 65,812 | |||||||||
|
|
|
|
|
|
|
|||||||
| Net loss per share |
$ | (0.72 | ) | $ | (0.27 | ) | $ | (0.30 | ) | |||
|
|
|
|
|
|
|
|||||||
| Diluted: |
||||||||||||
| Net loss |
$ | (50,149 | ) | $ | (17,965 | ) | $ | (20,043 | ) | |||
|
|
|
|
|
|
|
|||||||
| Basic weighted shares outstanding |
70,069 | 67,485 | 65,812 | |||||||||
| Effect of dilutive securities: |
||||||||||||
| Stock options, ESPP, restricted stock units, restricted stock awards and convertible senior notes |
— | — | — | |||||||||
|
|
|
|
|
|
|
|||||||
| Diluted weighted shares outstanding |
70,069 | 67,485 | 65,812 | |||||||||
|
|
|
|
|
|
|
|||||||
| Net loss per share |
$ | (0.72 | ) | $ | (0.27 | ) | $ | (0.30 | ) | |||
|
|
|
|
|
|
|
|||||||
Income Taxes
The Company accounts for income taxes using an asset and liability approach, which requires recognition of deferred tax assets and liabilities for the expected future tax consequences of events that have been recognized in the Company’s consolidated financial statements, but have not been reflected in the its taxable income. A valuation allowance is established to reduce deferred tax assets to their estimated realizable value. Therefore, the Company provides a valuation allowance to the extent that the Company does not believe it is more likely than not that it will generate sufficient taxable income in future periods to realize the benefit of its deferred tax assets.
Segments
The Company operates in one segment. Management uses one measurement of profitability and does not segregate its business for internal reporting.
Legal Contingencies
The Company is involved in various lawsuits and claims arising in the ordinary course of business, including actions with respect to intellectual property, employment, and other contractual matters. In connection with these matters, the Company assesses, on a regular basis, the probability and range of possible loss based on the developments in these matters. A liability is recorded in the financial statements if it is believed to be probable that a loss has been incurred and the amount of the loss can be reasonably estimated. If a reasonable estimate of a known or probable loss cannot be made, but a range of probable losses can be estimated, the low-end of the range of losses is recognized if no amount within the range is a better estimate than any other. If a loss is reasonably possible, but not probable and can be reasonably estimated, the estimated loss or range of loss is disclosed in the notes to the consolidated financial statements. The Company expenses legal fees as incurred.
Because litigation is inherently unpredictable and unfavorable results could occur, assessing contingencies is highly subjective and requires judgments about future events. We regularly review outstanding legal matters to determine the adequacy of the liabilities accrued and related disclosures. The amount of ultimate loss may differ from these estimates. Each matter presents its own unique circumstances, and prior litigation does not necessarily provide a reliable basis on which to predict the outcome, or range of outcomes, in any individual proceeding. Consequently, in the event that opposing litigants in outstanding litigations or claims ultimately succeed at trial and any subsequent appeals on their claims, any potential loss or charges in excess of any established accruals, individually or in the aggregate, could have a material adverse effect on our business, financial condition, results of operations, and/or cash flows in the period in which the unfavorable outcome occurs or becomes probable, and potentially in future periods.
60
Table of Contents
Recent Accounting Pronouncements
In May 2014, the FASB issued ASU No. 2014-09, Revenue from Contracts with Customers (Topic 606), which supersedes the revenue recognition requirements in ASC 605, Revenue Recognition. The core principal of ASU 2014-09 is to recognize revenue at an amount that reflects the consideration to which the entity expects to be entitled in exchange for those goods or services. The ASU also requires additional disclosure about the nature, amount, timing, and uncertainty of revenue and cash flows arising from customer contracts, including significant judgments, and changes in judgments and assets recognized from costs incurred to obtain or fulfill a contract. The effective date will be the first quarter of fiscal year 2017 using one of two retrospective transition methods. The Company has not yet selected a transition method nor has it determined the potential effects on its consolidated financial statements.
2. Fair Value
The following table summarizes the fair value hierarchy for the Company’s financial assets (cash, cash equivalents, short-term investments and non-current investments) and financial liabilities (foreign currency derivatives, convertible senior notes and contingent consideration) measured at fair value on a recurring basis as of December 31, 2014 and December 31, 2013 (in thousands):
61
Table of Contents
| Balance as of December 31, 2014: |
||||||||||||||||
| Level 1 | Level 2 | Level 3 | Total | |||||||||||||
| Assets: |
||||||||||||||||
| Cash and cash equivalents |
$ | 76,065 | $ | 20,598 | $ | — | $ | 96,663 | ||||||||
|
|
|
|
|
|
|
|
|
|||||||||
| Short-term investments: |
||||||||||||||||
| Asset-backed securities |
52,220 | 52,220 | ||||||||||||||
| Corporate debt securities |
— | 64,202 | — | 64,202 | ||||||||||||
| Commercial Paper |
— | 56,096 | — | 56,096 | ||||||||||||
| Government agency securities |
15,003 | 15,003 | ||||||||||||||
| Other securities |
— | 9,208 | — | 9,208 | ||||||||||||
|
|
|
|
|
|
|
|
|
|||||||||
| Total short-term investments |
— | 196,729 | — | 196,729 | ||||||||||||
|
|
|
|
|
|
|
|
|
|||||||||
| Foreign currency derivatives |
— | 3,887 | — | 3,887 | ||||||||||||
|
|
|
|
|
|
|
|
|
|||||||||
| Investments: |
||||||||||||||||
| Asset-backed securities |
— | 12,713 | — | 12,713 | ||||||||||||
| Corporate debt securities |
— | 22,679 | — | 22,679 | ||||||||||||
| Government agency securities |
— | 39,532 | — | 39,532 | ||||||||||||
| Other securities |
— | 4,807 | — | 4,807 | ||||||||||||
|
|
|
|
|
|
|
|
|
|||||||||
| Total investments |
— | 79,731 | — | 79,731 | ||||||||||||
|
|
|
|
|
|
|
|
|
|||||||||
| Total |
$ | 76,065 | $ | 300,945 | $ | — | $ | 377,010 | ||||||||
|
|
|
|
|
|
|
|
|
|||||||||
| Liabilities: |
||||||||||||||||
| Foreign currency derivatives |
$ | — | $ | 3,812 | $ | — | $ | 3,812 | ||||||||
|
|
|
|
|
|
|
|
|
|||||||||
| Total |
$ | — | $ | 3,812 | $ | — | $ | 3,812 | ||||||||
|
|
|
|
|
|
|
|
|
|||||||||
| Balance as of December 31, 2013: |
||||||||||||||||
| Level 1 | Level 2 | Level 3 | Total | |||||||||||||
| Assets: |
||||||||||||||||
| Cash and cash equivalents |
$ | 64,772 | $ | 1,300 | $ | — | $ | 66,072 | ||||||||
|
|
|
|
|
|
|
|
|
|||||||||
| Short-term investments: |
||||||||||||||||
| Commercial paper |
— | 5,448 | — | 5,448 | ||||||||||||
| Corporate debt securities |
— | 1,881 | — | 1,881 | ||||||||||||
| Government agency securities |
— | 1,508 | — | 1,508 | ||||||||||||
|
|
|
|
|
|
|
|
|
|||||||||
| Total short-term investments |
— | 8,837 | — | 8,837 | ||||||||||||
|
|
|
|
|
|
|
|
|
|||||||||
| Foreign currency derivatives |
— | 873 | — | 873 | ||||||||||||
|
|
|
|
|
|
|
|
|
|||||||||
| Investments: |
||||||||||||||||
| Asset-backed securities |
— | 1,891 | — | 1,891 | ||||||||||||
| Corporate debt securities |
— | 1,975 | — | 1,975 | ||||||||||||
| Government agency securities |
— | 3,405 | — | 3,405 | ||||||||||||
| United States government securities |
— | 2,149 | — | 2,149 | ||||||||||||
| Other securities |
— | 400 | — | 400 | ||||||||||||
|
|
|
|
|
|
|
|
|
|||||||||
| Total investments |
— | 9,820 | — | 9,820 | ||||||||||||
|
|
|
|
|
|
|
|
|
|||||||||
| Total |
$ | 64,772 | $ | 20,830 | $ | — | $ | 85,602 | ||||||||
|
|
|
|
|
|
|
|
|
|||||||||
| Liabilities: |
||||||||||||||||
| Foreign currency derivatives |
$ | — | $ | 1,555 | $ | — | $ | 1,555 | ||||||||
| Contingent consideration |
— | — | 310 | 310 | ||||||||||||
|
|
|
|
|
|
|
|
|
|||||||||
| Total |
$ | — | $ | 1,555 | $ | 310 | $ | 1,865 | ||||||||
|
|
|
|
|
|
|
|
|
|||||||||
62
Table of Contents
The estimated fair values of the Company’s other financial instruments which are not measured at fair value on a recurring basis as of December 31, 2014 and 2013, were as follows (in thousands):
| Balance as of December 31, 2014: |
||||||||||||||||
| Level 1 | Level 2 | Level 3 | Total | |||||||||||||
| Liabilities: |
||||||||||||||||
| Convertible senior notes |
$ | — | $ | 382,232 | $ | — | $ | 382,232 | ||||||||
|
|
|
|
|
|
|
|
|
|||||||||
| Total |
$ | — | $ | 382,232 | $ | — | $ | 382,232 | ||||||||
|
|
|
|
|
|
|
|
|
|||||||||
| Balance as of December 31, 2013: |
||||||||||||||||
| Level 1 | Level 2 | Level 3 | Total | |||||||||||||
| Liabilities: |
||||||||||||||||
| Convertible senior notes |
$ | — | $ | — | $ | — | $ | — | ||||||||
|
|
|
|
|
|
|
|
|
|||||||||
| Total |
$ | — | $ | — | $ | — | $ | — | ||||||||
|
|
|
|
|
|
|
|
|
|||||||||
The Company utilized levels 1 and 2 to value its financial assets on a recurring basis. Level 1 instruments use quoted prices in active markets for identical assets or liabilities, which include the Company’s cash accounts, short-term deposits, and money market funds as these specific assets are liquid. Level 2 instruments are valued using the market approach which uses quoted prices in markets that are not active or other inputs that are observable or can be corroborated by observable market data for substantially the full term of the assets or liabilities. Level 2 instruments include commercial paper, corporate debt securities, United States government securities, government agency securities, asset-backed securities, and other securities as similar or identical instruments can be found in active markets.
The Company recorded derivative assets and liabilities at fair value. The Company’s derivatives consist of foreign exchange forward contracts. The Company has elected to use the income approach to value the derivatives, using observable Level 2 market expectations at the measurement date and standard valuation techniques to convert future amounts to a single present amount assuming that participants are motivated, but not compelled to transact.
Level 2 inputs for the valuations are limited to quoted prices for similar assets or liabilities in active markets (specifically foreign currency spot rate and forward points) and inputs other than quoted prices that are observable for the asset or liability (specifically LIBOR rates, credit default spot rates, and company specific LIBOR spread). Mid-market pricing is used as a practical expedient for fair value measurements. The fair value measurement of an asset or liability must reflect the nonperformance risk of the entity and the counterparty. Therefore, the impact of the counterparty’s creditworthiness when in an asset position and the Company’s creditworthiness when in a liability position has also been factored into the fair value measurement of the derivative instruments and did not have a material impact on the fair value of these derivative instruments. Both the counterparty and the Company are expected to continue to perform under the contractual terms of the instruments. The estimated fair value of the convertible senior notes, which we have classified as Level 2 financial instruments, was determined based on the quoted price of the convertible senior notes in an over-the-counter market on December 31, 2014.
Level 3 liabilities, consisting of contingent consideration to be made in connection with an acquisition of certain assets in 2013, are valued by applying the income approach and are based on significant unobservable inputs that are supported by little or no market activity.
3. Investments
The Company’s marketable securities as of December 31, 2014, were classified as available-for-sale securities, with changes in fair value recognized in accumulated other comprehensive loss, a component of shareholders’ equity. Classification of marketable securities as a current asset is based on the intended holding period and realizability of the investment. The following tables summarize available-for-sale marketable securities (in thousands):
63
Table of Contents
| Balance as of December 31, 2014: |
||||||||||||||||
| Cost | Gross Unrealized Gain |
Gross Unrealized Loss |
Estimated Fair Value |
|||||||||||||
| Short-term investments: |
||||||||||||||||
| Asset-backed securities |
$ | 52,240 | $ | 3 | $ | (23 | ) | $ | 52,220 | |||||||
| Commercial paper |
76,683 | 12 | — | 76,695 | ||||||||||||
| Corporate debt securities |
64,244 | 2 | (45 | ) | 64,201 | |||||||||||
| Government agency securities |
15,000 | 3 | — | 15,003 | ||||||||||||
| Other securities |
9,206 | 2 | — | 9,208 | ||||||||||||
| Amounts classified as cash equivalents |
(20,598 | ) | — | — | (20,598 | ) | ||||||||||
|
|
|
|
|
|
|
|
|
|||||||||
| Total short-term investments |
$ | 196,775 | $ | 22 | $ | (68 | ) | $ | 196,729 | |||||||
|
|
|
|
|
|
|
|
|
|||||||||
| Investments: |
||||||||||||||||
| Asset-backed securities |
$ | 12,724 | $ | — | $ | (12 | ) | $ | 12,712 | |||||||
| Corporate debt securities |
22,709 | — | (29 | ) | 22,680 | |||||||||||
| Government agency securities |
39,583 | — | (51 | ) | 39,532 | |||||||||||
| Other securities |
4,815 | — | (8 | ) | 4,807 | |||||||||||
|
|
|
|
|
|
|
|
|
|||||||||
| Total investments |
$ | 79,831 | $ | — | $ | (100 | ) | $ | 79,731 | |||||||
|
|
|
|
|
|
|
|
|
|||||||||
| Balance as of December 31, 2013: |
||||||||||||||||
| Cost | Gross Unrealized Gain |
Gross Unrealized Loss |
Estimated Fair Value |
|||||||||||||
| Short-term investments: |
||||||||||||||||
| Commercial paper |
$ | 6,747 | $ | 1 | $ | — | $ | 6,748 | ||||||||
| Corporate debt securities |
1,881 | — | — | 1,881 | ||||||||||||
| Government agency securities |
1,506 | 2 | — | 1,508 | ||||||||||||
| Amounts classified as cash equivalents |
(1,300 | ) | — | — | (1,300 | ) | ||||||||||
|
|
|
|
|
|
|
|
|
|||||||||
| Total short-term investments |
$ | 8,834 | $ | 3 | $ | — | $ | 8,837 | ||||||||
|
|
|
|
|
|
|
|
|
|||||||||
| Investments: |
||||||||||||||||
| Asset-backed securities |
$ | 1,890 | $ | 1 | $ | — | $ | 1,891 | ||||||||
| Corporate debt securities |
1,970 | 5 | — | 1,975 | ||||||||||||
| Government agency securities |
3,405 | 1 | (1 | ) | 3,405 | |||||||||||
| United States government securities |
2,145 | 4 | — | 2,149 | ||||||||||||
| Other securities |
400 | — | — | 400 | ||||||||||||
|
|
|
|
|
|
|
|
|
|||||||||
| Total investments |
$ | 9,810 | $ | 11 | $ | (1 | ) | $ | 9,820 | |||||||
|
|
|
|
|
|
|
|
|
|||||||||
For the year ended December 31, 2014 and 2013, $115.9 million and $2.5 million, respectively, of proceeds from sales of marketable securities were collected. The Company determines gains and losses from sales of marketable securities based on specific identification of the securities sold. Gross realized gains and losses from sales of marketable securities, all of which are reported as a component of “Interest and other income, net” in the Consolidated Statements of Operations, were for the years ended December 31, 2014 and 2013 (in thousands):
| Years Ended December 31, | ||||||||
| 2014 | 2013 | |||||||
| Gross realized gains |
$ | 36 | $ | 2 | ||||
| Gross realized losses |
— | — | ||||||
|
|
|
|
|
|||||
| Realized gains, net |
$ | 36 | $ | 2 | ||||
|
|
|
|
|
|||||
64
Table of Contents
The fair value of the Company’s marketable securities with unrealized losses at December 31, 2014 and December 31, 2013, and the duration of time that such losses had been unrealized (in thousands) were:
| Balance at December 31, 2014: |
|
|||||||||||||||||||||||
| Less Than 12 months | More than 12 months | Total | ||||||||||||||||||||||
| Fair Value | Unrealized Loss | Fair Value | Unrealized Loss | Fair Value | Unrealized Loss | |||||||||||||||||||
| Asset-backed securities |
$ | 54,580 | $ | (35 | ) | $ | — | $ | — | $ | 54,580 | $ | (35 | ) | ||||||||||
| Corporate debt securities |
79,360 | (74 | ) | — | — | 79,360 | (74 | ) | ||||||||||||||||
| Government agency securities |
39,532 | (51 | ) | — | — | 39,532 | (51 | ) | ||||||||||||||||
| Other securities |
4,807 | (8 | ) | — | — | 4,807 | (8 | ) | ||||||||||||||||
|
|
|
|
|
|
|
|
|
|
|
|
|
|||||||||||||
| Total |
$ | 178,279 | $ | (168 | ) | $ | — | $ | — | $ | 178,279 | $ | (168 | ) | ||||||||||
|
|
|
|
|
|
|
|
|
|
|
|
|
|||||||||||||
| Balance at December 31, 2013: |
|
|||||||||||||||||||||||
| Less Than 12 months | More than 12 months | Total | ||||||||||||||||||||||
| Fair Value | Unrealized Loss | Fair Value | Unrealized Loss | Fair Value | Unrealized Loss | |||||||||||||||||||
| Asset-backed securities |
$ | 600 | $ | — | $ | — | $ | — | $ | 600 | $ | — | ||||||||||||
| Corporate debt securities |
1,180 | — | — | — | 1,180 | — | ||||||||||||||||||
| Government agency securities |
1,104 | (1 | ) | — | — | 1,104 | (1 | ) | ||||||||||||||||
| Other securities |
200 | — | — | — | 200 | — | ||||||||||||||||||
|
|
|
|
|
|
|
|
|
|
|
|
|
|||||||||||||
| Total |
$ | 3,084 | $ | (1 | ) | $ | — | $ | — | $ | 3,084 | $ | (1 | ) | ||||||||||
|
|
|
|
|
|
|
|
|
|
|
|
|
|||||||||||||
The Company has evaluated such securities, which consist of investments in asset-backed securities, corporate debt securities, government agency securities, and other securities as of December 31, 2014 and has determined that there was no indication of other-than-temporary impairments. This determination was based on several factors, including the length of time and extent to which fair value has been less than the cost basis, the financial condition and near-term prospects of the debt issuer, and the Company’s intent and ability to hold the securities for a period of time sufficient to allow for any anticipated recovery in market value.
The following table summarizes the amortized cost and estimated fair value of available-for-sale debt securities at December 31, 2014 and December 31, 2013, by contractual maturity (in thousands):
| December 31, 2014 | December 31, 2013 | |||||||||||||||
| Amortized Cost | Estimated Fair Value | Amortized Cost | Estimated Fair Value | |||||||||||||
| Debt securities: |
||||||||||||||||
| Mature in one year or less |
$ | 150,133 | $ | 150,105 | $ | 10,134 | $ | 10,137 | ||||||||
| Mature after one year through three years |
135,675 | 135,566 | 9,810 | 9,820 | ||||||||||||
| Mature in more than three years |
11,396 | 11,387 | — | — | ||||||||||||
|
|
|
|
|
|
|
|
|
|||||||||
| Total debt securities |
297,204 | 297,058 | 19,944 | 19,957 | ||||||||||||
| Securities with no contractual maturity |
— | — | 55 | 55 | ||||||||||||
|
|
|
|
|
|
|
|
|
|||||||||
| Total |
$ | 297,204 | $ | 297,058 | $ | 19,999 | $ | 20,012 | ||||||||
|
|
|
|
|
|
|
|
|
|||||||||
4. Derivative Financial Instruments
The Company uses derivatives to partially offset its business exposure to foreign currency exchange risk. The Company may enter into foreign currency forward contracts to offset some of the foreign exchange risk on expected future cash flows on certain forecasted revenue and cost of sales and on certain existing assets and liabilities.
To help protect gross margins from fluctuations in foreign currency exchange rates, a portion of forecasted foreign currency revenue and expenses of certain of the Company’s subsidiaries are hedged. The Company typically hedges portions of its forecasted foreign currency exposure associated with revenue, cost of sales, and operating expenses generally up to twelve months.
65
Table of Contents
The Company may also enter into foreign currency forward contracts to partially offset the foreign currency exchange gains and losses generated by the re-measurement of certain assets and liabilities. However, the Company may choose not to hedge certain foreign currency exchange exposures for a variety of reasons including, but not limited to, accounting considerations and the prohibitive economic cost of hedging particular exposures.
The Company records all derivatives in the Consolidated Balance Sheet at fair value. The Company’s accounting treatment of these instruments is based on whether the instruments are designated as hedge or non-hedge instruments. For derivative instruments that are designated and qualify as cash flow hedges, the Company initially records the effective portion of the gain or loss on the derivative instrument in accumulated other comprehensive income or loss, a separate component of shareholders’ equity and subsequently reclassify these amounts into earnings within the same financial statement line item as the hedged item in the period during which the hedged transaction is realized. The ineffective portions of cash flow hedges are recorded in foreign currency exchange loss and other, net. Gains and losses related to derivatives that are designated as hedging instruments are recorded in the financial statement line item to which the derivative relates.
The Company had a net deferred gain of $0.2 million and a net deferred loss of $0.6 million associated with cash flow hedges recorded in AOCI as of December 31, 2014 and December 31, 2013, respectively. Deferred gains and losses associated with cash flow hedges of forecasted foreign currency revenue are recognized as a component of revenues in the same period as the related revenue is recognized, and deferred gains and losses related to cash flow hedges of forecasted expenses are recognized as a component of cost of sales, research and development expense, sales and marketing expense and general and administrative expense in the same period as the related expenses are recognized. The Company’s hedged transactions as of December 31, 2014 are expected to occur within twelve months.
Derivative instruments designated as cash flow hedges must be de-designated as hedges when it is probable the forecasted hedged transaction will not occur in the initially identified time period or within a subsequent two-month time period. Deferred gains and losses in AOCI associated with such derivative instruments are reclassified immediately into foreign currency exchange loss and other, net. Any subsequent changes in fair value of such derivative instruments are reflected in foreign currency exchange loss and other, net unless they are re-designated as hedges of other transactions. The Company did not recognize any significant net gains or losses related to the loss of hedge designation on discontinued cash flow hedges during the years ended December 31, 2014, 2013 and 2012.
Gains or losses on derivatives not designated as hedging instruments are recorded in foreign currency exchange loss and other, net. During the years ended December 31, 2014, 2013 and 2012, the Company recognized a gain of $2.3 million, $0.1 million, and $0.4 million respectively, as a component of foreign currency exchange loss and other, net. These amounts represent the net gain or loss on the derivative contracts and do not include changes in the related exposures or ineffective portion or amounts excluded from the effectiveness testing of cash flow hedges.
The notional principle amounts of the Company’s outstanding derivative instruments designated as cash flow hedges are $117.2 million and $96.6 million as of December 31, 2014 and 2013, respectively. The notional principle amounts of the Company’s outstanding derivative instruments not designated as cash flow hedges is $30.4 million and $24.2 million as of December 31, 2014 and 2013, respectively.
66
Table of Contents
The following tables show the Company’s derivative instruments at gross fair value as reflected in the Consolidated Balance Sheets as of December 31, 2014 and 2013 (in thousands):
| December 31, 2014 | ||||||||||||
| Fair Value of Derivates Designated as Hedge |
Fair Value of Derivates Not Designated as Hedge Instruments |
Total Fair Value | ||||||||||
| Derivative Assets (a): |
||||||||||||
| Foreign exchange contracts |
$ | 3,887 | $ | — | $ | 3,887 | ||||||
| Derivative Liabilities (b): |
||||||||||||
| Foreign exchange contracts |
(3,685 | ) | (127 | ) | (3,812 | ) | ||||||
| December 31, 2013 | ||||||||||||
| Fair Value of Derivates Designated as Hedge Instruments |
Fair Value of Derivates Not Designated as Hedge Instruments |
Total Fair Value | ||||||||||
| Derivative Assets (a): |
||||||||||||
| Foreign exchange contracts |
$ | 782 | $ | 91 | $ | 873 | ||||||
| Derivative Liabilities (b): |
||||||||||||
| Foreign exchange contracts |
(1,446 | ) | (109 | ) | (1,555 | ) | ||||||
| a) | The fair value of derivative assets is measured using Level 2 fair value inputs and is recorded as other current assets in the Consolidated Balance Sheets. |
| b) | The fair value of derivative liabilities is measured using Level 2 fair value inputs and is recorded as accrued other liabilities in the Consolidated Balance Sheets. |
The following tables show the pre-tax effect of the Company’s derivative instruments designated as cash flow hedges in the Consolidated Statements of Operations for the years ended December 31, 2014 and 2013 (in thousands):
| Years Ended | ||||||||||||||||||||||||||||
| Gain (Loss) Recognized in OCI - Effective Portion |
Gain (Loss) Reclassified from AOCI into Income - Effective Portion |
Loss Recognized - Ineffective
Portion and Amount Excluded from Effectiveness Testing |
||||||||||||||||||||||||||
| December 31, 2014 |
December 31, 2013 |
December 31, 2014 (a) |
December 31, 2013 (b) |
Location | December 31, 2014 |
December 31, 2013 |
||||||||||||||||||||||
| Cash flow hedges: |
||||||||||||||||||||||||||||
| Foreign exchange contracts |
$ | 146 | $ | (118 | ) | $ | (735 | ) | $ | 427 | |
Foreign currency exchange loss and other, net |
|
$ | (46 | ) | $ | (10 | ) | |||||||||
|
|
|
|
|
|
|
|
|
|
|
|
|
|||||||||||||||||
| Total |
$ | 146 | $ | (118 | ) | $ | (735 | ) | $ | 427 | $ | (46 | ) | $ | (10 | ) | ||||||||||||
|
|
|
|
|
|
|
|
|
|
|
|
|
|||||||||||||||||
| a) | Includes gains and losses reclassified from AOCI into net income for the effective portion of cash flow hedges, of which a loss of $1.1 million within costs and operating expenses and a gain of $0.4 million within sales, respectively, were recognized within the Consolidated Statement of Operations for the year ended December 31, 2014. |
| b) | Includes gains and losses reclassified from AOCI into net income for the effective portion of cash flow hedges, of which a gain of $1.3 million within costs and operating expenses and a loss of $0.9 million within sales, respectively, were recognized within the Consolidated Statement of Operations for the year ended December 31, 2013. |
5. Intangible Assets
Intangible assets related to licenses are recorded at cost, less accumulated amortization. Intangible assets related to technology and other intangible assets acquired in acquisitions are recorded at fair value at the date of acquisition, less accumulated amortization. Intangible assets are amortized over their estimated useful lives, ranging from 3 to 15 years, on a straight-line basis. Amortization of intangible assets is primarily included in cost of sales, research and development and sales and marketing in the Consolidated Statements of Operations.
67
Table of Contents
The recorded value and accumulated amortization of major classes of intangible assets were as follows (in thousands):
| Gross Carrying Amount |
Accumulated Amortization |
Net Carrying Amount |
||||||||||
| Balance, December 31, 2014 |
||||||||||||
| Licenses |
$ | 13,594 | $ | (8,477 | ) | $ | 5,117 | |||||
| Technology acquired in acquisitions |
8,613 | (8,613 | ) | — | ||||||||
| Customer relationships and other intangible assets acquired in acquisitions |
36,582 | (10,259 | ) | 26,323 | ||||||||
|
|
|
|
|
|
|
|||||||
| $ | 58,789 | $ | (27,349 | ) | $ | 31,440 | ||||||
|
|
|
|
|
|
|
|||||||
| Balance, December 31, 2013 |
||||||||||||
| Licenses |
$ | 13,767 | $ | (6,787 | ) | $ | 6,980 | |||||
| Technology acquired in acquisitions |
8,613 | (8,613 | ) | — | ||||||||
| Customer relationships and other intangible assets acquired in acquisitions |
15,748 | (7,483 | ) | 8,265 | ||||||||
|
|
|
|
|
|
|
|||||||
| $ | 38,128 | $ | (22,883 | ) | $ | 15,245 | ||||||
|
|
|
|
|
|
|
|||||||
In 2014, the Company determined two acquired intangible assets were impaired, as there was no future use of the assets. As a result, the Company recorded an impairment expense of $0.1 million primarily to cost of sales in the Statement of Operations in the year ended December 31, 2014. In 2013, the Company determined an acquired intangible asset related to existing technology of one of the Company’s legacy products, as well as certain acquired technology assets, were impaired, as there was no future use of the assets. As a result, the Company recorded an impairment expense of $1.3 million primarily to cost of sales in the Statement of Operations in the year ended December 31, 2013.
The Company capitalizes patent licenses and acquired intangible assets and amortizes them over their estimated useful lives on a straight-line basis. Amortization expense of intangible assets was $4.7 million, $5.4 million and $5.0 million for the years ended December 31, 2014, 2013 and 2012, respectively. The expected future annual amortization expense of intangible assets recorded on the Company’s consolidated balance sheet as of December 31, 2014 is as follows (in thousands):
| For the Years Ending December 31, |
Amortization Expense |
|||
| 2015 |
$ | 6,348 | ||
| 2016 |
5,746 | |||
| 2017 |
5,384 | |||
| 2018 |
5,301 | |||
| 2019 |
4,182 | |||
| Thereafter |
4,479 | |||
|
|
|
|||
| Total expected future annual amortization |
$ | 31,440 | ||
|
|
|
|||
6. Acquisitions
The Company has recorded all acquisitions using the purchase method of accounting and, accordingly, included the results of operations in its consolidated results as of the date of each acquisition. The tangible assets, liabilities and intangible assets (including goodwill) acquired were accounted for based on their estimated fair values. The fair value assigned to assets acquired is based on valuations using the Company’s estimates and assumptions.
The Company acquired certain intangible assets from a distributor in the United States on October 1, 2014 in order to directly serve the smaller hospital market. The total purchase price for this transaction was $21.0 million, of which $18.0 million was paid in cash in 2014, and $3.0 million was retained subject to certain final price adjustments. This retained amount was recorded in “Accrued and other liabilities” in the Balance Sheet at December 31, 2014 and was paid in January, 2015. The Company accounted for the
68
Table of Contents
transaction as an asset acquisition and recorded two intangible assets: re-acquired exclusive distribution rights, and re-acquired distribution rights and customer relationships of $0.9 million and $19.9 million, respectively. The remaining $0.2 million was recorded as settlement for pre-existing relationships in the statements of operations in 2014.
For the asset acquisition completed in 2014, re-acquired exclusive distribution rights were assigned a useful life of 3 months, and re-acquired distribution rights and customer relationships assets were assigned a useful life of 6 years beginning from January 1, 2015.
The Company acquired a 100% interest in a distributor in Italy on April 1, 2013. The Company also acquired certain assets from a distributor in Australia on August 31, 2013. The Company included the financial results of these companies in the consolidated financial statements from the respective acquisition dates, and the results from each of these companies were not individually or in the aggregate material to the Company’s consolidated financial statements, therefore pro forma results of operations have not been presented. These transactions had a total purchase price of $4.0 million, of which $3.7 million, net of cash received, was paid in cash and the remainder being contingent cash considerations to be paid over time. These transactions were part of the ongoing expansion of the Company’s distribution network for the Company’s products. A summary of the fair value of the assets acquired and the liabilities assumed is as follows: acquired intangible assets of $2.0 million, property and equipment, inventory and other assets, net of liabilities, of $0.2 million, and goodwill of $1.5 million.
The contingent cash considerations were paid pursuant to a calculation based on product sales of the acquired entities. The amount of the contingent consideration which was settled in the third quarter of 2014 was immaterial to the Company’s results of operations or financial position.
For all acquisitions completed during 2013, customer relationships had a weighted-average useful life of 7 years and other intangibles had a weighted-average useful life of 15 years.
Revenue and earnings contributions of the acquired entities were not significant or were not separately identifiable due to the integration of these acquired entities into our existing operations.
69
Table of Contents
7. Income Taxes
For financial reporting purposes, loss before income taxes includes the following components (in thousands):
| December 31 | ||||||||||||
| 2014 | 2013 | 2012 | ||||||||||
| United States |
$ | (51,993 | ) | $ | (19,802 | ) | $ | (26,307 | ) | |||
| Foreign |
4,401 | 2,985 | 4,979 | |||||||||
|
|
|
|
|
|
|
|||||||
| Total |
$ | (47,592 | ) | $ | (16,817 | ) | $ | (21,328 | ) | |||
|
|
|
|
|
|
|
|||||||
The benefit (provision) for income taxes is comprised of (in thousands):
| Years Ended December 31, | ||||||||||||
| 2014 | 2013 | 2012 | ||||||||||
| Current |
||||||||||||
| Federal |
$ | (4 | ) | $ | 56 | $ | — | |||||
| State |
(92 | ) | 9 | (150 | ) | |||||||
| Foreign |
(2,595 | ) | (1,770 | ) | (207 | ) | ||||||
|
|
|
|
|
|
|
|||||||
| $ | (2,691 | ) | $ | (1,705 | ) | $ | (357 | ) | ||||
|
|
|
|
|
|
|
|||||||
| Deferred |
||||||||||||
| Federal |
$ | — | $ | — | $ | 312 | ||||||
| State |
— | — | — | |||||||||
| Foreign |
134 | 557 | 1,330 | |||||||||
|
|
|
|
|
|
|
|||||||
| $ | 134 | $ | 557 | $ | 1,642 | |||||||
|
|
|
|
|
|
|
|||||||
| Benefit (provision) for income taxes |
$ | (2,557 | ) | $ | (1,148 | ) | $ | 1,285 | ||||
Reconciliation between the Company’s effective tax rate on loss from continuing operations and the statutory tax rate is as follows:
| Years Ended December 31, | ||||||||||||
| 2014 | 2013 | 2012 | ||||||||||
| United States Federal statutory income tax rate |
34.0 | % | 34.0 | % | 34.0 | % | ||||||
| State taxes, net of federal benefit |
-0.2 | % | 0.1 | % | -0.7 | % | ||||||
| Foreign income taxed at other than U.S. rates |
-0.2 | % | 4.4 | % | 2.0 | % | ||||||
| Change in liabilities for uncertain positions |
-1.6 | % | -5.6 | % | -1.9 | % | ||||||
| Change in valuation allowance |
-37.4 | % | -40.0 | % | -28.7 | % | ||||||
| Other |
0.0 | % | 0.3 | % | 1.3 | % | ||||||
|
|
|
|
|
|
|
|||||||
| Effective tax rate |
-5.4 | % | -6.8 | % | 6.0 | % | ||||||
|
|
|
|
|
|
|
|||||||
70
Table of Contents
Deferred income taxes reflect the net tax effect of temporary differences between the carrying amounts of assets and liabilities for financial reporting purposes and the amounts used for income tax purposes. Significant components of the Company’s deferred tax assets (liabilities) are as follows (in thousands):
| December 31, | ||||||||
| 2014 | 2013 | |||||||
| Net operating loss carryforwards |
$ | 35,278 | $ | 36,314 | ||||
| Inventory |
5,342 | 3,115 | ||||||
| Reserves and Accruals |
12,199 | 4,808 | ||||||
| Fixed and Intangible Assets |
11,884 | 10,112 | ||||||
| Research and other credit carryforwards |
14,850 | 13,792 | ||||||
| Stock-based compensation expense |
14,641 | 15,341 | ||||||
| Other |
9,300 | 6,984 | ||||||
|
|
|
|
|
|||||
| Total deferred tax assets |
103,494 | 90,466 | ||||||
| Valuation allowance for deferred tax assets |
(78,832 | ) | (90,466 | ) | ||||
| Total deferred tax liability |
(25,544 | ) | (927 | ) | ||||
|
|
|
|
|
|||||
| Net deferred tax liability |
$ | (882 | ) | $ | (927 | ) | ||
|
|
|
|
|
|||||
A valuation allowance has been placed against the Company’s United States deferred tax assets, as management cannot conclude that it is more likely than not that these assets will be realized. The valuation allowance against United States deferred tax assets decreased by $11.6 million, increased by $12.8 million and by $8.4 million during the years ended December 31, 2014, 2013 and 2012, respectively.
As of December 31, 2014, the Company had federal and state net operating loss carryforwards of $296.3 million and $386.5 million, respectively, which, if not utilized, will expire in the years 2015 through 2034. As of December 31, 2014, the Company had federal research and development tax credits of $11.6 million, which expire in the years 2018 through 2034, and state research and development tax credits of $13.8 million, which carry forward indefinitely. The Company also had foreign tax credits of $0.1 million which expires in the year 2019.
Utilization of the Company’s net operating losses and research credits may be subject to a substantial annual limitation due to ownership change limitations provided by the Internal Revenue Code and similar state provisions. Such annual limitation may result in the expiration of net operating loss and research credits before utilization.
Undistributed earnings of the Company’s foreign subsidiaries of approximately $8.8 million and $5.2 million at December 31, 2014 and 2013, respectively, are considered to be indefinitely reinvested, and, accordingly, no provisions for federal and state income taxes have been provided thereon. Upon distribution of those earnings in the form of dividends or otherwise, the Company would be subject to both federal income taxes, subject to an adjustment for foreign income tax credits and withholding taxes payable to various foreign countries. The tax impact of the distribution of such foreign earnings to the United States parent would not be significant, as the Company’s net operating loss carryforward amount exceeds the amount of undistributed earnings.
The Company maintains liabilities for uncertain tax positions. These liabilities involve considerable judgment and estimation and are continuously monitored by management based on the best information available, including changes in tax regulations, the outcome of relevant court cases, and other information. The Company is currently under examination in Sweden. Although the outcome of any tax audit is uncertain, the Company believes that it has adequately provided in its consolidated financial statements for any additional taxes that the Company may be required to pay as a result of such examination.
The Company or one of its subsidiaries files income tax returns in the United States federal jurisdiction and various state and foreign jurisdictions. The Company’s United States and state income tax return years 1996 through 2014 remain open to examination. In addition, the Company files tax returns in multiple foreign taxing jurisdictions with open tax years ranging from 2009 to 2014.
The following table summarizes the activity related to the Company’s unrecognized tax benefits (in thousands):
| 2014 | 2013 | 2012 | ||||||||||
| Balance at beginning of year |
$ | 9,241 | $ | 7,397 | $ | 6,979 | ||||||
| Increase related to current year tax positions |
1,245 | 1,844 | 829 | |||||||||
| Increase (decrease) for tax positions of prior years |
(188 | ) | — | (276 | ) | |||||||
| Decrease due to lapse of statute |
— | — | (64 | ) | ||||||||
| Decrease due to settlements |
— | — | (71 | ) | ||||||||
|
|
|
|
|
|
|
|||||||
| Balance at end of year |
$ | 10,298 | $ | 9,241 | $ | 7,397 | ||||||
|
|
|
|
|
|
|
|||||||
At December 31, 2014 and 2013, the total gross unrecognized tax benefits were $10.3 million and $9.2 million, respectively, which, if recognized, would affect the Company’s effective tax rate, before consideration of certain valuation allowances. The Company anticipates that the total unrecognized tax benefits will not significantly change due to the settlement of audits and the expiration of statutes of limitations in the 12 months following December 31, 2014.
71
Table of Contents
The Company’s policy is to recognize interest and penalties accrued on any unrecognized tax benefits as a component of income tax expense. The Company recognizes interest and penalties related to uncertain tax positions in income tax expense. In 2014, 2013 and 2012, the Company did not recognize any significant interest or penalties related to uncertain tax positions. As of December 31, 2014, 2013 and 2012, the Company had accrued no significant interest or penalties.
8. Convertible Senior Notes and Notes Payable
In February 2014, the Company issued $345 million aggregate principal amount of 1.25% convertible senior notes (the “Notes”) due February 1, 2021, unless earlier repurchased by the Company or converted by the holder pursuant to their terms. Interest is payable semiannually in arrears on February 1 and August 1 of each year, commencing on August 1, 2014.
The Notes are governed by an Indenture between the Company, as issuer, and Wells Fargo Bank, National Association, as trustee. The Notes are unsecured and rank: senior in right of payment to the Company’s future indebtedness that is expressly subordinated in right of payment to the Notes; equal in right of payment to the Company’s existing and future indebtedness that is not so subordinated; effectively subordinated in right of payment to any of the Company’s secured indebtedness to the extent of the value of the assets securing such indebtedness; and structurally subordinated to all existing and future indebtedness and other liabilities incurred by the Company’s subsidiaries.
Upon conversion, the Company will pay or deliver, as the case may be, cash, shares of the Company’s common stock or a combination of cash and shares of common stock, at the Company’s election.
The Notes have an initial conversion rate of 15.3616 shares of common stock per $1,000 principal amount of Notes. This represents an initial effective conversion price of approximately $65.10 per share of common stock and approximately 5,300,000 shares upon conversion. Throughout the term of the Notes, the conversion rate may be adjusted upon the occurrence of certain events. Holders of the Notes will not receive any cash payment representing accrued and unpaid interest, if any, upon conversion of a Note, except in limited circumstances. Accrued but unpaid interest will be deemed to be paid by the cash, shares of the Company’s common stock or a combination of cash and shares of the Company’s common stock paid or delivered, as the case may be, to the holder upon conversion of a Note.
Prior to the close of business on the business day immediately preceding August 1, 2020, the Notes will be convertible at the option of holders during certain periods, only upon satisfaction of certain conditions set forth below. On or after August 1, 2020, until the close of business on the second scheduled trading day immediately preceding the maturity date, holders may convert all or any portion of their Notes at the conversion rate at any time regardless of whether the conditions set forth below have been met.
Holders may convert all or a portion of their Notes prior to the close of business on the business day immediately preceding August 1, 2020, in multiples of $1,000 principal amount, only under the following circumstances:
| • | during any calendar quarter commencing after the calendar quarter ending on March 31, 2014 (and only during such calendar quarter), if the last reported sale price of the Company’s common stock for at least 20 trading days (whether or not consecutive) during a period of 30 consecutive trading days ending on the last trading day of the immediately preceding calendar quarter is greater than or equal to 130% of the conversion price on each applicable trading day; |
| • | during the five business day period after any five consecutive trading day period (the “Notes Measurement Period”) in which the “trading price” (as the term is defined in the Indenture) per $1,000 principal amount of notes for each trading day of such Notes Measurement Period was less than 98% of the product of the last reported sale price of the Company’s common stock on such trading day and the conversion rate on each such trading day; or |
| • | upon the occurrence of specified corporate events. |
As of December 31, 2014, the Notes are not yet convertible.
Based on market data available for publicly traded, senior, unsecured corporate bonds issued by companies in the same industry and with similar maturity, the Company estimated the implied interest rate of its Notes to be approximately 5.0%, assuming no conversion option. Assumptions used in the estimate represent what market participants would use in pricing the liability component, including market interest rates, credit standing, and yield curves, all of which are defined as Level 2 observable inputs. The estimated implied interest rate was applied to the Notes, which resulted in a fair value of the liability component of $270 million upon issuance,
72
Table of Contents
calculated as the present value of implied future payments based on the $345 million aggregate principal amount. The excess of the principal amount of the liability component over its carrying amount (“debt discount”) is amortized to interest expense over the term of the Notes. The $75 million difference between the aggregate principal amount of $345 million and the estimated fair value of the liability component was recorded in additional paid-in capital as the Notes were not considered redeemable.
In accounting for the transaction costs related to the issuance of the Notes, the Company allocated the total amount incurred to the liability and equity components based on their estimated relative fair values. Transaction costs attributable to the liability component, totaling $7.2 million, are being amortized to expense over the term of the Notes, and transaction costs attributable to the equity component, totaling $2.0 million, and were netted with the equity component in shareholders’ equity.
The Notes consist of the following as of December 31, 2014 (in thousands):
| Liability component: |
||||
| Principal |
$ | 345,000 | ||
| Less: debt discount, net of amortization |
(66,787 | ) | ||
|
|
|
|||
| Net carrying amount |
$ | 278,213 | ||
| Equity component (a) |
73,013 |
| a) | Recorded in the consolidated balance sheet within additional paid-in capital, net of $2.0 million transaction costs in equity. |
The following table sets forth total interest expense recognized related to the Notes (in thousands):
| Year ended December 31, 2014 | ||||
| 1.25% coupon |
$ | 3,844 | ||
| Amortization of debt transaction costs |
387 | |||
| Amortization of debt discount |
8,213 | |||
|
|
|
|||
| $ | 12,444 | |||
As of December 31, 2014, the fair value of the Notes, which was determined based on inputs that are observable in the market or that could be derived from, or corroborated with, observable market data, quoted price of the Notes in an over-the-counter market (Level 2), and carrying value of debt instruments (carrying value excludes the equity component of the Company’s convertible notes classified in equity) were as follows (in thousands):
| December 31, 2014 | December 31, 2013 | |||||||||||||||
| Fair Value | Carrying Value | Fair Value | Carrying Value | |||||||||||||
| Convertible Senior Notes |
$ | 382,232 | $ | 278,213 | $ | — | $ | — | ||||||||
In connection with the issuance of the Notes, the Company entered into capped call transactions with certain counterparties affiliated with the initial purchasers and others. The capped call transactions are expected to reduce potential dilution of earnings per share upon conversion of the Notes. Under the capped call transactions, the Company purchased capped call options that in the aggregate relate to the total number of shares of the Company’s common stock underlying the Notes, with an initial strike price of approximately $65.10 per share, which corresponds to the initial conversion price of the Notes and is subject to anti-dilution adjustments substantially similar to those applicable to the conversion rate of the Notes, and have a cap price of approximately $78.61. The cost of the purchased capped calls of $25.1 million was recorded to shareholders’ equity and will not be re-measured.
Based on the closing price of our common stock of $54.14 on December 31, 2014, the if-converted value of the Notes was less than their respective principal amounts.
73
Table of Contents
As of December 31, 2014 and 2013, the Company had notes payable outstanding of $1.2 million and $1.7 million related to a loan received from the Company’s landlord in Sweden for tenant improvements. The note carries an interest rate of 4%. There are no debt covenants associated with the note. The note payable balance will be repaid by 2016.
9. Commitments, Debt obligations, Contingencies and Legal Matters
The following table summarizes the Company’s lease, purchase and minimum royalty commitments and debt obligations at December 31, 2014 (in thousands):
| Payments Due by Period | ||||||||||||||||||||
| Total | Less Than 1 Year |
1-3 Years | 3-5 Years | More Than 5 Years |
||||||||||||||||
| Operating leases |
$ | 79,042 | $ | 11,411 | $ | 23,597 | $ | 19,706 | $ | 24,328 | ||||||||||
| Purchase obligations |
43,271 | 43,271 | — | — | — | |||||||||||||||
| Minimum royalties |
3,395 | 559 | 1,183 | 295 | 1,358 | |||||||||||||||
| Debt obligations |
373,031 | 4,313 | 8,625 | 8,625 | 351,468 | |||||||||||||||
|
|
|
|
|
|
|
|
|
|
|
|||||||||||
| $ | 498,739 | $ | 59,554 | $ | 33,405 | $ | 28,626 | $ | 377,154 | |||||||||||
|
|
|
|
|
|
|
|
|
|
|
|||||||||||
Lease Commitments
As of December 31, 2014, the Company leased approximately 680,000 square feet of building space, primarily in the United States. The building space the Company occupies is pursuant to leases expiring up through May 2029. The Company’s manufacturing sites are located in the United States and Sweden. Certain of these lease arrangements contain escalation clauses whereby monthly rent increases over time. Rent expense is recognized on a straight-line basis over the lease period. As of December 31, 2014 and 2013, the Company accrued $1.1 million and $1.0 million, respectively, of asset retirement obligations for certain buildings currently under lease. Net rent expense for all operating leases for the years ended December 31, 2014, 2013 and 2012 was $11.6 million, $10.2 million and $8.4 million, respectively.
Purchase Commitments
Purchase commitments include non-cancellable purchase orders or contracts for the purchase of raw materials used in the manufacturing of the Company’s systems and reagents.
Minimum Royalty Commitments
Some of our licensing arrangements provide for a minimum royalty commitment. Royalty expense is generally based on a fee per unit shipped or a percent of revenue received for the products containing the licensed technology.
Debt obligations
Debt obligations include the principal amount of our convertible senior notes due 2021, as well as interest payments to be made under the notes. Although these notes mature in 2021, they can be converted into cash and shares of our common stock prior to maturity if certain conditions are met. Any conversion prior to maturity can result in repayments of the principal amounts sooner than the scheduled repayments as indicated in the table. Please see Note 8 (“Convertible Senior Notes and Notes Payable”) for further discussion of the terms of the convertible senior notes.
Contingencies
The Company responds to claims arising in the ordinary course of business. In certain cases, the Company has accrued estimates of the amounts it expects to pay upon resolution of such matters, and such amounts are included in accrued and other liabilities. Should the Company not be able to secure the resolution it expects, these estimates may change and will be recognized in the period in which they are identified.
In the normal course of business, the Company provides indemnifications of varying scope to customers against claims of intellectual property infringement made by third parties arising from the use of its products. Historically, costs related to indemnification provisions have not been significant and the Company is unable to estimate the maximum potential impact of these indemnification provisions on its future results of operations.
74
Table of Contents
To the extent permitted under California law, the Company has agreements whereby it indemnifies its directors and officers for certain events or occurrences while the director or officer is, or was serving, at the Company’s request in such capacity. The indemnification period covers all pertinent events and occurrences during the director’s or officer’s service. The maximum potential amount of future payments the Company could be required to make under these indemnification agreements is not specified in the agreements; however, the Company has director and officer insurance coverage that reduces its exposure and enables the Company to recover a portion of any future amounts paid. The Company believes the estimated fair value of these indemnification agreements in excess of applicable insurance coverage is minimal.
Legal Matters
In May 2005, the Company entered into a license agreement with F. Hoffmann-La Roche Ltd. and Roche Molecular Systems, Inc. (“Roche”) that provided us with rights under a broad range of Roche patents, including patents relating to the PCR process, reverse transcription-based methods, nucleic acid quantification methods, real-time PCR detection process and composition, and patents relating to methods for detection of viral and cancer targets. A number of the licensed patents expired in the United States prior to the end of August of 2010 and in Europe prior to the end of August of 2011. In August 2010, the Company terminated the Company’s license to United States Patent No. 5,804,375 (the “375 Patent”) and ceased paying United States-related royalties. The Company terminated the entire license agreement in the fourth quarter of 2011. In August 2011, Roche initiated an arbitration proceeding against the Company in the International Chamber of Commerce pursuant to the terms of the terminated agreement. The Company filed an answer challenging arbitral jurisdiction over the issues submitted by Roche and denying that the Company violated any provision of the agreement. A three-member panel has been convened to address these issues in confidential proceedings. On July 30, 2013, the panel determined that it had jurisdiction to decide the claims, a determination that the Company appealed to the Swiss Federal Supreme Court. On October 2, 2013, the arbitration panel determined that it would proceed with the arbitration while this appeal was pending. On February 27, 2014 the Swiss Federal Supreme Court upheld the jurisdiction of the arbitration panel to hear the case, and the case is continuing. The Company believes that it has not violated any provision of the agreement and that the asserted claim of the 375 Patent is expired, invalid, unenforceable, and not infringed.
Based on its ongoing evaluation of the facts and circumstances of the case, the Company believes that it is probable that this arbitration proceeding could result in a material loss. Accordingly, the Company recorded an estimated charge of $20 million as its best estimate of the potential loss as of December 31, 2014, which was included in accrued and other liabilities in the Company’s consolidated balance sheet. However, given the inherent uncertainty of arbitration and the nature of the claims in this matter, it is possible that we may incur an additional material charge, but an estimate of such a charge cannot be made at this time. The Company continues to strongly dispute Roche’s claims and intend to vigorously defend against them.
On August 21, 2012 the Company filed a lawsuit against Roche, in the United States District Court for the Northern District of California (“the Court”), for a declaratory judgment of (a) invalidity, expiration, and non-infringement of the 375 Patent; and (b) invalidity, unenforceability, expiration and non-infringement of United States Patent No. 6,127,155 (the “155 Patent”). On January 17, 2013, the Court issued an order granting a motion by Roche to stay the suit with respect to the 375 Patent pending resolution of the above noted arbitration proceeding. In the same order, the Court dismissed the Company’s suit with respect to the 155 Patent for lack of subject matter jurisdiction, without considering or ruling on the merits of the Company’s case. The Court left open the possibility that the Company could re-file its case against the 155 Patent in the future. Management believes that the possibility that these legal proceedings will result in a material adverse effect on the Company’s business is remote.
On July 16, 2014 Roche filed a lawsuit in the Court, alleging that the Company’s Xpert MTB-RIF product infringes United States Patent No. 5,643,723 (the “723 Patent”), which expired on July 1, 2014. On September 15, 2014, the Company filed its answer and counterclaims denying Roche’s allegations of infringement and asking the Court to find the 723 Patent invalid, unenforceable, and not infringed. On November 10, 2014, the Company filed a petition for inter partes review (“IPR”) of the 723 Patent in the United States Patent and Trademark Office and filed a motion with the Court to stay this lawsuit pending the outcome of the IPR. On January 7, 2015, the Court issued an order staying the lawsuit pending the outcome of the IPR. Management believes that the possibility that these legal proceedings will result in a material loss is remote.
The Company may be subject to additional various claims, complaints and legal actions that arise from time to time in the normal course of business. Other than as described above, the Company does not believe it is party to any currently pending legal proceedings that will result in a material adverse effect on its business. There can be no assurance that existing or future legal proceedings arising in the ordinary course of business or otherwise will not have a material adverse effect on the Company’s business, consolidated financial position, results of operations or cash flows.
75
Table of Contents
10. Shareholders’ Equity
Stock Option Plans
On April 27, 2006, the Company’s shareholders approved the 2006 Plan, which was approved by the Board in February 2006. On April 27, 2006, the Board also terminated the Company’s 1997 Stock Option Plan (“1997 Plan”). No new grants will be made under the 1997 Plan, and options granted or shares issued under the 1997 Plan that were outstanding on the date the 1997 Plan was terminated will remain subject to the terms of the 1997 Plan. Shares of common stock reserved for issuance under the 2006 Plan include (i) an initial authorization of 3,800,000 shares of common stock, (ii) shares reserved but unissued under the 1997 Plan as of the date the 1997 Plan was terminated and (iii) shares subject to awards granted under the 1997 Plan that are cancelled, forfeited or repurchased by the Company or expire after the 1997 Plan termination. On April 24, 2008, shareholders approved an increase to the number of shares of common stock reserved for issuance under the 2006 Plan by 1,800,000. On April 29, 2010, shareholders approved an increase to the number of shares of common stock reserved for issuance under the 2006 Plan by 3,800,000. On April 24, 2012, shareholders approved an increase to the number of shares of common stock reserved for issuance under the 2006 Plan by 5,000,000. On April 22, 2014 shareholders approved an increase to the number of shares of common stock reserved for issuance under the 2006 Plan by 3,300,000.
Under the 2006 Plan, the Company may grant incentive stock options (“ISOs”) and non-qualified stock options (“NQSOs”), restricted stock awards (“RSAs”), stock bonus awards (“SBAs”), stock appreciation rights (“SARs”), restricted stock units (“RSUs”) and performance share awards (“PSAs”). ISOs may be granted only to employees and directors of the Board, and all other awards may be granted to Company employees and directors and to consultants, independent contractors and advisors of the Company for services rendered. Any award, other than a stock option or a SAR, shall reduce the number of shares available for issuance by 1.75 shares for each share subject to such award (for a stock option or a SAR this ratio is 1:1). The 2006 Plan is administered by the Compensation and Organizational Development Committee of the Board (“Committee”). RSAs, SBAs, RSUs and PSAs (collectively, “Full Value Equity Awards”) with vesting or settlement restrictions, as applicable, based upon completion of performance goals, have a minimum one-year vesting or settlement restriction period (the “One-Year Restriction Period”) and all other vesting or settlement restrictions, as applicable, for Full Value Equity Awards shall have a minimum three-year vesting or settlement restriction period (the “Three-Year Restriction Period” and together with the One-Year Restriction Period, the “Minimum Restriction Periods”). The Company may grant Full Value Equity Awards without taking into account the Minimum Restriction Periods, provided, that, the Company does not grant more than 10% of the aggregate shares of common stock reserved and available for grant and issuance under the 2006 Plan without the Minimum Restriction Periods. The following provides a general description of each type of award under the 2006 Plan. As of December 31, 2014, the Company had 3,945,863 shares of the Company’s common stock reserved for future issuance under the 2006 Plan.
Stock options may be granted at no less than the fair market value per share of common stock on the date of the grant (at 110% of fair market value for ISOs granted to 10% shareholders), expire not later than seven years from the date of grant (five years from the date of grant for ISOs granted to 10% shareholders) and generally vest 25% one year after the date of grant and then on a pro rata basis over the following 36 months.
RSAs may be granted at a purchase price that is less than fair market value on the date of grant, and the restrictions are determined by the Committee and may be based on years of service with the Company or completion of performance goals during a period. The Committee will determine the extent that the RSA is earned prior to the payment for the shares awarded.
RSUs are awards for past or future services that may be settled in cash or shares of common stock, including restricted stock. The Committee determines the terms of each RSU, including the number of shares of common stock subject to the RSU, the times during which the RSU may be settled, consideration to be made on settlement, and effect of the participant’s termination. If RSUs are awarded based on performance goals, the Committee will determine the extent that the RSU is earned. The number of shares subject to the RSU may be fixed or may vary depending on performance goals determined by the Committee. While the RSU shall be paid currently, under certain circumstances the Committee may permit the participant to defer settlement of the RSU.
76
Table of Contents
A summary of stock option activity under all plans is as follows (in thousands, except weighted average exercise price and weighted average remaining contractual term):
| Shares | Weighted Average Exercise Price |
Weighted Average Remaining Contractual Term (in years) |
Instrinsic Value |
|||||||||||||
| Outstanding December 31, 2011 |
7,699 | $ | 17.54 | |||||||||||||
| Granted |
1,141 | $ | 36.68 | |||||||||||||
| Exercised |
(1,920 | ) | $ | 12.93 | ||||||||||||
| Forfeited |
(110 | ) | $ | 32.23 | ||||||||||||
|
|
|
|||||||||||||||
| Outstanding December 31, 2012 |
6,810 | $ | 21.81 | |||||||||||||
| Granted |
1,553 | $ | 38.55 | |||||||||||||
| Exercised |
(1,579 | ) | $ | 16.19 | ||||||||||||
| Forfeited |
(308 | ) | $ | 32.19 | ||||||||||||
|
|
|
|||||||||||||||
| Outstanding December 31, 2013 |
6,476 | $ | 26.70 | |||||||||||||
| Granted |
1,471 | $ | 46.36 | |||||||||||||
| Exercised |
(1,930 | ) | $ | 19.72 | ||||||||||||
| Forfeited |
(436 | ) | $ | 40.64 | ||||||||||||
|
|
|
|||||||||||||||
| Outstanding December 31, 2014 |
5,581 | $ | 33.20 | 4.12 | $ | 116,854 | ||||||||||
| Exercisable, December 31, 2014 |
3,122 | $ | 26.09 | 2.90 | $ | 87,580 | ||||||||||
| Vested and expected to vest December 31, 2014 |
5,385 | $ | 32.84 | 4.06 | $ | 114,721 | ||||||||||
The aggregate intrinsic value in the table above represents the total pretax intrinsic value (i.e., the difference between the Company’s closing stock price of $54.14 on the last trading day of 2014 and the exercise price, times the number of shares for options where the exercise price is below the closing stock price) that would have been received by the option holders had all option holders exercised their options on that date. This amount changes based on the fair market value of the Company’s stock. The total intrinsic value of options exercised was $58.2 million, $37.0 million, and $54.5 million for the years ended December 31, 2014, 2013, and 2012, respectively.
A summary of all award activity, which consists of RSAs and RSUs, is as follows (in thousands, except weighted average grant date fair value):
| Shares | Weighted Average Grant Date Fair Value |
|||||||
| Outstanding December 31, 2011 |
596 | $ | 25.87 | |||||
| Granted |
271 | $ | 36.90 | |||||
| Vested |
(209 | ) | $ | 27.62 | ||||
| Cancelled |
(16 | ) | $ | 34.29 | ||||
|
|
|
|||||||
| Outstanding December 31, 2012 |
642 | $ | 29.74 | |||||
| Granted |
412 | $ | 38.23 | |||||
| Vested |
(262 | ) | $ | 29.81 | ||||
| Cancelled |
(50 | ) | $ | 34.17 | ||||
|
|
|
|||||||
| Outstanding December 31, 2013 |
742 | $ | 34.13 | |||||
| Granted |
377 | $ | 46.83 | |||||
| Vested |
(327 | ) | $ | 34.11 | ||||
| Cancelled |
(94 | ) | $ | 39.35 | ||||
|
|
|
|||||||
| Outstanding December 31, 2014 |
698 | $ | 40.30 | |||||
77
Table of Contents
In accordance with the 2006 Plan, RSAs and RSUs granted in 2014, 2013 and 2012, reduced the number of shares available for future grant by a factor of 1.75 for each share subject to such award. Based on the closing price per share of the Company’s common stock of $54.14 and $46.67 on the last trading day in 2014 and in 2013, respectively, the total pre-tax intrinsic value of all outstanding stock awards as of December 31, 2014 and December 31, 2013 was $37.8 million and $34.5 million, respectively. Total fair value of stock awards vested was $14.8 million, $10.0 million, and $7.4 million for the years ended December 31, 2014, 2013 and 2012, respectively.
Employee Stock Purchase Plan
The 2000 Employee Stock Purchase Plan (“2000 ESPP”) was adopted in April 2000, amended in June 2003, April 2009 and April 2012 and terminated effective August 1, 2012. The 2000 ESPP permitted eligible employees of the Company and its participating subsidiaries to purchase common stock at a discount up to a maximum of 15% of compensation through payroll deductions during defined two-year offering periods consisting of four, six-month purchase periods. The price at which stock was purchased under the 2000 ESPP was equal to 85% of the fair market value of the common stock on the first day of the two-year offering period or the last day of the six-month purchase period, whichever was lower.
The 2012 Employee Stock Purchase Plan (“2012 ESPP”) was approved by the Company’s Board of Directors in February 2012 and adopted by the Company’s shareholders in April 2012. The 2012 ESPP permits eligible employees of the Company and its participating subsidiaries to purchase common stock at a discount up to a maximum of 15% of compensation through payroll deductions during defined two-year offering periods consisting of four, six-month purchase periods. The price at which stock is purchased under the 2012 ESPP is equal to 85% of the fair market value of the common stock on the first day of the two-year offering period or the last day of the six-month purchase period, whichever is lower. The number of shares available for future issuance increase annually equal to the lesser of (a) 500,000 shares or (b) an amount determined by the Compensation and Organizational Development Committee of the Board.
Reserved Shares
As of December 31, 2014, the Company has reserved shares of common stock for future issuance as follows (in thousands):
| Payments Due by Period Total |
||||
| 2006 Plan: |
||||
| Options, RSUs and awards outstanding for all plans |
$ | 6,278 | ||
| Reserved for future grants |
3,946 | |||
| 2012 ESPP |
2,210 | |||
|
|
|
|||
| $ | 12,434 | |||
78
Table of Contents
Stock-Based Compensation Expense
Fair Value—The fair value of the Company’s stock options granted to employees and shares purchased by employees under the 2012 ESPP, for the years ended December 31, 2014, 2013 and 2012 was estimated using the following assumptions:
| Years Ended December 31, | ||||||||||||
| 2014 | 2013 | 2012 | ||||||||||
| OPTION SHARES: |
||||||||||||
| Expected Term (in years) |
4.40 | 4.41 | 4.38 | |||||||||
| Volatility |
0.38 | 0.44 | 0.53 | |||||||||
| Expected Dividends |
0.00 | % | 0.00 | % | 0.00 | % | ||||||
| Risk Free Interest Rates |
1.71 | % | 0.90 | % | 0.80 | % | ||||||
| Estimated Forfeitures |
6.75 | % | 7.61 | % | 7.63 | % | ||||||
| Weighted Average Fair Value |
$ | 15.71 | $ | 14.17 | $ | 15.70 | ||||||
| ESPP SHARES: |
||||||||||||
| Expected Term (in years) |
1.24 | 1.25 | 1.25 | |||||||||
| Volatility |
0.33 | 0.42 | 0.54 | |||||||||
| Expected Dividends |
0.00 | % | 0.00 | % | 0.00 | % | ||||||
| Risk Free Interest Rates |
0.22 | % | 0.19 | % | 0.18 | % | ||||||
| Weighted Average Fair Value |
$ | 12.13 | $ | 12.10 | $ | 13.13 | ||||||
Stock-Based Compensation Expense—The following table is a summary of the major categories of stock compensation expense recognized in accordance with ASC 718, “Compensation—Stock Compensation” (“ASC 718”) for the years ended December 31, 2014, 2013 and 2012 (in thousands).
| Years Ended December 31, | ||||||||||||
| 2014 | 2013 | 2012 | ||||||||||
| Cost of sales |
$ | 4,086 | $ | 2,930 | $ | 3,087 | ||||||
| Research and development |
9,516 | 8,540 | 7,563 | |||||||||
| Sales and marketing |
6,048 | 5,636 | 5,032 | |||||||||
| General and administrative |
12,557 | 10,529 | 8,814 | |||||||||
|
|
|
|
|
|
|
|||||||
| Total stock-based compensation expense |
$ | 32,207 | $ | 27,635 | $ | 24,496 | ||||||
|
|
|
|
|
|
|
|||||||
The above stock-based compensation expense includes costs for 2012 ESPP of $2.7 million, $3.6 million, and $2.4 million for the years ended December 31, 2014, 2013, and 2012, respectively.
As of December 31, 2014, the total compensation expense related to unvested stock option grants under the Company’s 1997 Plan and 2006 Plan but not yet recognized was $32.0 million, which is net of estimated forfeitures of $6.6 million. This expense will be amortized on a straight line basis over a weighted average period of 2.6 years and will be adjusted for subsequent changes in estimated forfeitures.
As of December 31, 2014, the total compensation expense related to RSAs and RSUs under the 2006 Plan not yet recognized was $23.4 million, which is net of estimated forfeitures of $4.9 million. This expense will be amortized on a straight line basis over a weighted average period of 2.6 years and will be adjusted for subsequent changes in estimated forfeitures.
At December 31, 2014, the total compensation expense related to options to purchase the Company’s common shares under the 2012 ESPP but not yet recognized was $1.6 million. The expense will be amortized on a straight-line basis over the two-year offering period, as such term is defined in the 2012 ESPP.
79
Table of Contents
11. Employee Benefit Plan
The Company’s 401(k) plan allows eligible employees to contribute a percentage of their qualified compensation subject to IRS limits. The Company has the discretion to make matching contributions each year. Contributions made by the Company for the years ended December 31, 2014, 2013 and 2012 were $1.9 million, $1.5 million, and $1.2 million, respectively.
On December 9, 2013, the Compensation and Organizational Development Committee of the Board of Directors of the Company approved the establishment of the Cepheid Executive Deferred Compensation Plan (the “Deferred Compensation Plan”). The Deferred Compensation Plan is an unfunded deferred compensation plan and participants in the Deferred Compensation Plan will at all times have the status of unsecured general creditors of Cepheid with respect to the payment of any Plan benefits. The Deferred Compensation Plan is designed to provide designated executives of Cepheid, currently set at Vice Presidents and above, with the opportunity to defer the payment of
(1) between 5% and 75% of their base salary and
(2) between 5% and 100% of any cash-based incentive awards payable to a participant.
The Deferred Compensation Plan’s Administrative Committee will select investment options from which the participants may make elections for the deemed investment of their accounts under the Deferred Compensation Plan. Plan participants shall at all times be fully vested in any amounts deferred pursuant to the Deferred Compensation Plan. The Deferred Compensation Plan became effective beginning January 1, 2014 and has a balance of $0.4 million as of December 31, 2014.
12. Segment and Significant Concentrations
The Company and its wholly owned subsidiaries operate in one business segment. The following table summarizes total revenue (in thousands):
| Years Ended December 31, | ||||||||||||
| 2014 | 2013 | 2012 | ||||||||||
| Revenue: |
||||||||||||
| System and other revenue |
$ | 90,849 | $ | 76,763 | $ | 65,111 | ||||||
| Reagent and disposable revenue |
379,292 | 324,529 | 266,101 | |||||||||
|
|
|
|
|
|
|
|||||||
| Total revenue |
$ | 470,141 | $ | 401,292 | $ | 331,212 | ||||||
|
|
|
|
|
|
|
|||||||
The following table summarizes revenue in the Clinical and Non-Clinical markets (in thousands):
| Years Ended December 31, | ||||||||||||
| 2014 | 2013 | 2012 | ||||||||||
| Revenue by market: |
||||||||||||
| Clinical Systems |
$ | 84,695 | $ | 66,980 | $ | 52,805 | ||||||
| Clinical Reagents |
356,427 | 292,941 | 233,503 | |||||||||
|
|
|
|
|
|
|
|||||||
| Total Clinical |
$ | 441,122 | $ | 359,921 | $ | 286,308 | ||||||
|
|
|
|
|
|
|
|||||||
| Non-Clinical |
29,019 | 41,371 | 44,904 | |||||||||
|
|
|
|
|
|
|
|||||||
| Total revenue |
$ | 470,141 | $ | 401,292 | $ | 331,212 | ||||||
|
|
|
|
|
|
|
|||||||
80
Table of Contents
The following table summarizes revenue by geographic region (in thousands):
| Years Ended December 31, | ||||||||||||
| 2014 | 2013 | 2012 | ||||||||||
| Geographic revenue information: |
||||||||||||
| North America |
||||||||||||
| Clinical |
$ | 247,120 | $ | 212,362 | $ | 190,021 | ||||||
| Non-Clinical |
24,905 | 36,998 | 38,632 | |||||||||
|
|
|
|
|
|
|
|||||||
| Total North America |
272,025 | 249,360 | 228,653 | |||||||||
|
|
|
|
|
|
|
|||||||
| International |
||||||||||||
| Clinical |
$ | 194,002 | $ | 147,559 | $ | 96,286 | ||||||
| Non-Clinical |
4,114 | 4,373 | 6,273 | |||||||||
|
|
|
|
|
|
|
|||||||
| Total International |
198,116 | 151,932 | 102,559 | |||||||||
|
|
|
|
|
|
|
|||||||
| Total revenue |
$ | 470,141 | $ | 401,292 | $ | 331,212 | ||||||
The Company had a distribution agreement to distribute products in the United States until October 1, 2014 and has several regional distribution arrangements in place throughout Europe, Japan, China, Latin America, South America, Canada and other parts of the world.
The Company recognized revenues of $264.1 million, $237.8 million and $216.6 million for revenues from U.S. customers for the years ended December 31, 2014, 2013 and 2012. The Company recognized sales of $37.3 million, $41.6 million, and $22.8 million to customers in South Africa for the years ended December 31, 2014, 2013, and 2012, respectively. As of December 31, 2014 and 2013, the Company has long lived-assets (excluding intangible assets) of $96.0 million and $63.9 million, respectively, which reside in the United States. As of December 31, 2014 and 2013, the Company has long-lived assets of $19.8 million and $21.0 million, respectively, which reside primarily in Sweden and countries in the European Monetary Union.
13. Collaboration Profit Sharing
Collaboration profit sharing represents the amount that the Company pays to LIFE under its collaboration agreement to develop reagents for use in the USPS BDS program. Under the agreement, computed gross margin on anthrax cartridge sales are shared equally between the two parties. Collaboration profit sharing expense was $5.2 million, $7.5 million and $7.2 million for the years ended December 31, 2014, 2013, 2012 respectively. The total revenues and cost of sales related to these cartridge sales are included in the respective balances in the consolidated statement of operations.
14. Collaborative Agreements and Contracts
Foundation for Innovative New Diagnostics
In May 2006, the Company entered into an agreement with the FIND to develop a simple, rapid test that can detect mycobactrium tuberculosis and associated rifampin resistance from human sputum samples. Under the agreement, the Company was responsible for the development of a 6-color GeneXpert instrument to accomplish such test and the development of an enhanced manufacturing line for the manufacture of test cartridges used in the test. FIND reimbursed the Company at agreed upon amounts. The term of the development portion of the agreement was 30 months, which was subsequently extended an additional five months. In July 2009, the agreement was extended for another year for further specified enhancements. The supply term of the agreement is for 12 years, unless terminated by either party in accordance with relevant provisions of the agreement. In January 2011, the agreement was extended for another year and a new agreement was signed for the development of the Company’s Xpert HIV Viral Load test. Under the Xpert HIV agreement, FIND agreed to fund $5.1 million in development costs throughout the two-year contract. In December 2014, the Xpert HIV-1 Viral Load achieved CE-IVD status under the European Directive on In Vitro Diagnostic Medical Devices.
In the first quarter of 2011, the Company and FIND entered into a $1.0 million agreement with FIND to fund the development of a remote calibration kit for its GeneXpert system family.
In December 2013, the Company entered into an agreement to develop Xpert MTB/RIF Ultra with FIND and Rutgers New Jersey Medical School to develop a next-generation test for Mycobacterium tuberculosis (TB) with increased sensitivity to aid in detection of patients with smear-negative TB, which is often associated with HIV co-infection. Xpert MTB/RIF Ultra will run on existing 6-color GeneXpert Systems. Under the Xpert MTB/RIF Ultra agreement, FIND agreed to fund up to $3.0 million in development costs throughout the two-year contract.
81
Table of Contents
The Company recognized revenue from FIND of $2.1 million, $0.8 million and $2.2 million in “System and other revenues” for the years ended December 31, 2014, 2013 and 2012, respectively.
MTB/RIF Buy Down Program for the HBDC Market
During 2012, the Company entered into agreements with BMGF, USAID and UNITAID to reduce the price of the Company’s Multi-Drug Resistant Tuberculosis test to $9.98 for customers in the HBDC program. The Company received one-time payments of $3.5 million each from BMGF and USAID in 2012 and $3.2 million from UNITAID during 2013. Based on the terms of the agreements, the Company recognized revenue related to the BMGF and USAID agreements on a per-unit basis. Under the UNITAID agreement, the Company will recognize the $3.2 million of revenue on a straight line basis over a period of ten years. For the years ended December 31, 2014, 2013 and 2012, the Company recognized revenue of $0.3 million, $2.7 million and $4.8 million, respectively, related to the BMGF, USAID and UNITAID agreements.
LIFE and Northrop Grumman Corporation
In October 2002, the Company entered into a collaboration agreement with LIFE to develop reagents for use in the USPS BDS program, which was developed by the consortium led by Northrop Grumman Corporation. Under the agreement, reagents will be manufactured by LIFE for packaging by the Company into its GeneXpert test cartridges and sold by the Company for use in the BDS. This agreement calls for the computed gross margin on sales of anthrax cartridges for the USPS BDS program to be equally shared between the Company and LIFE.
In August 2007, Northrop Grumman entered into a five-year master purchase agreement with the Company for the purchase of up to $200 million in anthrax test cartridges and associated materials used in BDS. In the fourth quarter of 2011, Northrop Grumman entered into another five-year master purchase agreement with the Company for the purchase of up to $112 million of anthrax test cartridges and associated materials used in BDS. The agreement and subsequent purchase orders cover the period through September 30, 2016. In the fourth quarter of 2012, the Company entered into an agreement directly with the USPS to sell the anthrax test cartridges and associated materials used in BDS directly to USPS through the period ending September 30, 2016.
Bill and Melinda Gates and Paul G. Allen Family Foundation Xpert Ebola
In November 2014, the Company announced details of an awarded grant of up to $3.4 million co-financed by the Paul G. Allen Family Foundation and the BMGF to develop Xpert Ebola, a rapid test that could be run on the Company’s installed base of GeneXpert Systems in developing countries. In addition to Xpert Ebola, the Company is evaluating deployment of the Company’s RemoteXpert cloud-based monitoring software. For the year ended December 31, 2014, the Company recognized revenue of $0.5 million related to the agreement. The $1.9 million unused cash is contractually restricted for use only to develop the Xpert Ebola test in accordance with our agreement with BMGF and it is recorded as restricted cash and included in prepaid expenses and other current assets.
15. Related party transactions
The Company sells its products and provides services to Geisinger Health System (“Geisinger”), a physician-led health care system serving multiple regions of Pennsylvania. The President and Chief Executive Officer of Geisinger is also a director of the Company. Net revenues recorded from sales to Geisinger were approximately $1.7 million and $1.5 million for the years ended December 31, 2014 and 2013, respectively. There was no significant revenue for the year ended December 31, 2012. As of December 31, 2014, the Company had accounts receivable of approximately $0.2 million due from Geisinger.
82
Table of Contents
CEPHEID
QUARTERLY FINANCIAL INFORMATION (UNAUDITED)
| Mar 31 | June 30 | Sep 30 | Dec 31 | |||||||||||||
| (Unaudited) | ||||||||||||||||
| (In thousands, except per share data) | ||||||||||||||||
| 2014 |
||||||||||||||||
| Total revenue |
$ | 106,907 | $ | 116,503 | $ | 115,209 | $ | 131,522 | ||||||||
| Costs and operating expenses: |
||||||||||||||||
| Cost of sales |
53,083 | 59,568 | 56,791 | $ | 59,885 | |||||||||||
| Collaboration profit sharing |
1,291 | 649 | 1,291 | 1,923 | ||||||||||||
| Research and development |
21,740 | 23,998 | 23,541 | 27,572 | ||||||||||||
| Sales and marketing |
23,458 | 23,502 | 23,913 | 26,975 | ||||||||||||
| General and administrative |
13,667 | 14,340 | 13,069 | 13,971 | ||||||||||||
| Legal contingencies and settlements |
— | — | — | 20,000 | ||||||||||||
|
|
|
|
|
|
|
|
|
|||||||||
| Total cost and operating expenses |
113,239 | 122,057 | 118,605 | 150,326 | ||||||||||||
|
|
|
|
|
|
|
|
|
|||||||||
| Loss from operations |
(6,332 | ) | (5,554 | ) | (3,396 | ) | (18,804 | ) | ||||||||
| Other expense, net |
(2,291 | ) | (3,370 | ) | (3,573 | ) | (4,272 | ) | ||||||||
|
|
|
|
|
|
|
|
|
|||||||||
| Loss before income tax expense |
(8,623 | ) | (8,924 | ) | (6,969 | ) | (23,076 | ) | ||||||||
| Provision for income tax expense |
(680 | ) | (919 | ) | (266 | ) | (692 | ) | ||||||||
|
|
|
|
|
|
|
|
|
|||||||||
| Net Loss |
$ | (9,303 | ) | $ | (9,843 | ) | $ | (7,235 | ) | $ | (23,768 | ) | ||||
|
|
|
|
|
|
|
|
|
|||||||||
| Basic net loss per share |
(0.13 | ) | (0.14 | ) | (0.10 | ) | (0.34 | ) | ||||||||
|
|
|
|
|
|
|
|
|
|||||||||
| Diluted net loss per share |
$ | (0.13 | ) | $ | (0.14 | ) | $ | (0.10 | ) | $ | (0.34 | ) | ||||
|
|
|
|
|
|
|
|
|
|||||||||
| Weighted average shares used in computing basic net loss per share |
69,272 | 69,968 | 70,326 | 70,689 | ||||||||||||
|
|
|
|
|
|
|
|
|
|||||||||
| Weighted average shares used in computing diluted net loss per share |
69,272 | 69,968 | 70,326 | 70,689 | ||||||||||||
|
|
|
|
|
|
|
|
|
|||||||||
| Gross profit on sales: |
||||||||||||||||
| Sales |
$ | 106,907 | $ | 116,503 | $ | 115,209 | $ | 131,522 | ||||||||
| Cost of sales |
(53,083 | ) | (59,568 | ) | (56,791 | ) | (59,885 | ) | ||||||||
|
|
|
|
|
|
|
|
|
|||||||||
| $ | 53,824 | $ | 56,935 | $ | 58,418 | $ | 71,637 | |||||||||
|
|
|
|
|
|
|
|
|
|||||||||
83
Table of Contents
| Mar 31 | June 30 | Sep 30 | Dec 31 | |||||||||||||
| (Unaudited) | ||||||||||||||||
| (In thousands, except per share data) | ||||||||||||||||
| 2013 |
||||||||||||||||
| Total revenue |
$ | 91,938 | $ | 96,012 | $ | 100,081 | $ | 113,261 | ||||||||
| Costs and operating expenses: |
||||||||||||||||
| Cost of sales |
42,892 | 52,889 | 51,669 | $ | 60,483 | |||||||||||
| Collaboration profit sharing |
2,110 | 1,425 | 1,410 | 2,567 | ||||||||||||
| Research and development |
17,727 | 18,572 | 18,558 | 25,340 | ||||||||||||
| Sales and marketing |
19,126 | 19,105 | 19,788 | 21,922 | ||||||||||||
| General and administrative |
9,763 | 9,612 | 9,490 | 12,854 | ||||||||||||
|
|
|
|
|
|
|
|
|
|||||||||
| Total cost and operating expenses |
91,618 | 101,603 | 100,915 | 123,166 | ||||||||||||
|
|
|
|
|
|
|
|
|
|||||||||
| Income (loss) from operations |
320 | (5,591 | ) | (834 | ) | (9,905 | ) | |||||||||
| Other income (expense), net |
374 | (717 | ) | (200 | ) | (264 | ) | |||||||||
|
|
|
|
|
|
|
|
|
|||||||||
| Income (loss) before income tax expense |
694 | (6,308 | ) | (1,034 | ) | (10,169 | ) | |||||||||
| Provision for income tax expense |
(381 | ) | (272 | ) | (347 | ) | (148 | ) | ||||||||
|
|
|
|
|
|
|
|
|
|||||||||
| Net income (loss) |
$ | 313 | $ | (6,580 | ) | $ | (1,381 | ) | $ | (10,317 | ) | |||||
|
|
|
|
|
|
|
|
|
|||||||||
| Basic net income (loss) per share |
0.00 | (0.10 | ) | (0.02 | ) | (0.15 | ) | |||||||||
|
|
|
|
|
|
|
|
|
|||||||||
| Diluted net income (loss) per share |
$ | 0.00 | $ | (0.10 | ) | $ | (0.02 | ) | $ | (0.15 | ) | |||||
|
|
|
|
|
|
|
|
|
|||||||||
| Weighted average shares used in computing basic net income (loss) per share |
66,824 | 67,295 | 67,573 | 68,230 | ||||||||||||
|
|
|
|
|
|
|
|
|
|||||||||
| Weighted average shares used in computing diluted net income (loss) per share |
69,406 | 67,295 | 67,573 | 68,230 | ||||||||||||
|
|
|
|
|
|
|
|
|
|||||||||
| Gross profit on sales: |
||||||||||||||||
| Sales |
$ | 91,938 | $ | 96,012 | $ | 100,081 | $ | 113,261 | ||||||||
| Cost of sales |
(42,892 | ) | (52,889 | ) | (51,669 | ) | (60,483 | ) | ||||||||
|
|
|
|
|
|
|
|
|
|||||||||
| $ | 49,046 | $ | 43,123 | $ | 48,412 | $ | 52,778 | |||||||||
|
|
|
|
|
|
|
|
|
|||||||||
84
Table of Contents
ITEM 9. CHANGES IN AND DISAGREEMENTS WITH ACCOUNTANTS ON ACCOUNTING AND FINANCIAL DISCLOSURE
None.
ITEM 9A. CONTROLS AND PROCEDURES
Evaluation of Disclosure Controls and Procedures
As of December 31, 2014, we carried out an evaluation, under the supervision and with the participation of our management, including our Principal Executive Officer and Principal Financial Officer, of the effectiveness of the design and operation of our disclosure controls and procedures (as defined in Rules 13a-15(a) and 15d-15(e) under the Securities and Exchange Act of 1934, as amended). Based on the evaluation, we concluded that the design and operation of our disclosure controls and procedures are effective to ensure that information required to be disclosed by us in the reports filed and submitted under the Securities Exchange Act of 1934 is recorded, processed, summarized and reported within the time periods specified in SEC rules and forms, and is accumulated and communicated to our management, including our Principal Executive Officer and Principal Financial Officer, as appropriate, to allow timely decisions regarding required disclosure.
Management’s Annual Report on Internal Control over Financial Reporting
The report of management required under this Item 9A is contained in Item 8 of Part II of this Annual Report on Form 10-K under the heading “Management’s Report on Internal Control Over Financial Reporting.”
Attestation Report of Independent Registered Public Accounting Firm
The attestation report required under this Item 9A is contained in Item 8 of Part II of this Annual Report on Form 10-K under the heading “Report of Independent Registered Public Accounting Firm.”
Changes in Internal Control over Financial Reporting
There were no significant changes in our internal control over financial reporting during the fourth quarter of 2014.
None.
ITEM 10. DIRECTORS, EXECUTIVE OFFICERS AND CORPORATE GOVERNANCE
Information related to our executive officers appears under the caption “Executive Officers of the Registrant” in Item 1 to this report. All other information in response to this item is incorporated herein by reference to our definitive proxy statement for our 2015 annual meeting of shareholders to be held on April 28, 2015.
| ITEM 11. | EXECUTIVE COMPENSATION |
Information in response to this item is incorporated herein by reference to our definitive proxy statement for our 2015 annual meeting of shareholders to be held on April 28, 2015.
ITEM 12. SECURITY OWNERSHIP OF CERTAIN BENEFICIAL OWNERS AND MANAGEMENT AND RELATED SHAREHOLDER MATTERS
Information in response to this item is incorporated herein by reference to our definitive proxy statement for our 2015 annual meeting of shareholders to be held on April 28, 2015. The information required by this item with respect to Item 201(d) of Regulation S-K regarding securities authorized for issuance under equity compensation plans is contained in Item 5 of Part I of this Annual Report on Form 10-K under the heading “Market for Registrant’s Common Equity, Related Shareholder Matters and Issuer Purchases of Equity Securities—Equity Compensation Plan Information.”
| ITEM 13. | CERTAIN RELATIONSHIPS AND RELATED TRANSACTIONS AND DIRECTOR INDEPENDENCE |
Information in response to this item is incorporated herein by reference to our definitive proxy statement for our 2015 annual meeting of shareholders to be held on April 28, 2015.
85
Table of Contents
ITEM 14. PRINCIPAL ACCOUNTANT FEES AND SERVICES
Information in response to this item is incorporated herein by reference to our definitive proxy statement for our 2015 annual meeting of shareholders to be held on April 28, 2015.
ITEM 15. EXHIBITS AND FINANCIAL STATEMENT SCHEDULES
The following documents are being filed as part of this report on Form 10-K:
(a) Financial Statements
The following financial statements are filed as part of this report on Form 10-K under “Item 8: Consolidated Financial Statements and Supplementary Data.”
Management’s Report on Internal Control Over Financial Reporting
Reports of Independent Registered Public Accounting Firm
Consolidated Balance Sheets
Consolidated Statements of Operations
Consolidated Statements of Comprehensive Loss
Consolidated Statements of Shareholders’ Equity
Consolidated Statements of Cash Flows
Notes to Consolidated Financial Statements
Supplementary Data: Quarterly Financial Information
| (b) | Schedule II — Valuation and Qualifying Accounts for the years ended December 31, 2014, 2013 and 2012. |
All other schedules are omitted as the required information is inapplicable or the information is presented in “Item 8: Consolidated Financial Statements and Supplementary Data.”
(c) Exhibits
The exhibit list in the Index to Exhibits is incorporated herein by reference as the list of exhibits required as part of this report on Form 10-K.
86
Table of Contents
CEPHEID
SCHEDULE II — VALUATION AND QUALIFYING ACCOUNTS
| Description |
Balance at Beginning of Year |
Costs and Expenses |
Deductions | Balance at End of Year |
||||||||||||
| (In thousands) | ||||||||||||||||
| Allowance for doubtful accounts: |
||||||||||||||||
| Year ended December 31, 2012 |
$ | 61 | $ | 135 | $ | (20 | ) | $ | 176 | |||||||
| Year ended December 31, 2013 |
176 | 63 | (41 | ) | 198 | |||||||||||
| Year ended December 31, 2014 |
198 | 44 | (5 | ) | 237 | |||||||||||
87
Table of Contents
Pursuant to the requirements of Section 13 or 15(d) of the Securities Exchange Act of 1934, the registrant has duly caused this report to be signed on its behalf by the undersigned, thereunto duly authorized.
| CEPHEID | ||
| By: | /S/ DANIEL E. MADDEN | |
| Daniel E. Madden Vice President, Corporate Controller and Acting Chief Financial Officer (Principal Financial and Accounting Officer) | ||
POWER OF ATTORNEY
KNOW ALL PERSONS BY THESE PRESENTS, that each person whose signature appears below constitutes and appoints John L. Bishop and Daniel E. Madden or either of them, his or her true and lawful attorneys-in-fact and agents, with full power of substitution and re-substitution, for him and in his or her name, place and stead, in any and all capacities to sign any and all amendments to this Annual Report on Form 10-K, and to file the same, with all exhibits thereto and other documents in connection therewith, with the Securities and Exchange Commission, granting unto the attorneys-in-fact and agents, and each of them, full power and authority to do and perform each and every act and thing requisite and necessary to be done in connection therewith, as fully to all intents and purposes as he or she might or could do in person, hereby ratifying and confirming all that the attorneys-in-fact and agents, or either of them, or their, his or her substitutes or substitute, may lawfully do or cause to be done by virtue hereof.
Pursuant to the requirements of the Securities Exchange Act of 1934, as amended, this report has been signed by the following persons on behalf of the registrant and in the capacities and on the dates indicated.
| Signature |
Title |
Date | ||
| /S/ JOHN L. BISHOP |
Chairman and Chief Executive Officer | February 26, 2015 | ||
| John L. Bishop | (Principal Executive Officer) | |||
| /S/ DANIEL E. MADDEN |
February 26, 2015 | |||
| Daniel E. Madden | Vice President, Corporate Controller and Acting Chief Financial Officer (Principal Financial and Accounting Officer) | |||
| /S/ THOMAS L. GUTSHALL |
Director | February 26, 2015 | ||
| Thomas L. Gutshall | ||||
| /S/ THOMAS D. BROWN |
Director | February 26, 2015 | ||
| Thomas D. Brown | ||||
| /S/ ROBERT EASTON |
Director | February 26, 2015 | ||
| Robert Easton | ||||
| /S/ CRISTINA H. KEPNER |
Lead Independent Director | February 26, 2015 | ||
| Cristina H. Kepner | ||||
| /S/ DEAN O. MORTON |
Director | February 26, 2015 | ||
| Dean O. Morton | ||||
|
/s/ DAVID H. PERSING, M.D., Ph.D. |
Executive Vice President and Chief Medical | February 26, 2015 | ||
| David H. Persing, M.D., Ph.D. | and Technology Officer and Director | |||
| /S/ HOLLINGS C. RENTON |
Director | February 26, 2015 | ||
| Hollings C. Renton | ||||
|
/s/ GLENN D. STEELE, JR., M.D., Ph.D. |
Director | February 26, 2015 | ||
| Glenn D. Steele, Jr., M.D., Ph.D. | ||||
88
Table of Contents
| Exhibit Number |
Description of Exhibit |
Form |
File No. |
Exhibit |
Filing Date |
Filed Herewith | ||||||
| 3.1 | Certificate of Amendment of the Fifth Amended and Restated Articles of Incorporation of Cepheid and Fifth Amended and Restated Articles of Incorporation of Cepheid | 10-Q | 3.1 | 8/06/2014 | ||||||||
| 3.2 | Amended and Restated Bylaws | 8-K |
3.01 | 10/31/2011 | ||||||||
| 3.3 | Certificate of Determination specifying the terms of the Series A Junior Participating Preferred Stock of registrant, as filed with the Secretary of State to the State of California on October 2, 2002 | 8-A |
3.02 | 10/4/2002 | ||||||||
| 4.1 | Reference is made to Exhibits 3.1 and 3.2 | |||||||||||
| 4.2 | Specimen Common Stock Certificate | 10-Q |
4.01 | 7/31/2002 | ||||||||
| 4.3 | Indenture, dated as of February 10, 2014 between Cepheid and Wells Fargo Bank, National Association, as trustee | 10-Q |
4.1 | 5/06/14 | ||||||||
| 10.1* | 1997 Stock Option Plan, as amended | S-8 |
333-106181 | 4.2 | 6/17/2003 | |||||||
| 10.2* | 2000 Employee Stock Purchase Plan, as amended | 8-K |
10.01 | 10/31/2011 | ||||||||
| 10.3* | 2012 Employee Stock Purchase Plan | 8-K |
99.02 | 4/26/2012 | ||||||||
| 10.4* | 2006 Equity Incentive Plan, as amended, and restated | 8-K |
99.01 | 4/24/2014 | ||||||||
| 10.5* | Form of Indemnification Agreement between Cepheid and its officers and directors | S-1 |
333-34340 | 10.6 | 4/7/2000 | |||||||
| 10.6† | License Agreement, dated March 4, 1997, between Cepheid and The Regents of the University of California, Lawrence Livermore National Laboratory | S-1 |
333-34340 | 10.9 | 6/7/2000 | |||||||
| 10.7† | Thermal Cycler Supplier Agreement, dated April 15, 2000, between Cepheid and PE Biosystems, a division of PE Corporation | S-1 |
333-34340 | 10.16 | 5/18/2000 | |||||||
| 10.8† | Collaboration Agreement between Applied Biosystems and Cepheid dated October 11, 2002 | 10-K |
10.28 | 3/25/2003 | ||||||||
| 10.9† | IVD Products Patent License Agreement between Cepheid and F. Hoffmann-La Roche Ltd, effective July 1, 2004 | 10-Q |
10.28 | 8/9/2004 | ||||||||
| 10.10† | Real-Time Instrument Patent License Agreement between Applera Corporation and Cepheid, dated April 5, 2004 | 10-Q |
10.29 | 8/9/2004 | ||||||||
| 10.11 | Facility lease agreement between Cepheid and Teachers Insurance & Annuity Association of America, Inc. dated May 13, 2005 | 8-K |
99.01 | 5/18/2005 | ||||||||
| 10.12* | Employment offer letter between Cepheid and David H. Persing dated July 21, 2005 | 8-K |
99.01 | 7/26/2005 | ||||||||
89
Table of Contents
| Exhibit Number |
Description of Exhibit |
Form |
File No. |
Exhibit |
Filing Date |
Filed Herewith | ||||||
| 10.13* | Form of Stock Option Grant Agreement with certain executive officers of Cepheid approved by Cepheid’s Compensation and Organizational Development Committee of the Board of Directors on April 27, 2005 | 10-Q | 10.3 | 8/4/2005 | ||||||||
| 10.14* | Employment Agreement dated January 24, 2007, by and between Cepheid and John L. Bishop | 8-K | 10.1 | 1/29/2007 | ||||||||
90
Table of Contents
| Exhibit Number |
Description of Exhibit |
Form |
File No. |
Exhibit |
Filing Date |
Filed Herewith | ||||||
| 10.15* | Share Purchase Agreement dated February 14, 2007, by and between Cepheid, Altana Technology Projects GmbH, and Altana Pharma AG | 8-K | 2.1 | 2/20/2007 | ||||||||
| 10.16* | Employment Agreement dated February 6, 2008, by and between Cepheid and Andrew D. Miller | 8-K | 10.01 | 2/11/2008 | ||||||||
| 10.17* | Form of Change of Control Retention and Severance Agreement between Cepheid and each of its executive officers, as amended | 10-K | 10.18 | 2/27/2014 | ||||||||
| 10.18 | Office Lease dated February 28, 2008, between BRCP Caribbean Portfolio, LLC, and Cepheid | 10-Q | 10.1 | 5/7/2008 | ||||||||
| 10.19† | Confidential Settlement Agreement, dated as of September 24, 2012 by and between Cepheid and Abaxis, Inc. | 10-Q | 10.1 | 11/2/2012 | ||||||||
| 10.20* | Employment offer letter between Cepheid and Warren C. Kocmond dated April 12, 2013 | 8-K | 10.01 | 5/7/2013 | ||||||||
| 10.21* | Employment offer letter between Cepheid and Michael Fitzgerald dated December 22, 2011 | 10-K | 10.27 | 2/27/2014 | ||||||||
| 10.22* | Employment offer letter between Cepheid and James Post dated November 11, 2013. | 10-K | 10.27 | 2/27/2014 | ||||||||
| 10.23* | Separation Agreement, effective October 29, 2014, between Cepheid and James Post. | X | ||||||||||
| 10.24* | Offer Letter between Cepheid and Peter Farrell. | 10-Q | 10.1 | 8/06/2014 | ||||||||
| 10.25† | Purchase Agreement, dated as of September 30, 2014, between Cepheid and Laboratory Supply Company. | 10-Q | 10.1 | 11/4/2014 | ||||||||
| 10.26 | Base Capped Call Transaction Confirmation, dated as of February 4, 2014 between Cepheid and Morgan Stanley & Co. International plc. | 8-K | 99.01 | 2/10/2014 | ||||||||
| 10.27 | Additional Capped Call Transaction Confirmation, dated as of February 5, 2014 between Cepheid and Morgan Stanley & Co. International plc. | 8-K | 99.02 | 2/10/2014 | ||||||||
| 10.28 | Base Capped Call Transaction Confirmation, dated as of February 4, 2014 between Cepheid and Jefferies LLC. | 8-K | 99.03 | 2/10/2014 | ||||||||
| 10.29 | Additional Capped Call Transaction Confirmation, dated as of February 5, 2014 between Cepheid and Jefferies LLC. | 8-K | 99.04 | 2/10/2014 | ||||||||
| 10.30 | Base Capped Call Transaction Confirmation, dated as of February 4, 2014 between Cepheid and Goldman, Sachs & Co. | 8-K | 99.05 | 2/10/2014 | ||||||||
| 10.31 | Additional Capped Call Transaction Confirmation, dated as of February 5, 2014 between Cepheid and Goldman, Sachs & Co. | 8-K | 99.06 | 2/10/2014 | ||||||||
91
Table of Contents
| Exhibit Number |
Description of Exhibit |
Form |
File No. |
Exhibit |
Filing Date |
Filed Herewith | ||||||
| 21.1 | List of Subsidiaries | X | ||||||||||
| 23.1 | Consent of Independent Registered Public Accounting Firm | X | ||||||||||
| 24.1 | Power of Attorney (see Signature page to this annual report) | X | ||||||||||
| 31.1 | Certification of Chief Executive Officer pursuant to Rule 13a-14(a), as adopted pursuant to Section 302 of the Sarbanes-Oxley Act of 2002 | X | ||||||||||
| 31.2 | Certification of Principal Financial Officer pursuant to Rule 13a-14(a), as adopted pursuant to Section 302 of the Sarbanes-Oxley Act of 2002 | X | ||||||||||
| 32.1 | Certification of Chief Executive Officer pursuant to 18 U.S.C. Section 1350, as adopted pursuant to Section 906 of the Sarbanes-Oxley Act of 2002 | X | ||||||||||
| 32.2 | Certification of Principal Financial Officer pursuant to 18 U.S.C. Section 1350, as adopted pursuant to Section 906 of the Sarbanes-Oxley Act of 2002 | X | ||||||||||
| 101.INS | XBRL Instance Document | X | ||||||||||
| 101.SCH | XBRL Taxonomy Extension Schema Document | X | ||||||||||
| 101.CAL | XBRL Taxonomy Extension Calculation Linkbase Document | X | ||||||||||
| 101.DEF | XBRL Taxonomy Extension Definition Linkbase Document | X | ||||||||||
| 101.LAB | XBRL Taxonomy Extension Label Linkbase Document | X | ||||||||||
| 101.PRE | XBRL Taxonomy Extension Presentation Linkbase Document | X | ||||||||||
| * | Management contract or compensatory plan or arrangement. |
| † | Confidential treatment has been granted with respect to portions of the exhibit. A complete copy of the agreement, including the redacted terms, has been separately filed with the Securities and Exchange Commission. |
92