Attached files
| file | filename |
|---|---|
| EX-99.1 - EX-99.1 - CENTERPOINT ENERGY INC | d881643dex991.htm |
| 8-K - 8-K - CENTERPOINT ENERGY INC | d881643d8k.htm |
 The Benefits of
a Diversified Electric & Natural Gas Portfolio Full Year 2014 Earnings
Supplemental Materials
February 26, 2015
Exhibit 99.2 |
 investors.centerpointenergy.com
February 26, 2015
Cautionary Statement Regarding
Forward-Looking Information
This presentation contains statements concerning our expectations, beliefs, plans, objectives, goals,
strategies, future events or performance and underlying assumptions
and
other
statements
that
are
not
historical
facts.
These
statements
are
“forward-looking
statements”
within
the
meaning
of
the
Private
Securities
Litigation Reform Act of 1995. You should not place undue reliance on forward-looking statements.
Actual results may differ materially from those expressed or implied
by
these
statements.
You
can
generally
identify
our
forward-looking
statements
by
the
words
“anticipate,”
“believe,”
“continue,”
“could,”
“estimate,”
“expect,”
“forecast,”
“goal,”
“intend,”
“may,”
“objective,”
“plan,”
“potential,”
“predict,”
“projection,”
“should,”
“will,”
or other similar words. The absence of these words, however,
does not mean that the statements are not forward-looking.
We have based our forward-looking statements on our management's beliefs and assumptions based on
information currently available to our management at the time the statements are made. We
caution you that assumptions, beliefs, expectations, intentions, and projections about future events may and often do vary
materially
from
actual
results.
Therefore,
we
cannot
assure
you
that
actual
results
will
not
differ
materially
from
those
expressed
or
implied
by
our
forward-looking
statements.
Some of the factors that could cause actual results to differ from those expressed or implied by our
forward-looking statements include but are not limited to the timing and impact of future
regulatory, legislative and IRS decisions, financial market conditions, future market conditions, and other factors described in CenterPoint
Energy,
Inc.’s
Form
10-K
for
the
period
ended
December
31,
2014
under
“cautionary
statement
regarding
forward-looking
information,”
“Risk
Factors”
and
“
–
Liquidity and Capital Resources –
Other Matters –
Other Factors That Could Affect Cash Requirements”
and “Management’s Discussion and Analysis of Financial
Condition and Results of Operations -
Certain Factors Affecting Future Earnings,”
and in other filings with the SEC by CenterPoint Energy, which can be found at
www.centerpointenergy.com
on
the
Investor
Relations
page
or
on
the
SEC’s
website
at
www.sec.gov
.
This presentation contains time sensitive information that is accurate as of the date hereof.
Some of the information in this presentation in unaudited and may be subject to change.
We undertake no obligation to update the information presented herein except as required by law.
Investors and others should note that we may announce material information using SEC filings, press
releases, public conference calls, webcasts and the Investors page of our website. In the
future, we will continue to use these channels to distribute material information about the Company and to communicate
important information about the Company, key personnel, corporate initiatives, regulatory updates and
other matters. Information that we post on our website could be deemed material;
therefore, we encourage investors, the media, our customers, business partners and others interested in our Company to review the information
we post on our website.
Use
of
Non-GAAP
Financial
Measures
In addition to presenting its financial results in accordance with generally accepted accounting
principles (“GAAP”), CenterPoint Energy also provides guidance based
on
adjusted
diluted
earnings
per
share,
which
is
a
non-GAAP
financial
measure.
Generally,
a
non-GAAP
financial
measure
is
a
numerical
measure
of a
company’s
historical
or
future
financial
performance
that
excludes
or
includes
amounts
that
are
not
normally
excluded
or
included
in
the
most
directly
comparable
GAAP financial measure.
A reconciliation of net income and diluted earnings per share to the basis used in providing 2014
guidance is provided in this presentation on slide 5.
Management evaluates financial performance in part based on adjusted diluted earnings per share and
believes that presenting this non-GAAP financial measure enhances an investor’s
understanding of CenterPoint Energy’s overall financial performance by providing them with an additional meaningful and relevant
comparison of current and anticipated future results across periods by excluding items that Management
does not believe most accurately reflect its fundamental business performance, which items
include the items reflected in the reconciliation table on page 5 of this presentation.
This non-GAAP financial measure should be
considered as a supplement and complement to, and not as a substitute for, or superior to, the most
directly comparable GAAP financial measure and may be different than non-GAAP financial
measures used by other companies. 2 |
 investors.centerpointenergy.com
February 26, 2015
2014 Year Highlights
3
•
New management team in place with the right mix of industry experience and functional knowledge
•
Utility
Operations:
Strong
financial
and
operational
performances
Sustained strong economic activity with the addition of nearly 55,000 new meters for Houston
Electric and nearly 36,000 new Gas Utility customers
Continued interest in our transmission rights-of-way for our electric utility
Rate changes and cost management efforts led to a record performance for our natural gas
utilities
Invested over $1.4 billion in our utility operations, up 14 percent from 2013, to address
increasing demands associated with system safety, reliability, growth and ongoing
maintenance ERCOT endorsed an approximately $300 MM transmission line, the Brazos
Valley Connection, expected to be in service by summer of 2018
•
Enable Midstream Partners:
Completed their initial public offering
Contributed substantially all of CenterPoint’s remaining interest in Southeast Supply
Header, LLC (SESH) to Enable in May of 2014, increasing CenterPoint Energy’s
limited partner interest in Enable from approximately 54.7% to approximately
55.4% •
Increased dividend 4.2% in January 2015; a 19% increase in the quarterly dividend since the
formation of Enable in May 2013 |
 investors.centerpointenergy.com
February 26, 2015
2014 Forecast Summary
4
Compound Annual Growth Rates
2013 -2018 Forecast
(Provided June 2014)
1
2014 –
2019 Forecast
(Provided Feb 2015)
2
Houston Electric Rate Base
7-10%
8-10%
Houston Electric Operating Income
5-7%
5-7%
4
Gas Utilities Rate Base
8-10%
8-10%
Gas Utilities Operating Income
4-6%
4-6%
4
Consolidated Rate Base
7-10%
8-10%
Utility Operations Earnings
4-6%
3
4-6%
3, 4
1
The 2013 –
2018 forecast does not assume the utilization of bonus depreciation
2
The 2014 –
2019 forecast does not assume bonus depreciation for 2015 and beyond
3
Earnings are expected to be lower during initial years and higher during later years of the
forecast 4
The operating and earnings growth rates utilize the same adjustment methodology used to
determine the 2014 $0.70 utility operations baseline 5-Year Capital Investment
2014 -2018 Forecast
(Provided June 2014)
2015 –
2019 Forecast
(Provided Feb 2015)
Houston Electric
$3.7 -
$4.5 B
$4.4 B
Gas Utilities
$2.2 -
$2.6 B
$2.7 B
Utility Operations
$6.2 -
$7.4 B
$7.4 B
shown on the next slide |
 investors.centerpointenergy.com
February 26, 2015
2014 EPS Reconciliation to 2015 Utility Operations Guidance
Range of $0.71 to $0.75 per diluted share
5
2014 Fully Diluted EPS
$ 1.42
On an adjusted guidance basis:
ZENS-related mark to market gains
(0.12)
CES MTM gain
(0.04)
Pension Curtailment loss
0.01
2014 Consolidated EPS on a guidance basis
$ 1.27
Deferred Tax Benefit
(0.07)
2014 Fully Adjusted EPS
$ 1.20
Midstream Investments
(0.44)
2014 Fully Adjusted Utility Operations EPS
$ 0.76
1
2
(1)
The Equity Amortization schedule on page 19 details the decrease between the
2014 actual and 2015 projected equity returns
(2)
2008 Energy Efficiency Cost Recovery Factor Appeal details are provided in the
2014 10-K |
 investors.centerpointenergy.com
February 26, 2015
Electric Transmission and Distribution Utility
2014 Operating Income Drivers
6 |
 investors.centerpointenergy.com
February 26, 2015
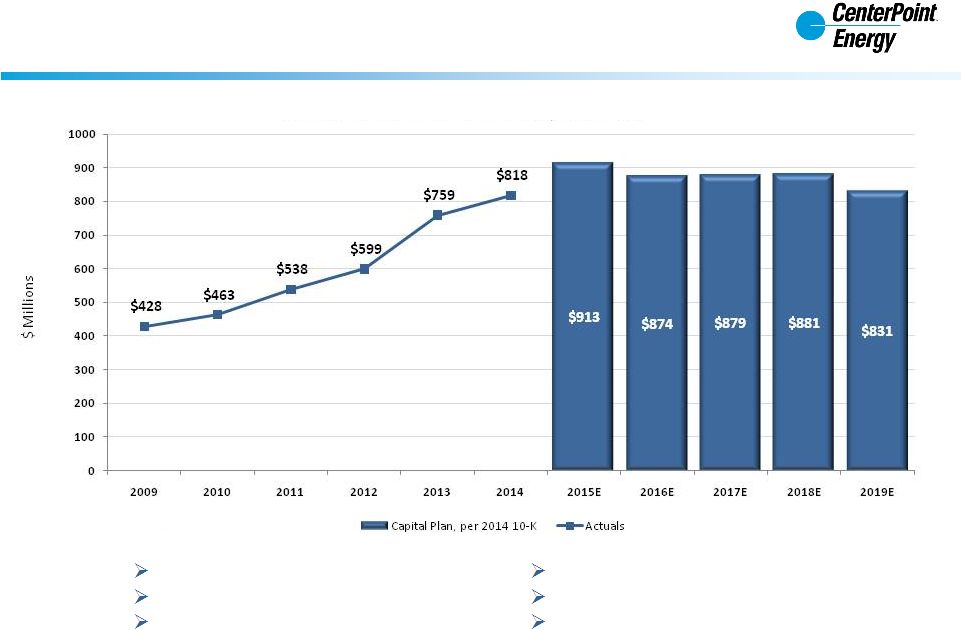
Electric Transmission and Distribution Utility
Capital Investment Growth
7
$4.4 Billion 2015 –
2019 Capital Plan
Capital Plan Includes:
1
A portion of the Houston Import Project
Brazos Valley Connection ¹
Reliability/Resiliency
Technology
Customer Growth
Infrastructure improvements
Reliability and Technology |
 investors.centerpointenergy.com
February 26, 2015
Electric Transmission & Distribution Utility
Capital Expenditures
2014A
2015E
2016E
2017E
2018E
2019E
Transmission
37%
36%
41%
40%
33%
24%
Distribution
59%
63%
56%
55%
63%
74%
8 |
 investors.centerpointenergy.com
February 26, 2015
$6.3 Billion Projected 2019 Rate Base
Electric Transmission and Distribution Utility
9
Note: The estimated average annual rate base is subject to change due to actual capital
investment, effects of bonus depreciation, deferred taxes, and actual rate base
authorized. As an example of the impact of bonus depreciation, 2018 rate base was reduced by approximately $100 MM as a result of the bonus
depreciation passed for 2014. Forecasts do not assume bonus depreciation is passed in
2015 and beyond. Projected Average Rate Base |
 investors.centerpointenergy.com
February 26, 2015
Natural Gas Utilities
2014 Operating Income Drivers
10 |
 investors.centerpointenergy.com
February 26, 2015
Natural Gas Utilities
Capital Investment Growth
11
$2.7 Billion 2015 –
2019 Capital Plan
Replacing aging infrastructure
Customer growth investment
System-wide AMR; 3.4 million meters by Q4 2015
Minnesota Belt Line Project; $400 million over 12
years
Capital Plan Includes: |
 investors.centerpointenergy.com
February 26, 2015
Natural Gas Utilities
Capital Expenditures
12
Capital Recovery Method
2014A
2015E
2016E
2017E
2018E
2019E
Annual Mechanisms
48%
52%
43%
55%
59%
59%
Rate Cases
52%
48%
57%
45%
41%
41%
Note: Annual mechanisms reduce the recovery lag time versus traditional rate cases.
|
 investors.centerpointenergy.com
February 26, 2015
$3.5 Billion Projected 2019 Rate Base
Natural Gas Utilities
13
Note: The estimated average annual rate base is subject to change due to actual capital
investment, effects of bonus depreciation, deferred taxes, and actual rate base
authorized. As an example of the impact of bonus depreciation, 2018 rate base was reduced by approximately $64 MM as a result of the bonus depreciation
passed for 2014. Forecasts do not assume bonus depreciation is passed in 2015 and
beyond. Projected Average Rate Base |
 investors.centerpointenergy.com
February 26, 2015
CenterPoint Energy Services (CES)
2014 Operating Income Drivers
14 |
 investors.centerpointenergy.com
February 26, 2015
Rate Mechanism and Estimated Timing
15
Estimated rate filing timelines as of December 31, 2014:
* MRP (not shown) is filed monthly. Texarkana TX is not included in Act 310
filings. Natural Gas Utilities
Houston Electric
Note:
Assumes
DCRF
or
similar
mechanisms
will
be
in
place
after
original
DCRF
sunsets
on
January
1,
2017
Q1
Q2
Q3
Q4
Q1
Q2
Q3
Q4
Q1
Q2
Q3
Q4
Q1
Q2
Q3
Q4
Q1
Q2
Q3
Q4
Minnesota
Arkansas
& Texarkana TX *
Oklahoma
PBRC
PBRC
PBRC
PBRC
PBRC
Louisiana
RSP
RSP
RSP
RSP
RSP
RRA
RRA
RRA
RRA
RRA
Jurisdiction
2015
2016
2017
2018
2019
Mississippi
East Texas
Texas Coast
Rate Case
Rate Case
Rate Case
Houston Gas
South Texas
Rate Case
cont. 2020
Rate Case
Rate Case
Rate Case
Rate Case
cont. in 2020
Rate Case
BDA
BDA
310
310
GRIP
310
GRIP
GRIP
GRIP
GRIP
GRIP
GRIP
GRIP
GRIP
Interim
Rates
BDA
310
Interim
Rates
GRIP
BDA
310
GRIP
GRIP
GRIP
GRIP
GRIP
GRIP
GRIP
GRIP
GRIP
GRIP
GRIP
BDA
GRIP
GRIP
310
GRIP
Interim
Rates
GRIP
GRIP |
 investors.centerpointenergy.com
February 26, 2015
2014 Financial Results
Midstream Operating Income moved to Equity Income on May 1, 2013
16
Operating Income
Equity Income
As reported, 12 months ended December 31
Note: Both 2013 and 2014 had $5 million in basis difference accretion
Key Enable Midstream Dates
•
For the four months ended April 30, 2013,
CenterPoint Energy maintained a 50%
ownership interest in SESH and reported its
results as Equity Income
•
Enable Midstream Partners, formed May 1,
2013, which includes CenterPoint Energy’s
former Interstate Pipelines and Field Services
segments and a 24.95% interest in SESH
•
Effective May 1, 2013 midstream operations
are reported as
Equity Income as part of
CenterPoint Energy’s midstream investment
segment
•
On April 16, 2014, Enable completed its IPO,
reducing CenterPoint Energy’s interest in
Enable from approximately 58.3% to 54.7%
•
Between May 1, 2013 and May 30, 2014,
CenterPoint
maintained a 25.05% ownership
interest in SESH
•
On May 30, 2014, CenterPoint contributed to
Enable a 24.95% interest in SESH, which
increased CenterPoint
Energy’s limited
partner interest in Enable from approximately
54.7% to approximately 55.4% |
 investors.centerpointenergy.com
February 26, 2015
17
Debt and Capitalization Ratios
Excluding Transition and System Restoration Bonds
($ in millions)
December 31,
December 31,
2014
2013
Short-term Debt:
Short-term borrowings
53
$
43
$
Current portion of transition and system restoration bonds*
372
354
Indexed debt (ZENS)**
152
143
Current portion of other long-term debt
271
-
Long-term Debt:
Transition and system restoration bonds*
2,674
3,046
Other
5,335
4,771
Total Debt
8,857
$
8,357
$
Less: Transition and system restoration bonds (including current portion)*
3,046
3,400
Total Debt, excluding transition and system restoration bonds
5,811
$
4,957
$
Total Shareholders' Equity
4,548
$
4,329
$
Total Capitalization, excluding transition and system restoration bonds
10,359
$
9,286
$
Total Debt/Total Capitalization, excluding transition and system restoration bonds
56.1%
53.4%
*
**
The debt component reflected on the financial statements was $152 million and $143 million as of
December 31, 2014 and December 31, 2013, respectively. The principal amount on which 2%
interest is paid was $828 million on each of December 31, 2014 and December 31, 2013.
The contingent principal amount was $751 million and $763 million as of December 31, 2014 and December 31, 2013, respectively. At
maturity or upon redemption, holders of ZENS will receive cash at the higher of the contingent
principal amount or the value of the reference shares of Time Warner Inc., Time Warner Cable
Inc., AOL Inc. and Time Inc. The value of the reference shares was $930 million and $767
million as of December 31, 2014 and December 31, 2013, respectively.
The transition and system restoration bonds are serviced with dedicated revenue streams, and the
bonds are non-recourse to CenterPoint Energy and CenterPoint Energy Houston
Electric. |
 investors.centerpointenergy.com
February 26, 2015
Liquidity and Credit Ratings
18
Moody's
S&P
Fitch
Debt Rated
Rating
Outlook
a
Rating
Outlook
b
Rating
Outlook
CenterPoint Energy Sr Unsecured
Baa1
Stable
BBB+
Stable
BBB
Stable
CenterPoint Energy Houston Electric Sr Secured
A1
Stable
A
Stable
A
Stable
CenterPoint Energy Resources Corp. Sr Unsecured
Baa2
Stable
A-
Stable
BBB
Stable
a
A
Moody’s
rating
outlook
is
an
opinion
regarding
the
likely
direction
of
an
issuer's
rating
over
the
medium
term.
b
An S&P rating outlook assesses the potential direction of long-term credit rating over the
intermediate to longer term. c
A
Fitch
rating
outlook
indicates
the
direction
a
rating
is
likely
to
move
over
a
one-
to
two-year
period.
(in millions)
Source of Liquidity on 02/17/2015
Facility
Size
Amount
Utilized
1
Amount
Unutilized
CenterPoint Energy, Inc. Revolver
$ 1,200
$ 170
2
$ 1,030
CenterPoint Houston Electric, LLC Revolver
300
4
3
296
CenterPoint Energy Resources Corp. Revolver
600
248
4
352
Total Bank Facilities
$ 2,100
$ 422
$ 1,678
Investments in Money Market Funds
0
Available Liquidity
$ 1,678
1
Based on the consolidated debt to capitalization covenant in the CenterPoint Energy, Inc. revolving
credit facility and the revolving credit facility of each of CenterPoint Energy Houston
Electric, LLC and CenterPoint Energy Resources Corp., the full capacity of such revolving
credit facilities, which aggregated $2.1 billion, could have been utilized at December 31,
2014. 2
Represents outstanding letters of credit of $6 million and outstanding commercial paper of $164
million. 3
Represents outstanding letters of credit.
4
Represents outstanding commercial paper.
C |
  investors.centerpointenergy.com
February 26, 2015
19
Estimated Amortization for Pre-Tax Equity Earnings
Associated
with
the
Recovery
of
Certain
Qualified
Cost
and
Storm
Restoration
Costs
The
amounts
reflected
for
2015
through
2024
are
based
on
CenterPoint
Energy’s
estimates
as
of
December
31,
2014.
However,
the
equity
returns
to
be
recognized
in
future periods with respect to each series of transition or system restoration bonds, as applicable,
will be periodically subject to adjustment based on tariff adjustments for any overcollections
or undercollections of transition charges or system restoration charges, as applicable. The equity return amounts reflected in the table are
reported in the financial statements of CenterPoint Energy and CenterPoint Energy Houston Electric as
revenues from electric transmission and distribution utility. TBC II
TBC III
TBC IV
SRBC
Total
2005
213,804
$
-
$
-
$
-
$
213,804
$
2006
6,644,004
-
-
-
6,644,004
2007
7,140,194
-
-
-
7,140,194
2008
6,673,765
4,743,048
-
-
11,416,813
2009
7,279,677
6,074,697
-
95,841
13,450,215
2010
9,071,326
5,745,580
-
2,657,384
17,474,291
2011
9,902,590
6,994,650
-
2,840,737
19,737,978
2012
9,717,059
6,837,290
27,873,514
2,473,992
46,901,855
2013
10,383,183
7,251,470
24,082,419
2,235,567
43,952,640
2014
11,442,612
8,699,455
42,944,063
3,680,587
66,766,717
2015
12,386,321
11,321,735
18,385,219
1,847,199
43,940,475
2016
11,998,830
8,301,168
29,248,671
2,795,079
52,343,747
2017
12,939,614
8,587,569
29,899,025
2,944,601
54,370,809
2018
13,946,918
9,293,326
30,817,623
3,115,549
57,173,417
2019
7,910,151
9,643,393
31,870,399
3,311,435
52,735,378
2020
-
842,583
32,937,717
3,506,718
37,287,017
2021
-
-
34,186,583
3,705,250
37,891,833
2022
-
-
35,552,782
2,244,613
37,797,395
2023
-
-
36,978,374
36,978,374
2024
-
-
30,008,722
30,008,722
137,650,048
$
94,335,964
$
404,785,110
$
37,454,553
$
674,225,675
$
As of December 31, 2014
The table provides
1)
the pre-tax equity return recognized by
CenterPoint
Energy, Inc. (CenterPoint
Energy)
during each of the years 2005 through 2014
related to CenterPoint
Energy Houston Electric,
LLC’s (CEHE) recovery of certain qualified costs
or storm restoration costs, as applicable,
pursuant to the past issuance of transition
bonds by CenterPoint
Energy Transition Bond
Company II, LLC (Transition BondCo
II) and
CenterPoint
Energy Transition Bond Company
III, LLC (Transition BondCo
III) or CenterPoint
Energy Transition Bond Company IV, LLC
(Transition BondCo
IV) or system restoration
bonds by CenterPoint
Energy Restoration Bond
Company, LLC (System Restoration BondCo), as
applicable and
2)
the estimated pre-tax equity return currently
expected to be recognized in each of the years
2015 through 2024 related to CEHE’s recovery
of certain qualified costs or storm restoration
costs, as applicable, pursuant to the past
issuance of transition bonds by Transition
BondCo
II, Transition BondCo
III or Transition
BondCo
IV or system restoration bonds by
System Restoration BondCo, as applicable. |