Attached files
| file | filename |
|---|---|
| EX-31.1 - EX-31.1 - ARES CAPITAL CORP | a2222984zex-31_1.htm |
| EX-31.2 - EX-31.2 - ARES CAPITAL CORP | a2222984zex-31_2.htm |
| EX-10.5 - EX-10.5 - ARES CAPITAL CORP | a2222984zex-10_5.htm |
| EX-32.1 - EX-32.1 - ARES CAPITAL CORP | a2222984zex-32_1.htm |
| EX-21.1 - EX-21.1 - ARES CAPITAL CORP | a2222984zex-21_1.htm |
UNITED STATES
SECURITIES AND EXCHANGE COMMISSION
Washington, D.C. 20549
FORM 10-K
| ý | ANNUAL REPORT PURSUANT TO SECTION 13 OR 15(d) OF THE SECURITIES EXCHANGE ACT OF 1934 | |
For the fiscal year ended December 31, 2014 |
||
OR |
||
o |
TRANSITION REPORT PURSUANT TO SECTION 13 OR 15(d) OF THE SECURITIES EXCHANGE ACT OF 1934 |
|
For the transition period from to |
||
Commission File No. 814-00663 |
||
ARES CAPITAL CORPORATION
(Exact name of registrant as specified in its charter)
| Maryland | 33-1089684 | |
| (State or other jurisdiction of incorporation or organization) |
(I.R.S. Employer Identification No.) |
|
245 Park Avenue, 44th Floor, New York, New York 10167 (Address of principal executive offices) (Zip Code) |
||
(212) 750-7300 (Registrant's telephone number, including area code) |
||
Securities registered pursuant to Section 12(b) of the Act:
| Title of each class | Name of each exchange on which registered | |
| Common Stock, par value $0.001 per share | The NASDAQ Global Select Market | |
| 5.875% Senior Notes due 2022 | The New York Stock Exchange | |
| 7.00% Senior Notes due 2022 | The New York Stock Exchange | |
| 7.75% Senior Notes due 2040 | The New York Stock Exchange | |
| 6.875% Senior Notes due 2047 | The New York Stock Exchange |
Securities registered pursuant to Section 12(g) of the Act: None
Indicate by check mark if the registrant is a well-known seasoned issuer, as defined in Rule 405 of the Securities Act. Yes o No ý
Indicate by check mark if the registrant is not required to file reports pursuant to Section 13 or Section 15(d) of the Act. Yes o No ý
Indicate by check mark whether the registrant (1) has filed all reports required to be filed by Section 13 or 15(d) of the Securities Exchange Act of 1934 during the preceding 12 months (or for such shorter period that the registrant was required to file such reports), and (2) has been subject to such filing requirements for the past 90 days: Yes ý No o
Indicate by check mark whether the registrant has submitted electronically and posted on its corporate Web site, if any, every Interactive Data File required to be submitted and posted pursuant to Rule 405 of Regulation S-T (Section §232.405 of this chapter) during the preceding 12 months (or for such shorter period that the registrant was required to submit and post such files). Yes o No o
Indicate by check mark if disclosure of delinquent filers pursuant to Item 405 of Regulation S-K is not contained herein, and will not be contained, to the best of registrant's knowledge, in definitive proxy or information statements incorporated by reference in Part III of this Form 10-K or any amendment to this Form 10-K. o
Indicate by check mark whether the registrant is a large accelerated filer, an accelerated filer, a non-accelerated filer, or a smaller reporting company. See the definitions of "large accelerated filer," "accelerated filer" and "smaller reporting company" in Rule 12b-2 of the Exchange Act:
| Large accelerated filer ý | Accelerated filer o | Non-accelerated filer o (Do not check if a smaller reporting company) |
Smaller reporting company o |
Indicate by check mark whether the registrant is a shell company (as defined in Rule 12b-2 of the Exchange Act). Yes o No ý
The aggregate market value of the voting stock held by non-affiliates of the registrant on June 30, 2014, based on the closing price on that date of $17.86 on The NASDAQ Global Select Market, was approximately $5,262,205,318. As of February 24, 2015, there were 314,108,062 shares of the registrant's common stock outstanding.
Portions of the registrant's Proxy Statement for its 2015 Annual Meeting of Stockholders to be filed not later than 120 days after the end of the fiscal year covered by this Annual Report on Form 10-K are incorporated by reference into Part III of this Form 10-K.
GENERAL
Ares Capital Corporation, a Maryland corporation (together with its subsidiaries, where applicable, "Ares Capital" or the "Company," which may also be referred to as "we," "us" or "our"), is a specialty finance company that is a closed-end, non-diversified management investment company. We have elected to be regulated as a business development company, or a "BDC," under the Investment Company Act of 1940, as amended, and the rules and regulations promulgated thereunder or the "Investment Company Act." We were founded on April 16, 2004, were initially funded on June 23, 2004 and completed our initial public offering on October 8, 2004. We are one of the largest BDCs with approximately $9.5 billion of total assets as of December 31, 2014.
We are externally managed by our investment adviser, Ares Capital Management LLC ("Ares Capital Management" or our "investment adviser"), a subsidiary of Ares Management, L.P. (NYSE:ARES) ("Ares Management" or "Ares"), a publicly traded, leading global alternative asset manager with approximately $86 billion of assets under management ("AUM")(1) as of December 31, 2014. Ares Operations LLC ("Ares Operations" or our "administrator"), our administrator, a subsidiary of Ares Management, provides certain administrative and other services necessary for us to operate.
Our investment objective is to generate both current income and capital appreciation through debt and equity investments. We invest primarily in U.S. middle-market companies, where we believe the supply of primary capital is limited and the investment opportunities are most attractive. However, we may from time to time invest in larger or smaller (in particular, for investments in early-stage and/or venture capital-backed) companies. We generally use the term "middle-market" to refer to companies with annual EBITDA between $10 million and $250 million. As used herein, EBITDA represents net income before net interest expense, income tax expense, depreciation and amortization.
We invest primarily in first lien senior secured loans (including "unitranche" loans, which are loans that combine both senior and mezzanine debt, generally in a first lien position), second lien senior secured loans and mezzanine debt, which in some cases includes an equity component. First and second lien senior secured loans generally are senior debt instruments that rank ahead of subordinated debt of a given portfolio company. Mezzanine debt is subordinated to senior loans and is generally unsecured. Our investments in corporate borrowers generally range between $30 million and $500 million each, investments in project finance/power generation projects generally range between $10 million and $200 million each and investments in early-stage and/or venture capital-backed companies generally range between $1 million and $25 million each. However, the investment sizes may be more or less than these ranges and may vary based on, among other things, our capital availability, the composition of our portfolio and general micro- and macro-economic factors.
To a lesser extent, we also make preferred and/or common equity investments, which have generally been non-control equity investments of less than $20 million (usually in conjunction with a
- (1)
- Ares Management is the parent to several registered investment advisers, including Ares Capital Management. AUM refers to the assets of the funds, alternative asset companies and other entities and accounts that are managed or co-managed by Ares, including funds managed by IHAM. For Ares funds other than collateralized loan obligations ("CLOs"), AUM represents the sum of the net asset value of such funds, the drawn and undrawn debt (at the fund-level including amounts subject to restrictions) and uncalled committed capital (including commitments to funds that have yet to commence their investment periods). For Ares funds that are CLOs, AUM represents subordinated notes (equity) plus all drawn and undrawn debt tranches. AUM amounts are as of December 31, 2014 and pro forma for Ares' acquisition of Energy Investors Funds ("EIF"), which closed on January 1, 2015.
1
concurrent debt investment). However, we may increase the size or change the nature of these investments.
The proportion of these types of investments will change over time given our views on, among other things, the economic and credit environment in which we are operating. In connection with our investing activities, we may make commitments with respect to indebtedness or securities of a potential portfolio company substantially in excess of our final investment. In such situations, while we may initially agree to fund up to a certain dollar amount of an investment, we may subsequently syndicate or sell a portion of such amount (including, without limitation, to vehicles managed by our portfolio company, Ivy Hill Asset Management, L.P. ("IHAM")), such that we are left with a smaller investment than what was reflected in our original commitment. In addition to originating investments, we may also acquire investments in the secondary market (including purchases of a portfolio of investments).
The first and second lien senior secured loans in which we invest generally have stated terms of three to 10 years and the mezzanine debt investments in which we invest generally have stated terms of up to 10 years, but the expected average life of such first and second lien loans and mezzanine debt is generally between three and seven years. However, we may invest in loans and securities with any maturity or duration. The instruments in which we invest typically are not rated by any rating agency, but we believe that if such instruments were rated, they would be below investment grade (rated lower than "Baa3" by Moody's Investors Service, lower than "BBB–" by Fitch Ratings or lower than "BBB–" by Standard & Poor's Ratings Services), which, under the guidelines established by these entities, is an indication of having predominantly speculative characteristics with respect to the issuer's capacity to pay interest and repay principal. Bonds that are rated below investment grade are sometimes referred to as "high yield bonds" or "junk bonds." We may invest without limit in debt or other securities of any rating, as well as debt or other securities that have not been rated by any nationally recognized statistical rating organization.
We believe that our investment adviser, Ares Capital Management, is able to leverage the current investment platform, resources and existing relationships of Ares Management with financial sponsors, financial institutions, hedge funds and other investment firms to provide us with attractive investment opportunities. For purposes of this document, we refer to Ares Management and its affiliated companies (other than portfolio companies of its affiliated funds) as "Ares." In addition to deal flow, the Ares investment platform assists our investment adviser in analyzing, structuring and monitoring investments. Ares has been in existence for over 17 years and its senior partners have an average of over 27 years of experience in leveraged finance, private equity, distressed debt, commercial real estate finance, investment banking and capital markets. We have access to Ares' investment professionals and administrative professionals, who provide assistance in accounting, finance, legal, compliance, operations, information technology and investor relations. As of December 31, 2014, Ares had over 320 investment professionals and over 430 administrative professionals.
We and General Electric Capital Corporation and GE Global Sponsor Finance LLC (collectively, "GE") also co-invest in first lien senior secured loans of middle market companies through an unconsolidated vehicle, the Senior Secured Loan Fund LLC, which operates using the name "Senior Secured Loan Program" (the "SSLP"). As of December 31, 2014, the SSLP had available capital of $11.0 billion of which approximately $9.9 billion in aggregate principal amount was funded at December 31, 2014. As of December 31, 2014, we had agreed to make available to the SSLP approximately $2.3 billion, of which approximately $2.0 billion was funded. The SSLP is capitalized as transactions are completed and all portfolio decisions and generally all other decisions in respect of the SSLP must be approved by an investment committee of the SSLP consisting of representatives of us and GE (with approval from a representative of each required). As of December 31, 2014, our investment in the SSLP was approximately $2.1 billion at fair value (including unrealized appreciation of $30.5 million), which represented approximately 23% of our total portfolio at fair value. As of December 31, 2014, the SSLP had 50 different underlying borrowers. For more information on the
2
SSLP, see "Management's Discussion and Analysis of Financial Condition and Results of Operations—Portfolio and Investment Activity—Senior Secured Loan Program."
While our primary focus is to generate current income and capital appreciation through investments in first and second lien senior secured loans and mezzanine debt and, to a lesser extent, equity securities of eligible portfolio companies, we also may invest up to 30% of our portfolio in non-qualifying assets, as permitted by the Investment Company Act. Specifically, as part of this 30% basket, we may invest in entities that are not considered "eligible portfolio companies" (as defined in the Investment Company Act), including companies located outside of the United States, entities that are operating pursuant to certain exceptions under the Investment Company Act, and publicly traded entities whose public equity market capitalization exceeds the levels provided for under the Investment Company Act.
In the first quarter of 2011, the staff of the Securities and Exchange Commission ("SEC") (the "Staff") informally communicated to certain BDCs the Staff's belief that certain entities, which would be classified as an "investment company" under the Investment Company Act but for the exception from the definition of "investment company" set forth in Rule 3a-7 promulgated under the Investment Company Act, could not be treated as eligible portfolio companies (as defined in Section 2(a)(46) under the Investment Company Act) (i.e., not eligible to be included in a BDC's 70% "qualifying assets" basket). Subsequently, in August 2011 the SEC issued a concept release (the "Concept Release") which stated that "[a]s a general matter, the Commission presently does not believe that Rule 3a-7 issuers are the type of small, developing and financially troubled businesses in which the U.S. Congress intended BDCs primarily to invest" and requested comment on whether or not a 3a-7 issuer should be considered an "eligible portfolio company." We provided a comment letter in respect of the Concept Release and continue to believe that the language of Section 2(a)(46) of the Investment Company Act permits a BDC to treat as "eligible portfolio companies" entities that rely on the 3a-7 exception. However, given the current uncertainty in this area (including the language in the Concept Release) and subsequent discussions with the Staff, we have, solely for purposes of calculating the composition of our portfolio pursuant to Section 55(a) of the Investment Company Act, identified such entities, which include the SSLP, as "non-qualifying assets" should the Staff ultimately disagree with our position.
As of December 31, 2014, our portfolio company, IHAM, an SEC registered investment adviser, managed 13 vehicles and served as the sub-manager/sub-servicer for three other vehicles (these vehicles managed or sub-managed/sub-serviced by IHAM are collectively referred to as the "IHAM Vehicles"). As of December 31, 2014, IHAM had assets under management ("IHAM AUM")(2) of approximately $2.7 billion. As of December 31, 2014, Ares Capital had invested approximately $171.0 million (at amortized cost) in IHAM. In connection with IHAM's registration as a registered investment adviser, on March 30, 2012, we received exemptive relief from the SEC allowing us to, subject to certain conditions, own directly or indirectly up to 100% of IHAM's outstanding equity interests and make additional investments in IHAM. From time to time, IHAM or certain IHAM Vehicles may purchase investments from us or sell investments to us, in each case for a price equal to the fair market value of such investments determined at the time of such transactions. See Note 4 to our consolidated financial statements for the year ended December 31, 2014 for more information about IHAM.
- (2)
- IHAM AUM refers to the assets of the vehicles managed, sub-managed and sub-serviced by IHAM. It includes drawn and undrawn amounts, including amounts that are subject to certain restrictions. IHAM AUM amounts are as of December 31, 2014 and are unaudited. Certain amounts are preliminary and remain subject to change, and differences may arise due to rounding.
3
Ares Management, L.P.
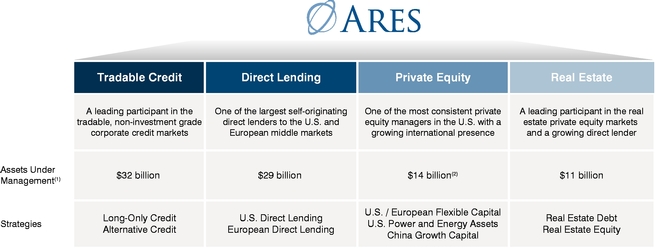
Ares is a publicly traded, leading global alternative asset manager with approximately $86 billion of AUM as of December 31, 2014. As of December 31, 2014, Ares had over 750 employees in over 15 principal and originating offices across the United States, Europe and Asia. Since its inception in 1997, Ares has adhered to a disciplined investment philosophy that focuses on delivering strong risk-adjusted investment returns throughout market cycles. Ares believes each of its four distinct but complementary investment groups in Tradable Credit, Direct Lending, Private Equity and Real Estate is a market leader based on AUM and investment performance. Ares was built upon the fundamental principle that each group benefits from being part of the greater whole.
The following chart shows the structure and various investment strategies of Ares as of December 31, 2014:
- (1)
- Ares Management is the parent to several registered investment advisers, including Ares Capital Management. AUM
refers to the assets of the funds, alternative asset companies and other entities and accounts that are managed or co-managed by Ares, including funds managed by IHAM. For Ares funds other than CLOs,
AUM represents the sum of the net asset value of such funds, the drawn and undrawn debt (at the fund-level including amounts subject to restrictions) and uncalled committed capital (including
commitments to funds that have yet to commence their investment periods). For Ares funds that are CLOs, AUM represents subordinated notes (equity) plus all drawn and undrawn debt tranches. AUM amounts
are as of December 31, 2014 and pro forma for Ares' acquisition of EIF, which closed on January 1, 2015.
- (2)
- Includes approximately $4 billion of AUM as of December 31, 2014 from Ares' acquisition of EIF on January 1, 2015.
Ares Capital Management LLC
Ares Capital Management, our investment adviser, is served by an origination, investment and portfolio management team of over 90 U.S.-based investment professionals as of December 31, 2014 and led by the senior partners of the Ares Direct Lending Group: Michael Arougheti, Kipp deVeer, Mitchell Goldstein and Michael Smith. Ares Capital Management leverages off of Ares' investment platform and benefits from the significant capital markets, trading and research expertise of Ares' investment professionals. Ares Capital Management's investment committee has 12 members, including the senior partners and U.S.-based partners of the Ares Direct Lending Group, senior partners in the Ares Private Equity Group and a senior partner in the Ares Tradable Credit Group.
4
MARKET OPPORTUNITY
We believe that current market conditions present attractive opportunities for us to invest in middle-market companies, specifically:
- •
- We believe that many commercial and investment banks have, in recent years, de-emphasized their service and product offerings to
middle-market businesses in favor of lending to large corporate clients and managing capital markets transactions. In addition, these lenders may be constrained in their ability to underwrite and hold
bank loans and high yield securities for middle-market issuers as they seek to meet existing and future regulatory capital requirements. These factors may result in opportunities for alternative
funding sources to middle-market companies and therefore more new-issue market opportunities for us.
- •
- We believe that the disruption and volatility in the credit markets between 2008 and 2009 reduced capital available to certain
specialty finance companies and other capital providers, causing a reduction in competition. These market conditions may continue to create opportunities to achieve attractive risk-adjusted returns.
- •
- We believe that there is a lack of market participants that are willing to hold meaningful amounts of certain middle-market loans. As
a result, we believe our ability to minimize syndication risk for a company seeking financing by being able to hold our loans without having to syndicate them is a competitive advantage.
- •
- We believe that middle-market companies have faced difficulty in raising debt through the capital markets. This approach to financing
may become more difficult to the extent institutional investors seek to invest in larger, more liquid offerings, leaving less competition and fewer financing alternatives for middle-market companies.
- •
- We believe there is a large pool of un-invested private equity capital for middle-market businesses. We expect private equity firms will seek to leverage their investments by combining equity capital with senior secured loans and mezzanine debt from other sources such as us.
COMPETITIVE ADVANTAGES
We believe that we have the following competitive advantages over other capital providers to middle-market companies:
The Ares Platform
As of December 31, 2014, Ares had approximately $86 billion of total AUM in the related asset classes of non-syndicated first and second lien senior secured corporate and commercial real estate loans, syndicated corporate and commercial real estate loans, high yield bonds, corporate and commercial real estate mezzanine debt and private equity. We believe Ares' current investment platform provides a competitive advantage in terms of access to origination and marketing activities and diligence for us. In particular, we believe that the Ares platform provides us with an advantage through its deal flow generation and investment evaluation process. Ares' asset management platform also provides additional market information, company knowledge and industry insight that benefit our investment and due diligence process. Ares' professionals maintain extensive financial sponsor and intermediary relationships, which provide valuable insight and access to transactions and information.
Seasoned Management Team
The investment professionals in the Ares Direct Lending Group and members of our investment adviser's investment committee also have significant experience investing across market cycles. This
5
experience also provides us with a competitive advantage in identifying, originating, investing in and managing a portfolio of investments in middle-market companies.
Broad Origination Strategy
We focus on self-originating most of our investments by pursuing a broad array of investment opportunities in middle-market companies, venture capital backed businesses and power generation projects across multiple channels. We also leverage off of the extensive relationships of the broader Ares platform, including relationships with the portfolio companies in the IHAM Vehicles, to identify investment opportunities. We believe that this allows for asset selectivity and that there is a significant relationship between proprietary deal origination and credit performance. We believe that our focus on generating proprietary deal flow and lead investing also gives us greater control over capital structure, deal terms, pricing and documentation and enables us to actively manage our portfolio investments. Moreover, by leading the investment process, we are often able to secure controlling positions in credit tranches, thereby providing additional control in investment outcomes. We also have originated substantial proprietary deal flow from middle-market intermediaries, which often allows us to act as the sole or principal source of institutional capital to the borrower.
Scale and Flexible Transaction Structuring
We believe that being one of the largest BDC's makes us a more desirable and flexible capital provider, especially in competitive markets. We are flexible with the types of investments we make and the terms associated with those investments. We believe this approach and experience enables our investment adviser to identify attractive investment opportunities throughout economic cycles and across a company's capital structure so we can make investments consistent with our stated investment objective and preserve principal while seeking appropriate risk adjusted returns. In addition, we have the flexibility to provide "one stop" financing with the ability to invest capital across the balance sheet and syndicate and hold larger investments than many of our competitors. We believe that the ability to underwrite, syndicate and hold larger investments benefits our stockholders by (a) potentially increasing net income and earnings through syndication, (b) increasing originated deal flow flexibility, (c) broadening market relationships and deal flow, (d) allowing us to optimize our portfolio composition and (e) allowing us to provide capital to a broader spectrum of middle-market companies, which we believe currently have limited access to capital from traditional lending sources. In addition, we believe that the ability to provide capital at every level of the balance sheet provides a strong value proposition to middle-market borrowers and our senior debt capabilities provide superior deal origination and relative value analysis capabilities compared to traditional "mezzanine only" lenders.
Experience with and Focus on Middle-Market Companies
Ares has historically focused on investments in middle-market companies and we benefit from this experience. In sourcing and analyzing deals, our investment adviser benefits from Ares' extensive network of relationships focused on middle-market companies, including management teams, members of the investment banking community, private equity groups and other investment firms with whom Ares has had long-term relationships. We believe this network enables us to identify well-positioned prospective portfolio company investments. The Ares Direct Lending Group works closely with Ares' other investment professionals. As of December 31, 2014, Ares oversaw a portfolio of investments in over 1,000 companies, over 385 structured assets and over 185 properties across over 30 industries, which provides access to an extensive network of relationships and insights into industry trends and the state of the capital markets.
6
Disciplined Investment Philosophy
In making its investment decisions, our investment adviser has adopted Ares' long-standing, consistent, credit-based investment approach that was developed over 17 years ago by its founders. Specifically, our investment adviser's investment philosophy, portfolio construction and portfolio management involve an assessment of the overall macroeconomic environment and financial markets and company-specific research and analysis. Its investment approach emphasizes capital preservation, low volatility and minimization of downside risk. In addition to engaging in extensive due diligence from the perspective of a long-term investor, our investment adviser's approach seeks to reduce risk in investments by focusing on:
- •
- businesses with strong franchises and sustainable competitive advantages;
- •
- industries with positive long-term dynamics;
- •
- businesses and industries with cash flows that are dependable and predictable;
- •
- management teams with demonstrated track records and appropriate economic incentives;
- •
- rates of return commensurate with the perceived risks;
- •
- securities or investments that are structured with appropriate terms and covenants; and
- •
- businesses backed by experienced private equity sponsors.
Extensive Industry Focus
We seek to concentrate our investing activities in industries with a history of predictable and dependable cash flows and in which the Ares investment professionals have had extensive investment experience. Ares investment professionals have developed long-term relationships with management teams and management consultants in over 30 industries, and have accumulated substantial information and identified potential trends within these industries. In turn, we benefit from these relationships, information and identification of potential trends in making investments.
OPERATING AND REGULATORY STRUCTURE
Our investment activities are managed by our investment adviser, Ares Capital Management, which is a subsidiary of Ares, and supervised by our board of directors, a majority of whom are independent of Ares and its affiliates. Ares Capital Management is registered under the Investment Advisers Act of 1940, or the "Advisers Act." Under our Amended and Restated Investment Advisory and Management Agreement with Ares Capital Management, referred to herein as our "investment advisory and management agreement," we have agreed to pay Ares Capital Management base management fees based on our total assets, as defined under the Investment Company Act (other than cash and cash equivalents, but including assets purchased with borrowed funds) ("base management fees"), fees based on our net investment income ("income based fees") and fees based on our net capital gains ("capital gains incentive fees"). See "Investment Advisory and Management Agreement." Ares Operations provides us with certain administrative and other services necessary for us to operate pursuant to an Amended and Restated Administration Agreement, referred to herein as our "administration agreement." See "Administration Agreement."
As a BDC, we are required to comply with certain regulatory requirements. For example, we are not generally permitted to invest in any portfolio company in which a fund managed by Ares or any of its downstream affiliates (other than us and our downstream affiliates) currently has an investment. However, we may co-invest with funds managed by Ares or any of its downstream affiliates, subject to compliance with existing regulatory guidance, applicable regulations and our allocation procedures. Certain types of co-investment transactions would only be permitted pursuant to an exemptive order
7
from the SEC, for which we have applied. Any such order will be subject to certain terms and conditions. Further there is no assurance that this application for exemptive relief will be granted by the SEC.
Also, while we may borrow funds to make investments, our ability to use debt is limited in certain significant aspects. In particular, BDC's must have at least 200% asset coverage calculated pursuant to the Investment Company Act in order to incur debt or issue preferred stock (which we refer to collectively as "senior securities"), which requires us to finance our investments with at least as much equity as senior securities in the aggregate. Certain of our credit facilities also require that we maintain asset coverage of at least 200%.
In addition, as a consequence of our being a regulated investment company ("RIC") under the Internal Revenue Code of 1986, as amended (the "Code") for U.S. federal income tax purposes, our asset growth is dependent on our ability to raise equity capital through the issuance of common stock. RICs generally must distribute substantially all of their investment company taxable income (as defined under the Code) to stockholders as dividends in order to preserve their status as a RIC and not to be subject to additional U.S. Federal corporate-level taxes. This requirement, in turn, generally prevents us from using our earnings to support our operations, including making new investments.
MARKET CONDITIONS
From time to time, capital markets may experience periods of disruption and instability. For example, between 2008 and 2009, the global financial markets experienced stress, volatility, instability, illiquidity and disruption, and as a result, during this time the availability of capital and access to capital markets was limited. While market conditions have experienced relative stability in recent years, there have been continuing periods of volatility and there can be no assurances that adverse market conditions will not repeat themselves in the future. If they do, we could face difficulty raising new capital on attractive terms. Consequently, our operating strategy could be materially and adversely affected. As the global liquidity situation and market conditions evolve, we will continue to monitor and adjust our approach to funding accordingly. See "Risk Factors—Risks Relating to Our Business—The capital markets may experience periods of disruption and instability. Such market conditions may materially and adversely affect debt and equity capital markets in the United States, which may have a negative impact on our business and operations."
In connection with the prior depressed market conditions of the general economy during the period between 2008 and 2009, the stocks of BDCs as an industry traded at near historic lows as a result of concerns over liquidity, credit quality, leverage restrictions and distribution requirements. In some cases, certain BDCs became "forced sellers" of assets, defaulted on their indebtedness, decreased their distributions to stockholders or announced share repurchase programs. Although we believe that we currently have sufficient capital to fund our investments and operations, if such adverse market conditions repeat themselves, we cannot assure you that the market pressures we may face in the future will not have a material adverse effect on our business, financial condition and results of operations.
INVESTMENTS
Ares Capital Corporation Portfolio
We have built an investment portfolio of primarily first and second lien senior secured loans, mezzanine debt and, to a lesser extent, equity investments in private middle-market companies. Our portfolio is well diversified by industry sector and its concentration to any single issuer is limited. Our largest investment as of December 31, 2014 was in the subordinated certificates of the SSLP. The SSLP consists of a diverse portfolio of first lien senior secured loans to 50 different borrowers as of December 31, 2014 and the portfolio companies in the SSLP are in industries similar to the companies
8
in Ares Capital's portfolio. Our investment in the SSLP represented approximately 23% of our portfolio fair value as of December 31, 2014.
Our debt investments in corporate borrowers generally range between $30 million and $500 million each, investments in project finance/power generation projects generally range between $10 million and $200 million each and investments in early-stage and/or venture capital-backed companies generally range between $1 million and $25 million each. However, the sizes of our investments may be more or less than these ranges and may vary based on, among other things, our capital availability, the composition of our portfolio and general micro- and macro-economic factors.
Our preferred and/or common equity investments have generally been non-control equity investments of less than $20 million (usually in conjunction with a concurrent debt investment). However, we may increase the size or change the nature of these investments.
In addition, the proportion of these types of investments will change over time given our views on, among other things, the economic and credit environment in which we are operating. In connection with our investing activities, we may make commitments with respect to indebtedness or securities of a potential portfolio company substantially in excess of our expected final hold size. In such situations, while we may initially agree to fund up to a certain dollar amount of an investment, we may subsequently syndicate a portion of such amount such that we are left with a smaller investment than what was reflected in our original commitment. We may also syndicate a "first out" tranche of a loan to an investor and retain a "last out" tranche of such loan, in which case the "first out" tranche of such loan will generally receive priority with respect to payments of principal, interest and any other amounts due thereunder. In addition to originating investments, we may also acquire investments in the secondary market (including purchases of a portfolio of investments).
We make senior secured loans primarily in the form of first lien loans (including unitranche loans) and second lien loans. Our senior secured loans generally have terms of three to 10 years. In connection with our senior secured loans we generally receive a security interest in certain of the assets of the borrower and consequently such assets serve as collateral in support of the repayment of such senior secured loans. Senior secured loans are generally exposed to the least amount of credit risk because they typically hold a senior position with respect to scheduled interest and principal payments and security interests in assets of the borrower. However, unlike mezzanine debt, senior secured loans typically do not receive any stock, warrants to purchase stock or other yield enhancements. Senior secured loans may include both revolving lines of credit and term loans.
Structurally, mezzanine debt usually ranks subordinate in priority of payment to senior secured loans and is often unsecured. However, mezzanine debt ranks senior to preferred and common equity in a borrower's capital structure. Mezzanine debt investments generally offer lenders fixed returns in the form of interest payments and will often provide lenders an opportunity to participate in the capital appreciation of a borrower, if any, through an equity interest. This equity interest typically takes the form of an equity co-investment and/or warrants. Due to its higher risk profile and often less restrictive covenants as compared to senior secured loans, mezzanine debt generally bears a higher stated interest rate than senior secured loans. The equity co-investment and warrants (if any) associated with a mezzanine debt investment typically allow lenders to receive repayment of their principal on an agreed amortization schedule while retaining their equity interest in the borrower. Equity issued in connection with mezzanine debt also may include a "put" feature, which permits the holder to sell its equity interest back to the borrower at a price determined through an agreed formula.
In making an equity investment, in addition to considering the factors discussed below under "—Investment Selection," we also consider the anticipated timing of a liquidity event, such as a public offering, sale of the company or redemption of our equity securities.
9
We generally seek to invest in companies in the industries in which Ares' investment professionals have direct expertise. The following is a representative list of the industries in which we have invested:
- •
- Aerospace and Defense
- •
- Automotive Services
- •
- Business Services
- •
- Consumer Products
- •
- Containers and Packaging
- •
- Education
- •
- Environmental Services
- •
- Financial Services
- •
- Food and Beverage
- •
- Healthcare Services
- •
- Investment Funds and Vehicles
- •
- Manufacturing
- •
- Oil and Gas
- •
- Other Services
- •
- Power Generation
- •
- Restaurant and Food Services
- •
- Retail
- •
- Telecommunications
However, we may invest in other industries if we are presented with attractive opportunities.
The industrial and geographic compositions of our portfolio at fair value as of December 31, 2014 and 2013 were as follows:
| |
As of December 31, |
||||||
|---|---|---|---|---|---|---|---|
| |
2014 | 2013 | |||||
Industry |
|||||||
Investment Funds and Vehicles(1) |
23.3 | % | 23.6 | % | |||
Healthcare Services |
16.3 | 16.2 | |||||
Other Services |
8.8 | 7.2 | |||||
Consumer Products |
8.3 | 3.5 | |||||
Power Generation |
7.3 | 5.4 | |||||
Business Services |
5.8 | 9.9 | |||||
Education |
5.0 | 5.9 | |||||
Financial Services |
4.5 | 5.1 | |||||
Restaurants and Food Services |
3.7 | 5.2 | |||||
Manufacturing |
3.3 | 3.3 | |||||
Containers and Packaging |
2.8 | 3.3 | |||||
Oil and Gas |
1.9 | 0.6 | |||||
Retail |
1.4 | 1.6 | |||||
Aerospace and Defense |
1.4 | 1.3 | |||||
Commercial Real Estate Finance |
1.2 | 0.6 | |||||
Other |
5.0 | 7.3 | |||||
| | | | | | | | |
Total |
100.0 | % | 100.0 | % | |||
| | | | | | | | |
| | | | | | | | |
| | | | | | | | |
- (1)
- Includes our investment in the SSLP, which had made first lien senior secured loans to 50 and 47 different borrowers as of December 31, 2014 and 2013, respectively. The portfolio companies in the SSLP are in industries similar to the companies in our portfolio.
10
| |
As of December 31, |
||||||
|---|---|---|---|---|---|---|---|
| |
2014 | 2013 | |||||
Geographic Region |
|||||||
West(1) |
46.2 | % | 50.0 | % | |||
Midwest |
18.1 | 15.8 | |||||
Southeast |
16.6 | 13.6 | |||||
Mid Atlantic |
15.4 | 15.9 | |||||
Northeast |
2.3 | 1.0 | |||||
International |
1.4 | 3.7 | |||||
| | | | | | | | |
Total |
100.0 | % | 100.0 | % | |||
| | | | | | | | |
| | | | | | | | |
| | | | | | | | |
- (1)
- Includes our investment in the SSLP, which represented 22.9% and 23.2% of the total investment portfolio at fair value as of December 31, 2014 and 2013, respectively.
Since our initial public offering on October 8, 2004 through December 31, 2014, our exited investments resulted in an aggregate cash flow realized internal rate of return (as discussed in more detail in footnote 1 to the table below) to us of approximately 13% (based on original cash invested, net of syndications, of approximately $9.9 billion and total proceeds from such exited investments of approximately $12.1 billion). Approximately 71% of these exited investments resulted in an aggregate cash flow realized internal rate of return to us of 10% or greater.
The aggregate cash flow realized internal rate of return, original cash invested, net of syndications, and total proceeds, in each case from exited investments, are listed below from our initial public offering on October 8, 2004 through the end of each period shown below.
| |
Exited Investments IPO through December 31, | |||||||||||||||||||||||||||||||||
|---|---|---|---|---|---|---|---|---|---|---|---|---|---|---|---|---|---|---|---|---|---|---|---|---|---|---|---|---|---|---|---|---|---|---|
(dollar amounts in millions)
|
2014 | 2013 | 2012 | 2011 | 2010 | 2009 | 2008 | 2007 | 2006 | 2005 | 2004 | |||||||||||||||||||||||
Realized internal rate of return(1) |
13 | % | 13 | % | 13 | % | 14 | % | 15 | % | 14 | % | 19 | % | 21 | % | 26 | % | 41 | % | 17 | % | ||||||||||||
Original cash invested, net of syndications |
$ | 9,883 | $ | 7,717 | $ | 6,817 | $ | 4,638 | $ | 2,696 | $ | 1,220 | $ | 923 | $ | 684 | $ | 424 | $ | 119 | $ | 28 | ||||||||||||
Total proceeds |
$ | 12,121 | $ | 9,445 | $ | 8,264 | $ | 5,627 | $ | 3,256 | $ | 1,405 | $ | 1,104 | $ | 818 | $ | 511 | $ | 140 | $ | 32 | ||||||||||||
- (1)
- Internal rate of return is the discount rate that makes the net present value of all cash flows related to a particular investment equal to zero. Internal rate of return is gross of expenses related to investments as these expenses are not allocable to specific investments. Investments are considered to be exited when the original investment objective has been achieved through the receipt of cash and/or non-cash consideration upon the repayment of a debt investment or sale of an investment or through the determination that no further consideration was collectible and, thus, a loss may have been realized.
Additionally, since our initial public offering on October 8, 2004 through December 31, 2014, our realized gains exceeded our realized losses by approximately $351 million (excluding a one-time gain on the acquisition of Allied Capital Corporation ("Allied Capital") (the "Allied Acquisition") and realized gains/losses from the extinguishment of debt and other assets). For the same time period, our average annualized net realized gain rate was approximately 1.1% (excluding a one-time gain on the Allied Acquisition and realized gains/losses from the extinguishment of debt and from other assets). Net realized gain/loss rates for a particular period are the amount of net realized gains/losses during such period divided by the average quarterly investments at amortized cost in such period.
Information included herein regarding internal rates of return, realized gains and losses and annualized net realized gain rates are historical results relating to our past performance and are not necessarily indicative of future results, the achievement of which cannot be assured.
11
INVESTMENT SELECTION
Ares' investment philosophy was developed over 17 years ago and has remained consistent and relevant throughout a number of economic cycles. We are managed using a similar investment philosophy used by the investment professionals of Ares in respect of its other investment funds.
This investment philosophy involves, among other things:
- •
- an assessment of the overall macroeconomic environment and financial markets and how such assessment may impact industry and asset
selection;
- •
- company-specific research and analysis; and
- •
- with respect to each individual company, an emphasis on capital preservation, low volatility and minimization of downside risk.
The foundation of Ares' investment philosophy is intensive credit investment analysis, a portfolio management discipline based on both market technicals and fundamental value-oriented research, and diversification strategy. We follow a rigorous investment process based on:
- •
- a comprehensive analysis of issuer creditworthiness, including a quantitative and qualitative assessment of the issuer's business;
- •
- an evaluation of management and its economic incentives;
- •
- an analysis of business strategy and industry trends; and
- •
- an in-depth examination of capital structure, financial results and projections.
We seek to identify those companies exhibiting superior fundamental risk-reward profiles and strong defensible business franchises while focusing on the relative value of the investment across the industry as well as for the specific company.
Intensive Due Diligence
The process through which an investment decision is made involves extensive research into the target company, its industry, its growth prospects and its ability to withstand adverse conditions. If the senior investment professional responsible for the potential transaction determines that an investment opportunity should be pursued, we will engage in an intensive due diligence process. Approximately 30-40% of the investments initially reviewed by us proceed to this phase. Though each transaction will involve a somewhat different approach, the regular due diligence steps generally undertaken include:
- •
- meeting with the target company's management team to get a detailed review of the business, and to probe for potential weaknesses in
business prospects;
- •
- checking management's backgrounds and references;
- •
- performing a detailed review of historical financial performance, including performance through various economic cycles, and the
quality of earnings;
- •
- reviewing both short and long term projections of the business, and sensitizing them for both upside and downside risk;
- •
- visiting headquarters and company operations and meeting with top and middle-level executives;
- •
- contacting customers and vendors to assess both business prospects and standard practices;
- •
- conducting a competitive analysis, and comparing the issuer to its main competitors on an operating, financial, market share and valuation basis;
12
- •
- researching the industry for historic growth trends and future prospects as well as to identify future exit alternatives (including
available Wall Street research, industry association literature and general news);
- •
- assessing asset value and the ability of physical infrastructure and information systems to handle anticipated growth; and
- •
- investigating legal risks and financial and accounting systems.
Selective Investment Process
After an investment has been identified and preliminary diligence has been completed, a credit research and analysis report is prepared. This report is reviewed by the senior investment professional in charge of the potential investment. If such senior and other investment professionals are in favor of the potential investment, then it is first presented to an underwriting committee, which is comprised of senior members of the Ares Direct Lending Group.
After the investment is approved by the underwriting committee, a more extensive due diligence process is employed by the transaction team. Additional due diligence with respect to any investment may be conducted on our behalf by attorneys, independent accountants, and other third party consultants and research firms prior to the closing of the investment, as appropriate on a case-by-case basis. Approximately 7-10% of all investments initially reviewed by us will be presented to the investment committee. Approval of an investment for funding requires the approval of the majority of the investment committee of our investment adviser, although unanimous consent is sought.
Issuance of Formal Commitment
Once we have determined that a prospective portfolio company is suitable for investment, we work with the management and/or sponsor of that company and its other capital providers, including senior, junior and equity capital providers, if any, to finalize the structure of the investment. Approximately 5-7% of the investments initially reviewed by us eventually result in the issuance of formal commitments and the closing of such transactions.
Debt Investments
We invest in portfolio companies primarily in the form of first lien senior secured loans (including unitranche loans), second lien senior secured loans and mezzanine debt. The first and second lien senior secured loans generally have terms of three to 10 years. In connection with our first and second lien senior secured loans we generally receive security interests in certain assets of our portfolio companies that could serve as collateral in support of the repayment of such loans. First and second lien senior secured loans generally have floating interest rates, which may have LIBOR floors, and also may provide for some amortization of principal and excess cash flow payments, with the remaining principal balance due at maturity.
We structure our mezzanine investments primarily as unsecured subordinated loans that provide for relatively higher fixed interest rates. The mezzanine debt investments generally have terms of up to 10 years. These loans typically have interest-only payments, with amortization of principal, if any, deferred to the later years of the mezzanine investment. In some cases, we may enter into loans that, by their terms, convert into equity or additional debt or defer payments of interest (or at least cash interest) for the first few years after our investment. Also, in some cases our mezzanine debt will be secured by a subordinated lien on some or all of the assets of the borrower.
In some cases, our debt investments may provide for a portion of the interest payable to be payment-in-kind ("PIK") interest. To the extent interest is PIK, it will be payable through the increase
13
of the principal amount of the loan by the amount of interest due on the then-outstanding aggregate principal amount of such loan.
In the case of our first and second lien senior secured loans and mezzanine debt, we tailor the terms of the investment to the facts and circumstances of the transaction and the prospective portfolio company, negotiating a structure that aims to protect our rights and manage our risk while creating incentives for the portfolio company to achieve its business plan and improve its profitability. For example, in addition to seeking a senior position in the capital structure of our portfolio companies, we will seek, where appropriate, to limit the downside potential of our investments by:
- •
- targeting a total return on our investments (including both interest and potential equity appreciation) that compensates us for credit
risk;
- •
- incorporating "put" rights, call protection and LIBOR floors for floating rate loans, into the investment structure; and
- •
- negotiating covenants in connection with our investments that afford our portfolio companies as much flexibility in managing their businesses as possible, consistent with preservation of our capital. Such restrictions may include affirmative and negative covenants, default penalties, lien protection, change of control provisions and board rights, including either observation or participation rights.
We generally require financial covenants and terms that require an issuer to reduce leverage, thereby enhancing credit quality. These methods include: (a) maintenance leverage covenants requiring a decreasing ratio of indebtedness to cash flow over time, (b) maintenance cash flow covenants requiring an increasing ratio of cash flow to the sum of interest expense and capital expenditures and (c) indebtedness incurrence prohibitions, limiting a company's ability to take on additional indebtedness. In addition, by including limitations on asset sales and capital expenditures we may be able to prevent a borrower from changing the nature of its business or capitalization without our consent.
Our debt investments may include equity features, such as warrants or options to buy a minority interest in the portfolio company. Warrants we receive with our debt investments may require only a nominal cost to exercise, and thus, as a portfolio company appreciates in value, we may achieve additional investment return from this equity interest. We may structure the warrants to provide provisions protecting our rights as a minority-interest holder, as well as puts, or rights to sell such securities back to the portfolio company, upon the occurrence of specified events. In many cases, we also obtain registration rights in connection with these equity interests, which may include demand and "piggyback" registration rights.
Equity Investments
To a lesser extent, we also make preferred and/or common equity investments, which have generally been non-control equity investments of less than $20 million (usually in conjunction with a concurrent debt investment). However, we may increase the size or change the nature of these investments.
ON-GOING RELATIONSHIPS WITH AND MONITORING OF PORTFOLIO COMPANIES
We closely monitor each investment we make, maintain a regular dialogue with both the management team and other stakeholders and seek specifically tailored financial reporting. In addition, senior investment professionals may take board seats or obtain board observation rights in connection with our portfolio companies. As of December 31, 2014, of our 205 portfolio companies, we were entitled to board seats or board observation rights on 39% of these companies and these companies represented approximately 64% of our portfolio at fair value.
14
We seek to exert significant influence post-investment, in addition to covenants and other contractual rights and through board participation, when appropriate, by actively working with management on strategic initiatives. We often introduce managers of companies in which we have invested to other portfolio companies to capitalize on complementary business activities and best practices.
Our investment adviser employs an investment rating system to categorize our investments. In addition to various risk management and monitoring tools, our investment adviser grades the credit risk of all investments on a scale of 1 to 4 no less frequently than quarterly. This system is intended primarily to reflect the underlying risk of a portfolio investment relative to our initial cost basis in respect of such portfolio investment (i.e., at the time of origination or acquisition), although it may also take into account under certain circumstances the performance of the portfolio company's business, the collateral coverage of the investment and other relevant factors. Under this system, investments with a grade of 4 involve the least amount of risk to our initial cost basis. The trends and risk factors for this investment since origination or acquisition are generally favorable, which may include the performance of the portfolio company or a potential exit. Investments graded 3 involve a level of risk to our initial cost basis that is similar to the risk to our initial cost basis at the time of origination or acquisition. This portfolio company is generally performing as expected and the risk factors to our ability to ultimately recoup the cost of our investment are neutral to favorable. All investments or acquired investments in new portfolio companies are initially assessed a grade of 3. Investments graded 2 indicate that the risk to our ability to recoup the initial cost basis of such investment has increased materially since origination or acquisition, including as a result of factors such as declining performance and non-compliance with debt covenants; however, payments are generally not more than 120 days past due. An investment grade of 1 indicates that the risk to our ability to recoup the initial cost basis of such investment has substantially increased since origination or acquisition, and the portfolio company likely has materially declining performance. For debt investments with an investment grade of 1, most or all of the debt covenants are out of compliance and payments are substantially delinquent. For investments graded 1, it is anticipated that we will not recoup our initial cost basis and may realize a substantial loss of our initial cost basis upon exit. For investments graded 1 or 2, our investment adviser enhances its level of scrutiny over the monitoring of such portfolio company. The grade of a portfolio investment may be reduced or increased over time.
As of December 31, 2014, the weighted average grade of our portfolio at fair value was 3.0. For more information, see "Management's Discussion and Analysis of Financial Condition and Results of Operations—Portfolio and Investment Activity."
MANAGERIAL ASSISTANCE
As a BDC, we must offer, and must provide upon request, significant managerial assistance to certain of our portfolio companies. This assistance could involve, among other things, monitoring the operations of our portfolio companies, participating in board and management meetings, consulting with and advising officers of portfolio companies and providing other organizational and financial guidance. Ares Operations may provide all or a portion of this assistance pursuant to our administration agreement, the costs of which will be reimbursed by us. We may receive fees for these services.
COMPETITION
Our primary competitors include public and private funds, commercial and investment banks, commercial finance companies, other BDCs and private equity funds, each of which we compete with for financing opportunities. Many of our competitors are substantially larger and have considerably greater financial and marketing resources than we do. For example, some competitors may have access to funding sources that are not available to us. In addition, some of our competitors may have higher
15
risk tolerances or different risk assessments, which could allow them to consider more investments and establish more relationships than we do. Furthermore, many of our competitors are not subject to the regulatory restrictions that the Investment Company Act imposes on us as a BDC. For additional information concerning the competitive risks we face, see "Risk Factors—Risks Relating to Our Business—We operate in a highly competitive market for investment opportunities".
We believe that the relationships of the members of our investment adviser's investment committee and of the senior partners of Ares enable us to learn about, and compete effectively for, financing opportunities with attractive middle-market companies in the industries in which we seek to invest. We believe that Ares' professionals' deep and long-standing direct sponsor relationships and the resulting proprietary transaction opportunities that these relationships often present, provide valuable insight and access to transactions and information. We use the industry information of Ares' investment professionals to which we have access to assess investment risks and determine appropriate pricing for our investments in portfolio companies.
STAFFING
We do not currently have any employees and do not expect to have any employees. Services necessary for our business are provided by individuals who are employees or affiliates of our investment adviser, Ares Capital Management, and our administrator, Ares Operations, each of which is a subsidiary of Ares Management, pursuant to the terms of our investment advisory and management agreement and our administration agreement, respectively, each as described below. Each of our executive officers is an employee or affiliate of our investment adviser or our administrator. Our day-to-day investment activities are managed by our investment adviser. Most of the services necessary for the origination of our investment portfolio are provided by investment professionals employed by Ares Capital Management. Ares Capital Management had over 90 U.S.-based investment professionals as of December 31, 2014 who focus on origination, transaction development, investment and the ongoing monitoring of our investments. See "Investment Advisory and Management Agreement" below. We reimburse both our investment adviser and our administrator for a certain portion of expenses incurred in connection with such staffing, as described in more detail below. Because we have no employees, Ares Capital does not have a formal employee relations policy.
INVESTMENT ADVISORY AND MANAGEMENT AGREEMENT
Management Services
Ares Capital Management serves as our investment adviser and is registered as an investment adviser under the Advisers Act. Subject to the overall supervision of our board of directors, our investment adviser manages the day-to-day operations of, and provides investment advisory and management services to, Ares Capital. Under the terms of the investment advisory and management agreement, our investment adviser:
- •
- determines the composition of our portfolio, the nature and timing of the changes to our portfolio and the manner of implementing such
changes;
- •
- identifies, evaluates and negotiates the structure of the investments we make (including performing due diligence on our prospective
portfolio companies);
- •
- closes and monitors the investments we make;
- •
- determines the investments and other assets that we purchase, retain or sell; and
- •
- provides us with such other investment advisory and research and related services as we may from time to time reasonably require.
16
Ares Capital Management's services to us under the investment advisory and management agreement are not exclusive, and it is free to furnish similar services to other entities. Similarly, affiliates of our investment adviser may directly or indirectly manage funds or other investment vehicles with investment objectives similar to ours. Accordingly, we may compete with these Ares funds or other investment vehicles managed by our investment adviser and its affiliates for capital and investment opportunities. Ares Capital Management endeavors to allocate investment opportunities in a fair and equitable manner, and in any event consistent with any fiduciary duties owed to Ares Capital. Nevertheless, it is possible that we may not be given the opportunity to participate in certain investments made by investment funds or other investment vehicles managed by Ares Capital Management or its affiliates.
Base Management Fee
Pursuant to the investment advisory and management agreement and subject to the overall supervision of our board of directors, our investment adviser provides investment advisory and management services to us. For providing these services, our investment adviser receives fees from us consisting of a base management fee, an income based fee and a capital gains incentive fee.
The base management fee is calculated at an annual rate of 1.5% based on the average value of our total assets (other than cash or cash equivalents but including assets purchased with borrowed funds) at the end of the two most recently completed calendar quarters. The base management fee is payable quarterly in arrears.
Income Based Fee
The income based fee is calculated and payable quarterly in arrears based on our net investment income excluding income based fees and capital gains incentive fees ("pre-incentive fee net investment income") for the quarter. Pre-incentive fee net investment income means interest income, dividend income and any other income (including any other fees such as commitment, origination, structuring, diligence and consulting fees or other fees that we receive from portfolio companies but excluding fees for providing managerial assistance) accrued during the calendar quarter, minus operating expenses for the quarter (including the base management fee, any expenses payable under the administration agreement, and any interest expense and dividends paid on any outstanding preferred stock, but excluding the income based fee and capital gains incentive fee accrued under U.S. generally accepted accounting principles ("GAAP")). Pre-incentive fee net investment income includes, in the case of investments with a deferred interest feature such as market discount, debt instruments with PIK interest, preferred stock with PIK dividends and zero coupon securities, accrued income that we have not yet received in cash. Our investment adviser is not under any obligation to reimburse us for any part of the income based fees it received that was based on accrued interest that we never actually received. See "Risk Factors—Risks Relating to Our Business—There are significant potential conflicts of interest that could impact our investment returns" and "Risk Factors—Risks Relating to Our Business—We may be obligated to pay our investment adviser certain fees even if we incur a loss."
Pre-incentive fee net investment income does not include any realized capital gains, realized capital losses, unrealized capital appreciation, unrealized capital depreciation or income tax expense related to realized gains and losses. Because of the structure of the income based fee, it is possible that we may pay such fees in a quarter where we incur a loss. For example, if we receive pre-incentive fee net investment income in excess of the hurdle rate (as defined below) for a quarter, we will pay the applicable income based fee even if we have incurred a loss in that quarter due to realized and/or unrealized capital losses.
17
Pre-incentive fee net investment income, expressed as a rate of return on the value of our net assets (defined as total assets less indebtedness and before taking into account any income based fees and capital gains incentive fees payable during the period) at the end of the immediately preceding calendar quarter, is compared to a fixed "hurdle rate" of 1.75% per quarter. If market credit spreads rise, we may be able to invest in debt instruments that provide for a higher return, which may increase our pre-incentive fee net investment income and make it easier for our investment adviser to surpass the fixed hurdle rate and receive and income based fee based on such net investment income. To the extent we have retained pre-incentive fee net investment income that has been used to calculate the income based fee, it is also included in the amount of our total assets (other than cash and cash equivalents but including assets purchased with borrowed funds) used to calculate the 1.5% base management fee.
We pay our investment adviser an income based fee with respect to our pre-incentive fee net investment income in each calendar quarter as follows:
- •
- no income based fee in any calendar quarter in which our pre-incentive fee net investment income does not exceed the hurdle rate;
- •
- 100% of our pre-incentive fee net investment income with respect to that portion of such pre-incentive fee net investment income, if
any, that exceeds the hurdle rate but is less than 2.1875% in any calendar quarter. We refer to this portion of our pre-incentive fee net investment income (which exceeds the hurdle rate but is less
than 2.1875%) as the "catch-up" provision. The "catch-up" is meant to provide our investment adviser with 20% of the pre-incentive fee net investment income as if a hurdle rate did not apply if this
net investment income exceeded 2.1875% in any calendar quarter; and
- •
- 20% of the amount of our pre-incentive fee net investment income, if any, that exceeds 2.1875% in any calendar quarter.
The following is a graphical representation of the calculation of the income based fee:
Quarterly Income Based Fee Based on Net Investment Income
Pre-incentive fee net investment income return
(expressed as a percentage of the value of net assets)
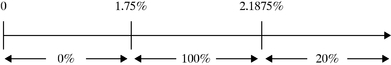
Percentage of pre-incentive fee net investment income
allocated to income based fee
These calculations are adjusted for any share issuances or repurchases during the quarter.
Capital Gains Incentive Fee
The capital gains incentive fee is determined and payable in arrears as of the end of each calendar year (or, upon termination of our investment advisory and management agreement, as of the termination date) and is calculated at the end of each applicable year by subtracting (a) the sum of our cumulative aggregate realized capital losses and aggregate unrealized capital depreciation from (b) our cumulative aggregate realized capital gains, in each case calculated from October 8, 2004, (the date we completed our initial public offering). Realized capital gains and losses include gains and losses on investments and foreign currencies, gains and losses on extinguishment of debt and other assets, as well as any income tax expense related to realized gains and losses. If such amount is positive at the end of
18
such year, then the capital gains incentive fee for such year is equal to 20% of such amount, less the aggregate amount of capital gains incentive fees paid in all prior years. If such amount is negative, then there is no capital gains incentive fee for such year.
The cumulative aggregate realized capital gains are calculated as the sum of the differences, if positive, between (a) the net sales price of each investment in our portfolio when sold and (b) the accreted or amortized cost basis of such investment.
The cumulative aggregate realized capital losses are calculated as the sum of the amounts by which (a) the net sales price of each investment in our portfolio when sold is less than (b) the accreted or amortized cost basis of such investment.
The aggregate unrealized capital depreciation is calculated as the sum of the differences, if negative, between (a) the valuation of each investment in our portfolio as of the applicable capital gains incentive fee calculation date and (b) the accreted or amortized cost basis of such investment.
Notwithstanding the foregoing, as a result of an amendment to the capital gains incentive fee under the investment advisory and management agreement that was adopted on June 6, 2011, if we are required by GAAP to record an investment at its fair value as of the time of acquisition instead of at the actual amount paid for such investment by us (including, for example, as a result of the application of the acquisition method of accounting), then solely for the purposes of calculating the capital gains incentive fee, the "accreted or amortized cost basis" of an investment shall be an amount (the "Contractual Cost Basis") equal to (1) (x) the actual amount paid by us for such investment plus (y) any amounts recorded in our financial statements as required by GAAP that are attributable to the accretion of such investment plus (z) any other adjustments made to the cost basis included in our financial statements, including PIK interest or additional amounts funded (net of repayments) minus (2) any amounts recorded in our financial statements as required by GAAP that are attributable to the amortization of such investment, whether such calculated Contractual Cost Basis is higher or lower than the fair value of such investment (as determined in accordance with GAAP) at the time of acquisition.
We defer cash payment of any income based fee and the capital gains incentive fee otherwise earned by our investment adviser if during the most recent four full calendar quarter period ending on or prior to the date such payment is to be made the sum of (a) the aggregate distributions to our stockholders and (b) the change in net assets (defined as total assets less indebtedness and before taking into account any income based fees or capital gains incentive fees accrued during the period) is less than 7.0% of our net assets (defined as total assets less indebtedness) at the beginning of such period. Any such deferred fees are carried over for payment in subsequent calculation periods to the extent such payment is payable under our investment advisory and management agreement.
Payment of Our Expenses
The services of all investment professionals and staff of our investment adviser, when and to the extent engaged in providing investment advisory and management services to us and routine overhead expenses of such personnel allocable to such services, are provided and paid for by our investment adviser. We bear all other costs and expenses of our operations and transactions, including, but not limited to, those relating to: rent; organization; calculation of our net asset value (including, but not limited to, the cost and expenses of any independent valuation firm); expenses incurred by our investment adviser payable to third parties, including agents, consultants or other advisers, in monitoring our financial and legal affairs and in monitoring our investments (including the cost of consultants hired to develop information technology systems designed to monitor our investments) and performing due diligence on our prospective portfolio companies; interest payable on indebtedness, if any, incurred to finance our investments; offerings of our common stock and other securities; investment advisory and management fees; administration fees; fees payable to third parties, including
19
agents, consultants or other advisers, relating to, or associated with, evaluating and making investments (including payments to third party vendors for financial information services); transfer agent and custodial fees; registration fees; listing fees; taxes; independent directors' fees and expenses; costs of preparing and filing reports or other documents with the SEC; the costs of any reports, proxy statements or other notices to stockholders, including printing costs; to the extent we are covered by any joint insurance policies, our allocable portion of the insurance premiums for such policies; direct costs and expenses of administration, including auditor and legal costs; and all other expenses incurred by us or our administrator in connection with administering our business as described in more detail under "Administration Agreement" below.
Duration, Termination and Amendment
At an in-person meeting of our board of directors on March 16, 2011, the form of our current investment advisory and management agreement, including two proposed amendments to our then existing investment advisory and management agreement, was approved by our board of directors with the recommendation that our stockholders vote to approve the proposed amendments. On June 6, 2011, our stockholders approved the proposed amendments and we entered into a restated investment advisory and management agreement, reflecting such amendments on June 6, 2011. At an in-person meeting of our board of directors on April 30, 2014, our board of directors, including a majority of the directors who are not "interested persons" of the Company as defined in the Investment Company Act, voted to approve the continuation of the investment advisory and management agreement to June 6, 2015. A discussion regarding the basis for our board of directors' approval of the 2011 adoption of the form of our current investment advisory and management agreement is available in our Annual Report on Form 10-K for the fiscal year ended December 31, 2011.
Unless terminated earlier, the investment advisory and management agreement will automatically renew for successive annual periods if approved annually by our board of directors or by the affirmative vote of the holders of a majority of our outstanding voting securities, including, in either case, approval by a majority of our directors who are not "interested persons" of the Company.
In voting to approve the continuation of the investment advisory and management agreement, the independent directors had the opportunity to consult in executive session with counsel to the Company regarding the approval of such agreement. In reaching a decision to approve the continuation of the investment advisory and management agreement, our board of directors reviewed a significant amount of information and considered, among other things:
- (i)
- the
nature, extent and quality of the advisory and other services to be provided to the Company by our investment adviser;
- (ii)
- the
long and short-term investment performance of the Company and our investment adviser;
- (iii)
- the
costs of the services to be provided by our investment adviser (including the base management fee, the income based fee and the capital gains
incentive fee (including hurdle rates) and expense ratios) and comparative data;
- (iv)
- the
limited potential for economies of scale in investment management associated with a larger capital base for investments in first and second lien senior
loans and mezzanine debt and whether such limited economies of scale would benefit our stockholders;
- (v)
- our
investment adviser's estimated pro forma profitability with respect to managing us;
- (vi)
- the
limited potential for additional benefits to be derived by our investment adviser and its affiliates as a result of our relationship with our
investment adviser; and
- (vii)
- various other matters, including the alignment of interests of our stockholders.
20
In voting to approve the continuation of the investment advisory and management agreement, our board of directors, including all of the directors who are not "interested persons," of the Company, made the following conclusions:
- •
- Nature, Extent and Quality of
Services. Our board of directors considered the nature, extent and quality of the investment selection process employed by our
investment adviser, including the flow of transaction opportunities resulting from Ares Capital Management's investment professionals' significant capital markets, trading and research expertise, the
employment of Ares Capital Management's investment philosophy, diligence procedures, credit recommendation process, investment structuring, and ongoing relationships with and monitoring of portfolio
companies, in light of the investment objective of the Company. Our board of directors also considered our investment adviser's personnel and their prior experience in connection with the types of
investments made by us, including such personnel's network of relationships with intermediaries focused on middle-market companies. Our board of directors also considered the benefit and increasing
costs of our investment adviser continuing to be able to recruit and retain top talent. In addition, our board of directors considered the other terms and conditions of the investment advisory and
management agreement. Our board of directors determined that the substantive terms of the investment advisory and management agreement (other than the fees payable thereunder, which our board of
directors reviewed separately), including the services to be provided, are generally the same as those of comparable BDCs described in the available market data and that it would be difficult to
obtain similar services of similar quality on a comparable basis from other third party service providers or through an internally managed structure. In addition, our board of directors considered the
fact that we have the ability to terminate the investment advisory and management agreement without penalty upon 60 days' written notice to our investment adviser. Our board of directors
further determined that our investment adviser is served by a dedicated origination, transaction development and investment team of investment professionals, and that these investment professionals
have historically focused on investments in middle- market companies and have developed an investment evaluation process and an extensive network of relationships with financial sponsors and
intermediaries focused on middle-market companies, which experience and relationships coincide with our investment objective and generally equal or exceed those of the management teams or investment
advisers of other comparable BDCs described in the available market data.
- •
- Investment
Performance. Our board of directors reviewed the long-term and short-term investment performance of the Company and our investment
adviser, as well as comparative data with respect to the long-term and short-term investment performance of other externally managed BDCs and their investment advisers. Our board of directors
determined that our investment adviser was delivering results consistent with the investment objective of the Company and that the Company's investment performance was generally above average when
compared to comparable BDCs. Our board of directors further determined that in light of the performance history of the Company, our investment adviser's extensive experience with our particular
investment objectives and policies and our investment adviser's commitment to the Company, the investment performance of the Company was likely to remain consistent with the approval of the investment
advisory and management agreement.
- •
- Costs of the Services Provided to the Company. Our board of directors considered (i) comparative data based on publicly available information with respect to services rendered and the advisory fees (including the base management fee, the income based fee and the capital gains incentive fee (including hurdle rates)) of other BDCs with similar investment objectives, our operating expenses and expense ratios compared to other BDCs of similar size and with similar investment objectives and (ii) the administrative services that our administrator will provide to us at cost. Based upon its review, our board of directors determined that the fees to
21
- •
- Economies of
Scale. Our board of directors considered information about the potential for our stockholders to experience economies of scale as the
Company grows in size. Our board of directors considered that the direct lending business is one of the least scalable businesses because it requires additional resources as it grows and also
considered that because there are no break points in our investment adviser's fees, any benefits resulting from the growth in the Company's assets where the Company's fixed costs did not increase
proportionately would not inure to the benefit of the stockholders. Taking into account such information, our board of directors determined that the advisory fee structure with respect to the
investment advisory and management agreement was reasonable and that no changes were currently necessary to reflect economies of scale.
- •
- Estimated Pro Forma Profitability of the Investment
Adviser. Our board of directors considered information about our investment adviser's budget and determined that, based on the
information available to our board of directors, our investment adviser's estimated pro forma profitability with respect to managing the Company was generally equal to or less than the profitability
of investment advisers managing comparable BDCs. Our board of directors noted that no market data was available for such advisers and that such determination was based, in particular, on the fact that
the management fee payable to our investment adviser is 1.50% (compared to 2.00% for a number of the Company's competitors) and is not paid on cash or cash equivalents held by the Company (unlike
several of the Company's competitors).
- •
- Limited Potential for Additional Benefits Derived by the Investment
Adviser. Our board of directors considered whether there was potential for additional benefits, such as soft dollar arrangements with
brokers, to be derived by our investment adviser and its affiliates as a result of our relationship with our investment adviser and noted that it believed any such potential was limited.
- •
- Other Matters Considered. Our board of directors considered the interests of senior management and concluded that the judgment and performance of our senior management were not impaired by those interests.
be paid under the investment advisory and management agreement are generally equal to or less than those payable under agreements of comparable BDCs described in the available market data. In addition, after examining market data, information prepared by management and a detailed discussion with management, our board of directors determined that while our total expenses (adjusted for certain non-recurring items and including interest expense and credit facility fees) as a percentage of assets for the year ended December 31, 2013 were slightly above average as compared to those disclosed in market data by comparable externally managed BDCs, our total expenses (adjusted for certain non-recurring items and excluding interest expense and credit facility fees) as a percentage of assets for the year ended December 31, 2013 were similar to or lower than those disclosed by comparable externally managed BDCs. Our board of directors noted that the slightly above average total expenses as a percentage of assets were attributable to increased interest expense as a result of our strategy of decreasing our balance sheet risk by extending debt maturities and refinancing short-term borrowings under floating rate secured debt with long-term fixed rate unsecured debt. Our board of directors further noted that many of our BDC competitors have been unable to access such unsecured debt.
In view of the wide variety of factors that our board of directors considered in connection with its evaluation of the investment advisory and management agreement, it is not practical to quantify, rank or otherwise assign relative weights to the specific factors it considered in reaching its decision. Our board of directors did not undertake to make any specific determination as to whether any particular factor, or any aspect of any particular factor, was favorable or unfavorable to the ultimate
22
determination of our board of directors. Rather, our board of directors based its approval on the totality of information presented to, and the investigation conducted by, it. In considering the factors discussed above, individual directors may have given different weights to different factors.
Based on the information reviewed and the factors discussed above, our directors (including those directors who are not "interested persons" of the Company) concluded that the terms of the investment advisory and management agreement, including the fee rates thereunder, are fair and reasonable in relation to the services provided and approved the continuation of the investment advisory and management agreement with our investment adviser as being in the best interests of the Company and its stockholders.
The investment advisory and management agreement will automatically terminate in the event of its assignment. The investment advisory and management agreement may be terminated by either party without penalty upon 60 days' written notice to the other party.
Conflicts of interest may arise if our investment adviser seeks to change the terms of our investment advisory and management agreement, including, for example, the amount of the base management fee, the income based fee, the capital gains incentive fee or other compensation terms. Material amendments to our investment advisory and management agreement must be approved by the affirmative vote of the holders of a majority of our outstanding voting securities and by a majority of our independent directors, and we may from time to time decide it is appropriate to seek the requisite approval to change the terms of the agreement.
Indemnification
The investment advisory and management agreement provides that, absent willful misfeasance, bad faith or gross negligence in the performance of its duties or by reason of the reckless disregard of its duties and obligations, our investment adviser, its members and their respective officers, managers, partners, agents, employees, controlling persons and members and any other person or entity affiliated with it are entitled to indemnification from us for any damages, liabilities, costs and expenses (including reasonable attorneys' fees and amounts reasonably paid in settlement) arising from the rendering of our investment adviser's services under the investment advisory and management agreement or otherwise as our investment adviser.
Organization of our Investment Adviser
Our investment adviser is a Delaware limited liability company that is registered as an investment adviser under the Advisers Act. The principal executive offices of Ares Capital Management are located at 2000 Avenue of the Stars, 12th Floor, Los Angeles, California 90067.
ADMINISTRATION AGREEMENT
We are also party to an administration agreement, referred to herein as the "administration agreement", with our administrator, Ares Operations. Our board of directors approved the continuation of our administration agreement on April 30, 2014, which extended the term of the agreement until June 1, 2015. Pursuant to the administration agreement, Ares Operations furnishes us with office equipment and clerical, bookkeeping and record keeping services at our office facilities. Under the administration agreement, Ares Operations also performs, or oversees the performance of, our required administrative services, which include, among other things, providing assistance in accounting, legal, compliance, operations, investor relations and technology, being responsible for the financial records that we are required to maintain and preparing reports to our stockholders and reports filed with the SEC. In addition, Ares Operations assists us in determining and publishing our net asset value, assists us in providing managerial assistance to our portfolio companies, oversees the preparation and filing of our tax returns and the printing and dissemination of reports to our stockholders, and generally
23
oversees the payment of our expenses and the performance of administrative and professional services rendered to us by others. Payments under our administration agreement are equal to an amount based upon our allocable portion of Ares Operations' overhead and other expenses (including travel expenses) incurred by Ares Operations in performing its obligations under the administration agreement, including our allocable portion of the compensation of certain of our officers (including our chief compliance officer, chief financial officer, chief accounting officer, general counsel, treasurer and assistant treasurer) and their respective staffs. The administration agreement may be terminated by either party without penalty upon 60 days' written notice to the other party.
Indemnification
The administration agreement provides that, absent willful misfeasance, bad faith or negligence in the performance of its duties or by reason of the reckless disregard of its duties and obligations, Ares Operations, its members and their respective officers, managers, partners, agents, employees, controlling persons and members and any other person or entity affiliated with it are entitled to indemnification from us for any damages, liabilities, costs and expenses (including reasonable attorneys' fees and amounts reasonably paid in settlement) arising from the rendering of Ares Operations' services under the administration agreement or otherwise as our administrator.
LEVERAGE
We may from time to time borrow funds to make investments, a practice known as "leverage," to attempt to increase returns to our stockholders. With certain limited exceptions, we are only allowed to borrow amounts such that our asset coverage, as calculated in accordance with the Investment Company Act, equals at least 200% after such borrowing. The amount of leverage that we employ at any particular time will depend on our investment adviser's and our board of directors' assessments of market and other factors at the time of any proposed borrowing. As of February 20, 2015, we had $3.6 billion of total principal debt outstanding under the various debt instruments described below. See "Risk Factors—Risks Relating to Our Business—We borrow money, which magnifies the potential for gain or loss on amounts invested and may increase the risk of investing with us."
We may from time to time seek to retire or repurchase our common stock through cash purchases, as well as retire, cancel or purchase our outstanding debt through cash purchases and/or exchanges, in open market purchases, privately negotiated transactions or otherwise. Such repurchases or exchanges, if any, will depend on prevailing market conditions, our liquidity requirements, contractual and regulatory restrictions and other factors. The amounts involved may be material.
We are party to a revolving credit facility, which allows us to borrow up to $1.25 billion at any one time outstanding (the "Revolving Credit Facility"). The Revolving Credit Facility also includes an "accordion" feature that allows us, under certain circumstances, to increase the size of the facility to a maximum of $1.8 billion. The Revolving Credit Facility provides for a revolving period until May 18, 2018 and a stated maturity of May 4, 2019. Subject to certain exceptions, the interest rate charged on the Revolving Credit Facility is based on LIBOR plus an applicable spread of 2.00% or a "base rate" (as defined in the agreements governing the Revolving Credit Facility) plus an applicable spread of 1.00%.
Our consolidated subsidiary, Ares Capital CP Funding LLC ("Ares Capital CP"), is party to a revolving funding facility, which allows us to borrow up to $540 million at any one time outstanding (the "Revolving Funding Facility"). The Revolving Funding Facility provides for a feature that allows, under certain circumstances, for an increase in the size of the facility to a maximum of $865 million. The Revolving Funding Facility provides for a reinvestment period until May 14, 2017 and a stated maturity of May 14, 2019. Subject to certain exceptions, the interest rate charged on the Revolving Funding Facility is based on applicable spreads ranging from 2.25% to 2.50% over LIBOR and ranging from 1.25% to 1.50% over "base rate" (as defined in the agreements governing the Revolving Funding
24
Facility) in each case, determined monthly based on the composition of the borrowing base relative to outstanding borrowings under the Revolving Funding Facility.
Our consolidated subsidiary, Ares Capital JB Funding LLC ("ACJB LLC") is party to a revolving funding facility with Sumitomo Mitsui Banking Corporation ("SMBC"), which allows us to borrow up to $400 million at any one time outstanding (the "SMBC Funding Facility" and together with the Revolving Credit Facility and the Revolving Funding Facility, the "Facilities"). The SMBC Funding Facility provides for a reinvestment period until September 14, 2016 and a stated maturity of September 14, 2021. The reinvestment period and the stated maturity date are both subject to two one-year extensions by mutual agreement. Subject to certain exceptions, the interest rate charged on the SMBC Funding Facility is based on one month LIBOR plus an applicable spread of 2.00% or a "base rate" (as defined in the agreements governing the SMBC Funding Facility) plus an applicable spread of 1.00%.
As of February 20, 2015, we had approximately $1.5 billion aggregate principal amount of convertible senior unsecured notes outstanding comprised of $575.0 million aggregate principal amount of convertible senior unsecured notes that mature on February 1, 2016 and bear interest at a rate of 5.75% (the "February 2016 Convertible Notes"), $230.0 million aggregate principal amount of convertible senior unsecured notes that mature on June 1, 2016 and bear interest at a rate of 5.125% (the "June 2016 Convertible Notes"), $162.5 million aggregate principal amount of convertible senior unsecured notes that mature on March 15, 2017 and bear interest at rate of 4.875% (the "2017 Convertible Notes"), $270.0 million aggregate principal amount of convertible senior unsecured notes that mature on January 15, 2018 and bear interest at a rate of 4.75% (the "2018 Convertible Notes"), and $300.0 million aggregate principal amount of convertible senior unsecured notes that mature on January 15, 2019 and bear interest at a rate of 4.375% (the "2019 Convertible Notes", and together with the February 2016 Convertible Notes, the June 2016 Convertible Notes, the 2017 Convertible Notes and the 2018 Convertible Notes, the "Convertible Unsecured Notes").
As of February 20, 2015, we had approximately $2.1 billion aggregate principal amount of senior unsecured notes outstanding comprised of $750.0 million aggregate principal amount of senior unsecured notes that mature on November 30, 2018 and bear interest at a rate of 4.875% (the "2018 Notes"), $600 million aggregate principal amount of senior unsecured notes that mature on January 15, 2020 and bear interest at a rate of 3.875% (the "2020 Notes"), $143.8 million aggregate principal amount of senior unsecured notes that mature on February 15, 2022 and bear interest at a rate of 7.00% (the "February 2022 Notes"), $182.5 million aggregate principal amount of senior unsecured notes that mature on October 1, 2022 and bear interest at a rate of 5.875% (the "October 2022 Notes"), $200.0 million aggregate principal amount of senior unsecured notes that mature on October 15, 2040 and bear interest at a rate of 7.75% (the "2040 Notes") and $229.5 million aggregate principal amount of senior unsecured notes that mature on April 15, 2047 and bear interest at a rate of 6.875% (the "2047 Notes" and together with the 2018 Notes, the 2020 Notes, the February 2022 Notes, the October 2022 Notes and the 2040 Notes, the "Unsecured Notes"). The Unsecured Notes, excluding the 2018 Notes and the 2020 Notes, are listed on The New York Stock Exchange. See "Management's Discussion And Analysis Of Financial Condition And Results Of Operations—Recent Developments," as well as Note 17 to our consolidated financial statements for the year ended December 31, 2014 for more information on the 2020 Notes and the February 2022 Notes.
We intend to continue borrowing under the Facilities in the future and we may increase the size of the Facilities, add additional credit facilities or otherwise issue additional debt securities or other evidences of indebtedness in the future, although there can be no assurance that we will be able to do so.
For more information on our debt, see "Management's Discussion and Analysis of Financial Condition and Results of Operations—Financial Condition, Liquidity and Capital Resources."
25
Small Business Investment Company
We have applied to the Small Business Administration ("SBA") for a license to allow a new wholly owned subsidiary to operate as a Small Business Investment Company ("SBIC") under the Small Business Investment Act of 1958. In May 2014, we received a "green light" or "go forth letter" from the SBA inviting us to continue our application process to obtain a license to form and operate an SBIC subsidiary, and we submitted our license application in October 2014. If approved, the license would provide us with an incremental source of long-term debt capital. Receipt of a green light letter from the SBA does not assure an applicant that the SBA will ultimately issue an SBIC license, and we have received no assurance or indication from the SBA that we will receive an SBIC license or of the timeframe in which we would receive a license should one ultimately be granted.
REGULATION
We have elected to be regulated as a BDC under the Investment Company Act and have elected to be treated as a RIC under the Code. As with other companies regulated by the Investment Company Act, a BDC must adhere to certain substantive regulatory requirements. The Investment Company Act contains prohibitions and restrictions relating to certain transactions between BDCs and certain affiliates (including any investment advisers or sub-advisers), principal underwriters and certain affiliates of those affiliates or underwriters. Among other things, we generally cannot invest in any portfolio company in which a fund managed by Ares or any of its downstream affiliates other than us and our downstream affiliates) currently has an investment (although we may co-invest with funds managed by Ares or any of its downstream affiliates, subject to compliance with existing regulatory guidance, applicable regulations and our allocation procedures). Certain types of co-investment transactions would only be permitted pursuant to an exemptive order from the SEC, for which we have applied. Any such order will be subject to certain terms and conditions. Further, there is no assurance that the application for exemptive relief will be granted by the SEC.
The Investment Company Act contains certain restrictions on certain types of investments we may make. Specifically, we may only invest up to 30% of our portfolio in entities that are not considered "eligible portfolio companies" (as defined in the Investment Company Act), including companies located outside of the United States, entities that are operating pursuant to certain exceptions under the Investment Company Act, and publicly traded entities whose public equity market capitalization exceeds the levels provided for under the Investment Company Act.
The Investment Company Act also requires that a majority of our directors be persons other than "interested persons," as that term is defined in Section 2(a)(19) of the Investment Company Act, referred to herein as "independent directors." In addition, the Investment Company Act provides that we may not change the nature of our business so as to cease to be, or to withdraw our election as, a BDC unless that change is approved by holders of at least a majority of our outstanding voting securities. Under the Investment Company Act, the vote of holders of at least a "majority of outstanding voting securities" means the vote of the holders of the lesser of: (a) 67% or more of the outstanding shares of our common stock present at a meeting or represented by proxy if holders of more than 50% of the shares of our common stock are present or represented by proxy or (b) more than 50% of the outstanding shares of our common stock.
We may invest up to 100% of our assets in securities acquired directly from issuers in privately negotiated transactions. With respect to such securities, we may, for the purpose of public resale, be deemed an "underwriter" as that term is defined in the Securities Act of 1933 (the "Securities Act"). Our intention is to not write (sell) or buy put or call options to manage risks associated with the publicly traded securities of our portfolio companies. We may enter into hedging transactions to manage the risks associated with interest rate and currency fluctuations. We may purchase or otherwise receive warrants or options to purchase the common stock of our portfolio companies in connection with acquisition financings or other investments. In connection with such an acquisition, we may
26
acquire rights to require the issuers of acquired securities or their affiliates to repurchase them under certain circumstances.
We also do not intend to acquire securities issued by any investment company that exceed the limits imposed by the Investment Company Act. Under these limits, we generally cannot acquire more than 3% of the voting stock of any investment company (as defined in the Investment Company Act), invest more than 5% of the value of our total assets in the securities of one investment company or invest more than 10% of the value of our total assets in the securities of investment companies in the aggregate. With regard to that portion of our portfolio invested in securities issued by investment companies, it should be noted that such investments might subject our stockholders to additional expenses.
PRIVACY PRINCIPLES
We are committed to maintaining the privacy of our stockholders and to safeguarding their non-public personal information. The following information is provided to help you understand what personal information we collect, how we protect that information and why, in certain cases, we may share information with select other parties.
Generally, we do not receive any non-public personal information relating to our stockholders, although certain non-public personal information of our stockholders may become available to us. The non-public personal information that we may receive falls into the following categories:
- •
- information we receive from stockholders, whether we receive it orally, in writing or electronically. This includes stockholders'
communications to us concerning their investment;
- •
- information about stockholders' transactions and history with us; or
- •
- other general information that we may obtain about stockholders, such as demographic and contact information such as a person's address.
We do not disclose any non-public personal information about our stockholders or former stockholders to anyone, except:
- •
- to our affiliates (such as our investment adviser and administrator) and their employees that have a legitimate business need for the
information;
- •
- to our service providers (such as our accountants, attorneys, custodians, transfer agent, underwriters and proxy solicitors) and their
employees, as is necessary to service recordholder accounts or otherwise provide the applicable services;
- •
- to comply with court orders, subpoenas, lawful discovery requests or other legal or regulatory requirements; or
- •
- as allowed or required by applicable law or regulation.
When we share non-public stockholder personal information referred to above, the information is made available for limited business purposes and under controlled circumstances designed to protect our stockholders' privacy. We do not permit use of stockholder information for any non-business or marketing purpose, nor do we permit third parties to rent, sell, trade or otherwise release or disclose information to any other party.
Our service providers, such as its investment adviser, administrator and transfer agent, are required to maintain physical, electronic, and procedural safeguards to protect stockholder non-public personal information to prevent unauthorized access or use and to dispose of such information when it is no longer required.
27
Personnel of our affiliates may access stockholder information only for business purposes. The degree of access is based on the sensitivity of the information and on personnel need for the information to service a stockholder's account or comply with legal requirements.
If a stockholder ceases to be a stockholder, we will adhere to the privacy policies and practices as described above. We may choose to modify our privacy policies at any time. Before we do so, we will notify stockholders and provide a description of our privacy policy.
In the event of a corporate change in control resulting from, for example, a sale to, or merger with, another entity, or in the event of a sale of assets, we reserve the right to transfer stockholders' non-public personal information to the new party in control or the party acquiring assets.
AVAILABLE INFORMATION
We file with or submit to the SEC annual, quarterly and current periodic reports, proxy statements and other information meeting the informational requirements of the Securities Exchange Act of 1934 (the "Exchange Act"). This information is available free of charge by calling us collect at (310) 201-4200 or on our website at www.arescapitalcorp.com. Information contained on our website is not incorporated into this Annual Report and you should not consider such information to be part of this Annual Report. You also may inspect and copy these reports, proxy statements and other information, as well as the Annual Report and related exhibits and schedules, at the Public Reference Room of the SEC at 100 F Street, N.E., Washington, D.C. 20549, the SEC's Northeast Regional Office at 3 World Financial Center, Suite 400, New York, NY 10281 and the SEC's Midwest Regional Office at 175 W. Jackson Blvd., Suite 900, Chicago, IL 60604. Such information is also available from the EDGAR database on the SEC's web site at http://www.sec.gov. You also can obtain copies of such information, after paying a duplicating fee, by sending a request by e-mail to publicinfo@sec.gov or by writing the SEC's Public Reference Branch, Office of Consumer Affairs and Information Services, Securities and Exchange Commission, Washington, D.C. 20549. You may obtain information on the operation of the SEC's Public Reference Room by calling the SEC at (202) 551-8090 or (800) SEC-0330.
28
You should carefully consider the risk factors described below, together with all of the other information included in this Annual Report, including our consolidated financial statements and the related notes thereto, before you decide whether to make an investment in our securities. The risks set out below are not the only risks we face. Additional risks and uncertainties not currently known to us or that we currently deem to be immaterial also may materially adversely affect our business, financial condition and/or operating results. If any of the following events occur, our business, financial condition and results of operations could be materially adversely affected. In such case, the net asset value of our common stock and the trading price of our securities could decline, and you may lose all or part of your investment.
RISKS RELATING TO OUR BUSINESS
The capital markets may experience periods of disruption and instability. Such market conditions may materially and adversely affect debt and equity capital markets in the United States, which may have a negative impact on our business and operations.
From time to time, capital markets may experience periods of disruption and instability. For example, between 2008 and 2009, the global capital markets were unstable as evidenced by periodic disruptions in liquidity in the debt capital markets, significant write-offs in the financial services sector, the re-pricing of credit risk in the broadly syndicated credit market and the failure of major financial institutions. Despite actions of the U.S. federal government and foreign governments, these events contributed to worsening general economic conditions that materially and adversely impacted the broader financial and credit markets and reduced the availability of debt and equity capital for the market as a whole and financial services firms in particular. While market conditions have experienced relative stability in recent years, there have been continuing periods of volatility and there can be no assurance that adverse market conditions will not repeat themselves in the future.
Equity capital may be difficult to raise during periods of adverse or volatile market conditions because, subject to some limited exceptions, as a BDC, we are generally not able to issue additional shares of our common stock at a price less than net asset value without first obtaining approval for such issuance from our stockholders and our independent directors. We generally seek approval from our stockholders so that we have the flexibility to issue up to 25% of our then outstanding shares of our common stock at a price below net asset value. Pursuant to approval granted at our 2014 annual stockholders meeting, we currently are permitted to sell or otherwise issue shares of our common stock at a price below net asset value, subject to certain limitations and determinations that must be made by our board of directors. Such stockholder approval expires the earlier of June 2, 2015 and the date of our 2015 annual stockholders meeting.
At times, volatility and dislocation in the capital markets can also create a challenging environment in which to raise or access debt capital. The re-appearance of market conditions similar to those experienced from 2008 through 2009 for any substantial length of time could make it difficult to extend the maturity of or refinance our existing indebtedness or obtain new indebtedness with similar terms and any failure to do so could have a material adverse effect on our business. The debt capital that will be available to us in the future, if at all, may be at a higher cost and on less favorable terms and conditions than what we currently experience. If we are unable to raise or refinance debt, then our equity investors may not benefit from the potential for increased returns on equity resulting from leverage and we may be limited in our ability to make new commitments or to fund existing commitments to our portfolio companies.
Significant changes or volatility in the capital markets may also have a negative effect on the valuations of our investments. While most of our investments are not publicly traded, applicable
29
accounting standards require us to assume as part of our valuation process that our investments are sold in a principal market to market participants (even if we plan on holding an investment through its maturity). Significant changes in the capital markets may also affect the pace of our investment activity and the potential for liquidity events involving our investments. Thus, the illiquidity of our investments may make it difficult for us to sell such investments to access capital if required, and as a result, we could realize significantly less than the value at which we have recorded our investments if we were required to sell them for liquidity purposes. An inability to raise or access capital could have a material adverse effect on our business, financial condition or results of operations.
Uncertainty about the financial stability of the United States and of several countries in the European Union (EU) could have a significant adverse effect on our business, financial condition and results of operations.
Due to federal budget deficit concerns, S&P downgraded the federal government's credit rating from AAA to AA+ for the first time in history on August 5, 2011. Further, Moody's and Fitch had warned that they may downgrade the federal government's credit rating. Further downgrades or warnings by S&P or other rating agencies, and the United States government's credit and deficit concerns in general, could cause interest rates and borrowing costs to rise, which may negatively impact both the perception of credit risk associated with our debt portfolio and our ability to access the debt markets on favorable terms. In addition, a decreased U.S. government credit rating could create broader financial turmoil and uncertainty, which may weigh heavily on our financial performance and the value of our common stock.
In 2010, a financial crisis emerged in Europe, triggered by high budget deficits and rising direct and contingent sovereign debt in Greece, Ireland, Italy, Portugal and Spain, which created concerns about the ability of these nations to continue to service their sovereign debt obligations. While the financial stability of such countries has improved significantly, risks resulting from any future debt crisis in Europe or any similar crisis could have a detrimental impact on the global economic recovery, sovereign and non-sovereign debt in these countries and the financial condition of European financial institutions. Market and economic disruptions have affected, and may in the future affect, consumer confidence levels and spending, personal bankruptcy rates, levels of incurrence and default on consumer debt and home prices, among other factors. We cannot assure you that market disruptions in Europe, including the increased cost of funding for certain governments and financial institutions, will not impact the global economy, and we cannot assure you that assistance packages will be available, or if available, be sufficient to stabilize countries and markets in Europe or elsewhere affected by a financial crisis. To the extent uncertainty regarding any economic recovery in Europe negatively impacts consumer confidence and consumer credit factors, our business, financial condition and results of operations could be significantly and adversely affected.
In October 2014, the Federal Reserve announced that it was concluding its bond-buying program, or quantitative easing, which was designed to stimulate the economy and expand the Federal Reserve's holdings of long-term securities, suggesting that key economic indicators, such as the unemployment rate, had showed signs of improvement since the inception of the program. It is unclear what effect, if any, the conclusion of the Federal Reserve's bond-buying program will have on the value of our investments. However, it is possible that, without quantitative easing by the Federal Reserve, these developments, along with the United States government's credit and deficit concerns and the European sovereign debt crisis, could cause interest rates and borrowing costs to rise, which may negatively impact our ability to access the debt markets on favorable terms. Additionally, in January 2015, the Federal Reserve reaffirmed its view that the current target range for the federal funds rate was appropriate based on current economic conditions. However, if key economic indicators, such as the unemployment rate or inflation, do not progress at a rate consistent with the Federal Reserve's objectives, the target range for the federal funds rate may increase and cause interest rates and
30
borrowing costs to rise, which may negatively impact our ability to access the debt markets on favorable terms.
A failure on our part to maintain our status as a BDC would significantly reduce our operating flexibility.
If we fail to maintain our status as a BDC, we might be regulated as a closed-end investment company that is required to register under the Investment Company Act, which would subject us to additional regulatory restrictions and significantly decrease our operating flexibility. In addition, any such failure could cause an event of default under our outstanding indebtedness, which could have a material adverse effect on our business, financial condition or results of operations.
We are dependent upon certain key personnel of Ares for our future success and upon their access to other Ares investment professionals.
We depend on the diligence, skill and network of business contacts of certain key personnel of the Ares Direct Lending Group. We also depend, to a significant extent, on access to the investment professionals of other groups within Ares and the information and deal flow generated by Ares' investment professionals in the course of their investment and portfolio management activities. Our future success depends on the continued service of the key personnel of the Ares Direct Lending Group. The departure of any of these individuals, or of a significant number of the investment professionals or partners of Ares, could have a material adverse effect on our business, financial condition or results of operations. In addition, we cannot assure you that Ares Capital Management will remain our investment adviser or that we will continue to have access to Ares' investment professionals or its information and deal flow. Further, there can be no assurance that Ares Capital will replicate its own or Ares' historical success, and we caution you that our investment returns could be substantially lower than the returns achieved by other Ares-managed funds.
Our financial condition and results of operations depend on our ability to manage future growth effectively.
Our ability to achieve our investment objective depends on our ability to acquire suitable investments and monitor and administer those investments, which depends, in turn, on our investment adviser's ability to identify, invest in and monitor companies that meet our investment criteria.
Accomplishing this result on a cost-effective basis is largely a function of the structuring of our investment process and the ability of our investment adviser to provide competent, attentive and efficient services to us. Our executive officers and the members of our investment adviser's investment committee have substantial responsibilities in connection with their roles at Ares and with the other Ares funds, as well as responsibilities under the investment advisory and management agreement. They may also be called upon to provide significant managerial assistance to certain of our portfolio companies. These demands on their time, which will increase as the number of investments grow, may distract them or slow the rate of investment. In order to grow, Ares will need to hire, train, supervise, manage and retain new employees. However, we cannot assure you that Ares will be able to do so effectively. Any failure to manage our future growth effectively could have a material adverse effect on our business, financial condition and results of operations.
In addition, as we grow, we may open up new offices in new geographic regions that may increase our direct operating expenses without corresponding revenue growth.
Our ability to grow depends on our ability to raise capital.
We will need to periodically access the capital markets to raise cash to fund new investments in excess of our repayments and, beginning in 2016, we may also need to access the capital markets to
31
refinance existing debt obligations to the extent such maturing obligations are not repaid with cash flows from operations. We have elected to be treated as a RIC and operate in a manner so as to qualify for the U.S. federal income tax treatment applicable to RICs. Among other things, in order to maintain our RIC status, we must distribute to our stockholders on a timely basis generally an amount equal to at least 90% of our investment company taxable income, and, as a result, such distributions will not be available to fund investment originations or repay maturing debt. We must continue to borrow from financial institutions and issue additional securities to fund our growth. Unfavorable economic or capital market conditions may increase our funding costs or limit our access to the capital markets, or could result in a decision by lenders not to extend credit to us. An inability to successfully access the capital markets may limit our ability to refinance our existing debt obligations as they become due and/or to fully execute our business strategy and could limit our ability to grow or cause us to have to shrink the size of our business, which could decrease our earnings, if any.
In addition, with certain limited exceptions, we are only allowed to borrow amounts or issue debt securities or preferred stock, which we refer to collectively as "senior securities," such that our asset coverage, as calculated pursuant to the Investment Company Act, equals at least 200% immediately after such borrowing, which, in certain circumstances, may restrict our ability to borrow or issue debt securities or preferred stock. The amount of leverage that we employ will depend on our investment adviser's and our board of directors' assessments of market and other factors at the time of any proposed borrowing or issuance of senior securities. We cannot assure you that we will be able to maintain our current Facilities, obtain other lines of credit or issue senior securities at all or on terms acceptable to us.
Regulations governing our operation as a BDC affect our ability to, and the way in which we, raise additional capital.
We may issue senior securities or borrow money from banks or other financial institutions, up to the maximum amount permitted by the Investment Company Act. Under the provisions of the Investment Company Act, we are permitted, as a BDC, to incur indebtedness or issue senior securities only in amounts such that our asset coverage, as calculated pursuant to the Investment Company Act, equals at least 200% after each such incurrence or issuance. If the value of our assets declines, we may be unable to satisfy this test, which may prohibit us from paying dividends and could prevent us from maintaining our status as a RIC or may prohibit us from repurchasing shares of our common stock. In addition, our inability to satisfy this test could cause an event of default under our existing indebtedness. If we cannot satisfy this test, we may be required to sell a portion of our investments at a time when such sales may be disadvantageous and, depending on the nature of our leverage, repay a portion of our indebtedness. Accordingly, any failure to satisfy this test could have a material adverse effect on our business, financial condition or results of operations. As of December 31, 2014, our asset coverage calculated in accordance with the Investment Company Act was 235%. Also, to generate cash for funding new investments, we may in the future seek to issue additional debt or to securitize certain of our loans. The Investment Company Act may impose restrictions on the structure of any such securitization.
We are not generally able to issue and sell our common stock at a price below net asset value per share. We may, however, sell our common stock, or warrants, options or rights to acquire our common stock, at a price below the current net asset value per share of our common stock if our board of directors determines that such sale is in our best interests and the best interests of our stockholders, and our stockholders approve such sale. Any such sale would be dilutive to the net asset value per share of our common stock. In any such case, the price at which our securities are to be issued and sold may not be less than a price that, in the determination of our board of directors, closely approximates the market value of such securities (less any commission or discount). If our common
32
stock trades at a discount to net asset value, this restriction could adversely affect our ability to raise capital.
Pursuant to approval granted at our 2014 annual stockholders meeting, we currently are permitted to sell or otherwise issue shares of our common stock at a price below net asset value, subject to certain limitations and determinations that must be made by our board of directors. Such stockholder approval expires the earlier of June 2, 2015 and the date of our 2015 annual stockholders meeting.
We borrow money, which magnifies the potential for gain or loss on amounts invested and may increase the risk of investing with us.
Borrowings, also known as leverage, magnify the potential for gain or loss on amounts invested and, therefore, increase the risks associated with investing in our securities. We currently borrow under our Facilities and have issued or assumed other senior securities, and in the future may borrow from, or issue additional senior securities to, banks, insurance companies, funds, institutional investors and other lenders and investors. Lenders and holders of such senior securities have fixed dollar claims on our consolidated assets that are superior to the claims of our common stockholders or any preferred stockholders. If the value of our consolidated assets increases, then leveraging would cause the net asset value per share of our common stock to increase more sharply than it would have had we not incurred leverage.
Conversely, if the value of our consolidated assets decreases, leveraging would cause net asset value to decline more sharply than it otherwise would have had we not incurred leverage. Similarly, any increase in our consolidated income in excess of consolidated interest payable on the borrowed funds would cause our net income to increase more than it would had we not incurred leverage, while any decrease in our consolidated income would cause net income to decline more sharply than it would have had we not incurred leverage. Such a decline could negatively affect our ability to make common stock dividend payments. There can be no assurance that a leveraging strategy will be successful.
As of December 31, 2014, we had approximately $556.0 million of outstanding borrowings under the Facilities, approximately $1,537.5 million in aggregate principal amount outstanding of the Convertible Unsecured Notes and approximately $1,905.8 million in aggregate principal amount outstanding of the Unsecured Notes. In order for us to cover our annual interest payments on our outstanding indebtedness at December 31, 2014, we must achieve annual returns on our December 31, 2014 total assets of at least 2.1%. The weighted average stated interest rate charged on our principal amount of outstanding indebtedness as of December 31, 2014 was 4.9%. We intend to continue borrowing under the Facilities in the future and we may increase the size of the Facilities or issue additional debt securities or other evidences of indebtedness (although there can be no assurance that we will be successful in doing so). For more information on our indebtedness, see "Management's Discussion and Analysis of Financial Condition and Results of Operations—Financial Condition, Liquidity and Capital Resources." Our ability to service our debt depends largely on our financial performance and is subject to prevailing economic conditions and competitive pressures. The amount of leverage that we employ at any particular time will depend on our investment adviser's and our board of directors' assessments of market and other factors at the time of any proposed borrowing.
The Facilities, the Convertible Unsecured Notes and the Unsecured Notes impose financial and operating covenants that restrict our business activities, including limitations that could hinder our ability to finance additional loans and investments or to make the distributions required to maintain our status as a RIC. A failure to renew the Facilities or to add new or replacement debt facilities or to issue additional debt securities or other evidences of indebtedness could have a material adverse effect on our business, financial condition and results of operations.
The following table illustrates the effect on return to a holder of our common stock of the leverage created by our use of borrowing at the weighted average stated interest rate of 4.9% as of
33
December 31, 2014, together with (a) our total value of net assets as of December 31, 2014; (b) approximately $3,999.3 million in aggregate principal amount of indebtedness outstanding as of December 31, 2014 and (c) hypothetical annual returns on our portfolio of minus 15% to plus 15%.
Assumed Return on Portfolio (Net of Expenses)(1) |
–15 | % | –10 | % | –5 | % | — | % | 5 | % | 10 | % | 15 | % | ||||||||
Corresponding Return to Common Stockholders(2) |
–31 | % | –22 | % | –13 | % | –4 | % | 5 | % | 14 | % | 23 | % |
- (1)
- The
assumed portfolio return is required by SEC regulations and is not a prediction of, and does not represent, our projected or actual performance. Actual
returns may be greater or less than those appearing in the table. Pursuant to SEC regulations, this table is calculated as of December 31, 2014. As a result, it has not been updated to take
into account any changes in assets or leverage since December 31, 2014.
- (2)
- In order to compute the "Corresponding Return to Common Stockholders," the "Assumed Return on Portfolio" is multiplied by the total value of our assets at December 31, 2014 to obtain an assumed return to us. From this amount, the interest expense (calculated by multiplying the weighted average stated interest rate of 4.9% by the approximately $3,999.3 million of principal debt outstanding) is subtracted to determine the return available to stockholders. The return available to stockholders is then divided by the total value of our net assets as of December 31, 2014 to determine the "Corresponding Return to Common Stockholders."
In addition to regulatory requirements that restrict our ability to raise capital, the Facilities, the Convertible Unsecured Notes and the Unsecured Notes contain various covenants that, if not complied with, could accelerate repayment under the Facilities, the Convertible Unsecured Notes and the Unsecured Notes, thereby materially and adversely affecting our liquidity, financial condition and results of operations.
The agreements governing the Facilities, the Convertible Unsecured Notes and the Unsecured Notes require us to comply with certain financial and operational covenants. These covenants may include, among other things:
- •
- restrictions on the level of indebtedness that we are permitted to incur in relation to the value of our assets;
- •
- restrictions on our ability to incur liens; and
- •
- maintenance of a minimum level of stockholders' equity.
As of the date of this Annual Report, we are in compliance in all material respects with the covenants of the Facilities, the Convertible Unsecured Notes and the Unsecured Notes. However, our continued compliance with these covenants depends on many factors, some of which are beyond our control. For example, depending on the condition of the public debt and equity markets and pricing levels, unrealized depreciation in our portfolio may increase in the future. Any such increase could result in our inability to comply with our obligation to restrict the level of indebtedness that we are able to incur in relation to the value of our assets or to maintain a minimum level of stockholders' equity.
Accordingly, although we believe we will continue to be in compliance, there are no assurances that we will continue to comply with the covenants in the Facilities, the Convertible Unsecured Notes and the Unsecured Notes. Failure to comply with these covenants could result in a default under the Facilities, the Convertible Unsecured Notes or the Unsecured Notes that, if we were unable to obtain a waiver from the lenders or holders of such indebtedness, as applicable, such lenders or holders could accelerate repayment under such indebtedness and thereby have a material adverse impact on our business, financial condition and results of operations.
34
We operate in a highly competitive market for investment opportunities.
A number of entities compete with us to make the types of investments that we make in middle-market companies. We compete with other BDCs, public and private funds, commercial and investment banks, commercial financing companies, insurance companies, hedge funds, and, to the extent they provide an alternative form of financing, private equity funds. Many of our competitors are substantially larger and have considerably greater financial, technical and marketing resources than we do. Some competitors may have a lower cost of funds and access to funding sources that are not available to us. In addition, some of our competitors may have higher risk tolerances or different risk assessments, which could allow them to consider a wider variety of investments and establish more relationships than us. Furthermore, many of our competitors are not subject to the regulatory restrictions that the Investment Company Act imposes on us as a BDC and that the Code imposes on us as a RIC. We cannot assure you that the competitive pressures we face will not have a material adverse effect on our business, financial condition and results of operations. Also, as a result of this competition, we may not be able to pursue attractive investment opportunities from time to time.
We do not seek to compete primarily based on the interest rates we offer and we believe that some of our competitors may make loans with interest rates that are comparable to or lower than the rates we offer. Rather, we compete with our competitors based on our existing investment platform, seasoned investment professionals, experience and focus on middle-market companies, disciplined investment philosophy, extensive industry focus and flexible transaction structuring. For a more detailed discussion of these competitive advantages, see "Business—Competitive Advantages."
We may lose investment opportunities if we do not match our competitors' pricing, terms and structure. If we match our competitors' pricing, terms and structure, we may experience decreased net interest income and increased risk of credit loss. As a result of operating in such a competitive environment, we may make investments that are on less favorable terms than what we may have originally anticipated, which may impact our return on these investments.
We may be subject to additional corporate-level income taxes if we fail to maintain our status as a RIC.
We have elected to be treated as a RIC under the Code and operate in a manner so as to qualify for the U.S. federal income tax treatment applicable to RICs. As a RIC, we generally will not pay U.S. federal corporate-level income taxes on our income and net capital gains that we distribute to our stockholders as dividends on a timely basis. We will be subject to U.S. federal corporate-level income tax on any undistributed income and/or gains. To maintain our status as a RIC, we must meet certain source of income, asset diversification and annual distribution requirements. We may also be subject to certain U.S. federal excise taxes, as well as state, local and foreign taxes.
To satisfy the annual distribution requirement applicable to RICs, we must distribute to our stockholders on a timely basis generally an amount equal to at least 90% of our investment company taxable income for each year. We have the ability to pay a large portion of our dividends in shares of our stock, and as long as a portion of such dividend is paid in cash and other requirements are met, such stock dividends will be taxable as a dividend for U.S. federal income tax purposes. This may result in our U.S. stockholders having to pay tax on such dividends, even if no cash is received, and may result in our non-U.S. stockholders being subject to withholding tax in respect of amounts distributed in our stock. Because we use debt financing, we are subject to certain asset coverage ratio requirements under the Investment Company Act and financial covenants under our indebtedness that could, under certain circumstances, restrict us from making distributions necessary to qualify as a RIC. If we are unable to obtain cash from other sources, we may fail to maintain our status as a RIC and, thus, may be subject to corporate-level income tax on all of our income and/or gains.
35
To maintain our status as a RIC, in addition to the annual distribution requirement applicable to RICs, we must also meet certain annual source of income requirements at the end of each taxable year and asset diversification requirements at the end of each calendar quarter. Failure to meet these requirements may result in our having to (a) dispose of certain investments quickly or (b) raise additional capital to prevent the loss of RIC status. Because most of our investments are in private companies and are generally illiquid, any such dispositions may be at disadvantageous prices and may result in losses. Also, the rules applicable to our qualification as a RIC are complex with many areas of uncertainty. Accordingly, no assurance can be given that we have qualified or will continue to qualify as a RIC. If we fail to maintain our status as a RIC for any reason and become subject to regular "C" corporation income tax, the resulting corporate-level income taxes could substantially reduce our net assets, the amount of income available for distribution and the amount of our distributions. Such a failure would have a material adverse effect on us and on any investment in us. The "Regulated Investment Company Modernization Act of 2010," which is effective for 2011 and later tax years, provides some relief from RIC disqualification due to failures of the source of income and asset diversification requirements, although there may be additional taxes due in such cases. We cannot assure you that we would qualify for any such relief should we fail the source of income or asset diversification requirements.
We may have difficulty paying our required distributions under applicable tax rules if we recognize income before or without receiving cash representing such income.
For U.S. federal income tax purposes, we generally are required to include in income certain amounts that we have not yet received in cash, such as original issue discount, which may arise, for example, if we receive warrants in connection with the making of a loan or PIK interest representing contractual interest added to the loan principal balance and due at the end of the loan term. Such original issue discount or PIK interest is included in income before we receive any corresponding cash payments. We also may be required to include in income certain other amounts that we will not receive in cash, including, for example, amounts attributable to hedging and foreign currency transactions or cancellation of indebtedness income resulting from a restructuring of an investment in debt securities.
Since, in certain cases, we may recognize income before or without receiving cash in respect of such income, we may have difficulty meeting the U.S. federal income tax requirement to distribute generally an amount equal to at least 90% of our investment company taxable income to maintain our status as a RIC. Accordingly, we may have to sell some of our investments at times we would not consider advantageous, raise additional debt or equity capital or reduce new investment originations to meet these distribution requirements. If we are not able to obtain cash from other sources, we may fail to qualify as a RIC and thus be subject to additional corporate-level income taxes. Such a failure would have a material adverse effect on us and on any investment in us.
We are exposed to risks associated with changes in interest rates.
General interest rate fluctuations may have a substantial negative impact on our investments and investment opportunities and, accordingly, may have a material adverse effect on our investment objective and rate of return on invested capital. Because we borrow money and may issue debt securities or preferred stock to make investments, our net investment income is dependent upon the difference between the rate at which we borrow funds or pay interest or dividends on such debt securities or preferred stock and the rate at which we invest these funds. As a result, there can be no assurance that a significant change in market interest rates will not have a material adverse effect on our net investment income.
Trading prices for debt that pays a fixed rate of return tend to fall as interest rates rise. Trading prices tend to fluctuate more for fixed-rate securities that have longer maturities. In the past, we have entered into certain hedging transactions, such as interest rate swap agreements, to mitigate our
36
exposure to adverse fluctuations in interest rates, and we may do so again in the future. In addition, we may increase our floating rate investments to position the portfolio for rate increases. However, we cannot assure you that such transactions will be successful in mitigating our exposure to interest rate risk. Hedging transactions may also limit our ability to participate in the benefits of lower interest rates with respect to our portfolio investments.
Although we have no policy governing the maturities of our investments, under current market conditions we expect that we will invest in a portfolio of debt generally having maturities of up to 10 years. This means that we are subject to greater risk (other things being equal) than a fund invested solely in shorter-term securities. A decline in the prices of the debt we own could adversely affect the trading price of our common stock. Also, an increase in interest rates available to investors could make an investment in our common stock less attractive if we are not able to increase our dividend rate, which could reduce the value of our common stock.
Most of our portfolio investments are not publicly traded and, as a result, the fair value of these investments may not be readily determinable.
A large percentage of our portfolio investments are not publicly traded. The fair value of investments that are not publicly traded may not be readily determinable. We value these investments quarterly at fair value as determined in good faith by our board of directors based on, among other things, the input of our management and audit committee and independent valuation firms that have been engaged at the direction of our board of directors to assist in the valuation of each portfolio investment without a readily available market quotation at least once during a trailing 12-month period (with certain de minimis exceptions). The valuation process is conducted at the end of each fiscal quarter, with a minimum of 55% (based on value) of our valuations of portfolio companies without readily available market quotations subject to review by an independent valuation firm each quarter. However, we may use these independent valuation firms to review the value of our investments more frequently, including in connection with the occurrence of significant events or changes in value affecting a particular investment. In addition, our independent registered public accounting firm obtains an understanding of, and performs select procedures relating to, our investment valuation process within the context of performing the integrated audit.
The types of factors that may be considered in valuing our investments include the enterprise value of the portfolio company (the entire value of the portfolio company to a market participant, including the sum of the values of debt and equity securities used to capitalize the enterprise at a point in time), the nature and realizable value of any collateral, the portfolio company's ability to make payments and its earnings and discounted cash flows, the markets in which the portfolio company does business, a comparison of the portfolio company's securities to similar publicly traded securities, changes in the interest rate environment and the credit markets generally that may affect the price at which similar investments would trade in their principal markets and other relevant factors. When an external event such as a purchase transaction, public offering or subsequent equity sale occurs, we consider the pricing indicated by the external event to corroborate our valuation. Because such valuations, and particularly valuations of private investments and private companies, are inherently uncertain, may fluctuate over short periods of time and may be based on estimates, our determinations of fair value may differ materially from the values that would have been used if a ready market for these investments existed and may differ materially from the values that we may ultimately realize. Our net asset value per share could be adversely affected if our determinations regarding the fair value of these investments are higher than the values that we realize upon disposition of such investments.
The lack of liquidity in our investments may adversely affect our business.
As we generally make investments in private companies, substantially all of these investments are subject to legal and other restrictions on resale or are otherwise less liquid than publicly traded
37
securities. The illiquidity of our investments may make it difficult for us to sell such investments if the need arises. In addition, if we are required to liquidate all or a portion of our portfolio quickly, we could realize significantly less than the value at which we have recorded our investments. In addition, we may face other restrictions on our ability to liquidate an investment in a portfolio company to the extent that we or an affiliated manager of Ares has material non-public information regarding such portfolio company.
We may experience fluctuations in our quarterly results.
We could experience fluctuations in our quarterly operating results due to a number of factors, including the interest rates payable on the debt investments we make, the default rates on such investments, the level of our expenses, variations in and the timing of the recognition of realized and unrealized gains or losses, the degree to which we encounter competition in our markets and general economic conditions. As a result of these factors, results for any period should not be relied upon as being indicative of performance in future periods.
Our financial condition and results of operations could be negatively affected if a significant investment fails to perform as expected.
Our investment portfolio includes investments that may be significant individually or in the aggregate. If a significant investment in one or more companies fails to perform as expected, such a failure could have a material adverse effect on our financial condition and results of operations, and the magnitude of such effect could be more significant than if we had further diversified our portfolio.
Our investment portfolio includes our investment in the SSLP, which as of December 31, 2014, represented approximately 23% of our total portfolio at fair value. In addition, for the year ended December 31, 2014, approximately 35% of our total investment income was earned from our investment in the SSLP. The income earned from the SSLP is derived from the interest and fee income earned by the SSLP from its investments in first lien senior secured loans of middle market companies. We provide capital to the SSLP in the form of subordinated certificates (the "SSLP Certificates"), which had a 13.55% yield at fair value as of December 31, 2014 and are junior in right of payment to the senior notes held by GE in the SSLP. For more information on the SSLP, see "Management's Discussion and Analysis of Financial Condition and Results of Operations—Portfolio and Investment Activity—Senior Secured Loan Program." Our return on and repayment of our investment in the SSLP Certificates depends on the performance of the loans in the SSLP's portfolio in the aggregate. Accordingly, any material degradation in the performance of the loans in the SSLP's portfolio in the aggregate would have a negative effect on the yield on our SSLP Certificates and could ultimately result in the loss of some or all of our investment in the SSLP Certificates.
There are significant potential conflicts of interest that could impact our investment returns.
Certain of our executive officers and directors, and members of the investment committee of our investment adviser, serve or may serve as officers, directors or principals of other entities and affiliates of our investment adviser and investment funds managed by our affiliates. Accordingly, they may have obligations to investors in those entities, the fulfillment of which might not be in our or our stockholders' best interests or may require them to devote time to services for other entities, which could interfere with the time available to provide services to us. Certain members of our investment adviser's investment committee have significant responsibilities for other Ares funds. For example, Mr. Bennett Rosenthal is required to devote a substantial majority of his business time to the affairs of the Ares Private Equity Group. Similarly, although the professional staff of our investment adviser will devote as much time to the management of the Company as appropriate to enable our investment adviser to perform its duties in accordance with the investment advisory and management agreement, the investment professionals of our investment adviser may have conflicts in allocating their time and
38
services among the Company, on the one hand, and investment vehicles managed by Ares or one or more of its affiliates, on the other hand. These activities could be viewed as creating a conflict of interest insofar as the time and effort of the professional staff of our investment adviser and its officers and employees will not be devoted exclusively to the business of the Company but will instead be allocated between the business of the Company and the management of these other investment vehicles. However, Ares believes that the efforts of such individuals are synergistic with and beneficial to the affairs of Ares Capital and these other investment vehicles managed by Ares or its affiliates.
In addition, certain Ares funds may have investment objectives that compete or overlap with, and may from time to time invest in asset classes similar to those targeted by, Ares Capital. Consequently, we, on the one hand, and these other entities, on the other hand, may from time to time pursue the same or similar capital and investment opportunities. Ares and our investment adviser endeavor to allocate investment opportunities in a fair and equitable manner, and in any event consistent with any fiduciary duties owed to Ares Capital. Nevertheless, it is possible that we may not be given the opportunity to participate in certain investments made by investment funds managed by investment managers affiliated with Ares. In addition, there may be conflicts in the allocation of investment opportunities among us and the funds managed by investment managers affiliated with Ares or one or more of our controlled affiliates or among the funds they manage.
We have from time to time sold assets to IHAM and certain of the vehicles managed by IHAM and, as part of our investment strategy, we may offer to sell additional assets to vehicles managed by one or more of our controlled affiliates (including IHAM) or we may purchase assets from vehicles managed by one or more of our controlled affiliates. In addition, vehicles managed by one or more of our controlled affiliates (including IHAM) may offer assets to or may purchase assets from one another. While assets may be sold or purchased at prices that are consistent with those that could be obtained from third parties in the marketplace, and although these types of transactions generally require approval of one or more independent parties, there may be an inherent conflict of interest in such transactions between us and funds managed by one of our controlled affiliates.
We pay a base management fee, an income based fee and a capital gains incentive fee to our investment adviser, and reimburse our investment adviser for certain expenses it incurs. In addition, investors in our common stock will invest on a gross basis and receive distributions on a net basis after expenses, resulting in, among other things, a lower rate of return than one might achieve if distributions were made on a gross basis.
Our investment adviser's base management fee is based on a percentage of our total assets (other than cash or cash equivalents but including assets purchased with borrowed funds) and, consequently, our investment adviser may have conflicts of interest in connection with decisions that could affect our total assets, such as decisions as to whether to incur indebtedness or to make future investments.
The income based fees payable by us to our investment adviser that relate to our pre-incentive fee net investment income is computed and paid on income that may include interest that is accrued but not yet received in cash. If a portfolio company defaults on a loan that is structured to provide accrued interest, it is possible that accrued interest previously used in the calculation of such fee will become uncollectible. Our investment adviser is not under any obligation to reimburse us for any part of the income based fees it received that were based on accrued interest that we never actually receive.
Our investment advisory and management agreement renews for successive annual periods if approved by our board of directors or by the affirmative vote of the holders of a majority of our outstanding voting securities, including, in either case, approval by a majority of our directors who are not "interested persons" of the Company as defined in Section 2(a)(19) of the Investment Company Act. However, both we and our investment adviser have the right to terminate the agreement without penalty upon 60 days' written notice to the other party. Moreover, conflicts of interest may arise if our investment adviser seeks to change the terms of our investment advisory and management agreement,
39
including, for example, the terms for compensation. While any material change to the investment advisory and management agreement must be submitted to stockholders for approval under the Investment Company Act, we may from time to time decide it is appropriate to seek stockholder approval to change the terms of the agreement.
We are party to an administration agreement with our administrator, Ares Operations, a subsidiary of Ares Management, pursuant to which our administrator furnishes us with administrative services and we pay our administrator at cost our allocable portion of overhead and other expenses (including travel expenses) incurred by our administrator in performing its obligations under our administration agreement, including our allocable portion of the cost of certain of our officers (including our chief compliance officer, chief financial officer, chief accounting officer, general counsel, treasurer and assistant treasurer) and their respective staffs, but not investment professionals.
Our portfolio company, IHAM, is party to an administration agreement, referred to herein as the "IHAM administration agreement," with Ares Operations. Pursuant to the IHAM administration agreement, our administrator provides IHAM with administrative services and IHAM reimburses our administrator for all of the actual costs associated with such services, including its allocable portion of our administrator's overhead and the cost of our administrator's officers and respective staff in performing its obligations under the IHAM administration agreement. Prior to entering into the IHAM administration agreement, IHAM was party to a services agreement with our investment adviser, pursuant to which our investment adviser provided similar services.
As a result of the arrangements described above, there may be times when the management team of Ares (including those members of management focused primarily on managing Ares Capital) has interests that differ from those of yours, giving rise to a conflict.
Our stockholders may have conflicting investment, tax and other objectives with respect to their investments in us. The conflicting interests of individual stockholders may relate to or arise from, among other things, the nature of our investments, the structure or the acquisition of our investments, and the timing of dispositions of our investments. As a consequence, conflicts of interest may arise in connection with decisions made by our investment adviser, including with respect to the nature or structuring of our investments, that may be more beneficial for one stockholder than for another stockholder, especially with respect to stockholders' individual tax situations. In selecting and structuring investments appropriate for us, our investment adviser will consider the investment and tax objectives of the Company and our stockholders, as a whole, not the investment, tax or other objectives of any stockholder individually.
We are dependent on information systems and systems failures could significantly disrupt our business, which may, in turn, negatively affect our liquidity, financial condition or results of operations.
Our business is dependent on our and third parties' communications and information systems. Any failure or interruption of those systems, including as a result of the termination of an agreement with any third-party service providers, could cause delays or other problems in our activities. Our financial, accounting, data processing, backup or other operating systems and facilities may fail to operate properly or become disabled or damaged as a result of a number of factors including events that are wholly or partially beyond our control and adversely affect our business. There could be:
- •
- sudden electrical or telecommunications outages;
- •
- natural disasters such as earthquakes, tornadoes and hurricanes;
- •
- disease pandemics;
- •
- events arising from local or larger scale political or social matters, including terrorist acts; and
- •
- cyber-attacks.
40
These events, in turn, could have a material adverse effect on our business, financial condition and operating results and negatively affect the market price of our common stock and our ability to pay dividends to our stockholders.
Cybersecurity risks and cyber incidents may adversely affect our business by causing a disruption to our operations, a compromise or corruption of our confidential information and/or damage to our business relationships, all of which could negatively impact our business, financial condition and operating results.
A cyber incident is considered to be any adverse event that threatens the confidentiality, integrity or availability of our information resources. These incidents may be an intentional attack or an unintentional event and could involve gaining unauthorized access to our information systems for purposes of misappropriating assets, stealing confidential information, corrupting data or causing operational disruption. The result of these incidents may include disrupted operations, misstated or unreliable financial data, liability for stolen assets or information, increased cybersecurity protection and insurance costs, litigation and damage to our business relationships. As our reliance on technology has increased, so have the risks posed to our information systems, both internal and those provided by Ares Management and third-party service providers. Ares Management has implemented processes, procedures and internal controls to help mitigate cybersecurity risks and cyber intrusions, but these measures, as well as our increased awareness of the nature and extent of a risk of a cyber incident, do not guarantee that a cyber incident will not occur and/or that our financial results, operations or confidential information will not be negatively impacted by such an incident.
Changes in laws or regulations governing our operations or the operations of our portfolio companies, changes in the interpretation thereof or newly enacted laws or regulations, such as the Dodd-Frank Act, and any failure by us or our portfolio companies to comply with these laws or regulations, could require changes to certain business practices of us or our portfolio companies, negatively impact the operations, cash flows or financial condition of us or our portfolio companies, impose additional costs on us or our portfolio companies or otherwise adversely affect our business or the business of our portfolio companies.
We and our portfolio companies are subject to regulation by laws and regulations at the local, state, federal and, in some cases, foreign levels. These laws and regulations, as well as their interpretation, may be changed from time to time, and new laws and regulations may be enacted. Accordingly, any change in these laws or regulations, changes in their interpretation, or newly enacted laws or regulations and any failure by us or our portfolio companies to comply with these laws or regulations, could require changes to certain business practices of us or our portfolio companies, negatively impact the operations, cash flows or financial condition of us or our portfolio companies, impose additional costs on us or our portfolio companies or otherwise adversely affect our business or the business of our portfolio companies.
On July 21, 2010, President Obama signed into law the Dodd-Frank Act. Many of the provisions of the Dodd-Frank Act have had extended implementation periods and delayed effective dates and have required extensive rulemaking by regulatory authorities. While many of the rules required to be written have been promulgated, some have not yet been implemented. Although the full impact of the Dodd-Frank Act on us and our portfolio companies may not be known for an extended period of time, the Dodd-Frank Act, including the rules implementing its provisions and the interpretation of those rules, along with other legislative and regulatory proposals directed at the financial services industry or affecting taxation that are proposed or pending in the U.S. Congress, may negatively impact the operations, cash flows or financial condition of us or our portfolio companies, impose additional costs on us or our portfolio companies, intensify the regulatory supervision of us or our portfolio companies or otherwise adversely affect our business or the business of our portfolio companies.
41
Over the last several years, there also has been an increase in regulatory attention to the extension of credit outside of the traditional banking sector, raising the possibility that some portion of the non-bank financial sector will be subject to new regulation. While it cannot be known at this time whether any regulation will be implemented or what form it will take, increased regulation of non-bank credit extension could negatively impact our operating results or financial condition, impose additional costs on us, intensify the regulatory supervision of us or otherwise adversely affect our business.
Our investment adviser's liability is limited under the investment advisory and management agreement, and we are required to indemnify our investment adviser against certain liabilities, which may lead our investment adviser to act in a riskier manner on our behalf than it would when acting for its own account.
Our investment adviser has not assumed any responsibility to us other than to render the services described in the investment advisory and management agreement, and it will not be responsible for any action of our board of directors in declining to follow our investment adviser's advice or recommendations. Pursuant to the investment advisory and management agreement, our investment adviser and its members and their respective officers, managers, partners, agents, employees, controlling persons and members and any other person or entity affiliated with it will not be liable to us for their acts under the investment advisory and management agreement, absent willful misfeasance, bad faith, gross negligence or reckless disregard in the performance of their duties. We have agreed to indemnify, defend and protect our investment adviser and its members and their respective officers, managers, partners, agents, employees, controlling persons and members and any other person or entity affiliated with it with respect to all damages, liabilities, costs and expenses resulting from acts of our investment adviser not arising out of willful misfeasance, bad faith, gross negligence or reckless disregard in the performance of their duties under the investment advisory and management agreement. These protections may lead our investment adviser to act in a riskier manner when acting on our behalf than it would when acting for its own account. See "Risk Factors—Risks Relating to Our Investments—Our investment adviser's fee structure may induce it to make certain investments, including speculative investments."
We may be obligated to pay our investment adviser certain fees even if we incur a loss.
Our investment adviser is entitled to income based fees for each fiscal quarter in an amount equal to a percentage of the excess of our pre-incentive fee net investment income for that quarter (before deducting any income based fee and capital gains incentive fees and certain other items) above a threshold return for that quarter. Our pre-incentive fee net investment income for income based fee purposes excludes realized and unrealized capital losses or depreciation and income taxes related to realized gains that we may incur in the fiscal quarter, even if such capital losses or depreciation and income taxes related to realized gains result in a net loss on our statement of operations for that quarter. Thus, we may be required to pay our investment adviser income based fees for a fiscal quarter even if there is a decline in the value of our portfolio or we incur a net loss for that quarter.
Under the investment advisory and management agreement, we will defer cash payment of any income based fee and the capital gains incentive fee otherwise earned by our investment adviser if, during the most recent four full calendar quarter periods ending on or prior to the date such payment is to be made, the sum of (a) our aggregate distributions to our stockholders and (b) our change in net assets (defined as total assets less indebtedness and before taking into account any income based fees or capital gains incentive fees accrued during the period) is less than 7.0% of our net assets (defined as total assets less indebtedness) at the beginning of such period. These calculations will be adjusted for any share issuances or repurchases. Any such deferred fees will be carried over for payment in subsequent calculation periods to the extent such payment can then be made under the investment advisory and management agreement.
42
If a portfolio company defaults on a loan that is structured to provide accrued interest, it is possible that accrued interest previously used in the calculation of income based fees will become uncollectible. Our investment adviser is not under any obligation to reimburse us for any part of income based fees it received that was based on accrued income that we never receive as a result of a default on the obligation that resulted in the accrual of such income.
RISKS RELATING TO OUR INVESTMENTS
Declines in market prices and liquidity in the corporate debt markets can result in significant net unrealized depreciation of our portfolio, which in turn would reduce our net asset value.
As a BDC, we are required to carry our investments at market value or, if no market value is ascertainable, at fair value as determined in good faith by or under the direction of our board of directors. We may take into account the following types of factors, if relevant, in determining the fair value of our investments: the enterprise value of a portfolio company (the entire value of the portfolio company to a market participant, including the sum of the values of debt and equity securities used to capitalize the enterprise at a point in time), the nature and realizable value of any collateral, the portfolio company's ability to make payments and its earnings and discounted cash flow, the markets in which the portfolio company does business, a comparison of the portfolio company's securities to similar publicly traded securities, changes in the interest rate environment and the credit markets generally that may affect the price at which similar investments would trade in their principal markets and other relevant factors. When an external event such as a purchase transaction, public offering or subsequent equity sale occurs, we use the pricing indicated by the external event to corroborate our valuation. While most of our investments are not publicly traded, applicable accounting standards require us to assume as part of our valuation process that our investments are sold in a principal market to market participants (even if we plan on holding an investment through its maturity). As a result, volatility in the capital markets can also adversely affect our investment valuations. Decreases in the market values or fair values of our investments are recorded as unrealized depreciation. The effect of all of these factors on our portfolio can reduce our net asset value by increasing net unrealized depreciation in our portfolio. Depending on market conditions, we could incur substantial realized losses and may suffer unrealized losses, which could have a material adverse effect on our business, financial condition or results of operations.
Economic recessions or downturns could impair our portfolio companies and harm our operating results.
Many of our portfolio companies may be susceptible to economic downturns or recessions and may be unable to repay our loans during these periods. Therefore, during these periods our non-performing assets may increase and the value of our portfolio may decrease if we are required to write down the values of our investments. Adverse economic conditions may also decrease the value of collateral securing some of our loans and the value of our equity investments. Economic slowdowns or recessions could lead to financial losses in our portfolio and a decrease in revenues, net income and assets. Unfavorable economic conditions also could increase our funding costs, limit our access to the capital markets or result in a decision by lenders not to extend credit to us. These events could prevent us from increasing investments and harm our operating results. We experienced to some extent such effects as a result of the economic downturn that occurred from 2008 through 2009 and may experience such effects again in any future downturn or recession.
A portfolio company's failure to satisfy financial or operating covenants imposed by us or other lenders could lead to defaults and, potentially, acceleration of the time when the loans are due and foreclosure on its assets representing collateral for its obligations, which could trigger cross defaults under other agreements and jeopardize our portfolio company's ability to meet its obligations under the
43
debt that we hold and the value of any equity securities we own. We may incur expenses to the extent necessary to seek recovery upon default or to negotiate new terms with a defaulting portfolio company.
Investments in privately held middle-market companies involve significant risks.
We primarily invest in privately held U.S. middle-market companies. Investments in privately held middle-market companies involve a number of significant risks, including the following:
- •
- these companies may have limited financial resources and may be unable to meet their obligations, which may be accompanied by a
deterioration in the value of any collateral and a reduction in the likelihood of us realizing any guarantees we may have obtained in connection with our investment;
- •
- they typically have shorter operating histories, narrower product lines and smaller market shares than larger businesses, which tend
to render them more vulnerable to competitors' actions and market conditions, as well as general economic downturns;
- •
- they typically depend on the management talents and efforts of a small group of persons; therefore, the death, disability, resignation
or termination of one or more of these persons could have a material adverse effect on our portfolio company and, in turn, on us;
- •
- there is generally little public information about these companies. These companies and their financial information are not subject to
the Exchange Act and other regulations that govern public companies, and we may be unable to uncover all material information about these companies, which may prevent us from making a fully informed
investment decision and cause us to lose money on our investments;
- •
- they generally have less predictable operating results and may require substantial additional capital to support their operations,
finance expansion or maintain their competitive position;
- •
- our executive officers, directors and our investment adviser may, in the ordinary course of business, be named as defendants in
litigation arising from our investments in our portfolio companies;
- •
- changes in laws and regulations, as well as their interpretations, may adversely affect their business, financial structure or
prospects; and
- •
- they may have difficulty accessing the capital markets to meet future capital needs.
Our debt investments may be risky and we could lose all or part of our investment.
The debt that we invest in is typically not initially rated by any rating agency, but we believe that if such investments were rated, they would be below investment grade (rated lower than "Baa3" by Moody's Investors Service, lower than "BBB–" by Fitch Ratings or lower than "BBB–" by Standard & Poor's Ratings Services), which under the guidelines established by these entities is an indication of having predominantly speculative characteristics with respect to the issuer's capacity to pay interest and repay principal. Bonds that are rated below investment grade are sometimes referred to as "high yield bonds" or "junk bonds." Therefore, our investments may result in an above average amount of risk and volatility or loss of principal. While the debt we invest in is often secured, such security does not guarantee that we will receive principal and interest payments according to the terms of the loan, or that the value of any collateral will be sufficient to allow us to recover all or a portion of the outstanding amount of the loan should we be forced to enforce our remedies.
We also may invest in assets other than first and second lien and mezzanine debt investments, including high-yield securities, U.S. government securities, credit derivatives and other structured
44
securities and certain direct equity investments. These investments entail additional risks that could adversely affect our investment returns.
Investments in equity securities, many of which are illiquid with no readily available market, involve a substantial degree of risk.
We may purchase common and other equity securities. Although common stock has historically generated higher average total returns than fixed income securities over the long-term, common stock also has experienced significantly more volatility in those returns. The equity securities we acquire may fail to appreciate and may decline in value or become worthless and our ability to recover our investment will depend on our portfolio company's success. Investments in equity securities involve a number of significant risks, including:
- •
- any equity investment we make in a portfolio company could be subject to further dilution as a result of the issuance of additional
equity interests and to serious risks as a junior security that will be subordinate to all indebtedness (including trade creditors) or senior securities in the event that the issuer is unable to meet
its obligations or becomes subject to a bankruptcy process;
- •
- to the extent that the portfolio company requires additional capital and is unable to obtain it, we may not recover our investment;
and
- •
- in some cases, equity securities in which we invest will not pay current dividends, and our ability to realize a return on our investment, as well as to recover our investment, will be dependent on the success of the portfolio company. Even if the portfolio company is successful, our ability to realize the value of our investment may be dependent on the occurrence of a liquidity event, such as a public offering or the sale of the portfolio company. It is likely to take a significant amount of time before a liquidity event occurs or we can otherwise sell our investment. In addition, the equity securities we receive or invest in may be subject to restrictions on resale during periods in which it could be advantageous to sell them.
There are special risks associated with investing in preferred securities, including:
- •
- preferred securities may include provisions that permit the issuer, at its discretion, to defer distributions for a stated period
without any adverse consequences to the issuer. If we own a preferred security that is deferring its distributions, we may be required to report income for tax purposes before we receive such
distributions;
- •
- preferred securities are subordinated to debt in terms of priority to income and liquidation payments, and therefore will be subject
to greater credit risk than debt;
- •
- preferred securities may be substantially less liquid than many other securities, such as common stock or U.S. government securities;
and
- •
- generally, preferred security holders have no voting rights with respect to the issuing company, subject to limited exceptions.
Additionally, when we invest in first lien senior secured loans (including unitranche loans), second lien senior secured loans or mezzanine debt, we may acquire warrants or other equity securities as well. Our goal is ultimately to dispose of such equity interests and realize gains upon our disposition of such interests. However, the equity interests we receive may not appreciate in value and, in fact, may decline in value. Accordingly, we may not be able to realize gains from our equity interests and any gains that we do realize on the disposition of any equity interests may not be sufficient to offset any other losses we experience.
45
We may invest, to the extent permitted by law, in the equity securities of investment funds that are operating pursuant to certain exceptions to the Investment Company Act and in advisers to similar investment funds and, to the extent we so invest, will bear our ratable share of any such company's expenses, including management and performance fees. We will also remain obligated to pay the base management fee, income based fee and capital gains incentive fee to our investment adviser with respect to the assets invested in the securities and instruments of such companies. With respect to each of these investments, each of our common stockholders will bear his or her share of the base management fee, income based fee and capital gains incentive fee due to our investment adviser as well as indirectly bearing the management and performance fees and other expenses of any such investment funds or advisers.
There may be circumstances in which our debt investments could be subordinated to claims of other creditors or we could be subject to lender liability claims.
If one of our portfolio companies were to go bankrupt, even though we may have structured our interest as senior debt, depending on the facts and circumstances, a bankruptcy court might recharacterize our debt holding as an equity investment and subordinate all or a portion of our claim to that of other creditors. In addition, lenders can be subject to lender liability claims for actions taken by them where they become too involved in the borrower's business or exercise control over the borrower. For example, we could become subject to a lender's liability claim, if, among other things, we actually render significant managerial assistance.
Our portfolio companies may incur debt or issue equity securities that rank equally with, or senior to, our investments in such companies.
Our portfolio companies may have, or may be permitted to incur, other debt, or issue other equity securities, that rank equally with, or senior to, our investments. By their terms, such instruments may provide that the holders are entitled to receive payment of dividends, interest or principal on or before the dates on which we are entitled to receive payments in respect of our investments. These debt instruments would usually prohibit the portfolio companies from paying interest on or repaying our investments in the event and during the continuance of a default under such debt. Also, in the event of insolvency, liquidation, dissolution, reorganization or bankruptcy of a portfolio company, holders of securities ranking senior to our investment in that portfolio company typically are entitled to receive payment in full before we receive any distribution in respect of our investment. After repaying such holders, the portfolio company may not have any remaining assets to use for repaying its obligation to us. In the case of securities ranking equally with our investments, we would have to share on an equal basis any distributions with other security holders in the event of an insolvency, liquidation, dissolution, reorganization or bankruptcy of the relevant portfolio company.
The rights we may have with respect to the collateral securing any junior priority loans we make to our portfolio companies may also be limited pursuant to the terms of one or more intercreditor agreements (including agreements governing "first out" and "last out" structures) that we enter into with the holders of senior debt. Under such an intercreditor agreement, at any time that senior obligations are outstanding, we may forfeit certain rights with respect to the collateral to the holders of the senior obligations. These rights may include the right to commence enforcement proceedings against the collateral, the right to control the conduct of such enforcement proceedings, the right to approve amendments to collateral documents, the right to release liens on the collateral and the right to waive past defaults under collateral documents. We may not have the ability to control or direct such actions, even if as a result our rights as junior lenders are adversely affected.
46
When we are a debt or minority equity investor in a portfolio company, we are often not in a position to exert influence on the entity, and other equity holders and management of the company may make decisions that could decrease the value of our portfolio holdings.
When we make debt or minority equity investments, we are subject to the risk that a portfolio company may make business decisions with which we disagree and the other equity holders and management of such company may take risks or otherwise act in ways that do not serve our interests. As a result, a portfolio company may make decisions that could decrease the value of our investment.
Our portfolio companies may be highly leveraged.
Some of our portfolio companies may be highly leveraged, which may have adverse consequences to these companies and to us as an investor. These companies may be subject to restrictive financial and operating covenants and the leverage may impair these companies' ability to finance their future operations and capital needs. As a result, these companies' flexibility to respond to changing business and economic conditions and to take advantage of business opportunities may be limited. Further, a leveraged company's income and net assets will tend to increase or decrease at a greater rate than if borrowed money were not used.
Our investment adviser's fee structure may induce it to make certain investments, including speculative investments.
The fees payable by us to our investment adviser may create an incentive for our investment adviser to make investments on our behalf that are risky or more speculative than would be the case in the absence of such compensation arrangement. The way in which income based fees payable to our investment adviser are determined, which are calculated as a percentage of the return on invested capital, may encourage our investment adviser to use leverage to increase the return on our investments. Under certain circumstances, the use of leverage may increase the likelihood of default, which would disfavor the holders of our common stock and the holders of securities convertible into our common stock. In addition, our investment adviser will receive the capital gains incentive fee based, in part, upon net capital gains realized on our investments. Unlike income based fees, there is no hurdle rate applicable to the capital gains incentive fee. As a result, our investment adviser may have a tendency to invest more in investments that are likely to result in capital gains as compared to income producing securities. Such a practice could result in our investing in more speculative securities than would otherwise be the case, which could result in higher investment losses, particularly during economic downturns.
The income based fees will be computed and paid on income that has been accrued but not yet received in cash, including as a result of investments with a deferred interest feature such as debt instruments with PIK interest, preferred stock with PIK dividends and zero coupon securities. If a portfolio company defaults on a loan that is structured to provide accrued interest, it is possible that accrued interest previously used in the calculation of the income based fee will become uncollectible. Our investment adviser is not under any obligation to reimburse us for any part of the fees it received that were based on such accrued interest that we never actually received.
Because of the structure of the income based fees, it is possible that we may have to pay income based fees in a quarter during which we incur a loss. For example, if we receive pre-incentive fee net investment income in excess of the hurdle rate for a quarter, we will pay the applicable income based fees even if we have incurred a loss in that quarter due to realized and/or unrealized capital losses. In addition, if market interest rates rise, our investment adviser may be able to invest our funds in debt instruments that provide for a higher return, which would increase our pre-incentive fee net investment income and make it easier for our investment adviser to surpass the fixed hurdle rate and receive income based fees.
47
Our investments in foreign companies may involve significant risks in addition to the risks inherent in U.S. investments.
Our investment strategy contemplates potential investments in foreign companies. Investing in foreign companies may expose us to additional risks not typically associated with investing in U.S. companies. These risks include changes in exchange control regulations, political and social instability, expropriation, imposition of foreign taxes (potentially at confiscatory levels), less liquid markets, less available information than is generally the case in the United States, higher transaction costs, less government supervision of exchanges, brokers and issuers, less developed bankruptcy laws, difficulty in enforcing contractual obligations, lack of uniform accounting and auditing standards and greater price volatility.
Although most of our investments will be U.S. dollar denominated, our investments that are denominated in a foreign currency will be subject to the risk that the value of a particular currency will change in relation to one or more other currencies. Among the factors that may affect currency values are trade balances, the level of short-term interest rates, differences in relative values of similar assets in different currencies, long-term opportunities for investment and capital appreciation and political developments. We may employ hedging techniques to minimize these risks, but we cannot assure you that such strategies will be effective or without risk to us.
We may expose ourselves to risks if we engage in hedging transactions.
We have and may in the future enter into hedging transactions, which may expose us to risks associated with such transactions. We may utilize instruments such as forward contracts, currency options and interest rate swaps, caps, collars and floors to seek to hedge against fluctuations in the relative values of our portfolio positions from changes in currency exchange rates and market interest rates. Use of these hedging instruments may include counter-party credit risk.
Hedging against a decline in the values of our portfolio positions does not eliminate the possibility of fluctuations in the values of such positions or prevent losses if the values of such positions decline. However, such hedging can establish other positions designed to gain from those same developments, thereby offsetting the decline in the value of such portfolio positions. Such hedging transactions may also limit the opportunity for gain if the values of the underlying portfolio positions should increase. Moreover, it may not be possible to hedge against an exchange rate or interest rate fluctuation that is so generally anticipated that we are not able to enter into a hedging transaction at an acceptable price.
The success of our hedging transactions will depend on our ability to correctly predict movements in currencies and interest rates. Therefore, while we may enter into such transactions to seek to reduce currency exchange rate and interest rate risks, unanticipated changes in currency exchange rates or interest rates may result in poorer overall investment performance than if we had not engaged in any such hedging transactions. In addition, the degree of correlation between price movements of the instruments used in a hedging strategy and price movements in the portfolio positions being hedged may vary. Moreover, for a variety of reasons, we may not seek to (or be able to) establish a perfect correlation between such hedging instruments and the portfolio holdings being hedged. Any such imperfect correlation may prevent us from achieving the intended hedge and expose us to risk of loss. In addition, it may not be possible to hedge fully or perfectly against currency fluctuations affecting the value of securities denominated in non-U.S. currencies because the value of those securities is likely to fluctuate as a result of factors not related to currency fluctuations. See also "Risk Factors-Risk Relating to Our Business-We are exposed to risks associated with changes in interest rates."
48
RISKS RELATING TO OUR COMMON STOCK AND PUBLICLY TRADED NOTES
Our shares of common stock have traded at a discount from net asset value and may do so again in the future, which could limit our ability to raise additional equity capital.
Shares of closed-end investment companies frequently trade at a market price that is less than the net asset value that is attributable to those shares. This characteristic of closed-end investment companies is separate and distinct from the risk that our net asset value per share may decline. It is not possible to accurately predict whether any shares of our common stock will trade at, above, or below net asset value. In the recent past, the stocks of BDCs as an industry, including at times shares of our common stock, have traded below net asset value and during much of 2009 traded at near historic lows as a result of concerns over liquidity, leverage restrictions and distribution requirements. When our common stock is trading below its net asset value per share, we will generally not be able to issue additional shares of our common stock at its market price without first obtaining approval for such issuance from our stockholders and our independent directors. Pursuant to approval granted at our 2014 annual stockholders meeting, we currently are permitted to sell or otherwise issue shares of our common stock at a price below net asset value, subject to certain limitations and determinations that must be made by our board of directors. Such stockholder approval expires the earlier of June 2, 2015 and the date of our 2015 annual stockholders meeting.
There is a risk that investors in our common stock may not receive dividends or that our dividends may not grow over time and that investors in our debt securities may not receive all of the interest income to which they are entitled.
We intend to make distributions on a quarterly basis to our stockholders out of assets legally available for distribution. We cannot assure you that we will achieve investment results that will allow us to make a specified level of cash distributions or year-to-year increases in cash distributions. If we declare a dividend and if more stockholders opt to receive cash distributions rather than participate in our dividend reinvestment plan, we may be forced to sell some of our investments in order to make cash dividend payments.
In addition, due to the asset coverage test applicable to us as a BDC, we may be limited in our ability to make distributions. Certain of the Facilities may also limit our ability to declare dividends if we default under certain provisions. Further, if we invest a greater amount of assets in equity securities that do not pay current dividends, it could reduce the amount available for distribution. See "Dividend/Distribution Policy."
The above-referenced restrictions on distributions may also inhibit our ability to make required interest payments to holders of our debt, which may cause a default under the terms of our debt agreements. Such a default could materially increase our cost of raising capital, as well as cause us to incur penalties under the terms of our debt agreements.
Provisions of the Maryland General Corporation Law and of our charter and bylaws could deter takeover attempts and have an adverse effect on the price of our common stock.
The Maryland General Corporation Law, our charter and our bylaws contain provisions that may discourage, delay or make more difficult a change in control of Ares Capital or the removal of our directors. We are subject to the Maryland Business Combination Act (the "Business Combination Act"), subject to any applicable requirements of the Investment Company Act. Our board of directors has adopted a resolution exempting from the Business Combination Act any business combination between us and any other person, subject to prior approval of such business combination by our board, including approval by a majority of our disinterested directors. If the resolution exempting business combinations is repealed or our board or disinterested directors do not approve a business combination, the Business Combination Act may discourage third parties from trying to acquire control of us and may increase the difficulty of consummating such an offer. Our bylaws exempt from the
49
Maryland Control Share Acquisition Act (the "Control Share Acquisition Act") acquisitions of our stock by any person. If we amend our bylaws to repeal the exemption from the Control Share Acquisition Act, subject to any applicable requirements of the Investment Company Act, the Control Share Acquisition Act also may make it more difficult for a third party to obtain control of us and may increase the difficulty of consummating such an offer.
We have also adopted measures that may make it difficult for a third party to obtain control of us, including provisions of our charter classifying our board of directors into three classes serving staggered three-year terms, and provisions of our charter authorizing our board of directors to classify or reclassify shares of our stock into one or more classes or series, to cause the issuance of additional shares of our stock, and to amend our charter from time to time, without stockholder approval, to increase or decrease the aggregate number of shares of stock or the number of shares of stock of any class or series that we have authority to issue. These provisions, as well as other provisions of our charter and bylaws, may discourage, delay, defer, make more difficult or prevent a transaction or a change in control that might otherwise be in your best interest.
Investing in our common stock may involve an above average degree of risk.
The investments we make in accordance with our investment objective may result in a higher amount of risk than alternative investment options and volatility or loss of principal. Our investments in portfolio companies may be highly speculative and aggressive and, therefore, an investment in our securities may not be suitable for someone with lower risk tolerance.
The market price of our common stock may fluctuate significantly.
The capital and credit markets have experienced periods of extreme volatility and disruption over the past several years. The market price and liquidity of the market for shares of our common stock may be significantly affected by numerous factors, some of which are beyond our control and may not be directly related to our operating performance. These factors include:
- •
- significant volatility in the market price and trading volume of securities of publicly traded RICs, BDCs or other companies in our
sector, which are not necessarily related to the operating performance of these companies;
- •
- price and volume fluctuations in the overall stock market from time to time;
- •
- the inclusion or exclusion of our common stock from certain indices;
- •
- changes in law, regulatory policies or tax guidelines, or interpretations thereof, particularly with respect to RICs or BDCs;
- •
- loss of our RIC status;
- •
- changes in our earnings or variations in our operating results;
- •
- changes in the value of our portfolio of investments;
- •
- any shortfall in revenue or net income or any increase in losses from levels expected by investors or securities analysts;
- •
- departure of Ares Capital Management's key personnel;
- •
- operating performance of companies comparable to us;
- •
- short-selling pressure with respect to shares of our common stock or BDCs generally;
- •
- future sales of our securities convertible into or exchangeable or exercisable for our common stock or the conversion of such
securities, including the Convertible Unsecured Notes;
- •
- uncertainty surrounding the strength of the U.S. economic recovery;
50
- •
- concerns regarding European sovereign debt;
- •
- general economic trends and other external factors; and
- •
- loss of a major funding source.
In the past, following periods of volatility in the market price of a company's securities, securities class action litigation has often been brought against that company. If our stock price fluctuates significantly, we may be the target of securities litigation in the future. Securities litigation could result in substantial costs and divert management's attention and resources from our business.
We may in the future determine to issue preferred stock, which could adversely affect the market value of our common stock.
The issuance of shares of preferred stock with dividend or conversion rights, liquidation preferences or other economic terms favorable to the holders of preferred stock could adversely affect the market price for our common stock by making an investment in the common stock less attractive. In addition, the dividends on any preferred stock we issue must be cumulative. Payment of dividends and repayment of the liquidation preference of preferred stock must take preference over any dividends or other payments to our common stockholders, and holders of preferred stock are not subject to any of our expenses or losses and are not entitled to participate in any income or appreciation in excess of their stated preference (other than convertible preferred stock that converts into common stock). In addition, under the Investment Company Act, preferred stock constitutes a "senior security" for purposes of the 200% asset coverage test.
Our stockholders will experience dilution in their ownership percentage if they opt out of our dividend reinvestment plan.
All dividends declared in cash payable to stockholders that are participants in our dividend reinvestment plan are automatically reinvested in shares of our common stock. As a result, our stockholders that opt out of our dividend reinvestment plan will experience dilution in their ownership percentage of our common stock over time.
Our stockholders may experience dilution upon the conversion of the Convertible Unsecured Notes.
The February 2016 Convertible Notes are convertible into shares of our common stock beginning August 15, 2015 or, under certain circumstances, earlier. The June 2016 Convertible Notes are convertible into shares of our common stock beginning on December 15, 2015 or, under certain circumstances, earlier. The 2017 Convertible Notes are convertible into shares of our common stock beginning on September 15, 2016 or, under certain circumstances, earlier. The 2018 Convertible Notes are convertible into shares of our common stock beginning on July 15, 2017 or, under certain circumstances, earlier. The 2019 Convertible Notes are convertible into shares of our common stock beginning on July 15, 2018 or, under certain circumstances, earlier. Upon conversion of the Convertible Unsecured Notes, we have the choice to pay or deliver, as the case may be, at our election, cash, shares of our common stock or a combination of cash and shares of our common stock. As of December 31, 2014, the conversion price of the February 2016 Convertible Notes was effectively $18.52 per share of common stock, the conversion price of the June 2016 Convertible Notes was effectively $18.43 per share, the conversion price of the 2017 Convertible Notes was effectively $19.01 per share, the conversion price of the 2018 Convertible Notes was effectively $19.70 per share and the conversion price of the 2019 Convertible Notes was effectively $20.05 per share, in each case taking into account certain de minimis adjustments that will be made on the conversion date and subject to further adjustment in certain circumstances. If we elect to deliver shares of common stock upon a conversion at the time our tangible book value per share exceeds the conversion price in effect at such time, our stockholders may incur dilution. In addition, our stockholders will experience dilution in their ownership percentage of common stock upon our issuance of common stock in connection with
51
the conversion of the Convertible Unsecured Notes and any dividends paid on our common stock will also be paid on shares issued in connection with such conversion after such issuance.
Our stockholders may receive shares of our common stock as dividends, which could result in adverse tax consequences to them.
In order to satisfy the annual distribution requirement applicable to RICs, we have the ability to declare a large portion of a dividend in shares of our common stock instead of in cash. As long as a portion of such dividend is paid in cash (which portion could be as low as 20%) and certain requirements are met, the entire distribution would be treated as a dividend for U.S. federal income tax purposes. As a result, a stockholder would be taxed on 100% of the fair market value of the shares received as part of the dividend on the date a stockholder received it in the same manner as a cash dividend, even though most of the dividend was paid in shares of our common stock.
Sales of substantial amounts of our common stock in the public market may have an adverse effect on the market price of our common stock.
Sales of substantial amounts of our common stock, or the availability of such common stock for sale (including as a result of the conversion of our Convertible Unsecured Notes into common stock), could adversely affect the prevailing market prices for our common stock. If this occurs and continues, it could impair our ability to raise additional capital through the sale of securities should we desire to do so.
The trading market or market value of our publicly issued debt securities may fluctuate.
Our publicly issued debt securities may or may not have an established trading market. We cannot assure holders of our debt securities that a trading market for our publicly issued debt securities will ever develop or be maintained if developed. In addition to our creditworthiness, many factors may materially adversely affect the trading market for, and market value of, our publicly issued debt securities. These factors include, but are not limited to, the following:
- •
- the time remaining to the maturity of these debt securities;
- •
- the outstanding principal amount of debt securities with terms identical to these debt securities;
- •
- the ratings assigned by national statistical ratings agencies;
- •
- the general economic environment;
- •
- the supply of such debt securities trading in the secondary market, if any;
- •
- the redemption or repayment features, if any, of these debt securities;
- •
- the level, direction and volatility of market interest rates generally; and
- •
- market rates of interest higher or lower than rates borne by the debt securities.
Holders of our debt securities should also be aware that there may be a limited number of buyers if and when they decide to sell their debt securities. This too may materially adversely affect the market value of the debt securities or the trading market for the debt securities.
Terms relating to redemption may materially adversely affect our noteholders' return on any debt securities that we may issue.
If our noteholders' debt securities are redeemable at our option, we may choose to redeem their debt securities at times when prevailing interest rates are lower than the interest rate paid on their debt securities. In addition, if our noteholders' debt securities are subject to mandatory redemption, we may be required to redeem their debt securities also at times when prevailing interest rates are lower than the interest rate paid on their debt securities. In this circumstance, our noteholders may not be able to
52
reinvest the redemption proceeds in a comparable security at an effective interest rate as high as their debt securities being redeemed.
Our credit ratings may not reflect all risks of an investment in our debt securities.
Our credit ratings are an assessment by third parties of our ability to pay our obligations. Consequently, real or anticipated changes in our credit ratings will generally affect the market value of our debt securities. Our credit ratings, however, may not reflect the potential impact of risks related to market conditions generally or other factors discussed above on the market value of or trading market for the publicly issued debt securities.
Item 1B. Unresolved Staff Comments
None.
We do not own any real estate or other physical properties materially important to our operation. Our headquarters are currently located at 245 Park Avenue, 44th Floor, New York, New York 10167. We are party to office leases pursuant to which we are leasing office facilities from third parties. For certain of these office leases, we have also entered into separate subleases with Ares Management LLC and IHAM, pursuant to which Ares Management LLC, the sole member of Ares Capital Management, and IHAM sublease a portion of these leases. Ares Management LLC has also entered into separate subleases with us, pursuant to which we sublease certain office spaces from Ares Management LLC.
We are party to certain lawsuits in the normal course of business. In addition, Allied Capital was involved in various legal proceedings that we assumed in connection with the Allied Acquisition. Furthermore, third parties may try to seek to impose liability on us in connection with our activities or the activities of our portfolio companies. While the outcome of any such legal proceedings cannot at this time be predicted with certainty, we do not expect that these legal proceedings will materially affect our business, financial condition or results of operations.
On May 20, 2013, we were named as one of several defendants in an action (the "Action") filed in the United States District Court for the Eastern District of Pennsylvania (the "Pennsylvania Court") by the bankruptcy trustee of DSI Renal Holdings LLC and two related companies. On March 17, 2014, the Action was transferred to the United States District Court for the District of Delaware (the "Delaware Court") pursuant to a motion filed by the defendants and granted by the Pennsylvania Court. On May 6, 2014, the Delaware Court referred the Action to the United States Bankruptcy Court for the District of Delaware. The complaint in the Action alleges, among other things, that each of the named defendants participated in a purported "fraudulent transfer" involving the restructuring of a subsidiary of DSI Renal Holdings LLC. Among other things, the complaint seeks, jointly and severally from all defendants, (1) damages of approximately $425 million, of which the complaint states our individual share is approximately $117 million, and (2) punitive damages. We are currently unable to assess with any certainty whether we may have any exposure in the Action. We believe the plaintiff's claims are without merit and intend to vigorously defend ourselves in the Action.
Item 4. Mine Safety Disclosures
Not applicable.
53
Item 5. Market For Registrant's Common Equity, Related Stockholder Matters And Issuer Purchases Of Equity Securities
Our common stock is traded on The NASDAQ Global Select Market under the symbol "ARCC." Our common stock has historically traded at prices both above and below our net asset value per share. It is not possible to accurately predict whether our common stock will trade at, above or below net asset value. See "Risk Factors—Risks Relating to our Common Stock and Publicly Traded Notes—Our shares of common stock have traded at a discount from net asset value and may do so again in the future, which could limit our ability to raise additional equity capital."
The following table sets forth the net asset value per share of our common stock, the range of high and low closing sales prices of our common stock as reported on The NASDAQ Global Select Market and the dividends paid by us in each fiscal quarter for the years ended December 31, 2014 and 2013. On February 24, 2015, the last reported closing sales price of our common stock on The NASDAQ Global Select Market was $17.05 per share, which represented a premium of approximately 1.4% to the net asset value per share reported by us as of December 31, 2014.
| |
|
Price Range | |
||||||||||
|---|---|---|---|---|---|---|---|---|---|---|---|---|---|
| |
Net Asset Value(1) |
Cash Dividend Per Share(2) |
|||||||||||
| |
High | Low | |||||||||||
Fiscal 2013 |
|||||||||||||
First Quarter |
$ | 15.98 | $ | 18.54 | $ | 17.66 | $ | 0.38 | |||||
Second Quarter |
$ | 16.21 | $ | 18.27 | $ | 16.42 | $ | 0.38 | |||||
Third Quarter |
$ | 16.35 | $ | 18.12 | $ | 17.03 | $ | 0.38 | |||||
Fourth Quarter |
$ | 16.46 | $ | 18.38 | $ | 17.06 | $ | 0.43 | (3) | ||||
Fiscal 2014 |
|||||||||||||
First Quarter |
$ | 16.42 | $ | 18.51 | $ | 17.36 | $ | 0.43 | (3) | ||||
Second Quarter |
$ | 16.52 | $ | 17.86 | $ | 16.50 | $ | 0.38 | |||||
Third Quarter |
$ | 16.71 | $ | 17.80 | $ | 16.12 | $ | 0.38 | |||||
Fourth Quarter |
$ | 16.82 | $ | 16.45 | $ | 14.66 | $ | 0.38 | |||||
- (1)
- Net
asset value per share is determined as of the last day in the relevant quarter and therefore may not reflect the net asset value per share on the date
of the high and low closing sales prices. The net asset values shown are based on outstanding shares at the end of the relevant quarter.
- (2)
- Represents
the dividends paid in the relevant quarter.
- (3)
- Consists of a quarterly dividend of $0.38 per share and an additional dividend of $0.05 per share.
As of February 24, 2015, there were 1,682 holders of record of our common stock (including Cede & Co.).
We currently intend to distribute dividends or make distributions to our stockholders on a quarterly basis out of assets legally available for distribution. We may also distribute additional dividends or make additional distributions to our stockholders from time to time. Our quarterly and additional dividends or distributions, if any, will be determined by our board of directors.
54
The following table summarizes our dividends declared and payable for 2013 and 2014:
Date Declared
|
Record Date | Payment Date | Amount | |||||
|---|---|---|---|---|---|---|---|---|
February 27, 2013 |
March 15, 2013 | March 29, 2013 | $ | 0.38 | ||||
May 7, 2013 |
June 14, 2013 | June 28, 2013 | $ | 0.38 | ||||
August 6, 2013 |
September 16, 2013 | September 30, 2013 | $ | 0.38 | ||||
November 5, 2013 |
December 16, 2013 | December 31, 2013 | $ | 0.38 | ||||
November 5, 2013 |
December 16, 2013 | December 31, 2013 | $ | 0.05 | (1) | |||
| | | | | | | | | |
Total declared and payable for 2013 |
$ | 1.57 | ||||||
| | | | | | | | | |
November 5, 2013 |
March 14, 2014 | March 28, 2014 | $ | 0.05 | (1) | |||
February 26, 2014 |
March 14, 2014 | March 31, 2014 | $ | 0.38 | ||||
May 6, 2014 |
June 16, 2014 | June 30, 2014 | $ | 0.38 | ||||
August 5, 2014 |
September 15, 2014 | September 30, 2014 | $ | 0.38 | ||||
November 4, 2014 |
December 15, 2014 | December 31, 2014 | $ | 0.38 | ||||
| | | | | | | | | |
Total declared and payable for 2014 |
$ | 1.57 | ||||||
| | | | | | | | | |
- (1)
- Represents an additional dividend.
Of the $1.57 per share in dividends declared and payable for the year ended December 31, 2014, the entire $1.57 per share was comprised of ordinary income. Of the $1.57 per share in dividends declared and payable for the year ended December 31, 2013, the entire $1.57 per share was comprised of ordinary income.
To maintain our RIC status, we must timely distribute an amount equal to at least 90% of our investment company taxable income (as defined by the Code, which generally includes net ordinary income and net short term capital gains) to our stockholders. In addition, we generally will be required to pay an excise tax equal to 4% on certain undistributed taxable income unless we distribute in a timely manner an amount at least equal to the sum of (i) 98% of our ordinary income recognized during a calendar year and (ii) 98.2% of our capital gain net income, as defined by the Code, recognized for the one year period ending October 31st in that calendar year and (iii) any income recognized, but not distributed, in preceding years. The taxable income on which we pay excise tax is generally distributed to our stockholders in the next tax year. Depending on the level of taxable income earned in a tax year, we may choose to carry forward such taxable income for distribution in the following year, and pay any applicable excise tax. For the years ended December 31, 2014 and 2013, we recorded a net excise tax expense of $5.5 million and $10.3 million, respectively. We cannot assure you that we will achieve results that will permit the payment of any cash distributions. We maintain an "opt out" dividend reinvestment plan for our common stockholders. As a result, if we declare a cash dividend, stockholders' cash dividends will be automatically reinvested in additional shares of our common stock, unless they specifically opt out of the dividend reinvestment plan so as to receive cash dividends.
RECENT SALES OF UNREGISTERED EQUITY SECURITIES
We did not sell any securities during the period covered by this Annual Report that were not registered under the Securities Act.
ISSUER PURCHASES OF EQUITY SECURITIES
During the year ended December 31, 2014, as a part of our dividend reinvestment plan for our common stockholders, we purchased 336,262 shares of our common stock for an average price per share of $16.19 in the open market in order to satisfy the reinvestment portion of our dividends. The
55
following chart outlines such purchases of our common stock during the year ended December 31, 2014.
Period
|
Total Number of Shares Purchased |
Average Price Paid Per Share |
Total Number of Shares Purchased as Part of Publicly Announced Plans or Programs |
Maximum (or Approximate Dollar Value) of Shares that May Yet Be Purchased Under the Plans or Programs |
|||||||||
|---|---|---|---|---|---|---|---|---|---|---|---|---|---|
January 1, 2014 through January 31, 2014 |
— | — | — | — | |||||||||
February 1, 2014 through February 28, 2014 |
— | — | — | — | |||||||||
March 1, 2014 through March 31, 2014 |
— | — | — | — | |||||||||
April 1, 2014 through April 30, 2014 |
— | — | — | — | |||||||||
May 1, 2014 through May 31, 2014 |
— | — | — | — | |||||||||
June 1, 2014 through June 30, 2014 |
— | — | — | — | |||||||||
July 1, 2014 through July 31, 2014 |
— | — | — | — | |||||||||
August 1, 2014 through August 31, 2014 |
— | — | — | — | |||||||||
September 1, 2014 through September 30, 2014 |
— | — | — | — | |||||||||
October 1, 2014 through October 31, 2014 |
336,262 | $ | 16.19 | — | — | ||||||||
November 1, 2014 through November 30, 2014 |
— | — | — | — | |||||||||
December 1, 2014 through December 31, 2014 |
— | — | — | — | |||||||||
| | | | | | | | | | | | | | |
Total |
336,262 | $ | 16.19 | — | — | ||||||||
| | | | | | | | | | | | | | |
| | | | | | | | | | | | | | |
| | | | | | | | | | | | | | |
56
COMPARISON OF CUMULATIVE TOTAL RETURN AMONG ARES CAPITAL
CORPORATION, S&P 500 INDEX AND SNL US INVESTMENT COMPANY INDEX
Total Return Performance
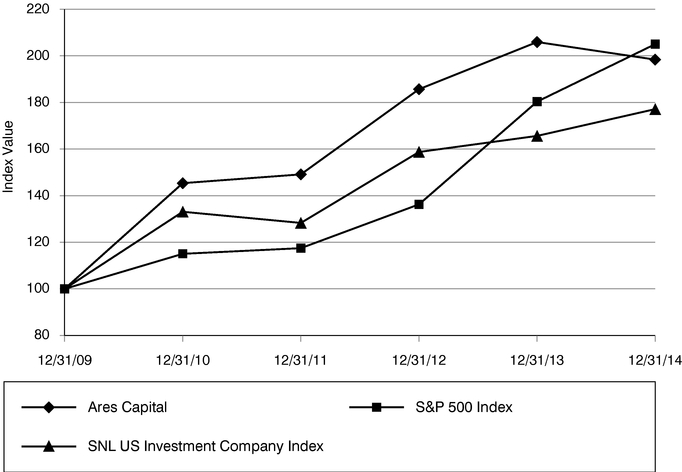
| SOURCE: | SNL Financial LC | |
| NOTES: | Assumes $100 invested December 31, 2009 in Ares Capital, the S&P 500 Index and the SNL US Investment Company Index. Assumes all dividends are reinvested on the respective dividend payment dates without commissions. |
| |
Dec09 | Dec10 | Dec11 | Dec12 | Dec13 | Dec14 | |||||||||||||
|---|---|---|---|---|---|---|---|---|---|---|---|---|---|---|---|---|---|---|---|
Ares Capital |
100.00 | 145.42 | 149.19 | 185.78 | 206.06 | 198.50 | |||||||||||||
S&P 500 Index |
100.00 | 115.06 | 117.49 | 136.30 | 180.44 | 205.14 | |||||||||||||
SNL US Investment Company Index |
100.00 | 133.13 | 128.33 | 158.81 | 165.72 | 177.23 | |||||||||||||
The graph and other information furnished under this Part II Item 5(d) of this Form 10-K shall not be deemed to be "soliciting material" or to be "filed" with the SEC or subject to Regulation 14A or 14C, or to the liabilities of Section 18 of the Exchange Act, as amended.
57
Item 6. Selected Financial Data
The following selected financial and other data for the years ended December 31, 2014, 2013, 2012, 2011 and 2010 are derived from our consolidated financial statements which have been audited by KPMG LLP, an independent registered public accounting firm whose report thereon is included elsewhere in this Annual Report. The data should be read in conjunction with our consolidated financial statements and notes thereto and "Management's Discussion and Analysis of Financial Condition and Results of Operations," which are included elsewhere in this Annual Report.
ARES CAPITAL CORPORATION AND SUBSIDIARIES
SELECTED FINANCIAL DATA
(dollar amounts in millions, except per share data)
| |
As of and For the Years Ended December 31, | |||||||||||||||
|---|---|---|---|---|---|---|---|---|---|---|---|---|---|---|---|---|
| |
2014 | 2013 | 2012 | 2011 | 2010 | |||||||||||
Total Investment Income |
$ | 989.0 | $ | 881.7 | $ | 748.0 | $ | 634.5 | $ | 483.4 | ||||||
Total Expenses |
532.9 | 437.2 | 387.9 | 344.6 | 262.2 | |||||||||||
| | | | | | | | | | | | | | | | | |
Net Investment Income Before Income Taxes |
456.1 | 444.5 | 360.1 | 289.9 | 221.2 | |||||||||||
Income Tax Expense, Including Excise Tax |
18.3 | 14.1 | 11.2 | 7.5 | 5.4 | |||||||||||
| | | | | | | | | | | | | | | | | |
Net Investment Income |
437.8 | 430.4 | 348.9 | 282.4 | 215.8 | |||||||||||
Net Realized and Unrealized Gains on Investments, Foreign Currencies, Extinguishment of Debt and Other Assets |
153.2 | 58.1 | 159.3 | 37.1 | 280.1 | |||||||||||
Gain on the Allied Acquisition |
— | — | — | — | 195.9 | |||||||||||
| | | | | | | | | | | | | | | | | |
Net Increase in Stockholders' Equity Resulting from Operations |
$ | 591.0 | $ | 488.5 | $ | 508.2 | $ | 319.5 | $ | 691.8 | ||||||
| | | | | | | | | | | | | | | | | |
| | | | | | | | | | | | | | | | | |
| | | | | | | | | | | | | | | | | |
Per Share Data: |
||||||||||||||||
Net Increase in Stockholders' Equity Resulting from Operations: |
||||||||||||||||
Basic |
$ | 1.94 | $ | 1.83 | $ | 2.21 | $ | 1.56 | $ | 3.91 | ||||||
Diluted |
$ | 1.94 | $ | 1.83 | $ | 2.21 | $ | 1.56 | $ | 3.91 | ||||||
Cash Dividends Declared and Payable(1) |
$ | 1.57 | $ | 1.57 | $ | 1.60 | $ | 1.41 | $ | 1.40 | ||||||
Net Asset Value |
$ | 16.82 | $ | 16.46 | $ | 16.04 | $ | 15.34 | $ | 14.92 | ||||||
Total Assets |
$ | 9,497.8 | $ | 8,141.5 | $ | 6,401.2 | $ | 5,387.4 | $ | 4,562.5 | ||||||
Total Debt (Carrying Value) |
$ | 3,924.5 | $ | 2,986.3 | $ | 2,195.9 | $ | 2,073.6 | $ | 1,378.5 | ||||||
Total Debt (Principal Value) |
$ | 3,999.3 | $ | 3,078.8 | $ | 2,293.8 | $ | 2,170.5 | $ | 1,435.1 | ||||||
Total Stockholders' Equity |
$ | 5,283.7 | $ | 4,904.4 | $ | 3,988.3 | $ | 3,147.3 | $ | 3,050.5 | ||||||
Other Data: |
||||||||||||||||
Number of Portfolio Companies at Period End(2) |
205 | 193 | 152 | 141 | 170 | |||||||||||
Principal Amount of Investments Purchased |
$ | 4,534.3 | $ | 3,493.2 | $ | 3,161.6 | $ | 3,239.0 | $ | 1,583.9 | ||||||
Principal Amount of Investments Acquired as part of the Allied Acquisition |
$ | — | $ | — | $ | — | $ | — | $ | 1,833.8 | ||||||
Principal Amount of Investments Sold and Repayments |
$ | 3,212.8 | $ | 1,801.4 | $ | 2,482.9 | $ | 2,468.2 | $ | 1,555.9 | ||||||
Total Return Based on Market Value(3) |
(3.3 | )% | 10.5 | % | 23.6 | % | 2.3 | % | 43.6 | % | ||||||
Total Return Based on Net Asset Value(4) |
11.8 | % | 11.4 | % | 14.3 | % | 10.5 | % | 31.6 | % | ||||||
Weighted Average Yield of Debt and Other Income Producing Securities at Fair Value(5) |
10.1 | % | 10.4 | % | 11.3 | % | 12.0 | % | 12.9 | % | ||||||
Weighted Average Yield of Debt and Other Income Producing Securities at Amortized Cost(5) |
10.1 | % | 10.4 | % | 11.4 | % | 12.1 | % | 13.2 | % | ||||||
- (1)
- Includes
an additional dividend of $0.05 per share paid in the year ended December 31, 2014, an additional dividend of $0.05 per share paid in the
year ended December 31, 2013 and additional dividends of $0.10 per share in the aggregate paid in the year ended December 31, 2012.
- (2)
- Includes
commitments to portfolio companies for which funding had yet to occur.
- (3)
- For the year ended December 31, 2014, the total return based on market value equaled the decrease of the ending market value at December 31, 2014 of $15.61 per share from the ending market value at December 31, 2013 of $17.77 per share plus the declared and payable dividends of $1.57 per share for the
58
year ended December 31, 2014, divided by the market value at December 31, 2013. For the year ended December 31, 2013, the total return based on market value equaled the increase of the ending market value at December 31, 2013 of $17.77 per share from the ending market value at December 31, 2012 of $17.50 per share plus the declared and payable dividends of $1.57 per share for the year ended December 31, 2013, divided by the market value at December 31, 2012. For the year ended December 31, 2012, the total return based on market value equaled the increase of the ending market value at December 31, 2012 of $17.50 per share from the ending market value at December 31, 2011 of $15.45 per share plus the declared and payable dividends of $1.60 per share for the year ended December 31, 2012, divided by the market value at December 31, 2011. For the year ended December 31, 2011, the total return based on market value equaled the decrease of the ending market value at December 30, 2011 of $15.45 per share from the ending market value at December 31, 2010 of $16.48 per share plus the declared and payable dividends of $1.41 per share for the year ended December 31, 2011, divided by the market value at December 31, 2010. For the year ended December 31, 2010, the total return based on market value equaled the increase of the ending market value at December 31, 2010 of $16.48 per share from the ending market value at December 31, 2009 of $12.45 per share plus the declared and payable dividends of $1.40 per share for the year ended December 31, 2010, divided by the market value at December 31, 2009. The Company's shares fluctuate in value. The Company's performance changes over time and currently may be different than that shown. Past performance is no guarantee of future results.
- (4)
- For
the year ended December 31, 2014, the total return based on net asset value equaled the change in net asset value during the period plus the
declared and payable dividends of $1.57 per share for the year ended December 31, 2014, divided by the beginning net asset value. For the year ended December 31, 2013, the total return
based on net asset value equaled the change in net asset value during the period plus the declared and payable dividends of $1.57 per share for the year ended December 31, 2013, divided by the
beginning net asset value. For the year ended December 31, 2012, the total return based on net asset value equaled the change in net asset value during the period plus the declared and payable
dividends of $1.60 per share for the year ended December 31, 2012 divided by the beginning net asset value for the period. For the year ended December 31, 2011, the total return based on
net asset value equaled the change in net asset value during the period plus the declared and payable dividends of $1.41 per share for the year ended December 31, 2011 divided by the beginning
net asset value for the period. For the year ended December 31, 2010, the total return based on net asset value equaled the change in net asset value during the period plus the declared and
payable dividends of $1.40 per share for the year ended December 31, 2010, divided by the beginning net asset value. These calculations are adjusted for shares issued in connection with the
dividend reinvestment plan and the issuance of common stock in connection with any equity offerings and the equity components of any convertible notes issued during the period. The Company's
performance changes over time and currently may be different than that shown. Past performance is no guarantee of future results.
- (5)
- Weighted average yield of debt and other income producing securities at fair value is computed as (a) the annual stated interest rate or yield earned plus the net annual amortization of original issue discount and market discount or premium earned on accruing debt and other income producing securities, divided by (b) total accruing debt and other income producing securities at fair value and other income producing securities. Weighted average yield of debt and other income producing securities at amortized cost is computed as (a) annual stated interest rate or yield earned plus the net annual amortization of original issue discount and market discount or premium earned on accruing debt and other income producing securities, divided by (b) total accruing debt and other income producing securities at amortized cost.
59
Item 7. Management's Discussion And Analysis Of Financial Condition And Results Of Operations
The information contained in this section should be read in conjunction with the Selected Financial Data and our financial statements and notes thereto appearing elsewhere in this Annual Report. In addition, some of the statements in this Annual Report (including in the following discussion) constitute forward- looking statements, which relate to future events or the future performance or financial condition of Ares Capital Corporation (the "Company," "ARCC," "Ares Capital," "we," "us," or "our"). The forward-looking statements contained in this report involve a number of risks and uncertainties, including statements concerning:
- •
- our, or our portfolio companies', future business, operations, operating results or prospects;
- •
- the return or impact of current and future investments;
- •
- the impact of a protracted decline in the liquidity of credit markets on our business;
- •
- the impact of fluctuations in interest rates on our business;
- •
- the impact of changes in laws or regulations (including the interpretation thereof) governing our operations or the operations of our
portfolio companies or the operations of our competitors;
- •
- the valuation of our investments in portfolio companies, particularly those having no liquid trading market;
- •
- our ability to recover unrealized losses;
- •
- market conditions and our ability to access alternative debt markets and additional debt and equity capital;
- •
- our contractual arrangements and relationships with third parties;
- •
- the general economy and its impact on the industries in which we invest;
- •
- uncertainty surrounding the financial stability of the U.S. and the EU;
- •
- Middle East turmoil and the potential for fluctuating energy prices and its impact on the industries in which we invest;
- •
- the financial condition of and ability of our current and prospective portfolio companies to achieve their objectives;
- •
- our expected financings and investments;
- •
- our ability to successfully complete and integrate any acquisitions;
- •
- the adequacy of our cash resources and working capital;
- •
- the timing, form and amount of any dividend distributions;
- •
- the timing of cash flows, if any, from the operations of our portfolio companies; and
- •
- the ability of our investment adviser to locate suitable investments for us and to monitor and administer our investments.
We use words such as "anticipates," "believes," "expects," "intends," "will," "should," "may" and similar expressions to identify forward-looking statements, although not all forward-looking statements include these words. Our actual results and condition could differ materially from those implied or expressed in the forward-looking statements for any reason, including the factors set forth in "Risk Factors" and elsewhere in this Annual Report.
We have based the forward-looking statements included in this Annual Report on information available to us on the date of this Annual Report, and we assume no obligation to update any such forward-looking statements. Although we undertake no obligation to revise or update any forward-
60
looking statements, whether as a result of new information, future events or otherwise, you are advised to consult any additional disclosures that we may make directly to you or through reports that we have filed or in the future may file with the SEC, including annual reports on Form 10-K, registration statements on Form N-2, quarterly reports on Form 10-Q and current reports on Form 8-K.
OVERVIEW
We are a specialty finance company that is a closed-end, non-diversified management investment company incorporated in Maryland. We have elected to be regulated as a BDC under the Investment Company Act.
We are externally managed by Ares Capital Management, a subsidiary of Ares Management, a publicly traded, leading global alternative asset manager, pursuant to our investment advisory and management agreement. Ares Operations, a subsidiary of Ares Management, provides certain administrative and other services necessary for us to operate.
Our investment objective is to generate both current income and capital appreciation through debt and equity investments. We invest primarily in first lien senior secured loans (including unitranche loans), second lien senior secured loans and mezzanine debt, which in some cases includes an equity component like warrants.
To a lesser extent, we also make preferred and/or common equity investments, which have generally been non-control equity investments, of less than $20 million (usually in conjunction with a concurrent debt investment). However, we may increase the size or change the nature of these investments.
Since our initial public offering on October 8, 2004 through December 31, 2014, our exited investments resulted in an aggregate cash flow realized internal rate of return to us of approximately 13% (based on original cash invested, net of syndications, of approximately $9.9 billion and total proceeds from such exited investments of approximately $12.1 billion). Internal rate of return is the discount rate that makes the net present value of all cash flows related to a particular investment equal to zero. Internal rate of return is gross of expenses related to investments as these expenses are not allocable to specific investments. Investments are considered to be exited when the original investment objective has been achieved through the receipt of cash and/or non-cash consideration upon the repayment of a debt investment or sale of an investment or through the determination that no further consideration was collectible and, thus, a loss may have been realized. Approximately 71% of these exited investments resulted in an aggregate cash flow realized internal rate of return to us of 10% or greater.
Additionally, since our initial public offering on October 8, 2004 through December 31, 2014, our realized gains have exceeded our realized losses by approximately $351 million (excluding a one-time gain on the acquisition of Allied Capital and realized gains/losses from the extinguishment of debt and other assets). For this same time period, our average annualized net realized gain rate was approximately 1.1% (excluding a one-time gain on the acquisition of Allied Capital and realized gains/losses from the extinguishment of debt and other assets). Net realized gain/loss rates for a particular period are the amount of net realized gains/losses during such period divided by the average quarterly investments at amortized cost in such period.
Information included herein regarding internal rates of return, realized gains and losses and annualized net realized gain rates are historical results relating to our past performance and are not necessarily indicative of future results, the achievement of which cannot be assured.
As a BDC, we are required to comply with certain regulatory requirements. For instance, we generally have to invest at least 70% of our total assets in "qualifying assets," including securities and indebtedness of private U.S. companies and certain public U.S. companies, cash, cash equivalents, U.S. government securities and high-quality debt investments that mature in one year or less. We also may
61
invest up to 30% of our portfolio in non-qualifying assets, as permitted by the Investment Company Act. Specifically, as part of this 30% basket, we may invest in entities that are not considered "eligible portfolio companies" (as defined in the Investment Company Act), including companies located outside of the United States, entities that are operating pursuant to certain exceptions under the Investment Company Act, and publicly traded entities whose public equity market capitalization exceeds the levels provided for under the Investment Company Act.
We have elected to be treated as a RIC, under the Code, and operate in a manner so as to qualify for the tax treatment applicable to RICs. To qualify as a RIC, we must, among other things, meet certain source-of-income and asset diversification requirements and timely distribute to our stockholders generally at least 90% of our investment company taxable income, as defined by the Code, for each year. Pursuant to this election, we generally will not have to pay U.S. federal corporate-level taxes on any income that we distribute to our stockholders provided that we satisfy those requirements.
62
PORTFOLIO AND INVESTMENT ACTIVITY
Our investment activity for the years ended December 31, 2014, 2013 and 2012 is presented below (information presented herein is at amortized cost unless otherwise indicated).
| |
For the Years Ended December 31, | |||||||||
|---|---|---|---|---|---|---|---|---|---|---|
(dollar amounts in millions)
|
2014 | 2013 | 2012 | |||||||
New investment commitments(1): |
||||||||||
New portfolio companies |
$ | 2,283.8 | $ | 2,148.5 | $ | 1,794.7 | ||||
Existing portfolio companies(2) |
2,294.8 | 1,854.4 | 1,402.3 | |||||||
| | | | | | | | | | | |
Total new investment commitments |
4,578.6 | 4,002.9 | 3,197.0 | |||||||
Less: |
||||||||||
Investment commitments exited |
3,539.8 | 1,840.0 | 2,614.5 | |||||||
| | | | | | | | | | | |
Net investment commitments |
$ | 1,038.8 | $ | 2,162.9 | $ | 582.5 | ||||
Principal amount of investments funded: |
||||||||||
First lien senior secured loans |
$ | 2,642.1 | $ | 2,011.1 | $ | 1,953.3 | ||||
Second lien senior secured loans |
1,046.9 | 602.8 | 733.1 | |||||||
Subordinated certificates of the SSLP(3) |
463.6 | 652.5 | 270.0 | |||||||
Senior subordinated debt |
298.8 | 181.0 | 101.3 | |||||||
Preferred equity securities |
13.7 | 1.8 | — | |||||||
Other equity securities |
69.2 | 44.0 | 103.9 | |||||||
| | | | | | | | | | | |
Total |
$ | 4,534.3 | $ | 3,493.2 | $ | 3,161.6 | ||||
Principal amount of investments sold or repaid: |
||||||||||
First lien senior secured loans |
2,326.0 | $ | 885.8 | $ | 1,455.9 | |||||
Second lien senior secured loans |
444.3 | 526.1 | 331.0 | |||||||
Subordinated certificates of the SSLP |
174.3 | 145.2 | 66.3 | |||||||
Senior subordinated debt |
143.5 | 201.0 | 409.0 | |||||||
Preferred equity securities |
31.2 | 26.3 | 26.2 | |||||||
Other equity securities |
88.7 | 16.8 | 126.0 | |||||||
Commercial real estate |
4.8 | 0.2 | 13.0 | |||||||
Collateralized loan obligations |
— | — | 55.5 | |||||||
| | | | | | | | | | | |
Total |
$ | 3,212.8 | $ | 1,801.4 | $ | 2,482.9 | ||||
Number of new investment commitments(4) |
115 | 95 | 82 | |||||||
Average new investment commitment amount |
$ | 39.8 | $ | 42.1 | $ | 39.0 | ||||
Weighted average term for new investment commitments (in months) |
73 | 74 | 66 | |||||||
Percentage of new investment commitments at floating rates |
90 | % | 89 | % | 88 | % | ||||
Percentage of new investment commitments at fixed rates |
8 | % | 10 | % | 8 | % | ||||
Weighted average yield of debt and other income producing securities(5): |
||||||||||
Funded during the period at amortized cost |
9.0 | % | 9.8 | % | 9.9 | % | ||||
Funded during the period at fair value(6) |
9.0 | % | 9.8 | % | 9.9 | % | ||||
Exited or repaid during the period at amortized cost |
8.3 | % | 9.8 | % | 9.7 | % | ||||
Exited or repaid during the period at fair value(6) |
8.3 | % | 9.7 | % | 9.6 | % | ||||
- (1)
- New
investment commitments include new agreements to fund revolving credit facilities or delayed draw loans.
- (2)
- Includes investment commitments to the SSLP to make co-investments with GE in first lien senior secured loans of middle market companies of $494.2 million, $736.6 million and $270.0 million for the years ended December 31, 2014, 2013 and 2012, respectively.
63
- (3)
- See
"Senior Secured Loan Program" below and Note 4 to our consolidated financial statements for the year ended December 31, 2014 for more
information on the SSLP.
- (4)
- Number
of new investment commitments represents each commitment to a particular portfolio company or a commitment to multiple companies as part of an
individual transaction (e.g., the purchase of a portfolio of investments).
- (5)
- "Weighted
average yield of debt and other income producing securities at amortized cost" is computed as the (a) annual stated interest rate or yield
earned plus the net annual amortization of original issue discount and market discount or premium earned on accruing debt and other income producing securities, divided by (b) total accruing
debt and other income producing securities at amortized cost. "Weighted average yield of debt and other income producing securities at fair value" is computed as the (a) annual stated interest
rate or yield earned plus the net annual amortization of original issue discount and market discount or premium earned on accruing debt and other income producing securities, divided by
(b) total accruing debt and other income producing securities at fair value.
- (6)
- Represents fair value for investments in the portfolio as of the most recent prior quarter end, if applicable.
As of December 31, 2014 and 2013, our investments consisted of the following:
| |
As of December 31, | ||||||||||||
|---|---|---|---|---|---|---|---|---|---|---|---|---|---|
| |
2014 | 2013 | |||||||||||
(in millions)
|
Amortized Cost | Fair Value | Amortized Cost | Fair Value | |||||||||
First lien senior secured loans |
$ | 3,728.9 | $ | 3,700.6 | $ | 3,461.6 | $ | 3,433.6 | |||||
Second lien senior secured loans |
1,938.9 | 1,900.5 | 1,335.8 | 1,319.2 | |||||||||
Subordinated certificates of the SSLP(1) |
2,034.5 | 2,065.0 | 1,745.2 | 1,771.4 | |||||||||
Senior subordinated debt |
524.1 | 523.3 | 308.1 | 267.2 | |||||||||
Preferred equity securities |
206.5 | 190.2 | 226.0 | 229.0 | |||||||||
Other equity securities |
440.1 | 642.8 | 453.7 | 600.2 | |||||||||
Commercial real estate |
2.1 | 6.0 | 7.0 | 12.3 | |||||||||
| | | | | | | | | | | | | | |
Total |
$ | 8,875.1 | $ | 9,028.4 | $ | 7,537.4 | $ | 7,632.9 | |||||
| | | | | | | | | | | | | | |
| | | | | | | | | | | | | | |
| | | | | | | | | | | | | | |
- (1)
- The proceeds from these certificates were applied to co-investments with GE to fund first lien senior secured loans to 50 and 47 different borrowers as of December 31, 2014 and 2013, respectively.
64
The weighted average yields at amortized cost and fair value of the following portions of our portfolio as of December 31, 2014 and 2013 were as follows:
| |
As of December 31, | ||||||||||||
|---|---|---|---|---|---|---|---|---|---|---|---|---|---|
| |
2014 | 2013 | |||||||||||
| |
Amortized Cost | Fair Value | Amortized Cost | Fair Value | |||||||||
Debt and other income producing securities(1) |
10.1 | % | 10.1 | % | 10.4 | % | 10.4 | % | |||||
Total portfolio(2) |
9.3 | % | 9.1 | % | 9.4 | % | 9.3 | % | |||||
First lien senior secured loans(2) |
8.1 | % | 8.2 | % | 7.8 | % | 7.9 | % | |||||
Second lien senior secured loans(2) |
8.7 | % | 8.8 | % | 9.4 | % | 9.5 | % | |||||
Subordinated certificates of the SSLP(2)(3) |
13.8 | % | 13.5 | % | 15.0 | % | 14.8 | % | |||||
Senior subordinated debt(2) |
11.2 | % | 11.2 | % | 10.4 | % | 12.0 | % | |||||
Income producing equity securities (2) |
9.4 | % | 9.4 | % | 10.1 | % | 9.1 | % | |||||
- (1)
- "Weighted
average yield of debt and other income producing securities at amortized cost" is computed as the (a) annual stated interest rate or yield
earned plus the net annual amortization of original issue discount and market discount or premium earned on accruing debt and other income producing securities, divided by (b) total accruing
debt and other income producing securities at amortized cost. "Weighted average yield of debt and other income producing securities at fair value" is computed as the (a) annual stated interest
rate or yield earned plus the net annual amortization of original issue discount and market discount or premium earned on accruing debt and other income producing securities, divided by
(b) total accruing debt and other income producing securities at fair value.
- (2)
- "Weighted
average yields at amortized cost" are computed as the (a) annual stated interest rate or yield earned plus the net annual amortization of
original issue discount and market discount or premium earned on the relevant accruing debt and other income producing securities, divided by (b) the total relevant investments at amortized
cost. "Weighted average yields at fair value" are computed as the (a) annual stated interest rate or yield earned plus the net annual amortization of original issue discount and market discount
or premium earned on the relevant accruing debt and other income producing securities, divided by (b) the total relevant investments at fair value.
- (3)
- The proceeds from these certificates were applied to co-investments with GE to fund first lien senior secured loans.
Ares Capital Management, our investment adviser, employs an investment rating system to categorize our investments. In addition to various risk management and monitoring tools, our investment adviser grades the credit risk of all investments on a scale of 1 to 4 no less frequently than quarterly. This system is intended primarily to reflect the underlying risk of a portfolio investment relative to our initial cost basis in respect of such portfolio investment (i.e., at the time of origination or acquisition), although it may also take into account under certain circumstances the performance of the portfolio company's business, the collateral coverage of the investment and other relevant factors. Under this system, investments with a grade of 4 involve the least amount of risk to our initial cost basis. The trends and risk factors for this investment since origination or acquisition are generally favorable, which may include the performance of the portfolio company or a potential exit. Investments graded 3 involve a level of risk to our initial cost basis that is similar to the risk to our initial cost basis at the time of origination or acquisition. This portfolio company is generally performing as expected and the risk factors to our ability to ultimately recoup the cost of our investment are neutral to favorable. All investments or acquired investments in new portfolio companies are initially assessed a grade of 3. Investments graded 2 indicate that the risk to our ability to recoup the initial cost basis of such investment has increased materially since origination or acquisition, including as a result of factors such as declining performance and non-compliance with debt covenants; however, payments are generally not more than 120 days past due. An investment grade of 1 indicates that the risk to our
65
ability to recoup the initial cost basis of such investment has substantially increased since origination or acquisition, and the portfolio company likely has materially declining performance. For debt investments with an investment grade of 1, most or all of the debt covenants are out of compliance and payments are substantially delinquent. For investments graded 1, it is anticipated that we will not recoup our initial cost basis and may realize a substantial loss of our initial cost basis upon exit. For investments graded 1 or 2, our investment adviser enhances its level of scrutiny over the monitoring of such portfolio company. The grade of a portfolio investment may be reduced or increased over time.
Set forth below is the grade distribution of our portfolio companies as of December 31, 2014 and 2013:
| |
As of December 31, | ||||||||||||||||||||||||
|---|---|---|---|---|---|---|---|---|---|---|---|---|---|---|---|---|---|---|---|---|---|---|---|---|---|
| |
2014 | 2013 | |||||||||||||||||||||||
(dollar amounts in millions)
|
Fair Value |
% | Number of Companies |
% | Fair Value |
% | Number of Companies |
% | |||||||||||||||||
Grade 1 |
$ | 49.9 | 0.6 | % | 5 | 2.4 | % | $ | 54.6 | 0.7 | % | 7 | 3.6 | % | |||||||||||
Grade 2 |
298.5 | 3.3 | % | 11 | 5.4 | % | 256.3 | 3.4 | % | 12 | 6.2 | % | |||||||||||||
Grade 3 |
7,847.6 | 86.9 | % | 171 | 83.4 | % | 6,636.2 | 86.9 | % | 162 | 83.9 | % | |||||||||||||
Grade 4 |
832.4 | 9.2 | % | 18 | 8.8 | % | 685.8 | 9.0 | % | 12 | 6.2 | % | |||||||||||||
| | | | | | | | | | | | | | | | | | | | | | | | | | |
Total |
$ | 9,028.4 | 100.0 | % | 205 | 100.0 | % | $ | 7,632.9 | 100.0 | % | 193 | 100.0 | % | |||||||||||
| | | | | | | | | | | | | | | | | | | | | | | | | | |
| | | | | | | | | | | | | | | | | | | | | | | | | | |
| | | | | | | | | | | | | | | | | | | | | | | | | | |
As of December 31, 2014 and 2013, the weighted average grade of the investments in our portfolio at fair value was 3.0 and 3.0, respectively.
As of December 31, 2014, loans on non-accrual status represented 2.2% and 1.7% of the total investments at amortized cost and at fair value, respectively. As of December 31, 2013, loans on non-accrual status represented 3.1% and 2.1% of the total investments at amortized cost and at fair value, respectively.
Senior Secured Loan Program
We co-invest in first lien senior secured loans of middle market companies with GE through an unconsolidated Delaware limited liability company, the Senior Secured Loan Fund LLC (d/b/a "the Senior Secured Loan Program") or the SSLP. The SSLP is capitalized as transactions are completed and all portfolio decisions and generally all other decisions in respect of the SSLP must be approved by an investment committee of the SSLP consisting of representatives of ours and GE (with approval from a representative of each required). We provide capital to the SSLP in the form of subordinated certificates (the "SSLP Certificates").
As of December 31, 2014 and 2013, we and GE had agreed to make $11.0 billion of capital available to the SSLP, of which approximately $9.9 billion and $8.7 billion in aggregate principal amount, respectively, was funded. As of December 31, 2014 and 2013, we had agreed to make available to the SSLP approximately $2.3 billion, of which approximately $2.0 billion and $1.7 billion in aggregate principal amount, respectively, was funded. Investment of any unfunded amount must be approved by the investment committee of the SSLP as described above.
As of December 31, 2014 and 2013, the SSLP had total assets of $10.0 billion and $8.7 billion, respectively. As of December 31, 2014 and 2013, GE's investment in the SSLP consisted of senior notes of $7.6 billion and $6.7 billion, respectively, and SSLP Certificates of $290.6 million and $249.3 million, respectively. The SSLP Certificates are junior in right of payment to the senior notes held by GE. As of December 31, 2014 and 2013, we and GE owned 87.5% and 12.5%, respectively, of the outstanding SSLP Certificates.
As of December 31, 2014 and 2013, the SSLP portfolio was comprised of all first lien senior secured loans to U.S. middle-market companies. As of December 31, 2014 and 2013, one loan was on
66
non-accrual status, representing 1.0% and 1.0%, respectively, of the total loans at principal amount in the SSLP. The portfolio companies in the SSLP are in industries similar to the companies in our portfolio. Additionally, as of December 31, 2014 and 2013, the SSLP had commitments to fund various delayed draw investments to certain of its portfolio companies of $484.3 million and $510.4 million, respectively, which had been approved by the investment committee of the SSLP. As of December 31, 2014 and 2013, we had commitments to co-invest in the SSLP for our portion of the SSLP's commitments to fund such delayed draw investments of up to $92.5 million and $85.1 million, respectively.
Below is a summary of the SSLP's portfolio, followed by a listing of the individual first lien senior secured loans in the SSLP's portfolio as of December 31, 2014 and 2013:
| |
As of December 31, | ||||||
|---|---|---|---|---|---|---|---|
(dollar amounts in millions)
|
2014 | 2013 | |||||
Total first lien senior secured loans(1) |
$ | 9,522.6 | $ | 8,664.4 | |||
Weighted average yield on first lien senior secured loans(2) |
6.7 | % | 7.1 | % | |||
Number of borrowers in the SSLP |
50 | 47 | |||||
Largest loan to a single borrower(1) |
$ | 331.5 | $ | 321.7 | |||
Total of five largest loans to borrowers(1) |
$ | 1,571.7 | $ | 1,510.7 | |||
- (1)
- At
principal amount.
- (2)
- Computed as the (a) annual stated interest rate on accruing first lien senior secured loans, divided by (b) total first lien senior secured loans at principal amount.
67
SSLP Loan Portfolio as of December 31, 2014
(dollar amounts in millions) Portfolio Company |
Business Description | Maturity Date |
Stated Interest Rate(1) |
Principal Amount |
Fair Value(2) |
||||||||||
|---|---|---|---|---|---|---|---|---|---|---|---|---|---|---|---|
ADG, LLC |
Dental services provider | 9/2019 | 8.1 | % | $ | 212.6 | $ | 212.6 | |||||||
AMZ Holding Corp. |
Specialty chemicals manufacturer | 12/2018 | 6.8 | % | 235.2 | 230.5 | |||||||||
Argon Medical Devices, Inc. |
Manufacturer and marketer of single-use specialty medical devices | 4/2018 | 6.5 | % | 221.3 | 221.3 | |||||||||
Argotec LLC |
Producer of thermoplastic polyurethane film and sheet used for paint production, glass lamination, medical use, graphics, and textile lamination. | 12/2019 | 7.5 | % | 93.0 | 93.0 | |||||||||
Athletico Management, LLC and Accelerated Holdings, LLC(3) |
Provider of outpatient rehabilitation services | 12/2020 | 6.3 | % | 325.0 | 325.0 | |||||||||
Breg, Inc. |
Designer, manufacturer, and distributor of non-surgical orthopedic products for preventative, post-operative and rehabilitative use | 10/2020 | 6.5 | % | 150.0 | 150.0 | |||||||||
Brewer Holdings Corp. and Zywave, Inc. |
Provider of software and technology-enabled content and analytical solutions to insurance brokers | 11/2019 | 7.0 | % | 173.7 | 173.7 | |||||||||
Cambridge International, Inc. |
Manufacturer of custom designed and engineered metal products | 4/2018 | 8.0 | % | 82.9 | 82.1 | |||||||||
CH Hold Corp.(3) |
Collision repair company | 11/2019 | 5.5 | % | 298.5 | 298.5 | |||||||||
Chariot Acquisition, LLC |
Distributor and designer of aftermarket golf cart parts and accessories | 1/2019 | 7.8 | % | 152.2 | 152.2 | |||||||||
CIBT Holdings, Inc.(5) |
Expedited travel document processing services | 12/2018 | 6.8 | % | 204.4 | 204.4 | |||||||||
Connoisseur Media, LLC |
Owner and operator of radio stations | 6/2019 | 7.3 | % | 134.3 | 133.0 | |||||||||
CWD, LLC |
Supplier of automotive aftermarket brake parts | 6/2016 | 7.0 | % | 125.9 | 125.9 | |||||||||
Drayer Physical Therapy Institute, LLC |
Outpatient physical therapy provider | 7/2018 | 8.0 | % | 133.9 | 133.9 | |||||||||
Driven Brands, Inc.(3)(5) |
Automotive aftermarket car care franchisor | 3/2017 | 6.0 | % | 201.2 | 201.2 | |||||||||
DTI Holdco, Inc.(3)(5) |
Provider of legal process outsourcing and managed services | 8/2020 | 5.8 | % | 300.3 | 300.3 | |||||||||
ECI Purchaser Company, LLC |
Manufacturer of equipment to safely control pressurized gases | 12/2019 | 6.0 | % | 235.0 | 232.6 | |||||||||
Excelligence Learning Corporation |
Developer, manufacturer and retailer of educational products | 12/2020 | 6.8 | % | 180.0 | 180.0 | |||||||||
Fleischmann's Vinegar Company, Inc. |
Manufacturer and marketer of industrial vinegar products | 5/2016 | 8.0 | % | 70.4 | 70.4 | |||||||||
Gentle Communications, LLC |
Dental services provider | 6/2020 | 6.5 | % | 84.8 | 84.0 | |||||||||
III US Holdings, LLC |
Provider of library automation software and systems | 6/2018 | 6.0 | % | 215.2 | 213.0 | |||||||||
Implus Footcare, LLC(5) |
Provider of footwear and other accessories | 4/2019 | 6.8 | % | 264.9 | 264.9 | |||||||||
Instituto de Banca y Comercio, Inc.(3)(5) |
Private school operator | 12/2016 | 91.5 | 73.2 | (6) | ||||||||||
Intermedix Corporation(4) |
Revenue cycle management provider to the emergency healthcare industry | 12/2019 | 5.8 | % | 267.9 | 267.9 | |||||||||
Laborie Medical Technologies Corp(5) |
Developer and manufacturer of medical equipment | 10/2018 | 6.8 | % | 125.4 | 125.4 | |||||||||
Mavis Tire Supply LLC |
Auto parts retailer | 10/2020 | 6.3 | % | 184.5 | 184.5 | |||||||||
MCH Holdings, Inc.(5) |
Healthcare professional provider | 1/2020 | 6.3 | % | 179.1 | 179.1 | |||||||||
MWI Holdings, Inc.(3) |
Engineered springs, fasteners, and other precision components | 3/2019 | 7.4 | % | 259.2 | 259.2 | |||||||||
Noranco Manufacturing (USA) Ltd. |
Supplier of complex machined and sheet metal components for the aerospace industry | 4/2019 | 6.8 | % | 156.3 | 156.3 | |||||||||
Nordco Inc. |
Designer and manufacturer of railroad maintenance-of-way machinery | 8/2019 | 7.0 | % | 217.3 | 217.3 | |||||||||
Oak Parent, Inc.(3) |
Manufacturer of athletic apparel | 4/2018 | 7.5 | % | 297.6 | 297.6 | |||||||||
68
(dollar amounts in millions) Portfolio Company |
Business Description | Maturity Date |
Stated Interest Rate(1) |
Principal Amount |
Fair Value(2) |
||||||||||
|---|---|---|---|---|---|---|---|---|---|---|---|---|---|---|---|
Palermo Finance Corporation |
Provider of mission-critical integrated public safety software and services to local, state, and federal agencies | 11/2020 | 7.0 | % | 135.0 | 135.0 | |||||||||
Penn Detroit Diesel Allison, LLC |
Distributor of new equipment and aftermarket parts to the heavy-duty truck industry | 10/2019 | 7.3 | % | 71.6 | 71.6 | |||||||||
PetroChoice Holdings, LLC |
Provider of lubrication solutions | 1/2017 | 10.0 | % | 238.5 | 238.5 | |||||||||
PODS Funding Corp. II(3) |
Storage and warehousing | 12/2018 | 7.0 | % | 331.5 | 331.5 | |||||||||
Pretium Packaging, L.L.C(5) |
Manufacturer and supplier of high performance plastic containers | 6/2020 | 6.2 | % | 209.2 | 209.2 | |||||||||
Protective Industries, Inc. dba Caplugs(3)(5) |
Plastic protection products | 10/2019 | 6.3 | % | 275.5 | 275.5 | |||||||||
Restaurant Technologies, Inc. |
Provider of bulk cooking oil management services to the restaurant and fast food service industries | 6/2018 | 7.0 | % | 198.5 | 198.5 | |||||||||
Sanders Industries Holdings, Inc.(5) |
Elastomeric parts, mid-sized composite structures, and composite tooling | 5/2020 | 7.0 | % | 83.8 | 83.8 | |||||||||
Selig Sealing Products, Inc. |
Manufacturer of container sealing products for rigid packaging applications | 10/2019 | 6.8 | % | 188.5 | 188.5 | |||||||||
Singer Sewing Company |
Manufacturer of consumer sewing machines | 6/2017 | 7.3 | % | 195.0 | 191.1 | |||||||||
STATS Acquisition, LLC |
Sports technology, data and content company | 6/2020 | 7.0 | % | 103.5 | 103.5 | |||||||||
Strategic Partners, Inc.(5) |
Supplier of medical uniforms, specialized medical footwear and accessories | 8/2018 | 7.3 | % | 289.3 | 289.3 | |||||||||
TA THI Buyer, Inc. and TA THI Parent, Inc.(5) |
Collision repair company | 7/2020 | 6.5 | % | 312.7 | 312.7 | |||||||||
The Linen Group |
Provider of outsourced commercial linen and laundry services | 8/2019 | 8.0 | % | 92.6 | 92.6 | |||||||||
The Teaching Company, LLC(3)(5) |
Education publications provider | 3/2017 | 9.0 | % | 109.2 | 108.1 | |||||||||
Towne Holdings, Inc. |
Provider of contracted hospitality services and parking systems | 12/2019 | 6.8 | % | 167.8 | 167.8 | |||||||||
U.S. Anesthesia Partners, Inc.(3)(4) |
Anesthesiology service provider | 12/2019 | 6.0 | % | 264.0 | 264.0 | |||||||||
Universal Services of America, LP |
Provider of security officer and guard services | 7/2019 | 6.0 | % | 302.2 | 302.2 | |||||||||
WCI-Quantum Holdings, Inc.(5) |
Distributor of instructional products, services and resources | 10/2020 | 5.8 | % | 80.7 | 80.7 | |||||||||
| | | | | | | | | | | | | | | | |
|
$ | 9,522.6 | $ | 9,487.1 | |||||||||||
| | | | | | | | | | | | | | | | |
| | | | | | | | | | | | | | | | |
| | | | | | | | | | | | | | | | |
- (1)
- Represents
the weighted average annual stated interest rate as of December 31, 2014. All interest rates are payable in cash. For loans on non-accrual
status, the stated interest rate is not shown as there is no current yield on such loans.
- (2)
- Represents
the fair value in accordance with Accounting Standards Codification ("ASC") 820-10. The determination of such fair value is not included in our
board of directors valuation process described elsewhere herein.
- (3)
- We
also hold a portion of this company's first lien senior secured loan.
- (4)
- We
also hold a portion of this company's second lien senior secured loan.
- (5)
- We
hold an equity investment in this company.
- (6)
- Loan was on non-accrual status, as determined by the investment committee of the SSLP, as of December 31, 2014.
69
SSLP Loan Portfolio as of December 31, 2013
(dollar amounts in millions) Portfolio Company |
Business Description | Maturity Date |
Stated Interest Rate(1) |
Principal Amount |
Fair Value(2) |
||||||||||
|---|---|---|---|---|---|---|---|---|---|---|---|---|---|---|---|
Access CIG, LLC(3) |
Records and information management services provider | 10/2017 | 7.0 | % | $ | 186.9 | $ | 186.9 | |||||||
ADG, LLC |
Dental services provider | 9/2019 | 8.1 | % | 217.5 | 217.5 | |||||||||
AMZ Holding Corp. |
Specialty chemicals manufacturer | 12/2018 | 6.8 | % | 237.6 | 237.6 | |||||||||
Argon Medical Devices, Inc. |
Manufacturer and marketer of single-use specialty medical devices | 4/2018 | 6.5 | % | 239.2 | 239.2 | |||||||||
BECO Holding Company, Inc.(5) |
Wholesale distributor of first response fire protection equipment and related parts | 12/2017 | 8.3 | % | 143.4 | 143.4 | |||||||||
Brewer Holdings Corp. and Zywave, Inc. |
Provider of software and technology-enabled content and analytical solutions to insurance brokers | 11/2019 | 7.0 | % | 175.5 | 175.5 | |||||||||
Cambridge International, Inc. |
Manufacturer of custom designed and engineered metal products | 4/2018 | 8.0 | % | 86.0 | 86.0 | |||||||||
CCS Group Holdings, LLC(5) |
Correctional facility healthcare operator | 4/2016 | 8.0 | % | 134.5 | 134.5 | |||||||||
CH Hold Corp. |
Collision repair company | 11/2019 | 5.5 | % | 270.0 | 270.0 | |||||||||
Chariot Acquisition, LLC |
Distributor and designer of aftermarket golf cart parts and accessories | 1/2019 | 7.8 | % | 142.3 | 142.3 | |||||||||
CIBT Holdings, Inc.(5) |
Expedited travel document processing services | 12/2018 | 6.8 | % | 178.9 | 178.9 | |||||||||
CWD, LLC |
Supplier of automotive aftermarket brake parts | 6/2016 | 10.0 | % | 130.5 | 130.5 | |||||||||
Drayer Physical Therapy Institute, LLC |
Outpatient physical therapy provider | 7/2018 | 7.5 | % | 136.7 | 136.7 | |||||||||
Driven Brands, Inc.(5) |
Automotive aftermarket car care franchisor | 3/2017 | 7.0 | % | 159.1 | 159.1 | |||||||||
ECI Purchaser Company, LLC |
Manufacturer of equipment to safely control pressurized gases | 12/2019 | 6.0 | % | 209.0 | 209.0 | |||||||||
Excelligence Learning Corporation(5) |
Developer, manufacturer and retailer of educational products | 8/2018 | 7.8 | % | 174.0 | 174.0 | |||||||||
Fleischmann's Vinegar Company, Inc. |
Manufacturer and marketer of industrial vinegar products | 5/2016 | 8.0 | % | 74.7 | 74.7 | |||||||||
Fox Hill Holdings, LLC(3) |
Third party claims administrator on behalf of insurance carriers | 6/2018 | 6.8 | % | 289.5 | 289.5 | |||||||||
III US Holdings, LLC |
Provider of library automation software and systems | 3/2018 | 7.6 | % | 194.5 | 194.5 | |||||||||
Implus Footcare, LLC(5) |
Provider of footwear and other accessories | 10/2016 | 9.0 | % | 210.3 | 210.3 | |||||||||
Instituto de Banca y Comercio, Inc.(3)(5) |
Private school operator | 6/2015 | 82.4 | 74.2 | (6) | ||||||||||
Intermedix Corporation(4) |
Revenue cycle management provider to the emergency healthcare industry | 12/2018 | 6.3 | % | 321.7 | 321.7 | |||||||||
iParadigms, LLC |
Provider of anti-plagiarism software to the education industry | 4/2019 | 6.5 | % | 164.2 | 164.2 | |||||||||
JHP Pharmaceuticals, LLC(5) |
Manufacturer of specialty pharmaceutical products | 12/2019 | 6.8 | % | 182.2 | 182.2 | |||||||||
Laborie Medical Technologies Corp(5) |
Developer and manufacturer of medical equipment | 10/2018 | 6.8 | % | 113.5 | 113.5 | |||||||||
LJSS Acquisition, Inc. |
Fluid power distributor | 10/2017 | 6.8 | % | 159.8 | 159.8 | |||||||||
MWI Holdings, Inc.(3) |
Engineered springs, fasteners, and other precision components | 3/2019 | 7.4 | % | 261.6 | 261.6 | |||||||||
Noranco Manufacturing (USA) Ltd. |
Supplier of complex machined and sheet metal components for the aerospace industry | 4/2019 | 6.8 | % | 161.1 | 161.1 | |||||||||
Nordco, Inc. |
Designer and manufacturer of railroad maintenance-of-way machinery | 8/2019 | 7.0 | % | 224.7 | 224.7 | |||||||||
Oak Parent, Inc.(3) |
Manufacturer of athletic apparel | 4/2018 | 7.5 | % | 307.1 | 307.1 | |||||||||
Penn Detroit Diesel Allison, LLC |
Distributor of new equipment and aftermarket parts to the heavy-duty truck industry | 12/2016 | 9.0 | % | 59.5 | 59.5 | |||||||||
70
(dollar amounts in millions) Portfolio Company |
Business Description | Maturity Date |
Stated Interest Rate(1) |
Principal Amount |
Fair Value(2) |
||||||||||
|---|---|---|---|---|---|---|---|---|---|---|---|---|---|---|---|
PetroChoice Holdings, LLC |
Provider of lubrication solutions | 1/2017 | 10.0 | % | 158.3 | 158.3 | |||||||||
PODS Funding Corp. II(3) |
Storage and warehousing | 12/2018 | 7.0 | % | 314.1 | 314.1 | |||||||||
Pregis Corporation, Pregis Intellipack Corp. and Pregis Innovative Packaging Inc.(3) |
Provider of highly-customized, tailored protective packaging solutions | 3/2017 | 7.8 | % | 152.0 | 152.0 | |||||||||
Protective Industries, Inc. dba Caplugs(3)(5) |
Plastic protection products | 10/2019 | 6.8 | % | 278.3 | 278.3 | |||||||||
PSSI Holdings, LLC(3) |
Provider of mission-critical outsourced cleaning and sanitation services to the food processing industry | 6/2018 | 6.0 | % | 224.4 | 224.4 | |||||||||
Restaurant Technologies, Inc. |
Provider of bulk cooking oil management services to the restaurant and fast food service industries | 6/2018 | 7.0 | % | 202.7 | 202.7 | |||||||||
Selig Sealing Products, Inc. |
Manufacturer of container sealing products for rigid packaging applications | 10/2019 | 6.8 | % | 209.0 | 209.0 | |||||||||
Singer Sewing Company |
Manufacturer of consumer sewing machines | 6/2017 | 7.3 | % | 197.0 | 197.0 | |||||||||
Strategic Partners, Inc.(5) |
Supplier of medical uniforms, specialized medical footwear and accessories | 8/2018 | 7.8 | % | 232.1 | 232.1 | |||||||||
Talent Partners G.P. and Print Payroll Services, G.P. |
Provider of technology-enabled payroll to the advertising industry | 10/2017 | 8.0 | % | 62.0 | 62.0 | |||||||||
TecoStar Acquisition Company |
Manufacturer of precision components for orthopedic medical devices | 12/2019 | 6.4 | % | 118.0 | 118.0 | |||||||||
The Teaching Company, LLC(3)(5) |
Education publications provider | 3/2017 | 9.0 | % | 111.5 | 109.3 | |||||||||
Towne Holdings, Inc. |
Provider of contracted hospitality services and parking systems | 12/2019 | 6.8 | % | 154.0 | 154.0 | |||||||||
U.S. Anesthesia Partners, Inc.(3) |
Anesthesiology service provider | 12/2019 | 6.0 | % | 210.0 | 210.0 | |||||||||
Universal Services of America, LP |
Provider of security officer and guard services | 7/2019 | 6.0 | % | 253.9 | 253.9 | |||||||||
WB Merger Sub, Inc. |
Importer, distributor and developer of premium wine and spirits | 12/2016 | 9.0 | % | 159.2 | 159.2 | |||||||||
| | | | | | | | | | | | | | | | |
|
$ | 8,664.4 | $ | 8,654.0 | |||||||||||
| | | | | | | | | | | | | | | | |
| | | | | | | | | | | | | | | | |
| | | | | | | | | | | | | | | | |
- (1)
- Represents
the weighted average annual stated interest rate as of December 31, 2013. All interest rates are payable in cash. For loans on non-accrual
status, the stated interest rate is not shown as there is no current yield on such loans.
- (2)
- Represents
the fair value in accordance with ASC 820-10. The determination of such fair value is not included in our board of directors valuation process
described elsewhere herein.
- (3)
- We
also hold a portion of this company's first lien senior secured loan.
- (4)
- We
also hold a portion of this company's second lien senior secured loan.
- (5)
- We
hold an equity investment in this company.
- (6)
- Loan was on non-accrual status, as determined by the investment committee of the SSLP, as of December 31, 2013.
The amortized cost and fair value of our SSLP Certificates was $2.0 billion and $2.1 billion, respectively, as of December 31, 2014, and $1.7 billion and $1.8 billion, respectively, as of December 31, 2013. The SSLP Certificates pay a weighted average coupon of LIBOR plus approximately 8.0% and also entitle the holders thereof to receive a portion of the excess cash flow from the underlying loan portfolio, which may result in a return to the holders of the SSLP Certificates that is greater than both the coupon on the SSLP Certificates as well as the weighted average yield on the SSLP's portfolio of 6.7% and 7.1% at December 31, 2014 and 2013, respectively. Our yield on our investment in the SSLP at amortized cost and fair value was 13.8% and 13.5%, respectively, as of December 31, 2014, and 15.0% and 14.8%, respectively, as of December 31, 2013. For the years ended
71
December 31, 2014, 2013 and 2012, we earned interest income of $275.0 million, $224.9 million and $184.7 million, respectively, from our investment in the SSLP Certificates.
We are also entitled to certain fees in connection with the SSLP. For the years ended December 31, 2014, 2013 and 2012, in connection with the SSLP, we earned capital structuring service, sourcing and other fees totaling $69.7 million, $66.6 million and $58.2 million, respectively.
Selected financial information for the SSLP as of and for the years ended December 31, 2014 and 2013 is as follows:
| |
As of and For the Years Ended December 31, |
||||||
|---|---|---|---|---|---|---|---|
(in millions)
|
2014 | 2013 | |||||
Selected Balance Sheet Information: |
|||||||
Investments in loans receivable, net |
$ | 9,442.6 | $ | 8,601.6 | |||
Cash and other assets |
$ | 563.3 | $ | 142.3 | |||
Total assets |
$ | 10,005.9 | $ | 8,743.9 | |||
Senior notes |
$ |
7,613.7 |
$ |
6,699.5 |
|||
Other liabilities |
$ | 77.7 | $ | 64.2 | |||
Total liabilities |
$ | 7,691.4 | $ | 6,763.7 | |||
Subordinated certificates and members' capital |
$ | 2,314.5 | $ | 1,980.2 | |||
Total liabilities and members' capital |
$ | 10,005.9 | $ | 8,743.9 | |||
Selected Statement of Operations Information: |
|||||||
Total revenues |
$ | 668.3 | $ | 554.2 | |||
Total expenses |
$ | 362.5 | $ | 296.7 | |||
Net income |
$ | 305.8 | $ | 257.5 | |||
RESULTS OF OPERATIONS
For the years ended December 31, 2014, 2013 and 2012
Operating results for the years ended December 31, 2014, 2013 and 2012 are as follows:
| |
For the Years Ended December 31, |
|||||||||
|---|---|---|---|---|---|---|---|---|---|---|
(in millions)
|
2014 | 2013 | 2012 | |||||||
Total investment income |
$ | 989.0 | $ | 881.7 | $ | 748.0 | ||||
Total expenses |
532.9 | 437.2 | 387.9 | |||||||
| | | | | | | | | | | |
Net investment income before income taxes |
456.1 | 444.5 | 360.1 | |||||||
Income tax expense, including excise tax |
18.3 | 14.1 | 11.2 | |||||||
| | | | | | | | | | | |
Net investment income |
437.8 | 430.4 | 348.9 | |||||||
Net realized gains on investments |
93.9 | 63.7 | 46.7 | |||||||
Net unrealized gains (losses) on investments |
59.4 | (5.6 | ) | 115.3 | ||||||
Realized losses on extinguishment of debt |
(0.1 | ) | — | (2.7 | ) | |||||
| | | | | | | | | | | |
Net increase in stockholders' equity resulting from operations |
$ | 591.0 | $ | 488.5 | $ | 508.2 | ||||
| | | | | | | | | | | |
| | | | | | | | | | | |
| | | | | | | | | | | |
72
Investment Income
| |
For the Years Ended December 31, |
|||||||||
|---|---|---|---|---|---|---|---|---|---|---|
(in millions)
|
2014 | 2013 | 2012 | |||||||
Interest income from investments |
$ | 741.4 | $ | 647.9 | $ | 571.5 | ||||
Capital structuring service fees |
113.6 | 91.7 | 102.1 | |||||||
Dividend income |
84.3 | 99.6 | 39.7 | |||||||
Management and other fees |
24.6 | 20.2 | 18.9 | |||||||
Other income |
25.1 | 22.3 | 15.8 | |||||||
| | | | | | | | | | | |
Total investment income |
$ | 989.0 | $ | 881.7 | $ | 748.0 | ||||
| | | | | | | | | | | |
| | | | | | | | | | | |
| | | | | | | | | | | |
The increase in interest income from investments for the year ended December 31, 2014 from the comparable period in 2013 was primarily due to an increase in the size of our portfolio, which increased from an average of $6.7 billion at amortized cost for the year ended December 31, 2013 to an average of $8.1 billion at amortized cost for the comparable period in 2014. The increase in capital structuring service fees for the year ended December 31, 2014 from the comparable period in 2013 was primarily due to the increase in new investment commitments, which increased from $4.0 billion for the year ended December 31, 2013 to $4.6 billion for the comparable period in 2014, as well as the increase in the average capital structuring service fees received on new investment commitments, from 2.3% for the year ended December 31, 2013 to 2.5% in the comparable period in 2014. Dividend income for the years ended December 31, 2014 and 2013 included dividends received from IHAM totaling $50.0 million and $72.4 million, respectively. The dividends received from IHAM for the years ended December 31, 2014 and 2013 included additional dividends of $10.0 million and $32.4 million, respectively, that were paid in addition to the quarterly dividends generally paid by IHAM. IHAM paid the additional dividends out of accumulated earnings that had previously been retained by IHAM. Also during the year ended December 31, 2014, we received $19.0 million in other non-recurring dividends from non-income producing equity securities compared to $9.0 million for the comparable period in 2013. The increase in management and other fees for the year ended December 31, 2014 from the comparable period in 2013 was primarily attributable to higher sourcing and other fees received from the SSLP.
The increase in interest income from investments for the year ended December 31, 2013 from the comparable period in 2012 was primarily due to the increase in the size of the portfolio, which increased from an average of $5.5 billion at amortized cost for the year ended December 31, 2012 to an average of $6.7 billion at amortized cost for the comparable period in 2013. Even though new investment commitments increased from $3.2 billion for the year ended December 31, 2012 to $4.0 billion for the comparable period in 2013, capital structuring service fees decreased for the year ended December 31, 2013 from the comparable period in 2012 primarily due to the decrease in the average capital structuring service fees received on new investment commitments, which decreased from 3.2% in 2012 to 2.3% in 2013. The increase in dividend income for the year ended December 31, 2013 from the comparable period in 2012 was primarily due to $72.4 million in dividends received from IHAM for the year ended December 31, 2013 as compared to $19.9 million for the comparable period in 2012. The dividends received from IHAM for the year ended December 31, 2013 included additional dividends of $32.4 million that were paid in addition to the quarterly dividends generally paid by IHAM. Also during the year ended December 31, 2013, we received $9.0 million in other non-recurring dividends from non-income producing equity securities compared to $2.2 million for the comparable period in 2012. The increase in other income for the year ended December 31, 2013 from the comparable period in 2012 was primarily attributable to higher amendment fees.
73
Operating Expenses
| |
For the Years Ended December 31, |
|||||||||
|---|---|---|---|---|---|---|---|---|---|---|
(in millions)
|
2014 | 2013 | 2012 | |||||||
Interest and credit facility fees |
$ | 216.0 | $ | 171.5 | $ | 143.0 | ||||
Base management fees |
128.0 | 104.9 | 86.2 | |||||||
Income based fees |
118.3 | 110.5 | 95.2 | |||||||
Capital gains incentive fees |
29.5 | 11.6 | 31.9 | |||||||
Administrative fees |
13.7 | 12.3 | 9.3 | |||||||
Other general and administrative |
27.4 | 26.4 | 22.3 | |||||||
| | | | | | | | | | | |
Total operating expenses |
$ | 532.9 | $ | 437.2 | $ | 387.9 | ||||
| | | | | | | | | | | |
| | | | | | | | | | | |
| | | | | | | | | | | |
Interest and credit facility fees for the years ended December 31, 2014, 2013 and 2012, were comprised of the following:
| |
For the Years Ended December 31, |
|||||||||
|---|---|---|---|---|---|---|---|---|---|---|
(in millions)
|
2014 | 2013 | 2012 | |||||||
Stated interest expense |
$ | 173.7 | $ | 136.3 | $ | 113.1 | ||||
Facility fees |
10.8 | 8.2 | 5.5 | |||||||
Amortization of debt issuance costs |
16.4 | 13.2 | 13.1 | |||||||
Accretion of net discount on notes payable |
15.1 | 13.8 | 11.3 | |||||||
| | | | | | | | | | | |
Total interest and credit facility fees |
$ | 216.0 | $ | 171.5 | $ | 143.0 | ||||
| | | | | | | | | | | |
| | | | | | | | | | | |
| | | | | | | | | | | |
Stated interest expense for the year ended December 31, 2014 increased from the comparable period in 2013 primarily due to the increase in the average principal amount of debt outstanding, partially offset by a decrease in our weighted average stated interest rate of our debt outstanding. For the year ended December 31, 2014, our average principal debt outstanding increased to $3.3 billion as compared to $2.6 billion for the comparable period in 2013, and the weighted average stated interest rate on our outstanding debt was 4.8% for the year ended December 31, 2014 as compared to 5.3% for the comparable period in 2013.
Stated interest expense for the year ended December 31, 2013 increased from the comparable period in 2012 primarily due to the increase in the average principal amount of debt outstanding and an increase in our weighted average stated interest rate of our debt outstanding. For the year ended December 31, 2013, our average principal debt outstanding was $2.6 billion as compared to $2.2 billion for the comparable period in 2012, and the weighted average stated interest rate on our outstanding debt was 5.3% for the year ended December 31, 2013 as compared to 5.2% for the comparable period in 2012.
The increase in base management fees and our income based fees for the year ended December 31, 2014 from the comparable period in 2013 and for the year ended December 31, 2013 from the comparable period in 2012 were primarily due to the increases in the size of the portfolio in the case of base management fees and in the case of income based fees, the related increase in net investment income excluding income based fees and capital gains incentive fees.
For the years ended December 31, 2014, 2013 and 2012, the capital gains incentive fee expense accrual calculated in accordance with GAAP was $29.5 million, $11.6 million and $31.9 million, respectively. Capital gains incentive fee expense accrual for the year ended December 31, 2014 increased from the comparable period in 2013 primarily due to higher net gains on investments and foreign currency transactions, which increased from $58.1 million during the year ended December 31,
74
2013 to $156.3 million for the comparable period in 2014. Capital gains incentive fee expense accrual for the year ended December 31, 2013 decreased from the comparable period in 2012 primarily due to lower net gains on investments and foreign currency transactions, which decreased from $159.3 million during the year ended December 31, 2012 to $58.1 million for the comparable period in 2013. The capital gains incentive fee accrued under GAAP includes an accrual related to unrealized capital appreciation, whereas the capital gains incentive fee actually payable under our investment advisory and management agreement does not. There can be no assurance that such unrealized capital appreciation will be realized in the future. The accrual for any capital gains incentive fee under GAAP in a given period may result in an additional expense if such cumulative amount is greater than in the prior period or a reduction of previously recorded expense if such cumulative amount is less than in the prior period. If such cumulative amount is negative, then there is no accrual. As of December 31, 2014, 2013 and 2012, the total capital gains incentive fee accrual calculated in accordance with GAAP was $93.0 million, $80.9 million and $80.8 million, respectively. As of December 31, 2014, 2013 and 2012, the capital gains incentive fee actually payable under our investment advisory and management agreement was $24.0 million, $17.4 million and $11.5 million, respectively. See Note 3 to our consolidated financial statements for the year ended December 31, 2014, for more information on the base management fees, income based fees and capital gains incentive fees.
Administrative fees represent fees paid to Ares Operations for our allocable portion of overhead and other expenses incurred by Ares Operations in performing its obligations under the administration agreement, including our allocable portion of the cost of certain of our executive officers and their respective staffs. Other general and administrative expenses include professional fees, rent, insurance, depreciation and director's fees, among other costs.
Income Tax Expense, Including Excise Tax
We have elected to be treated as a RIC under the Code and operate in a manner so as to qualify for the tax treatment applicable to RICs. To qualify as a RIC, we must, among other things, timely distribute to our stockholders generally at least 90% of our investment company taxable income, as defined by the Code, for each year. In order to maintain our RIC status, we, among other things, have made and intend to continue to make the requisite distributions to our stockholders which will generally relieve us from U.S. federal corporate-level income taxes.
Depending on the level of taxable income earned in a tax year, we may choose to carry forward such taxable income in excess of current year dividend distributions from such current year taxable income into the next tax year and pay a 4% excise tax on such income, as required. To the extent that we determine that our estimated current year annual taxable income will be in excess of estimated current year dividend distributions from such income, we accrue excise tax on estimated excess taxable income as such taxable income is earned. For the years ended December 31, 2014, 2013 and 2012, we recorded a net expense of $5.5 million, $10.3 million and $7.9 million, respectively, for U.S. federal excise tax. The net expense for the year ended December 31, 2014 included a reduction in expense related to the recording of a requested refund resulting from the overpayment of 2013 excise tax of $1.7 million.
Certain of our consolidated subsidiaries are subject to U.S. federal and state income taxes. For the years ended December 31, 2014, 2013 and 2012, we recorded a tax expense of approximately $12.8 million, $3.8 million and $3.2 million, respectively, for these subsidiaries. The increase in income tax expense for our taxable consolidated subsidiaries for the year ended December 31, 2014 from the comparable period in 2013 was primarily driven by the realized gains from the exits of certain investments held by such subsidiaries during the year ended December 31, 2014.
75
Net Realized Gains/Losses
During the year ended December 31, 2014, we had $3.3 billion of sales, repayments or exits of investments resulting in $91.7 million of net realized gains. These sales, repayments or exits included $219.6 million of investments sold to IHAM and certain vehicles managed by IHAM. A net realized loss of $0.1 million was recorded on these transactions. See Note 4 to our consolidated financial statements for the year ended December 31, 2014 for more detail on IHAM and its managed vehicles. Net realized gains of $91.7 million on investments were comprised of $153.8 million of gross realized gains and $62.1 million of gross realized losses.
The net realized gains on investments during the year ended December 31, 2014 consisted of the following:
(in millions) Portfolio Company |
Net Realized Gains (Losses) |
|||
|---|---|---|---|---|
Insight Pharmaceuticals Corporation |
$ | 33.1 | ||
The Dwyer Group |
21.1 | |||
Waste Pro USA, Inc. |
18.4 | |||
Service King Paint & Body, LLC |
10.4 | |||
The Thymes, LLC |
9.8 | |||
CT Technologies Intermediate Holdings, Inc. |
6.7 | |||
ELC Acquisition Corp. |
5.9 | |||
VSS-Tranzact Holdings, LLC |
5.1 | |||
Platform Acquisition, Inc. |
4.7 | |||
Apple & Eve, LLC |
4.3 | |||
Pillar Processing LLC |
(6.6 | ) | ||
CitiPostal Inc. |
(20.8 | ) | ||
MVL Group, Inc. |
(27.7 | ) | ||
Other, net |
27.3 | |||
| | | | | |
Total |
$ | 91.7 | ||
| | | | | |
| | | | | |
| | | | | |
During the year ended December 31, 2014, we purchased $0.4 million aggregate principal amount of the 2047 Notes and as a result of these transactions, we recognized realized losses of $0.1 million. During the year ended December 31, 2014, we also recognized net realized gains on foreign currency transactions of $2.2 million.
During the year ended December 31, 2013, we had $1.8 billion of sales, repayments or exits of investments resulting in $63.7 million of net realized gains. These sales, repayments or exits included $442.3 million of investments sold to IHAM and certain vehicles managed by IHAM. A net realized loss of $0.1 million was recorded on these transactions. Net realized gains of $63.7 million on investments were comprised of $112.9 million of gross realized gains and $49.2 million of gross realized losses.
76
The net realized gains on investments during the year ended December 31, 2013 consisted of the following:
(in millions) Portfolio Company |
Net Realized Gains (Losses) |
|||
|---|---|---|---|---|
Passport Health Communications, Inc. |
$ | 19.8 | ||
Financial Pacific Company |
17.7 | |||
Component Hardware Group, Inc. |
17.2 | |||
Tradesmen International, Inc. |
10.0 | |||
AWTP, LLC |
8.7 | |||
Performant Financial Corporation |
8.6 | |||
Senior Secured Loan Fund LLC |
7.1 | |||
Performance Food Group, Inc. |
4.1 | |||
eInstruction Corporation |
(40.3 | ) | ||
Other, net |
10.8 | |||
| | | | | |
Total |
$ | 63.7 | ||
| | | | | |
| | | | | |
| | | | | |
During the year ended December 31, 2012, we had $2.5 billion of sales, repayments or exits of investments resulting in $46.7 million of net realized gains. These sales, repayments or exits included $256.9 million of investments sold to IHAM and certain vehicles managed by IHAM. A net realized gain of $2.3 million was recorded on these transactions. Net realized gains of $46.7 million on investments were comprised of $172.0 million of gross realized gains and $125.3 million of gross realized losses.
The net realized gains on investments during the year ended December 31, 2012 consisted of the following:
(in millions) Portfolio Company |
Net Realized Gains (Losses) |
|||
|---|---|---|---|---|
Reed Group, Ltd. |
$ | 41.5 | ||
Stag-Parkway, Inc. |
30.0 | |||
R3 Education, Inc. and EIC Acquisitions Corp. |
18.3 | |||
Savers, Inc. and SAI Acquisition Corporation |
15.2 | |||
BenefitMall Holdings Inc. |
12.5 | |||
Things Remembered Inc. and TRM Holdings Corporation |
9.6 | |||
Sunquest Information Systems, Inc. |
9.1 | |||
Norwesco Acquisition Company |
5.7 | |||
OTG Management, Inc. |
4.0 | |||
Crescent Hotels & Resorts, LLC and affiliates |
(5.5 | ) | ||
LVCG Holdings LLC |
(6.6 | ) | ||
Direct Buy Holdings, Inc. and Direct Buy Investors, LP |
(8.3 | ) | ||
Aquila Binks Forest Development, LLC |
(9.5 | ) | ||
Making Memories Wholesale, Inc. |
(12.3 | ) | ||
Firstlight Financial Corporation |
(26.0 | ) | ||
Prommis Solutions, LLC |
(46.8 | ) | ||
Other, net |
15.8 | |||
| | | | | |
Total |
$ | 46.7 | ||
| | | | | |
| | | | | |
| | | | | |
Additionally, during the year ended December 31, 2012, in connection with the repayment in full of the $60.0 million aggregate principal amount of our asset-backed notes issued under our 2006 debt
77
securitization ahead of their scheduled maturities, $2.7 million of unamortized debt issuance costs were expensed and recorded as a realized loss on the extinguishment of debt.
Net Unrealized Gains/Losses
We value our portfolio investments quarterly and the changes in value are recorded as unrealized gains or losses. Net unrealized gains and losses for our portfolio for the years ended December 31, 2014, 2013 and 2012, were comprised of the following:
| |
For the Years Ended December 31, |
|||||||||
|---|---|---|---|---|---|---|---|---|---|---|
(in millions)
|
2014 | 2013 | 2012 | |||||||
Unrealized appreciation |
$ | 176.6 | $ | 106.5 | $ | 151.0 | ||||
Unrealized depreciation |
(120.4 | ) | (105.1 | ) | (126.7 | ) | ||||
Net unrealized (appreciation) depreciation reversal related to net realized gains or losses(1) |
1.6 | (7.0 | ) | 91.0 | ||||||
| | | | | | | | | | | |
Total net unrealized gains (losses) |
$ | 57.8 | $ | (5.6 | ) | $ | 115.3 | |||
| | | | | | | | | | | |
| | | | | | | | | | | |
| | | | | | | | | | | |
- (1)
- The net unrealized (appreciation) depreciation reversal related to net realized gains or losses represents the unrealized appreciation or depreciation recorded on the related asset at the end of the prior period.
The changes in net unrealized appreciation and depreciation during the year ended December 31, 2014 consisted of the following:
(in millions) Portfolio Company |
Net Unrealized Appreciation (Deprecation) |
|||
|---|---|---|---|---|
10th Street, LLC |
$ | 43.7 | ||
UL Holding Co., LLC |
15.0 | |||
Cast & Crew Payroll, LLC |
11.6 | |||
Imperial Capital Private Opportunities, LP |
10.1 | |||
Ciena Capital LLC |
9.8 | |||
Tripwire, Inc. |
8.4 | |||
Senior Secured Loan Fund LLC |
7.0 | |||
Campus Management Corp. |
6.8 | |||
Global Healthcare Exchange, LLC |
4.0 | |||
Eckler Industries, Inc. |
(4.0 | ) | ||
OTG Management, LLC |
(4.2 | ) | ||
Orion Foods, LLC |
(4.6 | ) | ||
Community Education Centers, Inc. |
(6.9 | ) | ||
2329497 Ontario Inc. |
(7.4 | ) | ||
The Step2 Company, LLC |
(17.1 | ) | ||
ADF Restaurant Group, LLC |
(18.1 | ) | ||
Ivy Hill Asset Management, L.P. |
(21.0 | ) | ||
Other, net |
23.1 | |||
| | | | | |
Total |
$ | 56.2 | ||
| | | | | |
| | | | | |
| | | | | |
During the year ended December 31, 2014, we also recognized net unrealized gains on foreign currency transactions of $1.6 million.
78
The changes in net unrealized appreciation and depreciation during the year ended December 31, 2013 consisted of the following:
(in millions) Portfolio Company |
Net Unrealized Appreciation (Depreciation) |
|||
|---|---|---|---|---|
Senior Secured Loan Fund LLC |
$ | 9.8 | ||
Orion Foods, LLC |
7.0 | |||
10th Street, LLC |
6.8 | |||
American Broadband Communications, LLC |
6.6 | |||
Imperial Capital Private Opportunities, LP |
5.7 | |||
OTG Management, LLC |
4.5 | |||
The Dwyer Group |
4.2 | |||
Ciena Capital LLC |
(7.7 | ) | ||
Competitor Group, Inc. |
(9.5 | ) | ||
Instituto de Banca y Comercio, Inc. |
(12.6 | ) | ||
UL Holding Co., LLC |
(13.2 | ) | ||
CitiPostal Inc. |
(13.8 | ) | ||
Ivy Hill Asset Management, L.P. |
(13.9 | ) | ||
Other, net |
27.5 | |||
| | | | | |
Total |
$ | 1.4 | ||
| | | | | |
| | | | | |
| | | | | |
The changes in net unrealized appreciation and depreciation during the year ended December 31, 2012 consisted of the following:
(in millions) Portfolio Company |
Net Unrealized Appreciation (Depreciation) |
|||
|---|---|---|---|---|
Ivy Hill Asset Management, L.P. |
$ | 41.6 | ||
ADF Restaurant Group, LLC |
12.2 | |||
R3 Education, Inc. |
6.9 | |||
Performant Financial Corporation |
6.5 | |||
Tradesmen International, Inc. |
6.5 | |||
AWTP, LLC |
6.2 | |||
Financial Pacific Company |
6.0 | |||
ELC Acquisition Corp. |
5.1 | |||
The Dwyer Group |
5.0 | |||
Campus Management Corp. |
(4.5 | ) | ||
Community Education Centers, Inc. |
(4.6 | ) | ||
Matrixx Initiatives, Inc. |
(4.8 | ) | ||
HCP Acquisition Holdings, LLC |
(6.2 | ) | ||
UL Holding Co., LLC |
(7.0 | ) | ||
RE Community Holdings II, Inc. |
(7.3 | ) | ||
American Broadband Communications, LLC |
(8.5 | ) | ||
Orion Foods, LLC |
(10.4 | ) | ||
eInstruction Corporation |
(16.7 | ) | ||
MVL Group, Inc. |
(27.9 | ) | ||
Other, net |
26.2 | |||
| | | | | |
Total |
$ | 24.3 | ||
| | | | | |
| | | | | |
| | | | | |
79
FINANCIAL CONDITION, LIQUIDITY AND CAPITAL RESOURCES
Our liquidity and capital resources are generated primarily from the net proceeds of public offerings of equity and debt securities, advances from the Facilities, net proceeds from the issuance of other securities, including convertible unsecured notes, as well as cash flows from operations.
As of December 31, 2014, we had $194.6 million in cash and cash equivalents and $4.0 billion in total aggregate principal amount of debt outstanding ($3.9 billion at carrying value). Subject to leverage and borrowing base restrictions, we had approximately $1.6 billion available for additional borrowings under the Facilities as of December 31, 2014.
We may from time to time seek to retire or repurchase our common stock through cash purchases, as well as retire, cancel or purchase our outstanding debt through cash purchases and/or exchanges, in open market purchases, privately negotiated transactions or otherwise. Such repurchases or exchanges, if any, will depend on prevailing market conditions, our liquidity requirements, contractual and regulatory restrictions and other factors. The amounts involved may be material. In addition, we may from time to time enter into additional debt facilities, increase the size of existing facilities or issue additional debt securities, including unsecured debt and/or debt securities convertible into common stock. Any such incurrence or issuance would be subject to prevailing market conditions, our liquidity requirements, contractual and regulatory restrictions and other factors. In accordance with the Investment Company Act, with certain limited exceptions, we are only allowed to borrow amounts such that our asset coverage, calculated pursuant to the Investment Company Act, is at least 200% after such borrowing. As of December 31, 2014, our asset coverage was 235%.
Equity Issuances
As of December 31, 2014 and 2013, our total equity market capitalization was $4.9 billion and $5.3 billion, respectively. The following table summarizes the total shares issued and proceeds received in public offerings of our common stock net of underwriting discounts and offering costs for the years ended December 31, 2014, 2013 and 2012:
(in millions, except per share data)
|
Shares issued |
Offering price per share(1) |
Proceeds net of underwriting discounts and offering costs |
|||||||
|---|---|---|---|---|---|---|---|---|---|---|
2014 |
||||||||||
July 2014 public offering |
15.5 | $ | 16.63 | $ | 257.7 | |||||
| | | | | | | | | | | |
Total for the year ended December 31, 2014 |
15.5 | $ | 257.7 | |||||||
2013 |
||||||||||
December 2013 public offering |
16.4 | $ | 17.47 | $ | 286.0 | |||||
October 2013 public offering |
12.7 | $ | 16.98 | 214.3 | ||||||
April 2013 public offering |
19.1 | $ | 17.43 | 333.2 | ||||||
| | | | | | | | | | | |
Total for the year ended December 31, 2013 |
48.2 | $ | 833.5 | |||||||
2012 |
||||||||||
August 2012 public offering |
25.9 | $ | 16.55 | $ | 427.6 | |||||
January 2012 public offering |
16.4 | $ | 15.41 | 252.4 | ||||||
| | | | | | | | | | | |
Total for the year ended December 31, 2012 |
42.3 | $ | 680.0 | |||||||
- (1)
- The shares were sold to the underwriters for a price equal to the offering price per share, which the underwriters were then permitted to sell at variable prices to the public.
80
Debt Capital Activities
Our debt obligations consisted of the following as of December 31, 2014 and 2013:
| |
As of December 31, | ||||||||||||||||||
|---|---|---|---|---|---|---|---|---|---|---|---|---|---|---|---|---|---|---|---|
| |
2014 | 2013 | |||||||||||||||||
(in millions)
|
Total Aggregate Principal Amount Available/ Outstanding(1) |
Principal Amount |
Carrying Value |
Total Aggregate Principal Amount Available/ Outstanding(1) |
Principal Amount |
Carrying Value |
|||||||||||||
Revolving Credit Facility |
$ | 1,250.0 | (2) | $ | 170.0 | $ | 170.0 | $ | 1,060.0 | $ | — | $ | — | ||||||
Revolving Funding Facility |
540.0 | (3) | 324.0 | 324.0 | 620.0 | 185.0 | 185.0 | ||||||||||||
SMBC Funding Facility |
400.0 | 62.0 | 62.0 | 400.0 | — | — | |||||||||||||
February 2016 Convertible Notes |
575.0 | 575.0 | 565.0 | (4) | 575.0 | 575.0 | 556.5 | (4) | |||||||||||
June 2016 Convertible Notes |
230.0 | 230.0 | 225.0 | (4) | 230.0 | 230.0 | 221.8 | (4) | |||||||||||
2017 Convertible Notes |
162.5 | 162.5 | 160.2 | (4) | 162.5 | 162.5 | 159.2 | (4) | |||||||||||
2018 Convertible Notes |
270.0 | 270.0 | 265.4 | (4) | 270.0 | 270.0 | 264.1 | (4) | |||||||||||
2019 Convertible Notes |
300.0 | 300.0 | 296.1 | (4) | 300.0 | 300.0 | 295.3 | (4) | |||||||||||
2018 Notes |
750.0 | 750.0 | 750.7 | (5) | 600.0 | 600.0 | 596.7 | (5) | |||||||||||
2020 Notes |
400.0 | 400.0 | 398.4 | (6) | — | — | — | ||||||||||||
February 2022 Notes |
143.8 | 143.8 | 143.8 | 143.8 | 143.8 | 143.8 | |||||||||||||
October 2022 Notes |
182.5 | 182.5 | 182.5 | 182.5 | 182.5 | 182.5 | |||||||||||||
2040 Notes |
200.0 | 200.0 | 200.0 | 200.0 | 200.0 | 200.0 | |||||||||||||
2047 Notes |
229.5 | 229.5 | 181.3 | (7) | 230.0 | 230.0 | 181.4 | (7) | |||||||||||
| | | | | | | | | | | | | | | | | | | | |
|
$ | 5,633.3 | $ | 3,999.3 | $ | 3,924.4 | $ | 4,973.8 | $ | 3,078.8 | $ | 2,986.3 | |||||||
| | | | | | | | | | | | | | | | | | | | |
| | | | | | | | | | | | | | | | | | | | |
| | | | | | | | | | | | | | | | | | | | |
- (1)
- Subject
to borrowing base and leverage restrictions. Represents the total aggregate amount committed or outstanding, as applicable, under such instrument.
- (2)
- Provides
for a feature that allows us, under certain circumstances, to increase the size of the Revolving Credit Facility to a maximum of
$1,755.0 million.
- (3)
- Provides
for a feature that allows us and our consolidated subsidiary, Ares Capital CP Funding LLC ("Ares Capital CP"), under certain circumstances,
to increase the size of the Revolving Funding Facility to a maximum of $865.0 million.
- (4)
- Represents
the aggregate principal amount outstanding of the Convertible Unsecured Notes less the unaccreted discount recorded upon issuance of the
Convertible Unsecured Notes. The total unaccreted discount for the February 2016 Convertible Notes, the June 2016 Convertible Notes, the 2017 Convertible Notes, the 2018 Convertible Notes and the 2019
Convertible Notes was $10.0 million, $5.0 million, $2.3 million, $4.6 million and $3.9 million, respectively, as of December 31, 2014. The total unaccreted
discount for the February 2016 Convertible Notes, the June 2016 Convertible Notes, the 2017 Convertible Notes, the 2018 Convertible Notes and the 2019 Convertible Notes was $18.5 million,
$8.2 million, $3.3 million, $5.9 million and $4.7 million, respectively, as of December 31, 2013.
- (5)
- Represents the aggregate principal amount outstanding plus the net unamortized premium recorded upon the issuances of the 2018 Notes. The total net unamortized premium for the 2018 Notes was $0.7 million as of December 31, 2014. The total unaccreted discount for the 2018 Notes was $3.3 million as of December 31, 2013.
81
- (6)
- Represents
the aggregate principal amount less the unaccreted discount of $1.6 million recorded upon the issuance of the 2020 Notes.
- (7)
- Represents the aggregate principal amount outstanding less the unaccreted purchased discount. The total unaccreted purchased discount for the 2047 Notes was $48.2 million and $48.6 million as of December 31, 2014 and 2013, respectively.
The weighted average stated interest rate and weighted average maturity, both on aggregate principal amount, of all our debt outstanding as of December 31, 2014 were 4.9% and 6.5 years, respectively, and as of December 31, 2013 were 5.3% and 7.9 years, respectively.
The ratio of total principal amount of debt outstanding to stockholders' equity as of December 31, 2014 was 0.76:1.00 compared to 0.63:1.00 as of December 31, 2013. The ratio of total carrying value of debt outstanding to stockholders' equity as of December 31, 2014 was 0.74:1.00 compared to 0.61:1.00 as of December 31, 2013.
Revolving Credit Facility
We are party to a senior secured revolving credit facility (as amended and restated, the "Revolving Credit Facility"), which allows us to borrow up to $1,250.0 million at any one time outstanding. The end of the revolving period and the stated maturity date for the Revolving Credit Facility are May 4, 2018 and May 4, 2019, respectively. The Revolving Credit Facility also provides for a feature that allows us, under certain circumstances, to increase the size of the facility to a maximum of $1,755.0 million. The interest rate charged on the Revolving Credit Facility is based on LIBOR plus an applicable spread of 2.00% or a "base rate" (as defined in the agreements governing the Revolving Credit Facility) plus an applicable spread of 1.00%. Additionally, we are required to pay a commitment fee of 0.375% per annum on any unused portion of the Revolving Credit Facility. As of December 31, 2014, there was $170.0 million outstanding under the Revolving Credit Facility and we were in compliance in all material respects with the terms of the Revolving Credit Facility.
Revolving Funding Facility
Our consolidated subsidiary, Ares Capital CP, is party to a revolving funding facility (as amended, the "Revolving Funding Facility"), which allows Ares Capital CP to borrow up to $540.0 million at any one time outstanding. The Revolving Funding Facility is secured by all of the assets held by, and the membership interest in, Ares Capital CP. The end of the reinvestment period and the stated maturity date for the Revolving Funding Facility is May 14, 2017 and May 14, 2019, respectively. The Revolving Funding Facility also provides for a feature that allows, under certain circumstances, for an increase in the size of the facility to a maximum of $865.0 million. The interest rate charged on the Revolving Funding Facility is one month LIBOR plus an applicable spread ranging from 2.25% to 2.50% over LIBOR and ranging from 1.25% to 1.50% over "base rate" (as defined in the agreements governing the Revolving Funding Facility) in each case, determined monthly based on the composition of the borrowing base relative to outstanding borrowings under the facility. Additionally, Ares Capital CP is required to pay a commitment fee of between 0.50% and 1.50% per annum depending on the size of the unused portion of the Revolving Funding Facility. As of December 31, 2014, there was $324.0 million outstanding under the Revolving Funding Facility and we and Ares Capital CP were in compliance in all material respects with the terms of the Revolving Funding Facility.
SMBC Funding Facility
Our consolidated subsidiary, Ares Capital JB Funding LLC ("ACJB"), is party to a revolving funding facility (as amended, the "SMBC Funding Facility"), which allows ACJB to borrow up to $400.0 million at any one time outstanding. The SMBC Funding Facility is secured by all of the assets held by ACJB. As of December 31, 2014, the end of the reinvestment period and the stated maturity
82
date for the SMBC Funding Facility were September 14, 2016 and September 14, 2021, respectively. The reinvestment period and the stated maturity date are both subject to two one-year extensions by mutual agreement. The interest rate charged on the SMBC Funding Facility is based on one month LIBOR plus an applicable spread of 2.00% or a "base rate" (as defined in the agreements governing the SMBC Funding Facility) plus an applicable spread of 1.00%. Additionally, ACJB is required to pay a commitment fee of between 0.35% and 0.875% per annum depending on the size of the unused portion of the SMBC Funding Facility. As of December 31, 2014, there was $62.0 million outstanding under the SMBC Funding Facility and we and ACJB were in compliance in all material respects with the terms of the SMBC Funding Facility.
Convertible Unsecured Notes
In January 2011, we issued $575.0 million aggregate principal amount of unsecured convertible notes that mature on February 1, 2016 (the "February 2016 Convertible Notes"), unless previously converted or repurchased in accordance with their terms. In March 2011, we issued $230.0 million aggregate principal amount of unsecured convertible notes that mature on June 1, 2016 (the "June 2016 Convertible Notes"), unless previously converted or repurchased in accordance with their terms. In March 2012, we issued $162.5 million aggregate principal amount of unsecured convertible notes that mature on March 15, 2017 (the "2017 Convertible Notes"), unless previously converted or repurchased in accordance with their terms. In the fourth quarter of 2012, we issued $270.0 million aggregate principal amount of unsecured convertible notes that mature on January 15, 2018 (the "2018 Convertible Notes"), unless previously converted or repurchased in accordance with their terms. In July 2013, we issued $300.0 million aggregate principal amount of unsecured convertible notes that mature on January 15, 2019 (the "2019 Convertible Notes" and together with the February 2016 Convertible Notes, the June 2016 Convertible Notes, the 2017 Convertible Notes and the 2018 Convertible Notes, the "Convertible Unsecured Notes"), unless previously converted or repurchased in accordance with their terms. We do not have the right to redeem the Convertible Unsecured Notes prior to maturity. The February 2016 Convertible Notes, the June 2016 Convertible Notes, the 2017 Convertible Notes, the 2018 Convertible Notes and the 2019 Convertible Notes bear interest at a rate of 5.750%, 5.125%, 4.875%, 4.750% and 4.375%, respectively, per year, payable semi-annually.
In certain circumstances, the Convertible Unsecured Notes will be convertible into cash, shares of our common stock or a combination of cash and shares of our common stock, at our election, at their respective conversion rates (listed below as of December 31, 2014) subject to customary anti-dilution adjustments and the requirements of their respective indenture (the "Convertible Unsecured Notes Indentures"). Prior to the close of business on the business day immediately preceding their respective conversion date (listed below), holders may convert their Convertible Unsecured Notes only under certain circumstances set forth in the respective Convertible Unsecured Notes Indenture. On or after their respective conversion dates until the close of business on the scheduled trading day immediately preceding their respective maturity date, holders may convert their Convertible Unsecured Notes at any time. In addition, if we engage in certain corporate events as described in their respective Convertible Unsecured Notes Indenture, holders of the Convertible Unsecured Notes may require us to repurchase for cash all or part of the Convertible Unsecured Notes at a repurchase price equal to 100% of the principal amount of the Convertible Unsecured Notes to be repurchased, plus accrued and unpaid interest through, but excluding, the required repurchase date.
83
Certain key terms related to the convertible features for each of the Convertible Unsecured Notes as of December 31, 2014 are listed below.
| |
February 2016 Convertible Notes |
June 2016 Convertible Notes |
2017 Convertible Notes |
2018 Convertible Notes |
2019 Convertible Notes |
|||||||||||
|---|---|---|---|---|---|---|---|---|---|---|---|---|---|---|---|---|
Conversion premium |
17.5 | % | 17.5 | % | 17.5 | % | 17.5 | % | 15.0 | % | ||||||
Closing stock price at issuance |
$16.28 | $16.20 | $16.46 | $16.91 | $17.53 | |||||||||||
Closing stock price date |
January 19, 2011 | March 22, 2011 | March 8, 2012 | October 3, 2012 | July 15, 2013 | |||||||||||
Conversion price(1) |
$18.52 | $18.43 | $19.01 | $19.70 | $20.05 | |||||||||||
Conversion rate (shares per one thousand dollar principal amount)(1) |
53.9908 | 54.2575 | 52.6043 | 50.7591 | 49.8854 | |||||||||||
Conversion dates |
August 15, 2015 | December 15, 2015 | September 15, 2016 | July 15, 2017 | July 15, 2018 | |||||||||||
- (1)
- Represents conversion price and conversion rate, as applicable, as of December 31, 2014, taking into account certain de minimis adjustments that will be made on the conversion date.
Unsecured Notes
2018 Notes
In November 2013, we issued $600.0 million in aggregate principal amount of unsecured notes, which bear interest at a rate of 4.875% per year and mature on November 30, 2018 (the "2018 Notes"). The 2018 Notes require payment of interest semi-annually, and all principal is due upon maturity. These notes are redeemable in whole or in part at any time at our option at a redemption price equal to par plus a "make whole" premium, as determined pursuant to the indenture governing the 2018 Notes, and any accrued and unpaid interest. The $600.0 million aggregate principal amount of the 2018 Notes was issued at a discount of the principal amount. In January 2014, we issued an additional $150.0 million aggregate principal amount of the 2018 Notes at a premium of 102.7% of their principal amount.
2020 Notes
In November 2014, we issued $400.0 million in aggregate principal amount of unsecured notes, which bear interest at a rate of 3.875% per year and mature on January 15, 2020 (the "2020 Notes"). The 2020 Notes require payment of interest semi-annually, and all principal is due upon maturity. These notes are redeemable in whole or in part at any time at our option at a redemption price equal to par plus a "make whole" premium, if applicable, as determined pursuant to the indenture governing the 2020 Notes, and any accrued and unpaid interest. The $400.0 million aggregate principal amount of the 2020 Notes was issued at a discount to the principal amount. See "Recent Developments," as well as Note 17 to our consolidated financial statements for the year ended December 31, 2014 for more information on the 2020 Notes.
February 2022 Notes
In February 2012, we issued $143.8 million in aggregate principal amount of unsecured notes, which bear interest at a rate of 7.00% per year and mature on February 15, 2022 (the "February 2022 Notes"). The February 2022 Notes require payment of interest quarterly, and all principal is due upon maturity. These notes are redeemable in whole or in part at any time or from time to time at our option on or after February 15, 2015, at a par redemption price of $25.00 per security plus accrued and unpaid interest. See "Recent Developments," as well as Note 17 to our consolidated financial statements for the year ended December 31, 2014 for more information on the February 2022 Notes.
84
October 2022 Notes
In September 2012 and October 2012, we issued $182.5 million in aggregate principal amount of unsecured notes, which bear interest at a rate of 5.875% per year and mature on October 1, 2022 (the "October 2022 Notes"). The October 2022 Notes require payment of interest quarterly and all principal is due upon maturity. These notes are redeemable in whole or in part at any time or from time to time at our option on or after October 1, 2015, at a par redemption price of $25.00 per security plus accrued and unpaid interest.
2040 Notes
In October 2010, we issued $200.0 million in aggregate principal amount of unsecured notes which bear interest at a rate of 7.75% and mature on October 15, 2040 (the "2040 Notes"). The 2040 Notes require payment of interest quarterly, and all principal is due upon maturity. These notes are redeemable in whole or in part at any time or from time to time at our option on or after October 15, 2015, at a par redemption price of $25.00 per security plus accrued and unpaid interest.
2047 Notes
As part of the Allied Acquisition, we assumed $230.0 million aggregate principal amount of unsecured notes which bear interest at a rate of 6.875% and mature on April 15, 2047 (the "2047 Notes" and together with the 2018 Notes, the 2020 Notes, the February 2022 Notes, the October 2022 Notes and the 2040 Notes, the "Unsecured Notes"). The 2047 Notes require payment of interest quarterly, and all principal is due upon maturity. These notes are redeemable in whole or in part at any time or from time to time at our option, at a par redemption price of $25.00 per security plus accrued and unpaid interest.
As of December 31, 2014, we were in compliance in all material respects with the terms of the Convertible Unsecured Notes Indentures and the indentures governing the Unsecured Notes.
The Convertible Unsecured Notes and the Unsecured Notes are our senior unsecured obligations and rank senior in right of payment to any future indebtedness that is expressly subordinated in right of payment to the Convertible Unsecured Notes and the Unsecured Notes; equal in right of payment to our existing and future unsecured indebtedness that is not expressly subordinated; effectively junior in right of payment to any of our secured indebtedness (including existing unsecured indebtedness that we later secure) to the extent of the value of the assets securing such indebtedness; and structurally junior to all existing and future indebtedness (including trade payables) incurred by our subsidiaries, financing vehicles or similar facilities.
See Note 5 to our consolidated financial statements for the year ended December 31, 2014 for more detail on our debt obligations.
85
CONTRACTUAL OBLIGATIONS
A summary of the maturities of our principal amounts of debt and other contractual payment obligations as of December 31, 2014 are as follows:
| |
Payments Due by Period | |||||||||||||||
|---|---|---|---|---|---|---|---|---|---|---|---|---|---|---|---|---|
(in millions)
|
Total | Less than 1 year |
1-3 years | 3-5 years | After 5 years |
|||||||||||
Revolving Credit Facility |
$ | 170.0 | $ | — | $ | — | $ | 170.0 | $ | — | ||||||
Revolving Funding Facility |
324.0 | — | — | 324.0 | — | |||||||||||
SMBC Funding Facility |
62.0 | — | — | — | 62.0 | |||||||||||
February 2016 Convertible Notes |
575.0 | — | 575.0 | — | — | |||||||||||
June 2016 Convertible Notes |
230.0 | — | 230.0 | — | — | |||||||||||
2017 Convertible Notes |
162.5 | — | 162.5 | — | — | |||||||||||
2018 Convertible Notes |
270.0 | — | — | 270.0 | — | |||||||||||
2019 Convertible Notes |
300.0 | — | — | 300.0 | — | |||||||||||
2018 Notes |
750.0 | — | — | 750.0 | — | |||||||||||
2020 Notes(1) |
400.0 | — | — | — | 400.0 | |||||||||||
February 2022 Notes(1) |
143.8 | — | — | — | 143.8 | |||||||||||
October 2022 Notes |
182.5 | — | — | — | 182.5 | |||||||||||
2040 Notes |
200.0 | — | — | — | 200.0 | |||||||||||
2047 Notes |
229.6 | — | — | — | 229.6 | |||||||||||
Operating lease obligations |
104.9 | 8.7 | 18.8 | 18.8 | 58.6 | |||||||||||
| | | | | | | | | | | | | | | | | |
|
$ | 4,104.3 | $ | 8.7 | $ | 986.3 | $ | 1,832.8 | $ | 1,276.5 | ||||||
| | | | | | | | | | | | | | | | | |
| | | | | | | | | | | | | | | | | |
| | | | | | | | | | | | | | | | | |
- (1)
- See "Recent Developments," as well as Note 17 to our consolidated financial statements for the year ended December 31, 2014 for more information on the 2020 Notes and the February 2022 Notes.
OFF BALANCE SHEET ARRANGEMENTS
We have various commitments to fund investments in our portfolio, as described below.
As of December 31, 2014 and 2013, we had the following commitments to fund various revolving and delayed draw senior secured and subordinated loans, including commitments to fund which are at (or substantially at) our discretion:
| |
As of December 31, | ||||||
|---|---|---|---|---|---|---|---|
(in millions)
|
2014 | 2013 | |||||
Total revolving and delayed draw commitments |
$ | 667.3 | $ | 834.5 | |||
Less: funded commitments |
(111.8 | ) | (87.1 | ) | |||
| | | | | | | | |
Total unfunded commitments |
555.5 | 747.4 | |||||
Less: commitments substantially at discretion of the Company |
(6.0 | ) | (16.0 | ) | |||
Less: unavailable commitments due to borrowing base or other covenant restrictions |
(2.7 | ) | (1.7 | ) | |||
| | | | | | | | |
Total net adjusted unfunded revolving and delayed draw commitments |
$ | 546.8 | $ | 729.7 | |||
| | | | | | | | |
| | | | | | | | |
| | | | | | | | |
Included within the total revolving and delayed draw commitments as of December 31, 2014 were commitments to issue up to $71.7 million in letters of credit through a financial intermediary on behalf of certain portfolio companies. As of December 31, 2014, we had $19.7 million in letters of credit
86
issued and outstanding under these commitments on behalf of the portfolio companies. In addition to these letters of credit included as a part of the total revolving and delayed draw commitments to portfolio companies, as of December 31, 2014 we also had $5.3 million of letters of credit issued and outstanding on behalf of other portfolio companies. For all these letters of credit issued and outstanding, we would be required to make payments to third parties if the portfolio companies were to default on their related payment obligations. None of these letters of credit issued and outstanding are recorded as a liability on our balance sheet as such letters of credit are considered in the valuation of the investments in the portfolio company. Of these letters of credit, $18.1 million expire in 2015 and $6.9 million expire in 2016.
We also have commitments to co-invest in the SSLP for our portion of the SSLP's commitments to fund delayed draw investments to certain portfolio companies of the SSLP. See "Senior Secured Loan Program" above and Note 4 to our consolidated financial statements for the year ended December 31, 2014 for more information.
As of December 31, 2014 and 2013, we were party to subscription agreements to fund equity investments in private equity investment partnerships as follows:
| |
As of December 31, | ||||||
|---|---|---|---|---|---|---|---|
(in millions)
|
2014 | 2013 | |||||
Total private equity commitments |
$ | 107.0 | $ | 59.5 | |||
Less: funded private equity commitments |
(13.9 | ) | (11.9 | ) | |||
| | | | | | | | |
Total unfunded private equity commitments |
93.1 | 47.6 | |||||
Less: private equity commitments substantially at discretion of the Company |
(91.2 | ) | (43.2 | ) | |||
| | | | | | | | |
Total net adjusted unfunded private equity commitments |
$ | 1.9 | $ | 4.4 | |||
| | | | | | | | |
| | | | | | | | |
| | | | | | | | |
In the ordinary course of business, we may sell certain of our investments to third party purchasers. In particular, in connection with the sale of certain controlled portfolio company equity investments (as well as certain other sales), we have, and may continue to do so in the future, agreed to indemnify such purchasers for future liabilities arising from the investments and the related sale transaction. Such indemnification provisions have given rise to liabilities in the past and may do so in the future.
RECENT DEVELOPMENTS
In January 2015, we issued an additional $200.0 million aggregate principal amount of the 2020 Notes (the "Additional 2020 Notes") at a premium of 100.2% of their principal amount. Total proceeds from the issuance of the Additional 2020 Notes, net of underwriting discounts and offering costs, were approximately $198.4 million. The proceeds were used to repay outstanding indebtedness under our debt facilities and for general corporate purposes, including investing in portfolio companies in accordance with our investment objective.
In February 2015, we notified the holders of our February 2022 Notes that we planned to redeem the entire $143.8 million aggregate principal amount outstanding, in accordance with the terms of the indenture governing the February 2022 Notes. We expect to complete the redemption on or about March 16, 2015.
From January 1, 2015 through February 20, 2015, we made new investment commitments of approximately $171 million, of which approximately $165 million were funded. Of these new commitments, 62% were in second lien senior secured loans, 34% were in first lien senior secured loans and 4% were investments in subordinated certificates of the SSLP to make co-investments with GE in first lien senior secured loans through the SSLP. Of the approximately $171 million of new
87
investment commitments, 88% were floating rate and 12% were fixed rate. The weighted average yield of debt and other income producing securities funded during the period at amortized cost was 10.0%. We may seek to syndicate a portion of these new investment commitments, although there can be no assurance that we will be able to do so.
From January 1, 2015 through February 20, 2015, we exited approximately $597 million of investment commitments. Of these investment commitments, 81% were first lien senior secured loans, 14% were investments in subordinated certificates of the SSLP, 4% were second lien senior secured loans and 1% were other equity securities. Of the approximately $597 million of exited investment commitments, 98% were floating rate, 1% were fixed rate and 1% were non-interest bearing. The weighted average yield of debt and other income producing securities exited or repaid during the period at amortized cost was 7.8%. On the approximately $597 million of investment commitments exited from January 1, 2015 through February 20, 2015, we recognized total net realized gains of approximately $15 million.
In addition, as of February 20, 2015, we had an investment backlog and pipeline of approximately $190 million and $510 million, respectively. Investment backlog includes transactions approved by our investment adviser's investment committee and/or for which a formal mandate, letter of intent or a signed commitment have been issued, and therefore we believe are likely to close. Investment pipeline includes transactions where due diligence and analysis are in process, but no formal mandate, letter of intent or signed commitment have been issued. The consummation of any of the investments in this backlog and pipeline depends upon, among other things, one or more of the following: satisfactory completion of our due diligence investigation of the prospective portfolio company, our acceptance of the terms and structure of such investment and the execution and delivery of satisfactory transaction documentation. In addition, we may syndicate a portion of these investments and certain of these investments may result in the repayment of existing investments. We cannot assure you that we will make any of these investments or that we will syndicate any portion of these investments.
CRITICAL ACCOUNTING POLICIES
Basis of Presentation
The accompanying consolidated financial statements have been prepared on the accrual basis of accounting in conformity with GAAP, and include the accounts of ours and our consolidated subsidiaries. We are an investment company following accounting and reporting guidance in ASC 946. The consolidated financial statements reflect all adjustments and reclassifications that, in the opinion of management, are necessary for the fair presentation of the results of the operations and financial condition as of and for the periods presented. All significant intercompany balances and transactions have been eliminated.
Cash and Cash Equivalents
Cash and cash equivalents include funds from time to time deposited with financial institutions and short-term, liquid investments in a money market fund. Cash and cash equivalents are carried at cost which approximates fair value.
Concentration of Credit Risk
We place our cash and cash equivalents with financial institutions and, at times, cash held in money market accounts may exceed the Federal Deposit Insurance Corporation insured limit.
88
Investments
Investment transactions are recorded on the trade date. Realized gains or losses are measured by the difference between the net proceeds from the repayment or sale and the amortized cost basis of the investment without regard to unrealized gains or losses previously recognized, and include investments charged off during the period, net of recoveries. Unrealized gains or losses primarily reflect the change in investment values, including the reversal of previously recorded unrealized gains or losses when gains or losses are realized.
Investments for which market quotations are readily available are typically valued at such market quotations. In order to validate market quotations, we look at a number of factors to determine if the quotations are representative of fair value, including the source and nature of the quotations. Debt and equity securities that are not publicly traded or whose market prices are not readily available (i.e., substantially all of our investments) are valued at fair value as determined in good faith by our board of directors, based on, among other things, the input of our investment adviser, audit committee and independent third-party valuation firms that have been engaged at the direction of our board of directors to assist in the valuation of each portfolio investment without a readily available market quotation at least once during a trailing 12-month period (with certain de minimis exceptions) and under a valuation policy and a consistently applied valuation process. The valuation process is conducted at the end of each fiscal quarter, and a minimum of 55% of our portfolio at fair value is subject to review by an independent valuation firm each quarter. In addition, our independent registered public accounting firm obtains an understanding of, and performs select procedures relating to, our investment valuation process within the context of performing the integrated audit.
As part of the valuation process, we may take into account the following types of factors, if relevant, in determining the fair value of our investments: the enterprise value of a portfolio company (the entire value of the portfolio company to a market participant, including the sum of the values of debt and equity securities used to capitalize the enterprise at a point in time), the nature and realizable value of any collateral, the portfolio company's ability to make payments and its earnings and discounted cash flow, the markets in which the portfolio company does business, a comparison of the portfolio company's securities to any similar publicly traded securities, changes in the interest rate environment and the credit markets generally that may affect the price at which similar investments would trade in their principal markets and other relevant factors. When an external event such as a purchase transaction, public offering or subsequent equity sale occurs, we consider the pricing indicated by the external event to corroborate our valuation.
Because there is not a readily available market value for most of the investments in our portfolio, we value substantially all of our portfolio investments at fair value as determined in good faith by our board of directors, as described herein. Due to the inherent uncertainty of determining the fair value of investments that do not have a readily available market value, the fair value of our investments may fluctuate from period to period. Additionally, the fair value of our investments may differ significantly from the values that would have been used had a ready market existed for such investments and may differ materially from the values that we may ultimately realize. Further, such investments are generally subject to legal and other restrictions on resale or otherwise are less liquid than publicly traded securities. If we were required to liquidate a portfolio investment in a forced or liquidation sale, we could realize significantly less than the value at which we have recorded it.
In addition, changes in the market environment and other events that may occur over the life of the investments may cause the gains or losses ultimately realized on these investments to be different than the unrealized gains or losses reflected in the valuations currently assigned.
89
Our board of directors undertakes a multi-step valuation process each quarter, as described below:
- •
- Our quarterly valuation process begins with each portfolio company or investment being initially valued by the investment
professionals responsible for the portfolio investment in conjunction with our portfolio management team.
- •
- Preliminary valuations are reviewed and discussed with our investment adviser's management and investment professionals, and then
valuation recommendations are presented to our board of directors.
- •
- The audit committee of our board of directors reviews these valuations, as well as the input of third parties, including independent
third-party valuation firms, who review a minimum of 55% of our portfolio at fair value.
- •
- Our board of directors discusses valuations and ultimately determines the fair value of each investment in our portfolio without a readily available market quotation in good faith based on, among other things, the input of our investment adviser, audit committee and, where applicable, independent third-party valuation firms.
Interest and Dividend Income Recognition
Interest income is recorded on an accrual basis and includes the accretion of discounts and amortization of premiums. Discounts from and premiums to par value on securities purchased are accreted/amortized into interest income over the life of the respective security using the effective yield method. The amortized cost of investments represents the original cost adjusted for the accretion of discounts and amortization of premiums, if any.
Loans are generally placed on non-accrual status when principal or interest payments are past due 30 days or more or when there is reasonable doubt that principal or interest will be collected in full. Accrued and unpaid interest is generally reversed when a loan is placed on non-accrual status. Interest payments received on non-accrual loans may be recognized as income or applied to principal depending upon management's judgment regarding collectability. Non-accrual loans are restored to accrual status when past due principal and interest is paid and, in management's judgment, are likely to remain current. We may make exceptions to this if the loan has sufficient collateral value and is in the process of collection.
Dividend income on preferred equity securities is recorded as dividend income on an accrual basis to the extent that such amounts are payable by the portfolio company and are expected to be collected. Dividend income on common equity securities is recorded on the record date for private portfolio companies or on the ex-dividend date for publicly traded portfolio companies.
Payment-in-Kind Interest
We have loans in our portfolio that contain PIK provisions. The PIK interest, computed at the contractual rate specified in each loan agreement, is added to the principal balance of the loan and recorded as interest income. To maintain our status as a RIC, this non-cash source of income must be paid out to stockholders in the form of dividends even though we have not yet collected the cash.
Capital Structuring Service Fees and Other Income
Our investment adviser seeks to provide assistance to our portfolio companies in connection with our investments and in return we may receive fees for capital structuring services. These fees are generally only available to us as a result of our underlying investments, are normally paid at the closing of the investments, are generally non-recurring and are recognized as revenue when earned upon closing of the investment. The services that our investment adviser provides vary by investment, but
90
generally include reviewing existing credit facilities, arranging bank financing, arranging equity financing, structuring financing from multiple lenders, structuring financing from multiple equity investors, restructuring existing loans, raising equity and debt capital, and providing general financial advice, which concludes upon closing of the investment. Any services of the above nature subsequent to the closing would generally generate a separate fee payable to us. In certain instances where we are invited to participate as a co-lender in a transaction and do not provide significant services in connection with the investment, a portion of loan fees paid to us in such situations will be deferred and amortized over the estimated life of the loan. We may also take a seat on the board of directors of a portfolio company, or observe the meetings of the board of directors without taking a formal seat.
Other income includes fees for asset management, management and consulting services, loan guarantees, commitments, amendments and other services rendered by us to portfolio companies. Such fees are recognized as income when earned or the services are rendered.
Foreign Currency Translation
Our books and records are maintained in U.S. dollars. Any foreign currency amounts are translated into U.S. dollars on the following basis:
- (1)
- Fair
value of investment securities, other assets and liabilities—at the exchange rates prevailing at the end of the period.
- (2)
- Purchases and sales of investment securities, income and expenses—at the exchange rates prevailing on the respective dates of such transactions, income or expenses.
Results of operations based on changes in foreign exchange rates are separately disclosed in the statement of operations. Foreign security and currency translations may involve certain considerations and risks not typically associated with investing in U.S. companies and U.S. government securities. These risks include, but are not limited to, currency fluctuations and revaluations and future adverse political, social and economic developments, which could cause investments in foreign markets to be less liquid and prices more volatile than those of comparable U.S. companies or U.S. government securities.
Accounting for Derivative Instruments
We do not utilize hedge accounting and instead mark our derivatives to market in our consolidated statement of operations.
Equity Offering Expenses
Our offering costs, excluding underwriters' fees, are charged against the proceeds from equity offerings when received.
Debt Issuance Costs
Debt issuance costs are amortized over the life of the related debt instrument using the straight line method or the effective yield method, depending on the type of debt instrument.
Income Taxes
We have elected to be treated as a RIC under the Code and operate in a manner so as to qualify for the tax treatment applicable to RICs. To qualify as a RIC, we must, among other things, meet certain source-of- income and asset diversification requirements and timely distribute to our stockholders at least 90% of our investment company taxable income, as defined by the Code, for each
91
year. We, among other things, have made and intend to continue to make the requisite distributions to our stockholders, which will generally relieve us from U.S. federal corporate-level income taxes.
Depending on the level of taxable income earned in a tax year, we may choose to carry forward such taxable income in excess of current year dividend distributions from such current year taxable income into the next tax year and pay a 4% excise tax on such income, as required. To the extent that we determine that our estimated current year annual taxable income will be in excess of estimated current year dividend distributions, we accrue excise tax, if any, on estimated excess taxable income as such taxable income is earned.
Certain of our consolidated subsidiaries are subject to U.S. federal and state corporate-level income taxes.
Dividends to Common Stockholders
Dividends and distributions to common stockholders are recorded on the ex-dividend date. The amount to be paid out as a dividend is determined by our board of directors each quarter and is generally based upon the earnings estimated by management. Net realized capital gains, if any, are generally distributed, although we may decide to retain such capital gains for investment.
We have adopted a dividend reinvestment plan that provides for reinvestment of any distributions we declare in cash on behalf of our stockholders, unless a stockholder elects to receive cash. As a result, if our board of directors authorizes, and we declare, a cash dividend, then our stockholders who have not "opted out" of our dividend reinvestment plan will have their cash dividends automatically reinvested in additional shares of our common stock, rather than receiving the cash dividend. We intend to use primarily newly issued shares to implement the dividend reinvestment plan (so long as we are trading at a premium to net asset value). If our shares are trading at a discount to net asset value and we are otherwise permitted under applicable law to purchase such shares, we may purchase shares in the open market in connection with our obligations under our dividend reinvestment plan. However, we reserve the right to issue new shares of our common stock in connection with our obligations under the dividend reinvestment plan even if our shares are trading below net asset value.
Use of Estimates in the Preparation of Financial Statements
The preparation of financial statements in conformity with GAAP requires management to make estimates and assumptions that affect the reported amounts of actual and contingent assets and liabilities at the date of the financial statements and the reported amounts of income or loss and expenses during the reporting period. Actual results could differ from those estimates. Significant estimates include the valuation of investments.
Recent Accounting Pronouncements
See Note 2 to our consolidated financial statements for the year ended December 31, 2014 for more information about recent accounting pronouncements.
Item 7A. Quantitative and Qualitative Disclosures About Market Risk
We are subject to financial market risks, including changes in interest rates and the valuations of our investment portfolio.
Interest Rate Risk
Interest rate sensitivity refers to the change in our earnings that may result from changes in the level of interest rates. Because we fund a portion of our investments with borrowings, our net investment income is affected by the difference between the rate at which we invest and the rate at
92
which we borrow. As a result, there can be no assurance that a significant change in market interest rates will not have a material adverse effect on our net investment income. See "Risk Factors—Risks Relating to Our Business—We are exposed to risks associated with changes in interest rates."
As of December 31, 2014, 82% of the investments at fair value in our portfolio bore interest at variable rates, 8% bore interest at fixed rates, 8% were non-interest earning and 2% were on non-accrual status. Additionally, for the variable rate investments, 71% of these investments contained interest rate floors (representing 59% of total investments at fair value). The Facilities all bear interest at variable rates with no interest rate floors, while the Unsecured Notes and the Convertible Unsecured Notes bear interest at fixed rates.
We regularly measure our exposure to interest rate risk. We assess interest rate risk and manage our interest rate exposure on an ongoing basis by comparing our interest rate sensitive assets to our interest rate sensitive liabilities. Based on that review, we determine whether or not any hedging transactions are necessary to mitigate exposure to changes in interest rates.
While hedging activities may mitigate our exposure to adverse fluctuations in interest rates, certain hedging transactions that we may enter into in the future, such as interest rate swap agreements, may also limit our ability to participate in the benefits of lower interest rates with respect to our portfolio investments. In addition, there can be no assurance that we will be able to effectively hedge our interest rate risk.
Based on our December 31, 2014, balance sheet, the following table shows the annual impact on net income of base rate changes in interest rates (considering interest rate floors for variable rate instruments) assuming no changes in our investment and borrowing structure:
(in millions) Basis Point Change |
Interest Income |
Interest Expense |
Net Income(1) |
|||||||
|---|---|---|---|---|---|---|---|---|---|---|
Up 300 basis points |
$ | 141.0 | $ | 16.7 | $ | 124.3 | ||||
Up 200 basis points |
$ | 68.1 | $ | 11.1 | $ | 57.0 | ||||
Up 100 basis points |
$ | (3.9 | ) | $ | 5.6 | $ | (9.5 | ) | ||
Down 100 basis points |
$ | 7.2 | $ | (1.0 | ) | $ | 8.2 | |||
Down 200 basis points |
$ | 7.2 | $ | (1.0 | ) | $ | 8.2 | |||
Down 300 basis points |
$ | 7.2 | $ | (1.0 | ) | $ | 8.2 | |||
- (1)
- Excludes the impact of income based fees. See Note 3 to our consolidated financial statements for the year ended December 31, 2014 for more information on the income based fees.
93
Based on our December 31, 2013, balance sheet, the following table shows the annual impact on net income of base rate changes in interest rates (considering interest rate floors for variable rate instruments) assuming no changes in our investment and borrowing structure:
(in millions) Basis Point Change |
Interest Income |
Interest Expense |
Net Income(1) |
|||||||
|---|---|---|---|---|---|---|---|---|---|---|
Up 300 basis points |
$ | 98.2 | $ | 5.6 | $ | 92.6 | ||||
Up 200 basis points |
$ | 38.7 | $ | 3.7 | $ | 35.0 | ||||
Up 100 basis points |
$ | (19.0 | ) | $ | 1.9 | $ | (20.9 | ) | ||
Down 100 basis points |
$ | 6.3 | $ | (0.3 | ) | $ | 6.6 | |||
Down 200 basis points |
$ | 6.3 | $ | (0.3 | ) | $ | 6.6 | |||
Down 300 basis points |
$ | 6.3 | $ | (0.3 | ) | $ | 6.6 | |||
- (1)
- Excludes the impact of income based fees. See Note 3 to our consolidated financial statements for the year ended December 31, 2014 for more information on the income based fees.
Item 8. Financial Statements And Supplementary Data
See the Index to Consolidated Financial Statements.
Item 9. Changes In And Disagreements With Accountants On Accounting And Financial Disclosure
None.
Item 9A. Controls And Procedures
(a) Evaluation of Disclosure Controls and Procedures. The Company's management, with the participation of the Company's Chief Executive Officer and Chief Financial Officer, has evaluated the effectiveness of the Company's disclosure controls and procedures (as defined in Rules 13a-15(e) and 15d-15(e) of the Exchange Act) as of the end of the period covered by this report. Based upon such evaluation, the Company's Chief Executive Officer and Chief Financial Officer concluded that our disclosure controls and procedures were effective, as of December 31, 2014, to provide assurance that information that is required to be disclosed by the Company in the reports that it files or submits under the Exchange Act is recorded, processed, summarized, and reported, within the time periods specified by the SEC's rules and forms. Disclosure controls and procedures include, without limitation, controls and procedures designed to ensure that information required to be disclosed by the Company in the reports that it files or submits under the Exchange Act is accumulated and communicated to the Company's management, including its Chief Executive Officer and Chief Financial Officer, or persons performing similar functions, as appropriate, to allow timely decisions regarding required disclosure.
(b) Management's Report on Internal Control over Financial Reporting. The Company's management is responsible for establishing and maintaining adequate internal controls over financial reporting (as defined in Rules 13a-15(f) and 15d-15(f) of the Exchange Act). Under the supervision and with the participation of management, including the Chief Executive Officer and Chief Financial Officer, the Company conducted an evaluation of the effectiveness of the Company's internal controls over financial reporting based on the criteria established in Internal Control—Integrated Framework (2013) issued by the Committee of Sponsoring Organizations of the Treadway Commission (COSO). Based on the Company's evaluation under the framework in Internal Control—Integrated Framework (2013), management concluded that the Company's internal controls over financial reporting was effective as of December 31, 2014. The Company's internal controls over financial reporting as of December 31, 2014, has been audited by our independent registered public accounting firm,
94
KPMG LLP, as stated in its report titled "Report of Independent Registered Public Accounting Firm" on page F-2.
Because of its inherent limitations, internal controls over financial reporting may not prevent or detect misstatements. Also, projections of any evaluation of effectiveness to future periods are subject to the risk that controls may become inadequate because of changes in conditions, or that the degree of compliance with the policies or procedures may deteriorate.
(c) Audit Report of the Registered Public Accounting Firm. The Company's independent registered public accounting firm, KPMG LLP, has issued an audit report on the effectiveness of the Company's internal control over financial reporting which is set forth under the heading "Report of Independent Registered Public Accounting Firm" on page F-2.
(d) Changes in Internal Control over Financial Reporting. There have been no changes in our internal control over financial reporting (as defined in Rules 13a-15(f) and 15d-15(f) of the Exchange Act) during our most recently completed fiscal quarter, that have materially affected, or are reasonably likely to materially affect, our internal control over financial reporting.
None.
95
Item 10. Directors, Executive Officers and Corporate Governance
The information required by this item will be contained in the Company's definitive Proxy Statement for its 2015 Annual Stockholder Meeting, to be filed with the SEC within 120 days after December 31, 2014, and is incorporated herein by reference.
Item 11. Executive Compensation
The information required by this item will be contained in the Company's definitive Proxy Statement for its 2015 Annual Stockholder Meeting, to be filed with the SEC within 120 days after December 31, 2014, and is incorporated herein by reference.
Item 12. Security Ownership of Certain Beneficial Owners and Management and Related Stockholder Matters
The information required by this item will be contained in the Company's definitive Proxy Statement for its 2015 Annual Stockholder Meeting, to be filed with the SEC within 120 days after December 31, 2014, and is incorporated herein by reference.
Item 13. Certain Relationships and Related Transactions, and Director Independence
The information required by this item will be contained in the Company's definitive Proxy Statement for its 2015 Annual Stockholder Meeting, to be filed with the SEC within 120 days after December 31, 2014, and is incorporated herein by reference.
Item 14. Principal Accountant Fees and Services
The information required by this item will be contained in the Company's definitive Proxy Statement for its 2015 Annual Stockholder Meeting, to be filed with the SEC within 120 days after December 31, 2014, and is incorporated herein by reference.
96
Item 15. Exhibits, Financial Statement Schedules
The following documents are filed as part of this Annual Report:
- 1.
- Financial
Statements-See the Index to Consolidated Financial Statements on Page F-1.
- 2.
- Financial
Statement Schedules-None. We have omitted financial statement schedules because they are not required or are not applicable, or the required
information is shown in the financial statements or notes to the financial statements.
- 3.
- Exhibits.
| Number | Description | ||
|---|---|---|---|
| 3.1 | Articles of Amendment and Restatement, as amended(1) | ||
3.2 |
Second Amended and Restated Bylaws, as amended(2) |
||
4.1 |
Form of Stock Certificate(3) |
||
4.2 |
Indenture, dated June 16, 2006, between Allied Capital Corporation and The Bank of New York, as trustee(4) |
||
4.3 |
Form of Note under the Indenture, dated June 16, 2006, between Allied Capital Corporation and The Bank of New York, as trustee(4) |
||
4.4 |
Third Supplemental Indenture, dated as of March 28, 2007, between Allied Capital Corporation and The Bank of New York, as trustee(5) |
||
4.5 |
Form of 6.875% Notes due 2047(5) |
||
4.6 |
Fourth Supplemental Indenture, dated as of April 1, 2010, among Ares Capital Corporation, Allied Capital Corporation and The Bank of New York Mellon, as trustee(6) |
||
4.7 |
Indenture, dated as of October 21, 2010, between Ares Capital Corporation and U.S. Bank National Association, as trustee(7) |
||
4.8 |
First Supplemental Indenture, dated as of October 21, 2010, relating to the 7.75% Senior Notes due 2040, between Ares Capital Corporation and U.S. Bank National Association, as trustee(7) |
||
4.9 |
Form of 7.75% Senior Notes due 2040(7) |
||
4.10 |
Second Supplemental Indenture, dated as of February 2, 2012, relating to the 7.00% Senior Notes due 2022, between Ares Capital Corporation and U.S. Bank National Association, as trustee(8) |
||
4.11 |
Form of 7.00% Senior Notes due 2022(8) |
||
4.12 |
Third Supplemental Indenture, dated as of September 25, 2012, relating to the 5.875% Senior Notes due 2022, between Ares Capital Corporation and U.S. Bank National Association, as trustee(9) |
||
4.13 |
Form of 5.875% Senior Notes due 2022(9) |
||
4.14 |
Fourth Supplemental Indenture, dated as of November 19, 2013, relating to the 4.875% Senior Notes due 2018, between Ares Capital Corporation and U.S. Bank National Association, as trustee(10) |
||
4.15 |
Form of 4.875% Senior Notes due 2018(10) |
||
97
| Number | Description | ||
|---|---|---|---|
| 4.16 | Fifth Supplemental Indenture, dated as of November 21, 2014, relating to the 3.875% Notes due 2020, between Ares Capital Corporation and U.S. Bank National Association, as trustee(11) | ||
4.17 |
Form of 3.875% Notes due 2020(11) |
||
4.18 |
Indenture, dated as of January 25, 2011, between Ares Capital Corporation and U.S. Bank National Association, as trustee(12) |
||
4.19 |
Form of 5.75% Convertible Senior Notes due 2016(12) |
||
4.20 |
Indenture, dated as of March 28, 2011, between Ares Capital Corporation and U.S. Bank National Association, as trustee(13) |
||
4.21 |
Form of 5.125% Convertible Senior Notes due 2016(13) |
||
4.22 |
Indenture, dated as of March 14, 2012, between Ares Capital Corporation and U.S. Bank National Association, as trustee(14) |
||
4.23 |
Form of 4.875% Convertible Senior Notes due 2017(14) |
||
4.24 |
Indenture, dated as of October 10, 2012, between Ares Capital Corporation and U.S. Bank National Association, as trustee(15) |
||
4.25 |
Form of 4.75% Convertible Senior Notes due 2018(15) |
||
4.26 |
Indenture, dated as of July 19, 2013, between Ares Capital Corporation and U.S. Bank National Association, as trustee(16) |
||
4.27 |
Form of 4.375% Convertible Senior Notes due 2019(16) |
||
10.1 |
Dividend Reinvestment Plan of Ares Capital Corporation(17) |
||
10.2 |
Restated Investment Advisory and Management Agreement, dated as of June 6, 2011, between Ares Capital Corporation and Ares Capital Management LLC(18) |
||
10.3 |
Amended and Restated Administration Agreement, dated as of June 1, 2007, between Ares Capital Corporation and Ares Operations LLC(19) |
||
10.4 |
Amended and Restated Custodian Agreement, dated as of May 15, 2009, between Ares Capital Corporation and U.S. Bank National Association(20) |
||
10.5 |
Amendment No. 1, dated as of December 19, 2014, to the Amended and Restated Custodian Agreement dated as of May 15, 2009, by and among Ares Capital Corporation and U.S. Bank National Association* |
||
10.6 |
Trademark License Agreement between Ares Capital Corporation and Ares Management LLC(21) |
||
10.7 |
Form of Indemnification Agreement between Ares Capital Corporation and directors and certain officers(22) |
||
10.8 |
Form of Indemnification Agreement between Ares Capital Corporation and members of Ares Capital Management LLC investment committee(22) |
||
10.9 |
Amended and Restated Purchase and Sale Agreement, dated as of January 22, 2010, among Ares Capital Corporation, as seller, and Ares Capital CP Funding Holdings LLC, as purchaser(23) |
||
98
| Number | Description | ||
|---|---|---|---|
| 10.10 | Amendment No. 1 to Amended and Restated Purchase and Sale Agreement, dated as of June 7, 2012, among Ares Capital Corporation, as seller, and Ares Capital CP Funding Holdings LLC, as purchaser(24) | ||
10.11 |
Second Tier Purchase and Sale Agreement, dated as of January 22, 2010, among Ares Capital CP Funding Holdings LLC, as seller, and Ares Capital CP Funding LLC, as purchaser(23) |
||
10.12 |
Amendment No. 1 to Second Tier Purchase and Sale Agreement, dated as of June 7, 2012, among Ares Capital CP Funding Holdings LLC, as seller, and Ares Capital CP Funding LLC, as purchaser(24) |
||
10.13 |
Amended and Restated Sale and Servicing Agreement, dated as of January 22, 2010, among Ares Capital CP Funding LLC, as borrower, Ares Capital Corporation, as servicer, Wachovia Bank, National Association, as note purchaser, U.S. Bank National Association, as trustee and collateral custodian, and Wells Fargo Securities, LLC, as agent(23) |
||
10.14 |
Amendment No. 1 to the Amended and Restated Sale and Servicing Agreement, dated as of May 6, 2010, among Ares Capital CP Funding LLC, as borrower, Ares Capital Corporation, as servicer, Wells Fargo Bank, National Association, as successor by merger to Wachovia Bank as note purchaser, U.S. Bank, National Association, as trustee and collateral custodian, and Wells Fargo Securities LLC, as agent(25) |
||
10.15 |
Amendment No. 2 to the Amended and Restated Sale and Servicing Agreement, dated as of January 18, 2011, among Ares Capital CP Funding LLC, as borrower, Ares Capital Corporation, as servicer, Wells Fargo Bank, National Association, as successor by merger to Wachovia Bank as note purchaser, U.S. Bank National Association, as trustee and collateral custodian, and Wells Fargo Securities, LLC, as agent(26) |
||
10.16 |
Amendment No. 3 to the Amended and Restated Sale and Servicing Agreement, dated as of October 13, 2011, among Ares Capital CP Funding LLC, as borrower, Ares Capital Corporation, as servicer and as transferor, Wells Fargo Bank, National Association (as successor by merger to Wachovia Bank, National Association), as note purchaser, U.S. Bank National Association, as trustee, collateral custodian and bank and Wells Fargo Securities, LLC, as agent(27) |
||
10.17 |
Amendment No. 4 to the Amended and Restated Sale and Servicing Agreement, dated as of January 18, 2012, among Ares Capital CP Funding LLC, as borrower, Ares Capital Corporation, as servicer and transferor, Wells Fargo Bank, National Association (as successor by merger to Wachovia Bank, National Association), as note purchaser, Wells Fargo Securities, LLC, as agent, and U.S. Bank National Association, as collateral custodian, trustee and bank(28) |
||
10.18 |
Amendment No. 5 to the Amended and Restated Sale and Servicing Agreement, dated as of June 7, 2012, among Ares Capital CP Funding LLC, as borrower, Ares Capital Corporation, as servicer and transferor, Wells Fargo Bank, National Association (as successor by merger to Wachovia Bank, National Association), as note purchaser, Wells Fargo Securities, LLC, as agent, and U.S. Bank National Association, as collateral custodian, trustee and bank(24) |
||
10.19 |
Amendment No. 6 to Loan and Servicing Agreement, dated as of January 25, 2013, among Ares Capital CP Funding LLC, as borrower, Ares Capital Corporation, as servicer and transferor, Wells Fargo Securities, LLC, as agent, Wells Fargo Bank, National Association, as swingline lender, and the other lenders party thereto(29) |
||
99
| Number | Description | ||
|---|---|---|---|
| 10.20 | Omnibus Amendment, dated as of May 14, 2014, among Ares Capital CP Funding LLC, Ares Capital CP Funding Holdings LLC, Ares Capital Corporation, Wells Fargo Bank, National Association, as swingline lender and as a lender, Wells Fargo Securities, LLC, as agent, and U.S. Bank National Association, as trustee, bank and collateral custodian (amending the Loan and Servicing Agreement, dated as of January 22, 2010, the Amended and Restated Purchase and Sale Agreement, dated as of January 22, 2010, and the Second Tier Purchase and Sale Agreement, dated as of January 22, 2010)(30) | ||
10.21 |
Fourth Amended and Restated Senior Secured Revolving Credit Agreement, dated as of March 31, 2014, among Ares Capital Corporation, the lenders party thereto, and JPMorgan Chase Bank, N.A., as administrative agent(31) |
||
10.22 |
Loan and Servicing Agreement, dated as of January 20, 2012, among Ares Capital JB Funding LLC, as borrower, Ares Capital Corporation, as servicer and transferor, Sumitomo Mitsui Banking Corporation, as administrative agent, collateral agent and lender, and U.S. Bank National Association, as collateral custodian and bank(32) |
||
10.23 |
Purchase and Sale Agreement, dated as of January 20, 2012, between Ares Capital JB Funding LLC, as purchaser, and Ares Capital Corporation, as seller(32) |
||
10.24 |
Omnibus Amendment No. 1, dated as of September 14, 2012, among Ares Capital JB Funding LLC, as borrower, Ares Capital Corporation, as servicer and transferor, Sumitomo Mitsui Banking Corporation, as administrative agent, lender and collateral agent, and U.S. Bank National Association, as collateral custodian and bank (amending the Loan and Servicing Agreement, dated as of January 20, 2012, and the Purchase and Sale Agreement, dated as of January 20, 2012)(33) |
||
10.25 |
Omnibus Amendment No. 2, dated as of December 20, 2013, among Ares Capital JB Funding LLC, as borrower, Ares Capital Corporation, as servicer and transferor, Sumitomo Mitsui Banking Corporation, as administrative agent, lender and collateral agent, and U.S. Bank National Association, as collateral custodian and bank (amending the Loan and Servicing Agreement, dated as of January 20, 2012, and the Purchase and Sale Agreement, dated as of January 20, 2012)(34) |
||
10.26 |
Form of Underwriting Agreement for Equity Securities(35) |
||
10.27 |
Form of Underwriting Agreement for Debt Securities(35) |
||
11.1 |
Statement of Computation of Per Share Earnings(36) |
||
21.1 |
Subsidiaries of Ares Capital Corporation* |
||
31.1 |
Certification by President pursuant to Exchange Act Rule 13a-14(a), as adopted pursuant to Section 302 of the Sarbanes-Oxley Act of 2002* |
||
31.2 |
Certification by Chief Financial Officer pursuant to Exchange Act Rule 13a-14(a), as adopted pursuant to Section 302 of the Sarbanes-Oxley Act of 2002* |
||
32.1 |
Certification by President and Chief Financial Officer pursuant to 18 U.S.C. Section 1350, as adopted pursuant to Section 906 of the Sarbanes-Oxley Act of 2002* |
||
- *
- Filed
herewith
- (1)
- Incorporated by reference to Exhibit 3.1 to the Company's Form 10-Q (File No. 814-00663) for the quarter ended September 30, 2012, filed on November 5, 2012.
100
- (2)
- Incorporated
by reference to Exhibit 3.2 to the Company's Form 10-Q (File No. 814-00663) for the quarter ended June 30, 2010,
filed on August 5, 2010.
- (3)
- Incorporated
by reference to Exhibit (d) to the Company's pre-effective Amendment No. 2 to the Registration Statement under the Securities Act
of 1933, as amended, on Form N-2 (File No. 333-114656), filed on September 28, 2004.
- (4)
- Incorporated
by reference to Exhibit d.2 to Allied Capital's Registration Statement under the Securities Act of 1933, as amended, on
Form N-2/A (File No. 333-133755), filed on June 21, 2006.
- (5)
- Incorporated
by reference to Exhibits d.8 and d.9, as applicable, to Allied Capital's post-effective Amendment No. 3 to the Registration
Statement under the Securities Act of 1933, as amended, on Form N-2/A (File No. 333-133755), filed on March 28, 2007.
- (6)
- Incorporated
by reference to Exhibit 10.1 to the Company's Form 8-K (File No. 814-00663), filed on April 7, 2010.
- (7)
- Incorporated
by reference to Exhibits 4.1, 4.2 and 4.3, as applicable, to the Company's Form 8-K (File No. 814-00663), filed on
October 22, 2010.
- (8)
- Incorporated
by reference to Exhibits 4.1 and 4.2, as applicable, to the Company's Form 8-K (File No. 814-00663), filed on
February 2, 2012.
- (9)
- Incorporated
by reference to Exhibits 4.1 and 4.2, as applicable, to the Company's Form 8-K (File No. 814-00663), filed on
September 25, 2012.
- (10)
- Incorporated
by reference to Exhibits 4.1 and 4.2, as applicable, to the Company's Form 8-K (File No. 814-00663), filed on
November 19, 2013.
- (11)
- Incorporated
by reference to Exhibits 4.1 and 4.2, as applicable, to the Registrant's Form 8-K (File No. 814-00663), filed on
November 21, 2014.
- (12)
- Incorporated
by reference to Exhibits 4.1 and 4.2, as applicable, to the Company's Form 8-K (File No. 814-00663), filed on
January 28, 2011.
- (13)
- Incorporated
by reference to Exhibits 4.1 and 4.2, as applicable, to the Company's Form 8-K (File No. 814-00663), filed on
March 28, 2011.
- (14)
- Incorporated
by reference to Exhibits 4.1 and 4.2, as applicable, to the Company's Form 8-K (File No. 814-00663), filed on
March 14, 2012.
- (15)
- Incorporated
by reference to Exhibits 4.1 and 4.2, as applicable, to the Company's Form 8-K (File No. 814-00663), filed on
October 10, 2012.
- (16)
- Incorporated
by reference to Exhibits 4.1 and 4.2, as applicable, to the Company's Form 8-K (File No. 814-00663), filed on
July 19, 2013.
- (17)
- Incorporated
by reference to Exhibit 10.1 to the Company's Form 8-K (File No. 814-00663), filed on February 27, 2012.
- (18)
- Incorporated
by reference to Exhibit 10.1 to the Company's Form 8-K (File No. 814-00663), filed on June 8, 2011.
- (19)
- Incorporated
by reference to Exhibit (j) to the Company's pre-effective Amendment No. 1 to the Registration Statement under the Securities
Act of 1933, as amended, on Form N-2 (File No. 333-158211), filed on May 28, 2009.
- (20)
- Incorporated by reference to Exhibit 10.1 to the Company's Form 10-Q (File No. 814-00663) for the quarter ended June 30, 2007, filed on August 9, 2007.
101
- (21)
- Incorporated
by reference to Exhibit (j) to the Company's pre-effective Amendment No. 1 to the Registration Statement under the Securities
Act of 1933, as amended, on Form N-2 (File No. 333-158211), filed on May 28, 2009.
- (22)
- Incorporated
by reference to Exhibits (k)(3) and (k)(4), as applicable, to the Company's Registration Statement under the Securities Act of 1933, as
amended, on Form N-2 (File No. 333-188175), filed on April 26, 2013.
- (23)
- Incorporated
by reference to Exhibits 10.2 through 10.4, as applicable, to the Company's Form 8-K (File No. 814-00663), filed on
January 25, 2010.
- (24)
- Incorporated
by reference to Exhibits 10.1 through 10.3, as applicable, to the Company's Form 8-K (File No. 814-0663), filed on
June 8, 2012.
- (25)
- Incorporated
by reference to Exhibit 10.5 to the Company's Form 10-Q (File No. 814-00663) for the quarter ended March 30, 2010,
filed on May 10, 2010.
- (26)
- Incorporated
by reference to Exhibit 10.1 to the Company's Form 8-K (File No. 814-00663), filed on January 19, 2011.
- (27)
- Incorporated
by reference to Exhibit 10.1 to the Company's Form 8-K (File No. 814-00663), filed on October 14, 2011.
- (28)
- Incorporated
by reference to Exhibit 10.1 to the Company's Form 8-K (File No. 814-00663), filed on January 19, 2012.
- (29)
- Incorporated
by reference to Exhibit 10.1 to the Company's Form 8-K (File No. 814-00663), filed on January 28, 2013.
- (30)
- Incorporated
by reference to Exhibit 10.1 to the Registrant's Form 8-K (File No. 814-00663), filed on May 15, 2014.
- (31)
- Incorporated
by reference to Exhibit 10.1 to the Registrant's Form 8-K (File No. 814-00663), filed on April 1, 2014.
- (32)
- Incorporated
by reference to Exhibit 10.1 and 10.2, as applicable, to the Company's Form 8-K (File No. 814-00663), filed on
January 24, 2012.
- (33)
- Incorporated
by reference to Exhibit 10.1 to the Company's Form 8-K (File No. 814-00663), filed on September 17, 2012.
- (34)
- Incorporated
by reference to Exhibit 10.1 to the Company's Form 8-K (File No. 814-00663), filed on December 23, 2013.
- (35)
- Incorporated
by reference to Exhibits (h)(1) and (h)(2), as applicable, to the Company's Registration Statement under the Securities Act of 1933, as
amended, on Form N-2 (File No. 333-181563), filed on May 21, 2012.
- (36)
- Included in Note 10 to the Company's Notes to Consolidated Financial Statements filed herewith.
102
INDEX TO CONSOLIDATED FINANCIAL STATEMENTS
F-1
Report of Independent Registered Public Accounting Firm
The
Board of Directors and Stockholders
Ares Capital Corporation:
We have audited the accompanying consolidated balance sheet of Ares Capital Corporation (and subsidiaries) (the Company) as of December 31, 2014 and 2013, including the consolidated schedules of investments as of December 31, 2014 and 2013, and the related consolidated statements of operations, stockholders' equity, and cash flows, and the financial highlights (included in note 14), for each of the years in the three-year period ended December 31, 2014. These consolidated financial statements are the responsibility of the Company's management. Our responsibility is to express an opinion on these consolidated financial statements based on our audits.
We conducted our audits in accordance with the standards of the Public Company Accounting Oversight Board (United States). Those standards require that we plan and perform the audit to obtain reasonable assurance about whether the financial statements are free of material misstatement. An audit includes examining, on a test basis, evidence supporting the amounts and disclosures in the financial statements. Our procedures included confirmation of securities owned as of December 31, 2014 and 2013, by correspondence with custodians, or by other appropriate auditing procedures. An audit also includes assessing the accounting principles used and significant estimates made by management, as well as evaluating the overall financial statement presentation. We believe that our audits provide a reasonable basis for our opinion.
In our opinion, the consolidated financial statements referred to above present fairly, in all material respects, the financial position of Ares Capital Corporation (and subsidiaries) as of December 31, 2014 and 2013, and the results of their operations and their cash flows for each of the years in the three-year period ended December 31, 2014, in conformity with U.S. generally accepted accounting principles.
We also have audited, in accordance with the standards of the Public Company Accounting Oversight Board (United States), Ares Capital Corporation's internal control over financial reporting as of December 31, 2014, based on criteria established in Internal Control—Integrated Framework (2013) issued by the Committee of Sponsoring Organizations of Treadway Commission (COSO), and our report dated February 26, 2015 expressed an unqualified opinion on the effectiveness of Ares Capital Corporation's internal control over financial reporting.
As explained in note 8 to the consolidated financial statements, the accompanying consolidated financial statements include investments valued at $9.0 billion (171% of net assets), whose fair values have been estimated by the Board of Directors and management in the absence of readily determinable fair values. Such estimates are based on financial and other information provided by management of its portfolio companies, pertinent market and industry data, as well as input from independent valuation firms. These investments are valued in accordance with FASB ASC 820, Fair Value Measurements, which requires the Company to assume that the portfolio investments are sold in a principal market to market participants. The Company has considered its principal market as the market in which the Company exits its portfolio investments with the greatest volume and level of activity. ASC 820 specifies a hierarchy of valuation techniques based on whether the inputs to these valuation techniques are observable or unobservable. $9.0 billion of investments at December 31, 2014 are valued based on unobservable inputs. Because such valuations, and particularly valuations of private investments and private companies, are inherently uncertain, they may fluctuate significantly over short periods of time. These determinations of fair value could differ materially from the values that would have been utilized had a ready market for these investments existed.
![]()
Los
Angeles, California
February 26, 2015
F-2
Report of Independent Registered Public Accounting Firm
The
Board of Directors and Stockholders
Ares Capital Corporation:
We have audited Ares Capital Corporation's (the Company) internal control over financial reporting as of December 31, 2014, based on criteria established in Internal Control—Integrated Framework (2013) issued by the Committee of Sponsoring Organizations of the Treadway Commission (COSO). Ares Capital Corporation's management is responsible for maintaining effective internal control over financial reporting and for its assessment of the effectiveness of internal control over financial reporting, included in the accompanying Management's Report on Internal Control Over Financial Reporting. Our responsibility is to express an opinion on the Company's internal control over financial reporting based on our audit.
We conducted our audit in accordance with the standards of the Public Company Accounting Oversight Board (United States). Those standards require that we plan and perform the audit to obtain reasonable assurance about whether effective internal control over financial reporting was maintained in all material respects. Our audit included obtaining an understanding of internal control over financial reporting, assessing the risk that a material weakness exists, and testing and evaluating the design and operating effectiveness of internal control based on the assessed risk. Our audit also included performing such other procedures as we considered necessary in the circumstances. We believe that our audit provides a reasonable basis for our opinion.
A company's internal control over financial reporting is a process designed to provide reasonable assurance regarding the reliability of financial reporting and the preparation of financial statements for external purposes in accordance with generally accepted accounting principles. A company's internal control over financial reporting includes those policies and procedures that (1) pertain to the maintenance of records that, in reasonable detail, accurately and fairly reflect the transactions and dispositions of the assets of the company; (2) provide reasonable assurance that transactions are recorded as necessary to permit preparation of financial statements in accordance with generally accepted accounting principles, and that receipts and expenditures of the company are being made only in accordance with authorizations of management and directors of the company; and (3) provide reasonable assurance regarding prevention or timely detection of unauthorized acquisition, use, or disposition of the company's assets that could have a material effect on the financial statements.
Because of its inherent limitations, internal control over financial reporting may not prevent or detect misstatements. Also, projections of any evaluation of effectiveness to future periods are subject to the risk that controls may become inadequate because of changes in conditions, or that the degree of compliance with the policies or procedures may deteriorate.
In our opinion, Ares Capital Corporation maintained, in all material respects, effective internal control over financial reporting as of December 31, 2014, based on criteria established in Internal Control—Integrated Framework (2013) issued by the Committee of Sponsoring Organizations of the Treadway Commission.
We also have audited, in accordance with the standards of the Public Company Accounting Oversight Board (United States), the consolidated balance sheets of Ares Capital Corporation (and subsidiaries) as of December 31, 2014 and 2013, including the consolidated schedules of investments as of December 31, 2014 and 2013, and the related consolidated statements of operations, stockholders' equity, and cash flows, and the financial highlights (included in note 14), for each of the years in the three-year period ended December 31, 2014, and our report dated February 26, 2015 expressed an unqualified opinion on those consolidated financial statements.
![]()
Los
Angeles, California
February 26, 2015
F-3
ARES CAPITAL CORPORATION AND SUBSIDIARIES
CONSOLIDATED BALANCE SHEET
(in thousands, except per share data)
| |
As of December 31, | ||||||
|---|---|---|---|---|---|---|---|
| |
2014 | 2013 | |||||
ASSETS |
|||||||
Investments at fair value |
|||||||
Non-controlled/non-affiliate company investments |
$ | 6,270,075 | $ | 5,136,612 | |||
Non-controlled affiliate company investments |
228,716 | 260,484 | |||||
Controlled affiliate company investments |
2,529,588 | 2,235,801 | |||||
| | | | | | | | |
Total investments at fair value (amortized cost of $8,875,095 and $7,537,403, respectively) |
9,028,379 | 7,632,897 | |||||
Cash and cash equivalents |
194,555 | 149,629 | |||||
Interest receivable |
160,981 | 123,981 | |||||
Receivable for open trades |
859 | 128,566 | |||||
Other assets |
112,999 | 106,431 | |||||
| | | | | | | | |
Total assets |
$ | 9,497,773 | $ | 8,141,504 | |||
| | | | | | | | |
| | | | | | | | |
| | | | | | | | |
LIABILITIES |
|||||||
Debt |
$ | 3,924,482 | $ | 2,986,275 | |||
Base management fees payable |
34,497 | 29,270 | |||||
Income based fees payable |
33,070 | 29,001 | |||||
Capital gains incentive fees payable |
92,979 | 80,937 | |||||
Accounts payable and other liabilities |
81,892 | 68,649 | |||||
Interest and facility fees payable |
46,974 | 42,828 | |||||
Payable for open trades |
164 | 100 | |||||
| | | | | | | | |
Total liabilities |
4,214,058 | 3,237,060 | |||||
Commitments and contingencies (Note 7) |
|||||||
STOCKHOLDERS' EQUITY |
|||||||
Common stock, par value $0.001 per share, 500,000 common shares authorized; 314,108 and 297,971 common shares issued and outstanding, respectively |
314 | 298 | |||||
Capital in excess of par value |
5,328,057 | 4,982,477 | |||||
Accumulated overdistributed net investment income |
(32,846 | ) | (8,785 | ) | |||
Accumulated net realized loss on investments, foreign currency transactions, extinguishment of debt and other assets |
(166,668 | ) | (165,040 | ) | |||
Net unrealized gains on investments and foreign currency transactions |
154,858 | 95,494 | |||||
| | | | | | | | |
Total stockholders' equity |
5,283,715 | 4,904,444 | |||||
| | | | | | | | |
Total liabilities and stockholders' equity |
$ | 9,497,773 | $ | 8,141,504 | |||
| | | | | | | | |
| | | | | | | | |
| | | | | | | | |
NET ASSETS PER SHARE |
$ | 16.82 | $ | 16.46 | |||
| | | | | | | | |
| | | | | | | | |
| | | | | | | | |
See accompanying notes to consolidated financial statements.
F-4
ARES CAPITAL CORPORATION AND SUBSIDIARIES
CONSOLIDATED STATEMENT OF OPERATIONS
(in thousands, except per share data)
| |
For the Years Ended December 31, |
|||||||||
|---|---|---|---|---|---|---|---|---|---|---|
| |
2014 | 2013 | 2012 | |||||||
INVESTMENT INCOME: |
||||||||||
From non-controlled/non-affiliate company investments: |
||||||||||
Interest income from investments |
$ | 439,405 | $ | 388,034 | $ | 328,342 | ||||
Capital structuring service fees |
72,170 | 48,167 | 58,106 | |||||||
Dividend income |
28,017 | 17,969 | 17,219 | |||||||
Management and other fees |
— | 949 | 1,342 | |||||||
Other income |
17,488 | 17,054 | 13,170 | |||||||
| | | | | | | | | | | |
Total investment income from non-controlled/non-affiliate company investments |
557,080 | 472,173 | 418,179 | |||||||
From non-controlled affiliate company investments: |
||||||||||
Interest income from investments |
11,814 | 19,531 | 21,767 | |||||||
Capital structuring service fees |
1,940 | 395 | 3,682 | |||||||
Dividend income |
5,608 | 7,994 | 1,324 | |||||||
Other income |
843 | 213 | 529 | |||||||
| | | | | | | | | | | |
Total investment income from non-controlled affiliate company investments |
20,205 | 28,133 | 27,502 | |||||||
From controlled affiliate company investments: |
||||||||||
Interest income from investments |
290,219 | 240,368 | 221,363 | |||||||
Capital structuring service fees |
39,452 | 43,119 | 40,348 | |||||||
Dividend income |
50,671 | 73,681 | 21,195 | |||||||
Management and other fees |
24,596 | 19,254 | 17,382 | |||||||
Other income |
6,736 | 4,993 | 2,056 | |||||||
| | | | | | | | | | | |
Total investment income from controlled affiliate company investments |
411,674 | 381,415 | 302,344 | |||||||
| | | | | | | | | | | |
Total investment income |
988,959 | 881,721 | 748,025 | |||||||
| | | | | | | | | | | |
EXPENSES: |
||||||||||
Interest and credit facility fees |
216,019 | 171,495 | 142,976 | |||||||
Base management fees |
127,997 | 104,857 | 86,228 | |||||||
Income based fees |
118,273 | 110,511 | 95,182 | |||||||
Capital gain incentive fees |
29,467 | 11,640 | 31,863 | |||||||
Administrative fees |
13,689 | 12,317 | 9,322 | |||||||
Other general and administrative |
27,383 | 26,390 | 22,421 | |||||||
| | | | | | | | | | | |
Total expenses |
532,828 | 437,210 | 387,992 | |||||||
| | | | | | | | | | | |
NET INVESTMENT INCOME BEFORE INCOME TAXES |
456,131 | 444,511 | 360,033 | |||||||
Income tax expense, including excise tax |
18,329 | 14,105 | 11,172 | |||||||
| | | | | | | | | | | |
NET INVESTMENT INCOME |
437,802 | 430,406 | 348,861 | |||||||
REALIZED AND UNREALIZED GAINS (LOSSES) ON INVESTMENTS AND FOREIGN CURRENCY TRANSACTIONS: |
||||||||||
Net realized gains (losses): |
||||||||||
Non-controlled/non-affiliate company investments |
59,053 | 49,763 | 61,857 | |||||||
Non-controlled affiliate company investments |
76,442 | (1,245 | ) | (36,766 | ) | |||||
Controlled affiliate company investments |
(43,807 | ) | 15,207 | 21,643 | ||||||
Foreign currency transactions |
2,167 | — | — | |||||||
| | | | | | | | | | | |
Net realized gains |
93,855 | 63,725 | 46,734 | |||||||
Net unrealized gains (losses): |
||||||||||
Non-controlled/non-affiliate company investments |
(29,770 | ) | 22,115 | 54,522 | ||||||
Non-controlled affiliate company investments |
18,080 | (1,123 | ) | 49,383 | ||||||
Controlled affiliate company investments |
69,476 | (26,602 | ) | 11,356 | ||||||
Foreign currency transactions |
1,578 | — | — | |||||||
| | | | | | | | | | | |
Net unrealized gains (losses) |
59,364 | (5,610 | ) | 115,261 | ||||||
| | | | | | | | | | | |
Net realized and unrealized gains from investments and foreign currency transactions |
153,219 | 58,115 | 161,995 | |||||||
REALIZED LOSSES ON EXTINGUISHMENT OF DEBT |
(72 | ) | — | (2,678 | ) | |||||
| | | | | | | | | | | |
NET INCREASE IN STOCKHOLDERS' EQUITY RESULTING FROM OPERATIONS |
$ | 590,949 | $ | 488,521 | $ | 508,178 | ||||
| | | | | | | | | | | |
| | | | | | | | | | | |
| | | | | | | | | | | |
BASIC AND DILUTED EARNINGS PER COMMON SHARE (see Note 10) |
$ | 1.94 | $ | 1.83 | $ | 2.21 | ||||
| | | | | | | | | | | |
| | | | | | | | | | | |
| | | | | | | | | | | |
WEIGHTED AVERAGE SHARES OF COMMON STOCK OUTSTANDING (see Note 10) |
305,287 | 266,939 | 230,151 | |||||||
| | | | | | | | | | | |
| | | | | | | | | | | |
| | | | | | | | | | | |
See accompanying notes to consolidated financial statements.
F-5
ARES CAPITAL CORPORATION AND SUBSIDIARIES
CONSOLIDATED SCHEDULE OF INVESTMENTS
As of December 31, 2014
(dollar amounts in thousands)
Company(1)
|
Business Description | Investment | Interest(5)(11) | Acquisition Date |
Amortized Cost |
Fair Value |
Percentage of Net Assets |
||||||||||||
|---|---|---|---|---|---|---|---|---|---|---|---|---|---|---|---|---|---|---|---|
| Investment Funds and Vehicles | |||||||||||||||||||
| CIC Flex, LP(9) | Investment partnership | Limited partnership units (0.94 units) | 9/7/2007 | $ | — | $ | 248 | (2) | |||||||||||
| Covestia Capital Partners, LP(9) | Investment partnership | Limited partnership interest (47.00% interest) | 6/17/2008 | 487 | 2,100 | (2) | |||||||||||||
| HCI Equity, LLC(7)(8)(9) | Investment company | Member interest (100.00% interest) | 4/1/2010 | — | 397 | ||||||||||||||
| Imperial Capital Private Opportunities, LP(9) | Investment partnership | Limited partnership interest (80.00% interest) | 5/10/2007 | 4,654 | 19,005 | (2) | |||||||||||||
| Partnership Capital Growth Fund I, L.P.(9) | Investment partnership | Limited partnership interest (25.00% interest) | 6/16/2006 | — | 1,526 | (2) | |||||||||||||
| Partnership Capital Growth Investors III, L.P.(9) | Investment partnership | Limited partnership interest (2.50% interest) | 10/5/2011 | 3,030 | 2,735 | (2) | |||||||||||||
| PCG-Ares Sidecar Investment, L.P.(9) | Investment partnership | Limited partnership interest (100.00% interest) | 5/22/2014 | 2,073 | 1,866 | (2) | |||||||||||||
| PCG-Ares Sidecar Investment II, L.P.(9) | Investment partnership | Limited partnership interest (100.00% interest) | 10/31/2014 | 6,500 | 6,500 | (2) | |||||||||||||
| Piper Jaffray Merchant Banking Fund I, L.P.(9) | Investment partnership | Limited partnership interest (2.00% interest) | 8/16/2012 | 1,074 | 955 | (2) | |||||||||||||
| Senior Secured Loan Fund LLC(7)(10) | Co-investment vehicle | Subordinated certificates ($2,034,498 par due 12/2024) | 8.26% (Libor + 8.00%/M)(26) | 10/30/2009 | 2,034,498 | 2,065,015 | |||||||||||||
| Membership interest (87.50% interest) | 10/30/2009 | — | — | ||||||||||||||||
| | | | | | | | | | | | | | | | | | | | |
| 2,034,498 | 2,065,015 | ||||||||||||||||||
| VSC Investors LLC(9) | Investment company | Membership interest (1.95% interest) | 1/24/2008 | 879 | 1,481 | (2) | |||||||||||||
| | | | | | | | | | | | | | | | | | | | |
| 2,053,195 | 2,101,828 | 39.78 | % | ||||||||||||||||
| | | | | | | | | | | | | | | | | | | | |
| Healthcare-Services | |||||||||||||||||||
| Alegeus Technologies Holdings Corp. | Benefits administration and transaction processing provider | Preferred stock (2,997 shares) | 12/13/2013 | 3,087 | 1,876 | ||||||||||||||
| Common stock (3 shares) | 12/13/2013 | 3 | — | ||||||||||||||||
| | | | | | | | | | | | | | | | | | | | |
| 3,090 | 1,876 | ||||||||||||||||||
| American Academy Holdings, LLC | Provider of education, training, certification, networking, and consulting services to medical coders and other healthcare professionals | First lien senior secured loan ($14,088 par due 6/2019) | 4.00% (Libor + 3.00%/Q) | 6/27/2014 | 14,088 | 14,088 | (2)(25) | ||||||||||||
| First lien senior secured loan ($23,425 par due 6/2019) | 7.00% (Libor + 6.00%/Q) | 6/27/2014 | 23,425 | 23,425 | (2)(13)(25) | ||||||||||||||
| First lien senior secured loan ($52,039 par due 6/2019) | 7.00% (Libor + 6.00%/Q) | 6/27/2014 | 52,039 | 52,039 | (3)(13)(25) | ||||||||||||||
| First lien senior secured loan ($4,126 par due 6/2019) | 4.00% (Libor + 3.00%/Q) | 6/27/2014 | 4,126 | 4,126 | (4)(25) | ||||||||||||||
| | | | | | | | | | | | | | | | | | | | |
| 93,678 | 93,678 | ||||||||||||||||||
| Athletico Management, LLC and Accelerated Holdings, LLC | Provider of outpatient rehabilitation services | First lien senior secured loan ($4,000 par due 12/2020) | 6.25% (Libor + 5.50%/Q) | 12/2/2014 | 3,968 | 4,000 | (2)(25) | ||||||||||||
F-6
Company(1)
|
Business Description | Investment | Interest(5)(11) | Acquisition Date |
Amortized Cost |
Fair Value |
Percentage of Net Assets |
||||||||||||
|---|---|---|---|---|---|---|---|---|---|---|---|---|---|---|---|---|---|---|---|
| AwarePoint Corporation | Healthcare technology platform developer | First lien senior secured loan ($10,000 par due 6/2018) | 9.50% | 9/5/2014 | 9,907 | 9,900 | (2) | ||||||||||||
| Warrant to purchase up to 3,213,367 shares of Series 1 preferred stock | 11/14/2014 | — | — | (2) | |||||||||||||||
| | | | | | | | | | | | | | | | | | | | |
| 9,907 | 9,900 | ||||||||||||||||||
| AxelaCare Holdings, Inc. and AxelaCare Investment Holdings, L.P. | Provider of home infusion services | Preferred units (8,218,160 units) | 4/12/2013 | 822 | 693 | (2) | |||||||||||||
| Common units (83,010 units) | 4/12/2013 | 8 | 7 | (2) | |||||||||||||||
| | | | | | | | | | | | | | | | | | | | |
| 830 | 700 | ||||||||||||||||||
| California Forensic Medical Group, Incorporated | Correctional facility healthcare operator | First lien senior secured loan ($48,630 par due 11/2018) | 9.25% (Libor + 8.00%/Q) | 11/16/2012 | 48,630 | 48,630 | (3)(25) | ||||||||||||
| CCS Intermediate Holdings, LLC and CCS Group Holdings, LLC | Correctional facility healthcare operator | First lien senior secured revolving loan ($1,275 par due 7/2019) | 5.00% (Libor + 4.00%/Q) | 7/23/2014 | 1,275 | 1,249 | (2)(25) | ||||||||||||
| First lien senior secured loan ($6,719 par due 7/2021) | 5.00% (Libor + 4.00%/Q) | 7/23/2014 | 6,688 | 6,584 | (2)(25) | ||||||||||||||
| Second lien senior secured loan ($135,000 par due 7/2022) | 9.38% (Libor + 8.38%/Q) | 7/23/2014 | 133,721 | 133,650 | (2)(25) | ||||||||||||||
| Class A units (601,937 units) | 8/19/2010 | — | 1,802 | (2) | |||||||||||||||
| | | | | | | | | | | | | | | | | | | | |
| 141,684 | 143,285 | ||||||||||||||||||
| DNAnexus, Inc. | Bioinformatics company | First lien senior secured loan ($5,000 par due 10/2017) | 9.25% | 3/21/2014 | 4,802 | 5,000 | (2) | ||||||||||||
| First lien senior secured loan ($5,000 par due 2/2018) | 9.25% | 3/21/2014 | 4,787 | 5,000 | (2) | ||||||||||||||
| Warrants to purchase up to 909,092 units of Series C preferred stock | 3/21/2014 | — | — | (2) | |||||||||||||||
| | | | | | | | | | | | | | | | | | | | |
| 9,589 | 10,000 | ||||||||||||||||||
| Genocea Biosciences, Inc. | Vaccine discovery technology company | Common stock (31,500 shares) | 2/10/2014 | — | 220 | (2) | |||||||||||||
| GI Advo Opco, LLC | Behavioral treatment services provider | First lien senior secured loan ($13,890 par due 6/2017) | 6.00% (Libor + 4.75%/Q) | 12/13/2013 | 14,182 | 13,890 | (2)(25) | ||||||||||||
| First lien senior secured loan ($69 par due 6/2017) | 7.00% (Base Rate + 3.75%/Q) | 12/13/2013 | 70 | 69 | (2)(25) | ||||||||||||||
| | | | | | | | | | | | | | | | | | | | |
| 14,252 | 13,959 | ||||||||||||||||||
| Global Healthcare Exchange, LLC and GHX Ultimate Parent Corp. | On-demand supply chain automation solutions provider | First lien senior secured loan ($231,250 par due 3/2020) | 8.50% (Libor + 7.50%/Q) | 3/11/2014 | 229,626 | 231,250 | (2)(25) | ||||||||||||
| Class A common stock (2,475 shares) | 3/11/2014 | 2,991 | 2,991 | (2) | |||||||||||||||
| Class B common stock (938 shares) | 3/11/2014 | 30 | 2,417 | (2) | |||||||||||||||
| | | | | | | | | | | | | | | | | | | | |
| 232,647 | 236,658 | ||||||||||||||||||
| Greenphire, Inc. and RMCF III CIV XXIX, L.P | Software provider for clinical trial management | First lien senior secured loan ($4,000 par due 12/2018) | 9.00% (Libor + 8.00%/Q) | 12/19/2014 | 4,000 | 4,000 | (2)(25) | ||||||||||||
| Limited partnership interest (99.90% interest) | 12/19/2014 | 999 | 999 | (2) | |||||||||||||||
| | | | | | | | | | | | | | | | | | | | |
| 4,999 | 4,999 | ||||||||||||||||||
| INC Research Mezzanine Co-Invest, LLC | Pharmaceutical and biotechnology consulting services | Common units (1,410,000 units) | 9/27/2010 | 1,512 | 4,287 | (2) | |||||||||||||
| Intermedix Corporation | Revenue cycle management provider to the emergency healthcare industry | Second lien senior secured loan ($112,000 par due 6/2020) | 9.25% (Libor + 8.25%/Q) | 12/27/2012 | 112,000 | 110,880 | (2)(25) | ||||||||||||
| LM Acquisition Holdings, LLC(8) | Developer and manufacturer of medical equipment | Class A units (426 units) | 9/27/2013 | 1,000 | 1,721 | (2) | |||||||||||||
F-7
Company(1)
|
Business Description | Investment | Interest(5)(11) | Acquisition Date |
Amortized Cost |
Fair Value |
Percentage of Net Assets |
||||||||||||
|---|---|---|---|---|---|---|---|---|---|---|---|---|---|---|---|---|---|---|---|
| MC Acquisition Holdings I, LLC | Healthcare professional provider | Class A units (1,338,314 units) | 1/17/2014 | 1,338 | 1,863 | (2) | |||||||||||||
Monte Nido Holdings, LLC |
Outpatient eating disorder treatment provider |
First lien senior secured loan ($44,750 par due 12/2019) |
8.00% (Libor + 7.00%/M) |
12/20/2013 |
44,750 |
42,065 |
(3)(19)(25) |
||||||||||||
MW Dental Holding Corp. |
Dental services provider |
First lien senior secured loan ($6,485 par due 4/2017) |
8.50% (Libor + 7.00%/M) |
4/12/2011 |
6,485 |
6,485 |
(2)(25) |
||||||||||||
| First lien senior secured loan ($24,484 par due 4/2017) | 8.50% (Libor + 7.00%/M) | 4/12/2011 | 24,484 | 24,484 | (2)(25) | ||||||||||||||
| First lien senior secured loan ($48,238 par due 4/2017) | 8.50% (Libor + 7.00%/M) | 4/12/2011 | 48,238 | 48,238 | (3)(25) | ||||||||||||||
| First lien senior secured loan ($19,949 par due 4/2017) | 8.50% (Libor + 7.00%/M) | 4/12/2011 | 19,949 | 19,949 | (4)(25) | ||||||||||||||
| | | | | | | | | | | | | | | | | | | | |
| 99,156 | 99,156 | ||||||||||||||||||
My Health Direct, Inc. |
Healthcare scheduling exchange software solution provider |
First lien senior secured loan ($3,000 par due 1/2018) |
10.75% |
9/18/2014 |
2,907 |
3,000 |
(2) |
||||||||||||
| Warrant to purchase up to 4,548 shares of Series D preferred stock | 9/18/2014 | 39 | 39 | (2) | |||||||||||||||
| | | | | | | | | | | | | | | | | | | | |
| 2,946 | 3,039 | ||||||||||||||||||
| Napa Management Services Corporation | Anesthesia management services provider | First lien senior secured loan ($13,000 par due 2/2019) | 6.00% (Libor + 5.00%/Q) | 4/15/2011 | 13,000 | 13,000 | (2)(25) | ||||||||||||
| First lien senior secured loan ($80,234 par due 2/2019) | 6.00% (Libor + 5.00%/Q) | 4/15/2011 | 80,234 | 80,234 | (2)(21)(25) | ||||||||||||||
| First lien senior secured loan ($33,266 par due 2/2019) | 6.00% (Libor + 5.00%/Q) | 4/15/2011 | 33,215 | 33,266 | (3)(21)(25) | ||||||||||||||
| Common units (5,345 units) | 4/15/2011 | 5,764 | 11,760 | (2) | |||||||||||||||
| | | | | | | | | | | | | | | | | | | | |
| 132,213 | 138,260 | ||||||||||||||||||
Netsmart Technologies, Inc. and NS Holdings, Inc. |
Healthcare technology provider |
First lien senior secured loan ($2,760 par due 12/2017) |
8.75% (Libor + 7.50%/Q) |
12/18/2012 |
2,760 |
2,760 |
(2)(17)(25) |
||||||||||||
| First lien senior secured loan ($34,912 par due 12/2017) | 8.75% (Libor + 7.50%/Q) | 12/18/2012 | 34,912 | 34,912 | (2)(17)(25) | ||||||||||||||
| Common stock (2,500,000 shares) | 6/21/2010 | 2,500 | 5,426 | (2) | |||||||||||||||
| | | | | | | | | | | | | | | | | | | | |
| 40,172 | 43,098 | ||||||||||||||||||
| New Trident Holdcorp, Inc. | Outsourced mobile diagnostic healthcare service provider | Second lien senior secured loan ($80,000 par due 7/2020) | 10.25% (Libor + 9.00%/Q) | 8/6/2013 | 78,667 | 78,400 | (2)(25) | ||||||||||||
Nodality, Inc. |
Biotechnology company |
First lien senior secured loan ($8,000 par due 2/2018) |
8.90% |
4/25/2014 |
7,768 |
8,000 |
(2) |
||||||||||||
| First lien senior secured loan ($3,000 par due 8/2018) | 8.90% | 4/25/2014 | 2,900 | 3,000 | (2) | ||||||||||||||
| Warrant to purchase up to 164,179 shares of Series B preferred stock | 4/25/2014 | — | 41 | (2) | |||||||||||||||
| | | | | | | | | | | | | | | | | | | | |
| 10,668 | 11,041 | ||||||||||||||||||
| OmniSYS Acquisition Corporation, OmniSYS, LLC, and OSYS Holdings, LLC | Provider of technology-enabled solutions to pharmacies | First lien senior secured loan ($20,475 par due 11/2018) | 8.50% (Libor + 7.50%/Q) | 11/21/2013 | 20,475 | 20,475 | (2)(25) | ||||||||||||
| Limited liability company membership interest (1.57%) | 11/21/2013 | 1,000 | 1,258 | (2) | |||||||||||||||
| | | | | | | | | | | | | | | | | | | | |
| 21,475 | 21,733 | ||||||||||||||||||
PerfectServe, Inc. |
Communications software platform provider for hospitals and physician practices |
First lien senior secured revolving loan ($500 par due 6/2015) |
7.50% |
12/26/2013 |
500 |
500 |
(2) |
||||||||||||
| First lien senior secured loan ($2,500 par due 10/2017) | 10.00% | 12/26/2013 | 2,479 | 2,500 | (2) | ||||||||||||||
| First lien senior secured loan ($3,372 par due 4/2017) | 10.00% | 12/26/2013 | 3,348 | 3,372 | (2) | ||||||||||||||
| Warrants to purchase up to 34,113 units of Series C preferred stock | 12/26/2013 | — | 84 | (2) | |||||||||||||||
| | | | | | | | | | | | | | | | | | | | |
| 6,327 | 6,456 | ||||||||||||||||||
F-8
Company(1)
|
Business Description | Investment | Interest(5)(11) | Acquisition Date |
Amortized Cost |
Fair Value |
Percentage of Net Assets |
||||||||||||
|---|---|---|---|---|---|---|---|---|---|---|---|---|---|---|---|---|---|---|---|
| PGA Holdings, Inc. | Provider of patient surveys, management reports and national databases for the integrated healthcare delivery system | Preferred stock (333 shares) | 3/12/2008 | 125 | 21 | (2) | |||||||||||||
| Common stock (16,667 shares) | 3/12/2008 | 167 | 1,051 | (2) | |||||||||||||||
| | | | | | | | | | | | | | | | | | | | |
| 292 | 1,072 | ||||||||||||||||||
PhyMED Management LLC |
Provider of anesthesia services |
First lien senior secured loan ($10,000 par due 11/2020) |
5.25% (Libor + 4.25%/M) |
11/18/2014 |
9,927 |
10,000 |
(2)(25) |
||||||||||||
Physiotherapy Associates Holdings, Inc. |
Physical therapy provider |
Class A common stock (100,000 shares) |
12/13/2013 |
3,090 |
2,465 |
||||||||||||||
POS I Corp. (fka Vantage Oncology, Inc.) |
Radiation oncology care provider |
Common stock (62,157 shares) |
2/3/2011 |
4,670 |
1,222 |
(2) |
|||||||||||||
| Reed Group Holdings, LLC | Medical disability management services provider | Equity interests | 4/1/2010 | — | — | (2) | |||||||||||||
Respicardia, Inc. |
Developer of implantable therapies to improve cardiovascular health |
First lien senior secured loan ($1,400 par due 7/2015) |
11.00% |
6/28/2012 |
1,399 |
1,400 |
(2) |
||||||||||||
| Warrants to purchase up to 99,094 shares of Series C preferred stock | 6/28/2012 | 38 | 28 | (2) | |||||||||||||||
| | | | | | | | | | | | | | | | | | | | |
| 1,437 | 1,428 | ||||||||||||||||||
| Sage Products Holdings III, LLC | Patient infection control and preventive care solutions provider | Second lien senior secured loan ($120,000 par due 6/2020) | 9.25% (Libor + 8.00%/Q) | 12/13/2012 | 119,775 | 120,000 | (2)(25) | ||||||||||||
Sarnova HC, LLC, Tri-Anim Health Services, Inc., and BEMS Holdings, LLC |
Distributor of emergency medical service and respiratory products |
Second lien senior secured loan ($60,000 par due 9/2018) |
8.75% (Libor + 8.00%/M) |
6/30/2014 |
60,000 |
60,000 |
(2)(25) |
||||||||||||
| SurgiQuest, Inc. | Medical device company | Warrants to purchase up to 54,672 shares of Series D-4 convertible preferred stock | 9/28/2012 | — | — | (2) | |||||||||||||
U.S. Anesthesia Partners, Inc. |
Anesthesiology service provider |
First lien senior secured loan ($49,725 par due 12/2019) |
6.00% (Libor + 5.00%/Q) |
6/26/2014 |
49,725 |
49,725 |
(2)(25) |
||||||||||||
| Second lien senior secured loan ($50,000 par due 9/2020) | 9.00% (Libor + 8.00%/Q) | 9/24/2014 | 50,000 | 50,000 | (2)(25) | ||||||||||||||
| | | | | | | | | | | | | | | | | | | | |
| 99,725 | 99,725 | ||||||||||||||||||
| Young Innovations, Inc. | Dental supplies and equipment manufacturer | Second lien senior secured loan ($45,000 par due 7/2019) | 9.00% (Libor + 8.00%/Q) | 5/30/2014 | 45,000 | 45,000 | (2)(25) | ||||||||||||
| | | | | | | | | | | | | | | | | | | | |
| 1,459,414 | 1,470,816 | 27.84 | % | ||||||||||||||||
| | | | | | | | | | | | | | | | | | | | |
| Services-Other | |||||||||||||||||||
| American Residential Services L.L.C. | Heating, ventilation and air conditioning services provider | Second lien senior secured loan ($50,000 par due 12/2021) | 9.00% (Libor + 8.00%/Q) | 6/30/2014 | 49,534 | 50,000 | (2)(25) | ||||||||||||
| Capital Investments and Ventures Corp. | SCUBA diver training and certification provider | First lien senior secured loan ($60,654 par due 8/2020) | 8.00% (Base Rate + 4.75%/Q) | 8/9/2012 | 60,334 | 60,654 | (2)(25) | ||||||||||||
| First lien senior secured loan ($21,181 par due 8/2020) | 8.00% (Base Rate + 4.75%/Q) | 8/9/2012 | 21,181 | 21,181 | (3)(25) | ||||||||||||||
| First lien senior secured loan ($7,534 par due 8/2020) | 8.00% (Base Rate + 4.75%/Q) | 8/9/2012 | 7,534 | 7,534 | (4)(25) | ||||||||||||||
| | | | | | | | | | | | | | | | | | | | |
| 89,049 | 89,369 | ||||||||||||||||||
| Community Education Centers, Inc. | Offender re-entry and in-prison treatment services provider | First lien senior secured loan ($14,130 par due 3/2015) | 6.25% (Libor + 5.25%/Q) | 12/10/2010 | 14,130 | 14,130 | (2)(18)(25) | ||||||||||||
| First lien senior secured loan ($156 par due 3/2015) | 7.50% (Base Rate + 4.25%/Q) | 12/10/2010 | 156 | 156 | (2)(18)(25) | ||||||||||||||
| Second lien senior secured loan ($48,377 par due 12/2015) | 12/10/2010 | 47,169 | 39,858 | (2)(24) | |||||||||||||||
F-9
Company(1)
|
Business Description | Investment | Interest(5)(11) | Acquisition Date |
Amortized Cost |
Fair Value |
Percentage of Net Assets |
||||||||||||
|---|---|---|---|---|---|---|---|---|---|---|---|---|---|---|---|---|---|---|---|
| Warrants to purchase up to 654,618 shares | 12/10/2010 | — | — | (2) | |||||||||||||||
| | | | | | | | | | | | | | | | | | | | |
| 61,455 | 54,144 | ||||||||||||||||||
| Competitor Group, Inc. and Calera XVI, LLC | Endurance sports media and event operator | First lien senior secured revolving loan ($2,850 par due 11/2018) | 10.00% (Base Rate + 6.75%/Q) | 11/30/2012 | 2,850 | 2,565 | (2)(25) | ||||||||||||
| First lien senior secured revolving loan ($900 par due 11/2018) | 9.00% (Libor + 7.75%/Q) | 11/30/2012 | 900 | 810 | (2)(25) | ||||||||||||||
| First lien senior secured loan ($24,444 par due 11/2018) | 10.50% (Libor + 7.75% Cash, 1.50% PIK /Q) | 11/30/2012 | 24,444 | 21,999 | (2)(25) | ||||||||||||||
| First lien senior secured loan ($29,931 par due 11/2018) | 10.50% (Libor + 7.75% Cash, 1.50% PIK /Q) | 11/30/2012 | 29,931 | 26,938 | (3)(25) | ||||||||||||||
| Membership units (2,500,000 units) | 11/30/2012 | 2,519 | 275 | (2)(9) | |||||||||||||||
| | | | | | | | | | | | | | | | | | | | |
| 60,644 | 52,587 | ||||||||||||||||||
| Crown Health Care Laundry Services, Inc. and Crown Laundry Holdings, LLC(6) | Provider of outsourced linen management solutions to the healthcare industry | First lien senior secured revolving loan ($700 par due 3/2019) | 8.25% (Libor + 7.00%/Q) | 3/13/2014 | 700 | 700 | (2)(25)(28) | ||||||||||||
| First lien senior secured loan ($24,316 par due 3/2019) | 8.25% (Libor + 7.00%/Q) | 3/13/2014 | 24,316 | 24,316 | (2)(25) | ||||||||||||||
| Class A preferred units (2,475,000 units) | 3/13/2014 | 2,475 | 2,723 | (2) | |||||||||||||||
| Class B common units (275,000 units) | 3/13/2014 | 275 | 303 | (2) | |||||||||||||||
| | | | | | | | | | | | | | | | | | | | |
| 27,766 | 28,042 | ||||||||||||||||||
| Dwyer Acquisition Parent, Inc. and TDG Group Holding Company | Operator of multiple franchise concepts primarily related to home maintenance or repairs | Senior subordinated loan ($52,670 par due 2/2020) | 11.00% | 8/15/2014 | 52,670 | 52,670 | (2) | ||||||||||||
| Common stock (30,000 shares) | 8/15/2014 | 3,000 | 3,439 | (2) | |||||||||||||||
| | | | | | | | | | | | | | | | | | | | |
| 55,670 | 56,109 | ||||||||||||||||||
| GHS Interactive Security, LLC and LG Security Holdings, LLC | Originates residential security alarm contracts | First lien senior secured loan ($8,578 par due 5/2018) | 7.50% (Libor + 6.00%/S) | 12/13/2013 | 8,626 | 8,578 | (25) | ||||||||||||
| Class A membership units (1,560,000 units) | 12/13/2013 | 1,607 | 728 | ||||||||||||||||
| | | | | | | | | | | | | | | | | | | | |
| 10,233 | 9,306 | ||||||||||||||||||
| Massage Envy, LLC | Franchisor in the massage industry | First lien senior secured loan ($28,245 par due 9/2018) | 8.50% (Libor + 7.25%/Q) | 9/27/2012 | 28,245 | 28,245 | (2)(25) | ||||||||||||
| First lien senior secured loan ($47,716 par due 9/2018) | 8.50% (Libor + 7.25%/Q) | 9/27/2012 | 47,716 | 47,716 | (3)(25) | ||||||||||||||
| Common stock (3,000,000 shares) | 9/27/2012 | 3,000 | 4,306 | (2) | |||||||||||||||
| | | | | | | | | | | | | | | | | | | | |
| 78,961 | 80,267 | ||||||||||||||||||
| McKenzie Sports Products, LLC | Designer, manufacturer and distributor of hunting-related supplies | First lien senior secured loan ($84,500 par due 9/2020) | 6.75% (Libor + 5.75%/M) | 9/18/2014 | 84,500 | 83,654 | (2)(12)(25) | ||||||||||||
| OpenSky Project, Inc. | Social commerce platform operator | First lien senior secured loan ($3,000 par due 9/2017) | 10.00% | 6/4/2014 | 2,960 | 3,000 | (2) | ||||||||||||
| Warrant to purchase up to 46,996 shares of Series D preferred stock | 6/4/2014 | 48 | 48 | (2) | |||||||||||||||
| | | | | | | | | | | | | | | | | | | | |
| 3,008 | 3,048 | ||||||||||||||||||
| PODS Funding Corp. II | Storage and warehousing | First lien senior secured loan ($3,899 par due 12/2018) | 7.00% (Libor + 6.00%/Q) | 3/12/2014 | 3,899 | 3,899 | (25) | ||||||||||||
| First lien senior secured loan ($33,989 par due 12/2018) | 7.00% (Libor + 6.00%/Q) | 3/12/2014 | 33,989 | 33,989 | (25) | ||||||||||||||
| | | | | | | | | | | | | | | | | | | | |
| 37,888 | 37,888 | ||||||||||||||||||
F-10
Company(1)
|
Business Description | Investment | Interest(5)(11) | Acquisition Date |
Amortized Cost |
Fair Value |
Percentage of Net Assets |
||||||||||||
|---|---|---|---|---|---|---|---|---|---|---|---|---|---|---|---|---|---|---|---|
| Spin HoldCo Inc. | Laundry service and equipment provider | Second lien senior secured loan ($140,000 par due 5/2020) | 8.00% (Libor + 7.00%/M) | 5/14/2013 | 140,000 | 137,200 | (2)(25) | ||||||||||||
| TWH Water Treatment Industries, Inc., TWH Filtration Industries, Inc. and TWH Infrastructure Industries, Inc. | Wastewater infrastructure repair, treatment and filtration company | First lien senior secured loan ($2,240 par due 10/2019) | 10.25% (Libor + 9.25%/Q) | 10/10/2014 | 2,240 | 2,240 | (2)(25) | ||||||||||||
| First lien senior secured loan ($36,400 par due 10/2019) | 10.25% (Libor + 9.25%/Q) | 10/10/2014 | 36,400 | 36,400 | (2)(25) | ||||||||||||||
| | | | | | | | | | | | | | | | | | | | |
| 38,640 | 38,640 | ||||||||||||||||||
| United Road Towing, Inc. | Towing company | Warrants to purchase up to 607 shares | 4/1/2010 | — | — | ||||||||||||||
Wash Multifamily Laundry Systems, LLC |
Laundry service and equipment provider |
Second lien senior secured loan ($78,000 par due 2/2020) |
7.75% (Libor + 6.75%/Q) |
6/26/2012 |
78,000 |
78,000 |
(2)(25) |
||||||||||||
| | | | | | | | | | | | | | | | | | | | |
| 815,348 | 798,254 | 15.11 | % | ||||||||||||||||
| | | | | | | | | | | | | | | | | | | | |
| Consumer Products | |||||||||||||||||||
| Feradyne Outdoors, LLC and Bowhunter Holdings, LLC | Provider of branded archery and bowhunting accessories | First lien senior secured loan ($50,100 par due 3/2019) | 6.55% (Libor + 5.55%/Q) | 4/24/2014 | 50,100 | 50,100 | (2)(22)(25) | ||||||||||||
| First lien senior secured loan ($6,953 par due 3/2019) | 4.00% (Libor + 3.00%/Q) | 4/24/2014 | 6,953 | 6,953 | (2)(25) | ||||||||||||||
| Common units (300 units) | 4/24/2014 | 3,000 | 2,573 | (2) | |||||||||||||||
| | | | | | | | | | | | | | | | | | | | |
| 60,053 | 59,626 | ||||||||||||||||||
| Implus Footcare, LLC | Provider of footwear and other accessories | Preferred stock (455 shares) | 6.00% PIK | 10/31/2011 | 4,740 | 4,740 | (2) | ||||||||||||
| Common stock (455 shares) | 10/31/2011 | — | 1,414 | (2) | |||||||||||||||
| | | | | | | | | | | | | | | | | | | | |
| 4,740 | 6,154 | ||||||||||||||||||
| Indra Holdings Corp. | Designer, marketer, and distributor of rain and cold weather products | Second lien senior secured loan ($80,000 par due 11/2021) | 8.50% (Libor + 7.50%/Q) | 5/1/2014 | 78,814 | 79,199 | (2)(25) | ||||||||||||
| Matrixx Initiatives, Inc. and Wonder Holdings Acquisition Corp. | Developer and marketer of OTC healthcare products | Warrants to purchase up to 1,489 shares of preferred stock | 7/27/2011 | — | 921 | (2) | |||||||||||||
| Warrants to purchase up to 1,654,678 shares of common stock | 7/27/2011 | — | — | (2) | |||||||||||||||
| | | | | | | | | | | | | | | | | | | | |
| — | 921 | ||||||||||||||||||
| Oak Parent, Inc. | Manufacturer of athletic apparel | First lien senior secured loan ($30,256 par due 4/2018) | 7.50% (Libor + 7.00%/Q) | 4/2/2012 | 30,172 | 30,256 | (3)(25) | ||||||||||||
| First lien senior secured loan ($157 par due 4/2018) | 9.25% (Base Rate + 6.00%/Q) | 4/2/2012 | 157 | 157 | (3)(25) | ||||||||||||||
| First lien senior secured loan ($8,551 par due 4/2018) | 7.50% (Libor + 7.00%/Q) | 4/2/2012 | 8,527 | 8,551 | (4)(25) | ||||||||||||||
| First lien senior secured loan ($44 par due 4/2018) | 9.25% (Base Rate + 6.00%/Q) | 4/2/2012 | 44 | 44 | (4)(25) | ||||||||||||||
| | | | | | | | | | | | | | | | | | | | |
| 38,900 | 39,008 | ||||||||||||||||||
| PG-ACP Co-Invest, LLC | Supplier of medical uniforms, specialized medical footwear and accessories | Class A membership units (1,000,0000 units) | 8/29/2012 | 1,000 | 1,444 | (2) | |||||||||||||
| Plantation Products, LLC, Seed Holdings, Inc. and Flora Parent, Inc. | Provider of branded lawn and garden products | First lien senior secured revolving loan ($9,007 par due 12/2020) | 5.00% (Libor + 4.00%/Q) | 12/23/2014 | 9,007 | 9,007 | (2)(25) | ||||||||||||
| First lien senior secured loan ($79,000 par due 12/2020) | 5.00% (Libor + 4.00%/Q) | 12/23/2014 | 78,545 | 79,000 | (2)(25) | ||||||||||||||
| Second lien senior secured loan ($66,000 par due 6/2021) | 9.94% (Libor + 8.94%/Q) | 12/23/2014 | 65,620 | 66,000 | (2)(25) | ||||||||||||||
| Common stock (30,000 shares) | 12/23/2014 | 3,000 | 3,000 | (2) | |||||||||||||||
| | | | | | | | | | | | | | | | | | | | |
| 156,172 | 157,007 | ||||||||||||||||||
F-11
Company(1)
|
Business Description | Investment | Interest(5)(11) | Acquisition Date |
Amortized Cost |
Fair Value |
Percentage of Net Assets |
||||||||||||
|---|---|---|---|---|---|---|---|---|---|---|---|---|---|---|---|---|---|---|---|
| Shock Doctor, Inc. and BRP Hold 14, LLC | Developer, marketer and distributor of sports protection equipment and accessories. | First lien senior secured loan ($1,333 par due 3/2020) | 8.75% (Libor + 7.75%/Q) | 3/14/2014 | 1,333 | 1,333 | (2)(25) | ||||||||||||
| First lien senior secured loan ($5,721 par due 3/2020) | 8.75% (Libor + 7.75%/Q) | 3/14/2014 | 5,721 | 5,721 | (2)(25) | ||||||||||||||
| First lien senior secured loan ($53,729 par due 3/2020) | 8.75% (Libor + 7.75%/Q) | 3/14/2014 | 53,729 | 53,729 | (3)(25) | ||||||||||||||
| First lien senior secured loan ($19,950 par due 3/2020) | 8.75% (Libor + 7.75%/Q) | 3/14/2014 | 19,950 | 19,950 | (4)(25) | ||||||||||||||
| Class A preferred units (50,000 units) | 3/14/2014 | 5,000 | 5,529 | (2) | |||||||||||||||
| | | | | | | | | | | | | | | | | | | | |
| 85,733 | 86,262 | ||||||||||||||||||
| The Step2 Company, LLC(7) | Toy manufacturer | Second lien senior secured loan ($27,583 par due 9/2019) | 10.00% PIK | 4/1/2010 | 27,463 | 27,583 | (2) | ||||||||||||
| Second lien senior secured loan ($4,500 par due 9/2019) | 10.00% | 3/13/2014 | 4,500 | 4,500 | (2) | ||||||||||||||
| Second lien senior secured loan ($37,207 par due 9/2019) | 4/1/2010 | 30,802 | 9,043 | (2)(24) | |||||||||||||||
| Common units (1,116,879 units) | 4/1/2010 | 24 | — | ||||||||||||||||
| Class B common units (126,278,000 units) | 10/30/2014 | — | — | (2) | |||||||||||||||
| Warrants to purchase up to 3,157,895 units | 4/1/2010 | — | — | ||||||||||||||||
| | | | | | | | | | | | | | | | | | | | |
| 62,789 | 41,126 | ||||||||||||||||||
| Varsity Brands Holding Co., Inc., Hercules Achievement, Inc., Hercules Achievement Holdings, Inc., and Hercules VB Holdings, Inc. | Leading manufacturer and distributor of textiles, apparel & luxury goods | Second lien senior secured loan ($180,000 par due 12/2022) | 9.75% (Libor + 8.75%/M) | 12/11/2014 | 178,200 | 180,000 | (2)(25) | ||||||||||||
| Common stock (3,353,371 shares) | 12/11/2014 | 4,147 | 4,147 | (2) | |||||||||||||||
| Common stock (3,353,371 shares) | 12/11/2014 | 3,353 | 3,353 | (2) | |||||||||||||||
| | | | | | | | | | | | | | | | | | | | |
| 185,700 | 187,500 | ||||||||||||||||||
| Woodstream Corporation | Pet products manufacturer | First lien senior secured loan ($12 par due 8/2016) | 7.00% (Base Rate + 3.75%/Q) | 4/18/2012 | 12 | 12 | (4)(25) | ||||||||||||
| First lien senior secured loan ($4,804 par due 8/2016) | 6.00% (Libor + 5.00%/Q) | 4/18/2012 | 4,804 | 4,804 | (4)(25) | ||||||||||||||
| Senior subordinated loan ($80,000 par due 2/2017) | 11.50% | 4/18/2012 | 78,178 | 80,000 | (2) | ||||||||||||||
| Common stock (4,254 shares) | 1/22/2010 | 1,222 | 2,816 | (2) | |||||||||||||||
| | | | | | | | | | | | | | | | | | | | |
| 84,216 | 87,632 | ||||||||||||||||||
| | | | | | | | | | | | | | | | | | | | |
| 758,117 | 745,879 | 14.12 | % | ||||||||||||||||
| | | | | | | | | | | | | | | | | | | | |
| Power Generation | |||||||||||||||||||
| Alphabet Energy, Inc. | Technology developer to convert waste-heat into electricity | First lien senior secured loan ($1,960 par due 7/2017) | 9.50% | 12/16/2013 | 1,894 | 1,960 | (2) | ||||||||||||
| First lien senior secured loan ($2,880 par due 7/2017) | 9.62% | 12/16/2013 | 2,683 | 2,880 | (2) | ||||||||||||||
| Series B preferred stock (74,449 shares) | 2/26/2014 | 250 | 250 | (2) | |||||||||||||||
| Warrant to purchase up to 59,524 units of Series B preferred stock | 12/16/2013 | 146 | 125 | (2) | |||||||||||||||
| | | | | | | | | | | | | | | | | | | | |
| 4,973 | 5,215 | ||||||||||||||||||
| Bicent (California) Holdings LLC | Gas turbine power generation facilities operator | Senior subordinated loan ($49,706 par due 2/2021) | 8.25% (Libor + 7.25%/Q) | 2/6/2014 | 49,706 | 49,706 | (2)(25) | ||||||||||||
F-12
Company(1)
|
Business Description | Investment | Interest(5)(11) | Acquisition Date |
Amortized Cost |
Fair Value |
Percentage of Net Assets |
||||||||||||
|---|---|---|---|---|---|---|---|---|---|---|---|---|---|---|---|---|---|---|---|
| Brush Power, LLC | Gas turbine power generation facilities operator | First lien senior secured loan ($1,730 par due 8/2020) | 7.50% (Base Rate + 4.25%/Q) | 8/1/2013 | 1,730 | 1,730 | (2)(25) | ||||||||||||
| First lien senior secured loan ($86,384 par due 8/2020) | 6.25% (Libor + 5.25%/Q) | 8/1/2013 | 86,384 | 86,384 | (2)(25) | ||||||||||||||
| | | | | | | | | | | | | | | | | | | | |
| 88,114 | 88,114 | ||||||||||||||||||
| CPV Maryland Holding Company II, LLC | Gas turbine power generation facilities operator | Senior subordinated loan ($42,838 par due 12/2020) | 5.00% Cash, 5.00% PIK | 8/8/2014 | 42,838 | 42,838 | (2) | ||||||||||||
| Warrant to purchase up to 4 units of common stock | 8/8/2014 | — | 200 | (2) | |||||||||||||||
| | | | | | | | | | | | | | | | | | | | |
| 42,838 | 43,038 | ||||||||||||||||||
| DESRI VI Management Holdings, LLC | Wind and solar power generation facility operator | Senior subordinated loan ($26,500 par due 12/2021) | 9.75% | 12/24/2014 | 26,500 | 26,500 | (2) | ||||||||||||
| Non-controlling units (10.0 units) | 12/24/2014 | 1,483 | 1,483 | (2) | |||||||||||||||
| | | | | | | | | | | | | | | | | | | | |
| 27,983 | 27,983 | ||||||||||||||||||
| DESRI Wind Development Acquisition Holdings, L.L.C. | Wind and solar power generation facility operator | Senior subordinated loan ($14,750 par due 8/2021) | 9.25% | 8/26/2014 | 14,750 | 14,750 | (2) | ||||||||||||
| Non-controlling units (7.5 units) | 8/26/2014 | 806 | 806 | (2) | |||||||||||||||
| | | | | | | | | | | | | | | | | | | | |
| 15,556 | 15,556 | ||||||||||||||||||
| Green Energy Partners, Stonewall LLC and Panda Stonewall Intermediate Holdings II LLC | Gas turbine power generation facilities operator | Senior subordinated loan ($81,500 par due 12/2021) | 13.25% | 11/13/2014 | 81,500 | 81,500 | (2) | ||||||||||||
| Joule Unlimited Technologies, Inc. and Stichting Joule Global Foundation | Renewable fuel and chemical production developer | First lien senior secured loan ($5,909 par due 2/2017) | 10.00% | 7/25/2013 | 5,873 | 5,909 | (2)(23) | ||||||||||||
| Warrant to purchase up to 32,051 shares of Series C-2 preferred stock | 7/25/2013 | — | 39 | (2)(8) | |||||||||||||||
| | | | | | | | | | | | | | | | | | | | |
| 5,873 | 5,948 | ||||||||||||||||||
| La Paloma Generating Company, LLC | Natural gas fired, combined cycle plant operator | Second lien senior secured loan ($10,000 par due 2/2020) | 9.25% (Libor + 8.25%/Q) | 2/20/2014 | 9,652 | 9,400 | (2)(25) | ||||||||||||
| Moxie Liberty LLC | Gas turbine power generation facilities operator | First lien senior secured loan ($100,000 par due 8/2020) | 7.50% (Libor + 6.50%/Q) | 8/21/2013 | 98,900 | 100,000 | (2)(25) | ||||||||||||
| Moxie Patriot LLC | Gas turbine power generation facilities operator | First lien senior secured loan ($100,000 par due 12/2020) | 6.75% (Libor + 5.75%/Q) | 12/19/2013 | 99,000 | 100,000 | (2)(25) | ||||||||||||
| Panda Sherman Power, LLC | Gas turbine power generation facilities operator | First lien senior secured loan ($32,429 par due 9/2018) | 9.00% (Libor + 7.50%/Q) | 9/14/2012 | 32,429 | 32,429 | (2)(25) | ||||||||||||
| Panda Temple Power II, LLC | Gas turbine power generation facilities operator | First lien senior secured loan ($20,000 par due 4/2019) | 7.25% (Libor + 6.00%/Q) | 4/3/2013 | 19,852 | 20,000 | (2)(25) | ||||||||||||
| Panda Temple Power, LLC | Gas turbine power generation facilities operator | First lien senior secured loan ($60,000 par due 7/2018) | 11.50% (Libor + 10.00%/Q) | 7/17/2012 | 58,719 | 60,000 | (2)(25) | ||||||||||||
| PERC Holdings 1 LLC | Operator of recycled energy, combined heat and power, and energy efficiency facilities | Class B common units (21,653,543 units) | 10/20/2014 | 21,654 | 21,654 | (2) | |||||||||||||
| | | | | | | | | | | | | | | | | | | | |
| 656,749 | 660,543 | 12.50 | % | ||||||||||||||||
| | | | | | | | | | | | | | | | | | | | |
F-13
Company(1)
|
Business Description | Investment | Interest(5)(11) | Acquisition Date |
Amortized Cost |
Fair Value |
Percentage of Net Assets |
||||||||||||
|---|---|---|---|---|---|---|---|---|---|---|---|---|---|---|---|---|---|---|---|
| Business Services | |||||||||||||||||||
| 2329497 Ontario Inc.(8) | Outsourced data center infrastructure and related services provider | Second lien senior secured loan ($42,480 par due 6/2019) | 10.50% (Libor + 9.25%/M) | 12/13/2013 | 43,323 | 36,006 | (2)(25) | ||||||||||||
| BlackArrow, Inc. | Advertising and data solutions software platform provider | First lien senior secured loan ($8,000 par due 9/2017) | 9.25% | 3/13/2014 | 7,782 | 8,000 | (2) | ||||||||||||
| Warrant to purchase up to 517,386 units of Series C preferred stock | 3/13/2014 | — | 76 | (2) | |||||||||||||||
| | | | | | | | | | | | | | | | | | | | |
| 7,782 | 8,076 | ||||||||||||||||||
| CallMiner, Inc. | Provider of cloud-based conversational analytics solutions | First lien senior secured loan ($4,000 par due 5/2018) | 10.00% | 7/23/2014 | 3,973 | 4,000 | (2) | ||||||||||||
| First lien senior secured loan ($2,000 par due 9/2018) | 10.00% | 7/23/2014 | 1,986 | 2,000 | (2) | ||||||||||||||
| Warrant to purchase up to 2,350,636 shares of Series 1 preferred stock | 7/23/2014 | — | — | (2) | |||||||||||||||
| | | | | | | | | | | | | | | | | | | | |
| 5,959 | 6,000 | ||||||||||||||||||
| Cast & Crew Payroll, LLC and Centerstage Co-Investors, L.L.C.(6) | Payroll and accounting services provider to the entertainment industry | First lien senior secured loan ($27,930 par due 10/2019) | 4.00% (Libor + 3.00%/Q) | 12/24/2012 | 27,930 | 27,930 | (2)(25) | ||||||||||||
| First lien senior secured loan ($53,569 par due 10/2019) | 7.00% (Libor + 6.00%/Q) | 12/24/2012 | 53,569 | 53,569 | (2)(16)(25) | ||||||||||||||
| First lien senior secured loan ($41,813 par due 10/2019) | 7.00% (Libor + 6.00%/Q) | 12/24/2012 | 41,813 | 41,813 | (3)(16)(25) | ||||||||||||||
| Class A membership units (2,500,000 units) | 12/24/2012 | 57 | 5,885 | (2) | |||||||||||||||
| Class B membership units (2,500,000 units) | 12/24/2012 | 57 | 5,885 | (2) | |||||||||||||||
| | | | | | | | | | | | | | | | | | | | |
| 123,426 | 135,082 | ||||||||||||||||||
| CIBT Investment Holdings, LLC | Expedited travel document processing services | Class A shares (2,500 shares) | 12/15/2011 | 2,500 | 4,915 | (2) | |||||||||||||
| Command Alkon, Incorporated and CA Note Issuer, LLC | Software solutions provider to the ready-mix concrete industry | Second lien senior secured loan ($10,000 par due 8/2020) | 9.25% (Libor + 8.25%/Q) | 9/28/2012 | 10,000 | 10,000 | (2)(25) | ||||||||||||
| Second lien senior secured loan ($26,500 par due 8/2020) | 9.25% (Libor + 8.25%/Q) | 9/28/2012 | 26,500 | 26,500 | (2)(25) | ||||||||||||||
| Second lien senior secured loan ($11,500 par due 8/2020) | 9.25% (Libor + 8.25%/Q) | 9/28/2012 | 11,500 | 11,500 | (2)(25) | ||||||||||||||
| Senior subordinated loan ($17,621 par due 8/2021) | 14.00% PIK | 8/8/2014 | 17,621 | 17,621 | (2) | ||||||||||||||
| | | | | | | | | | | | | | | | | | | | |
| 65,621 | 65,621 | ||||||||||||||||||
| Compuware Parent, LLC | Web and mobile cloud performance testing and monitoring services provider | Class A-1 common stock (4,132 units) | 12/15/2014 | 2,250 | 2,527 | (2) | |||||||||||||
| Class B-1 common stock (4,132 units) | 12/15/2014 | 450 | 505 | (2) | |||||||||||||||
| Class C-1 common stock (4,132 units) | 12/15/2014 | 300 | 337 | (2) | |||||||||||||||
| Class A-2 common stock (4,132 units) | 12/15/2014 | — | — | (2) | |||||||||||||||
| Class B-2 common stock (4,132 units) | 12/15/2014 | — | — | (2) | |||||||||||||||
| Class C-2 common stock (4,132 units) | 12/15/2014 | — | — | (2) | |||||||||||||||
| | | | | | | | | | | | | | | | | | | | |
| 3,000 | 3,369 | ||||||||||||||||||
| Coverall North America, Inc. | Commercial janitorial services provider | Letter of credit facility | 1/17/2013 | — | — | (29) | |||||||||||||
F-14
Company(1)
|
Business Description | Investment | Interest(5)(11) | Acquisition Date |
Amortized Cost |
Fair Value |
Percentage of Net Assets |
||||||||||||
|---|---|---|---|---|---|---|---|---|---|---|---|---|---|---|---|---|---|---|---|
| Directworks, Inc. and Co-Exprise Holdings, Inc. | Provider of cloud-based software solutions for direct materials sourcing and supplier management for manufacturers | First lien senior secured loan ($2,500 par due 4/2018) | 10.25% (Libor + 9.25%/M) | 12/19/2014 | 2,500 | 2,500 | (2)(25) | ||||||||||||
| Warrant to purchase up to 1,875,000 shares of Series 1 preferred stock | 12/19/2014 | — | — | (2) | |||||||||||||||
| | | | | | | | | | | | | | | | | | | | |
| 2,500 | 2,500 | ||||||||||||||||||
| DTI Holdco, Inc. and OPE DTI Holdings, Inc. | Provider of legal process outsourcing and managed services | First lien senior secured loan ($1,000 par due 8/2020) | 5.75% (Libor + 4.75%/Q) | 8/19/2014 | 1,000 | 1,000 | (2)(25) | ||||||||||||
| Class A common stock (7,500 shares) | 8/19/2014 | 7,500 | 8,383 | (2) | |||||||||||||||
| Class B common stock (7,500 shares) | 8/19/2014 | — | — | (2) | |||||||||||||||
| | | | | | | | | | | | | | | | | | | | |
| 8,500 | 9,383 | ||||||||||||||||||
| First Insight, Inc. | Software company providing merchandising and pricing solutions to companies worldwide | First lien senior secured loan ($3,267 par due 4/2017) | 9.50% | 3/20/2014 | 3,193 | 3,267 | (2) | ||||||||||||
| Warrants to purchase up to 122,827 units of Series C preferred stock | 3/20/2014 | — | 6 | (2) | |||||||||||||||
| | | | | | | | | | | | | | | | | | | | |
| 3,193 | 3,273 | ||||||||||||||||||
| HCPro, Inc. and HCP Acquisition Holdings, LLC(7) | Healthcare compliance advisory services | Senior subordinated loan ($9,398 par due 5/2015) | 3/5/2013 | 2,691 | — | (2)(24) | |||||||||||||
| Class A units (14,293,110 units) | 6/26/2008 | 12,793 | — | (2) | |||||||||||||||
| | | | | | | | | | | | | | | | | | | | |
| 15,484 | — | ||||||||||||||||||
| IfByPhone Inc. | Voice-based marketing automation software provider | Warrant to purchase up to 124,300 shares of Series C preferred stock | 10/15/2012 | 88 | 79 | (2) | |||||||||||||
| Investor Group Services, LLC(6) | Business consulting for private equity and corporate clients | Limited liability company membership interest (7.75% interest) | 6/22/2006 | — | 625 | ||||||||||||||
| IronPlanet, Inc. | Online auction platform provider for used heavy equipment | First lien senior secured revolving loan | 9/24/2013 | — | — | (2)(27) | |||||||||||||
| Warrant to purchase to up to 133,333 shares of Series C preferred stock | 9/24/2013 | 214 | 244 | (2) | |||||||||||||||
| | | | | | | | | | | | | | | | | | | | |
| 214 | 244 | ||||||||||||||||||
| ISS #2, LLC | Provider of repairs, refurbishments and services to the broader industrial end user markets | First lien senior secured loan ($54,767 par due 6/2018) | 6.50% (Libor + 5.50%/M) | 6/5/2013 | 54,767 | 54,767 | (2)(25) | ||||||||||||
| First lien senior secured loan ($4,900 par due 6/2018) | 6.50% (Libor + 5.50%/M) | 6/5/2013 | 4,900 | 4,900 | (2)(25) | ||||||||||||||
| First lien senior secured loan ($44,325 par due 6/2018) | 6.50% (Libor + 5.50%/Q) | 6/5/2013 | 44,325 | 44,325 | (3)(25) | ||||||||||||||
| | | | | | | | | | | | | | | | | | | | |
| 103,992 | 103,992 | ||||||||||||||||||
| Itel Laboratories, Inc. | Data services provider for building materials to property insurance industry | Preferred units (1,798,391 units) | 6/29/2012 | 1,000 | 1,289 | (2) | |||||||||||||
| Market Track Holdings, LLC | Business media consulting services company | Preferred stock (1,500 shares) | 12/13/2013 | 1,982 | 1,912 | ||||||||||||||
| Common stock (15,000 shares) | 12/13/2013 | 1,982 | 1,780 | ||||||||||||||||
| | | | | | | | | | | | | | | | | | | | |
| 3,964 | 3,692 | ||||||||||||||||||
F-15
Company(1)
|
Business Description | Investment | Interest(5)(11) | Acquisition Date |
Amortized Cost |
Fair Value |
Percentage of Net Assets |
||||||||||||
|---|---|---|---|---|---|---|---|---|---|---|---|---|---|---|---|---|---|---|---|
| Maximus Holdings, LLC | Provider of software simulation tools and related services | Warrants to purchase up to 1,050,013 shares of common stock | 12/13/2013 | — | 610 | ||||||||||||||
| Multi-Ad Services, Inc.(6) | Marketing services and software provider | Preferred units (1,725,280 units) | 4/1/2010 | 788 | 2,118 | ||||||||||||||
| Common units (1,725,280 units) | 4/1/2010 | — | — | ||||||||||||||||
| | | | | | | | | | | | | | | | | | | | |
| 788 | 2,118 | ||||||||||||||||||
| MVL Group, Inc.(7) | Marketing research provider | Senior subordinated loan ($430 par due 7/2012) | 4/1/2010 | 226 | 226 | (2)(24) | |||||||||||||
| Common stock (560,716 shares) | 4/1/2010 | — | — | (2) | |||||||||||||||
| | | | | | | | | | | | | | | | | | | | |
| 226 | 226 | ||||||||||||||||||
| NComputing, Inc. | Desktop virtualization hardware and software technology service provider | Warrant to purchase up to 462,726 shares of Series C preferred stock | 3/20/2013 | — | 12 | (2) | |||||||||||||
| PeakColo Holdings, Inc. and Powered by Peak LLC | Wholesaler of cloud-based software applications and services | First lien senior secured loan ($4,000 par due 11/2018) | 9.75% (Libor + 8.75%/M) | 11/3/2014 | 3,909 | 3,920 | (2)(25) | ||||||||||||
| Warrant to purchase up to 2,037 shares of Series A preferred stock | 11/3/2014 | 93 | 93 | (2) | |||||||||||||||
| | | | | | | | | | | | | | | | | | | | |
| 4,002 | 4,013 | ||||||||||||||||||
| PHL Investors, Inc., and PHL Holding Co.(7) | Mortgage services | Class A common stock (576 shares) | 7/31/2012 | 3,768 | — | (2) | |||||||||||||
| Powersport Auctioneer Holdings, LLC | Powersport vehicle auction operator | Common units (1,972 units) | 3/2/2012 | 1,000 | 963 | (2) | |||||||||||||
| R2 Acquisition Corp. | Marketing services | Common stock (250,000 shares) | 5/29/2007 | 250 | 181 | (2) | |||||||||||||
| Rocket Fuel Inc. | Provider of open and integrated software for digital marketing optimization | Common stock (11,405 units) | 9/9/2014 | 40 | 92 | (2) | |||||||||||||
| Ship Investor & Cy S.C.A.(8) | Payment processing company | Common stock (936,693 shares) | 12/13/2013 | 1,729 | 3,135 | ||||||||||||||
| Tripwire, Inc. | IT security software provider | First lien senior secured loan ($65,716 par due 5/2018) | 7.00% (Libor + 5.75%/Q) | 5/23/2011 | 65,716 | 66,373 | (2)(25) | ||||||||||||
| First lien senior secured loan ($38,582 par due 5/2018) | 7.00% (Libor + 5.75%/Q) | 5/23/2011 | 38,582 | 38,968 | (3)(25) | ||||||||||||||
| First lien senior secured loan ($7,716 par due 5/2018) | 7.00% (Libor + 5.75%/Q) | 5/23/2011 | 7,716 | 7,794 | (4)(25) | ||||||||||||||
| Class A common stock (2,970 shares) | 5/23/2011 | 2,970 | 4,098 | (2) | |||||||||||||||
| Class B common stock (2,655,638 shares) | 5/23/2011 | 30 | 11,602 | (2) | |||||||||||||||
| | | | | | | | | | | | | | | | | | | | |
| 115,014 | 128,835 | ||||||||||||||||||
| Velocity Holdings Corp. | Hosted enterprise resource planning application management services provider | Common units (1,713,546 units) | 12/13/2013 | 4,503 | 3,270 | ||||||||||||||
| Venturehouse-Cibernet Investors, LLC | Financial settlement services for intercarrier wireless roaming | Equity interest | 4/1/2010 | — | — | (2) | |||||||||||||
| | | | | | | | | | | | | | | | | | | | |
| 521,866 | 527,601 | 9.99 | % | ||||||||||||||||
| | | | | | | | | | | | | | | | | | | | |
| Education | |||||||||||||||||||
| Campus Management Corp. and Campus Management Acquisition Corp.(6) | Education software developer | Preferred stock (485,159 shares) | 2/8/2008 | 10,520 | 10,161 | (2) | |||||||||||||
F-16
Company(1)
|
Business Description | Investment | Interest(5)(11) | Acquisition Date |
Amortized Cost |
Fair Value |
Percentage of Net Assets |
||||||||||||
|---|---|---|---|---|---|---|---|---|---|---|---|---|---|---|---|---|---|---|---|
| Infilaw Holding, LLC | Operator of for-profit law schools | First lien senior secured revolving loan | 8/25/2011 | — | — | (2)(27) | |||||||||||||
| First lien senior secured loan ($1 par due 8/2016) | 9.50% (Libor + 8.50%/Q) | 8/25/2011 | 1 | 1 | (2)(25) | ||||||||||||||
| First lien senior secured loan ($9,411 par due 8/2016) | 9.50% (Libor + 8.50%/Q) | 8/25/2011 | 9,411 | 9,411 | (3)(25) | ||||||||||||||
| Series A preferred units (124,890 units) | 9.50% (Libor + 8.50%/Q) | 8/25/2011 | 124,890 | 124,890 | (2)(25) | ||||||||||||||
| Series B preferred units (3.91 units) | 10/19/2012 | 9,245 | 12,840 | (2) | |||||||||||||||
| | | | | | | | | | | | | | | | | | | | |
| 143,547 | 147,142 | ||||||||||||||||||
| Instituto de Banca y Comercio, Inc. & Leeds IV Advisors, Inc. | Private school operator | First lien senior secured loan ($58,798 par due 12/2016) | 4/24/2013 | 52,972 | 47,039 | (2)(24) | |||||||||||||
| First lien senior secured loan ($1,996 par due 12/2016) | 6/13/2014 | 1,996 | 1,597 | (2)(24) | |||||||||||||||
| Series B preferred stock (1,750,000 shares) | 8/5/2010 | 5,000 | — | (2) | |||||||||||||||
| Series C preferred stock (2,512,586 shares) | 6/7/2010 | 689 | — | (2) | |||||||||||||||
| Common stock (20 shares) | 6/7/2010 | — | — | (2) | |||||||||||||||
| | | | | | | | | | | | | | | | | | | | |
| 60,657 | 48,636 | ||||||||||||||||||
| Lakeland Tours, LLC | Educational travel provider | First lien senior secured revolving loan | 10/4/2011 | — | — | (2)(27) | |||||||||||||
| First lien senior secured loan ($4,181 par due 1/2017) | 5.25% (Libor + 4.25%/Q) | 10/4/2011 | 4,180 | 4,181 | (2)(25) | ||||||||||||||
| First lien senior secured loan ($85,688 par due 1/2017) | 8.50% (Libor + 7.50%/Q) | 10/4/2011 | 85,664 | 85,688 | (2)(15)(25) | ||||||||||||||
| First lien senior secured loan ($40,362 par due 1/2017) | 8.50% (Libor + 7.50%/Q) | 10/4/2011 | 40,305 | 40,362 | (3)(15)(25) | ||||||||||||||
| Common stock (5,000 shares) | 10/4/2011 | 5,000 | 5,261 | (2) | |||||||||||||||
| | | | | | | | | | | | | | | | | | | | |
| 135,149 | 135,492 | ||||||||||||||||||
| PIH Corporation | Franchisor of education-based early childhood centers | First lien senior secured revolving loan ($621 par due 6/2017) | 7.25% (Libor + 6.25%/M) | 12/13/2013 | 621 | 621 | (2)(25) | ||||||||||||
| First lien senior secured loan ($35,512 par due 6/2017) | 7.25% (Libor + 6.25%/M) | 12/13/2013 | 36,127 | 35,512 | (2)(25) | ||||||||||||||
| | | | | | | | | | | | | | | | | | | | |
| 36,748 | 36,133 | ||||||||||||||||||
| R3 Education, Inc. and EIC Acquisitions Corp. | Medical school operator | Preferred stock (1,977 shares) | 7/30/2008 | 494 | 494 | (2) | |||||||||||||
| Common membership interest (15.76% interest) | 9/21/2007 | 15,800 | 26,199 | (2) | |||||||||||||||
| Warrants to purchase up to 27,890 shares | 12/8/2009 | 0 | 0 | (2) | |||||||||||||||
| | | | | | | | | | | | | | | | | | | | |
| 16,294 | 26,693 | ||||||||||||||||||
| Regent Education, Inc. | Provider of software solutions designed to optimize the financial aid and enrollment processes | First lien senior secured loan ($3,000 par due 1/2018) | 10.00% | 7/1/2014 | 2,934 | 2,940 | (2) | ||||||||||||
| Warrant to purchase up to 987,771 shares of Series CC preferred stock | 7/1/2014 | — | 76 | (2) | |||||||||||||||
| | | | | | | | | | | | | | | | | | | | |
| 2,934 | 3,016 | ||||||||||||||||||
| RuffaloCODY, LLC | Provider of student fundraising and enrollment management services | First lien senior secured loan ($12,683 par due 5/2019) | 5.57% (Libor + 4.32%/Q) | 5/29/2013 | 12,683 | 12,620 | (2)(25) | ||||||||||||
| First lien senior secured loan ($18,860 par due 5/2019) | 5.57% (Libor + 4.32%/Q) | 5/29/2013 | 18,860 | 18,765 | (2)(25) | ||||||||||||||
| First lien senior secured loan ($11,709 par due 5/2019) | 5.57% (Libor + 4.32%/Q) | 5/29/2013 | 11,709 | 11,651 | (4)(25) | ||||||||||||||
| | | | | | | | | | | | | | | | | | | | |
| 43,252 | 43,036 | ||||||||||||||||||
| WCI-Quantum Holdings, Inc. | Distributor of instructional products, services and resources | Series A preferred stock (1,272 shares) | 10/24/2014 | 1,000 | 1,000 | (2) | |||||||||||||
| | | | | | | | | | | | | | | | | | | | |
| 450,101 | 451,309 | 8.54 | % | ||||||||||||||||
| | | | | | | | | | | | | | | | | | | | |
F-17
Company(1)
|
Business Description | Investment | Interest(5)(11) | Acquisition Date |
Amortized Cost |
Fair Value |
Percentage of Net Assets |
||||||||||||
|---|---|---|---|---|---|---|---|---|---|---|---|---|---|---|---|---|---|---|---|
| Financial Services | |||||||||||||||||||
| AllBridge Financial, LLC(7) | Asset management services | Equity interests | 4/1/2010 | 1,140 | 5,804 | ||||||||||||||
| Callidus Capital Corporation(7) | Asset management services | Common stock (100 shares) | 4/1/2010 | 3,000 | 1,702 | ||||||||||||||
| Ciena Capital LLC(7) | Real estate and small business loan servicer | First lien senior secured revolving loan ($14,000 par due 12/2014) | 6.00% | 11/29/2010 | 14,000 | 14,000 | (2) | ||||||||||||
| First lien senior secured loan ($1,000 par due 12/2016) | 12.00% | 11/29/2010 | 1,000 | 1,000 | (2) | ||||||||||||||
| First lien senior secured loan ($10,000 par due 12/2016) | 12.00% | 11/29/2010 | 10,000 | 10,000 | (2) | ||||||||||||||
| First lien senior secured loan ($5,000 par due 12/2016) | 12.00% | 11/29/2010 | 5,000 | 5,000 | (2) | ||||||||||||||
| Equity interests | 11/29/2010 | 49,374 | 19,907 | (2) | |||||||||||||||
| | | | | | | | | | | | | | | | | | | | |
| 79,374 | 49,907 | ||||||||||||||||||
| Commercial Credit Group, Inc. | Commercial equipment finance and leasing company | Senior subordinated loan ($28,000 par due 5/2018) | 12.75% | 5/10/2012 | 28,000 | 28,000 | (2) | ||||||||||||
| Cook Inlet Alternative Risk, LLC | Risk management services | Senior subordinated loan ($750 par due 9/2015) | 9.00% | 9/30/2011 | 750 | 750 | (2) | ||||||||||||
| Gordian Acquisition Corp. | Financial services firm | Common stock (526 shares) | 11/30/2012 | — | — | (2) | |||||||||||||
| Imperial Capital Group LLC | Investment services | Class A common units (23,130 units) | 5/10/2007 | 11,248 | 15,633 | (2) | |||||||||||||
| 2006 Class B common units (7,578 units) | 5/10/2007 | 2 | 4 | (2) | |||||||||||||||
| 2007 Class B common units (945 units) | 5/10/2007 | — | — | (2) | |||||||||||||||
| | | | | | | | | | | | | | | | | | | | |
| 11,250 | 15,637 | ||||||||||||||||||
| Ivy Hill Asset Management, L.P.(7)(9) | Asset management services | Member interest (100.00% interest) | 6/15/2009 | 170,961 | 259,325 | ||||||||||||||
| Javlin Three LLC, Javlin Four LLC, and Javlin Five LLC(9) | Asset-backed financial services company | First lien senior secured revolving loan ($42,400 par due 6/2017) | 8.41% (Libor + 8.25%/M) | 6/24/2014 | 42,400 | 42,400 | (2) | ||||||||||||
| | | | | | | | | | | | | | | | | | | | |
| 336,875 | 403,525 | 7.64 | % | ||||||||||||||||
| | | | | | | | | | | | | | | | | | | | |
| Restaurants and Food Services | |||||||||||||||||||
| ADF Capital, Inc., ADF Restaurant Group, LLC, and ARG Restaurant Holdings, Inc. | Restaurant owner and operator | First lien senior secured loan ($28,581 par due 12/2018) | 9.25% (Libor + 8.25%/Q) | 11/27/2006 | 28,581 | 27,152 | (2)(20)(25) | ||||||||||||
| First lien senior secured loan ($10,919 par due 12/2018) | 9.25% (Libor + 8.25%/Q) | 11/27/2006 | 10,922 | 10,373 | (3)(20)(25) | ||||||||||||||
| Promissory note ($18,817 par due 12/2023) | 11/27/2006 | 13,770 | 346 | (2) | |||||||||||||||
| Warrants to purchase up to 23,750 units of Series D common stock | 12/18/2013 | 24 | — | (2) | |||||||||||||||
| | | | | | | | | | | | | | | | | | | | |
| 53,297 | 37,871 | ||||||||||||||||||
| Benihana, Inc. | Restaurant owner and operator | First lien senior secured loan ($4,888 par due 1/2019) | 6.75% (Libor + 5.50%/Q) | 8/21/2012 | 4,888 | 4,790 | (4)(25) | ||||||||||||
| DineInFresh, Inc. | Meal-delivery provider | First lien senior secured loan ($7,500 par due 7/2018) | 9.75% (Libor + 8.75%/Q) | 12/19/2014 | 7,425 | 7,500 | (2)(25) | ||||||||||||
| Warrant to purchase up to 143,079 shares of Series A preferred stock | 12/19/2014 | — | 3 | (2) | |||||||||||||||
| | | | | | | | | | | | | | | | | | | | |
| 7,425 | 7,503 | ||||||||||||||||||
F-18
Company(1)
|
Business Description | Investment | Interest(5)(11) | Acquisition Date |
Amortized Cost |
Fair Value |
Percentage of Net Assets |
||||||||||||
|---|---|---|---|---|---|---|---|---|---|---|---|---|---|---|---|---|---|---|---|
| Garden Fresh Restaurant Corp. | Restaurant owner and operator | First lien senior secured revolving loan ($1,100 par due 7/2018) | 10.00% (Libor + 8.50%/M) | 10/3/2013 | 1,100 | 1,100 | (2)(25)(28) | ||||||||||||
| First lien senior secured loan ($42,219 par due 7/2018) | 10.00% (Libor + 8.50%/M) | 10/3/2013 | 42,219 | 42,219 | (3)(25) | ||||||||||||||
| | | | | | | | | | | | | | | | | | | | |
| 43,319 | 43,319 | ||||||||||||||||||
| Global Franchise Group, LLC and GFG Intermediate Holding, Inc. | Worldwide franchisor of quick service restaurants | First lien senior secured loan ($62,500 par due 12/2019) | 10.57% (Libor + 9.57%/Q) | 12/18/2014 | 62,500 | 62,500 | (2)(25) | ||||||||||||
| Hojeij Branded Foods, Inc. | Airport restaurant operator | First lien senior secured revolving loan ($1,450 par due 2/2017) | 9.00% (Libor + 8.00%/Q) | 2/15/2012 | 1,450 | 1,450 | (2)(25)(28) | ||||||||||||
| First lien senior secured loan ($14,442 par due 2/2017) | 9.00% (Libor + 8.00%/Q) | 2/15/2012 | 14,442 | 14,442 | (2)(25) | ||||||||||||||
| First lien senior secured loan ($9,407 par due 2/2017) | 9.00% (Libor + 8.00%/Q) | 7/15/2014 | 9,407 | 9,407 | (2)(25) | ||||||||||||||
| First lien senior secured loan ($14,442 par due 2/2017) | 9.00% (Libor + 8.00%/Q) | 2/15/2012 | 14,136 | 14,442 | (2)(25) | ||||||||||||||
| Warrants to purchase up to 7.5% of membership interest | 2/15/2012 | — | 507 | (2) | |||||||||||||||
| Warrants to purchase up to 324 shares of Class A common stock | 2/15/2012 | 669 | 7,313 | (2) | |||||||||||||||
| | | | | | | | | | | | | | | | | | | | |
| 40,104 | 47,561 | ||||||||||||||||||
| Orion Foods, LLC (fka Hot Stuff Foods, LLC)(7) | Convenience food service retailer | First lien senior secured loan ($8,069 par due 9/2015) | 4/1/2010 | 8,069 | 3,106 | (2)(24) | |||||||||||||
| Second lien senior secured loan ($19,420 par due 9/2015) | 4/1/2010 | — | — | (2)(24) | |||||||||||||||
| Preferred units (10,000 units) | 10/28/2010 | — | — | (2) | |||||||||||||||
| Class A common units (25,001 units) | 4/1/2010 | — | — | (2) | |||||||||||||||
| Class B common units (1,122,452 units) | 4/1/2010 | — | — | (2) | |||||||||||||||
| | | | | | | | | | | | | | | | | | | | |
| 8,069 | 3,106 | ||||||||||||||||||
| OTG Management, LLC | Airport restaurant operator | First lien senior secured revolving loan ($2,500 par due 12/2017) | 8.75% (Libor + 7.25%/M) | 12/11/2012 | 2,500 | 2,500 | (2)(25) | ||||||||||||
| First lien senior secured loan ($6,250 par due 12/2017) | 8.75% (Libor + 7.25%/Q) | 12/11/2012 | 6,250 | 6,250 | (2)(25) | ||||||||||||||
| First lien senior secured loan ($15,700 par due 12/2017) | 8.75% (Libor + 7.25%/Q) | 12/11/2012 | 15,700 | 15,700 | (2)(25) | ||||||||||||||
| First lien senior secured loan ($25,000 par due 12/2017) | 8.75% (Libor + 7.25%/Q) | 12/11/2012 | 25,000 | 25,000 | (2)(25) | ||||||||||||||
| Common units (3,000,000 units) | 1/5/2011 | 3,000 | 2,238 | (2) | |||||||||||||||
| Warrants to purchase up to 7.73% of common units | 6/19/2008 | 100 | 4,464 | (2) | |||||||||||||||
| | | | | | | | | | | | | | | | | | | | |
| 52,550 | 56,152 | ||||||||||||||||||
| Performance Food Group, Inc. and Wellspring Distribution Corp | Food service distributor | Second lien senior secured loan ($24,328 par due 11/2019) | 6.25% (Libor + 5.25%/M) | 5/14/2013 | 24,234 | 24,084 | (2)(25) | ||||||||||||
| Class A non-voting common stock (1,366,120 shares) | 5/3/2008 | 6,303 | 8,507 | (2) | |||||||||||||||
| | | | | | | | | | | | | | | | | | | | |
| 30,537 | 32,591 | ||||||||||||||||||
| Restaurant Holding Company, LLC | Fast food restaurant operator | First lien senior secured loan ($37,312 par due 2/2019) | 8.75% (Libor + 7.75%/M) | 3/13/2014 | 36,998 | 34,327 | (2)(25) | ||||||||||||
F-19
Company(1)
|
Business Description | Investment | Interest(5)(11) | Acquisition Date |
Amortized Cost |
Fair Value |
Percentage of Net Assets |
||||||||||||
|---|---|---|---|---|---|---|---|---|---|---|---|---|---|---|---|---|---|---|---|
| S.B. Restaurant Company | Restaurant owner and operator | Preferred stock (46,690 shares) | 4/1/2010 | — | — | (2) | |||||||||||||
| Warrants to purchase up to 257,429 shares of common stock | 4/1/2010 | — | — | (2) | |||||||||||||||
| | | | | | | | | | | | | | | | | | | | |
| — | — | ||||||||||||||||||
| | | | | | | | | | | | | | | | | | | | |
| 339,687 | 329,720 | 6.24 | % | ||||||||||||||||
| | | | | | | | | | | | | | | | | | | | |
| Manufacturing | |||||||||||||||||||
| Cambrios Technologies Corporation | Nanotechnology-based solutions for electronic devices and computers | First lien senior secured loan ($1,212 par due 8/2015) | 12.00% | 8/7/2012 | 1,212 | 1,212 | (2) | ||||||||||||
| Warrants to purchase up to 400,000 shares of Series D-4 convertible preferred stock | 8/7/2012 | — | 13 | (2) | |||||||||||||||
| | | | | | | | | | | | | | | | | | | | |
| 1,212 | 1,225 | ||||||||||||||||||
| Component Hardware Group, Inc. | Commercial equipment | First lien senior secured revolving loan ($1,867 par due 7/2019) | 5.50% (Libor + 4.50%/M) | 7/1/2013 | 1,867 | 1,867 | (2)(25) | ||||||||||||
| First lien senior secured loan ($6,838 par due 7/2019) | 5.50% (Libor + 4.25%/Q) | 7/1/2013 | 6,838 | 6,838 | (4)(25) | ||||||||||||||
| First lien senior secured loan ($1,306 par due 7/2019) | 5.50% (Libor + 4.50%/M) | 7/1/2013 | 1,306 | 1,306 | (4)(25) | ||||||||||||||
| | | | | | | | | | | | | | | | | | | | |
| 10,011 | 10,011 | ||||||||||||||||||
| Harvey Tool Company, LLC and Harvey Tool Holding, LLC | Cutting tool provider to the metalworking industry | First lien senior secured loan ($4,863 par due 3/2020) | 5.75% (Libor + 4.75%/Q) | 3/28/2014 | 4,863 | 4,863 | (2)(25) | ||||||||||||
| First lien senior secured loan ($12 par due 3/2020) | 7.00% (Base Rate + 3.75%/Q) | 3/28/2014 | 12 | 12 | (2)(25) | ||||||||||||||
| Class A membership units (750 units) | 3/28/2014 | 750 | 958 | (2) | |||||||||||||||
| | | | | | | | | | | | | | | | | | | | |
| 5,625 | 5,833 | ||||||||||||||||||
| Ioxus, Inc. | Energy storage devices | First lien senior secured loan ($10,000 par due 11/2017) | 9.00% | 4/29/2014 | 9,674 | 9,300 | (2) | ||||||||||||
| Warrant to purchase up to 538,314 shares of Series C preferred stock | 4/29/2014 | — | — | (2) | |||||||||||||||
| | | | | | | | | | | | | | | | | | | | |
| 9,674 | 9,300 | ||||||||||||||||||
| Mac Lean-Fogg Company | Intelligent transportation systems products in the traffic and rail industries | Senior subordinated loan ($101,763 par due 10/2023) | 9.50% Cash, 1.50% PIK | 10/31/2013 | 101,763 | 101,763 | (2) | ||||||||||||
| MWI Holdings, Inc. | Engineered springs, fasteners, and other precision components | First lien senior secured loan ($28,274 par due 3/2019) | 9.38% (Libor + 8.13%/Q) | 6/15/2011 | 28,274 | 28,274 | (2)(25) | ||||||||||||
| First lien senior secured loan ($20,000 par due 3/2019) | 9.38% (Libor + 8.13%/Q) | 6/15/2011 | 20,000 | 20,000 | (4)(25) | ||||||||||||||
| | | | | | | | | | | | | | | | | | | | |
| 48,274 | 48,274 | ||||||||||||||||||
| Niagara Fiber Intermediate Corp. | Insoluble fiber filler products | First lien senior secured revolving loan ($1,881 par due 5/2018) | 6.75% (Libor + 5.50%/M) | 5/8/2014 | 1,865 | 1,806 | (2)(25) | ||||||||||||
| First lien senior secured loan ($15,464 par due 5/2018) | 6.75% (Libor + 5.50%/M) | 5/8/2014 | 15,333 | 14,845 | (2)(25) | ||||||||||||||
| | | | | | | | | | | | | | | | | | | | |
| 17,198 | 16,651 | ||||||||||||||||||
| Pelican Products, Inc. | Flashlights | Second lien senior secured loan ($40,000 par due 4/2021) | 9.25% (Libor + 8.25%/Q) | 4/11/2014 | 39,947 | 40,000 | (2)(25) | ||||||||||||
| Protective Industries, Inc. dba Caplugs | Plastic protection products | First lien senior secured loan ($987 par due 10/2019) | 6.25% (Libor + 5.25%/M) | 11/30/2012 | 987 | 987 | (2)(25) | ||||||||||||
| Preferred stock (2,379,361 shares) | 5/23/2011 | 1,298 | 7,468 | (2) | |||||||||||||||
| | | | | | | | | | | | | | | | | | | | |
| 2,285 | 8,455 | ||||||||||||||||||
F-20
Company(1)
|
Business Description | Investment | Interest(5)(11) | Acquisition Date |
Amortized Cost |
Fair Value |
Percentage of Net Assets |
||||||||||||
|---|---|---|---|---|---|---|---|---|---|---|---|---|---|---|---|---|---|---|---|
| Saw Mill PCG Partners LLC | Metal precision engineered components | Common units (1,000 units) | 1/30/2007 | 1,000 | — | (2) | |||||||||||||
| SI Holdings, Inc. | Elastomeric parts, mid-sized composite structures, and composite tooling | Common stock (1,500 shares) | 5/30/2014 | 1,500 | 1,905 | (2) | |||||||||||||
| TPTM Merger Corp. | Time temperature indicator products | First lien senior secured loan ($40,216 par due 9/2018) | 9.42% (Libor + 8.42%/Q) | 9/12/2013 | 40,216 | 40,216 | (2)(25) | ||||||||||||
| First lien senior secured loan ($409 par due 9/2018) | 4.75% (Libor + 3.75%/Q) | 9/12/2013 | 409 | 409 | (2)(25) | ||||||||||||||
| First lien senior secured loan ($9,950 par due 9/2018) | 4.75% (Libor + 3.75%/Q) | 9/12/2013 | 9,950 | 9,950 | (4)(25) | ||||||||||||||
| | | | | | | | | | | | | | | | | | | | |
| 50,575 | 50,575 | ||||||||||||||||||
| | | | | | | | | | | | | | | | | | | | |
| 289,064 | 293,992 | 5.56 | % | ||||||||||||||||
| | | | | | | | | | | | | | | | | | | | |
| Containers—Packaging | |||||||||||||||||||
| GS Pretium Holdings, Inc. | Manufacturer and supplier of high performance plastic containers | Common stock (500,000 shares) | 6/2/2014 | 500 | 397 | (2) | |||||||||||||
| ICSH, Inc. | Industrial container manufacturer, reconditioner and servicer | First lien senior secured revolving loan | 8/31/2011 | — | — | (2)(27) | |||||||||||||
| First lien senior secured loan ($25,669 par due 8/2016) | 6.75% (Libor + 5.75%/Q) | 8/31/2011 | 25,669 | 25,669 | (2)(25) | ||||||||||||||
| First lien senior secured loan ($23,716 par due 8/2016) | 6.75% (Libor + 5.75%/Q) | 8/31/2011 | 23,724 | 23,716 | (2)(25) | ||||||||||||||
| First lien senior secured loan ($53,515 par due 8/2016) | 6.75% (Libor + 5.75%/Q) | 8/31/2011 | 53,515 | 53,515 | (3)(25) | ||||||||||||||
| | | | | | | | | | | | | | | | | | | | |
| 102,908 | 102,900 | ||||||||||||||||||
| Microstar Logistics LLC, Microstar Global Asset Management LLC, and MStar Holding Corporation | Keg management solutions provider | Second lien senior secured loan ($142,500 par due 12/2018) | 8.50% (Libor + 7.50%/Q) | 12/14/2012 | 142,500 | 142,500 | (2)(25) | ||||||||||||
| Common stock (50,000 shares) | 12/14/2012 | 3,951 | 6,595 | (2) | |||||||||||||||
| | | | | | | | | | | | | | | | | | | | |
| 146,451 | 149,095 | ||||||||||||||||||
| | | | | | | | | | | | | | | | | | | | |
| 249,859 | 252,392 | 4.78 | % | ||||||||||||||||
| | | | | | | | | | | | | | | | | | | | |
| Oil and Gas | |||||||||||||||||||
| Lonestar Prospects, Ltd. | Sand proppant producer and distributor to the oil and natural gas industry | First lien senior secured loan ($75,187 par due 9/2018) | 8.50% (Libor + 6.50% Cash, 1.00% PIK/Q) | 9/18/2014 | 75,187 | 72,180 | (2)(25) | ||||||||||||
| Petroflow Energy Corporation | Oil and gas exploration and production company | First lien senior secured loan ($51,147 par due 7/2017) | 12.00% (Libor + 8.00% Cash, 3.00% PIK/Q) | 7/31/2014 | 50,165 | 47,055 | (2)(25) | ||||||||||||
| UL Holding Co., LLC and Universal Lubricants, LLC(6) | Manufacturer and distributor of re-refined oil products | Second lien senior secured loan ($11,136 par due 12/2016) | 4/30/2012 | 8,761 | 9,187 | (2)(24) | |||||||||||||
| Second lien senior secured loan ($47,233 par due 12/2016) | 4/30/2012 | 37,229 | 38,967 | (2)(24) | |||||||||||||||
| Second lien senior secured loan ($5,496 par due 12/2016) | 4/30/2012 | 4,294 | 4,534 | (2)(24) | |||||||||||||||
| Class A common units (533,351 units) | 6/17/2011 | 4,993 | — | (2) | |||||||||||||||
| Class B-5 common units (272,834 units) | 6/17/2011 | 2,491 | — | (2) | |||||||||||||||
| Class C common units (758,546 units) | 4/25/2008 | — | — | (2) | |||||||||||||||
F-21
Company(1)
|
Business Description | Investment | Interest(5)(11) | Acquisition Date |
Amortized Cost |
Fair Value |
Percentage of Net Assets |
||||||||||||
|---|---|---|---|---|---|---|---|---|---|---|---|---|---|---|---|---|---|---|---|
| Warrant to purchase up to 467,575 shares of Class A units | 5/2/2014 | — | — | (2) | |||||||||||||||
| Warrant to purchase up to 18,639 shares of Class B-1 units | 5/2/2014 | — | — | (2) | |||||||||||||||
| Warrant to purchase up to 37,277 shares of Class B-2 units | 5/2/2014 | — | — | (2) | |||||||||||||||
| Warrant to purchase up to 19,277 shares of Class B-3 units | 5/2/2014 | — | — | (2) | |||||||||||||||
| Warrant to purchase up to 52,263 shares of Class B-5 units | 5/2/2014 | — | — | (2) | |||||||||||||||
| Warrant to purchase up to 38,792 shares of Class B-6 units | 5/2/2014 | — | — | (2) | |||||||||||||||
| Warrant to purchase up to 680,649 shares of Class C units | 5/2/2014 | — | — | (2) | |||||||||||||||
| | | | | | | | | | | | | | | | | | | | |
| 57,768 | 52,688 | ||||||||||||||||||
| | | | | | | | | | | | | | | | | | | | |
| 183,120 | 171,923 | 3.25 | % | ||||||||||||||||
| | | | | | | | | | | | | | | | | | | | |
| Retail | |||||||||||||||||||
| Fulton Holdings Corp. | Airport restaurant operator | First lien senior secured loan ($43,000 par due 5/2018) | 8.50% | 5/10/2013 | 43,000 | 43,000 | (2)(14) | ||||||||||||
| First lien senior secured loan ($40,000 par due 5/2018) | 8.50% | 5/28/2010 | 40,000 | 40,000 | (3)(14) | ||||||||||||||
| Common stock (19,672 shares) | 5/28/2010 | 1,461 | 3,142 | (2) | |||||||||||||||
| | | | | | | | | | | | | | | | | | | | |
| 84,461 | 86,142 | ||||||||||||||||||
| Paper Source, Inc. and Pine Holdings, Inc. | Retailer of fine and artisanal paper products | First lien senior secured loan ($8,863 par due 9/2018) | 7.25% (Libor + 6.25%/Q) | 9/23/2013 | 8,863 | 8,863 | (2)(25) | ||||||||||||
| First lien senior secured loan ($9,900 par due 9/2018) | 7.25% (Libor + 6.25%/Q) | 9/23/2013 | 9,900 | 9,900 | (4)(25) | ||||||||||||||
| Class A common stock (36,364 shares) | 9/23/2013 | 6,000 | 6,871 | (2) | |||||||||||||||
| | | | | | | | | | | | | | | | | | | | |
| 24,763 | 25,634 | ||||||||||||||||||
| Things Remembered, Inc. and TRM Holdings Corporation | Personalized gifts retailer | First lien senior secured loan ($14,443 par due 5/2018) | 8.00% (Libor + 6.50%/Q) | 5/24/2012 | 14,443 | 12,999 | (4)(25) | ||||||||||||
| | | | | | | | | | | | | | | | | | | | |
| 123,667 | 124,775 | 2.36 | % | ||||||||||||||||
| | | | | | | | | | | | | | | | | | | | |
| Aerospace and Defense | |||||||||||||||||||
| Cadence Aerospace, LLC (fka PRV Aerospace, LLC) | Aerospace precision components manufacturer | First lien senior secured loan ($4,414 par due 5/2018) | 6.50% (Libor + 5.25%/Q) | 5/15/2012 | 4,387 | 4,414 | (4)(25) | ||||||||||||
| Second lien senior secured loan ($79,657 par due 5/2019) | 10.50% (Libor + 9.25%/Q) | 5/10/2012 | 79,657 | 76,471 | (2)(25) | ||||||||||||||
| | | | | | | | | | | | | | | | | | | | |
| 84,044 | 80,885 | ||||||||||||||||||
| ILC Industries, LLC | Designer and manufacturer of protective cases and technically advanced lighting systems | Second lien senior secured loan ($40,000 par due 7/2021) | 9.50% (Libor + 8.50%/Q) | 7/15/2014 | 40,000 | 40,000 | (2)(25) | ||||||||||||
| Wyle Laboratories, Inc. and Wyle Holdings, Inc. | Provider of specialized engineering, scientific and technical services | Senior preferred stock (775 shares) | 8.00% PIK | 1/17/2008 | 121 | 121 | (2) | ||||||||||||
| Common stock (1,885,195 shares) | 1/17/2008 | 2,291 | 2,341 | (2) | |||||||||||||||
| | | | | | | | | | | | | | | | | | | | |
| 2,412 | 2,462 | ||||||||||||||||||
| | | | | | | | | | | | | | | | | | | | |
| 126,456 | 123,347 | 2.33 | % | ||||||||||||||||
| | | | | | | | | | | | | | | | | | | | |
F-22
Company(1)
|
Business Description | Investment | Interest(5)(11) | Acquisition Date |
Amortized Cost |
Fair Value |
Percentage of Net Assets |
||||||||||||
|---|---|---|---|---|---|---|---|---|---|---|---|---|---|---|---|---|---|---|---|
| Commercial Real Estate Finance | |||||||||||||||||||
| 10th Street, LLC and New 10th Street, LLC(7) | Real estate holding company | First lien senior secured loan ($25,065 par due 11/2019) | 7.00% Cash, 1.00% PIK | 3/31/2014 | 25,065 | 25,065 | (2) | ||||||||||||
| Senior subordinated loan ($26,964 par due 11/2019) | 7.00% Cash, 1.00% PIK | 4/1/2010 | 26,964 | 26,964 | (2) | ||||||||||||||
| Member interest (10.00% interest) | 4/1/2010 | 594 | 50,926 | ||||||||||||||||
| Option (25,000 units) | 4/1/2010 | 25 | 25 | ||||||||||||||||
| | | | | | | | | | | | | | | | | | | | |
| 52,648 | 102,980 | ||||||||||||||||||
| Cleveland East Equity, LLC | Hotel operator | Real estate equity interests | 4/1/2010 | — | 3,544 | ||||||||||||||
| Commons R-3, LLC | Real estate developer | Real estate equity interests | 4/1/2010 | — | — | ||||||||||||||
| Crescent Hotels & Resorts, LLC and affiliates(7) | Hotel operator | Senior subordinated loan ($2,236 par due 9/2011) | 15.00% | 4/1/2010 | — | — | (2) | ||||||||||||
| Common equity interest | 4/1/2010 | — | — | ||||||||||||||||
| | | | | | | | | | | | | | | | | | | | |
| — | — | ||||||||||||||||||
| NPH, Inc. | Hotel property | Real estate equity interests | 4/1/2010 | 2,140 | 2,450 | ||||||||||||||
| | | | | | | | | | | | | | | | | | | | |
| 54,788 | 108,974 | 2.06 | % | ||||||||||||||||
| | | | | | | | | | | | | | | | | | | | |
| Automotive Services | |||||||||||||||||||
| CH Hold Corp. | Collision repair company | First lien senior secured loan ($17,661 par due 11/2019) | 5.50% (Libor + 4.75%/Q) | 7/25/2014 | 17,661 | 17,661 | (2)(25) | ||||||||||||
| ChargePoint, Inc. | Developer and operator of electric vehicle charging stations | First lien senior secured loan ($10,000 par due 1/2019) | 9.75% (Libor + 8.75%/M) | 12/24/2014 | 9,473 | 9,700 | (2)(25) | ||||||||||||
| Warrant to purchase up to 404,563 shares of Series E preferred stock | 12/24/2014 | 327 | 327 | (2) | |||||||||||||||
| | | | | | | | | | | | | | | | | | | | |
| 9,800 | 10,027 | ||||||||||||||||||
| Driven Brands, Inc. and Driven Holdings, LLC | Automotive aftermarket car care franchisor | First lien senior secured loan ($984 par due 3/2017) | 6.00% (Libor + 5.00%/Q) | 1/3/2014 | 984 | 984 | (2)(25) | ||||||||||||
| First lien senior secured loan ($8 par due 3/2017) | 7.25% (Base Rate + 4.00%/Q) | 1/3/2014 | 8 | 8 | (2)(25) | ||||||||||||||
| Preferred stock (247,500 units) | 12/16/2011 | 2,475 | 3,088 | (2) | |||||||||||||||
| Common stock (25,000 units) | 12/16/2011 | 25 | 1,492 | (2) | |||||||||||||||
| | | | | | | | | | | | | | | | | | | | |
| 3,492 | 5,572 | ||||||||||||||||||
| Eckler Industries, Inc. | Restoration parts and accessories provider for classic automobiles | First lien senior secured revolving loan ($4,800 par due 7/2017) | 8.25% (Base Rate + 5.00%/Q) | 7/12/2012 | 4,800 | 4,560 | (2)(25) | ||||||||||||
| First lien senior secured loan ($7,976 par due 7/2017) | 7.25% (Libor + 6.00%/Q) | 7/12/2012 | 7,976 | 7,577 | (2)(25) | ||||||||||||||
| First lien senior secured loan ($29,962 par due 7/2017) | 7.25% (Libor + 6.00%/Q) | 7/12/2012 | 29,962 | 28,464 | (3)(25) | ||||||||||||||
| Series A preferred stock (1,800 shares) | 7/12/2012 | 1,800 | 261 | (2) | |||||||||||||||
| Common stock (20,000 shares) | 7/12/2012 | 200 | — | (2) | |||||||||||||||
| | | | | | | | | | | | | | | | | | | | |
| 44,738 | 40,862 | ||||||||||||||||||
| EcoMotors, Inc. | Engine developer | First lien senior secured loan ($3,788 par due 10/2016) | 10.83% | 12/28/2012 | 3,726 | 3,788 | (2) | ||||||||||||
| First lien senior secured loan ($4,545 par due 6/2017) | 10.83% | 12/28/2012 | 4,449 | 4,545 | (2) | ||||||||||||||
| First lien senior secured loan ($3,146 par due 7/2016) | 10.13% | 12/28/2012 | 3,103 | 3,146 | (2) | ||||||||||||||
| Warrant to purchase up to 321,888 shares of Series C preferred stock | 12/28/2012 | — | 43 | (2) | |||||||||||||||
| | | | | | | | | | | | | | | | | | | | |
| 11,278 | 11,522 | ||||||||||||||||||
F-23
Company(1)
|
Business Description | Investment | Interest(5)(11) | Acquisition Date |
Amortized Cost |
Fair Value |
Percentage of Net Assets |
||||||||||||
|---|---|---|---|---|---|---|---|---|---|---|---|---|---|---|---|---|---|---|---|
| SK SPV IV, LLC | Collision repair site operators | Series A common units (12,500 units) | 8/18/2014 | 625 | 1,987 | (2) | |||||||||||||
| Series B common units (12,500 units) | 8/18/2014 | 625 | 1,987 | (2) | |||||||||||||||
| | | | | | | | | | | | | | | | | | | | |
| 1,250 | 3,974 | ||||||||||||||||||
| TA THI Buyer, Inc. and TA THI Parent, Inc. | Collision repair company | Series A preferred stock (50,000 shares) | 7/28/2014 | 5,000 | 5,607 | (2) | |||||||||||||
| | | | | | | | | | | | | | | | | | | | |
| 93,219 | 95,225 | 1.80 | % | ||||||||||||||||
| | | | | | | | | | | | | | | | | | | | |
| Chemicals | |||||||||||||||||||
| Genomatica, Inc. | Developer of a biotechnology platform for the production of chemical products | Warrant to purchase 322,422 shares of Series D preferred stock | 3/28/2013 | — | 6 | (2) | |||||||||||||
| K2 Pure Solutions Nocal, L.P. | Chemical producer | First lien senior secured revolving loan ($2,256 par due 8/2019) | 8.13% (Libor + 7.13%/M) | 8/19/2013 | 2,256 | 2,233 | (2)(25) | ||||||||||||
| First lien senior secured loan ($21,231 par due 8/2019) | 7.00% (Libor + 6.00%/M) | 8/19/2013 | 21,231 | 21,019 | (2)(25) | ||||||||||||||
| First lien senior secured loan ($39,500 par due 8/2019) | 7.00% (Libor + 6.00%/M) | 8/19/2013 | 39,500 | 39,105 | (3)(25) | ||||||||||||||
| First lien senior secured loan ($19,750 par due 8/2019) | 7.00% (Libor + 6.00%/M) | 8/19/2013 | 19,750 | 19,552 | (4)(25) | ||||||||||||||
| | | | | | | | | | | | | | | | | | | | |
| 82,737 | 81,909 | ||||||||||||||||||
| Kinestral Technologies, Inc. | Designer of adaptive, dynamic glass for the commercial and residential markets | First lien senior secured loan ($6,500 par due 8/2017) | 10.00% | 4/22/2014 | 6,390 | 6,500 | (2) | ||||||||||||
| Warrant to purchase up to 325,000 shares of Series A preferred stock | 4/22/2014 | 73 | 73 | (2) | |||||||||||||||
| | | | | | | | | | | | | | | | | | | | |
| 6,463 | 6,573 | ||||||||||||||||||
| Liquid Light, Inc. | Developer and licensor of process technology for the conversion of carbon dioxide into major chemicals | First lien senior secured loan ($3,000 par due 11/2017) | 10.00% | 8/13/2014 | 2,931 | 2,970 | (2) | ||||||||||||
| Warrant to purchase up to 86,009 shares of Series B preferred stock | 8/13/2014 | 77 | 74 | (2) | |||||||||||||||
| | | | | | | | | | | | | | | | | | | | |
| 3,008 | 3,044 | ||||||||||||||||||
| | | | | | | | | | | | | | | | | | | | |
| 92,208 | 91,532 | 1.73 | % | ||||||||||||||||
| | | | | | | | | | | | | | | | | | | | |
| Environmental Services | |||||||||||||||||||
| RE Community Holdings II, Inc., Pegasus Community Energy, LLC., and MPH Energy Holdings, LP | Operator of municipal recycling facilities | Preferred stock (1,000 shares) | 3/1/2011 | 8,839 | — | (2) | |||||||||||||
| Limited partnership interest (3.13% interest) | 1/8/2014 | — | — | (2) | |||||||||||||||
| | | | | | | | | | | | | | | | | | | | |
| 8,839 | — | ||||||||||||||||||
| Waste Pro USA, Inc | Waste management services | Second lien senior secured loan ($77,500 par due 10/2020) | 8.50% (Libor + 7.50%/Q) | 10/15/2014 | 77,500 | 77,500 | (2)(25) | ||||||||||||
| | | | | | | | | | | | | | | | | | | | |
| 86,339 | 77,500 | 1.47 | % | ||||||||||||||||
| | | | | | | | | | | | | | | | | | | | |
| Hotel Services | |||||||||||||||||||
| Castle Management Borrower LLC | Hotel operator | Second lien senior secured loan ($55,000 par due 3/2021) | 11.00% (Libor + 10.00%/Q) | 10/17/2014 | 55,000 | 55,000 | (2)(25) | ||||||||||||
| | | | | | | | | | | | | | | | | | | | |
| 55,000 | 55,000 | 1.04 | % | ||||||||||||||||
| | | | | | | | | | | | | | | | | | | | |
F-24
Company(1)
|
Business Description | Investment | Interest(5)(11) | Acquisition Date |
Amortized Cost |
Fair Value |
Percentage of Net Assets |
||||||||||||
|---|---|---|---|---|---|---|---|---|---|---|---|---|---|---|---|---|---|---|---|
| Health Clubs | |||||||||||||||||||
| Athletic Club Holdings, Inc. | Premier health club operator | First lien senior secured loan ($41,000 par due 10/2020) | 9.50% (Libor + 8.50%/M) | 10/11/2007 | 41,000 | 41,000 | (2)(25) | ||||||||||||
| CFW Co-Invest, L.P., NCP Curves, L.P. and Curves International Holdings, Inc. | Health club franchisor | Limited partnership interest (4,152,165 shares) | 7/31/2012 | 4,152 | 3,418 | (2) | |||||||||||||
| Limited partnership interest (2,218,235 shares) | 7/31/2012 | 2,218 | 1,826 | (2)(8) | |||||||||||||||
| Common stock (1,680 shares) | 11/12/2014 | — | — | (2)(8) | |||||||||||||||
| | | | | | | | | | | | | | | | | | | | |
| 6,370 | 5,244 | ||||||||||||||||||
| | | | | | | | | | | | | | | | | | | | |
| 47,370 | 46,244 | 0.88 | % | ||||||||||||||||
| | | | | | | | | | | | | | | | | | | | |
| Printing, Publishing and Media | |||||||||||||||||||
| Batanga, Inc. | Independent digital media company | First lien senior secured revolving loan ($4,000 par due 12/2015) | 10.00% | 10/31/2012 | 4,000 | 4,000 | (2) | ||||||||||||
| First lien senior secured loan ($6,590 par due 6/2017) | 10.60% | 10/31/2012 | 6,590 | 6,650 | (2) | ||||||||||||||
| | | | | | | | | | | | | | | | | | | | |
| 10,590 | 10,650 | ||||||||||||||||||
| Earthcolor Group, LLC | Printing management services | Limited liability company interests (9.30%) | 5/18/2012 | — | — | ||||||||||||||
| Summit Business Media Parent Holding Company LLC | Business media consulting services | Limited liability company membership interest (22.99% interest) | 5/20/2011 | — | 705 | (2) | |||||||||||||
| The Teaching Company, LLC and The Teaching Company Holdings, Inc. | Education publications provider | First lien senior secured loan ($20,454 par due 3/2017) | 9.00% (Libor + 7.50%/Q) | 3/6/2011 | 20,454 | 20,249 | (2)(25) | ||||||||||||
| First lien senior secured loan ($9,500 par due 3/2017) | 9.00% (Libor + 7.50%/Q) | 3/6/2011 | 9,500 | 9,405 | (4)(25) | ||||||||||||||
| Preferred stock (10,663 shares) | 9/29/2006 | 1,066 | 2,827 | (2) | |||||||||||||||
| Common stock (15,393 shares) | 9/29/2006 | 3 | 7 | (2) | |||||||||||||||
| | | | | | | | | | | | | | | | | | | | |
| 31,023 | 32,488 | ||||||||||||||||||
| | | | | | | | | | | | | | | | | | | | |
| 41,613 | 43,843 | 0.83 | % | ||||||||||||||||
| | | | | | | | | | | | | | | | | | | | |
| Wholesale Distribution | |||||||||||||||||||
| Flow Solutions Holdings, Inc. | Distributor of high value fluid handling, filtration and flow control products | Second lien senior secured loan ($29,500 par due 10/2018) | 11.25% (Base Rate + 8.00%/Q) | 12/16/2014 | 29,500 | 29,500 | (2)(25) | ||||||||||||
| | | | | | | | | | | | | | | | | | | | |
| 29,500 | 29,500 | 0.56 | % | ||||||||||||||||
| | | | | | | | | | | | | | | | | | | | |
| Telecommunications | |||||||||||||||||||
| American Broadband Communications, LLC, American Broadband Holding Company, and Cameron Holdings of NC, Inc. | Broadband communication services | Warrants to purchase up to 208 shares | 11/7/2007 | — | 8,423 | ||||||||||||||
| Warrants to purchase up to 200 shares | 9/1/2010 | — | 4,457 | ||||||||||||||||
| | | | | | | | | | | | | | | | | | | | |
| — | 12,880 | ||||||||||||||||||
| Quantance, Inc. | Designer of semiconductor products to the mobile wireless market | First lien senior secured loan ($2,831 par due 9/2016) | 10.25% | 8/23/2013 | 2,782 | 2,831 | (2) | ||||||||||||
| Warrant to purchase up to 130,432 shares of Series D preferred stock | 8/23/2013 | 74 | 102 | (2) | |||||||||||||||
| | | | | | | | | | | | | | | | | | | | |
| 2,856 | 2,933 | ||||||||||||||||||
| Startec Equity, LLC(7) | Communication services | Member interest | 4/1/2010 | — | — | ||||||||||||||
F-25
Company(1)
|
Business Description | Investment | Interest(5)(11) | Acquisition Date |
Amortized Cost |
Fair Value |
Percentage of Net Assets |
||||||||||||
|---|---|---|---|---|---|---|---|---|---|---|---|---|---|---|---|---|---|---|---|
| Wilcon Holdings LLC | Communications infrastructure provider | Class A common stock (2,000,000 shares) | 12/13/2013 | 1,829 | 2,135 | ||||||||||||||
| | | | | | | | | | | | | | | | | | | | |
| 4,685 | 17,948 | 0.34 | % | ||||||||||||||||
| | | | | | | | | | | | | | | | | | | | |
| Computers and Electornics | |||||||||||||||||||
| Powervation Inc. and Powervation Limited(8) | Semiconductor company focused on power control and management | First lien senior secured loan ($3,000 par due 11/2017) | 9.04% | 11/13/2014 | 2,883 | 3,000 | (2) | ||||||||||||
| Warrant to purchase up to 11,531 shares of Series D preferred stock | 11/13/2014 | — | 11 | (2) | |||||||||||||||
| | | | | | | | | | | | | | | | | | | | |
| 2,883 | 3,011 | ||||||||||||||||||
| Zemax, LLC | Provider of optical illumination design software to design engineers | First lien senior secured loan ($2,992 par due 10/2019) | 6.50% (Libor + 5.50%/Q) | 10/23/2014 | 2,992 | 2,992 | (2)(25) | ||||||||||||
| | | | | | | | | | | | | | | | | | | | |
| 5,875 | 6,003 | 0.11 | % | ||||||||||||||||
| | | | | | | | | | | | | | | | | | | | |
| Food and Beverage | |||||||||||||||||||
| Distant Lands Trading Co. | Coffee manufacturer | Class A common stock (1,294 shares) | 4/1/2010 | 980 | 706 | (2) | |||||||||||||
| Class A-1 common stock (2,157 shares) | 4/1/2010 | — | — | (2) | |||||||||||||||
| | | | | | | | | | | | | | | | | | | | |
| 980 | 706 | ||||||||||||||||||
| | | | | | | | | | | | | | | | | | | | |
| 980 | 706 | 0.01 | % | ||||||||||||||||
| | | | | | | | | | | | | | | | | | | | |
| 8,875,095 | 9,028,379 | 170.87 | % | ||||||||||||||||
| | | | | | | | | | | | | | | | | | | | |
| | | | | | | | | | | | | | | | | | | | |
| | | | | | | | | | | | | | | | | | | | |
- (1)
- Other
than the Company's investments listed in footnote 7 below (subject to the limitations set forth therein), the Company does not "Control" any of its
portfolio companies, for the purposes of the Investment Company Act of 1940, as amended (together with the rules and regulations promulgated thereunder, the "Investment Company Act"). In general,
under the Investment Company Act, the Company would "Control" a portfolio company if the Company owned more than 25% of its outstanding voting securities (i.e., securities with the right to
elect directors) and/or had the power to exercise control over the management or policies of such portfolio company. All of the Company's portfolio company investments, which as of December 31,
2014 represented 171% of the Company's net assets or 95% of the Company's total assets, are subject to legal restrictions on sales.
- (2)
- These
assets are pledged as collateral for the Revolving Credit Facility and, as a result, are not directly available to the creditors of the Company to
satisfy any obligations of the Company other than the Company's obligations under the Revolving Credit Facility (see Note 5 to the consolidated financial statements).
- (3)
- These
assets are owned by the Company's consolidated subsidiary Ares Capital CP Funding LLC ("Ares Capital CP"), are pledged as collateral for the
Revolving Funding Facility and, as a result, are not directly available to the creditors of the Company to satisfy any obligations of the Company other than Ares Capital CP's obligations under the
Revolving Funding Facility (see Note 5 to the consolidated financial statements).
- (4)
- These
assets are owned by the Company's consolidated subsidiary Ares Capital JB Funding LLC ("ACJB"), are pledged as collateral for the SMBC Funding
Facility and, as a result, are not directly available to the creditors of the Company to satisfy any obligations of the Company other than ACJB's obligations under the SMBC Funding Facility (see
Note 5 to the consolidated financial statements).
- (5)
- Investments without an interest rate are non-income producing.
- (6)
- As defined in the Investment Company Act, the Company is deemed to be an "Affiliated Person" and "Control" this portfolio company because it owns 5% or more of the portfolio company's outstanding voting securities or it has the power to exercise control over the management or policies of such portfolio company (including
F-26
through a management agreement). Transactions during the year ended December 31, 2014 in which the issuer was an Affiliated Person (but not a portfolio company that the Company is deemed to Control) are as follows:
Company
|
Purchases (cost) |
Redemptions (cost) |
Sales (cost) |
Interest income |
Capital structuring service fees |
Dividend income |
Other income |
Net realized gains (losses) |
Net unrealized gains (losses) |
|||||||||||||||||||
|---|---|---|---|---|---|---|---|---|---|---|---|---|---|---|---|---|---|---|---|---|---|---|---|---|---|---|---|---|
Apple & Eve, LLC and US Juice Partners, LLC |
$ | — | $ | — | $ | 5,000 | $ | — | $ | — | $ | — | $ | — | $ | 4,344 | $ | (205 | ) | |||||||||
Campus Management Corp. and Campus Management Acquisition Corp. |
$ | — | $ | — | $ | — | $ | — | $ | — | $ | — | $ | — | $ | — | $ | 6,824 | ||||||||||
Cast & Crew Payroll, LLC and Centerstage Co-Investors, L.L.C. |
$ | 87,089 | $ | 27,037 | $ | 5,000 | $ | 5,590 | $ | 1,290 | $ | 1,682 | $ | 511 | $ | — | $ | 8,614 | ||||||||||
Crown Health Care Laundry Services, Inc. and Crown Laundry Holdings, LLC |
$ | 28,550 | $ | 784 | $ | — | $ | 1,684 | $ | 590 | $ | — | $ | 120 | $ | — | $ | 276 | ||||||||||
CT Technologies Intermediate Holdings, Inc. and CT Technologies Holdings LLC |
$ | 702 | $ | 702 | $ | 2,543 | $ | 3 | $ | — | $ | — | $ | 33 | $ | 6,736 | $ | (2,113 | ) | |||||||||
The Dwyer Group |
$ | 14,418 | $ | 46,377 | $ | — | $ | 2,772 | $ | 60 | $ | 2,279 | $ | 179 | $ | 21,141 | $ | (11,791 | ) | |||||||||
ELC Acquisition Corp. and ELC Holdings Corporation |
$ | — | $ | — | $ | 11,737 | $ | — | $ | — | $ | 1,448 | $ | — | $ | 5,938 | $ | (1,345 | ) | |||||||||
Insight Pharmaceuticals Corporation |
$ | — | $ | 19,187 | $ | 12,070 | $ | 1,765 | $ | — | $ | — | $ | — | $ | 33,076 | $ | (2,544 | ) | |||||||||
Investor Group Services, LLC |
$ | — | $ | — | $ | — | $ | — | $ | — | $ | 199 | $ | — | $ | 90 | $ | (8 | ) | |||||||||
Multi-Ad Services, Inc. |
$ | — | $ | — | $ | — | $ | — | $ | — | $ | — | $ | — | $ | — | $ | 364 | ||||||||||
Soteria Imaging Services, LLC |
$ | — | $ | — | $ | — | $ | — | $ | — | $ | — | $ | — | $ | 60 | $ | — | ||||||||||
VSS-Tranzact Holdings, LLC |
$ | — | $ | — | $ | 10,204 | $ | — | $ | — | $ | — | $ | — | $ | 5,057 | $ | 4,967 | ||||||||||
UL Holding Co., LLC |
$ | — | $ | 4,000 | $ | — | $ | — | $ | — | $ | — | $ | — | $ | — | $ | 15,041 | ||||||||||
- (7)
- As defined in the Investment Company Act, the Company is deemed to be both an "Affiliated Person" and "Control" this portfolio company because it owns more than 25% of the portfolio company's outstanding voting securities or it has the power to exercise control over the management or policies of such portfolio company (including through a management agreement). Transactions during the year ended December 31, 2014 in which the issuer was both an Affiliated Person and a portfolio company that the Company is deemed to Control are as follows:
Company
|
Purchases (cost) |
Redemptions (cost) |
Sales (cost) |
Interest income |
Capital structuring service fees |
Dividend income |
Other income |
Net realized gains (losses) |
Net unrealized gains (losses) |
|||||||||||||||||||
|---|---|---|---|---|---|---|---|---|---|---|---|---|---|---|---|---|---|---|---|---|---|---|---|---|---|---|---|---|
10th Street, LLC and New 10th Street, LLC |
$ | 24,895 | $ | — | $ | — | $ | 4,002 | $ | 455 | $ | — | $ | — | $ | — | $ | 43,669 | ||||||||||
AllBridge Financial, LLC |
$ | — | $ | 3,937 | $ | — | $ | — | $ | — | $ | 382 | $ | — | $ | — | $ | 23 | ||||||||||
Callidus Capital Corporation |
$ | — | $ | — | $ | — | $ | — | $ | — | $ | — | $ | — | $ | — | $ | (11 | ) | |||||||||
Ciena Capital LLC |
$ | — | $ | 14,000 | $ | — | $ | 3,769 | $ | — | $ | — | $ | — | $ | — | $ | 12,981 | ||||||||||
Citipostal Inc. |
$ | — | $ | 70,270 | $ | — | $ | 60 | $ | — | $ | — | $ | 17 | $ | (21,047 | ) | $ | 25,270 | |||||||||
Crescent Hotels & Resorts, LLC and affiliates |
$ | — | $ | — | $ | — | $ | 151 | $ | — | $ | 42 | $ | — | $ | — | $ | — | ||||||||||
HCI Equity, LLC |
$ | — | $ | 112 | $ | — | $ | — | $ | — | $ | 89 | $ | — | $ | — | $ | 175 | ||||||||||
HCP Acquisition Holdings, LLC |
$ | — | $ | — | $ | — | $ | — | $ | — | $ | — | $ | — | $ | — | $ | — | ||||||||||
Hot Light Brands, Inc. |
$ | — | $ | 90 | $ | — | $ | — | $ | — | $ | — | $ | — | $ | 164 | $ | (163 | ) | |||||||||
Ivy Hill Asset Management, L.P. |
$ | — | $ | — | $ | — | $ | — | $ | — | $ | 50,000 | $ | — | $ | — | $ | (21,029 | ) | |||||||||
MVL Group, Inc. |
$ | — | $ | 30,040 | $ | — | $ | — | $ | — | $ | — | $ | — | $ | (27,709 | ) | $ | 27,781 | |||||||||
Orion Foods, LLC |
$ | 3,450 | $ | 56,342 | $ | — | $ | 4,143 | $ | — | $ | — | $ | 646 | $ | 1,624 | $ | (6,743 | ) | |||||||||
Pillar Processing LLC, PHL Investors, Inc., and PHL Holding Co. |
$ | — | $ | 9,844 | $ | — | $ | — | $ | — | $ | — | $ | — | $ | (6,592 | ) | $ | 6,522 | |||||||||
Senior Secured Loan Fund LLC* |
$ | 463,626 | $ | 174,325 | $ | — | $ | 275,036 | $ | 38,997 | $ | — | $ | 30,669 | $ | — | $ | 4,340 | ||||||||||
Startec Equity, LLC |
$ | — | $ | — | $ | — | $ | — | $ | — | $ | — | $ | — | $ | — | $ | — | ||||||||||
The Step2 Company, LLC |
$ | 4,500 | $ | — | $ | — | $ | 3,058 | $ | — | $ | — | $ | — | $ | — | $ | (17,127 | ) | |||||||||
The Thymes, LLC |
$ | — | $ | 840 | $ | 4,014 | $ | — | $ | — | $ | 158 | $ | — | $ | 9,753 | $ | (6,212 | ) | |||||||||
- *
- Together
with GE Global Sponsor Finance LLC and General Electric Capital Corporation (together, "GE"), the Company co-invests through the Senior
Secured Loan Fund LLC d/b/a the "Senior Secured Loan Program" (the "SSLP"). The SSLP is capitalized as transactions are completed and all portfolio decisions and generally all other decisions
in respect of the SSLP must be approved by an investment committee of the SSLP consisting of representatives of the Company and GE (with approval from a representative of each required); therefore,
although the Company owns more than 25% of the voting securities of the SSLP, the Company does not believe that it has control over the SSLP (for purposes of the Investment Company Act or otherwise)
because, among other things, these "voting securities" do not afford the Company the right to elect directors of the SSLP or any other special rights (see Note 4 to the consolidated financial
statements).
- (8)
- Non-U.S.
company or principal place of business outside the U.S. and as a result is not a qualifying asset under Section 55(a) of the Investment
Company Act. Under the Investment Company Act, the Company may not acquire any non-qualifying asset unless, at the time such acquisition is made, qualifying assets represent at least 70% of the
Company's total assets.
- (9)
- Excepted
from the definition of investment company under Section 3(c) of the Investment Company Act and as a result is not a qualifying asset under
Section 55(a) of the Investment Company Act. Under the Investment Company Act, the Company may not acquire any non-qualifying asset unless, at the time such acquisition is made, qualifying
assets represent at least 70% of the Company's total assets.
- (10)
- In
the first quarter of 2011, the staff of the Securities and Exchange Commission (the "Staff") informally communicated to certain business development
companies ("BDCs") the Staff's belief that certain entities, which would be classified as an "investment company" under the Investment Company Act but for the exception from the definition of
"investment company" set forth in Rule 3a-7 promulgated under the Investment Company Act, could not be treated as eligible portfolio companies (as defined in Section 2(a)(46) under
Investment Company Act) (i.e. not eligible to included in a BDC's 70% "qualifying assets" basket). Subsequently, in August 2011 the Securities and Exchange Commission issued a concept release
(the "Concept Release") which stated that "[a]s a general matter, the Commission presently does not believe that Rule 3a-7 issuers are the type of small, developing and
financially troubled businesses in which the U.S. Congress intended BDCs primarily to invest" and requested comment on whether or not a 3a-7 issuer should be considered an "eligible portfolio
company". The Company provided a comment letter in respect of the Concept Release and continues to believe that the language of Section 2(a)(46) of the Investment Company Act permits a BDC to
treat as "eligible portfolio companies" entities that rely on the 3a-7 exception. However, given the current uncertainty in this area (including the language in the Concept Release) and subsequent
discussions with the Staff, the Company has, solely for purposes of calculating the composition of its portfolio pursuant to Section 55(a) of the Investment Company Act, identified such
entities, which include the SSLP, as "non-qualifying assets" should the Staff ultimately disagree with the Company's position.
- (11)
- Variable rate loans to the Company's portfolio companies bear interest at a rate that may be determined by reference to either LIBOR or an alternate base rate (commonly based on the Federal Funds Rate or the Prime Rate), at the borrower's option, which reset annually (A), semi-annually (S), quarterly (Q), bi-monthly (B), monthly (M) or daily (D). For each such loan, the Company has provided the interest rate in effect on the date presented.
F-27
- (12)
- In
addition to the interest earned based on the stated interest rate of this security, the Company is entitled to receive an additional interest amount of
2.00% on $87 million aggregate principal amount of a "first out" tranche of the portfolio company's senior term debt previously syndicated by the Company into "first out" and "last out"
tranches, whereby the "first out" tranche will have priority as to the "last out" tranche with respect to payments of principal, interest and any other amounts due thereunder.
- (13)
- In
addition to the interest earned based on the stated interest rate of this security, the Company is entitled to receive an additional interest amount of
3.00% on $68 million aggregate principal amount of a "first out" tranche of the portfolio company's senior term debt previously syndicated by the Company into "first out" and "last out"
tranches, whereby the "first out" tranche will have priority as to the "last out" tranche with respect to payments of principal, interest and any other amounts due thereunder.
- (14)
- In
addition to the interest earned based on the stated interest rate of this security, the Company is entitled to receive an additional interest amount of
6.00% on $11 million aggregate principal amount of a "first out" tranche of the portfolio company's senior term debt previously syndicated by the Company into "first out" and "last out"
tranches, whereby the "first out" tranche will have priority as to the "last out" tranche with respect to payments of principal, interest and any other amounts due thereunder.
- (15)
- In
addition to the interest earned based on the stated interest rate of this security, the Company is entitled to receive an additional interest amount of
3.25% on $53 million aggregate principal amount of a "first out" tranche of the portfolio company's senior term debt previously syndicated by the Company into "first out" and "last out"
tranches, whereby the "first out" tranche will have priority as to the "last out" tranche with respect to payments of principal, interest and any other amounts due thereunder.
- (16)
- In
addition to the interest earned based on the stated interest rate of this security, the Company is entitled to receive an additional interest amount of
3.00% on $48 million aggregate principal amount of a "first out" tranche of the portfolio company's senior term debt previously syndicated by the Company into "first out" and "last out"
tranches, whereby the "first out" tranche will have priority as to the "last out" tranche with respect to payments of principal, interest and any other amounts due thereunder.
- (17)
- In
addition to the interest earned based on the stated interest rate of this security, the Company is entitled to receive an additional interest amount of
3.13% on $54 million aggregate principal amount of a "first out" tranche of the portfolio company's senior term debt previously syndicated by the Company into "first out" and "last out"
tranches, whereby the "first out" tranche will have priority as to the "last out" tranche with respect to payments of principal, interest and any other amounts due thereunder.
- (18)
- In
addition to the interest earned based on the stated interest rate of this security, the Company is entitled to receive an additional interest amount of
1.13% on $16 million aggregate principal amount of a "first out" tranche of the portfolio company's first lien senior secured loans, whereby the "first out" tranche will have priority as to the
"last out" tranche with respect to payments of principal, interest and any other amounts due thereunder.
- (19)
- In
addition to the interest earned based on the stated interest rate of this security, the Company is entitled to receive an additional interest amount of
3.75% on $24 million aggregate principal amount of a "first out" tranche of the portfolio company's first lien senior secured loans, whereby the "first out" tranche will have priority as to the
"last out" tranche with respect to payments of principal, interest and any other amounts due thereunder.
- (20)
- In
addition to the interest earned based on the stated interest rate of this security, the Company is entitled to receive an additional interest amount of
5.00% on $21 million aggregate principal amount of a "first out" tranche of the portfolio company's first lien senior secured loans, whereby the "first out" tranche will have priority as to the
"last out" tranche with respect to payments of principal, interest and any other amounts due thereunder.
- (21)
- In
addition to the interest earned based on the stated interest rate of this security, the Company is entitled to receive an additional interest amount of
2.00% on $87 million aggregate principal amount of a "first out" tranche of the portfolio company's first lien senior secured loans, whereby the "first out" tranche will have priority as to the
"last out" tranche with respect to payments of principal, interest and any other amounts due thereunder.
- (22)
- In
addition to the interest earned based on the stated interest rate of this security, the Company is entitled to receive an additional interest amount of
2.55% on $28 million aggregate principal amount of a "first out" tranche of the portfolio company's first lien senior secured loans, whereby the "first out" tranche will have priority as to the
"last out" tranche with respect to payments of principal, interest and any other amounts due thereunder.
- (23)
- The
Company is entitled to receive a fixed fee upon the occurrence of certain events as defined in the credit agreement governing the Company's debt
investment in the portfolio company. The fair value of such fee is included in the fair value of the debt investment.
- (24)
- Loan
was on non-accrual status as of December 31, 2014.
- (25)
- Loan
includes interest rate floor feature.
- (26)
- In
addition to the interest earned based on the stated contractual interest rate of this security, the certificates entitle the holders thereof to receive
a portion of the excess cash flow from the SSLP's loan portfolio, which may result in a return to the Company greater than the contractual stated interest rate.
- (27)
- As
of December 31, 2014, no amounts were funded by the Company under this first lien senior secured revolving loan; however, there were letters of
credit issued and outstanding through a financial intermediary under the loan. See Note 7 to the consolidated financial statements for further information on letters of credit commitments
related to certain portfolio companies.
- (28)
- As
of December 31, 2014, in addition to the amounts funded by the Company under this first lien senior secured revolving loan, there were also
letters of credit issued and outstanding through a financial intermediary under the loan. See Note 7 to the consolidated financial statements for further information on letters of credit
commitments related to certain portfolio companies.
- (29)
- As of December 31, 2014, no amounts were funded by the Company under this letter of credit facility; however, there were letters of credit issued and outstanding through a financial intermediary under the letter of credit facility. See Note 7 to the consolidated financial statements for further information on letters of credit commitments related to certain portfolio companies.
F-28
ARES CAPITAL CORPORATION AND SUBSIDIARIES
CONSOLIDATED SCHEDULE OF INVESTMENTS
As of December 31, 2013
(dollar amounts in thousands)
Company(1)
|
Business Description | Investment | Interest(5)(11) | Acquisition Date |
Amortized Cost |
Fair Value |
Percentage of Net Assets |
||||||||||||
|---|---|---|---|---|---|---|---|---|---|---|---|---|---|---|---|---|---|---|---|
| Investment Funds and Vehicles | |||||||||||||||||||
| CIC Flex, LP(9) | Investment partnership | Limited partnership units (0.94 units) | 9/7/2007 | $ | 867 | $ | 2,851 | (2) | |||||||||||
| Covestia Capital Partners, LP(9) | Investment partnership | Limited partnership interest (47.00% interest) | 6/17/2008 | 826 | 1,177 | (2) | |||||||||||||
| Dynamic India Fund IV, LLC(9) | Investment company | Member interest (5.44% interest) | 4/1/2010 | 4,822 | 3,285 | ||||||||||||||
| HCI Equity, LLC(7)(8)(9) | Investment company | Member interest (100.00% interest) | 4/1/2010 | 112 | 334 | ||||||||||||||
| Imperial Capital Private Opportunities, LP(9) | Investment partnership | Limited partnership interest (80.00% interest) | 5/10/2007 | 3,315 | 10,231 | (2) | |||||||||||||
| Partnership Capital Growth Fund I, L.P.(9) | Investment partnership | Limited partnership interest (25.00% interest) | 6/16/2006 | 1,411 | 3,939 | (2) | |||||||||||||
| Partnership Capital Growth Investors III, L.P.(9) | Investment partnership | Limited partnership interest (2.50% interest) | 10/5/2011 | 2,804 | 2,588 | (2) | |||||||||||||
| Piper Jaffray Merchant Banking Fund I, L.P.(9) | Investment partnership | Limited partnership interest (2.00% interest) | 8/16/2012 | 632 | 563 | (2) | |||||||||||||
| Senior Secured Loan Fund LLC(7)(10) | Co-investment vehicle | Subordinated certificates ($1,745,192 par due 12/2024) | 8.24% (Libor + 8.00%/Q)(26) | 10/30/2009 | 1,745,192 | 1,771,369 | |||||||||||||
| Membership interest (87.50% interest) | 10/30/2009 | — | — | ||||||||||||||||
| | | | | | | | | | | | | | | | | | | | |
| 1,745,192 | 1,771,369 | ||||||||||||||||||
| VSC Investors LLC(9) | Investment company | Membership interest (1.95% interest) | 1/24/2008 | 745 | 1,211 | (2) | |||||||||||||
| | | | | | | | | | | | | | | | | | | | |
| 1,760,726 | 1,797,548 | 36.65 | % | ||||||||||||||||
| | | | | | | | | | | | | | | | | | | | |
| Healthcare—Services | |||||||||||||||||||
| Alegeus Technologies Holdings Corp. | Benefits administration and transaction processing provider | Preferred stock (2,997 shares) | 12/13/2013 | 3,087 | 3,087 | ||||||||||||||
| Common stock (3 shares) | 12/13/2013 | 3 | 3 | ||||||||||||||||
| | | | | | | | | | | | | | | | | | | | |
| 3,090 | 3,090 | ||||||||||||||||||
| American Academy Holdings, LLC | Provider of education, training, certification, networking, and consulting services to medical coders and other healthcare professionals | First lien senior secured revolving loan ($2,250 par due 3/2019) | 6.00% (Libor + 5.00%/Q) | 3/18/2011 | 2,250 | 2,250 | (2)(25) | ||||||||||||
| First lien senior secured loan ($56,236 par due 3/2019) | 6.00% (Libor + 5.00%/Q) | 3/18/2011 | 56,236 | 56,236 | (3)(25) | ||||||||||||||
| First lien senior secured loan ($4,651 par due 3/2019) | 6.00% (Libor + 5.00%/Q) | 3/18/2011 | 4,651 | 4,651 | (4)(25) | ||||||||||||||
| | | | | | | | | | | | | | | | | | | | |
| 63,137 | 63,137 | ||||||||||||||||||
| ATI Phyiscal Therapy Holdings, LLC | Outpatient rehabilitation services provider | Class C common stock (51,005 shares) | 12/13/2013 | 53 | 53 | ||||||||||||||
| AxelaCare Holdings, Inc. and AxelaCare Investment Holdings, L.P. | Provider of home infusion services | First lien senior secured loan ($4,458 par due 4/2019) | 5.75% (Libor + 4.50%/Q) | 4/12/2013 | 4,458 | 4,458 | (2)(25) | ||||||||||||
| Preferred units (8,218,160 units) | 4/12/2013 | 822 | 855 | (2) | |||||||||||||||
| Common units (83,010 units) | 4/12/2013 | 8 | 9 | (2) | |||||||||||||||
| | | | | | | | | | | | | | | | | | | | |
| 5,288 | 5,322 | ||||||||||||||||||
| California Forensic Medical Group, Incorporated | Correctional facility healthcare operator | First lien senior secured loan ($53,640 par due 11/2018) | 9.25% (Libor + 8.00%/Q) | 11/16/2012 | 53,640 | 53,640 | (3)(25) | ||||||||||||
F-29
Company(1)
|
Business Description | Investment | Interest(5)(11) | Acquisition Date |
Amortized Cost |
Fair Value |
Percentage of Net Assets |
||||||||||||
|---|---|---|---|---|---|---|---|---|---|---|---|---|---|---|---|---|---|---|---|
| CCS Group Holdings, LLC | Correctional facility healthcare operator | Class A units (601,937 units) | 8/19/2010 | 602 | 1,546 | (2) | |||||||||||||
| CT Technologies Intermediate Holdings, Inc. and CT Technologies Holdings LLC(6) | Healthcare analysis services provider | Class A common stock (9,679 shares) | 6/15/2007 | 2,543 | 4,014 | (2) | |||||||||||||
| Class C common stock (1,546 shares) | 6/15/2007 | — | 641 | (2) | |||||||||||||||
| | | | | | | | | | | | | | | | | | | | |
| 2,543 | 4,655 | ||||||||||||||||||
| Dialysis Newco, Inc. | Dialysis provider | First lien senior secured loan ($15,509 par due 8/2020) | 5.25% (Libor + 4.25%/Q) | 8/16/2013 | 15,509 | 15,509 | (2)(25) | ||||||||||||
| Second lien senior secured loan ($56,500 par due 2/2021) | 9.75% (Libor + 8.50%/Q) | 8/16/2013 | 56,500 | 56,500 | (2)(25) | ||||||||||||||
| | | | | | | | | | | | | | | | | | | | |
| 72,009 | 72,009 | ||||||||||||||||||
| Genocea Biosciences, Inc. | Vaccine discovery technology company | First lien senior secured loan ($10,000 par due 4/2017) | 8.00% | 9/30/2013 | 9,805 | 10,000 | (2) | ||||||||||||
| Warrant to purchase up to 689,655 shares of Series C convertible preferred stock | 9/30/2013 | — | — | (2) | |||||||||||||||
| | | | | | | | | | | | | | | | | | | | |
| 9,805 | 10,000 | ||||||||||||||||||
| GI Advo Opco, LLC | Behavioral treatment services provider | First lien senior secured loan ($15,005 par due 6/2017) | 6.00% (Libor + 4.75%/Q) | 12/13/2013 | 15,448 | 15,455 | (25) | ||||||||||||
| First lien senior secured loan ($13 par due 6/2017) | 7.00% (Base Rate + 3.75%/Q) | 12/13/2013 | 13 | 13 | (25) | ||||||||||||||
| | | | | | | | | | | | | | | | | | | | |
| 15,461 | 15,468 | ||||||||||||||||||
| INC Research Mezzanine Co-Invest, LLC | Pharmaceutical and biotechnology consulting services | Common units (1,410,000 units) | 9/27/2010 | 1,512 | 1,758 | (2) | |||||||||||||
| Intermedix Corporation | Revenue cycle management provider to the emergency healthcare industry | Second lien senior secured loan ($112,000 par due 6/2019) | 10.25% (Libor + 9.00%/Q) | 12/27/2012 | 112,000 | 112,000 | (2)(25) | ||||||||||||
| JHP Group Holdings, Inc. | Manufacturer of speciality pharmaceutical products | Series A preferred stock (1,000,000 shares) | 6.00% PIK | 2/19/2013 | 272 | 2,673 | (2) | ||||||||||||
| LM Acquisition Holdings, LLC(8) | Developer and manufacturer of medical equipment | Class A units (426 units) | 9/27/2013 | 1,000 | 1,195 | (2) | |||||||||||||
| Magnacare Holdings, Inc., Magnacare Administrative Services, LLC, and Magnacare, LLC | Healthcare professional provider | First lien senior secured loan ($134,115 par due 3/2018) | 9.00% (Libor + 8.00%/Q) | 9/15/2010 | 134,721 | 135,457 | (2)(25) | ||||||||||||
| First lien senior secured loan ($56,134 par due 3/2018) | 9.00% (Libor + 8.00%/Q) | 9/15/2010 | 56,134 | 56,695 | (3)(25) | ||||||||||||||
| First lien senior secured loan ($4,668 par due 3/2018) | 9.00% (Libor + 8.00%/Q) | 3/6/2012 | 4,668 | 4,715 | (4)(25) | ||||||||||||||
| | | | | | | | | | | | | | | | | | | | |
| 195,523 | 196,867 | ||||||||||||||||||
| Monte Nido Holdings, LLC | Outpatient eating disorder treatment provider | First lien senior secured loan ($44,750 par due 12/2019) | 7.75% (Libor + 6.75%/Q) | 12/20/2013 | 44,750 | 44,750 | (2)(19)(25) | ||||||||||||
| MW Dental Holding Corp. | Dental services provider | First lien senior secured revolving loan ($4,500 par due 4/2017) | 8.50% (Libor + 7.00%/M) | 4/12/2011 | 4,500 | 4,500 | (2)(25) | ||||||||||||
| First lien senior secured loan ($12,582 par due 4/2017) | 8.50% (Libor + 7.00%/M) | 4/12/2011 | 12,582 | 12,582 | (2)(25) | ||||||||||||||
| First lien senior secured loan ($12,460 par due 4/2017) | 8.50% (Libor + 7.00%/M) | 4/12/2011 | 12,460 | 12,460 | (2)(25) | ||||||||||||||
| First lien senior secured loan ($48,757 par due 4/2017) | 8.50% (Libor + 7.00%/M) | 4/12/2011 | 48,757 | 48,757 | (3)(25) | ||||||||||||||
| First lien senior secured loan ($9,800 par due 4/2017) | 8.50% (Libor + 7.00%/M) | 4/12/2011 | 9,800 | 9,800 | (4)(25) | ||||||||||||||
| | | | | | | | | | | | | | | | | | | | |
| 88,099 | 88,099 | ||||||||||||||||||
F-30
Company(1)
|
Business Description | Investment | Interest(5)(11) | Acquisition Date |
Amortized Cost |
Fair Value |
Percentage of Net Assets |
||||||||||||
|---|---|---|---|---|---|---|---|---|---|---|---|---|---|---|---|---|---|---|---|
| Napa Management Services Corporation | Anesthesia management services provider | First lien senior secured loan ($23,496 par due 4/2018) | 6.50% (Libor + 5.25%/Q) | 4/15/2011 | 23,496 | 23,496 | (2)(25) | ||||||||||||
| First lien senior secured loan ($33,266 par due 4/2018) | 6.50% (Libor + 5.25%/Q) | 4/15/2011 | 33,203 | 33,266 | (3)(25) | ||||||||||||||
| Common units (5,000 units) | 4/15/2011 | 5,000 | 8,896 | (2) | |||||||||||||||
| | | | | | | | | | | | | | | | | | | | |
| 61,699 | 65,658 | ||||||||||||||||||
| National Healing Corporation and National Healing Holding Corp. | Wound care service and equipment provider | Second lien senior secured loan ($10,000 par due 2/2020) | 9.25% (Libor + 8.00%/S) | 12/13/2013 | 10,297 | 10,301 | (25) | ||||||||||||
| Preferred stock (869,565 shares) | 12/13/2013 | 1,296 | 1,296 | ||||||||||||||||
| | | | | | | | | | | | | | | | | | | | |
| 11,593 | 11,597 | ||||||||||||||||||
| Netsmart Technologies, Inc. and NS Holdings, Inc. | Healthcare technology provider | First lien senior secured loan ($2,833 par due 12/2017) | 7.25% (Libor + 6.00%/Q) | 12/18/2012 | 2,833 | 2,833 | (2)(17)(25) | ||||||||||||
| First lien senior secured loan ($36,259 par due 12/2017) | 7.25% (Libor + 6.00%/Q) | 12/18/2012 | 36,259 | 36,259 | (2)(17)(25) | ||||||||||||||
| Common stock (2,500,000 shares) | 6/21/2010 | 2,500 | 2,710 | (2) | |||||||||||||||
| | | | | | | | | | | | | | | | | | | | |
| 41,592 | 41,802 | ||||||||||||||||||
| New Trident Holdcorp, Inc. | Outsourced mobile diagnostic healthcare service provider | Second lien senior secured loan ($80,000 par due 7/2020) | 10.25% (Libor +9.00%/Q) | 8/6/2013 | 78,465 | 80,000 | (2)(25) | ||||||||||||
| OmniSYS Acquisition Corporation, OmniSYS, LLC, and OSYS Holdings, LLC | Provider of technology-enabled solutions to pharmacies | First lien senior secured loan ($21,000 par due 11/2018) | 8.50% (Libor + 7.50%/Q) | 11/21/2013 | 21,000 | 21,000 | (2)(25) | ||||||||||||
| Limited liability company membership interest (1.57% interest) | 11/21/2013 | 1,000 | 1,000 | (2) | |||||||||||||||
| | | | | | | | | | | | | | | | | | | | |
| 22,000 | 22,000 | ||||||||||||||||||
| PerfectServe, Inc. | Communications software platform provider for hospitals and physician practices | First lien senior secured loan ($3,500 par due 4/2017) | 10.00% | 12/26/2013 | 3,465 | 3,500 | |||||||||||||
| Warrants to purchase up to 34,113 units of Series C preferred stock | 12/26/2013 | — | 50 | ||||||||||||||||
| | | | | | | | | | | | | | | | | | | | |
| 3,465 | 3,550 | ||||||||||||||||||
| PG Mergersub, Inc. and PGA Holdings, Inc. | Provider of patient surveys, management reports and national databases for the integrated healthcare delivery system | Second lien senior secured loan ($2,368 par due 10/2018) | 8.25% (Libor + 7.00%/Q) | 4/19/2012 | 2,439 | 2,376 | (25) | ||||||||||||
| Second lien senior secured loan ($21,316 par due 10/2018) | 8.25% (Libor + 7.00%/Q) | 4/19/2012 | 21,316 | 21,380 | (2)(25) | ||||||||||||||
| Preferred stock (333 shares) | 3/12/2008 | 125 | 16 | (2) | |||||||||||||||
| Common stock (16,667 shares) | 3/12/2008 | 167 | 825 | (2) | |||||||||||||||
| | | | | | | | | | | | | | | | | | | | |
| 24,047 | 24,597 | ||||||||||||||||||
| Physiotherapy Associates Holdings, Inc. | Outpatient rehabilitation physical therapy provider | Class A common stock (100,000 shares) | 12/13/2013 | 3,090 | 3,090 | ||||||||||||||
| POS I Corp. (fka Vantage Oncology, Inc.) | Radiation oncology care provider | Common stock (62,157 shares) | 2/3/2011 | 4,670 | 1,375 | (2) | |||||||||||||
| RCHP, Inc. | Operator of general acute care hospitals | First lien senior secured loan ($14,887 par due 11/2018) | 7.00% (Libor + 5.75%/Q) | 11/4/2011 | 14,888 | 14,664 | (2)(25) | ||||||||||||
| First lien senior secured loan ($60,518 par due 11/2018) | 7.00% (Libor + 5.75%/Q) | 11/4/2011 | 60,496 | 59,611 | (3)(25) | ||||||||||||||
| Second lien senior secured loan ($85,000 par due 5/2019) | 11.50% (Libor + 10.00%/Q) | 11/4/2011 | 85,000 | 85,000 | (2)(25) | ||||||||||||||
| | | | | | | | | | | | | | | | | | | | |
| 160,384 | 159,275 | ||||||||||||||||||
F-31
Company(1)
|
Business Description | Investment | Interest(5)(11) | Acquisition Date |
Amortized Cost |
Fair Value |
Percentage of Net Assets |
||||||||||||
|---|---|---|---|---|---|---|---|---|---|---|---|---|---|---|---|---|---|---|---|
| Reed Group, Ltd. | Medical disability management services provider | Equity interests | 4/1/2010 | — | — | (2) | |||||||||||||
| Respicardia, Inc. | Developer of implantable therapies to improve cardiovascular health | First lien senior secured loan ($3,800 par due 7/2015) | 11.00% | 6/28/2012 | 3,787 | 3,800 | (2) | ||||||||||||
| Warrants to purchase up to 99,094 shares of Series C preferred stock | 6/26/2012 | 38 | 29 | (2) | |||||||||||||||
| | | | | | | | | | | | | | | | | | | | |
| 3,825 | 3,829 | ||||||||||||||||||
| Sage Products Holdings III, LLC | Patient infection control and preventive care solutions provider | Second lien senior secured loan ($75,000 par due 6/2020) | 9.25% (Libor + 8.00%/Q) | 12/13/2012 | 75,000 | 75,000 | (2)(25) | ||||||||||||
| Sorbent Therapeutics, Inc. | Orally-administered drug developer | First lien senior secured loan ($6,500 par due 9/2016) | 10.25% | 4/23/2013 | 6,500 | 6,500 | (2) | ||||||||||||
| Warrant to purchase up to 727,272 shares of Series C preferred stock | 4/23/2013 | — | 25 | (2) | |||||||||||||||
| | | | | | | | | | | | | | | | | | | | |
| 6,500 | 6,525 | ||||||||||||||||||
| Soteria Imaging Services, LLC(6) | Outpatient medical imaging provider | Preferred member units (1,823,179 units) | 4/1/2010 | — | — | ||||||||||||||
| SurgiQuest, Inc. | Medical device company | First lien senior secured loan ($6,281 par due 10/2017) | 10.00% | 9/28/2012 | 6,133 | 6,281 | (2) | ||||||||||||
| First lien senior secured loan ($2,000 par due 10/2017) | 10.69% | 9/28/2012 | 1,953 | 2,000 | (2) | ||||||||||||||
| Warrants to purchase up to 54,672 shares of Series D-4 convertible preferred stock | 9/28/2012 | — | — | (2) | |||||||||||||||
| | | | | | | | | | | | | | | | | | | | |
| 8,086 | 8,281 | ||||||||||||||||||
| U.S. Anesthesia Partners, Inc. | Anesthesiology service provider | First lien senior secured loan ($30,000 par due 12/2019) | 6.00% (Libor + 5.00%/Q) | 12/31/2013 | 30,000 | 30,000 | (2)(25) | ||||||||||||
| Young Innovations, Inc. | Dental supplies and equipment manufacturer | First lien senior secured loan ($9,697 par due 1/2019) | 5.75% (Libor + 4.50%/Q) | 1/31/2013 | 9,697 | 9,697 | (3)(25) | ||||||||||||
| First lien senior secured loan ($32 par due 1/2019) | 6.75% (Base Rate + 3.50%/Q) | 1/31/2013 | 32 | 32 | (3)(25) | ||||||||||||||
| First lien senior secured loan ($13,304 par due 1/2019) | 5.75% (Libor + 4.50%/Q) | 1/31/2013 | 13,304 | 13,304 | (4)(25) | ||||||||||||||
| First lien senior secured loan ($44 par due 1/2019) | 6.75% (Base Rate + 3.50%/Q) | 1/31/2013 | 44 | 44 | (4)(25) | ||||||||||||||
| | | | | | | | | | | | | | | | | | | | |
| 23,077 | 23,077 | ||||||||||||||||||
| | | | | | | | | | | | | | | | | | | | |
| 1,226,277 | 1,235,918 | 25.20 | % | ||||||||||||||||
| | | | | | | | | | | | | | | | | | | | |
| Business Services | |||||||||||||||||||
| 2329497 Ontario Inc.(8) | Provider of outsourced data center infrastructure and related services | Second lien senior secured loan ($42,480 par due 6/2019) | 10.50% (Libor + 9.25%/M) | 12/13/2013 | 43,551 | 43,603 | (25) | ||||||||||||
| Access CIG, LLC | Records and information management services provider | First lien senior secured loan ($992 par due 10/2017) | 7.00% (Libor + 5.75%/M) | 10/5/2012 | 992 | 992 | (2)(25) | ||||||||||||
| BluePay Processing, Inc. | Technology-enabled payment processing solutions provider | First lien senior secured loan ($6,000 par due 8/2019) | 5.00% (Libor + 4.00%/Q) | 8/30/2013 | 6,000 | 6,000 | (2)(25) | ||||||||||||
| Cast & Crew Payroll, LLC and Centerstage Co-Investors, L.L.C.(6) | Payroll and accounting services provider to the entertainment industry | First lien senior secured loan ($18,107 par due 12/2017) | 7.25% (Libor + 6.25%/Q) | 12/24/2012 | 18,107 | 18,107 | (2)(18)(25) | ||||||||||||
| First lien senior secured loan ($45,267 par due 12/2017) | 7.25% (Libor + 6.25%/Q) | 12/24/2012 | 45,267 | 45,267 | (3)(18)(25) | ||||||||||||||
| Class A membership units (2,500,000 units) | 12/24/2012 | 2,500 | 4,021 | (2) | |||||||||||||||
| Class B membership units (2,500,000 units) | 12/24/2012 | 2,500 | 4,021 | (2) | |||||||||||||||
| | | | | | | | | | | | | | | | | | | | |
| 68,374 | 71,416 | ||||||||||||||||||
F-32
Company(1)
|
Business Description | Investment | Interest(5)(11) | Acquisition Date |
Amortized Cost |
Fair Value |
Percentage of Net Assets |
||||||||||||
|---|---|---|---|---|---|---|---|---|---|---|---|---|---|---|---|---|---|---|---|
| CIBT Investment Holdings, LLC | Expedited travel document processing services | Class A shares (2,500 shares) | 12/15/2011 | 2,500 | 3,658 | (2) | |||||||||||||
| CitiPostal Inc.(7) | Document storage and management services | First lien senior secured revolving loan ($3,500 par due 12/2014) | 6.50% (Libor + 4.50%/M) | 4/1/2010 | 3,500 | 3,500 | (2)(25) | ||||||||||||
| First lien senior secured loan ($53,731 par due 12/2014) | 4/1/2010 | 53,731 | 41,501 | (2)(24) | |||||||||||||||
| Senior subordinated loan ($20,193 par due 12/2015) | 4/1/2010 | 13,038 | — | (2)(24) | |||||||||||||||
| Common stock (37,024 shares) | 4/1/2010 | — | — | ||||||||||||||||
| | | | | | | | | | | | | | | | | | | | |
| 70,269 | 45,001 | ||||||||||||||||||
| Command Alkon, Inc. | Software solutions provider to the ready-mix concrete industry | Second lien senior secured loan ($10,000 par due 3/2018) | 8.75% (Libor + 7.50%/M) | 9/28/2012 | 10,000 | 10,000 | (2)(25) | ||||||||||||
| Second lien senior secured loan ($34,000 par due 5/2019) | 8.75% (Libor + 7.50%/Q) | 9/28/2012 | 34,000 | 34,000 | (2)(25) | ||||||||||||||
| | | | | | | | | | | | | | | | | | | | |
| 44,000 | 44,000 | ||||||||||||||||||
| Coverall North America, Inc. | Commercial janitorial services provider | Letter of credit facility | 1/17/2013 | — | — | (2)(29) | |||||||||||||
| eCommerce Industries, Inc. | Business critical enterprise resource planning software provider | First lien senior secured loan ($19,936 par due 10/2016) | 8.00% (Libor + 6.75%/Q) | 12/13/2013 | 19,936 | 20,217 | (22)(25) | ||||||||||||
| HCPro, Inc. and HCP Acquisition Holdings, LLC(7) | Healthcare compliance advisory services | Senior subordinated loan ($9,004 par due 8/2014) | 3/5/2013 | 2,692 | — | (2)(24) | |||||||||||||
| Class A units (14,293,110 units) | 6/26/2008 | 12,793 | — | (2) | |||||||||||||||
| | | | | | | | | | | | | | | | | | | | |
| 15,485 | — | ||||||||||||||||||
| IfByPhone Inc. | Voice-based marketing automation software provider | First lien senior secured loan ($1,533 par due 11/2015) | 11.00% | 10/15/2012 | 1,490 | 1,533 | (2) | ||||||||||||
| First lien senior secured loan ($833 par due 1/2016) | 11.00% | 10/15/2012 | 833 | 833 | (2) | ||||||||||||||
| Warrant to purchase up to 124,300 shares of Series C preferred stock | 10/15/2012 | 88 | 64 | (2) | |||||||||||||||
| | | | | | | | | | | | | | | | | | | | |
| 2,411 | 2,430 | ||||||||||||||||||
| Investor Group Services, LLC(6) | Business consulting for private equity and corporate clients | Limited liability company membership interest (8.5% interest) | 6/22/2006 | — | 633 | ||||||||||||||
| IronPlanet, Inc. | Online auction platform provider for used heavy equipment | First lien senior secured revolving loan ($5,000 par due 9/2015) | 8.00% | 9/24/2013 | 5,000 | 5,000 | (2) | ||||||||||||
| First lien senior secured loan ($7,500 par due 7/2017) | 9.25% | 9/24/2013 | 7,155 | 7,275 | (2) | ||||||||||||||
| Warrant to purchase to up to 133,333 shares of Series C preferred stock | 9/24/2013 | 214 | 246 | (2) | |||||||||||||||
| | | | | | | | | | | | | | | | | | | | |
| 12,369 | 12,521 | ||||||||||||||||||
| ISS #2, LLC | Provider of repairs, refurbishments and services to the broader industrial end user markets | First lien senior secured loan ($14,950 par due 6/2018) | 6.50% (Libor + 5.50%/Q) | 6/5/2013 | 14,950 | 14,950 | (2)(25) | ||||||||||||
| First lien senior secured loan ($44,775 par due 6/2018) | 6.50% (Libor + 5.50%/Q) | 6/5/2013 | 44,775 | 44,775 | (3)(25) | ||||||||||||||
| | | | | | | | | | | | | | | | | | | | |
| 59,725 | 59,725 | ||||||||||||||||||
| Itel Laboratories, Inc. | Data services provider for building materials to property insurance industry | Preferred units (1,798,391 units) | 6/29/2012 | 1,000 | 995 | (2) | |||||||||||||
F-33
Company(1)
|
Business Description | Investment | Interest(5)(11) | Acquisition Date |
Amortized Cost |
Fair Value |
Percentage of Net Assets |
||||||||||||
|---|---|---|---|---|---|---|---|---|---|---|---|---|---|---|---|---|---|---|---|
| Keynote Systems, Inc. and Hawaii Ultimate Parent Corp., Inc. | Web and mobile cloud performance testing and monitoring services provider | First lien senior secured loan ($164,587 par due 2/2020) | 9.50% (Libor + 8.50%/Q) | 8/22/2013 | 164,587 | 164,587 | (2)(25) | ||||||||||||
| Class A common stock (2,970 shares) | 8/22/2013 | 2,970 | 3,429 | (2) | |||||||||||||||
| Class B common stock (1,956,522 shares) | 8/22/2013 | 30 | 35 | (2) | |||||||||||||||
| | | | | | | | | | | | | | | | | | | | |
| 167,587 | 168,051 | ||||||||||||||||||
| Market Track Holdings, LLC | Business media consulting services company | Preferred stock (1,500 shares) | 12/13/2013 | 1,982 | 1,982 | ||||||||||||||
| Common stock (15,000 shares) | 12/13/2013 | 1,982 | 1,982 | ||||||||||||||||
| | | | | | | | | | | | | | | | | | | | |
| 3,964 | 3,964 | ||||||||||||||||||
| MSC.Software Corporation and Maximus Holdings, LLC | Provider of software simulation tools and related services | First lien senior secured loan ($42,750 par due 11/2017) | 8.50% (Libor + 7.25%/Q) | 12/13/2013 | 44,015 | 44,033 | (21)(25) | ||||||||||||
| Warrants to purchase up to 1,050,013 shares of common stock | 12/13/2013 | 424 | 424 | ||||||||||||||||
| | | | | | | | | | | | | | | | | | | | |
| 44,439 | 44,457 | ||||||||||||||||||
| Multi-Ad Services, Inc.(6) | Marketing services and software provider | Preferred units (1,725,280 units) | 4/1/2010 | 788 | 1,754 | ||||||||||||||
| Common units (1,725,280 units) | 4/1/2010 | — | — | ||||||||||||||||
| | | | | | | | | | | | | | | | | | | | |
| 788 | 1,754 | ||||||||||||||||||
| MVL Group, Inc.(7) | Marketing research provider | Junior subordinated loan ($185 par due 7/2012) | 4/1/2010 | — | — | (2)(24) | |||||||||||||
| Senior subordinated loan ($33,337 par due 7/2012) | 4/1/2010 | 30,265 | 2,485 | (2)(24) | |||||||||||||||
| Common stock (560,716 shares) | 4/1/2010 | — | — | (2) | |||||||||||||||
| | | | | | | | | | | | | | | | | | | | |
| 30,265 | 2,485 | ||||||||||||||||||
| NComputing, Inc. | Desktop virtualization hardware and software technology service provider | First lien senior secured loan ($6,500 par due 7/2016) | 10.50% | 3/20/2013 | 6,500 | 6,695 | (2) | ||||||||||||
| Warrant to purchase up to 462,726 shares of Series C preferred stock | 3/20/2013 | — | 56 | (2) | |||||||||||||||
| | | | | | | | | | | | | | | | | | | | |
| 6,500 | 6,751 | ||||||||||||||||||
| Pillar Processing LLC, PHL Investors, Inc., and PHL Holding Co.(6) | Mortgage services | First lien senior secured loan ($4,658 par due 11/2018) | 7/31/2008 | 3,982 | 3,321 | (2)(24) | |||||||||||||
| First lien senior secured loan ($7,375 par due 5/2019) | 11/20/2007 | 5,862 | — | (2)(24) | |||||||||||||||
| Class A common stock (576 shares) | 7/31/2012 | 3,768 | — | (2) | |||||||||||||||
| | | | | | | | | | | | | | | | | | | | |
| 13,612 | 3,321 | ||||||||||||||||||
| Platform Acquisition, Inc. | Data center and managed cloud services provider | Common stock (48,604 shares) | 12/13/2013 | 7,536 | 7,536 | ||||||||||||||
| Powersport Auctioneer Holdings, LLC | Powersport vehicle auction operator | Common units (1,972 units) | 3/2/2012 | 1,000 | 879 | (2) | |||||||||||||
| PSSI Holdings, LLC | Provider of mission-critical outsourced cleaning and sanitation services to the food processing industry | First lien senior secured loan ($1,000 par due 6/2018) | 6.00% (Libor + 5.00%/Q) | 8/7/2013 | 1,000 | 1,000 | (2)(25) | ||||||||||||
| R2 Acquisition Corp. | Marketing services | Common stock (250,000 shares) | 5/29/2007 | 250 | 154 | (2) | |||||||||||||
F-34
Company(1)
|
Business Description | Investment | Interest(5)(11) | Acquisition Date |
Amortized Cost |
Fair Value |
Percentage of Net Assets |
||||||||||||
|---|---|---|---|---|---|---|---|---|---|---|---|---|---|---|---|---|---|---|---|
| Rainstor, Inc. | Database solutions provider | First lien senior secured loan ($2,800 par due 4/2016) | 11.25% | 3/28/2013 | 2,735 | 2,800 | (2) | ||||||||||||
| Warrant to purchase up to 142,210 shares of Series C preferred stock | 3/28/2013 | 88 | 70 | (2) | |||||||||||||||
| | | | | | | | | | | | | | | | | | | | |
| 2,823 | 2,870 | ||||||||||||||||||
| TOA Technologies, Inc. | Cloud based, mobile workforce management applications provider | First lien senior secured loan ($12,567 par due 11/2016) | 10.25% | 10/31/2012 | 12,124 | 12,567 | (2) | ||||||||||||
| Warrant to purchase up to 2,509,770 shares of Series D preferred stock | 10/31/2012 | 605 | 1,201 | (2) | |||||||||||||||
| | | | | | | | | | | | | | | | | | | | |
| 12,729 | 13,768 | ||||||||||||||||||
| Tripwire, Inc. | IT security software provider | First lien senior secured loan ($74,684 par due 5/2018) | 7.50% (Libor + 6.25%/Q) | 5/23/2011 | 74,684 | 74,684 | (2)(25) | ||||||||||||
| First lien senior secured loan ($10,266 par due 5/2018) | 7.50% (Libor + 6.25%/Q) | 5/23/2011 | 10,266 | 10,266 | (2)(25) | ||||||||||||||
| First lien senior secured loan ($49,875 par due 5/2018) | 7.50% (Libor + 6.25%/Q) | 5/23/2011 | 49,875 | 49,875 | (3)(25) | ||||||||||||||
| First lien senior secured loan ($9,975 par due 5/2018) | 7.50% (Libor + 6.25%/Q) | 5/23/2011 | 9,975 | 9,975 | (4)(25) | ||||||||||||||
| Class B common stock (2,655,638 shares) | 5/23/2011 | 30 | 84 | (2) | |||||||||||||||
| Class A common stock (2,970 shares) | 5/23/2011 | 2,970 | 8,315 | (2) | |||||||||||||||
| | | | | | | | | | | | | | | | | | | | |
| 147,800 | 153,199 | ||||||||||||||||||
| Venturehouse-Cibernet Investors, LLC | Financial settlement services for intercarrier wireless roaming | Equity interest | 4/1/2010 | — | — | (2) | |||||||||||||
| VSS-Tranzact Holdings, LLC(6) | Management consulting services | Common membership interest (5.98% interest) | 10/26/2007 | 10,204 | 5,236 | ||||||||||||||
| VTE Holdings Corp. | Hosted enterprise resource planning application management services provider | Common units (1,500,000 units) | 12/13/2013 | 3,862 | 3,862 | ||||||||||||||
| Worldpay (UK) Limited, Worldpay ECommerce Limited, Ship US Bidco, Inc., Ship Investor & Cy S.C.A.(8) | Payment processing company | First lien senior secured loan ($5,341 par due 10/2017) | 6.00% (Libor + 4.75%/Q) | 12/13/2013 | 5,432 | 5,394 | (25) | ||||||||||||
| Common stock (936,693 shares) | 12/13/2013 | 2,698 | 2,732 | ||||||||||||||||
| | | | | | | | | | | | | | | | | | | | |
| 8,130 | 8,126 | ||||||||||||||||||
| X Plus Two Solutions, Inc. and X Plus One Solutions, Inc. | Provider of open and integrated software for digital marketing optimization | First lien senior secured revolving loan ($8,600 par due 9/2014) | 8.50% | 4/1/2013 | 8,600 | 8,600 | (2) | ||||||||||||
| First lien senior secured loan ($7,000 par due 3/2017) | 10.00% | 4/1/2013 | 6,645 | 6,860 | (2) | ||||||||||||||
| Warrant to purchase up to 999,167 shares of Series C preferred stock | 4/1/2013 | 284 | 299 | (2) | |||||||||||||||
| | | | | | | | | | | | | | | | | | | | |
| 15,529 | 15,759 | ||||||||||||||||||
| | | | | | | | | | | | | | | | | | | | |
| 824,630 | 754,363 | 15.38 | % | ||||||||||||||||
| | | | | | | | | | | | | | | | | | | | |
| Services—Other | |||||||||||||||||||
| Capital Investments and Ventures Corp. | SCUBA diver training and certification provider | First lien senior secured loan ($24,512 par due 8/2018) | 7.00% (Libor + 5.75%/Q) | 8/9/2012 | 24,512 | 24,512 | (3)(25) | ||||||||||||
| First lien senior secured loan ($8,719 par due 8/2018) | 7.00% (Libor + 5.75%/Q) | 8/9/2012 | 8,719 | 8,719 | (4)(25) | ||||||||||||||
| | | | | | | | | | | | | | | | | | | | |
| 33,231 | 33,231 | ||||||||||||||||||
F-35
Company(1)
|
Business Description | Investment | Interest(5)(11) | Acquisition Date |
Amortized Cost |
Fair Value |
Percentage of Net Assets |
||||||||||||
|---|---|---|---|---|---|---|---|---|---|---|---|---|---|---|---|---|---|---|---|
| Community Education Centers, Inc. | Offender re-entry and in-prison treatment services provider | First lien senior secured loan ($14,286 par due 12/2014) | 6.25% (Libor + 5.25%/Q) | 12/10/2010 | 14,286 | 14,286 | (2)(15)(25) | ||||||||||||
| Second lien senior secured loan ($35,283 par due 12/2015) | 15.24% (Libor + 10.00% Cash, 5.00% PIK/Q) | 12/10/2010 | 35,283 | 34,225 | (2) | ||||||||||||||
| Second lien senior secured loan ($10,649 par due 12/2015) | 15.26% (Libor + 10.00% Cash, 5.00% PIK/Q) | 12/10/2010 | 10,649 | 10,330 | (2) | ||||||||||||||
| Warrants to purchase up to 654,618 shares | 12/10/2010 | — | 979 | (2) | |||||||||||||||
| | | | | | | | | | | | | | | | | | | | |
| 60,218 | 59,820 | ||||||||||||||||||
| Competitor Group, Inc. and Calera XVI, LLC | Endurance sports media and event operator | First lien senior secured revolving loan ($2,850 par due 11/2018) | 10.00% (Base Rate + 6.75%/Q) | 11/30/2012 | 2,850 | 2,508 | (2)(25) | ||||||||||||
| First lien senior secured revolving loan ($900 par due 11/2018) | 9.00% (Libor + 7.75%/Q) | 11/30/2012 | 900 | 792 | (2)(25) | ||||||||||||||
| First lien senior secured loan ($24,380 par due 11/2018) | 10.00% (Libor + 7.75% Cash, 1.00% PIK /Q) | 11/30/2012 | 24,380 | 21,454 | (2)(25) | ||||||||||||||
| First lien senior secured loan ($29,853 par due 11/2018) | 10.00% (Libor + 7.75% Cash, 1.00% PIK /Q) | 11/30/2012 | 29,853 | 26,271 | (3)(25) | ||||||||||||||
| Membership units (2,500,000 units) | 11/30/2012 | 2,513 | 17 | (2)(9) | |||||||||||||||
| | | | | | | | | | | | | | | | | | | | |
| 60,496 | 51,042 | ||||||||||||||||||
| Fox Hill Holdings, Inc. | Third party claims administrator on behalf of insurance carriers | First lien senior secured loan ($7,442 par due 6/2018) | 6.75% (Libor + 5.75%/Q) | 10/31/2013 | 7,442 | 7,442 | (2)(25) | ||||||||||||
| First lien senior secured loan ($39 par due 6/2018) | 8.00% (Base Rate + 4.75%/Q) | 10/31/2013 | 39 | 39 | (2)(25) | ||||||||||||||
| | | | | | | | | | | | | | | | | | | | |
| 7,481 | 7,481 | ||||||||||||||||||
| GHS Interactive Security, LLC and LG Security Holdings, LLC | Originates residential security alarm contracts | First lien senior secured loan ($2,091 par due 5/2018) | 7.50% (Libor + 6.00%/Q) | 12/13/2013 | 2,153 | 2,153 | (25) | ||||||||||||
| Class A membership units (1,560,000 units) | 12/13/2013 | 1,607 | 1,607 | ||||||||||||||||
| | | | | | | | | | | | | | | | | | | | |
| 3,760 | 3,760 | ||||||||||||||||||
| Massage Envy, LLC | Franchisor in the massage industry | First lien senior secured loan ($29,177 par due 9/2018) | 8.50% (Libor + 7.25%/Q) | 9/27/2012 | 29,177 | 29,177 | (2)(25) | ||||||||||||
| First lien senior secured loan ($49,291 par due 9/2018) | 8.50% (Libor + 7.25%/Q) | 9/27/2012 | 49,291 | 49,291 | (3)(25) | ||||||||||||||
| Common stock (3,000,000 shares) | 9/27/2012 | 3,000 | 3,532 | (2) | |||||||||||||||
| | | | | | | | | | | | | | | | | | | | |
| 81,468 | 82,000 | ||||||||||||||||||
| McKenzie Sports Products, LLC | Designer, manufacturer, and distributor of hunting-related supplies and supplies | First lien senior secured loan ($8,140 par due 3/2017) | 5.75% (Libor + 4.75%/M) | 3/30/2012 | 8,140 | 8,140 | (2)(25) | ||||||||||||
| First lien senior secured loan ($9,302 par due 3/2017) | 5.75% (Libor + 4.75%/M) | 3/30/2012 | 9,302 | 9,302 | (4)(25) | ||||||||||||||
| | | | | | | | | | | | | | | | | | | | |
| 17,442 | 17,442 | ||||||||||||||||||
| PODS Funding Corp. II | Storage and warehousing | First lien senior secured loan ($35,897 par due 12/2018) | 7.00% (Libor + 6.00%/Q) | 12/19/2013 | 35,897 | 35,897 | (25) | ||||||||||||
| Spin HoldCo Inc. | Laundry service and equipment provider | Second lien senior secured loan ($140,000 par due 5/2020) | 9.00% (Libor + 7.75%/Q) | 5/14/2013 | 140,000 | 140,000 | (2)(25) | ||||||||||||
| The Dwyer Group(6) | Operator of multiple franchise concepts primarily related to home maintenance or repairs | Senior subordinated loan ($25,686 par due 6/2018) | 12.00% Cash, 1.50% PIK | 12/22/2010 | 25,686 | 25,686 | (2) | ||||||||||||
| Series A preferred units (13,292,377 units) | 8.00% PIK | 12/22/2010 | 6,859 | 18,650 | (2) | ||||||||||||||
| | | | | | | | | | | | | | | | | | | | |
| 32,545 | 44,336 | ||||||||||||||||||
F-36
Company(1)
|
Business Description | Investment | Interest(5)(11) | Acquisition Date |
Amortized Cost |
Fair Value |
Percentage of Net Assets |
||||||||||||
|---|---|---|---|---|---|---|---|---|---|---|---|---|---|---|---|---|---|---|---|
| United Road Towing, Inc. | Towing company | Warrants to purchase up to 607 shares | 4/1/2010 | — | — | ||||||||||||||
| Wash Multifamily Laundry Systems, LLC | Laundry service and equipment provider | Second lien senior secured loan ($78,000 par due 2/2020) | 9.75% (Libor + 8.50%/Q) | 6/26/2012 | 78,000 | 78,000 | (2)(25) | ||||||||||||
| | | | | | | | | | | | | | | | | | | | |
| 550,538 | 553,009 | 11.28 | % | ||||||||||||||||
| | | | | | | | | | | | | | | | | | | | |
| Education | |||||||||||||||||||
| Campus Management Corp. and Campus Management Acquisition Corp.(6) | Education software developer | Preferred stock (485,159 shares) | 2/8/2008 | 10,520 | 3,337 | (2) | |||||||||||||
| ELC Acquisition Corp., ELC Holdings Corporation, and Excelligence Learning Corporation(6) | Developer, manufacturer and retailer of educational products | Preferred stock (99,492 shares) | 12.00% PIK | 8/1/2011 | 10,286 | 10,286 | (2) | ||||||||||||
| Common stock (50,800 shares) | 8/1/2011 | — | 1,345 | (2) | |||||||||||||||
| | | | | | | | | | | | | | | | | | | | |
| 10,286 | 11,631 | ||||||||||||||||||
| Infilaw Holding, LLC | Operator of for-profit law schools | First lien senior secured revolving loan | 8/25/2011 | — | — | (2)(27) | |||||||||||||
| First lien senior secured loan ($1 par due 8/2016) | 9.50% (Libor + 8.50%/Q) | 8/25/2011 | 1 | 1 | (2)(25) | ||||||||||||||
| First lien senior secured loan ($14,362 par due 8/2016) | 9.50% (Libor + 8.50%/Q) | 8/25/2011 | 14,362 | 14,362 | (3)(25) | ||||||||||||||
| Series A preferred units (124,890 units) | 9.50% (Libor + 8.50%/Q) | 8/25/2011 | 124,890 | 124,890 | (2)(25) | ||||||||||||||
| Series B preferred units (3.91 units) | 10/19/2012 | 9,245 | 11,060 | (2) | |||||||||||||||
| | | | | | | | | | | | | | | | | | | | |
| 148,498 | 150,313 | ||||||||||||||||||
| Instituto de Banca y Comercio, Inc. & Leeds IV Advisors, Inc. | Private school operator | First lien senior secured loan ($39,459 par due 6/2015) | 4/24/2013 | 39,385 | 35,514 | (3)(24) | |||||||||||||
| First lien senior secured loan ($14,774 par due 6/2015) | 4/24/2013 | 14,746 | 13,297 | (4)(24) | |||||||||||||||
| Series B preferred stock (1,750,000 shares) | 8/5/2010 | 5,000 | — | (2) | |||||||||||||||
| Series C preferred stock (2,512,586 shares) | 6/7/2010 | 689 | — | (2) | |||||||||||||||
| Common stock (20 shares) | 6/7/2010 | — | — | (2) | |||||||||||||||
| | | | | | | | | | | | | | | | | | | | |
| 59,820 | 48,811 | ||||||||||||||||||
| Lakeland Tours, LLC | Educational travel provider | First lien senior secured revolving loan | 10/4/2011 | — | — | (2)(27) | |||||||||||||
| First lien senior secured loan ($83,140 par due 12/2016) | 8.50% (Libor + 7.50%/Q) | 10/4/2011 | 83,067 | 83,131 | (2)(14)(25) | ||||||||||||||
| First lien senior secured loan ($1,585 par due 12/2016) | 5.25% (Libor + 4.25%/Q) | 10/4/2011 | 1,585 | 1,585 | (2)(25) | ||||||||||||||
| First lien senior secured loan ($40,362 par due 12/2016) | 8.50% (Libor + 7.50%/Q) | 10/4/2011 | 40,277 | 40,362 | (3)(14)(25) | ||||||||||||||
| First lien senior secured loan ($8,297 par due 12/2016) | 5.25% (Libor + 4.25%/Q) | 10/4/2011 | 8,280 | 8,297 | (3)(25) | ||||||||||||||
| Common stock (5,000 shares) | 10/4/2011 | 5,000 | 5,117 | (2) | |||||||||||||||
| | | | | | | | | | | | | | | | | | | | |
| 138,209 | 138,492 | ||||||||||||||||||
| PIH Corporation | Franchisor of education-based early childhood centers | First lien senior secured revolving loan ($621 par due 6/2016) | 7.25% (Libor + 6.25%/M) | 12/13/2013 | 621 | 621 | (25) | ||||||||||||
| First lien senior secured loan ($39,062 par due 6/2016) | 7.25% (Libor + 6.25%/M) | 12/13/2013 | 39,570 | 39,594 | (25) | ||||||||||||||
| | | | | | | | | | | | | | | | | | | | |
| 40,191 | 40,215 | ||||||||||||||||||
| R3 Education, Inc. and EIC Acquisitions Corp. | Medical school operator | Preferred stock (8,800 shares) | 7/30/2008 | 2,200 | 1,936 | (2) | |||||||||||||
| Common membership interest (26.27% interest) | 9/21/2007 | 15,800 | 29,584 | (2) | |||||||||||||||
| Warrants to purchase up to 27,890 shares | 12/8/2009 | — | — | (2) | |||||||||||||||
| | | | | | | | | | | | | | | | | | | | |
| 18,000 | 31,520 | ||||||||||||||||||
F-37
Company(1)
|
Business Description | Investment | Interest(5)(11) | Acquisition Date |
Amortized Cost |
Fair Value |
Percentage of Net Assets |
||||||||||||
|---|---|---|---|---|---|---|---|---|---|---|---|---|---|---|---|---|---|---|---|
| RuffaloCODY, LLC | Provider of student fundraising and enrollment management services | First lien senior secured loan ($634 par due 5/2019) | 6.50% (Base Rate + 3.25%/Q) | 5/29/2013 | 634 | 634 | (2)(25) | ||||||||||||
| First lien senior secured loan ($24,996 par due 5/2019) | 5.50% (Libor + 4.25%/Q) | 5/29/2013 | 24,996 | 24,996 | (2)(25) | ||||||||||||||
| | | | | | | | | | | | | | | | | | | | |
| 25,630 | 25,630 | ||||||||||||||||||
| | | | | | | | | | | | | | | | | | | | |
| 451,154 | 449,949 | 9.17 | % | ||||||||||||||||
| | | | | | | | | | | | | | | | | | | | |
| Power Generation | |||||||||||||||||||
| Alphabet Energy, Inc. | Technology developer to convert waste-heat into electricity | First lien senior secured loan ($3,000 par due 7/2017) | 9.62% | 12/16/2013 | 2,721 | 2,850 | (2) | ||||||||||||
| Warrants to purchase up to 59,524 units of Series B preferred stock | 12/16/2013 | 146 | 146 | (2) | |||||||||||||||
| | | | | | | | | | | | | | | | | | | | |
| 2,867 | 2,996 | ||||||||||||||||||
| Brush Power, LLC | Gas turbine power generation facilities operator | First lien senior secured loan ($89,892 par due 8/2020) | 6.25% (Libor + 5.25%/Q) | 8/1/2013 | 89,892 | 89,892 | (2)(25) | ||||||||||||
| Centinela Funding, LLC | Solar power generation facility developer and operator | Senior subordinated loan ($56,000 par due 11/2020) | 10.00% (Libor + 8.75%/Q) | 11/14/2012 | 56,000 | 56,000 | (2)(25) | ||||||||||||
| Joule Unlimited Technologies, Inc. and Stichting Joule Global Foundation | Renewable fuel and chemical production developer | First lien senior secured loan ($7,500 par due 2/2017) | 10.00% | 7/25/2013 | 7,433 | 7,500 | (2) | ||||||||||||
| Warrant to purchase up to 32,051 shares of Series C-2 preferred stock | 7/25/2013 | — | 34 | (2)(8) | |||||||||||||||
| | | | | | | | | | | | | | | | | | | | |
| 7,433 | 7,534 | ||||||||||||||||||
| La Paloma Generating Company, LLC | Natural gas fired, combined cycle plant operator | Second lien senior secured loan ($68,000 par due 8/2018) | 10.25% (Libor + 8.75%/M) | 8/9/2011 | 67,060 | 67,320 | (2)(25) | ||||||||||||
| Panda Sherman Power, LLC | Gas turbine power generation facilities operator | First lien senior secured loan ($32,500 par due 9/2018) | 9.00% (Libor + 7.50%/Q) | 9/14/2012 | 32,500 | 32,500 | (2)(25) | ||||||||||||
| Panda Temple Power II, LLC | Gas turbine power generation facilities operator | First lien senior secured loan ($20,000 par due 4/2019) | 7.25% (Libor + 6.00%/Q) | 4/3/2013 | 19,820 | 20,000 | (2)(25) | ||||||||||||
| Panda Temple Power, LLC | Gas turbine power generation facilities operator | First lien senior secured loan ($60,000 par due 7/2018) | 11.50% (Libor + 10.00%/Q) | 7/17/2012 | 58,402 | 60,000 | (2)(25) | ||||||||||||
| Sunrun Solar Owner Holdco X, LLC | Residential solar energy provider | First lien senior secured loan ($59,749 par due 6/2019) | 9.50% (Libor + 8.25%/Q) | 6/7/2013 | 59,749 | 59,749 | (2)(25) | ||||||||||||
| Sunrun Solar Owner Holdco XIII, LLC | Residential solar energy provider | First lien senior secured loan ($19,300 par due 12/2019) | 9.50% (Libor + 7.25% Cash, 1.00% PIK /Q) | 11/27/2013 | 19,079 | 19,300 | (2)(25) | ||||||||||||
| | | | | | | | | | | | | | | | | | | | |
| 412,802 | 415,291 | 8.47 | % | ||||||||||||||||
| | | | | | | | | | | | | | | | | | | | |
| Restaurants and Food Services | |||||||||||||||||||
| ADF Capital, Inc., ADF Restaurant Group, LLC, and ARG Restaurant Holdings, Inc. | Restaurant owner and operator | First lien senior secured loan ($33,581 par due 12/2018) | 10.50% (Base Rate + 7.25%/Q) | 11/27/2006 | 33,581 | 33,581 | (2)(20)(25) | ||||||||||||
| First lien senior secured loan ($10,919 par due 12/2018) | 10.50% (Base Rate + 7.25%/Q) | 11/27/2006 | 10,922 | 10,919 | (3)(20)(25) | ||||||||||||||
| Promissory note ($16,558 par due 12/2018) | 13.00% PIK | 11/27/2006 | 13,273 | 15,997 | (2) | ||||||||||||||
| Warrants to purchase up to 23,750 units of Series D common stock | 12/18/2013 | 24 | — (2 | ) | |||||||||||||||
| | | | | | | | | | | | | | | | | | | | |
| 57,800 | 60,497 | ||||||||||||||||||
| Benihana, Inc. | Restaurant owner and operator | First lien senior secured loan ($4,925 par due 2/2018) | 6.75% (Libor + 5.50%/Q) | 8/21/2012 | 4,925 | 4,925 | (4)(25) | ||||||||||||
F-38
Company(1)
|
Business Description | Investment | Interest(5)(11) | Acquisition Date |
Amortized Cost |
Fair Value |
Percentage of Net Assets |
||||||||||||
|---|---|---|---|---|---|---|---|---|---|---|---|---|---|---|---|---|---|---|---|
| Garden Fresh Restaurant Corp. | Restaurant owner and operator | First lien senior secured revolving loan | 10/3/2013 | — | — | (2)(27) | |||||||||||||
| First lien senior secured loan ($43,750 par due 7/2018) | 10.00% (Libor + 8.50%/M) | 10/3/2013 | 43,750 | 43,750 | (2)(25) | ||||||||||||||
| | | | | | | | | | | | | | | | | | | | |
| 43,750 | 43,750 | ||||||||||||||||||
| Hojeij Branded Foods, Inc. | Airport restaurant operator | First lien senior secured revolving loan ($450 par due 2/2017) | 9.00% (Libor + 8.00%/Q) | 2/15/2012 | 450 | 450 | (2)(25)(28) | ||||||||||||
| First lien senior secured loan ($12,500 par due 2/2017) | 9.00% (Libor + 8.00%/Q) | 2/15/2012 | 12,500 | 12,500 | (2)(25) | ||||||||||||||
| First lien senior secured loan ($15,000 par due 2/2017) | 9.00% (Libor + 8.00%/Q) | 2/15/2012 | 14,543 | 15,000 | (2)(25) | ||||||||||||||
| Warrants to purchase up to 7.5% of membership interest | 2/15/2012 | — | 299 | (2) | |||||||||||||||
| Warrants to purchase up to 324 shares of Class A common stock | 2/15/2012 | 669 | 4,307 | (2) | |||||||||||||||
| | | | | | | | | | | | | | | | | | | | |
| 28,162 | 32,556 | ||||||||||||||||||
| Orion Foods, LLC (fka Hot Stuff Foods, LLC)(7) | Convenience food service retailer | First lien senior secured revolving loan ($9,500 par due 9/2014) | 10.75% (Base Rate + 7.50%/M) | 4/1/2010 | 9,500 | 9,500 | (2)(25) | ||||||||||||
| First lien senior secured loan ($33,037 par due 9/2014) | 10.00% (Libor + 8.50%/Q) | 4/1/2010 | 33,037 | 33,037 | (3)(25) | ||||||||||||||
| Second lien senior secured loan ($37,552 par due 9/2014) | 4/1/2010 | 18,423 | 20,205 | (2)(24) | |||||||||||||||
| Preferred units (10,000 units) | 10/28/2010 | — | — | (2) | |||||||||||||||
| Class A common units (25,001 units) | 4/1/2010 | — | — | (2) | |||||||||||||||
| Class B common units (1,122,452 units) | 4/1/2010 | — | — | (2) | |||||||||||||||
| | | | | | | | | | | | | | | | | | | | |
| 60,960 | 62,742 | ||||||||||||||||||
| OTG Management, LLC | Airport restaurant operator | First lien senior secured loan ($25,000 par due 12/2017) | 8.75% (Libor + 7.25%/Q) | 12/11/2012 | 25,000 | 25,000 | (2)(25) | ||||||||||||
| First lien senior secured loan ($7,075 par due 12/2017) | 8.75% (Libor + 7.25%/Q) | 12/11/2012 | 7,075 | 7,075 | (2)(25) | ||||||||||||||
| Common units (3,000,000 units) | 1/5/2011 | 3,000 | 3,638 | (2) | |||||||||||||||
| Warrants to purchase up to 7.73% of common units | 6/19/2008 | 100 | 7,257 | (2) | |||||||||||||||
| | | | | | | | | | | | | | | | | | | | |
| 35,175 | 42,970 | ||||||||||||||||||
| Performance Food Group, Inc. and Wellspring Distribution Corp | Food service distributor | Second lien senior secured loan ($74,625 par due 11/2019) | 6.25% (Libor + 5.25%/Q) | 5/14/2013 | 74,282 | 74,850 | (2)(25) | ||||||||||||
| Class A non-voting common stock (1,366,120 shares) | 5/3/2008 | 6,303 | 6,529 | (2) | |||||||||||||||
| | | | | | | | | | | | | | | | | | | | |
| 80,585 | 81,379 | ||||||||||||||||||
| PMI Holdings, Inc. | Restaurant owner and operator | Preferred stock (46,025 shares) | 12/13/2013 | 687 | 687 | ||||||||||||||
| Common stock (22,401 shares) | 12/13/2013 | 379 | 379 | ||||||||||||||||
| | | | | | | | | | | | | | | | | | | | |
| 1,066 | 1,066 | ||||||||||||||||||
| Restaurant Holding Company, LLC | Fast food restaurant operator | First lien senior secured loan ($60,125 par due 2/2017) | 9.00% (Libor + 7.50%/M) | 2/17/2012 | 59,303 | 58,922 | (3)(25) | ||||||||||||
| First lien senior secured loan ($9,250 par due 2/2017) | 9.00% (Libor + 7.50%/M) | 2/17/2012 | 9,122 | 9,065 | (4)(25) | ||||||||||||||
| | | | | | | | | | | | | | | | | | | | |
| 68,425 | 67,987 | ||||||||||||||||||
| S.B. Restaurant Company | Restaurant owner and operator | Preferred stock (46,690 shares) | 4/1/2010 | — | — | (2) | |||||||||||||
| Warrants to purchase up to 257,429 shares of common stock | 4/1/2010 | — | — | (2) | |||||||||||||||
| | | | | | | | | | | | | | | | | | | | |
| — | — | ||||||||||||||||||
| | | | | | | | | | | | | | | | | | | | |
| 380,848 | 397,872 | 8.11 | % | ||||||||||||||||
| | | | | | | | | | | | | | | | | | | | |
F-39
Company(1)
|
Business Description | Investment | Interest(5)(11) | Acquisition Date |
Amortized Cost |
Fair Value |
Percentage of Net Assets |
||||||||||||
|---|---|---|---|---|---|---|---|---|---|---|---|---|---|---|---|---|---|---|---|
| Financial Services | |||||||||||||||||||
| AllBridge Financial, LLC(7) | Asset management services | Equity interests | 4/1/2010 | 5,077 | 9,718 | ||||||||||||||
| Callidus Capital Corporation(7) | Asset management services | Common stock (100 shares) | 4/1/2010 | 3,000 | 1,713 | ||||||||||||||
| Ciena Capital LLC(7) | Real estate and small business loan servicer | First lien senior secured revolving loan ($14,000 par due 12/2014) | 6.00% | 11/29/2010 | 14,000 | 14,000 | (2) | ||||||||||||
| First lien senior secured loan ($26,000 par due 12/2016) | 12.00% | 11/29/2010 | 26,000 | 26,000 | (2) | ||||||||||||||
| Equity interests | 11/29/2010 | 53,374 | 10,926 | (2) | |||||||||||||||
| | | | | | | | | | | | | | | | | | | | |
| 93,374 | 50,926 | ||||||||||||||||||
| Commercial Credit Group, Inc. | Commercial equipment finance and leasing company | Senior subordinated loan ($28,000 par due 5/2018) | 12.75% | 5/10/2012 | 28,000 | 28,000 | (2) | ||||||||||||
| Cook Inlet Alternative Risk, LLC | Risk management services | Senior subordinated loan ($1,750 par due 9/2015) | 9.00% | 9/30/2011 | 1,750 | 1,750 | (2) | ||||||||||||
| Gordian Acquisition Corp. | Financial services firm | Common stock (526 shares) | 11/30/2012 | — | — | (2) | |||||||||||||
| Imperial Capital Group LLC | Investment services | 2006 Class B common units (2,526 units) | 5/10/2007 | 3 | 5 | (2) | |||||||||||||
| 2007 Class B common units (315 units) | 5/10/2007 | — | 1 | (2) | |||||||||||||||
| Class A common units (7,710 units) | 5/10/2007 | 14,997 | 19,672 | (2) | |||||||||||||||
| | | | | | | | | | | | | | | | | | | | |
| 15,000 | 19,678 | ||||||||||||||||||
| Ivy Hill Asset Management, L.P.(7)(9) | Asset management services | Member interest (100.00% interest) | 6/15/2009 | 170,961 | 280,353 | ||||||||||||||
| | | | | | | | | | | | | | | | | | | | |
| 317,162 | 392,138 | 8.00 | % | ||||||||||||||||
| | | | | | | | | | | | | | | | | | | | |
| Consumer Products—Non-durable | |||||||||||||||||||
| Gilchrist & Soames, Inc. | Personal care manufacturer | First lien senior secured revolving loan ($8,700 par due 12/2014) | 6.25% (Libor + 5.00%/M) | 4/1/2010 | 8,700 | 8,700 | (2)(25) | ||||||||||||
| First lien senior secured loan ($22,508 par due 12/2014) | 13.44% Cash, 2.00% PIK | 4/1/2010 | 22,504 | 21,833 | (2) | ||||||||||||||
| | | | | | | | | | | | | | | | | | | | |
| 31,204 | 30,533 | ||||||||||||||||||
| Implus Footcare, LLC | Provider of footwear and other accessories | Preferred stock (455 shares) | 6.00% PIK | 10/31/2011 | 5,172 | 5,172 | (2) | ||||||||||||
| Common stock (455 shares) | 10/31/2011 | 455 | 170 | (2) | |||||||||||||||
| | | | | | | | | | | | | | | | | | | | |
| 5,627 | 5,342 | ||||||||||||||||||
| Insight Pharmaceuticals Corporation(6) | OTC drug products manufacturer | Second lien senior secured loan ($19,310 par due 8/2017) | 13.25% (Libor + 11.75%/Q) | 8/26/2011 | 19,165 | 19,310 | (2)(25) | ||||||||||||
| Class A common stock (155,000 shares) | 8/26/2011 | 6,035 | 7,234 | (2) | |||||||||||||||
| Class B common stock (155,000 shares) | 8/26/2011 | 6,035 | 7,234 | (2) | |||||||||||||||
| | | | | | | | | | | | | | | | | | | | |
| 31,235 | 33,778 | ||||||||||||||||||
| Matrixx Initiatives, Inc. and Wonder Holdings Acquisition Corp. | Developer and marketer of over-the-counter healthcare products | Warrants to purchase up to 1,654,678 shares of common stock | 7/27/2011 | — | 1,219 | (2) | |||||||||||||
| Warrants to purchase up to 1,489 shares of preferred stock | 7/27/2011 | — | 1,144 | (2) | |||||||||||||||
| | | | | | | | | | | | | | | | | | | | |
| — | 2,363 | ||||||||||||||||||
| Oak Parent, Inc. | Manufacturer of athletic apparel | First lien senior secured loan ($31,295 par due 4/2018) | 7.50% (Libor + 7.00%/Q) | 4/2/2012 | 31,184 | 31,294 | (3)(25) | ||||||||||||
| First lien senior secured loan ($86 par due 4/2018) | 9.25% (Base Rate + 6.00%/S) | 4/2/2012 | 85 | 86 | (3)(25) | ||||||||||||||
| First lien senior secured loan ($8,844 par due 4/2018) | 7.50% (Libor + 7.00%/Q) | 4/2/2012 | 8,813 | 8,844 | (4)(25) | ||||||||||||||
F-40
Company(1)
|
Business Description | Investment | Interest(5)(11) | Acquisition Date |
Amortized Cost |
Fair Value |
Percentage of Net Assets |
||||||||||||
|---|---|---|---|---|---|---|---|---|---|---|---|---|---|---|---|---|---|---|---|
| First lien senior secured loan ($24 par due 4/2018) | 9.25% (Base Rate + 6.00%/S) | 4/2/2012 | 24 | 24 | (4)(25) | ||||||||||||||
| | | | | | | | | | | | | | | | | | | | |
| 40,106 | 40,248 | ||||||||||||||||||
| PG-ACP Co-Invest, LLC | Supplier of medical uniforms, specialized medical footwear and accessories | Class A membership units (1,000,0000 units) | 8/29/2012 | 1,000 | 1,526 | (2) | |||||||||||||
| The Step2 Company, LLC | Toy manufacturer | Second lien senior secured loan ($25,600 par due 4/2015) | 10.00% | 4/1/2010 | 25,089 | 25,088 | (2) | ||||||||||||
| Second lien senior secured loan ($32,865 par due 4/2015) | 10.00% | 4/1/2010 | 30,802 | 26,292 | (2) | ||||||||||||||
| Common units (1,116,879 units) | 4/1/2010 | 24 | — | ||||||||||||||||
| Warrants to purchase up to 3,157,895 units | 4/1/2010 | — | — | ||||||||||||||||
| | | | | | | | | | | | | | | | | | | | |
| 55,915 | 51,380 | ||||||||||||||||||
| The Thymes, LLC(7) | Cosmetic products manufacturer | Preferred units (6,283 units) | 8.00% PIK | 6/21/2007 | 4,696 | 4,221 | |||||||||||||
| Common units (5,400 units) | 6/21/2007 | — | 6,687 | ||||||||||||||||
| | | | | | | | | | | | | | | | | | | | |
| 4,696 | 10,908 | ||||||||||||||||||
| Woodstream Corporation | Pet products manufacturer | First lien senior secured loan ($8,465 par due 8/2016) | 6.00% (Libor + 5.00%/Q) | 4/18/2012 | 8,465 | 8,465 | (4)(25) | ||||||||||||
| Senior subordinated loan ($80,000 par due 2/2017) | 11.50% | 4/18/2012 | 77,412 | 80,000 | (2) | ||||||||||||||
| Common stock (4,254 shares) | 1/22/2010 | 1,222 | 2,685 | (2) | |||||||||||||||
| | | | | | | | | | | | | | | | | | | | |
| 87,099 | 91,150 | ||||||||||||||||||
| | | | | | | | | | | | | | | | | | | | |
| 256,882 | 267,228 | 5.45 | % | ||||||||||||||||
| | | | | | | | | | | | | | | | | | | | |
| Containers—Packaging | |||||||||||||||||||
| ICSH, Inc. | Industrial container manufacturer, reconditioner and servicer | First lien senior secured revolving loan | 8/31/2011 | — | — | (2)(27) | |||||||||||||
| First lien senior secured loan ($27,740 par due 8/2016) | 7.00% (Libor + 6.00%/Q) | 8/31/2011 | 27,777 | 27,740 | (2)(25) | ||||||||||||||
| First lien senior secured loan ($61,518 par due 8/2016) | 7.00% (Libor + 6.00%/Q) | 8/31/2011 | 61,518 | 61,518 | (3)(25) | ||||||||||||||
| First lien senior secured loan ($14,718 par due 8/2016) | 7.00% (Libor + 6.00%/Q) | 8/31/2011 | 14,718 | 14,718 | (4)(25) | ||||||||||||||
| | | | | | | | | | | | | | | | | | | | |
| 104,013 | 103,976 | ||||||||||||||||||
| Microstar Logistics LLC, Microstar Global Asset Management LLC, and MStar Holding Corporation | Keg management solutions provider | Second lien senior secured loan ($142,500 par due 12/2018) | 8.50% (Libor + 7.50%/Q) | 12/14/2012 | 142,500 | 142,500 | (2)(25) | ||||||||||||
| Common stock (50,000 shares) | 12/14/2012 | 5,000 | 7,223 | (2) | |||||||||||||||
| | | | | | | | | | | | | | | | | | | | |
| 147,500 | 149,723 | ||||||||||||||||||
| Pregis Corporation, Pregis Intellipack Corp., and Pregis Innovative Packaging Inc. | Provider of highly-customized, tailored protective packaging solutions | First lien senior secured loan ($975 par due 3/2017) | 7.75% (Libor + 6.25%/M) | 4/25/2012 | 975 | 975 | (2)(25) | ||||||||||||
| First lien senior secured loan ($5 par due 3/2017) | 8.50% (Base Rate + 5.25%/Q) | 4/25/2012 | 5 | 5 | (2)(25) | ||||||||||||||
| | | | | | | | | | | | | | | | | | | | |
| 980 | 980 | ||||||||||||||||||
| | | | | | | | | | | | | | | | | | | | |
| 252,493 | 254,679 | 5.19 | % | ||||||||||||||||
| | | | | | | | | | | | | | | | | | | | |
F-41
Company(1)
|
Business Description | Investment | Interest(5)(11) | Acquisition Date |
Amortized Cost |
Fair Value |
Percentage of Net Assets |
||||||||||||
|---|---|---|---|---|---|---|---|---|---|---|---|---|---|---|---|---|---|---|---|
| Manufacturing | |||||||||||||||||||
| Cambrios Technologies Corporation | Nanotechnology-based solutions for electronic devices and computers | First lien senior secured loan ($3,030 par due 8/2015) | 12.00% | 8/7/2012 | 3,030 | 3,030 | (2) | ||||||||||||
| Warrants to purchase up to 400,000 shares of Series D-4 convertible preferred stock | 8/7/2012 | — | 6 | (2) | |||||||||||||||
| | | | | | | | | | | | | | | | | | | | |
| 3,030 | 3,036 | ||||||||||||||||||
| Component Hardware Group, Inc. | Commercial equipment | First lien senior secured loan ($23,701 par due 7/2019) | 5.50% (Libor + 4.50%/M) | 7/1/2013 | 23,701 | 23,701 | (2)(25) | ||||||||||||
| Lighting Science Group Corporation | Advanced lighting products | Letter of credit facility | 9/20/2011 | — | — | (2)(29) | |||||||||||||
| Mac Lean-Fogg Company | Provider of intelligent transportation systems products in the traffic and rail industries | Senior subordinated loan ($100,251 par due 10/2023) | 9.50% Cash, 1.50% PIK | 10/31/2013 | 100,251 | 100,251 | (2) | ||||||||||||
| MWI Holdings, Inc. | Engineered springs, fasteners, and other precision components | First lien senior secured loan ($38,274 par due 3/2019) | 9.38% (Libor + 8.13%/Q) | 6/15/2011 | 38,274 | 38,274 | (2)(25) | ||||||||||||
| First lien senior secured loan ($10,000 par due 3/2019) | 9.38% (Libor + 8.13%/Q) | 6/15/2011 | 10,000 | 10,000 | (4)(25) | ||||||||||||||
| | | | | | | | | | | | | | | | | | | | |
| 48,274 | 48,274 | ||||||||||||||||||
| NetShape Technologies, Inc. | Metal precision engineered components | First lien senior secured revolving loan ($538 par due 12/2014) | 7.50% (Libor + 6.50%/Q) | 4/1/2010 | 538 | 538 | (2)(25) | ||||||||||||
| Pelican Products, Inc. | Flashlights | First lien senior secured loan ($2,317 par due 7/2018) | 6.25% (Libor + 5.00%/Q) | 7/13/2012 | 2,317 | 2,317 | (4)(25) | ||||||||||||
| Second lien senior secured loan ($32,000 par due 6/2019) | 11.50% (Libor + 10.00%/Q) | 7/13/2012 | 32,000 | 32,000 | (2)(25) | ||||||||||||||
| | | | | | | | | | | | | | | | | | | | |
| 34,317 | 34,317 | ||||||||||||||||||
| Protective Industries, Inc. dba Caplugs | Plastic protection products | First lien senior secured loan ($997 par due 10/2019) | 6.75% (Libor + 5.75%/Q) | 11/30/2012 | 997 | 997 | (2)(25) | ||||||||||||
| Preferred stock (2,379,361 shares) | 5/23/2011 | 1,298 | 4,837 | (2) | |||||||||||||||
| | | | | | | | | | | | | | | | | | | | |
| 2,295 | 5,834 | ||||||||||||||||||
| Saw Mill PCG Partners LLC | Metal precision engineered components | Common units (1,000 units) | 1/30/2007 | 1,000 | — | (2) | |||||||||||||
| SSH Environmental Industries, Inc. and SSH Non-Destructive Testing, Inc. | Magnetic sensors and supporting sensor products | First lien senior secured loan ($11,140 par due 12/2016) | 9.00% (Libor + 7.50%/Q) | 3/23/2012 | 10,990 | 11,140 | (2)(25) | ||||||||||||
| TPTM Merger Corp. | Time temperature indicator products | First lien senior secured revolving loan ($950 par due 9/2018) | 6.25% (Libor + 5.25%/Q) | 9/12/2013 | 950 | 950 | (2)(25) | ||||||||||||
| First lien senior secured revolving loan ($540 par due 9/2018) | 7.50% (Base Rate + 4.25%/Q) | 9/12/2013 | 540 | 540 | (2)(25) | ||||||||||||||
| First lien senior secured loan ($25,935 par due 9/2018) | 6.25% (Libor + 5.25%/Q) | 9/12/2013 | 25,935 | 25,935 | (2)(25) | ||||||||||||||
| | | | | | | | | | | | | | | | | | | | |
| 27,425 | 27,425 | ||||||||||||||||||
| | | | | | | | | | | | | | | | | | | | |
| 251,821 | 254,516 | 5.19 | % | ||||||||||||||||
| | | | | | | | | | | | | | | | | | | | |
| Automotive Services | |||||||||||||||||||
| Driven Holdings, LLC | Automotive aftermarket car care franchisor | Preferred stock (247,500 units) | 12/16/2011 | 2,475 | 2,852 | (2) | |||||||||||||
| Common stock (25,000 units) | 12/16/2011 | 25 | 808 | (2) | |||||||||||||||
| | | | | | | | | | | | | | | | | | | | |
| 2,500 | 3,660 | ||||||||||||||||||
| Eckler Industries, Inc. | Restoration parts and accessories provider for classic automobiles | First lien senior secured revolving loan ($2,000 par due 7/2017) | 8.25% (Base Rate + 5.00%/Q) | 7/12/2012 | 2,000 | 2,000 | (2)(25) | ||||||||||||
| First lien senior secured loan ($8,172 par due 7/2017) | 7.25% (Libor + 6.00%/M) | 7/12/2012 | 8,172 | 8,172 | (2)(25) | ||||||||||||||
| First lien senior secured loan ($30,609 par due 7/2017) | 7.25% (Libor + 6.00%/M) | 7/12/2012 | 30,609 | 30,609 | (3)(25) | ||||||||||||||
F-42
Company(1)
|
Business Description | Investment | Interest(5)(11) | Acquisition Date |
Amortized Cost |
Fair Value |
Percentage of Net Assets |
||||||||||||
|---|---|---|---|---|---|---|---|---|---|---|---|---|---|---|---|---|---|---|---|
| Series A preferred stock (1,800 shares) | 7/12/2012 | 1,800 | 2,031 | (2) | |||||||||||||||
| Common stock (20,000 shares) | 7/12/2012 | 200 | 116 | (2) | |||||||||||||||
| | | | | | | | | | | | | | | | | | | | |
| 42,781 | 42,928 | ||||||||||||||||||
| EcoMotors, Inc. | Engine developer | First lien senior secured loan ($5,000 par due 10/2016) | 10.83% | 12/28/2012 | 4,869 | 5,000 | (2) | ||||||||||||
| First lien senior secured loan ($5,000 par due 6/2017) | 10.83% | 12/28/2012 | 4,853 | 5,000 | (2) | ||||||||||||||
| First lien senior secured loan ($4,833 par due 7/2016) | 10.13% | 12/28/2012 | 4,724 | 4,833 | (2) | ||||||||||||||
| Warrant to purchase up to 321,888 shares of Series C preferred stock | 12/28/2012 | — | 43 | (2) | |||||||||||||||
| | | | | | | | | | | | | | | | | | | | |
| 14,446 | 14,876 | ||||||||||||||||||
| Service King Paint & Body, LLC | Collision repair site operators | First lien senior secured loan ($7,617 par due 8/2017) | 4.00% (Libor + 3.00%/Q) | 8/20/2012 | 7,617 | 7,617 | (2)(25) | ||||||||||||
| First lien senior secured loan ($46,898 par due 8/2017) | 6.00% (Libor + 5.00%/Q) | 8/20/2012 | 46,898 | 46,898 | (2)(16)(25) | ||||||||||||||
| First lien senior secured loan ($6,398 par due 8/2017) | 4.00% (Libor + 3.00%/Q) | 8/20/2012 | 6,398 | 6,398 | (2)(25) | ||||||||||||||
| First lien senior secured loan ($72,135 par due 8/2017) | 6.00% (Libor + 5.00%/Q) | 8/20/2012 | 72,135 | 72,135 | (2)(16)(25) | ||||||||||||||
| First lien senior secured loan ($9,646 par due 8/2017) | 4.00% (Libor + 3.00%/Q) | 8/20/2012 | 9,646 | 9,646 | (4)(25) | ||||||||||||||
| First lien senior secured loan ($10,000 par due 8/2017) | 6.00% (Libor + 5.00%/Q) | 8/20/2012 | 10,000 | 10,000 | (3)(16)(25) | ||||||||||||||
| Membership interest | 8/20/2012 | 5,000 | 6,948 | (2) | |||||||||||||||
| | | | | | | | | | | | | | | | | | | | |
| 157,694 | 159,642 | ||||||||||||||||||
| | | | | | | | | | | | | | | | | | | | |
| 217,421 | 221,106 | 4.51 | % | ||||||||||||||||
| | | | | | | | | | | | | | | | | | | | |
| Retail | |||||||||||||||||||
| Fulton Holdings Corp.(12) | Airport restaurant operator | First lien senior secured loan ($43,000 par due 5/2018) | 8.50% | 5/10/2013 | 43,000 | 43,000 | (2)(12) | ||||||||||||
| First lien senior secured loan ($40,000 par due 5/2018) | 8.50% | 5/28/2010 | 40,000 | 40,000 | (3)(12) | ||||||||||||||
| Common stock (19,672 shares) | 5/28/2010 | 1,461 | 2,086 | (2) | |||||||||||||||
| | | | | | | | | | | | | | | | | | | | |
| 84,461 | 85,086 | ||||||||||||||||||
| Paper Source, Inc. and Pine Holdings, Inc. | Retailer of fine and artisanal papers, gifts, gift wrap, greeting cards and envelopes | First lien senior secured loan ($18,952 par due 9/2018) | 7.25% (Libor + 6.25%/Q) | 9/23/2013 | 18,952 | 18,952 | (2)(25) | ||||||||||||
| Class A common stock (36,364 shares) | 9/23/2013 | 6,000 | 6,660 | (2) | |||||||||||||||
| | | | | | | | | | | | | | | | | | | | |
| 24,952 | 25,612 | ||||||||||||||||||
| Things Remembered Inc. and TRM Holdings Corporation | Personalized gifts retailer | First lien senior secured loan ($14,813 par due 5/2018) | 8.00% (Libor + 6.50%/Q) | 5/24/2012 | 14,813 | 14,813 | (4)(25) | ||||||||||||
| | | | | | | | | | | | | | | | | | | | |
| 124,226 | 125,511 | 2.56 | % | ||||||||||||||||
| | | | | | | | | | | | | | | | | | | | |
| Chemicals | |||||||||||||||||||
| Argotec, LLC | Thermoplastic polyurethane films | First lien senior secured revolving loan ($625 par due 5/2018) | 7.00% (Base Rate + 3.75%/M) | 5/31/2013 | 625 | 625 | (2)(25) | ||||||||||||
| First lien senior secured loan ($5,788 par due 5/2019) | 5.75% (Libor + 4.75%/M) | 5/31/2013 | 5,788 | 5,788 | (2)(25) | ||||||||||||||
| First lien senior secured loan ($74 par due 5/2019) | 7.00% (Base Rate + 3.75%/Q) | 5/31/2013 | 74 | 74 | (2)(25) | ||||||||||||||
| | | | | | | | | | | | | | | | | | | | |
| 6,487 | 6,487 | ||||||||||||||||||
| Emerald Performance Materials, LLC | Polymers and performance materials manufacturer | First lien senior secured loan ($17,730 par due 5/2018) | 6.75% (Libor + 5.50%/Q) | 12/13/2013 | 18,256 | 18,262 | (25) | ||||||||||||
| Genomatica, Inc. | Developer of a biotechnology platform for the production of chemical products | First lien senior secured loan ($1,500 par due 10/2016) | 9.26% | 3/28/2013 | 1,439 | 1,500 | (2) | ||||||||||||
F-43
Company(1)
|
Business Description | Investment | Interest(5)(11) | Acquisition Date |
Amortized Cost |
Fair Value |
Percentage of Net Assets |
||||||||||||
|---|---|---|---|---|---|---|---|---|---|---|---|---|---|---|---|---|---|---|---|
| Warrant to purchase 322,422 shares of Series D preferred stock | 3/28/2013 | — | 6 | (2) | |||||||||||||||
| | | | | | | | | | | | | | | | | | | | |
| 1,439 | 1,506 | ||||||||||||||||||
| K2 Pure Solutions Nocal, L.P. | Chemical producer | First lien senior secured revolving loan ($2,256 par due 8/2019) | 8.13% (Libor + 7.13%/M) | 8/19/2013 | 2,256 | 2,211 | (2)(25) | ||||||||||||
| First lien senior secured loan ($41,500 par due 8/2019) | 7.00% (Libor + 6.00%/M) | 8/19/2013 | 41,500 | 40,670 | (2)(25) | ||||||||||||||
| First lien senior secured loan ($40,000 par due 8/2019) | 7.00% (Libor + 6.00%/M) | 8/19/2013 | 40,000 | 39,200 | (3)(25) | ||||||||||||||
| | | | | | | | | | | | | | | | | | | | |
| 83,756 | 82,081 | ||||||||||||||||||
| | | | | | | | | | | | | | | | | | | | |
| 109,938 | 108,336 | 2.21 | % | ||||||||||||||||
| | | | | | | | | | | | | | | | | | | | |
| Aerospace and Defense | |||||||||||||||||||
| Cadence Aerospace, LLC (fka PRV Aerospace, LLC) | Aerospace precision components manufacturer | First lien senior secured loan ($4,459 par due 5/2018) | 6.50% (Libor + 5.25%/Q) | 5/15/2012 | 4,425 | 4,459 | (4)(25) | ||||||||||||
| First lien senior secured loan ($65 par due 5/2018) | 7.50% (Base Rate + 4.25%/Q) | 5/15/2012 | 65 | 65 | (4)(25) | ||||||||||||||
| Second lien senior secured loan ($79,657 par due 5/2019) | 10.50% (Libor + 9.25%/Q) | 5/10/2012 | 79,657 | 77,267 | (2)(25) | ||||||||||||||
| | | | | | | | | | | | | | | | | | | | |
| 84,147 | 81,791 | ||||||||||||||||||
| ILC Industries, LLC | Designer and manufacturer of protective cases and technically advanced lighting systems | First lien senior secured loan ($19,192 par due 7/2018) | 8.00% (Libor + 6.50%/Q) | 7/13/2012 | 18,885 | 19,192 | (4)(25) | ||||||||||||
| Wyle Laboratories, Inc. and Wyle Holdings, Inc. | Provider of specialized engineering, scientific and technical services | Senior preferred stock (775 shares) | 8.00% PIK | 1/17/2008 | 111 | 111 | (2) | ||||||||||||
| Common stock (1,885,195 shares) | 1/17/2008 | 2,291 | 1,722 | (2) | |||||||||||||||
| | | | | | | | | | | | | | | | | | | | |
| 2,402 | 1,833 | ||||||||||||||||||
| | | | | | | | | | | | | | | | | | | | |
| 105,434 | 102,816 | 2.10 | % | ||||||||||||||||
| | | | | | | | | | | | | | | | | | | | |
| Printing, Publishing and Media | |||||||||||||||||||
| Batanga, Inc. | Independent digital media company | First lien senior secured revolving loan ($3,000 par due 4/2014) | 8.50% | 10/31/2012 | 3,000 | 3,000 | (2)(23) | ||||||||||||
| First lien senior secured loan ($4,936 par due 11/2016) | 9.60% | 10/31/2012 | 4,936 | 5,030 | (2)(23) | ||||||||||||||
| First lien senior secured loan ($4,500 par due 9/2017) | 9.60% | 10/31/2012 | 4,500 | 4,500 | (2)(23) | ||||||||||||||
| | | | | | | | | | | | | | | | | | | | |
| 12,436 | 12,530 | ||||||||||||||||||
| Earthcolor Group, LLC | Printing management services | Limited liability company interests (9.30%) | 5/18/2012 | — | — | ||||||||||||||
| Encompass Digital Media, Inc. | Provider of outsourced network origination and transmission services for media companies | First lien senior secured loan ($19,651 par due 8/2017) | 6.75% (Libor + 5.50%/Q) | 12/13/2013 | 20,233 | 20,241 | (25) | ||||||||||||
| Summit Business Media Parent Holding Company LLC | Business media consulting services | Limited liability company membership interest (22.99% interest) | 5/20/2011 | — | 1,458 | (2) | |||||||||||||
F-44
Company(1)
|
Business Description | Investment | Interest(5)(11) | Acquisition Date |
Amortized Cost |
Fair Value |
Percentage of Net Assets |
||||||||||||
|---|---|---|---|---|---|---|---|---|---|---|---|---|---|---|---|---|---|---|---|
| The Teaching Company, LLC and The Teaching Company Holdings, Inc. | Education publications provider | First lien senior secured loan ($20,886 par due 3/2017) | 9.00% (Libor + 7.50%/Q) | 9/29/2006 | 20,886 | 20,469 | (2)(25) | ||||||||||||
| First lien senior secured loan ($9,701 par due 3/2017) | 9.00% (Libor + 7.50%/Q) | 9/29/2006 | 9,701 | 9,507 | (4)(25) | ||||||||||||||
| Preferred stock (10,663 shares) | 9/29/2006 | 1,066 | 2,282 | (2) | |||||||||||||||
| Common stock (15,393 shares) | 9/29/2006 | 3 | 5 | (2) | |||||||||||||||
| | | | | | | | | | | | | | | | | | | | |
| 31,656 | 32,263 | ||||||||||||||||||
| | | | | | | | | | | | | | | | | | | | |
| 64,325 | 66,492 | 1.36 | % | ||||||||||||||||
| | | | | | | | | | | | | | | | | | | | |
| Commercial Real Estate Finance | |||||||||||||||||||
| 10th Street, LLC(6) | Real estate holding company | Senior subordinated loan ($26,250 par due 11/2014) | 8.93% Cash, 4.07% PIK | 4/1/2010 | 26,250 | 26,250 | (2) | ||||||||||||
| Member interest (10.00% interest) | 4/1/2010 | 594 | 7,257 | ||||||||||||||||
| Option (25,000 units) | 4/1/2010 | 25 | 25 | ||||||||||||||||
| | | | | | | | | | | | | | | | | | | | |
| 26,869 | 33,532 | ||||||||||||||||||
| American Commercial Coatings, Inc. | Real estate property | Commercial mortgage loan ($2,275 par due 12/2025) | 8.75% (Libor + 7.50%/Q) | 4/1/2010 | 664 | 1,500 | |||||||||||||
| Cleveland East Equity, LLC | Hotel operator | Real estate equity interests | 4/1/2010 | 1,026 | 5,305 | ||||||||||||||
| Commons R-3, LLC | Real estate developer | Real estate equity interests | 4/1/2010 | — | — | ||||||||||||||
| Crescent Hotels & Resorts, LLC and affiliates(7) | Hotel operator | Senior subordinated loan ($2,236 par due 9/2011) | 4/1/2010 | — | — | (2)(24) | |||||||||||||
| Senior subordinated loan ($2,092 par due 6/2017) | 4/1/2010 | — | — | (2)(24) | |||||||||||||||
| Common equity interest | 4/1/2010 | — | — | ||||||||||||||||
| | | | | | | | | | | | | | | | | | | | |
| — | — | ||||||||||||||||||
| Hot Light Brands, Inc.(7) | Real estate holding company | First lien senior secured loan ($31,384 par due 2/2011) | 4/1/2010 | 90 | 253 | (2)(24) | |||||||||||||
| Common stock (93,500 shares) | 4/1/2010 | — | — | (2) | |||||||||||||||
| | | | | | | | | | | | | | | | | | | | |
| 90 | 253 | ||||||||||||||||||
| NPH, Inc. | Hotel property | Real estate equity interests | 4/1/2010 | 5,291 | 5,532 | ||||||||||||||
| | | | | | | | | | | | | | | | | | | | |
| 33,940 | 46,122 | 0.94 | % | ||||||||||||||||
| | | | | | | | | | | | | | | | | | | | |
| Oil and Gas | |||||||||||||||||||
| Geotrace Technologies, Inc. | Reservoir processing and development | Warrants to purchase up to 69,978 shares of common stock | 4/1/2010 | 88 | — | (2) | |||||||||||||
| Warrants to purchase up to 210,453 shares of preferred stock | 4/1/2010 | 2,805 | 638 | (2) | |||||||||||||||
| | | | | | | | | | | | | | | | | | | | |
| 2,893 | 638 | ||||||||||||||||||
| UL Holding Co., LLC and Universal Lubricants, LLC(6) | Petroleum product manufacturer | Second lien senior secured loan ($10,093 par due 12/2014) | 4/30/2012 | 9,519 | 7,260 | (2)(24) | |||||||||||||
| Second lien senior secured loan ($42,812 par due 12/2014) | 4/30/2012 | 40,097 | 30,795 | (2)(24) | |||||||||||||||
| Second lien senior secured loan ($4,994 par due 12/2014) | 4/30/2012 | 4,668 | 3,592 | (2)(24) | |||||||||||||||
| Class A common units (151,236 units) | 6/17/2011 | 1,512 | — | (2) | |||||||||||||||
| Class B-5 common units (599,200 units) | 4/25/2008 | 5,472 | — | (2) | |||||||||||||||
| Class B-4 common units (50,000 units) | 6/17/2011 | 500 | — | (2) | |||||||||||||||
| Class C common units (758,546 units) | 4/25/2008 | — | — | (2) | |||||||||||||||
| | | | | | | | | | | | | | | | | | | | |
| 61,768 | 41,647 | ||||||||||||||||||
| | | | | | | | | | | | | | | | | | | | |
| 64,661 | 42,285 | 0.86 | % | ||||||||||||||||
| | | | | | | | | | | | | | | | | | | | |
F-45
Company(1)
|
Business Description | Investment | Interest(5)(11) | Acquisition Date |
Amortized Cost |
Fair Value |
Percentage of Net Assets |
||||||||||||
|---|---|---|---|---|---|---|---|---|---|---|---|---|---|---|---|---|---|---|---|
| Health Clubs | |||||||||||||||||||
| Athletic Club Holdings, Inc. | Premier health club operator | First lien senior secured loan ($34,000 par due 3/2019) | 7.25% (Libor + 6.00%/M) | 10/11/2007 | 34,000 | 34,000 | (2)(13)(25) | ||||||||||||
| CFW Co-Invest, L.P. and NCP Curves, L.P. | Health club franchisor | Limited partnership interest (4,152,165 shares) | 7/31/2012 | 4,152 | 2,913 | (2) | |||||||||||||
| Limited partnership interest (2,218,235 shares) | 7/31/2012 | 2,218 | 1,556 | (2)(8) | |||||||||||||||
| | | | | | | | | | | | | | | | | | | | |
| 6,370 | 4,469 | ||||||||||||||||||
| | | | | | | | | | | | | | | | | | | | |
| 40,370 | 38,469 | 0.78 | % | ||||||||||||||||
| | | | | | | | | | | | | | | | | | | | |
| Telecommunications | |||||||||||||||||||
| American Broadband Communications, LLC, American Broadband Holding Company, and Cameron Holdings of NC, Inc. | Broadband communication services | Warrants to purchase up to 378 shares | 11/7/2007 | — | 6,833 | (2) | |||||||||||||
| Warrants to purchase up to 200 shares | 9/1/2010 | — | 3,615 | (2) | |||||||||||||||
| | | | | | | | | | | | | | | | | | | | |
| — | 10,448 | ||||||||||||||||||
| EUNetworks Group Limited(8) | Broadband bandwidth infrastructure provider | First lien senior secured loan ($20,567 par due 5/2019) | 7.50% (Libor + 6.50%/Q) | 12/13/2013 | 21,192 | 21,185 | (25) | ||||||||||||
| Quantance, Inc. | Designer of semiconductor products to the mobile wireless market | First lien senior secured loan ($3,500 par due 9/2016) | 10.25% | 8/23/2013 | 3,402 | 3,465 | (2) | ||||||||||||
| Warrant to purchase up to 130,432 shares of Series D preferred stock | 8/23/2013 | 74 | 74 | (2) | |||||||||||||||
| | | | | | | | | | | | | | | | | | | | |
| 3,476 | 3,539 | ||||||||||||||||||
| Startec Equity, LLC(7) | Communication services | Member interest | 4/1/2010 | — | — | ||||||||||||||
| Wilcon Holdings LLC | Communications infrastructure provider | Class A common stock (2,000,000 shares) | 12/13/2013 | 1,829 | 1,829 | ||||||||||||||
| | | | | | | | | | | | | | | | | | | | |
| 26,497 | 37,001 | 0.75 | % | ||||||||||||||||
| | | | | | | | | | | | | | | | | | | | |
| Transportation | |||||||||||||||||||
| Eberle Design, Inc. | Provider of intelligent transportation systems products in the traffic and rail industries | First lien senior secured loan ($30,500 par due 8/2018) | 7.50% (Libor + 6.25%/Q) | 8/26/2013 | 30,359 | 30,500 | (2)(25) | ||||||||||||
| | | | | | | | | | | | | | | | | | | | |
| 30,359 | 30,500 | 0.62 | % | ||||||||||||||||
| | | | | | | | | | | | | | | | | | | | |
| Environmental Services | |||||||||||||||||||
| RE Community Holdings II, Inc.and Pegasus Community Energy, LLC. | Operator of municipal recycling facilities | Preferred stock (1,000 shares) | 3/1/2011 | 8,839 | 532 | (2) | |||||||||||||
| Waste Pro USA, Inc. | Waste management services | Preferred Class A common equity (611,615 shares) | 11/9/2006 | 12,263 | 27,898 | (2) | |||||||||||||
| | | | | | | | | | | | | | | | | | | | |
| 21,102 | 28,430 | 0.58 | % | ||||||||||||||||
| | | | | | | | | | | | | | | | | | | | |
| Food and Beverage | |||||||||||||||||||
| Apple & Eve, LLC and US Juice Partners, LLC(6) | Juice manufacturer | Senior units (50,000 units) | 10/5/2007 | 5,000 | 5,205 | ||||||||||||||
| Charter Baking Company, Inc. | Baked goods manufacturer | Senior subordinated loan ($2,750 par due 6/2015) | 17.50% PIK | 2/6/2008 | 2,750 | 2,750 | (2) | ||||||||||||
| Preferred stock (6,258 shares) | 9/1/2006 | 2,567 | 2,260 | (2) | |||||||||||||||
| | | | | | | | | | | | | | | | | | | | |
| 5,317 | 5,010 | ||||||||||||||||||
| Distant Lands Trading Co. | Coffee manufacturer | Class A common stock (1,294 shares) | 4/1/2010 | 980 | — | (2) | |||||||||||||
| Class A-1 common stock (2,157 shares) | 4/1/2010 | — | — | (2) | |||||||||||||||
| | | | | | | | | | | | | | | | | | | | |
| 980 | — | ||||||||||||||||||
| | | | | | | | | | | | | | | | | | | | |
| 11,297 | 10,215 | 0.21 | % | ||||||||||||||||
| | | | | | | | | | | | | | | | | | | | |
F-46
Company(1)
|
Business Description | Investment | Interest(5)(11) | Acquisition Date |
Amortized Cost |
Fair Value |
Percentage of Net Assets |
||||||||||||
|---|---|---|---|---|---|---|---|---|---|---|---|---|---|---|---|---|---|---|---|
| Wholesale Distribution | |||||||||||||||||||
| BECO Holding Company, Inc. | Wholesale distributor of first response fire protection equipment and related parts | Common stock (25,000 shares) | 7/30/2010 | 2,500 | 3,103 | (2) | |||||||||||||
| | | | | | | | | | | | | | | | | | | | |
| 2,500 | 3,103 | 0.06 | % | ||||||||||||||||
| | | | | | | | | | | | | | | | | | | | |
| $ | 7,537,403 | $ | 7,632,897 | 155.63 | % | ||||||||||||||
| | | | | | | | | | | | | | | | | | | | |
| | | | | | | | | | | | | | | | | | | | |
| | | | | | | | | | | | | | | | | | | | |
- (1)
- Other
than the Company's investments listed in footnote 7 below (subject to the limitations set forth therein), the Company does not "Control" any of its
portfolio companies, for the purposes of the Investment Company Act of 1940, as amended (together with the rules and regulations promulgated thereunder, the "Investment Company Act"). In general,
under the Investment Company Act, the Company would "Control" a portfolio company if the Company owned more than 25% of its outstanding voting securities (i.e., securities with the right to
elect directors) and/or had the power to exercise control over the management or policies of such portfolio company. All of the Company's portfolio company investments, which as of December 31,
2013 represented 156% of the Company's net assets or 94% of the Company's total assets, are subject to legal restrictions on sales.
- (2)
- These
assets are pledged as collateral for the Revolving Credit Facility and, as a result, are not directly available to the creditors of the Company to
satisfy any obligations of the Company other than the Company's obligations under the Revolving Credit Facility (see Note 5 to the consolidated financial statements).
- (3)
- These
assets are owned by the Company's consolidated subsidiary Ares Capital CP, are pledged as collateral for the Revolving Funding Facility and, as a
result, are not directly available to the creditors of the Company to satisfy any obligations of the Company other than Ares Capital CP's obligations under the Revolving Funding Facility (see
Note 5 to the consolidated financial statements).
- (4)
- These
assets are owned by the Company's consolidated subsidiary Ares Capital JB Funding LLC ("ACJB"), are pledged as collateral for the SMBC Funding
Facility and, as a result, are not directly available to the creditors of the Company to satisfy any obligations of the Company other than ACJB's obligations under the SMBC Funding Facility (see
Note 5 to the consolidated financial statements).
- (5)
- Investments
without an interest rate are non income producing.
- (6)
- As defined in the Investment Company Act, the Company is deemed to be an "Affiliated Person" and "Control" this portfolio company because it owns 5% or more of the portfolio company's outstanding voting securities or it has the power to exercise control over the management or policies of such portfolio company (including through a management agreement). Transactions during the year ended December 31, 2013 in which the issuer was an Affiliated Person (but not a portfolio company that the Company is deemed to Control) are as follows:
Company
|
Purchases (cost) | Redemptions (cost) |
Sales (cost) |
Interest income |
Capital structuring service fees |
Dividend income |
Other income |
Net realized gains (losses) |
Net unrealized gains (losses) |
|||||||||||||||||||
|---|---|---|---|---|---|---|---|---|---|---|---|---|---|---|---|---|---|---|---|---|---|---|---|---|---|---|---|---|
10th Street, LLC |
$ | — | $ | — | $ | — | $ | 3,361 | $ | — | $ | — | $ | — | $ | — | $ | 6,781 | ||||||||||
Apple & Eve, LLC and US Juice Partners, LLC |
$ | — | $ | — | $ | — | $ | — | $ | — | $ | — | $ | — | $ | — | $ | 3,807 | ||||||||||
Campus Management Corp. and Campus Management Acquisition Corp |
$ | — | $ | — | $ | — | $ | — | $ | — | $ | — | $ | — | $ | — | $ | (3,252 | ) | |||||||||
Cast & Crew Payroll, LLC and Centerstage Co-Investors, L.L.C. |
$ | — | $ | 6,626 | $ | 30,000 | $ | 6,177 | $ | — | $ | 128 | $ | 154 | $ | — | $ | 3,042 | ||||||||||
CT Technologies Intermediate Holdings, Inc. and CT Technologies Holdings, LLC |
$ | — | $ | 16,195 | $ | — | $ | 875 | $ | 395 | $ | 1,047 | $ | 10 | $ | — | $ | 615 | ||||||||||
The Dwyer Group |
$ | — | $ | — | $ | — | $ | 3,458 | $ | — | $ | 522 | $ | — | $ | — | $ | 4,166 | ||||||||||
ELC Acquisition Corp. and ELC Holdings Corporation |
$ | — | $ | 1,682 | $ | — | $ | — | $ | — | $ | 6,121 | $ | — | $ | — | $ | (2,667 | ) | |||||||||
Insight Pharmaceuticals Corporation |
$ | — | $ | — | $ | — | $ | 2,623 | $ | — | $ | — | $ | — | $ | — | $ | (2,114 | ) | |||||||||
Investor Group Services, LLC |
$ | — | $ | — | $ | — | $ | — | $ | — | $ | 176 | $ | — | $ | 142 | $ | (78 | ) | |||||||||
Multi-Ad Services, Inc. |
$ | — | $ | — | $ | — | $ | — | $ | — | $ | — | $ | — | $ | — | $ | (283 | ) | |||||||||
Pillar Processing LLC and PHL Holding Co. |
$ | — | $ | 3,527 | $ | — | $ | — | $ | — | $ | — | $ | — | $ | 46 | $ | (707 | ) | |||||||||
Soteria Imaging Services, LLC |
$ | — | $ | 2,049 | $ | — | $ | — | $ | — | $ | — | $ | — | $ | (1,448 | ) | $ | 1,208 | |||||||||
VSS-Tranzact Holdings, LLC |
$ | — | $ | — | $ | — | $ | — | $ | — | $ | — | $ | — | $ | — | $ | 1,584 | ||||||||||
UL Holding Co., LLC |
$ | — | $ | 295 | $ | — | $ | 3,037 | $ | — | $ | — | $ | 49 | $ | 15 | $ | (13,225 | ) | |||||||||
F-47
- (7)
- As defined in the Investment Company Act, the Company is deemed to be both an "Affiliated Person" and "Control" this portfolio company because it owns more than 25% of the portfolio company's outstanding voting securities or it has the power to exercise control over the management or policies of such portfolio company (including through a management agreement). Transactions during the period for the year ended December 31, 2013 in which the issuer was both an Affiliated Person and a portfolio company that the Company is deemed to Control are as follows:
Company
|
Purchases | Redemptions (cost) |
Sales (cost) |
Interest income |
Capital structuring service fees |
Dividend income |
Other income |
Net realized gains (losses) |
Net unrealized gains (losses) |
|||||||||||||||||||
|---|---|---|---|---|---|---|---|---|---|---|---|---|---|---|---|---|---|---|---|---|---|---|---|---|---|---|---|---|
AllBridge Financial, LLC |
$ | — | $ | 598 | $ | — | $ | — | $ | — | $ | 864 | $ | — | $ | — | $ | 2,503 | ||||||||||
AWTP, LLC |
$ | — | $ | — | $ | 10,333 | $ | 1,237 | $ | — | $ | — | $ | 269 | $ | 8,740 | $ | (4,580 | ) | |||||||||
Callidus Capital Corporation |
$ | — | $ | — | $ | — | $ | — | $ | — | $ | — | $ | — | $ | — | $ | (6 | ) | |||||||||
Ciena Capital LLC |
$ | — | $ | 6,000 | $ | — | $ | 4,495 | $ | — | $ | — | $ | — | $ | — | $ | (7,691 | ) | |||||||||
Citipostal, Inc. |
$ | 4,000 | $ | 4,738 | $ | — | $ | 5,473 | $ | — | $ | — | $ | (321 | ) | $ | — | $ | (13,787 | ) | ||||||||
Crescent Hotels & Resorts, LLC and affiliates |
$ | — | $ | — | $ | — | $ | — | $ | — | $ | — | $ | — | $ | 194 | $ | — | ||||||||||
HCI Equity, LLC |
$ | — | $ | 340 | $ | — | $ | — | $ | — | $ | — | $ | — | $ | — | $ | 227 | ||||||||||
HCP Acquisition Holdings, LLC |
$ | 6,696 | $ | — | $ | 3,559 | $ | — | $ | — | $ | — | $ | — | $ | (809 | ) | $ | (3,137 | ) | ||||||||
Hot Light Brands, Inc. |
$ | — | $ | 1,573 | $ | — | $ | — | $ | — | $ | — | $ | — | $ | — | $ | 698 | ||||||||||
Ivy Hill Asset Management, L.P. |
$ | — | $ | — | $ | — | $ | — | $ | — | $ | 72,407 | $ | — | $ | — | $ | (13,904 | ) | |||||||||
MVL Group, Inc. |
$ | — | $ | 5,176 | $ | — | $ | 11 | $ | — | $ | — | $ | — | $ | — | $ | 1,525 | ||||||||||
Orion Foods, LLC |
$ | 2,700 | $ | 6,712 | $ | — | $ | 4,285 | $ | — | $ | — | $ | 808 | $ | — | $ | 7,669 | ||||||||||
Senior Secured Loan Fund LLC* |
$ | 652,458 | $ | 145,153 | $ | — | $ | 224,867 | $ | 43,119 | $ | — | $ | 23,491 | $ | 7,082 | $ | 421 | ||||||||||
The Thymes, LLC |
$ | — | $ | — | $ | — | $ | — | $ | — | $ | 410 | $ | — | $ | — | $ | 3,460 | ||||||||||
- *
- Together with GE Global Sponsor Finance LLC and General Electric Capital Corporation (together, "GE"), the Company co invests through
the Senior Secured Loan Fund LLC d/b/a the "Senior Secured Loan Program" (the "SSLP"). The SSLP is capitalized as transactions are completed and all portfolio decisions and generally all other
decisions in respect of the SSLP must be approved by an investment committee of the SSLP consisting of representatives of the Company and GE (with approval from a representative of each required);
therefore, although the Company owns more than 25% of the voting securities of the SSLP, the Company does not believe that it has control over the SSLP (for purposes of the Investment Company Act or
otherwise) because, among other things, these "voting securities" do not afford the Company the right to elect directors of the SSLP or any other special rights (see Note 4 to the consolidated
financial statements).
- (8)
- Non
U.S. company or principal place of business outside the U.S. and as a result is not a qualifying asset under Section 55(a) of the Investment
Company Act. Under the Investment Company Act, the Company may not acquire any non qualifying asset unless, at the time such acquisition is made, qualifying assets represent at least 70% of the
Company's total assets.
- (9)
- Excepted
from the definition of investment company under Section 3(c) of the Investment Company Act and as a result is not a qualifying asset under
Section 55(a) of the Investment Company Act. Under the Investment Company Act, the Company may not acquire any non qualifying asset unless, at the time such acquisition is made, qualifying
assets represent at least 70% of the Company's total assets.
- (10)
- In
the first quarter of 2011, the Staff informally communicated to certain BDC's the Staff's belief that certain entities, which would be classified as an
"investment company" under the Investment Company Act but for the exception from the definition of "investment company" set forth in Rule 3a-7 promulgated under the Investment Company Act,
could not be treated as eligible portfolio companies (as defined in Section 2(a)(46) under the Investment Company Act) (i.e., not eligible to be included in a BDC's 70% "qualifying
assets" basket). Subsequently, in August 2011 the Securities and Exchange Commission issued a concept release (the "Concept Release") which stated that "[a]s a general matter,
the Commission presently does not believe that Rule 3a-7 issuers are the type of small, developing and financially troubled businesses in which the U.S. Congress intended BDCs primarily to
invest" and requested comment on whether or not a 3a-7 issuer should be considered an "eligible portfolio company". The Company provided a comment letter in respect of the Concept Release and
continues to believe that the language of Section 2(a)(46) of the Investment Company Act permits a BDC to treat as "eligible portfolio companies" entities that rely on the 3a-7 exception.
However, given the current uncertainty in this area (including the language in the Concept Release) and subsequent discussions with the Staff, the Company has, solely for purposes of calculating the
composition of its portfolio pursuant to Section 55(a) of the Investment Company Act, identified such entities, which include the SSLP, as "non qualifying assets" should the Staff ultimately
disagree with the Company's position.
- (11)
- Variable
rate loans to the Company's portfolio companies bear interest at a rate that may be determined by reference to either LIBOR or an alternate base
rate (commonly based on the Federal Funds Rate or the Prime Rate), at the borrower's option, which reset annually (A), semi annually (S), quarterly (Q), bi monthly (B), monthly (M) or daily
(D). For each such loan, the Company has provided the interest rate in effect on the date presented.
- (12)
- In
addition to the interest earned based on the stated interest rate of this security, the Company is entitled to receive an additional interest amount of
6.00% on $12 million aggregate principal amount of a "first out" tranche of the portfolio company's senior term debt previously syndicated by the Company into "first out" and "last out"
tranches, whereby the "first out" tranche will have priority as to the "last out" tranche with respect to payments of principal, interest and any other amounts due thereunder.
- (13)
- In
addition to the interest earned based on the stated interest rate of this security, the Company is entitled to receive an additional interest amount of
3.00% on $17 million aggregate principal amount of a "first out" tranche of the portfolio company's senior term debt previously syndicated by the Company into "first out" and "last out"
tranches, whereby the "first out" tranche will have priority as to the "last out" tranche with respect to payments of principal, interest and any other amounts due thereunder.
- (14)
- In
addition to the interest earned based on the stated interest rate of this security, the Company is entitled to receive an additional interest amount of
3.25% on $60 million aggregate principal amount of a "first out" tranche of the portfolio company's senior term debt previously syndicated by the Company into "first out" and "last out"
tranches, whereby the "first out" tranche will have priority as to the "last out" tranche with respect to payments of principal, interest and any other amounts due thereunder.
- (15)
- In
addition to the interest earned based on the stated interest rate of this security, the Company is entitled to receive an additional interest amount of
1.13% on $18 million aggregate principal amount of a "first out" tranche of the portfolio company's senior term debt previously syndicated by the Company into "first out" and "last out"
tranches, whereby the "first out" tranche will have priority as to the "last out" tranche with respect to payments of principal, interest and any other amounts due thereunder.
- (16)
- In
addition to the interest earned based on the stated interest rate of this security, the Company is entitled to receive an additional interest amount of
2.00% on $97 million aggregate principal amount of a "first out" tranche of the portfolio company's senior term debt previously syndicated by the Company into "first out" and "last out"
tranches, whereby the "first out" tranche will have priority as to the "last out" tranche with respect to payments of principal, interest and any other amounts due thereunder.
- (17)
- In addition to the interest earned based on the stated interest rate of this security, the Company is entitled to receive an additional interest amount of 3.13% on $55 million aggregate principal amount of a "first out" tranche of the portfolio company's senior term debt previously syndicated by the Company into "first out" and "last out" tranches, whereby the "first out" tranche will have priority as to the "last out" tranche with respect to payments of principal, interest and any other amounts due thereunder.
F-48
- (18)
- In
addition to the interest earned based on the stated interest rate of this security, the Company is entitled to receive an additional interest amount of
3.00% on $27 million aggregate principal amount of a "first out" tranche of the portfolio company's first lien senior secured loans, whereby the "first out" tranche will have priority as to the
"last out" tranche with respect to payments of principal, interest and any other amounts due thereunder.
- (19)
- In
addition to the interest earned based on the stated interest rate of this security, the Company is entitled to receive an additional interest amount of
3.75% on $25 million aggregate principal amount of a "first out" tranche of the portfolio company's first lien senior secured loans, whereby the "first out" tranche will have priority as to the
"last out" tranche with respect to payments of principal, interest and any other amounts due thereunder.
- (20)
- In
addition to the interest earned based on the stated interest rate of this security, the Company is entitled to receive an additional interest amount of
5.00% on $23 million aggregate principal amount of a "first out" tranche of the portfolio company's first lien senior secured loans, whereby the "first out" tranche will have priority as to the
"last out" tranche with respect to payments of principal, interest and any other amounts due thereunder.
- (21)
- In
addition to the interest earned based on the stated interest rate of this security, the Company is entitled to receive an additional interest amount of
0.75% on $45 million aggregate principal amount of a "first out" tranche of the portfolio company's first lien senior secured loans, whereby the "first out" tranche will have priority as to the
"last out" tranche with respect to payments of principal, interest and any other amounts due thereunder.
- (22)
- In
addition to the interest earned based on the stated interest rate of this security, the Company is entitled to receive an additional interest amount of
3.75% on $36 million aggregate principal amount of a "first out" tranche of the portfolio company's first lien senior secured loans, whereby the "first out" tranche will have priority as to the
"last out" tranche with respect to payments of principal, interest and any other amounts due thereunder.
- (23)
- The
Company is entitled to receive a fixed fee upon the occurrence of certain events as defined in the credit agreement governing the Company's debt
investment in the portfolio company. The fair value of such fee is included in the fair value of the debt investment.
- (24)
- Loan
was on non accrual status as of December 31, 2013.
- (25)
- Loan
includes interest rate floor feature.
- (26)
- In
addition to the interest earned based on the stated contractual interest rate of this security, the certificates entitle the holders thereof to receive
a portion of the excess cash flow from the SSLP's loan portfolio, which may result in a return to the Company greater than the contractual stated interest rate.
- (27)
- As
of December 31, 2013, no amounts were funded by the Company under this first lien senior secured revolving loan; however, there were letters of
credit issued and outstanding through a financial intermediary under the loan. See Note 7 to the consolidated financial statements for further information on letters of credit commitments
related to certain portfolio companies.
- (28)
- As
of December 31, 2013, in addition to the amounts funded by the Company under this first lien senior secured revolving loan, there were also
letters of credit issued and outstanding through a financial intermediary under the loan. See Note 7 to the consolidated financial statements for further information on letters of credit
commitments related to certain portfolio companies.
- (29)
- As of December 31, 2013, no amounts were funded by the Company under this letter of credit facility; however, there were letters of credit issued and outstanding through a financial intermediary under the letter of credit facility. See Note 7 to the consolidated financial statements for further information on letters of credit commitments related to certain portfolio companies.
F-49
ARES CAPITAL CORPORATION AND SUBSIDIARIES
CONSOLIDATED STATEMENT OF STOCKHOLDERS' EQUITY
(in thousands, except per share data)
| |
|
|
|
|
Accumulated Net Realized Loss on Investments, Foreign Currency Transactions, Extinguishment of Debt and Other Assets |
|
|
|||||||||||||||
|---|---|---|---|---|---|---|---|---|---|---|---|---|---|---|---|---|---|---|---|---|---|---|
| |
|
|
|
|
Net Unrealized Gains (Losses) on Investments and Foreign Currency Transactions |
|
||||||||||||||||
| |
Common Stock | |
Accumulated Overdistributed Net Investment Income |
|
||||||||||||||||||
| |
Capital in Excess of Par Value |
Total Stockholders' Equity |
||||||||||||||||||||
| |
Shares | Amount | ||||||||||||||||||||
Balance at December 31, 2011 |
205,130 | $ | 205 | $ | 3,390,354 | $ | (10,449 | ) | $ | (218,688 | ) | $ | (14,157 | ) | $ | 3,147,265 | ||||||
Issuances of common stock in add-on offerings (net of offering and underwriting costs) |
42,297 | 43 | 679,938 | — | — | — | 679,981 | |||||||||||||||
Shares issued in connection with dividend reinvestment plan |
1,226 | 1 | 20,448 | — | — | — | 20,449 | |||||||||||||||
Issuances of the Convertible Unsecured Notes (See Note 5) |
— | — | 9,967 | — | — | — | 9,967 | |||||||||||||||
Net increase in stockholders' equity resulting from operations |
— | — | — | 348,861 | 44,056 | 115,261 | 508,178 | |||||||||||||||
Dividends declared and payable ($1.60 per share) |
— | — | — | (377,494 | ) | — | — | (377,494 | ) | |||||||||||||
Tax reclassification of stockholders' equity in accordance with generally accepted accounting principles |
— | — | 16,810 | 11,172 | (27,982 | ) | — | — | ||||||||||||||
| | | | | | | | | | | | | | | | | | | | | | | |
Balance at December 31, 2012 |
248,653 | $ | 249 | $ | 4,117,517 | $ | (27,910 | ) | $ | (202,614 | ) | $ | 101,104 | $ | 3,988,346 | |||||||
| | | | | | | | | | | | | | | | | | | | | | | |
| | | | | | | | | | | | | | | | | | | | | | | |
| | | | | | | | | | | | | | | | | | | | | | | |
Issuances of common stock in add-on offerings (net of offering and underwriting costs) |
48,242 | 48 | 833,428 | — | — | — | 833,476 | |||||||||||||||
Shares issued in connection with dividend reinvestment plan |
1,076 | 1 | 18,905 | — | — | — | 18,906 | |||||||||||||||
Issuances of the Convertible Unsecured Notes (See Note 5) |
— | — | 582 | — | — | — | 582 | |||||||||||||||
Net increase in stockholders' equity resulting from operations |
— | — | — | 430,406 | 63,725 | (5,610 | ) | 488,521 | ||||||||||||||
Dividends declared and payable ($1.57 per share) |
— | — | — | (425,387 | ) | — | — | (425,387 | ) | |||||||||||||
Tax reclassification of stockholders' equity in accordance with generally accepted accounting principles |
— | — | 12,045 | 14,106 | (26,151 | ) | — | — | ||||||||||||||
| | | | | | | | | | | | | | | | | | | | | | | |
Balance at December 31, 2013 |
297,971 | $ | 298 | $ | 4,982,477 | $ | (8,785 | ) | $ | (165,040 | ) | $ | 95,494 | $ | 4,904,444 | |||||||
| | | | | | | | | | | | | | | | | | | | | | | |
| | | | | | | | | | | | | | | | | | | | | | | |
| | | | | | | | | | | | | | | | | | | | | | | |
Issuances of common stock in add-on offerings (net of offering and underwriting costs) |
15,525 | 15 | 257,652 | — | — | — | 257,667 | |||||||||||||||
Shares issued in connection with dividend reinvestment plan |
612 | 1 | 10,846 | — | — | — | 10,847 | |||||||||||||||
Net increase in stockholders' equity resulting from operations |
— | — | — | 437,802 | 93,783 | 59,364 | 590,949 | |||||||||||||||
Dividends declared and payable ($1.57 per share) |
— | — | — | (480,192 | ) | — | — | (480,192 | ) | |||||||||||||
Tax reclassification of stockholders' equity in accordance with generally accepted accounting principles |
— | — | 77,082 | 18,329 | (95,411 | ) | — | — | ||||||||||||||
| | | | | | | | | | | | | | | | | | | | | | | |
Balance at December 31, 2014 |
314,108 | $ | 314 | $ | 5,328,057 | $ | (32,846 | ) | $ | (166,668 | ) | $ | 154,858 | $ | 5,283,715 | |||||||
| | | | | | | | | | | | | | | | | | | | | | | |
| | | | | | | | | | | | | | | | | | | | | | | |
| | | | | | | | | | | | | | | | | | | | | | | |
See accompanying notes to consolidated financial statements.
F-50
ARES CAPITAL CORPORATION AND SUBSIDIARIES
CONSOLIDATED STATEMENT OF CASH FLOWS
(in thousands)
| |
For the Years Ended December 31, | |||||||||
|---|---|---|---|---|---|---|---|---|---|---|
| |
2014 | 2013 | 2012 | |||||||
OPERATING ACTIVITIES: |
||||||||||
Net increase in stockholders' equity resulting from operations |
$ | 590,949 | $ | 488,521 | $ | 508,178 | ||||
Adjustments to reconcile net increase in stockholders' equity resulting from operations: |
||||||||||
Realized losses on extinguishment of debt |
72 | — | 2,678 | |||||||
Net realized gains on investments and foreign currency transactions |
(93,855 | ) | (63,725 | ) | (46,734 | ) | ||||
Net unrealized (gains) losses on investments and foreign currency transactions |
(59,364 | ) | 5,610 | (115,261 | ) | |||||
Net accretion of discount on investments |
(3,153 | ) | (4,692 | ) | (13,747 | ) | ||||
Increase in payment-in-kind interest and dividends |
(11,916 | ) | (18,894 | ) | (25,036 | ) | ||||
Collections of payment-in-kind interest and dividends |
12,054 | 29,531 | 21,465 | |||||||
Amortization of debt issuance costs |
16,384 | 13,230 | 13,140 | |||||||
Accretion of net discount on notes payable |
15,107 | 13,806 | 11,310 | |||||||
Depreciation |
805 | 802 | 829 | |||||||
Proceeds from sales and repayments of investments |
3,411,764 | 1,722,672 | 2,494,062 | |||||||
Purchases of investments |
(4,536,804 | ) | (3,494,767 | ) | (3,160,021 | ) | ||||
Changes in operating assets and liabilities: |
||||||||||
Interest receivable |
(37,000 | ) | (14,983 | ) | (9,920 | ) | ||||
Other assets |
(2,317 | ) | (8,333 | ) | 19,042 | |||||
Base management fees payable |
5,227 | 6,155 | 3,973 | |||||||
Income based fees payable |
4,069 | 1,351 | 3,252 | |||||||
Capital gains and incentive fees payable |
12,042 | 117 | 31,864 | |||||||
Accounts payable and other liabilities |
13,243 | 13,771 | 5,774 | |||||||
Interest and facility fees payable |
4,146 | 12,225 | 4,220 | |||||||
| | | | | | | | | | | |
Net cash used in operating activities |
(658,547 | ) | (1,297,603 | ) | (250,932 | ) | ||||
| | | | | | | | | | | |
FINANCING ACTIVITIES: |
||||||||||
Net proceeds from issuance of common stock |
257,667 | 833,476 | 679,981 | |||||||
Borrowings on debt |
4,878,451 | 6,431,179 | 3,212,458 | |||||||
Repayments and repurchases of debt |
(3,955,423 | ) | (5,654,000 | ) | (3,091,531 | ) | ||||
Debt issuance costs |
(12,849 | ) | (21,013 | ) | (44,383 | ) | ||||
Dividends paid |
(464,373 | ) | (411,453 | ) | (357,332 | ) | ||||
| | | | | | | | | | | |
Net cash provided by financing activities |
703,473 | 1,178,189 | 399,193 | |||||||
| | | | | | | | | | | |
CHANGE IN CASH AND CASH EQUIVALENTS |
44,926 | (119,414 | ) | 148,261 | ||||||
CASH AND CASH EQUIVALENTS, BEGINNING OF PERIOD |
149,629 | 269,043 | 120,782 | |||||||
| | | | | | | | | | | |
CASH AND CASH EQUIVALENTS, END OF PERIOD |
$ | 194,555 | $ | 149,629 | $ | 269,043 | ||||
| | | | | | | | | | | |
| | | | | | | | | | | |
| | | | | | | | | | | |
Supplemental Information: |
||||||||||
Interest paid during the period |
$ | 169,222 | $ | 124,406 | $ | 108,761 | ||||
Taxes, including excise tax, paid during the period |
$ | 20,809 | $ | 13,907 | $ | 10,149 | ||||
Dividends declared and payable during the period |
$ | 480,192 | $ | 425,387 | $ | 377,494 | ||||
See accompanying notes to consolidated financial statements.
F-51
ARES CAPITAL CORPORATION AND SUBSIDIARIES
NOTES TO CONSOLIDATED FINANCIAL STATEMENTS
As of December 31, 2014
(in thousands, except per share data, percentages and as otherwise indicated;
for example, with the words "million," "billion" or otherwise)
1. ORGANIZATION
Ares Capital Corporation (the "Company" or "ARCC") is a specialty finance company that is a closed-end, non-diversified management investment company incorporated in Maryland. The Company has elected to be regulated as a business development company ("BDC") under the Investment Company Act of 1940, as amended (together with the rules and regulations promulgated thereunder, the "Investment Company Act"). The Company has elected to be treated as a regulated investment company ("RIC") under the Internal Revenue Code of 1986, as amended (the "Code") and operates in a manner so as to qualify for the tax treatment applicable to RICs.
The Company's investment objective is to generate both current income and capital appreciation through debt and equity investments. The Company invests primarily in first lien senior secured loans (including "unitranche" loans, which are loans that combine both senior and mezzanine debt, generally in a first lien position), second lien senior secured loans and mezzanine debt, which in some cases includes an equity component. To a lesser extent, the Company also makes equity investments.
The Company is externally managed by Ares Capital Management LLC ("Ares Capital Management" or the Company's "investment adviser"), a subsidiary of Ares Management, L.P. ("Ares Management" or "Ares"), a publicly traded, leading global alternative asset manager, pursuant to an investment advisory and management agreement. Ares Operations LLC ("Ares Operations" or the Company's "administrator"), a subsidiary of Ares Management, provides certain administrative and other services necessary for the Company to operate.
2. SIGNIFICANT ACCOUNTING POLICIES
Basis of Presentation
The accompanying consolidated financial statements have been prepared on the accrual basis of accounting in conformity with U.S. generally accepted accounting principles ("GAAP"), and include the accounts of the Company and its consolidated subsidiaries. The Company is an investment company following accounting and reporting guidance in Accounting Standards Codification ("ASC") 946. The consolidated financial statements reflect all adjustments and reclassifications that, in the opinion of management, are necessary for the fair presentation of the results of the operations and financial condition as of and for the periods presented. All significant intercompany balances and transactions have been eliminated.
Cash and Cash Equivalents
Cash and cash equivalents include funds from time to time deposited with financial institutions and short-term, liquid investments in a money market fund. Cash and cash equivalents are carried at cost which approximates fair value.
Concentration of Credit Risk
The Company places its cash and cash equivalents with financial institutions and, at times, cash held in money market accounts may exceed the Federal Deposit Insurance Corporation insured limit.
F-52
Investments
Investment transactions are recorded on the trade date. Realized gains or losses are measured by the difference between the net proceeds from the repayment or sale and the amortized cost basis of the investment without regard to unrealized gains or losses previously recognized, and include investments charged off during the period, net of recoveries. Unrealized gains or losses primarily reflect the change in investment values, including the reversal of previously recorded unrealized gains or losses when gains or losses are realized.
Investments for which market quotations are readily available are typically valued at such market quotations. In order to validate market quotations, the Company looks at a number of factors to determine if the quotations are representative of fair value, including the source and nature of the quotations. Debt and equity securities that are not publicly traded or whose market prices are not readily available (i.e., substantially all of the Company's investments) are valued at fair value as determined in good faith by the Company's board of directors, based on, among other things, the input of the Company's investment adviser, audit committee and independent third-party valuation firms that have been engaged at the direction of the Company's board of directors to assist in the valuation of each portfolio investment without a readily available market quotation at least once during a trailing 12-month period (with certain de minimis exceptions) and under a valuation policy and a consistently applied valuation process. The valuation process is conducted at the end of each fiscal quarter, and a minimum of 55% of the Company's portfolio at fair value is subject to review by an independent valuation firm each quarter. In addition, the Company's independent registered public accounting firm obtains an understanding of, and performs select procedures relating to, the Company's investment valuation process within the context of performing the integrated audit.
As part of the valuation process, the Company may take into account the following types of factors, if relevant, in determining the fair value of the Company's investments: the enterprise value of a portfolio company (the entire value of the portfolio company to a market participant, including the sum of the values of debt and equity securities used to capitalize the enterprise at a point in time), the nature and realizable value of any collateral, the portfolio company's ability to make payments and its earnings and discounted cash flow, the markets in which the portfolio company does business, a comparison of the portfolio company's securities to any similar publicly traded securities, changes in the interest rate environment and the credit markets generally that may affect the price at which similar investments would trade in their principal markets and other relevant factors. When an external event such as a purchase transaction, public offering or subsequent equity sale occurs, the Company considers the pricing indicated by the external event to corroborate its valuation.
Because there is not a readily available market value for most of the investments in its portfolio, the Company values substantially all of its portfolio investments at fair value as determined in good faith by its board of directors, as described herein. Due to the inherent uncertainty of determining the fair value of investments that do not have a readily available market value, the fair value of the Company's investments may fluctuate from period to period. Additionally, the fair value of the Company's investments may differ significantly from the values that would have been used had a ready market existed for such investments and may differ materially from the values that the Company may ultimately realize. Further, such investments are generally subject to legal and other restrictions on resale or otherwise are less liquid than publicly traded securities. If the Company was required to liquidate a portfolio investment in a forced or liquidation sale, the Company could realize significantly less than the value at which the Company has recorded it.
In addition, changes in the market environment and other events that may occur over the life of the investments may cause the gains or losses ultimately realized on these investments to be different than the unrealized gains or losses reflected in the valuations currently assigned.
F-53
The Company's board of directors undertakes a multi-step valuation process each quarter, as described below:
- •
- The Company's quarterly valuation process begins with each portfolio company or investment being initially valued by the investment
professionals responsible for the portfolio investment in conjunction with the Company's portfolio management team.
- •
- Preliminary valuations are reviewed and discussed with the Company's investment adviser's management and investment professionals, and
then valuation recommendations are presented to the Company's board of directors.
- •
- The audit committee of the Company's board of directors reviews these valuations, as well as the input of third parties, including
independent third-party valuation firms, who review a minimum of 55% of the Company's portfolio at fair value.
- •
- The Company's board of directors discusses valuations and ultimately determines the fair value of each investment in the Company's portfolio without a readily available market quotation in good faith based on, among other things, the input of the Company's investment adviser, audit committee and, where applicable, independent third-party valuation firms.
See Note 8 for more information on the Company's valuation process.
Interest and Dividend Income Recognition
Interest income is recorded on an accrual basis and includes the accretion of discounts and amortization of premiums. Discounts from and premiums to par value on securities purchased are accreted/amortized into interest income over the life of the respective security using the effective yield method. The amortized cost of investments represents the original cost adjusted for the accretion of discounts and amortization of premiums, if any.
Loans are generally placed on non-accrual status when principal or interest payments are past due 30 days or more or when there is reasonable doubt that principal or interest will be collected in full. Accrued and unpaid interest is generally reversed when a loan is placed on non-accrual status. Interest payments received on non-accrual loans may be recognized as income or applied to principal depending upon management's judgment regarding collectability. Non-accrual loans are restored to accrual status when past due principal and interest is paid and, in management's judgment, are likely to remain current. The Company may make exceptions to this if the loan has sufficient collateral value and is in the process of collection.
Dividend income on preferred equity securities is recorded as dividend income on an accrual basis to the extent that such amounts are payable by the portfolio company and are expected to be collected. Dividend income on common equity securities is recorded on the record date for private portfolio companies or on the ex-dividend date for publicly traded portfolio companies.
Payment-in-Kind Interest
The Company has loans in its portfolio that contain payment-in-kind ("PIK") provisions. The PIK interest, computed at the contractual rate specified in each loan agreement, is added to the principal balance of the loan and recorded as interest income. To maintain the Company's status as a RIC, this non-cash source of income must be paid out to stockholders in the form of dividends, even though the Company has not yet collected the cash.
Capital Structuring Service Fees and Other Income
The Company's investment adviser seeks to provide assistance to its portfolio companies and in return the Company may receive fees for capital structuring services. These fees are generally only
F-54
available to the Company as a result of the Company's underlying investments, are normally paid at the closing of the investments, are generally non-recurring and are recognized as revenue when earned upon closing of the investment. The services that the Company's investment adviser provides vary by investment, but generally include reviewing existing credit facilities, arranging bank financing, arranging equity financing, structuring financing from multiple lenders, structuring financing from multiple equity investors, restructuring existing loans, raising equity and debt capital, and providing general financial advice, which concludes upon closing of the investment. Any services of the above nature subsequent to the closing would generally generate a separate fee payable to the Company. In certain instances where the Company is invited to participate as a co-lender in a transaction and does not provide significant services in connection with the investment, a portion of loan fees paid to the Company in such situations will be deferred and amortized over the estimated life of the loan. The Company may also take a seat on the board of directors of a portfolio company, or observe the meetings of the board of directors without taking a formal seat.
Other income includes fees for management and consulting services, loan guarantees, commitments, amendments and other services rendered by the Company to portfolio companies. Such fees are recognized as income when earned or the services are rendered.
Foreign Currency Translation
The Company's books and records are maintained in U.S. dollars. Any foreign currency amounts are translated into U.S. dollars on the following basis:
- (1)
- Fair
value of investment securities, other assets and liabilities—at the exchange rates prevailing at the end of the period.
- (2)
- Purchases and sales of investment securities, income and expenses—at the exchange rates prevailing on the respective dates of such transactions, income or expenses.
Results of operations based on changes in foreign exchange rates are separately disclosed in the statement of operations, if any. Foreign security and currency translations may involve certain considerations and risks not typically associated with investing in U.S. companies and U.S. government securities. These risks include, but are not limited to, currency fluctuations and revaluations and future adverse political, social and economic developments, which could cause investments in foreign markets to be less liquid and prices more volatile than those of comparable U.S. companies or U.S. government securities.
Accounting for Derivative Instruments
The Company does not utilize hedge accounting and instead marks its derivatives to market in the Company's consolidated statement of operations.
Equity Offering Expenses
The Company's offering costs, excluding underwriters' fees, are charged against the proceeds from equity offerings when received.
Debt Issuance Costs
Debt issuance costs are amortized over the life of the related debt instrument using the straight line method or the effective yield method, depending on the type of debt instrument.
F-55
Income Taxes
The Company has elected to be treated as a RIC under the Code and operates in a manner so as to qualify for the tax treatment applicable to RICs. To qualify as a RIC, the Company must, among other things, meet certain source-of- income and asset diversification requirements and timely distribute to its stockholders at least 90% of its investment company taxable income, as defined by the Code, for each year. The Company, among other things, has made and intends to continue to make the requisite distributions to its stockholders, which will generally relieve the Company from U.S. federal corporate-level income taxes.
Depending on the level of taxable income earned in a tax year, the Company may choose to carry forward taxable income in excess of current year dividend distributions from such current year taxable income into the next tax year and pay a 4% excise tax on such income, as required. To the extent that the Company determines that its estimated current year annual taxable income will be in excess of estimated current year dividend distributions, the Company accrues excise tax, if any, on estimated excess taxable income as such taxable income is earned.
Certain of the Company's consolidated subsidiaries are subject to U.S. federal and state corporate-level income taxes.
Dividends to Common Stockholders
Dividends and distributions to common stockholders are recorded on the ex-dividend date. The amount to be paid out as a dividend is determined by the Company's board of directors each quarter and is generally based upon the earnings estimated by management. Net realized capital gains, if any, are generally distributed, although the Company may decide to retain such capital gains for investment.
The Company has adopted a dividend reinvestment plan that provides for reinvestment of any distributions the Company declares in cash on behalf of its stockholders, unless a stockholder elects to receive cash. As a result, if the Company's board of directors authorizes, and the Company declares, a cash dividend, then the Company's stockholders who have not "opted out" of the Company's dividend reinvestment plan will have their cash dividends automatically reinvested in additional shares of the Company's common stock, rather than receiving the cash dividend. The Company intends to use primarily newly issued shares to implement the dividend reinvestment plan (so long as the Company is trading at a premium to net asset value). If the Company's shares are trading at a discount to net asset value and the Company is otherwise permitted under applicable law to purchase such shares, the Company may purchase shares in the open market in connection with the Company's obligations under the dividend reinvestment plan. However, the Company reserves the right to issue new shares of the Company's common stock in connection with the Company's obligations under the dividend reinvestment plan even if the Company's shares are trading below net asset value.
Use of Estimates in the Preparation of Financial Statements
The preparation of financial statements in conformity with GAAP requires management to make estimates and assumptions that affect the reported amounts of actual and contingent assets and liabilities at the date of the financial statements and the reported amounts of income or loss and expenses during the reporting period. Actual results could differ from those estimates. Significant estimates include the valuation of investments.
Recent Accounting Pronouncements
In May 2014, the Financial Accounting Standards Board (the "FASB") issued Accounting Standards Update ("ASU") No. 2014-09, "Revenue from Contracts with Customers (Topic 606)." The guidance in this ASU supersedes the revenue recognition requirements in Topic 605, "Revenue
F-56
Recognition." Under the new guidance, an entity should recognize revenue to depict the transfer of promised goods or services to customers in an amount that reflects the consideration to which the entity expects to be entitled in exchange for those goods or services. The amendments in ASU No. 2014-09 are effective for annual reporting periods beginning after December 15, 2016, including interim periods within that reporting period. Early application is not permitted. The Company is currently evaluating the impact of adopting this ASU on its consolidated financial statements.
In November 2014, the FASB issued ASU No. 2014-16, "Derivatives and Hedging (Topic 815)." The objective of this ASU is to eliminate the use of different methods in practice and thereby reduce existing diversity under GAAP in the accounting for hybrid financial instruments issued in the form of a share. The amendments clarify how current GAAP should be interpreted in evaluating the economic characteristics and risks of a host contract in a hybrid financial instrument that is issued in the form of a share. In addition, the amendments in this ASU clarify that, in evaluating the nature of a host contract, an entity should assess the substance of the relevant terms and features when considering how to weight those terms and features. The amendments in ASU No. 2014-16 are effective for public entities for fiscal years, and interim periods within those fiscal years, beginning after December 15, 2015. Early application is permitted; however, the Company does not plan to early adopt this ASU. The application of this guidance is not expected to have a material impact on the Company's consolidated financial statements.
3. AGREEMENTS
Investment Advisory and Management Agreement
The Company is party to an investment advisory and management agreement (the "investment advisory and management agreement") with Ares Capital Management. Subject to the overall supervision of the Company's board of directors, Ares Capital Management provides investment advisory and management services to the Company. For providing these services, Ares Capital Management receives fees from the Company consisting of a base management fee, a fee based on the Company's net investment income ("income based fee") and a fee based on the Company's net capital gains ("capital gains incentive fee"). The investment advisory and management agreement may be terminated by either party without penalty upon 60 days' written notice to the other party.
The base management fee is calculated at an annual rate of 1.5% based on the average value of the Company's total assets (other than cash or cash equivalents but including assets purchased with borrowed funds) at the end of the two most recently completed calendar quarters. The base management fee is payable quarterly in arrears.
The income based fee is calculated and payable quarterly in arrears based on the Company's net investment income excluding income based fees and capital gains incentive fees ("pre-incentive fee net investment income") for the quarter. Pre-incentive fee net investment income means interest income, dividend income and any other income (including any other fees such as commitment, origination, structuring, diligence and consulting fees or other fees that the Company receives from portfolio companies but excluding fees for providing managerial assistance) accrued during the calendar quarter, minus operating expenses for the quarter (including the base management fee, any expenses payable under the administration agreement, and any interest expense and dividends paid on any outstanding preferred stock, but excluding the income based fee and capital gains incentive fee accrued under GAAP). Pre-incentive fee net investment income includes, in the case of investments with a deferred interest feature such as market discount, debt instruments with PIK interest, preferred stock with PIK dividends and zero coupon securities, accrued income that the Company has not yet received in cash. The Company's investment adviser is not under any obligation to reimburse the Company for any part of the income based fees it received that was based on accrued interest that the Company never actually received.
F-57
Pre-incentive fee net investment income does not include any realized capital gains, realized capital losses, unrealized capital appreciation, unrealized capital depreciation or income tax expense related to realized gains and losses. Because of the structure of the income based fee, it is possible that the Company may pay such fees in a quarter where the Company incurs a loss. For example, if the Company receives pre-incentive fee net investment income in excess of the hurdle rate (as defined below) for a quarter, the Company will pay the applicable income based fee even if the Company has incurred a loss in that quarter due to realized and/or unrealized capital losses.
Pre-incentive fee net investment income, expressed as a rate of return on the value of the Company's net assets (defined as total assets less indebtedness and before taking into account any income based fees and capital gains incentive fees payable during the period) at the end of the immediately preceding calendar quarter, is compared to a fixed "hurdle rate" of 1.75% per quarter. If market credit spreads rise, the Company may be able to invest its funds in debt instruments that provide for a higher return, which may increase the Company's pre-incentive fee net investment income and make it easier for the Company's investment adviser to surpass the fixed hurdle rate and receive an income based fee based on such net investment income. To the extent the Company has retained pre-incentive fee net investment income that has been used to calculate the income based fee, it is also included in the amount of the Company's total assets (other than cash and cash equivalents but including assets purchased with borrowed funds) used to calculate the 1.5% base management fee.
The Company pays its investment adviser an income based fee with respect to the Company's pre-incentive fee net investment income in each calendar quarter as follows:
- •
- no income based fee in any calendar quarter in which the Company's pre- incentive fee net investment income does not exceed the hurdle
rate;
- •
- 100% of the Company's pre-incentive fee net investment income with respect to that portion of such pre-incentive fee net investment
income, if any, that exceeds the hurdle rate but is less than 2.1875% in any calendar quarter. The Company refers to this portion of its pre-incentive fee net investment income (which exceeds the
hurdle rate but is less than 2.1875%) as the "catch-up" provision. The "catch-up" is meant to provide the Company's investment adviser with 20% of the pre-incentive fee net investment income as if a
hurdle rate did not apply if this net investment income exceeded 2.1875% in any calendar quarter; and
- •
- 20% of the amount of the Company's pre-incentive fee net investment income, if any, that exceeds 2.1875% in any calendar quarter.
These calculations are adjusted for any share issuances or repurchases during the quarter.
The capital gains incentive fee is determined and payable in arrears as of the end of each calendar year (or, upon termination of the investment advisory and management agreement, as of the termination date) and is calculated at the end of each applicable year by subtracting (a) the sum of the Company's cumulative aggregate realized capital losses and aggregate unrealized capital depreciation from (b) the Company's cumulative aggregate realized capital gains, in each case calculated from October 8, 2004 (the date the Company completed its initial public offering). Realized capital gains and losses include gains and losses on investments and foreign currencies, gains and losses on extinguishment of debt and other assets, as well as any income tax expense related to realized gains and losses. If such amount is positive at the end of such year, then the capital gains incentive fee for such year is equal to 20% of such amount, less the aggregate amount of capital gains incentive fees paid in all prior years. If such amount is negative, then there is no capital gains incentive fee for such year.
The cumulative aggregate realized capital gains are calculated as the sum of the differences, if positive, between (a) the net sales price of each investment in the Company's portfolio when sold and (b) the accreted or amortized cost basis of such investment.
F-58
The cumulative aggregate realized capital losses are calculated as the sum of the amounts by which (a) the net sales price of each investment in the Company's portfolio when sold is less than (b) the accreted or amortized cost basis of such investment.
The aggregate unrealized capital depreciation is calculated as the sum of the differences, if negative, between (a) the valuation of each investment in the Company's portfolio as of the applicable capital gains incentive fee calculation date and (b) the accreted or amortized cost basis of such investment.
Notwithstanding the foregoing, as a result of an amendment to the capital gains incentive fee under the investment advisory and management agreement that was adopted on June 6, 2011, if the Company is required by GAAP to record an investment at its fair value as of the time of acquisition instead of at the actual amount paid for such investment by the Company (including, for example, as a result of the application of the acquisition method of accounting), then solely for the purposes of calculating the capital gains incentive fee , the "accreted or amortized cost basis" of an investment shall be an amount (the "Contractual Cost Basis") equal to (1) (x) the actual amount paid by the Company for such investment plus (y) any amounts recorded in the Company's financial statements as required by GAAP that are attributable to the accretion of such investment plus (z) any other adjustments made to the cost basis included in the Company's financial statements, including PIK interest or additional amounts funded (net of repayments) minus (2) any amounts recorded in the Company's financial statements as required by GAAP that are attributable to the amortization of such investment, whether such calculated Contractual Cost Basis is higher or lower than the fair value of such investment (as determined in accordance with GAAP) at the time of acquisition.
The Company defers cash payment of any income based fees and capital gains incentive fees otherwise earned by the Company's investment adviser if during the most recent four full calendar quarter period ending on or prior to the date such payment is to be made the sum of (a) the aggregate distributions to the Company's stockholders and (b) the change in net assets (defined as total assets less indebtedness and before taking into account any income based fees and capital gains incentive fees payable during the period) is less than 7.0% of the Company's net assets (defined as total assets less indebtedness) at the beginning of such period. Any deferred income based fees and capital gains incentive fees are carried over for payment in subsequent calculation periods to the extent such payment is payable under the investment advisory and management agreement.
The capital gains incentive fee payable to the Company's investment adviser as calculated under the investment advisory and management agreement (as described above) for the years ended December 31, 2014, 2013 and 2012 was $23,993, $17,425 and $11,523, respectively. However, in accordance with GAAP, the Company had cumulatively accrued a capital gains incentive fee of $92,979 as of December 31, 2014, of which $68,986 is not currently due under the investment advisory and management agreement. GAAP requires that the capital gains incentive fee accrual consider the cumulative aggregate unrealized capital appreciation in the calculation, as a capital gains incentive fee would be payable if such unrealized capital appreciation were realized, even though such unrealized capital appreciation is not permitted to be considered in calculating the fee actually payable under the investment advisory and management agreement. This GAAP accrual is calculated using the aggregate cumulative realized capital gains and losses and aggregate cumulative unrealized capital depreciation included in the calculation of the capital gains incentive fee plus the aggregate cumulative unrealized capital appreciation. If such amount is positive at the end of a period, then GAAP requires the Company to record a capital gains incentive fee equal to 20% of such cumulative amount, less the aggregate amount of actual capital gains incentive fees paid or capital gains incentive fees accrued under GAAP in all prior periods. As of December 31, 2014, the Company has paid capital gains incentive fees since inception totaling $33,411. The resulting accrual for any capital gains incentive fee under GAAP in a given period may result in an additional expense if such cumulative amount is greater than in the prior period or a reversal of previously recorded expense if such cumulative amount
F-59
is less than in the prior period. If such cumulative amount is negative, then there is no accrual. There can be no assurance that such unrealized capital appreciation will be realized in the future.
For the year ended December 31, 2014, base management fees were $127,997, income based fees were $118,273 and capital gains incentive fees calculated in accordance with GAAP were $29,467. For the year ended December 31, 2013, base management fees were $104,857, income based fees were $110,511 and capital gains incentive fees calculated in accordance with GAAP were $11,640. For the year ended December 31, 2012, base management fees were $86,228, income based fees were $95,182 and capital gains incentive fees calculated in accordance with GAAP were $31,863.
Administration Agreement
The Company is party to an administration agreement, referred to herein as the "administration agreement", with its administrator, Ares Operations. Pursuant to the administration agreement, Ares Operations furnishes the Company with office equipment and clerical, bookkeeping and record keeping services at the Company's office facilities. Under the administration agreement, Ares Operations also performs, or oversees the performance of, the Company's required administrative services, which include, among other things, providing assistance in accounting, legal, compliance, operations, technology and investor relations, being responsible for the financial records that the Company is required to maintain and preparing reports to its stockholders and reports filed with the SEC. In addition, Ares Operations assists the Company in determining and publishing its net asset value, assists the Company in providing managerial assistance to its portfolio companies, oversees the preparation and filing of the Company's tax returns and the printing and dissemination of reports to its stockholders, and generally oversees the payment of its expenses and the performance of administrative and professional services rendered to the Company by others. Payments under the administration agreement are equal to an amount based upon its allocable portion of Ares Operations' overhead and other expenses (including travel expenses) incurred by Ares Operations in performing its obligations under the administration agreement, including the Company's allocable portion of the compensation of certain of its officers (including the Company's chief compliance officer, chief financial officer, chief accounting officer, general counsel, treasurer and assistant treasurer) and their respective staffs. The administration agreement may be terminated by either party without penalty upon 60 days' written notice to the other party.
For the years ended December 31, 2014, 2013 and 2012, the Company incurred $13,689, $12,317 and $9,322, respectively, in administrative fees. As of December 31, 2014, $4,028 of these fees were unpaid and included in "accounts payable and other liabilities" in the accompanying consolidated balance sheet.
F-60
4. INVESTMENTS
As of December 31, 2014 and 2013, investments consisted of the following:
| |
As of December 31, | ||||||||||||
|---|---|---|---|---|---|---|---|---|---|---|---|---|---|
| |
2014 | 2013 | |||||||||||
| |
Amortized Cost(1) | Fair Value | Amortized Cost(1) | Fair Value | |||||||||
First lien senior secured loans |
$ | 3,728,872 | $ | 3,700,602 | $ | 3,405,597 | $ | 3,377,608 | |||||
Second lien senior secured loans |
1,938,861 | 1,900,464 | 1,335,761 | 1,319,191 | |||||||||
Subordinated certificates of the SSLP(2) |
2,034,498 | 2,065,015 | 1,745,192 | 1,771,369 | |||||||||
Senior subordinated debt |
524,157 | 523,288 | 364,094 | 323,171 | |||||||||
Preferred equity securities |
206,475 | 190,254 | 226,044 | 229,006 | |||||||||
Other equity securities |
440,092 | 642,762 | 453,732 | 600,214 | |||||||||
Commercial real estate |
2,140 | 5,994 | 6,983 | 12,338 | |||||||||
| | | | | | | | | | | | | | |
Total |
$ | 8,875,095 | $ | 9,028,379 | $ | 7,537,403 | $ | 7,632,897 | |||||
| | | | | | | | | | | | | | |
| | | | | | | | | | | | | | |
| | | | | | | | | | | | | | |
- (1)
- The
amortized cost represents the original cost adjusted for the accretion of discounts and amortization of premiums, if any.
- (2)
- The proceeds from these certificates were applied to co-investments with GE Global Sponsor Finance LLC and General Electric Capital Corporation to fund first lien senior secured loans to 50 and 47 different borrowers as of December 31, 2014 and 2013, respectively.
The industrial and geographic compositions of the Company's portfolio at fair value as of December 31, 2014 and 2013 were as follows:
| |
As of December 31, |
||||||
|---|---|---|---|---|---|---|---|
| |
2014 | 2013 | |||||
Industry |
|||||||
Investment Funds and Vehicles(1) |
23.3 | % | 23.6 | % | |||
Healthcare Services |
16.3 | 16.2 | |||||
Other Services |
8.8 | 7.2 | |||||
Consumer Products |
8.3 | 3.5 | |||||
Power Generation |
7.3 | 5.4 | |||||
Business Services |
5.8 | 9.9 | |||||
Education |
5.0 | 5.9 | |||||
Financial Services |
4.5 | 5.1 | |||||
Restaurants and Food Services |
3.7 | 5.2 | |||||
Manufacturing |
3.3 | 3.3 | |||||
Containers and Packaging |
2.8 | 3.3 | |||||
Oil and Gas |
1.9 | 0.6 | |||||
Retail |
1.4 | 1.6 | |||||
Aerospace and Defense |
1.4 | 1.3 | |||||
Commercial Real Estate Finance |
1.2 | 0.6 | |||||
Other |
5.0 | 7.3 | |||||
| | | | | | | | |
Total |
100.0 | % | 100.0 | % | |||
| | | | | | | | |
| | | | | | | | |
| | | | | | | | |
- (1)
- Includes the Company's investment in the SSLP, which had made first lien senior secured loans to 50 and 47 different borrowers as of December 31, 2014 and 2013, respectively. The portfolio companies in the SSLP are in industries similar to the companies in the Company's portfolio.
F-61
| |
As of December 31, |
||||||
|---|---|---|---|---|---|---|---|
| |
2014 | 2013 | |||||
Geographic Region |
|||||||
West(1) |
46.2 | % | 50.0 | % | |||
Midwest |
18.1 | 15.8 | |||||
Southeast |
16.6 | 13.6 | |||||
Mid Atlantic |
15.4 | 15.9 | |||||
Northeast |
2.3 | 1.0 | |||||
International |
1.4 | 3.7 | |||||
| | | | | | | | |
Total |
100.0 | % | 100.0 | % | |||
| | | | | | | | |
| | | | | | | | |
| | | | | | | | |
- (1)
- Includes the Company's investment in the SSLP, which represented 22.9% and 23.2% of the total investment portfolio at fair value as of December 31, 2014 and 2013, respectively.
As of December 31, 2014, 2.2% of total investments at amortized cost (or 1.7% of total investments at fair value) were on non-accrual status. As of December 31, 2013, 3.1% of total investments at amortized cost (or 2.1% of total investments at fair value) were on non-accrual status.
Senior Secured Loan Program
The Company co-invests in first lien senior secured loans of middle market companies with GE Global Sponsor Finance LLC and General Electric Capital Corporation (together, "GE") through an unconsolidated Delaware limited liability company, the Senior Secured Loan Fund LLC (d/b/a the "Senior Secured Loan Program") or the "SSLP." The SSLP is capitalized as transactions are completed and all portfolio decisions and generally all other decisions in respect of the SSLP must be approved by an investment committee of the SSLP consisting of representatives of the Company and GE (with approval from a representative of each required). The Company provides capital to the SSLP in the form of subordinated certificates (the "SSLP Certificates").
As of December 31, 2014 and 2013, GE and the Company had agreed to make $11.0 billion of capital available to the SSLP, of which approximately $9.9 billion and $8.7 billion in aggregate principal amount, respectively, was funded. As of December 31, 2014 and 2013, the Company had agreed to make available to the SSLP approximately $2.3 billion, of which approximately $2.0 billion and $1.7 billion in aggregate principal amount, respectively, was funded. Investment of any unfunded amount must be approved by the investment committee of the SSLP described above.
As of December 31, 2014 and 2013, the SSLP had total assets of $10.0 billion and $8.7 billion, respectively. As of December 31, 2014 and 2013, GE's investment in the SSLP consisted of senior notes of $7.6 billion and $6.7 billion, respectively, and SSLP Certificates of $290.6 million and $249.3 million, respectively. The SSLP Certificates are junior in right of payment to the senior notes held by GE. As of December 31, 2014 and 2013, the Company and GE owned 87.5% and 12.5%, respectively, of the outstanding SSLP Certificates.
The SSLP's portfolio consisted of first lien senior secured loans to 50 and 47 different borrowers as of December 31, 2014 and 2013, respectively. As of December 31, 2014 and 2013, the portfolio was comprised of all first lien senior secured loans to U.S. middle-market companies. As of December 31, 2014 and 2013, one loan was on non-accrual status, representing 1.0% and 1.0%, respectively, of the total loans at principal amount in the SSLP. As of December 31, 2014 and 2013, the largest loan to a single borrower in the SSLP's portfolio in aggregate principal amount was $331.5 million and $321.7 million, respectively, and the five largest loans to borrowers in the SSLP totaled $1.6 billion and $1.5 billion, respectively. The portfolio companies in the SSLP are in industries similar to the
F-62
companies in the Company's portfolio. Additionally, as of December 31, 2014 and 2013, the SSLP had commitments to fund various delayed draw investments to certain of its portfolio companies of $484.3 million and $510.4 million, respectively, which had been approved by the investment committee of the SSLP. As of December 31, 2014 and 2013, the Company had commitments to co-invest in the SSLP for its portion of the SSLP's commitments to fund such delayed draw investments of up to $92.5 million and $85.1 million, respectively.
The amortized cost and fair value of the SSLP Certificates held by the Company were $2.0 billion and $2.1 billion, respectively, as of December 31, 2014 and $1.7 billion and $1.8 billion, respectively, as of December 31, 2013. The SSLP Certificates pay a weighted average coupon of LIBOR plus approximately 8.0% and also entitle the holders thereof to receive a portion of the excess cash flow from the loan portfolio, which may result in a return to the holders of the SSLP Certificates that is greater than the coupon. The Company's yield on its investment in the SSLP at fair value was 13.5% and 14.8% as of December 31, 2014 and 2013, respectively. For the years ended December 31, 2014, 2013 and 2012, the Company earned interest income of $275.0 million, $224.9 million and $184.7 million, respectively, from its investment in the SSLP Certificates. The Company is also entitled to certain fees in connection with the SSLP. For the years ended December 31, 2014, 2013 and 2012, in connection with the SSLP, the Company earned capital structuring service, sourcing and other fees totaling $69.7 million, $66.6 million and $58.2 million, respectively.
Ivy Hill Asset Management, L.P.
Ivy Hill Asset Management, L.P. ("IHAM") is an asset management services company and an SEC-registered investment adviser. The Company has made investments in IHAM, its wholly owned portfolio company and previously made investments in certain vehicles managed by IHAM. As of December 31, 2014, IHAM had assets under management ("IHAM AUM")(1) of approximately $2.7 billion. As of December 31, 2014, IHAM managed 13 vehicles and served as the sub-manager/sub-servicer for three other vehicles (these vehicles managed or sub-managed/sub-serviced by IHAM are collectively referred to as the "IHAM Vehicles"). IHAM earns fee income from managing the IHAM Vehicles and has also invested in certain of these vehicles as part of its business strategy. As of December 31, 2014 and 2013, IHAM had total investments of $219.0 million and $170.0 million, respectively. For the years ended December 31, 2014, 2013 and 2012, IHAM had management and incentive fee income of $19.0 million, $21.0 million and $22.0 million, respectively, and other investment-related income of $34.0 million, $91.0 million and $40.0 million, respectively.
The amortized cost and fair value of the Company's investment in IHAM was $171.0 million and $259.3 million, respectively, as of December 31, 2014, and $171.0 million and $280.4 million, respectively, as of December 31, 2013. For the years ended December 31, 2014, 2013 and 2012, the Company received distributions consisting entirely of dividend income from IHAM of $50.0 million, $72.4 million and $19.9 million, respectively. The dividend income for the years ended December 31, 2014 and 2013 included additional dividends of $10.0 million and $32.4 million, respectively, in addition to the quarterly dividends generally paid by IHAM.
From time to time, IHAM or certain IHAM Vehicles may purchase investments from, or sell investments to, the Company. For any such sales or purchases by the IHAM Vehicles to or from the Company, the IHAM Vehicles must obtain approval from third parties unaffiliated with the Company or IHAM, as applicable. During the years ended December 31, 2014 and 2013, IHAM or certain of the
- (1)
- IHAM AUM refers to the assets of the vehicles managed, sub-managed and sub-serviced by IHAM. It includes drawn and undrawn amounts, including certain amounts that are subject to regulatory leverage restrictions and/or borrowing base restrictions. IHAM AUM amounts are as of December 31, 2014 and are unaudited. Certain amounts are preliminary and remain subject to change, and differences may arise due to rounding.
F-63
IHAM Vehicles purchased $219.6 million and $442.3 million, respectively, of investments from the Company. A net realized loss of $0.1 million was recorded by the Company on these transactions for each of the years ended December 31, 2014 and 2013. During the years ended December 31, 2014 and 2013, the Company purchased $20.2 million and $156.0 million of investments, respectively, from certain of the IHAM Vehicles.
IHAM is party to an administration agreement, referred to herein as the "IHAM administration agreement," with Ares Operations. Pursuant to the IHAM administration agreement, Ares Operations provides IHAM with, among other things, office facilities, equipment, clerical, bookkeeping and record keeping services, services relating to the marketing and sale of interests in vehicles managed by IHAM, services of, and oversight of, custodians, depositories, accountants, attorneys, underwriters and such other persons in any other capacity deemed to be necessary. Under the IHAM administration agreement, IHAM reimburses Ares Operations for all of the actual costs associated with such services, including Ares Operations' allocable portion of overhead and the cost of its officers, employees and respective staff in performing its obligations under the IHAM administration agreement.
5. DEBT
In accordance with the Investment Company Act, with certain limited exceptions, the Company is only allowed to borrow amounts such that its asset coverage, calculated pursuant to the Investment Company Act, is at least 200% after such borrowing. As of December 31, 2014 the Company's asset coverage was 235%.
F-64
The Company's outstanding debt as of December 31, 2014 and 2013 were as follows:
| |
As of December 31, | ||||||||||||||||||
|---|---|---|---|---|---|---|---|---|---|---|---|---|---|---|---|---|---|---|---|
| |
2014 | 2013 | |||||||||||||||||
| |
Total Aggregate Principal Amount Committed/ Outstanding(1) |
Principal Amount Outstanding |
Carrying Value |
Total Aggregate Principal Amount Committed/ Outstanding(1) |
Principal Amount Outstanding |
Carrying Value |
|||||||||||||
Revolving Credit Facility |
$ | 1,250,000 | (2) | $ | 170,000 | $ | 170,000 | $ | 1,060,000 | $ | — | $ | — | ||||||
Revolving Funding Facility |
540,000 | (3) | 324,000 | 324,000 | 620,000 | 185,000 | 185,000 | ||||||||||||
SMBC Funding Facility |
400,000 | 62,000 | 62,000 | 400,000 | — | — | |||||||||||||
February 2016 Convertible Notes |
575,000 | 575,000 | 565,001 | (4) | 575,000 | 575,000 | 556,456 | (4) | |||||||||||
June 2016 Convertible Notes |
230,000 | 230,000 | 225,026 | (4) | 230,000 | 230,000 | 221,788 | (4) | |||||||||||
2017 Convertible Notes |
162,500 | 162,500 | 160,180 | (4) | 162,500 | 162,500 | 159,220 | (4) | |||||||||||
2018 Convertible Notes |
270,000 | 270,000 | 265,431 | (4) | 270,000 | 270,000 | 264,097 | (4) | |||||||||||
2019 Convertible Notes |
300,000 | 300,000 | 296,130 | (4) | 300,000 | 300,000 | 295,279 | (4) | |||||||||||
2018 Notes |
750,000 | 750,000 | 750,704 | (5) | 600,000 | 600,000 | 596,756 | (5) | |||||||||||
2020 Notes |
400,000 | 400,000 | 398,430 | (6) | — | — | — | ||||||||||||
February 2022 Notes |
143,750 | 143,750 | 143,750 | 143,750 | 143,750 | 143,750 | |||||||||||||
October 2022 Notes |
182,500 | 182,500 | 182,500 | 182,500 | 182,500 | 182,500 | |||||||||||||
2040 Notes |
200,000 | 200,000 | 200,000 | 200,000 | 200,000 | 200,000 | |||||||||||||
2047 Notes |
229,557 | 229,557 | 181,330 | (7) | 230,000 | 230,000 | 181,429 | (7) | |||||||||||
| | | | | | | | | | | | | | | | | | | | |
Total |
$ | 5,633,307 | $ | 3,999,307 | $ | 3,924,482 | $ | 4,973,750 | $ | 3,078,750 | $ | 2,986,275 | |||||||
| | | | | | | | | | | | | | | | | | | | |
| | | | | | | | | | | | | | | | | | | | |
| | | | | | | | | | | | | | | | | | | | |
- (1)
- Subject
to borrowing base and leverage restrictions. Represents the total aggregate amount committed or outstanding, as applicable, under such instrument.
- (2)
- Provides
for a feature that allows the Company, under certain circumstances, to increase the size of the Revolving Credit Facility to a maximum of
$1,755,000.
- (3)
- Provides
for a feature that allows the Company and Ares Capital CP, under certain circumstances, to increase the size of the Revolving Funding Facility to a
maximum of $865,000.
- (4)
- Represents the aggregate principal amount outstanding of the Convertible Unsecured Notes (as defined below) less the unaccreted discount recorded upon issuance of the Convertible Unsecured Notes. The total unaccreted discount for the February 2016 Convertible Notes, the June 2016 Convertible Notes, the 2017 Convertible Notes, the 2018 Convertible Notes and the 2019 Convertible Notes was $9,999, $4,974, $2,320, $4,569 and $3,870, respectively, as of December 31, 2014. The total unaccreted discount for the February 2016 Convertible Notes, the June 2016 Convertible Notes, the 2017 Convertible Notes, the 2018 Convertible Notes and the 2019 Convertible Notes was $18,544, $8,212, $3,280, $5,903 and $4,721 respectively, as of December 31, 2013.
F-65
- (5)
- As
of December 31, 2014, represents the aggregate principal amount outstanding plus the net unamortized premium of $704 that was recorded upon the
issuances of the 2018 Notes. As of December 31, 2013, represents the aggregate principal amount less the unaccreted discount of $3,244 recorded on the first issuance of the 2018 Notes.
- (6)
- As
of December 31, 2014, represents the aggregate principal amount less the unaccreted discount of $1,570 recorded on the issuance of the 2020 Notes.
- (7)
- Represents the aggregate principal amount outstanding less the unaccreted purchased discount recorded as a part of the Allied Acquisition (as defined below). The total unaccreted purchased discount for the 2047 Notes was $48,227 and $48,571 as of December 31, 2014 and 2013, respectively.
The weighted average stated interest rate and weighted average maturity, both on aggregate principal amount, of all the Company's outstanding debt as of December 31, 2014 were 4.9% and 6.5 years, respectively, and as of December 31, 2013 were 5.3% and 7.9 years, respectively.
Revolving Credit Facility
The Company is party to a senior secured revolving credit facility (as amended and restated, the "Revolving Credit Facility"), which allows the Company to borrow up to $1,250,000 at any one time outstanding. The end of the revolving period and the stated maturity date for the Revolving Credit Facility are May 4, 2018 and May 4, 2019, respectively. The Revolving Credit Facility also includes a feature that allows, under certain circumstances, for an increase in the size of the facility to a maximum of $1,755,000. The Revolving Credit Facility generally requires payments of interest at the end of each LIBOR interest period, but no less frequently than quarterly, on LIBOR based loans, and monthly payments of interest on other loans. From the end of the revolving period to the stated maturity date, the Company is required to repay outstanding principal amounts under the Revolving Credit Facility on a monthly basis in an amount equal to 1/12th of the outstanding principal amount at the end of the revolving period.
Under the Revolving Credit Facility, the Company is required to comply with various covenants, reporting requirements and other customary requirements for similar revolving credit facilities, including, without limitation, covenants related to: (a) limitations on the incurrence of additional indebtedness and liens, (b) limitations on certain investments, (c) limitations on certain restricted payments, (d) maintaining a certain minimum stockholders' equity, (e) maintaining a ratio of total assets (less total liabilities other than indebtedness) to total indebtedness of the Company and its consolidated subsidiaries of not less than 2.0:1.0, (f) limitations on pledging certain unencumbered assets, and (g) limitations on the creation or existence of agreements that prohibit liens on certain properties of the Company and certain of its subsidiaries. These covenants are subject to important limitations and exceptions that are described in the documents governing the Revolving Credit Facility. Borrowings under the Revolving Credit Facility (and the incurrence of certain other permitted debt) are also subject to compliance with a borrowing base that applies different advance rates to different types of assets in the Company's portfolio that are pledged as collateral. As of December 31, 2014, the Company was in compliance in all material respects with the terms of the Revolving Credit Facility.
F-66
As of December 31, 2014 there was $170,000 outstanding under the Revolving Credit Facility. As of December 31, 2013, there were no amounts outstanding under the Revolving Credit Facility. The Revolving Credit Facility also provides for a sub-limit for the issuance of letters of credit for up to an aggregate amount of $200,000. As of December 31, 2014 and 2013, the Company had $29,648 and $47,898, respectively, in letters of credit issued through the Revolving Credit Facility. The amount available for borrowing under the Revolving Credit Facility is reduced by any letters of credit issued. As of December 31, 2014, there was $1,050,352 available for borrowing (net of letters of credit issued) under the Revolving Credit Facility.
Since May 2, 2013, subject to certain exceptions, the interest rate charged on the Revolving Credit Facility is based on LIBOR plus an applicable spread of 2.00% or a "base rate" (as defined in the agreements governing the Revolving Credit Facility) plus an applicable spread of 1.00%. From May 5, 2012 through May 1, 2013, the interest rate charged on the Revolving Credit Facility was based on LIBOR plus an applicable spread of 2.25% or a "base rate" plus an applicable spread of 1.25%. Prior to and including May 4, 2012, the interest rate charged on the Revolving Credit Facility was based on LIBOR plus an applicable spread of between 2.50% and 4.00% or on a "base rate" plus an applicable spread of between 1.50% and 3.00%, in each case, based on a pricing grid depending upon the Company's credit ratings. As of December 31, 2014, the one, two, three and six month LIBOR was 0.17%, 0.21%, 0.26% and 0.36%, respectively. As of December 31, 2013, the one, two, three and six month LIBOR was 0.17%, 0.21%, 0.25% and 0.35%, respectively. In addition to the stated interest expense on the Revolving Credit Facility, since May 4, 2012, the Company is required to pay a commitment fee of 0.375% per annum on any unused portion of the Revolving Credit Facility. Prior to and including May 4, 2012, the commitment fee was 0.50%. Since May 2, 2013, the Company is also required to pay a letter of credit fee of 2.25% per annum on letters of credit issued. From May 5, 2012 through May 1, 2013, the letter of credit fee was 2.50% and prior to and including May 4, 2012, the letter of credit fee was 3.25%.
The Revolving Credit Facility is secured by certain assets in the Company's portfolio and excludes investments held by Ares Capital CP under the Revolving Funding Facility and those held by ACJB under the SMBC Funding Facility, each as discussed below, and certain other investments.
For the years ended December 31, 2014, 2013 and 2012, the components of interest and credit facility fees expense, cash paid for interest expense, average stated interest rates (i.e., rate in effect plus the spread) and average outstanding balances for the Revolving Credit Facility were as follows:
| |
For the Years Ended December 31, | |||||||||
|---|---|---|---|---|---|---|---|---|---|---|
| |
2014 | 2013 | 2012 | |||||||
Stated interest expense |
$ | 737 | $ | 3,250 | $ | 3,523 | ||||
Facility fees |
5,028 | 4,044 | 4,260 | |||||||
Amortization of debt issuance costs |
2,556 | 2,746 | 4,207 | |||||||
| | | | | | | | | | | |
Total interest and credit facility fees expense |
$ | 8,321 | $ | 10,040 | $ | 11,990 | ||||
| | | | | | | | | | | |
| | | | | | | | | | | |
| | | | | | | | | | | |
Cash paid for interest expense |
$ | 640 | $ | 3,250 | $ | 4,128 | ||||
Average stated interest rate |
2.20 | % | 2.24 | % | 2.82 | % | ||||
Average outstanding balance |
$ | 33,110 | $ | 144,995 | $ | 124,855 | ||||
Revolving Funding Facility
The Company's consolidated subsidiary, Ares Capital CP Funding LLC ("Ares Capital CP"), is party to a revolving funding facility (as amended, the "Revolving Funding Facility"), which allows Ares Capital CP to borrow up to $540,000 at any one time outstanding. The Revolving Funding Facility is secured by all of the assets held by, and the membership interest in, Ares Capital CP. The end of the reinvestment period and the stated maturity date for the Revolving Funding Facility are May 14, 2017
F-67
and May 14, 2019, respectively. The Revolving Funding Facility also includes a feature that allows, under certain circumstances, for an increase in the Revolving Funding Facility to a maximum of $865,000.
Amounts available to borrow under the Revolving Funding Facility are subject to a borrowing base that applies different advance rates to different types of assets held by Ares Capital CP. Ares Capital CP is also subject to limitations with respect to the loans securing the Revolving Funding Facility, including restrictions on sector concentrations, loan size, payment frequency and status, collateral interests, loans with fixed rates and loans with certain investment ratings, as well as restrictions on portfolio company leverage, which may also affect the borrowing base and therefore amounts available to borrow. The Company and Ares Capital CP are also required to comply with various covenants, reporting requirements and other customary requirements for similar facilities. These covenants are subject to important limitations and exceptions that are described in the agreements governing the Revolving Funding Facility. As of December 31, 2014, the Company and Ares Capital CP were in compliance in all material respects with the terms of the Revolving Funding Facility.
As of December 31, 2014 and 2013, there was $324,000 and $185,000 outstanding, respectively, under the Revolving Funding Facility. Since January 25, 2013, the interest charged on the Revolving Funding Facility is based on applicable spreads ranging from 2.25% to 2.50% over LIBOR and ranging from 1.25% to 1.50% over "base rate" (as defined in the agreements governing the Revolving Funding Facility) in each case, determined monthly based on the composition of the borrowing base relative to outstanding borrowings under the Revolving Funding Facility. From January 18, 2012 through January 24, 2013, the interest rate charged on the Revolving Funding Facility was based on LIBOR plus an applicable spread of 2.50% or on a "base rate" plus an applicable spread of 1.50%. Prior to January 18, 2012, the interest rate charged on the Revolving Funding Facility was based on LIBOR plus an applicable spread of between 2.25% and 3.75% or on a "base rate" plus an applicable spread of between 1.25% to 2.75%, in each case, based on a pricing grid depending upon the Company's credit ratings. As of December 31, 2014 and 2013, the interest rate in effect was based on one month LIBOR, which was 0.17% at the end of each period. Through May 13, 2014, Ares Capital CP was required to pay a commitment fee between 0.50% and 1.75% per annum depending on the size of the unused portion of the Revolving Funding Facility. Since May 14, 2014, Ares Capital CP is required to pay a commitment fee between 0.50% and 1.50% per annum depending on the size of the unused portion of the Revolving Funding Facility.
For the years ended December 31, 2014, 2013 and 2012, the components of interest and credit facility fees expense, cash paid for interest expense, average stated interest rates (i.e., rate in effect plus the spread) and average outstanding balances for the Revolving Funding Facility were as follows:
| |
For the Years Ended December 31, | |||||||||
|---|---|---|---|---|---|---|---|---|---|---|
| |
2014 | 2013 | 2012 | |||||||
Stated interest expense |
$ | 3,997 | $ | 5,968 | $ | 10,557 | ||||
Facility fees |
4,271 | 3,702 | 1,209 | |||||||
Amortization of debt issuance costs |
2,215 | 2,015 | 1,772 | |||||||
| | | | | | | | | | | |
Total interest and credit facility fees expense |
$ | 10,483 | $ | 11,685 | $ | 13,538 | ||||
| | | | | | | | | | | |
| | | | | | | | | | | |
| | | | | | | | | | | |
Cash paid for interest expense |
$ | 3,877 | $ | 6,475 | $ | 11,979 | ||||
Average stated interest rate |
2.41 | % | 2.47 | % | 2.80 | % | ||||
Average outstanding balance |
$ | 163,838 | $ | 241,247 | $ | 377,098 | ||||
SMBC Funding Facility
The Company's consolidated subsidiary, Ares Capital JB Funding LLC ("ACJB"), is party to a revolving funding facility (as amended, the "SMBC Funding Facility") with ACJB, as the borrower, and
F-68
Sumitomo Mitsui Banking Corporation ("SMBC"), as the administrative agent, collateral agent, and lender, which allows ACJB to borrow up to $400,000 at any one time outstanding. The SMBC Funding Facility is secured by all of the assets held by ACJB. The end of the reinvestment period and the stated maturity date for the SMBC Funding Facility are September 14, 2016 and September 14, 2021, respectively. The reinvestment period and the stated maturity date are both subject to two one-year extensions by mutual agreement.
Amounts available to borrow under the SMBC Funding Facility are subject to a borrowing base that applies an advance rate to assets held by ACJB. The Company and ACJB are also required to comply with various covenants, reporting requirements and other customary requirements for similar facilities. These covenants are subject to important limitations and exceptions that are described in the documents governing the SMBC Funding Facility. As of December 31, 2014, the Company and ACJB were in compliance in all material respects with the terms of the SMBC Funding Facility.
As of December 31, 2014, there was $62,000 outstanding under the SMBC Funding Facility. As of December 31, 2013, there were no amounts outstanding under the SMBC Funding Facility. Since December 19, 2013, subject to certain exceptions, the interest rate charged on the SMBC Funding Facility is based on one month LIBOR plus an applicable spread of 2.00% or a "base rate" (as defined in the agreements governing the SMBC Funding Facility) plus an applicable spread of 1.00%. Prior to and including December 19, 2013, subject to certain exceptions, the interest rate charged on the SMBC Funding Facility was based on one month LIBOR plus an applicable spread of 2.125% or a "base rate" (as defined in the agreements governing the SMBC Funding Facility) plus an applicable spread of 1.125%. As of December 31, 2014 and 2013, one month LIBOR was 0.17% at the end of each period. ACJB was not required to pay a commitment fee until September 15, 2013 and through December 19, 2013, at which time ACJB was required to pay a commitment fee of up to 0.50% per annum depending on the size of the unused portion of the SMBC Funding Facility. From December 20, 2013 through March 14, 2014, ACJB was required to pay a commitment fee of up to 0.75% per annum depending on the size of the unused portion of the SMBC Funding Facility. After March 14, 2014, ACJB is required to pay a commitment fee of between 0.35% and 0.875% per annum depending on the size of the unused portion of the SMBC Funding Facility.
For the years ended December 31, 2014, 2013 and 2012, the components of interest and credit facility fees expense, cash paid for interest expense, average stated interest rates (i.e., rate in effect plus the spread) and average outstanding balances for the SMBC Funding Facility were as follows:
| |
For the Years Ended December 31, | |||||||||
|---|---|---|---|---|---|---|---|---|---|---|
| |
2014 | 2013 | 2012 | |||||||
Stated interest expense |
$ | 486 | $ | — | $ | 1,419 | ||||
Facility fees |
1,483 | 446 | 3 | |||||||
Amortization of debt issuance costs |
1,125 | 1,047 | 629 | |||||||
| | | | | | | | | | | |
Total interest and credit facility fees expense |
$ | 3,094 | $ | 1,493 | $ | 2,051 | ||||
| | | | | | | | | | | |
| | | | | | | | | | | |
| | | | | | | | | | | |
Cash paid for interest expense |
$ | 421 | $ | 16 | $ | 1,404 | ||||
Average stated interest rate |
2.16 | % | — | % | 2.41 | % | ||||
Average outstanding balance |
$ | 22,208 | $ | — | $ | 58,987 | ||||
Convertible Unsecured Notes
In January 2011, the Company issued $575,000 aggregate principal amount of unsecured convertible notes that mature on February 1, 2016 (the "February 2016 Convertible Notes"), unless previously converted or repurchased in accordance with their terms. In March 2011, the Company issued $230,000 aggregate principal amount of unsecured convertible notes that mature on June 1, 2016 (the "June 2016 Convertible Notes"), unless previously converted or repurchased in accordance with
F-69
their terms. In March 2012, the Company issued $162,500 aggregate principal amount of unsecured convertible notes that mature on March 15, 2017 (the "2017 Convertible Notes"), unless previously converted or repurchased in accordance with their terms. In the fourth quarter of 2012, the Company issued $270,000 aggregate principal amount of unsecured convertible notes that mature on January 15, 2018 (the "2018 Convertible Notes"), unless previously converted or repurchased in accordance with their terms. In July 2013, the Company issued $300,000 aggregate principal amount of unsecured convertible notes that mature on January 15, 2019 (the "2019 Convertible Notes" and together with the February 2016 Convertible Notes, the June 2016 Convertible Notes, the 2017 Convertible Notes and the 2018 Convertible Notes, the "Convertible Unsecured Notes"), unless previously converted or repurchased in accordance with their terms. The Company does not have the right to redeem the Convertible Unsecured Notes prior to maturity. The February 2016 Convertible Notes, the June 2016 Convertible Notes, the 2017 Convertible Notes, the 2018 Convertible Notes and the 2019 Convertible Notes bear interest at a rate of 5.750%, 5.125%, 4.875%, 4.750% and 4.375%, respectively, per year, payable semi-annually.
In certain circumstances, the Convertible Unsecured Notes will be convertible into cash, shares of the Company's common stock or a combination of cash and shares of its common stock, at the Company's election, at their respective conversion rates (listed below as of December 31, 2014) subject to customary anti-dilution adjustments and the requirements of their respective indenture (the "Convertible Unsecured Notes Indentures"). Prior to the close of business on the business day immediately preceding their respective conversion date (listed below), holders may convert their Convertible Unsecured Notes only under certain circumstances set forth in the Convertible Unsecured Notes Indentures. On or after their respective conversion dates until the close of business on the scheduled trading day immediately preceding their respective maturity date, holders may convert their Convertible Unsecured Notes at any time. In addition, if the Company engages in certain corporate events as described in their respective Convertible Unsecured Notes Indenture, holders of the Convertible Unsecured Notes may require the Company to repurchase for cash all or part of the Convertible Unsecured Notes at a repurchase price equal to 100% of the principal amount of the Convertible Unsecured Notes to be repurchased, plus accrued and unpaid interest through, but excluding, the required repurchase date.
Certain key terms related to the convertible features for each of the Convertible Unsecured Notes as of December 31, 2014 are listed below.
| |
February 2016 Convertible Notes |
June 2016 Convertible Notes |
2017 Convertible Notes |
2018 Convertible Notes |
2019 Convertible Notes |
|||||||||||
|---|---|---|---|---|---|---|---|---|---|---|---|---|---|---|---|---|
Conversion premium |
17.5 | % | 17.5 | % | 17.5 | % | 17.5 | % | 15.0 | % | ||||||
Closing stock price at issuance |
$16.28 | $16.20 | $16.46 | $16.91 | $17.53 | |||||||||||
Closing stock price date |
January 19, 2011 | March 22, 2011 | March 8, 2012 | October 3, 2012 | July 15, 2013 | |||||||||||
Conversion price(1) |
$18.52 | $18.43 | $19.01 | $19.70 | $20.05 | |||||||||||
Conversion rate (shares per one thousand dollar principal amount)(1) |
53.9908 | 54.2575 | 52.6043 | 50.7591 | 49.8854 | |||||||||||
Conversion dates |
August 15, 2015 | December 15, 2015 | September 15, 2016 | July 15, 2017 | July 15, 2018 | |||||||||||
- (1)
- Represents conversion price and conversion rate, as applicable, as of December 31, 2014, taking into account certain de minimis adjustments that will be made on the conversion date.
As of December 31, 2014, the principal amounts of each series of the Convertible Unsecured Notes exceeded the value of the underlying shares multiplied by the per share closing price of the Company's common stock.
F-70
The Convertible Unsecured Notes Indentures contain certain covenants, including covenants requiring the Company to comply with Section 18(a)(1)(A) as modified by Section 61(a)(1) of the Investment Company Act and to provide financial information to the holders of the Convertible Unsecured Notes under certain circumstances. These covenants are subject to important limitations and exceptions that are described in the Convertible Unsecured Notes Indentures. As of December 31, 2014, the Company was in compliance in all material respects with the terms of the Convertible Unsecured Notes Indentures.
The Convertible Unsecured Notes are accounted for in accordance with ASC 470-20. Upon conversion of any of the Convertible Unsecured Notes, the Company intends to pay the outstanding principal amount in cash and to the extent that the conversion value exceeds the principal amount, the Company has the option to pay in cash or shares of the Company's common stock (or a combination of cash and shares) in respect of the excess amount, subject to the requirements of the Convertible Unsecured Notes Indentures. The Company has determined that the embedded conversion options in the Convertible Unsecured Notes are not required to be separately accounted for as a derivative under GAAP. In accounting for the Convertible Unsecured Notes, the Company estimated at the time of issuance separate debt and equity components for each of the Convertible Unsecured Notes. An original issue discount equal to the equity components of the Convertible Unsecured Notes was recorded in "capital in excess of par value" in the accompanying consolidated balance sheet. Additionally, the issuance costs associated with the Convertible Unsecured Notes were allocated to the debt and equity components in proportion to the allocation of the proceeds and accounted for as debt issuance costs and equity issuance costs, respectively.
The debt and equity component percentages, the issuance costs and the equity component amounts for each of the Convertible Unsecured Notes are listed below.
| |
February 2016 Convertible Notes |
June 2016 Convertible Notes |
2017 Convertible Notes |
2018 Convertible Notes |
2019 Convertible Notes |
|||||||||||
|---|---|---|---|---|---|---|---|---|---|---|---|---|---|---|---|---|
Debt and equity component percentages, respectively(1) |
93.0% and 7.0 | % | 93.0% and 7.0 | % | 97.0% and 3.0 | % | 98.0% and 2.0 | % | 99.8% and 0.2 | % | ||||||
Debt issuance costs(1) |
$ | 15,778 | $ | 5,913 | $ | 4,813 | $ | 5,712 | $ | 4,475 | ||||||
Equity issuance costs(1) |
$ | 1,188 | $ | 445 | $ | 149 | $ | 116 | $ | 9 | ||||||
Equity component, net of issuance costs(2) |
$ | 39,062 | $ | 15,654 | $ | 4,724 | $ | 5,243 | $ | 582 | ||||||
- (1)
- At
time of issuance.
- (2)
- At time of issuance and as of December 31, 2014.
In addition to the original issue discount equal to the equity components of the Convertible Unsecured Notes, the 2018 Convertible Notes and the 2019 Convertible Notes were each issued at a discount. The Company records interest expense comprised of both stated interest expense as well as accretion of any original issue discount.
F-71
As of December 31, 2014, the components of the carrying value of the Convertible Unsecured Notes, the stated interest rate and the effective interest rate were as follows:
| |
February 2016 Convertible Notes |
June 2016 Convertible Notes |
2017 Convertible Notes |
2018 Convertible Notes |
2019 Convertible Notes |
|||||||||||
|---|---|---|---|---|---|---|---|---|---|---|---|---|---|---|---|---|
Principal amount of debt |
$ | 575,000 | $ | 230,000 | $ | 162,500 | $ | 270,000 | $ | 300,000 | ||||||
Original issue discount, net of accretion |
(9,999 | ) | (4,974 | ) | (2,320 | ) | (4,569 | ) | (3,870 | ) | ||||||
| | | | | | | | | | | | | | | | | |
Carrying value of debt |
$ | 565,001 | $ | 225,026 | $ | 160,180 | $ | 265,431 | $ | 296,130 | ||||||
| | | | | | | | | | | | | | | | | |
| | | | | | | | | | | | | | | | | |
| | | | | | | | | | | | | | | | | |
Stated interest rate |
5.750 | % | 5.125 | % | 4.875 | % | 4.750 | % | 4.375 | % | ||||||
Effective interest rate(1) |
7.2 | % | 6.5 | % | 5.5 | % | 5.2 | % | 4.7 | % | ||||||
- (1)
- The effective interest rate of the debt component of the Convertible Unsecured Notes is equal to the stated interest rate plus the accretion of original issue discount.
For the years ended December 31, 2014, 2013 and 2012, the components of interest expense and cash paid for interest expense for the Convertible Unsecured Notes were as follows:
| |
For the Years Ended December 31, | |||||||||
|---|---|---|---|---|---|---|---|---|---|---|
| |
2014 | 2013 | 2012 | |||||||
Stated interest expense |
$ | 78,722 | $ | 71,540 | $ | 53,877 | ||||
Amortization of debt issuance costs |
7,292 | 13,508 | 11,099 | |||||||
Accretion of original issue discount |
14,927 | 6,293 | 5,436 | |||||||
| | | | | | | | | | | |
Total interest expense |
$ | 100,941 | $ | 91,341 | $ | 70,412 | ||||
| | | | | | | | | | | |
| | | | | | | | | | | |
| | | | | | | | | | | |
Cash paid for interest expense |
$ | 78,612 | $ | 62,568 | $ | 48,833 | ||||
Unsecured Notes
2018 Notes
In November 2013, the Company issued $600,000 aggregate principal amount of unsecured notes that mature on November 30, 2018 (the "2018 Notes"). The 2018 Notes bear interest at a rate of 4.875% per year, payable semi-annually and all principal is due upon maturity. The 2018 Notes may be redeemed in whole or in part at any time at the Company's option at a redemption price equal to par plus a "make whole" premium, as determined pursuant to the indenture governing the 2018 Notes, and any accrued and unpaid interest. The 2018 Notes were issued at a discount at the time of issuance totaling $3,312. The Company records interest expense comprised of both stated interest expense as well as any accretion of any original issue discount. Total proceeds from the issuance of the 2018 Notes, net of the original issue discount, underwriting discounts and offering costs, were $586,014. In January 2014, the Company issued an additional $150,000 aggregate principal amount of the 2018 Notes at a premium of 102.7% of their principal amount (the "Additional 2018 Notes"). The original issue premium recognized upon issuance of the Additional 2018 Notes totaled $4,050. Total proceeds from the issuance of the Additional 2018 Notes, net of underwriting discounts and offering costs, were approximately $151,900.
F-72
2020 Notes
In November 2014, the Company issued $400,000 aggregate principal amount of unsecured notes that mature on January 15, 2020 (the "2020 Notes"). The 2020 Notes bear interest at a rate of 3.875% per year, payable semi-annually and all principal is due upon maturity. The 2020 Notes may be redeemed in whole or in part at any time at the Company's option at a redemption price equal to par plus a "make whole" premium, if applicable, as determined pursuant to the indenture governing the 2020 Notes, and any accrued and unpaid interest. The 2020 Notes were issued at a discount at the time of issuance totaling $1,600. The Company records interest expense comprised of both stated interest expense as well as any accretion of any original issue discount. Total proceeds from the issuance of the 2020 Notes, net of the original issue discount, underwriting discounts and offering costs, were $394,308. See Note 17 for a subsequent event relating to the 2020 Notes.
February 2022 Notes
In February 2012, the Company issued $143,750 aggregate principal amount of unsecured notes that mature on February 15, 2022 (the "February 2022 Notes"). The February 2022 Notes bear interest at a rate of 7.00% per year, payable quarterly and all principal is due upon maturity. The February 2022 Notes may be redeemed in whole or in part at any time or from time to time at the Company's option on or after February 15, 2015, at a par redemption price of $25.00 per security plus accrued and unpaid interest. Total proceeds from the issuance of the February 2022 Notes, net of underwriting discounts and offering costs, were $138,338. See Note 17 for a subsequent event relating to the February 2022 Notes.
October 2022 Notes
In September 2012 and October 2012, the Company issued $182,500 aggregate principal amount of unsecured notes that mature on October 1, 2022 (the "October 2022 Notes"). The October 2022 Notes bear interest at a rate of 5.875% per year, payable quarterly and all principal is due upon maturity. The October 2022 Notes may be redeemed in whole or in part at any time or from time to time at the Company's option on or after October 1, 2015, at a par redemption price of $25.00 per security plus accrued and unpaid interest. Total proceeds from the issuance of the October 2022 Notes, net of underwriting discounts and offering costs, were $176,054.
2040 Notes
In October 2010, the Company issued $200,000 aggregate principal amount of unsecured notes that mature on October 15, 2040 (the "2040 Notes"). The 2040 Notes bear interest at a rate of 7.75% per year, payable quarterly and all principal is due upon maturity. The 2040 Notes may be redeemed in whole or in part at any time or from time to time at the Company's option on or after October 15, 2015, at a par redemption price of $25.00 per security plus accrued and unpaid interest. Total proceeds from the issuance of the 2040 Notes, net of underwriting discounts and offering costs, were $192,664.
2047 Notes
As part of the acquisition of Allied Capital Corporation ("Allied Capital") in April 2010 (the "Allied Acquisition"), the Company assumed $230,000 aggregate principal amount of unsecured notes due on April 15, 2047 (the "2047 Notes" and together with the 2018 Notes, the 2020 Notes, the February 2022 Notes, the October 2022 Notes and the 2040 Notes, the "Unsecured Notes"). The 2047 Notes bear interest at a rate of 6.875%, payable quarterly and all principal is due upon maturity. The 2047 Notes may be redeemed in whole or in part at any time or from time to time at the Company's option, at a par redemption price of $25.00 per security plus accrued and unpaid interest. During the year ended December 31, 2014, the Company purchased $443 aggregate principal amount of the 2047
F-73
Notes and as a result of these transactions, the Company recognized a realized loss of $72. As of December 31, 2014 and 2013, the outstanding principal was $229,557 and $230,000, respectively, and the carrying value was $181,330 and $181,429, respectively. The carrying value represents the outstanding principal amount of the 2047 Notes less the unaccreted purchased discount recorded as a part of the Allied Acquisition.
For the years ended December 31, 2014, 2013 and 2012, the components of interest expense and cash paid for interest expense for the Unsecured Notes were as follows:
| |
For the Years Ended December 31, |
|||||||||
|---|---|---|---|---|---|---|---|---|---|---|
| |
2014 | 2013 | 2012 | |||||||
Stated interest expense |
$ | 89,804 | $ | 55,509 | $ | 43,357 | ||||
Amortization of debt issuance costs |
3,196 | 298 | 211 | |||||||
Accretion of purchase discount |
180 | 1,129 | 917 | |||||||
| | | | | | | | | | | |
Total interest expense |
$ | 93,180 | $ | 56,936 | $ | 44,485 | ||||
| | | | | | | | | | | |
| | | | | | | | | | | |
| | | | | | | | | | | |
Cash paid for interest expense |
$ | 85,672 | $ | 52,097 | $ | 42,070 | ||||
The Unsecured Notes contain certain covenants, including covenants requiring the Company to comply with Section 18(a)(1)(A) as modified by Section 61(a)(1) of the Investment Company Act and to provide financial information to the holders of such notes under certain circumstances. These covenants are subject to important limitations and exceptions set forth in the indentures governing such notes. As of December 31, 2014, the Company was in compliance in all material respects with the terms of the respective indentures governing each of the Unsecured Notes.
The Convertible Unsecured Notes and the Unsecured Notes are the Company's unsecured senior obligations and rank senior in right of payment to any future indebtedness that is expressly subordinated in right of payment to the Convertible Unsecured Notes and the Unsecured Notes; equal in right of payment to the Company's existing and future unsecured indebtedness that is not expressly subordinated; effectively junior in right of payment to any of its secured indebtedness (including existing unsecured indebtedness that the Company later secures) to the extent of the value of the assets securing such indebtedness; and structurally junior to all existing and future indebtedness (including trade payables) incurred by the Company's subsidiaries, financing vehicles or similar facilities.
Small Business Investment Company
The Company has applied to the Small Business Administration ("SBA") for a license to allow a new wholly owned subsidiary to operate as a Small Business Investment Company ("SBIC") under the Small Business Investment Act of 1958. In May 2014, the Company received a "green light" or "go forth letter" from the SBA inviting the Company to continue its application process to obtain a license to form and operate an SBIC subsidiary, and the Company submitted its license application in October 2014. If approved, the license would provide the Company with an incremental source of long-term debt capital. Receipt of a green light letter from the SBA does not assure an applicant that the SBA will ultimately issue an SBIC license, and the Company has received no assurance or indication from the SBA that it will receive an SBIC license or of the timeframe in which the Company would receive a license should one ultimately be granted.
6. DERIVATIVE INSTRUMENTS
The Company may enter into forward currency contracts from time to time to help mitigate the impact that an adverse change in foreign exchange rates would have on the value of the Company's investments denominated in foreign currencies. Forward contracts are considered undesignated derivative instruments.
F-74
Certain information related to the Company's derivative financial instruments is presented below as of December 31, 2014:
| |
As of December 31, 2014 | ||||||||||||||||
|---|---|---|---|---|---|---|---|---|---|---|---|---|---|---|---|---|---|
Description
|
Notional Amount |
Maturity Date | Gross Amount of Recognized Assets |
Gross Amount Offset in the Balance Sheet |
Net Amount of Assets in the Balance Sheet |
Balance Sheet Location |
|||||||||||
Foreign currency forward contract |
CAD45,000 | 1/8/2015 | $ | 40,247 | $ | (38,710 | ) | $ | 1,537 | Other assets | |||||||
| | | | | | | | | | | | | | | | | | |
Total |
$ | 40,247 | $ | (38,710 | ) | $ | 1,537 | ||||||||||
7. COMMITMENTS AND CONTINGENCIES
The Company has various commitments to fund investments in its portfolio as described below.
As of December 31, 2014 and 2013, the Company had the following commitments to fund various revolving and delayed draw senior secured and subordinated loans, including commitments to fund which are at (or substantially at) the Company's discretion:
| |
As of December 31, | ||||||
|---|---|---|---|---|---|---|---|
| |
2014 | 2013 | |||||
Total revolving and delayed draw commitments |
$ | 667,303 | $ | 834,444 | |||
Less: funded commitments |
(111,803 | ) | (87,073 | ) | |||
| | | | | | | | |
Total unfunded commitments |
555,500 | 747,371 | |||||
Less: commitments substantially at discretion of the Company |
(6,000 | ) | (16,000 | ) | |||
Less: unavailable commitments due to borrowing base or other covenant restrictions |
(2,700 | ) | (1,660 | ) | |||
| | | | | | | | |
Total net adjusted unfunded revolving and delayed draw commitments |
$ | 546,800 | $ | 729,711 | |||
| | | | | | | | |
| | | | | | | | |
| | | | | | | | |
Included within the total revolving and delayed draw commitments as of December 31, 2014 were commitments to issue up to $71,700 in letters of credit through a financial intermediary on behalf of certain portfolio companies. As of December 31, 2014, the Company had $19,695 in letters of credit issued and outstanding under these commitments on behalf of portfolio companies. In addition to these letters of credit included as a part of the total revolving and delayed draw commitments to portfolio companies, as of December 31, 2014 the Company also had $5,284 of letters of credit issued and outstanding on behalf of other portfolio companies. For all these letters of credit issued and outstanding, the Company would be required to make payments to third parties if the portfolio companies were to default on their related payment obligations. None of these letters of credit issued and outstanding are recorded as a liability on the Company's balance sheet as such letters of credit are considered in the valuation of the investments in the portfolio company. Of these letters of credit $18,057 expire in 2015 and $6,922 expire in 2016.
The Company also has commitments to co-invest in the SSLP for the Company's portion of the SSLP's commitments to fund delayed draw investments to certain portfolio companies of the SSLP. See Note 4 for more information.
F-75
As of December 31, 2014 and 2013, the Company was party to subscription agreements to fund equity investments in private equity investment partnerships as follows:
| |
As of December 31, | ||||||
|---|---|---|---|---|---|---|---|
| |
2014 | 2013 | |||||
Total private equity commitments |
$ | 107,000 | $ | 59,500 | |||
Less: funded private equity commitments |
(13,912 | ) | (11,891 | ) | |||
| | | | | | | | |
Total unfunded private equity commitments |
93,088 | 47,609 | |||||
Less: private equity commitments substantially at discretion of the Company |
(91,163 | ) | (43,206 | ) | |||
| | | | | | | | |
Total net adjusted unfunded private equity commitments |
$ | 1,925 | $ | 4,403 | |||
| | | | | | | | |
| | | | | | | | |
| | | | | | | | |
In the ordinary course of business, the Company may sell certain of its investments to third party purchasers. In particular, in connection with the sale of certain controlled portfolio company equity investments (as well as certain other sales) the Company has, and may continue to do so in the future, agreed to indemnify such purchasers for future liabilities arising from the investments and the related sale transaction. Such indemnification provisions have given rise to liabilities in the past and may do so in the future.
Lease Commitments
The Company is obligated under a number of operating leases and subleases for office spaces with terms ranging from less than one year to more than 15 years. Total rent expense incurred by the Company for the years ended December 31, 2014, 2013 and 2012 was $3,366, $3,687 and $3,958, respectively.
The following table shows future minimum payments under the Company's operating leases and subleases as of December 31, 2014:
For the Years Ended December 31,
|
Amount | |||
|---|---|---|---|---|
2015 |
$ | 8,671 | ||
2016 |
9,349 | |||
2017 |
9,514 | |||
2018 |
9,406 | |||
2019 |
9,411 | |||
Thereafter |
58,591 | |||
| | | | | |
Total |
$ | 104,942 | ||
| | | | | |
| | | | | |
| | | | | |
For certain of its operating leases, the Company has entered into subleases including ones with Ares Management and IHAM, a wholly owned portfolio company of the Company. See Note 13 for further description of these subleases.
The following table shows future expected rental payments to be received under the Company's subleases as of December 31, 2014. The current allocations reflected below are as of December 31, 2014. The allocations in connection with the Company's subleases are subject to change and future
F-76
review. Further, such allocations are subject to change depending on the composition of, and functions performed by, the staff in each office.
For the Years Ended December 31,
|
Amount | |||
|---|---|---|---|---|
2015 |
$ | 5,148 | ||
2016 |
5,584 | |||
2017 |
5,677 | |||
2018 |
5,674 | |||
2019 |
5,614 | |||
Thereafter |
37,144 | |||
| | | | | |
Total |
$ | 64,841 | ||
| | | | | |
| | | | | |
| | | | | |
8. FAIR VALUE OF FINANCIAL INSTRUMENTS
The Company follows ASC 825-10, which provides companies the option to report selected financial assets and liabilities at fair value. ASC 825-10 also establishes presentation and disclosure requirements designed to facilitate comparisons between companies that choose different measurement attributes for similar types of assets and liabilities and to more easily understand the effect of the company's choice to use fair value on its earnings. ASC 825-10 also requires entities to display the fair value of the selected assets and liabilities on the face of the balance sheet. The Company has not elected the ASC 825-10 option to report selected financial assets and liabilities at fair value. With the exception of the line items entitled "other assets" and "debt," which are reported at amortized cost, all assets and liabilities approximate fair value on the balance sheet. The carrying value of the lines titled "interest receivable," "receivable for open trades," "payable for open trades," "accounts payable and other liabilities," "base management fees payable," "income based fees payable," "capital gains incentive fees payable" and "interest and facility fees payable" approximate fair value due to their short maturity.
The Company also follows ASC 820-10, which expands the application of fair value accounting. ASC 820-10 defines fair value, establishes a framework for measuring fair value in accordance with GAAP and expands disclosure of fair value measurements. ASC 820-10 determines fair value to be the price that would be received for an investment in a current sale, which assumes an orderly transaction between market participants on the measurement date. ASC 820-10 requires the Company to assume that the portfolio investment is sold in its principal market to market participants or, in the absence of a principal market, the most advantageous market, which may be a hypothetical market. Market participants are defined as buyers and sellers in the principal or most advantageous market that are independent, knowledgeable, and willing and able to transact. In accordance with ASC 820-10, the Company has considered its principal market as the market in which the Company exits its portfolio investments with the greatest volume and level of activity. ASC 820-10 specifies a hierarchy of valuation techniques based on whether the inputs to those valuation techniques are observable or unobservable. In accordance with ASC 820-10, these inputs are summarized in the three broad levels listed below:
- •
- Level 1—Valuations based on quoted prices in active markets for identical assets or liabilities that the Company
has the ability to access.
- •
- Level 2—Valuations based on quoted prices in markets that are not active or for which all significant inputs are
observable, either directly or indirectly.
- •
- Level 3—Valuations based on inputs that are unobservable and significant to the overall fair value measurement.
In addition to using the above inputs in investment valuations, the Company continues to employ the net asset valuation policy approved by the Company's board of directors that is consistent with
F-77
ASC 820-10 (see Note 2). Consistent with the Company's valuation policy, it evaluates the source of inputs, including any markets in which the Company's investments are trading (or any markets in which securities with similar attributes are trading), in determining fair value. The Company's valuation policy considers the fact that because there is not a readily available market value for most of the investments in the Company's portfolio, the fair value of the investments must typically be determined using unobservable inputs.
The Company's portfolio investments (other than as discussed below in the following paragraph) are typically valued using two different valuation techniques. The first valuation technique is an analysis of the enterprise value ("EV") of the portfolio company. Enterprise value means the entire value of the portfolio company to a market participant, including the sum of the values of debt and equity securities used to capitalize the enterprise at a point in time. The primary method for determining EV uses a multiple analysis whereby appropriate multiples are applied to the portfolio company's EBITDA (net income before net interest expense, income tax expense, depreciation and amortization). EBITDA multiples are typically determined based upon review of market comparable transactions and publicly traded comparable companies, if any. The Company may also employ other valuation multiples to determine EV, such as revenues or, in the case of certain portfolio companies in the power generation industry, kilowatt capacity. The second method for determining EV uses a discounted cash flow analysis whereby future expected cash flows of the portfolio company are discounted to determine a present value using estimated discount rates (typically a weighted average cost of capital based on costs of debt and equity consistent with current market conditions). The EV analysis is performed to determine the value of equity investments, the value of debt investments in portfolio companies where the Company has control or could gain control through an option or warrant security, and to determine if there is credit impairment for debt investments. If debt investments are credit impaired, an EV analysis may be used to value such debt investments; however, in addition to the methods outlined above, other methods such as a liquidation or wind-down analysis may be utilized to estimate enterprise value. The second valuation technique is a yield analysis, which is typically performed for non-credit impaired debt investments in portfolio companies where the Company does not own a controlling equity position. To determine fair value using a yield analysis, a current price is imputed for the investment based upon an assessment of the expected market yield for a similarly structured investment with a similar level of risk. In the yield analysis, the Company considers the current contractual interest rate, the maturity and other terms of the investment relative to risk of the company and the specific investment. A key determinant of risk, among other things, is the leverage through the investment relative to the enterprise value of the portfolio company. As debt investments held by the Company are substantially illiquid with no active transaction market, the Company depends on primary market data, including newly funded transactions, as well as secondary market data with respect to high yield debt instruments and syndicated loans, as inputs in determining the appropriate market yield, as applicable.
For other portfolio investments such as investments in collateralized loan obligations and the SSLP Certificates, discounted cash flow analysis is the primary technique utilized to determine fair value. Expected future cash flows associated with the investment are discounted to determine a present value using a discount rate that reflects estimated market return requirements.
The following tables summarize the significant unobservable inputs the Company used to value the majority of its investments categorized within Level 3 as of December 31, 2014 and 2013. The tables
F-78
are not intended to be all-inclusive, but instead capture the significant unobservable inputs relevant to the Company's determination of fair values.
| |
As of December 31, 2014 | ||||||||||||
|---|---|---|---|---|---|---|---|---|---|---|---|---|---|
| |
|
|
Unobservable Input | ||||||||||
Asset Category
|
Fair Value |
Primary Valuation Techniques |
Input | Estimated Range |
Weighted Average |
||||||||
First lien senior secured loans |
$ | 3,700,602 | Yield analysis | Market yield | 4.0% - 20.0% | 8.5 | % | ||||||
Second lien senior secured loans |
1,900,464 | Yield analysis | Market yield | 6.6% - 13.5% | 9.5 | % | |||||||
Subordinated certificates of the SSLP |
2,065,015 | Discounted cash flow analysis | Discount rate | 10.0% - 13.0% | 11.8 | % | |||||||
Senior subordinated debt |
523,288 | Yield analysis | Market yield | 8.3% - 14.0% | 11.2 | % | |||||||
Preferred equity securities |
190,254 | EV market multiple analysis | EBITDA multiple | 4.5x - 15.2x | 9.7 | x | |||||||
Other equity securities and other |
644,157 | EV market multiple analysis | EBITDA multiple | 4.5x - 14.5x | 9.5 | x | |||||||
| | | | | | | | | | | | | | |
Total |
$ | 9,023,780 | |||||||||||
| | | | | | | | | | | | | | |
| | | | | | | | | | | | | | |
| | | | | | | | | | | | | | |
| |
As of December 31, 2013 | ||||||||||||
|---|---|---|---|---|---|---|---|---|---|---|---|---|---|
| |
|
|
Unobservable Input | ||||||||||
Asset Category
|
Fair Value |
Primary Valuation Technique |
Input | Estimated Range |
Weighted Average |
||||||||
First lien senior secured loans |
$ | 3,433,608 | Yield analysis | Market yield | 4.0% - 19.0% | 8.4 | % | ||||||
Second lien senior secured loans |
1,319,191 | Yield analysis | Market yield | 6.1% - 25.3% | 10.3 | % | |||||||
Subordinated certificates of the SSLP |
1,771,369 | Discounted cash flow analysis | Discount rate | 10.5% - 13.5% | 12.3 | % | |||||||
Senior subordinated debt |
267,171 | Yield analysis | Market yield | 9.0% - 17.5% | 11.7 | % | |||||||
Preferred equity securities |
229,006 | EV market multiple analysis | EBITDA multiple | 4.5x - 11.6x | 8.3 | x | |||||||
Other equity securities and other |
612,552 | EV market multiple analysis | EBITDA multiple | 4.5x - 14.8x | 8.6 | x | |||||||
| | | | | | | | | | | | | | |
Total |
$ | 7,632,897 | |||||||||||
| | | | | | | | | | | | | | |
| | | | | | | | | | | | | | |
| | | | | | | | | | | | | | |
Changes in market yields, discount rates or EBITDA multiples, each in isolation, may change the fair value of certain of the Company's investments. Generally, an increase in market yields or discount rates or decrease in EBITDA multiples may result in a decrease in the fair value of certain of the Company's investments.
Due to the inherent uncertainty of determining the fair value of investments that do not have a readily available market value, the fair value of the Company's investments may fluctuate from period to period. Additionally, the fair value of the Company's investments may differ significantly from the values that would have been used had a ready market existed for such investments and may differ materially from the values that the Company may ultimately realize. Further, such investments are generally subject to legal and other restrictions on resale or otherwise are less liquid than publicly traded securities. If the Company was required to liquidate a portfolio investment in a forced or liquidation sale, it could realize significantly less than the value at which the Company has recorded it.
In addition, changes in the market environment and other events that may occur over the life of the investments may cause the gains or losses ultimately realized on these investments to be different than the unrealized gains or losses reflected in the valuations currently assigned.
F-79
The following table presents fair value measurements of cash and cash equivalents, investments and derivatives as of December 31, 2014:
| |
Fair Value Measurements Using | ||||||||||||
|---|---|---|---|---|---|---|---|---|---|---|---|---|---|
| |
Total | Level 1 | Level 2 | Level 3 | |||||||||
Cash and cash equivalents |
$ | 194,555 | $ | 194,555 | $ | — | $ | — | |||||
Investments |
$ | 9,028,379 | $ | 4,599 | $ | — | $ | 9,023,780 | |||||
Derivatives |
$ | 1,537 | $ | — | $ | 1,537 | $ | — | |||||
The following table presents fair value measurements of cash and cash equivalents and investments as of December 31, 2013:
| |
Fair Value Measurements Using | ||||||||||||
|---|---|---|---|---|---|---|---|---|---|---|---|---|---|
| |
Total | Level 1 | Level 2 | Level 3 | |||||||||
Cash and cash equivalents |
$ | 149,629 | $ | 149,629 | $ | — | $ | — | |||||
Investments |
$ | 7,632,897 | $ | — | $ | — | $ | 7,632,897 | |||||
The following table presents changes in investments that use Level 3 inputs as of and for the as of and for the year ended December 31, 2014:
| |
As of and For the Year Ended December 31, 2014 |
|||
|---|---|---|---|---|
Balance as of December 31, 2013 |
$ | 7,632,897 | ||
Net realized gains |
90,578 | |||
Net unrealized gains |
56,379 | |||
Purchases |
4,536,868 | |||
Sales |
(1,035,697 | ) | ||
Redemptions |
(2,267,822 | ) | ||
Payment-in-kind interest and dividends |
11,916 | |||
Net accretion of discount on securities |
3,153 | |||
Net transfers in and/or out of Level 3 |
(4,492 | ) | ||
| | | | | |
Balance as of December 31, 2014 |
$ | 9,023,780 | ||
| | | | | |
| | | | | |
| | | | | |
As of December 31, 2014, the net unrealized appreciation on the investments that use Level 3 inputs was $150,237.
For the year ended December 31, 2014, the total amount of gains (losses) for the period included in earnings attributable to the change in unrealized gains (losses) relating to the Company's Level 3 assets still held as of December 31, 2014, and reported within the net unrealized gains (losses) from investments in the Company's consolidated statement of operations was $63,638.
F-80
The following table presents changes in investments that use Level 3 inputs as of and for the year ended December 31, 2013:
| |
As of and For the Year Ended December 31, 2013 |
|||
|---|---|---|---|---|
Balance as of December 31, 2012 |
$ | 5,914,657 | ||
Net realized gains |
63,629 | |||
Net unrealized losses |
(5,612 | ) | ||
Purchases |
3,493,227 | |||
Sales |
(866,052 | ) | ||
Redemptions |
(990,538 | ) | ||
Payment-in-kind interest and dividends |
18,894 | |||
Net accretion of discount on securities |
4,692 | |||
Net transfers in and/or out of Level 3 |
— | |||
| | | | | |
Balance as of December 31, 2013 |
$ | 7,632,897 | ||
| | | | | |
| | | | | |
| | | | | |
As of December 31, 2013, the net unrealized appreciation on the investments that use Level 3 inputs was $95,494.
For the year ended December 31, 2013, the total amount of gains (losses) for the period included in earnings attributable to the change in unrealized gains (losses) relating to the Company's Level 3 assets still held as of December 31, 2013, and reported within the net unrealized gains (losses) from investments in the Company's consolidated statement of operations was $(6,948).
Transfers between levels, if any, are recognized at the beginning of the quarter in which the transfers occur.
Following are the carrying and fair values of the Company's debt obligations as of December 31, 2014 and 2013. Fair value is estimated by discounting remaining payments using applicable current
F-81
market rates, which take into account changes in the Company's marketplace credit ratings, or market quotes, if available.
| |
As of December 31, | ||||||||||||
|---|---|---|---|---|---|---|---|---|---|---|---|---|---|
| |
2014 | 2013 | |||||||||||
| |
Carrying value(1) |
Fair value | Carrying value(1) |
Fair value | |||||||||
Revolving Credit Facility |
$ | 170,000 | $ | 170,000 | $ | — | $ | — | |||||
Revolving Funding Facility |
324,000 | 324,000 | 185,000 | 185,000 | |||||||||
SMBC Funding Facility |
62,000 | 62,000 | — | — | |||||||||
February 2016 Convertible Notes (principal amount outstanding of $575,000) |
565,001 | (2) | 592,940 | 556,456 | (2) | 620,960 | |||||||
June 2016 Convertible Notes (principal amount outstanding of $230,000) |
225,026 | (2) | 237,010 | 221,788 | (2) | 246,810 | |||||||
2017 Convertible Notes (principal amount outstanding of $162,500) |
160,180 | (2) | 168,521 | 159,220 | (2) | 172,289 | |||||||
2018 Convertible Notes (principal amount outstanding of $270,000) |
265,431 | (2) | 279,169 | 264,096 | (2) | 284,702 | |||||||
2019 Convertible Notes (principal amount outstanding of $300,000) |
296,130 | (2) | 302,532 | 295,279 | (2) | 311,169 | |||||||
2018 Notes (principal amount outstanding of $750,000 and $600,000, respectively) |
750,704 | (3) | 788,288 | 596,757 | (3) | 619,782 | |||||||
2020 Notes (principal amount outstanding of $400,000) |
398,430 | (4) | 399,740 | — | — | ||||||||
February 2022 Notes (principal amount outstanding of $143,750) |
143,750 | 144,764 | 143,750 | 149,364 | |||||||||
October 2022 Notes (principal amount outstanding of $182,500) |
182,500 | 183,835 | 182,500 | 181,770 | |||||||||
2040 Notes (principal amount outstanding of $200,000) |
200,000 | 203,208 | 200,000 | 199,208 | |||||||||
2047 Notes (principal amount outstanding of $229,557 and $230,000, respectively) |
181,330 | (5) | 226,592 | 181,429 | (5) | 206,606 | |||||||
| | | | | | | | | | | | | | |
|
$ | 3,924,482 | (6) | $ | 4,082,599 | $ | 2,986,275 | (6) | $ | 3,177,660 | |||
| | | | | | | | | | | | | | |
| | | | | | | | | | | | | | |
| | | | | | | | | | | | | | |
- (1)
- Except
for the Convertible Unsecured Notes, the 2018 Notes, the 2020 Notes and the 2047 Notes, all carrying values are the same as the principal amounts
outstanding.
- (2)
- Represents
the aggregate principal amount outstanding of the Convertible Unsecured Notes less the unaccreted discount recorded upon issuance of each
respective series of the Convertible Unsecured Notes.
- (3)
- As
of December 31, 2014, represents the aggregate principal amount outstanding plus the net unamortized premium that was recorded upon the issuances
of the 2018 Notes. As of December 31, 2013, represents the aggregate principal amount outstanding of the 2018 Notes less the unaccreted discount recognized on the first issuance of the 2018
Notes.
- (4)
- As
of December 31, 2014, represents the aggregate principal amount outstanding of the 2020 Notes less the unaccreted discount recognized on the
issuance of the 2020 Notes.
- (5)
- Represents the aggregate principal amount outstanding of the 2047 Notes less the unaccreted purchased discount.
F-82
- (6)
- Total principal amount of debt outstanding totaled $3,999,307 and $3,078,750 as of December 31, 2014 and December 31, 2013, respectively.
The following table presents fair value measurements of the Company's debt obligations as of December 31, 2014 and 2013:
| |
As of December 31, | ||||||
|---|---|---|---|---|---|---|---|
Fair Value Measurements Using
|
2014 | 2013 | |||||
Level 1 |
$ | 758,399 | $ | 736,948 | |||
Level 2 |
3,324,200 | 2,440,712 | |||||
| | | | | | | | |
Total |
$ | 4,082,599 | $ | 3,177,660 | |||
| | | | | | | | |
| | | | | | | | |
| | | | | | | | |
9. STOCKHOLDERS' EQUITY
The following table summarizes the total shares issued and proceeds received in public offerings of the Company's common stock net of underwriting discounts and offering costs for the years ended December 31, 2014, 2013 and 2012:
| |
Shares issued |
Offering price per share(1) |
Proceeds net of underwriting discounts and offering costs |
|||||||
|---|---|---|---|---|---|---|---|---|---|---|
2014 |
||||||||||
July 2014 public offering |
15,525 | $ | 16.63 | $ | 257,667 | |||||
| | | | | | | | | | | |
Total for the year ended December 31, 2014 |
15,525 | $ | 257,667 | |||||||
2013 |
||||||||||
December 2013 public offering |
16,445 | $ | 17.47 | $ | 285,993 | |||||
October 2013 public offering |
12,650 | $ | 16.98 | 214,339 | ||||||
April 2013 public offering |
19,148 | $ | 17.43 | 333,144 | ||||||
| | | | | | | | | | | |
Total for the year ended December 31, 2013 |
48,243 | $ | 833,476 | |||||||
2012 |
||||||||||
August 2012 public offering |
25,875 | $ | 16.55 | $ | 427,566 | |||||
January 2012 public offering |
16,422 | $ | 15.41 | 252,415 | ||||||
| | | | | | | | | | | |
|
42,297 | $ | 679,981 | |||||||
- (1)
- The shares were sold to the underwriters for a price equal to the offering price per share, which the underwriters were then permitted to sell at variable prices to the public.
The Company used the net proceeds from the above public equity offerings to repay outstanding indebtedness and for general corporate purposes, which included funding investments in accordance with its investment objective.
F-83
10. EARNINGS PER SHARE
The following information sets forth the computations of basic and diluted net increase in stockholders' equity resulting from operations per share for the years ended December 31, 2014, 2013 and 2012:
| |
For the Years Ended December 31, | |||||||||
|---|---|---|---|---|---|---|---|---|---|---|
| |
2014 | 2013 | 2012 | |||||||
Net increase in stockholders' equity resulting from operations available to common stockholders |
$ | 590,949 | $ | 488,521 | $ | 508,178 | ||||
Weighted average shares of common stock outstanding—basic and diluted |
305,287 | 266,939 | 230,151 | |||||||
Basic and diluted net increase in stockholders' equity resulting from operations per share |
$ | 1.94 | $ | 1.83 | $ | 2.21 | ||||
For the purpose of calculating diluted net increase in stockholders' equity resulting from operations per share, the average closing price of the Company's common stock for the year ended December 31, 2014 was less than the conversion price for each of the Convertible Unsecured Notes outstanding as of December 31, 2014. For the year ended December 31, 2013 and the date of issuance of the 2019 Convertible Notes through December 31, 2013, the average closing price of the Company's common stock for such period was each less than the conversion price for each of the Convertible Unsecured Notes outstanding as of December 31, 2013. For the year ended December 31, 2012, the date of issuance of the 2018 Convertible Notes through December 31, 2012 and the date of issuance of the 2017 Convertible Notes through December 31, 2012, the average closing price of the Company's common stock for such period was each less than the conversion price for each of the Convertible Unsecured Notes outstanding as of December 31, 2012. Therefore, for all periods presented in the financial statements, the underlying shares for the intrinsic value of the embedded options in the Convertible Unsecured Notes have no impact on the computation of diluted net increase in stockholders' equity resulting from operations per share.
11. INCOME AND EXCISE TAXES
For income tax purposes, dividends paid and distributions made to the Company's stockholders are reported by the Company to the stockholders as ordinary income, capital gains, or a combination thereof. Dividends paid per common share for the years ended December 31, 2014, 2013 and 2012 were taxable as follows (unaudited):
| |
For the Years Ended December 31, |
|||||||||
|---|---|---|---|---|---|---|---|---|---|---|
| |
2014 | 2013 | 2012 | |||||||
Ordinary income(1) |
$ | 1.57 | $ | 1.57 | $ | 1.56 | ||||
Capital gains |
— | — | 0.04 | |||||||
| | | | | | | | | | | |
Total |
$ | 1.57 | $ | 1.57 | $ | 1.60 | ||||
| | | | | | | | | | | |
| | | | | | | | | | | |
| | | | | | | | | | | |
- (1)
- For the years ended December 31, 2014, 2013 and 2012, ordinary income included dividend income of approximately $0.1055, $0.1082 and $0.0918, per share, respectively, that qualified to be taxed at the maximum capital gains rate. For certain eligible corporate shareholders, these dividends were eligible for the dividends received deduction.
F-84
The following reconciles net increase in stockholders' equity resulting from operations to taxable income for the years ended December 31, 2014, 2013 and 2012:
| |
For the Years Ended December 31, | |||||||||
|---|---|---|---|---|---|---|---|---|---|---|
| |
2014 | 2013 | 2012 | |||||||
| |
(Estimated)(1) |
|
|
|||||||
Net increase in stockholders' equity resulting from operations |
$ | 590,949 | $ | 488,521 | $ | 508,178 | ||||
Adjustments: |
||||||||||
Net unrealized (gains) losses on investments |
(59,364 | ) | 5,610 | (115,261 | ) | |||||
Income not currently taxable |
(58,608 | ) | (78,309 | ) | (26,270 | ) | ||||
Income for tax but not book |
12,533 | 43,264 | 55,723 | |||||||
Expenses not currently deductible |
42,764 | 24,876 | 46,333 | |||||||
Expenses for tax but not book |
(4,628 | ) | (7,906 | ) | (6,211 | ) | ||||
Realized gain/loss differences |
(94,546 | ) | (65,244 | ) | (15,689 | ) | ||||
| | | | | | | | | | | |
Taxable income |
$ | 429,100 | $ | 410,812 | $ | 446,803 | ||||
| | | | | | | | | | | |
| | | | | | | | | | | |
| | | | | | | | | | | |
- (1)
- The calculation of estimated 2014 taxable income includes a number of estimated inputs, including information received from third parties and, as a result, actual 2014 taxable income will not be finally determined until the Company's 2014 tax return is filed in 2015 (and, therefore, such estimate is subject to change).
Taxable income generally differs from net increase in stockholders' equity resulting from operations for financial reporting purposes due to temporary and permanent differences in the recognition of income and expenses, and generally excludes net unrealized gains or losses, as unrealized gains or losses are generally not included in taxable income until they are realized. In addition, on April 1, 2010, the Company acquired Allied Capital in a tax-free merger, which has caused certain merger-related items to vary in their deductibility for GAAP and tax purposes.
Capital losses in excess of capital gains earned in a tax year may generally be carried forward and used to offset capital gains, subject to certain limitations. As of December 31, 2014, the Company estimates that it will have a capital loss carryforward of approximately $103 million available for use in later tax years. Because of the loss limitation rules of the Code, some of the tax basis capital losses may be limited in their use. The unused balance will be carried forward and utilized as gains are realized, subject to such limitations. In addition to the capital loss carryforwards, the Company realized tax basis net losses totaling approximately $0.3 billion from the Allied Capital portfolio since the Allied Acquisition through December 31, 2014, that have not yet been deducted for tax purposes as their deductibility in years since the Allied Acquisition was limited by the Code. While the Company's ability to utilize losses in the future depends upon a variety of factors that cannot be known in advance, substantially all of the Company's capital loss carryforwards and the net realized losses from the Allied Capital portfolio may become permanently unavailable due to limitations by the Code.
For 2014, the Company had estimated taxable income in excess of the distributions made from such taxable income during the year, and therefore, the Company has elected to carry forward the excess for distribution to shareholders in 2015. The amount carried forward to 2015 is estimated to be approximately $181 million, although this amount will not be finalized until the 2014 tax returns are filed in 2015. For 2013 and 2012, the Company had taxable income in excess of the distributions made from such taxable income during the year, and therefore, the Company elected to carry forward the excess for distribution to shareholders in 2014 and 2013, respectively. The amount carried forward to 2014 and 2013 was approximately $232 million and $246 million, respectively. To the extent that the Company determines that its estimated current year annual taxable income will be in excess of estimated current year dividend distributions from such income, the Company accrues excise tax on
F-85
estimated excess taxable income. For the years ended December 31, 2014, 2013 and 2012, a net expense of $5,486, $10,277 and $7,937, respectively, was recorded for U.S. federal excise tax.
As of December 31, 2014, the cost basis of investments for tax purposes was $9.6 billion resulting in estimated gross unrealized gains and losses of $0.3 billion and $0.9 billion, respectively. As of December 31, 2013, the cost basis of investments for tax purposes was $8.5 billion resulting in estimated gross unrealized gains and losses of $0.3 billion and $1.2 billion, respectively. As of December 31, 2014 and 2013, the cost of investments for tax purposes was greater than the amortized cost of investments for book purposes of $8.9 billion and $7.5 billion, respectively, primarily as a result of the Allied Acquisition. The Allied Acquisition qualified as a tax free merger, which resulted in the acquired assets retaining Allied Capital's cost basis at the merger date.
In general, the Company may make certain adjustments to the classification of stockholders' equity as a result of permanent book-to-tax differences, which may include merger-related items, differences in the book and tax basis of certain assets and liabilities, and nondeductible federal taxes, among other items. During the year ended December 31, 2014, the Company decreased accumulated overdistributed net investment income by $18,329, increased accumulated net realized loss on investments, foreign currency transactions, extinguishment of debt and other assets by $95,411 and increased capital in excess of par value by $77,082. During the year ended December 31, 2013, the Company decreased accumulated overdistributed net investment income by $14,106, increased accumulated net realized loss on investments, foreign currency transactions, extinguishment of debt and other assets by $26,151 and increased capital in excess of par value by $12,045. During the year ended December 31, 2012, the Company decreased accumulated overdistributed net investment income by $11,172, increased accumulated net realized loss on investments, foreign currency transactions, extinguishment of debt and other assets by $27,982 and increased capital in excess of par value by $16,810.
Certain of the Company's consolidated subsidiaries are subject to U.S. federal and state income taxes. For the years ended December 31, 2014, 2013 and 2012, the Company recorded a tax expense of approximately $12,843, $3,828 and $3,235, respectively, for these subsidiaries.
F-86
12. DIVIDENDS AND DISTRIBUTIONS
The following table summarizes the Company's dividends declared and payable during the years ended December 31, 2014, 2013 and 2012:
Date declared
|
Record date | Payment date | Per share amount |
Total amount |
|||||||
|---|---|---|---|---|---|---|---|---|---|---|---|
November 4, 2014 |
December 15, 2014 | December 31, 2014 | $ | 0.38 | $ | 119,361 | |||||
August 5, 2014 |
September 15, 2014 | September 30, 2014 | 0.38 | 119,361 | |||||||
May 6, 2014 |
June 16, 2014 | June 30, 2014 | 0.38 | 113,343 | |||||||
February 26, 2014 |
March 14, 2014 | March 31, 2014 | 0.38 | 113,228 | |||||||
November 5, 2013 |
March 14, 2014 | March 28, 2014 | 0.05 | (1) | 14,899 | ||||||
| | | | | | | | | | | | |
Total declared for 2014 |
$ | 1.57 | $ | 480,192 | |||||||
| | | | | | | | | | | | |
| | | | | | | | | | | | |
| | | | | | | | | | | | |
November 5, 2013 |
December 16, 2013 | December 31, 2013 | $ | 0.38 | $ | 112,307 | |||||
November 5, 2013 |
December 16, 2013 | December 31, 2013 | 0.05 | (1) | 14,777 | ||||||
August 6, 2013 |
September 16, 2013 | September 30, 2013 | 0.38 | 101,959 | |||||||
May 7, 2013 |
June 14, 2013 | June 28, 2013 | 0.38 | 101,856 | |||||||
February 27, 2013 |
March 15, 2013 | March 29, 2013 | 0.38 | 94,488 | |||||||
| | | | | | | | | | | | |
Total declared for 2013 |
$ | 1.57 | $ | 425,387 | |||||||
| | | | | | | | | | | | |
| | | | | | | | | | | | |
| | | | | | | | | | | | |
November 5, 2012 |
December 14, 2012 | December 28, 2012 | $ | 0.38 | $ | 94,360 | |||||
November 5, 2012 |
December 14, 2012 | December 28, 2012 | 0.05 | (1) | 12,415 | ||||||
August 7, 2012 |
September 14, 2012 | September 28, 2012 | 0.38 | 94,250 | |||||||
August 7, 2012 |
September 14, 2012 | September 28, 2012 | 0.05 | (1) | 12,401 | ||||||
May 8, 2012 |
June 15, 2012 | June 29, 2012 | 0.37 | 82,094 | |||||||
February 28, 2012 |
March 15, 2012 | March 30, 2012 | 0.37 | 81,974 | |||||||
| | | | | | | | | | | | |
Total declared for 2012 |
$ | 1.60 | $ | 377,494 | |||||||
| | | | | | | | | | | | |
| | | | | | | | | | | | |
| | | | | | | | | | | | |
- (1)
- Represents an additional dividend.
The Company has a dividend reinvestment plan, whereby the Company may buy shares of its common stock in the open market or issue new shares in order to satisfy dividend reinvestment requests. When the Company issues new shares in connection with the dividend reinvestment plan, the issue price is equal to the closing price of its common stock on the dividend payment date. Dividend reinvestment plan activity for the years ended December 31, 2014, 2013 and 2012, was as follows:
| |
2014 | 2013 | 2012 | |||||||
|---|---|---|---|---|---|---|---|---|---|---|
Shares issued |
612 | 1,076 | 1,226 | |||||||
Average price per share |
$ | 17.74 | $ | 17.58 | $ | 16.68 | ||||
Shares purchased by plan agent for stockholders |
696 | — | — | |||||||
Average price per share |
$ | 15.93 | $ | — | $ | — | ||||
13. RELATED PARTY TRANSACTIONS
In accordance with the investment advisory and management agreement, the Company bears all costs and expenses of the operation of the Company and reimburses its investment adviser or its affiliates for certain of such costs and expenses incurred in the operation of the Company. For the years ended December 31, 2014, 2013 and 2012, the Company's investment adviser or its affiliates incurred such expenses totaling $6,197, $5,250 and $3,528, respectively. As of December 31, 2014, $1,696 was unpaid and such payable is included in "accounts payable and other liabilities" in the accompanying consolidated balance sheet.
F-87
The Company is party to office leases pursuant to which it is leasing office facilities from third parties. For certain of these office leases, the Company has also entered into separate subleases with Ares Management LLC, the sole member of Ares Capital Management, and IHAM, pursuant to which Ares Management LLC and IHAM sublease a portion of these leases. For the years ended December 31, 2014, 2013 and 2012, amounts payable to the Company under these subleases totaled $4,073, $2,183 and $1,587, respectively.
Ares Management LLC has also entered into separate subleases with the Company, pursuant to which the Company subleases certain office spaces from Ares Management LLC. For the years ended December 31, 2014 and 2013 amounts payable to Ares Management LLC under these subleases totaled $569 and $185, respectively. For the year ended December 31, 2012, there were no amounts payable to Ares Management LLC as there were no such subleases in place during that period.
The Company also was party to an office sublease with Ares Commercial Real Estate Management LLC ("ACREM"), a wholly owned subsidiary of Ares Management LLC and manager of Ares Commercial Real Estate Corporation. The Company's office sublease with ACREM was terminated on June 30, 2013. For the years ended December 31, 2013 and 2012, amounts payable under this sublease by the Company to ACREM totaled $26 and $55, respectively.
See Note 3 for descriptions of other related party transactions.
14. FINANCIAL HIGHLIGHTS
The following is a schedule of financial highlights as of and for the years ended December 31, 2014, 2013 and 2012:
| |
As of and For the Years Ended December 31, | |||||||||
|---|---|---|---|---|---|---|---|---|---|---|
Per Share Data:
|
2014 | 2013 | 2012 | |||||||
Net asset value, beginning of period(1) |
$ | 16.46 | $ | 16.04 | $ | 15.34 | ||||
Issuances of common stock |
— | 0.16 | 0.05 | |||||||
Issuances of the Convertible Unsecured Notes |
— | — | 0.04 | |||||||
Net investment income for period(2) |
1.43 | 1.61 | 1.52 | |||||||
Net realized and unrealized gains for period(2) |
0.51 | 0.22 | 0.69 | |||||||
| | | | | | | | | | | |
Net increase in stockholders' equity |
1.94 | 1.99 | 2.30 | |||||||
Total distributions to stockholders |
(1.57 | ) | (1.57 | ) | (1.60 | ) | ||||
| | | | | | | | | | | |
Net asset value at end of period(1) |
$ | 16.82 | $ | 16.46 | $ | 16.04 | ||||
| | | | | | | | | | | |
Per share market value at end of period |
$ | 15.61 | $ | 17.77 | $ | 17.50 | ||||
Total return based on market value(3) |
(3.32 | )% | 10.51 | % | 23.62 | % | ||||
Total return based on net asset value(4) |
11.79 | % | 11.41 | % | 14.34 | % | ||||
Shares outstanding at end of period |
314,108 | 297,971 | 248,653 | |||||||
Ratio/Supplemental Data: |
||||||||||
Net assets at end of period |
$ | 5,283,715 | $ | 4,904,444 | $ | 3,988,346 | ||||
Ratio of operating expenses to average net assets(5)(6) |
10.46 | % | 10.03 | % | 10.70 | % | ||||
Ratio of net investment income to average net assets(5)(7) |
8.71 | % | 9.86 | % | 9.62 | % | ||||
Portfolio turnover rate(5) |
39 | % | 27 | % | 45 | % | ||||
- (1)
- The
net assets used equals the total stockholders' equity on the consolidated balance sheet.
- (2)
- Weighted
average basic per share data.
- (3)
- For the year ended December 31, 2014, the total return based on market value equaled the decrease of the ending market value at December 31, 2014 of $15.61 per share from the ending market value at December 31, 2013 of $17.77 per share plus the declared and payable dividends of
F-88
$1.57 per share for the year ended December 31, 2014, divided by the market value at December 31, 2013. For the year ended December 31, 2013, the total return based on market value equaled the increase of the ending market value at December 31, 2013 of $17.77 per share from the ending market value at December 31, 2012 of $17.50 per share plus the declared and payable dividends of $1.57 per share for the year ended December 31, 2013, divided by the market value at December 31, 2012. For the year ended December 31, 2012, the total return based on market value equaled the increase of the ending market value at December 31, 2012 of $17.50 per share from the ending market value at December 31, 2011 of $15.45 per share plus the declared and payable dividends of $1.60 per share for the year ended December 31, 2012, divided by the market value at December 31, 2011. The Company's shares fluctuate in value. The Company's performance changes over time and currently may be different than that shown. Past performance is no guarantee of future results.
- (4)
- For
the year ended December 31, 2014, the total return based on net asset value equaled the change in net asset value during the period plus the
declared and payable dividends of $1.57 per share for the year ended December 31, 2014, divided by the beginning net asset value for the period. For the year ended December 31, 2013, the
total return based on net asset value equaled the change in net asset value during the period plus the declared and payable dividends of $1.57 per share for the year ended December 31, 2013,
divided by the beginning net asset value for the period. For the year ended December 31, 2012, the total return based on net asset value equaled the change in net asset value during the period
plus the declared and payable dividends of $1.60 per share for the year ended December 31, 2012 divided by the beginning net asset value for the period. These calculations are adjusted for
shares issued in connection with the dividend reinvestment plan, the issuance of common stock in connection with any equity offerings and the equity components of any convertible notes issued during
the period. The Company's performance changes over time and currently may be different than that shown. Past performance is no guarantee of future results.
- (5)
- The
ratios reflect an annualized amount.
- (6)
- For
the year ended December 31, 2014, the ratio of operating expenses to average net assets consisted of 2.51% of base management fees, 2.90% of
income based fees and capital gains incentive fees, 4.24% of the cost of borrowing and 0.81% of other operating expenses. For the year ended December 31, 2013, the ratio of operating expenses
to average net assets consisted of 2.40% of base management fees, 2.80% of income based fees and capital gains incentive fees, 3.94% of the cost of borrowing and 0.89% of other operating expenses. For
the year ended December 31, 2012, the ratio of operating expenses to average net assets consisted of 2.38% of base management fees, 3.50% of income based fees and capital gains incentive fees,
3.94% of the cost of borrowing and other operating expenses of 0.88%. These ratios reflect annualized amounts.
- (7)
- The ratio of net investment income to average net assets excludes income taxes related to realized gains and losses.
F-89
15. SELECTED QUARTERLY DATA (Unaudited)
| |
2014 | ||||||||||||
|---|---|---|---|---|---|---|---|---|---|---|---|---|---|
| |
Q4 | Q3 | Q2 | Q1 | |||||||||
Total investment income |
$ | 270,917 | $ | 253,396 | $ | 224,927 | $ | 239,719 | |||||
Net investment income before net realized and unrealized gains and income based fees and capital gains incentive fees |
$ | 166,532 | $ | 149,722 | $ | 127,699 | $ | 141,589 | |||||
Income based fees and capital gains incentive fees |
$ | 38,347 | $ | 44,432 | $ | 35,708 | $ | 29,253 | |||||
Net investment income before net realized and unrealized gains |
$ | 128,185 | $ | 105,290 | $ | 91,991 | $ | 112,336 | |||||
Net realized and unrealized gains |
$ | 25,202 | $ | 72,449 | $ | 50,840 | $ | 4,656 | |||||
Net increase in stockholders' equity resulting from operations |
$ | 153,387 | $ | 177,739 | $ | 142,831 | $ | 116,992 | |||||
Basic and diluted earnings per common share |
$ | 0.49 | $ | 0.57 | $ | 0.48 | $ | 0.39 | |||||
Net asset value per share as of the end of the quarter |
$ | 16.82 | $ | 16.71 | $ | 16.52 | $ | 16.42 | |||||
| |
2013 | ||||||||||||
|---|---|---|---|---|---|---|---|---|---|---|---|---|---|
| |
Q4 | Q3 | Q2 | Q1 | |||||||||
Total investment income |
$ | 233,742 | $ | 246,801 | $ | 206,123 | $ | 195,055 | |||||
Net investment income before net realized and unrealized gains (losses) and income based fees and capital gains incentive fees |
$ | 145,003 | $ | 161,421 | $ | 126,951 | $ | 119,182 | |||||
Income based fees and capital gains incentive fees |
$ | 33,493 | $ | 35,199 | $ | 33,374 | $ | 20,085 | |||||
Net investment income before net realized and unrealized gains (losses) |
$ | 111,510 | $ | 126,222 | $ | 93,577 | $ | 99,097 | |||||
Net realized and unrealized gains (losses) |
$ | 22,374 | $ | 14,575 | $ | 39,921 | $ | (18,755 | ) | ||||
Net increase in stockholders' equity resulting from operations |
$ | 133,884 | $ | 140,797 | $ | 133,498 | $ | 80,342 | |||||
Basic and diluted earnings per common share |
$ | 0.47 | $ | 0.52 | $ | 0.50 | $ | 0.32 | |||||
Net asset value per share as of the end of the quarter |
$ | 16.46 | $ | 16.35 | $ | 16.21 | $ | 15.98 | |||||
| |
2012 | ||||||||||||
|---|---|---|---|---|---|---|---|---|---|---|---|---|---|
| |
Q4 | Q3 | Q2 | Q1 | |||||||||
Total investment income |
$ | 212,160 | $ | 190,572 | $ | 177,555 | $ | 167,738 | |||||
Net investment income before net realized and unrealized gains and income based fees and capital gains incentive fees |
$ | 138,249 | $ | 123,599 | $ | 110,634 | $ | 103,424 | |||||
Income based fees and capital gains incentive fees |
$ | 43,787 | $ | 34,139 | $ | 22,733 | $ | 26,386 | |||||
Net investment income before net realized and unrealized gains |
$ | 94,462 | $ | 89,460 | $ | 87,901 | $ | 77,038 | |||||
Net realized and unrealized gains |
$ | 80,682 | $ | 47,095 | $ | 3,031 | $ | 28,509 | |||||
Net increase in stockholders' equity resulting from operations |
$ | 175,144 | $ | 136,555 | $ | 90,932 | $ | 105,547 | |||||
Basic and diluted earnings per common share |
$ | 0.71 | $ | 0.59 | $ | 0.41 | $ | 0.49 | |||||
Net asset value per share as of the end of the quarter |
$ | 16.04 | $ | 15.74 | $ | 15.51 | $ | 15.47 | |||||
16. LITIGATION
The Company is party to certain lawsuits in the normal course of business. In addition, Allied Capital was involved in various legal proceedings that the Company assumed in connection with the
F-90
Allied Acquisition. Furthermore, third parties may try to seek to impose liability on the Company in connection with the activities of its portfolio companies. While the outcome of any such legal proceedings cannot at this time be predicted with certainty, the Company does not expect that these legal proceedings will materially affect its business, financial condition or results of operations.
On May 20, 2013, the Company was named as one of several defendants in an action (the "Action") filed in the United States District Court for the Eastern District of Pennsylvania (the "Pennsylvania Court") by the bankruptcy trustee of DSI Renal Holdings LLC and two related companies. On March 17, 2014, the Action was transferred to the United States District Court for the District of Delaware (the "Delaware Court") pursuant to a motion filed by the defendants and granted by the Pennsylvania Court. On May 6, 2014, the Delaware Court referred the Action to the United States Bankruptcy Court for the District of Delaware. The complaint in the Action alleges, among other things, that each of the named defendants participated in a purported "fraudulent transfer" involving the restructuring of a subsidiary of DSI Renal Holdings LLC. Among other things, the complaint seeks, jointly and severally from all defendants, (1) damages of approximately $425 million, of which the complaint states the Company's individual share is approximately $117 million, and (2) punitive damages. The Company is currently unable to assess with any certainty whether it may have any exposure in the Action. The Company believes the plaintiff's claims are without merit and intends to vigorously defend itself in the Action.
17. SUBSEQUENT EVENTS
The Company's management has evaluated subsequent events through the date of issuance of the consolidated financial statements included herein. There have been no subsequent events that occurred during such period that would require disclosure in this Form 10-K or would be required to be recognized in the consolidated financial statements as of and for the year ended December 31, 2014, except as disclosed below.
In January 2015, the Company issued an additional $200,000 aggregate principal amount of the 2020 Notes (the "Additional 2020 Notes") at a premium of 100.2% of its principal amount. Total proceeds from the issuance of the Additional 2020 Notes, net of underwriting discounts and offering costs, were approximately $198,359. The proceeds were used to repay outstanding indebtedness under the Company's debt facilities and for general corporate purposes, including investing in portfolio companies in accordance with the Company's investment objective.
In February 2015, the Company notified the holders of its February 2022 Notes that it planned to redeem the entire $143,800 aggregate principal amount outstanding, in accordance with the terms of the indenture governing the February 2022 Notes. The Company expects to complete the redemption on or about March 16, 2015.
F-91
Pursuant to the requirements of Section 13 or 15(d) of the Securities Exchange Act of 1934, the registrant has duly caused this report to be signed on its behalf by the undersigned, thereunto duly authorized.
|
ARES CAPITAL CORPORATION | |||
|
By: |
/s/ R. KIPP DEVEER |
||
Pursuant to the requirements of the Securities Exchange Act of 1934, this report has been signed below by the following persons on behalf of the registrant and in the capacities and on the dates indicated.
| By: | /s/ R. KIPP DEVEER R. Kipp deVeer Chief Executive Officer (principal executive officer) Date: February 26, 2015 |
|||
By: |
/s/ PENNI F. ROLL Penni F. Roll Chief Financial Officer (principal financial officer) Date: February 26, 2015 |
|||
By: |
/s/ SCOTT C. LEM Scott C. Lem Chief Accounting Officer (principal accounting officer) Date: February 26, 2015 |
|||
By: |
/s/ STEVE BARTLETT Steve Bartlett Director Date: February 26, 2015 |
|||
By: |
/s/ ANN TORRE BATES Ann Torre Bates Director Date: February 26, 2015 |
|||
By: |
/s/ STEVEN B. MCKEEVER Steven B. McKeever Director Date: February 26, 2015 |
|||
By: |
/s/ FRANK E. O'BRYAN Frank E. O'Bryan Director Date: February 26, 2015 |
| By: | /s/ ANTONY P. RESSLER Antony P. Ressler Director Date: February 26, 2015 |
|||
By: |
/s/ ROBERT L. ROSEN Robert L. Rosen Director Date: February 26, 2015 |
|||
By: |
/s/ BENNETT ROSENTHAL Bennett Rosenthal Director Date: February 26, 2015 |
|||
By: |
/s/ ERIC B. SIEGEL Eric B. Siegel Director Date: February 26, 2015 |
|||
By: |
/s/ MICHAEL J AROUGHETI Michael J Arougheti Director Date: February 26, 2015 |