Attached files
| file | filename |
|---|---|
| 8-K - FORM 8-K - WCI Communities, Inc. | d874078d8k.htm |
| EX-99.1 - EARNINGS PRESS RELEASE - WCI Communities, Inc. | d874078dex991.htm |
 Exhibit 99.2
WCI Communities
Fourth Quarter and Full Year 2014 Earnings Conference Call
February 25, 2015 |
 Disclosure Statement
This presentation contains forward-looking statements. All statements that are
not statements of historical fact, including statements about the
Company’s beliefs and expectations, are forward-looking statements within the meaning of the federal
securities laws, and should be evaluated as such. Forward-looking statements
include information concerning the Company’s future goals, expected
growth, market conditions and outlook (including the estimates, forecasts, statements and projections
relating to Florida or national markets prepared by John Burns Real Estate
Consulting), expected liquidity and possible or assumed future results of
operations, including descriptions of its business plan and strategies. These forward-looking statements
may
be
identified
by
the
use
of
such
forward-looking
terminology,
including
the
terms
“believe,”
“estimate,”
“project,”
“anticipate,”
“expect,”
“seek,”
“predict,”
“contemplate,”
“continue,”
“possible,”
“intend,”
“may,”
“might,”
“will,”
“could,”
“would,”
“should,”
“forecast,”
or “assume”
or, in each case, their negative, or other variations or comparable
terminology. For more information concerning factors that could cause actual
results to differ materially from those contained in the forward-
looking
statements,
please
refer
to
“Risk
Factors”
in
Item
1A
of
Part
I
of
our
Annual
Report
on
Form
10-K
filed
by
the
Company
with
the
Securities
and
Exchange
Commission
on
February
27,
2014
and
subsequent
filings
by
the
Company.
The
Company
bases these forward-looking statements or projections on its current
expectations, plans and assumptions that it has made in light of
its
experience
in
the
industry,
as
well
as
its
perceptions
of
historical
trends,
current
conditions,
expected
future
developments
and other factors it believes are appropriate under the circumstances and at such
time. As you read and consider this presentation, you should understand that
these statements are not guarantees of performance or results. The forward-looking
statements and projections are subject to and involve risks, uncertainties and
assumptions and you should not place undue reliance
on
these
forward-looking
statements
or
projections.
Although
the
Company
believes
that
these
forward-looking
statements and projections are based on reasonable assumptions at the time they are
made, you should be aware that many factors could affect the Company’s
actual financial results or results of operations and could cause actual results to differ
materially from those expressed in the forward-looking statements and
projections. The Company undertakes no obligation to update or revise any
forward-looking statements, whether as a result of new information, future events or otherwise. If the
Company does update one or more forward-looking statements, there should be no
inference that it will make additional updates with respect to those or
other forward-looking statements. In addition to the financial measures
prepared in accordance with U.S. generally accepted accounting principles (“GAAP”), this
presentation contains the non-GAAP financial measures EBITDA, Adjusted EBITDA,
Adjusted gross margin from homes delivered and net debt to net
capitalization. The reasons for the use of these measures, a reconciliation
of these measures to the most directly
comparable
GAAP
measures
and
other
information
relating
to
these
measures
are
included
below
in
the
appendix
to
this
presentation.
2 |
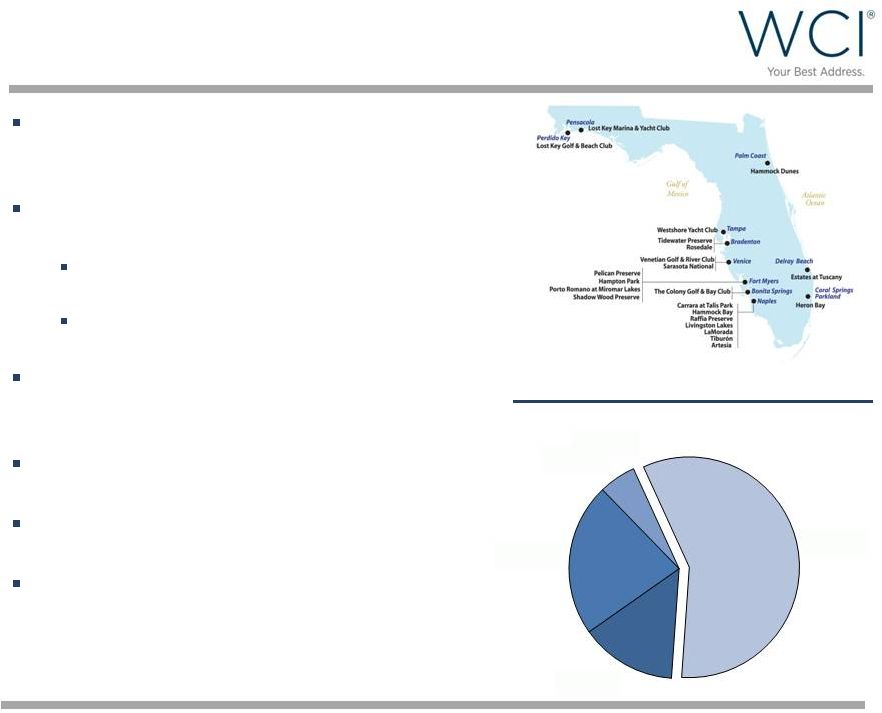 WCI
Communities at a Glance Lifestyle community developer and
luxury homebuilder throughout
Florida
Target move-up, second-home and
active adult customers
High average selling prices -
$452,000 on 2014 deliveries
High proportion of cash buyers –
58% on 2014 deliveries
Approximately 12,600 home sites
owned and controlled as of
December 31, 2014
Conservative balance sheet with
approximately $175 million of cash
Strong year over year growth across
key Homebuilding metrics
Complementary and value-add Real
Estate Services & Amenities
businesses
3
Buyer Profile with Low Reliance on Financing
Loan to Value Percentage –
2014 Deliveries
LTV 1-64%
14%
LTV 65-80%
23%
LTV >80%
5%
Cash
58% |
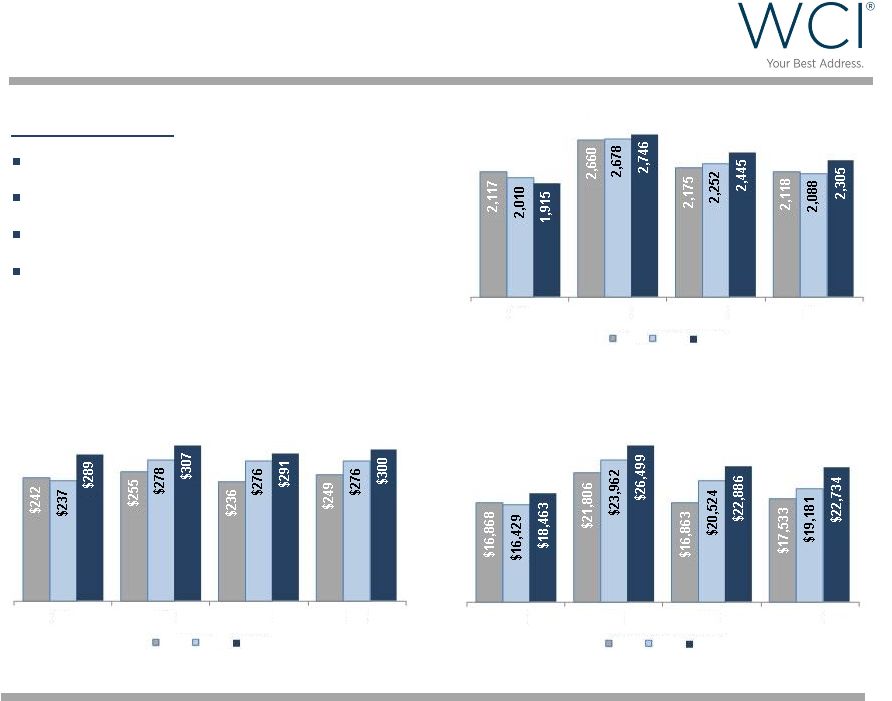
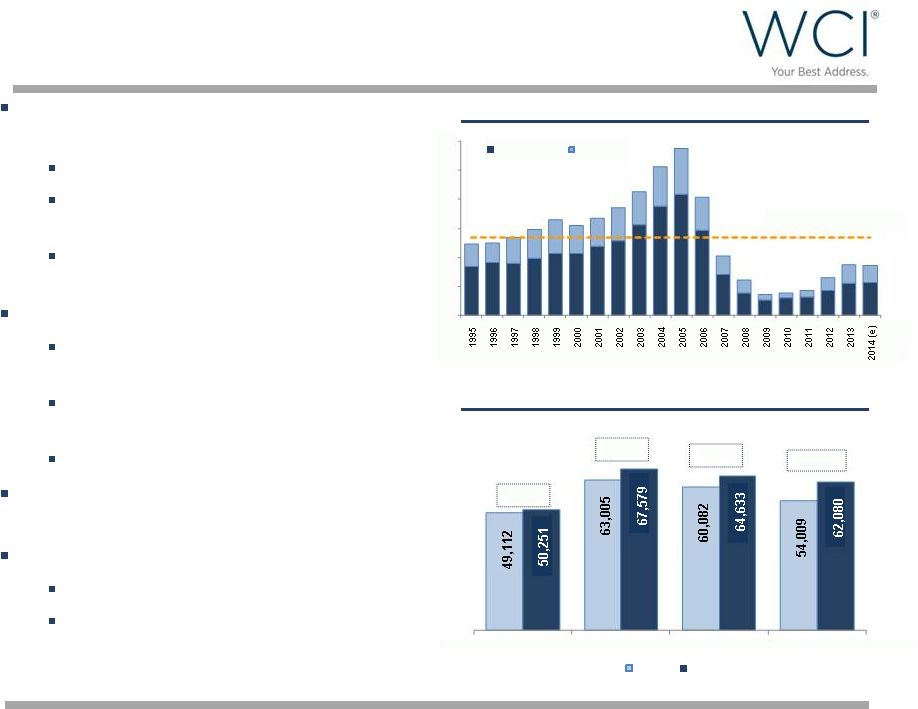 Compelling Florida Real Estate Market
2014
Florida
building
permits
–
second
highest in the U.S.
(1)
Permits still ~70% off peak
Permits less than two thirds of the
twenty year average
Single-family permit growth of 3.3%;
more than double the national rate
Florida is a leading growth state
Moved ahead of N.Y. to become 3
rd
most populous state in 2014
(1)
Job growth rate of 3.0%; higher than
national average of 2.1%
(2)
Business friendly tax climate
Southern Florida continues to be
ranked #1 market in the U.S.
(3)
Strong, stable resale market
(4)
Single-family closings up 8.1% in 2014
37
th
consecutive month median sales
prices increased year over year
4
(1)
U.S. Census Bureau
(2)
Florida Department of Economic Opportunity; January 23, 2015
(3)
John Burns Real Estate Consulting, January 2015
(4)
Florida Realtors ®
Florida Annual Permit Activity
(1)
Florida Single-Family Resales –
Quarterly Closed Sales
(4)
0
50,000
100,000
150,000
200,000
250,000
300,000
Single-Family
Multi-Family
20 Year Average
Q1
Q2
Q3
Q4
2013
2014
+2.3%
+14.9%
+7.6%
+7.3% |
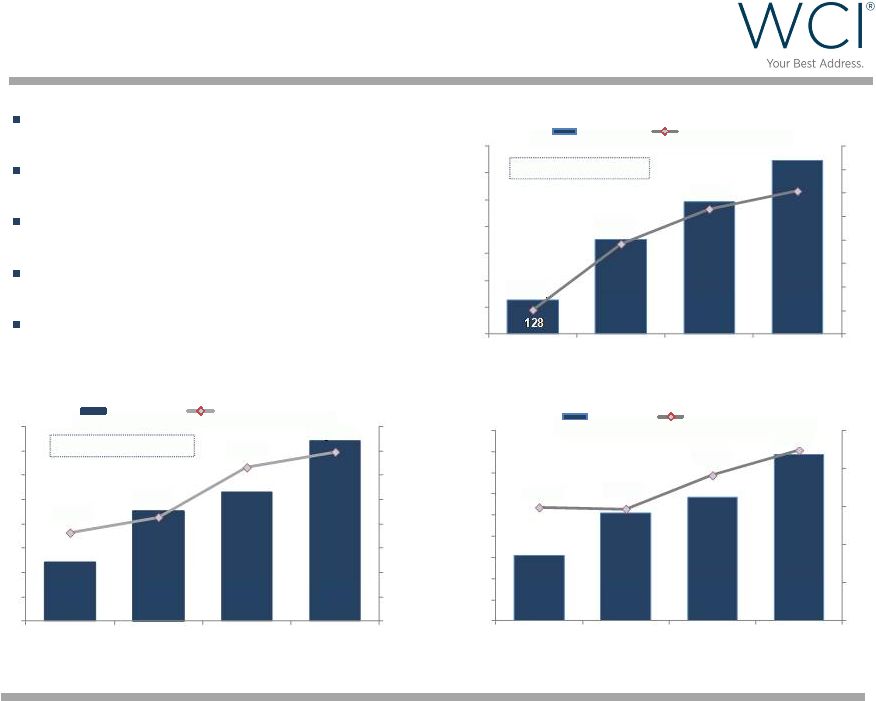
 Fourth
Quarter 2014 Highlights Revenues from
homes delivered up
74.0% to $120.0
million
Deliveries up 57.6% to
238 homes
Average selling price
per delivered home of
$504,000, up 10.3%
New orders up 47.4%
to 171 homes
Increased active
selling neighborhood
count by 48.0%
5
19
50
81
202
79
122
141
151
117
143
146
238
Q1
Q2
Q3
Q4
Deliveries
2012
2013
2014
114
128
105
106
140
147
128
116
205
195
172
171
Q1
Q2
Q3
Q4
New Orders
2012
2013
2014 |
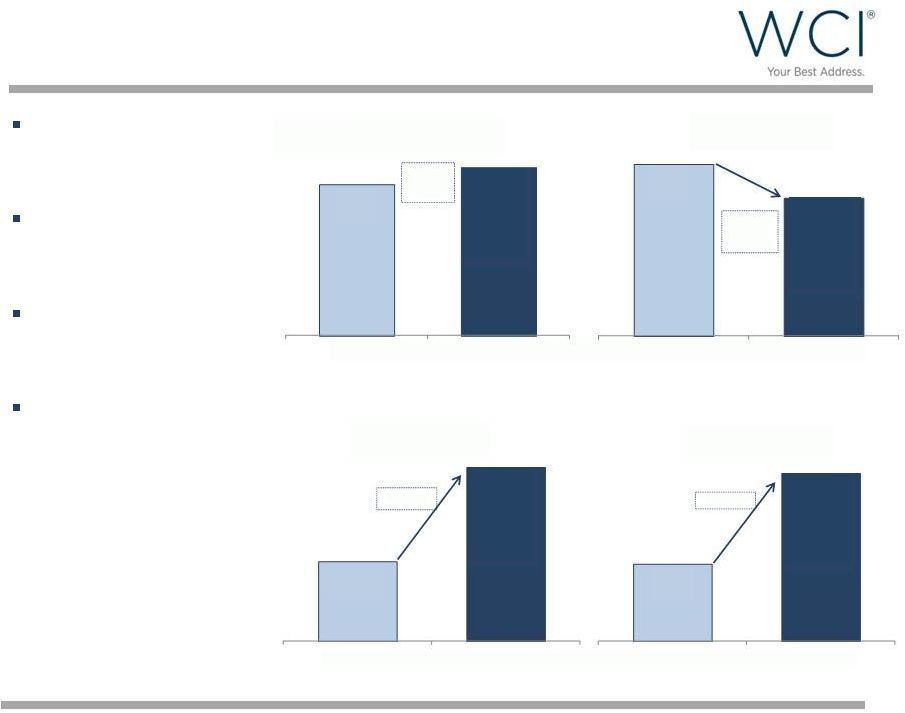 Fourth
Quarter 2014 Highlights ($ in thousands) Adjusted
gross margin from homes
delivered of 31.9%
Improved SG&A
leverage by 300
basis points
Adjusted EBITDA
of $25.6 million, up
117.5%
Income from
continuing
operations before
income taxes of
$20.9 million, up
117.9%
6
(1)
Measured as a percentage of revenues from homes delivered
(2)
Measured as a percentage of Homebuilding revenues
(3)
Represents income from continuing operations before income taxes
30.7%
4Q13
4Q14
Adjusted Gross Margin
+120
Basis
Points
15.3%
4Q13
4Q14
SG&A %
(2)
-300
Basis
Points
$9,574
4Q13
4Q14
Pre-tax Income
(3)
+
117.9%
$11,770
4Q13
4Q14
Adjusted EBITDA
+
117.5%
(1)
31.9%
12.3%
$20,864
$25,600 |
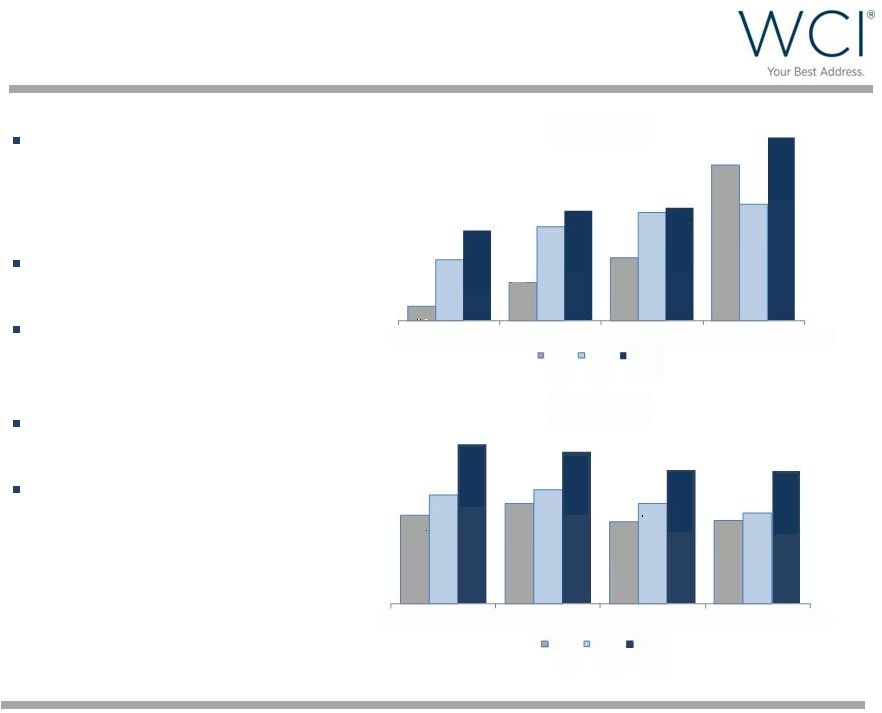
 Real
Estate Services Quarterly Trend ($ in thousands)
7
4Q14 vs. 4Q13
Brokerage transactions up 10%
Brokerage ASP up 9%
Brokerage revenues up 19%
Gross margin of $681K, up
$710K
Q1
Q2
Q3
Q4
2012
2013
2014
Brokerage Transactions
Q1
Q2
Q3
Q4
Brokerage ASP
2012
2013
2014
Q1
Q2
Q3
Q4
Real Estate Services Revenues
2012
2013
2014 |
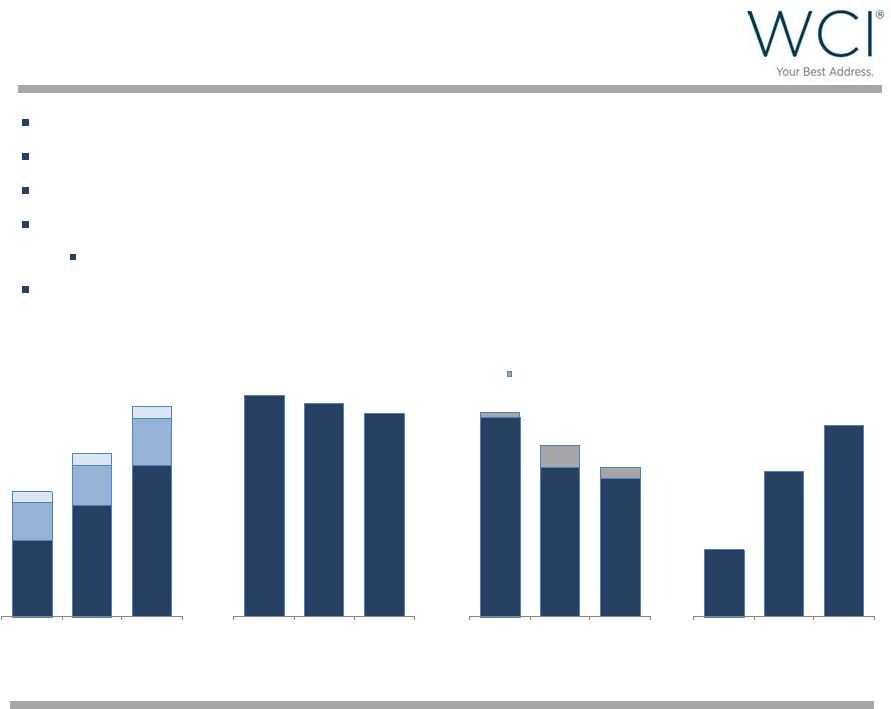
 2014
Homebuilding Highlights Deliveries up 30.6% to 644
homes
New Orders up 39.9% to 743
homes
Contract value of new orders up
44.7% to $351.9 million
Average selling price per new
order up 3.5% to $474,000
Backlog contract value up 42.8%
to $205.3 million
8
352
493
644
$326
$396
$433
$452
$300
$325
$350
$375
$400
$425
$450
$475
$500
-
100
200
300
400
500
600
700
2011
2012
2013
2014
Deliveries
Deliveries
Deliveries ASP ($K)
71%
Deliveries CAGR
154
255
293
392
$449
$447
$491
$300
$350
$400
$450
$500
$550
-
50
100
150
200
250
300
350
400
450
2011
2012
2013
2014
Backlog
Backlog
Backlog ASP ($K)
$524
245
453
531
743
$391
$407
$458
$474
$300
$325
$350
$375
$400
$425
$450
$475
$500
-
100
200
300
400
500
600
700
800
2011
2012
2013
2014
New Orders
New Orders
New Order ASP ($K)
45%
Unit Order CAGR |
 Executing on the WCI Growth Strategy
Increasing revenues driven by Homebuilding and Real Estate Services
Continued gross margin strength
Improved SG&A leverage by 250 basis points
Income from continuing operations before taxes of $36.0 million,
up 73.1%
Earnings per diluted share of $0.82
Growing Adjusted EBITDA
9
HB
$146.9
HB
$214.0
HB
$292.8
RES
$73.1
RES
$80.1
RES
$90.6
AM
$21.0
AM
$23.2
AM
$23.6
$241.0
$317.3
$407.0
2012
2013
2014
Revenues
($ in millions)
33.2%
32.0%
30.5%
2012
2013
2014
Adjusted GM %
(1)
21.4%
16.0%
14.8%
0.5%
2.4%
1.2%
21.9%
18.5%
16.0%
2012
2013
2014
SG&A %
(2)
Non-Cash Incentive Comp
$17.4
$37.5
$49.3
2012
2013
2014
Adjusted EBITDA
(3)
($ in millions)
(1)
Represents adjusted gross margin from homes delivered
(2)
Measured
as
a
percentage
of
Homebuilding
revenues;
2013
does
not
foot
due
to
rounding
(3)
Measured as a percentage of total revenues |
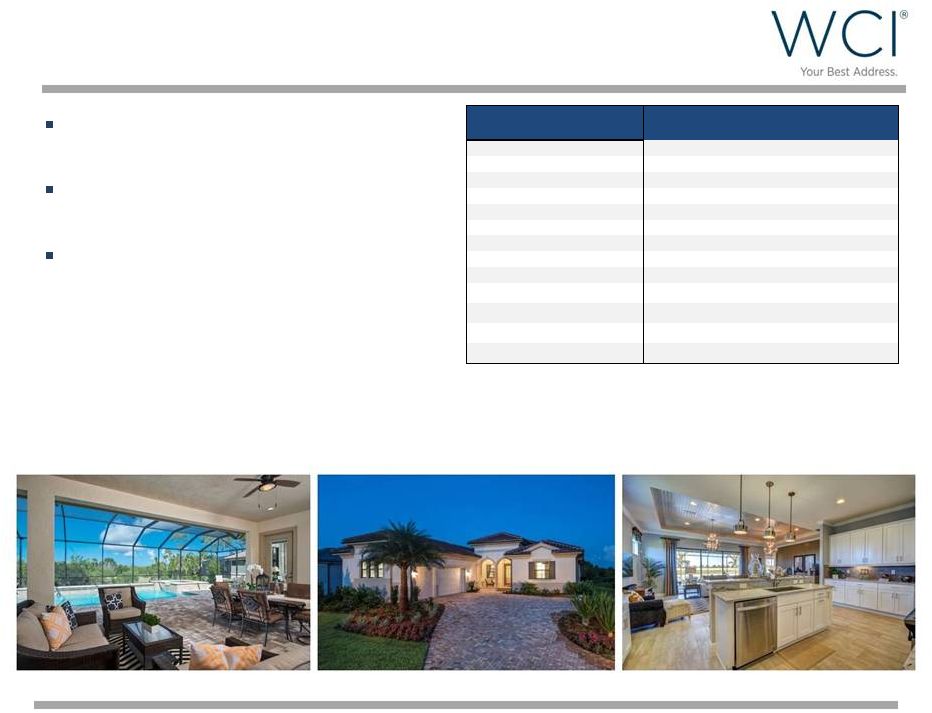
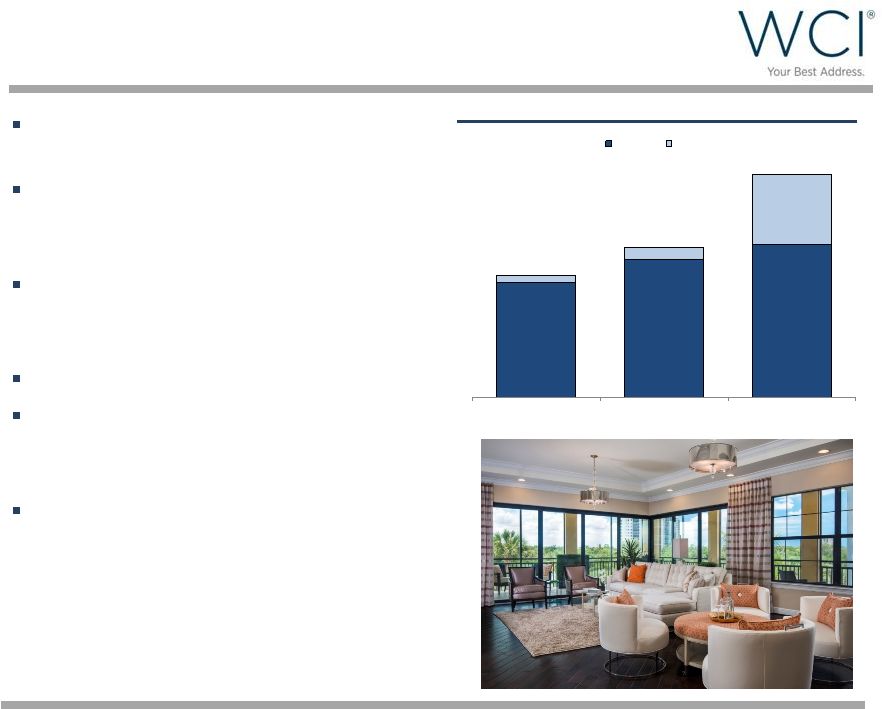 Land
Portfolio Positioned for Growth High quality land positions in land
constrained markets
Closed on approximately 2,100
home sites in 2014; Optioned
additional 4,000 home sites
Land portfolio totals approximately
12,600 owned and controlled home
sites; up 48% from year end 2013
68% owned / 32% optioned
Experienced team with extensive
land entitlement and development
experience
Actively pursuing additional land
acquisition opportunities
throughout Florida
10
Owned and Controlled Home Sites –
Year End Trending
6,502
7,831
8,613
360
676
4,006
6,862
8,507
12,619
2012
2013
2014
Owned
Optioned |
 Selected Operating Results
11
$ in thousands, except per share amounts
2014
2013
Variance %
2014
2013
Variance %
Homebuilding revenues
121,491
$
68,962
$
76.2%
292,785
$
214,016
$
36.8%
Real estate services revenues
22,734
19,181
18.5%
90,582
80,096
13.1%
Amenities revenues
6,379
6,617
-3.6%
23,636
23,237
1.7%
Total revenues
150,604
94,760
58.9%
407,003
317,349
28.3%
Total gross margin
35,002
19,461
79.9%
82,541
65,324
26.4%
Income tax expense (benefit)
8,315
(125,624)
NM
14,652
(125,709)
NM
Net income attributable to common shareholders
12,639
$
135,198
$
NM
21,597
$
126,968
$
NM
Earnings per share - diluted
0.48
$
5.16
$
NM
0.82
$
5.86
$
NM
Weighted average number of shares outstanding - diluted
26,351
26,206
0.6%
26,292
21,680
21.3%
SG&A expenses as a percent of Homebuilding revenues
12.3%
15.3%
-300 bps
16.0%
18.5%
-250 bps
Adjusted gross margin percentage
31.9%
30.7%
+120 bps
30.5%
32.0%
-150 bps
Adjusted EBITDA
25,600
$
11,770
$
117.5%
49,340
$
37,494
$
31.6%
Homes delivered
238
151
57.6%
644
493
30.6%
Average selling price per home delivered
504
$
457
$
10.3%
452
$
433
$
4.4%
New orders
171
116
47.4%
743
531
39.9%
Average selling price per new order
428
$
516
$
-17.1%
474
$
458
$
3.5%
Backlog units
392
293
33.8%
Average selling price per backlog unit
524
$
491
$
6.7%
Three Months Ended December 31,
Years Ended December 31, |
 Conservative Balance Sheet
Balance sheet positioned to
execute the growth strategy
Undrawn $75 million
revolving credit facility
Invested $156 million in 2014
on land and land
development
12
(1)
Available liquidity includes the $75 million of borrowing capacity under a
four-year revolving credit facility and $8 million of borrowing capacity
under a revolving credit facility with Stonegate Bank (2)
Debt to capital is computed by dividing the carrying value of our total debt, as
reported on our consolidated balance sheets by total capital
(3)
Net debt represents total debt excluding premium less cash and cash equivalents;
net capitalization represents net debt plus total equity
$ in thousands
Cash & cash equivalents
174,756
$
213,352
$
Real estate inventories
449,249
280,293
Total debt
251,179
200,000
Total equity
434,443
409,864
Total capital
685,622
609,864
Available liquidity
(1)
257,756
296,352
Debt to capital
(2)
36.6%
32.8%
Net debt to net capitalization
(3)
14.8%
NM
(Cash + inventory) / total debt
2.48
2.47
December 31,
2014 December 31, 2013 |
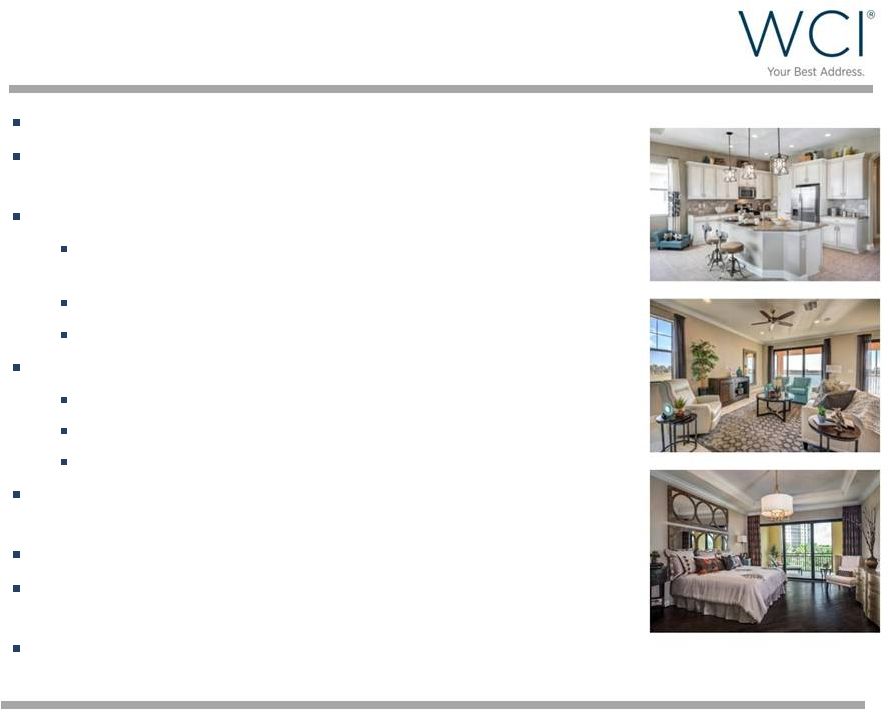 Key
Takeaways Florida real estate market remains strong
Fully integrated Florida luxury homebuilder and
community developer
Executing the strategy
Focus on move-up, second-home and active adult
customer segments
Differentiate via extensive amenity offerings
Operational discipline
Positioned for continued growth
Growing new orders and deliveries
Increasing active selling neighborhood count
Growing revenues and Adjusted EBITDA
Complementary Real Estate Services and Amenities
businesses
Actively pursuing land acquisition opportunities
Conservative balance sheet with liquidity and flexibility
for growth
Experienced and talented team
13 |
 Appendix |
 Reconciliation of Non-GAAP Financial Measures
In addition to the results reported in accordance with U.S. generally accepted
accounting principles (“GAAP”), we have provided information in
this
presentation
relating
to
adjusted
gross
margin
from
homes
delivered,
EBITDA,
Adjusted
EBITDA
(both
terms
defined
below)
and
net
debt
to
net capitalization.
Adjusted Gross Margin from Homes Delivered
We calculate adjusted gross margin from homes delivered by subtracting the gross
margin from land and home sites, if any, from Homebuilding gross
margin
to
arrive
at
gross
margin
from
homes
delivered.
Adjusted
gross
margin
from
homes
delivered
is
calculated
by
adding
asset
impairments, if any, and capitalized interest in cost of sales to gross margin from
homes delivered. Management uses adjusted gross margin from homes
delivered to evaluate operating performance in our Homebuilding segment and make strategic decisions regarding sales price,
construction and development pace, product mix and other operating decisions.
We believe that adjusted gross margin from homes delivered is relevant
and
useful
to
shareholders,
investors
and
other
interested
parties
for
evaluating
our
comparative
operating
performance
from
period
to
period and among companies within the homebuilding industry as it is reflective of
overall profitability during any given reporting period. This measure
is considered a non-GAAP financial measure and should be considered in addition to, rather than as a substitute for, the comparable
GAAP
financial
measures
when
evaluating
our
operating
performance.
Although
other
companies
in
the
homebuilding
industry
report
similar
information, the methods used by such companies may differ from our methodology
and, therefore, may not be comparable. We urge shareholders, investors
and other interested parties to understand the methods used by other companies in the homebuilding industry to
calculate gross margins and any adjustments to such amounts before comparing our
measures to those of such other companies. The table below reconciles
adjusted gross margin from homes delivered to the most directly comparable GAAP financial measure,
Homebuilding gross margin, for the periods presented herein.
15
Three Months Ended December 31,
2014
2013
2014
2013
Homebuilding gross margin
36,054
$
19,815
$
82,994
$
64,248
$
Less: gross margin from land and home
sites 437
(6)
437
195
Gross margin from homes delivered
35,617
19,821
82,557
64,053
Add: capitalized interest in cost of sales
2,653
1,377
6,306
4,257
Adjusted gross margin from homes delivered
38,270
$
21,198
$
88,863
$
68,310
$
Gross margin from homes delivered as a
percentage of revenues from homes delivered
29.7%
28.7%
28.3%
30.0%
Adjusted gross margin from homes delivered as a
percentage of revenues from homes delivered
31.9%
30.7%
30.5%
32.0%
Years Ended December 31,
($ in thousands) |
 Reconciliation of Non-GAAP Financial Measures
EBITDA and Adjusted EBITDA
Adjusted
EBITDA
measures
performance
by
adjusting
net
income
(loss)
attributable
to
common
shareholders
of
WCI
Communities,
Inc.
to
exclude, if any, interest expense, capitalized interest in cost of sales, income
taxes, depreciation (‘‘EBITDA’’), preferred stock dividends, income
(loss) from discontinued operations, other income, stock-based and other
non-cash long-term incentive compensation expense, asset
impairments
and
expenses
related
to
early
repayment
of
debt.
We
believe
that
the
presentation
of
Adjusted
EBITDA
provides
useful
information
to
shareholders,
investors
and
other
interested
parties
regarding
our
results
of
operations
because
it
assists
those
parties
and
us
when
analyzing and benchmarking the performance and value of our business. We also
believe that Adjusted EBITDA is useful as a measure of comparative operating
performance from period to period and among companies in the homebuilding industry as it is reflective of changes in
pricing decisions, cost controls and other factors that affect operating
performance, and it removes the effects of our capital structure (such as
preferred stock dividends and interest expense), asset base (primarily
depreciation), items outside of our control (primarily income taxes) and the
volatility related to the timing and extent of non-operating activities (such as discontinued operations and asset impairments). Accordingly,
we believe that this measure is useful for comparing general operating performance
from period to period. Other companies may define Adjusted EBITDA
differently and, as a result, our measure of Adjusted EBITDA may not be directly comparable to Adjusted EBITDA of other
companies. Although we use Adjusted EBITDA as a financial measure to assess
the performance of our business, the use of Adjusted EBITDA is limited
because it does not include certain material costs, such as interest and income taxes, necessary to operate our business. Adjusted
EBITDA and EBITDA should be considered in addition to, and not as substitutes for,
net income (loss) in accordance with GAAP as a measure of
performance.
Our
presentation
of
EBITDA
and
Adjusted
EBITDA
should
not
be
construed
as
an
indication
that
our
future
results
will
be
unaffected by unusual or nonrecurring items. Our EBITDA-based measures
have limitations as analytical tools and, therefore, shareholders, investors
and other interested parties should not consider them in isolation or as substitutes for analyses of our results as reported under GAAP.
Some such limitations are:
Because
of
these
limitations,
our
EBITDA-based
measures
are
not
intended
to
be
alternatives
to
net
income
(loss),
indicators
of
our
operating
performance,
alternatives
to
any
other
measure
of
performance
in
conformity
with
GAAP
or
alternatives
to
cash
flow
provided
by
(used
in)
operating activities as measures of liquidity. Shareholders, investors and
other interested parties should therefore not place undue reliance on our
EBITDA-based measures or ratios calculated using those measures. Our GAAP-based measures can be found in our audited consolidated
financial statements in Item 8 of the Annual Report on Form 10-K that we plan
to file with the Securities and Exchange Commission on or before February
27, 2015. 16
they do not reflect the impact of earnings or charges resulting from matters that
we consider not to be indicative of our ongoing operations; they are not
adjusted for all non-cash income or expense items that are reflected in our consolidated statements of cash flows;
they do not reflect the interest expense necessary to service our debt; and
other companies in our industry may calculate these measures differently than we
do, thereby limiting their usefulness as comparative measures.
|
 17
Reconciliation of Non-GAAP Financial Measures
EBITDA and Adjusted EBITDA (continued)
(1)
Represents capitalized interest expensed in cost of sales on home deliveries and
land and home site sales. (2)
Represents the Company’s income taxes from continuing operations as reported
in its consolidated statements of operations. (3)
Represents a reduction in net income attributable to WCI Communities, Inc.
pertaining to its preferred stock wherein we (i) exchanged 903,825 shares
of our common stock (valued at $19.0 million) for 10,000 outstanding shares of our Series A preferred stock during July 2013 and (ii) paid
$0.7 million in cash to purchase the one outstanding share of our Series B
preferred stock during April 2013. All such shares of preferred stock,
which were carried at a nominal value on our consolidated balance sheets, have
been cancelled and retired. In accordance with Accounting Standards
Codification 260, Earnings Per Share, paragraph 10-S99-2, any difference between the consideration transferred to our preferred stock
shareholders and the corresponding book value has been (i) characterized as a
preferred stock dividend in the Company’s consolidated statements of
operations during the year that the related transaction was completed and (ii) deducted from net income attributable to WCI Communities, Inc. to
arrive at net income attributable to common shareholders of WCI Communities,
Inc. (4)
Represents the Company’s other income, net as reported in its consolidated
statements of operations. (5)
Represents expenses recorded in the Company’s consolidated statements of
operations related to its stock-based and other non-cash long-term
incentive compensation plans.
(6)
Represents an impairment charge recorded in the Company’s consolidated
statements of operations during the year ended December 31, 2014 in
connection with the write-down to fair value of one of its Amenities
assets. 2014
2013
2014
2013
Net income attributable to common
shareholders of WCI Communities, Inc.
12,639
$
135,198
$
21,597
$
126,968
$
Interest expense
264
739
1,140
2,537
Capitalized interest in cost of sales (1)
2,653
1,377
6,306
4,257
Income tax expense (benefit) (2)
8,315
(125,624)
14,652
(125,709)
Depreciation
717
568
2,627
2,081
EBITDA
24,588
12,258
46,322
10,134
Preferred stock dividends (3)
-
-
-
19,680
Other income, net (4)
(1,069)
(1,393)
(1,604)
(2,642)
Stock-based and other non-cash long-term
incentive compensation expense (5)
881
905
3,422
5,217
Asset impairment (6)
1,200
-
1,200
-
Expenses related to early repayment of debt (7)
-
-
-
5,105
Adjusted EBITDA
25,600
$
11,770
$
49,340
$
37,494
$
Adjusted EBITDA margin
17.0%
12.4%
12.1%
11.8%
Years Ended December 31,
Three Months Ended December 31,
($ in thousands)
The table below reconciles EBITDA and Adjusted EBITDA to the most directly
comparable GAAP financial measure, net income (loss) attributable to common
shareholders of WCI Communities, Inc., for the periods presented herein. (7)
Represents expenses related to early repayment of debt as reported in the Company’s consolidated
statements of operations, consisting of $5.1 million of write-offs of unamortized debt
discount and debt issuance costs and a prepayment premium related to our voluntary prepayment
of the entire outstanding principal amount of the Company’s Senior Secured Term Notes due 2017 in August 2013. |
 Reconciliation of Non-GAAP Financial Measures
18
(1) Debt to capital is computed by dividing the carrying value of our Senior
Notes due 2021, as reported on our consolidated balance sheets, by total
capital
as
calculated
above.
The
Senior
Notes
due
2021
were
our
only
outstanding
debt
as
of
December
31,
2014
and
2013.
(2) Net debt to net capitalization is computed by dividing net debt by net
capitalization. (3) Net debt to net capitalization as of December 31,
2013 is not meaningful (“NM”) because our net debt was less than zero on such date.
Net Debt to Net Capitalization
2014
2013
Senior Notes due 2021
251,179
$
200,000
$
Total equity
434,443
409,864
Total capital
685,622
$
609,864
$
Debt
to capital (1) 36.6%
32.8%
Senior Notes due 2021
251,179
$
200,000
$
Less: unamortized premium
1,179
-
Principal amount of Senior Notes due 2021
250,000
200,000
Less: cash and cash equivalents
174,756
213,352
Net debt
75,244
(13,352)
Total equity
434,443
409,864
Net capitalization
509,687
$
396,512
$
Net
debt to net capitalization (2) 14.8%
NM (3)
December 31,
($ in thousands)
The
table
below
presents
the
computations
of
our
net
debt
to
net
capitalization
and
reconciles
such
amounts
to
the
most
directly
comparable
GAAP financial measure, debt to capital.
We believe that by deducting cash and cash equivalents from our outstanding debt,
we provide a measure of our debt that considers our cash position.
Furthermore, we believe that this approach provides useful information because the ratio of debt to capital does not consider our
cash and cash equivalents and we believe that a debt ratio net of cash, such as net
debt to net capitalization, provides supplemental information by which our
financial position may be considered. Shareholders, investors and other interested parties may also find this
information to be helpful when comparing our leverage to the leverage of our
competitors that present similar information. We believe that net debt to
net capitalization provides useful information to shareholders, investors and other interested parties regarding our financial
position and cash and debt management. It is also a relevant financial
measure for understanding the leverage employed in our operations and as an
indicator of our ability to obtain future financing.
|