Attached files
| file | filename |
|---|---|
| EX-32 - EXHIBIT 32 - KEY ENERGY SERVICES INC | keg10-k12312014ex32.htm |
| EX-23 - EXHIBIT 23 - KEY ENERGY SERVICES INC | keg10-k12312014ex23.htm |
| EX-21 - EXHIBIT 21 - KEY ENERGY SERVICES INC | keg10-k12312014ex21.htm |
| EX-31.1 - EXHIBIT 31.1 - KEY ENERGY SERVICES INC | keg10-k12312014ex311.htm |
| EX-31.2 - EXHIBIT 31.2 - KEY ENERGY SERVICES INC | keg10-k12312014ex312.htm |
| EX-10.13 - EXHIBIT 10.13 - KEY ENERGY SERVICES INC | keg10-k12312014ex1013.htm |
| EX-10.16.3 - EXHIBIT 10.16.3 - KEY ENERGY SERVICES INC | keg10-k13312014ex10163.htm |
| EX-10.16.2 - EXHIBIT 10.16.2 - KEY ENERGY SERVICES INC | keg10-k12312014ex10162.htm |
| EX-10.16.4 - EXHIBIT 10.16.4 - KEY ENERGY SERVICES INC | keg10-k12312014ex10164.htm |
| EXCEL - IDEA: XBRL DOCUMENT - KEY ENERGY SERVICES INC | Financial_Report.xls |
UNITED STATES SECURITIES AND EXCHANGE COMMISSION
Washington, D.C. 20549
______________________________________
Form 10-K
(Mark One)
þ | ANNUAL REPORT PURSUANT TO SECTION 13 OR 15(d) OF THE SECURITIES EXCHANGE ACT OF 1934 | |
For the fiscal year ended December 31, 2014
¨ | TRANSITION REPORT PURSUANT TO SECTION 13 OR 15(d) OF THE SECURITIES EXCHANGE ACT OF 1934 | |
Commission file number 001-08038
KEY ENERGY SERVICES, INC.
(Exact name of registrant as specified in its charter)
Maryland | 04-2648081 | |
(State or other jurisdiction of incorporation or organization) | (I.R.S. Employer Identification No.) | |
1301 McKinney Street
Suite 1800
Houston, Texas 77010
(Address of principal executive offices, including Zip Code)
(713) 651-4300
(Registrant’s telephone number, including area code)
Securities registered pursuant to Section 12(b) of the Act:
Title of Each Class | Name of Exchange on Which Registered | |
Common Stock, $0.10 par value | New York Stock Exchange | |
Securities registered pursuant to Section 12(g) of the Act:
Title of Class
None
Indicate by check mark if the registrant is a well-known seasoned issuer (as defined in Rule 405 of the Securities Act). Yes þ No ¨
Indicate by check mark if the registrant is not required to file reports pursuant to Section 13 or Section 15(d) of the Exchange Act. Yes ¨ No þ
Indicate by check mark whether the registrant (1) has filed all reports required to be filed by Section 13 or 15(d) of the Securities Exchange Act of 1934 during the preceding 12 months (or for such shorter period that the registrant was required to file such reports), and (2) has been subject to such filing requirements for the past 90 days. Yes þ No ¨
Indicate by check mark whether the registrant has submitted electronically and posted on its corporate Web site, if any, every Interactive Data File required to be submitted and posted pursuant to Rule 405 of Regulation S-T (§ 232.405 of this chapter) during the preceding 12 months (or for such shorter period that the registrant was required to submit and post such files.) Yes þ No ¨
Indicate by check mark if disclosure of delinquent filers pursuant to Item 405 of Regulation S-K (§ 229.405 of this chapter) is not contained herein, and will not be contained, to the best of registrant’s knowledge, in definitive proxy or information statements incorporated by reference in Part III of this Form 10-K or any amendment to this Form 10-K. ¨
Indicate by check mark whether the registrant is a large accelerated filer, an accelerated filer, a non-accelerated filer, or a smaller reporting company. See the definitions of “large accelerated filer,” “accelerated filer” and “smaller reporting company” in Rule 12b-2 of the Exchange Act. (Check one):
Large accelerated filer þ | Accelerated filer ¨ | Non-accelerated filer ¨ | Smaller reporting company ¨ | |||
(Do not check if a smaller reporting company) | ||||||
Indicate by check mark whether the registrant is a shell company (as defined in Rule 12b-2 of the Exchange Act). Yes ¨ No þ
The aggregate market value of the common stock of the registrant held by non-affiliates as of June 30, 2014, based on the $9.14 per share closing price for the registrant’s common stock as quoted on the New York Stock Exchange on such date, was $1.2 billion (for purposes of calculating these amounts, only directors, officers and beneficial owners of 10% or more of the outstanding common stock of the registrant have been deemed affiliates).
As of February 17, 2015, the number of outstanding shares of common stock of the registrant was 154,398,693.
DOCUMENTS INCORPORATED BY REFERENCE
Portions of the registrant’s definitive proxy statement to be filed pursuant to Regulation 14A under the Securities Exchange Act of 1934 with respect to the 2014 Annual Meeting of Stockholders are incorporated by reference into Part III of this Form 10-K.
KEY ENERGY SERVICES, INC.
ANNUAL REPORT ON FORM 10-K
For the Year Ended December 31, 2014
INDEX
Page Number | ||
PART I | ||
ITEM 1. | ||
ITEM 1A. | ||
ITEM 1B. | ||
ITEM 2. | ||
ITEM 3. | ||
ITEM 4. | ||
PART II | ||
ITEM 5. | ||
ITEM 6. | ||
ITEM 7. | ||
ITEM 7A. | ||
ITEM 8. | ||
ITEM 9. | ||
ITEM 9A. | ||
ITEM 9B. | ||
PART III | ||
ITEM 10. | ||
ITEM 11. | ||
ITEM 12. | ||
ITEM 13. | ||
ITEM 14. | ||
PART IV | ||
ITEM 15. | ||
2
CAUTIONARY NOTE REGARDING FORWARD-LOOKING STATEMENTS
In addition to statements of historical fact, this report contains forward-looking statements within the meaning of the Private Securities Litigation Reform Act of 1995. Statements that are not historical in nature or that relate to future events and conditions are, or may be deemed to be, forward-looking statements. These “forward-looking statements” are based on our current expectations, estimates and projections about Key Energy Services, Inc. and its wholly owned and controlled subsidiaries, our industry and management’s beliefs and assumptions concerning future events and financial trends affecting our financial condition and results of operations. In some cases, you can identify these statements by terminology such as “may,” “will,” “should,” “predicts,” “expects,” “believes,” “anticipates,” “projects,” “potential” or “continue” or the negative of such terms and other comparable terminology. These statements are only predictions and are subject to substantial risks and uncertainties and are not guarantees of performance. Future actions, events and conditions and future results of operations may differ materially from those expressed in these statements. In evaluating those statements, you should carefully consider the risks outlined in “Item 1A. Risk Factors.”
We undertake no obligation to update any forward-looking statement to reflect events or circumstances after the date of this report except as required by law. All of our written and oral forward-looking statements are expressly qualified by these cautionary statements and any other cautionary statements that may accompany such forward-looking statements.
Important factors that may affect our expectations, estimates or projections include, but are not limited to, the following:
• | conditions in the oil and natural gas industry, especially oil and natural gas prices and capital expenditures by oil and natural gas companies; |
• | volatility in oil and natural gas prices; |
• | our ability to finance future growth of our operations or future acquisitions; |
• | our ability to implement price increases or maintain pricing on our core services; |
• | industry capacity; |
• | increased labor costs or unavailability of skilled workers; |
• | asset impairments or other charges; |
• | the periodic low demand for our services and resulting operating losses; |
• | our highly competitive industry as well as operating risks, which are primarily self-insured, and the possibility that our insurance may not be adequate to cover all of our losses or liabilities; |
• | the economic, political and social instability risks of doing business in certain foreign countries; |
• | significant costs and potential liabilities resulting from compliance with investigations relating to the possible violations the U.S. Foreign Corruption Practices Act and other applicable laws; |
• | our historically high employee turnover rate and our ability to replace or add workers; |
• | our ability to incur debt or long-term lease obligations or to implement technological developments and enhancements; |
• | significant costs and liabilities resulting from environmental, health and safety laws and regulations, including those relating to hydraulic fracturing; |
• | severe weather impacts on our business; |
• | our ability to successfully identify, make and integrate acquisitions; |
• | the loss of one or more of our larger customers; |
• | the impact of compliance with climate change legislation or initiatives; |
• | our ability to generate sufficient cash flow to meet debt service obligations; |
• | the amount of our debt and the limitations imposed by the covenants in the agreements governing our debt; |
• | an increase in our debt service obligations due to variable rate indebtedness; and |
• | other factors affecting our business described in “Item 1A. Risk Factors.” |
3
PART I
ITEM 1. BUSINESS
General Description of Business
Key Energy Services, Inc. (NYSE: KEG), a Maryland corporation, is the largest onshore, rig-based well servicing contractor based on the number of rigs owned. References to “Key,” the “Company,” “we,” “us” or “our” in this report refer to Key Energy Services, Inc., its wholly owned subsidiaries and its controlled subsidiaries. We were organized in April 1977 and commenced operations in July 1978 under the name National Environmental Group, Inc. In December 1992, we became Key Energy Group, Inc. and we changed our name to Key Energy Services, Inc. in December 1998.
We provide a full range of well services to major oil companies, foreign national oil companies and independent oil and natural gas production companies. Our services include rig-based and coiled tubing-based well maintenance and workover services, well completion and recompletion services, fluid management services, fishing and rental services and other ancillary oilfield services. Additionally, certain of our rigs are capable of specialty drilling applications. We operate in most major oil and natural gas producing regions of the continental United States, and we have operations in Mexico, Colombia, Ecuador, the Middle East and Russia. In addition, we have a technology development and control systems business based in Canada.
The following is a description of the various products and services that we provide and our major competitors for those products and services.
Service Offerings
We revised our reportable business segments as of the fourth quarter of 2014. The revised reportable segments are U.S. Rig Services, Fluid Management Services, Coiled Tubing Services, Fishing and Rental Services and International. We also have a “Functional Support” segment associated with overhead and other costs in support of our reportable segments. Segment disclosures as of and for the years ended December 31, 2013 and 2012 have been revised to reflect the change in segments. We revised our segments to reflect changes in management’s resource allocation and performance assessment in making decisions regarding our business. Our U.S. Rig Services, Fluid Management Services, Coiled Tubing Services, Fishing and Rental Services operate geographically within the United States. The International reportable segment includes our operations in Mexico, Colombia, Ecuador, Russia, Bahrain and Oman. Our Canadian subsidiary is also reflected in our International reportable segment. We evaluate the performance of our segments based on gross margin measures. All inter-segment sales pricing is based on current market conditions. See “Note 22. Segment Information” in “Item 8. Financial Statements and Supplementary Data” for additional financial information about our reportable business segments and the various geographical areas where we operate.
U.S. Rig Services
Our U.S. Rig Services include the completion of newly drilled wells, workover and recompletion of existing oil and natural gas wells, well maintenance, and the plugging and abandonment of wells at the end of their useful lives. We also provide specialty drilling services to oil and natural gas producers with certain of our larger rigs that are capable of providing conventional and horizontal drilling services. Our rigs encompass various sizes and capabilities, allowing us to service all types of wells with depths up to 20,000 feet. Many of our rigs are outfitted with our proprietary KeyView® technology, which captures and reports well site operating data and provides safety control systems. We believe that this technology allows our customers and our crews to better monitor well site operations, improves efficiency and safety, and adds value to the services that we offer.
The completion and recompletion services provided by our rigs prepare wells for production, whether newly drilled or recently extended through a workover operation. The completion process may involve selectively perforating the well casing to access production zones, stimulating and testing these zones, and installing tubular and downhole equipment. We typically provide a well service rig and may also provide other equipment to assist in the completion process. Completion services vary by well and our work may take a few days to several weeks to perform, depending on the nature of the completion.
The workover services that we provide are designed to enhance the production of existing wells and generally are more complex and time consuming than normal maintenance services. Workover services can include deepening or extending wellbores into new formations by drilling horizontal or lateral wellbores, sealing off depleted production zones and accessing previously bypassed production zones, converting former production wells into injection wells for enhanced recovery operations and conducting major subsurface repairs due to equipment failures. Workover services may last from a few days to several weeks, depending on the complexity of the workover.
Maintenance services provided with our rig fleet are generally required throughout the life cycle of an oil or natural gas well. Examples of these maintenance services include routine mechanical repairs to the pumps, tubing and other equipment, removing debris and formation material from wellbores, and pulling rods and other downhole equipment from wellbores to
4
identify and resolve production problems. Maintenance services are generally less complicated than completion and workover related services and require less time to perform.
Our rig fleet is also used in the process of permanently shutting-in oil or natural gas wells that are at the end of their productive lives. These plugging and abandonment services generally require auxiliary equipment in addition to a well servicing rig. The demand for plugging and abandonment services is not significantly impacted by the demand for oil and natural gas because well operators are required by state regulations to plug wells that are no longer productive.
We believe that the largest competitors for our U.S. Rig Services include Nabors Industries Ltd., Basic Energy Services, Inc., Superior Energy Services, Inc., Forbes Energy Services Ltd. and Pioneer Energy Services Corp. Numerous smaller companies also compete in our rig-based markets in the United States.
Fluid Management Services
We provide transportation and well-site storage services for various fluids utilized in connection with drilling, completions, workover and maintenance activities. We also provide disposal services for fluids produced subsequent to well completion. These fluids are removed from the well site and transported for disposal in saltwater disposal (“SWD”) wells owned by us or a third party. Demand and pricing for these services generally correspond to demand for our well service rigs.
We believe that the largest competitors for our domestic fluid management services include Basic Energy Services, Inc., Superior Energy Services, Inc., Nabors Industries Ltd., Nuverra Environmental Solutions, Forbes Energy Services Ltd., and Stallion Oilfield Services Ltd. Numerous smaller companies also compete in the fluid management services market in the United States.
Coiled Tubing Services
Coiled Tubing Services involve the use of a continuous metal pipe spooled onto a large reel which is then deployed into oil and natural gas wells to perform various applications, such as wellbore clean-outs, nitrogen jet lifts, through-tubing fishing, and formation stimulations utilizing acid and chemical treatments. Coiled tubing, particularly larger diameter coil units, is also used for a number of horizontal well applications such as milling temporary isolation plugs that separate frac zones and various other pre- and post-hydraulic fracturing well preparation services.
Our primary competitors in the Coiled Tubing Services market include Schlumberger Ltd., Baker Hughes Incorporated, Halliburton Company and Superior Energy Services, Inc. Numerous smaller companies also compete in our coiled tubing services markets in the United States. Demand for these services generally correspond to demand for well completion services.
Fishing and Rental Services
We offer a full line of fishing services and rental equipment designed for use in providing both onshore and offshore drilling and workover services. Fishing services involve recovering lost or stuck equipment in the wellbore utilizing a broad array of “fishing tools.” Our rental tool inventory consists of drill pipe, tubulars, handling tools (including our patented Hydra-Walk® pipe-handling units and services), pressure-control equipment, pumps, power swivels, reversing units and foam air units.
As a result of the 2011 acquisition of Edge Oilfield Services, LLC and Summit Oilfield Services, LLC (collectively, “Edge”), our rental inventory also includes frac stack equipment used to support hydraulic fracturing operations and the associated flowback of frac fluids, proppants, oil and natural gas. We also provide well testing services.
Demand for our Fishing and Rental Services is also closely related to capital spending by oil and natural gas producers.
Our primary competitors for our Fishing and Rental Services include Baker Oil Tools (owned by Baker Hughes Incorporated), Weatherford International Ltd., Basic Energy Services, Inc., Smith Services (owned by Schlumberger), Superior Energy Services, Inc., Quail Tools (owned by Parker Drilling Company) and Knight Oil Tools. Numerous smaller companies also compete in our fishing and rental services markets in the United States.
International Segment
Our International segment includes operations in Mexico, Colombia, Ecuador, the Middle East and Russia. In addition, we have a technology development and control systems business based in Canada. Also, prior to the sale of our Argentina business in the third quarter of 2012, we operated in Argentina. We are reporting the results of our Argentina business as discontinued operations for the 2012 period. We provide rig-based services such as the maintenance, workover, and recompletion of existing oil wells, completion of newly-drilled wells, and plugging and abandonment of wells at the end of their useful lives in each of our international markets.
5
In addition, in Mexico we provide drilling, coiled tubing, wireline and project management and consulting services. Our work in Mexico also requires us to provide third-party services, which vary in scope by project.
In the Middle East, we operate in the Kingdom of Bahrain and Oman. On August 5, 2013, we agreed to the dissolution of AlMansoori Key Energy Services, LLC, a joint venture formed under the laws of Abu Dhabi, UAE, and the acquisition of the underlying business for $5.1 million. See “Note 2. Acquisitions” in “Item 8. Financial Statements and Supplementary Data” for further discussion.
Our Russian operations provide drilling, workover, and reservoir engineering services. On April 9, 2013, we completed the acquisition of the remaining 50% noncontrolling interest in OOO Geostream Services Group (“Geostream”), a limited liability company incorporated in the Russian Federation, for $14.6 million. We now own 100% of Geostream. See “Note 2. Acquisitions” in “Item 8. Financial Statements and Supplementary Data” for further discussion.
Our technology development and control systems business based in Canada is focused on the development of hardware and software related to oilfield service equipment controls, data acquisition and digital information flow.
Functional Support Segment
Our Functional Support segment includes unallocated overhead costs associated with sales, safety and administrative support for our U.S. and International reporting segments.
Equipment Overview
We categorize our rigs and equipment as marketed or stacked. We consider a marketed rig or piece of equipment to be a unit that is working, on standby, or down for repairs but with work orders assigned to it or that is available for work. A stacked rig or piece of equipment is a unit that is in the remanufacturing process and could not be put to work without significant investment in repairs and additional equipment or we intend to salvage the unit for parts, sell the unit or scrap the unit. The definitions of marketed and stacked are used for the majority of our equipment.
Rigs
As mentioned above, our fleet is diverse and allows us to work on all types of wells, ranging from very shallow wells to wells as deep as 20,000 feet. Typically, higher horsepower (“HP”) rigs will be utilized on deep wells while lower HP rigs will be used on shallow wells. In most cases, these rigs can be reassigned to other regions should market conditions warrant the transfer of equipment. The following table summarizes our rigs based on horsepower (“HP”) as of December 31, 2014:
Horsepower | ||||||||
< 450 HP | ≥ 450 HP | Total | ||||||
Marketed | 304 | 336 | 640 | |||||
Stacked | 257 | 63 | 320 | |||||
Total | 561 | 399 | 960 | |||||
Coiled Tubing
Coiled tubing uses a spooled continuous metal pipe that is injected downhole in oil and gas wells in order to convey tools, log, stimulate, clean-out and perform other intervention functions. Typically, larger diameter coiled tubing is able to service longer lateral horizontal wells. The table below summarizes our Coiled Tubing Services fleet by pipe diameter as of December 31, 2014:
Pipe Diameter | ||||||||
< 2" | ≥ 2" | Total | ||||||
Marketed | 17 | 21 | 38 | |||||
Stacked | 3 | 10 | 13 | |||||
Total | 20 | 31 | 51 | |||||
6
Fluid Management Services
We have an extensive and diverse fleet of oilfield transportation service vehicles. We broadly define an oilfield transportation service vehicle as any heavy-duty, revenue-generating vehicle weighing over one ton. Our transportation fleet includes vacuum trucks, winch trucks, hot oilers and other vehicles, including kill trucks and various hauling and transport trucks. The table below summarizes our Fluid Management Services fleet as of December 31, 2014:
Marketed | Stacked | Total | ||||||
Truck Type | ||||||||
Vacuum Trucks | 494 | 94 | 588 | |||||
Winch Trucks | 83 | 5 | 88 | |||||
Hot Oil Trucks | 49 | 8 | 57 | |||||
Kill Trucks | 68 | 9 | 77 | |||||
Other | 33 | — | 33 | |||||
Total | 727 | 116 | 843 | |||||
Disposal Wells
As part of our Fluid Management Services, we provide disposal services for fluids produced subsequent to well completion. These fluids are removed from the well site and transported for disposal in SWD wells. The table below summarizes our SWD facilities, and brine and freshwater stations by state as of December 31, 2014:
Owned | Leased(1) | Total | ||||||
Location | ||||||||
Arkansas | 1 | 1 | 2 | |||||
Louisiana | 2 | — | 2 | |||||
Montana | — | 2 | 2 | |||||
New Mexico | 3 | 8 | 11 | |||||
North Dakota | 1 | 8 | 9 | |||||
Texas | 30 | 36 | 66 | |||||
Total | 37 | 55 | 92 | |||||
(1) | Includes SWD facilities as “leased” if we own the wellbore for the SWD but lease the land. In other cases, we lease both the wellbore and the land. Lease terms vary among different sites, but with respect to some of the SWD facilities for which we lease the land and own the wellbore, the land owner has an option under the land lease to retain the wellbore at the termination of the lease. |
Other Business Data
Raw Materials
We purchase a wide variety of raw materials, parts and components that are made by other manufacturers and suppliers for our use. We are not dependent on any single source of supply for those parts, supplies or materials.
Customers
Our customers include major oil companies, foreign national oil companies, and independent oil and natural gas production companies. During the years ended December 31, 2014 and December 31, 2013, Chevron Texaco Exploration and Production accounted for approximately 15% of our consolidated revenue. During the year ended December 31, 2012, Petróleos Mexicanos (“Pemex”) and Occidental Petroleum Corporation accounted for approximately 12% and 10% of our consolidated revenue, respectively. No other customer accounted for more than 10% of our consolidated revenue in 2014, 2013 or 2012.
Receivables outstanding from Pemex were approximately 19% of our total accounts receivable as of December 31, 2013. No other customers accounted for more than 10% of our total accounts receivable as of December 31, 2014 and 2013.
Competition and Other External Factors
The markets in which we operate are highly competitive. Competition is influenced by such factors as price, capacity, availability of work crews, and reputation and experience of the service provider. We believe that an important competitive
7
factor in establishing and maintaining long-term customer relationships is having an experienced, skilled and well-trained work force. We devote substantial resources toward employee safety and training programs. In addition, we believe that our proprietary KeyView® system provides important safety enhancements. We believe many of our larger customers place increased emphasis on the safety, performance and quality of the crews, equipment and services provided by their contractors. Although we believe customers consider all of these factors, price is often the primary factor in determining which service provider is awarded the work. However, in numerous instances, we secure and maintain work for large customers for which efficiency, safety, technology, size of fleet and availability of other services are of equal importance to price.
The demand for our services fluctuates, primarily in relation to the price (or anticipated price) of oil and natural gas, which, in turn, is driven for the most part by the supply of, and demand for, oil and natural gas. Generally, as supply of those commodities decreases and demand increases, service and maintenance requirements increase as oil and natural gas producers attempt to maximize the productivity of their wells in a higher priced environment. However, in a lower oil and natural gas price environment, demand for service and maintenance generally decreases as oil and natural gas producers decrease their activity. In particular, the demand for new or existing field drilling and completion work is driven by available investment capital for such work. Because these types of services can be easily “started” and “stopped,” and oil and natural gas producers generally tend to be less risk tolerant when commodity prices are low or volatile, we may experience a more rapid decline in demand for well maintenance services compared with demand for other types of oilfield services. Furthermore, in a low commodity price environment, fewer well service rigs are needed for completions, as these activities are generally associated with drilling activity.
The level of our revenues, earnings and cash flows are substantially dependent upon, and affected by, the level of U.S. and international oil and natural gas exploration, development and production activity, as well as the equipment capacity in any particular region.
Seasonality
Our operations are impacted by seasonal factors. Historically, our business has been negatively impacted during the winter months due to inclement weather, fewer daylight hours and holidays. During the summer months, our operations may be impacted by tropical or other inclement weather systems. During periods of heavy snow, ice or rain, we may not be able to operate or move our equipment between locations, thereby reducing our ability to provide services and generate revenues. In addition, the majority of our equipment works only during daylight hours. In the winter months when days become shorter, this reduces the amount of time that our assets can work and therefore has a negative impact on total hours worked. Lastly, during the fourth quarter, we historically have experienced significant slowdown during the Thanksgiving and Christmas holiday seasons and demand sometimes slows during this period as our customers exhaust their annual spending budgets.
Patents, Trade Secrets, Trademarks and Copyrights
We own numerous patents, trademarks and proprietary technology that we believe provide us with a competitive advantage in the various markets in which we operate or intend to operate. We have devoted significant resources to developing technological improvements in our well service business and have sought patent protection both inside and outside the United States for products and methods that appear to have commercial significance. All the issued patents have varying remaining durations and begin expiring between 2015 and 2031. The most notable of our technologies include numerous patents surrounding our KeyView® system.
We own several trademarks that are important to our business both in the United States and in foreign countries. In general, depending upon the jurisdiction, trademarks are valid as long as they are in use, or their registrations are properly maintained and they have not been found to become generic. Registrations of trademarks can generally be renewed indefinitely as long as the trademarks are in use. While our patents and trademarks, in the aggregate, are of considerable importance to maintaining our competitive position, no single patent or trademark is considered to be of a critical or essential nature to our business.
We also rely on a combination of trade secret laws, copyright and contractual provisions to establish and protect proprietary rights in our products and services. We typically enter into confidentiality agreements with our employees, strategic partners and suppliers and limit access to the distribution of our proprietary information.
Employees
As of December 31, 2014, we employed approximately 6,700 persons in our U.S. operations and approximately 1,400 additional persons in Mexico, Colombia, Ecuador, the Middle East, Russia and Canada. Our domestic employees are not represented by a labor union and are not covered by collective bargaining agreements. In Mexico, we have entered into a collective bargaining agreement that applies to our workers in Mexico performing work under our Pemex contracts. As noted below in “Item 1A. Risk Factors,” we have historically experienced a high employee turnover rate. We have not experienced
8
any significant work stoppages associated with labor disputes or grievances and consider our relations with our employees to be generally satisfactory.
Governmental Regulations
Our operations are subject to various federal, state and local laws and regulations pertaining to health, safety and the environment. We cannot predict the level of enforcement of existing laws or regulations or how such laws and regulations may be interpreted by enforcement agencies or court rulings in the future. We also cannot predict whether additional laws and regulations affecting our business will be adopted, or the effect such changes might have on us, our financial condition or our business. The following is a summary of the more significant existing environmental, health and safety laws and regulations to which our operations are subject and for which a lack of compliance may have a material adverse impact on our results of operations, financial position or cash flows. We believe that we are in material compliance with all such laws.
Environmental Regulations
Our operations routinely involve the storage, handling, transport and disposal of bulk waste materials, some of which contain oil, contaminants and other regulated substances. Various environmental laws and regulations require prevention, and where necessary, cleanup of spills and leaks of such materials, and some of our operations must obtain permits that limit the discharge of materials. Failure to comply with such environmental requirements or permits may result in fines and penalties, remediation orders and revocation of permits.
Hazardous Substances and Waste
The Comprehensive Environmental Response, Compensation, and Liability Act, as amended, referred to as “CERCLA” or the “Superfund” law, and comparable state laws, impose liability without regard to fault or the legality of the original conduct of certain defined persons, including current and prior owners or operators of a site where a release of hazardous substances occurred and entities that disposed or arranged for the disposal of the hazardous substances found at the site. Under CERCLA, these “responsible persons” may be jointly and severally liable for the costs of cleaning up the hazardous substances, for damages to natural resources and for the costs of certain health studies.
In the course of our operations, we occasionally generate materials that are considered “hazardous substances” and, as a result, may incur CERCLA liability for cleanup costs. Also, claims may be filed for personal injury and property damage allegedly caused by the release of hazardous substances or other pollutants. We also generate solid wastes that are subject to the requirements of the Resource Conservation and Recovery Act, as amended, or “RCRA,” and comparable state statutes.
Although we use operating and disposal practices that are standard in the industry, hydrocarbons or other wastes may have been released at properties owned or leased by us now or in the past, or at other locations where these hydrocarbons and wastes were taken for treatment or disposal. Under CERCLA, RCRA and analogous state laws, we could be required to clean up contaminated property (including contaminated groundwater), or to perform remedial activities to prevent future contamination.
Air Emissions
The Clean Air Act, as amended, or “CAA,” and similar state laws and regulations restrict the emission of air pollutants and also impose various monitoring and reporting requirements. These laws and regulations may require us to obtain approvals or permits for construction, modification or operation of certain projects or facilities and may require use of emission controls.
Global Warming and Climate Change
Some scientific studies suggest that emissions of greenhouse gases (including carbon dioxide and methane) may contribute to warming of the Earth’s atmosphere. While we do not believe our operations raise climate change issues different from those generally raised by commercial use of fossil fuels, legislation or regulatory programs that restrict greenhouse gas emissions in areas where we conduct business could increase our costs in order to comply with any new laws.
Water Discharges
We operate facilities that are subject to requirements of the Clean Water Act, as amended, or “CWA,” and analogous state laws that impose restrictions and controls on the discharge of pollutants into navigable waters. Spill prevention, control and counter-measure requirements under the CWA require implementation of measures to help prevent the contamination of navigable waters in the event of a hydrocarbon spill. Other requirements for the prevention of spills are established under the Oil Pollution Act of 1990, as amended, or “OPA,” which applies to owners and operators of vessels, including barges, offshore platforms and certain onshore facilities. Under OPA, regulated parties are strictly and jointly and severally liable for oil spills and must establish and maintain evidence of financial responsibility sufficient to cover liabilities related to an oil spill for which such parties could be statutorily responsible.
9
Occupational Safety and Health Act
We are subject to the requirements of the federal Occupational Safety and Health Act, as amended, or “OSHA,” and comparable state laws that regulate the protection of employee health and safety. OSHA’s hazard communication standard requires that information about hazardous materials used or produced in our operations be maintained and provided to employees and state and local government authorities.
Saltwater Disposal Wells
We operate SWD wells that are subject to the CWA, Safe Drinking Water Act, and state and local laws and regulations, including those established by the Underground Injection Control Program of the Environmental Protection Agency (“EPA”), which establishes the minimum program requirements. Most of our SWD wells are located in Texas. We also operate SWD wells in Arkansas, Louisiana, Montana, New Mexico and North Dakota. Regulations in these states require us to obtain an Underground Injection Control permit to operate each of our SWD wells. The applicable regulatory agency may suspend or modify one or more of our permits if our well operations are likely to result in pollution of freshwater, substantial violation of permit conditions or applicable rules, or if the well leaks into the environment.
Access to Company Reports
Our Web site address is www.keyenergy.com, and we make available free of charge through our Web site our Annual Reports on Form 10-K, Quarterly Reports on Form 10-Q, Current Reports on Form 8-K and all amendments to those reports, as soon as reasonably practicable after such materials are electronically filed with or furnished to the Securities and Exchange Commission (“SEC”). Our Web site also includes general information about us, including our Corporate Governance Guidelines and charters for the committees of our board of directors. Information on our Web site or any other Web site is not a part of this report.
ITEM 1A. RISK FACTORS
In addition to the other information in this report, the following factors should be considered in evaluating us and our business.
Our business is cyclical and depends on conditions in the oil and natural gas industry, especially oil and natural gas prices and capital expenditures by oil and natural gas companies. Volatility in oil and natural gas prices, tight credit markets and disruptions in the U.S. and global economies and financial systems may adversely impact our business.
Prices for oil and natural gas historically have been volatile and as a result of changes in the supply of, and demand for, oil and natural gas and other factors. These include changes resulting from. among other things, the ability of the Organization of Petroleum Export Countries (“OPEC”) to support oil prices, changes in the levels of oil and natural gas production in the United States, domestic and worldwide economic conditions and political instability in oil-producing countries. We depend on our customers' willingness to make capital expenditures to explore for, develop and produce oil and natural gas. Therefore, weakness in oil and natural gas prices (or the perception by our customers that oil and natural gas prices will decrease in the future) could result in a reduction in the utilization of our equipment and result in lower rates for our services.
Our customers’ willingness to undertake exploration and production activities depends largely upon prevailing industry conditions that are influenced by numerous factors over which we have no control, including:
• | prices, and expectations about future prices, of oil and natural gas; |
• | domestic and worldwide economic conditions; |
• | domestic and foreign supply of and demand for oil and natural gas; |
• | the price and quantity of imports of foreign oil and natural gas including the ability of OPEC to set and maintain production levels for oil; |
• | the cost of exploring for, developing, producing and delivering oil and natural gas; |
• | the level of excess production capacity, available pipeline, storage and other transportation capacity; |
• | lead times associated with acquiring equipment and products and availability of qualified personnel; |
• | the expected rates of decline in production from existing and prospective wells; |
• | the discovery rates of new oil and gas reserves; |
• | federal, state and local regulation of exploration and drilling activities and equipment, material or supplies that we furnish; |
• | public pressure on, and legislative and regulatory interest within, federal, state and local governments to stop, significantly limit or regulate hydraulic fracturing activities; |
• | weather conditions, including hurricanes that can affect oil and natural gas operations over a wide area and severe winter weather that can interfere with our operations; |
10
• | political instability in oil and natural gas producing countries; |
• | advances in exploration, development and production technologies or in technologies affecting energy consumption; |
• | the price and availability of alternative fuel and energy sources; |
• | uncertainty in capital and commodities markets; and |
• | changes in the value of the U.S. dollar relative to other major global currencies. |
A substantial decline in oil and natural gas prices generally leads to decreased spending by our customers. While higher oil and natural gas prices generally lead to increased spending by our customers, sustained high energy prices can be an impediment to economic growth, and can therefore negatively impact spending by our customers. Our customers also take into account the volatility of energy prices and other risk factors by requiring higher returns for individual projects if there is higher perceived risk. Any of these factors could affect the demand for oil and natural gas and could have a material adverse effect on our business, financial condition, results of operations and cash flow.
Spending by exploration and production companies can also be impacted by conditions in the capital markets. Limitations on the availability of capital, or higher costs of capital, for financing expenditures may cause exploration and production companies to make additional reductions to capital budgets in the future even if oil prices remain at current levels or natural gas prices increase from current levels. Any such cuts in spending will curtail drilling programs as well as discretionary spending on well services, which may result in a reduction in the demand for our services, and the rates we can charge and the utilization of our assets. Moreover, reduced discovery rates of new oil and natural gas reserves, or a decrease in the development rate of reserves, in our market areas, whether due to increased governmental regulation, limitations on exploration and drilling activity or other factors, could also have a material adverse impact on our business, even in a stronger oil and natural gas price environment.
We may be unable to implement price increases or maintain existing prices on our core services.
We periodically seek to increase the prices of our services to offset rising costs and to generate higher returns for our stockholders. However, we operate in a very competitive industry and as a result, we are not always successful in raising, or maintaining our existing prices. Additionally, during periods of increased market demand, a significant amount of new service capacity, including new well service rigs, fluid hauling trucks, coiled tubing units and new fishing and rental equipment, may enter the market, which also puts pressure on the pricing of our services and limits our ability to increase or maintain prices. Furthermore, during periods of declining pricing for our services, we may not be able to reduce our costs accordingly, which could further adversely affect our profitability.
Even when we are able to increase our prices, we may not be able to do so at a rate that is sufficient to offset such rising costs. In periods of high demand for oilfield services, a tighter labor market may result in higher labor costs. During such periods, our labor costs could increase at a greater rate than our ability to raise prices for our services. Also, we may not be able to successfully increase prices without adversely affecting our activity levels. The inability to maintain our prices or to increase our prices as costs increase could have a material adverse effect on our business, financial position and results of operations.
We participate in a capital-intensive industry. We may not be able to finance future growth of our operations or future acquisitions.
Our activities require substantial capital expenditures. If our cash flow from operating activities and borrowings under our 2011 Credit Facility (as defined below) are not sufficient to fund our capital expenditure budget, we would be required to fund these expenditures through debt or equity or alternative financing plans, such as refinancing or restructuring our debt or selling assets.
Our ability to raise debt or equity capital or to refinance or restructure our debt will depend on the condition of the capital markets and our financial condition at such time, among other things. Any refinancing of our debt could be at higher interest rates and may require us to comply with more onerous covenants, which could further restrict our business operations. The terms of existing or future debt instruments may restrict us from adopting some of these alternatives. If debt and equity capital or alternative financing plans are not available or are not available on economically attractive terms, we would be required to curtail our capital spending, and our ability to grow our business and sustain or improve our profits may be adversely affected. Any of the foregoing consequences could materially and adversely affect our business, financial condition, results of operations and prospects.
11
Increased labor costs or the unavailability of skilled workers could hurt our operations.
Companies in our industry, including us, are dependent upon the available labor pool of skilled employees. We compete with other oilfield services businesses and other employers to attract and retain qualified personnel with the technical skills and experience required to provide our customers with the highest quality service. We are also subject to the Fair Labor Standards Act, which governs such matters as minimum wage, overtime and other working conditions, and which can increase our labor costs or subject us to liabilities to our employees. A shortage in the labor pool of skilled workers or other general inflationary pressures or changes in applicable laws and regulations could make it more difficult for us to attract and retain personnel and could require us to enhance our wage and benefits packages. Labor costs may increase in the future or we may not be able to reduce wages when demand and pricing falls, and such changes could have a material adverse effect on our business, financial condition and results of operations.
Our future financial results could be adversely impacted by asset impairments or other charges.
We have recorded goodwill impairment charges and asset impairment charges in the past. We periodically evaluate our long-lived assets, including our property and equipment, indefinite-lived intangible assets, and goodwill for impairment. In performing these assessments, we project future cash flows on a discounted basis for goodwill, and on an undiscounted basis for other long-lived assets, and compare these cash flows to the carrying amount of the related assets. These cash flow projections are based on our current operating plans, estimates and judgmental assumptions. We perform the assessment of potential impairment on our goodwill and indefinite-lived intangible assets at least annually in the fourth quarter, or more often if events and circumstances warrant. We perform the assessment of potential impairment for our property and equipment whenever facts and circumstances indicate that the carrying value of those assets may not be recoverable due to various external or internal factors. If we determine that our estimates of future cash flows were inaccurate or our actual results are materially different from what we have predicted, we could record additional impairment charges in future periods, which could have a material adverse effect on our financial position and results of operations.
We have operated at a loss in the past and there is no assurance of our profitability in the future.
Historically, we have experienced periods of low demand for our services and have incurred operating losses. In the future, we may incur further operating losses and experience negative operating cash flow. We may not be able to reduce our costs, increase our revenues, or reduce our debt service obligations sufficient to achieve or maintain profitability and generate positive operating income in the future.
Our business involves certain operating risks, which are primarily self-insured, and our insurance may not be adequate to cover all insured losses or liabilities we might incur in our operations.
Our operations are subject to many hazards and risks, including the following:
• | accidents resulting in serious bodily injury and the loss of life or property; |
• | liabilities from accidents or damage by our fleet of trucks, rigs and other equipment; |
• | pollution and other damage to the environment; |
• | reservoir damage; |
• | blow-outs, the uncontrolled flow of natural gas, oil or other well fluids into the atmosphere or an underground formation; and |
• | fires and explosions. |
If any of these hazards occur, they could result in suspension of operations, damage to or destruction of our equipment and the property of others, or injury or death to our or a third party's personnel.
We self-insure against a significant portion of these liabilities. For losses in excess of our self-insurance limits, we maintain insurance from unaffiliated commercial carriers. However, our insurance may not be adequate to cover all losses or liabilities that we might incur in our operations. Furthermore, our insurance may not adequately protect us against liability from all of the hazards of our business. As a result of market conditions, premiums and deductibles for certain of our insurance policies may substantially increase. In some instances, certain insurance could become unavailable or available only for reduced amounts of coverage. We also are subject to the risk that we may be unable to maintain or obtain insurance of the type and amount we desire at a reasonable cost. If we were to incur a significant liability for which we were uninsured or for which we were not fully insured, it could have a material adverse effect on our financial position, results of operations and cash flows.
We operate in a highly competitive industry, with intense price competition, which may intensify as our competitors expand their operations.
The market for oilfield services in which we operate is highly competitive and includes numerous small companies capable of competing effectively in our markets on a local basis, as well as several large companies that possess substantially
12
greater financial resources than we do. Contracts are traditionally awarded on the basis of competitive bids or direct negotiations with customers.
The principal competitive factors in our markets are product and service quality and availability, responsiveness, experience, technology, equipment quality, reputation for safety and price. The competitive environment has intensified as recent mergers among exploration and production companies have reduced the number of available customers. The fact that drilling rigs and other vehicles and oilfield services equipment are mobile and can be moved from one market to another in response to market conditions heightens the competition in the industry. We may be competing for work against competitors that may be better able to withstand industry downturns and may be better suited to compete on the basis of price, retain skilled personnel and acquire new equipment and technologies, all of which could affect our revenues and profitability.
Compliance with new regulations regarding the use of “conflict minerals” could limit the supply and increase the cost of certain metals used in manufacturing our products.
In accordance with Section 1502 of the Dodd-Frank Wall Street Reform and Consumer Protection Act of 2010 (the “Dodd-Frank Act”) the SEC new disclosure requirements, which became effective in 2014, for manufacturers of products containing certain minerals which are mined from the Democratic Republic of Congo and adjoining countries. These “conflict minerals” are commonly found in metals used in the manufacture of semiconductors. Manufacturers are also required to disclose their efforts to prevent the sourcing of such minerals and metals produced from them. One of our whole-owned subsidiaries manufactures certain products that are covered by these requirements. The implementation of these new regulations may limit the sourcing and availability of some of the metals used in the manufacture of our products. The regulations may also reduce the number of suppliers who provide conflict-free metals, and may affect our ability to obtain the metals in sufficient quantities or at competitive prices. Finally, some of our customers may elect to disqualify us as a supplier if we are unable to verify that the metals used in our products are free of conflict minerals.
We are subject to the economic, political and social instability risks of doing business in certain foreign countries.
We currently have operations based in Mexico, Colombia, Ecuador, the Middle East and Russia and we own a technology development and control systems business based in Canada. In the future, we may expand our operations into other foreign countries. As a result, we are exposed to risks of international operations, including:
• | increased governmental ownership and regulation of the economy in the markets in which we operate; |
• | inflation and adverse economic conditions stemming from governmental attempts to reduce inflation, such as imposition of higher interest rates and wage and price controls; |
• | economic and financial instability of national oil companies; |
• | increased trade barriers, such as higher tariffs and taxes on imports of commodity products; |
• | exposure to foreign currency exchange rates; |
• | exchange controls or other currency restrictions; |
• | war, civil unrest or significant political instability; |
• | restrictions on repatriation of income or capital; |
• | expropriation, confiscatory taxation, nationalization or other government actions with respect to our assets located in the markets where we operate; |
• | governmental policies limiting investments by and returns to foreign investors; |
• | labor unrest and strikes; |
• | deprivation of contract rights; and |
• | restrictive governmental regulation and bureaucratic delays. |
The occurrence of one or more of these risks may:
• | negatively impact our results of operations; |
• | restrict the movement of funds and equipment to and from affected countries; and |
• | inhibit our ability to collect receivables. |
Our wholly owned subsidiary, Geostream, provides drilling, workover and reservoir engineering services in Russia. Continued political instability, deteriorating macroeconomic conditions, economic sanctions and actual or threatened military action related to the annexation of the Ukrainian territory of Crimea could have a material adverse effect on our subsidiary’s operations in the region and on the result of operations of our International segment.
13
Our failure to comply with the Foreign Corrupt Practices Act (“FCPA”) and similar laws may have a negative impact on our ongoing operations.
Our ability to comply with the FCPA and similar laws is dependent on the success of our ongoing compliance program, including our ability to continue to manage our agents, affiliates and business partners, and supervise, train and retain competent employees. Our compliance program is also dependent on the efforts of our employees to comply with applicable law and our Business Code of Conduct. We could be subject to sanctions and civil and criminal prosecution as well as fines and penalties in the event of a finding of violation of the FCPA or similar laws by us or any of our employees.
A Special Committee of our Board of Directors is currently investigating possible violations of the FCPA involving business activities of our operations in Russia and an allegation involving our Mexico operations that, if true, could potentially constitute a violation of certain of our policies, including our Code of Business Conduct, the FCPA and other applicable laws. The Special Committee’s investigation, which also includes a review of certain aspects of the Company’s operations in Colombia, as well as our other international locations, is ongoing. See Item 3. Legal Proceedings for a more detailed discussion of these investigations.
We have incurred, and may continue to incur, legal and other expenses in connection with the investigations and related compliance activities. In addition, our reputation and our ability to obtain new business or retain existing business from our current and potential clients in the relevant foreign jurisdictions could be adversely affected by the outcome of, or publicity relating to, the investigations, which could have a negative impact on our results of operations.
Historically, we have experienced a high employee turnover rate. Any difficulty we experience replacing or adding workers could adversely affect our business.
We believe that the high turnover rate in our industry is attributable to the nature of oilfield services work, which is physically demanding and performed outdoors. As a result, workers may choose to pursue employment in fields that offer a more desirable work environment at wage rates that are competitive with ours. The potential inability or lack of desire by workers to commute to our facilities and job sites, as well as the competition for workers from competitors or other industries, are factors that could negatively affect our ability to attract and retain workers. We may not be able to recruit, train and retain an adequate number of workers to replace departing workers. The inability to maintain an adequate workforce could have a material adverse effect on our business, financial condition and results of operations.
We may not be successful in implementing and maintaining technology development and enhancements. New technology may cause us to become less competitive.
The oilfield services industry is subject to the introduction of new drilling and completion techniques and services using new technologies, some of which may be subject to patent protection. As competitors and others use or develop new technologies in the future, we may be placed at a competitive disadvantage. Further, we may face competitive pressure to implement or acquire certain new technologies at a substantial cost. Some of our competitors have greater financial, technical and personnel resources that may allow them to implement new technologies before we can. If we are unable to develop and implement new technologies or products on a timely basis and at competitive cost, our business, financial condition, results of operations and cash flows could be adversely affected.
A component of our business strategy is to incorporate the KeyView® system, our proprietary technology, into our well service rigs. The inability to successfully develop, integrate and protect this technology could:
• | limit our ability to improve our market position; |
• | increase our operating costs; and |
• | limit our ability to recoup the investments made in this technological initiative. |
The loss of or a substantial reduction in activity by one or more of our largest customers could materially and adversely affect our business, financial condition and results of operations.
One customer accounted for more than 10% of our total consolidated revenues for the year ended December 31, 2014, and our ten largest customers represented approximately 47% of our consolidated revenues for the period. The loss of or a substantial reduction in activity by one or more of these customers could have an adverse effect on our business, financial condition and results of operations.
Potential adoption of future state or federal laws or regulations surrounding the hydraulic fracturing process could make it more difficult to complete oil or natural gas wells and could materially and adversely affect our business, financial condition and results of operations.
Many of our customers utilize hydraulic fracturing services during the life of a well. Hydraulic fracturing is the process of creating or expanding cracks, or fractures, in underground formations where water, sand and other additives are
14
pumped under high pressure into the formation. Although we are not a provider of hydraulic fracturing services, many of our services complement the hydraulic fracturing process.
Legislation has been introduced in Congress to provide for broader federal regulation of hydraulic fracturing operations and the reporting and public disclosure of chemicals used in the fracturing process. Additionally, the EPA has asserted federal regulatory authority over certain hydraulic fracturing activities involving diesel fuel under the Safe Drinking Water Act and in May 2012 issued draft guidance for fracturing operations that involved diesel fuels. If additional levels of regulation or permitting requirements were imposed through the adoption of new laws and regulations, our customers' business and operations could be subject to delays and increased operating and compliance costs, which could negatively impact the number of active wells in the marketplaces we serve. New regulations addressing hydraulic fracturing and chemical disclosure have been approved or are under consideration by a number of states and some municipalities have sought to restrict or ban hydraulic fracturing within their jurisdictions. The adoption of future federal, state or municipal laws regulating the hydraulic fracturing process could negatively impact our business, financial condition and results of operations.
We may incur significant costs and liabilities as a result of environmental, health and safety laws and regulations that govern our operations.
Our operations are subject to U.S. federal, state and local and foreign laws and regulations that impose limitations on the discharge of pollutants into the environment and establish standards for the handling, storage and disposal of waste materials, including toxic and hazardous wastes. To comply with these laws and regulations, we must obtain and maintain numerous permits, approvals and certificates from various governmental authorities. While the cost of such compliance has not been significant in the past, new laws, regulations or enforcement policies could become more stringent and significantly increase our compliance costs or limit our future business opportunities, which could have a material adverse effect on our financial condition and results of operations.
Our operations pose risks of environmental liability, including leakage from our operations to surface or subsurface soils, surface water or groundwater. Some environmental laws and regulations may impose strict liability, joint and several liability, or both. Therefore, in some situations, we could be exposed to liability as a result of our conduct that was lawful at the time it occurred or the conduct of, or conditions caused by, third parties without regard to whether we caused or contributed to the conditions. Actions arising under these laws and regulations could result in the shutdown of our operations, fines and penalties, expenditures for remediation or other corrective measures, and claims for liability for property damage, exposure to hazardous materials, exposure to hazardous waste or personal injuries. Sanctions for noncompliance with applicable environmental laws and regulations also may include the assessment of administrative, civil or criminal penalties, revocation of permits, temporary or permanent cessation of operations in a particular location and issuance of corrective action orders. Such claims or sanctions and related costs could cause us to incur substantial costs or losses and could have a material adverse effect on our business, financial condition, results of operations and cash flow. Additionally, an increase in regulatory requirements on oil and natural gas exploration and completion activities could significantly delay or interrupt our operations.
Increasing regulatory expansion could adversely impact costs associated with our offshore Fishing and Rental Services.
The scope of regulation of our services may increase in light of the April 2010 Macondo accident and resulting oil spill in the Gulf of Mexico, including possible increases in liabilities or funding requirements imposed by governmental agencies. In 2012, the Bureau of Safety and Environmental Enforcement, or “BSEE”, expanded its regulatory oversight beyond oil and gas operators to include service and equipment contractors. In addition, U.S. federal law imposes on certain entities deemed to be “responsible parties” a variety of regulations related to the prevention of oil spills, releases of hazardous substances, and liability for removal costs and natural resource, real property and certain economic damages arising from such incidents. Some of these laws may impose strict and/or joint and several liability for certain costs and damages without regard to the conduct of the parties. As a provider of services and rental equipment for offshore drilling and workover services, we may be deemed a “responsible party” under federal law. The implementation of such laws and the adoption and implementation of future regulatory initiatives, or the specific responsibilities that may arise from such initiatives may subject us to increased costs and liabilities, which could interrupt our operations or have an adverse effect on our revenue or results of operations.
Severe weather could have a material adverse effect on our business.
Our business could be materially and adversely affected by severe weather. Our customers' oil and natural gas operations located in Louisiana and parts of Texas may be adversely affected by hurricanes and tropical storms, resulting in reduced demand for our services. Furthermore, our customers' operations may be adversely affected by seasonal weather conditions. Adverse weather can also directly impede our own operations. Repercussions of severe weather conditions may include:
• | curtailment of services; |
• | weather-related damage to facilities and equipment, resulting in suspension of operations; |
• | inability to deliver equipment, personnel and products to job sites in accordance with contract schedules; and |
15
• | loss of productivity. |
These constraints could delay our operations and materially increase our operating and capital costs. Unusually warm winters may also adversely affect the demand for our services by decreasing the demand for natural gas.
Acquisitions and divestitures - we may not be successful in identifying, making and integrating acquisitions or limiting ongoing costs associated with the operations we divest.
An important component of our growth strategy is to make acquisitions that will strengthen our core services or presence in selected markets. The success of this strategy will depend, among other things, on our ability to identify suitable acquisition candidates, to negotiate acceptable financial and other terms, to timely and successfully integrate acquired business or assets into our existing businesses and to retain the key personnel and the customer base of acquired businesses. Any future acquisitions could present a number of risks, including but not limited to:
• | incorrect assumptions regarding the future results of acquired operations or assets or expected cost reductions or other synergies expected to be realized as a result of acquiring operations or assets; |
• | failure to successfully integrate the operations or management of any acquired operations or assets in a timely manner; |
• | failure to retain or attract key employees; |
• | diversion of management's attention from existing operations or other priorities; |
• | the inability to implement promptly an effective control environment; |
• | potential impairment charges if purchase assumptions are not achieved or market conditions decline; |
• | the risks inherent in entering markets or lines of business with which the company has limited or no prior experience; and |
• | inability to secure sufficient financing, sufficient financing on economically attractive terms, that may be required for any such acquisition or investment. |
Our business plan anticipates, and is based upon our ability to successfully complete and integrate, acquisitions of other businesses or assets in a timely and cost effective manner. Our failure to do so could adversely affect our business, financial condition or results of operations.
We also make strategic divestitures from time to time. In the case of divestitures, we may agree to indemnify acquiring parties for certain liabilities arising from our former businesses. These divestitures may also result in continued financial involvement in the divested businesses, including through guarantees, service level agreements, or other financial arrangements, following the transaction. Lower performance by those divested businesses could affect our future financial results if there is contingent consideration associated.
Compliance with climate change legislation or initiatives could negatively impact our business.
Various state governments and regional organizations comprising state governments are considering enacting new legislation and promulgating new regulations governing or restricting the emission of greenhouse gases, or “GHG”, from stationary sources, which may include our equipment and operations. At the federal level, the EPA has already issued regulations that require us to establish and report an inventory of GHG emissions. The EPA also has established a GHG permitting requirement for large stationary sources and may lower the threshold of the permitting program, which could include our equipment and operations. Legislative and regulatory proposals for restricting GHG emissions or otherwise addressing climate change could require us to incur additional operating costs and could adversely affect demand for natural gas and oil. The potential increase in our operating costs could include new or increased costs to obtain permits, operate and maintain our equipment and facilities, install new emission controls on our equipment and facilities, acquire allowances to authorize our greenhouse gas emissions, pay taxes related to our GHG emissions and administer and manage a GHG emissions program.
Conservation measures and technological advances could reduce demand for oil and natural gas.
Fuel conservation measures, alternative fuel requirements, increasing consumer demand for alternatives to oil and natural gas, technological advances in fuel economy and energy generation could reduce demand for oil and natural gas. Moreover, incentives to conserve energy or use alternative energy sources could reduce demand for oil and natural gas. Management cannot predict the impact of the changing demand for oil and natural gas services and products, and any major changes may have a material effect on our business, financial condition, results of operations and cash flows.
16
The amount of our debt and the covenants in the agreements governing our debt could negatively impact our financial condition, results of operations and business prospects.
Our level of indebtedness, and the covenants contained in the agreements governing our debt, could have important consequences for our operations, including:
• | making it more difficult for us to satisfy our obligations under the agreement governing our indebtedness and increasing the risk that we may default on our debt obligations; |
• | requiring us to dedicate a substantial portion of our cash flow from operations to required payments on indebtedness, thereby reducing the availability of cash flow for working capital, capital expenditures and other general business activities; |
• | limiting our ability to obtain additional financing in the future for working capital, capital expenditures, acquisitions, general corporate purposes and other activities; |
• | limiting management's flexibility in operating our business; |
• | limiting our flexibility in planning for, or reacting to, changes in our business and the industry in which we operate; |
• | diminishing our ability to withstand successfully a downturn in our business or the economy generally; |
• | placing us at a competitive disadvantage against less leveraged competitors; and |
• | making us vulnerable to increases in interest rates, because certain of our debt will vary with prevailing interest rates. |
We may be required to repay all or a portion of our debt on an accelerated basis in certain circumstances. If we fail to comply with the covenants and other restrictions in the agreements governing our debt, it could lead to an event of default and the consequent acceleration of our obligation to repay outstanding debt. Our ability to comply with debt covenants and other restrictions may be affected by events beyond our control, including general economic and financial conditions.
In particular, under the terms of our indebtedness, we must comply with certain financial ratios and satisfy certain financial condition tests, several of which become more restrictive over time and could require us to take action to reduce our debt or take some other action in order to comply with them. Our ability to satisfy required financial ratios and tests can be affected by events beyond our control, including prevailing economic, financial and industry conditions, and we may not be able to continue to meet those ratios and tests in the future. A breach of any of these covenants, ratios or tests could result in a default under our indebtedness. If we default, lenders under our senior secured revolving credit facility will no longer be obligated to extend credit to us and they, as well as the trustee for our outstanding notes, could elect to declare all amounts outstanding under our 2011 Credit Facility or indentures, as applicable, together with accrued interest, to be immediately due and payable. The results of such actions would have a significant negative impact on our results of operations, financial position and cash flows.
We may incur more debt and long-term lease obligations in the future.
The agreements governing our long-term debt restrict, but do not prohibit, us from incurring additional indebtedness and other obligations in the future. As of December 31, 2014, we had $748.4 million of total debt.
An increase in our level of indebtedness could exacerbate the risks described in the immediately preceding risk factor and the occurrence of any of such events could result in a material adverse effect on our business, financial condition, results of operations, and business prospects.
We may not be able to generate sufficient cash flow to meet our debt service obligations.
Our ability to make payments on our indebtedness and to fund planned capital expenditures depends on our ability to generate cash in the future. This, to a certain extent, is subject to conditions in the oil and natural gas industry, general economic and financial conditions, competition in the markets in which we operate, the impact of legislative and regulatory actions on how we conduct our business and other factors, all of which are beyond our control. This risk could be exacerbated by any economic downturn or instability in the U.S. and global credit markets.
Our business may not generate sufficient cash flow from operations to service our outstanding indebtedness. In addition, future borrowings may not be available to us in amounts sufficient to enable us to repay our indebtedness or to fund our other capital needs. If our business does not generate sufficient cash flow from operations to service our outstanding indebtedness, we may have to undertake alternative financing plans, such as:
• | refinancing or restructuring our debt; |
• | selling assets; |
• | reducing or delaying acquisitions or capital investments, such as remanufacturing our rigs and related equipment; or |
• | seeking to raise additional capital. |
17
We may not be able to implement alternative financing plans, if necessary, on commercially reasonable terms or at all, and implementing any such alternative financing plans may not allow us to meet our debt obligations. In addition, a downgrade in our credit rating would make it more difficult for us to raise additional debt in the future. Our inability to generate sufficient cash flow to satisfy our debt obligations, or to obtain alternative financings, could materially and adversely affect our business, financial condition, results of operations and future prospects for growth.
Our variable rate indebtedness subjects us to interest rate risk, which could cause our debt service obligations to increase significantly.
Borrowings under our 2011 Credit Facility bear interest at variable rates, exposing us to interest rate risk. If interest rates increase, our debt service obligations on the variable rate indebtedness would increase even though the amount borrowed remained the same, and our net income and cash available for servicing our indebtedness would decrease.
Our bylaws contain provisions that may prevent or delay a change in control.
Our bylaws contain certain provisions designed to enhance the ability of our board of directors to respond to unsolicited attempts to acquire control of the Company. These provisions:
• | establish a classified board of directors, providing for three-year staggered terms of office for all members of our board of directors; |
• | set limitations on the removal of directors; |
• | enable our board of directors to set the number of directors and to fill vacancies on the board occurring between stockholder meetings; and |
• | set limitations on who may call a special meeting of stockholders. |
These provisions may have the effect of entrenching management and may deprive investors of the opportunity to sell their shares to potential acquirers seeking control of the Company at a premium over prevailing prices. This potential inability to obtain a control premium could reduce the price of our common stock.
ITEM 1B. UNRESOLVED STAFF COMMENTS
None.
ITEM 2. PROPERTIES
We lease office space for our principal executive offices in Houston, Texas. We also lease local office space in the various countries in which we operate. Additionally, we own or lease numerous rig facilities, storage facilities, truck facilities and sales and administrative offices throughout the geographic regions in which we operate. We lease temporary facilities to house employees in regions where infrastructure is limited. In connection with our Fluid Management Services, we operate a number of owned and leased SWD facilities, and brine and freshwater stations. Our leased properties are subject to various lease terms and expirations.
We believe all properties that we currently occupy are suitable for their intended uses. We believe that our current facilities are sufficient to conduct our operations. However, we continue to evaluate the purchase or lease of additional properties or the consolidation of our properties, as our business requires.
The following table shows our active owned and leased properties, as well as active SWD facilities, categorized by geographic region as of December 31, 2014:
Region | Office, Repair & Service and Other(1) | SWDs, Brine and Freshwater Stations(2) | Operational Field Services Facilities | |||||
United States | ||||||||
Owned | 9 | 37 | 65 | |||||
Leased | 32 | 55 | 48 | |||||
International | ||||||||
Owned | — | — | — | |||||
Leased | 47 | — | 7 | |||||
TOTAL | 88 | 92 | 120 | |||||
(1) | Includes 15 residential properties leased in the United States and 8 residential properties leased outside the United States used to house employees. |
(2) | Includes SWD facilities as “leased” if we own the wellbore for the SWD but lease the land. In other cases, we lease both the wellbore and the land. Lease terms vary among different sites, but with respect to some of the SWD facilities for |
18
which we lease the land and own the wellbore, the land owner has an option under the land lease to retain the wellbore at the termination of the lease.
ITEM 3. LEGAL PROCEEDINGS
We are subject to various suits and claims that have arisen in the ordinary course of business. We do not believe that the disposition of any of our ordinary course litigation will result in a material adverse effect on our consolidated financial position, results of operations or cash flows.
Between May of 2013 and June of 2014, five lawsuits (four class actions and one enforcement action) were filed in California involving alleged violations of California's wage and hour laws. In general, the lawsuits allege failure to pay wages, including overtime and minimum wages, failure to pay final wages upon employment terminations in a timely manner, failure to reimburse reasonable and necessary business expenses, failure to provide wage statements consistent with California law, and violations of the California meal and break period laws, among other claims. We intend to vigorously investigate and defend these actions. Because these cases are in relatively early stages, and we have not yet briefed class certification issues, we cannot predict the outcome of these lawsuits at this time. Accordingly, we cannot estimate any possible loss or range of loss.
In January, 2014, the SEC advised us that it is investigating possible violations of the U.S. Foreign Corrupt Practices Act (“FCPA”) involving business activities of Key’s operations in Russia. In April 2014, we became aware of an allegation involving our Mexico operations that, if true, could potentially constitute a violation of certain of our policies, including our Code of Business Conduct, the FCPA and other applicable laws. A Special Committee of our Board of Directors is investigating this allegation as well as the possible violations of the FCPA involving business activities of our operations in Russia. The Special Committee’s investigations, which also include a review of certain aspects of the Company’s operations in Colombia, as well as our other international locations, are ongoing. On May 30, 2014, we voluntarily disclosed the allegation involving our Mexico operations and information from the Company’s initial investigation to the SEC and Department of Justice (“DOJ”). We are fully cooperating with investigations by the SEC and DOJ. At this time we are unable to predict the ultimate resolution of these matters with these agencies and, accordingly, cannot estimate any possible loss or range of loss. The Special Committee of our Board of Directors currently expects to substantially complete the fact-finding phase of its investigation by the end of March 2015.
In August 2014, two class action lawsuits were filed in the U.S. District Court, Southern District of Texas, Houston Division, individually and on behalf of all other persons similarly situated against the Company and certain officers of the Company, alleging violations of federal securities laws, specifically, violations of Section 10(b) and Rule 10(b)-5, Section 20(a) of the Securities Exchange Act of 1934. Those lawsuits were styled as follows: Sean Cady, Individually and on Behalf of All Other Persons Similarly Situated v. Key Energy Services, Inc., Richard J. Alario, and J. Marshall Dodson, No. 4:14-cv-2368, filed on August 15, 2014; and Ian W. Davidson, Individually and on Behalf of All Other Persons Similarly Situated v. Key Energy Services, Inc., Richard J. Alario, and J. Marshall Dodson, No. 4.14-cv-2403, filed on August 21, 2014. On December 11, 2014, the Court entered an order that consolidated the two lawsuits into one action, along with any future filed tag-along actions brought on behalf of purchasers of Key Energy Services, Inc. common stock. The order also appointed Inter-Local Pension Fund as the lead plaintiff in the class action and approved the law firm of Spector Roseman Kodroff & Willis, P.C. as lead counsel for the consolidated class and Kendall Law Group, LLP, as local counsel for the consolidated class. The lead plaintiff filed the consolidated amended complaint on February 13, 2015. Among other changes, the consolidated amended complaint adds Taylor M. Whichard III and Newton W. Wilson III as defendants and expands the class period to include the timeframe between September 4, 2012 and July 17, 2014. Because this case is in early stages, we cannot predict the outcome at this time. Accordingly, we cannot estimate any possible loss or range of loss.
In addition, in a letter dated September 4, 2014, a purported shareholder of the Company demanded that the Board commence an independent internal investigation into and legal proceedings against each member of the Board, a former member of the Board and certain officers of the Company for alleged violations of Maryland and/or federal law. The letter alleges that the Board and senior officers breached their fiduciary duties to the Company, including the duty of loyalty and due care, by (i) improperly accounting for goodwill, (ii) causing the Company to potentially violate the FCPA, resulting in an investigation by the SEC, (iii) causing the Company to engage in improper conduct related to the Company’s Russia operations; and (iv) making false statements regarding, and failing to properly account for, certain contracts with Pemex. As described in the letter, the purported shareholder believes that the legal proceedings should seek recovery of damages in an unspecified amount allegedly sustained by the Company. The Board of Directors referred the demand letter to the Special Committee. We cannot predict the outcome of this matter.
ITEM 4. MINE SAFETY DISCLOSURES
Not applicable.
19
PART II
ITEM 5. MARKET FOR REGISTRANT’S COMMON EQUITY, RELATED STOCKHOLDER MATTERS AND ISSUER PURCHASES OF EQUITY SECURITIES
Market and Share Prices
Our common stock is traded on the New York Stock Exchange (“NYSE”) under the symbol “KEG.” As of February 17, 2015, there were 568 registered holders of 154,398,693 issued and outstanding shares of common stock. This number of registered holders does not include holders that have shares of common stock held for them in “street name”, meaning that the shares are held for their accounts by a broker or other nominee. In these instances, the brokers or other nominees are included in the number of registered holders, but the underlying holders of the common stock that have shares held in “street name” are not. The following table sets forth the reported high and low closing price of our common stock for the periods indicated:
High | Low | ||||||
Year Ended December 31, 2014 | |||||||
1st Quarter | $ | 9.24 | $ | 7.15 | |||
2nd Quarter | 10.45 | 7.96 | |||||
3rd Quarter | 9.19 | 4.84 | |||||
4th Quarter | 4.82 | 1.05 | |||||
High | Low | ||||||
Year Ended December 31, 2013 | |||||||
1st Quarter | $ | 9.38 | $ | 7.15 | |||
2nd Quarter | 7.80 | 5.61 | |||||
3rd Quarter | 8.01 | 6.08 | |||||
4th Quarter | 8.88 | 6.90 | |||||
The following Performance Graph and related information shall not be deemed “soliciting material” or to be “filed” with the SEC, nor shall such information be incorporated by reference into any future filing under the Securities Act of 1933 or the Securities Exchange Act of 1934, except to the extent that we specifically incorporate it by reference into such filing.
The following performance graph compares the performance of our common stock to the PHLX Oil Service Sector Index, the Russell 2000 Index and a peer group as established by management.
The peer group consists of the following companies: Baker Hughes Incorporated, Basic Energy Services, Inc., Exterran Holdings, Inc., Helix Energy Solutions Group, Inc., Noble Corporation, Oceaneering International Inc., Oil States International Inc., Patterson UTI Energy Inc., RPC, Inc., Superior Energy Services, Inc. and Weatherford International Ltd.
The graph below compares the cumulative five-year total return to holders of our common stock with the cumulative total returns of the PHLX Oil Service Sector, the listed Russell 2000 Index and our peer group. The graph assumes that the value of the investment in our common stock and each index (including reinvestment of dividends) was $100 at December 31, 2009 and tracks the return on the investment through December 31, 2014.
20
COMPARISON OF 5 YEAR CUMULATIVE TOTAL RETURN*
Among Key Energy Services, Inc., the Russell 2000 Index, the Russell 1000 Index,
the PHLX Oil Service Sector Index and Peer Group
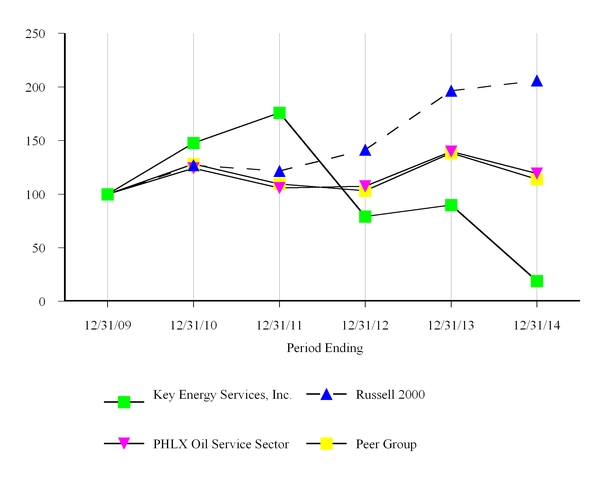
* $100 invested on December 31, 2009 in stock or index, including reinvestment of dividends. Fiscal years ended December 31.
Dividend Policy
There were no dividends declared or paid on our common stock for the years ended December 31, 2014, 2013 and 2012. Under the terms of our 2011 Credit Facility, we must meet certain financial covenants before we may pay dividends. We do not currently intend to pay dividends.
Issuer Purchases of Equity Securities
During the fourth quarter of 2014, we repurchased an aggregate of 2,848 shares of our common stock. The repurchases were to satisfy tax withholding obligations that arose upon vesting of restricted stock. Set forth below is a summary of the share repurchases:
Period | Total Number of Shares Purchased | Average Price Paid Per Share(1) | ||||
October 1, 2014 to October 31, 2014 | — | $ | — | |||
November 1, 2014 to November 30, 2014 | 2,075 | $ | 2.71 | |||
December 1, 2014 to December 31, 2014 | 773 | $ | 1.55 | |||
(1) | The price paid per share with respect to the tax withholding repurchases was determined using the closing prices on the applicable vesting date, as quoted on the NYSE. |
21
Equity Compensation Plan Information
The following table sets forth information as of December 31, 2014 with respect to equity compensation plans (including individual compensation arrangements) under which our common stock is authorized for issuance. The material features of each of these plans are described in “Note 19. Share-Based Compensation” in “Item 8. Financial Statement and Supplementary Date.”
Plan Category | Number of Securities to be Issued Upon Exercise of Outstanding Options, Warrants And Rights (a)(2) | Weighted Average Exercise Price of Outstanding Options, Warrants And Rights (b)(3) | Number of Securities Remaining Available for Future Issuance Under Equity Compensation Plans (Excluding Securities Reflected in Column (a)) (c)(4) | ||||||
(in thousands) | (in thousands) | ||||||||
Equity compensation plans approved by stockholders(1) | 1,392 | $ | 14.07 | 10,004 | |||||
Equity compensation plans not approved by stockholders | — | $ | — | — | |||||
Total | 1,392 | 10,004 | |||||||
(1) | Represents options and other stock-based awards outstanding under the Key Energy Services, Inc. 2014 Equity and Cash Incentive Plan (the “2014 Incentive Plan”). |
(2) | Includes 1,319,100 of shares that may be issued upon the exercise of stock options and 73,247 of shares that may be issued upon vesting of restricted stock units (“RSUs”). Stock-settled stock appreciation rights (“SARs”) are excluded as the fair market value of our SARs was zero as of December 31, 2014. |
(3) | RSUs do not have an exercise price; therefore RSUs are excluded from weighted average exercise price of outstanding awards. |
(4) | Represents the number of shares remaining available for grant under the 2014 Incentive Plan as of December 31, 2014. If any common stock underlying an unvested award that is canceled, forfeited or is otherwise terminated without delivery of shares, then such shares will again be available for issuance under the 2014 Incentive Plan. |
ITEM 6. SELECTED FINANCIAL DATA
The following historical selected financial data as of and for the years ended December 31, 2010 through December 31, 2014 has been derived from our audited financial statements included in “Item 8. Financial Statements and Supplementary Data.” For the years ended December 31, 2010 and December 31, 2011, we have reclassified the historical results of operations of our Argentina business as discontinued operations. Additionally, for the year ended December 31, 2010, we have reclassified the historical results of operations of our pressure pumping and wireline businesses as discontinued operations. The historical selected financial data should be read in conjunction with “Item 7. Management’s Discussion and Analysis of Financial Condition and Results of Operations” and the historical consolidated financial statements and related notes thereto included in “Item 8. Financial Statements and Supplementary Data.”
22
RESULTS OF OPERATIONS DATA
Year Ended December 31, | |||||||||||||||||||
2014 | 2013 | 2012 | 2011 | 2010 | |||||||||||||||
(in thousands, except per share amounts) | |||||||||||||||||||
REVENUES | $ | 1,427,336 | $ | 1,591,676 | $ | 1,960,070 | $ | 1,729,211 | $ | 1,062,595 | |||||||||
COSTS AND EXPENSES: | |||||||||||||||||||
Direct operating expenses | 1,059,651 | 1,114,462 | 1,308,845 | 1,085,190 | 746,441 | ||||||||||||||
Depreciation and amortization expense | 200,738 | 225,297 | 213,783 | 166,946 | 133,898 | ||||||||||||||
General and administrative expenses | 249,646 | 221,753 | 230,496 | 223,299 | 186,188 | ||||||||||||||
Impairment expense | 121,176 | — | — | — | — | ||||||||||||||
Operating income (loss) | (203,875 | ) | 30,164 | 206,946 | 253,776 | (3,932 | ) | ||||||||||||
Loss on early extinguishment of debt | — | — | — | 46,451 | — | ||||||||||||||
Interest expense, net of amounts capitalized | 54,227 | 55,204 | 53,566 | 40,849 | 41,240 | ||||||||||||||
Other (income) expense, net | 1,009 | (803 | ) | (6,649 | ) | (8,977 | ) | (2,807 | ) | ||||||||||
Income (loss) from continuing operations before tax | (259,111 | ) | (24,237 | ) | 160,029 | 175,453 | (42,365 | ) | |||||||||||
Income tax (expense) benefit | 80,483 | 3,064 | (57,352 | ) | (64,117 | ) | 17,961 | ||||||||||||
Income (loss) from continuing operations | (178,628 | ) | (21,173 | ) | 102,677 | 111,336 | (24,404 | ) | |||||||||||
Income (loss) from discontinued operations, net of tax | — | — | (93,568 | ) | (10,681 | ) | 94,753 | ||||||||||||
Net income (loss) | (178,628 | ) | (21,173 | ) | 9,109 | 100,655 | 70,349 | ||||||||||||
Income (loss) attributable to noncontrolling interest | — | 595 | 1,487 | (806 | ) | (3,146 | ) | ||||||||||||
INCOME (LOSS) ATTRIBUTABLE TO KEY | $ | (178,628 | ) | $ | (21,768 | ) | $ | 7,622 | $ | 101,461 | $ | 73,495 | |||||||
Earnings (loss) per share from continuing operations attributable to Key: | |||||||||||||||||||
Basic | $ | (1.16 | ) | $ | (0.14 | ) | $ | 0.67 | $ | 0.77 | $ | (0.16 | ) | ||||||
Diluted | $ | (1.16 | ) | $ | (0.14 | ) | $ | 0.67 | $ | 0.76 | $ | (0.16 | ) | ||||||
Earnings (loss) per share from discontinued operations: | |||||||||||||||||||
Basic | $ | — | $ | — | $ | (0.62 | ) | $ | (0.07 | ) | $ | 0.73 | |||||||
Diluted | $ | — | $ | — | $ | (0.62 | ) | $ | (0.07 | ) | $ | 0.73 | |||||||
Earnings (loss) per share attributable to Key: | |||||||||||||||||||
Basic | $ | (1.16 | ) | $ | (0.14 | ) | $ | 0.05 | $ | 0.70 | $ | 0.57 | |||||||
Diluted | $ | (1.16 | ) | $ | (0.14 | ) | $ | 0.05 | $ | 0.69 | $ | 0.57 | |||||||
23
Year Ended December 31, | |||||||||||||||||||
2014 | 2013 | 2012 | 2011 | 2010 | |||||||||||||||
(in thousands) | |||||||||||||||||||
Income (loss) from continuing operations attributable to Key: | |||||||||||||||||||
Income (loss) from continuing operations | $ | (178,628 | ) | $ | (21,173 | ) | $ | 102,677 | $ | 111,336 | $ | (24,404 | ) | ||||||
Income (loss) attributable to noncontrolling interest | — | 595 | 1,487 | (806 | ) | (3,146 | ) | ||||||||||||
Income (loss) from continuing operations attributable to Key | $ | (178,628 | ) | $ | (21,768 | ) | $ | 101,190 | $ | 112,142 | $ | (21,258 | ) | ||||||
Weighted Average Shares Outstanding: | |||||||||||||||||||
Basic | 153,371 | 152,271 | 151,106 | 145,909 | 129,368 | ||||||||||||||
Diluted | 153,371 | 152,271 | 151,125 | 146,217 | 129,368 | ||||||||||||||
CASH FLOW DATA
Year Ended December 31, | |||||||||||||||||||
2014 | 2013 | 2012 | 2011 | 2010 | |||||||||||||||
(in thousands) | |||||||||||||||||||
Net cash provided by operating activities | $ | 164,168 | $ | 228,643 | $ | 369,660 | $ | 188,305 | $ | 129,805 | |||||||||
Net cash used in investing activities | (146,840 | ) | (160,881 | ) | (428,709 | ) | (520,090 | ) | (8,631 | ) | |||||||||
Net cash provided by (used in) financing activities | (22,058 | ) | (85,492 | ) | 73,946 | 306,084 | (100,205 | ) | |||||||||||
Effect of changes in exchange rates on cash | 3,728 | 87 | (4,391 | ) | 4,516 | (1,735 | ) | ||||||||||||
BALANCE SHEET DATA
Year Ended December 31, | |||||||||||||||||||
2014 | 2013 | 2012 | 2011 | 2010 | |||||||||||||||
(in thousands) | |||||||||||||||||||
Working capital | $ | 191,937 | $ | 273,809 | $ | 284,698 | $ | 311,060 | $ | 132,385 | |||||||||
Property and equipment, gross | 2,555,515 | 2,606,738 | 2,528,578 | 2,184,810 | 1,789,571 | ||||||||||||||
Property and equipment, net | 1,235,258 | 1,365,646 | 1,436,674 | 1,197,300 | 920,797 | ||||||||||||||
Total assets | 2,333,498 | 2,587,470 | 2,761,588 | 2,599,120 | 1,892,936 | ||||||||||||||
Long-term debt and capital leases, net of current maturities | 748,426 | 763,981 | 848,110 | 773,975 | 427,121 | ||||||||||||||
Total liabilities | 1,275,435 | 1,336,377 | 1,474,256 | 1,384,489 | 911,133 | ||||||||||||||
Equity | 1,058,063 | 1,251,093 | 1,287,332 | 1,214,631 | 981,803 | ||||||||||||||
Cash dividends per common share | — | — | — | — | — | ||||||||||||||
ITEM 7. MANAGEMENT’S DISCUSSION AND ANALYSIS OF FINANCIAL CONDITION AND RESULTS OF OPERATIONS
The following discussion and analysis of our financial condition and results of operations should be read in conjunction with our consolidated financial statements and related notes thereto in “Item 8. Financial Statements and Supplementary Data.” The discussion below contains forward-looking statements that are based upon our current expectations and are subject to uncertainty and changes in circumstances including those identified in “Cautionary Note Regarding Forward-Looking Statements” above. Actual results may differ materially from these expectations due to potentially inaccurate assumptions and known or unknown risks and uncertainties. Such forward-looking statements should be read in conjunction with our disclosures under “Item 1A. Risk Factors.”
24
Overview
We provide a full range of well services to major oil companies, foreign national oil companies and independent oil and natural gas production companies to produce, maintain and enhance the flow of oil and natural gas throughout the life of a well. These services include rig-based and coiled tubing-based well maintenance and workover services, well completion and recompletion services, fluid management services, fishing and rental services and other ancillary oilfield services. Additionally, certain of our rigs are capable of specialty drilling applications. We operate in most major oil and natural gas producing regions of the continental United States, and we have operations in Mexico, Colombia, Ecuador, the Middle East and Russia. In addition, we have a technology development and control systems business based in Canada.
The demand for our services fluctuates, primarily in relation to the price (or anticipated price) of oil and natural gas, which, in turn, is driven primarily by the supply of, and demand for, oil and natural gas. Generally, as supply of those commodities decreases and demand increases, service and maintenance requirements increase as oil and natural gas producers attempt to maximize the productivity of their wells in a higher priced environment. However, in a lower oil and natural gas price environment, demand for service and maintenance generally decreases as oil and natural gas producers decrease their activity. In particular, the demand for new or existing field drilling and completion work is driven by available investment capital for such work. Because these types of services can be easily “started” and “stopped,” and oil and natural gas producers generally tend to be less risk tolerant when commodity prices are low or volatile, we may experience a more rapid decline in demand for well maintenance services compared with demand for other types of oilfield services. Further, in a lower-priced environment, fewer well service rigs are needed for completions, as these activities are generally associated with drilling activity.
Business and Growth Strategies
Focus on Horizontal Well Services
Over the past several years the number of horizontal wells, particularly horizontal oil wells, drilled in the U.S. has increased significantly. Horizontal wells tend to involve a higher degree of service intensity associated with their drilling and completion, and we believe ultimately the maintenance required over their lifetime as well. We believe that many of these wells are entering the phase of their life where more maintenance services are required to stem declines and maintain production. We further believe that over future periods, the market for maintenance on the installed base of horizontal oil wells will grow. To capitalize on this growing market segment we have built and acquired new equipment, including more capable rigs and coiled tubing units, upgraded existing equipment capable of providing services integral to the completion and maintenance of horizontal wellbores and acquired frac stack equipment used to support completion of the horizontal wellbore. We also expanded our service offerings into unconventional shale regions where horizontal activity is most prevalent including the Bakken shale, the Eagle Ford shale and others. As horizontal wells have become more prevalent in the Permian Basin, we have expanded our operations and assets best suited for horizontal well maintenance, with all of our service offerings in that market. Additionally, while we have invested in the assets used to service our customer’s well site needs, we have also strengthened our sales and service efforts to better identify and meet the needs of our customers. We intend to continue our focus on the expansion of horizontal well service offerings, particularly production maintenance related services, in existing markets and into new markets in the United States.
Navigate Market Uncertainties
We operate in a cyclical business where our customer’s spending is largely driven by the prices received on their sale of oil and natural gas production. During periods of declining oil and natural gas prices, demand for our services and the price we receive for our services may fall while competition for the remaining market activity will increase. During these periods of low demand for our services, we will stack older and more costly to operate equipment and reduce the amount of capital invested in the business for growth or replacement of equipment. We will also take steps to lower our cost to operate, reducing headcount and the costs of labor. Additionally, we have taken steps to reduce the fixed costs in our business and will continue to do so. We believe that through these actions we will be able to maintain sufficient liquidity to capitalize on a return in activity as well as what we see as the longer term trend towards higher maintenance needs on the recently installed base of horizontal oil wells.
Pursue Prudent Acquisitions in Complementary Businesses
We are focused on maximizing cash flows from acquisitions and other investments we have made, and we have added an internal financial metric, Key Value Added, or “KVA,” to evaluate our investments. We intend to continue our disciplined approach to acquisitions, seeking opportunities, that strengthen our presence in selected regional markets and provide opportunities to expand our core services. We also seek to acquire technologies, assets and businesses that represent a good operational, strategic, and/or synergistic fit with our existing service offerings.
25
PERFORMANCE MEASURES
The Baker Hughes U.S. rig count data, which is publicly available on a weekly basis, is often used as a coincident indicator of overall Exploration and Production (“E&P”) company spending and broader oilfield activity. In assessing overall activity in the U.S. onshore oilfield service industry in which we operate, we believe that the Baker Hughes U.S. land drilling rig count is the best barometer of E&P companies' capital spending and resulting activity levels. Historically, our activity levels have been highly correlated to U.S. onshore capital spending by our E&P company customers as a group.
Year | WTI Cushing Crude Oil(1) | NYMEX Henry Hub Natural Gas(1) | Average Baker Hughes U.S. Land Drilling Rigs(2) | |||||||
2010 | $ | 79.48 | $ | 4.38 | 1,514 | |||||
2011 | $ | 94.87 | $ | 4.03 | 1,846 | |||||
2012 | $ | 94.05 | $ | 2.75 | 1,871 | |||||
2013 | $ | 97.98 | $ | 3.73 | 1,705 | |||||
2014 | $ | 93.17 | $ | 4.37 | 1,804 | |||||
(1) | Represents the average of the monthly average prices for each of the years presented. Source: U.S. Energy Information Administration, Bloomberg. |
(2) | Source: www.bakerhughes.com |
Internally, we measure activity levels for our well servicing operations primarily through our rig and trucking hours. Generally, as capital spending by E&P companies increases, demand for our services also rises, resulting in increased rig and trucking services and more hours worked. Conversely, when activity levels decline due to lower spending by E&P companies, we generally provide fewer rig and trucking services, which results in lower hours worked. The following table presents our quarterly rig and trucking hours from 2012 through 2014.
Rig Hours | Trucking Hours | Key’s U.S. Working Days(3) | |||||||
U.S. | International(1) | Total(2) | |||||||
2014: | |||||||||
First Quarter | 347,047 | 46,090 | 393,137 | 481,353 | 63 | ||||
Second Quarter | 355,219 | 33,758 | 388,977 | 493,494 | 63 | ||||
Third Quarter | 365,891 | 34,603 | 400,494 | 506,486 | 64 | ||||
Fourth Quarter | 341,313 | 41,156 | 382,469 | 481,653 | 61 | ||||
Total 2014 | 1,409,470 | 155,607 | 1,565,077 | 1,962,986 | 251 | ||||
2013: | |||||||||
First Quarter | 337,714 | 114,103 | 451,817 | 580,862 | 62 | ||||
Second Quarter | 365,956 | 65,280 | 431,236 | 559,584 | 64 | ||||
Third Quarter | 360,112 | 55,105 | 415,217 | 524,513 | 64 | ||||
Fourth Quarter | 343,626 | 46,553 | 390,179 | 507,636 | 62 | ||||
Total 2013 | 1,407,408 | 281,041 | 1,688,449 | 2,172,595 | 252 | ||||
2012: | |||||||||
First Quarter | 435,280 | 84,469 | 519,749 | 722,718 | 64 | ||||
Second Quarter | 428,864 | 104,656 | 533,520 | 685,587 | 63 | ||||
Third Quarter | 412,998 | 103,448 | 516,446 | 607,480 | 63 | ||||
Fourth Quarter | 357,628 | 113,246 | 470,874 | 594,770 | 62 | ||||
Total 2012 | 1,634,770 | 405,819 | 2,040,589 | 2,610,555 | 252 | ||||
(1) | International rig hours exclude rig hours generated in Argentina, as our Argentina operations were sold in the third quarter of 2012 and are reported as discontinued operations. Argentina hours were 54,625 and 55,972 for the first and second quarters of 2012, respectively. |
(2) | Total rig hours included U.S. rig hours and international rig hours, as described in footnote (1) above. |
(3) | Key's U.S. working days are the number of weekdays during the quarter minus national holidays. |
26
MARKET CONDITIONS AND OUTLOOK
Market Conditions — Year Ended December 31, 2014
Our core businesses depend on our customers' willingness to make expenditures to produce, develop and explore for oil and natural gas. Industry conditions are influenced by numerous factors, such as the supply of and demand for oil and natural gas, domestic and worldwide economic conditions, and political instability in oil producing countries.
Over the course of 2014, our businesses in the U.S. were faced with strong competitive forces in a market environment where demand for completion related services for horizontal oil wells continued to grow. In response to the competitive environment, we made organizational changes to improve our responsiveness to customer demands and service requirements. In addition, given the strong demand for oilfield service labor, we faced rising labor costs in order to ensure that we could appropriately services our customers’ needs in a market where, due to competitive pressures, we were challenged to pass those costs along to our customers. Demand for production maintenance services did not see the same growth in 2014, although we believe that we began to see an increase in demand for maintenance on horizontal oil wellbores and expect that trend to continue.
Outside the U.S., we were awarded a two year $48 million contract in Mexico, our first with Pemex since 2011 and began to provide services under this contract in the fourth quarter of 2014. We believe that with this contract we can begin to stabilize our Mexican operation. Additionally, we moved nineteen well service rigs from Mexico to the U.S.
Market Outlook
We continue to position Key to take advantage of the shift to horizontal oil well maintenance through steady investment in production-driven services built to address the demands of complex horizontal wellbores. We continue to see the population of horizontal well bores expand and a growing number of these well bores entering the more maintenance intensive cycle phase of their life associated with older producing wells and believe that we are well positioned to take advantage of this trend.
As we look to 2015, the recent unraveling in global oil prices has cast a shadow of uncertainty over the U.S. oil industry. U.S. customer capital budgets are being slashed in order to respond to a lower oil price environment and to preserve liquidity. Although U.S. customers are reacting in draconian fashion, we believe that the impetus to optimize existing horizontal oil production in a moderated oil price environment will continue to grow as well maintenance can provide an attractive return to our customers for a fraction of the outlay of a new well. It is also important that we keep a sharp focus on continuing to broaden our customer base to provide new opportunities to help offset spending declines. Further, we have implemented significant cost control efforts, including executive salary reductions, headcount reductions, furlough programs and field wage reductions in order to help mitigate margin degradation. We believe that although 2015 will present many challenges, we can weather the storm and emerge a stronger company.
27
RESULTS OF OPERATIONS
Consolidated Results of Operations
The following table shows our consolidated results of operations for the years ended December 31, 2014, 2013 and 2012:
Year Ended December 31, | |||||||||||
2014 | 2013 | 2012 | |||||||||
(in thousands, except per share amounts) | |||||||||||
REVENUES | $ | 1,427,336 | $ | 1,591,676 | $ | 1,960,070 | |||||
COSTS AND EXPENSES: | |||||||||||
Direct operating expenses | 1,059,651 | 1,114,462 | 1,308,845 | ||||||||
Depreciation and amortization expense | 200,738 | 225,297 | 213,783 | ||||||||
General and administrative expenses | 249,646 | 221,753 | 230,496 | ||||||||
Impairment expense | 121,176 | — | — | ||||||||
Operating income (loss) | (203,875 | ) | 30,164 | 206,946 | |||||||
Interest expense, net of amounts capitalized | 54,227 | 55,204 | 53,566 | ||||||||
Other (income) expense, net | 1,009 | (803 | ) | (6,649 | ) | ||||||
Income (loss) from continuing operations before tax | (259,111 | ) | (24,237 | ) | 160,029 | ||||||
Income tax (expense) benefit | 80,483 | 3,064 | (57,352 | ) | |||||||
Income (loss) from continuing operations | (178,628 | ) | (21,173 | ) | 102,677 | ||||||
Loss from discontinued operations, net of tax | — | — | (93,568 | ) | |||||||
Net income (loss) | (178,628 | ) | (21,173 | ) | 9,109 | ||||||
Income attributable to noncontrolling interest | — | 595 | 1,487 | ||||||||
INCOME (LOSS) ATTRIBUTABLE TO KEY | $ | (178,628 | ) | $ | (21,768 | ) | $ | 7,622 | |||
Years Ended December 31, 2014 and 2013
For the year ended December 31, 2014, our operating loss was $203.9 million, compared to operating income of $30.2 million for the year ended December 31, 2013. Loss per share was $1.16 for the year ended December 31, 2014 compared to $0.14 loss per share for the year ended December 31, 2013.
Revenues
Our revenues for the year ended December 31, 2014 decreased $164.3 million, or 10.3%, to $1.4 billion from $1.6 billion for the year ended December 31, 2013, primarily due to overall lower activity in the U.S. as a result of competitive pressure and reduced customer activity. Reduced customer activity in Mexico resulted in reduced revenue in our International segment. See “Segment Operating Results — Years Ended December 31, 2014 and 2013” below for a more detailed discussion of the change in our revenues.
Direct operating expenses
Our direct operating expenses decreased $54.8 million, or 4.9%, to $1.06 billion (74.2% of revenues) for the year ended December 31, 2014, compared to $1.11 billion (70.0% of revenues) for the year ended December 31, 2013 as a result of lower variable costs, such as cost attributable to direct labor and equipment, due to reduced activity levels. See “Segment Operating Results — Years Ended December 31, 2014 and 2013” below for a more detailed discussion of the change in our direct operating expenses.
Depreciation and amortization expense
Depreciation and amortization expense decreased $24.6 million, or 10.9%, to $200.7 million (14.1% of revenues) for the year ended December 31, 2014, compared to $225.3 million (14.2% of revenues) for the year ended December 31, 2013. The decrease is primarily attributable to decreases in capital expenditures and lower amortization related to intangible assets.
28
General and administrative expenses
General and administrative expenses increased $27.9 million, or 12.6%, to $249.6 million (17.5% of revenues) for the year ended December 31, 2014, compared to $221.8 million (13.9% of revenues) for the year ended December 31, 2013. The increase is primarily due to legal expenses related to the FCPA investigation of $41.1 million partially offset by lower compensation costs due to reduced staffing levels.
Impairment expense
During the year ended December 31, 2014, we recorded a $28.7 million impairment of goodwill and other intangibles assets in our Russian business unit, which is included in our International reporting segment, $73.4 million impairment of fixed assets and other intangibles assets at our Fishing and Rental Services segment and a $19.1 million impairment of goodwill impairment of goodwill at our Coiled Tubing segment. No impairments were recorded in 2013.
Interest expense, net of amounts capitalized
Interest expense decreased $1.0 million to $54.2 million (3.8% of revenues), for the year ended December 31, 2014, compared to $55.2 million (3.5% of revenues) for the year ended December 31, 2013. The decrease is primarily related to reduced borrowings under the revolving credit facility for the year ended December 31, 2014 compared to 2013.
Other (income) expense, net
During the year ended December 31, 2014, we recognized other expense, net, of $1.0 million, compared to other income, net, of $0.8 million for the year ended December 31, 2013. Our foreign exchange loss relates to U.S. dollar-denominated transactions in our foreign locations and fluctuations in exchange rates between local currencies and the U.S. dollar. The table below presents comparative detailed information about other (income) expense, net at December 31, 2014 and 2013:
Year Ended December 31, | |||||||
2014 | 2013 | ||||||
(in thousands) | |||||||
Interest income | $ | (82 | ) | $ | (220 | ) | |
Foreign exchange loss | 3,733 | 834 | |||||
Other, net | (2,642 | ) | (1,417 | ) | |||
Total | $ | 1,009 | $ | (803 | ) | ||
Income tax benefit
Our income tax benefit on continuing operations was $80.5 million (31.1% effective rate) on pre-tax loss of $259.1 million for the year ended December 31, 2014, compared to an income tax benefit of $3.1 million (12.6% effective rate) on a pre-tax loss of $24.2 million for the year ended December 31, 2013. Our effective tax rates for such periods differ from the U.S. statutory rate of 35% due to a number of factors, including the mix of profit and loss between domestic and international taxing jurisdictions and the impact of permanent items, such as goodwill impairment expense, that affect book income but do not affect taxable income.
Noncontrolling interest
We have no noncontrolling interest holders in 2014, due to our acquisition of our remaining noncontrolling interest in our joint ventures in 2013. For the year ended December 31, 2013, we allocated $0.6 million associated with the income incurred by our joint ventures to the noncontrolling interest holders of these ventures.
Years Ended December 31, 2013 and 2012
For the year ended December 31, 2013, our operating income was $30.2 million, compared to $206.9 million for the year ended December 31, 2012. Loss per share was $0.14 for the year ended December 31, 2013 compared to $0.05 income per share for the year ended December 31, 2012.
Revenues
Our revenues for the year ended December 31, 2013 decreased $368.4 million, or 18.8%, to $1.59 billion from $1.96 billion for the year ended December 31, 2012, primarily due to lower demand for our rig-based services in oil markets and overall weaker economic conditions affecting both our domestic and international operations. See “Segment Operating Results— Years Ended December 31, 2013 and 2012” below for a more detailed discussion of the change in our revenues.
Direct operating expenses
29
Our direct operating expenses decreased $194.4 million, or 14.9%, to $1.1 billion (70.0% of revenues) for the year ended December 31, 2013, compared to $1.3 billion (66.8% of revenues) for the year ended December 31, 2012. The decrease was a direct result of activity decreases in our business and improved operating efficiencies in our rig-based services and coiled tubing services. The operating efficiencies were partially offset by charges of $6.3 million primarily associated with severance costs, $2.3 million of costs primarily associated with rig mobilizations from the North Region of Mexico to the South Region of Mexico and to other countries, including the U.S., and $1.9 million of lease cancellation fees which caused direct operating expenses as a percentage of revenue to be higher in 2013 than 2012. See “Segment Operating Results — Years Ended
December 31, 2013 and 2012” below for a more detailed discussion of the change in our direct operating expenses.
Depreciation and amortization expense
Depreciation and amortization expense increased $11.5 million, or 5.4%, to $225.3 million (14.2% of revenues) for the year ended December 31, 2013, compared to $213.8 million (10.9% of revenues) for the year ended December 31, 2012. The increase is primarily attributable to the 2013 impact of increased capital expenditures in 2012.
General and administrative expenses
General and administrative expenses decreased $8.7 million, or 3.8%, to $221.8 million (13.9% of revenues) for the year ended December 31, 2013, compared to $230.5 million (11.8% of revenues) for the year ended December 31, 2012. The decrease is primarily related to lower third party consulting fees partially offset by a $2.2 million charge associated with the retirement of an executive recorded during first quarter of 2013 and $2.2 million of expenses primarily associated with severance costs recorded during the second quarter of 2013.
Interest expense, net of amounts capitalized
Interest expense increased $1.6 million to $55.2 million (3.5% of revenues), for the year ended December 31, 2013, compared to $53.6 million (2.7% of revenues) for the year ended December 31, 2012. Interest expense for the year ended December 31, 2013 increased due to the issuance of the additional $200 million aggregate principal amount of 2021 Notes (as defined below) during March 2012.
Other income, net
During the year ended December 31, 2013, we recognized other income, net, of $0.8 million, compared to $6.6 million for the year ended December 31, 2012. Our foreign exchange (gain) loss relates to U.S. dollar-denominated transactions in our foreign locations and fluctuations in exchange rates between local currencies and the U.S. dollar. The table below presents comparative detailed information about other income, net at December 31, 2013 and 2012:
Year Ended December 31, | |||||||
2013 | 2012 | ||||||
(in thousands) | |||||||
Interest income | $ | (220 | ) | $ | (46 | ) | |
Foreign exchange (gain) loss | 834 | (4,726 | ) | ||||
Other, net | (1,417 | ) | (1,877 | ) | |||
Total | $ | (803 | ) | $ | (6,649 | ) | |
Income tax (expense) benefit
Our income tax benefit on continuing operations was $3.1 million (12.6% effective rate) on pre-tax loss of $24.2 million for the year ended December 31, 2013, compared to an income tax expense of $57.4 million (35.8% effective rate) on a pre-tax income of $160.0 million for the year ended December 31, 2012. Our effective tax rates differ from the statutory rate of 35% primarily because of state, local and foreign income taxes, and the tax effects of permanent items attributable to book-tax differences.
Discontinued operations
Our net loss from discontinued operations for the year ended December 31, 2013 was zero compared to $93.6 million for the year ended December 31, 2012. The 2012 loss is related to our Argentina business, which was sold in September 2012. Included in the loss from discontinued operations is a pre-tax loss of $85.8 million, which includes a noncash impairment charge of $41.5 million recorded in the first quarter of 2012, and a write-off of $51.9 million cumulative translation adjustment previously recorded in accumulated other comprehensive loss. For further discussion see “Note 3. Discontinued Operations” in “Item 8. Financial Statements and Supplementary Data.”
Noncontrolling interest
30
For the year ended December 31, 2013, we allocated $0.6 million associated with the income incurred by our joint ventures to the noncontrolling interest holders of these ventures compared to income of $1.5 million for the year ended December 31, 2012. The decrease in income allocated to noncontrolling interest holders is due to our acquisition of our remaining noncontrolling interests in 2013 resulting in less income being allocated to noncontrolling interests holders.
Segment Operating Results
Years Ended December 31, 2014 and 2013
The following table shows operating results for each of our reportable segments for the years ended December 31, 2014 and 2013 (in thousands):
For the year ended December 31, 2014
U.S. Rig Service | Fluid Management Services | Coiled Tubing Services | Fishing and Rental Services | International | Functional Support | Total | |||||||||||||||||||||
Revenues from external customers | $ | 679,045 | $ | 249,589 | $ | 173,364 | $ | 212,598 | $ | 112,740 | $ | — | $ | 1,427,336 | |||||||||||||
Operating expenses | 582,658 | 246,262 | 184,183 | 271,542 | 178,172 | 168,394 | 1,631,211 | ||||||||||||||||||||
Operating income (loss) | 96,387 | 3,327 | (10,819 | ) | (58,944 | ) | (65,432 | ) | (168,394 | ) | (203,875 | ) | |||||||||||||||
For the year ended December 31, 2013
U.S. Rig Service | Fluid Management Services | Coiled Tubing Services | Fishing and Rental Services | International | Functional Support | Total | |||||||||||||||||||||
Revenues from external customers | $ | 673,465 | $ | 271,709 | $ | 193,184 | $ | 238,611 | $ | 214,707 | $ | — | $ | 1,591,676 | |||||||||||||
Operating expenses | 539,907 | 267,671 | 169,757 | 207,302 | 241,364 | 135,511 | 1,561,512 | ||||||||||||||||||||
Operating income (loss) | 133,558 | 4,038 | 23,427 | 31,309 | (26,657 | ) | (135,511 | ) | 30,164 | ||||||||||||||||||
U.S. Rig Services
Revenues for our U.S. Rig Services segment increased $5.6 million, or 0.8%, to $679.0 million for the year ended December 31, 2014, compared to $673.5 million for the year ended December 31, 2013. The increase in revenue is primarily due to an increase in market activity partially offset by a decrease in customer activity in California rig-based services and a decrease in customer spending.
Operating expenses for our U.S. Rig Services segment were $582.7 million during the year ended December 31, 2014, which represented an increase of $42.8 million, or 7.9%, compared to $539.9 million for the year ended December 31, 2013. These expenses increased primarily as a result of an increase in direct labor and repair and maintenance expenses related to an increase in activity.
Fluid Management Services
Revenues for our Fluid Management Services segment decreased $22.1 million, or 8.1%, to $249.6 million for the year ended December 31, 2014, compared to $271.7 million for the year ended December 31, 2013. The decrease in revenue is primarily due to lower activity and decrease in pricing due to competitive pressure.
Operating expenses for our Fluid Management Services segment were $246.3 million during the year ended December 31, 2014, which represented a decrease of $21.4 million, or 8.0%, compared to $267.7 million for the year ended December 31, 2013. The decrease in expenses is primarily related to lower direct labor expenses and fuel costs due to a decrease in activity.
Coiled Tubing Services
Revenues for our Coiled Tubing Services segment decreased $19.8 million, or 10.3%, to $173.4 million for the year ended December 31, 2014, compared to $193.2 million for the year ended December 31, 2013. The decrease in revenue is primarily due to lower activity due to competitive pressure and unscheduled down time events.
Operating expenses for our Coiled Tubing Services segment were $184.2 million during the year ended December 31, 2014, which represented an increase of $14.4 million, or 8.5%, compared to $169.8 million for the year ended December 31, 2013. The increase in expenses is primarily a result of impairment of goodwill partially offset by lower direct labor expenses due to a decrease in activity.
Fishing and Rental Services
31
Revenues for our Fishing and Rental Services segment decreased $26.0 million, or 10.9%, to $212.6 million for the year ended December 31, 2014, compared to $238.6 million for the year ended December 31, 2013. The decrease in revenue is primarily due to lower activity due to competitive pressure.
Operating expenses for our Fishing and Rental Services segment were $271.5 million during the year ended December 31, 2014, which represented an increase of $64.2 million, or 31.0%, compared to $207.3 million for the year ended December 31, 2013. The increase in expenses is primarily a result of the impairment of fixed assets and other intangible assets partially offset by a decrease in depreciation expense.
International
Revenues for our International segment decreased $102.0 million, or 47.5%, to $112.7 million for the year ended December 31, 2014, compared to $214.7 million for the year ended December 31, 2013. The decrease was primarily attributable to lower customer activity in Mexico.
Operating expenses for our International segment decreased $63.2 million, or 26.2%, to $178.2 million for the year ended December 31, 2014, compared to $241.4 million for the year ended December 31, 2013. These expenses decreased as a direct result of lower customer activity and severance costs in Mexico, partially offset by impairment of goodwill and tradenames in our Russian business reporting unit.
Functional support
Operating expenses for our Functional Support segment increased $32.9 million, or 24.3%, to $168.4 million (11.8% of consolidated revenues) for the year ended December 31, 2014 compared to $135.5 million (8.5% of consolidated revenues) for the year ended December 31, 2013. The increase is primarily due to increased legal expense related to the FCPA investigations, partially offset by lower employee compensation and benefit costs.
Years Ended December 31, 2013 and 2012
The following table shows operating results for each of our reportable segments for the years ended December 31, 2013 and 2012 (in thousands):
For the year ended December 31, 2013
U.S. Rig Service | Fluid Management Services | Coiled Tubing Services | Fishing and Rental Services | International | Functional Support | Total | |||||||||||||||||||||
Revenues from external customers | $ | 673,465 | $ | 271,709 | $ | 193,184 | $ | 238,611 | $ | 214,707 | $ | — | $ | 1,591,676 | |||||||||||||
Operating expenses | 539,907 | 267,671 | 169,757 | 207,302 | 241,364 | 135,511 | 1,561,512 | ||||||||||||||||||||
Operating income (loss) | 133,558 | 4,038 | 23,427 | 31,309 | (26,657 | ) | (135,511 | ) | 30,164 | ||||||||||||||||||
For the year ended December 31, 2012
U.S. Rig Service | Fluid Management Services | Coiled Tubing Services | Fishing and Rental Services | International | Functional Support | Total | |||||||||||||||||||||
Revenues from external customers | $ | 788,512 | $ | 353,597 | $ | 215,876 | $ | 268,783 | $ | 333,302 | $ | — | $ | 1,960,070 | |||||||||||||
Operating expenses | 594,217 | 328,033 | 200,747 | 218,430 | 270,310 | 141,387 | 1,753,124 | ||||||||||||||||||||
Operating income (loss) | 194,295 | 25,564 | 15,129 | 50,353 | 62,992 | (141,387 | ) | 206,946 | |||||||||||||||||||
U.S. Rig Services
Revenues for our U.S. Rig Services segment decreased $115.0 million, or 14.6%, to $673.5 million for the year ended December 31, 2013, compared to $788.5 million for the year ended December 31, 2012. The decrease in revenue is primarily related to reduced customer spending, lower activity in natural gas markets and increased competition.
Operating expenses for our U.S. Rig Services segment were $539.9 million during the year ended December 31, 2013, which represented a decrease of $54.3 million, or 9.1%, compared to $594.2 million for the year ended December 31, 2012. The decrease in expenses is primarily as a result of a decrease in direct labor expenses and repair and maintenance expenses directly attributable to lower activity in natural gas markets during the period and improved operating efficiencies.
32
Fluid Management Services
Revenues for our Fluid Management Services segment decreased $81.9 million, or 23.2%, to $271.7 million for the year ended December 31, 2013, compared to $353.6 million for the year ended December 31, 2012. The decrease in revenue is primarily related to reduced customer spending, lower activity in natural gas markets and increased competition.
Operating expenses for our Fluid Management Services segment were $267.7 million during the year ended December 31, 2013, which represented a decrease of $60.4 million, or 18.4%, compared to $328.0 million for the year ended December 31, 2012. The decrease in expenses is primarily as a result of a decrease in direct labor, repair and maintenance, and fuel expenses directly attributable to lower activity in natural gas markets during the period.
Coiled Tubing Services
Revenues for our Coiled Tubing Services decreased $22.7 million, or 10.5%, to $193.2 million for the year ended December 31, 2013, compared to $215.9 million for the year ended December 31, 2012. The decrease in revenue is primarily related to reduced customer spending, lower activity in natural gas markets and increased competition.
Operating expenses for our Coiled Tubing Services segment were $169.8 million during the year ended December 31, 2013, which represented a decrease of $31.0 million, or 15.4%, compared to $200.7 million for the year ended December 31, 2012. The decrease in expenses is primarily as a result of a decrease in direct labor and fuel expenses directly attributable to lower activity in natural gas markets during the period and improved operating efficiencies.
Fishing and Rental Services
Revenues for our Fishing and Rental Services segment decreased $30.2 million, or 11.2%, to $238.6 million for the year ended December 31, 2013, compared to $268.8 million for the year ended December 31, 2012. The decrease in revenue is primarily related to reduced customer spending, lower activity in natural gas markets and increased competition.
Operating expenses for our Fishing and Rental Services segment were $207.3 million during the year ended December 31, 2013, which represented a decrease of $11.1 million, or 5.1%, compared to $218.4 million for the year ended December 31, 2012. The decrease in expenses is primarily as a result of a decrease in direct labor expenses directly attributable to lower activity in natural gas markets during the period.
International
Revenues for our International segment decreased $118.6 million, or 35.6%, to $214.7 million for the year ended December 31, 2013, compared to $333.3 million for the year ended December 31, 2012. The decrease was primarily attributable to lower customer activity in Mexico.
Operating expenses for our International segment decreased $28.9 million, or 10.7%, to $241.4 million for the year ended December 31, 2013, compared to $270.3 million for the year ended December 31, 2012. These expenses decreased as a direct result of lower customer activity in Mexico partially offset by charges of $4.8 million primarily associated with severance costs and $2.1 million of costs associated with rig mobilizations from the North Region of Mexico to the South Region of Mexico and to other countries, including the U.S.
Functional Support
Operating expenses for our Functional Support segment decreased $5.9 million, or 4.2%, to $135.5 million (8.5% of consolidated revenues) for the year ended December 31, 2013 compared to $141.4 million (7.2% of consolidated revenues) for the year ended December 31, 2012. The decrease reflects lower consulting fees partially offset by higher severance costs and incentive bonus and equity based compensation accruals.
Liquidity and Capital Resources
We require capital to fund ongoing operations, including maintenance expenditures on our existing fleet and equipment, organic growth initiatives, investments and acquisitions. Our primary sources of liquidity are cash flows generated from our operations, available cash and borrowings under our senior secured revolving credit facility. We maintain a senior secured credit facility pursuant to a revolving credit agreement with several lenders and JPMorgan Chase Bank, N.A., as Administrative Agent, Bank of America, N.A., as Syndication Agent, and Capital One, N.A., Wells Fargo Bank, N.A., Credit Agricole Corporate and Investment Bank and DnB NOR Bank ASA, as Co-Documentation Agents (as amended on July 27, 2011 and December 5, 2014, our “2011 Credit Facility”). Our 2011 Credit Facility consists of a revolving credit facility, letter of credit sub-facility and swing line facility, up to an aggregate principal amount of $400.0 million, all of which will mature no later than March 31, 2016. We intend to use these sources of liquidity to fund our working capital requirements, capital expenditures, strategic investments and acquisitions.
33
In 2015, we expect to access available funds under our 2011 Credit Facility to meet our cash requirements for day-to-day operations and in times of peak needs throughout the year. Our planned capital expenditures, as well as any acquisitions we choose to pursue, could be financed through a combination of cash on hand, cash flow from operations, borrowings under our 2011 Credit Facility and, in the case of acquisitions, equity. We believe that our internally generated cash flows from operations, current reserves of cash and availability under our 2011 Credit Facility are sufficient to finance our cash requirements for current and future operations, budgeted capital expenditures and debt service for the next twelve months. Under the terms of our 2011 Credit Facility, committed letters of credit count against our borrowing capacity. As of December 31, 2014, we had $70.0 million in borrowings, $50.4 million of letters of credit outstanding with borrowing capacity of $279.6 million available considering covenant constraints under our 2011 Credit Facility.
All obligations under our 2011 Credit Facility are guaranteed by most of our subsidiaries and are secured by most of our assets, including our accounts receivable, inventory and equipment. See further discussion under “Debt Service” below.
As of December 31, 2014, our adjusted working capital (working capital excluding the current portion of long-term debt) was $191.9 million compared to $277.4 million as of December 31, 2013. Our adjusted working capital decreased during 2014 primarily as a result of a decrease in accounts receivable, predominantly in Mexico.
As of December 31, 2014, we had $27.3 million of cash, of which approximately $6.9 million was held in the bank accounts of our foreign subsidiaries. As of December 31, 2014, $0.2 million of the cash held by our foreign subsidiaries was held in U.S. bank accounts and denominated in U.S. dollars. We believe that the cash held by our wholly owned foreign subsidiaries could be repatriated for general corporate use without material withholdings.
Cash Flows
During the year ended December 31, 2014, we generated cash flows from operating activities of $164.2 million, compared to $228.6 million for the year ended December 31, 2013. Operating cash inflows primarily relate to net loss adjusted for non cash items.
Cash used in investing activities was $146.8 million and $160.9 million for years ended December 31, 2014 and 2013, respectively. Investing cash outflows during these periods consisted primarily of capital expenditures. Capital expenditures primarily relate to replacement assets for our existing fleet and equipment. Additionally, during 2013, we completed the acquisition of the remaining 50% noncontrolling interest in Geostream for $14.6 million.
Cash used in financing activities was $22.1 million and $85.5 million during the years ended December 31, 2014 and 2013, respectively. Financing cash outflows primarily relate to net payments on our 2011 Credit Facility.
The following table summarizes our cash flows for the years ended December 31, 2014 and 2013:
Year Ended December 31, | |||||||
2014 | 2013 | ||||||
(in thousands) | |||||||
Net cash provided by operating activities | $ | 164,168 | $ | 228,643 | |||
Cash paid for capital expenditures | (161,639 | ) | (164,137 | ) | |||
Proceeds from sale of fixed assets | 15,844 | 17,256 | |||||
Payment of accrued acquisition cost of the 51% noncontrolling interest in AlMansoori Key Energy Services LLC | (5,100 | ) | — | ||||
Acquisition of the 50% noncontrolling interest in Geostream | — | (14,600 | ) | ||||
Proceeds from notes receivable | 4,055 | 600 | |||||
Repayments of capital lease obligations | — | (393 | ) | ||||
Repayments of long-term debt | (3,573 | ) | — | ||||
Proceeds from borrowings on revolving credit facility | 260,000 | 220,000 | |||||
Repayments on revolving credit facility | (275,000 | ) | (300,000 | ) | |||
Payment of deferred financing costs | — | (69 | ) | ||||
Other financing activities, net | (3,485 | ) | (5,030 | ) | |||
Effect of changes in exchange rates on cash | 3,728 | 87 | |||||
Net decrease in cash and cash equivalents | $ | (1,002 | ) | $ | (17,643 | ) | |
34
Debt Service
At December 31, 2014, our annual maturities on our indebtedness, consisting only of our 2021 Notes and borrowings under our 2011 Credit Facility at year-end, were as follows:
Principal Payments | |||
(in thousands) | |||
2015 | $ | — | |
2016 | 70,000 | ||
2017 | — | ||
2018 | — | ||
2019 and thereafter | 675,000 | ||
Total | $ | 745,000 | |
Interest on $675.0 million of our 2021 Notes is due on March 1 and September 1 of each year. Our 2021 Notes mature on September 1, 2021. Interest paid on our 2014 Notes and 2021 Notes during 2014 and 2013 was $45.6 million and $45.9 million, respectively. We expect to fund interest payments from cash on hand and cash generated by operations.
8.375% Senior Notes due 2014
On November 29, 2007, we issued $425.0 million aggregate principal amount of 2014 Notes. In March of 2011, we repurchased $421.4 million aggregate principal amount of our 2014 Notes. On February 25, 2014, we redeemed the remaining $3.6 million aggregate principal amount and paid $0.1 million accrued interest of 2014 Notes pursuant to the indenture dated as of November 29, 2007 (as supplemented, the “Indenture”). The 2014 Notes were general unsecured senior obligations and were subordinate to all of our existing and future secured indebtedness. The 2014 Notes were jointly and severally guaranteed on a senior unsecured basis by certain of our existing and future domestic subsidiaries. Interest on the 2014 Notes was payable on June 1 and December 1 of each year.
6.75% Senior Notes due 2021
We issued $475.0 million aggregate principal amount of 6.75% Senior Notes due 2021 (the “Initial 2021 Notes”) on March 4, 2011 and issued an additional $200.0 million aggregate principal amount of the 2021 Notes (the “Additional 2021 Notes” and, together with the Initial 2021 Notes, the “2021 Notes”) in a private placement on March 8, 2012 under an indenture dated March 4, 2011 (the “Base Indenture”), as supplemented by a first supplemental indenture dated March 4, 2011 and amended by a further supplemental indenture dated March 8, 2012 (the “Supplemental Indenture” and, together with the Base Indenture, the “Indenture”). We used the net proceeds to repay senior secured indebtedness under our revolving bank credit facility. We capitalized $4.6 million of financing costs associated with the issuance of the 2021 Notes that will be amortized over the term of the notes.
On March 5, 2013, we completed an offer to exchange the $200.0 million in aggregate principal amount of unregistered Additional 2021 Notes for an equal principal amount of such notes registered under the Securities Act of 1933. All of the 2021 Notes are treated as a single class under the Indenture and as of the closing of the exchange offer, bear the same CUSIP and ISIN numbers.
The 2021 Notes are general unsecured senior obligations and are effectively subordinated to all of our existing and future secured indebtedness. The 2021 Notes are or will be jointly and severally guaranteed on a senior unsecured basis by certain of our existing and future domestic subsidiaries.
On or after March 1, 2016, the 2021 Notes will be subject to redemption at any time and from time to time at our option, in whole or in part, at the redemption prices below (expressed as percentages of the principal amount redeemed), plus accrued and unpaid interest to the applicable redemption date, if redeemed during the twelve-month period beginning on March 1 of the years indicated below:
Year | Percentage | |
2016 | 103.375 | % |
2017 | 102.250 | % |
2018 | 101.125 | % |
2019 and thereafter | 100.000 | % |
At any time and from time to time prior to March 1, 2016, we may, at our option, redeem all or a portion of the 2021 Notes at a redemption price equal to 100% of the principal amount plus a premium with respect to the 2021 Notes plus accrued
35
and unpaid interest to the redemption date. The premium is the excess of (i) the present value of the redemption price of 103.375 of the principal amount, plus all remaining scheduled interest payments due through March 1, 2016 discounted at the treasury rate plus 0.50% over (ii) the principal amount of the note. If we experience a change of control, subject to certain exceptions, we must give holders of the 2021 Notes the opportunity to sell to us their 2021 Notes, in whole or in part, at a purchase price equal to 101% of the aggregate principal amount, plus accrued and unpaid interest to the date of purchase.
We are subject to certain negative covenants under the Indenture. The Indenture limits our ability to, among other things:
• | incur additional indebtedness and issue preferred equity interests; |
• | pay dividends or make other distributions or repurchase or redeem equity interests; |
• | make loans and investments; |
• | enter into sale and leaseback transactions; |
• | sell, transfer or otherwise convey assets; |
• | create liens; |
• | enter into transactions with affiliates; |
• | enter into agreements restricting subsidiaries’ ability to pay dividends; |
• | designate future subsidiaries as unrestricted subsidiaries; and |
• | consolidate, merge or sell all or substantially all of the applicable entities’ assets. |
These covenants are subject to certain exceptions and qualifications, and contain cross-default provisions relating to the covenants of our 2011 Credit Facility discussed below. Substantially all of the covenants will terminate before the 2021 Notes mature if one of two specified ratings agencies assigns the 2021 Notes an investment grade rating in the future and no events of default exist under the Indenture. As of December 31, 2014, the 2021 Notes were rated below investment grade. Any covenants that cease to apply to us as a result of achieving an investment grade rating will not be restored, even if the credit rating assigned to the 2021 Notes later falls below investment grade. We were in compliance with all covenants at December 31, 2014.
Senior Secured Credit Facility
On December 5, 2014, we entered into the Second Amendment to Credit Agreement (the “Amendment”) for our $400.0 million senior secured revolving bank credit facility with JPMorgan Chase Bank, N.A., as Administrative Agent, Bank of America, N.A., as Syndication Agent, and Capital One, N.A., Wells Fargo Bank, N.A., Credit Agricole Corporate and Investment Bank and DnB NOR Bank ASA, as Co-Documentation Agent (as amended, our “2011 Credit Facility”), which is an important source of liquidity for us. The Amendment decreased the total commitments by the lenders under the credit facility from $550.0 million to $400.0 million, which will automatically be further reduced from $400.0 million to $350.0 million on July 1, 2015. Among other changes, the Amendment modified the definition of earnings before interest, taxes, depreciation and amortization (as calculated pursuant to the terms of our 2011 Credit Facility, “EBITDA”) to allow for the add back of (i) all expenses incurred during the second and third quarters of 2014 related to the Company’s compliance with the FCPA and (ii) up to $50.0 million of additional expenses incurred in relation to the Company’s FCPA compliance commencing in the fourth quarter of 2014. Our 2011 Credit Facility consists of a revolving credit facility, letter of credit sub-facility and swing line facility, all of which will mature no later than March 31, 2016. The maximum amount that we may borrow under the facility may be subject to limitation due to the operation of the covenants contained in the facility. Our 2011 Credit Facility allows us to request increases in the total commitments under the facility by up to $100.0 million in the aggregate in part or in full anytime during the term of our 2011 Credit Facility, with any such increases being subject to compliance with the restrictive covenants in our 2011 Credit Facility and in the Indenture, as well as lender approval.
We capitalized $4.9 million of financing costs in connection with the execution of our 2011 Credit Facility and an additional $1.4 million related to the first amendment that will be amortized over the term of the debt. The $0.4 million remaining unamortized financing costs related to the first amendment was written off at the time of the second amendment.
Our interest rate per annum applicable to our 2011 Credit Facility is, at our option, (i) adjusted LIBOR plus the applicable margin or (ii) the higher of (x) JPMorgan’s prime rate, (y) the Federal Funds rate plus 0.5% and (z) one-month adjusted LIBOR plus 1.0%, plus in each case the applicable margin for all other loans. The applicable margin for LIBOR loans ranges from 225 to 300 basis points, and the applicable margin for all other loans ranges from 125 to 200 basis points, depending upon our consolidated total leverage ratio as defined in our 2011 Credit Facility. Unused commitment fees on the facility equal 0.5%.
The 2011 Credit Facility contains certain financial covenants, which, among other things, limit our annual capital expenditures, restrict our ability to repurchase shares and require us to maintain certain financial ratios. The financial ratios require that:
• | our ratio of consolidated funded indebtedness to total capitalization be no greater than 55%; |
36
• | our senior secured leverage ratio of senior secured funded debt to trailing four quarters EBITDA be no greater than 2.00 to 1.00; |
• | we maintain a consolidated interest coverage ratio of trailing four quarters EBITDA to interest expense for no less than the ratio specified for such fiscal quarter as indicated in the table below: |
Fiscal Quarter Ending | Ratio |
December 31, 2014 through September 30, 2015 | 2.75 to 1.00 |
December 31, 2015 and thereafter | 3.00 to 1.00 |
• | we maintain a collateral coverage ratio, the ratio of the aggregate book value of the collateral to the amount of the total commitments, as of the last day of any fiscal quarter of at least 2.00 to 1.00; and |
• | we limit our capital expenditures and investments in foreign subsidiaries to $250.0 million per fiscal year, if the consolidated total leverage ratio exceeds 3.00 to 1.00. |
In addition, our 2011 Credit Facility contains certain affirmative and negative covenants, including, without limitation, restrictions on (i) liens; (ii) debt, guarantees and other contingent obligations; (iii) mergers and consolidations; (iv) sales, transfers and other dispositions of property or assets; (v) loans, acquisitions, joint ventures and other investments (with acquisitions permitted so long as, after giving pro forma effect thereto, no default or event of default exists under our 2011 Credit Facility, the pro forma consolidated total leverage ratio does not exceed 4.00 to 1.00, we are in compliance with other financial covenants and we have at least $25.0 million of availability under our 2011 Credit Facility); (vi) dividends and other distributions to, and redemptions and repurchases from, equityholders; (vii) making investments, loans or advances; (viii) selling properties; (ix) prepaying, redeeming or repurchasing subordinated (contractually or structurally) debt; (x) engaging in transactions with affiliates; (xi) entering into hedging arrangements; (xii) entering into sale and leaseback transactions; (xiii) granting negative pledges other than to the lenders; (xiv) changes in the nature of business; (xv) amending organizational documents; and (xvi) changes in accounting policies or reporting practices; in each of the foregoing cases, with certain exceptions.
We were in compliance with these covenants at December 31, 2014. We may prepay our 2011 Credit Facility in whole or in part at any time without premium or penalty, subject to certain reimbursements to the lenders for breakage and redeployment costs. As of December 31, 2014, we had borrowings of $70.0 million under the revolving credit facility, $50.4 million of letters of credit outstanding with borrowing capacity of $279.6 million available considering covenant constraints under our 2011 Credit Facility. For the years ended December 31, 2014 and 2013, the weighted average interest rates on the outstanding borrowings under our 2011 Credit Facility was 2.97% and 2.76%, respectively.
Letter of Credit Facility
On November 7, 2013, we entered into an uncommitted, unsecured $15.0 million letter of credit facility to be used solely for the issuances of performance letters of credit. As of December 31, 2014, $3.0 million of letters of credit were outstanding under the facility.
Off-Balance Sheet Arrangements
At December 31, 2014, we did not, and we currently do not, have any off-balance sheet arrangements that have or are reasonably likely to have a material current or future effect on our financial condition, revenues or expenses, results of operations, liquidity, capital expenditures or capital resources.
37
Contractual Obligations
Set forth below is a summary of our contractual obligations as of December 31, 2014. The obligations we pay in future periods reflect certain assumptions, including variability in interest rates on our variable-rate obligations and the duration of our obligations, and actual payments in future periods may vary.
Payments Due by Period | |||||||||||||||||||
Total | Less than 1 Year (2015) | 1-3 Years (2016-2018) | 4-5 Years (2019-2020) | After 5 Years (2021+) | |||||||||||||||
(in thousands) | |||||||||||||||||||
2021 Notes | 675,000 | — | — | — | 675,000 | ||||||||||||||
Interest associated with 2021 Notes | 300,088 | 45,562 | 136,812 | 91,250 | 26,464 | ||||||||||||||
Borrowings under 2011 Credit Facility | 70,000 | — | 70,000 | — | — | ||||||||||||||
Interest associated with 2011 Credit Facility(1) | 2,746 | 2,198 | 548 | — | — | ||||||||||||||
Commitment and availability fees associated with 2011 Credit Facility | 1,747 | 1,398 | 349 | — | — | ||||||||||||||
Non-cancelable operating leases | 34,917 | 13,960 | 15,888 | 3,736 | 1,333 | ||||||||||||||
Liabilities for uncertain tax positions | 1,004 | 618 | 386 | — | — | ||||||||||||||
Equity based compensation liability awards(2) | 386 | 386 | — | — | — | ||||||||||||||
Total | $ | 1,085,888 | $ | 64,122 | $ | 223,983 | $ | 94,986 | $ | 702,797 | |||||||||
(1) | Based on interest rates in effect at December 31, 2014. |
(2) | Based on our closing stock price at December 31, 2014. |
Debt Compliance
At December 31, 2014, we were in compliance with all the financial covenants under our 2011 Credit Facility and 2021 Notes. Based on management’s current projections, we expect to be in compliance with all the covenants under our 2011 Credit Facility and 2021 Notes for the next twelve months. A breach of any of these covenants, ratios or tests could result in a default under our indebtedness. See “Item 1A. Risk Factors.”
Capital Expenditures
During the year ended December 31, 2014, our capital expenditures totaled $161.6 million, primarily related to the ongoing replacement to our rig service fleet, coiled tubing units, fluid transportation equipment and rental equipment. Our capital expenditure plan for 2015 contemplates spending between $50.0 million and $80.0 million, subject to market conditions. This is primarily related to equipment replacement needs, including ongoing replacement to our rig services fleet. Our capital expenditure program for 2015 is subject to market conditions, including activity levels, commodity prices, industry capacity and specific customer needs. Our focus for 2015 will be the maximization of our current equipment fleet, but we may choose to increase our capital expenditures in 2015 to increase market share or expand our presence into a new market. We currently anticipate funding our 2015 capital expenditures through a combination of cash on hand, operating cash flow, and borrowings under our 2011 Credit Facility. Should our operating cash flows or activity levels prove to be insufficient to warrant our currently planned capital spending levels, management expects it will adjust our capital spending plans accordingly. We may also incur capital expenditures for strategic investments and acquisitions.
Acquisitions
Geostream
On April 9, 2013, we completed the acquisition of the remaining 50% noncontrolling interest in Geostream for $14.6 million. We now own 100% of Geostream.
AlMansoori Key Energy Services, LCC
On August 5, 2013, we agreed to the dissolution of AlMansoori Key Energy Services, LLC, a joint venture formed under the laws of Abu Dhabi, UAE, and the acquisition of the underlying business for $5.1 million. During the fourth quarter of 2014 the joint venture was duly liquidated and the $5.1 million was transferred to AlMansoori.
38
We anticipate that acquisitions of complementary companies, assets and lines of businesses will continue to play an important role in our business strategy. While there are currently no unannounced agreements or ongoing negotiations for the acquisition of any material businesses or assets, such transactions can be effected quickly and may occur at any time.
Critical Accounting Policies
Our Accounting Department is responsible for the development and application of our accounting policies and internal control procedures and reports to the Chief Financial Officer.
The process and preparation of our financial statements in conformity with generally accepted accounting principles in the United States (“GAAP”) requires us to make certain estimates, judgments and assumptions, which may affect the reported amounts of our assets and liabilities, disclosures of contingencies at the balance sheet date, the amounts of revenues and expenses recognized during the reporting period and the presentation of our statement of cash flows. We may record materially different amounts if these estimates, judgments and assumptions change or if actual results differ. However, we analyze our estimates, assumptions and judgments based on our historical experience and various other factors that we believe to be reasonable under the circumstances.
We have identified the following critical accounting policies that require a significant amount of estimation or judgment to accurately present our financial position, results of operations and cash flows:
• | Revenue recognition; |
• | Estimate of reserves for workers’ compensation, vehicular liability and other self-insurance; |
• | Contingencies; |
• | Income taxes; |
• | Estimates of depreciable lives; |
• | Valuation of indefinite-lived intangible assets; |
• | Valuation of tangible and finite-lived intangible assets; and |
• | Valuation of equity-based compensation. |
Revenue Recognition
We recognize revenue when all of the following criteria have been met: (i) evidence of an arrangement exists, (ii) delivery has occurred or services have been rendered, (iii) the price to the customer is fixed and determinable and (iv) collectability is reasonably assured.
• | Evidence of an arrangement exists when a final understanding between us and our customer has occurred, and can be evidenced by a completed customer purchase order, field ticket, supplier contract, or master service agreement. |
• | Delivery has occurred or services have been rendered when we have completed requirements pursuant to the terms of the arrangement as evidenced by a field ticket or service log. |
• | The price to the customer is fixed and determinable when the amount that is required to be paid is agreed upon. Evidence of the price being fixed and determinable is evidenced by contractual terms, our price book, a completed customer purchase order, or a field ticket. |
• | Collectability is reasonably assured when we screen our customers and provide goods and services to customers according to determined credit terms that have been granted in accordance with our credit policy. |
We present our revenues net of any sales taxes collected by us from our customers that are required to be remitted to local or state governmental taxing authorities.
We review our contracts for multiple element revenue arrangements. Deliverables will be separated into units of accounting and assigned fair value if they have standalone value to our customer, have objective and reliable evidence of fair value, and delivery of undelivered items is substantially controlled by us. We believe that the negotiated prices for deliverables in our services contracts are representative of fair value since the acceptance or non-acceptance of each element in the contract does not affect the other elements.
Workers’ Compensation, Vehicular Liability and Other Self-Insurance
The occurrence of an event not fully insured or indemnified against, or the failure of a customer or insurer to meet its indemnification or insurance obligations, could result in substantial losses. In addition, insurance may not be available to cover any or all of these risks, and, if available, we might not be able to obtain such insurance without a substantial increase in premiums. It is possible that, in addition to higher premiums, future insurance coverage may be subject to higher deductibles and coverage restrictions.
We estimate our liability arising out of uninsured and potentially insured events, including workers’ compensation, employer’s liability, vehicular liability, and general liability, and record accruals in our consolidated financial statements.
39
Reserves related to claims are based on the specific facts and circumstances of the insured event and our past experience with similar claims and trend analysis. We adjust loss estimates in the calculation of these accruals based upon actual claim settlements and reported claims. Loss estimates for individual claims are adjusted based upon actual claim judgments, settlements and reported claims. The actual outcome of these claims could differ significantly from estimated amounts. Changes in our assumptions and estimates could potentially have a negative impact on our earnings.
We are largely self-insured against physical damage to our property, rigs, equipment and automobiles due to large deductibles or self-insurance.
Contingencies
We are periodically required to record other loss contingencies, which relate to lawsuits, claims, proceedings and tax-related audits in the normal course of our operations, on our consolidated balance sheet. We record a loss contingency for these matters when it is probable that a liability has been incurred and the amount of the loss can be reasonably estimated. We periodically review our loss contingencies to ensure that we have recorded appropriate liabilities on the balance sheet. We adjust these liabilities based on estimates and judgments made by management with respect to the likely outcome of these matters, including the effect of any applicable insurance coverage for litigation matters. Our estimates and judgments could change based on new information, changes in laws or regulations, changes in management’s plans or intentions, the outcome of legal proceedings, settlements or other factors. Actual results could vary materially from these reserves.
We record liabilities when environmental assessment indicates that site remediation efforts are probable and the costs can be reasonably estimated. We measure environmental liabilities based, in part, on relevant past experience, currently enacted laws and regulations, existing technology, site-specific costs and cost-sharing arrangements. Recognition of any joint and several liability is based upon our best estimate of our final pro-rata share of such liability or the low amount in a range of estimates. These assumptions involve the judgments and estimates of management, and any changes in assumptions or new information could lead to increases or decreases in our ultimate liability, with any such changes recognized immediately in earnings.
We record legal obligations to retire tangible, long-lived assets on our balance sheet as liabilities, which are recorded at a discount when we incur the liability. Significant judgment is involved in estimating our future cash flows associated with such obligations, as well as the ultimate timing of the cash flows. If our estimates on the amount or timing of the cash flows change, the change may have a material impact on our results of operations.
Income Taxes
We account for deferred income taxes using the asset and liability method and provide income taxes for all significant temporary differences. Management determines our current tax liability as well as taxes incurred as a result of current operations, yet deferred until future periods. Current taxes payable represent our liability related to our income tax return for the current year, while net deferred tax expense or benefit represents the change in the balance of deferred tax assets and liabilities reported on our consolidated balance sheets. Management estimates the changes in both deferred tax assets and liabilities using the basis of assets and liabilities for financial reporting purposes and for enacted rates that management estimates will be in effect when the differences reverse. Further, management makes certain assumptions about the timing of temporary tax differences for the differing treatment of certain items for tax and accounting purposes or whether such differences are permanent. The final determination of our tax liability involves the interpretation of local tax laws, tax treaties, and related authorities in each jurisdiction as well as the significant use of estimates and assumptions regarding the scope of future operations and results achieved and the timing and nature of income earned and expenditures incurred.
We establish valuation allowances to reduce deferred tax assets if we determine that it is more likely than not (e.g., a likelihood of more than 50%) that some or all of the deferred tax assets will not be realized in future periods. To assess the likelihood, we use estimates and judgment regarding our future taxable income, as well as the jurisdiction in which this taxable income is generated, to determine whether a valuation allowance is required. Such evidence can include our current financial position, our results of operations, both actual and forecasted results, the reversal of deferred tax liabilities, and tax planning strategies as well as the current and forecasted business economics of our industry. Additionally, we record uncertain tax positions at their net recognizable amount, based on the amount that management deems is more likely than not to be sustained upon ultimate settlement with the tax authorities in the domestic and international tax jurisdictions in which we operate.
If our estimates or assumptions regarding our current and deferred tax items are inaccurate or are modified, these changes could have potentially material negative impacts on our earnings.
Estimates of Depreciable Lives
We use the estimated depreciable lives of our long-lived assets, such as rigs, heavy-duty trucks and trailers, to compute depreciation expense, to estimate future asset retirement obligations and to conduct impairment tests. We base the estimates of our depreciable lives on a number of factors, such as the environment in which the assets operate, industry factors including
40
forecasted prices and competition, and the assumption that we provide the appropriate amount of capital expenditures while the asset is in operation to maintain economical operation of the asset and prevent untimely demise to scrap. The useful lives of our intangible assets are determined by the years over which we expect the assets to generate a benefit based on legal, contractual or other expectations.
We depreciate our operational assets over their depreciable lives to their salvage value, which is generally 10% of the acquisition cost. We recognize a gain or loss upon ultimate disposal of the asset based on the difference between the carrying value of the asset on the disposal date and any proceeds we receive in connection with the disposal.
We periodically analyze our estimates of the depreciable lives of our fixed assets to determine if the depreciable periods and salvage value continue to be appropriate. We also analyze useful lives and salvage value when events or conditions occur that could shorten the remaining depreciable life of the asset. We review the depreciable periods and salvage values for reasonableness, given current conditions. As a result, our depreciation expense is based upon estimates of depreciable lives of the fixed assets, the salvage value and economic factors, all of which require management to make significant judgments and estimates. If we determine that the depreciable lives should be different than originally estimated, depreciation expense may increase or decrease and impairments in the carrying values of our fixed assets may result, which could negatively impact our earnings.
Valuation of Indefinite-Lived Intangible Assets
We periodically review our intangible assets not subject to amortization, including our goodwill, to determine whether an impairment of those assets may exist. These tests must be made on at least an annual basis, or more often if circumstances indicate that the assets may be impaired. These circumstances include, but are not limited to, significant adverse changes in the business climate.
The test for impairment of indefinite-lived intangible assets allows us to first assess the qualitative factors to determine whether it is “more likely than not” that the fair value of a reporting unit is less than its carrying amount as a basis for determining whether it is necessary to perform the two-step goodwill impairment test. If our qualitative analysis shows that it is “more likely than not” that the fair value of a reporting unit is less than its carrying amount we will perform the two-step goodwill impairment test. In the first step, a fair value is calculated for each of our reporting units, and that fair value is compared to the current carrying value of the reporting unit, including the reporting unit’s goodwill. If the fair value of the reporting unit exceeds its carrying value, there is no potential impairment, and the second step is not performed. If the carrying value exceeds the fair value of the reporting unit, then the second step is required.
The second step of the test for impairment compares the implied fair value of the reporting unit’s goodwill to its current carrying value. The implied fair value of the reporting unit’s goodwill is determined in the same manner as the amount of goodwill that would be recognized in a business combination, with the purchase price being equal to the fair value of the reporting unit. If the implied fair value of the reporting unit’s goodwill is in excess of its carrying value, no impairment charge is recorded. If the carrying value of the reporting unit’s goodwill is in excess of its implied fair value, an impairment charge equal to the excess is recorded.
We conducted our annual impairment test for goodwill and other intangible assets not subject to amortization as of October 1, 2014. In determining the fair value of our reporting units, we use a weighted-average approach of three commonly used valuation techniques — a discounted cash flow method, a guideline companies method, and a similar transactions method. We assigned a weight to the results of each of these methods based on the facts and circumstances that are in existence for that testing period. We assigned more weight to the discounted cash flow method as we believe it is more representative of the future of the business.
In addition to the estimates made by management regarding the weighting of the various valuation techniques, the creation of the techniques themselves requires that we make significant estimates and assumptions. The discounted cash flow method, which was assigned the highest weight by management during the current year, requires us to make assumptions about future cash flows, future growth rates, tax rates in future periods, book-tax differences in the carrying value of our assets in future periods, and discount rates. The assumptions about future cash flows and growth rates are based on our current budgets for future periods, as well as our strategic plans, the beliefs of management about future activity levels, and analysts’ expectations about our revenues, profitability and cash flows in future periods. The assumptions about our future tax rates and book-tax differences in the carrying value of our assets in future periods are based on the assumptions about our future cash flows and growth rates, and management’s knowledge of and beliefs about tax law and practice in current and future periods. The assumptions about discount rates include an assessment of the specific risk associated with each reporting unit being tested, and were developed with the assistance of a third-party valuation consultant. The ultimate conclusions of the valuation techniques remain our responsibility.
41
We conducted our most recent annual test for impairment of our goodwill and other indefinite-lived intangible assets as of October 1, 2014. On that date, our reporting units for the purposes of impairment testing were U.S. Rig Services, Fluid Management Services, Coiled Tubing Services, Fishing and Rental Services and our Canadian reporting units. While this test is required on an annual basis, it can also be required more frequently based on changes in external factors or other triggering events. In 2014, we experienced several triggering events that required us to perform additional interim testing for the possible impairment of goodwill, which resulted in the recording of a reduction in value of our goodwill of $41.5 million and indefinite-lived intangible of $9.9 million.
Our goodwill by reporting unit as of December 31, 2014 is as follows (in thousands, except for percentages):
U.S. | |||||||
U.S. Rig Services | $ | 297,719 | 51 | % | |||
Fluid Management Services | 24,479 | 4 | % | ||||
Coiled Tubing Services | 82,695 | 14 | % | ||||
Fishing and Rental Services | 173,463 | 30 | % | ||||
Subtotal | 578,356 | 99 | % | ||||
International | |||||||
Canada | 4,383 | 1 | % | ||||
Subtotal | 4,383 | 1 | % | ||||
Total | $ | 582,739 | 100 | % | |||
We also have intangible assets that are not amortized of $1.5 million and $1.2 million related to our Fishing and Rental Services segment and our Russian reporting unit, respectively. These tradenames are tested for impairment annually using a relief from royalty method.
As noted above, the determination of the fair value of our reporting units is heavily dependent upon certain estimates and assumptions that we make about our reporting units. Changes in those estimates and assumptions could possibly impact the determination of the fair value of our reporting units. Discount rates we use in future periods could change substantially if the cost of debt or equity were to significantly increase or decrease, or if we were to choose different comparable companies in determining the appropriate discount rate for our reporting units. Additionally, our future projected cash flows for our reporting units could significantly impact the fair value of our reporting units, and if our current projections about our future activity levels, pricing, and cost structure are inaccurate, the fair value of our reporting units could change materially. If the current overall economy further declines or if there is a significant and rapid adverse change in our business in the near- or mid-term for any of our reporting units, our current estimates of the fair value of our reporting units could decrease significantly, leading to possible impairment charges in future periods. Based on our current knowledge and beliefs, we do not think that material adverse changes to our current estimates and assumptions such that our reporting units would fail step one of the impairment test are reasonably possible.
Valuation of Tangible and Finite-Lived Intangible Assets
Our fixed assets and finite-lived intangibles are tested for potential impairment when circumstances or events indicate a possible impairment may exist. These circumstances or events are referred to as “trigger events” and examples of such trigger events include, but are not limited to, an adverse change in market conditions, a significant decrease in benefits being derived from an acquired business, a change in the use of an asset, or a significant disposal of a particular asset or asset class.
If a trigger event occurs, an impairment test is performed based on an undiscounted cash flow analysis. To perform an impairment test, we make judgments, estimates and assumptions regarding long-term forecasts of revenues and expenses relating to the assets subject to review. Market conditions, energy prices, estimated depreciable lives of the assets, discount rate assumptions and legal factors impact our operations and have a significant effect on the estimates we use to determine whether our assets are impaired. If the results of the analysis indicate that the carrying value of the assets being tested for impairment are not recoverable, then we record an impairment charge to write the carrying value of the assets down to their fair value. Using different judgments, assumptions or estimates, we could potentially arrive at a materially different fair value for the assets being tested for impairment, which may result in an impairment charge.
We identified triggering events in 2014 that resulted in the recording of a reduction in value of fixed assets of $62.1 million and finite-lived intangibles of $7.7 million in our Fishing and Rental Services segment. We did not identify any trigger events causing us to test our tangible and finite-lived intangible assets for impairment during the years ended December 31, 2013 or 2012.
42
Valuation of Equity-Based Compensation
We have granted stock options, stock-settled stock appreciation rights (“SARs”), restricted stock (“RSAs” and “RSUs”), phantom shares and performance units to our employees and non-employee directors. The option and SAR awards we grant are fair valued using a Black-Scholes option model on the grant date and are amortized to compensation expense over the vesting period of the option or SAR award, net of estimated and actual forfeitures. Compensation related to RSAs and RSUs is based on the fair value of the award on the grant date and is recognized based on the vesting requirements that have been satisfied during the period. Phantom shares are accounted for at fair value, and changes in the fair value of these awards are recorded as compensation expense during the period. Performance units provide a cash incentive award, the unit value of which is determined with reference to our common stock. See “Note 19. Share Based Compensation” in “Item 8. Financial Statements and Supplementary Data” for a more detailed discussion of performance units measurement.
In utilizing the Black-Scholes option pricing model to determine fair values of awards, certain assumptions are made which are based on subjective expectations, and are subject to change. A change in one or more of these assumptions would impact the expense associated with future grants. These key assumptions include the volatility in the price of our common stock, the risk-free interest rate and the expected life of awards. We did not grant any stock options during the years ended December 31, 2014, 2013 and 2012.
Accounting Standards Adopted or Not Yet Adopted in this Report
There are no new accounting standards that have been adopted in this report.
ASU 2014-09. In May 2014, the FASB issued ASU 2014-09, Revenue from Contracts with Customers (Topic 606). The objective of this ASU is to establish the principles to report useful information to users of financial statements about the nature, amount, timing, and uncertainty of revenue from contracts with customers. The core principle is to recognize revenue to depict the transfer of promised goods or services to customers in an amount that reflects the consideration to which the entity expects to be entitled in exchange for those goods or services. ASU 2014-09 is effective for interim and annual reporting periods beginning after December 15, 2016 and must be adopted using either a full retrospective method or a modified retrospective method. We are currently evaluating the standard to determine the impact of its adoption on the consolidated financial statements.
ITEM 7A. QUANTITATIVE AND QUALITATIVE DISCLOSURES ABOUT MARKET RISK
We are exposed to certain market risks as part of our ongoing business operations, including risks from changes in interest rates, foreign currency exchange rates and equity prices that could impact our financial position, results of operations and cash flows. We manage our exposure to these risks through regular operating and financing activities, and may, on a limited basis, use derivative financial instruments to manage this risk. Derivative financial instruments were not used in the years ended December 31, 2014, 2013 and 2012. To the extent that we use such derivative financial instruments, we will use them only as risk management tools and not for speculative investment purposes.
Interest Rate Risk
As of December 31, 2014, we had outstanding $675.0 million of 2021 Notes. These notes are fixed-rate obligations, and as such do not subject us to risks associated with changes in interest rates. Borrowings under our 2011 Credit Facility bear interest at variable interest rates, and therefore expose us to interest rate risk. As of December 31, 2014, the weighted average interest rate on our outstanding variable-rate debt obligations was 3.14%. A hypothetical 10% increase in that rate would increase the annual interest expense on those instruments by $0.2 million.
Foreign Currency Risk
As of December 31, 2014, we conduct operations in Mexico, Colombia, Ecuador, the Middle East and Russia. We also have a Canadian subsidiary. As of December 31, 2011, the functional currency for Mexico, Russia and Canada was the local currency and the functional currency for Colombia and the Middle East was the U. S. dollar. Due to significant changes in economic facts and circumstances, the functional currency for Mexico and Canada was changed to the U.S. dollar effective January 1, 2012. For balances denominated in our Russian subsidiaries’ local currency, changes in the value of their assets and liabilities due to changes in exchange rates are deferred and accumulated in other comprehensive income until we liquidate our investment. Our Russian foreign subsidiaries must remeasure their account balances at the end of each period to an equivalent amount of U.S. dollars, with changes reflected in earnings during the period. A hypothetical 10% decrease in the average value of the U.S. dollar relative to the value of the local currency for our Russian subsidiaries would increase our net income by $0.4 million.
43
ITEM 8. FINANCIAL STATEMENTS AND SUPPLEMENTARY DATA
Key Energy Services, Inc. and Subsidiaries
INDEX TO CONSOLIDATED FINANCIAL STATEMENTS
Page | |
44
REPORT OF INDEPENDENT REGISTERED PUBLIC ACCOUNTING FIRM
Board of Directors and Stockholders
Key Energy Services, Inc.
We have audited the accompanying consolidated balance sheets of Key Energy Services, Inc. (a Maryland corporation) and subsidiaries (the “Company”) as of December 31, 2014 and 2013, and the related consolidated statements of operations, comprehensive income (loss), changes in shareholders' equity, and cash flows for each of the three years in the period ended December 31, 2014. These financial statements are the responsibility of the Company's management. Our responsibility is to express an opinion on these financial statements based on our audits.
We conducted our audits in accordance with the standards of the Public Company Accounting Oversight Board (United States). Those standards require that we plan and perform the audit to obtain reasonable assurance about whether the financial statements are free of material misstatement. An audit includes examining, on a test basis, evidence supporting the amounts and disclosures in the financial statements. An audit also includes assessing the accounting principles used and significant estimates made by management, as well as evaluating the overall financial statement presentation. We believe that our audits provide a reasonable basis for our opinion.
In our opinion, the consolidated financial statements referred to above present fairly, in all material respects, the financial position of Key Energy Services, Inc. and subsidiaries as of December 31, 2014 and 2013, and the results of their operations and their cash flows for each of the three years in the period ended December 31, 2014 in conformity with accounting principles generally accepted in the United States of America.
We also have audited, in accordance with the standards of the Public Company Accounting Oversight Board (United States), the Company's internal control over financial reporting as of December 31, 2014, based on criteria established in the 2013 Internal Control-Integrated Framework issued by the Committee of Sponsoring Organizations of the Treadway Commission (COSO), and our report dated February 24, 2015 expressed an unqualified opinion on the effectiveness of internal control over financial reporting.
/s/ GRANT THORNTON LLP
Houston, Texas
February 24, 2015
45
REPORT OF INDEPENDENT REGISTERED PUBLIC ACCOUNTING FIRM
Board of Directors and Stockholders
Key Energy Services, Inc.
We have audited the internal control over financial reporting of Key Energy Services, Inc. (a Maryland corporation) and subsidiaries (the “Company”) as of December 31, 2014, based on criteria established in the 2013 Internal Control-Integrated Framework issued by the Committee of Sponsoring Organizations of the Treadway Commission (COSO). The Company's management is responsible for maintaining effective internal control over financial reporting and for its assessment of the effectiveness of internal control over financial reporting, included in the accompanying Management's Report on Internal Control Over Financial Reporting. Our responsibility is to express an opinion on the Company's internal control over financial reporting based on our audit.
We conducted our audit in accordance with the standards of the Public Company Accounting Oversight Board (United States). Those standards require that we plan and perform the audit to obtain reasonable assurance about whether effective internal control over financial reporting was maintained in all material respects. Our audit included obtaining an understanding of internal control over financial reporting, assessing the risk that a material weakness exists, testing and evaluating the design and operating effectiveness of internal control based on the assessed risk, and performing such other procedures as we considered necessary in the circumstances. We believe that our audit provides a reasonable basis for our opinion.
A company's internal control over financial reporting is a process designed to provide reasonable assurance regarding the reliability of financial reporting and the preparation of financial statements for external purposes in accordance with generally accepted accounting principles. A company's internal control over financial reporting includes those policies and procedures that (1) pertain to the maintenance of records that, in reasonable detail, accurately and fairly reflect the transactions and dispositions of the assets of the company; (2) provide reasonable assurance that transactions are recorded as necessary to permit preparation of financial statements in accordance with generally accepted accounting principles, and that receipts and expenditures of the company are being made only in accordance with authorizations of management and directors of the company; and (3) provide reasonable assurance regarding prevention or timely detection of unauthorized acquisition, use, or disposition of the company's assets that could have a material effect on the financial statements.
Because of its inherent limitations, internal control over financial reporting may not prevent or detect misstatements. Also, projections of any evaluation of effectiveness to future periods are subject to the risk that controls may become inadequate because of changes in conditions, or that the degree of compliance with the policies or procedures may deteriorate.
In our opinion, the Company maintained, in all material respects, effective internal control over financial reporting as of December 31, 2014, based on criteria established in the 2013 Internal Control-Integrated Framework issued by COSO.
We also have audited, in accordance with the standards of the Public Company Accounting Oversight Board (United States), the consolidated financial statements of the Company as of and for the year ended December 31, 2014, and our report dated February 24, 2015 expressed an unqualified opinion on those financial statements.
/s/ GRANT THORNTON LLP
Houston, Texas
February 24, 2015
46
Key Energy Services, Inc. and Subsidiaries
CONSOLIDATED BALANCE SHEETS
December 31, | |||||||
2014 | 2013 | ||||||
(in thousands, except share amounts) | |||||||
ASSETS | |||||||
Current assets: | |||||||
Cash and cash equivalents | $ | 27,304 | $ | 28,306 | |||
Accounts receivable, net of allowance for doubtful accounts of $2,925 and $766 | 289,466 | 348,966 | |||||
Inventories | 30,171 | 32,335 | |||||
Other current assets | 86,854 | 96,546 | |||||
Total current assets | 433,795 | 506,153 | |||||
Property and equipment, gross | 2,555,515 | 2,606,738 | |||||
Accumulated depreciation | (1,320,257 | ) | (1,241,092 | ) | |||
Property and equipment, net | 1,235,258 | 1,365,646 | |||||
Goodwill | 582,739 | 624,875 | |||||
Other intangible assets, net | 14,500 | 41,146 | |||||
Deferred financing costs, net | 10,735 | 13,897 | |||||
Other assets | 56,471 | 35,753 | |||||
TOTAL ASSETS | $ | 2,333,498 | $ | 2,587,470 | |||
LIABILITIES AND EQUITY | |||||||
Current liabilities: | |||||||
Accounts payable | $ | 77,631 | $ | 58,826 | |||
Other current liabilities | 164,227 | 169,945 | |||||
Current portion of long-term debt | — | 3,573 | |||||
Total current liabilities | 241,858 | 232,344 | |||||
Long-term debt | 748,426 | 763,981 | |||||
Workers’ compensation, vehicular and health insurance liabilities | 29,690 | 29,944 | |||||
Deferred tax liabilities | 228,394 | 284,453 | |||||
Other non-current liabilities | 27,067 | 25,655 | |||||
Commitments and contingencies | |||||||
Equity: | |||||||
Common stock, $0.10 par value; 200,000,000 shares authorized, 153,557,108 and 152,331,006 shares issued and outstanding | 15,356 | 15,233 | |||||
Additional paid-in capital | 960,647 | 953,306 | |||||
Accumulated other comprehensive loss | (37,280 | ) | (15,414 | ) | |||
Retained earnings | 119,340 | 297,968 | |||||
Total equity | 1,058,063 | 1,251,093 | |||||
TOTAL LIABILITIES AND EQUITY | $ | 2,333,498 | $ | 2,587,470 | |||
See the accompanying notes which are an integral part of these consolidated financial statements
47
Key Energy Services, Inc. and Subsidiaries
CONSOLIDATED STATEMENTS OF OPERATIONS
Year Ended December 31, | |||||||||||
2014 | 2013 | 2012 | |||||||||
(in thousands, except per share amounts) | |||||||||||
REVENUES | $ | 1,427,336 | $ | 1,591,676 | $ | 1,960,070 | |||||
COSTS AND EXPENSES: | |||||||||||
Direct operating expenses | 1,059,651 | 1,114,462 | 1,308,845 | ||||||||
Depreciation and amortization expense | 200,738 | 225,297 | 213,783 | ||||||||
General and administrative expenses | 249,646 | 221,753 | 230,496 | ||||||||
Impairment expense | 121,176 | — | — | ||||||||
Operating income (loss) | (203,875 | ) | 30,164 | 206,946 | |||||||
Interest expense, net of amounts capitalized | 54,227 | 55,204 | 53,566 | ||||||||
Other (income) loss, net | 1,009 | (803 | ) | (6,649 | ) | ||||||
Income (loss) from continuing operations before tax | (259,111 | ) | (24,237 | ) | 160,029 | ||||||
Income tax (expense) benefit | 80,483 | 3,064 | (57,352 | ) | |||||||
Income (loss) from continuing operations | (178,628 | ) | (21,173 | ) | 102,677 | ||||||
Loss from discontinued operations, net of tax | — | — | (93,568 | ) | |||||||
Net income (loss) | (178,628 | ) | (21,173 | ) | 9,109 | ||||||
Income attributable to noncontrolling interest | — | 595 | 1,487 | ||||||||
INCOME (LOSS) ATTRIBUTABLE TO KEY | $ | (178,628 | ) | $ | (21,768 | ) | $ | 7,622 | |||
Earnings (loss) per share from continuing operations attributable to Key: | |||||||||||
Basic and diluted | $ | (1.16 | ) | $ | (0.14 | ) | $ | 0.67 | |||
Loss per share from discontinued operations: | |||||||||||
Basic and diluted | $ | — | $ | — | $ | (0.62 | ) | ||||
Earnings (loss) per share attributable to Key: | |||||||||||
Basic and diluted | $ | (1.16 | ) | $ | (0.14 | ) | $ | 0.05 | |||
Income (loss) from continuing operations attributable to Key: | |||||||||||
Income (loss) from continuing operations | $ | (178,628 | ) | $ | (21,173 | ) | $ | 102,677 | |||
Income attributable to noncontrolling interest | — | 595 | 1,487 | ||||||||
Income (loss) from continuing operations attributable to Key | $ | (178,628 | ) | $ | (21,768 | ) | $ | 101,190 | |||
Weighted Average Shares Outstanding: | |||||||||||
Basic | 153,371 | 152,271 | 151,106 | ||||||||
Diluted | 153,371 | 152,271 | 151,125 | ||||||||
See the accompanying notes which are an integral part of these consolidated financial statements
48
Key Energy Services, Inc. and Subsidiaries
CONSOLIDATED STATEMENTS OF COMPREHENSIVE INCOME (LOSS)
Year Ended December 31, | |||||||||||
2014 | 2013 | 2012 | |||||||||
(in thousands) | |||||||||||
INCOME (LOSS) FROM CONTINUING OPERATIONS | $ | (178,628 | ) | $ | (21,173 | ) | $ | 102,677 | |||
Other comprehensive income (loss): | |||||||||||
Foreign currency translation income (loss), net of tax | (21,866 | ) | (5,607 | ) | 1,933 | ||||||
Reclassification adjustment for sales of foreign subsidiaries | — | — | 51,892 | ||||||||
Total other comprehensive income (loss) | (21,866 | ) | (5,607 | ) | 53,825 | ||||||
COMPREHENSIVE INCOME (LOSS) FROM CONTINUING OPERATIONS, NET OF TAX | (200,494 | ) | (26,780 | ) | 156,502 | ||||||
Comprehensive loss from discontinued operations | — | — | (93,568 | ) | |||||||
COMPREHENSIVE INCOME (LOSS) | (200,494 | ) | (26,780 | ) | 62,934 | ||||||
Comprehensive (income) loss attributable to noncontrolling interest | — | 96 | (3,229 | ) | |||||||
COMPREHENSIVE INCOME (LOSS) ATTRIBUTABLE TO KEY | $ | (200,494 | ) | $ | (26,684 | ) | $ | 59,705 | |||
See the accompanying notes which are an integral part of these consolidated financial statements
49
Key Energy Services, Inc. and Subsidiaries
CONSOLIDATED STATEMENTS OF CASH FLOWS
Year Ended December 31, | |||||||||||
2014 | 2013 | 2012 | |||||||||
(in thousands) | |||||||||||
CASH FLOWS FROM OPERATING ACTIVITIES: | |||||||||||
Net income (loss) | $ | (178,628 | ) | $ | (21,173 | ) | $ | 9,109 | |||
Adjustments to reconcile net income (loss) to net cash provided by operating activities: | |||||||||||
Depreciation and amortization expense | 200,738 | 225,297 | 213,783 | ||||||||
Impairment expense | 121,176 | — | 84,732 | ||||||||
Bad debt expense | 2,710 | 634 | 1,299 | ||||||||
Accretion of asset retirement obligations | 605 | 604 | 594 | ||||||||
(Income) loss from equity method investments | (25 | ) | 447 | 926 | |||||||
Amortization and write-off of deferred financing costs and premium on debt | 2,606 | 2,244 | 2,664 | ||||||||
Deferred income tax expense (benefit) | (82,922 | ) | (11,929 | ) | 35,998 | ||||||
Capitalized interest | — | (607 | ) | (1,314 | ) | ||||||
(Gain) loss on disposal of assets, net | 8,686 | (2,972 | ) | 1,661 | |||||||
Share-based compensation | 10,949 | 13,785 | 13,306 | ||||||||
Excess tax expense (benefit) from share-based compensation | 1,240 | 1,848 | (4,085 | ) | |||||||
Changes in working capital: | |||||||||||
Accounts receivable | 54,024 | 54,003 | (15,409 | ) | |||||||
Other current assets | (2,471 | ) | 5,915 | (42,558 | ) | ||||||
Accounts payable and accrued liabilities | 15,114 | (82,318 | ) | 60,665 | |||||||
Share-based compensation liability awards | (846 | ) | 954 | 1,555 | |||||||
Other assets and liabilities | 11,212 | 41,911 | 6,734 | ||||||||
Net cash provided by operating activities | 164,168 | 228,643 | 369,660 | ||||||||
CASH FLOWS FROM INVESTING ACTIVITIES: | |||||||||||
Capital expenditures | (161,639 | ) | (164,137 | ) | (447,160 | ) | |||||
Proceeds from sale of fixed assets | 15,844 | 17,256 | 17,127 | ||||||||
Proceeds from sale of assets held for sale | — | — | 2,000 | ||||||||
Payment of accrued acquisition cost of the 51% noncontrolling interest in AlMansoori Key Energy Services LLC | (5,100 | ) | — | — | |||||||
Acquisition of the 50% noncontrolling interest in Geostream | — | (14,600 | ) | — | |||||||
Proceeds from notes receivable | 4,055 | 600 | — | ||||||||
Investment in Wilayat Key Energy, LLC | — | — | (676 | ) | |||||||
Net cash used in investing activities | (146,840 | ) | (160,881 | ) | (428,709 | ) | |||||
CASH FLOWS FROM FINANCING ACTIVITIES: | |||||||||||
Repayments of long-term debt | (3,573 | ) | — | — | |||||||
Proceeds from long-term debt | — | — | 205,000 | ||||||||
Repayments of capital lease obligations | — | (393 | ) | (1,959 | ) | ||||||
Proceeds from borrowings on revolving credit facility | 260,000 | 220,000 | 275,000 | ||||||||
Repayments on revolving credit facility | (275,000 | ) | (300,000 | ) | (405,000 | ) | |||||
Payment of deferred financing costs | — | (69 | ) | (4,597 | ) | ||||||
Repurchases of common stock | (2,245 | ) | (3,196 | ) | (7,519 | ) | |||||
Proceeds from exercise of stock options and warrants | — | 14 | 901 | ||||||||
Excess tax (expense) benefit from share-based compensation | (1,240 | ) | (1,848 | ) | 4,085 | ||||||
Other financing activities | — | — | 8,035 | ||||||||
Net cash provided by (used in) financing activities | (22,058 | ) | (85,492 | ) | 73,946 | ||||||
Effect of changes in exchange rates on cash | 3,728 | 87 | (4,391 | ) | |||||||
Net increase (decrease) in cash and cash equivalents | (1,002 | ) | (17,643 | ) | 10,506 | ||||||
Cash and cash equivalents, beginning of period | 28,306 | 45,949 | 35,443 | ||||||||
Cash and cash equivalents, end of period | $ | 27,304 | $ | 28,306 | $ | 45,949 | |||||
See the accompanying notes which are an integral part of these consolidated financial statements
50
Key Energy Services, Inc. and Subsidiaries
CONSOLIDATED STATEMENTS OF STOCKHOLDERS’ EQUITY
COMMON STOCKHOLDERS | Noncontrolling Interest | Total | ||||||||||||||||||||||||
Common Stock | Additional Paid-in Capital | Accumulated Other Comprehensive Loss | Retained Earnings | |||||||||||||||||||||||
Number of Shares | Amount at par | |||||||||||||||||||||||||
(in thousands, except per share data) | ||||||||||||||||||||||||||
BALANCE AT DECEMBER 31, 2011 | 150,733 | $ | 15,073 | $ | 915,400 | $ | (58,231 | ) | $ | 312,114 | $ | 30,275 | $ | 1,214,631 | ||||||||||||
Foreign currency translation | — | — | — | 191 | — | 1,742 | 1,933 | |||||||||||||||||||
Foreign currency impact on sale of Argentina (Note 3) | — | — | — | 51,892 | — | — | 51,892 | |||||||||||||||||||
Common stock purchases | (483 | ) | (48 | ) | (7,471 | ) | — | — | — | (7,519 | ) | |||||||||||||||
Exercise of stock options and warrants | 100 | 10 | 891 | — | — | — | 901 | |||||||||||||||||||
Share-based compensation | 788 | 80 | 13,226 | — | — | — | 13,306 | |||||||||||||||||||
Tax benefit from share-based compensation | — | — | 4,085 | — | — | — | 4,085 | |||||||||||||||||||
Shares surrendered | (68 | ) | (7 | ) | (999 | ) | — | — | — | (1,006 | ) | |||||||||||||||
Net income | — | — | — | — | 7,622 | 1,487 | 9,109 | |||||||||||||||||||
BALANCE AT DECEMBER 31, 2012 | 151,070 | 15,108 | 925,132 | (6,148 | ) | 319,736 | 33,504 | 1,287,332 | ||||||||||||||||||
Foreign currency translation | — | — | — | (4,916 | ) | — | (691 | ) | (5,607 | ) | ||||||||||||||||
Common stock purchases | (416 | ) | (42 | ) | (3,154 | ) | — | — | — | (3,196 | ) | |||||||||||||||
Exercise of stock options | 4 | — | 14 | — | — | — | 14 | |||||||||||||||||||
Share-based compensation | 1,673 | 167 | 13,618 | — | — | — | 13,785 | |||||||||||||||||||
Tax benefit from share-based compensation | — | — | (1,848 | ) | — | — | — | (1,848 | ) | |||||||||||||||||
Acquisition of the 50% noncontrolling interest in Geostream (Note 2) | — | — | 22,432 | (4,350 | ) | — | (31,196 | ) | (13,114 | ) | ||||||||||||||||
Acquisition of the 51% noncontrolling interest in AlMansoori Key Energy Services, LLC (Note 2) | — | — | (2,888 | ) | — | — | (2,212 | ) | (5,100 | ) | ||||||||||||||||
Net income (loss) | — | — | — | — | (21,768 | ) | 595 | (21,173 | ) | |||||||||||||||||
BALANCE AT DECEMBER 31, 2013 | 152,331 | 15,233 | 953,306 | (15,414 | ) | 297,968 | — | 1,251,093 | ||||||||||||||||||
Foreign currency translation | — | — | — | (21,866 | ) | — | — | (21,866 | ) | |||||||||||||||||
Common stock purchases | (291 | ) | (29 | ) | (2,216 | ) | — | — | — | (2,245 | ) | |||||||||||||||
Share-based compensation | 1,517 | 152 | 10,797 | — | — | — | 10,949 | |||||||||||||||||||
Tax expense from share-based compensation | — | — | (1,240 | ) | — | — | — | (1,240 | ) | |||||||||||||||||
Net loss | — | — | — | — | (178,628 | ) | — | (178,628 | ) | |||||||||||||||||
BALANCE AT DECEMBER 31, 2014 | 153,557 | $ | 15,356 | $ | 960,647 | $ | (37,280 | ) | $ | 119,340 | $ | — | $ | 1,058,063 | ||||||||||||
See the accompanying notes which are an integral part of these consolidated financial statements
51
Key Energy Services, Inc. and Subsidiaries
NOTES TO CONSOLIDATED FINANCIAL STATEMENTS
NOTE 1. ORGANIZATION AND SUMMARY OF SIGNIFICANT ACCOUNTING POLICIES
Key Energy Services, Inc., and its wholly owned subsidiaries (collectively, “Key,” the “Company,” “we,” “us” and “our”) provide a full range of well services to major oil companies, foreign national oil companies and independent oil and natural gas production companies. Our services include rig-based and coiled tubing-based well maintenance and workover services, well completion and recompletion services, fluid management services, fishing and rental services and other ancillary oilfield services. Additionally, certain of our rigs are capable of specialty drilling applications. We operate in most major oil and natural gas producing regions of the continental United States, and we have operations in Mexico, Colombia, Ecuador, the Middle East and Russia. In addition, we have a technology development and control systems business based in Canada.
Basis of Presentation
The consolidated financial statements included in this Annual Report on Form 10-K present our financial position, results of operations and cash flows for the periods presented in accordance with generally accepted accounting principles in the United States (“GAAP”).
The preparation of these consolidated financial statements requires us to develop estimates and to make assumptions that affect our financial position, results of operations and cash flows. These estimates also impact the nature and extent of our disclosure, if any, of our contingent liabilities. Among other things, we use estimates to (i) analyze assets for possible impairment, (ii) determine depreciable lives for our assets, (iii) assess future tax exposure and realization of deferred tax assets, (iv) determine amounts to accrue for contingencies, (v) value tangible and intangible assets, (vi) assess workers’ compensation, vehicular liability, self-insured risk accruals and other insurance reserves, (vii) provide allowances for our uncollectible accounts receivable, (viii) value our asset retirement obligations, and (ix) value our equity-based compensation. We review all significant estimates on a recurring basis and record the effect of any necessary adjustments prior to publication of our financial statements. Adjustments made with respect to the use of estimates relate to improved information not previously available. Because of the limitations inherent in this process, our actual results may differ materially from these estimates. We believe that our estimates are reasonable.
We have evaluated events occurring after the balance sheet date included in this Annual Report on Form 10-K for possible disclosure as a subsequent event. Management monitored for subsequent events through the date that these financial statements were issued.
We revised our reportable business segments effective in the fourth quarter of 2014, and in connection with the revision, we have revised disclosures for the corresponding items of segment information for the years ended December 31, 2013 and 2012. The revised reportable segments are U.S. Rig Services, Fluid Management Services, Coiled Tubing Services, Fishing and Rental Services and International. We also have a “Functional Support” segment associated with overhead costs in support of our reportable segments. We revised our segments to reflect changes in management’s resource allocation and performance assessment in making decisions regarding our business. Our U.S. Rig Services, Fluid Management Services, Coiled Tubing Services, Fishing and Rental Services operate geographically within the United States. The International reportable segment includes our operations in Mexico, Colombia, Ecuador, Russia, Bahrain and Oman. Our Canadian subsidiary is also reflected in our International reportable segment. These changes reflect our current operating focus in compliance with Accounting Standards Codification (“ASC”) No. 280, Segment Reporting (“ASC 280”). These presentation changes did not impact our consolidated net income, earnings per share, total current assets, total assets or total stockholders’ equity.
On February 17, 2012, the Company announced its decision to sell its business and operations in Argentina (the “Argentina business”) and on September 14, 2012 completed the sale of the Argentina business. In accordance with applicable accounting requirements and guidance, the Company has reclassified and presented the Argentina business as a discontinued operation for the 2012 period.
Principles of Consolidation
Within our consolidated financial statements, we include our accounts and the accounts of our majority-owned or controlled subsidiaries. We eliminate intercompany accounts and transactions. When we have an interest in an entity for which we do not have significant control or influence, we account for that interest using the cost method. When we have an interest in an entity and can exert significant influence but not control, we account for that interest using the equity method.
52
Key Energy Services, Inc. and Subsidiaries
NOTES TO CONSOLIDATED FINANCIAL STATEMENTS — (Continued)
Acquisitions
From time to time, we acquire businesses or assets that are consistent with our long-term growth strategy. Results of operations for acquisitions are included in our financial statements beginning on the date of acquisition and are accounted for using the acquisition method. For all business combinations (whether partial, full or in stages), the acquirer records 100% of all assets and liabilities of the acquired business, including goodwill, at their fair values; including contingent consideration. Final valuations of assets and liabilities are obtained and recorded as soon as practicable no later than one year from the date of the acquisition.
Revenue Recognition
We recognize revenue when all of the following criteria have been met: (i) evidence of an arrangement exists, (ii) delivery has occurred or services have been rendered, (iii) the price to the customer is fixed and determinable and (iv) collectability is reasonably assured.
• | Evidence of an arrangement exists when a final understanding between us and our customer has occurred, and can be evidenced by a completed customer purchase order, field ticket, supplier contract, or master service agreement. |
• | Delivery has occurred or services have been rendered when we have completed requirements pursuant to the terms of the arrangement as evidenced by a field ticket or service log. |
• | The price to the customer is fixed and determinable when the amount that is required to be paid is agreed upon. Evidence of the price being fixed and determinable is evidenced by contractual terms, our price book, a completed customer purchase order, or a field ticket. |
• | Collectability is reasonably assured when we screen our customers and provide goods and services to customers according to determined credit terms that have been granted in accordance with our credit policy. |
We present our revenues net of any sales taxes collected by us from our customers that are required to be remitted to local or state governmental taxing authorities.
We review our contracts for multiple element revenue arrangements. Deliverables will be separated into units of accounting and assigned fair value if they have standalone value to our customer, have objective and reliable evidence of fair value, and delivery of undelivered items is substantially controlled by us. We believe that the negotiated prices for deliverables in our services contracts are representative of fair value since the acceptance or non-acceptance of each element in the contract does not affect the other elements.
Cash and Cash Equivalents
We consider short-term investments with an original maturity of less than three months to be cash equivalents. At December 31, 2014, we have not entered into any compensating balance arrangements, but all of our obligations under our 2011 Credit Facility (as defined below) with a syndicate of banks of which JPMorgan Chase Bank, N.A. is the administrative agent were secured by most of our assets, including assets held by our subsidiaries, which includes our cash and cash equivalents. We restrict investment of cash to financial institutions with high credit standing and limit the amount of credit exposure to any one financial institution.
We maintain our cash in bank deposit and brokerage accounts which exceed federally insured limits. As of December 31, 2014, accounts were guaranteed by the Federal Deposit Insurance Corporation (“FDIC”) up to $250,000 and substantially all of our accounts held deposits in excess of the FDIC limits.
We believe that the cash held by our other foreign subsidiaries could be repatriated for general corporate use without material withholdings. From time to time and in the normal course of business in connection with our operations or ongoing legal matters, we are required to place certain amounts of our cash in deposit accounts with restrictions that limit our ability to withdraw those funds.
Certain of our cash accounts are zero-balance controlled disbursement accounts that do not have right of offset against our other cash balances. We present the outstanding checks written against these zero-balance accounts as a component of accounts payable in the accompanying consolidated balance sheets.
Accounts Receivable and Allowance for Doubtful Accounts
We establish provisions for losses on accounts receivable if we determine that there is a possibility that we will not collect all or part of the outstanding balances. We regularly review accounts over 150 days past due from the invoice date for collectability and establish or adjust our allowance as necessary using the specific identification method. If we exhaust all collection efforts and determine that the balance will never be collected, we write off the accounts receivable and the associated provision for uncollectible accounts.
53
Key Energy Services, Inc. and Subsidiaries
NOTES TO CONSOLIDATED FINANCIAL STATEMENTS — (Continued)
From time to time we are entitled to proceeds under our insurance policies for amounts that we have reserved in our self-insurance liability. We present these insurance receivables gross on our balance sheet as a component of other assets, separate from the corresponding liability.
Concentration of Credit Risk and Significant Customers
Our customers include major oil and natural gas production companies, independent oil and natural gas production companies, and foreign national oil and natural gas production companies. We perform ongoing credit evaluations of our customers and usually do not require material collateral. We maintain reserves for potential credit losses when necessary. Our results of operations and financial position should be considered in light of the fluctuations in demand experienced by oilfield service companies as changes in oil and gas producers’ expenditures and budgets occur. These fluctuations can impact our results of operations and financial position as supply and demand factors directly affect utilization and hours which are the primary determinants of our net cash provided by operating activities.
During the years ended December 31, 2014 and December 31, 2013, Chevron Texaco Exploration and Production accounted for approximately 15% of our consolidated revenue. During the year ended December 31, 2012, Pemex and Occidental Petroleum Corporation accounted for approximately 12% and 10% of our consolidated revenue, respectively. No other customer accounted for more than 10% of our consolidated revenue in 2014, 2013 or 2012.
Receivables outstanding from Pemex were approximately 19% of our total accounts receivable as of December 31, 2013. No other customer accounted for more than 10% of our total accounts receivable as of December 31, 2014 and 2013.
Inventories
Inventories, which consist primarily of equipment parts and spares for use in our operations and supplies held for consumption, are valued at the lower of average cost or market.
Property and Equipment
Property and equipment are carried at cost less accumulated depreciation. Depreciation is provided for our assets over the estimated depreciable lives of the assets using the straight-line method. Depreciation expense for the years ended December 31, 2014, 2013 and 2012 was $191.9 million, $206.2 million and $190.5 million, respectively. We depreciate our operational assets over their depreciable lives to their salvage value, which is a value higher than the assets’ value as scrap. Salvage value approximates 10% of an operational asset’s acquisition cost. When an operational asset is stacked or taken out of service, we review its physical condition, depreciable life and ultimate salvage value to determine if the asset is operable and whether the remaining depreciable life and salvage value should be adjusted. When we scrap an asset, we accelerate the depreciation of the asset down to its salvage value. When we dispose of an asset, a gain or loss is recognized.
As of December 31, 2014, the estimated useful lives of our asset classes are as follows:
Description | Years |
Well service rigs and components | 3-15 |
Oilfield trucks, vehicles and related equipment | 4-7 |
Fishing and rental tools, coiled tubing units and equipment, tubulars and pressure control equipment | 3-10 |
Disposal wells | 15 |
Furniture and equipment | 3-7 |
Buildings and improvements | 15-30 |
From time to time, we lease certain of our operating assets under capital lease obligations whose terms run from 55 to 60 months. These assets are depreciated over their estimated useful lives or the term of the capital lease obligation, whichever is shorter.
54
Key Energy Services, Inc. and Subsidiaries
NOTES TO CONSOLIDATED FINANCIAL STATEMENTS — (Continued)
A long-lived asset or asset group should be tested for recoverability whenever events or changes in circumstances indicate that its carrying amount may not be recoverable. For purposes of testing for impairment, we group our long-lived assets along our lines of business based on the services provided, which is the lowest level for which identifiable cash flows are largely independent of the cash flows of other assets and liabilities. We would record an impairment charge, reducing the net carrying value to an estimated fair value, if the asset group’s estimated future cash flows were less than its net carrying value. Events or changes in circumstance that cause us to evaluate our fixed assets for recoverability and possible impairment may include changes in market conditions, such as adverse movements in the prices of oil and natural gas, or changes of an asset group, such as its expected future life, intended use or physical condition, which could reduce the fair value of certain of our property and equipment. The development of future cash flows and the determination of fair value for an asset group involves significant judgment and estimates. We identified a triggering event in the third quarter of 2014 that resulted in a recording of a reduction in value of fixed assets of $62.1 million in our Fishing and Rental Services segment. We did not identify any trigger events causing us to test our tangible and finite-lived intangible assets for impairment during the years ended December 31, 2013 or 2012. See “Note 8. Property and Equipment,” for further discussion.
Asset Retirement Obligations
We recognize a liability for the fair value of all legal obligations associated with the retirement of tangible long-lived assets and capitalize an equal amount as a cost of the asset. We depreciate the additional cost over the estimated useful life of the assets. Our obligations to perform our asset retirement activities are unconditional, despite the uncertainties that may exist surrounding an individual retirement activity. Accordingly, we recognize a liability for the fair value of a conditional asset retirement obligation if the fair value can be reasonably estimated. In determining the fair value, we examine the inputs that we believe a market participant would use if we were to transfer the liability. We probability-weight the potential costs a third-party would charge, adjust the cost for inflation for the estimated life of the asset, and discount this cost using our credit adjusted risk free rate. Significant judgment is involved in estimating future cash flows associated with such obligations, as well as the ultimate timing of those cash flows. If our estimates of the amount or timing of the cash flows change, such changes may have a material impact on our results of operations. See “Note 11. Asset Retirement Obligations.”
Deposits
Due to capacity constraints on equipment manufacturers, we have been required to make advanced payments for certain oilfield service equipment and other items used in the normal course of business. As of December 31, 2014 and December 31, 2013, deposits totaled $10.1 million and $1.5 million, respectively. Deposits consist primarily of payments made related to high demand long-lead time items.
Capitalized Interest
Interest is capitalized on the average amount of accumulated expenditures for major capital projects under construction using an effective interest rate based on related debt until the underlying assets are placed into service. The capitalized interest is added to the cost of the assets and amortized to depreciation expense over the useful life of the assets, and is included in the depreciation and amortization line in the accompanying consolidated statements of operations.
Deferred Financing Costs
Deferred financing costs associated with long-term debt are carried at cost and are amortized to interest expense using the effective interest method over the life of the related debt instrument. When the related debt instrument is retired, any remaining unamortized costs are included in the determination of the gain or loss on the extinguishment of the debt. We record gains and losses from the extinguishment of debt as a part of continuing operations. See “Note 14. Long-term Debt,” for further discussion.
Goodwill and Other Intangible Assets
Goodwill results from business combinations and represents the excess of the acquisition consideration over the fair value of the net assets acquired. Goodwill and other intangible assets not subject to amortization are tested for impairment annually or more frequently if events or changes in circumstances indicate that the asset might be impaired.
The test for impairment of indefinite-lived intangible assets allows us to first assess the qualitative factors to determine whether it is “more likely than not” that the fair value of a reporting unit is less than its carrying amount as a basis for determining whether it is necessary to perform the two-step goodwill impairment test. If our qualitative analysis shows that it is “more likely than not” that the fair value of a reporting unit is less than its carrying amount we will perform the two-step goodwill impairment test. In the first step of the test, a fair value is calculated for each of our reporting units, and that fair value is compared to the carrying value of the reporting unit, including the reporting unit’s goodwill. If the fair value of the reporting
55
Key Energy Services, Inc. and Subsidiaries
NOTES TO CONSOLIDATED FINANCIAL STATEMENTS — (Continued)
unit exceeds its carrying value, there is no impairment, and the second step of the test is not performed. If the carrying value exceeds the fair value for the reporting unit, then the second step of the test is required.
The second step of the test compares the implied fair value of the reporting unit’s goodwill to its carrying value. The implied fair value of the reporting unit’s goodwill is determined in the same manner as the amount of goodwill recognized in a business combination, with the purchase price being equal to the fair value of the reporting unit. If the implied fair value of the reporting unit’s goodwill is in excess of its carrying value, no impairment is recorded. If the carrying value is in excess of the implied fair value, an impairment equal to the excess is recorded.
To assist management in the preparation and analysis of the valuation of our reporting units, we utilize the services of a third-party valuation consultant. The ultimate conclusions of the valuation techniques remain our sole responsibility. The determination of the fair value used in the test is heavily impacted by the market prices of our equity and debt securities, as well as the assumptions and estimates about our future activity levels, profitability and cash flows.
We conduct our annual impairment test as of October 1 of each year. While this test is required on an annual basis, it can also be required more frequently based on changes in external factors or other triggering events. In 2014, we experienced several triggering events that required us to perform additional interim testing for the possible impairment of goodwill, which resulted in the recording of a reduction in value of our goodwill of $41.5 million and other intangible assets of $17.6 million. See “Note 9. Goodwill and Other Intangible Assets,” for further discussion.
Internal-Use Software
We capitalize costs incurred during the application development stage of internal-use software and amortize these costs over the software’s estimated useful life, generally five to seven years. Costs incurred related to selection or maintenance of internal-use software are expensed as incurred.
Litigation
When estimating our liabilities related to litigation, we take into account all available facts and circumstances in order to determine whether a loss is probable and reasonably estimable.
Various suits and claims arising in the ordinary course of business are pending against us. We conduct business throughout the continental United States and may be subject to jury verdicts or arbitrations that result in outcomes in favor of the plaintiffs. We are also exposed to various claims abroad. We continually assess our contingent liabilities, including potential litigation liabilities, as well as the adequacy of our accruals and our need for the disclosure of these items. We establish a provision for a contingent liability when it is probable that a liability has been incurred and the amount is reasonably estimable. See “Note 15. Commitments and Contingencies.”
Environmental
Our operations routinely involve the storage, handling, transport and disposal of bulk waste materials, some of which contain oil, contaminants, and regulated substances. These operations are subject to various federal, state and local laws and regulations intended to protect the environment. Environmental expenditures are expensed or capitalized depending on their future economic benefit. Expenditures that relate to an existing condition caused by past operations and that have no future economic benefits are expensed. We record liabilities on an undiscounted basis when our remediation efforts are probable and the costs to conduct such remediation efforts can be reasonably estimated. While our litigation reserves reflect the application of our insurance coverage, our environmental reserves do not reflect management’s assessment of the insurance coverage that may apply to the matters at issue. See “Note 15. Commitments and Contingencies.”
Self-Insurance
We are largely self-insured against physical damage to our equipment and automobiles as well as workers’ compensation claims. The accruals that we maintain on our consolidated balance sheet relate to these deductibles and self-insured retentions, which we estimate through the use of historical claims data and trend analysis. To assist management with the liability amount for our self-insurance reserves, we utilize the services of a third party actuary. The actual outcome of any claim could differ significantly from estimated amounts. We adjust loss estimates in the calculation of these accruals, based upon actual claim settlements and reported claims. See “Note 15. Commitments and Contingencies.”
Income Taxes
We account for deferred income taxes using the asset and liability method and provide income taxes for all significant temporary differences. Management determines our current tax liability as well as taxes incurred as a result of current operations, but which are deferred until future periods. Current taxes payable represent our liability related to our income tax
56
Key Energy Services, Inc. and Subsidiaries
NOTES TO CONSOLIDATED FINANCIAL STATEMENTS — (Continued)
returns for the current year, while net deferred tax expense or benefit represents the change in the balance of deferred tax assets and liabilities reported on our consolidated balance sheets. Management estimates the changes in both deferred tax assets and liabilities using the basis of assets and liabilities for financial reporting purposes and for enacted rates that management estimates will be in effect when the differences reverse. Further, management makes certain assumptions about the timing of temporary tax differences for the differing treatments of certain items for tax and accounting purposes or whether such differences are permanent. The final determination of our tax liability involves the interpretation of local tax laws, tax treaties, and related authorities in each jurisdiction as well as the significant use of estimates and assumptions regarding the scope of future operations and results achieved and the timing and nature of income earned and expenditures incurred.
We establish valuation allowances to reduce deferred tax assets if we determine that it is more likely than not (e.g., a likelihood of more than 50%) that some portion or all of the deferred tax assets will not be realized in future periods. To assess the likelihood, we use estimates and judgment regarding our future taxable income, as well as the jurisdiction in which this taxable income is generated, to determine whether a valuation allowance is required. Such evidence can include our current financial position, our results of operations, both actual and forecasted results, the reversal of deferred tax liabilities, and tax planning strategies as well as the current and forecasted business economics of our industry. Additionally, we record uncertain tax positions at their net recognizable amount, based on the amount that management deems is more likely than not to be sustained upon ultimate settlement with the tax authorities in the domestic and international tax jurisdictions in which we operate. See “Note 13. Income Taxes” for further discussion of accounting for income taxes, changes in our valuation allowance, components of our tax rate reconciliation and realization of loss carryforwards.
Earnings Per Share
Basic earnings per common share is determined by dividing net earnings applicable to common stock by the weighted average number of common shares actually outstanding during the period. Diluted earnings per common share is based on the increased number of shares that would be outstanding assuming conversion of dilutive outstanding convertible securities using the treasury stock and “as if converted” methods. See “Note 10. Earnings Per Share.”
Share-Based Compensation
In the past, we have issued stock options, shares of restricted common stock, restricted stock units, stock appreciation rights (“SARs”), phantom shares and performance units to our employees as part of those employees’ compensation and as a retention tool. For our options, restricted shares and SARs, we calculate the fair value of the awards on the grant date and amortize that fair value to compensation expense ratably over the vesting period of the award, net of estimated and actual forfeitures. The fair value of our stock option and SAR awards are estimated using a Black-Scholes fair value model. The valuation of our stock options and SARs requires us to estimate the expected term of award, which we estimated using the simplified method, as we did not have sufficient historical exercise information because of past legal restrictions on the exercise of our stock options. Additionally, the valuation of our stock option and SARs awards is also dependent on our historical stock price volatility, which we calculate using a lookback period equivalent to the expected term of the award, a risk-free interest rate, and an estimate of future forfeitures. The grant-date fair value of our restricted stock awards is determined using our stock price on the grant date. Our phantom shares and performance units are treated as “liability” awards and carried at fair value at each balance sheet date, with changes in fair value recorded as a component of compensation expense and an offsetting liability on our consolidated balance sheet. We record share-based compensation as a component of general and administrative and direct operating expense for the applicable individual. See “Note 19. Share-Based Compensation.”
Foreign Currency Gains and Losses
With respect to our operations in Russia, where the local currency is the functional currency, assets and liabilities are translated at the rates of exchange on the balance sheet date, while income and expense items are translated at average rates of exchange during the period. The resulting gains or losses arising from the translation of accounts from the functional currency to the U.S. dollar are included as a separate component of stockholders’ equity in other comprehensive income until a partial or complete sale or liquidation of our net investment in the foreign entity. As of December 31, 2011, the functional currency for Mexico, Russia and Canada was the local currency and the functional currency for Colombia and the Middle East was the U. S. dollar. Due to significant changes in economic facts and circumstances, the functional currency for Mexico and Canada was changed to the U.S. dollar effective January 1, 2012. See “Note 16. Accumulated Other Comprehensive Loss.”
From time to time our foreign subsidiaries may enter into transactions that are denominated in currencies other than their functional currency. These transactions are initially recorded in the functional currency of that subsidiary based on the applicable exchange rate in effect on the date of the transaction. At the end of each month, these transactions are remeasured to an equivalent amount of the functional currency based on the applicable exchange rates in effect at that time. Any adjustment
57
Key Energy Services, Inc. and Subsidiaries
NOTES TO CONSOLIDATED FINANCIAL STATEMENTS — (Continued)
required to remeasure a transaction to the equivalent amount of the functional currency at the end of the month is recorded in the income or loss of the foreign subsidiary as a component of other income, net.
Comprehensive Income
We display comprehensive income (loss) and its components in our financial statements, and we classify items of comprehensive income by their nature in our financial statements and display the accumulated balance of other comprehensive income separately in our stockholders’ equity.
Leases
We lease real property and equipment through various leasing arrangements. When we enter into a leasing arrangement, we analyze the terms of the arrangement to determine whether the lease should be accounted for as an operating lease or a capital lease.
We periodically incur costs to improve the assets that we lease under these arrangements. If the value of the leasehold improvements exceeds our threshold for capitalization, we record the improvement as a component of our property and equipment and amortize the improvement over the useful life of the improvement or the lease term, whichever is shorter.
Certain of our operating lease agreements are structured to include scheduled and specified rent increases over the term of the lease agreement. These increases may be the result of an inducement or “rent holiday” conveyed to us early in the lease, or are included to reflect the anticipated effects of inflation. We recognize scheduled and specified rent increases on a straight-line basis over the term of the lease agreement. In addition, certain of our operating lease agreements contain incentives to induce us to enter into the lease agreement, such as up-front cash payments to us, payment by the lessor of our costs, such as moving expenses, or the assumption by the lessor of our pre-existing lease agreements with third parties. Any payments made to us or on our behalf represent incentives that we consider to be a reduction of our rent expense, and are recognized on a straight-line basis over the term of the lease agreement.
Accounting Standards Adopted or Not Yet Adopted in this Report
There are no new accounting standards that have been adopted in this report.
ASU 2014-09. In May 2014, the FASB issued ASU 2014-09, Revenue from Contracts with Customers (Topic 606). The objective of this ASU is to establish the principles to report useful information to users of financial statements about the nature, amount, timing, and uncertainty of revenue from contracts with customers. The core principle is to recognize revenue to depict the transfer of promised goods or services to customers in an amount that reflects the consideration to which the entity expects to be entitled in exchange for those goods or services. ASU 2014-09 is effective for interim and annual reporting periods beginning after December 15, 2016 and must be adopted using either a full retrospective method or a modified retrospective method. We are currently evaluating the standard to determine the impact of its adoption on the consolidated financial statements.
NOTE 2. ACQUISITIONS
2013 Acquisition of Noncontrolling Interests
Geostream. On October 31, 2008, we acquired a 26% interest in OOO Geostream Services Group (“Geostream”) for $17.4 million. Geostream is a limited liability company incorporated in the Russian Federation that provides a wide range of drilling, workover and reservoir engineering services. On September 1, 2009, we acquired an additional 24% interest for $16.4 million, which brought our total investment in Geostream to 50% and provided us a controlling interest with representation on Geostream's board of directors. We accounted for the second investment as a business combination achieved in stages. The results of Geostream have been included in our consolidated financial statements since the initial acquisition date, with the portion outside of our control forming a noncontrolling interest. On April 9, 2013, we completed the acquisition of the 50% noncontrolling interest in Geostream for $14.6 million. Geostream is now our wholly owned subsidiary. This acquisition of the 50% noncontrolling interest was accounted for as an equity transaction. Therefore, our acquisition of the noncontrolling interest in Geostream in the second quarter of 2013 did not result in a gain or loss.
AlMansoori Key Energy Services, LLC. On March 7, 2010, we entered into an agreement with AlMansoori Petroleum Services, LLC (“AlMansoori”) to form the joint venture AlMansoori Key Energy Services, LLC, a joint venture under the laws of Abu Dhabi, UAE. The purpose of the joint venture was to engage in conventional workover and drilling services, coiled tubing services, fishing and rental services, rig monitoring services, pipe handling services and fluids, waste treatment and handling services. Although AlMansoori held a 51% interest in the joint venture and we held a 49% interest, we held three of the five board of directors seats and a controlling financial interest. In addition, profits and losses of the joint venture were
58
Key Energy Services, Inc. and Subsidiaries
NOTES TO CONSOLIDATED FINANCIAL STATEMENTS — (Continued)
shared on equal terms and in equal amounts with AlMansoori. Because the joint venture did not have sufficient resources to carry on its activities without our financial support, we determined it to be a variable interest entity of which we were the primary beneficiary. We consolidated the entity in our financial statements. On August 5, 2013, we agreed to the dissolution of AlMansoori Key Energy Services, LLC (the “Joint Venture”) and the acquisition of the underlying business for $5.1 million. The acquisition of the 51% noncontrolling interest in AlMansoori Key Energy Services, LLC was accounted for as an equity transaction and therefore did not result in a gain or loss. During the fourth quarter the Joint Venture was formally liquidated and $5.1 million was transferred to AlMansoori.
NOTE 3. DISCONTINUED OPERATIONS
In September 2012, we completed the sale of our Argentina operations for approximately $12.5 million, net of transaction costs. The $12.5 million net proceeds from the sale of Argentina operations included $2.0 million received in cash and the balance in notes receivable which was comprised of non-interest bearing notes. These notes are included in "other current assets" in our condensed consolidated balance sheets.
In connection with the sale, we recognized a total loss of $85.8 million, which includes the noncash impairment charge of $41.5 million recorded in the first quarter of 2012, and a write-off of $51.9 million cumulative translation adjustment previously recorded in accumulated other comprehensive loss during the third quarter of 2012. We are reporting the results of our Argentina operations in discontinued operations for 2012.
The following table presents the results of operations for the Argentina business sold in this transaction for the year ended December 31, 2012 (in thousands):
REVENUES | $ | 75,815 | |
COSTS AND EXPENSES: | |||
Direct operating expenses | 72,664 | ||
Depreciation and amortization expense | 143 | ||
General and administrative expenses | 11,232 | ||
Asset retirements and impairments | 85,755 | ||
Operating loss | (93,979 | ) | |
Interest expense, net of amounts capitalized | 168 | ||
Other expense, net | 3,725 | ||
Loss before taxes | (97,872 | ) | |
Income tax benefit | 4,304 | ||
Net loss | $ | (93,568 | ) |
NOTE 4. SEVERANCE, CONTRACT TERMINATION AND MOBILIZATION COSTS
In the second quarter of 2013, we implemented a significant restructuring of our Fluid Management Services and our corporate cost structure to better align them with current market conditions. As a result of this restructuring, we recognized approximately $6.3 million of severance expenses in the second quarter of 2013. The severance costs were based on obligations under our existing severance agreements. Furthermore, we recognized lease cancellation fees of $1.9 million primarily related to our Fluid Management Services. Additionally, in our international business, due to customer spending reductions in Mexico, we began redeploying idle rigs from the North Region of Mexico to higher demand markets, incurring mobilization cost of $2.3 million. These costs are reflected in our consolidated statements of operations and include $8.3 million of direct operating expenses and $2.2 million of general and administrative expenses. On a segment basis, $7.2 million, $2.3 million, $0.3 million and $0.7 million is associated with our International, Fluid Management Services, U.S. Rig Services and Functional Support segments, respectively. The restructuring activities were implemented in the second quarter of 2013 and were completed in the fourth quarter of 2013.
59
Key Energy Services, Inc. and Subsidiaries
NOTES TO CONSOLIDATED FINANCIAL STATEMENTS — (Continued)
NOTE 5. OTHER BALANCE SHEET INFORMATION
The table below presents comparative detailed information about other current assets at December 31, 2014 and 2013:
December 31, 2014 | December 31, 2013 | ||||||
(in thousands) | |||||||
Other current assets: | |||||||
Current deferred tax assets | $ | 11,823 | $ | 11,707 | |||
Prepaid current assets | 28,218 | 28,435 | |||||
Reinsurance receivable | 9,200 | 9,113 | |||||
VAT asset | 18,889 | 21,683 | |||||
Other | 18,724 | 25,608 | |||||
Total | $ | 86,854 | $ | 96,546 | |||
The table below presents comparative detailed information about other non-current assets at December 31, 2014 and 2013:
December 31, 2014 | December 31, 2013 | ||||||
(in thousands) | |||||||
Other non-current assets: | |||||||
Deferred tax assets | $ | 35,238 | $ | 22,313 | |||
Reinsurance receivable | 9,537 | 9,397 | |||||
Deposits | 10,125 | 1,533 | |||||
Equity method investments | 987 | 962 | |||||
Other | 584 | 1,548 | |||||
Total | $ | 56,471 | $ | 35,753 | |||
The table below presents comparative detailed information about other current liabilities at December 31, 2014 and 2013:
December 31, 2014 | December 31, 2013 | ||||||
(in thousands) | |||||||
Other current liabilities: | |||||||
Accrued payroll, taxes and employee benefits | $ | 32,477 | $ | 34,956 | |||
Accrued operating expenditures | 45,899 | 36,573 | |||||
Income, sales, use and other taxes | 25,892 | 37,064 | |||||
Self-insurance reserves | 31,359 | 32,129 | |||||
Accrued interest | 15,241 | 15,285 | |||||
Accrued insurance premiums | 7,515 | 8,049 | |||||
Other | 5,844 | 5,889 | |||||
Total | $ | 164,227 | $ | 169,945 | |||
60
Key Energy Services, Inc. and Subsidiaries
NOTES TO CONSOLIDATED FINANCIAL STATEMENTS — (Continued)
The table below presents comparative detailed information about other non-current liabilities at December 31, 2014 and 2013:
December 31, 2014 | December 31, 2013 | ||||||
(in thousands) | |||||||
Other non-current accrued liabilities: | |||||||
Asset retirement obligations | $ | 12,525 | $ | 11,999 | |||
Environmental liabilities | 5,730 | 6,176 | |||||
Accrued rent | 263 | 853 | |||||
Accrued sales, use and other taxes | 5,411 | 5,552 | |||||
Other | 3,138 | 1,075 | |||||
Total | $ | 27,067 | $ | 25,655 | |||
NOTE 6. OTHER EXPENSE (INCOME), NET
The table below presents comparative detailed information about our other income and expense from continuing operations for the years ended December 31, 2014, 2013 and 2012:
Year Ended December 31, | |||||||||||
2014 | 2013 | 2012 | |||||||||
(in thousands) | |||||||||||
Interest income | $ | (82 | ) | $ | (220 | ) | $ | (46 | ) | ||
Foreign exchange (gain) loss | 3,733 | 834 | (4,726 | ) | |||||||
Other, net | (2,642 | ) | (1,417 | ) | (1,877 | ) | |||||
Total | $ | 1,009 | $ | (803 | ) | $ | (6,649 | ) | |||
NOTE 7. ALLOWANCE FOR DOUBTFUL ACCOUNTS
The table below presents a rollforward of our allowance for doubtful accounts for the years ended December 31, 2014, 2013 and 2012:
Additions | |||||||||||||||||||
Balance at Beginning of Period | Charged to Expense | Charged to Other Accounts | Deductions | Balance at End of Period | |||||||||||||||
(in thousands) | |||||||||||||||||||
As of December 31, 2014 | $ | 766 | $ | 2,710 | $ | — | $ | (551 | ) | $ | 2,925 | ||||||||
As of December 31, 2013 | 2,860 | 634 | — | (2,728 | ) | 766 | |||||||||||||
As of December 31, 2012 | 8,013 | 1,299 | 6 | (6,458 | ) | 2,860 | |||||||||||||
61
Key Energy Services, Inc. and Subsidiaries
NOTES TO CONSOLIDATED FINANCIAL STATEMENTS — (Continued)
NOTE 8. PROPERTY AND EQUIPMENT
Property and equipment consists of the following:
December 31, | |||||||
2014 | 2013 | ||||||
(in thousands) | |||||||
Major classes of property and equipment: | |||||||
Oilfield service equipment | $ | 1,927,353 | $ | 1,960,208 | |||
Disposal wells | 88,465 | 87,681 | |||||
Motor vehicles | 288,523 | 304,244 | |||||
Furniture and equipment | 132,617 | 122,218 | |||||
Buildings and land | 91,553 | 86,085 | |||||
Work in progress | 27,004 | 46,302 | |||||
Gross property and equipment | 2,555,515 | 2,606,738 | |||||
Accumulated depreciation | (1,320,257 | ) | (1,241,092 | ) | |||
Net property and equipment | $ | 1,235,258 | $ | 1,365,646 | |||
Interest is capitalized on the average amount of accumulated expenditures for major capital projects under construction using an effective interest rate based on related debt until the underlying assets are placed into service. Capitalized interest for the years ended December 31, 2014, 2013 and 2012 was zero, $0.6 million, and $1.3 million, respectively. As of December 31, 2014 and 2013, we have no capital lease obligations.
Depreciation of assets held under capital leases was zero, $1.9 million, and $2.8 million for the years ended December 31, 2014, 2013 and 2012, respectively, and is included in depreciation and amortization expense in the accompanying consolidated statements of operations.
The decline in market value of our common stock in comparison to the carrying value of our assets during the third quarter of 2014 was determined to be a triggering event. This triggering event required us to perform step one of the goodwill impairment test to identify potential impairment. Our step one testing indicated potential impairment in our Fishing and Rental Services segment which required us to perform step two of the goodwill impairment test to determine the amount of impairment, if any. Our preliminary step two testing performed during the third quarter of 2014, using a discounted cash flow model to determine fair value, concluded that certain assets, primarily frac stack and well testing assets, were impaired. As a result, we recorded an estimated pre-tax charge of $60.8 million in the third quarter of 2014. Our preliminary step two testing also indicated no impairment of goodwill in our Fishing and Rental Services segment. During the fourth quarter of 2014 we finalized our step two testing, preliminarily performed in the third quarter of 2014, based on additional analysis performed by outside consultants. As a result, we recorded an additional pre-tax asset impairment charge of $1.3 million in the fourth quarter of 2014.
During the fourth quarter the market value of our stock continued to decline and we determined it was necessary to perform the first step of the goodwill impairment test for our U.S. Rig Services, Coiled Tubing Services, Fishing and Rental Services and Fluid Management Services segments. The results of our step one analysis indicated potential impairment in our Coiled Tubing Services segment. Step two of the goodwill impairment testing for the Coiled Tubing Services segment was performed preliminarily during the fourth quarter of 2014 and our analysis concluded that that there was no impairment of goodwill. In addition, our analysis concluded that there was no impairment of fixed assets. Step two testing for our Coiled Tubing Services segment will be concluded in the first quarter of 2015 and any adjustment to the amount recorded, which could differ materially, will be recorded in the first quarter of 2015. There were no asset impairment charges for the years ended 2013 and 2012.
62
Key Energy Services, Inc. and Subsidiaries
NOTES TO CONSOLIDATED FINANCIAL STATEMENTS — (Continued)
NOTE 9. GOODWILL AND OTHER INTANGIBLE ASSETS
The changes in the carrying amount of our goodwill for the years ended December 31, 2014 and 2013 are as follows:
U.S. Rig Services | Fluid Management Services | Coiled Tubing Services | Fishing and Rental Services | International | Total | ||||||||||||||||||
(in thousands) | |||||||||||||||||||||||
December 31, 2012 | $ | 297,719 | $ | 24,479 | $ | 101,795 | $ | 173,463 | $ | 29,025 | $ | 626,481 | |||||||||||
Impact of foreign currency translation | — | — | — | — | (1,606 | ) | (1,606 | ) | |||||||||||||||
December 31, 2013 | 297,719 | 24,479 | 101,795 | 173,463 | 27,419 | 624,875 | |||||||||||||||||
Goodwill impairment | — | — | (19,100 | ) | — | (22,437 | ) | (41,537 | ) | ||||||||||||||
Impact of foreign currency translation | — | — | — | — | (599 | ) | (599 | ) | |||||||||||||||
December 31, 2014 | $ | 297,719 | $ | 24,479 | $ | 82,695 | $ | 173,463 | $ | 4,383 | $ | 582,739 | |||||||||||
The components of our other intangible assets as of December 31, 2014 and 2013 are as follows:
December 31, 2014 | December 31, 2013 | ||||||
(in thousands) | |||||||
Noncompete agreements: | |||||||
Gross carrying value | $ | 2,269 | $ | 9,332 | |||
Accumulated amortization | (1,710 | ) | (7,104 | ) | |||
Net carrying value | $ | 559 | $ | 2,228 | |||
Patents, trademarks and tradenames: | |||||||
Gross carrying value | $ | 3,106 | $ | 14,039 | |||
Accumulated amortization | (263 | ) | (223 | ) | |||
Net carrying value | $ | 2,843 | $ | 13,816 | |||
Customer relationships and contracts: | |||||||
Gross carrying value | $ | 59,045 | $ | 100,271 | |||
Accumulated amortization | (52,303 | ) | (78,926 | ) | |||
Net carrying value | $ | 6,742 | $ | 21,345 | |||
Developed technology: | |||||||
Gross carrying value | $ | 8,494 | $ | 7,583 | |||
Accumulated amortization | (4,138 | ) | (3,826 | ) | |||
Net carrying value | $ | 4,356 | $ | 3,757 | |||
Customer backlog: | |||||||
Gross carrying value | $ | 779 | $ | 779 | |||
Accumulated amortization | (779 | ) | (779 | ) | |||
Net carrying value | $ | — | $ | — | |||
Total: | |||||||
Gross carrying value | $ | 73,693 | $ | 132,004 | |||
Accumulated amortization | (59,193 | ) | (90,858 | ) | |||
Net carrying value | $ | 14,500 | $ | 41,146 | |||
63
Key Energy Services, Inc. and Subsidiaries
NOTES TO CONSOLIDATED FINANCIAL STATEMENTS — (Continued)
Amortization expense for our intangible assets with determinable lives was as follows:
Year Ended December 31, | |||||||||||
2014 | 2013 | 2012 | |||||||||
(in thousands) | |||||||||||
Noncompete agreements | $ | 1,671 | $ | 2,082 | $ | 3,827 | |||||
Patents and trademarks | 40 | 40 | 309 | ||||||||
Customer relationships and contracts | 6,749 | 16,726 | 18,941 | ||||||||
Developed technology | 316 | 221 | 221 | ||||||||
Total intangible asset amortization expense | $ | 8,776 | $ | 19,069 | $ | 23,298 | |||||
Of our intangible assets at December 31, 2014, $2.7 million are indefinite-lived tradenames and patents which are not subject to amortization. These tradenames are tested for impairment annually using a relief from royalty method. The weighted average remaining amortization periods and expected amortization expense for the next five years for our definite lived intangible assets are as follows:
Weighted average remaining amortization period (years) | Expected Amortization Expense | ||||||||||||||||||||
2015 | 2016 | 2017 | 2018 | 2019 | |||||||||||||||||
(in thousands) | |||||||||||||||||||||
Noncompete agreements | 1.8 | $ | 309 | $ | 250 | $ | — | $ | — | $ | — | ||||||||||
Trademarks | 3.4 | 40 | 40 | 40 | 17 | — | |||||||||||||||
Customer relationships and contracts | 5.0 | 2,473 | 1,875 | 1,392 | 431 | 341 | |||||||||||||||
Developed technology | 16.0 | 400 | 400 | 400 | 400 | 324 | |||||||||||||||
Total expected intangible asset amortization expense | $ | 3,222 | $ | 2,565 | $ | 1,832 | $ | 848 | $ | 665 | |||||||||||
Certain of our other intangible assets are denominated in Russian Rubles and, as such, the values of these assets are subject to fluctuations associated with changes in exchange rates.
We perform an analysis of goodwill impairment on an annual basis unless an event occurs that triggers additional interim testing. During 2014 we identified several triggering events requiring us to perform testing for possible goodwill impairment.
Deterioration in the capital investment climate in Russia as a result of geopolitical events occurring during the second quarter of 2014 was determined to be a triggering event. This triggering event required us to perform testing for possible goodwill impairment of our Russian business reporting unit which is included in our International reporting segment. Our analysis concluded that Russia's $22.4 million of goodwill was fully impaired, and that $6.3 million of Russia's tradename intangible assets was impaired as well. We concluded that there was no impairment to Russia's other long-lived assets.
The decline in market value of our common stock in comparison to the carrying value of our assets during the third quarter of 2014 was determined to be a triggering event requiring us to perform testing for possible goodwill impairment in our U.S. Rig Services, Coiled Tubing Services, Fishing and Rental Services and Fluid Management Services segments. Our step one testing indicated there may be impairment in our Fishing and Rental Services segment. No impairment was indicated in our other U.S. segments. Step two of the goodwill impairment testing for the Fishing and Rental Service segment was performed preliminarily during the third quarter of 2014 and, while our preliminary analysis concluded that that there was no impairment of goodwill, it did indicate that there was an impairment of fixed assets. During the fourth quarter of 2014 we engaged outside consultants to finalize our step two testing. The additional analysis preformed by our consultants confirmed that there was no impairment of goodwill. The analysis did conclude that $7.7 million of customer relationship and $3.6 million of tradename intangible assets in our Fishing and Rental Services segment was impaired.
During the fourth quarter we performed our annual qualitative analysis of goodwill impairment as of October 1, 2014. Based on this analysis we determined our Canadian reporting unit, which is included in our International reporting segment, did not have an indication of impairment. However, the market value of our stock continued to decline during the fourth quarter and we determined it was necessary to perform the first step of the goodwill impairment test for our U.S. Rig Services, Coiled Tubing Services, Fishing and Rental Services and Fluid Management Services segments. Based on the results of our step one analysis, the fair value of our U.S. Rig Services, Fluid Management Services and Fishing and Rental Services segments
64
Key Energy Services, Inc. and Subsidiaries
NOTES TO CONSOLIDATED FINANCIAL STATEMENTS — (Continued)
exceeded their carrying values, but indicated potential impairment in our Coiled Tubing Services segment. Step two of the goodwill impairment testing for the Coiled Tubing Services segment was performed preliminarily during the fourth quarter of 2014 and our analysis concluded that $19.1 million of goodwill was impaired and recorded in the fourth quarter. Our analysis concluded that there was no impairment of fixed assets. Step two testing will be concluded in the first quarter of 2015 and any adjustment to the amount recorded, which could differ materially, will be recorded in the first quarter of 2015. See “Note 8. Property and Equipment,” for further discussion.
NOTE 10. EARNINGS PER SHARE
The following table presents our basic and diluted earnings per share (“EPS”) for the years ended December 31, 2014, 2013 and 2012:
Year Ended December 31, | |||||||||||
2014 | 2013 | 2012 | |||||||||
(in thousands, except per share amounts) | |||||||||||
Basic EPS Calculation: | |||||||||||
Numerator | |||||||||||
Income (loss) from continuing operations attributable to Key | $ | (178,628 | ) | $ | (21,768 | ) | $ | 101,190 | |||
Loss from discontinued operations, net of tax | — | — | (93,568 | ) | |||||||
Income (loss) attributable to Key | $ | (178,628 | ) | $ | (21,768 | ) | $ | 7,622 | |||
Denominator | |||||||||||
Weighted average shares outstanding | 153,371 | 152,271 | 151,106 | ||||||||
Basic earnings (loss) per share from continuing operations attributable to Key | $ | (1.16 | ) | $ | (0.14 | ) | $ | 0.67 | |||
Basic loss per share from discontinued operations | — | — | (0.62 | ) | |||||||
Basic earnings (loss) per share attributable to Key | $ | (1.16 | ) | $ | (0.14 | ) | $ | 0.05 | |||
Diluted EPS Calculation: | |||||||||||
Numerator | |||||||||||
Income (loss) from continuing operations attributable to Key | $ | (178,628 | ) | $ | (21,768 | ) | $ | 101,190 | |||
Loss from discontinued operations, net of tax | — | — | (93,568 | ) | |||||||
Income (loss) attributable to Key | $ | (178,628 | ) | $ | (21,768 | ) | $ | 7,622 | |||
Denominator | |||||||||||
Weighted average shares outstanding | 153,371 | 152,271 | 151,106 | ||||||||
Stock options | — | — | 19 | ||||||||
Total | 153,371 | 152,271 | 151,125 | ||||||||
Diluted earnings (loss) per share from continuing operations attributable to Key | $ | (1.16 | ) | $ | (0.14 | ) | $ | 0.67 | |||
Diluted loss per share from discontinued operations | — | — | (0.62 | ) | |||||||
Diluted earnings (loss) per share attributable to Key | $ | (1.16 | ) | $ | (0.14 | ) | $ | 0.05 | |||
Stock options, warrants and SARs are included in the computation of diluted earnings per share using the treasury stock method. Restricted stock awards are legally considered issued and outstanding when granted and are included in basic weighted average shares outstanding. The diluted earnings per share calculation for the years ended December 31, 2014, 2013, and 2012 exclude the potential exercise of 1.4 million, 1.7 million and 2.0 million stock options, respectively, and 0.3 million, 0.3 million and 0.4 million SARs, respectively, because the effects of such exercises on earnings per share would be anti-dilutive.
There have been no material changes in share amounts subsequent to the balance sheet date that would have a material impact on the earnings per share calculation for the year ended December 31, 2014. However, we issued 0.9 million shares of restricted stock on January 30, 2015.
65
Key Energy Services, Inc. and Subsidiaries
NOTES TO CONSOLIDATED FINANCIAL STATEMENTS — (Continued)
NOTE 11. ASSET RETIREMENT OBLIGATIONS
In connection with our well servicing activities, we operate a number of SWD facilities. Our operations involve the transportation, handling and disposal of fluids in our SWD facilities that are by-products of the drilling process. SWD facilities used in connection with our fluid hauling operations are subject to future costs associated with the retirement of these properties. As a result, we have incurred costs associated with the proper storage and disposal of these materials.
Annual accretion of the assets associated with the asset retirement obligations was $0.6 million for the years ended December 31, 2014, 2013 and 2012. A summary of changes in our asset retirement obligations is as follows (in thousands):
Balance at December 31, 2012 | $ | 11,659 | |
Additions | 174 | ||
Costs incurred | (135 | ) | |
Accretion expense | 604 | ||
Disposals | (303 | ) | |
Balance at December 31, 2013 | 11,999 | ||
Additions | — | ||
Costs incurred | (79 | ) | |
Accretion expense | 605 | ||
Disposals | — | ||
Balance at December 31, 2014 | $ | 12,525 | |
NOTE 12. ESTIMATED FAIR VALUE OF FINANCIAL INSTRUMENTS
The following is a summary of the carrying amounts and estimated fair values of our financial instruments as of December 31, 2014 and 2013.
Cash, cash equivalents, accounts receivable, accounts payable and accrued liabilities. These carrying amounts approximate fair value because of the short maturity of the instruments or because the carrying value is equal to the fair value of those instruments on the balance sheet date.
December 31, 2014 | December 31, 2013 | ||||||||||||||
Carrying Value | Fair Value | Carrying Value | Fair Value | ||||||||||||
(in thousands) | |||||||||||||||
Financial assets: | |||||||||||||||
Notes receivable — Argentina operations sale | $ | 8,300 | $ | 8,300 | $ | 12,355 | $ | 12,355 | |||||||
Financial liabilities: | |||||||||||||||
6.75% Senior Notes due 2021 | $ | 675,000 | $ | 413,438 | $ | 675,000 | $ | 690,390 | |||||||
8.375% Senior Notes due 2014 | — | — | 3,573 | 3,627 | |||||||||||
Credit Facility revolving loans | 70,000 | 70,000 | 85,000 | 85,000 | |||||||||||
Notes receivable — Argentina operations sale. The fair value of these notes are based upon the quoted market Treasury rates as of the dates indicated. The carrying values of these items approximate their fair values due to the maturity dates rapidly approaching, thus giving way to discount rates that are similar.
6.75% Senior Notes due 2021. The fair value of these notes is based upon the quoted market prices for those securities as of the dates indicated. The carrying value of these notes as of December 31, 2014 was $675.0 million, and the fair value was $413.4 million (61.3% of carrying value).
8.375% Senior Notes due 2014. At December 31, 2013 the fair value of our 2014 Notes was based upon the quoted market prices for those securities as of the dates indicated. These notes were redeemed in February 2014.
Credit Facility Revolving Loans. Because the variable interest rates of these loans approximate current market rates, the fair values of the revolving loans borrowed under our 2011 Credit Facility approximate their carrying values. The carrying and fair values of these loans as of December 31, 2014 were $70.0 million.
66
Key Energy Services, Inc. and Subsidiaries
NOTES TO CONSOLIDATED FINANCIAL STATEMENTS — (Continued)
NOTE 13. INCOME TAXES
The components of our income tax expense are as follows:
Year Ended December 31, | |||||||||||
2014 | 2013 | 2012 | |||||||||
(in thousands) | |||||||||||
Current income tax expense: | |||||||||||
Federal and state | $ | (755 | ) | $ | (8,515 | ) | $ | (16,165 | ) | ||
Foreign | (1,684 | ) | (350 | ) | (5,189 | ) | |||||
(2,439 | ) | (8,865 | ) | (21,354 | ) | ||||||
Deferred income tax (expense) benefit: | |||||||||||
Federal and state | 69,508 | (4,870 | ) | (32,729 | ) | ||||||
Foreign | 13,414 | 16,799 | (3,269 | ) | |||||||
82,922 | 11,929 | (35,998 | ) | ||||||||
Total income tax (expense) benefit | $ | 80,483 | $ | 3,064 | $ | (57,352 | ) | ||||
The sources of our income or loss from continuing operations before income taxes and noncontrolling interest were as follows:
Year Ended December 31, | |||||||||||
2014 | 2013 | 2012 | |||||||||
(in thousands) | |||||||||||
Domestic income (loss) | $ | (202,973 | ) | $ | 29,086 | $ | 129,865 | ||||
Foreign income (loss) | (56,138 | ) | (53,323 | ) | 30,164 | ||||||
Total income (loss) | $ | (259,111 | ) | $ | (24,237 | ) | $ | 160,029 | |||
We made federal income tax payments of zero, $30.0 million and $5.1 million for the years ended December 31, 2014, 2013 and 2012, respectively. We made state income tax payments of $1.6 million, $2.9 million and $2.9 million for the years ended December 31, 2014, 2013 and 2012, respectively. We made foreign tax payments of $1.1 million, $2.3 million and $5.2 million for the years ended December 31, 2014, 2013 and 2012, respectively. For the years ended December 31, 2014, 2013 and 2012, tax benefit (expense) allocated to stockholders’ equity for compensation expense for income tax purposes in excess of amounts recognized for financial reporting purposes was $1.2 million, $1.8 million and $4.1 million, respectively. In addition, we received federal income tax refunds of $11.9 million, $25.1 million and $16.7 million during the years ended December 31, 2014, 2013 and 2012, respectively.
Income tax expense differs from amounts computed by applying the statutory federal rate as follows:
Year Ended December 31, | ||||||||
2014 | 2013 | 2012 | ||||||
Income tax computed at Federal statutory rate | 35.0 | % | 35.0 | % | 35.0 | % | ||
State taxes | 1.4 | % | (6.0 | )% | 2.5 | % | ||
Meals and entertainment | (0.7 | )% | (7.7 | )% | — | % | ||
Foreign rate difference | (0.7 | )% | (8.0 | )% | — | % | ||
Non-deductible goodwill | (3.9 | )% | — | % | — | % | ||
Other | — | % | (0.7 | )% | (1.7 | )% | ||
Effective income tax rate | 31.1 | % | 12.6 | % | 35.8 | % | ||
67
Key Energy Services, Inc. and Subsidiaries
NOTES TO CONSOLIDATED FINANCIAL STATEMENTS — (Continued)
As of December 31, 2014 and 2013, our deferred tax assets and liabilities consisted of the following:
December 31, | |||||||
2014 | 2013 | ||||||
(in thousands) | |||||||
Deferred tax assets: | |||||||
Net operating loss and tax credit carryforwards | $ | 64,107 | $ | 36,860 | |||
Capital loss carryforwards | 21,417 | 21,417 | |||||
Self-insurance reserves | 15,751 | 16,217 | |||||
Allowance for doubtful accounts | 1,046 | 199 | |||||
Accrued liabilities | 6,283 | 8,981 | |||||
Share-based compensation | 7,254 | 7,759 | |||||
Other | 869 | (392 | ) | ||||
Total deferred tax assets | 116,727 | 91,041 | |||||
Valuation allowance for deferred tax assets | (22,247 | ) | (22,248 | ) | |||
Net deferred tax assets | 94,480 | 68,793 | |||||
Deferred tax liabilities: | |||||||
Property and equipment | (225,136 | ) | (269,167 | ) | |||
Intangible assets | (46,543 | ) | (48,807 | ) | |||
Other | (4,134 | ) | (1,252 | ) | |||
Total deferred tax liabilities | (275,813 | ) | (319,226 | ) | |||
Net deferred tax liability, net of valuation allowance | $ | (181,333 | ) | $ | (250,433 | ) | |
The December 31, 2014 net deferred tax liability balance is comprised of $228.4 million long-term deferred tax liability, less $11.8 million current deferred tax asset and $35.2 million long-term deferred tax asset. The December 31, 2013 net deferred liability balance is comprised of $284.5 million long-term deferred tax liability, less $11.7 million current deferred tax asset and $22.3 million long-term deferred tax asset.
In recording deferred income tax assets, we consider whether it is more likely than not that some portion or all of the deferred income tax assets will be realized. The ultimate realization of deferred income tax assets is dependent upon the generation of future taxable income during the periods in which those deferred income tax assets would be deductible. We consider the scheduled reversal of deferred income tax liabilities and projected future taxable income for this determination. To fully realize the deferred income tax assets related to our federal net operating loss carryforwards that do not have a valuation allowance due to Section 382 limitations, we would need to generate future federal taxable income of approximately $0.1 million over the next four years. With certain exceptions noted below, we believe that after considering all the available objective evidence, both positive and negative, historical and prospective, with greater weight given to the historical evidence, it is more likely than not that these assets will be realized.
We estimate that as of December 31, 2014, 2013 and 2012, we have available $50.7 million, $2.4 million and $2.8 million, respectively, of federal net operating loss carryforwards. Approximately $2.4 million of our net operating losses as of December 31, 2014 are subject to a $5,000 annual Section 382 limitation and expire in 2016 through 2018. The gross deferred tax asset associated with our federal net operating loss carryforward at December 31, 2014 is $17.8 million. Due to annual limitations under Sections 382 and 383, management believes that we will not be able to utilize all available carryforwards prior to their ultimate expiration. At December 31, 2014 and 2013, we had a valuation allowance of $0.8 million related to the deferred tax asset associated with our remaining federal net operating loss carryforwards that will expire before utilization due to Section 382 limitations.
We estimate that as of December 31, 2014, 2013 and 2012, we have available approximately $102.0 million, $64.9 million and $44.4 million, respectively, of state net operating loss carryforwards that will expire between 2015 and 2034. The deferred tax asset associated with our remaining state net operating loss carryforwards at December 31, 2014 is $5.2 million, net of federal tax benefit. Management believes that it is more likely than not that we will be able to utilize all available state carryforwards prior to their ultimate expiration.
We estimate that as of December 31, 2014, 2013 and 2012, we have available approximately $177.5 million, $117.6 million, and $34.4 million, respectively, of foreign net operating loss carryforwards that will expire between 2020 and 2030. The gross deferred tax asset associated with our foreign net operating loss carryforwards at December 31, 2014 is $50.4
68
Key Energy Services, Inc. and Subsidiaries
NOTES TO CONSOLIDATED FINANCIAL STATEMENTS — (Continued)
million. Management believes that it is more likely than not that we will be able to utilize the net operating loss carryforwards prior to their ultimate expiration in all foreign jurisdictions in which we currently operate.
The Company recognized a valuation allowance of $21.4 million as of December 31, 2014 against the deferred tax asset associated with the capital loss carryforward. The capital loss carryforward will expire in 2017.
We did not provide for U.S. income taxes or withholding taxes on unremitted earnings of our Mexico, Canada, Colombia and the Middle East subsidiaries, as these earnings are considered permanently reinvested because the cash flow generated by these businesses is needed to fund additional equipment and working capital requirements in these jurisdictions. Furthermore, we did not provide for U.S. income taxes on unremitted earnings of our other foreign subsidiaries as our tax basis in these foreign subsidiaries exceeded the book basis.
We file income tax returns in the United States federal jurisdiction and various states and foreign jurisdictions. In 2014 the Internal Revenue Service (“IRS”) concluded their audit of our returns for the tax years ended December 31, 2010, 2011 and 2012 with no material changes. Our other significant filings, which are in Mexico, are currently being examined for tax years 2009 and 2010.
As of December 31, 2014, 2013 and 2012, we had $1.0 million, $0.9 million and $1.2 million, respectively, of unrecognized tax benefits which, if recognized, would impact our effective tax rate. We have accrued $0.1 million, $0.4 million and $0.3 million for the payment of interest and penalties as of December 31, 2014, 2013 and 2012, respectively. We believe that it is reasonably possible that $0.6 million of our currently remaining unrecognized tax positions, each of which are individually insignificant, may be recognized by the end of 2015 as a result of a lapse of the statute of limitations and settlement of an open audit.
We recognized a net tax benefit of less than $0.1 million in 2014 for expirations of statutes of limitations.
The following table presents the gross activity during 2014 and 2013 related to our liabilities for uncertain tax positions (in thousands):
Balance at January 1, 2013 | $ | 1,593 | |
Additions based on tax positions related to the current year | 251 | ||
Reductions for tax positions from prior years | (473 | ) | |
Settlements | — | ||
Balance at December 31, 2013 | 1,371 | ||
Additions based on tax positions related to the current year | 108 | ||
Reductions for tax positions from prior years | (30 | ) | |
Settlements | — | ||
Balance at December 31, 2014 | 1,449 | ||
Tax Legislative Changes
Tax Increase Prevention Act of 2014. On December 19, 2014, H.R. 5771, Tax Increase Prevention Act of 2014, was signed into law. The new law retroactively extends for one year, until the end of 2014, most of the provisions of the American Taxpayer Relief Act that expired at the end of 2013, including the first-year bonus depreciation deduction of 50% of the adjusted basis of qualified property acquired and placed in service during 2014.
On September 13, 2013, the United States Treasury Department and the IRS issued final regulations providing comprehensive guidance on the tax treatment of costs incurred to acquire, repair, or improve tangible property. The final regulations are generally effective for taxable years beginning on or after January 1, 2014. On January 16, 2015 the IRS issued procedural guidance for taxpayers to follow with respect to filing applications for changes in accounting methods. This guidance includes the method change procedures that taxpayers must follow for adopting the tangible property regulations. We are currently assessing the future impacts of these regulations, but do not anticipate a material impact on our financial condition, results of operations or cash flows.
69
Key Energy Services, Inc. and Subsidiaries
NOTES TO CONSOLIDATED FINANCIAL STATEMENTS — (Continued)
NOTE 14. LONG-TERM DEBT
The components of our long-term debt are as follows:
December 31, 2014 | December 31, 2013 | ||||||
(in thousands) | |||||||
6.75% Senior Notes due 2021 | $ | 675,000 | $ | 675,000 | |||
8.375% Senior Notes due 2014 | — | 3,573 | |||||
Senior Secured Credit Facility revolving loans due 2016 | 70,000 | 85,000 | |||||
Net unamortized premium on debt | 3,426 | 3,981 | |||||
Total debt | 748,426 | 767,554 | |||||
Less current portion | — | (3,573 | ) | ||||
Total long-term debt and capital leases | $ | 748,426 | $ | 763,981 | |||
8.375% Senior Notes due 2014
On November 29, 2007, we issued $425.0 million aggregate principal amount of 8.375% Senior Notes due 2014 (the “2014 Notes”). In March of 2011, we repurchased $421.4 million aggregate principal amount of our 2014 Notes. On February 25, 2014, we redeemed the remaining $3.6 million aggregate principal amount and paid $0.1 million accrued interest of 2014 Notes pursuant to the indenture dated as of November 29, 2007 (as supplemented, the “Indenture”). The 2014 Notes were general unsecured senior obligations and were subordinate to all of our existing and future secured indebtedness. The 2014 Notes were jointly and severally guaranteed on a senior unsecured basis by certain of our existing and future domestic subsidiaries. Interest on the 2014 Notes was payable on June 1 and December 1 of each year.
6.75% Senior Notes due 2021
We issued $475.0 million aggregate principal amount of 6.75% Senior Notes due 2021 (the “Initial 2021 Notes”) on March 4, 2011 and issued an additional $200.0 million aggregate principal amount of the 2021 Notes (the “Additional 2021 Notes” and, together with the Initial 2021 Notes, the “2021 Notes”) in a private placement on March 8, 2012 under an indenture dated March 4, 2011 (the “Base Indenture”), as supplemented by a first supplemental indenture dated March 4, 2011 and amended by a further supplemental indenture dated March 8, 2012 (the “Supplemental Indenture” and, together with the Base Indenture, the “Indenture”). We used the net proceeds to repay senior secured indebtedness under our revolving bank credit facility. We capitalized $4.6 million of financing costs associated with the issuance of the 2021 Notes that will be amortized over the term of the notes.
On March 5, 2013, we completed an offer to exchange the $200.0 million in aggregate principal amount of unregistered Additional 2021 Notes for an equal principal amount of such notes registered under the Securities Act of 1933. All of the 2021 Notes are treated as a single class under the Indenture and as of the closing of the exchange offer, bear the same CUSIP and ISIN numbers.
The 2021 Notes are general unsecured senior obligations and are effectively subordinated to all of our existing and future secured indebtedness. The 2021 Notes are or will be jointly and severally guaranteed on a senior unsecured basis by certain of our existing and future domestic subsidiaries. Interest on the 2021 Notes is payable on March 1 and September 1 of each year. The 2021 Notes mature on March 1, 2021.
On or after March 1, 2016, the 2021 Notes will be subject to redemption at any time and from time to time at our option, in whole or in part, at the redemption prices below (expressed as percentages of the principal amount redeemed), plus accrued and unpaid interest to the applicable redemption date, if redeemed during the twelve-month period beginning on March 1 of the years indicated below:
Year | Percentage | |
2016 | 103.375 | % |
2017 | 102.250 | % |
2018 | 101.125 | % |
2019 and thereafter | 100.000 | % |
At any time and from time to time prior to March 1, 2016, we may, at our option, redeem all or a portion of the 2021 Notes at a redemption price equal to 100% of the principal amount plus a premium with respect to the 2021 Notes plus accrued
70
Key Energy Services, Inc. and Subsidiaries
NOTES TO CONSOLIDATED FINANCIAL STATEMENTS — (Continued)
and unpaid interest to the redemption date. The premium is the excess of (i) the present value of the redemption price of 103.375% of the principal amount, plus all remaining scheduled interest payments due through March 1, 2016 discounted at the treasury rate plus 0.5% over (ii) the principal amount of the note. If we experience a change of control, subject to certain exceptions, we must give holders of the 2021 Notes the opportunity to sell to us their 2021 Notes, in whole or in part, at a purchase price equal to 101% of the aggregate principal amount, plus accrued and unpaid interest to the date of purchase.
We are subject to certain negative covenants under the Indenture. The Indenture limits our ability to, among other things:
• | incur additional indebtedness and issue preferred equity interests; |
• | pay dividends or make other distributions or repurchase or redeem equity interests; |
• | make loans and investments; |
• | enter into sale and leaseback transactions; |
• | sell, transfer or otherwise convey assets; |
• | create liens; |
• | enter into transactions with affiliates; |
• | enter into agreements restricting subsidiaries’ ability to pay dividends; |
• | designate future subsidiaries as unrestricted subsidiaries; and |
• | consolidate, merge or sell all or substantially all of the applicable entities’ assets. |
These covenants are subject to certain exceptions and qualifications, and contain cross-default provisions relating to the covenants of our 2011 Credit Facility discussed below. Substantially all of the covenants will terminate before the 2021 Notes mature if one of two specified ratings agencies assigns the 2021 Notes an investment grade rating in the future and no events of default exist under the Indenture. As of December 31, 2014, the 2021 Notes were rated below investment grade. Any covenants that cease to apply to us as a result of achieving an investment grade rating will not be restored, even if the credit rating assigned to the 2021 Notes later falls below investment grade. We were in compliance with these covenants at December 31, 2014.
Senior Secured Credit Facility
On December 5, 2014, we entered into the Second Amendment to Credit Agreement (the “Amendment”) for our $400.0 million senior secured revolving bank credit facility with JPMorgan Chase Bank, N.A., as Administrative Agent, Bank of America, N.A., as Syndication Agent, and Capital One, N.A., Wells Fargo Bank, N.A., Credit Agricole Corporate and Investment Bank and DnB NOR Bank ASA, as Co-Documentation Agent (as amended, our “2011 Credit Facility”), which is an important source of liquidity for us. The Amendment decreased the total commitments by the lenders under the credit facility from $550.0 million to $400.0 million, which will automatically be further reduced from $400.0 million to $350.0 million on July 1, 2015. Among other changes, the Amendment modified the definition of earnings before interest, taxes, depreciation and amortization (as calculated pursuant to the terms of our 2011 Credit Facility, “EBITDA”) to allow for the add back of (i) all expenses incurred during the second and third quarters of 2014 related to the Company’s compliance with the FCPA and (ii) up to $50.0 million of additional expenses incurred in relation to the Company’s FCPA compliance commencing in the fourth quarter of 2014. Our 2011 Credit Facility consists of a revolving credit facility, letter of credit sub-facility and swing line facility, all of which will mature no later than March 31, 2016. The maximum amount that we may borrow under the facility may be subject to limitation due to the operation of the covenants contained in the facility. Our 2011 Credit Facility allows us to request increases in the total commitments under the facility by up to $100.0 million in the aggregate in part or in full anytime during the term of our 2011 Credit Facility, with any such increases being subject to compliance with the restrictive covenants in our 2011 Credit Facility and in the Indenture, as well as lender approval.
We capitalized $4.9 million of financing costs in connection with the execution of our 2011 Credit Facility and an additional $1.4 million related to the first amendment that will be amortized over the term of the debt. The $0.4 million remaining unamortized financing costs related to the first amendment was written off at the time of the second amendment.
The interest rate per annum applicable to the 2011 Credit Facility is, at our option, (i) adjusted LIBOR plus the applicable margin or (ii) the higher of (x) JPMorgan’s prime rate, (y) the Federal Funds rate plus 0.5% and (z) one-month adjusted LIBOR plus 1.0%, plus in each case the applicable margin for all other loans. The applicable margin for LIBOR loans ranges from 225 to 300 basis points, and the applicable margin for all other loans ranges from 125 to 200 basis points, depending upon our consolidated total leverage ratio as defined in the 2011 Credit Facility. Unused commitment fees on the facility equal 0.5%.
71
Key Energy Services, Inc. and Subsidiaries
NOTES TO CONSOLIDATED FINANCIAL STATEMENTS — (Continued)
Our 2011 Credit Facility contains certain financial covenants, which, among other things, limit our annual capital expenditures, restrict our ability to repurchase shares and require us to maintain certain financial ratios. The financial ratios require that:
• | our ratio of consolidated funded indebtedness to total capitalization be no greater than 55%; |
• | our senior secured leverage ratio of senior secured funded debt to trailing four quarters EBITDA be no greater than 2.00 to 1.00; |
• | we maintain a consolidated interest coverage ratio of trailing four quarters EBITDA to interest expense for no less than the ratio specified for such fiscal quarter as indicated in the table below: |
Fiscal Quarter Ending | Ratio |
December 31, 2014 through September 30, 2015 | 2.75 to 1.00 |
December 31, 2015 and thereafter | 3.00 to 1.00 |
• | we maintain a collateral coverage ratio, the ratio of the aggregate book value of the collateral to the amount of the total commitments, as of the last day of any fiscal quarter of at least 2.00 to 1.00; and |
• | we limit our capital expenditures and investments in foreign subsidiaries to $250.0 million per fiscal year, if the consolidated total leverage ratio exceeds 3.00 to 1.00. |
In addition, our 2011 Credit Facility contains certain affirmative and negative covenants, including, without limitation, restrictions on (i) liens; (ii) debt, guarantees and other contingent obligations; (iii) mergers and consolidations; (iv) sales, transfers and other dispositions of property or assets; (v) loans, acquisitions, joint ventures and other investments (with acquisitions permitted so long as, after giving pro forma effect thereto, no default or event of default exists under our 2011 Credit Facility, the pro forma consolidated total leverage ratio does not exceed 4.00 to 1.00, we are in compliance with other financial covenants and we have at least $25.0 million of availability under our 2011 Credit Facility); (vi) dividends and other distributions to, and redemptions and repurchases from, equityholders; (vii) making investments, loans or advances; (viii) selling properties; (ix) prepaying, redeeming or repurchasing subordinated (contractually or structurally) debt; (x) engaging in transactions with affiliates; (xi) entering into hedging arrangements; (xii) entering into sale and leaseback transactions; (xiii) granting negative pledges other than to the lenders; (xiv) changes in the nature of business; (xv) amending organizational documents; and (xvi) changes in accounting policies or reporting practices; in each of the foregoing cases, with certain exceptions.
We were in compliance with these covenants at December 31, 2014. We may prepay our 2011 Credit Facility in whole or in part at any time without premium or penalty, subject to certain reimbursements to the lenders for breakage and redeployment costs. As of December 31, 2014, we had borrowings of $70.0 million under the revolving credit facility, $50.4 million of letters of credit outstanding with borrowing capacity of $279.6 million available considering covenant constraints under our 2011 Credit Facility. For the years ended December 31, 2014 and 2013, the weighted average interest rates on the outstanding borrowings under our 2011 Credit Facility was 2.97% and 2.76%, respectively.
Letter of Credit Facility
On November 7, 2013, we entered into an uncommitted, unsecured $15.0 million letter of credit facility to be used solely for the issuances of performance letters of credit. As of December 31, 2014, $3.0 million of letters of credit were outstanding under the facility.
72
Key Energy Services, Inc. and Subsidiaries
NOTES TO CONSOLIDATED FINANCIAL STATEMENTS — (Continued)
Long-Term Debt Principal Repayment and Interest Expense
Presented below is a schedule of the repayment requirements of long-term debt for each of the next five years and thereafter as of December 31, 2014:
Principal Amount of Long-Term Debt | |||
(in thousands) | |||
2015 | $ | — | |
2016 | 70,000 | ||
2017 | — | ||
2018 | — | ||
2019 | — | ||
Thereafter | 675,000 | ||
Total long-term debt | $ | 745,000 | |
Interest expense for the years ended December 31, 2014, 2013 and 2012 consisted of the following:
Year Ended December 31, | |||||||||||
2014 | 2013 | 2012 | |||||||||
(in thousands) | |||||||||||
Cash payments | $ | 49,410 | $ | 51,705 | $ | 46,767 | |||||
Commitment and agency fees paid | 2,179 | 1,799 | 1,450 | ||||||||
Amortization of premium on debt | (556 | ) | (556 | ) | (463 | ) | |||||
Amortization of deferred financing costs | 2,800 | 2,800 | 2,695 | ||||||||
Write-off of deferred financing costs | 362 | — | — | ||||||||
Net change in accrued interest | 32 | 63 | 4,431 | ||||||||
Capitalized interest | — | (607 | ) | (1,314 | ) | ||||||
Net interest expense | $ | 54,227 | $ | 55,204 | $ | 53,566 | |||||
As of December 31, 2014, 2013 and 2012, the weighted average interest rates of our variable rate debt was 3.14%, 2.88% and 2.70%, respectively.
Deferred Financing Costs
A summary of deferred financing costs including capitalized costs, write-offs and amortization, for the years ended December 31, 2014 and 2013 are presented in the table below (in thousands):
Balance at December 31, 2012 | $ | 16,628 | |
Capitalized costs | 69 | ||
Amortization | (2,800 | ) | |
Balance at December 31, 2013 | 13,897 | ||
Amortization | (2,800 | ) | |
Write-off | (362 | ) | |
Balance at December 31, 2014 | $ | 10,735 | |
NOTE 15. COMMITMENTS AND CONTINGENCIES
Operating Lease Arrangements
We lease certain property and equipment under non-cancelable operating leases that expire at various dates through 2021, with varying payment dates throughout each month. In addition, we have a number of leases scheduled to expire during 2015.
73
Key Energy Services, Inc. and Subsidiaries
NOTES TO CONSOLIDATED FINANCIAL STATEMENTS — (Continued)
As of December 31, 2014, the future minimum lease payments under non-cancelable operating leases are as follows (in thousands):
Lease Payments | |||
2015 | $ | 13,960 | |
2016 | 9,006 | ||
2017 | 4,250 | ||
2018 | 2,632 | ||
2019 | 2,012 | ||
Thereafter | 3,057 | ||
Total | $ | 34,917 | |
We are also party to a significant number of month-to-month leases that can be canceled at any time. Operating lease expense was $22.3 million, $23.9 million, and $24.4 million for the years ended December 31, 2014, 2013 and 2012, respectively.
Litigation
Various suits and claims arising in the ordinary course of business are pending against us. We conduct business throughout the continental United States and may be subject to jury verdicts or arbitrations that result in outcomes in favor of the plaintiffs. We are also exposed to various claims abroad. We continually assess our contingent liabilities, including potential litigation liabilities, as well as the adequacy of our accruals and the need for disclosure of these items, if any. We establish a provision for a contingent liability when it is probable that a liability has been incurred and the amount is reasonably estimable. As of December 31, 2014, the aggregate amount of our liabilities related to litigation that are deemed probable and reasonably estimable is $0.1 million. We do not believe that the disposition of any of these matters will result in an additional loss materially in excess of amounts that have been recorded. Our liabilities related to litigation matters that were deemed probable and reasonably estimable as of December 31, 2013 were $0.3 million.
Between May of 2013 and June of 2014, five lawsuits (four class actions and one enforcement action) were filed in California involving alleged violations of California's wage and hour laws. In general, the lawsuits allege failure to pay wages, including overtime and minimum wages, failure to pay final wages upon employment terminations in a timely manner, failure to reimburse reasonable and necessary business expenses, failure to provide wage statements consistent with California law, and violations of the California meal and break period laws, among other claims. We intend to vigorously investigate and defend these actions. Because these cases are in relatively early stages, and we have not yet briefed class certification issues, we cannot predict the outcome of these lawsuits at this time. Accordingly, we cannot estimate any possible loss or range of loss.
In January, 2014, the SEC advised us that it is investigating possible violations of the U.S. Foreign Corrupt Practices Act (“FCPA”) involving business activities of Key’s operations in Russia. In April 2014, we became aware of an allegation involving our Mexico operations that, if true, could potentially constitute a violation of certain of our policies, including our Code of Business Conduct, the FCPA and other applicable laws. A Special Committee of our Board of Directors is investigating this allegation as well as the possible violations of the FCPA involving business activities of our operations in Russia. The Special Committee’s investigations, which also include a review of certain aspects of the Company’s operations in Colombia, as well as our other international locations, are ongoing. On May 30, 2014, we voluntarily disclosed the allegation involving our Mexico operations and information from the Company’s initial investigation to the SEC and Department of Justice (“DOJ”). We are fully cooperating with investigations by the SEC and DOJ. At this time we are unable to predict the ultimate resolution of these matters with these agencies and, accordingly, cannot estimate any possible loss or range of loss. The Special Committee of our Board of Directors currently expects to substantially complete the fact-finding phase of its investigation by the end of March 2015.
In August 2014, two class action lawsuits were filed in the U.S. District Court, Southern District of Texas, Houston Division, individually and on behalf of all other persons similarly situated against the Company and certain officers of the Company, alleging violations of federal securities laws, specifically, violations of Section 10(b) and Rule 10(b)-5, Section 20(a) of the Securities Exchange Act of 1934. Those lawsuits were styled as follows: Sean Cady, Individually and on Behalf of All Other Persons Similarly Situated v. Key Energy Services, Inc., Richard J. Alario, and J. Marshall Dodson, No. 4:14-cv-2368, filed on August 15, 2014; and Ian W. Davidson, Individually and on Behalf of All Other Persons Similarly Situated v. Key Energy Services, Inc., Richard J. Alario, and J. Marshall Dodson, No. 4.14-cv-2403, filed on August 21, 2014. On December 11, 2014, the Court entered an order that consolidated the two lawsuits into one action, along with any future filed tag-along
74
Key Energy Services, Inc. and Subsidiaries
NOTES TO CONSOLIDATED FINANCIAL STATEMENTS — (Continued)
actions brought on behalf of purchasers of Key Energy Services, Inc. common stock. The order also appointed Inter-Local Pension Fund as the lead plaintiff in the class action and approved the law firm of Spector Roseman Kodroff & Willis, P.C. as lead counsel for the consolidated class and Kendall Law Group, LLP, as local counsel for the consolidated class. The lead plaintiff filed the consolidated amended complaint on February 13, 2015. Among other changes, the consolidated amended complaint adds Taylor M. Whichard III and Newton W. Wilson III as defendants and expands the class period to include the timeframe between September 4, 2012 and July 17, 2014. Because this case is in early stages, we cannot predict the outcome at this time. Accordingly, we cannot estimate any possible loss or range of loss.
In addition, in a letter dated September 4, 2014, a purported shareholder of the Company demanded that the Board commence an independent internal investigation into and legal proceedings against each member of the Board, a former member of the Board and certain officers of the Company for alleged violations of Maryland and/or federal law. The letter alleges that the Board and senior officers breached their fiduciary duties to the Company, including the duty of loyalty and due care, by (i) improperly accounting for goodwill, (ii) causing the Company to potentially violate the FCPA, resulting in an investigation by the SEC, (iii) causing the Company to engage in improper conduct related to the Company’s Russia operations; and (iv) making false statements regarding, and failing to properly account for, certain contracts with Pemex. As described in the letter, the purported shareholder believes that the legal proceedings should seek recovery of damages in an unspecified amount allegedly sustained by the Company. The Board of Directors has referred the demand letter to the Special Committee. We cannot predict the outcome of this matter.
Tax Audits
We are routinely the subject of audits by tax authorities, and in the past have received material assessments from tax auditors. As of December 31, 2014 and 2013, we have recorded reserves that management feels are appropriate for future potential liabilities as a result of prior audits. While we believe we have fully reserved for these assessments, the ultimate amount of settlements can vary from our estimates.
Self-Insurance Reserves
We maintain reserves for workers’ compensation and vehicle liability on our balance sheet based on our judgment and estimates using an actuarial method based on claims incurred. We estimate general liability claims on a case-by-case basis. We maintain insurance policies for workers’ compensation, vehicular liability and general liability claims. These insurance policies carry self-insured retention limits or deductibles on a per occurrence basis. The retention limits or deductibles are accounted for in our accrual process for all workers’ compensation, vehicular liability and general liability claims. As of December 31, 2014 and 2013, we have recorded $61.0 million and $62.1 million, respectively, of self-insurance reserves related to workers’ compensation, vehicular liabilities and general liability claims. Partially offsetting these liabilities, we had approximately $18.7 million and $18.5 million of insurance receivables as of December 31, 2014 and 2013, respectively. We believe that the liabilities we have recorded are appropriate based on the known facts and circumstances and do not expect further losses materially in excess of the amounts already accrued for existing claims.
Environmental Remediation Liabilities
For environmental reserve matters, including remediation efforts for current locations and those relating to previously-disposed properties, we record liabilities when our remediation efforts are probable and the costs to conduct such remediation efforts can be reasonably estimated. As of December 31, 2014 and 2013, we have recorded $5.7 million and $6.2 million, respectively, for our environmental remediation liabilities. We believe that the liabilities we have recorded are appropriate based on the known facts and circumstances and do not expect further losses materially in excess of the amounts already accrued.
We provide performance bonds to provide financial surety assurances for the remediation and maintenance of our SWD properties to comply with environmental protection standards. Costs for SWD properties may be mandatory (to comply with applicable laws and regulations), in the future (required to divest or cease operations), or for optimization (to improve operations, but not for safety or regulatory compliance).
NOTE 16. ACCUMULATED OTHER COMPREHENSIVE LOSS
The components of our accumulated other comprehensive loss are as follows (in thousands):
December 31, | |||||||
2014 | 2013 | ||||||
Foreign currency translation loss | $ | (37,280 | ) | $ | (15,414 | ) | |
Accumulated other comprehensive loss | $ | (37,280 | ) | $ | (15,414 | ) | |
75
Key Energy Services, Inc. and Subsidiaries
NOTES TO CONSOLIDATED FINANCIAL STATEMENTS — (Continued)
Upon the completion of the sale of our Argentina operations on September 14, 2012, the accumulated foreign currency translation balance related to Argentina was reversed out of our accumulated other comprehensive loss and recorded as part of our 2012 loss from discontinued operations.
The local currency is the functional currency for our operations in Russia. As of December 31, 2014 and 2013, one U.S. dollar was equal to 56.45 and 32.77 Russian rubles, respectively. As of December 31, 2011, the functional currency for Mexico, Russia and Canada was the local currency and the functional currency for Colombia and the Middle East was the U.S. dollar. Due to significant changes in economic facts and circumstances, the functional currency for Mexico and Canada was changed to the U.S. dollar effective January 1, 2012. The cumulative translation gains and losses resulting from translating financial statements from the functional currency to U.S. dollars are included in other comprehensive income and accumulated in stockholders’ equity until a partial or complete sale or liquidation of our net investment in the entity.
NOTE 17. EMPLOYEE BENEFIT PLANS
We maintain a 401(k) plan as part of our employee benefits package. We match 100% of employee contributions up to 4% of the employee’s salary, which vest immediately, into our 401(k) plan, subject to maximums of $10,400, $10,200 and $10,000 for the years ended December 31, 2014, 2013 and 2012, respectively. Our matching contributions were $10.9 million, $10.4 million and $10.7 million for the years ended December 31, 2014, 2013 and 2012, respectively. We do not offer participants the option to purchase shares of our common stock through a 401(k) plan fund.
NOTE 18. STOCKHOLDERS’ EQUITY
Common Stock
As of December 31, 2014 and 2013, we had 200,000,000 shares of common stock authorized with a par value of $0.10 per share, of which 153,557,108 shares were issued and outstanding at December 31, 2014 and 152,331,006 shares were issued and outstanding at December 31, 2013. During 2014, 2013 and 2012, no dividends were declared or paid. Under the terms of the 2021 Notes and our 2011 Credit Facility, we must meet certain financial covenants before we may pay dividends. We currently do not intend to pay dividends.
Tax Withholding
We repurchase shares of restricted common stock that have been previously granted to certain of our employees, pursuant to an agreement under which those individuals are permitted to sell shares back to us in order to satisfy the minimum income tax withholding requirements related to vesting of these grants. We repurchased a total of 290,697 shares, 416,101 shares and 482,951 shares for an aggregate cost of $2.2 million, $3.2 million and $7.5 million during 2014, 2013 and 2012, respectively, which represented the fair market value of the shares based on the price of our stock on the dates of purchase.
NOTE 19. SHARE-BASED COMPENSATION
2014 Incentive Plan
On May 15, 2014, our stockholders approved the 2014 Equity and Cash Incentive Plan (the “2014 Incentive Plan”). The 2014 Incentive Plan is administered by our board of directors or a committee designated by our board of directors (the “Committee”). Our board of directors or the Committee (the “Administrator”) will have the power and authority to select Participants (as defined below) in the 2014 Plan and grant Awards as defined below) to such Participants pursuant to the terms of the 2014 Incentive Plan. The 2014 Incentive Plan expires May 15, 2024. The 2014 Plan was established as a successor to the Company’s 2012 Equity Cash and Incentive Plan (the “2012 Incentive Plan” ), the 2009 Equity Cash and Incentive Plan (the “2009 Incentive Plan” ) and the 2007 Equity Cash and Incentive Plan (the “2007 Incentive Plan”, collectively with the 2012 Plan and the 2009 Plan, the “Prior Plans”). The Prior Plans were merged with and into the 2014 Plan effective as of May 15, 2014. Outstanding awards under the Prior Plans will continue in effect according to their terms as in effect before the merger of the Prior Plans into the 2014 Plan (subject to such amendments as the Administrator deems appropriate), and the shares with respect to outstanding grants under the Prior Plans will be issued or transferred under the 2014 Plan. No additional grants will be made under the Prior Plans.
Subject to adjustment, the total number of shares of our common stock that will be available for grant of Awards under the 2014 Plan may not exceed 12,310,750 shares; however, for purposes of this limitation, any stock subject to an Award that is canceled, forfeited, expires or otherwise terminates without the issuance of stock, is settled in cash, or is exchanged with the Administrator's permission, prior to the issuance of stock, for an Award not involving stock, will again become available for issuance under the 2014 Incentive Plan. Awards may be in the form of stock options (incentive stock options and nonqualified
76
Key Energy Services, Inc. and Subsidiaries
NOTES TO CONSOLIDATED FINANCIAL STATEMENTS — (Continued)
stock options), restricted stock, restricted stock units, performance compensation awards and SARs (collectively, "Awards"). Awards may be granted to employees, directors and, in some cases, consultants and those individuals whom the Administrator determines are reasonably expected to become employees, directors or consultants following the grant date of the Award (“Participants”). However, incentive stock options may be granted only to employees.
Our board of directors at any time, and from time to time, may amend or terminate the 2014 Incentive Plan. However, except as provided otherwise in the 2014 Incentive Plan, no amendment will be effective unless approved by the stockholders of the Company to the extent stockholder approval is necessary to satisfy any applicable law or securities exchange listing requirements. Further, if the exercise price of an option, including an incentive stock option, exceeds the fair market value of our common stock on a given date, the Committee has the authority to reduce the exercise price of such option to a new exercise price that is no less than the then-current fair market value of our common stock; provided that such action shall first have been approved by a vote of our stockholders. The Administrator at any time, and from time to time, may amend the terms of any one or more Awards; however, if the amendment would constitute an impairment of the rights under any Award, we must request the consent of the Participant and the Participant must consent in writing. It is expressly contemplated that the board may amend the 2014 Incentive Plan in any respect our board of directors deem necessary or advisable to provide eligible employees with the maximum benefits provided or to be provided under the provisions of the Internal Revenue Code of 1986, as amended, and the regulations promulgated thereunder relating to incentive stock options and/or to bring the 2014 Incentive Plan and/or Awards granted under it into compliance therewith. As of December 31, 2014, there were 10.0 million shares available for grant under the 2014 Incentive Plan.
Stock Option Awards
Stock option awards granted under our incentive plans have a maximum contractual term of ten years from the date of grant. Shares issuable upon exercise of a stock option are issued from authorized but unissued shares of our common stock. The following tables summarize the stock option activity (shares in thousands):
Year Ended December 31, 2014 | ||||||||||
Options | Weighted Average Exercise Price | Weighted Average Fair Value | ||||||||
Outstanding at beginning of period | 1,372 | $ | 14.10 | $ | 6.00 | |||||
Granted | — | $ | — | $ | — | |||||
Exercised | — | $ | — | $ | — | |||||
Cancelled or expired | (53 | ) | $ | 14.70 | $ | 6.23 | ||||
Outstanding at end of period | 1,319 | $ | 14.07 | $ | 5.99 | |||||
Exercisable at end of period | 1,319 | $ | 14.07 | $ | 5.99 | |||||
We did not grant any stock options during the years ended December 31, 2014, 2013 and 2012. No stock options vested during the year ended December 31, 2014. We recognized zero, zero and less than $0.1 million in pre-tax expense related to stock options for the years ended December 31, 2014, 2013 and 2012, respectively. We recognized tax benefits of zero, zero and less than $0.1 million, related to our stock options for the years ended December 31, 2014, 2013 and 2012, respectively. All of the stock option awards were vested as of December 31, 2012. The weighted average remaining contractual term for stock option awards exercisable as of December 31, 2014 is 1.3 years. The intrinsic value of the options exercised for the years ended December 31, 2014, 2013 and 2012 was zero, less than $0.1 million and $0.6 million, respectively. We received no cash from the exercise of options for the year ended December 31, 2014 with zero associated tax benefits.
77
Key Energy Services, Inc. and Subsidiaries
NOTES TO CONSOLIDATED FINANCIAL STATEMENTS — (Continued)
Common Stock Awards
Our common stock awards include restricted stock awards and restricted stock units. The weighted average grant date fair market value of all common stock awards granted during the years ended December 31, 2014, 2013 and 2012 was $7.31, $7.56, $13.44, respectively. The total fair market value of all common stock awards vested during the years ended December 31, 2014, 2013 and 2012 was $12.0 million, $16.6 million and $14.2 million, respectively.
The following tables summarize information for the year ended December 31, 2014 about our unvested common stock awards that we have outstanding (shares in thousands):
Year Ended December 31, 2014 | ||||||
Outstanding | Weighted Average Issuance Price | |||||
Shares at beginning of period | 2,246 | $ | 9.68 | |||
Granted | 1,893 | $ | 7.31 | |||
Vested | (1,187 | ) | $ | 10.12 | ||
Cancelled | (386 | ) | $ | 8.41 | ||
Shares at end of period | 2,566 | $ | 7.92 | |||
We have issued 197,865 shares, 288,780 shares and 153,063 shares of common stock to our non-employee directors that vested immediately upon issuance during 2014, 2013 and 2012, respectively. For common stock grants that vest immediately upon issuance, we record expense equal to the fair market value of the shares on the date of grant. For common stock awards that do not immediately vest, we recognize compensation expense ratably over the graded vesting period of the grant, net of estimated and actual forfeitures. For the years ended December 31, 2014, 2013 and 2012, we recognized $10.9 million, $13.8 million and $13.3 million, respectively, of pre-tax expense from continuing operations associated with common stock awards, including common stock grants to our outside directors. In connection with the expense related to common stock awards recognized during the year ended December 31, 2014, we recognized tax benefits of $3.8 million. Tax benefits for the years ended December 31, 2013 and 2012 were $5.2 million and $4.2 million, respectively. For the unvested common stock awards outstanding as of December 31, 2014, we anticipate that we will recognize $8.2 million of pre-tax expense over the next 0.9 years.
Performance Units
On January 30, 2014, the Compensation Committee of the Board of Directors adopted the 2014 Performance Unit Plan (the “2014 PU Plan”) and granted performance units pursuant to the Performance Award Agreement (“2012 PU Award Agreement”) under the Key Energy Services, Inc. 2012 Equity and Cash Incentive Plan (the “2012 Plan”). We believe that the 2014 PU Plan and 2012 PU Award Agreement will enable us to obtain and retain employees who will contribute to our long term success by aligning the interests of our executives with the interests of our stockholders by providing compensation that is linked directly to increases in share value.
78
Key Energy Services, Inc. and Subsidiaries
NOTES TO CONSOLIDATED FINANCIAL STATEMENTS — (Continued)
In January 2014, we issued 0.5 million performance units to our executive officers under the 2012 Plan with such material terms as set forth in the 2012 PU Award Agreement. In February 2014, we issued 0.1 million performance units to certain other employees under the 2014 PU Plan. The performance units are measured based on two performance periods from January 1, 2014 to December 31, 2014 and from January 1, 2015 to December 31, 2015. One half of the performance units are measured based on the first performance period, and the other half are measured based on the second performance period. The number of performance units that may be earned by a participant is determined at the end of each performance period based on the relative placement of Key’s total stockholder return for that period within the peer group, as follows:
Company Placement for the Performance Period | Percentile Ranking in Peer Group | Performance Units Earned as a Percentage of Target | ||||
First | 100 | % | 200 | % | ||
Second | 91 | % | 180 | % | ||
Third | 82 | % | 160 | % | ||
Fourth | 73 | % | 140 | % | ||
Fifth | 64 | % | 120 | % | ||
Sixth | 55 | % | 100 | % | ||
Seventh | 45 | % | 75 | % | ||
Eighth | 36 | % | 50 | % | ||
Ninth | 27 | % | 25 | % | ||
Tenth | 18 | % | — | % | ||
Eleventh | 9 | % | — | % | ||
Twelfth | — | % | — | % | ||
If any performance units vest for a given performance period, the award holder will be paid a cash amount equal to the vested percentage of the performance units multiplied by the closing stock price of our common stock on the last trading day of the performance period. We account for the performance units as a liability-type award as they are settled in cash. As of December 31, 2014, the fair value of outstanding performance units was $0.5 million, and is being accreted to compensation expense over the vesting terms of the awards. As of December 31, 2014, the unrecognized compensation cost related to our unvested performance units is estimated to be $0.3 million and is expected to be recognized over a weighted-average period of 1.0 years.
Phantom Share Plan
In December 2006, we announced the implementation of a “Phantom Share Plan,” in which certain of our employees were granted “Phantom Shares.” Phantom Shares vest ratably over a four-year period and convey the right to the grantee to receive a cash payment on the anniversary date of the grant equal to the fair market value of the Phantom Shares vesting on that date. Grantees are not permitted to defer this payment to a later date. The Phantom Shares are a “liability” type award and we account for these awards at fair value. We recognize compensation expense related to the Phantom Shares based on the change in the fair value of the awards during the period and the percentage of the service requirement that has been performed, net of estimated and actual forfeitures, with an offsetting liability recorded on our consolidated balance sheets. We recognized pre-tax compensation benefit from continuing operations, associated with the Phantom Shares of zero, zero and less than $0.1 million for the years ended December 31, 2014, 2013 and 2012, respectively. As of December 31, 2014, no Phantom Shares were outstanding.
We recognized income tax benefit associated with the Phantom Shares of zero, zero and less than $0.1 million for the years ended December 31, 2014, 2013 and 2012, respectively. During 2014, there were no cash payments related to the Phantom Shares.
79
Key Energy Services, Inc. and Subsidiaries
NOTES TO CONSOLIDATED FINANCIAL STATEMENTS — (Continued)
Stock Appreciation Rights
In August 2007, we issued approximately 587,000 SARs to our executive officers. Each SAR has a ten-year term from the date of grant. The vesting of all outstanding SAR awards was accelerated during the fourth quarter of 2008. Upon the exercise of a SAR, the recipient will receive an amount equal to the difference between the exercise price and the fair market value of a share of our common stock on the date of exercise, multiplied by the number of shares of common stock for which the SAR was exercised. All payments will be made in shares of our common stock. Prior to exercise, the SAR does not entitle the recipient to receive any shares of our common stock and does not provide the recipient with any voting or other stockholders’ rights. We account for these SARs as equity awards and recognize compensation expense ratably over the vesting period of the SAR based on their fair value on the date of issuance, net of estimated and actual forfeitures. We did not recognize any expense associated with these awards during 2014, 2013 and 2012. We did not forfeit any SARs during 2014. As of December 31, 2014, 0.3 million SARs remained unexercised.
NOTE 20. TRANSACTIONS WITH RELATED PARTIES
Board of Director Relationships
A member of our board of directors is the Executive Vice President, General Counsel and Chief Administrative Officer of Anadarko Petroleum Corporation (“Anadarko”), which is one of our customers. Sales to Anadarko were $32.5 million, $41.2 million and $37.0 million for the years ended December 31, 2014, 2013 and 2012, respectively. Receivables outstanding from Anadarko were $2.9 million and $4.9 million as of December 31, 2014 and 2013, respectively. Transactions with Anadarko for our services are made on terms consistent with other customers.
A member of our board of directors serves on the United States Advisory Board of the Alexander Proudfoot practice of Management Consulting Group PLC (“Proudfoot”), which provided consulting services related to our general and administrative cost restructuring initiative in 2012. Payments to Proudfoot were zero, zero and $1.9 million for the years ended December 31, 2014, 2013 and 2012, respectively.
NOTE 21. SUPPLEMENTAL CASH FLOW INFORMATION
Year Ended December 31, | |||||||||||
2014 | 2013 | 2012 | |||||||||
(in thousands) | |||||||||||
Noncash investing and financing activities: | |||||||||||
Sale of Argentina operations/Notes receivable | $ | — | $ | — | $ | 12,955 | |||||
Asset retirement obligations | — | 174 | — | ||||||||
Supplemental cash flow information: | |||||||||||
Cash paid for interest | $ | 51,589 | $ | 53,504 | $ | 48,217 | |||||
Cash paid for taxes | 2,699 | 35,239 | 13,148 | ||||||||
Tax refunds | 13,109 | 26,361 | 18,681 | ||||||||
Cash paid for interest includes cash payments for interest on our long-term debt and capital lease obligations, and commitment and agency fees paid.
NOTE 22. SEGMENT INFORMATION
We revised our reportable business segments as of the fourth quarter of 2014. The revised reportable segments are U.S. Rig Services, Fluid Management Services, Coiled Tubing Services, Fishing and Rental Services and International. We also have a “Functional Support” segment associated with overhead costs in support of our reportable segments. Segment disclosures as of and for the years ended December 31, 2013 and 2012 have been revised to reflect the change in reportable segments. We revised our segments to reflect changes in management’s resource allocation and performance assessment in making decisions regarding our business. Our U.S. Rig Services, Fluid Management Services, Coiled Tubing Services, Fishing and Rental Services operate geographically within the United States. The International reportable segment includes our operations in Mexico, Colombia, Ecuador, Russia, Bahrain and Oman. Our Canadian subsidiary is also reflected in our International reportable segment. We evaluate the performance of our segments based on gross margin measures. All inter-segment sales pricing is based on current market conditions. These changes reflect our current operating focus in compliance with ASC 280. We aggregate services that create our reportable segments in accordance with ASC 280, and the accounting policies for our segments are the same as those described in “Note 1. Organization and Summary of Significant Accounting Policies” above.
80
Key Energy Services, Inc. and Subsidiaries
NOTES TO CONSOLIDATED FINANCIAL STATEMENTS — (Continued)
U.S. Rig Services
Our U.S. Rig Services include the completion of newly drilled wells, workover and recompletion of existing oil and natural gas wells, well maintenance, and the plugging and abandonment of wells at the end of their useful lives. We also provide specialty drilling services to oil and natural gas producers with certain of our larger rigs that are capable of providing conventional and horizontal drilling services. Our rigs encompass various sizes and capabilities, allowing us to service all types of wells with depths up to 20,000 feet. Many of our rigs are outfitted with our proprietary KeyView® technology, which captures and reports well site operating data and provides safety control systems. We believe that this technology allows our customers and our crews to better monitor well site operations, improves efficiency and safety, and adds value to the services that we offer.
The completion and recompletion services provided by our rigs prepare wells for production, whether newly drilled, or recently extended through a workover operation. The completion process may involve selectively perforating the well casing to access production zones, stimulating and testing these zones, and installing tubular and downhole equipment. We typically provide a well service rig and may also provide other equipment to assist in the completion process. Completion services vary by well and our work may take a few days to several weeks to perform, depending on the nature of the completion.
The workover services that we provide are designed to enhance the production of existing wells and generally are more complex and time consuming than normal maintenance services. Workover services can include deepening or extending wellbores into new formations by drilling horizontal or lateral wellbores, sealing off depleted production zones and accessing previously bypassed production zones, converting former production wells into injection wells for enhanced recovery operations and conducting major subsurface repairs due to equipment failures. Workover services may last from a few days to several weeks, depending on the complexity of the workover.
Maintenance services provided with our rig fleet are generally required throughout the life cycle of an oil or natural gas well. Examples of these maintenance services include routine mechanical repairs to the pumps, tubing and other equipment, removing debris and formation material from wellbores, and pulling rods and other downhole equipment from wellbores to identify and resolve production problems. Maintenance services are generally less complicated than completion and workover related services and require less time to perform.
Our rig fleet is also used in the process of permanently shutting-in oil or natural gas wells that are at the end of their productive lives. These plugging and abandonment services generally require auxiliary equipment in addition to a well servicing rig. The demand for plugging and abandonment services is not significantly impacted by the demand for oil and natural gas because well operators are required by state regulations to plug wells that are no longer productive.
Fluid Management Services
We provide transportation and well-site storage services for various fluids utilized in connection with drilling, completions, workover and maintenance activities. We also provide disposal services for fluids produced subsequent to well completion. These fluids are removed from the well site and transported for disposal in SWD wells owned by us or a third party. In addition, we operate a fleet of hot oilers capable of pumping heated fluids used to clear soluble restrictions in a wellbore. Demand and pricing for these services generally correspond to demand for our well service rigs.
Coiled Tubing Services
Coiled Tubing Services involve the use of a continuous metal pipe spooled onto a large reel which is then deployed into oil and natural gas wells to perform various applications, such as wellbore clean-outs, nitrogen jet lifts, through-tubing fishing, and formation stimulations utilizing acid and chemical treatments. Coiled tubing is also used for a number of horizontal well applications such as milling temporary isolation plugs that separate frac zones, and various other pre- and post- hydraulic fracturing well preparation services.
Fishing and Rental Services
We offer a full line of services and rental equipment designed for use in providing both onshore and offshore drilling and workover services. Fishing services involve recovering lost or stuck equipment in the wellbore utilizing a broad array of “fishing tools.” Our rental tool inventory consists of drill pipe, tubulars, handling tools (including our patented Hydra-Walk® pipe-handling units and services), pressure-control equipment, pumps, power swivels, reversing units, foam air units frac stack equipment used to support hydraulic fracturing operations and the associated flowback of frac fluids, proppants, oil and natural gas. We also provide well testing services.
Demand for our Fishing and Rental Services is closely related to capital spending by oil and natural gas producers, which is generally a function of oil and natural gas prices.
81
Key Energy Services, Inc. and Subsidiaries
NOTES TO CONSOLIDATED FINANCIAL STATEMENTS — (Continued)
International
Our International segment includes operations in Mexico, Colombia, Ecuador, the Middle East and Russia. In addition, we have a technology development and control systems business based in Canada. Also, prior to the sale of our Argentina business in the third quarter of 2012, we operated in Argentina. We are reporting the results of our Argentina business as discontinued operations for the 2012 period. We provide rig-based services such as the maintenance, workover, recompletion of existing oil wells, completion of newly-drilled wells, and plugging and abandonment of wells at the end of their useful lives in each of our international markets.
In addition, in Mexico we provide drilling, coiled tubing, wireline and project management and consulting services. Our work in Mexico also requires us to provide third party services which varies in scope by project.
In the Middle East, we operate in the Kingdom of Bahrain and Oman. On August 5, 2013, we agreed to the dissolution of AlMansoori Key Energy Services, LLC, a joint venture formed under the laws of Abu Dhabi, UAE, and the acquisition of the underlying business for $5.1 million. See “Note 2. Acquisitions” for further discussion.
Our Russian operations provide drilling, workover, and reservoir engineering services. On April 9, 2013, we completed the acquisition of the remaining 50% noncontrolling interest in Geostream for $14.6 million. We now own 100% of Geostream. See “Note 2. Acquisitions” for further discussion.
Our technology development and control systems business based in Canada is focused on the development of hardware and software related to oilfield service equipment controls, data acquisition and digital information flow.
Functional Support
Our Functional Support segment includes unallocated overhead costs associated with administrative support for our U.S. and International reporting segments.
82
Key Energy Services, Inc. and Subsidiaries
NOTES TO CONSOLIDATED FINANCIAL STATEMENTS — (Continued)
Financial Summary
The following table presents our segment information as of and for the years ended December 31, 2014, 2013 and 2012 (in thousands):
As of and for the year ended December 31, 2014
U.S. Rig Service | Fluid Management Services | Coiled Tubing Services | Fishing and Rental Services | International | Functional Support(2) | Reconciling Eliminations | Total | ||||||||||||||||||||||||
Revenues from external customers | $ | 679,045 | $ | 249,589 | $ | 173,364 | $ | 212,598 | $ | 112,740 | $ | — | $ | — | $ | 1,427,336 | |||||||||||||||
Intersegment revenues | 706 | 1,258 | — | 6,078 | 9,142 | 1,988 | (19,172 | ) | — | ||||||||||||||||||||||
Depreciation and amortization | 59,190 | 31,870 | 23,375 | 44,004 | 30,311 | 11,988 | — | 200,738 | |||||||||||||||||||||||
Impairment expense | — | — | 19,100 | 73,389 | 28,687 | — | — | 121,176 | |||||||||||||||||||||||
Other operating expenses | 523,468 | 214,392 | 141,708 | 154,149 | 119,174 | 156,406 | — | 1,309,297 | |||||||||||||||||||||||
Operating income (loss) | 96,387 | 3,327 | (10,819 | ) | (58,944 | ) | (65,432 | ) | (168,394 | ) | — | (203,875 | ) | ||||||||||||||||||
Interest expense, net of amounts capitalized | — | — | — | — | 32 | 54,195 | — | 54,227 | |||||||||||||||||||||||
Income (loss) from continuing operations before tax | 96,922 | 3,581 | (10,442 | ) | (58,794 | ) | (68,924 | ) | (221,454 | ) | — | (259,111 | ) | ||||||||||||||||||
Long-lived assets(1) | 796,654 | 181,041 | 196,265 | 326,218 | 270,893 | 278,904 | (150,272 | ) | 1,899,703 | ||||||||||||||||||||||
Total assets | 1,608,122 | 295,670 | 260,375 | 669,823 | 397,295 | (510,229 | ) | (387,558 | ) | 2,333,498 | |||||||||||||||||||||
Capital expenditures, excluding acquisitions | 90,982 | 3,920 | 10,815 | 30,389 | 7,560 | 17,973 | — | 161,639 | |||||||||||||||||||||||
83
Key Energy Services, Inc. and Subsidiaries
NOTES TO CONSOLIDATED FINANCIAL STATEMENTS — (Continued)
As of and for the year ended December 31, 2013
U.S. Rig Service | Fluid Management Services | Coiled Tubing Services | Fishing and Rental Services | International | Functional Support(2) | Reconciling Eliminations | Total | ||||||||||||||||||||||||
Revenues from external customers | $ | 673,465 | $ | 271,709 | $ | 193,184 | $ | 238,611 | $ | 214,707 | $ | — | $ | — | $ | 1,591,676 | |||||||||||||||
Intersegment revenues | 4,283 | 700 | 10 | 5,637 | 8,715 | 509 | (19,854 | ) | — | ||||||||||||||||||||||
Depreciation and amortization | 64,804 | 37,510 | 25,877 | 53,785 | 30,227 | 13,094 | — | 225,297 | |||||||||||||||||||||||
Other operating expenses | 475,103 | 230,161 | 143,880 | 153,517 | 211,137 | 122,417 | — | 1,336,215 | |||||||||||||||||||||||
Operating income (loss) | 133,558 | 4,038 | 23,427 | 31,309 | (26,657 | ) | (135,511 | ) | — | 30,164 | |||||||||||||||||||||
Interest expense, net of amounts capitalized | 1 | — | — | — | 62 | 55,141 | — | 55,204 | |||||||||||||||||||||||
Income (loss) from continuing operations before tax | 133,642 | 4,110 | 23,436 | 31,351 | (26,795 | ) | (189,981 | ) | — | (24,237 | ) | ||||||||||||||||||||
Long-lived assets(1) | 746,021 | 222,075 | 246,889 | 420,486 | 333,273 | 301,032 | (188,459 | ) | 2,081,317 | ||||||||||||||||||||||
Total assets | 1,511,419 | 279,950 | 246,180 | 637,163 | 497,938 | (181,940 | ) | (403,240 | ) | 2,587,470 | |||||||||||||||||||||
Capital expenditures, excluding acquisitions | 79,761 | 7,307 | 12,682 | 25,378 | 19,541 | 19,468 | — | 164,137 | |||||||||||||||||||||||
84
Key Energy Services, Inc. and Subsidiaries
NOTES TO CONSOLIDATED FINANCIAL STATEMENTS — (Continued)
As of and for the year ended December 31, 2012
U.S. Rig Service | Fluid Management Services | Coiled Tubing Services | Fishing and Rental Services | International | Functional Support(2) | Reconciling Eliminations | Total | ||||||||||||||||||||||||
Revenues from external customers | $ | 788,512 | $ | 353,597 | $ | 215,876 | $ | 268,783 | $ | 333,302 | $ | — | $ | — | $ | 1,960,070 | |||||||||||||||
Intersegment revenues | 39,257 | 263 | 15 | 4,332 | 6,273 | 15 | (50,155 | ) | — | ||||||||||||||||||||||
Depreciation and amortization | 69,513 | 40,637 | 25,205 | 47,147 | 19,643 | 11,638 | — | 213,783 | |||||||||||||||||||||||
Other operating expenses | 524,704 | 287,396 | 175,542 | 171,283 | 250,667 | 129,749 | — | 1,539,341 | |||||||||||||||||||||||
Operating income (loss) | 194,295 | 25,564 | 15,129 | 50,353 | 62,992 | (141,387 | ) | — | 206,946 | ||||||||||||||||||||||
Interest expense, net of amounts capitalized | 11 | — | 1 | 5 | 172 | 53,377 | — | 53,566 | |||||||||||||||||||||||
Income (loss) from continuing operations before tax | 194,558 | 25,712 | 15,182 | 50,394 | 68,036 | (193,853 | ) | — | 160,029 | ||||||||||||||||||||||
Long-lived assets(1) | 749,031 | 250,872 | 265,786 | 453,690 | 334,329 | 286,369 | (168,283 | ) | 2,171,794 | ||||||||||||||||||||||
Total assets | 1,343,275 | 261,310 | 215,125 | 595,963 | 541,882 | 153,665 | (349,632 | ) | 2,761,588 | ||||||||||||||||||||||
Capital expenditures, excluding acquisitions | 69,105 | 35,491 | 45,545 | 97,660 | 171,095 | 28,264 | — | 447,160 | |||||||||||||||||||||||
(1) | Long-lived assets include: fixed assets, goodwill, intangibles and other assets. |
(2) | Functional Support is geographically located in the United States. |
NOTE 23. UNAUDITED QUARTERLY RESULTS OF OPERATIONS
The following table presents our summarized, unaudited quarterly information for the two most recent years covered by these consolidated financial statements (in thousands, except for per share data):
First Quarter | Second Quarter | Third Quarter | Fourth Quarter | ||||||||||||
Year Ended December 31, 2014: | |||||||||||||||
Revenues | $ | 356,141 | $ | 350,595 | $ | 365,798 | $ | 354,802 | |||||||
Direct operating expenses | 258,302 | 262,883 | 272,112 | 266,354 | |||||||||||
Net loss | (11,899 | ) | (52,196 | ) | (62,229 | ) | (52,304 | ) | |||||||
Loss attributable to Key | (11,899 | ) | (52,196 | ) | (62,229 | ) | (52,304 | ) | |||||||
Loss per share(1): | |||||||||||||||
Basic and Diluted | (0.08 | ) | (0.34 | ) | (0.41 | ) | (0.34 | ) | |||||||
85
Key Energy Services, Inc. and Subsidiaries
NOTES TO CONSOLIDATED FINANCIAL STATEMENTS — (Continued)
First Quarter | Second Quarter | Third Quarter | Fourth Quarter | ||||||||||||
Year Ended December 31, 2013: | |||||||||||||||
Revenues | $ | 428,449 | $ | 411,390 | $ | 389,673 | $ | 362,164 | |||||||
Direct operating expenses | 299,182 | 287,102 | 268,297 | 259,881 | |||||||||||
Net loss | (186 | ) | (3,772 | ) | (4,697 | ) | (12,518 | ) | |||||||
Loss attributable to Key | (274 | ) | (4,128 | ) | (4,848 | ) | (12,518 | ) | |||||||
Loss per share(1): | |||||||||||||||
Basic and Diluted | — | (0.03 | ) | (0.03 | ) | (0.08 | ) | ||||||||
(1) | Quarterly earnings per common share are based on the weighted average number of shares outstanding during the quarter, and the sum of the quarters may not equal annual earnings per common share. |
NOTE 24. CONDENSED CONSOLIDATING FINANCIAL STATEMENTS
Our 2021 Notes are guaranteed by virtually all of our domestic subsidiaries, all of which are wholly owned. The guarantees are joint and several, full, complete and unconditional. There are no restrictions on the ability of subsidiary guarantors to transfer funds to the parent company.
As a result of these guarantee arrangements, we are required to present the following condensed consolidating financial information pursuant to SEC Regulation S-X Rule 3-10, “Financial Statements of Guarantors and Issuers of Guaranteed Securities Registered or Being Registered.”
CONDENSED CONSOLIDATING BALANCE SHEETS
December 31, 2014 | |||||||||||||||||||
Parent Company | Guarantor Subsidiaries | Non-Guarantor Subsidiaries | Eliminations | Consolidated | |||||||||||||||
(in thousands) | |||||||||||||||||||
Assets: | |||||||||||||||||||
Current assets | $ | 39,020 | $ | 341,188 | $ | 53,587 | $ | — | $ | 433,795 | |||||||||
Property and equipment, net | — | 1,128,776 | 106,482 | — | 1,235,258 | ||||||||||||||
Goodwill | — | 578,358 | 4,381 | — | 582,739 | ||||||||||||||
Deferred financing costs, net | 10,735 | — | — | — | 10,735 | ||||||||||||||
Intercompany notes and accounts receivable and investment in subsidiaries | 3,170,874 | 1,426,160 | 42,352 | (4,639,386 | ) | — | |||||||||||||
Other assets | — | 56,664 | 14,307 | — | 70,971 | ||||||||||||||
TOTAL ASSETS | $ | 3,220,629 | $ | 3,531,146 | $ | 221,109 | $ | (4,639,386 | ) | $ | 2,333,498 | ||||||||
Liabilities and equity: | |||||||||||||||||||
Current liabilities | $ | 22,046 | $ | 192,079 | $ | 27,733 | $ | — | $ | 241,858 | |||||||||
Long-term debt and capital leases, less current portion | 748,426 | — | — | — | 748,426 | ||||||||||||||
Intercompany notes and accounts payable | 1,162,648 | 2,696,051 | 123,810 | (3,982,509 | ) | — | |||||||||||||
Deferred tax liabilities | 228,199 | 398 | (134 | ) | (69 | ) | 228,394 | ||||||||||||
Other long-term liabilities | 1,264 | 55,182 | 311 | — | 56,757 | ||||||||||||||
Equity | 1,058,046 | 587,436 | 69,389 | (656,808 | ) | 1,058,063 | |||||||||||||
TOTAL LIABILITIES AND EQUITY | $ | 3,220,629 | $ | 3,531,146 | $ | 221,109 | $ | (4,639,386 | ) | $ | 2,333,498 | ||||||||
86
Key Energy Services, Inc. and Subsidiaries
NOTES TO CONSOLIDATED FINANCIAL STATEMENTS — (Continued)
CONDENSED CONSOLIDATING BALANCE SHEETS
December 31, 2013 | |||||||||||||||||||
Parent Company | Guarantor Subsidiaries | Non-Guarantor Subsidiaries | Eliminations | Consolidated | |||||||||||||||
(in thousands) | |||||||||||||||||||
Assets: | |||||||||||||||||||
Current assets | $ | 50,321 | $ | 398,188 | $ | 57,644 | $ | — | $ | 506,153 | |||||||||
Property and equipment, net | — | 1,244,216 | 121,430 | — | 1,365,646 | ||||||||||||||
Goodwill | — | 597,457 | 27,418 | — | 624,875 | ||||||||||||||
Deferred financing costs, net | 13,897 | — | — | — | 13,897 | ||||||||||||||
Intercompany notes and accounts receivable and investment in subsidiaries | 3,421,607 | 1,364,174 | 12,939 | (4,798,720 | ) | — | |||||||||||||
Other assets | — | 34,278 | 42,621 | — | 76,899 | ||||||||||||||
TOTAL ASSETS | $ | 3,485,825 | $ | 3,638,313 | $ | 262,052 | $ | (4,798,720 | ) | $ | 2,587,470 | ||||||||
Liabilities and equity: | |||||||||||||||||||
Current liabilities | $ | 26,097 | $ | 182,497 | $ | 23,750 | $ | — | $ | 232,344 | |||||||||
Long-term debt and capital leases, less current portion | 763,981 | — | — | — | 763,981 | ||||||||||||||
Intercompany notes and accounts payable | 1,162,648 | 2,667,943 | 97,050 | (3,927,641 | ) | — | |||||||||||||
Deferred tax liabilities | 280,828 | 4,643 | (1,819 | ) | 801 | 284,453 | |||||||||||||
Other long-term liabilities | 1,195 | 54,486 | (82 | ) | — | 55,599 | |||||||||||||
Equity | 1,251,076 | 728,744 | 143,153 | (871,880 | ) | 1,251,093 | |||||||||||||
TOTAL LIABILITIES AND EQUITY | $ | 3,485,825 | $ | 3,638,313 | $ | 262,052 | $ | (4,798,720 | ) | $ | 2,587,470 | ||||||||
87
Key Energy Services, Inc. and Subsidiaries
NOTES TO CONSOLIDATED FINANCIAL STATEMENTS — (Continued)
CONDENSED CONSOLIDATING STATEMENTS OF OPERATIONS
Year Ended December 31, 2014 | |||||||||||||||||||
Parent Company | Guarantor Subsidiaries | Non-Guarantor Subsidiaries | Eliminations | Consolidated | |||||||||||||||
(in thousands) | |||||||||||||||||||
Revenues | $ | — | $ | 1,325,670 | $ | 125,262 | $ | (23,596 | ) | 1,427,336 | |||||||||
Direct operating expense | — | 979,018 | 90,584 | (9,951 | ) | 1,059,651 | |||||||||||||
Depreciation and amortization expense | — | 187,676 | 13,062 | — | 200,738 | ||||||||||||||
General and administrative expense | 941 | 239,276 | 23,054 | (13,625 | ) | 249,646 | |||||||||||||
Impairment expense | — | 92,489 | 28,687 | — | 121,176 | ||||||||||||||
Operating loss | (941 | ) | (172,789 | ) | (30,125 | ) | (20 | ) | (203,875 | ) | |||||||||
Interest expense, net of amounts capitalized | 54,195 | — | 32 | — | 54,227 | ||||||||||||||
Other (income) expense, net | (1,976 | ) | 666 | 2,276 | 43 | 1,009 | |||||||||||||
Loss from continuing operations before taxes | (53,160 | ) | (173,455 | ) | (32,433 | ) | (63 | ) | (259,111 | ) | |||||||||
Income tax benefit | 68,883 | 10,551 | 1,179 | (130 | ) | 80,483 | |||||||||||||
Income (loss) from continuing operations | 15,723 | (162,904 | ) | (31,254 | ) | (193 | ) | (178,628 | ) | ||||||||||
Discontinued operations | — | — | — | — | — | ||||||||||||||
Net income (loss) | 15,723 | (162,904 | ) | (31,254 | ) | (193 | ) | (178,628 | ) | ||||||||||
Income attributable to noncontrolling interest | — | — | — | — | — | ||||||||||||||
INCOME (LOSS) ATTRIBUTABLE TO KEY | $ | 15,723 | $ | (162,904 | ) | $ | (31,254 | ) | $ | (193 | ) | $ | (178,628 | ) | |||||
Year Ended December 31, 2013 | |||||||||||||||||||
Parent Company | Guarantor Subsidiaries | Non-Guarantor Subsidiaries | Eliminations | Consolidated | |||||||||||||||
(in thousands) | |||||||||||||||||||
Revenues | $ | — | $ | 1,494,683 | $ | 161,536 | $ | (64,543 | ) | $ | 1,591,676 | ||||||||
Direct operating expense | — | 1,046,376 | 118,028 | (49,942 | ) | 1,114,462 | |||||||||||||
Depreciation and amortization expense | — | 214,334 | 10,963 | — | 225,297 | ||||||||||||||
General and administrative expense | 1,077 | 202,599 | 33,336 | (15,259 | ) | 221,753 | |||||||||||||
Operating income (loss) | (1,077 | ) | 31,374 | (791 | ) | 658 | 30,164 | ||||||||||||
Interest expense, net of amounts capitalized | 55,747 | (606 | ) | 63 | — | 55,204 | |||||||||||||
Other (income) expense, net | (3,616 | ) | (1,126 | ) | 316 | 3,623 | (803 | ) | |||||||||||
Income (loss) from continuing operations before taxes | (53,208 | ) | 33,106 | (1,170 | ) | (2,965 | ) | (24,237 | ) | ||||||||||
Income tax (expense) benefit | (13,385 | ) | 15,456 | 993 | — | 3,064 | |||||||||||||
Income (loss) from continuing operations | (66,593 | ) | 48,562 | (177 | ) | (2,965 | ) | (21,173 | ) | ||||||||||
Discontinued operations | — | — | — | — | — | ||||||||||||||
Net income (loss) | (66,593 | ) | 48,562 | (177 | ) | (2,965 | ) | (21,173 | ) | ||||||||||
Income attributable to noncontrolling interest | — | — | 595 | — | 595 | ||||||||||||||
INCOME (LOSS) ATTRIBUTABLE TO KEY | $ | (66,593 | ) | $ | 48,562 | $ | (772 | ) | $ | (2,965 | ) | $ | (21,768 | ) | |||||
88
Key Energy Services, Inc. and Subsidiaries
NOTES TO CONSOLIDATED FINANCIAL STATEMENTS — (Continued)
CONDENSED CONSOLIDATING STATEMENTS OF OPERATIONS
Year Ended December 31, 2012 | |||||||||||||||||||
Parent Company | Guarantor Subsidiaries | Non-Guarantor Subsidiaries | Eliminations | Consolidated | |||||||||||||||
(in thousands) | |||||||||||||||||||
Revenues | $ | — | $ | 1,867,198 | $ | 165,248 | $ | (72,376 | ) | $ | 1,960,070 | ||||||||
Direct operating expense | — | 1,254,087 | 117,293 | (62,535 | ) | 1,308,845 | |||||||||||||
Depreciation and amortization expense | — | 205,755 | 8,028 | — | 213,783 | ||||||||||||||
General and administrative expense | 1,046 | 216,069 | 24,853 | (11,472 | ) | 230,496 | |||||||||||||
Operating income (loss) | (1,046 | ) | 191,287 | 15,074 | 1,631 | 206,946 | |||||||||||||
Interest expense, net of amounts capitalized | 54,690 | (1,292 | ) | 170 | (2 | ) | 53,566 | ||||||||||||
Other income, net | (5,500 | ) | (1,474 | ) | (3,142 | ) | 3,467 | (6,649 | ) | ||||||||||
Income (loss) from continuing operations before taxes | (50,236 | ) | 194,053 | 18,046 | (1,834 | ) | 160,029 | ||||||||||||
Income tax expense | (48,893 | ) | (3,385 | ) | (5,073 | ) | (1 | ) | (57,352 | ) | |||||||||
Income (loss) from continuing operations | (99,129 | ) | 190,668 | 12,973 | (1,835 | ) | 102,677 | ||||||||||||
Discontinued operations | — | — | (93,568 | ) | — | (93,568 | ) | ||||||||||||
Net income (loss) | (99,129 | ) | 190,668 | (80,595 | ) | (1,835 | ) | 9,109 | |||||||||||
Income attributable to noncontrolling interest | — | — | 1,487 | — | 1,487 | ||||||||||||||
INCOME (LOSS) ATTRIBUTABLE TO KEY | $ | (99,129 | ) | $ | 190,668 | $ | (82,082 | ) | $ | (1,835 | ) | $ | 7,622 | ||||||
89
Key Energy Services, Inc. and Subsidiaries
NOTES TO CONSOLIDATED FINANCIAL STATEMENTS — (Continued)
CONDENSED CONSOLIDATING STATEMENTS OF CASH FLOWS
Year Ended December 31, 2014 | |||||||||||||||||||
Parent Company | Guarantor Subsidiaries | Non-Guarantor Subsidiaries | Eliminations | Consolidated | |||||||||||||||
(in thousands) | |||||||||||||||||||
Net cash provided by operating activities | $ | — | $ | 158,707 | $ | 5,461 | $ | — | $ | 164,168 | |||||||||
Cash flows from investing activities: | |||||||||||||||||||
Capital expenditures | — | (154,952 | ) | (6,687 | ) | — | (161,639 | ) | |||||||||||
Payment of accrued acquisition cost of the 51% noncontrolling interest in AlMansoori Key Energy Services LLC | — | (5,100 | ) | — | — | (5,100 | ) | ||||||||||||
Intercompany notes and accounts | — | (18,892 | ) | — | 18,892 | — | |||||||||||||
Other investing activities, net | — | 19,899 | — | — | 19,899 | ||||||||||||||
Net cash used in investing activities | — | (159,045 | ) | (6,687 | ) | 18,892 | (146,840 | ) | |||||||||||
Cash flows from financing activities: | |||||||||||||||||||
Repayment of long-term debt | (3,573 | ) | — | — | — | (3,573 | ) | ||||||||||||
Proceeds from borrowings on revolving credit facility | 260,000 | — | — | — | 260,000 | ||||||||||||||
Repayments on revolving credit facility | (275,000 | ) | — | — | — | (275,000 | ) | ||||||||||||
Repurchases of common stock | (2,245 | ) | — | — | — | (2,245 | ) | ||||||||||||
Intercompany notes and accounts | 18,892 | — | — | (18,892 | ) | — | |||||||||||||
Other financing activities, net | (1,240 | ) | — | — | — | (1,240 | ) | ||||||||||||
Net cash used in financing activities | (3,166 | ) | — | — | (18,892 | ) | (22,058 | ) | |||||||||||
Effect of changes in exchange rates on cash | — | — | 3,728 | — | 3,728 | ||||||||||||||
Net increase (decrease) in cash and cash equivalents | (3,166 | ) | (338 | ) | 2,502 | — | (1,002 | ) | |||||||||||
Cash and cash equivalents at beginning of period | 23,115 | 788 | 4,403 | — | 28,306 | ||||||||||||||
Cash and cash equivalents at end of period | $ | 19,949 | $ | 450 | $ | 6,905 | $ | — | $ | 27,304 | |||||||||
90
Key Energy Services, Inc. and Subsidiaries
NOTES TO CONSOLIDATED FINANCIAL STATEMENTS — (Continued)
CONDENSED CONSOLIDATING STATEMENTS OF CASH FLOWS
Year Ended December 31, 2013 | |||||||||||||||||||
Parent Company | Guarantor Subsidiaries | Non-Guarantor Subsidiaries | Eliminations | Consolidated | |||||||||||||||
(in thousands) | |||||||||||||||||||
Net cash provided by operating activities | $ | — | $ | 222,364 | $ | 6,279 | $ | — | $ | 228,643 | |||||||||
Cash flows from investing activities: | |||||||||||||||||||
Capital expenditures | — | (157,443 | ) | (6,694 | ) | — | (164,137 | ) | |||||||||||
Acquisition of the 50% noncontrolling interest in Geostream | — | (14,600 | ) | — | — | (14,600 | ) | ||||||||||||
Intercompany notes and accounts | — | (68,597 | ) | — | 68,597 | — | |||||||||||||
Other investing activities, net | — | 17,856 | — | — | 17,856 | ||||||||||||||
Net cash used in investing activities | — | (222,784 | ) | (6,694 | ) | 68,597 | (160,881 | ) | |||||||||||
Cash flows from financing activities: | |||||||||||||||||||
Repayments of capital lease obligations | — | (393 | ) | — | — | (393 | ) | ||||||||||||
Proceeds from borrowings on revolving credit facility | 220,000 | — | — | — | 220,000 | ||||||||||||||
Repayments on revolving credit facility | (300,000 | ) | — | — | — | (300,000 | ) | ||||||||||||
Payment of deferred financing cost | (69 | ) | — | — | — | (69 | ) | ||||||||||||
Repurchases of common stock | (3,196 | ) | — | — | — | (3,196 | ) | ||||||||||||
Intercompany notes and accounts | 68,597 | — | — | (68,597 | ) | — | |||||||||||||
Other financing activities, net | (1,834 | ) | — | — | — | (1,834 | ) | ||||||||||||
Net cash used in financing activities | (16,502 | ) | (393 | ) | — | (68,597 | ) | (85,492 | ) | ||||||||||
Effect of changes in exchange rates on cash | — | — | 87 | — | 87 | ||||||||||||||
Net decrease in cash and cash equivalents | (16,502 | ) | (813 | ) | (328 | ) | — | (17,643 | ) | ||||||||||
Cash and cash equivalents at beginning of period | 39,617 | 1,601 | 4,731 | — | 45,949 | ||||||||||||||
Cash and cash equivalents at end of period | $ | 23,115 | $ | 788 | $ | 4,403 | $ | — | $ | 28,306 | |||||||||
91
Key Energy Services, Inc. and Subsidiaries
NOTES TO CONSOLIDATED FINANCIAL STATEMENTS — (Continued)
CONDENSED CONSOLIDATING STATEMENTS OF CASH FLOWS
Year Ended December 31, 2012 | |||||||||||||||||||
Parent Company | Guarantor Subsidiaries | Non-Guarantor Subsidiaries | Eliminations | Consolidated | |||||||||||||||
(in thousands) | |||||||||||||||||||
Net cash provided by operating activities | $ | — | $ | 349,208 | $ | 20,452 | $ | — | $ | 369,660 | |||||||||
Cash flows from investing activities: | |||||||||||||||||||
Capital expenditures | — | (430,045 | ) | (17,115 | ) | — | (447,160 | ) | |||||||||||
Intercompany notes and accounts | 676 | 49,926 | — | (50,602 | ) | — | |||||||||||||
Other investing activities, net | (676 | ) | 19,127 | — | — | 18,451 | |||||||||||||
Net cash used in investing activities | — | (360,992 | ) | (17,115 | ) | (50,602 | ) | (428,709 | ) | ||||||||||
Cash flows from financing activities: | |||||||||||||||||||
Proceeds from long term debt | 205,000 | — | — | — | 205,000 | ||||||||||||||
Repayments of capital lease obligations | — | (1,959 | ) | — | — | (1,959 | ) | ||||||||||||
Proceeds from borrowings on revolving credit facility | 275,000 | — | — | — | 275,000 | ||||||||||||||
Repayments on revolving credit facility | (405,000 | ) | — | — | — | (405,000 | ) | ||||||||||||
Payment of deferred financing cost | (4,597 | ) | — | — | — | (4,597 | ) | ||||||||||||
Repurchases of common stock | (7,519 | ) | — | — | — | (7,519 | ) | ||||||||||||
Intercompany notes and accounts | (49,926 | ) | (676 | ) | — | 50,602 | — | ||||||||||||
Other financing activities, net | 4,986 | 8,035 | — | — | 13,021 | ||||||||||||||
Net cash provided by financing activities | 17,944 | 5,400 | — | 50,602 | 73,946 | ||||||||||||||
Effect of changes in exchange rates on cash | — | — | (4,391 | ) | — | (4,391 | ) | ||||||||||||
Net increase (decrease) in cash and cash equivalents | 17,944 | (6,384 | ) | (1,054 | ) | — | 10,506 | ||||||||||||
Cash and cash equivalents at beginning of period | 21,673 | 7,985 | 5,785 | — | 35,443 | ||||||||||||||
Cash and cash equivalents at end of period | $ | 39,617 | $ | 1,601 | $ | 4,731 | $ | — | $ | 45,949 | |||||||||
92
ITEM 9. CHANGES IN AND DISAGREEMENTS WITH ACCOUNTANTS ON ACCOUNTING AND FINANCIAL DISCLOSURE
None.
ITEM 9A. CONTROLS AND PROCEDURES
Disclosure Controls and Procedures
We maintain a set of disclosure controls and procedures that are designed to provide reasonable assurance that information required to be disclosed in our reports filed under the Securities Exchange Act of 1934 (the “Exchange Act”) is recorded, processed, summarized, and reported within the time periods specified in the SEC’s rules and forms. Disclosure controls and procedures include, without limitation, controls and procedures designed to ensure that information required to be disclosed by us in the reports that we file or submit under the Exchange Act is accumulated and communicated to our management, including our principal executive officer and principal financial officer, as appropriate to allow timely decisions regarding required disclosure.
Our management, with the participation of our principal executive officer and principal financial officer, has evaluated the effectiveness of our disclosure controls and procedures (as such term is defined in Rules 13a-15(e) and 15d-15(e) under the Exchange Act) as of the end of the period covered by this report. Based on such evaluation, our principal executive and financial officers have concluded that our disclosure controls and procedures were effective as of the end of such period.
Management’s Report on Internal Control Over Financial Reporting
Management is responsible for establishing and maintaining adequate internal control over financial reporting. Internal control over financial reporting is a process designed to provide reasonable assurance regarding the reliability of financial reporting and the preparation of financial statements for external purposes in accordance with generally accepted accounting principles. Internal control over financial reporting includes those policies and procedures that (i) pertain to the maintenance of records that, in reasonable detail, accurately and fairly reflect our transactions and dispositions of our assets; (ii) provide reasonable assurance that transactions are recorded as necessary to permit preparation of financial statements in accordance with generally accepted accounting principles, and that our receipts and expenditures are being made only in accordance with authorizations of our management and directors; and (iii) provide reasonable assurance regarding prevention or timely detection of unauthorized acquisition, use, or disposition of our assets that could have a material effect on the financial statements.
Internal control over financial reporting cannot provide absolute assurance of achieving financial reporting objectives because of its inherent limitations. Internal control over financial reporting is a process that involves human diligence and compliance and is subject to lapses in judgment and breakdowns resulting from human failures. Internal control over financial reporting can also be circumvented by collusion or improper management override. Because of such limitations, there is a risk that material misstatements may not be prevented or detected on a timely basis by internal control over financial reporting. Also, projections of any evaluation of effectiveness to future periods are subject to the risk that controls may become inadequate because of changes in conditions, or that the degree of compliance with the policies or procedures may deteriorate. However, these inherent limitations are known features of the financial reporting process. Therefore, it is possible to design into the process safeguards to reduce, though not eliminate, this risk.
A material weakness (as defined in Rule 12b-2 under the Exchange Act) is a deficiency, or combination of deficiencies, in internal control over financial reporting such that there is a reasonable possibility that a material misstatement of the annual or interim financial statements will not be prevented or detected on a timely basis.
Management conducted an assessment of the effectiveness of our internal control over financial reporting as of December 31, 2014. In making this assessment, management used the criteria described in 2013 Internal Control — Integrated Framework issued by the Committee of Sponsoring Organizations of the Treadway Commission. Based on this assessment, management concluded that our internal control over financial reporting was effective as of December 31, 2014.
Our internal control over financial reporting has been audited by Grant Thornton LLP, an independent registered public accounting firm, as stated in their report included herein.
Changes in Internal Control Over Financial Reporting
There were no changes in our internal control over financial reporting during our last fiscal quarter of 2014, that materially affected, or are reasonably likely to materially affect, our internal control over financial reporting.
ITEM 9B. OTHER INFORMATION
93
Not applicable.
PART III
ITEM 10. DIRECTORS, EXECUTIVE OFFICERS AND CORPORATE GOVERNANCE
Item 10 is incorporated by reference to our definitive proxy statement to be filed pursuant to Regulation 14A under the Exchange Act. We expect to file the definitive proxy statement with the SEC within 120 days after the close of the year ended December 31, 2014.
ITEM 11. EXECUTIVE COMPENSATION
Item 11 is incorporated by reference to our definitive proxy statement to be filed pursuant to Regulation 14A under the Exchange Act. We expect to file the definitive proxy statement with the SEC within 120 days after the close of the year ended December 31, 2014.
ITEM 12. SECURITY OWNERSHIP OF CERTAIN BENEFICIAL OWNERS AND MANAGEMENT AND RELATED STOCKHOLDER MATTERS
Item 12 is incorporated by reference to our definitive proxy statement to be filed pursuant to Regulation 14A under the Exchange Act. We expect to file the definitive proxy statement with the SEC within 120 days after the close of the year ended December 31, 2014.
ITEM 13. CERTAIN RELATIONSHIPS AND RELATED TRANSACTIONS, AND DIRECTOR INDEPENDENCE
Item 13 is incorporated by reference to our definitive proxy statement to be filed pursuant to Regulation 14A under the Exchange Act. We expect to file the definitive proxy statement with the SEC within 120 days after the close of the year ended December 31, 2014.
ITEM 14. | PRINCIPAL ACCOUNTING FEES AND SERVICES |
Item 14 is incorporated by reference to our definitive proxy statement to be filed pursuant to Regulation 14A under the Exchange Act. We expect to file the definitive proxy statement with the SEC within 120 days after the close of the year ended December 31, 2014.
PART IV
ITEM 15. EXHIBITS, FINANCIAL STATEMENT SCHEDULES
The following financial statements and exhibits are filed as part of this report:
1. Financial Statements — See “Index to Consolidated Financial Statements” at Page 44.
2. We have omitted all financial statement schedules because they are not required or are not applicable, or the required information is shown in the financial statements or the notes to the financial statements.
3. Exhibits
The Exhibit Index, which follows the signature pages to this report and is incorporated by reference herein, sets forth a list of exhibits to this report.
94
SIGNATURES
Pursuant to the requirements of Section 13 or 15(d) of the Securities Exchange Act of 1934, the registrant has duly caused this report to be signed on its behalf by the undersigned, thereunto duly authorized.
KEY ENERGY SERVICES, INC.
By: | /s/ J. MARSHALL DODSON | |
J. Marshall Dodson, | ||
Senior Vice President and Chief Financial Officer (As duly authorized officer and Principal Financial Officer) | ||
Date: February 24, 2015
POWER OF ATTORNEY
Each person whose signature appears below hereby constitutes and appoints Richard J. Alario and J. Marshall Dodson, and each of them, his true and lawful attorney-in-fact and agent, with full powers of substitution, for him and in his name, place and stead, in any and all capacities, to sign any and all amendments to this Annual Report on Form 10-K, and to file the same, with all exhibits thereto, and other documents in connection therewith, with the Securities and Exchange Commission granting to said attorneys-in-fact, and each of them, full power and authority to perform any other act on behalf of the undersigned required to be done in connection therewith.
95
Pursuant to the requirements of the Securities Exchange Act of 1934, this report has been signed below by the following persons on behalf of the registrant in their capacities and on February 24, 2015.
Signature | Title | |
/s/ RICHARD J. ALARIO | Chairman of the Board of Directors, President and Chief | |
Richard J. Alario | Executive Officer (Principal Executive Officer) | |
/s/ J. MARSHALL DODSON | Senior Vice President and Chief Financial Officer (Principal | |
J. Marshall Dodson | Financial Officer) | |
/s/ MARK A. COX | Vice President and Controller (Principal Accounting Officer) | |
Mark A. Cox | ||
/s/ LYNN R. COLEMAN | Director | |
Lynn R. Coleman | ||
/s/ KEVIN P. COLLINS | Director | |
Kevin P. Collins | ||
/s/ WILLIAM D. FERTIG | Director | |
William D. Fertig | ||
/s/ W. PHILLIP MARCUM | Director | |
W. Phillip Marcum | ||
/s/ RALPH S. MICHAEL, III | Director | |
Ralph S. Michael, III | ||
/s/ WILLIAM F. OWENS | Director | |
William F. Owens | ||
/s/ ROBERT K. REEVES | Director | |
Robert K. Reeves | ||
/s/ MARK H. ROSENBERG | Director | |
Mark H. Rosenberg | ||
/s/ ARLENE M. YOCUM | Director | |
Arlene M. Yocum | ||
96
EXHIBIT INDEX
Exhibit No. | Description | |
2.1 | Asset Purchase Agreement, dated as of July 2, 2010, by and among Key Energy Pressure Pumping Services, LLC, Key Electric Wireline Services, LLC, Key Energy Services, Inc., Portofino Acquisition Company (now known as Universal Pressure Pumping, Inc.) and Patterson UTI Energy, Inc. (Incorporated by reference to Exhibit 10.1 of the Company’s Current Report on Form 8-K filed on July 6, 2010, File No. 001-08038.) | |
2.2 | Amending Letter Agreement, dated September 1, 2010, by and among Key Energy Pressure Pumping Services, LLC, Key Electric Wireline Services, LLC, Key Energy Services, Inc., Portofino Acquisition Company (now known as Universal Pressure Pumping, Inc.) and Patterson UTI Energy, Inc. (Incorporated by reference to Exhibit 10.2 of the Company’s Quarterly Report on Form 10-Q for the quarterly period ended September 30, 2010, File No. 001-08038) | |
2.3 | Amending Letter Agreement, dated October 1, 2010, by and among Key Energy Pressure Pumping Services, LLC, Key Electric Wireline Services, LLC, Key Energy Services, Inc., Portofino Acquisition Company (now known as Universal Pressure Pumping, Inc.) and Patterson UTI Energy, Inc. (Incorporated by reference to Exhibit 10.3 of the Company’s Quarterly Report on Form 10-Q for the quarterly period ended September 30, 2010, File No. 001-08038) | |
2.4 | Purchase and Sale Agreement, dated as of July 23, 2010, by and among OFS Holdings, LLC, a Delaware limited liability company, OFS Energy Services, LLC, a Delaware limited liability company, Key Energy Services, Inc., a Maryland corporation, and Key Energy Services, LLC, a Texas limited liability company. (Incorporated by reference to Exhibit 2.1 of the Company’s Current Report on Form 8-K/A filed on October 8, 2010, File No. 001-08038.) | |
2.5 | Amendment No. 1 to Purchase and Sale Agreements, dated as of August 27, 2010, by and among OFS Holdings, LLC, a Delaware limited liability company, OFS Energy Services, LLC, a Delaware limited liability company, Key Energy Services, Inc., a Maryland corporation, and Key Energy Services, LLC, a Texas limited liability company. (Incorporated by reference to Exhibit 2.2 of the Company’s Current Report on Form 8-K/A filed on October 8, 2010, File No. 001-08038.) | |
2.6 | Amendment No. 2 to Purchase and Sale Agreements, dated as of September 30, 2010, by and among OFS Holdings, LLC, a Delaware limited liability company, OFS Energy Services, LLC, a Delaware limited liability company, Key Energy Services, Inc., a Maryland corporation, and Key Energy Services, LLC, a Texas limited liability company. (Incorporated by reference to Exhibit 2.3 of the Company’s Current Report on Form 8-K/A filed on October 8, 2010, File No. 001-08038.) | |
2.7 | Agreement and Plan of Merger, dated as of July 13, 2011, by and among Key Energy Services, Inc., Key Merger Sub I, Key Merger Sub II, Edge Oilfield Services, L.L.C., Summit Oilfield Services, L.L.C., the Edge Holders and the Summit Holders (Incorporated by reference to Exhibit 2.1 of our Current Report on Form 8-K filed on July 15, 2011, File No. 001-08038.) | |
3.1 | Articles of Restatement of Key Energy Services, Inc. (Incorporated by reference to Exhibit 3.1 of the Company’s Annual Report on Form 10-K for the fiscal year ended December 31, 2006, File No. 001-08038.) | |
3.2 | Unanimous consent of the Board of Directors of Key Energy Services, Inc., dated January 11, 2000, limiting the designation of the additional authorized shares to common stock. (Incorporated by reference to Exhibit 3.2 of the Company’s Quarterly Report on Form 10-Q for the quarter ended March 31, 2000, File No. 001-08038.) | |
3.3 | Seventh Amended and Restated By-laws of Key Energy Services, Inc. as amended through February 26, 2014 (Incorporated by reference to Exhibit 3.1 of the Company's Current Report on Form 8-K filed on February 26, 2014, File No. 001-08038.) | |
97
Exhibit No. | Description | |
4.1.1 | Indenture, dated as of November 29, 2007, among Key Energy Services, Inc., the guarantors party thereto and The Bank of New York Trust Company, N.A., as trustee. (Incorporated by reference to Exhibit 4.1 of the Company’s Current Report on Form 8-K filed on November 30, 2007, File No. 001-08038.) | |
4.1.2 | First Supplemental Indenture, dated as of January 22, 2008, among Key Marine Services, LLC, the existing Guarantors and The Bank of New York Trust Company, N.A., as trustee. (Incorporated by reference to Exhibit 4.5 of the Company’s Quarterly Report on Form 10-Q for the quarter ended March 31, 2008, File No. 001-08038.) | |
4.1.3 | Second Supplemental Indenture, dated as of January 13, 2009, among Key Energy Mexico, LLC, the existing Guarantors and The Bank of New York Trust Company, N.A., as trustee. (Incorporated by reference to Exhibit 4.6 of the Company’s Annual Report on Form 10-K for the year ended December 31, 2008, File No. 001-08038.) | |
4.1.4 | Third Supplemental Indenture, dated as of July 31, 2009, among Key Energy Services California, Inc., the existing Guarantors and The Bank of New York Trust Company, N.A., as trustee. (Incorporated by reference to Exhibit 4.5 of the Company’s Quarterly Report on Form 10-Q for the quarter ended September 30, 2009, File No. 001-08038.) | |
4.1.5 | Fourth Supplemental Indenture dated as of March 1, 2011 by and among Key Energy Services, Inc., the subsidiary guarantors named therein and The Bank of New York Mellon Trust Company, N.A., as trustee. (Incorporated by reference to Exhibit 4.1 of the Company’s Current Report on Form 8-K filed on March 1, 2011, File No. 001-08038.) | |
4.1.6 | Fifth Supplemental Indenture dated as of January 17, 2013 by and among Key Energy Services, Inc., the subsidiary guarantors named therein and The Bank of New York Mellon Trust Company, N.A., as trustee. (Incorporated by reference to Exhibit 4.1.6 to the Company's Annual Report on Form 10-K for the fiscal year ended December 31, 2012, File No. 001-0838.) | |
4.2.1 | Indenture, dated as of March 4, 2011, among Key Energy Services, Inc., the guarantors named therein and The Bank of New York Mellon Trust Company, N.A., as trustee. (Incorporated by reference to Exhibit 4.1 of the Company’s Current Report on Form 8-K filed on March 4, 2011, File No. 001-08038.) | |
4.2.2 | First Supplemental Indenture, dated as of March 4, 2011, among Key Energy Services, Inc., the guarantors named therein and The Bank of New York Mellon Trust Company, N.A., as trustee. (Incorporated by reference to Exhibit 4.2 of the Company’s Current Report on Form 8-K filed on March 4, 2011, File No. 001-08038.) | |
4.2.3 | Amended First Supplemental Indenture, dated as of March 8, 2012, by and among Key Energy Services, Inc., the guarantors named therein and The Bank of New York Mellon Trust Company, N.A., as trustee. (Incorporated by reference to Exhibit 4.1 of the Company's Current Report on Form 8-K filed March 9, 2012, File No. 001-08038.) | |
4.2.4 | Second Supplemental Indenture, dated as of January 17, 2013, among Key Energy Services, Inc., the guarantors named therein and The Bank of New York Mellon Trust Company, N.A., as trustee. (Incorporated by reference to Exhibit 4.2.4 to the Company's Annual Report on Form 10-K for the fiscal year ended December 31, 2012, File No. 001-0838.) | |
4.2.5 | Form of global note for 6.750% Senior Notes due 2021 (Incorporated by reference from Exhibit A to Exhibit 4.8.) | |
4.2.6 | Form of global note for 6.750% Senior Notes due 2021. (Incorporated by reference from Exhibit A to Rule 144A/Regulation S Appendix to Exhibit 4.1 of the Company's Current Report on Form 8-K filed March 9, 2012, File No. 001-08038.) | |
98
Exhibit No. | Description | |
4.2.7 | Registration Rights Agreement with MHR Group dated July 26, 2012. (Incorporated by reference to Exhibit 4.2.7 to the Company's Annual Report on Form 10-K for the fiscal year ended December 31, 2013, File No. 001-0838.) | |
10.1.1† | Key Energy Services, Inc. 2007 Equity and Cash Incentive Plan. (Incorporated by Reference to Appendix A of the Company’s Schedule 14A Proxy Statement filed on November 1, 2007, File No. 001-08038.) | |
10.1.2† | Form of Nonstatutory Stock Option Agreement under 2007 Equity and Cash Incentive Plan. (Incorporated by reference to Exhibit 10.8 of the Company’s Annual Report on Form 10-K for the year ended December 31, 2007, File No. 001-08038.) | |
10.1.3† | Form of Restricted Stock Award Agreement under 2007 Equity and Cash Incentive Plan. (Incorporated by reference to Exhibit 10.1 of the Company’s Current Report on Form 8-K dated April 16, 2008, File No. 001-08038.) | |
10.2.1† | Key Energy Services, Inc. 2009 Equity and Cash Incentive Plan. (Incorporated by Reference to Appendix A of the Company’s Schedule 14A Proxy Statement filed on April 16, 2009, File No. 001-08038.) | |
10.2.2† | Form of Restricted Stock Award Agreement under 2009 Equity and Cash Incentive Plan. (Incorporated by reference to Exhibit 10.1 of the Company’s Quarterly Report on Form 10-Q for the quarter ended September 30, 2009, File No. 001-08038.) | |
10.2.3† | Form of Nonqualified Stock Option Agreement under 2009 Equity and Cash Incentive Plan. (Incorporated by reference to Exhibit 10.2 of the Company’s Quarterly Report on Form 10-Q for the quarter ended September 30, 2009, File No. 001-08038.) | |
10.2.4† | Form of Restricted Stock Unit Award Agreement (Canadian) under 2009 Equity and Cash Incentive Plan. (Incorporated by reference to Exhibit 10.2.4 to the Company's Annual Report on Form 10-K for the fiscal year ended December 31, 2012, File No. 001-0838.) | |
10.2.5† | Form of Restricted Stock Unit Award Agreement (Non-Canadian) under 2009 Equity and Cash Incentive Plan. (Incorporated by reference to Exhibit 10.2.5 to the Company's Annual Report on Form 10-K for the fiscal year ended December 31, 2012, File No. 001-0838.) | |
10.2.6† | Form of Performance Unit Award Agreement under the Key Energy Services, Inc. 2009 Equity and Cash Incentive Plan. (Incorporated by reference to Exhibit 10.2 of the Company's Current Report on Form 8-K filed January 20, 2012, File No. 001-08038.) | |
10.3† | Key Energy Services, Inc. 2012 Performance Unit Plan. (Incorporated by reference to Exhibit 10.1 of the Company's Current Report on Form 8-K filed January 20, 2012, File No. 001-08038.) | |
10.4.1† | Key Energy Services, Inc. 2012 Equity and Cash Incentive Plan. (Incorporated by reference to Appendix A of the Company's Proxy Statement on Schedule 14A filed on April 11, 2012, File No. 001-08038.) | |
10.4.2† | Form of Restricted Stock Award Agreement under 2012 Equity and Cash Incentive Plan. (Incorporated by reference to Exhibit 10.1 of the Company's Current Report on Form 8-K filed January 25, 2013, File No. 001-08038.) | |
10.4.3† | Form of Performance Unit Award Agreement under 2012 Equity and Cash Incentive Plan. (Incorporated by reference to Exhibit 10.2 of the Company's Current Report on Form 8-K filed January 25, 2013, File No. 001-08038.) | |
99
Exhibit No. | Description | |
10.4.4† | Form of Nonstatutory Stock Option Agreement under 2012 Equity and Cash Incentive Plan. (Incorporated by reference to Exhibit 10.4.4 to the Company's Annual Report on Form 10-K for the fiscal year ended December 31, 2012, File No. 001-0838.) | |
10.4.5† | Form of Restricted Stock Unit Award Agreement (Canadian) under 2012 Equity and Cash Incentive Plan. (Incorporated by reference to Exhibit 10.4.5 to the Company's Annual Report on Form 10-K for the fiscal year ended December 31, 2012, File No. 001-0838.) | |
10.4.6† | Form of Restricted Stock Unit Award Agreement (Non-Canadian) under 2012 Equity and Cash Incentive Plan. (Incorporated by reference to Exhibit 10.4.6 to the Company's Annual Report on Form 10-K for the fiscal year ended December 31, 2012, File No. 001-0838.) | |
10.5† | Key Energy Services, Inc. 2013 Performance Unit Plan. (Incorporated by reference to Exhibit 10.5 to the Company's Annual Report on Form 10-K for the fiscal year ended December 31, 2012, File No. 001-0838.) | |
10.6† | Restated Employment Agreement, dated effective as of December 31, 2007, among Richard J. Alario, Key Energy Services, Inc. and Key Energy Shared Services, LLC. (Incorporated by reference to Exhibit 10.1 of the Company’s Current Report on Form 8-K filed on January 7, 2008, File No. 001-08038.) | |
10.7† | Employment Agreement, dated as of March 26, 2009, by and between Trey Whichard and Key Energy Shared Services, LLC. (Incorporated by reference to Exhibit 10.1 of the Company’s Current Report on Form 8-K dated April 1, 2009, File No. 001-08038.) | |
10.8† | Restated Employment Agreement, dated effective as of December 31, 2007, among Newton W. Wilson III, Key Energy Services, Inc. and Key Energy Shared Services, LLC. (Incorporated by reference to Exhibit 10.3 of the Company’s Current Report on Form 8-K filed on January 7, 2008, File No. 001-08038.) | |
10.9† | Amended and Restated Employment Agreement, dated October 22, 2008, between Kimberly R. Frye, Key Energy Services, Inc. and Key Energy Shared Services, LLC. (Incorporated by reference to Exhibit 10.14 of the Company’s Annual Report on Form 10-K for the year ended December 31, 2008, File No. 001-08038.) | |
10.10† | Restated Employment Agreement dated effective as of December 31, 2007, among Kim B. Clarke, Key Energy Services, Inc. and Key Energy Shared Services, LLC (Incorporated by reference to Exhibit 10.4 of the Company’s Current Report on Form 8-K filed on January 7, 2008, File No. 001-08038.) | |
10.11† | Employment Agreement, dated effective as of March 25, 2013, among J. Marshall Dodson and Key Energy Services, LLC (Incorporated by reference to Exhibit 10.1 of the Company’s Current Report on Form 8-K dated March 28, 2013, File No. 001-08038.) | |
10.12† | Form of Amendment to Employment Agreement, in the form executed on March 29, 2010, by and between Key Energy Services, Inc., Key Energy Shared Services, LLC, and each of Richard J. Alario, T.M. Whichard III, Newton W. Wilson III, Kim B. Clarke and Kim R. Frye. (Incorporated by reference to Exhibit 10.1 of the Company’s Current Report on Form 8-K dated April 1, 2010, File No. 001-08038.) | |
10.13* | Key Energy Services, Inc. Clawback Policy. | |
10.14.1 | Credit Agreement, dated as of March 31, 2011, among Key Energy Services, Inc., each of the lenders from time to time party thereto, JPMorgan Chase Bank, N.A., as administrative agent, Bank of America, N.A., as syndication agent, and Capital One, N.A. and Wells Fargo Bank, N.A., as co-documentation agents. (Incorporated by reference to Exhibit 10.1 of the Company’s Current Report on Form 8-K filed on April 5, 2011, File No. 001-08038.) | |
100
Exhibit No. | Description | |
10.14.2 | First Amendment to Credit Agreement, dated as of July 27, 2011, among Key Energy Services, Inc., each of the lenders from time to time party thereto, JPMorgan Chase Bank, N.A., as administrative agent, Bank of America, N.A., as syndication agent, and Capital One, N.A., Wells Fargo Bank, N.A., Credit Agricole Corporate and Investment Bank and DnB NOR Bank ASA, as co-documentation agents (Incorporated by reference to Exhibit 10.1 of the Company’s Current Report on Form 8-K filed on July 29, 2011, File No. 001-08038.) | |
10.14.3 | Second Amendment to Credit Agreement, dated as of December 5, 2014, among Key Energy Services, Inc., each of the lenders from time to time party thereto, JPMorgan Chase Bank, N.A., as administrative agent, Bank of America, N.A., as syndication agent, and Capital One, N.A., Wells Fargo Bank, N.A., Credit Agricole Corporate and Investment Bank and DnB NOR Bank ASA, as co-documentation agents (Incorporated by reference to Exhibit 10.1 of the Company’s Current Report on Form 8-K filed on December 8, 2014, File No. 001-08038.) | |
10.15 | Twenty-First Amendment to Office Lease dated May 15, 2014 Crescent 1301 McKinney, L.P. and Key Energy Services, Inc. (Incorporated by reference to Exhibit 10.1 of the Company’s Current Report on Form 8-K filed on May 16, 2014 File No. 001-08038.) | |
10.16.1† | Key Energy Services, Inc. 2014 Equity and Cash Incentive Plan. (Incorporated by reference to Appendix A of the Company's Proxy Statement on Schedule 14A filed on May 7, 2014, File No. 001-08038.) | |
10.16.2†* | Form of Restricted Stock Award Agreement under 2014 Equity and Cash Incentive Plan. | |
10.16.3†* | Form of Performance Unit Award Agreement under 2014 Equity and Cash Incentive Plan. | |
10.16.4†* | Form of Director Restricted Stock Unit Agreement under 2014 Equity and Cash Incentive Plan. | |
21* | Significant Subsidiaries of the Company. | |
23* | Consent of Independent Registered Public Accounting Firm. | |
31.1* | Certification of CEO pursuant to Securities Exchange Act Rules 13a-14(a) and 15d-14(a), as adopted pursuant to Section 302 of the Sarbanes-Oxley Act. of 2002. | |
31.2* | Certification of CFO pursuant to Securities Exchange Act Rules 13a-14(a) and 15d-14(a), as adopted pursuant to Section 302 of the Sarbanes-Oxley Act of 2002. | |
32* | Certification of CEO and CFO pursuant to 18 U.S.C. Section 1350, as adopted pursuant to Section 906 of the Sarbanes-Oxley Act of 2002. | |
101* | Interactive Data File. | |
† | Indicates a management contract or compensatory plan, contract or arrangement in which any Director or any Executive Officer participates. | |
* | Filed herewith. | |
101