Attached files
| file | filename |
|---|---|
| EXCEL - IDEA: XBRL DOCUMENT - Vitamin Shoppe, Inc. | Financial_Report.xls |
| EX-21.1 - EX-21.1 - Vitamin Shoppe, Inc. | d846595dex211.htm |
| EX-31.1 - EX-31.1 - Vitamin Shoppe, Inc. | d846595dex311.htm |
| EX-31.2 - EX-31.2 - Vitamin Shoppe, Inc. | d846595dex312.htm |
| EX-32.1 - EX-32.1 - Vitamin Shoppe, Inc. | d846595dex321.htm |
| EX-32.2 - EX-32.2 - Vitamin Shoppe, Inc. | d846595dex322.htm |
| EX-23.1 - EX-23.1 - Vitamin Shoppe, Inc. | d846595dex231.htm |
Table of Contents
UNITED STATES
SECURITIES AND EXCHANGE COMMISSION
Washington, DC 20549
FORM 10-K
| x | ANNUAL REPORT PURSUANT TO SECTION 13 OR 15(d) OF THE SECURITIES EXCHANGE ACT OF 1934 |
For the fiscal year ended December 27, 2014
or
| ¨ | TRANSITION REPORT PURSUANT TO SECTION 13 OR 15(d) OF THE SECURITIES EXCHANGE ACT OF 1934 |
for the transition period from to .
Commission file number: 001-34507
VITAMIN SHOPPE, INC.
(Exact name of registrant as specified in its charter)
| Delaware | 11-3664322 | |
| (State or Other Jurisdiction of Incorporation or Organization) |
(IRS Employer Identification No.) |
2101 91st Street
North Bergen, New Jersey 07047
(Addresses of Principal Executive Offices, including Zip Code)
(201) 868-5959
(Registrant’s Telephone Number, Including Area Code)
Securities registered pursuant to Section 12(b) of the Act:
| Title of Class |
Name of the exchange on which registered | |
| Common Stock, $0.01 par value per share | New York Stock Exchange |
Securities registered pursuant to Section 12(g) of the Act: None
Indicate by check mark if the registrant is a well-known seasoned issuer, as defined in Rule 405 of the Securities Act. x Yes ¨ No
Indicate by check mark if the registrant is not required to file reports pursuant to Section 13 or Section 15(d) of the Act. ¨ Yes x No
Indicate by check mark whether the registrant (1) has filed all reports required to be filed by Section 13 or 15(d) of the Securities Exchange Act of 1934 during the preceding 12 months (or for such shorter period that the registrant was required to file such reports), and (2) has been subject to such filing requirements for the past 90 days. x Yes ¨ No
Indicate by check mark whether the registrant has submitted electronically and posted on its corporate Web site, if any, every Interactive Data File required to be submitted and posted pursuant to Rule 405 of Regulation S-T (§232.405 of this chapter) during the preceding 12 months (or for such shorter period that the registrant was required to submit and post such files). x Yes ¨ No
Indicate by check mark if disclosure of delinquent filers pursuant to Item 405 of Regulation S-K (§229.405 of this chapter) is not contained herein, and will not be contained, to the best of registrant’s knowledge, in definitive proxy or information statements incorporated by reference in Part III of this Form 10-K or any amendment to this Form 10-K. x
Indicate by check mark whether the registrant is a large accelerated filer, an accelerated filer, a non-accelerated filer, or a smaller reporting company. See the definitions of “large accelerated filer,” “accelerated filer” and “smaller reporting company” in Rule 12b-2 of the Exchange Act. (Check one):
| Large accelerated filer | x | Accelerated filer | ¨ | |||
| Non-accelerated filer | ¨ (Do not check if a smaller reporting company) | Smaller reporting company | ¨ | |||
Indicate by check mark whether the registrant is a shell company (as defined in Rule 12b-2 of the Exchange Act). ¨ Yes x No
The aggregate market value of the registrant’s voting and non-voting common stock held by non-affiliates of the registrant was approximately $1,311,721,173 as of June 27, 2014, the last business day of the registrant’s most recently completed second fiscal quarter, based on the closing price of the common stock on the New York Stock Exchange.
As of January 24, 2015, Vitamin Shoppe, Inc. had 29,987,938 shares of common stock outstanding.
DOCUMENTS INCORPORATED BY REFERENCE
The information required by Part III of this report, to the extent not set forth herein, is incorporated by reference from the Registrant’s definitive Proxy Statement for the Annual Meeting of the Stockholders to be held on June 3, 2015.
Table of Contents
EX 21.1
EX 23.1
EX 31.1
EX 31.2
EX 32.1
EX 32.2
EX-101 INSTANCE DOCUMENT
EX-101 SCHEMA DOCUMENT
EX-101 CALCULATION LINKBASE DOCUMENT
EX-101 DEFINITION LINKBASE DOCUMENT
EX-101 LABELS LINKBASE DOCUMENT
EX-101 PRESENTATION LINKBASE DOCUMENT
2
Table of Contents
Forward-Looking Statements
Statements in this document that are not historical facts are “forward looking statements” for the purposes of the safe harbors provided by Section 21E of the Securities Exchange Act of 1934, as amended (the “Exchange Act”), and Section 27A of the Securities Act of 1933, as amended (the “Securities Act”). Moreover, the Company, through its senior management, may from time to time make “forward looking statements” about matters described herein or other matters concerning the Company. We caution readers that such “forward looking statements”, including without limitation, those relating to the Company’s future business prospects, revenue, new stores, integration of acquisitions, working capital, liquidity, capital expenditures, capital needs and interest costs, wherever they occur in this document or in other statements attributable to the Company, are necessarily estimates reflecting the judgment of the Company’s senior management and are based on current information and expectations. Actual results may differ materially from those suggested by the “forward looking statements” as a result of certain risks and uncertainties including, but not limited to, industry based factors such as the level of competition in the vitamin, mineral and supplement industry, continued demand from the primary markets the Company serves, consumer perception of our products, the availability of raw materials, as well as economic conditions generally and factors more specific to the Company such as compliance with manufacturing regulations, certifications and practices and restrictions imposed by the Company’s revolving credit facility including financial covenants and limitations on the Company’s ability to incur additional indebtedness and the Company’s future capital requirements. For details regarding these and other risks and uncertainties, see Item 1A., “Risk Factors” and Item 7., “Management’s Discussion and Analysis of Financial Condition and Results of Operations” as well as other factors set forth throughout this Annual Report on Form 10-K. You can identify forward-looking statements by words such as “may”, “expect”, “intend”, “anticipate”, “plan”, “believe”, “seek”, “should”, “estimate”, “outlook”, “trends”, “future benefits”, “strategies”, “goals” and similar words.
Except as required by law, the Company disclaims any intent or obligation to update “forward looking statements” to reflect changed assumptions, the occurrence of unanticipated events, or changes to future operating results over time.
Electronic Access to Company Reports
Our investor website can be accessed at www.vitaminshoppe.com under “Investor Relations”. Our Annual Reports on Form 10-K, Quarterly Reports on Form 10-Q, Current Reports on Form 8-K and amendments to those reports filed with or furnished to the Securities and Exchange Commission (the “SEC”) pursuant to Section 13(a) or Section 15(d) of the Securities Exchange Act of 1934, as amended, are available free of charge on our investor website under the caption “SEC Filings” promptly after we electronically file those materials with, or furnish those materials to, the SEC. No information contained on any of our websites is intended to be included as part of, or incorporated by reference into, this Annual Report on Form 10-K. Information relating to corporate governance at our Company, including our Corporate Governance Guidelines, our Standards of Business Conduct for all directors, officers, and employees, and information concerning our directors, Committees of the Board, including Committee charters, and transactions in Company securities by directors and executive officers, is available at our investor website under the captions “Corporate Governance” and “SEC Filings”. Paper copies of these filings and corporate governance documents are available to stockholders free of charge by written request to Investor Relations, Vitamin Shoppe, Inc., 2101 91st Street, North Bergen, New Jersey, 07047. Documents filed with the SEC are also available on the SEC’s website at www.sec.gov.
3
Table of Contents
Unless the context requires otherwise, references in this Annual Report on Form 10-K to “VSI”, the “Company”, “we”, “us” and “our” collectively refer to Vitamin Shoppe, Inc., Vitamin Shoppe Industries Inc., VS Direct Inc., Vitamin Shoppe Mariner, Inc., VS Hercules LLC, Vitamin Shoppe Global, Inc. and Vitapath Canada Limited. References to “Fiscal” or “Fiscal Year” mean the fifty-two weeks ended December 27, 2014, December 28, 2013 and December 29, 2012 for Fiscal Year 2014, Fiscal Year 2013 and Fiscal Year 2012, respectively, and references to “Fiscal” and “Fiscal Year” for other years are similarly based on a fifty-two week or fifty-three week fiscal year, as applicable.
| Item 1. | Business |
Overview of our Company
We are a multi-channel specialty retailer and contract manufacturer of vitamins, minerals, herbs, specialty supplements, sports nutrition and other health and wellness products (“VMS”). We market over 900 nationally recognized brands as well as our own brands, which include Vitamin Shoppe®, BodyTech®, True Athlete®, Mytrition®, plnt™, ProBioCare™, Next Step™, Nutri-Force® Sport and Betancourt Sports Nutrition. We believe we offer one of the greatest varieties of products among vitamin, mineral and supplement retailers with approximately 8,000 stock keeping units (“SKUs”) offered in our typical store and approximately 17,000 additional SKUs available through our e-commerce and other direct sales channels. Our broad product offering enables us to provide our customers with a selection of products that is not readily available at other specialty retailers or mass merchants, such as discount stores, supermarkets, drugstores and wholesale clubs. We believe our extensive product offering and emphasis on product education and customer service help us bond with our target customer and serve as a foundation for strong customer loyalty.
We sell our products through three operating segments: retail, direct and manufacturing. In our retail segment, which includes Vitamin Shoppe, Super Supplements and Vitapath retail store formats, we have leveraged our successful store economic model by opening a total of 167 new stores and acquiring 31 stores from the beginning of Fiscal Year 2012 through Fiscal Year 2014. As of December 27, 2014, we operated 717 stores in 45 states, the District of Columbia, Puerto Rico and Ontario, Canada, primarily located in high-traffic retail centers and stand alone locations. In our direct segment, we sell our products directly to consumers through the internet, primarily at www.vitaminshoppe.com. Our e-commerce sites and our catalog complement our in-store experience by extending our retail product offerings and enable us to access customers outside our retail markets and those who prefer to shop online. Our manufacturing segment provides custom manufacturing and private labeling of VMS products, and develops and markets our own branded products for both sales to third parties and for the VSI product assortment.
On June 6, 2014, the Company acquired all of the outstanding equity interests of FDC Vitamins, LLC d/b/a Nutri-Force Nutrition (“Nutri-Force”), a company which provides custom manufacturing and private labeling of vitamins, dietary supplements, nutraceuticals and nutritional supplements, as well as, develops and markets its own branded products. The total purchase price was $86.1 million in cash, which includes $5.0 million of contingent consideration. For additional information, refer to Note 3., “Acquisitions”, to our consolidated financial statements included in this Annual Report on Form 10-K.
Segment Information
We operate through three business segments: retail, which includes Vitamin Shoppe, Super Supplements and Vitapath retail store formats, direct, which consists of our e-commerce and catalog formats, and manufacturing, which consists of the Nutri-Force manufacturing operations.
Retail. Through our retail store formats, we believe we operate a unique retail store concept in the VMS industry, which has been successful in diverse geographic and demographic markets. Our stores carry a broad selection of VMS products and are staffed with experienced and knowledgeable employees (“Health Enthusiasts®”) who are able to inform our customers about product features and assist in product selection.
We continue to pursue new store growth. Since the beginning of Fiscal 2012 through Fiscal 2014, we have opened 167 new stores and acquired 31 stores, expanding our presence in our existing markets as well as entering new markets. In addition, our new stores since the beginning of Fiscal 2013 average approximately 3,000 square feet compared to the average of our total store portfolio of approximately 3,600 square feet. This strategy has allowed us to increase our sales per square foot without impacting the breadth of our product assortment.
Direct. We sell our products directly to consumers through the internet, primarily at www.vitaminshoppe.com. Our e-commerce sites and our catalog complement our in-store experience by extending our retail product offerings with approximately 17,000 additional SKUs that are not available in our stores and enable us to access customers outside our retail markets and those who prefer to shop online. Catalog sales were not material in 2014, and are expected to continue to decline in the future, as customers migrate to our e-commerce sites and stores.
Manufacturing. Through Nutri-Force, we provide custom manufacturing and private labeling of VMS products and develop and market our own branded products for both sales to third parties and for part of the VSI product assortment.
4
Table of Contents
Industry
The VMS industry in the United States of America (“U.S.”) is highly fragmented, and based on the most current information available from the Nutrition Business Journal (“NBJ”) no single industry participant accounted for more than 5% of total domestic industry sales in 2013. Retailers of VMS products primarily include specialty retailers and mass merchants, such as discount stores, supermarkets, drugstores and wholesale clubs. The specialty retailers typically cater to the more sophisticated VMS customer by focusing on selection and customer service, while the mass merchants generally offer a limited assortment comprised of more mainstream products with less customer service. Specialty retailers comprised the largest segment of the market in 2013, with 36% market share, according to the NBJ.
According to the NBJ, the U.S. nutritional supplements industry was a $34.9 billion retail market in 2013, and is projected to grow at an approximate 6.8% average annual growth rate through 2020. NBJ anticipates that specialty retail will remain the major market driver for supplements through 2020, and the specialty retail channel is expected to add over $8 billion in new annual sales by that time. Additionally, NBJ forecasts the internet channel to achieve 10% compound annual growth from 2014 to 2020. Positive industry trends include an aging U.S. population, rising healthcare costs and the increased use of preventive measures. In addition, the increased focus on diet and nutrition, along with growing fitness and wellness program participation, serves as a positive trend for the nutritional supplements industry.
Competitive Strengths
We believe we are well positioned to capitalize on the favorable VMS industry dynamics as a result of the following competitive strengths:
Extensive Product Selection, Including a Strong Assortment of Private-Label Brands. We believe we have a complete and authoritative merchandise assortment and market one of the broadest product selections in the VMS industry. Our merchandise assortment includes approximately 25,000 SKUs from a combination of over 900 nationally recognized brands as well as our own brands. Our private-label brands merchandise accounted for approximately 19% of our net sales in Fiscal 2014, and provides our customers the opportunity to purchase VMS products at a good value.
Value-Added Customer Service. We believe we offer one of the highest degrees of customer service among national competitors in the VMS retail industry, aided by the deep product knowledge of our experienced Health Enthusiasts. We place a strong emphasis on employee training and customer service and view our Health Enthusiasts as health and wellness information stewards who inform our customers while assisting them with their product selections.
Highly Refined Real Estate Strategy. We apply demanding criteria to our retail site selection. We locate our stores primarily in attractive stand-alone locations or endcap (corner) positions in retail centers. We believe that the location and visibility of our real estate is one of our single most effective and efficient customer acquisition strategies.
Attractive, Loyal Customer Base. We have a large and growing base of loyal customers who proactively manage their long-term health and wellness through the use of supplements. In Fiscal 2014, 89% of net sales (excluding Super Supplements and Nutri-Force net sales) were attributable to our Healthy Awards customers. Our no-fee Healthy Awards Program promotes brand loyalty among our customers and allows our customers to earn points redeemable for future purchases, approximately 71% of which were redeemed in Fiscal 2014. We also utilize our Healthy Awards Program database to track customer purchasing patterns across our retail and direct business segments, analyze market and industry trends and create targeted merchandising and marketing strategies.
Multi-Channel Retailer. We are a multi-channel retailer, distributing products through our retail stores, our e-commerce sites and our catalog, enabling us to access customers outside our retail markets and those who prefer to shop online. This business model affords us multiple touch points of interaction with our customers, which allows us to gather data and communicate with them in person, through our call center and via the internet.
Experienced Management Team with Proven Track Record. We have assembled a management team across a broad range of disciplines with extensive experience in building leading national specialty retailers.
Business Strategy
We intend to continue to pursue the following key strategies to drive customer traffic, grow our sales and improve profitability:
| • | Store and Comparable Sales Growth - To increase sales and profitability through the maturation of our recently opened stores, as well as continued opening of new stores in the future. The increase in our retail store base has improved shopping convenience to our customers. Based on an analysis conducted by an independent third-party, we believe the U.S. market can support approximately 900 Vitamin Shoppe stores, in the current store format. In addition, the size of our new stores beginning in Fiscal 2013 averages approximately 3,000 square feet compared to the average of our total store portfolio of approximately 3,600 square feet as we seek to increase store productivity; |
| • | Increase Emphasis on our Direct Business - To increase sales of our e-commerce business by continuing to enhance the features and functionality of our e-commerce sites and providing our customers with a more personalized shopping experience. We plan to continue to enhance our e-commerce platform attributes for customer tracking and marketing ability, which will allow us, among other things, to better market to our customers; |
5
Table of Contents
| • | Enhance the Customers’ Shopping Experience - To enhance our customers’ shopping experience by continuing to offer a convenient shopping experience complemented by our knowledgeable Health Enthusiasts and access to a broad selection of products that are in-stock and priced competitively to the marketplace. We continue to expand categories complementary to our core VMS and sports nutrition products, and we plan to strengthen our assortment by adding new products and brands in growth categories. To keep our assortment relevant, we replaced approximately two thousand items in 2014. In addition, we plan on improving our customers’ ability to shop across both our retail and direct channels by continuing to implement improved order management systems during 2015; |
| • | Continuous Health Enthusiast Education and Training - To continue to invest in Health Enthusiast training and provide employees with opportunities to grow within our Company. In 2014 we held our tenth product education conference, attended by our retail store and district managers, and many of our vendors. We currently plan to continue this conference in 2015. In addition, we continue to improve and expand our online learning website, Vitamin Shoppe University®, which provides the opportunity for our Health Enthusiasts to expand their knowledge and stay current on new products and developments in our industry; |
| • | International Expansion – To expand into international markets through Company operated and franchise based arrangements. As of December 27, 2014, we have opened three retail stores in Ontario, Canada as well as three franchise locations in Panama. We plan to expand into other international markets through franchise and wholesale opportunities; and |
| • | Vertical integration – The acquisition of the manufacturing operations of Nutri-Force allows us to better control the production and timing of new product introductions, control costs, maintain high standards of product quality and enhance profitability. We plan on transitioning at least 40% of the VSI private label assortment to Nutri-Force over the next three years. |
Store Counts and Locations
We plan to open approximately 60 new stores in Fiscal 2015. The following table shows the change in our network of stores for the Fiscal Years 2010 through 2014:
| Fiscal Year | ||||||||||||||||||||
| 2014 | 2013 | 2012 | 2011 | 2010 | ||||||||||||||||
| Store Data: |
||||||||||||||||||||
| Stores open at beginning of year |
659 | 579 | 528 | 484 | 438 | |||||||||||||||
| Stores opened |
61 | 52 | 54 | 48 | 47 | |||||||||||||||
| Stores acquired |
— | 31 | — | — | — | |||||||||||||||
| Stores closed |
(3 | ) | (3 | ) | (3 | ) | (4 | ) | (1 | ) | ||||||||||
|
|
|
|
|
|
|
|
|
|
|
|||||||||||
| Stores open at end of year |
717 | 659 | 579 | 528 | 484 | |||||||||||||||
|
|
|
|
|
|
|
|
|
|
|
|||||||||||
Based on our historical experience, we believe that new stores typically require approximately four to five years to mature, generating lower store level sales in the initial years then our mature stores. As a result, new stores generally have a negative impact on our overall operating margin. In addition, our new stores beginning in Fiscal 2013 are approximately 3,000 square feet compared to the average of our total store portfolio of approximately 3,600 square feet. Additionally, stores opened in new markets have lower brand awareness compared to stores in existing markets, and as a result initially experience a lower sales volume than stores opened in existing markets. As a result of these trends, our recently opened stores have produced lower sales volume than historical sales trends.
6
Table of Contents
As these stores mature, we expect them to contribute to our operating results. The following table reflects our store count by state, as well as the District of Columbia, Puerto Rico and Ontario, Canada, at December 27, 2014:
| Stores Open at December 27, 2014 |
Stores Open at December 27, 2014 |
|||||||||
| Alabama |
4 | Nebraska | 2 | |||||||
| Arizona |
12 | Nevada | 6 | |||||||
| Arkansas |
2 | New Hampshire | 4 | |||||||
| California |
89 | New Jersey | 29 | |||||||
| Colorado |
8 | New Mexico | 3 | |||||||
| Connecticut |
10 | New York | 70 | |||||||
| Delaware |
3 | North Carolina | 19 | |||||||
| District of Columbia |
1 | Ohio | 22 | |||||||
| Florida |
71 | Oklahoma | 2 | |||||||
| Georgia |
20 | Oregon | 11 | |||||||
| Hawaii |
7 | Pennsylvania | 24 | |||||||
| Idaho |
2 | Rhode Island | 1 | |||||||
| Illinois |
40 | South Carolina | 10 | |||||||
| Indiana |
13 | South Dakota | 1 | |||||||
| Iowa |
3 | Tennessee | 12 | |||||||
| Kansas |
3 | Texas | 52 | |||||||
| Kentucky |
5 | Utah | 2 | |||||||
| Louisiana |
6 | Vermont | 1 | |||||||
| Maine |
2 | Virginia | 26 | |||||||
| Maryland |
19 | Washington | 36 | |||||||
| Massachusetts |
17 | Wisconsin | 6 | |||||||
| Michigan |
16 | |||||||||
| Minnesota |
10 | |||||||||
| Missouri |
8 | Ontario, Canada | 3 | |||||||
| Mississippi |
1 | Puerto Rico | 3 | |||||||
|
|
|
|||||||||
| Total | 717 | |||||||||
|
|
|
|||||||||
As of December 27, 2014, we leased the property for all of our 717 stores. Our typical lease terms are ten years, with one or two five-year renewal options. We do not believe that any individual store property is material to our financial condition or results of operations. Of the leases for our stores, 29 expire in Fiscal 2015, 58 expire in Fiscal 2016, 57 expire in Fiscal 2017, 100 expire in Fiscal 2018, 104 expire in Fiscal 2019 and the balance expire in Fiscal 2020 or thereafter. For the majority of our leases, renewal options remain available.
Products
We organize our products by category enabling easy comparisons between different brands within each product sub-category. In addition, our stores are staffed with experienced and knowledgeable Health Enthusiasts, many of whom are regular and informed VMS consumers. Our Health Enthusiasts are trained to inform our customers about product features and assist our customers in product selection. To further inform our customers, our stores are equipped with Aisle Seven, an independent source of health and wellness information.
We offer a comprehensive selection of vitamins, minerals, herbs, homeopathic remedies, specialty supplements such as fish oil, probiotics, glucosamine and Co Q10, sports nutrition, weight management, as well as natural bath and beauty, pet supplements and options for a healthy home. Our offering includes approximately 25,000 SKUs from over 900 brands, including our own brands such as Vitamin Shoppe®, BodyTech®, True Athlete®, Mytrition®, plnt™, ProBioCare™ , Next Step™, Nutri-Force® Sport and Betancourt Sports Nutrition brands which include products such as Ultimate Man, Ultimate Woman, Ultimate 10 Probiotic, Whey Tech and Whey Tech Pro 24 Proteins. We also offer a comprehensive assortment from leading national brands such as Optimum Nutrition®, Cellucor®, Garden of Life®, Quest Nutrition®, Solaray®, Solgar® and Nature’s Way®. This extensive assortment is designed to provide our customers with a unique selection of available products to help them achieve their health and wellness goals. Sales of our branded products accounted for approximately 19% of our net sales in Fiscal 2014.
Key Product Categories
Below is a comparison of our net merchandise sales by major product category and the respective percentage of our total net merchandise sales for the periods shown (dollars in thousands).
7
Table of Contents
Product Category
| Fiscal 2014 (a) | Fiscal 2013 | Fiscal 2012 | ||||||||||||||||||||||
| Dollars | % | Dollars | % | Dollars | % | |||||||||||||||||||
| Vitamins, Minerals, Herbs and Homeopathy |
$ | 285,775 | 24 | % | $ | 276,447 | 26 | % | $ | 243,910 | 26 | % | ||||||||||||
| Sports Nutrition |
428,845 | 35 | % | 393,659 | 36 | % | 339,359 | 36 | % | |||||||||||||||
| Specialty Supplements |
313,025 | 26 | % | 305,320 | 28 | % | 274,307 | 29 | % | |||||||||||||||
| Other |
182,352 | 15 | % | 109,554 | 10 | % | 91,109 | 9 | % | |||||||||||||||
|
|
|
|
|
|
|
|
|
|
|
|
|
|||||||||||||
| Total |
1,209,997 | 100 | % | 1,084,980 | 100 | % | 948,685 | 100 | % | |||||||||||||||
| Delivery Revenue |
3,049 | 2,489 | 2,217 | |||||||||||||||||||||
|
|
|
|
|
|
|
|||||||||||||||||||
| $ | 1,213,046 | $ | 1,087,469 | $ | 950,902 | |||||||||||||||||||
|
|
|
|
|
|
|
|||||||||||||||||||
| (a) | In Fiscal 2014, the “Other” product category includes net merchandise sales to third parties of Nutri-Force of $40.3 million. |
Vitamins, Minerals, Herbs and Homeopathy
Vitamins and minerals are recommended to maintain health, proactively to improve health and in support of specific health conditions. These products help prevent nutrient deficiencies that can occur when diet alone does not provide all the necessary vitamins and minerals our bodies need. The vitamin and mineral product category includes multi-vitamins, which many consider to be a foundation of a healthy regimen, lettered vitamins, such as Vitamins A, C, D, E, and B-complex, along with major and trace minerals such as calcium, magnesium, chromium and zinc. With approximately 4,000 SKUs, a wide range of potency levels and multiple delivery systems, our customers have many choices to fit their individual needs.
Herbs offer a natural remedy to address specific conditions. Certain herbs help support specific body systems, including ginkgo to support brain function and milk thistle to help support liver function, as well as other less common herbs such as black cohosh for menopause support. Herbal products include whole herbs, standardized extracts, herb combination formulas and teas. Homeopathic remedies offer our customers the ability to address health concerns while providing the safety of having no known drug interactions or side effects. With approximately 5,000 SKUs, a wide range of potency levels and multiple delivery systems, our customers have many choices to fit their individual needs.
Sports Nutrition
Our sports nutrition consumers are looking for products to help maintain or supplement a healthy lifestyle. These products are used in conjunction with cardiovascular conditioning, weight training and sports activities. Major categories in sports nutrition include protein and weight gain powders, meal replacements, weight management, and pre and post-workout supplements to either support energy production or enhance recovery after exercise. Our sports nutrition products are offered in many convenient forms, such as powders, tablets, capsules, soft gels and liquids. Our sports nutrition consumers include the sports enthusiast, weekend warrior, endurance athlete, marathoner, serious bodybuilder, as well as those seeking to maintain a healthy fitness level. We offer approximately 3,000 SKUs in sports nutrition.
Specialty Supplements
Specialty supplements help supply higher levels of nutrients than diet alone can provide, help individuals stay healthy, and support specific conditions and life stages such as childhood, pregnancy, menopause and aging. Categories of specialty supplements include omega fatty acids, probiotics and condition specific formulas. Certain specialty supplements, such as organic greens, psyllium fiber and soy proteins, provide added support during various life stages. Folic acid is specifically useful during pregnancy. Super antioxidants, such as coenzyme Q-10, grapeseed extract and pycnogenol, address specific conditions. High ORAC (oxygen radical absorptive capacity) fruit concentrates such as; gogi, mangosteen, pomegranate and blueberry help prevent oxygen radical damage. Other specialty supplement formulas are targeted to support specific organs, biosystems and body functions. We offer approximately 7,000 SKUs of specialty supplements.
Other
Our “Other” category represents all other product classifications we stock that do not fit within the previously described categories. These products include items such as natural beauty and personal care, on the go bars, drinks and snacks and natural pet food. Natural beauty and personal care products offer an alternative to traditional products that often contain synthetic and/or other ingredients that our customers find objectionable. Our customers choose these products over more traditional products because they contain organic and natural ingredients, are free of pesticides or not tested on animals and/or are more closely aligned with the health and wellness goals of our customers. Our on the go bars, drinks and snacks offer our customers access to an offering of protein, low carb and natural bars, protein, energy and functional beverages and natural snacks. Our natural pet products include nutritionally balanced foods and snacks along with condition specific supplements such as glucosamine for joint health. We offer approximately 6,000 SKUs for our Other category. In Fiscal 2014, our Other product category includes net merchandise sales to third parties of Nutri-Force of $40.3 million.
8
Table of Contents
Delivery Revenue
Delivery revenue represents amounts billed to customers for shipping fees.
Access to New Products
One of the many components of customer satisfaction is the introduction of new products. We identify customer and market trends by listening to our customers, Health Enthusiasts, vendors, contract manufacturers and market influencers. We maintain very active partnerships with our vendors to stay on top of their product offerings and to bring new products to our customers quickly. In addition, we have a knowledgeable team in-house who focuses on bringing new Vitamin Shoppe branded products to our offering. Each year we launch many new products under our own brands including the launch in Fiscal 2014 of approximately 100 new products. These include new flavors of our popular BodyTech Whey Tech Pro 24 protein family, BodyTech Whey Isolates, new flavors of our True Athlete branded proteins, a collection of aromatherapy single note oils and carrier oils and a new collection of pet items. In 2014, we also launched a new weight management brand named Next Step. The Next Step Weight Management System includes natural meal replacement powders with protein, fiber and CLA, supplements to support a healthy weight management program and basic exercise support products such as pedometers and jump ropes.
Manufacturing
Through Nutri-Force, we provide custom manufacturing and private labeling of VMS products and develop and market our own branded products for both sales to third parties and for the VSI product assortment. Our manufacturing operations, which are located in Miami Lakes, Florida, produce tablets, capsules, soft-gels and powders. By operating our own manufacturing facilities, we have the ability to better control the production and timing of new product introductions, control costs, maintain high standards of product quality and enhance profitability.
Suppliers and Inventory
Glanbia, plc is the only supplier from whom we purchased at least 5% of our merchandise during Fiscal 2014, 2013 and 2012. We purchased approximately 12% of our total merchandise from Glanbia, plc during Fiscal 2014 and approximately 10% during Fiscal 2013 and 2012.
We consider numerous factors in supplier selection, including, but not limited to, quality, price, credit terms, and product offerings. As is customary in our industry, we generally do not have long-term contracts with any supplier and most suppliers may discontinue selling to us at any time.
We strive to maintain sufficient inventory to enable us to provide a high level of service to our customers. Inventory, accounts receivable and accounts payable levels, payment terms and return policies are in accordance with standard business procedures. We maintain a distribution network which we use in conjunction with a just-in-time inventory ordering system that we use to replenish our stores based upon customer demand of a given product or products. Our working capital requirements for merchandise inventory will continue to increase as we continue to open additional stores and expand our distribution network. Currently, our practice is to establish an inventory level of approximately $155,000 at cost for each of our new stores, the cost of which is partially offset by vendor incentive and allowance programs. Additionally, 30 day payment terms have been extended to us by some of our suppliers allowing us to effectively manage our inventory and working capital. We believe that our buying power enables us to receive favorable pricing terms and enhances our ability to obtain high demand merchandise.
Warehouse and Distribution
We operate our supply chain primarily from three Company operated distribution center facilities. The Company operates distribution centers in North Bergen, New Jersey, Ashland, Virginia and Seattle, Washington. By operating our own facilities we gain greater control over supervision costs and distribution center related inventory levels. In addition, through a combination of improved technology, processes, controls and layout, we continue to improve our pick accuracy rates and net inventory accuracy rates. The Ashland, Virginia distribution center facility began operations in the third quarter of Fiscal 2013. Certain geographic store areas will transition to be fulfilled from the Ashland facility through 2015. As a result of opening this facility and transitioning store fulfillment through 2015, we experienced higher supply chain costs as a percentage of sales in Fiscal 2014 and expect supply chain costs as a percentage of sales to subsequently decline in future periods. Our products manufactured by Nutri-Force are warehoused and distributed through its Miami Lakes, Florida facilities.
In addition, a west coast third-party facility provided us with warehousing and distribution functions. We have elected to terminate our relationship with this facility and expect to discontinue use of this facility during the first half of Fiscal 2015.
Regulatory and Quality Control
The Food and Drug Administration (“FDA”) is the regulatory authority charged with overseeing the products we offer and the Federal Trade Commission (“FTC”) regulates the advertising of those products.
9
Table of Contents
Our Scientific and Regulatory Affairs (“S&RA”) and legal departments review all aspects of our Company’s FDA and FTC regulatory processes, ensuring compliance with regulations. We have established processes to review the underlying safety and efficacy of our branded products, including Vitamin Shoppe®, BodyTech®, True Athlete®, Mytrition®, plnt™, ProBioCare™, Next Step™, Nutri-Force® Sport and Betancourt Sports Nutrition. These processes include review of the ingredients’ safety information, product formulation, product form, product labeling, the efficacy and claim support for the product and any marketing materials. All consumer communications that deal with product and health issues must be approved by S&RA prior to being disseminated to the public.
We have standard procedures whereby all potential Vitamin Shoppe contract manufacturers are reviewed and approved before they can supply any of our branded products. In addition, all potential new products are evaluated and approved prior to being accepted into our branded product lines.
Our relationships with manufacturers require that all of our branded products, including Vitamin Shoppe®, BodyTech®, True Athlete®, Mytrition®, plnt™, ProBioCare™, Next Step™, Nutri-Force® Sport and Betancourt Sports Nutrition, not be adulterated or misbranded under any provisions of the Federal Food, Drug, and Cosmetic Act (“FDCA”) and the regulations promulgated thereunder. This includes, but is not limited to, compliance with applicable Current Good Manufacturing Practices (“cGMP”). This means that ingredients in our products must be tested for identity, purity, quality, strength, and composition before being incorporated into our branded products, and that our final branded products must again be tested for identity, purity, quality, strength, and composition prior to being released. All of these products require a certificate of analysis, which includes certification to 100% of label claim.
We have established a standard quality control operating procedure that calls for on-site audits of our contract manufacturers’ facilities and processes, and have established an internal team that will audit each of these facilities and work with our contract manufacturers to resolve any noncompliance with dietary supplement cGMP regulations. We require that our manufacturers have certificates of analysis (such as for microbial testing and label testing).
Third party vendors, are also subject to a standard review, must comply with our vendor partnership agreement and are required to carry adequate insurance policies to satisfy our standards. Each new product proposed to be carried by us is reviewed by our S&RA department. They reject those products that they believe may present undue risk or be unsafe.
Healthy Awards Program
Our Healthy Awards Program, which we established over 15 years ago, encourages our customers to make repeat purchases and enables us to enhance customer loyalty. The program is open to Vitamin Shoppe and Vitapath customers and is free of charge to join. Members of the program earn one point for every dollar they spend, starting with the first purchase upon joining the program. If a member accumulates over 100 points between January 1 and December 31 in a calendar year, the member will receive a special credit certificate in January of the following year to use on any single purchase made before March 31 of that year. We enrolled approximately 2.3 million new members in Fiscal 2014. The number of active members between retail and online shoppers has grown to approximately 6.1 million as of December 27, 2014. An active member is a customer that has purchased an item within the last twelve months.
We utilize our Healthy Awards Program database to track customer purchasing patterns across our retail and direct business segments, analyze market and industry trends and create targeted merchandising and marketing strategies. In addition, it provides us with customer and demographic data we use to assist us in the selection of future store locations.
Marketing
We believe our high quality real estate is one of our primary marketing tools, as we locate our stores in high-visibility areas. We also conduct targeted marketing efforts by mailing offers and promotional announcements to members of our Healthy Awards Program. We advertise in national magazines, and engage in local advertising via direct mail, radio and television for certain new stores. We continue to develop our social media presence and digital marketing.
We promote our own branded products, including Vitamin Shoppe®, BodyTech®, True Athlete®, Mytrition®, plnt™, ProBioCare™ , Next Step™, Nutri-Force® Sport and Betancourt Sports Nutrition through our retail channel by placing the products in strategic and highly visible locations in our stores.
Competition
The U.S. nutritional supplements retail industry is highly competitive and fragmented. According to the NBJ, no single retailer accounted for more than 5% of total domestic industry sales in 2013. Competition is based primarily on quality, product assortment, price, customer service, convenience, marketing support and availability of new products. We compete with publicly and privately owned companies with broad geographical market coverage and product categories. We compete with other specialty and mass market retailers including Vitamin World®, GNC®, Whole Foods®, Natural Grocers®, Sprouts Farmers Market®, Costco® and Wal-Mart®, drugstore chains including Rite-Aid®, CVS® and Walgreens®, internet and mail order companies including Amazon.com®, Puritan’s Pride®, Vitacost.com®, Bodybuilding.com®, Doctors Trust®, Swanson® and iHerb® in addition to a variety of independent health and vitamin stores and e-commerce outlets.
10
Table of Contents
Insurance and Risk Management
We purchase insurance to partially offset standard risks in our industry, including policies to cover products liability, travel liability, auto liability and other casualty and property risks. We are self-insured for certain losses related to our employee medical benefits, workers’ compensation and general liability, although we maintain stop-loss coverage with third-party insurers to limit our liability exposure. Our insurance rates are based on our safety record, claims experience and trends in the insurance industry.
We face an inherent risk of exposure to product liability claims if, among other things, the use of our products results in injury. With respect to product liability coverage, we carry insurance coverage typical of our industry and product lines. Our coverage involves self-insured retentions with primary and excess liability coverage above the retention amount. We have the ability to refer claims to our contract manufacturers, third-party vendors and their respective insurers to pay the costs associated with any claims arising from those contract manufacturers’ or third-party vendors’ products. Our insurance covers claims that are not adequately covered by a contract manufacturer’s or third-party vendor’s insurance and provides for excess secondary coverage above the limits provided by our contract manufacturers or third-party vendors. We believe we have obtained a prudent amount of insurance for the insurable risks associated with our business. Our experience is that our insurance costs have increased in the past, and may increase in the future.
Tradenames and Other Intellectual Property
We believe trademark protection is particularly important to the maintenance of the recognized proprietary brand names under which we market our products. We own trademarks or trade names that we use in conjunction with the sale of our products, including the Vitamin Shoppe®, BodyTech®, True Athlete®, Mytrition®, plnt™, ProBioCare™ , Next Step™, Nutri-Force® Sport and Betancourt Sports Nutrition brand names. We also rely upon trade secrets, know-how, continuing technological innovations and licensing opportunities to develop and maintain our competitive position. We protect our intellectual property rights through a variety of methods including trademark and trade secret laws, as well as confidentiality agreements and proprietary information agreements with vendors, employees, consultants and others who have access to our proprietary information. Protection of our intellectual property often affords us the opportunity to enhance our position in the marketplace by precluding our competitors from using or otherwise exploiting our technology and brands. The carrying value of our trademarks and brands, which are primarily indefinite lived intangible assets, was $80.6 million at December 27, 2014 and $71.2 million at December 28, 2013.
Sales from International Sources
For each of the last three years, less than 1.0% of our sales have been derived from international sources.
Employees
As of December 27, 2014, we had a total of 4,088 full-time and 1,495 part-time employees, of whom 4,405 were employed in our retail channel and 1,178 were employed in corporate, manufacturing, distribution and direct channel support functions. None of our employees belong to a union or are a party to any collective bargaining or similar agreement except for certain employees at one of our Seattle based stores, who are members of the United Food & Commercial Workers Local No. 367. We consider our relationships with our employees to be good.
Environmental
We are subject to numerous federal, state, local and foreign laws and regulations governing our operations, including the handling, transportation and disposal of our products and our non-hazardous and hazardous substances and wastes, as well as emissions and discharges into the environment, including discharges to air, surface water and groundwater. Failure to comply with those laws and regulations could result in costs for corrective action, penalties or the imposition of other liabilities. Changes in environmental laws or the interpretation thereof or the development of new facts could also cause us to incur additional capital and operational expenditures to maintain compliance with environmental laws and regulations. We also are subject to laws and regulations that impose liability and cleanup responsibility for releases of hazardous substances into the environment without regard to fault or knowledge about the condition or action causing the liability. Under certain of these laws and regulations, such liabilities can be imposed for cleanup of previously owned or operated properties. The presence of contamination from those substances or wastes could also adversely affect our ability to utilize our leased properties. Compliance with environmental laws and regulations has not had a material effect upon our earnings or financial position; however, if we violate any environmental obligation, it could have a material adverse effect on our business or financial performance.
Government Regulation
The formulation, manufacturing, processing, labeling, packaging, advertising and distribution of our products are subject to regulation by various federal, state, local and international agencies, including the FDA, the FTC, the Consumer Product Safety Commission, the U.S. Department of Agriculture (“USDA”) and the Environmental Protection Agency (“EPA”). These activities are also regulated by various agencies of the states and localities in which our products are sold. Pursuant to the FDCA, the FDA regulates the processing, formulation, safety, manufacture, packaging, labeling and distribution of dietary supplements (including vitamins, minerals, and herbs) and cosmetics. The FTC has jurisdiction to regulate the advertising of these products.
11
Table of Contents
The FDCA has been amended several times with respect to dietary supplements, in particular by the Dietary Supplement Health and Education Act of 1994 (“DSHEA”). DSHEA established a new framework governing the composition, safety, labeling and marketing of dietary supplements. “Dietary supplements” are defined as vitamins, minerals, herbs, other botanicals, amino acids and other dietary substances for human use to supplement the diet, as well as concentrates, metabolites, constituents, extracts or combinations of such dietary ingredients. Generally, under DSHEA, dietary ingredients that were on the market prior to October 15, 1994 may be used in dietary supplements without notifying the FDA. New dietary ingredients (i.e., not marketed in the U.S. prior to October 15, 1994) must be the subject of a new dietary ingredient notification submitted to the FDA unless the ingredient has been “present in the food supply as an article used for food” without being “chemically altered.” A new dietary ingredient notification must be submitted to the FDA at least 75 days before the initial marketing of the new dietary ingredient. The FDA has issued guidance regarding the content of a new dietary ingredient notification. While the guidance is not enforceable, it represents the FDA’s current point of view. Should the FDA enforce the guidance as written, it would have a negative effect on the innovation and continued marketing of dietary supplements. There is no certainty that the FDA will accept any particular evidence of safety for any new dietary ingredient. The FDA’s refusal to accept such evidence could prevent the marketing of those dietary ingredients.
DSHEA permits “statements of nutritional support” to be included in labeling for dietary supplements without premarket FDA approval. Such statements must be submitted to the FDA within 30 days of marketing and must bear a label disclosure that “This statement has not been evaluated by the Food and Drug Administration. This product is not intended to diagnose, treat, cure, or prevent any disease.” Such statements may describe how a particular dietary ingredient affects the structure, function or general well-being of the body, or the mechanism of action by which a dietary ingredient may affect body structure, function or well-being, but may not expressly or implicitly represent that a dietary supplement will diagnose, cure, mitigate, treat, or prevent a disease. A company that uses a statement of nutritional support in labeling must possess scientific evidence substantiating that the statement is truthful and not misleading. If the FDA were to determine that a particular statement of nutritional support was an unacceptable drug claim or an unauthorized version of a disease claim for a food product, or if the FDA were to determine that a particular claim was not adequately supported by existing scientific data or was false or misleading, we would be prevented from using that claim.
In addition, DSHEA provides that so-called “third-party literature,” e.g. a reprint of a peer-reviewed scientific publication linking a particular dietary ingredient with health benefits, may be used “in connection with the sale of a dietary supplement to consumers” without the literature being subject to regulation as labeling. Such literature must not be false or misleading; the literature may not “promote” a particular manufacturer or brand of dietary supplement; and a balanced view of the available scientific information on the subject matter must be presented. If the literature fails to satisfy each of these requirements, we may be prevented from disseminating such literature with our products, and any dissemination could subject our product to regulatory action as an illegal drug. The FDA adopted final regulations regarding cGMP, in manufacturing, packing, or holding dietary ingredients and dietary supplements, authorized by DSHEA on June 25, 2007. cGMP regulations require dietary supplements to be prepared, packaged and held in compliance with strict rules, and require quality control provisions similar to those in the cGMP regulations for drugs. The FDA could inspect one of our facilities or those of one of our contract manufacturers and determine that the facility was not in compliance with these regulations, and cause affected products made or held in the facility to be subject to FDA enforcement actions.
The FDA has broad authority to enforce the provisions of the FDCA applicable to foods, dietary supplements, and cosmetics including powers to issue a public warning letter to a company, to publicize information about illegal products, to request a recall of illegal products from the market, and to request the United States Department of Justice to initiate a seizure action, an injunction action, or a criminal prosecution in the U. S. courts. The regulation of foods, dietary supplements and cosmetics may increase or become more restrictive in the future.
Legislation could be passed which would impose substantial new regulatory requirements for dietary supplements. Such potential legislation could impose new requirements which could raise our costs and hinder our business.
The FTC exercises jurisdiction over the advertising of foods, dietary supplements and cosmetics. In recent years, the FTC has instituted numerous enforcement actions against dietary supplement companies for failure to have adequate substantiation for claims made in advertising or for the use of false or misleading advertising claims. As a result of our efforts to comply with applicable statutes and regulations, we have from time to time reformulated, eliminated or relabeled certain of our products and revised certain provisions of our sales and marketing program. The FTC has broad authority to enforce its laws and regulations applicable to foods, dietary supplements and cosmetics, including the ability to institute enforcement actions which often result in consent decrees, injunctions, and the payment of civil penalties by the companies involved. Failure to comply with the FTC’s laws and regulations could impair our ability to market our products.
| Item 1A. | Risk Factors |
You should carefully consider the following factors, in addition to other information in this Annual Report on Form 10-K, in evaluating our Company and our business.
Unfavorable publicity or consumer perception of our products and any similar products distributed by other companies could have a material adverse effect on our reputation, which could result in decreased sales and significant fluctuations in our business, financial condition and results of operations.
12
Table of Contents
We depend significantly on consumer perception regarding the safety and quality of our products, as well as similar products distributed by other companies. Consumer perception of products can be significantly influenced by adverse publicity in the form of published scientific research, national media attention or other publicity, whether or not accurate, that associates consumption of our products or any other similar products with illness or other adverse effects, or questions the benefits of our or similar products or that claims that any such products are ineffective. A new product may initially be received favorably, resulting in high sales of that product, but that sales level may not be sustainable as consumer preferences change. Future scientific research or publicity could be unfavorable to our industry or any of our particular products and may not be consistent with earlier favorable research or publicity. Unfavorable research or publicity could have a material adverse effect on our ability to generate sales. For example, in 2013, our sales of weight management products were negatively impacted as a result of negative publicity surrounding, and FDA actions with respect to, products containing 1.3-dimethylpentylamine/dimethylamylamine/13-dimethylamylamine (“DMAA”) and aegeline and certain weight management products such as OxyElite Pro™. As a result of the above factors, our sales could decrease and our operating results could fluctuate significantly from quarter-to-quarter and year-to-year.
Our failure to appropriately and timely respond to changing consumer preferences and demand for new products and services could significantly harm our customer relationships and our business, financial condition and results of operations.
Our business is subject to changing consumer trends and preferences. Our failure to accurately predict or react to these trends could negatively impact consumer opinion of us as a source for the latest products, which in turn could harm our customer relationships and cause us to lose market share. The success of our product offerings depends upon a number of factors, including our ability to:
| • | anticipate customer needs; |
| • | innovate and develop new products; |
| • | successfully introduce new products in a timely manner; |
| • | price our products competitively with retail and online competitors; |
| • | deliver our products in sufficient volumes and in a timely manner; and |
| • | differentiate our product offerings from those of our competitors. |
If we do not introduce new products or make enhancements to meet the changing needs of our customers in a timely manner, some of our products could be rendered obsolete, which could have a material adverse effect on our sales and other operating results.
We may incur material product liability claims, which could increase our costs and adversely affect our reputation with our customers, which in turn could materially adversely affect our business, financial condition and results of operations.
As a retailer, direct marketer and manufacturer of products designed for human consumption, we are subject to product liability claims if the use of our products or the products that we manufacture for third parties is alleged to have resulted in injury or to include inadequate instructions for use or inadequate warnings concerning possible side effects and interactions with other substances. Most of our products and the products that we manufacture for third parties are vitamins, minerals, herbs and other ingredients that are classified as foods or dietary supplements and are not subject to pre-market regulatory approval in the U. S. Our products or the products that we manufacture for third parties could contain contaminated substances, and some of our products and the products that we manufacture for third parties contain ingredients that do not have long histories of human consumption. Previously unknown adverse reactions resulting from human consumption of these ingredients could occur. While we attempt to manage these risks by obtaining indemnification agreements from the manufacturers of products that we sell (other than our own branded products) and insurance, third parties may not satisfy their indemnification obligations to us and/or our insurance policies may not be sufficient or available. A product liability claim against us, whether with respect to products of a third party that we sell, our branded products or products that we manufacture for third parties, could result in increased costs and could adversely affect our reputation with our customers, which in turn could materially adversely affect our business, financial condition and results of operations.
We may not be able to obtain insurance coverage in the future at current rates, or we may experience unfavorable claims.
While we believe we will be able to obtain liability insurance in the future, because of increased selectivity by insurance providers we may only be able to obtain such insurance at increased rates and/or with reduced coverage levels. Additionally, we may experience unfavorable claims. Changes in insurance rates, reduced coverage levels, or unfavorable claims could reduce our income from operations.
Compliance with governmental regulations could increase our costs significantly and adversely affect our operating income.
The processing, formulation, manufacturing, packaging, labeling, advertising and distribution of our products and the products that we manufacture for third parties are subject to federal laws and regulation by one or more federal agencies, including the FDA, the FTC, the USDA and the EPA. These activities are also regulated by various state, local and international laws and agencies of the states and localities in which our products and the products that we manufacture for third parties are sold. Regulations may prevent or delay the introduction, or
13
Table of Contents
require the reformulation, of our products or the products that we manufacture for third parties, which could result in lost sales and increased costs to us. A regulatory agency may not accept the evidence of safety for any new ingredients that we may want to market, may determine that a particular product or product ingredient presents an unacceptable health risk, may determine that a particular statement of nutritional support on our products or that parties use on the products we manufacture for them, or that we want to use on our products or that third parties want to use on the products we manufacture for them, is an unacceptable drug claim or an unauthorized version of a food “health claim”. A regulatory agency may determine that particular claims are not adequately supported by available scientific evidence. Any such regulatory determination would prevent us or third parties, as applicable, from marketing particular products or using certain statements on those products, which could adversely affect our sales of those products.
We may experience product recalls, withdrawals or seizures, which could materially and adversely affect our business, financial condition and results of operations.
We may be subject to product recalls, withdrawals or seizures if any of the products we sell or the products that we manufacture for third parties is believed to cause injury or illness or if we are alleged to have violated governmental regulations in the labeling, promotion, sale or distribution of those products. A significant recall, withdrawal or seizure of any of the products we manufacture or sell may require significant management attention, would likely result in substantial and unexpected costs and may materially and adversely affect our business, financial condition or results of operations. Furthermore, a recall, withdrawal or seizure of any of our products or the products we manufacture for third parties may adversely affect consumer confidence in our brands and thus decrease consumer demand for our products or such third parties’ products, as applicable. As is common in the VMS industry, except with respect to the products that we manufacture at our manufacturing facility, we rely on our contract manufacturers and suppliers to ensure that the products they manufacture and sell to us comply with all applicable regulatory and legislative requirements. In general, we seek representations and warranties, indemnification and/or insurance from our contract manufacturers and suppliers. However, even with adequate insurance and indemnification, any claims of non-compliance could significantly damage our reputation and consumer confidence in our products. In addition, the failure of those products to comply with applicable regulatory and legislative requirements could prevent us from marketing the products or require us to recall or remove such products from the market, which in certain cases could materially and adversely affect our business, financial condition and results of operations.
For example, products manufactured by others that contain DMAA (1.3-dimethylpentylamine/dimethylamylamine/13-dimethylamylamine) had been among our top selling products. On April 27, 2012, the FDA announced that it had issued warning letters to ten manufacturers and distributors of dietary supplements containing DMAA for allegedly marketing products for which evidence of the safety of the product had not been submitted to FDA. The FDA also indicated that the warning letters advised the companies that the FDA was not aware of evidence or history of use to indicate that DMAA was safe. On April 16, 2013, USP Labs issued a press release indicating its voluntary decision to phase out products containing DMAA (including Oxy Elite Pro) and replace them with new advanced formulations. We discontinued selling any further inventory of products containing DMAA during Fiscal 2013. In the fourth quarter of 2013, we were informed by USP Labs that due to a pending FDA investigation regarding several adverse events reported in Hawaii involving Oxy Elite Pro products, they were stopping domestic distribution of Oxy Elite Pro with the purple top and Oxy Elite Pro Super Thermo Powder. Shortly thereafter, we ceased distribution of all Oxy Elite products to our stores and took all Oxy Elite products off our shelves nationwide. Simultaneously with our decision, the FDA and the Center for Disease Control issued health alerts pertaining to Oxy Elite Pro products, as reformulated containing aegeline. For the fiscal year ended December 28, 2013, Oxy Elite products (both those containing DMAA and the reformulated versions) represented approximately one percent of our sales.
If it is determined that products that we manufacture (either for ourselves or for third parties) or sell, including but not limited to other weight management products, contain ingredients that do not comply with applicable regulatory and legislative requirements, we could be required to recall or remove from the market all such products and we could become subject to lawsuits related to any alleged non-compliance, any of which recalls, removals or lawsuits could materially and adversely affect our business, financial condition and results of operations.
Disruptions at our manufacturing facility or loss of manufacturing certifications could materially and adversely affect our business, financial condition, results of operations and customer relationships.
Any significant disruption in our operations at our manufacturing facility for any reason, including regulatory requirements, an FDA determination that the facility is not in compliance with the cGMP regulations, the loss of certifications, power interruptions, terrorist attacks, civil unrest, war or the perceived threat thereof, fires, hurricanes and other natural disasters could disrupt our ability to manufacture products for our contract manufacturing customers and our own branded products. Any such disruption could have a material adverse effect on our business, financial condition and results of operations.
We are subject to environmental, health and safety laws and regulations, which could subject us to liabilities, increase our costs or restrict our operations in the future.
Our operations are subject to a variety of environmental, health and safety laws and regulations in each of the jurisdictions in which we operate. These laws and regulations govern, among other things, air emissions, wastewater discharges, the handling and disposal of hazardous substances and wastes, soil and groundwater contamination and employee health and safety. We are also subject to laws and regulations governing the handling and disposal of raw materials, non-compliant products and waste, the handling of regulated material that is included
14
Table of Contents
in our products or products that we manufacture for third parties and the disposal of products at the end of their useful life. These laws and regulations have increasingly become more stringent, and we may incur additional expenses to ensure compliance with existing or new requirements in the future. Any failure by us to comply with environmental, health and safety requirements could result in the limitation or suspension of our operations, including operations at our manufacturing facility. We also could incur monetary fines, civil or criminal sanctions, third-party claims or cleanup or other costs as a result of violations of or liabilities under such requirements. In addition, compliance with environmental, health and safety requirements could restrict our ability to expand our facilities or require us to acquire costly pollution control equipment, incur other significant expenses or modify our manufacturing processes.
Our manufacturing facilities use, store and dispose of hazardous substances in connection with the manufacturing processes. It is possible that these facilities may expose us to environmental liabilities associated with historical site conditions that have not yet been discovered. Some environmental laws impose liability for contamination on current and former owners and operators of affected sites, regardless of fault. If remediation costs or potential claims for personal injury or property or natural resource damages resulting from contamination arise, they may be material and may not be recoverable under any contractual indemnity or otherwise from prior owners or operators or any insurance policy. Additionally, we may not be able to successfully enforce any such indemnity or insurance policy in the future. In the event that new or previously unknown contamination is discovered or new cleanup obligations are otherwise imposed at any of our currently or previously owned or operated facilities, we may be required to take additional, unplanned remedial measures and record charges for which no reserves have been recorded.
Although we expect that our acquisition of Nutri-Force will result in benefits to our business, we may not realize those benefits because of integration difficulties and other challenges.
The success of our acquisition of Nutri-Force will depend in large part on the ability of our management to realize the anticipated benefits from the acquisition of Nutri-Force. To realize these anticipated benefits, the businesses of Nutri-Force must be successfully integrated with the Company. Management may face challenges in consolidating the functions of the Company and Nutri-Force, integrating the technologies, organizations, procedures, policies and operations, as well as addressing the different business cultures at the two companies, and retaining key management and employees of Nutri-Force. If integration is not successful, the anticipated benefits of the acquisition may not be realized fully or at all or may take longer to realize than expected. The integration may also be time consuming and require substantial resources and effort. The integration process and other disruptions resulting from the acquisition may disrupt our ongoing businesses or adversely affect relationships with employees, regulators and others with whom we have business or dealings. While the former owners of Nutri-Force have agreed to indemnify us for certain liabilities related to the conduct or operations of Nutri-Force prior to the acquisition, and although we maintain insurance to cover such liabilities, such indemnification arrangement and insurance coverage may be unenforceable or inadequate to cover unpredictable or unforeseen liabilities related to the Nutri-Force business.
Our customers for whom we contract manufacture may significantly influence our business, financial condition and results of operations.
Our contract manufacturing business is dependent on demand for the products we manufacture for our customers and we have no control or influence over the market demand for those products. Demand for our customers’ products can be adversely affected by, among other things, regulatory issues, the loss of patent or other intellectual property rights protection, the emergence of competing products, competition from other contract manufacturers, negative public or consumer perception of those products or our industry and changes in the marketing strategies for such products.
If production volumes of products that we manufacture for third parties and related revenues are not maintained, it may have a material adverse effect on our business, financial condition and results of operations. Additionally, any changes in product mix due to our customers’ products may adversely affect our results of operations.
Congress and/or regulatory agencies may impose additional laws or regulations or change current laws or regulations, and compliance with new or changed governmental regulations could increase our costs significantly and materially and adversely affect our business, financial condition and results of operations.
From time to time, Congress, the FDA, the FTC or other federal, state, local or foreign legislative and regulatory authorities may impose additional laws or regulations that apply to us, repeal laws or regulations that we consider favorable to us or impose more stringent interpretations of current laws or regulations. We are not able to predict the nature of such future laws, regulations, repeals or interpretations or to predict the effect that additional governmental regulation, when and if it occurs, would have on our business in the future. Those developments could require reformulation of certain products to meet new standards, recalls or discontinuance of certain products (including products that we sell and products that we manufacture for third parties) not able to be reformulated, additional record-keeping requirements, increased documentation of the properties of certain products, additional or different labeling, additional scientific substantiation, adverse event reporting or other new requirements. Any developments of this nature could increase our costs significantly and could have a material adverse effect on our business, financial condition and results of operations.
On July 5, 2011, the FDA issued draft guidance governing the notification of new dietary ingredients (“NDIs”). We believe that the draft guidance, if implemented as proposed, would have a material impact on our operations. FDA enforcement of the NDI guidance as written
15
Table of Contents
could require us to incur additional expenses, which could be significant, and negatively affect our business in several ways, including, but not limited to, the detention and refusal of admission of imported products, the injunction of manufacturing of any dietary ingredients or dietary supplements until the FDA determines that those ingredients or products are in compliance, and the potential imposition of penalties for non-compliance. Each of those events would increase our liability and could have a material adverse effect on our financial condition, results of operations and cash flow.
We rely on contract manufacturers to produce the majority of our own branded products. Disruptions in our contract manufacturers’ operations or losses of manufacturing certifications could adversely affect our sales and customer relationships.
Our contract manufacturers produce the majority of our own branded products. We manufacture the remaining portion of our own branded products at our manufacturing facilities in Miami Lakes, Florida. Any significant disruption in the operations of our contract manufacturers for any reason, such as regulatory requirements or loss of certifications, power interruptions, fires, hurricanes, destruction of or damage to facilities, war or threats of terrorism, could adversely affect our sales and customer relationships. While we do not believe it would be difficult to source our products from other contract manufacturers, a transition period would be required in order to source our own branded products from other contract manufacturers.
Increases in the price or shortages of supply of key raw materials could materially and adversely affect our business, financial condition and results of operations.
Our products and the products we manufacture for third parties are composed of certain key raw materials. If the prices of these raw materials were to increase significantly, it could result in a significant increase to us in the prices charged to us for our own branded products and third-party products. Raw material prices may increase in the future and we may not be able to pass on those increases to customers who purchase our products. A significant increase in the price of raw materials that cannot be passed on to customers could have a material adverse effect on our business, financial condition and results of operations.
We are reliant upon the supply of raw materials that meet our specifications and the specifications of third parties for which we manufacture. If any raw material is adulterated and does not meet our specifications or third parties’ specifications, it could significantly impact our ability to manufacture products and could materially and adversely affect our business, financial condition and results of operations.
In addition, if we are no longer able to obtain products from one or more of our suppliers on terms reasonable to us or at all, our ability to perform under contracts with third parties for which we manufacture products and our customer relationships could be materially and adversely affected. Events such as terrorist attacks, civil unrest or war, or the perceived threat thereof, may also have a significant adverse effect on raw material availability essential to the manufacturing of our products which could have a material adverse effect on our business, financial condition and results of operations.
We currently rely primarily on two warehouse and distribution facilities to distribute most of the products we sell. Disruptions to these warehouse and distribution facilities could adversely affect our business.
Our primary warehouse and distribution operations are currently concentrated in two locations; adjacent to our corporate headquarters in North Bergen, New Jersey and in Ashland, Virginia. Although we acquired a distribution center in Seattle, Washington in the acquisition of Super Supplements in February 2013, any significant disruption to our two primary distribution centers operations for any reason, such as a flood, fire or hurricane, could adversely affect our product distributions and sales until we are able to secure an alternative distribution method.
Failure to increase the utilization of our supply chain network could have a material adverse effect on our business.
If we fail to increase the utilization of our supply chain network and expand functionality of our information technology systems, we could experience increased costs associated with diminished productivity and operating inefficiencies related to the flow of goods through our supply chain, which could have a material adverse affect on our financial results.
Our existing stores, or any stores we open in the future, may not achieve sales and operating levels consistent with historical results. In addition, our growth strategy includes the addition of a significant number of new stores each year. We may not be able to successfully implement this strategy on a timely basis or at all, and our business could be materially and adversely affected if we are unable to successfully negotiate favorable lease terms.
We continue to pursue new store growth. Since the beginning of Fiscal 2012, we have opened 167 new stores and acquired 31 stores, expanding our presence in our existing markets as well as entering new markets. Historically, our new stores have reached sales that are consistent with our mature stores over the course of approximately four to five years. Our new stores opened since the beginning of Fiscal 2013 average approximately 3,000 square feet compared to the average of our total store portfolio of approximately 3,600 square feet, resulting in initial sales volume lower than historical trends. Existing stores, or any new stores we open in the future, may not achieve sales and operating levels consistent with our historical results. In addition, customer migration from retail stores to e-commerce may also reduce store potential. The failure of our existing stores and new stores to achieve sales and operating levels consistent with our historical results could have a material adverse effect on our financial condition and operating results. As of December 27, 2014, we leased 717 stores along
16
Table of Contents
with our corporate headquarters, additional office space and manufacturing and distribution facilities. The store leases are generally for a term of ten years and we have options to extend most leases for a minimum of five years. Our business, financial condition, and operating results could be materially and adversely affected if we are unable to continue to negotiate acceptable lease and renewal terms.
In addition, our growth continues to depend, in part, on our ability to open and operate new stores successfully. The success of this strategy depends upon, among other things, the identification of suitable sites for store locations, the negotiation of acceptable lease terms, the hiring, training and retention of competent sales personnel, and the effective management of inventory to meet the needs of new and existing stores on a timely basis. Our continued expansion will also place increased demands on our operational, managerial and administrative resources. These increased demands could cause us to operate our business less effectively, which in turn could cause deterioration in the financial performance of our existing stores. Further, our new store openings may result in reduced net sales volumes in the direct channel, as well as in our existing stores in those markets. We expect to fund our expansion through cash flow from operations and, if necessary, by borrowings under our revolving credit facility. If we experience a decline in performance, we may slow or discontinue store openings. If we fail to successfully implement these strategies, our financial condition and operating results may be materially and adversely affected.
We operate in a highly competitive industry and our failure to compete effectively could materially and adversely affect our sales and growth prospects.
The U.S. nutritional supplements retail industry is a large and highly fragmented industry. According to the NBJ, in 2013, no single industry participant accounted for more than 5% of total domestic industry sales. We compete primarily against other specialty retailers, supermarkets, drugstores, mass merchants, multi-level marketing organizations and mail order companies. This market is highly sensitive to the introduction of new products, which may rapidly capture a significant share of the market. As certain products become more mainstream, we experience increased competition for those products. For example, as the trend in favor of low carb products developed, we experienced increased competition for our low carb products from supermarkets, drug stores, mass merchants and other food companies. Increased competition from companies that distribute through retail, e-commerce or wholesale channels could have a material adverse effect on our financial condition and results of operations. Certain of our competitors may have significantly greater financial, technical and marketing resources than we do. In addition, our competitors may be more effective and efficient in introducing new products. We may not be able to compete effectively, and any of the factors listed above may cause price reductions, reduced margins and losses of our market share.
The loss of key management could negatively affect our business.
Our success largely depends on the efforts and abilities of our senior executive group and key personnel. The loss of the services of one or more of our key executives or personnel, or the increased demands placed on our key executives and personnel by our continued growth could adversely affect our financial performance and our ability to execute our strategies. Our continued success also depends on our ability to attract and retain qualified team members to meet our future growth needs. We may not be able to attract and retain necessary team members to operate our business.
On September 9, 2014, Anthony N. Truesdale, notified the Company’s Board of Directors that he will resign as Chief Executive Officer of the Company, effective as of June 27, 2015, or such date as mutually agreed by Mr. Truesdale and the Company’s Board of Directors. The departure of Mr. Truesdale, and the transition to a new Chief Executive Officer, could adversely affect our financial performance and our ability to execute our strategies.
If we fail to protect our brand names, competitors may adopt tradenames that dilute the value of our brand names.
We may be unable or unwilling to strictly enforce our tradenames in each jurisdiction in which we do business. In addition, because of the differences in foreign trademark laws concerning proprietary rights, our trademarks may not receive the same degree of protection in foreign countries as they do in the U.S. Also, we may not always be able to successfully enforce our trademarks against competitors, or against challenges by others. Our failure to successfully protect our trademarks could diminish the value and efficacy of our past and future marketing efforts, and could cause customer confusion, which could, in turn, materially and adversely affect our sales and profitability.
We may be subject to intellectual property litigation and infringement claims by others.
We may be subject to intellectual property litigation and infringement claims initiated by others, other competitors or entities may assert rights in, or ownership of, our trademarks and other intellectual property rights or in marks that are similar to ours, and we may not be able to successfully resolve these types of conflicts to our satisfaction. Claims and litigation of this nature could cause us to incur significant expenses or prevent us from manufacturing, selling or using some of our products or the products that we manufacture for third parties, which could, in turn, adversely affect our sales and profitability.
Changes in accounting standards and estimates could have a material adverse effect on our results of operations and financial position.
Generally accepted accounting principles and the related authoritative guidance for many aspects of our business, including revenue recognition, inventories, goodwill and intangible assets, leases, income taxes and stock-based compensation, are complex and involve subjective judgments. Changes in these rules or changes in the underlying estimates, assumptions or judgments by our management could have a material adverse effect on our results of operations. For example, proposed authoritative guidance for lease accounting, once finalized and enacted, could have a material adverse effect on our results of operations and financial position.
17
Table of Contents
Disruptions in our information systems could damage our reputation, be expensive to remedy and have a material adverse effect on our business and results of operations.
We rely extensively on information systems for point-of-sale processing in our stores, our e-commerce business, supply chain, manufacturing operations, financial reporting, human resources and various other processes and transactions. Our information systems, including those provided and maintained by third-party service providers, are subject to damage or interruption from power outages or other types of damage, including those due to computer and telecommunications failures, natural events including hurricanes, fires, floods, earthquakes, tornadoes, high winds and other severe weather, and from events caused by humans, including computer viruses, physical or electronic break-ins and acts of war or terrorism. Any of these events could cause system interruptions, delays and loss of critical data, and could prevent us from accepting and fulfilling customer orders and providing services, which could make our product offerings less attractive and subject us to liability as well as result in lost customer confidence. Our systems are not fully redundant and our disaster recovery planning may not be sufficient. In addition, we may have inadequate insurance coverage to compensate for any related losses. Any of these events could damage our reputation, be expensive to remedy and have a material adverse effect on our business and results of operations.
If we fail to protect the integrity and security of customer-related and other confidential information, we could be exposed to litigation, increased costs and reputational damage, and our business, results of operations and financial condition could be materially and adversely affected.
The use of individually identifiable data by us, our customers, our Health Enthusiasts and others is regulated at the state, federal and international levels. Privacy and information security laws and regulations change from time to time, and increasing costs of compliance with those laws and regulations and related technology investments could materially and adversely affect our business and results of operations. Additionally, the success of our e-commerce operations depends upon the secure transmission of confidential information over public networks, including the use of cashless payments, and we use computers in substantially all other aspects of our business operations, including for point-of-sale processing in our stores. Such uses give rise to cybersecurity risks, including security breach, espionage, system disruption, theft and inadvertent release of information. While we have taken significant steps to protect customers’ personal information, consumer preferences and credit card information, and other confidential information including our employees’ private information and financial and strategic data about the Company and our business partners, the intentional or negligent actions of Health Enthusiasts, our suppliers or others may undermine our security measures. As a result, unauthorized parties may obtain access to our data systems and misappropriate confidential data. Furthermore, because the methods used to obtain unauthorized access change frequently and may not be immediately detected, we may be unable to anticipate these methods or implement preventative measures, and our incident response efforts may not be entirely effective. Any preventative measures we implement may have the potential to negatively affect our relations with our customers or decrease activity on our websites by making them less user-friendly. If our data security is compromised, it could have a material adverse effect on our reputation, results of operations and financial condition, materially increase the costs we incur to protect against those events in the future and subject us to additional legal risk and a competitive disadvantage. In addition, our customers could lose confidence in our ability to protect their personal information, which could cause them to stop shopping at our stores or online. The loss of confidence from a data security breach involving Health Enthusiasts could hurt our, and their, reputation and as a result cause Health Enthusiast recruiting and retention challenges.
Potential reliance on future indebtedness could adversely affect our financial condition.
We have in the past and may again in the future rely on debt financing to help fund our growth plans. If we again incur material debt financing, it could:
| • | increase our vulnerability to general adverse economic, industry and competitive conditions; |
| • | require us to dedicate a substantial portion of our cash flow from operations to payments on our indebtedness, thereby reducing the availability of our cash flow to fund working capital, new store growth and other capital expenditures, research and development efforts and other general corporate purposes; |
| • | limit our flexibility in planning for, or reacting to, changes in our business and the industry in which we operate; |
| • | place us at a competitive disadvantage compared to our competitors that have less debt; and |
| • | limit our ability to borrow additional funds. |
Healthcare legislation may materially and adversely affect our results of operations, financial position and cash flows.
In March 2010, comprehensive health care reform legislation under the Patient Protection and Affordable Care Act and the Health Care Education and Affordability Reconciliation Act was passed and signed into law. Provisions of this law have become and will become effective at various dates over the next several years, and many of the regulations and guidance for this law have not been implemented. Due to the breadth and complexity of this law, the lack of implementing regulations and interpretive guidance and the phased-in nature of the implementation, we cannot predict the future effect of this law on our business. In part because it may increase the costs of providing medical insurance to our Health Enthusiasts and we may be unable to pass on these costs to our customers, this law may materially and adversely affect our results of operations, financial position and cash flows.
18
Table of Contents
Our international operations may result in additional market risks, which may harm our business.
We entered the Canadian market in 2012 and operate 3 stores in Canada and also distribute products to other countries and manufacture products for third parties in other countries. As our international operations expand, they may require greater management and financial resources. International operations require the integration of personnel with varying cultural and business backgrounds and an understanding of the relevant differences in the cultural, legal and regulatory environments. Our business may be increasingly affected by the risks of our international activities, including:
| • | Fluctuations in currency exchange rates; |
| • | Changes in international staffing and employment issues; |
| • | Tariff and other trade barriers; |
| • | Greater difficulty in using and enforcing our intellectual property rights; |
| • | Failure to understand the local culture and market; |
| • | Inconsistent product regulation or sudden policy changes by foreign agencies or governments; |
| • | Compliance with U.S. laws applicable to international operations, including the Foreign Corrupt Practices Act and regulations promulgated by the Office of Foreign Asset Control; |
| • | Compliance with foreign laws, including tax laws and financial accounting standards; and |
| • | Political and economic instability and developments. |
Natural disasters and unusually adverse weather conditions could cause permanent or temporary damage to our distribution centers or stores, impair our ability to purchase, receive or replenish inventory or cause customer traffic to decline, all of which could result in lost sales and otherwise materially and adversely affect our results of operations.
The occurrence of one or more natural disasters, such as hurricanes, fires, floods, earthquakes, tornadoes, high winds and other severe weather, could materially and adversely affect our operations and results of operations. To the extent these events result in the closure of our distribution centers, our corporate headquarters, or a significant number of our stores, or to the extent they adversely affect one or more of our key suppliers, our operations and results of operations could be materially and adversely affected through an inability to make deliveries to our stores and through lost sales. In addition, these events could result in increases in fuel (or other energy) prices or a fuel shortage, delays in opening new stores, the temporary lack of an adequate work force in a market, the temporary or long-term disruption in the supply of products from suppliers, delay in the delivery of goods to our distribution centers or stores, the temporary reduction in the availability of products in our stores and disruption to our information systems, as noted above. These events also could have indirect consequences, such as increases in the cost of insurance, if they were to result in significant loss of property or other insurable damage.
Our e-commerce business is dependent on certain third parties. Changes in business practices or terms by such third parties could have a material adverse effect on our results of operations.
Our e-commerce business has several third-party relationships that contribute to our ability to generate revenue from a variety of online sources. These relationships may be dependent upon third-party tools, such as search engines, or established business terms negotiated by the Company. If the economics of these relationships or the use of the third-party tools used to drive revenue change materially, this could affect our decision to maintain these relationships, and could result in lost sales and otherwise materially and adversely affect our financial performance.
If we do not successfully develop and maintain a relevant omni-channel experience for our customers, our business and results of operations could be materially and adversely affected.
Omni-channel retailing is rapidly evolving, and we must keep pace with changing customer expectations and new developments by our competitors. Our customers are increasingly using computers, tablets, mobile phones, and other devices to shop online. As part of our omni-channel strategy, we are making technology investments. If we are unable to make, improve, or develop relevant customer-facing technology in a timely manner, our ability to compete and our business and results of operations could be materially and adversely affected. In addition, if our e-commerce businesses or our other customer-facing technology systems do not function as designed, we may experience a loss of customer confidence, lost sales, or data security breaches, any of which could materially and adversely affect our business and results of operations.
We may not be able to realize the expected benefits from the implementation of our strategic initiative to develop our presence in international markets.
Our strategic initiatives are focused on, among other things, developing a presence in new international markets through franchise, wholesale and retail distribution opportunities. Our future operating results are dependent, in part, on our management’s success in implementing this, and other, strategic initiatives. Also, our short-term operating results could be unfavorably impacted by the opportunity and financial costs associated with the implementation of our strategic plans. See “Item 1—Business—Business Strategy” and our statement on Forward Looking Statements in this Annual Report on Form 10-K for further discussion.
19
Table of Contents
| Item 1B. | Unresolved Staff Comments |
None.
| Item 2. | Properties |
As of December 27, 2014, there were 717 Vitamin Shoppe, Super Supplements and Vitapath retail stores open in the United States, Puerto Rico and Ontario, Canada. See “Item 1—Business—Store Counts and Locations” for additional information on the growth in our network of stores for Fiscal 2010 through 2014 and the location of our stores as of December 27, 2014. As of December 27, 2014, we leased the property for all of our stores. We do not believe that any individual store property is material to our financial condition or results of operation, however, more highly populated geographic areas may have a higher concentration of store locations. Of the leases for our stores as of December 27, 2014, 29 expire in Fiscal 2015, 58 expire in Fiscal 2016, 57 expire in Fiscal 2017, 100 expire in Fiscal 2018, 104 expire in Fiscal 2019 and the balance expire in Fiscal 2020 or thereafter. We have options to extend most of these leases for a minimum of five years.
Our leased properties also include the following:
| Location |
Description |
Square |
Lease Termination Year |
Renewal Options | ||||||
| North Bergen, New Jersey |
Warehouse, Distribution Center and Corporate Headquarters | 230,000 | 2017 | One Five-Year Renewal Option | ||||||
| Ashland, Virginia |
Warehousing and Distribution Center | 312,000 | 2028 | Three Five-Year Renewal Options | ||||||
| Secaucus, New Jersey |
Corporate Offices | 56,000 | 2029 | Two Five-Year Renewal Options | ||||||
| Seattle, Washington |
Warehousing and Distribution Center | 60,000 | 2017 | Two Five-Year Renewal Options | ||||||
| Miami Lakes, Florida |
Manufacturing Facilities | 212,000 | 2016 and 2018 | Three Five-Year Renewal Options | ||||||
We entered into an agreement with a west coast third-party logistics facility during Fiscal 2010. We have elected to terminate this agreement and expect to discontinue use of this facility during the first half of Fiscal 2015.
We believe that all of our current facilities are in good condition.
| Item 3. | Legal Proceedings |
The Company is party to various lawsuits arising from time to time in the normal course of business, many of which are covered by insurance. As of December 27, 2014, the Company was not party to any material legal proceedings. Although the impact of the final resolution of these matters on the Company’s financial condition, results of operations or cash flows is not known, management does not believe that the resolution of these lawsuits will have a material adverse effect on the financial condition, results of operations or liquidity of the Company.
| Item 4. | Mine Safety Disclosures |
Not applicable.
20
Table of Contents
| Item 5. | Market for Registrant’s Common Equity, Related Stockholder Matters and Issuer Purchases of Equity Securities |
Market Information
Since October 28, 2009, our common stock has been traded on the New York Stock Exchange (“NYSE”) under the trading symbol “VSI”. At December 27, 2014, there were 30,048,881 common shares outstanding, and the closing sale price of our common stock was $47.17. Also as of that date, we had approximately 202 common shareholders of record. The table below sets forth the high and low sale prices of our common stock for the periods indicated:
| Fiscal period |
High | Low | ||||||
| 2014 Quarter ended: |
||||||||
| March |
$ | 52.47 | $ | 40.57 | ||||
| June |
49.83 | 40.42 | ||||||
| September |
46.78 | 36.90 | ||||||
| December |
49.04 | 40.35 | ||||||
| 2013 Quarter ended: |
||||||||
| March |
$ | 65.93 | $ | 48.22 | ||||
| June |
52.99 | 43.16 | ||||||
| September |
50.06 | 39.92 | ||||||
| December |
55.20 | 42.44 | ||||||
Stock Performance Graph
The line graph below compares the cumulative total stockholder return on the Company’s common stock with the Russell 2000 Index (RUT), S&P Retail Index (SPXRT) and the NYSE Composite Index (NYA) for the period covering the Company’s initial public offering on October 28, 2009 through December 27, 2014. The graph assumes an investment of $100 made at the closing of trading on October 28, 2009, in (i) the Company’s common stock, (ii) the stocks comprising the RUT, (iii) the stocks comprising the SPXRT and (iv) the stocks comprising the NYA. All values assume reinvestment of the full amount of all dividends, if any, into additional shares of the same class of equity securities at the frequency with which dividends are paid on those securities during the applicable time period.
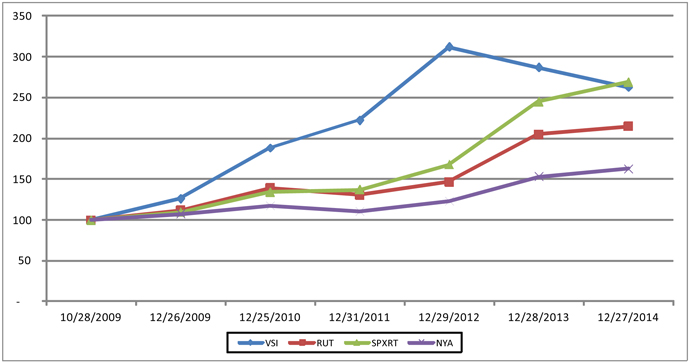
21
Table of Contents
| 10/28/2009 | 12/26/2009 | 12/25/2010 | 12/31/2011 | 12/29/2012 | 12/28/2013 | 12/27/2014 | ||||||||||||||||||||||
| Vitamin Shoppe, Inc. |
100.00 | 126.07 | 187.97 | 222.17 | 311.87 | 286.57 | 262.79 | |||||||||||||||||||||
| Russell 2000 Index |
100.00 | 111.96 | 139.30 | 130.82 | 146.92 | 205.01 | 214.56 | |||||||||||||||||||||
| S&P Retail Index |
100.00 | 109.42 | 134.13 | 137.11 | 167.59 | 244.81 | 269.13 | |||||||||||||||||||||
| NYSE Composite Index |
100.00 | 107.23 | 117.14 | 110.51 | 122.92 | 153.03 | 162.37 | |||||||||||||||||||||
This graph and the accompanying table are not “soliciting material”, are not deemed filed with the Securities and Exchange Commission and are not to be incorporated by reference in any filing by us under the Securities Act of 1933, as amended, or the Securities Exchange Act of 1934, as amended, whether made before or after the date hereof and irrespective of any general incorporation language in any such filing.
Share Repurchase Program
In 2014, the Company’s board of directors approved a share repurchase program that enables the Company to purchase up to $100 million of its shares of common stock from time to time over a three year period. As of December 27, 2014, 1,183,714 shares have been repurchased for a total of $57.8 million. During the third quarter of Fiscal 2014, the Company repurchased 201,000 shares of its common stock in the open market, which were retired upon repurchase. The total purchase price was $7.8 million with an average repurchase price per share of $38.88. Additionally, as part of the share repurchase program approved by the Company’s board of directors, the Company entered into an accelerated share repurchase arrangement (“ASR”) with a financial institution beginning in November 2014. In exchange for an up-front payment of $50.0 million, the financial institution initially delivered 982,714 shares of the Company’s common stock. The purchase period of the ASR ended in January 2015 at which time the financial institution delivered an additional 88,325 shares of the Company’s common stock. The average repurchase price per share under the ASR was $46.68. The shares were retired in the periods they were delivered. For additional information, refer to Note 11., “Share Repurchase Program”, to our consolidated financial statements included in this Annual Report on Form 10-K.
| Item 6. | Selected Financial Data |
We have derived the selected financial data presented below from our consolidated financial statements for the Fiscal Years ended December 27, 2014, December 28, 2013, December 29, 2012, December 31, 2011 and December 25, 2010. Financial results for all fiscal years presented are based on a 52-week period, with the exception of financial results for the Fiscal Year ended December 31, 2011 which are based on a 53-week period, unless otherwise stated. The selected financial data for the Fiscal Years ended December 27, 2014, December 28, 2013 and December 29, 2012 presented below, should be read in conjunction with such consolidated financial statements and notes included herein and in conjunction with Item 7., “Management’s Discussion and Analysis of Financial Condition and Results of Operations”.
22
Table of Contents
| Fiscal Year Ended | ||||||||||||||||||||
| December 27, 2014 |
December 28, 2013 |
December 29, 2012 |
December 31, 2011 |
December 25, 2010 |
||||||||||||||||
| (data presented in thousands, except for share, per share data, number of stores and average store square footage) |
||||||||||||||||||||
| Statement of Operations Data: |
||||||||||||||||||||
| Net sales |
$ | 1,213,046 | $ | 1,087,469 | $ | 950,902 | $ | 856,586 | $ | 751,482 | ||||||||||
| Cost of goods sold |
808,787 | 709,823 | 617,920 | 563,627 | 501,948 | |||||||||||||||
|
|
|
|
|
|
|
|
|
|
|
|||||||||||
| Gross profit |
404,259 | 377,646 | 332,982 | 292,959 | 249,534 | |||||||||||||||
| Selling, general and administrative expenses |
301,603 | 267,354 | 233,610 | 216,125 | 189,872 | |||||||||||||||
|
|
|
|
|
|
|
|
|
|
|
|||||||||||
| Income from operations |
102,656 | 110,292 | 99,372 | 76,834 | 59,662 | |||||||||||||||
| Loss on extinguishment of debt and other (1) |
— | — | — | 635 | 1,349 | |||||||||||||||
| Interest expense, net |
495 | 495 | 659 | 2,325 | 9,517 | |||||||||||||||
|
|
|
|
|
|
|
|
|
|
|
|||||||||||
| Income before provision for income taxes |
102,161 | 109,797 | 98,713 | 73,874 | 48,796 | |||||||||||||||
| Provision for income taxes |
40,920 | 43,251 | 37,888 | 29,010 | 19,550 | |||||||||||||||
|
|
|
|
|
|
|
|
|
|
|
|||||||||||
| Net income |
$ | 61,241 | $ | 66,546 | $ | 60,825 | $ | 44,864 | $ | 29,246 | ||||||||||
|
|
|
|
|
|
|
|
|
|
|
|||||||||||
| Weighted average shares outstanding: |
||||||||||||||||||||
| Basic |
30,239,183 | 29,992,620 | 29,473,711 | 28,802,103 | 27,390,419 | |||||||||||||||
| Diluted |
30,664,105 | 30,541,057 | 30,110,237 | 29,556,024 | 28,338,788 | |||||||||||||||
| Net income per share: |
||||||||||||||||||||
| Basic |
$ | 2.03 | $ | 2.22 | $ | 2.06 | $ | 1.56 | $ | 1.07 | ||||||||||
| Diluted |
$ | 2.00 | $ | 2.18 | $ | 2.02 | $ | 1.52 | $ | 1.03 | ||||||||||
| Other Financial Data: |
||||||||||||||||||||
| Depreciation and amortization of fixed and intangible assets |
$ | 34,219 | $ | 28,026 | $ | 23,076 | $ | 20,300 | $ | 21,112 | ||||||||||
| Acquisition and integration related costs (2) |
$ | 10,242 | $ | 4,336 | $ | 1,281 | $ | — | $ | — | ||||||||||
| Operating Data: |
||||||||||||||||||||
| Number of stores at end of period |
717 | 659 | 579 | 528 | 484 | |||||||||||||||
| Total retail square feet at end of period |
2,568 | 2,390 | 2,130 | 1,969 | 1,823 | |||||||||||||||
| Average store square footage at end of period |
3,582 | 3,627 | 3,679 | 3,730 | 3,766 | |||||||||||||||
| Net sales per store (3) |
$ | 1,453 | $ | 1,471 | $ | 1,468 | $ | 1,451 | $ | 1,380 | ||||||||||
| Comparable store sales growth (4) |
2.8 | % | 3.5 | % | 8.2 | % | 7.4 | % | 7.1 | % | ||||||||||
| E-commerce sales growth (5) |
12.0 | % | 19.4 | % | 16.4 | % | 11.3 | % | 11.5 | % | ||||||||||
| Balance Sheet Data: |
||||||||||||||||||||
| Working capital |
$ | 125,382 | $ | 172,341 | $ | 153,453 | $ | 69,343 | $ | 75,959 | ||||||||||
| Total assets |
722,391 | 682,064 | 586,285 | 487,830 | 482,976 | |||||||||||||||
| Total debt, including capital lease obligations |
8,195 | 347 | 168 | 956 | 75,794 | |||||||||||||||
| Stockholders’ equity |
551,934 | 528,340 | 447,418 | 355,803 | 297,696 | |||||||||||||||
| (1) | For Fiscal 2011, loss on extinguishment of debt includes $0.6 million for the write-off of unamortized deferred financing fees related to the repurchase of the remaining portion of our floating rate notes in February 2011 and $0.1 million for the write-off of unamortized deferred financing fees related to the early termination of our term loan in October 2011. For Fiscal 2010, loss on extinguishment of debt includes the write-off of deferred financing fees and a portion of the unrecognized loss on our terminated interest rate swap of $0.9 million and $0.4 million, respectively, related to the repurchase of a portion of our floating rate notes. |
| (2) | In Fiscal 2014, these amounts relate to acquisition costs of $3.4 million and integration costs of $1.4 million ($0.6 million for Nutri-Force and $0.8 million for Super Supplements), charges to cost of goods sold for the inventory valuation step-up of $4.5 million and the contingent consideration adjustment for the Nutri-Force acquisition of $1.0 million. In Fiscal 2013 and 2012, these amounts represent costs incurred related to the acquisition and integration of Super Supplements. |
| (3) | Net sales per store are calculated by dividing retail net sales by the number of stores open at the end of the period. |
| (4) | A new retail store is included in comparable store sales after 410 days of operation, and acquired retail stores from the Super Supplements acquisition are included in comparable store sales after 365 days. For Fiscal 2011, comparable store sales growth is based on a 52-week period. |
| (5) | E-commerce sales growth is based on a 52-week period. Fiscal 2014 and Fiscal 2013 sales growth includes sales of the acquired Super Supplements e-commerce business. |
23
Table of Contents
| Item 7. | Management’s Discussion and Analysis of Financial Condition and Results of Operations |
The following Management’s Discussion and Analysis of Financial Condition and Results of Operations should be read in conjunction with the consolidated financial statements and notes thereto included as part of this Annual Report on Form 10-K. The discussion in this section contains forward-looking statements that are based upon current information and expectations. We sometimes identify forward-looking statements with such words as “may”, “expect”, “intend”, “anticipate”, “plan”, “believe”, “seek”, “should”, “estimate”, “outlook”, “trends”, “future benefits”, “strategies”, “goals” and similar words. The forward-looking statements contained herein, include, without limitation, statements concerning future revenue sources and concentration, gross profit margins, selling and marketing expenses, general and administrative expenses, capital resources, liquidity, capital expenditures, new stores, integration of acquisitions, retail inflation, additional financings or borrowings and are subject to risks and uncertainties including, but not limited to, those discussed below and elsewhere in this Annual Report on Form 10-K that could cause actual results to differ materially from the results contemplated by these forward-looking statements. We also urge you to carefully review the risk factors set forth in Item 1A. – “Risk Factors”. See also “Forward-Looking Statements” for additional information regarding forward-looking statements.
References to “Fiscal” or “Fiscal Year” mean the fifty-two weeks ended December 27, 2014, December 28, 2013 and December 29, 2012 for Fiscal Year 2014, Fiscal Year 2013 and Fiscal Year 2012, respectively.
Overview
We are a multi-channel specialty retailer and contract manufacturer of vitamins, minerals, herbs, specialty supplements, sports nutrition and other health and wellness products. We market over 900 nationally recognized brands as well as our own brands, which include Vitamin Shoppe®, BodyTech®, True Athlete®, Mytrition®, plnt™, ProBioCare™ , Next Step™, Nutri-Force® Sport and Betancourt Sports Nutrition. We believe we offer one of the largest varieties of products among VMS retailers with approximately 8,000 SKUs offered in our typical store and approximately 17,000 additional SKUs available through our e-commerce and other direct sales channels. Our broad product offering enables us to provide our customers with a selection of products that is not readily available at other specialty retailers or mass merchants, such as discount stores, supermarkets, drugstores and wholesale clubs. We believe our extensive product offering and emphasis on product education and customer service help us bond with our target customer and serve as a foundation for strong customer loyalty.
On June 6, 2014, the Company acquired all of the outstanding equity interests of Nutri-Force, a company which provides custom manufacturing and private labeling of vitamins, dietary supplements, nutraceuticals and nutritional supplements, as well as, develops and markets its own branded products. The total purchase price was $86.1 million in cash, which includes $5.0 million of contingent consideration. For additional information, refer to Note 3., “Acquisitions”, to our consolidated financial statements included in this Annual Report on Form 10-K. We anticipate incurring approximately $1.5 million of additional costs related to the integration of Nutri-Force in Fiscal 2015.
On February 14, 2013, the Company acquired substantially all of the assets and assumed certain liabilities of Super Supplements, a specialty retailer of vitamins, minerals, specialty supplements and sports nutrition, including 31 retail locations in Washington, Oregon and Idaho, a distribution center in Seattle, Washington and an e-commerce business. The total purchase price was $50.5 million in cash and the assumption of certain liabilities. For additional information, refer to Note 3., “Acquisitions”, to our consolidated financial statements included in this Annual Report on Form 10-K. We do not anticipate incurring significant additional costs related to the integration of Super Supplements, however, we continue to evaluate further integration initiatives.
During Fiscal 2014 we undertook several initiatives that we believe will position the Company for future success. These initiatives included the acquisition and integration of Nutri-Force, the development of order management systems to support omni-channel initiatives, increasing the utilization of our distribution center in Ashland, Virginia, the continued expansion of our retail chain by opening 61 stores, various enhancements to our website and mobile site and the addition of new product lines.
As we look to Fiscal 2015, we are focused on continuing to leverage these initiatives and are also looking to strengthen operational efficiencies. However, such efficiencies may not be achieved and they are partially dependent on working with outside software providers. In addition we are developing opportunities for expansion into international markets.
Trends and Other Factors Affecting Our Business
Our performance is affected by industry trends including, among others, demographic, health and lifestyle preferences, as well as other factors. For example, our industry is subject to potential regulatory actions and other legal matters that could affect the viability of a given product. Variable consumer trends, such as those described in the following paragraph, the overall impact on consumer spending, which may be affected heavily by current economic conditions, and limited innovation and product introductions in the VMS industry can dramatically affect purchasing patterns. Our business allows us to respond to changing industry trends by introducing new products and adjusting our product mix and sales incentives. During Fiscal 2014, retail price inflation has been at a rate below historical trends. In Fiscal 2015, we anticipate retail inflation to occur at a rate more consistent with past trends of approximately 1% to 2%. We will continue to diversify our product lines in an attempt to offer items less susceptible to the effects of economic conditions. Additionally, our performance is affected by competitive trends such as the entry of new competitors, changes in promotional strategies or expansion of product assortment by various competitors.
Our performance is also affected by trends in product mix and channel penetration. While our sports nutrition category continues to be among our fastest growing categories, product margins within the sports nutrition category are historically lower than other product
24
Table of Contents
categories. In addition, our e-commerce sales growth rate is expected to be higher than the sales growth rate for our retail stores. As our e-commerce business has historically operated at a lower gross margin than our retail stores, the increased penetration of the e-commerce channel may adversely affect our gross margins.
The acquisition of Nutri-Force has affected and is anticipated to continue to affect our performance as this manufacturing operation historically generates lower margins than our retail and direct operations. In addition, as a result of fair value accounting for the acquisition of Nutri-Force, a preliminary purchase accounting adjustment of $4.5 million was recorded for the step up of inventory to its market value. During Fiscal 2014, the $4.5 million of valuation step up related to inventory sold during Fiscal 2014 was charged to cost of goods sold which negatively impacted our results. Also included in our SG&A results for Fiscal 2014 is $1.0 million of contingent consideration related to the acquisition. We have begun the process to transition part of the VSI private label assortment to Nutri-Force and will continue to increase the number of items manufactured by Nutri-Force. We expect to achieve improved gross margins on these items over time.
Sales of weight management products are generally more sensitive to consumer trends, such as increased demand for products recommended by media personalities, resulting in higher volatility than our other products. Our sales of weight management products have been significantly influenced by the rapid increase and subsequent decline of products such as those containing ephedra, DMAA (1.3 dimethylpentylamine/dimethylamylamine/13-dimethylamylamine), low carb products, and certain thermogenic products. Accordingly, we launch new weight management products on an ongoing basis in response to prevailing market conditions and consumer demands. Fiscal 2014 weight management sales growth was relatively flat, whereas Fiscal 2013 experienced significantly higher weight management sales growth. This change in trend negatively impacted the overall sales growth rate for Fiscal 2014. We expect continued volatility in the demand for weight management products.
In addition to the weight management product lines, we intend to continue our focus in meeting the demands of an increasingly aging population, the effects of increasing costs of traditional healthcare and a rapidly growing health conscious public.
We believe that the aging of the U.S. population provides us with an area of opportunity. The U.S. Census Bureau reports that the number of individuals in the 45 and over age group is expected to increase to 147 million people in 2020 from 125 million people in 2013, representing approximately 1.4 times the overall population growth rate. Moreover, it is estimated that by 2030 the 65 or older group will comprise 21% of the population. We tend to see that as people age they take on a more active role in maintaining or improving their health. As the portion of the population over age 45 increases, we believe that we will have an increasing opportunity to drive sales.
We believe that as the costs of healthcare continue to increase, lower-cost alternatives to prescription drugs and preventative supplementation will continue to be an option for the American consumer. According to the Center for Medicare and Medicaid Services, medical spending as a percentage of GDP was 17.2% in 2012, and is projected to reach 19.3% of GDP by 2023. As an increasing number of the population seeks to avoid costly medical issues and focuses on prevention through diet, supplementation and exercise, we expect the demand in this market segment to provide us with continued opportunities.
Our historical results have also been significantly influenced by our new store openings. Since the beginning of 2012, we have opened 167 stores, acquired 31 stores and as of December 27, 2014 operate 717 stores located in 45 states, the District of Columbia, Puerto Rico and Ontario, Canada.
Based on our historical experience, new stores typically require approximately four to five years to mature, generating lower store level sales in the initial years than our mature stores. As a result, new stores generally have a negative impact on our overall operating margin. In addition, we have reduced the average store size since Fiscal 2011, as we have improved our inventory replenishment systems. Our new stores since the beginning of Fiscal 2013 are approximately 3,000 square feet compared to our mature stores which are approximately 3,600 square feet. Additionally, stores opened in new markets have lower brand awareness compared to stores in existing markets, and as a result initially experience a lower sales volume than stores opened in existing markets. As a result of these trends, our recently opened stores have produced lower sales volume than historical sales trends. As these stores mature, we expect them to contribute meaningfully to our operating results.
With the opening of our Ashland, Virginia distribution center in Fiscal 2013, the Company increased volume and productivity of this facility through Fiscal 2014 and as a result experienced higher supply chain costs as a percentage of sales during Fiscal 2014. The Company expects supply chain costs as a percentage of sales to decline in Fiscal 2015.
Critical Accounting Policies
The preparation of financial statements in conformity with accounting principles generally accepted in the United States of America requires management to make estimates and assumptions that affect the reported amounts of assets and liabilities and disclosure of contingent assets and liabilities at the date of the financial statements, and the reported amounts of revenue and expenses during the reporting period. Critical accounting policies are those that are the most important portrayal of our financial condition and results of operations, and require our most difficult, subjective and complex judgments as a result of the need to make estimates about the effect of matters that are inherently uncertain. While our significant accounting policies are described in more detail in the notes to our consolidated financial statements, our most critical accounting policies, discussed below, pertain to revenue recognition, inventories, vendor allowances, impairment of long-lived assets, goodwill and other intangible assets, deferred sales for our Healthy Awards Program, and income taxes. In applying such policies, we must
25
Table of Contents
use some amounts that are based upon our informed judgments and best estimates. Estimates, by their nature, are based on judgments and available information. The estimates that we make are based upon historical factors, current circumstances and the experience and judgment of management. We evaluate our assumptions and estimates on an ongoing basis.
Revenue Recognition. We recognize revenue upon sale of our products when merchandise is sold “at point of sale” in retail stores or upon delivery to a direct customer. Wholesale revenue is recognized when title is transferred to the customer. All revenue is recognized net of sales returns. In addition, we classify amounts billed to customers that represent shipping fees as sales. To arrive at net sales, gross sales are reduced by deferred sales, customer discounts, actual customer returns, and a provision for estimated future customer returns, which is based on management’s review of historical and current customer returns. Sales taxes collected from customers are presented on a net basis and as such are excluded from revenue.
Inventories. Inventories are stated at the lower of cost or market value. Cost is determined using the weighted average method. As applied to inventories, cost means in principle the sum of the applicable expenditures and charges directly or indirectly incurred in bringing the product to its existing condition and location. Finished goods inventory includes costs on freight on internally transferred merchandise, and costs associated with our buying department, distribution facilities, and manufacturing overhead, which are capitalized into inventory and then expensed as merchandise is sold. In addition, the cost of inventory is reduced by purchase discounts and other allowances received from certain of our vendors. We adjust our inventory to reflect situations in which the cost of inventory is not expected to be recovered. We regularly review our inventory, including when a product is close to expiration and not expected to be sold, when a product has reached its expiration date, or when a product is not expected to be saleable. In determining the reserves for these products we consider factors such as the amount of inventory on hand and its remaining shelf life, and current and expected market conditions, including management forecasts and levels of competition. In addition, we have established a reserve for estimated inventory shrinkage between physical inventories. Physical inventories and cycle counts are taken on a regular basis, and inventory is adjusted accordingly. For each reporting period, we estimate inventory shrinkage based on a historical trend analysis. We have evaluated the current level of inventory considering historical trends and other factors, and based on our evaluation, have recorded adjustments to reflect inventory at net realizable value. These adjustments are estimates, which could vary significantly from actual results if future economic conditions, customer demand or competition differ from expectations. These estimates require us to make assessments about the future demand for our products in order to identify such inventory items as slow moving, expiring, obsolete or in excess of need. These future estimates are subject to the ongoing accuracy of management’s forecasts of market conditions, industry trends and competition. We are also subject to volatile changes in specific product demand as a result of unfavorable publicity, government regulation and rapid changes in demand for new and improved products or services. Obsolescence reserves were $3.1 million and $2.6 million at December 27, 2014 and December 28, 2013, respectively.
Vendor Allowances. Vendor allowances include discounts, allowances and rebates received from vendors and are based on various contract terms. Vendor allowances are recognized as either purchase discounts which represent a reduction of product cost, funding which is capitalized into inventory and recognized in the statement of income as the merchandise is sold, or direct offset which represents funding subject to immediate recognition in the statement of income, depending on the nature of the allowance.
Long-Lived Assets. We evaluate long-lived assets, including fixed assets and intangible assets with finite useful lives, periodically for impairment whenever events or changes in circumstances indicate that the carrying amount of any such asset may not be recoverable. If the sum of our estimated undiscounted future cash flows is less than the asset’s carrying value, we recognize an impairment loss, measured as the amount by which the carrying value exceeds the fair value of the asset. These estimates of cash flow require significant management judgment and certain assumptions about future sales and expense growth rates, devaluation and inflation. As such, these estimates may differ from actual cash flows. The Company recognized impairment charges of $0.4 million during Fiscal 2014 on fixed assets related to three of its underperforming retail locations still in use in the Company’s operations and $0.7 million during Fiscal 2012 on fixed assets related to three of its underperforming retail locations still in use in the Company’s operations. Impairment charges are included in selling, general and administrative expenses in the consolidated statements of income.
Goodwill and Other Intangible Assets. On an annual basis, or whenever impairment indicators exist, we perform an evaluation of goodwill and indefinite-lived intangible assets. In the absence of any impairment indicators, goodwill and other indefinite-lived intangible assets are tested in the fourth quarter of each fiscal year. With regards to goodwill, our evaluations are based on our three reporting units. The evaluations of goodwill and indefinite-lived intangible assets may first consider qualitative factors to determine whether the existence of events or circumstances leads to a determination that it is more likely than not that the fair value of a reporting unit or indefinite-lived intangible asset is less than its carrying value. A quantitative evaluation is performed if the qualitative evaluation results in a more likely than not determination or if a qualitative evaluation is not performed. Our quantitative evaluation for goodwill utilizes the discounted cash flow method, based on operating projections, as well as the market multiples method. For indefinite-lived tradenames, we utilize the royalty relief method in our quantitative evaluations. For those intangible assets which have definite lives, we amortize their cost on a straight-line basis over their estimated useful lives, the periods of which vary based on their particular contractual terms.
Our annual impairment review requires extensive use of accounting judgment and financial estimates. Judgments regarding the existence of impairment indicators are based on market conditions and operational performance of the business. Future events could cause us to conclude that impairment indicators exist, and therefore that goodwill and other intangible assets may be impaired. The valuation of goodwill and indefinite-lived intangible assets is affected by, among other things, our business plan for the future and estimated results of future operations. Changes in the business plan, operating results, or application of alternative assumptions that are different than the estimates used to develop the valuation of the assets may materially impact their valuation.
26
Table of Contents
In Fiscal 2014, the Company performed a qualitative analysis of its retail and direct reporting units and determined that it was more likely than not that the fair values of each of these reporting units and indefinite-lived tradenames were greater than their respective carrying values. The Company performed a quantitative analysis of its manufacturing reporting unit and determined that the fair value of this reporting unit was greater than its carrying value. As a result, the Company believes the fair values of each of the Company’s reporting units and indefinite-lived tradenames substantially exceeds their respective carrying values.
Deferred Sales. Deferred sales primarily consists of the liability pertaining to our Healthy Awards Program. The Healthy Awards Program allows customers to earn points toward free merchandise based on the volume of purchases. Points are earned each year under the Healthy Awards Program and are redeemable within the first three months of the following year or they expire. We defer sales as points are earned, based on historical redemption data as well as marketing data within the current period, and record a liability for points earned based on the value of points that are expected to be redeemed. Net increases to deferred sales were $0.8 million, $0.8 million and $2.1 million for the years ended December 27, 2014, December 28, 2013 and December 29, 2012, respectively. The balances for the deferred sales liability were $22.5 million and $21.7 million at December 27, 2014 and December 28, 2013, respectively. A hypothetical 1% increase in the redemption rate would result in an increase of $0.3 million in the deferred sales liability.
Income Taxes. Deferred income taxes reflect the tax effects of temporary differences between the carrying amounts of assets and liabilities for financial reporting purposes and the amounts used for income tax purposes. We record valuation allowances to reduce deferred tax assets to the amount that is more likely than not to be realized. When assessing the need for valuation allowances, we consider future taxable income and ongoing prudent and feasible tax planning strategies. Should a change in circumstances lead to a change in judgment about the realization of deferred tax assets in future years, we would adjust related valuation allowances in the period that the change in circumstances occurs, along with a corresponding increase or charge to income.
We account for our tax positions based on the provisions of the accounting literature related to accounting for uncertainty in income tax positions. That literature provides guidance for the recognition threshold and measurement attribute for financial statement recognition and measurement of a tax position taken or expected to be taken in a tax return. For tax positions that are not more likely than not sustainable upon audit, we recognize the largest amount of the benefit that is more likely than not to be sustained. We make estimates of the potential liability based on our assessment of all potential tax exposures. In addition, we use factors such as applicable tax laws and regulations, current information and past experience with similar issues to make these adjustments. The tax positions are analyzed regularly and adjustments are made as events occur that warrant adjustments for those positions. We record interest expense and penalties payable to relevant tax authorities as income tax expense. See Note 9., “Income Taxes”, to our consolidated financial statements for more information.
General Definitions for Operating Results
Net Sales consist of sales, net of sales returns, deferred sales, customer incentives and a provision for estimated future returns, from comparable and non comparable sales. Total comparable net sales include sales generated by retail stores after 410 days of operation, e-commerce sales, and sales generated by acquired retail stores from the Super Supplements acquisition after 365 days. Sales to third parties of manufactured products generated by Nutri-Force are considered non-comparable sales.
Cost of goods sold includes the cost of inventory sold, costs of warehousing, distribution, manufacturing and store occupancy costs and excludes depreciation and amortization related to the retail and direct segments that is included within selling, general and administrative expenses. Warehousing, distribution and manufacturing costs, which are capitalized into inventory and then expensed as merchandise is sold, include freight to transfer merchandise, costs associated with our buying department, distribution facilities and manufacturing overhead. Store occupancy costs include rent, common area maintenance, real estate taxes and utilities.
Gross profit is net sales minus cost of goods sold.
Selling, general and administrative expenses consist of depreciation and amortization of fixed and intangible assets, operating payroll and related benefits, advertising and promotion expense, and other selling, general and administrative expenses.
Income from operations consists of gross profit minus selling, general and administrative expenses.
Interest expense, net includes interest on our revolving credit facility, along with letters of credit fees, interest on our capital leases, as well as amortization of financing costs, offset with interest income earned from highly liquid investments (investments purchased with an original maturity of three months or less).
27
Table of Contents
Key Performance Indicators and Statistics
We use a number of key indicators of financial condition and operating results to evaluate the performance of our business, including the following (in thousands):
| Fiscal Year Ended | ||||||||||||
| December 27, 2014 |
December 28, 2013 |
December 29, 2012 |
||||||||||
| Net sales |
$ | 1,213,046 | $ | 1,087,469 | $ | 950,902 | ||||||
| Increase in total comparable net sales (1) |
3.7 | % | 4.6 | % | 9.0 | % | ||||||
| Increase in comparable store net sales |
2.8 | % | 3.5 | % | 8.2 | % | ||||||
| Gross profit as a percent of net sales |
33.3 | % | 34.7 | % | 35.0 | % | ||||||
| Income from operations |
$ | 102,656 | $ | 110,292 | $ | 99,372 | ||||||
| (1) | Total comparable net sales are comprised of comparable retail store sales and e-commerce sales. |
The following table shows the growth in our network of stores for Fiscal 2014, 2013 and 2012:
| Fiscal Year | ||||||||||||
| 2014 | 2013 | 2012 | ||||||||||
| Stores open at beginning of year |
659 | 579 | 528 | |||||||||
| Stores opened |
61 | 52 | 54 | |||||||||
| Stores acquired |
— | 31 | — | |||||||||
| Stores closed |
(3 | ) | (3 | ) | (3 | ) | ||||||
|
|
|
|
|
|
|
|||||||
| Stores open at end of year |
717 | 659 | 579 | |||||||||
|
|
|
|
|
|
|
|||||||
Results of Operations
The information presented below is for the Fiscal years ended December 27, 2014, December 28, 2013, and December 29, 2012 and was derived from our audited consolidated financial statements, which, in the opinion of management, includes all adjustments necessary for a fair presentation of our financial position and operating results for such periods and as of such dates. The following table summarizes our results of operations for the Fiscal years ended December 27, 2014, December 28, 2013, and December 29, 2012 as a percentage of net sales:
| Fiscal Year Ended | ||||||||||||
| December 27, 2014 |
December 28, 2013 |
December 29, 2012 |
||||||||||
| Net sales |
100.0 | % | 100.0 | % | 100.0 | % | ||||||
| Cost of goods sold |
66.7 | % | 65.3 | % | 65.0 | % | ||||||
|
|
|
|
|
|
|
|||||||
| Gross profit |
33.3 | % | 34.7 | % | 35.0 | % | ||||||
| Selling, general and administrative expenses |
24.9 | % | 24.6 | % | 24.6 | % | ||||||
|
|
|
|
|
|
|
|||||||
| Income from operations |
8.5 | % | 10.1 | % | 10.5 | % | ||||||
| Interest expense, net |
0.0 | % | 0.0 | % | 0.1 | % | ||||||
|
|
|
|
|
|
|
|||||||
| Income before provision for income taxes |
8.4 | % | 10.1 | % | 10.4 | % | ||||||
| Provision for income taxes |
3.4 | % | 4.0 | % | 4.0 | % | ||||||
|
|
|
|
|
|
|
|||||||
| Net income |
5.0 | % | 6.1 | % | 6.4 | % | ||||||
|
|
|
|
|
|
|
|||||||
Figures may not sum due to rounding.
The results of operations presented for the Fiscal years ended December 27, 2014, December 28, 2013 and December 29, 2012 are each based on a 52-week period (“Fiscal 2014”, “Fiscal 2013” and “Fiscal 2012”).
Comparison of Fiscal 2014 with Fiscal 2013
2014 Financial Highlights
| • | Net sales increased 11.5% |
| • | Total comparable net sales increased 3.7% |
| • | Comparable store net sales increased 2.8% |
28
Table of Contents
| • | E-commerce sales increased 12.0% |
| • | Opened 61 stores, including one store in Canada |
| • | Acquired the manufacturing operations of Nutri-Force |
| • | Initiated share repurchase program |
| • | Fully diluted earnings per share of $2.00, which includes $0.20 per share for acquisition and integration related costs |
Outlook for 2015
| • | Net sales increase of approximately 10% |
| • | Total comparable net sales increase of 2% to 4% |
| • | To open approximately 60 new stores |
| • | Diluted earnings per share of $2.36 to $2.46 |
Net Sales
Net sales increased $125.6 million, or 11.5%, to $1,213.0 million for Fiscal 2014 compared to $1,087.5 million for Fiscal 2013. The increase was the result of an increase in our total comparable net sales of $39.7 million, or 3.7%, as well as an increase in our non-comparable sales of $85.9 million, which includes $40.3 million from Nutri-Force. Sales increased primarily in the Sports Nutrition category which increased $35.2 million and in the Other category which increased $32.5 million (excluding Nutri-Force) primarily due to new product introductions.
Retail
Net sales from our retail stores increased $72.4 million, or 7.5%, to $1,042.1 million for Fiscal 2014 compared to $969.6 million for Fiscal 2013. We operated 717 stores as of December 27, 2014 compared to 659 stores as of December 28, 2013. Store sales increased due to an increase in comparable retail store sales of $26.8 million, or 2.8%, and an increase in non-comparable store sales of $45.6 million. The increase in comparable store sales was primarily driven by customer traffic.
Direct
Net sales to our direct customers increased $12.8 million, or 10.8%, to $130.6 million for Fiscal 2014 compared to $117.9 million for Fiscal 2013. The increase in our direct sales was due to an increase in our e-commerce sales of 12.0% which was offset in part by a decrease in our catalog sales. The increase in e-commerce sales was largely due to retention marketing programs.
Manufacturing
Net sales to third party manufacturing customers were $40.3 million for Fiscal 2014, representing net sales since the date of the acquisition of Nutri-Force.
Cost of Goods Sold
Cost of goods sold, which includes product, warehouse, distribution, manufacturing and occupancy costs, increased $99.0 million, or 13.9%, to $808.8 million for Fiscal 2014 compared to $709.8 million for Fiscal 2013. The dollar increase was primarily due to an increase in sales, as well as $35.0 million from the addition of Nutri-Force. Cost of goods sold as a percentage of net sales increased to 66.7% for the year ended December 27, 2014, compared to 65.3% for the year ended December 28, 2013. The increase of cost of goods sold as a percentage of net sales was primarily due to 0.7% resulting from the acquired manufacturing operations of Nutri-Force and 0.5% due to higher supply chain costs.
Gross Profit
As a result of the foregoing, gross profit increased $26.6 million, or 7.0%, to $404.3 million for Fiscal 2014 compared to $377.6 million for Fiscal 2013. Gross profit as a percentage of sales decreased to 33.3% for Fiscal 2014 compared to 34.7% for Fiscal 2013.
Selling, General and Administrative Expenses
Selling, general and administrative expenses increased $34.3 million, or 12.8%, to $301.6 million during Fiscal 2014, compared to $267.4 million during Fiscal 2013. The components of selling, general and administrative expenses are explained below. Selling, general and administrative expenses as a percentage of net sales increased to 24.9% for Fiscal 2014 compared to 24.6% for Fiscal 2013.
Operating payroll and related benefits increased $11.8 million, or 10.9%, to $119.5 million for Fiscal 2014 compared to $107.7 million for Fiscal 2013. The dollar increase in operating payroll and related benefits was primarily due to the increase in head count added to operate new stores and an increase in the average wage rates. Operating payroll and related benefits expenses as a percentage of net sales was 9.9% for both Fiscal 2014 and Fiscal 2013.
29
Table of Contents
Advertising and promotion expenses increased $2.8 million, or 16.7%, to $19.3 million for Fiscal 2014 compared to $16.5 million for Fiscal 2013. The dollar increase in advertising and promotional expenses was primarily due to an increase in digital advertising. Advertising and promotion expenses as a percentage of net sales increased to 1.6% for Fiscal 2014 compared to 1.5% for Fiscal 2013.
Other selling, general and administrative expenses, which include depreciation and amortization expense, increased $19.7 million, or 13.8%, to $162.8 million in Fiscal 2014 compared to $143.1 million for Fiscal 2013. The dollar increase in other selling, general and administrative expenses was primarily due to an increase in depreciation and amortization expense of $5.9 million, costs related to the addition of Nutri-Force of $5.8 million, acquisition and integration expenses of $4.8 million and additional contingent consideration for the acquisition of Nutri-Force of $1.0 million. Fiscal 2013 included proceeds from insurance recoveries of $1.1 million and costs related to the acquisition and integration of Super Supplements of $4.3 million. Other selling, general and administrative expenses as a percentage of net sales increased to 13.4% for Fiscal 2014 compared to 13.2% for Fiscal 2013.
Income from Operations
As a result of the foregoing, income from operations decreased $7.6 million, or 6.9%, to $102.7 million for Fiscal 2014 compared to $110.3 million for Fiscal 2013. Income from operations as a percentage of net sales decreased to 8.5% during Fiscal 2014 as compared to 10.1% during Fiscal 2013.
Retail
Income from operations for the retail segment increased $2.4 million, or 1.3%, to $194.9 million for Fiscal 2014 compared to $192.4 million for Fiscal 2013. Income from operations as a percentage of net sales for the retail segment decreased to 18.7% for Fiscal 2014 compared to 19.8% for Fiscal 2013. The decrease was primarily due to supply chain costs of 0.6% and payroll related benefits costs of 0.3% as a percentage of net sales.
Direct
Income from operations for the direct segment increased $0.8 million, or 3.8%, to $22.8 million for Fiscal 2014 compared to $21.9 million for Fiscal 2013. Income from operations as a percentage of net sales for the direct segment decreased to 17.4% for Fiscal 2014 compared to 18.6% for Fiscal 2013. This decrease was primarily due to advertising and promotion expenses of 0.6% and general operating expenses of 0.5% as a percentage of net sales.
Manufacturing
Loss from operations for the manufacturing segment was $1.8 million for Fiscal 2014, and includes depreciation and amortization expense of $0.9 million. Excluding $4.5 million in charges related to the inventory valuation step up for inventory sold subsequent to the acquisition of Nutri-Force, income from operations for the manufacturing segment was $2.7 million, or 6.6% of net sales for the manufacturing segment.
Corporate Costs
Corporate costs increased $9.1 million, or 8.7%, to $113.1 million during Fiscal 2014 compared to $104.1 million for Fiscal 2013. Corporate costs as a percentage of net sales decreased to 9.3% for Fiscal 2014 compared to 9.6% for Fiscal 2013. The dollar increase in corporate costs was primarily due to an increase in depreciation and amortization expense of $4.9 million, acquisition and integration costs of $4.8 million and additional contingent consideration for the acquisition of Nutri-Force of $1.0 million. Fiscal 2013 included proceeds from insurance recoveries of $1.1 million and costs related to the acquisition and integration of Super Supplements of $4.3 million.
Provision for Income Taxes
We recognized $40.9 million of income tax expense during Fiscal 2014 compared to $43.3 million in Fiscal 2013. The effective tax rate for Fiscal 2014 was 40.1%, compared to 39.4% for Fiscal 2013. The effective tax rate increased primarily due to an increase in permanent non-deductible items during Fiscal 2014 as compared to Fiscal 2013 and a benefit in Fiscal 2013 from the reversal of charges previously recorded relating to uncertain tax positions due to the expiration of the applicable statutes of limitations that did not recur in Fiscal 2014.
Net Income
As a result of the foregoing, we generated net income of $61.2 million in Fiscal 2014 compared to net income of $66.5 million in Fiscal 2013.
Comparison of Fiscal 2013 with Fiscal 2012
Net Sales
Net sales increased $136.6 million, or 14.4%, to $1,087.5 million for Fiscal 2013 compared to $950.9 million for Fiscal 2012. The increase was primarily the result of an increase in our comparable store sales, non-comparable store sales (including acquired stores), as well as an increase in our direct sales. Excluding the impact of sales from Super Supplements of $66.1 million, sales increased primarily in the sports nutrition category, which increased $41.2 million. The sports nutrition category continues to be among our fastest growing categories.
30
Table of Contents
Retail
Net sales from our retail stores increased $119.8 million, or 14.1%, to $969.6 million for Fiscal 2013 compared to $849.8 million for Fiscal 2012. We operated 659 stores as of December 28, 2013 compared to 579 stores as of December 29, 2012. Store sales increased due to an increase in comparable store sales of $29.0 million, or 3.5% and an increase in non-comparable store sales of $90.8 million, which includes $61.4 million from Super Supplements stores. The increase in comparable store sales was primarily driven by increased traffic. Mature stores, which generally have been open for at least five years, had slightly positive comparable store sales for Fiscal 2013.
Direct
Net sales to our direct customers increased $16.7 million, or 16.5%, to $117.9 million for Fiscal 2013 compared to $101.1 million for Fiscal 2012. The increase in our direct sales was due to an increase in our e-commerce sales of 19.4% which was offset in part by a decrease in our catalog sales. The increase in e-commerce sales was largely due to continued efficiency in customer acquisition and retention marketing programs. The addition of supersup.com resulted in 5.0% of growth in e-commerce sales. We continue to reduce our catalog circulation and customer prospecting as we believe catalog purchasing in general is declining in popularity as a purchasing medium, especially in light of the growth in online shopping.
Cost of Goods Sold
Cost of goods sold, which includes product, warehouse and distribution and occupancy costs, increased $91.9 million, or 14.9%, to $709.8 million for Fiscal 2013 compared to $617.9 million for Fiscal 2012. The dollar increase was primarily due to an increase in sales, as well as an increase resulting from the addition of Super Supplements for the year ended December 28, 2013, as compared to the year ended December 29, 2012. Cost of goods sold as a percentage of net sales increased to 65.3% for the year ended December 28, 2013, compared to 65.0% for the year ended December 29, 2012. The increase of cost of goods sold as a percentage of net sales was primarily due to changes in product mix and channel penetration as well as supply chain costs related to the new distribution center.
Gross Profit
As a result of the foregoing, gross profit increased $44.7 million, or 13.4%, to $377.6 million for Fiscal 2013 compared to $333.0 million for Fiscal 2012. Gross profit as a percentage of sales decreased to 34.7% for Fiscal 2013 compared to 35.0% for Fiscal 2012.
Selling, General and Administrative Expenses
Selling, general and administrative expenses increased $33.7 million, or 14.4%, to $267.4 million during Fiscal 2013, compared to $233.6 million during Fiscal 2012. The components of selling, general and administrative expenses are explained below. Selling, general and administrative expenses as a percentage of net sales remained constant at 24.6% for Fiscal 2013 and Fiscal 2012.
Operating payroll and related benefits increased $15.9 million, or 17.4%, to $107.7 million for Fiscal 2013 compared to $91.8 million for Fiscal 2012. The dollar increase in operating payroll and related benefits was primarily due to the increase in head count added to operate new stores and acquired Super Supplements stores. Operating payroll and related benefits expenses as a percentage of net sales increased to 9.9% for Fiscal 2013 compared to 9.7% for Fiscal 2012. The increase in operating payroll and related benefits as a percentage of net sales is primarily the result of an increase to payroll related benefits costs and the inclusion of Super Supplements operating payroll and related benefits, as Super Supplements stores operate at a rate higher than Vitamin Shoppe stores.
Advertising and promotion expenses increased $1.8 million, or 12.5%, to $16.5 million for Fiscal 2013 compared to $14.7 million for Fiscal 2012. Advertising and promotion expenses as a percentage of net sales remained constant at 1.5% for Fiscal 2013 and Fiscal 2012.
Other selling, general and administrative expenses, which include depreciation and amortization expense, increased $16.0 million, or 12.6%, to $143.1 million in Fiscal 2013 compared to $127.1 million for Fiscal 2012. The dollar increase in other selling, general and administrative expenses was primarily due to an increase in depreciation and amortization expense of $5.0 million, the corporate costs of Super Supplements of $4.6 million and costs related to the acquisition and integration of Super Supplements of $4.3 million partially offset by proceeds from insurance recoveries of $1.1 million in Fiscal 2013 as compared to Fiscal 2012. Other selling, general and administrative expenses as a percentage of net sales decreased to 13.2% for Fiscal 2013 compared to 13.4% for Fiscal 2012.
Income from Operations
As a result of the foregoing, income from operations increased $10.9 million, or 11.0%, to $110.3 million for Fiscal 2013 compared to $99.4 million for Fiscal 2012. Income from operations as a percentage of net sales decreased to 10.1% during Fiscal 2013 as compared to 10.5% during Fiscal 2012.
Retail
Income from operations for the retail segment increased $19.1 million, or 11.0%, to $192.4 million for Fiscal 2013 compared to $173.3 million for Fiscal 2012. Income from operations as a percentage of net sales for the retail segment decreased to 19.8% for Fiscal 2013 compared to 20.4% for Fiscal 2012. The decrease as a percentage of net sales was primarily due to an increase to payroll related benefits costs and the inclusion of Super Supplements, which operates at a lower margin as a percentage of net sales.
31
Table of Contents
Direct
Income from operations for the direct segment increased $2.3 million, or 12.0%, to $21.9 million for Fiscal 2013 compared to $19.6 million for Fiscal 2012. Income from operations as a percentage of net sales for the direct segment decreased to 18.6% for Fiscal 2013 compared to 19.4% for Fiscal 2012. The decrease was primarily due to the inclusion of the Super Supplements e-commerce business, which operates at a lower margin than our other e-commerce sites and the impact of increased promotional investments.
Corporate Costs
Corporate costs increased $10.6 million, or 11.3%, to $104.1 million during Fiscal 2013 compared to $93.5 million for Fiscal 2012. Corporate costs as a percentage of net sales decreased to 9.6% for Fiscal 2013 compared to 9.8% for Fiscal 2012. The dollar increase in corporate costs was primarily due to an increase in depreciation and amortization expense of $5.0 million, the corporate costs of Super Supplements of $4.6 million and costs related to the acquisition and integration of Super Supplements of $4.3 million partially offset by proceeds from insurance recoveries of $1.1 million in Fiscal 2013 as compared to Fiscal 2012.
Provision for Income Taxes
We recognized $43.3 million of income tax expense during Fiscal 2013 compared to $37.9 million in Fiscal 2012. The effective tax rate for Fiscal 2013 was 39.4%, compared to 38.4% for Fiscal 2012. The effective tax rates for both Fiscal 2013 and Fiscal 2012 reflect benefits primarily due to the reversal of charges previously recorded relating to uncertain tax positions due to the expiration of the applicable statutes of limitations. Additionally, for Fiscal 2013 a benefit was recognized due to the reversal of previously recorded charges relating to uncertain tax positions for accrued bonus and deferred compensation due to a change in accounting method. The benefit to the provision for income taxes for Fiscal 2013 was $0.5 million. The benefit to the provision for income taxes for Fiscal 2012 of $2.0 million was partially offset by a charge in connection with an audit of prior year tax returns of approximately $0.6 million. The increase in the effective tax rate reflects the decrease in the benefit for Fiscal 2013 as compared to Fiscal 2012.
Net Income
As a result of the foregoing, we generated net income of $66.5 million in Fiscal 2013 compared to net income of $60.8 million in Fiscal 2012.
Key Indicators of Liquidity and Capital Resources
The following table provides key indicators of our liquidity and capital resources (in thousands):
| December 27, 2014 |
December 28, 2013 |
|||||||
| Balance Sheet Data: |
||||||||
| Cash and cash equivalents |
$ | 12,166 | $ | 74,036 | ||||
| Working capital |
125,382 | 172,341 | ||||||
| Total assets |
722,391 | 682,064 | ||||||
| Total debt, including capital lease obligations |
8,195 | 347 | ||||||
| Fiscal Year Ended | ||||||||||||
| December 27, 2014 |
December 28, 2013 |
December 29, 2012 |
||||||||||
| Other Information: |
||||||||||||
| Depreciation and amortization (1) |
$ | 34,219 | $ | 28,026 | $ | 23,076 | ||||||
| Cash Flows Provided By (Used In): |
||||||||||||
| Operating activities |
$ | 100,147 | $ | 81,122 | $ | 78,350 | ||||||
| Investing activities |
(125,184 | ) | (93,650 | ) | (31,174 | ) | ||||||
| Financing activities |
(36,877 | ) | 5,463 | 23,237 | ||||||||
| Effect of exchange rate changes on cash and cash equivalents |
44 | (67 | ) | 1 | ||||||||
|
|
|
|
|
|
|
|||||||
| Net (decrease) increase in cash and cash equivalents |
$ | (61,870 | ) | $ | (7,132 | ) | $ | 70,414 | ||||
|
|
|
|
|
|
|
|||||||
| (1) | Excludes amortization of deferred financing fees. |
32
Table of Contents
Liquidity and Capital Resources
Our primary uses of cash have been to complete acquisitions, repurchase shares of our common stock, fund working capital, operating expenses and capital expenditures related primarily to the build-out of new stores, the remodeling of existing stores and information technology investments. Historically, we have financed our requirements predominately through internally generated cash flow, supplemented with short-term financing. We believe that the cash generated by operations and cash and cash equivalents, together with the borrowing availability under our revolving credit facility, will be sufficient to meet our working capital needs for the next twelve months, our store growth plans, systems development and store improvements, as well as the repurchase of shares of our common stock from time to time.
In addition to the $81.5 million for the acquisition of Nutri-Force during Fiscal 2014, and $5.0 million of the contingent consideration related to this acquisition that we expect to pay during Fiscal 2015, we purchased $57.8 million of common stock under our $100.0 million share repurchase program during Fiscal 2014. Refer to Note 11., “Share Repurchase Program”, to our consolidated financial statements included in this Annual Report on Form 10-K for additional information. We invested $43.0 million in capital expenditures during Fiscal 2014, most of which pertains to new stores, the remodeling of existing stores and information technology investments. During Fiscal 2015 we plan to spend approximately $40 million to $45 million in capital expenditures, including costs for building new stores, remodeling existing stores and information technology. We opened 61 new stores and closed 3 stores during Fiscal 2014. We plan to open approximately 60 new stores in Fiscal 2015. Our working capital requirements for merchandise inventory will continue to increase as we continue to open additional stores. Currently, our practice is to establish an inventory level of approximately $155,000 at cost for each of our stores, the cost of which is partially offset by vendor incentive and allowance programs. Additionally, 30 day payment terms have been extended to us by some of our suppliers allowing us to effectively manage our inventory and working capital.
The Company is subject to concentrations of credit risk associated with cash and cash equivalents, and at times holds cash balances in excess of Federal Deposit Insurance Corporation limits. Currently, the Company’s cash management practice is to hold cash balances in quality institutions and invest in highly liquid and secure investments.
We were in compliance with all debt covenants relating to our Revolving Credit Facility as of December 27, 2014. We expect to be in compliance with these same debt covenants during Fiscal 2015 as well.
Cash Provided by Operating Activities
Net cash provided by operating activities was $100.1 million and $81.1 million during Fiscal 2014 and Fiscal 2013, respectively. The $19.0 million increase in net cash flows from operating activities is primarily due to reductions in prepaid taxes and inventory purchases.
Net cash provided by operating activities was $81.1 million and $78.4 million during Fiscal 2013 and Fiscal 2012, respectively. The $2.8 million increase in net cash flows from operating activities is primarily due to the increase in our net income and the increase in accounts payable related to the growth of the Company, partially offset by an increase in prepaid income taxes in Fiscal 2013 as compared to Fiscal 2012.
Cash Used in Investing Activities
Net cash used in investing activities was $125.2 million during Fiscal 2014 as compared to $93.7 million during Fiscal 2013. The $31.5 million increase in cash used in investing activities is primarily due to the $81.5 million for the acquisition of Nutri-Force in Fiscal 2014 partially offset by the $50.5 million for the acquisition of Super Supplements. Capital expenditures during Fiscal 2014 and Fiscal 2013 were used primarily for the build-out of new stores, improvements to existing stores and computer equipment related to those stores. The Company opened 61 new stores in Fiscal 2014 as compared to 52 new stores in Fiscal 2013.
Net cash used in investing activities was $93.7 million during Fiscal 2013 as compared to $31.2 million during Fiscal 2012. The $62.5 million increase in cash used in investing activities is primarily due to the acquisition of Super Supplements for $50.5 million. Capital expenditures during Fiscal 2013 and Fiscal 2012 were used primarily for the build-out of new stores, improvements to existing stores, computer equipment related to those stores, as well as costs for the new distribution center. The Company opened 52 new stores in Fiscal 2013 as compared to 54 new stores in Fiscal 2012.
Cash Used in and Provided by Financing Activities
Net cash used in financing activities was $36.9 million in Fiscal 2014 as compared to net cash provided by financing activities of $5.5 million in Fiscal 2013. The $42.3 million increase in cash used in financing activities was primarily due to purchases of common stock under the Company’s share repurchase program of $57.8 million and an increase in purchases of treasury stock of $2.1 million partially offset by net borrowings under the Company’s revolving credit facility of $8.0 million, an increase in the proceeds from exercises of stock options of $5.9 million and an increase in the tax benefits on exercises of stock options of $3.3 million.
Net cash provided by financing activities was $5.5 million in Fiscal 2013 as compared to $23.2 million in Fiscal 2012. The $17.8 million decrease in cash provided by financing activities was primarily due to the reduction in proceeds from exercises of common stock options and a decrease in tax benefits on exercises of stock options in Fiscal 2013 as compared to Fiscal 2012.
33
Table of Contents
Revolving Credit Facility
The terms of our Revolving Credit Facility extend through October 11, 2018, and allow the Company to borrow up to $90.0 million, subject to the terms of the facility, with a Company option to increase the facility up to a total of $150.0 million. For information regarding the terms of our Revolving Credit Facility, refer to Note 8., “Credit Arrangements”, to our consolidated financial statements included in this Annual Report on Form 10-K. As of December 27, 2014, the Company had $8.0 million of borrowings outstanding on its Revolving Credit Facility. The largest amount borrowed at any given point during Fiscal 2014 was $15.0 million. The unused available line of credit under the Revolving Credit Facility at December 27, 2014 was $81.0 million.
Contractual Obligations and Commercial Commitments
As of December 27, 2014, our lease commitments and contractual obligations were as follows (in thousands):
| Fiscal year ending |
Total | Operating Leases Real Estate (1) |
Operating Leases Equipment |
Capital Lease Obligations |
||||||||||||
| 2015 |
$ | 116,097 | $ | 115,345 | $ | 672 | $ | 80 | ||||||||
| 2016 |
113,246 | 112,584 | 571 | 91 | ||||||||||||
| 2017 |
103,246 | 102,968 | 254 | 24 | ||||||||||||
| 2018 |
88,419 | 88,419 | — | — | ||||||||||||
| 2019 |
71,215 | 71,215 | — | — | ||||||||||||
| Thereafter |
213,502 | 213,502 | — | — | ||||||||||||
|
|
|
|
|
|
|
|
|
|||||||||
| $ | 705,725 | $ | 704,033 | $ | 1,497 | $ | 195 | |||||||||
|
|
|
|
|
|
|
|
|
|||||||||
| (1) | Store operating leases included in the above table do not include contingent rent based upon sales volume. Operating leases do not include common area maintenance costs or real estate taxes that are paid to the landlord during the year, which combined represented approximately 16.5% of our minimum lease obligations for Fiscal 2014. In addition, not included are variable activity based fees associated with our west coast logistics facility, which were approximately $2.3 million during Fiscal 2014. |
We are not party to any long-term purchase commitments. Our typical merchandise purchase orders are generally performed upon within a four to six week period. However, as of December 27, 2014, we have an obligation, excluded from the above commitments, of approximately $8.7 million to purchase an agreed upon supply of our own branded merchandise which has been produced by, and resides with, the applicable vendors.
In addition to the contractual obligations set forth in the table above, we have employment agreements with certain of our executives that provide for compensation and certain other benefits. Under certain circumstances, these agreements provide for severance or other payments, if those circumstances occur during the term of their employment.
Off-Balance Sheet Arrangements
We have not created, and are not party to, any special-purpose or off-balance sheet entities for the purpose of raising capital, incurring debt or operating our business. We do not have any off-balance sheet arrangements or relationships with entities that are not consolidated into our financial statements that have or are reasonably likely to have a material current or future effect on our financial condition, changes in financial condition, revenues, expenses, results of operations, liquidity, capital expenditures or capital resources. The Company has commitments for its operating leases, primarily related to its stores as well as its manufacturing and corporate facilities, which are not reflected on our balance sheet.
Effects of Inflation
We do not believe that our sales or operating results have been materially affected by inflation during the periods presented in our financial statements. During Fiscal 2014, retail price inflation was at a rate below historical trends. During Fiscal 2015, we anticipate retail inflation to occur at a rate more consistent with past trends of approximately 1% to 2%. Additionally, we may experience increased cost pressure from our suppliers which could have an adverse effect on our gross profit results in the future.
Recent Accounting Pronouncements
Except as discussed in Note 2., “Summary of Significant Accounting Policies”, to our consolidated financial statements included in this Annual Report on Form 10-K, we have considered all new accounting pronouncements and have concluded that there are no new pronouncements that may have a material impact on our results of operations, financial condition, or cash flows, based on current information.
34
Table of Contents
| Item 7A. | Quantitative and Qualitative Disclosures About Market Risk |
Interest Rate Risk
The Company’s market risks relate primarily to changes in interest rates. Market risk represents the risk of changes in the value of market risk sensitive instruments caused by fluctuations in interest rates and commodity prices. Changes in these factors could cause fluctuations in the results of our operations and cash flows.
Our Revolving Credit Facility carries a floating interest rate and, therefore, our statements of income and our cash flows are exposed to changes in interest rates. As of December 27, 2014, there was $8.0 million of borrowings outstanding on our Revolving Credit Facility. At December 27, 2014, a hypothetical 10% change in the floating interest rate would have a de minimis impact on our consolidated financial statements.
Foreign Currency Risk
The Company is minimally exposed to foreign currency exchange risk. We lease and operate three stores in Canada. Sales made from the Canadian stores are made in Canadian dollars. The Company does not currently hedge against the risk of exchange rate fluctuations. At December 27, 2014, a hypothetical 10% change in value of the U.S. dollar relative to the Canadian dollar would have a de minimis impact on our consolidated financial statements.
| Item 8. | Financial Statements and Supplementary Data |
The response to this item is incorporated herein by reference to the financial statements and supplementary financial data in Item 15. “Exhibits and Financial Statement Schedules” appearing at the end of this Annual Report on Form 10-K.
| Item 9. | Changes in and Disagreements with Accountants on Accounting and Financial Disclosure |
None.
| Item 9A. | Controls and Procedures |
Conclusion Regarding the Effectiveness of Disclosure Controls and Procedures
We carried out an evaluation, under the supervision and with the participation of our management, including our Chief Executive Officer and Chief Financial Officer, who are our principal executive officer and principal financial officer, respectively, of the design and operation of our disclosure controls and procedures as such term is defined in Rules 13a-15(e) and 15d—15(e) under the Securities Exchange Act of 1934 (the “Exchange Act”) as of December 27, 2014, pursuant to Exchange Act Rule 13a-15 and 15d-15. Based on such evaluation, the Chief Executive Officer and Chief Financial Officer concluded that our disclosure controls and procedures were effective at a reasonable assurance level as of December 27, 2014.
Management’s Report on Internal Control Over Financial Reporting
See Item 15. “Exhibits and Financial Statement Schedules” appearing at the end of this Annual Report on Form 10-K for Management’s Report on Internal Control Over Financial Reporting.
On June 6, 2014, the Company acquired all of the outstanding equity interests of Nutri-Force. Prior to the acquisition, Nutri-Force was a privately-held company. We excluded the operations of Nutri-Force from the scope of our Sarbanes-Oxley Section 404 report on internal control over financial reporting for Fiscal 2014. The Company began the process of evaluating Nutri-Force’s internal controls and implementing our internal control structure over the acquired operations during Fiscal 2014 and expects that this effort will be completed in Fiscal 2015.
Changes in Internal Control over Financial Reporting
There have been no changes in our internal control over financial reporting during the quarter ended December 27, 2014, that have materially affected, or are reasonably likely to materially affect, our internal control over financial reporting.
Inherent Limitations on Effectiveness of Controls
Our management, including the CEO and CFO, do not expect that our disclosure controls and procedures or our internal control over financial reporting will prevent or detect all errors and all fraud. A control system, no matter how well designed and operated, can provide only reasonable, not absolute, assurance that the control system’s objectives will be met. The design of a control system must reflect the fact that there are resource constraints, and the benefits of controls must be considered relative to their costs. Further, because of the inherent limitations in all control systems, no evaluation of controls can provide absolute assurance that misstatements due to error or fraud will not occur or that all control issues and instances of fraud, if any, within the Company have been detected. These inherent limitations include the realities that judgments in decision-making can be faulty and that breakdowns can occur because of simple error or mistake. Controls can also be circumvented by the individual acts of some persons, by collusion of two or more people, or by management override of the controls. The
35
Table of Contents
design of any system of controls is based in part on certain assumptions about the likelihood of future events, and there can be no assurance that any design will succeed in achieving its stated goals under all potential future conditions. Projections of any evaluation of controls effectiveness to future periods are subject to risks. Over time, controls may become inadequate because of changes in conditions or deterioration in the degree of compliance with policies or procedures.
| Item 9B. | Other Information |
None.
| Item 10. | Directors, Executive Officers and Corporate Governance |
Information with respect to this Item will be included in the Company’s Proxy Statement to be filed in April 2015, which is incorporated herein by reference under the captions “Proposal One – Election of Directors”, “Corporate Governance”, “Executive Officers” and “Section 16(a) Beneficial Ownership Reporting Compliance”.
| Item 11. | Executive Compensation |
Information with respect to this Item will be included in the Company’s Proxy Statement to be filed in April 2015, which is incorporated herein by reference under the captions, “Director Compensation”, “Compensation Discussion and Analysis” and “Executive Compensation”.
| Item 12. | Security Ownership of Certain Beneficial Owners and Management and Related Stockholder Matters |
Information with respect to this Item will be included in the Company’s Proxy Statement to be filed in April 2015, which is incorporated herein by reference under the captions “Security Ownership” and “Equity Compensation Plan Information”.
| Item 13. | Certain Relationships and Related Transactions, and Director Independence |
Information with respect to this Item will be included in the Company’s Proxy Statement to be filed in April 2015, which is incorporated herein by reference under the captions “Corporate Governance – Director Independence”, “Corporate Governance – Policies with Respect to Transactions with Related Persons” and “Certain Relationships and Related Party Transactions, and Director Independence”.
| Item 14. | Principal Accounting Fees and Services |
Information with respect to this Item will be included in the Company’s Proxy Statement to be filed in April 2015, which is incorporated herein by reference under the caption “Principal Accountant Fees and Services”.
| Item 15. | Exhibits, Financial Statement Schedules |
| (a) | The following documents are filed as part of this annual report on Form 10-K: |
| 1. | The following consolidated financial statements listed below are filed as a separate section of this annual report on Form 10-K: |
Management’s Reports and Reports of Independent Registered Public Accounting Firm—Deloitte & Touche LLP.
Consolidated Balance Sheets as of December 27, 2014 and December 28, 2013.
Consolidated Statements of Income for the Fiscal years ended December 27, 2014, December 28, 2013, and December 29, 2012.
Consolidated Statements of Comprehensive Income for the Fiscal years ended December 27, 2014, December 28, 2013, and December 29, 2012.
Consolidated Statements of Stockholders’ Equity for the Fiscal years ended December 27, 2014, December 28, 2013, and December 29, 2012.
Consolidated Statements of Cash Flows for the Fiscal years ended December 27, 2014, December 28, 2013, and December 29, 2012.
Notes to Consolidated Financial Statements for the Fiscal years ended December 27, 2014, December 28, 2013, and December 29, 2012.
36
Table of Contents
| 2. | Exhibits: |
| Exhibit |
Description | |
| 2.1 | Agreement and Plan of Merger by and between VS Holdings, Inc. and VS Parent, Inc. (1) | |
| 2.2 | LLC Interest Purchase Agreement, dated as of June 6, 2014, by and among VSH, the Company, the Equityholders and Nutri-Force. (2) | |
| 3.1 | Amended and Restated Certificate of Incorporation of Vitamin Shoppe, Inc. (3) | |
| 3.2 | Second Amended and Restated Bylaws of Vitamin Shoppe, Inc. (3) | |
| 3.3 | Third Amended and Restated Bylaws of Vitamin Shoppe Inc. (4) | |
| 4.1 | Specimen certificate for shares of common stock, $0.01 par value, of Vitamin Shoppe, Inc. (5) | |
| 10.1 | Amended and Restated Loan and Security Agreement, dated January 20, 2011, by and among Vitamin Shoppe Industries Inc. and VS Direct Inc. as borrowers, Vitamin Shoppe, Inc. as Guarantor, the Lenders and Issuing Bank from time to time party thereto, and JPMorgan Chase Bank, N.A. as Administrative Agent. (6) | |
| 10.2 | First Amendment to Amended and Restated Loan and Security Agreement, dated as of January 10, 2013, by and among Vitamin Shoppe Industries Inc., VS Direct Inc. and Vitamin Shoppe Mariner, Inc., as Borrowers, Vitamin Shoppe, Inc., as Guarantor, and JPMorgan Chase Bank, N.A., as Agent, the Issuing Bank and a Lender. (7) | |
| 10.3 | Second Amendment to Amended and Restated Loan and Security Agreement and First Amendment to Existing Guarantees, dated January 10, 2013, by and among Vitamin Shoppe Industries Inc., VS Direct Inc., Vitamin Shoppe Mariner, Inc., and Vitamin Shoppe Global, Inc., as Borrowers, Vitamin Shoppe, Inc., as Guarantor, and JPMorgan Chase Bank, N.A., as Agent, the Issuing Bank and a Lender. (7) | |
| 10.4 | Intercreditor Agreement Joinder, dated as of September 25, 2009, by JPMorgan Chase Bank, N.A. (8) | |
| 10.5 | Intellectual Property Security Agreement, dated as of September 25, 2009, by and among Vitamin Shoppe Industries Inc., VS Direct Inc. and Vitamin Shoppe, Inc. (f/k/a VS Holdings, Inc.) and JPMorgan Chase Bank, N.A., as Administrative Agent for the Lenders. (8) | |
| 10.6 | Stock Pledge Agreement, dated September 25, 2009 by and between Vitamin Shoppe, Inc. (f/k/a VS Holdings, Inc.) as Pledgor and JPMorgan Chase Bank, N.A. as Pledgee. (8) | |
| 10.7 | Amended and Restated Stock Pledge Agreement, dated October 11, 2013 by and between Vitamin Shoppe Industries Inc. as Pledgor and JPMorgan Chase Bank, N.A. as Pledgee. (7) | |
| 10.8 | Guarantee of Vitamin Shoppe Industries Inc. and Vitamin Shoppe, Inc. (f/k/a VS Holdings, Inc.), dated September 25, 2009, of obligations of VS Direct Inc. under the Amended and Restated Loan and Security Agreement, as amended. (8) | |
| 10.9 | Guarantee of VS Direct Inc. and Vitamin Shoppe, Inc. (f/k/a VS Holdings, Inc.), dated September 25, 2009, of obligations of Vitamin Shoppe Industries Inc. under the Amended and Restated Loan and Security Agreement, as amended. (8) | |
| 10.10 | Guarantee of Vitamin Shoppe, Inc., Vitamin Shoppe Industries Inc. and VS Direct Inc., dated January 10, 2013, of obligations of Vitamin Shoppe Mariner, Inc. under the Amended and Restated Loan Agreement, as amended. (7) | |
| 10.11 | Guarantee of Vitamin Shoppe, Inc., Vitamin Shoppe Industries Inc., VS Direct Inc. and Vitamin Shoppe Mariner, Inc., dated October 11, 2013, of the obligations of Vitamin Shoppe Global, Inc. under the Amended and Restated Loan Agreement, as amended. (7) | |
37
Table of Contents
| 10.12 | Joinder Agreement, dated as of January 10, 2013, by and between Vitamin Shoppe Mariner, Inc., and JPMorgan Chase Bank, N.A. (7) | |
| 10.13 | Joinder Agreement, dated as of October 11, 2013, by and between Vitamin Shoppe Global, Inc., and JPMorgan Chase Bank, N.A. (7) | |
| 10.14 | Joinder Agreement, dated as of August 21, 2014, by and between VS Hercules LLC, FDC Vitamins, LLC, Betancourt Sports Nutrition, LLC, and JPMorgan Chase Bank, N.A. (9) | |
| 10.15 | Guarantee, dated as of August 21, 2014, by Vitamin Shoppe, Inc., Vitamin Shoppe Industries Inc., VS Direct Inc., Vitamin Shoppe Mariner, Inc., Vitamin Shoppe Global, Inc., VS Hercules LLC, FDC Vitamins, LLC and Betancourt Sports Nutrition, LLC, of the obligations of one another under the Amended and Restated Loan Agreement, as amended, by and among Vitamin Shoppe Industries Inc., VS Direct Inc. and Vitamin Shoppe Mariner, Inc., as Borrowers, Vitamin Shoppe, Inc., as Guarantor, and JPMorgan Chase Bank, N.A., as Agent for the Lenders thereunder, the Issuing Bank and as a Lender. (9) | |
| 10.16 | Stock Pledge Agreement, dated as of August 21, 2014, by and between Vitamin Shoppe Global, Inc., as Pledgor, and JPMorgan Chase Bank, N.A., as Pledgee. (9) | |
| 10.17 | Stock Pledge Agreement, dated as of August 21, 2014, by and between VS Hercules LLC, as Pledgor, and JPMorgan Chase Bank, N.A., as Pledgee. (9) | |
| 10.18 | Stock Pledge Agreement, dated as of August 21, 2014, by and between FDC Vitamins, LLC, as Pledgor, and JPMorgan Chase Bank, N.A., as Pledgee. (9) | |
| 10.19 | Second Amended and Restated Intellectual Property Security Agreement, dated as of October 6, 2014, by and between Vitamin Shoppe Industries Inc., as Grantor and JPMorgan Chase Bank, N.A., as Administrative Agent. (10) | |
| 10.14 | Lease Agreement, dated as of May 2, 2002, by and between Hartz Mountain Industries, Inc. and Vitamin Shoppe Industries Inc. (11) | |
| 10.15 | Purchase Agreement, dated as of November 1, 2004, between Nature’s Value, Inc. and Vitamin Shoppe Industries Inc. (11) | |
| 10.16 | Form of Employment Agreement by and among executive officer, VS Parent, Inc., Vitamin Shoppe, Inc. (f/k/a VS Holdings, Inc.) and Vitamin Shoppe Industries Inc. * (11) | |
| 10.17 | Form of Indemnification Agreement by and among executive officer, Vitamin Shoppe, Inc. (f/k/a VS Holdings, Inc.) and Vitamin Shoppe Industries Inc. * (5) | |
| 10.18 | Form of Indemnification Agreement by and among director, Vitamin Shoppe, Inc. (f/k/a VS Holdings, Inc.) and Vitamin Shoppe Industries Inc. * (5) | |
| 10.19 | VS Parent, Inc. 2006 Stock Option Plan. * (12) | |
| 10.20 | 2009 Vitamin Shoppe Equity Incentive Plan. * (13) | |
| 10.21 | Vitamin Shoppe 2010 Employee Stock Purchase Plan. * (14) | |
| 10.22 | Employment and Non-Competition Agreement, dated as of September 9, 2009, among Richard Markee, VS Parent, Inc., VS Direct, Inc. Vitamin Shoppe, Inc. (f/k/a VS Holdings, Inc.) and Vitamin Shoppe Industries Inc. * (13) | |
| 10.23 | Amended and Restated Employment and Non-Competition Agreement, dated as of June 12, 2006, by and among Anthony Truesdale, VS Parent, Inc., Vitamin Shoppe, Inc. (f/k/a VS Holdings, Inc.) and Vitamin Shoppe Industries Inc. * (15) | |
| 10.24 | Amendment to Amended and Restated Employment and Non-Competition Agreement, dated as of December 28, 2007, by and among Anthony Truesdale, VS Parent, Inc., Vitamin Shoppe, Inc. (f/k/a VS Holdings, Inc.) and Vitamin Shoppe Industries Inc. * (16) | |
38
Table of Contents
| 10.25 | Amendment No. 2 to Employment and Non-Competition Agreement, dated as of September 25, 2009 by and among Anthony Truesdale, VS Parent, Inc., Vitamin Shoppe, Inc. (f/k/a VS Holdings, Inc.) and Vitamin Shoppe Industries Inc. * (8) | |
| 10.26 | Employment and Non-Competition Agreement, dated as of April 16, 2007, by and among Michael G. Archbold, VS Parent, Inc., Vitamin Shoppe, Inc. (f/k/a VS Holdings, Inc.) and Vitamin Shoppe Industries Inc. * (17) | |
| 10.27 | Amendment to Employment and Non-Competition Agreement, dated as of December 28, 2007, by and among Michael G. Archbold, VS Parent, Inc., Vitamin Shoppe, Inc. (f/k/a VS Holdings, Inc.) and Vitamin Shoppe Industries Inc. * (16) | |
| 10.28 | Amendment No. 2 to Employment and Non-Competition Agreement, dated as of September 25, 2009 by and among Michael G. Archbold, VS Parent, Inc., Vitamin Shoppe, Inc. (f/k/a VS Holdings, Inc.) and Vitamin Shoppe Industries, Inc. * (8) | |
| 10.29 | Employment and Non-Competition Agreement, dated as of January 15, 2007, by and among Louis H. Weiss, VS Parent, Inc., VS Direct, Inc., Vitamin Shoppe, Inc. (f/k/a VS Holdings, Inc.) and Vitamin Shoppe Industries, Inc. * (18) | |
| 10.30 | Amendment to Employment and Non-Competition Agreement, dated as of December 28, 2007, by and among Louis H. Weiss, VS Parent, Inc., VS Direct, Inc., Vitamin Shoppe, Inc. (f/k/a VS Holdings, Inc.) and Vitamin Shoppe Industries Inc. * (16) | |
| 10.31 | Letter Agreement, dated as of February 10, 2011, by and between Brenda Galgano and Vitamin Shoppe Industries, Inc. * (6) | |
| 10.32 | Amendment No. 3 to Employment and Non-Competition Agreement, dated as of February 28, 2011, by and among Michael G. Archbold, Vitamin Shoppe, Inc. and Vitamin Shoppe Industries Inc. * (6) | |
| 10.33 | Amendment No. 3 to Employment and Non-Competition Agreement, dated as of February 28, 2011, by and among Anthony Truesdale, Vitamin Shoppe, Inc. and Vitamin Shoppe Industries Inc. * (6) | |
| 10.34 | Amendment No. 1 to Employment and Non-Competition Agreement, dated as of February 28, 2011, by and among Richard Markee, Vitamin Shoppe, Inc. and Vitamin Shoppe Industries Inc. * (6) | |
| 10.35 | Amendment No. 2 to Employment and Non-Competition Agreement dated as of March 29, 2012 by and among Richard Markee, Vitamin Shoppe, Inc. and Vitamin Shoppe Industries Inc. * (19) | |
| 10.36 | Amendment No. 4 to Employment and Non-Competition Agreement dated as of March 29, 2012 by and among Anthony Truesdale, Vitamin Shoppe, Inc. and Vitamin Shoppe Industries Inc. * (19) | |
| 10.37 | Amendment No. 4 to Employment and Non-Competition Agreement dated as of March 29, 2012 by and among Michael G. Archbold, Vitamin Shoppe, Inc. and Vitamin Shoppe Industries Inc. * (19) | |
| 10.38 | Amendment No. 2 to Employment and Non-Competition Agreement dated as of March 29, 2012 by and among Louis H. Weiss, Vitamin Shoppe, Inc. and Vitamin Shoppe Industries Inc. * (19) | |
| 10.39 | Employment and Non-Competition Agreement dated as of March 29, 2012 by and among Brenda Galgano, Vitamin Shoppe, Inc. and Vitamin Shoppe Industries Inc. * (19) | |
| 10.40 | Vitamin Shoppe, Inc. Executive Severance Pay Policy, amended and restated effective as of October 29, 2014. * (19) | |
| 10.41 | Lease Agreement dated as of August 27, 2012 by and between CLF Ashland, LLC and Vitamin Shoppe Industries Inc. (20) | |
| 10.42 | Lease Agreement dated as of November 21, 2012 by and between Secaucus 300, LLC and Vitamin Shoppe Industries Inc. (Lease A) (21) | |
39
Table of Contents
| 10.43 | Lease Agreement dated as of November 21, 2012 by and between Secaucus 300, LLC and Vitamin Shoppe Industries Inc. (Lease B) (21) | |
| 10.44 | Asset Purchase Agreement dated as of December 17, 2012 by and among Vitamin Shoppe Mariner, Inc., Super Supplements, Inc., John Wurts and, solely for certain specified provisions thereof, Vitamin Shoppe, Inc. (22) | |
| 10.45 | Amendment No. 1 to Asset Purchase Agreement dated as of December 30, 2012 by and among Vitamin Shoppe Mariner, Inc., Super Supplements, Inc., John Wurts and, solely for certain specified provisions thereof, Vitamin Shoppe, Inc. (23) | |
| 10.46 | Master Confirmation - Capped Accelerated Share Repurchase, dated November 3, 2014, by and among Vitamin Shoppe, Inc. and JP Morgan Securities LLC, as Agent for JPMorgan Chase Bank, National Association, London Branch. (24) | |
| 10.47 | Employment Agreement, effective January 1, 2015, by and between Vitamin Shoppe, Inc. and Vitamin Shoppe Industries Inc. and Richard Markee. (25) | |
| 21.1 | Subsidiaries of the Registrant. (26) | |
| 23.1 | Consent of Independent Registered Public Accounting Firm. (26) | |
| 31.1 | Certification of Chief Executive Officer pursuant to Section 302 of the Sarbanes-Oxley Act of 2002. (26) | |
| 31.2 | Certification of Chief Financial Officer pursuant to Section 302 of the Sarbanes-Oxley Act of 2002. (26) | |
| 32.1 | Certification pursuant to 18 U.S.C. Section 1350, as adopted pursuant to Section 906 of the Sarbanes-Oxley Act of 2002 – Chief Executive Officer. (26) | |
| 32.2 | Certification pursuant to 18 U.S.C. Section 1350, as adopted pursuant to Section 906 of the Sarbanes-Oxley Act of 2002 – Chief Financial Officer. (26) | |
| 101 | The following financial information from the Company’s Annual Report on Form 10-K for the fiscal year ended December 27, 2014, formatted in eXtensible Business Reporting Language (XBRL): (a) Consolidated Balance Sheets as of December 27, 2014 and December 28, 2013; (b) Consolidated Statements of Income for the fiscal years ended December 27, 2014, December 28, 2013, and December 29, 2012; (c) Consolidated Statements of Comprehensive Income for the fiscal years ended December 27, 2014, December 28, 2013, and December 29, 2012; (d) Consolidated Statements of Stockholders’ Equity for the fiscal years ended December 27, 2014, December 28, 2013, and December 29, 2012; (e) Consolidated Statements of Cash Flows for the fiscal years ended December 27, 2014, December 28, 2013, and December 29, 2012; and (f) Notes to Consolidated Financial Statements for the fiscal years ended December 27, 2014, December 28, 2013, and December 29, 2012. | |
| (1) | Incorporated by reference to exhibits in our Current Report on Form 8-K filed on November 2, 2009 (File No. 001-34507). |
| (2) | Incorporated by reference to exhibits in our Current report on Form 8-K filed on June 9, 2014 (File No. 001-34507). |
| (3) | Incorporated by reference to exhibits in Amendment No. 1 to our Form 10-Q filed on November 13, 2009 (File No. 001-34507). |
| (4) | Incorporated by reference to exhibits in our Current Report on Form 8-K filed on August 26, 2013 (File No. 001-34507). |
| (5) | Incorporated by reference to exhibits in Amendment No. 4 to our Registration Statement No. 333-160756 on Form S-1 filed on October 14, 2009 (File No. 333-160756). |
| (6) | Incorporated by reference to exhibits in our Annual Report on Form 10-K filed on March 9, 2011 (File No. 001-34507). |
| (7) | Incorporated by reference to exhibits in our Current Report on Form 8-K filed on October 16, 2013 (File No. 001-34507). |
| (8) | Incorporated by reference to exhibits in our Current Report on Form 8-K filed on September 30, 2009 (File No. 333-134983-02). |
| (9) | Incorporated by reference to exhibits in our Current Report on Form 8-K filed on August 27, 2014 (File No. 001-34507). |
| (10) | Incorporated by reference to exhibits in our Current Report on Form 8-K filed on October 10, 2014 (File No. 001-34507). |
| (11) | Incorporated by reference to exhibits in our Registration Statement No. 333-134983 on Form S-4 filed on June 13, 2006 (File No. 333-134983-02). |
40
Table of Contents
| (12) | Incorporated by reference to exhibits in Amendment No. 5 to our Registration Statement No. 333-160756 on Form S-1 filed on October 22, 2009 (File No. 333-160756). |
| (13) | Incorporated by reference to exhibits in Amendment No. 2 to our Registration Statement No. 333-160756 on Form S-1 filed on September 22, 2009 (File No. 333-160756). |
| (14) | Incorporated by reference to exhibits in our Annual Report on Form 10-K filed on March 17, 2010 (File No. 001-34507). |
| (15) | Incorporated by reference to exhibits in Amendment No. 1 to our Registration Statement No. 333-134983 on Form S-4 filed on June 14, 2006 (File No. 333-134983-02). |
| (16) | Incorporated by reference to exhibits in our Annual Report on Form 10-K filed on March 28, 2008 (File No. 333-134983-02). |
| (17) | Incorporated by reference to exhibits in our Current Report on Form 8-K filed on April 19, 2007 (File No. 333-134983-02). |
| (18) | Incorporated by reference to exhibits in our Current Report on Form 8-K filed on January 16, 2007 (File No. 333-134983-02). |
| (19) | Incorporated by reference to exhibits in our Current Report on Form 8-K filed on April 2, 2012 (File No. 001-34507). |
| (20) | Incorporated by reference to exhibits in our Current Report on Form 8-K filed on August 31, 2012 (File No. 001-34507). |
| (21) | Incorporated by reference to exhibits in our Current Report on Form 8-K filed on November 28, 2012 (File No. 001-34507). |
| (22) | Incorporated by reference to exhibits in our Current Report on Form 8-K filed on December 18, 2012 (File No. 001-34507). |
| (23) | Incorporated by reference to exhibits in our Current Report on Form 8-K filed on January 2, 2013 (File No. 001-34507). |
| (24) | Incorporated by reference to exhibits in our Current Report on Form 8-K filed on November 6, 2014 (File No. 001-34507). |
| (25) | Incorporated by reference to exhibits in our Current Report on Form 8-K filed on January 7, 2015 (File No. 001-34507). |
| (26) | Filed herewith. |
| * | Management contract or compensation plan or arrangement. |
41
Table of Contents
SIGNATURES
Pursuant to the requirements of Section 13 or 15(d) of the Securities Exchange Act of 1934, the registrant has duly caused this report to be signed on its behalf by the undersigned, thereunto duly authorized, on February 24, 2015.
| VITAMIN SHOPPE, INC. | ||
| By: | /s/ Anthony N. Truesdale | |
| Anthony N. Truesdale Chief Executive Officer (Principal Executive Officer) | ||
Pursuant to the requirements of the Securities Exchange Act of 1934, this report has been signed below by the following persons on behalf of the registrant and in the capacities and on the dates indicated.
| Name |
Title |
Date | ||||
| By: | /s/ Richard L. Markee Richard L. Markee |
Executive Chairman, Director | February 24, 2015 | |||
| By: | /s/ Anthony N. Truesdale Anthony N. Truesdale |
Chief Executive Officer, Director (Principal Executive Officer) |
February 24, 2015 | |||
| By: | /s/ Brenda Galgano Brenda Galgano |
EVP, Chief Financial Officer (Principal Financial Officer) |
February 24, 2015 | |||
| By: | /s/ Daniel Lamadrid Daniel Lamadrid |
Chief Accounting Officer (Principal Accounting Officer) |
February 24, 2015 | |||
| By: | /s/ David H. Edwab David H. Edwab |
Lead Director | February 24, 2015 | |||
| By: | /s/ B. Michael Becker B. Michael Becker |
Director | February 24, 2015 | |||
| By: | /s/ John Bowlin John Bowlin |
Director | February 24, 2015 | |||
| By: | /s/ Catherine Buggeln Catherine Buggeln |
Director | February 24, 2015 | |||
| By: | /s/ Deborah M. Derby Deborah M. Derby |
Director | February 24, 2015 | |||
| By: | /s/ John H. Edmondson John H. Edmondson |
Director | February 24, 2015 | |||
| By: | /s/ Richard L. Perkal Richard L. Perkal |
Director | February 24, 2015 | |||
| By: | /s/ Beth M. Pritchard Beth M. Pritchard |
Director | February 24, 2015 | |||
| By: | /s/ Katherine Savitt Katherine Savitt |
Director | February 24, 2015 | |||
42
Table of Contents
MANAGEMENT’S REPORT ON INTERNAL CONTROL OVER FINANCIAL REPORTING
Our management is responsible for establishing and maintaining adequate internal control over financial reporting (as defined under the Exchange Act) to provide reasonable assurance regarding the reliability of financial reporting and the preparation of financial statements for external purposes in accordance with generally accepted accounting principles in the United States of America (“GAAP”). Such internal control includes those policies and procedures that (i) pertain to the maintenance of records that in reasonable detail accurately and fairly reflect the transactions and dispositions of the assets; and (ii) provide reasonable assurance (A) that transactions are recorded as necessary to permit preparation of financial statements in accordance with GAAP and that receipts and expenditures of the Company are being made only in accordance with authorizations of management and directors; and (B) regarding prevention or timely detection of unauthorized acquisition, use or disposition of our assets that could have a material effect on the financial statements.
Our management assessed the effectiveness of our internal control over financial reporting as of December 27, 2014. In making this assessment, it used the criteria set forth in Internal Control—Integrated Framework issued by the Committee of Sponsoring Organizations of the Treadway Commission (COSO) published in 2013. Based on this assessment, management has determined that, as of December 27, 2014, our internal control over financial reporting is effective based on those criteria.
Management’s evaluation excludes FDC Vitamins, LLC d/b/a Nutri-Force Nutrition, which was acquired on June 6, 2014, and whose financial statements constitute approximately 13% of total assets and approximately 3% of net sales of the consolidated financial statement amounts as of and for the year ended December 27, 2014. In accordance with guidance issued by the Securities and Exchange Commission, companies are permitted to exclude acquisitions from their assessment of internal control over financial reporting during the first year subsequent to the acquisition while integrating the acquired operations.
The Company’s internal control over financial reporting as of December 27, 2014 has been audited by Deloitte & Touche LLP, an independent registered public accounting firm, as stated in their attestation report which appears herein.
February 24, 2015
| /s/ Anthony N. Truesdale |
/s/ Brenda Galgano | |
| Anthony N. Truesdale | Brenda Galgano | |
| Chief Executive Officer | Chief Financial Officer |
MANAGEMENT’S RESPONSIBILITY FOR FINANCIAL STATEMENTS
The management of Vitamin Shoppe, Inc. is responsible for the preparation, objectivity and integrity of the consolidated financial statements and other information contained in this Annual Report on Form 10-K. The consolidated financial statements have been prepared in accordance with accounting principles generally accepted in the United States of America and include some amounts that are based on management’s informed judgments and best estimates.
Deloitte & Touche LLP, an independent registered public accounting firm, has audited these consolidated financial statements in accordance with the standards of the Public Company Accounting Oversight Board (United States) and has expressed herein their unqualified opinion on those financial statements.
The Audit Committee of the Board of Directors, which oversees all of the Company’s financial reporting process on behalf of the Board of Directors, consists solely of independent directors, meets with the independent registered public accounting firm, internal auditors and management periodically to review their respective activities and the discharge of their respective responsibilities. Both the independent registered public accounting firm and the internal auditors have unrestricted access to the Audit Committee, with or without management, to discuss the scope and results of their audits and any recommendations regarding the system of internal controls.
February 24, 2015
| /s/ Anthony N. Truesdale |
/s/ Brenda Galgano | |
| Anthony N. Truesdale | Brenda Galgano | |
| Chief Executive Officer | Chief Financial Officer |
43
Table of Contents
REPORT OF INDEPENDENT REGISTERED PUBLIC ACCOUNTING FIRM
To the Board of Directors and Stockholders of
Vitamin Shoppe, Inc.
North Bergen, New Jersey
We have audited the internal control over financial reporting of Vitamin Shoppe, Inc. and Subsidiary (the “Company”) as of December 27, 2014, based on criteria established in Internal Control—Integrated Framework (2013) issued by the Committee of Sponsoring Organizations of the Treadway Commission. As described in Management’s Report on Internal Control Over Financial Reporting, management excluded FDC Vitamins, LLC d/b/a Nutri-Force Nutrition (“Nutri-Force”), which was acquired on June 6, 2014, from its assessment of the internal control over financial reporting. The financial statements of Nutri-Force constitute approximately 13% of total assets and approximately 3% of net sales of the consolidated financial statement amounts as of and for the year ended December 27, 2014. Accordingly, our audit did not include the internal control over financial reporting for Nutri-Force. The Company’s management is responsible for maintaining effective internal control over financial reporting and for its assessment of the effectiveness of internal control over financial reporting, included in the accompanying Management’s Report on Internal Control over Financial Reporting. Our responsibility is to express an opinion on the Company’s internal control over financial reporting based on our audit.
We conducted our audit in accordance with the standards of the Public Company Accounting Oversight Board (United States). Those standards require that we plan and perform the audit to obtain reasonable assurance about whether effective internal control over financial reporting was maintained in all material respects. Our audit included obtaining an understanding of internal control over financial reporting, assessing the risk that a material weakness exists, testing and evaluating the design and operating effectiveness of internal control based on the assessed risk, and performing such other procedures as we considered necessary in the circumstances. We believe that our audit provides a reasonable basis for our opinion.
A company’s internal control over financial reporting is a process designed by, or under the supervision of, the company’s principal executive and principal financial officers, or persons performing similar functions, and effected by the company’s board of directors, management, and other personnel to provide reasonable assurance regarding the reliability of financial reporting and the preparation of financial statements for external purposes in accordance with generally accepted accounting principles. A company’s internal control over financial reporting includes those policies and procedures that (1) pertain to the maintenance of records that, in reasonable detail, accurately and fairly reflect the transactions and dispositions of the assets of the company; (2) provide reasonable assurance that transactions are recorded as necessary to permit preparation of financial statements in accordance with generally accepted accounting principles, and that receipts and expenditures of the company are being made only in accordance with authorizations of management and directors of the company; and (3) provide reasonable assurance regarding prevention or timely detection of unauthorized acquisition, use, or disposition of the company’s assets that could have a material effect on the financial statements.
Because of the inherent limitations of internal control over financial reporting, including the possibility of collusion or improper management override of controls, material misstatements due to error or fraud may not be prevented or detected on a timely basis. Also, projections of any evaluation of the effectiveness of the internal control over financial reporting to future periods are subject to the risk that the controls may become inadequate because of changes in conditions, or that the degree of compliance with the policies or procedures may deteriorate.
In our opinion, the Company maintained, in all material respects, effective internal control over financial reporting as of December 27, 2014, based on the criteria established in Internal Control—Integrated Framework (2013) issued by the Committee of Sponsoring Organizations of the Treadway Commission.
We have also audited, in accordance with the standards of the Public Company Accounting Oversight Board (United States), the consolidated financial statements as of and for the fiscal year ended December 27, 2014 of the Company and our report dated February 24, 2015 expressed an unqualified opinion on those financial statements.
/s/ Deloitte & Touche LLP
New York, New York
February 24, 2015
44
Table of Contents
REPORT OF INDEPENDENT REGISTERED PUBLIC ACCOUNTING FIRM
To the Board of Directors and Stockholders of
Vitamin Shoppe, Inc.
North Bergen, New Jersey
We have audited the accompanying consolidated balance sheets of Vitamin Shoppe, Inc. and Subsidiary (the “Company”) as of December 27, 2014 and December 28, 2013, and the related consolidated statements of income, comprehensive income, stockholders’ equity, and cash flows for each of the three fiscal years in the period ended December 27, 2014. These financial statements are the responsibility of the Company’s management. Our responsibility is to express an opinion on these financial statements based on our audits.
We conducted our audits in accordance with the standards of the Public Company Accounting Oversight Board (United States). Those standards require that we plan and perform the audit to obtain reasonable assurance about whether the consolidated financial statements are free of material misstatement. An audit includes examining, on a test basis, evidence supporting the amounts and disclosures in the financial statements. An audit also includes assessing the accounting principles used and significant estimates made by management, as well as evaluating the overall financial statement presentation. We believe that our audits provide a reasonable basis for our opinion.
In our opinion, such consolidated financial statements present fairly, in all material respects, the financial position of the Company as of December 27, 2014 and December 28, 2013, and the results of their operations and their cash flows for each of the three fiscal years in the period ended December 27, 2014, in conformity with accounting principles generally accepted in the United States of America.
We have also audited, in accordance with the standards of the Public Company Accounting Oversight Board (United States), the Company’s internal control over financial reporting as of December 27, 2014, based on criteria established in Internal Control—Integrated Framework (2013) issued by the Committee of Sponsoring Organizations of the Treadway Commission and our report dated February 24, 2015 expressed an unqualified opinion on the Company’s internal control over financial reporting.
/s/ Deloitte & Touche LLP
New York, New York
February 24, 2015
45
Table of Contents
VITAMIN SHOPPE, INC. AND SUBSIDIARY
CONSOLIDATED BALANCE SHEETS
(In thousands, except share and per share data)
| December 27, 2014 |
December 28, 2013 |
|||||||
| ASSETS | ||||||||
| Current assets: |
||||||||
| Cash and cash equivalents |
$ | 12,166 | $ | 74,036 | ||||
| Accounts receivable, net of allowances of $1,883 at December 27, 2014 |
10,376 | — | ||||||
| Inventories |
187,027 | 163,921 | ||||||
| Prepaid expenses and other current assets |
29,580 | 31,292 | ||||||
| Deferred income taxes |
7,449 | 5,936 | ||||||
|
|
|
|
|
|||||
| Total current assets |
246,598 | 275,185 | ||||||
| Property and equipment, net |
140,596 | 120,142 | ||||||
| Goodwill |
243,269 | 210,633 | ||||||
| Other intangibles, net |
89,025 | 71,264 | ||||||
| Other long-term assets |
2,903 | 4,840 | ||||||
|
|
|
|
|
|||||
| Total assets |
$ | 722,391 | $ | 682,064 | ||||
|
|
|
|
|
|||||
| LIABILITIES AND STOCKHOLDERS’ EQUITY | ||||||||
| Current liabilities: |
||||||||
| Revolving credit facility |
$ | 8,000 | $ | — | ||||
| Accounts payable |
37,396 | 39,106 | ||||||
| Deferred sales |
22,499 | 21,712 | ||||||
| Accrued expenses and other current liabilities |
53,321 | 42,026 | ||||||
|
|
|
|
|
|||||
| Total current liabilities |
121,216 | 102,844 | ||||||
| Deferred income taxes |
9,151 | 11,588 | ||||||
| Deferred rent |
39,388 | 36,032 | ||||||
| Other long-term liabilities |
702 | 3,260 | ||||||
| Commitments and contingencies |
||||||||
| Stockholders’ equity: |
||||||||
| Preferred stock, $0.01 par value; 250,000,000 shares authorized and no shares issued and outstanding at December 27, 2014 and December 28, 2013 |
— | — | ||||||
| Common stock, $0.01 par value; 400,000,000 shares authorized, 30,106,337 shares issued and 30,048,881 shares outstanding at December 27, 2014, and 30,531,550 shares issued and 30,525,234 shares outstanding at December 28, 2013 |
301 | 305 | ||||||
| Additional paid-in capital |
267,083 | 302,314 | ||||||
| Treasury stock, at cost; 57,456 shares at December 27, 2014 and 6,316 shares at December 28, 2013 |
(2,695 | ) | (280 | ) | ||||
| Accumulated other comprehensive loss |
(83 | ) | (86 | ) | ||||
| Retained earnings |
287,328 | 226,087 | ||||||
|
|
|
|
|
|||||
| Total stockholders’ equity |
551,934 | 528,340 | ||||||
|
|
|
|
|
|||||
| Total liabilities and stockholders’ equity |
$ | 722,391 | $ | 682,064 | ||||
|
|
|
|
|
|||||
See accompanying notes to consolidated financial statements.
46
Table of Contents
VITAMIN SHOPPE, INC. AND SUBSIDIARY
CONSOLIDATED STATEMENTS OF INCOME
(In thousands, except share and per share data)
| Fiscal Year Ended | ||||||||||||
| December 27, 2014 |
December 28, 2013 |
December 29, 2012 |
||||||||||
| Net sales |
$ | 1,213,046 | $ | 1,087,469 | $ | 950,902 | ||||||
| Cost of goods sold |
808,787 | 709,823 | 617,920 | |||||||||
|
|
|
|
|
|
|
|||||||
| Gross profit |
404,259 | 377,646 | 332,982 | |||||||||
| Selling, general and administrative expenses |
301,603 | 267,354 | 233,610 | |||||||||
|
|
|
|
|
|
|
|||||||
| Income from operations |
102,656 | 110,292 | 99,372 | |||||||||
| Interest expense, net |
495 | 495 | 659 | |||||||||
|
|
|
|
|
|
|
|||||||
| Income before provision for income taxes |
102,161 | 109,797 | 98,713 | |||||||||
| Provision for income taxes |
40,920 | 43,251 | 37,888 | |||||||||
|
|
|
|
|
|
|
|||||||
| Net income |
$ | 61,241 | $ | 66,546 | $ | 60,825 | ||||||
|
|
|
|
|
|
|
|||||||
| Weighted average common shares outstanding |
||||||||||||
| Basic |
30,239,183 | 29,992,620 | 29,473,711 | |||||||||
| Diluted |
30,664,105 | 30,541,057 | 30,110,237 | |||||||||
| Net income per common share |
||||||||||||
| Basic |
$ | 2.03 | $ | 2.22 | $ | 2.06 | ||||||
| Diluted |
$ | 2.00 | $ | 2.18 | $ | 2.02 | ||||||
See accompanying notes to consolidated financial statements.
CONSOLIDATED STATEMENTS OF COMPREHENSIVE INCOME
(In thousands)
| Fiscal Year Ended | ||||||||||||
| December 27, 2014 |
December 28, 2013 |
December 29, 2012 |
||||||||||
| Net income |
$ | 61,241 | $ | 66,546 | $ | 60,825 | ||||||
| Other comprehensive income (loss): |
||||||||||||
| Foreign currency translation adjustments |
3 | (87 | ) | 1 | ||||||||
|
|
|
|
|
|
|
|||||||
| Other comprehensive income (loss) |
3 | (87 | ) | 1 | ||||||||
|
|
|
|
|
|
|
|||||||
| Comprehensive income |
$ | 61,244 | $ | 66,459 | $ | 60,826 | ||||||
|
|
|
|
|
|
|
|||||||
See accompanying notes to consolidated financial statements.
47
Table of Contents
VITAMIN SHOPPE, INC. AND SUBSIDIARY
CONSOLIDATED STATEMENTS OF STOCKHOLDERS’ EQUITY
(In thousands, except share data)
|
Common Stock |
Treasury Stock |
Additional Paid-In Capital |
Accumulated Other Comprehensive (Loss) Income |
Retained Earnings |
Total | |||||||||||||||||||||||||||
| Shares | Amounts | Shares | Amounts | |||||||||||||||||||||||||||||
| Balance at December 31, 2011 |
29,216,888 | $ | 292 | — | $ | — | $ | 256,795 | $ | — | $ | 98,716 | $ | 355,803 | ||||||||||||||||||
| Comprehensive income |
— | — | — | — | — | 1 | 60,825 | 60,826 | ||||||||||||||||||||||||
| Equity compensation |
— | — | — | — | 6,500 | — | — | 6,500 | ||||||||||||||||||||||||
| Issuance of restricted shares |
145,462 | 1 | — | — | (1 | ) | — | — | — | |||||||||||||||||||||||
| Cancelation of restricted shares |
(45,991 | ) | — | — | — | — | — | — | — | |||||||||||||||||||||||
| Issuance of shares under employee stock purchase plan |
18,897 | — | — | — | 721 | — | — | 721 | ||||||||||||||||||||||||
| Exercise of stock options |
835,371 | 9 | — | — | 11,227 | — | — | 11,236 | ||||||||||||||||||||||||
| Tax benefits on exercise of stock options |
— | — | — | — | 12,332 | — | — | 12,332 | ||||||||||||||||||||||||
|
|
|
|
|
|
|
|
|
|
|
|
|
|
|
|
|
|||||||||||||||||
| Balance at December 29, 2012 |
30,170,627 | 302 | — | — | 287,574 | 1 | 159,541 | 447,418 | ||||||||||||||||||||||||
| Comprehensive (loss) income |
— | — | — | — | — | (87 | ) | 66,546 | 66,459 | |||||||||||||||||||||||
| Equity compensation |
— | — | — | — | 8,333 | — | — | 8,333 | ||||||||||||||||||||||||
| Issuance of restricted shares |
166,573 | 1 | — | — | (1 | ) | — | — | — | |||||||||||||||||||||||
| Purchase of treasury stock |
— | — | (6,316 | ) | (280 | ) | — | — | — | (280 | ) | |||||||||||||||||||||
| Cancelation of restricted shares |
(16,610 | ) | — | — | — | — | — | — | — | |||||||||||||||||||||||
| Issuance of shares under employee stock purchase plan |
20,887 | — | — | — | 849 | — | — | 849 | ||||||||||||||||||||||||
| Exercise of stock options |
190,073 | 2 | — | — | 3,485 | — | — | 3,487 | ||||||||||||||||||||||||
| Tax benefits on exercise of stock options |
— | — | — | — | 2,074 | — | — | 2,074 | ||||||||||||||||||||||||
|
|
|
|
|
|
|
|
|
|
|
|
|
|
|
|
|
|||||||||||||||||
| Balance at December 28, 2013 |
30,531,550 | 305 | (6,316 | ) | (280 | ) | 302,314 | (86 | ) | 226,087 | 528,340 | |||||||||||||||||||||
| Comprehensive income |
— | — | — | — | — | 3 | 61,241 | 61,244 | ||||||||||||||||||||||||
| Equity compensation |
— | — | — | — | 6,901 | — | — | 6,901 | ||||||||||||||||||||||||
| Issuance of restricted shares |
194,929 | 2 | — | — | (2 | ) | — | — | — | |||||||||||||||||||||||
| Purchases of treasury stock |
— | — | (51,140 | ) | (2,415 | ) | — | — | — | (2,415 | ) | |||||||||||||||||||||
| Purchases of shares under Share Repurchase Program |
(1,183,714 | ) | (12 | ) | — | — | (57,803 | ) | — | — | (57,815 | ) | ||||||||||||||||||||
| Cancelation of restricted shares |
(14,691 | ) | — | — | — | — | — | — | — | |||||||||||||||||||||||
| Issuance of shares under employee stock purchase plan |
24,289 | — | — | — | 923 | — | — | 923 | ||||||||||||||||||||||||
| Exercise of stock options |
553,974 | 6 | — | — | 9,387 | — | — | 9,393 | ||||||||||||||||||||||||
| Tax benefits on exercise of stock options |
— | — | — | — | 5,363 | — | — | 5,363 | ||||||||||||||||||||||||
|
|
|
|
|
|
|
|
|
|
|
|
|
|
|
|
|
|||||||||||||||||
| Balance at December 27, 2014 |
30,106,337 | $ | 301 | (57,456 | ) | $ | (2,695 | ) | $ | 267,083 | $ | (83 | ) | $ | 287,328 | $ | 551,934 | |||||||||||||||
|
|
|
|
|
|
|
|
|
|
|
|
|
|
|
|
|
|||||||||||||||||
See accompanying notes to consolidated financial statements.
48
Table of Contents
VITAMIN SHOPPE, INC. AND SUBSIDIARY
CONSOLIDATED STATEMENTS OF CASH FLOWS
(In thousands)
| Fiscal Year Ended | ||||||||||||
| December 27, 2014 |
December 28, 2013 |
December 29, 2012 |
||||||||||
| Cash flows from operating activities: |
||||||||||||
| Net income |
$ | 61,241 | $ | 66,546 | $ | 60,825 | ||||||
| Adjustments to reconcile net income to net cash provided by operating activities: |
||||||||||||
| Depreciation and amortization of fixed and intangible assets |
34,219 | 28,026 | 23,076 | |||||||||
| Impairment charge on fixed assets |
419 | — | 730 | |||||||||
| Contingent consideration adjustment for Nutri-Force acquisition |
959 | — | — | |||||||||
| Gain on insurance recoveries |
— | (1,079 | ) | — | ||||||||
| Amortization of deferred financing fees |
164 | 96 | 258 | |||||||||
| Loss on disposal of fixed assets |
— | — | 711 | |||||||||
| Deferred income taxes |
(3,950 | ) | 545 | (6,055 | ) | |||||||
| Deferred rent |
(503 | ) | 810 | 292 | ||||||||
| Equity compensation expense |
6,901 | 8,333 | 6,500 | |||||||||
| Proceeds from insurance recoveries |
— | 757 | — | |||||||||
| Tax benefits on exercises of stock options |
(5,363 | ) | (2,074 | ) | (12,332 | ) | ||||||
| Changes in operating assets and liabilities: |
||||||||||||
| Accounts receivable |
1,499 | — | — | |||||||||
| Inventories |
(2,458 | ) | (13,429 | ) | (16,201 | ) | ||||||
| Prepaid expenses and other current assets |
3,782 | (15,668 | ) | 558 | ||||||||
| Other long-term assets |
2,441 | (968 | ) | (629 | ) | |||||||
| Accounts payable |
(9,869 | ) | 11,688 | 2,226 | ||||||||
| Deferred sales |
787 | 734 | 2,053 | |||||||||
| Accrued expenses and other current liabilities |
8,483 | (1,416 | ) | 15,842 | ||||||||
| Other long-term liabilities |
1,395 | (1,779 | ) | 496 | ||||||||
|
|
|
|
|
|
|
|||||||
| Net cash provided by operating activities |
100,147 | 81,122 | 78,350 | |||||||||
|
|
|
|
|
|
|
|||||||
| Cash flows from investing activities: |
||||||||||||
| Capital expenditures |
(42,957 | ) | (42,782 | ) | (30,775 | ) | ||||||
| Acquisition of FDC Vitamins, LLC |
(81,538 | ) | — | — | ||||||||
| Acquisition of Super Supplements |
— | (50,542 | ) | — | ||||||||
| Trademarks and other intangible assets |
(689 | ) | (648 | ) | (399 | ) | ||||||
| Proceeds from insurance recoveries |
— | 322 | — | |||||||||
|
|
|
|
|
|
|
|||||||
| Net cash used in investing activities |
(125,184 | ) | (93,650 | ) | (31,174 | ) | ||||||
|
|
|
|
|
|
|
|||||||
| Cash flows from financing activities: |
||||||||||||
| Borrowings under revolving credit agreement |
15,000 | — | — | |||||||||
| Repayments of borrowings under revolving credit agreement |
(7,000 | ) | — | — | ||||||||
| Payments of capital lease obligations |
(152 | ) | (135 | ) | (1,052 | ) | ||||||
| Proceeds from exercises of common stock options |
9,393 | 3,487 | 11,236 | |||||||||
| Issuance of shares under employee stock purchase plan |
923 | 849 | 721 | |||||||||
| Purchases of treasury stock |
(2,415 | ) | (280 | ) | — | |||||||
| Purchases of shares under Share Repurchase Program |
(7,815 | ) | — | — | ||||||||
| Purchases of shares under Accelerated Share Repurchase Program |
(50,000 | ) | — | — | ||||||||
| Tax benefits on exercises of stock options |
5,363 | 2,074 | 12,332 | |||||||||
| Deferred financing fees and other |
(174 | ) | (532 | ) | — | |||||||
|
|
|
|
|
|
|
|||||||
| Net cash (used in) provided by financing activities |
(36,877 | ) | 5,463 | 23,237 | ||||||||
|
|
|
|
|
|
|
|||||||
| Effect of exchange rate changes on cash and cash equivalents |
44 | (67 | ) | 1 | ||||||||
|
|
|
|
|
|
|
|||||||
| Net (decrease) increase in cash and cash equivalents |
(61,870 | ) | (7,132 | ) | 70,414 | |||||||
| Cash and cash equivalents beginning of year |
74,036 | 81,168 | 10,754 | |||||||||
|
|
|
|
|
|
|
|||||||
| Cash and cash equivalents end of year |
$ | 12,166 | $ | 74,036 | $ | 81,168 | ||||||
|
|
|
|
|
|
|
|||||||
| Supplemental disclosures of cash flow information: |
||||||||||||
| Interest paid |
$ | 249 | $ | 390 | $ | 362 | ||||||
| Income taxes paid |
$ | 37,652 | $ | 57,064 | $ | 30,817 | ||||||
| Supplemental disclosures of non-cash investing activities: |
||||||||||||
| Liability for purchases of property and equipment |
$ | 8,379 | $ | 7,106 | $ | 5,064 | ||||||
| Assets acquired under capital lease |
$ | — | $ | 314 | $ | 264 | ||||||
See accompanying notes to consolidated financial statements.
49
Table of Contents
VITAMIN SHOPPE, INC. AND SUBSIDIARY
NOTES TO CONSOLIDATED FINANCIAL STATEMENTS
1. Basis of Presentation
Vitamin Shoppe, Inc. (“VSI”), is incorporated in the State of Delaware, and through its wholly-owned subsidiary, Vitamin Shoppe Industries Inc. (“Subsidiary” or “Industries”) and Industries’ wholly-owned subsidiaries, VS Direct Inc. (“Direct”), Vitamin Shoppe Mariner, Inc. (“VSM”), VS Hercules LLC (“VSH”), Vitamin Shoppe Global, Inc. (“VSG”) and Vitapath Canada Limited (“VCL”, and, together with Industries, Direct, VSM, VSH, VSG and VSI, the “Company”), is a multi-channel specialty retailer and contract manufacturer of nutritional products. Sales of both national brands and our own brands of vitamins, minerals, herbs, specialty supplements, sports nutrition and other health and wellness products (“VMS products”) are made through VSI-operated retail stores, the internet and mail order catalogs to customers located primarily in the United States. In addition, the Company manufactures products for both sales to third parties as well as for the VSI product assortment. VSI operates from its headquarters in North Bergen, New Jersey.
The consolidated financial statements for the fiscal years ended December 27, 2014, December 28, 2013 and December 29, 2012 include the accounts of VSI and Subsidiary. All intercompany transactions and balances have been eliminated in consolidation.
The Company’s fiscal year ends on the last Saturday in December. As used herein, the term “Fiscal Year” or “Fiscal” refers to a 52-week period, ending on the last Saturday in December.
On June 6, 2014, the Company acquired all of the outstanding equity interests of FDC Vitamins, LLC d/b/a Nutri-Force Nutrition (“Nutri-Force”), a company which provides custom manufacturing and private labeling of vitamins, dietary supplements, nutraceuticals and nutritional supplements, as well as, develops and markets its own branded products. The total purchase price was $86.1 million in cash, which includes $5.0 million of contingent consideration. Refer to Note 3. Acquisitions for additional information.
On February 14, 2013, the Company acquired substantially all of the assets and assumed certain liabilities of Super Supplements, Inc. (“Super Supplements”), a specialty retailer of vitamins, minerals, specialty supplements and sports nutrition, including 31 retail locations in the Pacific Northwest, a distribution center in Seattle, Washington and an e-commerce business. The total purchase price was $50.5 million in cash and the assumption of certain liabilities. Refer to Note 3. Acquisitions for additional information.
2. Summary of Significant Accounting Policies
Use of Estimates—The preparation of financial statements in conformity with accounting principles generally accepted in the United States of America (“GAAP”) requires management to make estimates and assumptions that affect the reported amounts of assets and liabilities, and disclosures of contingent assets and liabilities at the date of the financial statements, and revenue and expenses during the reporting period. Actual results could differ from those estimates.
Cash and Cash Equivalents—Cash and cash equivalents include all highly liquid investments with original maturities of ninety days or less. The Company reclassifies cash overdrafts to accounts payable.
Accounts Receivable—Through Nutri-Force, the Company sells product to third-party wholesale customers. Accounts receivable consists primarily of trade receivables of $10.4 million at December 27, 2014. The Company monitors the financial condition of its third-party wholesale customers and establishes an allowance for doubtful accounts for balances estimated to be uncollectible. In addition, customer allowances including promotional discounts and allowances are provided to wholesale customers based on various contract terms and are recorded as a reduction to revenue.
The following table details the activity and balances for the Company’s customer allowances for the year ended December 27, 2014 (in thousands):
| Balance at Beginning of Fiscal Year |
Additions | Deductions | Balance at End of Fiscal Year |
|||||||||||||
| Customer Allowances: |
||||||||||||||||
| Period Ended December 27, 2014 |
$ | — | $ | 3,194.2 | $ | (1,311.0 | ) | $ | 1,883.2 | |||||||
Inventories—Inventories are stated at the lower of cost or market value. Cost is determined using the weighted average method. Finished goods inventory includes costs on freight on internally transferred merchandise, and costs associated with our buying department and distribution facilities, as well as manufacturing overhead which are capitalized into inventory and then expensed as merchandise is sold. In addition, the cost of inventory is reduced by purchase discounts and other allowances received from certain of our vendors. The Company estimates losses for expiring inventory and the net realizable value of inventory based on when a product is close to expiration and not
50
Table of Contents
expected to be sold, when a product has reached its expiration date, or when a product is not expected to be saleable. In determining the reserves for these products consideration is given to such factors as the amount of inventory on hand, the remaining shelf life, current and expected market conditions, historical trends and the likelihood of recovering the inventory costs based on anticipated demand. The following table details the activity and balances for the Company’s reserve for obsolete inventory for the years ended December 27, 2014, December 28, 2013, and December 29, 2012 (in thousands):
| Balance at Beginning of Fiscal Year |
Amounts Charged to Cost of Goods Sold |
Write-Offs Against Reserves |
Balance at End of Fiscal Year |
|||||||||||||
| Obsolescence Reserves: |
||||||||||||||||
| Fiscal Year Ended December 27, 2014 |
$ | 2,640.3 | $ | 5,866.6 | $ | (5,385.9 | ) | $ | 3,121.0 | |||||||
| Fiscal Year Ended December 28, 2013 |
1,841.2 | 4,637.9 | (3,838.8 | ) | 2,640.3 | |||||||||||
| Fiscal Year Ended December 29, 2012 |
1,785.7 | 2,957.6 | (2,902.1 | ) | 1,841.2 | |||||||||||
Property and Equipment, Net—Property and equipment, net is stated at cost less accumulated depreciation and amortization. Depreciation and amortization are provided for on a straight-line basis over the estimated useful lives of the related assets. Furniture, fixtures and equipment are generally depreciated over seven years. Leasehold improvements are amortized generally over the shorter of their useful lives or related lease terms. The direct internal and external costs associated with the development of the features and functionality of the Company’s website, transaction processing systems, telecommunications infrastructure and network operations, are capitalized and are amortized on a straight line basis over the estimated useful lives of generally five years. Capitalization of costs begins when the preliminary project stage is completed and management authorizes and commits to funding the computer software project and that it is probable that the project will be completed and the software will be used to perform the function intended. Depreciation of the assets commences when they are put into use. Expenditures for repairs and maintenance are expensed as incurred and expenditures for major renovations and improvements are capitalized. Upon retirement or disposition of property and equipment, the applicable cost and accumulated depreciation are removed from the accounts and any resulting gains or losses are included in the results of operations.
Impairment of Long-Lived Assets—The Company reviews its long-lived assets for impairment whenever events or changes in circumstances indicate that the carrying amount of an asset may not be recoverable. Recoverability of assets held and used is measured by a comparison of the carrying amount of an asset to undiscounted pre-tax future net cash flows expected to be generated by that asset. If the undiscounted future cash flows are not adequate to recover the carrying value of the asset, an impairment loss is recognized for the amount by which the carrying amount of the assets exceeds the fair value of the assets.
Goodwill and Other Intangibles—Goodwill and other indefinite-lived intangibles are not amortized. Evaluations for impairment are performed at least annually, in the fourth quarter of each year, or whenever impairment indicators exist. Goodwill is evaluated for impairment at the reporting unit level (the Company’s operating segments). The evaluation of goodwill and other indefinite-lived intangibles may first consider qualitative factors to determine whether the existence of events or circumstances leads to a determination that it is more likely than not that the fair value is less than its carrying value. A quantitative evaluation is performed if the qualitative evaluation results in a more likely than not determination or if a qualitative evaluation is not performed. The Company’s quantitative impairment tests involve calculating the fair value of each reporting unit using the discounted cash flow analysis method along with the market multiples method which is used for additional validation of the fair value calculated. These valuation methods require certain assumptions and estimates be made by the Company regarding certain industry trends and future profitability. It is the Company’s policy to conduct goodwill impairment testing from information based on current business projections, which include projected future revenues and cash flows. The cash flows utilized in the discounted cash flow analysis are based on five-year financial forecasts developed internally by management. Cash flows for each reporting unit are discounted using an internally derived weighted average cost of capital which reflects the costs of borrowing for the funding of each unit as well as the risk associated with the units themselves. Also as part of the quantitative test, the Company conducts the test using a 10% decrease in its revenue projections as an additional sensitivity test to ensure the reporting unit’s fair value is greater than its carrying value should events in the future be less favorable than anticipated. If the carrying amount of a reporting unit exceeds its fair value, the Company would compare the implied fair value of the reporting unit goodwill with its carrying value. To compute the implied fair value of goodwill, the Company would assign the fair value of the reporting unit to all of the assets and liabilities of that unit (including any unrecognized intangible assets) as if the reporting unit had been acquired in a business combination. The excess of the fair value of a reporting unit over the amounts assigned to its assets and liabilities is the implied fair value of goodwill. For indefinite-lived tradenames, we utilize the royalty relief method in our quantitative evaluations. To the extent that the implied fair value associated with the goodwill and indefinite-lived intangible assets is less than the recorded value, this would result in a write down of the carrying value of the asset. Impairment tests between annual tests may be undertaken if an event occurs or circumstances change that would reduce the fair value of a reporting unit below its carrying value. The valuation of the goodwill and indefinite-lived intangible assets is affected by, among other things, the Company’s projections for the future and estimated results of future operations. Changes in the business plan or operating results that are different than the estimates used to develop the valuation of the assets may impact these valuations. For those intangible assets which have definite lives, the Company amortizes their cost on a straight-line basis over their estimated useful lives, the periods of which vary based on their particular contractual terms.
51
Table of Contents
In Fiscal 2014, the Company performed a qualitative analysis of its retail and direct reporting units and determined that it was more likely than not that the fair values of each of these reporting units and indefinite-lived tradenames were greater than their respective carrying values. The Company performed a quantitative analysis of its manufacturing reporting unit and determined that the fair value of this reporting unit was greater than its carrying value. There have been no impairment charges related to other intangibles during Fiscal 2014, Fiscal 2013 and Fiscal 2012.
Insurance Liabilities—Based on the Company’s assessment of risk and cost efficiency, the Company purchases insurance policies to provide for workers’ compensation, general liability, and property losses, as well as directors’ and officers’ liability. The Company is self-insured for certain losses related to our employee medical benefits, workers’ compensation and general liability, although it maintains stop-loss coverage with third-party insurers to limit its liability exposure. The accruals for claims incurred but not reported amounted to $1.8 million at December 27, 2014 and $1.2 million at December 28, 2013.
Rent Expenses, Deferred Rent and Landlord Construction Allowances—Rent expense and rent incentives, including landlord construction allowances, are recognized on a straight-line basis over the lease term. The Company records rent expense for stores, distribution centers and manufacturing facilities as a component of cost of goods sold. The Company accounts for landlord construction allowances as lease incentives and records them as a component of deferred rent, which is recognized in cost of goods sold over the lease term.
Revenue Recognition—The Company recognizes revenue when merchandise is sold “at point of sale” in retail stores or upon delivery to a direct customer. In addition, shipping fees billed to customers are classified as sales. Amount recognized as shipping revenue during Fiscal 2014, Fiscal 2013, and Fiscal 2012, were $3.0 million, $2.5 million, and $2.2 million, respectively. Nutri-Force sells product primarily to third-party customers and to our retail and direct segments. Revenue is recognized when risk of loss, title and insurable risks have transferred to the customer, net of estimated returns and allowances. To arrive at net sales, gross sales are reduced by deferred sales, customer discounts, actual customer returns and a provision for estimated future customer returns, which is based on management’s review of historical and current customer returns. Sales taxes collected from customers are presented on a net basis and as such are excluded from revenue.
Cost of Goods Sold—The Company includes the cost of inventory sold, costs of warehousing, distribution, manufacturing and store occupancy costs in cost of goods sold and excludes depreciation and amortization related to the retail and direct segments, which is included within selling, general and administrative expenses. Warehousing, distribution and manufacturing costs, which are capitalized into inventory and then expensed as merchandise is sold, include freight on internally transferred merchandise as well as for shipments to direct and wholesale customers and costs associated with our buying department and distribution facilities, as well as manufacturing overhead. Store occupancy costs include rent, common area maintenance, real estate taxes and utilities.
Vendor Allowances—Vendor allowances include discounts, allowances and rebates received from vendors and are based on various contract terms. Vendor allowances are recognized as either purchase discounts which represent a reduction of product cost, funding which is capitalized into inventory and recognized in the statement of income as the merchandise is sold, or direct offset which represents funding subject to immediate recognition in the statement of income, depending on the nature of the allowance.
Frequent Buyer Program—The Company has a frequent buyer program (“Healthy Awards Program”), whereby customers earn points toward free merchandise based on the dollar volume of purchases. Points are earned each calendar year and must be redeemed within the first three months of the following year or they expire. Sales are deferred at the time points are earned based on the value of points that are projected to be redeemed, which are based on historical redemption data. The Company records a liability for points earned within the current period. This is reported as a reduction of sales with a liability recorded as “Deferred sales” on the consolidated balance sheet.
Store Pre-opening Costs—Costs associated with the opening of new retail stores and start up activities are expensed as incurred.
Advertising Costs—The costs of advertising for online marketing arrangements, magazines, direct mail, television and radio are expensed the first time the advertising takes place. Costs associated with the production and distribution of the Company’s catalogs are expensed as incurred. Advertising expense was $19.3 million, $16.5 million and $14.7 million for Fiscal 2014, Fiscal 2013 and Fiscal 2012, respectively.
Online Marketing Arrangements—The Company has entered into online marketing arrangements with various online companies. These agreements are established for periods of 24 months, 12 months or, in some cases, a lesser period and generally provide for compensation based on revenue sharing upon the attainment of stipulated revenue amounts, a percentage of the media expenditure managed by the online partner, or based on the number of visitors that the online company refers to the Company. The Company had no fixed payment commitments during Fiscal 2014, Fiscal 2013 and Fiscal 2012.
Income Taxes—Deferred income tax assets and liabilities are recorded in accordance with the liability method. Deferred income taxes have been provided for temporary differences between the tax bases and financial reporting bases of the Company’s assets and liabilities using the tax rates and laws in effect for the periods in which the differences are expected to reverse.
The Company accounts for tax positions based on the provisions of the accounting literature related to accounting for uncertainty in income tax positions. Such literature provides guidance for the recognition threshold and measurement attribute for financial statement recognition
52
Table of Contents
and measurement of a tax position taken or expected to be taken in a tax return. For tax positions that are not more likely than not sustainable upon audit, the Company recognizes the largest amount of the benefit that is more likely than not to be sustained. The Company makes estimates of the potential liability based on our assessment of all potential tax exposures. In addition, the Company uses factors such as applicable tax laws and regulations, current information and past experience with similar issues to make these adjustments. The tax positions are analyzed regularly and adjustments are made as events occur that warrant adjustments for those positions. The Company records interest expense and penalties payable to relevant tax authorities as income tax expense.
Comprehensive Income—Comprehensive income represents net income plus the results of certain non-stockholders’ equity changes not reflected in the statements of income. The amounts recorded in accumulated other comprehensive income at December 27, 2014 and December 28, 2013, primarily represent the value of foreign currency translation adjustments related to the consolidation of VCL.
Foreign Currency—The local currency is used as the functional currency for Vitapath Canada Limited. We translate assets and liabilities denominated in foreign currency into United States dollars at the current rate of exchange at year end, and translate revenues and expenses at the average exchange rate during the period. Foreign currency translation adjustments are included in other comprehensive income and are reported separately in stockholders’ equity in the consolidated balance sheets.
Concentrations of Credit Risk—Financial instruments, which potentially subject the Company to concentrations of credit risk, include accounts receivable from wholesale customers as well as debit and credit card processors of retail transactions. As of December 27, 2014, five customers represented approximately 60% of the accounts receivable from wholesale customers. Accounts receivable from debit and credit card processors, included in prepaid expenses and other current assets on the consolidated balance sheets, totaled $7.2 million at December 27, 2014 and $7.7 million at December 28, 2013.
Glanbia, plc is the only supplier from whom we purchased at least 5% of our merchandise during Fiscal 2014, 2013 and 2012. We purchased approximately 12% of our total merchandise from Glanbia, plc during Fiscal 2014 and approximately 10% during Fiscal 2013 and 2012.
The Company is subject to concentrations of credit risk associated with cash and cash equivalents, and at times holds cash balances in excess of Federal Deposit Insurance Corporation limits.
Stock-Based Compensation—Stock-based compensation cost is measured at the grant date based on the fair value of awards and is recognized as expense on a straight-line basis over the requisite service period for each separately vesting portion of the award, net of anticipated forfeitures. With the exception of restricted shares and restricted share units, determining the fair value of stock-based awards at the grant date requires considerable judgment, including estimating expected volatility, expected term and risk-free rate. Compensation expense resulting from the granting of restricted shares and restricted share units is based on the grant date fair value of those common shares and is recognized generally over the two to four year vesting period for restricted shares and over the one year vesting period for restricted share units. For accounting purposes, the expense for performance based stock options and performance based restricted shares is calculated and recorded, based on the determination that the achievement of the pre-established performance targets are probable, over the relevant service period. The vesting requirements for performance based stock options and performance based restricted shares permit a catch-up of vesting at the end of the vesting period.
Expense related to shares purchased under the Company’s Employee Stock Purchase Plan (“ESPP”) is accounted for based on fair value recognition requirements similar to stock options. ESPP participation occurs each calendar quarter (the “Participation Period”) and the expense of which is subject to employee participation in the plan. Under the ESPP, participating employees are allowed to purchase shares at 85% of the lower of the market price of the Company’s common stock at either the first or last trading day of the Participation Period. Compensation expense related to the ESPP is based on the estimated fair value of the discount and purchase price offered on the estimated shares to be purchased under the ESPP. Expense is calculated quarterly, based on the employee contributions made over the applicable three-month Participation Period, using volatility and risk free rates applicable to that three-month period.
Net Income Per Share—The Company’s basic net income per share excludes the dilutive effect of stock options, unvested restricted shares and unvested restricted share units. It is based upon the weighted average number of common shares outstanding during the period divided into net income.
Diluted net income per share reflects the potential dilution that would occur if securities or other contracts to issue common stock were exercised or converted into common stock. Stock options, unvested restricted shares and unvested restricted share units are included as potential dilutive securities for the periods applicable, using the treasury stock method to the extent dilutive.
The components of the calculation of basic net income per common share and diluted net income per common share are as follows (in thousands except share and per share data):
53
Table of Contents
| Fiscal Year Ended | ||||||||||||
| December 27, 2014 |
December 28, 2013 |
December 29, 2012 |
||||||||||
| Numerator: |
||||||||||||
| Net income available to common stockholders |
$ | 61,241 | $ | 66,546 | $ | 60,825 | ||||||
|
|
|
|
|
|
|
|||||||
| Denominator: |
||||||||||||
| Basic weighted average common shares outstanding |
30,239,183 | 29,992,620 | 29,473,711 | |||||||||
| Effect of dilutive securities: |
||||||||||||
| Stock options |
235,057 | 402,814 | 545,426 | |||||||||
| Restricted shares |
184,995 | 141,573 | 89,038 | |||||||||
| Restricted share units |
4,870 | 4,050 | 2,062 | |||||||||
|
|
|
|
|
|
|
|||||||
| Diluted weighted average common shares outstanding |
30,664,105 | 30,541,057 | 30,110,237 | |||||||||
|
|
|
|
|
|
|
|||||||
| Basic net income per common share |
$ | 2.03 | $ | 2.22 | $ | 2.06 | ||||||
|
|
|
|
|
|
|
|||||||
| Diluted net income per common share |
$ | 2.00 | $ | 2.18 | $ | 2.02 | ||||||
|
|
|
|
|
|
|
|||||||
Stock options and restricted shares for the fiscal years ended December 27, 2014, December 28, 2013 and December 29, 2012 for 18,089, 23,319 and 42,305 shares, respectively, have been excluded from the above calculation as they were anti-dilutive.
Recent Accounting Pronouncements—Except as noted below, the Company has considered all new accounting pronouncements and has concluded that there are no new pronouncements that may have a material impact on its results of operations, financial condition, or cash flows, based on current information.
In May 2014, the Financial Accounting Standards Board issued Accounting Standards Update No. 2014-09 (“ASU 2014-09”), Revenue from Contracts with Customers (Topic 606). Under ASU 2014-09, an entity should recognize revenue to depict the transfer of promised goods or services to customers in an amount that reflects the consideration to which the entity expects to be entitled in exchange for those goods or services. ASU 2014-09 will be effective for the Company for annual reporting periods beginning after December 15, 2016 and early application of ASU 2014-09 is not permitted for public companies. The Company is evaluating ASU 2014-09 to determine if this guidance will have a material impact on the Company’s consolidated financial statements.
3. Acquisitions
Nutri-Force
On June 6, 2014, the Company acquired all of the outstanding equity interests of Nutri-Force. The total purchase price for the acquisition was $86.1 million in cash, which includes $5.0 million of contingent consideration to be paid by the Company in Fiscal 2015 based on the achievement of fiscal year 2014 operating performance targets. The $5.0 million of contingent consideration represents the maximum amount to be paid under the contingent consideration arrangement. The acquisition was funded by cash on hand.
The Company has recorded its accounting for this acquisition in accordance with accounting guidance on business combinations. The acquisition resulted in goodwill primarily related to the expected benefits resulting from vertical integration as well as growth opportunities. The Company recorded $4.0 million of acquisition and integration related costs during Fiscal 2014, which are included in the consolidated statement of income within selling, general and administrative expenses.
The purchase price of the acquisition has been allocated to the net tangible and intangible assets acquired, with the remainder recorded as goodwill on the basis of estimated fair values. The goodwill was allocated to the Company’s manufacturing segment. The allocation is as follows (in thousands):
54
Table of Contents
| Consideration transferred |
$ | 81,538 | ||
| Working capital adjustment receivable |
(487 | ) | ||
| Estimated contingent consideration |
4,041 | (a) | ||
|
|
|
|||
| Total consideration |
$ | 85,092 | ||
|
|
|
|||
| Less: net identifiable assets acquired |
||||
| Current assets |
33,798 | |||
| Non-current assets |
10,008 | |||
| Intangible assets |
18,800 | |||
| Current liabilities |
(10,150 | ) | ||
|
|
|
|||
| Total net identifiable assets acquired |
$ | 52,456 | ||
|
|
|
|||
| Goodwill |
$ | 32,636 | ||
|
|
|
| (a) | In the fourth quarter of Fiscal 2014, the Company recorded approximately $1.0 million of additional contingent consideration, which is included in the consolidated statement of income within selling, general and administrative expenses. |
As a result of fair value accounting for the acquisition, current assets includes an inventory valuation step-up of $4.5 million, which was charged to cost of goods sold during Fiscal 2014. Intangible assets consist of brands totaling $10.0 million, customer relationships of $7.5 million and internally-developed software of $1.3 million which are being amortized over their estimated useful lives of 18 years, 20 years and 5 years, respectively. The goodwill of $32.6 million is being amortized for tax purposes.
From June 6, 2014 through December 27, 2014, the acquired business generated net sales to third parties of $40.3 million and a pre-tax net loss of $1.8 million, excluding acquisition and integration costs. The pre-tax net loss includes the $4.5 million of charges related to the inventory valuation step-up noted above. The results represent the manufacturing segment. Pro forma results are not presented as the acquisition was not significant to the operating results for Fiscal 2014 or Fiscal 2013.
Super Supplements
On February 14, 2013, the Company acquired substantially all of the assets and assumed certain liabilities of Super Supplements, a specialty retailer of vitamins, minerals, specialty supplements and sports nutrition, including 31 retail locations in the Pacific Northwest, a distribution center in Seattle, Washington and an e-commerce business. The total purchase price was $50.5 million in cash and the assumption of certain liabilities. The acquisition was funded with existing cash on the Company’s balance sheet. The results of operations of the acquired business are included in the Company’s results from the acquisition date.
The acquisition resulted in goodwill primarily related to growth opportunities. The Company expensed acquisition and integration costs of $0.8 million and $4.3 million during Fiscal 2014 and Fiscal 2013, respectively, which are included in the consolidated statements of income within selling, general and administrative expenses.
The purchase price of the acquisition has been allocated to the net tangible and intangible assets acquired, with the remainder recorded as goodwill on the basis of estimated fair values. The goodwill was allocated to the Company’s retail segment. The allocation is as follows (in thousands):
| Total consideration transferred |
$ | 50,542 | ||
| Less: net identifiable assets acquired: |
||||
| Current assets |
13,876 | |||
| Non-current assets |
7,027 | |||
| Intangible assets |
2,400 | |||
| Current liabilities |
(5,350 | ) | ||
| Long-term liabilities |
(796 | ) | ||
|
|
|
|||
| Total net identifiable assets acquired |
$ | 17,157 | ||
|
|
|
|||
| Goodwill |
$ | 33,385 | ||
|
|
|
Intangible assets consist of a tradename of $2.4 million which is being amortized over the estimated useful life of 3 years. Long-term liabilities include unfavorable leases for certain retail locations of $0.8 million. The unfavorable lease liabilities are being amortized to rent expense over their respective lease terms, ranging from 2 to 9 years. The goodwill of $33.4 million is being amortized for tax purposes.
From February 15, 2013 through December 28, 2013 the acquired business generated net sales of $66.1 million and net income of $3.1 million, excluding acquisition and integration costs. Pro forma results are not presented as the acquisition was not significant to the operating results for Fiscal 2014 and Fiscal 2013.
55
Table of Contents
4. Inventories
The components of inventories are as follows (in thousands):
| December 27, 2014 |
December 28, 2013 |
|||||||
| Finished goods |
$ | 171,896 | $ | 163,921 | ||||
| Work-in-process |
4,592 | — | ||||||
| Raw materials |
10,539 | — | ||||||
|
|
|
|
|
|||||
| $ | 187,027 | $ | 163,921 | |||||
|
|
|
|
|
|||||
As of December 27, 2014, the inventories of Nutri-Force were $17.7 million.
5. Goodwill and Intangible Assets
Goodwill is allocated between the Company’s segments (reporting units), retail, direct and manufacturing. The following table discloses the carrying value of all intangible assets (in thousands):
| December 27, 2014 | December 28, 2013 | |||||||||||||||||||||||
| Gross Carrying Amount |
Accumulated Amortization |
Net | Gross Carrying Amount |
Accumulated Amortization |
Net | |||||||||||||||||||
| Intangible assets: |
||||||||||||||||||||||||
| Goodwill |
$ | 243,269 | $ | — | $ | 243,269 | $ | 210,633 | $ | — | $ | 210,633 | ||||||||||||
| Tradenames—Indefinite-lived |
68,405 | — | 68,405 | 68,405 | — | 68,405 | ||||||||||||||||||
| Brands |
10,000 | 324 | 9,676 | — | — | — | ||||||||||||||||||
| Customer relationships |
7,500 | 219 | 7,281 | — | — | — | ||||||||||||||||||
| Tradenames—Definite-lived |
4,250 | 1,735 | 2,515 | 3,562 | 785 | 2,777 | ||||||||||||||||||
| Software |
1,300 | 152 | 1,148 | — | — | — | ||||||||||||||||||
| Intangibles related to asset purchase |
2,950 | 2,950 | — | 2,950 | 2,868 | 82 | ||||||||||||||||||
|
|
|
|
|
|
|
|
|
|
|
|
|
|||||||||||||
| $ | 337,674 | $ | 5,380 | $ | 332,294 | $ | 285,550 | $ | 3,653 | $ | 281,897 | |||||||||||||
|
|
|
|
|
|
|
|
|
|
|
|
|
|||||||||||||
The increase in goodwill in Fiscal 2014 of $32.6 million represents the goodwill recognized from the acquisition of Nutri-Force, which has been allocated to the Company’s manufacturing segment.
Intangible amortization expense for Fiscal 2014, Fiscal 2013 and Fiscal 2012 was $1.7 million, $0.9 million and $0.1 million, respectively. The annual impairment tests for goodwill and tradenames were performed during the fourth quarter of Fiscal 2014. There have been no impairment charges related to goodwill or other intangibles during Fiscal 2014, Fiscal 2013 and Fiscal 2012.
The useful lives of the Company’s definite-lived intangible assets are between 3 to 20 years. The expected amortization expense on definite-lived intangible assets on the Company’s consolidated balance sheet at December 27, 2014, is as follows (in thousands):
| Fiscal 2015 |
$ | 2,175 | ||
| Fiscal 2016 |
1,475 | |||
| Fiscal 2017 |
1,375 | |||
| Fiscal 2018 |
1,375 | |||
| Fiscal 2019 |
1,375 | |||
| Thereafter |
12,845 | |||
|
|
|
|||
| $ | 20,620 | |||
|
|
|
6. Property and Equipment
Property and equipment consists of the following (in thousands):
56
Table of Contents
| December 27, 2014 |
December 28, 2013 |
|||||||
| Leasehold improvements |
$ | 160,348 | $ | 141,842 | ||||
| Furniture, fixtures and equipment |
155,927 | 135,921 | ||||||
| Software |
52,040 | 42,911 | ||||||
|
|
|
|
|
|||||
| 368,315 | 320,674 | |||||||
| Less: accumulated depreciation and amortization |
(238,613 | ) | (207,928 | ) | ||||
|
|
|
|
|
|||||
| Subtotal |
129,702 | 112,746 | ||||||
| Construction in progress |
10,894 | 7,396 | ||||||
|
|
|
|
|
|||||
| $ | 140,596 | $ | 120,142 | |||||
|
|
|
|
|
|||||
Depreciation and amortization expense on property and equipment for the fiscal years ended December 27, 2014, December 28, 2013, and December 29, 2012 was approximately $32.5 million, $27.1 million and $22.9 million, respectively. The Company recognized impairment charges of $0.4 million during Fiscal 2014 on fixed assets related to three of its underperforming retail locations still in use in the Company’s operations and $0.7 million during Fiscal 2012 on fixed assets related to three of its underperforming retail locations still in use in the Company’s operations.
Depreciation and amortization expense on property and equipment for the Company’s retail and direct segments is recorded in selling, general and administrative expenses on the consolidated statements of income. Depreciation on property and equipment used in the manufacturing process is recorded in cost of goods sold on the consolidated statements of income. All other depreciation and amortization for the manufacturing segment is recorded in selling, general and administrative expenses on the consolidated statements of income. Assets held under capital leases are classified under furniture, fixtures and equipment. Capital leases were $0.3 million, net of accumulated amortization of $5.5 million, at December 27, 2014, and $0.6 million, net of accumulated amortization of $5.2 million, at December 28, 2013.
7. Accrued Expenses and Other Current Liabilities
Accrued expenses and other current liabilities consist of the following (in thousands):
| December 27, 2014 |
December 28, 2013 |
|||||||
| Accrued salaries and related expenses |
$ | 8,824 | $ | 9,940 | ||||
| Accrued fixed asset additions |
7,290 | 6,286 | ||||||
| Sales tax payable and related expenses |
6,494 | 6,334 | ||||||
| Other accrued expenses |
30,713 | 19,466 | ||||||
|
|
|
|
|
|||||
| $ | 53,321 | $ | 42,026 | |||||
|
|
|
|
|
|||||
The Company is involved in ongoing examinations with various taxing authorities regarding non-income based tax matters for Fiscal 2014 and prior. The final obligation to these authorities may be subject to either an increase or decrease to the initial estimates recorded. As of December 27, 2014, the Company believes the reserves for these matters are adequately provided for in its consolidated financial statements, the reserves of which are reflected in “Sales tax payable and related expenses” in the table above.
8. Credit Arrangements
As of December 27, 2014, the Company had $8.0 million of borrowings outstanding on its Revolving Credit Facility. As of December 28, 2013, the Company had no outstanding debt.
Revolving Credit Facility
Subject to the terms of the Revolving Credit Facility, which has a maturity date of October 11, 2018, the Company may borrow up to $90.0 million, with a Company option to increase the facility up to a total of $150.0 million. The availability under the Revolving Credit Facility is subject to a borrowing base calculated on the value of certain accounts receivable from debit and credit card companies as well as the inventory of Industries, Direct, VSM, VSG and VSH. The obligations thereunder are secured by a security interest in substantially all of the assets of VSI, Industries, Direct, VSM, VSG and VSH. Under the Revolving Credit Facility, VSI has guaranteed the Company’s obligations, and Industries, Direct, VSM, VSG and VSH have each guaranteed the obligations of the four other respective entities. The Revolving Credit Facility provides for affirmative and negative covenants affecting VSI, Industries, Direct, VSM, VSG and VSH. The Revolving Credit Facility restricts, among other things, the Company’s ability to incur indebtedness, create or permit liens on the Company’s assets, declare or pay dividends and make certain other restricted payments, consolidate, merge or recapitalize, sell assets, make certain investments, loans or
57
Table of Contents
other advances, enter into transactions with affiliates, change our line of business, and restricts the types of hedging activities the Company can enter into. The largest amount borrowed at any given point during Fiscal 2014 was $15.0 million. The unused available line of credit under the Revolving Credit Facility at December 27, 2014 was $81.0 million.
Borrowings under the Revolving Credit Facility accrue interest, at the Company’s option, at the rate per annum based on an “alternative base rate” plus 0.25% or 0.50% or the adjusted Eurodollar rate plus 1.25% or 1.50%, in each case with the higher spread applicable in the event that the aggregate amount of the borrowings under the Revolving Credit Facility exceeds 50% of the borrowing base availability under the Revolving Credit Facility. The weighted average interest rate for the Revolving Credit facility for Fiscal 2014 was 1.44%.
The commitment fee on the undrawn portion of the $90.0 million Revolving Credit Facility was 0.25% as of December 27, 2014 and December 28, 2013.
Interest expense, net for Fiscal 2014, 2013 and 2012 consists of the following (in thousands):
| Fiscal Year Ended | ||||||||||||
| December 27, 2014 |
December 28, 2013 |
December 29, 2012 |
||||||||||
| Interest / fees on the revolving credit facility and other interest |
$ | 344 | $ | 419 | $ | 401 | ||||||
| Amortization of deferred financing fees |
164 | 96 | 258 | |||||||||
| Interest income |
(13 | ) | (20 | ) | — | |||||||
|
|
|
|
|
|
|
|||||||
| Interest expense, net |
$ | 495 | $ | 495 | $ | 659 | ||||||
|
|
|
|
|
|
|
|||||||
9. Income Taxes
The provision for income taxes for Fiscal 2014, Fiscal 2013 and Fiscal 2012 consists of the following (in thousands):
| Fiscal Year Ended | ||||||||||||
| December 27, 2014 |
December 28, 2013 |
December 29, 2012 |
||||||||||
| Current: |
||||||||||||
| Federal |
$ | 38,432 | $ | 36,070 | $ | 36,776 | ||||||
| State |
6,438 | 6,636 | 7,167 | |||||||||
|
|
|
|
|
|
|
|||||||
| Total current |
44,870 | 42,706 | 43,943 | |||||||||
|
|
|
|
|
|
|
|||||||
| Deferred: |
||||||||||||
| Federal |
(3,497 | ) | 256 | (4,881 | ) | |||||||
| State |
(453 | ) | 289 | (1,174 | ) | |||||||
|
|
|
|
|
|
|
|||||||
| Total deferred |
(3,950 | ) | 545 | (6,055 | ) | |||||||
|
|
|
|
|
|
|
|||||||
| Provision for income taxes |
$ | 40,920 | $ | 43,251 | $ | 37,888 | ||||||
|
|
|
|
|
|
|
|||||||
A reconciliation of the statutory Federal income tax rate and effective rate of the provision for income taxes is as follows:
| Fiscal Year Ended | ||||||||||||
| December 27, 2014 |
December 28, 2013 |
December 29, 2012 |
||||||||||
| Federal statutory rate |
35.0 | % | 35.0 | % | 35.0 | % | ||||||
| State income taxes, net of Federal income tax benefit |
4.2 | % | 4.4 | % | 4.7 | % | ||||||
| Adjustments for uncertain tax positions |
0.0 | % | (0.5 | )% | (1.9 | )% | ||||||
| Other |
0.9 | % | 0.5 | % | 0.6 | % | ||||||
|
|
|
|
|
|
|
|||||||
| Effective tax rate |
40.1 | % | 39.4 | % | 38.4 | % | ||||||
|
|
|
|
|
|
|
|||||||
58
Table of Contents
Deferred income taxes reflect the net tax effects of temporary differences between the carrying value of assets and liabilities for financial reporting purposes and amounts used for income tax purposes. The temporary differences and carryforwards that give rise to deferred tax assets and liabilities at December 27, 2014 and December 28, 2013 are as follows (in thousands):
| December 27, 2014 |
December 28, 2013 |
|||||||
| Deferred tax assets: |
||||||||
| Net operating loss carryforward |
$ | 1,142 | $ | 647 | ||||
| Deferred rent |
11,861 | 11,733 | ||||||
| Tenant allowance |
3,667 | 2,419 | ||||||
| Deferred sales |
4,386 | 4,087 | ||||||
| General accrued liabilities |
6,165 | 2,637 | ||||||
| Deferred wages and compensation |
711 | 269 | ||||||
| Inventory |
4,339 | 3,482 | ||||||
| Equity compensation expense |
6,304 | 6,847 | ||||||
| Other |
2,062 | 1,190 | ||||||
|
|
|
|
|
|||||
| 40,637 | 33,311 | |||||||
| Valuation allowance |
(1,142 | ) | (647 | ) | ||||
|
|
|
|
|
|||||
| Deferred tax assets |
39,495 | 32,664 | ||||||
|
|
|
|
|
|||||
| Deferred tax liabilities: |
||||||||
| Trade name and goodwill |
(29,368 | ) | (27,594 | ) | ||||
| Accumulated depreciation |
(9,612 | ) | (8,441 | ) | ||||
| Prepaid expenses |
(2,217 | ) | (2,281 | ) | ||||
|
|
|
|
|
|||||
| Deferred tax liabilities |
(41,197 | ) | (38,316 | ) | ||||
|
|
|
|
|
|||||
| Net deferred tax liability |
$ | (1,702 | ) | $ | (5,652 | ) | ||
|
|
|
|
|
|||||
| Amounts recognized in the consolidated balance sheets consist of: |
||||||||
| Deferred tax assets—current |
$ | 7,449 | $ | 5,936 | ||||
| Deferred tax liabilities—long term |
(9,151 | ) | (11,588 | ) | ||||
|
|
|
|
|
|||||
| Net deferred tax liability |
$ | (1,702 | ) | $ | (5,652 | ) | ||
|
|
|
|
|
|||||
Management periodically assesses whether the Company is more likely than not to realize some or all of its deferred tax assets. As of December 27, 2014, with the exception of $1.1 million of deferred tax assets arising from a foreign and state net operating loss carryforward against which there is a valuation allowance (see above table), management determined that the Company is more likely than not to realize the deferred tax assets detailed above. Realization of deferred tax assets associated with the state net operating loss carryforwards is dependent upon generating sufficient taxable income prior to their expiration by tax jurisdiction.
The Company and its subsidiaries file income tax returns in the U.S. federal jurisdiction, various state jurisdictions, Puerto Rico and Canada. As of December 27, 2014, the Company has accrued a liability of approximately $0.5 million related to uncertain tax positions, which is included in other long-term liabilities in the consolidated balance sheet.
The total amount of unrecognized tax benefits that, if recognized, would impact the effective tax rate was approximately $0.4 million at December 27, 2014, $0.3 million at December 28, 2013 and $0.5 million at December 29, 2012. A reconciliation of the beginning and ending amount of unrecognized tax benefits is as follows (in thousands):
59
Table of Contents
| Balance at December 31, 2011 |
$ | 6,706 | ||
| Additions based on tax positions related to the current year |
1,169 | |||
| Additions for tax positions of prior years |
2,554 | |||
| Decreases for tax positions of prior years due to revaluation of positions |
(2,554 | ) | ||
| Decreases for tax positions of prior years due to lapse of statutes |
(2,245 | ) | ||
|
|
|
|||
| Balance at December 29, 2012 |
$ | 5,630 | ||
| Additions based on tax positions related to the current year |
13 | |||
| Additions for tax positions of prior years |
— | |||
| Decreases for tax positions of prior years due to revaluation of positions |
(4,627 | ) | ||
| Decreases for tax positions of prior years due to lapse of statutes |
(612 | ) | ||
|
|
|
|||
| Balance at December 28, 2013 |
$ | 404 | ||
| Additions based on tax positions related to the current year |
148 | |||
| Additions for tax positions of prior years |
— | |||
| Decreases for tax positions of prior years due to revaluation of positions |
— | |||
| Decreases for tax positions of prior years due to lapse of statutes |
(93 | ) | ||
|
|
|
|||
| Balance at December 27, 2014 |
$ | 459 | ||
|
|
|
The Company recognizes interest related to uncertain tax positions in income tax expense. The Company is no longer subject to U.S. federal examinations by tax authorities for years before 2011 and for state examinations before 2008. However, the tax authorities still have the ability to review the relevance of net operating loss carryforwards created in closed years if such tax attributes are utilized in open years (subsequent to 2008).
The Company has domestic (U.S. state) and foreign net operating losses of approximately $1.4 million and $3.8 million at December 27, 2014, against which a full valuation allowance is recorded. Domestic net operating losses generated in the state of New Jersey will continue to expire annually through Fiscal 2030. The Company’s foreign net operating loss is generated through operations in Canada, and will expire in Fiscal 2034.
10. Stock Based Compensation
Equity Incentive Plans—The Company has two equity incentive plans that provide stock based compensation to certain directors, officers, consultants and employees of the Company; the 2006 Stock Option Plan (the “2006 Plan”) and the Vitamin Shoppe 2009 Equity Incentive Plan (the “2009 Plan”), under which the Company has granted stock options (includes non-qualified as well as performance based stock options), restricted shares (includes time based as well as performance based restricted shares) and restricted share units. The issuance of up to 7,453,678 shares of common stock is authorized under these plans. As of December 27, 2014, there were 2,454,029 shares available to grant under both plans. Restricted shares and restricted share units are issued at a value not less than the fair market value of the common shares on the date of the grant and stock options are exercisable at no less than the fair market value of the underlying shares on the date of grant. Equity awards of restricted shares generally shall become vested between two and four years subsequent to the date on which such equity grants were awarded. Generally, stock options awarded shall become vested in four equal increments on each of the first, second, third and fourth anniversaries of the date on which such equity grants were awarded and generally have a maximum term of 10 years. However, regarding performance based restricted shares and performance based stock options, vesting is dependent not only on the passage of time, but also on the attainment of certain internal performance metrics. The vesting requirements for performance based restricted shares and performance based stock options permit a catch-up of vesting at the end of the vesting period. For accounting purposes, the expense for performance based stock options and performance based restricted shares is calculated and recorded, based on the determination that the achievement of the pre-established performance targets are probable, over the relevant service period. Restricted share units generally shall become vested one year subsequent to the date on which such equity grants were awarded.
The following table summarizes restricted shares for the 2009 Plan as of December 27, 2014 and changes during Fiscal 2014:
60
Table of Contents
| Number of Unvested Restricted Shares |
Weighted Average Grant Date Fair Value |
|||||||
| Unvested at December 28, 2013 |
396,360 | $ | 43.83 | |||||
| Granted |
188,515 | $ | 44.51 | |||||
| Vested |
(121,573 | ) | $ | 39.65 | ||||
| Canceled/forfeited |
(14,691 | ) | $ | 50.33 | ||||
|
|
|
|||||||
| Unvested at December 27, 2014 |
448,611 | $ | 45.04 | |||||
|
|
|
|||||||
The following table summarizes stock options for the 2006 and 2009 Plans as of December 27, 2014 and changes during Fiscal 2014:
| Number of Options |
Weighted Average Exercise Price |
Weighted Average Remaining Contractual Life (years) |
Aggregate Intrinsic Value (in thousands) |
|||||||||||||
| Outstanding at December 28, 2013 |
938,664 | $ | 19.92 | |||||||||||||
| Granted |
— | — | ||||||||||||||
| Exercised |
(553,974 | ) | $ | 16.96 | ||||||||||||
| Canceled/forfeited |
(1,113 | ) | $ | 37.71 | ||||||||||||
|
|
|
|||||||||||||||
| Outstanding at December 27, 2014 |
383,577 | $ | 24.14 | 4.10 | $ | 8,917 | ||||||||||
|
|
|
|
|
|
|
|
|
|||||||||
| Vested or expected to vest at December 27, 2014 |
362,672 | $ | 24.14 | 4.10 | ||||||||||||
|
|
|
|
|
|
|
|
|
|||||||||
| Vested and exercisable at December 27, 2014 |
338,118 | $ | 22.35 | 3.79 | $ | 8,433 | ||||||||||
|
|
|
|
|
|
|
|
|
|||||||||
The total intrinsic value of options exercised during Fiscal 2014, Fiscal 2013 and Fiscal 2012 was $16.0 million, $6.1 million and $34.2 million, respectively. The cash received from options exercised during Fiscal 2014, Fiscal 2013 and Fiscal 2012 was $9.4 million, $3.5 million and $11.2 million, respectively.
The following table summarizes restricted share units for the 2009 Plan as of December 27, 2014 and changes during Fiscal 2014:
| Number of Unvested Restricted Share Units |
Weighted Average Grant Date Fair Value |
|||||||
| Unvested at December 28, 2013 |
6,414 | $ | 56.08 | |||||
| Granted |
9,633 | $ | 51.37 | |||||
| Vested |
(6,414 | ) | $ | 56.08 | ||||
| Canceled/forfeited |
— | — | ||||||
|
|
|
|||||||
| Unvested at December 27, 2014 |
9,633 | $ | 51.37 | |||||
|
|
|
|||||||
Compensation expense attributable to stock-based compensation for Fiscal 2014 was $6.9 million, for Fiscal 2013 was $8.3 million and for Fiscal 2012 was $6.5 million. As of December 27, 2014, the remaining unrecognized stock based compensation expense for non-vested stock options, restricted shares and restricted share units to be expensed in future periods is $8.2 million, and the related weighted average period over which it is expected to be recognized is 1.5 years. Forfeitures are estimated at the time of grant and revised, if necessary, in subsequent periods if actual forfeitures differ from those estimates. The Company estimates forfeitures based on its historical forfeiture rate since the inception of granting stock based awards. The estimated value of future forfeitures for stock options, restricted shares and restricted share units as of December 27, 2014 is approximately $1.6 million.
61
Table of Contents
The weighted average grant date fair value of stock options was $18.99, $23.76 and $23.20 for Fiscal 2014, Fiscal 2013 and Fiscal 2012, respectively. These valuations represent the fair value of subsequent annual tranches of performance based stock option grants. The fair value of each option grant was estimated on the date of grant using the Black-Scholes option-pricing model with the following assumptions:
| Fiscal Year Ended | ||||||||||||
| December 27, 2014 | December 28, 2013 | December 29, 2012 | ||||||||||
| Expected dividend yield |
0.0 | % | 0.0 | % | 0.0 | % | ||||||
| Weighted average expected volatility |
35.3 | % | 39.0 | % | 44.6 | % | ||||||
| Weighted average risk-free interest rate |
1.4 | % | 0.6 | % | 1.0 | % | ||||||
| Expected holding period(s) |
4.00 - 4.43 years | 4.00 - 4.93 years | 4.50 - 6.25 years | |||||||||
Treasury Stock—As part of the Company’s stock plans, the Company makes required tax payments on behalf of employees as their restricted shares vest. The Company withholds the number of vested shares having a value on the date of vesting equal to the minimum statutory tax obligation. The shares withheld are recorded as treasury shares. During Fiscal 2014, the Company purchased 51,140 shares in settlement of employees’ tax obligations for a total of $2.4 million. The Company accounts for treasury stock using the cost method.
11. Share Repurchase Program
In 2014, the Company’s board of directors approved a share repurchase program that enables the Company to purchase up to $100 million of its shares of common stock from time to time over a three year period. As of December 27, 2014, 1,183,714 shares have been repurchased for a total of $57.8 million. The repurchase program does not obligate the Company to acquire any specific number of shares of its common stock and may be suspended, terminated or modified at any time for any reason, including market conditions, the cost of repurchasing such shares, the availability of alternative investment opportunities, liquidity, and other factors deemed appropriate. These factors may also affect the timing and amount of share repurchases.
During the third quarter of Fiscal 2014, the Company repurchased 201,000 shares of its common stock in the open market, which were retired upon repurchase. The total purchase price was $7.8 million with an average repurchase price per share of $38.88.
Additionally, the Company entered into an accelerated share repurchase arrangement (“ASR”) with a financial institution beginning in November 2014. In exchange for an up-front payment of $50.0 million, the financial institution initially delivered 982,714 shares of the Company’s common stock. The total number of shares ultimately delivered, and therefore the average repurchase price paid per share, is determined at the end of the purchase period of the ASR based on the volume weighted-average price of the Company’s common stock during that period. The purchase period of the ASR ended in January 2015 at which time the financial institution delivered an additional 88,325 shares of the Company’s common stock. The average repurchase price per share under the ASR was $46.68. The shares were retired in the periods they were delivered, and the up-front payment is accounted for as a reduction to stockholders’ equity in the Company’s Consolidated Balance Sheet in the period the payment was made. The Company reflects the ASR as a repurchase of common stock in the period delivered for purposes of calculating earnings per share and as a forward contract indexed to its own common stock. The ASR met all of the applicable criteria for equity classification, and therefore, was not accounted for as a derivative instrument.
12. Benefit Plans
The Company sponsors the Vitamin Shoppe Industries, Inc. 401(k) Plan (“401k Plan”). Employees who have completed one month of service are eligible to participate in the 401k Plan. The 401k Plan provides for participant contributions of 1% to 100% of participant compensation into deferred savings, subject to IRS limitations. The 401k Plan provides for Company contributions upon the participant meeting the eligibility requirements. Participants are 100% vested in the Company matching contribution upon receipt. The Company matching contribution is 100% of the first 3% of participant compensation contributed to the 401k Plan and 50% of the next 2% of participant compensation contributed to the 401k Plan. The Company may make discretionary contributions for each 401k Plan year.
The Company recognized expenses for the 401k Plan of $1.6 million in Fiscal 2014 and $1.5 million in both Fiscal 2013 and Fiscal 2012.
The Company has a Non-qualified Deferred Compensation Plan (“DC Plan”). The DC Plan allowed participants the opportunity to defer pretax amounts up to 75% of base salary and up to 100% of other eligible compensation. The DC Plan was primarily funded by elective contributions made by the participants. The Company elected to finance any potential DC Plan benefit obligation using corporate owned life insurance policies. The assets of the DC Plan were $2.7 million and $2.5 million at December 27, 2014 and December 28, 2013, respectively. Accordingly, gains and losses on the underlying investments, which are held in a Rabbi Trust, are recognized in the consolidated statements of income. The liabilities for the DC Plan were $2.3 million and $2.6 million at December 27, 2014 and December 28, 2013, respectively. In December 2013, the Compensation Committee of the Company’s Board of Directors passed a resolution to discontinue and unwind the DC Plan. The termination of the DC Plan, which occurred in January 2015, did not have a material impact on the Company’s results of operations, financial condition or cash flows.
62
Table of Contents
13. Lease Commitments
The Company has non-cancelable real estate operating leases, which expire through 2036. These leases generally contain renewal options for periods ranging from 1 to 10 years and require the Company to pay costs such as real estate taxes and common area maintenance. Contingent rentals are paid based on a percentage of gross sales as defined by lease agreements. The following table provides the net rental expense for all real estate operating leases (in thousands):
| Fiscal Year Ended | ||||||||||||
| December 27, 2014 |
December 28, 2013 |
December 29, 2012 |
||||||||||
| Minimum rentals |
$ | 107,456 | $ | 97,332 | $ | 86,178 | ||||||
| Contingent rentals |
103 | 110 | 15 | |||||||||
|
|
|
|
|
|
|
|||||||
| 107,559 | 97,442 | 86,193 | ||||||||||
| Less: Sublease rentals |
(245 | ) | (244 | ) | (248 | ) | ||||||
|
|
|
|
|
|
|
|||||||
| Net rental expense |
$ | 107,314 | $ | 97,198 | $ | 85,945 | ||||||
|
|
|
|
|
|
|
|||||||
The Company recorded charges of $0.4 million in Fiscal 2012 for lease termination costs related to the closing of one retail location, which is included in selling, general and administrative expenses in the consolidated statements of income.
As of December 27, 2014, the Company’s real estate lease commitments are as follows (in thousands):
| Fiscal year | Total Operating Leases (1) |
|||
| 2015 |
115,345 | |||
| 2016 |
112,584 | |||
| 2017 |
102,968 | |||
| 2018 |
88,419 | |||
| 2019 |
71,215 | |||
| Thereafter |
213,502 | |||
|
|
|
|||
| $ | 704,033 | |||
|
|
|
|||
| (1) | Store operating leases included in the above table do not include contingent rent based upon sales volume. Operating leases do not include common area maintenance costs or real estate taxes that are paid to the landlord during the year, which combined represented approximately 16.5% of our minimum lease obligations for Fiscal 2014. In addition, not included are variable activity based fees associated with our west coast logistics facility, which were approximately $2.3 million during Fiscal 2014. |
14. Legal Proceedings
The Company is party to various lawsuits arising from time to time in the normal course of business, many of which are covered by insurance. As of December 27, 2014, the Company was not party to any material legal proceedings. Although the impact of the final resolution of these matters on the Company’s financial condition, results of operations or cash flows is not known, management does not believe that the resolution of these lawsuits will have a material adverse effect on the financial condition, results of operations or liquidity of the Company.
15. Segment and Product Data
The Company currently operates three business segments, retail, direct and manufacturing. The operating segments are segments of the Company for which separate financial information is available and for which operating results are evaluated regularly by executive management in deciding how to allocate resources and in assessing performance. The Company’s management evaluates segment operating results based on several indicators. The primary key performance indicators are sales and operating income for each segment. The table below represents key financial information for each of the Company’s business segments as well as corporate costs. The retail segment primarily includes the Company’s retail stores. The retail segment generates revenue primarily through the sale of VMS products through
63
Table of Contents
Vitamin Shoppe, Super Supplements and Vitapath retail stores in the United States, Puerto Rico and in Canada. The direct segment generates revenue through the sale of VMS products primarily through the Company’s websites and catalog. The Company’s websites offer customers online access to a full assortment of approximately 25,000 SKUs. The manufacturing segment supplies the retail and direct segments, along with various thirds parties, with finished products for sale. Corporate costs represent all other expenses not allocated to the retail, direct or manufacturing segments which include, but are not limited to: human resources, legal, retail management, direct management, finance, information technology, depreciation and amortization, and various other corporate level activity related expenses. Intercompany sales transactions are eliminated in consolidation.
The Company’s segments are designed to allocate resources internally and provide a framework to determine management responsibility. The Company has allocated $165.3 million, $45.3 million and $32.6 million of its recorded goodwill to the retail, direct and manufacturing segments, respectively. The Company does not have identifiable assets separated by segment, with the exception of the identifiable assets of the manufacturing segment, which were $96.2 million as of December 27, 2014. Capital expenditures for the manufacturing segment from the acquisition date of June 6, 2014 through December 27, 2014 were approximately $0.5 million. At December 27, 2014, long lived assets of the manufacturing segment were $59.9 million.
The following table contains key financial information of the Company’s business segments (in thousands):
| Fiscal Year Ended | ||||||||||||
| December 27, 2014 |
December 28, 2013 |
December 29, 2012 |
||||||||||
| Net sales: |
||||||||||||
| Retail |
$ | 1,042,054 | $ | 969,610 | $ | 849,765 | ||||||
| Direct |
130,644 | 117,859 | 101,137 | |||||||||
| Manufacturing |
48,102 | — | — | |||||||||
|
|
|
|
|
|
|
|||||||
| Segment net sales |
1,220,800 | 1,087,469 | 950,902 | |||||||||
| Elimination of intersegment revenues |
(7,754 | ) | — | — | ||||||||
|
|
|
|
|
|
|
|||||||
| Net sales |
1,213,046 | 1,087,469 | 950,902 | |||||||||
|
|
|
|
|
|
|
|||||||
| Income from operations: |
||||||||||||
| Retail |
194,864 | 192,439 | 173,300 | |||||||||
| Direct |
22,755 | 21,930 | 19,588 | |||||||||
| Manufacturing (1) |
(1,830 | ) | — | — | ||||||||
| Corporate costs (2) |
(113,133 | ) | (104,077 | ) | (93,516 | ) | ||||||
|
|
|
|
|
|
|
|||||||
| Income from operations |
$ | 102,656 | $ | 110,292 | $ | 99,372 | ||||||
|
|
|
|
|
|
|
|||||||
| (1) | Income from operations for the manufacturing segment includes $4.5 million in charges related to the inventory valuation step up for inventory sold subsequent to the acquisition of Nutri-Force. |
| (2) | Corporate costs include (in thousands): |
| Fiscal Year Ended | ||||||||||||
| December 27, 2014 |
December 28, 2013 |
December 29, 2012 |
||||||||||
| Depreciation and amortization expenses |
$ | 32,968 | $ | 28,026 | $ | 23,076 | ||||||
| Acquisition and integration costs |
4,777 | 4,336 | 1,281 | |||||||||
| Contingent consideration for Nutri-Force acquisition |
959 | — | — | |||||||||
| Insurance recoveries from Superstorm Sandy |
— | (1,079 | ) | — | ||||||||
64
Table of Contents
The following table represents net merchandise sales by major product category (in thousands):
| Product Category |
Fiscal Year Ended | |||||||||||
| December 27, 2014 (a) |
December 28, 2013 |
December 29, 2012 |
||||||||||
| Vitamins, Minerals, Herbs and Homeopathy |
$ | 285,775 | $ | 276,447 | $ | 243,910 | ||||||
| Sports Nutrition |
428,845 | 393,659 | 339,359 | |||||||||
| Specialty Supplements |
313,025 | 305,320 | 274,307 | |||||||||
| Other |
182,352 | 109,554 | 91,109 | |||||||||
|
|
|
|
|
|
|
|||||||
| Total |
1,209,997 | 1,084,980 | 948,685 | |||||||||
| Delivery Revenue |
3,049 | 2,489 | 2,217 | |||||||||
|
|
|
|
|
|
|
|||||||
| $ | 1,213,046 | $ | 1,087,469 | $ | 950,902 | |||||||
|
|
|
|
|
|
|
|||||||
| (a) | In Fiscal 2014, the “Other” product category includes net merchandise sales to third parties of Nutri-Force of $40.3 million. |
For each of the last three years, less than 1.0% of our sales have been derived from international sources.
16. Fair Value of Financial Instruments
The fair value hierarchy requires the categorization of assets and liabilities into three levels based upon the assumptions (inputs) used to price the assets or liabilities. Level 1 provides the most reliable measure of fair value, while Level 3 generally requires significant management judgment. The three levels are defined as follows:
| • | Level 1: Unadjusted quoted prices in active markets for identical assets and liabilities. |
| • | Level 2: Observable inputs other than those included in Level 1. For example, quoted prices for similar assets or liabilities in active markets or quoted prices for identical assets or liabilities in inactive markets. |
| • | Level 3: Unobservable inputs reflecting management’s own assumptions about the inputs used in pricing the asset or liability. |
The Company’s cash equivalents include approximately $1.0 million in investments such as commercial paper, debt securities and money market funds that are recorded at fair value on a recurring basis. The fair value of these financial instruments is based upon quoted prices in active markets. The Company’s financial instruments also consist of cash and certificates of deposit, accounts receivable, accounts payable and its revolving credit facility. The Company believes that the recorded values of its financial instruments approximate their fair values due to their nature and respective durations.
The fair value of the contingent consideration for the Nutri-Force acquisition of $5.0 million as of December 27, 2014 is considered level 3 in the fair value hierarchy.
17. Selected Quarterly Financial Information (unaudited)
The following table summarizes the Fiscal 2014 and Fiscal 2013 quarterly results (in thousands, except for share data):
65
Table of Contents
| Fiscal Quarter Ended | ||||||||||||||||
| March | June | September | December | |||||||||||||
| Fiscal Year Ended December 27, 2014 |
||||||||||||||||
| Net sales |
$ | 307,836 | $ | 306,218 | $ | 308,910 | $ | 290,082 | ||||||||
| Gross profit |
109,469 | 102,907 | 97,294 | 94,589 | ||||||||||||
| Income from operations |
34,247 | 28,166 | 20,549 | 19,694 | ||||||||||||
| Net income |
20,509 | 16,926 | 12,197 | 11,609 | ||||||||||||
| Net income per common share: |
||||||||||||||||
| Basic |
$ | 0.68 | $ | 0.56 | $ | 0.40 | $ | 0.39 | ||||||||
| Diluted |
$ | 0.67 | $ | 0.55 | $ | 0.40 | $ | 0.38 | ||||||||
| Fiscal Year Ended December 28, 2013 |
||||||||||||||||
| Net sales |
$ | 279,087 | $ | 279,483 | $ | 272,472 | $ | 256,427 | ||||||||
| Gross profit |
101,642 | 97,257 | 93,053 | 85,694 | ||||||||||||
| Income from operations |
34,681 | 30,584 | 26,102 | 18,925 | ||||||||||||
| Net income |
20,797 | 18,262 | 16,268 | 11,219 | ||||||||||||
| Net income per common share: |
||||||||||||||||
| Basic |
$ | 0.70 | $ | 0.61 | $ | 0.54 | $ | 0.37 | ||||||||
| Diluted |
$ | 0.68 | $ | 0.60 | $ | 0.53 | $ | 0.37 | ||||||||
The following table summarizes non-operating items for Fiscal 2014 and Fiscal 2013 which impacted quarterly results on a pre-tax basis (in thousands):
| Fiscal Quarter Ended | ||||||||||||||||
| March | June | September | December | |||||||||||||
| Fiscal Year Ended December 27, 2014 |
||||||||||||||||
| Acquisition and integration costs |
$ | 1,758 | $ | 2,248 | $ | 289 | $ | 482 | ||||||||
| Inventory valuation step-up recognized in cost of goods sold |
— | 1,200 | 3,306 | — | ||||||||||||
| Contingent consideration for Nutri-Force acquisition |
— | — | — | 959 | ||||||||||||
| Fiscal Year Ended December 28, 2013 |
||||||||||||||||
| Acquisition and integration costs |
$ | 2,045 | $ | 946 | $ | 868 | $ | 477 | ||||||||
| Insurance recoveries from Superstorm Sandy |
(200 | ) | (879 | ) | — | — | ||||||||||
66