Attached files
| file | filename |
|---|---|
| EXCEL - IDEA: XBRL DOCUMENT - HOME PROPERTIES INC | Financial_Report.xls |
| EX-11 - EX-11 - HOME PROPERTIES INC | a14-25081_1ex11.htm |
| EX-21 - EX-21 - HOME PROPERTIES INC | a14-25081_1ex21.htm |
| EX-99 - EX-99 - HOME PROPERTIES INC | a14-25081_1ex99.htm |
| EX-31.1 - EX-31.1 - HOME PROPERTIES INC | a14-25081_1ex31d1.htm |
| EX-32.1 - EX-32.1 - HOME PROPERTIES INC | a14-25081_1ex32d1.htm |
| EX-31.2 - EX-31.2 - HOME PROPERTIES INC | a14-25081_1ex31d2.htm |
| EX-32.2 - EX-32.2 - HOME PROPERTIES INC | a14-25081_1ex32d2.htm |
| EX-23 - EX-23 - HOME PROPERTIES INC | a14-25081_1ex23.htm |
UNITED STATES
SECURITIES AND EXCHANGE COMMISSION
Washington, D.C. 20549
FORM 10-K
|
þ |
ANNUAL REPORT PURSUANT TO SECTION 13 OR 15(d) OF THE SECURITIES EXCHANGE ACT OF 1934 |
|
For the fiscal year ended December 31, 2014 | |
|
¨ |
TRANSITION REPORT PURSUANT TO SECTION 13 OR 15(d) OF THE SECURITIES EXCHANGE ACT OF 1934 |
COMMISSION FILE NUMBER: 1-13136
HOME PROPERTIES, INC.
(EXACT NAME OF REGISTRANT AS SPECIFIED IN ITS CHARTER)
|
MARYLAND |
|
16-1455126 |
|
(State of incorporation) |
|
(I.R.S. Employer Identification No.) |
850 Clinton Square, Rochester, New York 14604
(Address of principal executive offices)(Zip Code)
Registrant’s telephone number, including area code: (585) 546-4900
Securities registered pursuant to Section 12(b) of the Act:
|
Title of each class |
|
Name of each exchange on which registered |
|
Common Stock, $0.01 par value |
|
New York Stock Exchange |
Securities registered pursuant to section 12(g) of the Act: None
Indicate by check mark if the registrant is a well-known seasoned issuer, as defined in Rule 405 of the Securities Act.
|
|
Yes |
þ |
|
No |
¨ |
|
Indicate by check mark if the registrant is not required to file reports pursuant to Section 13 or 15(d) of the Act.
|
|
Yes |
¨ |
|
No |
þ |
|
Indicate by check mark whether the registrant (1) has filed all reports required to be filed by Section 13 or 15(d) of the Securities Exchange Act of 1934 during the preceding 12 months (or for such shorter period that the registrant was required to file such reports), and (2) has been subject to such filing requirements for the past 90 days.
|
|
Yes |
þ |
|
No |
¨ |
|
Indicate by check mark whether the registrant has submitted electronically and posted on its corporate website, if any, every Interactive Data File required to be submitted and posted pursuant to Rule 405 of Regulation S-T (§232.405 of this chapter) during the preceding 12 months (or for such shorter period that the registrant was required to submit and post such files).
|
|
Yes |
þ |
|
No |
¨ |
|
Indicate by check mark if disclosure of delinquent filers pursuant to Item 405 of Regulation S-K (§229.405 of this chapter) is not contained herein, and will not be contained, to the best of registrant’s knowledge, in definitive proxy or information statements incorporated by reference in Part III of this Form 10-K or any amendment to this Form 10-K. þ
Indicate by check mark whether the registrant is a large accelerated filer, an accelerated filer, non-accelerated filer or a smaller reporting company. See definition of “large accelerated filer”, “accelerated filer” and “smaller reporting company” in Rule 12b-2 of the Exchange Act. (Check one):
|
Large accelerated filer þ |
Accelerated filer ¨ |
Non-accelerated filer ¨ |
Smaller reporting company ¨ |
Indicate by check mark whether the registrant is a shell company (as defined in Rule 12b-2 of the Act).
|
|
Yes |
¨ |
|
No |
þ |
|
As of June 30, 2014, the aggregate market value of the 56,586,875 shares of common stock held by non-affiliates was $3,619,296,525 based on the last reported closing sale price of $63.96 per share on the New York Stock Exchange on June 30, 2014.
As of February 11, 2015, there were 57,789,541 shares of common stock, $0.01 par value, outstanding.
DOCUMENTS INCORPORATED BY REFERENCE
|
Document |
Part Into Which Incorporated |
|
Proxy Statement for the Annual Meeting of Stockholders to be held on April 28, 2015 |
Part III |
HOME PROPERTIES, INC.
Forward-Looking Statements
This Form 10-K contains forward-looking statements within the meaning of Section 27A of the Securities Act of 1933 and Section 21E of the Securities Exchange Act of 1934. Our actual results could differ materially from those set forth in each forward-looking statement. Certain factors that might cause such a difference are discussed in this report, including in the section entitled “Forward-Looking Statements” on page 59 of this Form 10-K.
The Company
Home Properties, Inc. (“Home Properties” or the “Company”) was formed in November 1993 as a Maryland corporation. Home Properties is a self-administered and self-managed real estate investment trust (“REIT”) that owns, operates, acquires and repositions apartment communities in suburbs of major metropolitan areas, primarily along the East Coast of the United States. The Company completed an initial public offering of 5,408,000 shares of common stock (the “IPO”) on August 4, 1994 and is traded on the New York Stock Exchange (“NYSE”) under the symbol “HME”. The Company is included in S&P’s MidCap 400 Index.
The Company conducts its business through Home Properties, L.P. (the “Operating Partnership”), a New York limited partnership, and a management company, Home Properties Resident Services, Inc. (“HPRS”), a Maryland corporation. At December 31, 2014, the Company held 85.2% (84.8% at December 31, 2013) of the limited partnership units in the Operating Partnership (“UPREIT Units”).
Home Properties, through its affiliates described above, owned and operated 121 communities with 42,107 apartment units (the “Communities” or the “Properties”) as of December 31, 2014:
|
|
|
Apartment | ||||
|
Market Area |
Communities |
Units | ||||
|
Washington, D.C. |
|
28 |
|
|
11,221 |
|
|
Baltimore |
|
23 |
|
|
10,477 |
|
|
Philadelphia |
|
20 |
|
|
5,859 |
|
|
Long Island |
|
14 |
|
|
3,586 |
|
|
Northern New Jersey |
|
13 |
|
|
3,578 |
|
|
Boston |
|
13 |
|
|
3,556 |
|
|
Chicago |
|
8 |
|
|
2,994 |
|
|
Southeast Florida |
|
2 |
|
|
836 |
|
|
Totals |
|
121 |
|
|
42,107 |
|
The Company’s mission is to maximize long-term shareholder value by acquiring, repositioning, managing and owning market-rate apartment communities while enhancing the quality of life for our residents and providing employees with opportunities for growth and accomplishment. Our vision is to be a prominent owner and manager of market-rate apartment communities located in high barrier, high growth markets. We expect to maintain or grow portfolios in markets that profitably support our mission as economic conditions permit.
The Company (continued)
The Company’s long-term business strategies include:
· proactively managing and improving our communities to increase net operating income;
· acquiring additional apartment communities with attractive returns at prices that provide a positive spread over the Company’s long-term cost of capital;
· disposing of properties that have reached their potential, are less efficient to operate, or are located in markets where growth has slowed to a pace below that of the markets targeted for acquisition; and
· maintaining a strong and flexible capital structure with cost-effective access to the capital markets.
Structure
The Company was formed in November 1993 as a Maryland corporation and is the general partner of the Operating Partnership. On December 31, 2014, it held an 85.2% partnership interest in the Operating Partnership comprised of: a 1.0% interest as sole general partner; and an 84.2% limited partner interest through its wholly owned subsidiary, Home Properties I, LLC, which owns 100% of Home Properties Trust, the actual limited partner of the Operating Partnership. The holders of the remaining 14.8% of the UPREIT Units are certain individuals and entities who received UPREIT Units as consideration for their interests in entities owning apartment communities purchased by the Operating Partnership, including certain officers of the Company.
The Operating Partnership is a New York limited partnership formed in December 1993. Holders of UPREIT Units in the Operating Partnership may redeem an UPREIT Unit for one share of the Company’s common stock or cash equal to the fair market value at the time of the redemption, at the option of the Company. Management expects that it will continue to utilize UPREIT Units as a form of consideration for a portion of its acquisition properties when it is economical to do so.
HPRS is wholly owned by the Operating Partnership, and as a result, the accompanying consolidated financial statements include the accounts of both companies. HPRS is a taxable REIT subsidiary under the Tax Relief Extension Act of 1999.
In September 1997, Home Properties Trust (“the QRS”) was formed as a Maryland real estate trust and as a qualified REIT subsidiary. The QRS is wholly owned by Home Properties I, LLC which is owned 100% by the Company. The QRS is a limited partner of the Operating Partnership and holds all of the Company’s interest in the Operating Partnership, except for the 1% held directly by the Company as sole general partner.
The Company currently has approximately 1,200 employees and its executive offices are located at 850 Clinton Square, Rochester, New York 14604. Its telephone number is (585) 546-4900.
Operating Strategies
The Company will continue to focus on enhancing long-term investment returns by:
· acquiring apartment communities and repositioning them for long-term growth at prices that provide a positive spread over the Company’s long-term cost of capital;
· recycling assets by disposing of properties in low-growth markets and those that have reached their potential or are less efficient to operate due to size or remote location;
· balancing a decentralized property management philosophy with the efficiencies of centralized support functions and accountability, including rent optimization and volume purchasing;
· enhancing the quality of living for residents by improving service and physical amenities at each community in an environmentally responsible manner;
· adopting new technology to minimize time and cost of administration and maximize efforts to attract and serve residents;
· utilizing its written “Pledge” of customer satisfaction, the foundation on which the Company’s brand was built; and
· focusing on expense control while improving the level of service to residents.
The Company has a strategy of acquiring mature C/B- apartment communities and repositioning them to B/B+ properties. Since its 1994 IPO, the Company has acquired and redeveloped 224 communities, containing approximately 63,000 units. The repositioning process targets a minimum 10% cash-on-cash return on investment. It is expected that capital expenditures in 2015 for repositioning activities will be in-line with 2014 levels, as residents continue to prefer an upgraded apartment at a higher monthly rent in a recovering economic environment.
As a result of the Company’s long and successful history in the redevelopment of apartment communities, our employees have significant design and construction management skills. The complete repositioning of a community can take place over a five to seven year period. The comprehensive process typically begins with improvements in landscaping, signage and common areas. Exterior improvements increase curb appeal and marketability of the property. Deferred maintenance is corrected, which can include new HVAC systems, roofs, balconies and windows. At many properties, community centers and swimming pools are added or upgraded. Apartment interiors are renovated when residents move out, with the most significant investments made in the upgrade of kitchens and baths. Complete remodeling of dated kitchens and bathrooms typically includes new appliances, flooring, counters, cabinets, lighting, tile, fixtures, sinks, bathtubs and toilets. It may include the removal of kitchen walls to create an open concept living space. When feasible, in-unit washers and dryers are added. Repositioning efforts significantly increase a property’s rental income, net operating income and market value.
Acquisition, Disposition and Development Strategies
The Company’s strategy is to grow primarily through acquisitions in the suburbs of major metropolitan markets that are near public transportation and major highways and have significant barriers to new construction, limited new apartment supply, easy access to the Company’s headquarters and sufficient apartments available for acquisition to achieve a critical mass. Other characteristics of targeted markets include: acquisition opportunities below replacement costs, a mature housing stock, high average single-family home prices, a favorable supply/demand relationship, stable or moderate job growth, reduced vulnerability to economic downturns and large prime renter populations including immigrants and young adults in their twenties and early thirties.
The Company currently expects its growth to occur within its eight existing markets. The Company’s largest markets include the suburbs of Baltimore, Boston, New York City, Philadelphia and Washington, D.C. Continued geographic specialization is expected to have a greater impact on operating efficiencies as compared to the widespread accumulation of properties. The Company will continue to pursue the acquisition of individual properties as well as multi-property portfolios. It may also consider strategic investments in other apartment companies, as well as strategic alliances.
During 2014, the Company acquired three communities in suburban Philadelphia and Chicago with a total of 1,052 units for an aggregate consideration of $142 million, or an average of approximately $134,500 per apartment unit. The weighted average expected first year capitalization rate for the acquired communities was 6.3%. Capitalization rate (“cap rate”) is defined as the rate of interest used to convert the first year expected net operating income (“NOI”) less a 2.7% management fee into a single present value. NOI is defined by the Company as rental income and property other income less operating and maintenance expenses. For a reconciliation of NOI to income from continuing operations, please refer to Note 12 to Consolidated Financial Statements, under Part IV, Item 15 of this Form 10-K.
The Company believes that it will have the opportunity to make acquisitions during 2015 and has projected $250 million to $350 million in purchases for the year.
The Company sold three communities in 2014 with a total of 1,527 units for approximately $217 million, resulting in a weighted average unlevered internal rate of return (“IRR”) of 10.0%. IRR is defined as the discount rate at which the present value of the future cash flows of the investment is equal to the cost of the investment. The Company sold four communities in 2013 with a total of 1,013 units for approximately $192 million, resulting in a weighted average IRR of 11.3%. The Company has identified additional communities for sale in 2015 and will continue to evaluate the sale of its communities. The Company expects to dispose of between $100 million and $200 million of properties in 2015. Typically, a property will be targeted for sale if management believes that it has reached its potential or if it is located in a slower growth market or is less efficient to operate.
The Company announced in July 2014 that it was exiting the business of developing new apartment communities. The two projects currently under construction will be completed - Eleven55 Ripley in Silver Spring, Maryland and The Courts at Spring Mill Station in Conshohocken, Pennsylvania. No additional new apartment communities will be started. Land parcels that will not be developed are being marketed for sale.
Management believes it is in the best interest of the Company’s stockholders to dissolve the new development platform and focus 100% on the Company’s core differentiating strategy of acquiring and redeveloping mature apartment communities. This change in strategy is a positive one as it simplifies the investment story for the Company, reduces risk, and allows management to spend more time on what the Company does best - own, operate, acquire, and reposition Class C/B apartment communities.
Financing and Capital Strategies
The Company intends to continue to adhere to the following financing policies:
· maintaining a ratio of debt-to-total value (total debt of the Company as a percentage of the value (using the Company’s value as calculated under the terms of the line of credit facility)) of approximately 38.0% or less;
· utilizing primarily fixed rate debt;
· varying debt maturities to avoid significant exposure to interest rate changes upon refinancing; and
· maintaining a line of credit so that it can respond quickly to acquisition opportunities.
On December 31, 2014, the Company’s debt was approximately $2.5 billion and the debt-to-total market capitalization ratio was 35.6% based on the year-end closing price of the Company’s common stock of $65.60. The weighted average interest rate on the Company’s mortgage debt as of December 31, 2014 was 5.17% and the weighted average maturity was approximately three and a half years. Debt maturities are staggered. Excluding the Company’s line of credit and 180-day bank term loan balance as of December 31, 2014, an average of 14.3% of loans mature each of the next seven years ranging from a high of 24.3% in 2018 to a low of 8.7% in 2017. As of December 31, 2014, the Company had a $450 million unsecured line of credit facility with M&T Bank and U.S. Bank National Association (acting as joint lead banks) and nine other participating commercial banks with $269 million outstanding on the line of credit.
The Company further strengthened its balance sheet and increased its financial flexibility during 2014 as follows:
· The Company received a published investment grade credit rating of BBB from Standard & Poor’s Ratings Services to complement its existing Baa2 rating from Moody’s Investor Services and BBB rating from Fitch Ratings.
· The Company increased the value of unencumbered properties in relationship to the total property portfolio from 47.8% to 52.8%. This higher level adds flexibility, allowing the Company to place additional unsecured financing or increase secured borrowing on unencumbered assets.
· The Government Sponsored Enterprises (“GSEs”) Fannie Mae and Freddie Mac are still active lending to apartment owners. However, no secured debt was added during 2014, except for one loan assumed in conjunction with a property acquisition. The Company paid off approximately $180 million of mortgage debt in 2014 with a weighted average interest rate of 4.30%.
Financing and Capital Strategies (continued)
The capital market initiatives described above allowed the Company to achieve stronger key debt and credit metrics at December 31, 2014 versus December 31, 2013 as follows:
· total debt to value was reduced to 38.0% from 38.5%; (1)
· total secured debt to value was reduced to 25.3% from 28.4%; (1)
· net debt to EBITDA (net income before interest expense, income taxes, depreciation and amortization) was reduced to 6.0 times from 6.1 times;
· interest coverage ratio was increased to 4.0 times from 3.5 times;
· fixed charge coverage ratio increased to 3.7 times from 3.3 times; and
· the value of the unencumbered asset pool was increased to $3.4 billion from $3.0 billion; or to 52.8% from 47.7% of total value, respectively. (1)
(1) Value as calculated under the terms of the line of credit facility.
For 2015, the Company plans to continue to increase the level of the value of unencumbered properties to approximately 58% of the portfolio, maintaining the debt-to-total value ratio at a level equal to or slightly less than the level at December 31, 2014 and utilizing more unsecured debt with minimal reliance on new secured debt.
Management expects to continue to fund a portion of its continued growth by taking advantage of its UPREIT structure and using UPREIT Units as currency in acquisition transactions. It is difficult to predict the level of demand from sellers for this type of transaction. In periods when the Company’s stock price is trading at a discount to estimated net asset value (“NAV”) per share, it is unlikely that management would engage in UPREIT transactions.
The Company’s strategy is to opportunistically repurchase shares at a discount to its estimated NAV, thereby continuing to build value for long-term shareholders. The last year where the Company repurchased any shares under this program was 2008. At December 31, 2014, there was approval remaining to purchase 2.3 million shares. Management does not anticipate making share repurchases in 2015.
Competition
The Company’s properties are primarily located in developed areas where there are other multifamily properties which directly compete for residents. There is also limited competition from single family homes and condominiums for sale or rent. The competitive environment may have a detrimental effect on the Company’s ability to lease apartments at existing and newly developed properties, as well as on rental rates.
In addition, the Company competes with other real estate investors in seeking property for acquisition. These competitors include pension and investment funds, insurance companies, private investors, local owners and developers, and other apartment REITs. This competition could increase prices for properties that the Company would like to purchase and impact the Company’s ability to achieve its long-term growth targets.
The Company believes, however, that it is well-positioned to compete effectively for both residents and properties as a result of its:
· focus on service and resident satisfaction, as evidenced by both The Home Properties Pledge, which provides a money-back service guarantee and lease flexibility, and by its resident turnover ratio which is consistently below the industry average;
· ability to issue UPREIT Units in purchase transactions, which provides sellers with the opportunity to defer taxes; and
· unique repositioning strategy that differentiates the Company from its competitors.
Market Environment
The markets in which Home Properties operates could be characterized long term as stable, with moderate levels of job growth. After a recessionary period, starting in 2010 and expected to continue through 2015, many regions of the United States have been experiencing varying degrees of economic recovery resulting in improving job growth for both the country as a whole and the Company’s markets.
In 2013, job growth in the Company’s markets was slightly behind the U.S. average with 1.2% job growth versus 1.6%, respectively. In 2014, job growth in the Company’s markets continued to lag the U.S. average with a 1.2% growth rate versus 2.3%. However, the unemployment rate for the Company’s markets of 5.1% continues to compare favorably to the country average of 5.4%. The Company’s Boston, MA market experienced the lowest unemployment rate of 4.2%. This market represents 8.4% of the Company’s total apartment unit count. Unemployment in the Company’s largest market, Northern VA/DC with 26.6% of the Company’s total apartment units, dropped from 4.6% at December 31, 2013 to 4.5% at December 31, 2014 and remains well below the country average. These two markets represent a combined 35% of the Company’s total units with an unemployment rate below 5.0% as of December 31, 2014.
New construction in the Company’s markets is low relative to the existing multifamily housing stock and compared to other regions of the country. In 2014, Home Properties’ markets represented 28.0% of the total estimated existing U.S. multifamily housing stock, but only 20.9% of the country’s estimated new supply of multifamily housing units.
The information on the “Market Demographics and Multifamily Supply and Demand” tables on pages 10 and 11 were compiled by the Company from the sources indicated on the tables. The methods used include estimates and, while the Company feels that the estimates are reasonable, there can be no assurance that the estimates are accurate. There can also be no assurance that the historical information included on the tables will be consistent with future trends.
An analysis of multifamily supply compared to multifamily demand can indicate whether a particular market is tightening, softening or in equilibrium. The fourth to last column in the “Multifamily Supply and Demand” table on page 11 reflects current estimated net new multifamily supply as a percentage of new multifamily demand for the Company’s markets and the United States. For both the Company’s markets and the country as a whole, net new supply is low compared to expected new demand. For the country, net new supply represents 64.1% of net new demand, creating an environment where both pricing and/or occupancy are expected to remain stable with room for some improvement. The relationship in the Company’s markets is even better, where net new supply after obsolescence is expected to meet only 55.8% of the expected increasing demand for rental housing.
Market Demographics
|
|
|
|
|
|
|
|
|
|
|
|
|
|
|
|
|
2014 |
|
|
|
|
|
|
|
|
|
|
|
|
|
|
|
|
|
|
|
Multifamily |
|
|
|
|
|
|
|
|
|
|
|
|
|
|
|
|
|
2014 |
|
Units as a % |
|
2014 |
|
|
|
|
|
% of |
|
2014 |
|
2014 |
|
2014 vs. 2013 |
|
December 2014 |
|
Median |
|
of Total |
|
Multifamily |
|
|
|
|
|
Company |
|
Number of |
|
Job |
|
Job Growth |
|
Unemployment |
|
Home |
|
Housing Units |
|
Housing |
|
CBSA Market Area |
|
HME Region |
|
Units |
|
Households |
|
Growth |
|
% Change |
|
Rate |
|
Value |
|
Stock (5) |
|
Stock (6) |
|
Northern VA/DC |
|
Washington, D.C. |
|
26.6% |
|
2,221,454 |
|
20,800 |
|
0.7% |
|
4.5% |
|
372,468 |
|
29.9% |
|
707,425 |
|
Baltimore, MD |
|
Baltimore |
|
24.9% |
|
1,066,538 |
|
21,900 |
|
1.6% |
|
5.5% |
|
279,248 |
|
20.0% |
|
232,410 |
|
Suburban New York City (1) |
|
Long Island/Northern NJ |
|
17.0% |
|
7,323,215 |
|
129,000 |
|
1.5% |
|
5.6% |
|
401,799 |
|
37.0% |
|
2,952,288 |
|
Eastern PA (2) |
|
Philadelphia |
|
14.0% |
|
2,616,156 |
|
25,300 |
|
0.8% |
|
5.0% |
|
239,329 |
|
15.3% |
|
431,558 |
|
Boston, MA (3) |
|
Boston |
|
8.4% |
|
2,038,895 |
|
53,900 |
|
1.9% |
|
4.2% |
|
339,325 |
|
21.9% |
|
484,484 |
|
Chicago, IL |
|
Chicago |
|
7.1% |
|
3,531,674 |
|
40,000 |
|
0.9% |
|
5.6% |
|
222,691 |
|
24.9% |
|
966,497 |
|
Southeast Florida (4) |
|
Southeast Florida |
|
2.0% |
|
2,202,598 |
|
72,800 |
|
3.0% |
|
5.6% |
|
185,634 |
|
38.6% |
|
993,701 |
|
Home Properties Markets |
|
|
|
100.0% |
|
21,000,530 |
|
363,700 |
|
1.2% |
|
5.1% |
|
318,580 |
|
29.4% |
|
6,768,363 |
|
United States |
|
|
|
|
|
120,163,305 |
|
3,156,000 |
|
2.3% |
|
5.4% |
|
182,060 |
|
17.8% |
|
24,187,011 |
(1) Suburban New York City is defined for this report as New York-Northern New Jersey-Long Island, NY-NJ-PA Core Based Statistical Area (CBSA).
(2) Eastern Pennsylvania is defined for this report as Philadelphia-Camden-Wilmington, PA-NJ-DE-MD CBSA & Allentown-Bethlehem-Easton PA-NJ CBSA.
(3) Boston, MA is defined for this report as Boston-Cambridge-Quincy, MA CBSA & Portland-South Portland-Biddeford, ME CBSA.
(4) Southeast Florida is defined for this report as Miami-Fort Lauderdale-Miami Beach, FL CBSA.
(5) Based on The Nielsen Company 2014 estimates calculated from the 2010 U.S. Census figures.
(6) 2014 Multifamily Housing Stock is from The Nielsen Company estimates of five or more units based on the 2010 U.S. Census.
Sources: Bureau of Labor Statistics (BLS); The Nielsen Company (Nielsen); US Census Bureau - Manufacturing & Construction Div.
Data collected is data available as of February 5, 2015 and in some cases may be preliminary.
BLS is the principal fact-finding agency for the Federal Government in the broad field of labor economics and statistics.
Nielsen is a leading provider of precision marketing solutions and related products and services.
U.S. Census Bureau’s parent Federal agency is the U.S. Dept. of Commerce, which promotes American business and trade.
Multifamily Supply and Demand
|
|
|
|
|
|
|
|
|
|
|
|
|
Estimated |
|
Estimated |
|
|
|
|
|
|
|
|
|
|
|
|
|
|
|
Estimated |
|
Net New |
|
Net New |
|
|
|
|
|
|
|
|
|
Estimated |
|
|
|
Estimated |
|
2014 |
|
Multifamily |
|
Multifamily |
|
|
|
|
|
|
|
|
|
2014 |
|
Estimated |
|
2014 |
|
New |
|
Supply as a |
|
Supply as a |
|
|
|
Expected |
|
|
|
|
|
New |
|
2014 |
|
Net New |
|
Multifamily |
|
% of New |
|
% of |
|
Expected |
|
Excess |
|
|
|
|
|
Supply of |
|
Multifamily |
|
Multifamily |
|
Household |
|
Multifamily |
|
Multifamily |
|
Excess |
|
Revenue |
|
CBSA Market Area |
|
HME Region |
|
Multifamily (7) |
|
Obsolescence (8) |
|
Supply (9) |
|
Demand (10) |
|
Demand |
|
Stock |
|
Demand (11) |
|
Growth (12) |
|
Northern VA/DC |
|
Washington, D.C. |
|
11,847 |
|
3,537 |
|
8,310 |
|
4,149 |
|
200.3% |
|
1.2% |
|
(4,161) |
|
(0.6%) |
|
Baltimore, MD |
|
Baltimore |
|
2,267 |
|
1,162 |
|
1,105 |
|
2,917 |
|
37.9% |
|
0.5% |
|
1,812 |
|
0.8% |
|
Suburban New York City (1) |
|
Long Island/Northern NJ |
|
32,078 |
|
14,761 |
|
17,317 |
|
31,829 |
|
54.4% |
|
0.6% |
|
14,512 |
|
0.5% |
|
Eastern PA (2) |
|
Philadelphia |
|
6,399 |
|
2,158 |
|
4,241 |
|
2,575 |
|
164.7% |
|
1.0% |
|
(1,666) |
|
(0.4%) |
|
Boston, MA (3) |
|
Boston |
|
6,662 |
|
2,422 |
|
4,240 |
|
7,868 |
|
53.9% |
|
0.9% |
|
3,628 |
|
0.7% |
|
Chicago, IL |
|
Chicago |
|
7,046 |
|
4,832 |
|
2,214 |
|
6,656 |
|
33.3% |
|
0.2% |
|
4,442 |
|
0.5% |
|
Southeast Florida (4) |
|
Southeast Florida |
|
9,260 |
|
4,969 |
|
4,291 |
|
18,744 |
|
22.9% |
|
0.4% |
|
14,453 |
|
1.5% |
|
Home Properties Markets |
|
|
|
75,559 |
|
33,841 |
|
41,718 |
|
74,738 |
|
55.8% |
|
0.6% |
|
33,020 |
|
0.5% |
|
United States |
|
|
|
361,679 |
|
120,935 |
|
240,744 |
|
375,328 |
|
64.1% |
|
1.0% |
|
134,584 |
|
0.6% |
(1)-(6) see footnotes on prior page
(7) Estimated 2014 New Supply of Multifamily = Multifamily permits (2014 figures U.S. Census Bureau, Mfg. & Constr. Div., 5+ permits only) adjusted by the average % of permits resulting in a construction start (estimated at 95%).
(8) Estimated 2014 Multifamily Obsolescence = Estimated 2014 Multifamily Housing Stock multiplied by the estimated % of obsolescence (0.5%).
(9) Estimated 2014 Net New Multifamily Supply = Estimated 2014 New Supply of Multifamily - Estimated 2014 Multifamily Obsolescence.
(10) Estimated 2014 New Multifamily Household Demand = 2014 job growth (Nonfarm, not seasonally adjusted payroll employment figures) (12/31/2013-12/31/2014) multiplied by the expected % of new household formations resulting from new jobs (66.7%) and the % of multifamily households in each market (based on Nielsen estimates).
(11) Expected Excess Demand = Estimated 2014 New Multifamily Household Demand - Estimated 2014 Net New Multifamily Supply.
(12) Expected Excess Revenue Growth = Expected Excess Demand divided by 2014 Multifamily Housing Stock. This percentage is expected to reflect the relative impact that changes in the supply and demand for multifamily housing units will have on occupancy rates and/or rental rates in each market, beyond the impact caused by broader economic factors, such as inflation and interest rates.
Environmental Matters
As a current or prior owner, operator and developer of real estate, the Company is subject to various federal, state and local environmental laws, regulations and ordinances and also could be liable to third parties as a result of environmental contamination or noncompliance at its properties. See the discussion under the caption, “We may incur costs due to environmental contamination or non-compliance that could adversely affect our financial results and reputation” in Item 1A, Risk Factors, for information concerning the potential effect of environmental regulations on the Company’s operations.
Available Information
The Company’s annual reports on Form 10-K, quarterly reports on Form 10-Q, current reports on Form 8-K and other reports required by Sections 13(a) and 15(d) of the Securities Exchange Act of 1934, as amended (collectively, the “Reports”), are electronically filed with the Securities and Exchange Commission (“SEC”). The public may read and copy any materials the Company files with the SEC at the SEC’s Public Reference Room at 100 F Street NE, Washington, DC 20549-2521. Please call the SEC at 1-800-732-0330 for further information on the operation of the Public Reference Room. The SEC maintains a website at www.sec.gov that contains reports, proxy and information statements, and other information regarding issuers that file electronically with the SEC, which are available without charge.
Company Website
The Company maintains an Internet website at www.homeproperties.com. The Company provides free-of-charge access to its Reports filed with the SEC, and any amendments thereto, through this website. These Reports are available as soon as reasonably practicable after the Reports are filed electronically with the SEC and are found under “Investors/SEC Filings.” In addition, a paper copy of the Reports filed with the SEC may be obtained at no charge by contacting the Corporate Secretary, Home Properties, Inc., 850 Clinton Square, Rochester, New York 14604.
Current copies of the Company’s Code of Business Conduct and Ethics, Code of Ethics for Senior Financial Officers with Certification, Corporate Governance Guidelines and Charters for the Audit, Compensation, Corporate Governance/Nominating and Real Estate Investment Committees of the Board are also available on the Company’s website under the heading “Investors/Corporate Overview/Governance Documents Highlights.” A copy of these documents is also available at no charge upon request by contacting the Corporate Secretary at Home Properties, Inc., 850 Clinton Square, Rochester, New York 14604.
The reference to our website does not incorporate by reference the information contained in the website and such information should not be considered a part of this report.
As used in this section, references to “we” or “us” or “our” refer to the Company, the Operating Partnership, and HPRS, taken as a whole.
Our business is subject to uncertainties and risks. Please carefully consider the risk factors described below, which apply to Home Properties, the Operating Partnership, and HPRS, in addition to other risks set forth in this Form 10-K. Additional risks and uncertainties not presently known to us or that we currently deem immaterial may also impair our business or prospects. The risk factors we describe contain or refer to certain forward-looking statements. You should review the explanation of the limitations of forward-looking statements contained in the section entitled “Forward-Looking Statements” on page 59 of this Form 10-K.
Real Estate Investment Risks
We are subject to risks that are part of owning residential real estate.
Real property investments are subject to varying degrees of risk. If our communities do not generate revenues sufficient to meet operating expenses, debt service and capital expenditures, our cash flow and ability to make distributions to our stockholders will be adversely affected. A multifamily apartment community’s revenues and value may be adversely affected by general economic conditions (including unemployment and erosion in the credit quality of the renter pool); local and regional economic conditions (including population shifts); local and regional real estate considerations (such as oversupply of or reduced demand for apartments); changes in home ownership or condominium affordability; the perception by prospective residents of the convenience and attractiveness of the communities or neighborhoods in which they are located and the quality of local schools and other amenities; and increased operating costs (including real estate taxes and utilities). Certain significant fixed expenses are generally not reduced when circumstances cause a reduction in income from a community.
We depend on rental income for cash flow to pay expenses and make distributions.
We are dependent on rental income from our multifamily properties to pay operating expenses, debt service and capital expenditures, and in order to generate cash to enable us to make distributions to our stockholders. If we are unable to attract and retain residents or if our residents are unable, due to an adverse change in the economic condition of the region or otherwise, to pay their rental obligations, our financial results and our ability to make expected distributions will be adversely affected. In addition, the weather and other factors outside of our control can result in an increase in the operating expenses for which we are responsible.
An increase in operating expenses, including real estate taxes, would negatively affect our financial results.
Unanticipated increases in real estate taxes and other unanticipated or increased operating expenses cannot always be passed through to residents in the form of higher rents and may adversely affect financial results and our ability to make expected distributions.
Attractive acquisitions may not be available and acquisitions we may be able to make may fail to meet expectations.
We plan to continue to selectively acquire apartment communities that meet our investment criteria. We expect that other real estate investors, including insurance companies, pension funds, other REITs and other well-capitalized private investors will compete with us to acquire multifamily properties. This competition could increase prices for properties of the type we would likely pursue and adversely affect our growth, profitability and current strategy of targeting a similar range of acquisitions and dispositions. If we are able to make acquisitions, there are risks that those acquisitions will perform less favorably than we expect. Our estimates of future income, expenses and the costs of improvements or redevelopment that are necessary to allow us to operate an acquired property as originally intended may prove to be inaccurate. Other acquisition risks include environmental issues, tax reassessments, structural issues, competition, economic submarket changes and employment variables.
Real Estate Investment Risks (continued)
Real estate investments are relatively illiquid, and we may not be able to respond to changing conditions quickly.
Real estate investments are relatively illiquid and, therefore, we have limited ability to adjust our portfolio quickly in response to changes in economic or other conditions. In addition, the prohibition in the Internal Revenue Code (the “Code”) on REITs holding property for sale and related regulations may affect our ability to sell properties without adversely affecting distributions to stockholders. A number of our properties were acquired using UPREIT Units and four of those properties are still subject to certain agreements which may restrict our ability to sell such properties in transactions that would create current taxable income to the former owners.
Possible difficulties in selling apartment communities could limit our flexibility.
We have identified certain of our communities that we intend to sell in 2015. We may encounter difficulty in finding buyers in a timely manner who are willing to pay acceptable prices for these communities. If we are unable to sell apartment communities or if we can only sell them at prices lower than are expected, then we may have to take on additional leverage in order to provide adequate capital to execute our strategies.
Competition could limit our ability to lease apartments or increase or maintain rents.
Our apartment communities compete with other housing alternatives to attract residents, including other rental apartments, condominiums and single-family homes that are available for rent, as well as new and existing condominiums and single-family homes for sale. Competitive residential housing in a particular area could adversely affect our ability to lease apartment units and to increase or maintain rental rates. The recent challenges in the credit and housing markets have increased single-family housing inventory that may compete with our properties.
Repositioning and development risks could affect our profitability.
A key component of our strategy is to acquire properties and to reposition them for long-term growth. In addition, while we have made a decision to no longer include development of new properties as a strategy, we have one new development property that is in the process of being completed and another new development property that is substantially completed but has not achieved full lease up. Repositioning activities may require various governmental and other approvals, which have no assurance of being received. Our repositioning and limited remaining development activities generally entail certain risks, including the following:
· funds may be expended and management’s time devoted to projects that may not be completed due to a variety of factors, including without limitation, the inability to obtain necessary zoning or other approvals;
· construction costs of a project may exceed original estimates, possibly making the economic return on a repositioned or developed property less than anticipated;
· occupancy rates and rents at a completed development project or at a repositioned property may be less than anticipated; and
· the operating expenses may be higher than anticipated.
If any of these risks materialized, the effect may negatively impact our financial results and reduce the funds available for distribution to our stockholders. Further, the repositioning and development of properties is also subject to the general risks associated with real estate investments.
Real Estate Investment Risks (continued)
Short-term leases expose us to the effects of declining market conditions.
Virtually all of the leases for our properties are short-term leases (generally, one year or less). Typically, our residents can leave after the end of a one-year lease term. As a result, our rental revenues are impacted by declines in market conditions more quickly than if our leases were for longer terms.
A significant uninsured property or liability loss could have a material adverse effect on our financial condition and results of operations.
The Company carries commercial general liability, property and business interruption insurance with respect to our properties on terms we consider commercially reasonable. There are however certain types of extraordinary losses, such as losses for certain natural catastrophes and relating to environmental contamination, that are not insured, in full or part, because they are either uninsurable or the cost of insurance makes it, in management’s view, economically impractical. If an uninsured loss occurred, we could incur significant expense. As a result of a catastrophic uninsured event impacting an entire property, we could lose our investment in and cash flow from, the affected property, and could be required to repay any indebtedness secured by that property and related taxes and other charges. If an uninsured liability to a third party were to occur, we would incur the cost of defense and/or settlement with or court ordered damages to, that third party.
Insurance costs and policy deductibles expose us to unpredictable expenses which may be material.
As of December 31, 2014, the Company’s property insurance policies provide for a per occurrence deductible of $50,000 until exhaustion of $2.25 million annual aggregate self-insured retention, and then $100,000 per occurrence deductible. Earthquake, named windstorm, and flood losses are subject to higher deductibles but are not subject to the aggregate self-insured retention. Should a covered claim exceed these deductibles and self-insured retention, it would be 100% covered by insurance. The Company’s general liability policies provide for a self-insured retention of $100,000 per occurrence and its workers’ compensation policies contains a $250,000 per claim deductible. These large deductible and self-insured retention amounts expose the Company to greater potential uninsured losses. Management believes that this exposure is justified by savings in insurance premium amounts and, in some cases, was necessary for the Company to secure coverage. However, the potential impact of poor claims experience could cause a significant increase in insurance premiums and deductibles or a decrease in the availability of coverage, either or which could expose the Company to even greater uninsured losses.
The Company also maintains a $50 million stand-alone terrorism policy with a $25,000 per occurrence deductible in regard to property damage and business interruption combined.
The Company is subject to increased exposure to economic and other competitive factors due to concentration of its Properties in certain markets.
At December 31, 2014, approximately 26.6%, 24.9%, 14.0%, 8.5% and 8.5% (on an apartment unit basis) of the Company’s Properties are located in the Washington, D.C., Baltimore, Philadelphia, Long Island and Northern New Jersey markets, respectively. The Company’s current strategy is to reduce its concentration in the Washington, D.C. market to approximately 25%. If any one or more of such core markets is adversely affected by local or regional deteriorating economic conditions or other factors, the adverse impact on our results of operations could be greater than if our portfolio was more geographically diverse.
Real Estate Investment Risks (continued)
Changes in applicable laws, or noncompliance with applicable laws, could adversely affect our operations or expose us to liability.
We must operate our properties in compliance with numerous federal, state and local laws and regulations, including landlord tenant laws and other laws generally applicable to business operations. Noncompliance with laws could expose us to liability.
Compliance with changes in: (i) laws increasing the potential liability for environmental conditions existing on properties or the restrictions on discharges or other conditions; (ii) rent control or rent stabilization laws; or (iii) other governmental rules and regulations or enforcement policies affecting the use and operation of our communities, including changes to building codes and fire and life-safety codes, may result in lower revenue growth or significant unanticipated expenditures.
We may incur costs and increased expenses to repair property damage resulting from inclement weather.
In every market we are exposed to risks associated with inclement weather, including increased costs for the removal of snow and ice. In addition, in all of our markets, we have exposure to severe storms which also could increase the need for maintenance and repair of our communities.
We may incur increased costs resulting from the climate change regulations and the occurrence of climate change could adversely affect our financial results.
Various treaties, laws and regulations result in increased capital expenditures to improve the energy efficiency of our properties and may have been adopted relating to climate change. The Company believes these laws being enacted or proposed may cause energy and waste removal costs at our properties to increase. We do not expect the direct impact of these increases to be material to our results of operations. Increased costs relating to energy either would be the responsibility of our residents directly or in large part may be passed through by us to our residents through the utility recovery programs. We may be able to pass increased waste removal costs on to our residents directly or in the form of increased rental rates. If this is not possible, it is still not expected that these additional costs would affect the Company’s financial performance in any material way. To the extent that climate change does occur, we may experience extreme weather and changes in precipitation and temperature, all of which may result in physical damage or a decrease in demand for properties located in these areas or affected by these conditions. Should the impact of climate change be material in nature, including destruction of our properties, or occur for lengthy periods of time, our financial condition or results of operations may be adversely affected.
We may incur costs due to environmental contamination or non-compliance that could adversely affect our financial results and reputation.
Under various federal, state and local environmental laws, regulations and ordinances, we may be required, regardless of knowledge or responsibility, to investigate and remediate the effects of hazardous or toxic substances at our properties and may be held liable under these laws or common law to a governmental entity or to third parties for property, personal injury or natural resources damages and for investigation and remediation costs incurred as a result of the contamination. These damages and costs may be substantial. The presence of such substances, or the failure to properly remediate the contamination, may adversely affect our ability to borrow against, sell or rent the affected property.
The operation of our communities is subject to regulations and permitting under various federal, state and local laws, regulations and ordinances, which regulate matters including wetlands protection, storm water runoff and wastewater discharge. Noncompliance with such laws and regulations may subject us to fines and penalties. We do not currently anticipate that we will incur any material liabilities as a result of noncompliance with these laws.
Real Estate Investment Risks (continued)
We may incur costs due to environmental contamination or non-compliance that could adversely affect our financial results and reputation (continued).
Certain federal, state and local laws, regulations and ordinances govern the removal, encapsulation or disturbance of asbestos containing materials (“ACMs”) when such materials are in poor condition or in the event of renovation or demolition of a building. These laws and the common law may impose liability for release of ACMs and may allow third parties to seek recovery from owners or operators of real properties for personal injury associated with exposure to ACMs. ACMs are present at some of our communities. We implement an operations and maintenance program at each of the communities at which ACMs are detected. We do not currently anticipate that we will incur any material liabilities as a result of the presence of ACMs at our communities.
We are aware that some of our communities have or may have lead paint and have implemented an operations and maintenance program at each of those communities to contain, remove or test for lead paint to limit the exposure of our residents. At some of our properties, we are required by federal law to provide lead-based paint disclosures to our residents. Failure to comply with the federal notification requirement can result in a penalty. We do not currently anticipate that we will incur any material liabilities as a result of the presence of lead-based paint at our communities or the failure to provide disclosures.
Mold growth may occur when excessive moisture accumulates in buildings or on building materials, particularly if the moisture problem remains undiscovered or is not addressed over a period of time. Although the occurrence of mold at multifamily and other structures, and the need to remediate such mold, is not a new phenomenon, there has been increased awareness in recent years that certain molds may in some instances lead to adverse health effects, including allergic or other reactions. This has resulted in an increasing number of lawsuits against owners and managers of multifamily properties. Insurance companies have reacted by excluding mold-related claims from existing policies and pricing mold endorsements at prohibitively high rates. We have adopted programs designed to minimize any impact mold might have on our residents and our properties. However, if mold should become an issue in the future, our financial condition or results of operations may be adversely affected.
All of our communities have been subjected to at least a Phase I or similar environmental assessment, which generally does not involve invasive techniques such as soil or ground water sampling. These assessments, together with subsurface assessments conducted on some of our properties, have not revealed, and we are not otherwise aware of, any environmental conditions that we believe would have a material adverse effect on our business, assets, financial condition or results of operation. However, there is no assurance that Phase I assessments would reveal all environmental liabilities. In addition, environmental conditions not known to the Company may exist now or in the future which could result in liability to the Company for remediation or fines or to third parties for property or personal injury damages, either under existing laws and regulations or future changes to such requirements.
On a limited basis, we previously were involved in managing, leasing and operating various properties for third parties. Consequently, we may be considered to have been an operator of such properties and, therefore, potentially liable for removal or remediation costs or other potential costs which could relate to hazardous or toxic substances. We are not aware of any material environmental liabilities with respect to properties managed by us for such third parties.
Financing Risks
We are subject to general risks related to debt.
We are subject to the customary risks associated with debt financing. For example, if a property is mortgaged to secure payment of indebtedness and we are unable to meet its debt service obligations, the property could be foreclosed upon. This could adversely affect our cash flow and, consequently, the amount available for distributions to stockholders.
Financing Risks (continued)
We may not be able to obtain refinancing at favorable rates.
Because a significant amount of our financing is not fully self-amortizing, we anticipate that only a portion of the principal of our indebtedness will be repaid prior to maturity. Accordingly, we will need to refinance debt and there is a risk that we will not be successful in refinancing existing indebtedness or that the terms of such refinancing will not be as favorable as the terms of the existing indebtedness. If principal payments due at maturity cannot be refinanced, extended or paid with proceeds of other capital transactions, such as new equity capital, our operating cash flow will not be sufficient in all years to repay all maturing debt. As a result, certain of our other debt may cross default, we may be forced to postpone capital expenditures necessary for the maintenance of our properties, we may have to dispose of one or more properties on terms that would otherwise be unacceptable to us or we may be forced to allow the mortgage holder to foreclose on a property. Foreclosure on mortgaged properties or an inability to refinance existing indebtedness would likely have a negative impact on our financial condition and results of operations.
Financing may not be available and issuing equity could dilute our stockholders’ interests.
Our ability to execute our business strategy depends on our access to an appropriate blend of debt financing, including unsecured lines of credit and other forms of secured and unsecured debt, and equity financing, including common and preferred equity. Debt or equity financing may not be available in sufficient amounts, or on favorable terms or at all. If we issue additional equity securities instead of incurring debt, the interests of our existing stockholders could be diluted.
Disruptions in the financial markets could adversely affect our ability to obtain debt financing and impact our acquisitions and dispositions.
In periods when the capital and credit markets experience significant volatility, the amounts, sources and cost of capital available to us may be adversely affected. We primarily use external financing to fund acquisitions, our re-positioning program and to refinance indebtedness as it matures. If sufficient sources of external financing are not available to us on cost effective terms, we could be forced to limit our planned activity and/or take other actions to fund our business activities and repayment of debt such as selling assets, reducing our cash dividend or paying out less than 100% of our taxable income. To the extent that we are able and/or choose to access capital at a higher cost than we have experienced in recent years (reflected in higher interest rates for debt financing or a lower stock price for equity financing) our earnings per share and cash flows could be adversely affected. Uncertainty in the credit markets also could negatively impact our ability to make acquisitions and make it more difficult or not possible for us to sell properties or may adversely affect the price we receive for properties that we do sell, as prospective buyers may experience increased costs of debt financing or difficulties in obtaining debt financing.
Potential continued disruptions in the financial markets could also have other unknown adverse effects on us or the economy generally and may cause the price of our securities to fluctuate significantly and/or to decline.
Failure to maintain our current credit ratings could adversely affect our cost of funds, liquidity and access to capital markets.
There are three rating agencies that have assigned an issuer credit rating to the Company. These ratings are based on a number of factors, which include their assessment of our financial strength, liquidity, capital structure, and sustainability of cash flow and earnings, among other factors. If market conditions change, we may not be able to maintain our current ratings, which could adversely affect our cost of funds, liquidity and access to capital markets.
Financing Risks (continued)
Potential reduction or elimination of the role that Fannie Mae and Freddie Mac play in the multifamily financing sector may negatively impact the multifamily sector and our ability to obtain financing.
Fannie Mae and Freddie Mac (the “GSEs”) are a major source of financing for secured multifamily real estate. We have used the GSEs for a portion of our financing needs. There is significant uncertainty surrounding the future of the GSEs. A final decision by the government to eliminate the GSEs or to change their mandate may adversely affect interest rates and capital availability and the value of multifamily communities.
The Company in part relies on its line of credit to meet its short-term liquidity requirements.
As of December 31, 2014, the Company had an unsecured line of credit agreement of $450 million with an initial maturity date of August 18, 2017, and a one-year extension, at the Company’s option. The Company had $269 million outstanding under the credit facility on December 31, 2014. We believe that the lenders under our line of credit will fulfill their obligations thereunder, but if economic conditions deteriorate or the financial condition of our lenders is otherwise negatively affected, there can be no assurance that the ability of those lenders to fulfill their obligations would not be adversely affected.
The credit agreement relating to the line of credit requires the Company to maintain certain financial covenants, ratios and measurements. Maintaining compliance with these covenants could limit our flexibility. In addition, a default in these requirements, if uncured, could result in a termination of the line of credit and a requirement that we repay outstanding amounts, which could adversely affect our liquidity and increase our financing costs.
Failure to comply with the financial covenants relating to our unsecured debt could result in a default and early repayment of the loans.
In addition to the line of credit, as of December 31, 2014, the Company had $550 million of unsecured debt outstanding. These loans require the Company to maintain some of the same covenants, ratios and measurements as under the line of credit. A default in any of these requirements could result in a default of these unsecured loans and a requirement that the loan be repaid early. This could adversely affect our liquidity and result in increased financing costs.
Rising interest rates could adversely affect operations and cash flow.
As of December 31, 2014, approximately 84% of our debt was at fixed rates. This limits our exposure to changes in interest rates. Prolonged interest rate increases, however, could negatively affect our ability to make acquisitions, dispose of properties at favorable prices, or reposition properties and refinance existing borrowings at acceptable rates.
Failure to hedge effectively against interest rates may adversely affect results of operations.
We have in the past and may in the future manage our exposure to interest rate volatility by using interest rate hedging arrangements, such as interest rate cap agreements and rate swap agreements. These agreements involve risks, such as the risk that the counterparties may fail to honor their obligations under these arrangements and that these arrangements may reduce the benefits to us if interest rates decline. Failure to hedge effectively against interest rate changes could have a negative impact on our financial performance and our ability to make distributions to our shareholders and pay amounts due on our debt.
Financing Risks (continued)
There is no legal limit on the amount of debt we can incur.
The Board has adopted a policy of limiting our indebtedness to approximately 55% of our total market capitalization (with the equity component of total market capitalization based on the per share NAV presented to our Board at its most recent Board meeting), but our organizational documents do not contain any limitation on the amount or percentage of indebtedness we may incur. Accordingly, the Board could alter or eliminate its current policy on borrowing. If this policy were changed, we could become more highly leveraged, resulting in an increase in debt service costs that could adversely affect our ability to make expected distributions to stockholders and increase the risk of default on our indebtedness. Our NAV fluctuates based on a number of factors. Our line of credit agreement limits the amount of indebtedness we may incur.
Other Risks
The loss of members of key personnel could negatively affect the Company’s performance.
Our success depends in part on our ability to attract and retain the services of executive officers and other personnel. Our executive officers make important capital allocation and other significant decisions or recommendations to our Board of Directors. There is substantial competition for qualified personnel in the real estate industry, and the loss of several of our key personnel could adversely affect the Company.
Breaches of our data security could materially harm our business and reputation.
Information security risks have generally increased in recent years due to the rise in new technologies and the increased sophistication and activities of perpetrators of cyber attacks. We collect and retain certain personal information provided by our residents and employees. In addition, we engage third party service providers that may have access to such personal information in connection with providing necessary information technology and security and other business services to us. We have implemented a variety of security measures to protect the confidentiality of this information and periodically test and verify the proper and secure operation of these measures. However, there can be no assurance that we will be able to prevent unauthorized access to this information. A failure in or breach of our operational or information security systems, or those of our third party service providers, as a result of cyber attacks or information security breaches could result in a wide range of potentially serious harm to our business operations and financial prospects, including (among others) disruption of our business and operations, disclosure or misuse of confidential or proprietary information (including personal information of our residents and/or employees), damage to our reputation, and/or potentially significant legal and/or financial liabilities.
Emerging technologies, if not adopted properly, and internet viruses could negatively impact our business.
Despite a robust governance structure developed around the use of technology, adoption of emerging technologies in an improper or inefficient manner might place Company data, systems and productivity at risk, as well as potentially introduce legal and regulatory compliance issues. This could be related to new technology that is configured or deployed incorrectly or is not managed appropriately (whether by us or by a vendor). In addition, the Company could suffer internet interruptions due to malicious software or viruses. This could temporarily negatively affect various operations and productivity.
Other Risks (continued)
The ability of our stockholders to effect a change of control is limited by certain provisions of our Articles of Incorporation as well as by Maryland law and our executive retention plan.
Our Amended and Restated Articles of Incorporation, as amended (the “Articles of Incorporation”), authorize the Board to issue up to a total of 160 million shares of common stock, 10 million shares of excess stock and 10 million shares of preferred stock and to establish the rights and preferences of any shares issued. Further, under the Articles of Incorporation, the stockholders do not have cumulative voting rights.
In order for us to maintain our qualification as a REIT, not more than 50% in value of our outstanding stock may be owned, directly or indirectly, by five or fewer individuals (including certain entities) at any time during the last half of its taxable year. We have limited ownership of the issued and outstanding shares of common stock by any single stockholder to 8% of the aggregate value of our outstanding shares.
The percentage ownership limit described above, the issuance of preferred stock in the future and the absence of cumulative voting rights could have the effect of: (i) delaying or preventing a change of control even if a change in control were in the stockholders’ interest; (ii) deterring tender offers for our common stock that may be beneficial to the stockholders; or (iii) limiting the opportunity for stockholders to receive a premium for their common stock that might otherwise exist if an investor attempted to assemble a block of our common stock in excess of the percentage ownership limit or otherwise to effect a change of control.
As a Maryland corporation, we are subject to the provisions of the Maryland General Corporation Law. Maryland law imposes restrictions on some business combinations and requires compliance with statutory procedures before some mergers and acquisitions may occur, which may delay or prevent offers to acquire us or increase the difficulty of completing any offers, even if they are in our stockholders’ best interests. In addition, other provisions of the Maryland General Corporation Law permit the Board of Directors to make elections and to take actions without stockholder approval (such as classifying our Board such that the entire Board is not up for re-election annually) that, if made or taken, could have the effect of discouraging or delaying a change in control.
Also, to assure that our management has appropriate incentives to focus on our business and properties in the face of a change of control situation, we have adopted an executive retention plan which provides some key employees with salary, bonus and some benefits continuation in the event of a change of control.
The future sale of shares under our At-The-Market offering may negatively impact our stock price.
Beginning in 2009, the Company made the necessary filings with the Securities and Exchange Commission to institute the sale of its common shares from time to time in “at the market offerings” or negotiated transactions (the “ATM”). As of December 31, 2014, approximately 2.0 million shares remain available under the current filings relating to the ATM. If authorized by its Board of Directors, the Company, in the future could affect additional filings to register additional common shares for sale under the ATM. Sales of substantial amounts of shares of common stock in the public market or the perception that such sales might occur could adversely affect the market price of the common stock.
Federal Income Tax Risks
There is no assurance that we will continue to qualify as a REIT.
We believe that we have been organized and have operated in such manner so as to qualify as a REIT under the Code, commencing with our taxable year ended December 31, 1994. A REIT generally is not taxed at the corporate level on income it currently distributes to its shareholders as long as it distributes currently at least 90% of its taxable income (excluding net capital gains). No assurance can be provided, however, that we have qualified or will continue to qualify as a REIT or that new legislation, Treasury Regulations, administrative interpretations or court decisions will not significantly change the tax laws with respect to our qualification as a REIT or the federal income tax consequences of such qualification.
Federal Income Tax Risks (continued)
We are required to make certain distributions to qualify as a REIT, and there is no assurance that we will have the funds necessary to make the distributions.
In order to continue to qualify as a REIT, we currently are required each year to distribute to our stockholders at least 90% of our taxable income (excluding net capital gains). In addition, we will be subject to a 4% nondeductible excise tax on the amount, if any, by which certain distributions made by us with respect to the calendar year are less than the sum of 85% of our ordinary income, 95% of our capital gain net income for that year, and any undistributed taxable income from prior periods. We intend to make distributions to our stockholders to comply with the 90% distribution requirement and to avoid the nondeductible excise tax and will rely for this purpose on distributions from the Operating Partnership. However, differences in timing between taxable income and cash available for distribution could require us to borrow funds or to issue additional equity to enable us to meet the 90% distribution requirement (and, therefore, to maintain our REIT qualification) and to avoid the nondeductible excise tax. The Operating Partnership is required to pay (or reimburse us, as its general partner, for) certain taxes and other liabilities and expenses that we incur, including any taxes that we must pay in the event we were to fail to qualify as a REIT. In addition, because we are unable to retain earnings (resulting from REIT distribution requirements), we will generally be required to refinance debt that matures with additional debt or equity. There can be no assurance that any of these sources of funds, if available at all, would be available to meet our distribution and tax obligations.
Our failure to qualify as a REIT would have adverse consequences.
If we fail to qualify as a REIT, we will be subject to federal and state income tax (including any applicable alternative minimum tax) on our taxable income at regular corporate rates. In addition, unless entitled to relief under certain statutory provisions, we will be disqualified from treatment as a REIT for the four taxable years following the year during which REIT qualification is lost. The additional tax burden on us would significantly reduce the cash available for distribution by us to our stockholders. Our failure to qualify as a REIT could reduce materially the value of our common stock and would cause all our distributions to be taxable as ordinary income to the extent of our current and accumulated earnings and profits (although, subject to certain limitations under the Code, corporate distributees may be eligible for the dividends received deduction with respect to these distributions).
The Operating Partnership intends to qualify as a partnership but there is no guarantee that it will qualify.
We believe that the Operating Partnership qualifies as a partnership for federal income tax purposes. No assurance can be provided, however, that the Internal Revenue Service (the “IRS”) will not challenge its status as a partnership for federal income tax purposes, or that a court would not sustain such a challenge. If the IRS were to be successful in treating the Operating Partnership as an entity that is taxable as a corporation, we would cease to qualify as a REIT because the value of our ownership interest in the Operating Partnership would exceed 5% of our assets and because we would be considered to hold more than 10% of the voting securities of another corporation. Also, the imposition of a corporate tax on the Operating Partnership would reduce significantly the amount of cash available for distribution to our limited partners and stockholders. Finally, the classification of the Operating Partnership as a corporation would cause its limited partners to recognize gain (upon the event that causes the Operating Partnership to be classified as a corporation) at least equal to their “negative capital accounts” (and possibly more, depending upon the circumstances).
Item 1B. Unresolved Staff Comments
None.
As of December 31, 2014, the Properties consisted of 121 multifamily residential communities containing a total of 42,107 apartment units. In 2014, the Company acquired three communities with a total of 1,052 units in three transactions for total consideration of $141.5 million. Also in 2014, the Company sold three communities with a total of 1,527 units in separate transactions for total consideration of $216.8 million. In 2013, the Company acquired two communities with a total of 457 units in two transactions for total consideration of $55.8 million. Also in 2013, the Company sold four communities with a total of 1,013 units in separate transactions for total consideration of $192.1 million.
The Properties are generally located in established markets in suburban neighborhoods. Average physical occupancy at the Properties was 94.3% for 2014. “Physical occupancy” is defined as total possible rental income, net of vacancy, as a percentage of total possible rental income. Total possible rental income is determined by valuing occupied units at contract rates and vacant units at market rents. Average economic occupancy at the Properties was 93.0% for 2014. “Economic occupancy” is defined as total possible rental income, net of vacancy and bad debt expense as a percentage of total possible rental income. The Properties are typically two- and three-story garden style apartment buildings in landscaped settings and a majority are of brick or other masonry construction. The Company believes that its strategic focus on appealing to middle income residents and the quality of the services it provides to such residents results in lower resident turnover. Average turnover at the Properties was approximately 40% for 2014, which is significantly below the national average of approximately 50% for garden style apartments.
Resident leases are generally for a one year term. Security deposits equal to one month’s rent or less are generally required.
Certain of the Properties collateralize mortgage loans. See Schedule III contained herein (pages 103 to 105).
The table on the following pages illustrates certain of the important characteristics of the Properties as of December 31, 2014.
|
Property Information |
|
|
|
|
|
|
|
|
|
|
|
|
|
|
|
|
|
(4) |
|
(4) |
|
|
|
|
|
|
|
|
|
|
|
|
|
|
|
(2) |
|
(3) |
|
(3) |
|
2014 |
|
2013 |
|
|
|
|
|
|
|
|
|
|
|
|
|
|
|
2014 |
|
2014 |
|
2013 |
|
Avg Mo |
|
Avg Mo |
|
12/31/2014 |
|
|
|
|
|
# |
|
Age |
|
|
|
Average |
|
Resident |
|
Average |
|
Average |
|
Rent Rate |
|
Rent Rate |
|
Total Cost |
|
|
|
|
|
Of |
|
In |
|
Year |
|
Apt Size |
|
Turnover |
|
Occupancy |
|
Occupancy |
|
per Apt |
|
per Apt |
|
(000) |
|
Region |
|
|
|
Apts |
|
Years |
|
Acq/Dev |
|
(Sq Ft) |
|
% |
|
% |
|
% |
|
$ |
|
$ |
|
$ |
|
|
|
Core Communities (1) |
|
|
|
|
|
|
|
|
|
|
|
|
|
|
|
|
|
|
|
|
|
Baltimore |
|
Annapolis Roads |
|
282 |
|
39 |
|
2010 |
|
977 |
|
39% |
|
94% |
|
92% |
|
$ 1,335 |
|
$ 1,321 |
|
$ 41,535 |
|
Baltimore |
|
Bonnie Ridge |
|
960 |
|
48 |
|
1999 |
|
998 |
|
39% |
|
95% |
|
94% |
|
1,194 |
|
1,167 |
|
92,160 |
|
Baltimore |
|
Canterbury |
|
618 |
|
36 |
|
1999 |
|
858 |
|
43% |
|
94% |
|
94% |
|
1,081 |
|
1,051 |
|
48,874 |
|
Baltimore |
|
Charleston Place |
|
858 |
|
43 |
|
2010 |
|
817 |
|
39% |
|
96% |
|
96% |
|
1,274 |
|
1,233 |
|
122,785 |
|
Baltimore |
|
Country Village |
|
344 |
|
43 |
|
1998 |
|
773 |
|
52% |
|
95% |
|
94% |
|
1,050 |
|
1,047 |
|
28,381 |
|
Baltimore |
|
Dunfield |
|
312 |
|
27 |
|
2007 |
|
916 |
|
50% |
|
93% |
|
94% |
|
1,273 |
|
1,251 |
|
41,321 |
|
Baltimore |
|
Fox Hall |
|
720 |
|
38 |
|
2007 |
|
826 |
|
44% |
|
92% |
|
93% |
|
966 |
|
932 |
|
83,209 |
|
Baltimore |
|
Gateway Village |
|
132 |
|
25 |
|
1999 |
|
932 |
|
35% |
|
96% |
|
96% |
|
1,455 |
|
1,423 |
|
13,902 |
|
Baltimore |
|
Heritage Woods |
|
164 |
|
41 |
|
2006 |
|
925 |
|
42% |
|
96% |
|
95% |
|
1,205 |
|
1,192 |
|
19,013 |
|
Baltimore |
|
Howard Crossing |
|
1,350 |
|
46 |
|
2012 |
|
805 |
|
33% |
|
95% |
|
95% |
|
1,169 |
|
1,132 |
|
198,053 |
|
Baltimore |
|
Middlebrooke |
|
208 |
|
40 |
|
2010 |
|
834 |
|
44% |
|
96% |
|
96% |
|
1,059 |
|
1,017 |
|
21,600 |
|
Baltimore |
|
Mill Towne Village |
|
384 |
|
41 |
|
2001 |
|
804 |
|
38% |
|
96% |
|
96% |
|
979 |
|
959 |
|
34,624 |
|
Baltimore |
|
Morningside Heights |
|
1,050 |
|
49 |
|
1998 |
|
865 |
|
42% |
|
93% |
|
93% |
|
1,016 |
|
972 |
|
80,268 |
|
Baltimore |
|
Owings Run |
|
504 |
|
19 |
|
1999 |
|
1,064 |
|
44% |
|
95% |
|
96% |
|
1,347 |
|
1,306 |
|
54,310 |
|
Baltimore |
|
Ridgeview at Wakefield Valley |
|
204 |
|
26 |
|
2005 |
|
972 |
|
50% |
|
94% |
|
96% |
|
1,293 |
|
1,258 |
|
26,190 |
|
Baltimore |
|
Saddle Brooke |
|
468 |
|
41 |
|
2008 |
|
889 |
|
43% |
|
96% |
|
95% |
|
1,213 |
|
1,150 |
|
63,173 |
|
Baltimore |
|
Selford |
|
102 |
|
27 |
|
1999 |
|
946 |
|
42% |
|
97% |
|
96% |
|
1,530 |
|
1,473 |
|
10,073 |
|
Baltimore |
|
The Apts at Cambridge Court |
|
544 |
|
15 |
|
2011 |
|
900 |
|
46% |
|
93% |
|
92% |
|
1,378 |
|
1,370 |
|
94,934 |
|
Baltimore |
|
The Coves at Chesapeake |
|
469 |
|
32 |
|
2006 |
|
986 |
|
44% |
|
93% |
|
93% |
|
1,371 |
|
1,343 |
|
79,739 |
|
Baltimore |
|
The Greens at Columbia |
|
168 |
|
28 |
|
2010 |
|
969 |
|
34% |
|
96% |
|
95% |
|
1,484 |
|
1,474 |
|
29,579 |
|
Baltimore |
|
Top Field |
|
156 |
|
41 |
|
2006 |
|
1,132 |
|
30% |
|
96% |
|
95% |
|
1,394 |
|
1,355 |
|
23,832 |
|
Baltimore |
|
Village Square |
|
370 |
|
46 |
|
1999 |
|
967 |
|
41% |
|
94% |
|
95% |
|
1,260 |
|
1,229 |
|
31,342 |
|
Baltimore |
|
Westbrooke |
|
110 |
|
53 |
|
2010 |
|
651 |
|
44% |
|
95% |
|
95% |
|
949 |
|
911 |
|
8,507 |
|
Boston |
|
Gardencrest |
|
696 |
|
66 |
|
2002 |
|
907 |
|
40% |
|
96% |
|
96% |
|
1,801 |
|
1,728 |
|
122,214 |
|
Boston |
|
Highland House |
|
172 |
|
45 |
|
2006 |
|
709 |
|
42% |
|
95% |
|
95% |
|
1,357 |
|
1,305 |
|
22,255 |
|
Boston |
|
Liberty Commons |
|
120 |
|
8 |
|
2006 |
|
1,075 |
|
41% |
|
97% |
|
97% |
|
1,351 |
|
1,318 |
|
15,066 |
|
Boston |
|
Liberty Place |
|
107 |
|
26 |
|
2006 |
|
924 |
|
44% |
|
96% |
|
96% |
|
1,592 |
|
1,558 |
|
18,676 |
|
Boston |
|
Redbank Village |
|
500 |
|
70 |
|
1998 |
|
752 |
|
47% |
|
97% |
|
97% |
|
1,052 |
|
977 |
|
35,378 |
|
Boston |
|
Stone Ends |
|
280 |
|
35 |
|
2003 |
|
813 |
|
44% |
|
97% |
|
95% |
|
1,433 |
|
1,369 |
|
43,869 |
|
Boston |
|
The Commons at Haynes Farm |
|
302 |
|
23 |
|
2011 |
|
881 |
|
42% |
|
97% |
|
97% |
|
1,427 |
|
1,363 |
|
46,284 |
|
Boston |
|
The Heights at Marlborough |
|
348 |
|
41 |
|
2006 |
|
898 |
|
44% |
|
96% |
|
95% |
|
1,381 |
|
1,319 |
|
62,359 |
|
Boston |
|
The Meadows at Marlborough |
|
264 |
|
42 |
|
2006 |
|
822 |
|
39% |
|
96% |
|
96% |
|
1,330 |
|
1,281 |
|
43,700 |
|
Boston |
|
The Townhomes of Beverly |
|
204 |
|
44 |
|
2007 |
|
973 |
|
41% |
|
96% |
|
96% |
|
1,713 |
|
1,641 |
|
43,291 |
|
Boston |
|
The Village at Marshfield |
|
276 |
|
42 |
|
2004 |
|
766 |
|
38% |
|
96% |
|
95% |
|
1,324 |
|
1,269 |
|
42,387 |
|
Boston |
|
Westwoods |
|
35 |
|
24 |
|
2007 |
|
832 |
|
43% |
|
97% |
|
98% |
|
1,436 |
|
1,390 |
|
4,746 |
|
Chicago |
|
Blackhawk |
|
371 |
|
53 |
|
2000 |
|
804 |
|
51% |
|
95% |
|
95% |
|
960 |
|
924 |
|
29,023 |
|
Chicago |
|
Courtyards Village |
|
224 |
|
43 |
|
2001 |
|
765 |
|
47% |
|
98% |
|
98% |
|
972 |
|
936 |
|
20,587 |
|
Chicago |
|
Cypress Place |
|
192 |
|
44 |
|
2000 |
|
840 |
|
39% |
|
97% |
|
97% |
|
1,126 |
|
1,067 |
|
18,137 |
|
Property Information |
|
|
|
|
|
|
|
|
|
|
|
|
|
|
|
|
|
(4) |
|
(4) |
|
|
|
|
|
|
|
|
|
|
|
|
|
|
|
(2) |
|
(3) |
|
(3) |
|
2014 |
|
2013 |
|
|
|
|
|
|
|
|
|
|
|
|
|
|
|
2014 |
|
2014 |
|
2013 |
|
Avg Mo |
|
Avg Mo |
|
12/31/2014 |
|
|
|
|
|
# |
|
Age |
|
|
|
Average |
|
Resident |
|
Average |
|
Average |
|
Rent Rate |
|
Rent Rate |
|
Total Cost |
|
|
|
|
|
Of |
|
In |
|
Year |
|
Apt Size |
|
Turnover |
|
Occupancy |
|
Occupancy |
|
per Apt |
|
per Apt |
|
(000) |
|
Region |
|
|
|
Apts |
|
Years |
|
Acq/Dev |
|
(Sq Ft) |
|
% |
|
% |
|
% |
|
$ |
|
$ |
|
$ |
|
Chicago |
|
Lakeview Townhomes |
|
120 |
|
18 |
|
2010 |
|
1,080 |
|
52% |
|
97% |
|
97% |
|
1,281 |
|
1,252 |
|
17,534 |
|
Chicago |
|
The Colony |
|
783 |
|
41 |
|
1999 |
|
716 |
|
44% |
|
97% |
|
97% |
|
975 |
|
931 |
|
64,011 |
|
Chicago |
|
The Gates of Deer Grove |
|
204 |
|
40 |
|
2011 |
|
844 |
|
37% |
|
97% |
|
96% |
|
1,117 |
|
1,065 |
|
21,964 |
|
Chicago |
|
The New Colonies |
|
672 |
|
40 |
|
1998 |
|
674 |
|
47% |
|
97% |
|
96% |
|
778 |
|
770 |
|
40,273 |
|
Long Island |
|
Bayview/Colonial |
|
160 |
|
47 |
|
2000 |
|
717 |
|
28% |
|
98% |
|
98% |
|
1,410 |
|
1,364 |
|
17,433 |
|
Long Island |
|
Cambridge Village |
|
82 |
|
47 |
|
2002 |
|
725 |
|
38% |
|
97% |
|
98% |
|
2,040 |
|
1,947 |
|
9,237 |
|
Long Island |
|
Crescent Club |
|
257 |
|
41 |
|
2010 |
|
876 |
|
37% |
|
97% |
|
97% |
|
1,503 |
|
1,412 |
|
39,876 |
|
Long Island |
|
Devonshire Hills |
|
656 |
|
46 |
|
2001 |
|
767 |
|
35% |
|
96% |
|
97% |
|
1,729 |
|
1,677 |
|
129,819 |
|
Long Island |
|
Hawthorne Court |
|
434 |
|
46 |
|
2002 |
|
759 |
|
34% |
|
97% |
|
97% |
|
1,586 |
|
1,522 |
|
60,487 |
|
Long Island |
|
Heritage Square |
|
80 |
|
65 |
|
2002 |
|
696 |
|
38% |
|
98% |
|
98% |
|
1,962 |
|
1,903 |
|
10,686 |
|
Long Island |
|
Holiday Square |
|
144 |
|
35 |
|
2002 |
|
575 |
|
22% |
|
98% |
|
99% |
|
1,364 |
|
1,318 |
|
13,962 |
|
Long Island |
|
Lake Grove |
|
368 |
|
44 |
|
1997 |
|
775 |
|
43% |
|
96% |
|
96% |
|
1,598 |
|
1,554 |
|
45,337 |
|
Long Island |
|
Mid-Island Estates |
|
232 |
|
49 |
|
1997 |
|
684 |
|
23% |
|
98% |
|
98% |
|
1,540 |
|
1,503 |
|
20,638 |
|
Long Island |
|
Sayville Commons |
|
342 |
|
13 |
|
2005 |
|
1,012 |
|
16% |
|
97% |
|
98% |
|
1,765 |
|
1,691 |
|
69,596 |
|
Long Island |
|
Southern Meadows |
|
452 |
|
43 |
|
2001 |
|
813 |
|
35% |
|
96% |
|
96% |
|
1,582 |
|
1,531 |
|
58,089 |
|
Long Island |
|
Westwood Village |
|
242 |
|
45 |
|
2002 |
|
917 |
|
39% |
|
96% |
|
95% |
|
2,627 |
|
2,578 |
|
48,415 |
|
Long Island |
|
Woodmont Village |
|
97 |
|
46 |
|
2002 |
|
725 |
|
29% |
|
97% |
|
97% |
|
1,475 |
|
1,412 |
|
13,189 |
|
Long Island |
|
Yorkshire Village |
|
40 |
|
45 |
|
2002 |
|
766 |
|
35% |
|
97% |
|
97% |
|
2,001 |
|
1,991 |
|
5,206 |
|
New Jersey |
|
Barrington Gardens |
|
148 |
|
41 |
|
2005 |
|
837 |
|
45% |
|
97% |
|
97% |
|
1,447 |
|
1,378 |
|
14,854 |
|
New Jersey |
|
Chatham Hill |
|
308 |
|
47 |
|
2004 |
|
856 |
|
39% |
|
94% |
|
95% |
|
2,028 |
|
2,009 |
|
68,824 |
|
New Jersey |
|
East Hill Gardens |
|
33 |
|
56 |
|
1998 |
|
694 |
|
33% |
|
95% |
|
98% |
|
1,690 |
|
1,631 |
|
3,756 |
|
New Jersey |
|
Hackensack Gardens |
|
198 |
|
66 |
|
2005 |
|
552 |
|
45% |
|
97% |
|
97% |
|
1,286 |
|
1,225 |
|
21,614 |
|
New Jersey |
|
Jacob Ford Village |
|
270 |
|
66 |
|
2007 |
|
744 |
|
30% |
|
97% |
|
98% |
|
1,473 |
|
1,421 |
|
38,172 |
|
New Jersey |
|
Lakeview |
|
106 |
|
65 |
|
1998 |
|
575 |
|
36% |
|
97% |
|
97% |
|
1,511 |
|
1,478 |
|
10,990 |
|
New Jersey |
|
Northwood |
|
134 |
|
49 |
|
2004 |
|
850 |
|
40% |
|
96% |
|
96% |
|
1,493 |
|
1,444 |
|
21,685 |
|
New Jersey |
|
Oak Manor |
|
77 |
|
58 |
|
1998 |
|
1,006 |
|
46% |
|
96% |
|
96% |
|
2,114 |
|
2,021 |
|
9,848 |
|
New Jersey |
|
Pleasant View Gardens |
|
1,142 |
|
46 |
|
1998 |
|
738 |
|
36% |
|
96% |
|
97% |
|
1,268 |
|
1,226 |
|
97,310 |
|
New Jersey |
|
Pleasure Bay |
|
270 |
|
43 |
|
1998 |
|
803 |
|
50% |
|
96% |
|
95% |
|
1,212 |
|
1,154 |
|
22,192 |
|
New Jersey |
|
Royal Gardens |
|
550 |
|
46 |
|
1997 |
|
872 |
|
35% |
|
97% |
|
97% |
|
1,367 |
|
1,327 |
|
44,598 |
|
New Jersey |
|
Wayne Village |
|
275 |
|
49 |
|
1998 |
|
790 |
|
30% |
|
97% |
|
96% |
|
1,531 |
|
1,490 |
|
28,168 |
|
New Jersey |
|
Windsor Realty |
|
67 |
|
61 |
|
1998 |
|
622 |
|
39% |
|
97% |
|
98% |
|
1,384 |
|
1,345 |
|
7,030 |
|
Philadelphia |
|
Glen Manor |
|
180 |
|
38 |
|
1997 |
|
642 |
|
39% |
|
94% |
|
95% |
|
839 |
|
807 |
|
11,364 |
|
Philadelphia |
|
Golf Club |
|
399 |
|
45 |
|
2000 |
|
857 |
|
53% |
|
95% |
|
95% |
|
1,229 |
|
1,182 |
|
47,325 |
|
Philadelphia |
|
Hill Brook Place |
|
274 |
|
46 |
|
1999 |
|
711 |
|
44% |
|
94% |
|
96% |
|
972 |
|
956 |
|
23,991 |
|
Philadelphia |
|
Home Properties of Bryn Mawr |
|
316 |
|
63 |
|
2000 |
|
705 |
|
79% |
|
92% |
|
92% |
|
1,608 |
|
1,531 |
|
41,670 |
|
Philadelphia |
|
Home Properties of Devon |
|
631 |
|
51 |
|
2000 |
|
913 |
|
45% |
|
95% |
|
95% |
|
1,328 |
|
1,296 |
|
85,226 |
|
Philadelphia |
|
New Orleans Park |
|
442 |
|
43 |
|
1997 |
|
696 |
|
43% |
|
94% |
|
94% |
|
948 |
|
917 |
|
34,815 |
|
Philadelphia |
|
Racquet Club East |
|
466 |
|
43 |
|
1998 |
|
910 |
|
29% |
|
94% |
|
95% |
|
1,172 |
|
1,149 |
|
48,234 |
|
Philadelphia |
|
Racquet Club South |
|
103 |
|
45 |
|
1999 |
|
860 |
|
40% |
|
93% |
|
95% |
|
974 |
|
965 |
|
8,713 |
|
Property Information |
|
|
|
|
|
|
|
|
|
|
|
|
|
|
|
|
|
(4) |
|
(4) |
|
|
|
|
|
|
|
|
|
|
|
|
|
|
|
(2) |
|
(3) |
|
(3) |
|
2014 |
|
2013 |
|
|
|
|
|
|
|
|
|
|
|
|
|
|
|
2014 |
|
2014 |
|
2013 |
|
Avg Mo |
|
Avg Mo |
|
12/31/2014 |
|
|
|
|
|
# |
|
Age |
|
|
|
Average |
|
Resident |
|
Average |
|
Average |
|
Rent Rate |
|
Rent Rate |
|
Total Cost |
|
|
|
|
|
Of |
|
In |
|
Year |
|
Apt Size |
|
Turnover |
|
Occupancy |
|
Occupancy |
|
per Apt |
|
per Apt |
|
(000) |
|
Region |
|
|
|
Apts |
|
Years |
|
Acq/Dev |
|
(Sq Ft) |
|
% |
|
% |
|
% |
|
$ |
|
$ |
|
$ |
|
Philadelphia |
|
Ridley Brook |
|
244 |
|
52 |
|
1999 |
|
796 |
|
33% |
|
95% |
|
95% |
|
1,009 |
|
992 |
|
18,822 |
|
Philadelphia |
|
Sherry Lake |
|
298 |
|
49 |
|
1998 |
|
813 |
|
45% |
|
96% |
|
96% |
|
1,344 |
|
1,329 |
|
34,342 |
|
Philadelphia |
|
The Brooke at Peachtree Village |
|
146 |
|
28 |
|
2005 |
|
1,261 |
|
36% |
|
97% |
|
97% |
|
1,278 |
|
1,247 |
|
22,238 |
|
Philadelphia |
|
The Landings |
|
384 |
|
41 |
|
1996 |
|
912 |
|
40% |
|
96% |
|
95% |
|
1,123 |
|
1,117 |
|
37,001 |
|
Philadelphia |
|
Trexler Park |
|
250 |
|
40 |
|
2000 |
|
919 |
|
47% |
|
96% |
|
95% |
|
1,173 |
|
1,160 |
|
28,669 |
|
Philadelphia |
|
Trexler Park West |
|
216 |
|
6 |
|
2008 |
|
1,032 |
|
44% |
|
97% |
|
96% |
|
1,395 |
|
1,398 |
|
26,528 |
|
Philadelphia |
|
Waterview |
|
203 |
|
46 |
|
2011 |
|
776 |
|
48% |
|
96% |
|
95% |
|
1,149 |
|
1,096 |
|
30,397 |
|
Philadelphia |
|
William Henry |
|
363 |
|
43 |
|
2000 |
|
939 |
|
53% |
|
95% |
|
95% |
|
1,253 |
|
1,227 |
|
49,290 |
|
Southeast Florida |
|
The Hamptons |
|
668 |
|
25 |
|
2004 |
|
945 |
|
48% |
|
96% |
|
95% |
|
1,126 |
|
1,056 |
|
77,349 |
|
Southeast Florida |
|
Vinings at Hampton Village |
|
168 |
|
25 |
|
2004 |
|
1,171 |
|
46% |
|
96% |
|
97% |
|
1,251 |
|
1,179 |
|
19,829 |
|
Washington, D.C. |
|
1200 East West |
|
247 |
|
4 |
|
2010 |
|
839 |
|
39% |
|
94% |
|
97% |
|
1,841 |
|
1,900 |
|
85,772 |
|
Washington, D.C. |
|
Braddock Lee |
|
256 |
|
59 |
|
1998 |
|
749 |
|
26% |
|
96% |
|
97% |
|
1,455 |
|
1,435 |
|
23,971 |
|
Washington, D.C. |
|
Cinnamon Run |
|
511 |
|
54 |
|
2005 |
|
966 |
|
25% |
|
93% |
|
93% |
|
1,344 |
|
1,307 |
|
80,611 |
|
Washington, D.C. |
|
Courts at Huntington Station |
|
421 |
|
3 |
|
2011 |
|
996 |
|
39% |
|
94% |
|
94% |
|
1,964 |
|
1,989 |
|
122,465 |
|
Washington, D.C. |
|
East Meadow |
|
150 |
|
43 |
|
2000 |
|
943 |
|
35% |
|
96% |
|
96% |
|
1,500 |
|
1,477 |
|
19,356 |
|
Washington, D.C. |
|
Elmwood Terrace |
|
504 |
|
41 |
|
2000 |
|
910 |
|
46% |
|
95% |
|
95% |
|
1,043 |
|
1,006 |
|
38,129 |
|
Washington, D.C. |
|
Hunters Glen |
|
108 |
|
30 |
|
2011 |
|
822 |
|
47% |
|
93% |
|
93% |
|
1,067 |
|
1,026 |
|
8,801 |
|
Washington, D.C. |
|
Mount Vernon Square |
|
1,387 |
|
40 |
|
2006 |
|
847 |
|
38% |
|
93% |
|
94% |
|
1,370 |
|
1,347 |
|
172,269 |
|
Washington, D.C. |
|
Newport Village |
|
937 |
|
46 |
|
2011 |
|
1,051 |
|
33% |
|
93% |
|
94% |
|
1,578 |
|
1,567 |
|
228,999 |
|
Washington, D.C. |
|
Park Shirlington |
|
294 |
|
59 |
|
1998 |
|
840 |
|
30% |
|
95% |
|
96% |
|
1,477 |
|
1,443 |
|
27,367 |
|
Washington, D.C. |
|
Peppertree Farm |
|
879 |
|
60 |
|
2005 |
|
1,020 |
|
26% |
|
93% |
|
94% |
|
1,324 |
|
1,279 |
|
126,654 |
|
Washington, D.C. |
|
Seminary Hill |
|
296 |
|
54 |
|
1999 |
|
901 |
|
35% |
|
96% |
|
97% |
|
1,471 |
|
1,427 |
|
28,278 |
|
Washington, D.C. |
|
Seminary Towers |
|
545 |
|
50 |
|
1999 |
|
911 |
|
33% |
|
96% |
|
96% |
|
1,491 |
|
1,478 |
|
54,621 |
|
Washington, D.C. |
|
Somerset Park |
|
108 |
|
8 |
|
2011 |
|
967 |
|
48% |
|
97% |
|
97% |
|
1,535 |
|
1,514 |
|
20,827 |
|
Washington, D.C. |
|
Tamarron |
|
132 |
|
27 |
|
1999 |
|
955 |
|
42% |
|
94% |
|
93% |
|
1,678 |
|
1,661 |
|
16,126 |
|
Washington, D.C. |
|
The Apts at Cobblestone Square |
|
314 |
|
2 |
|
2012 |
|
923 |
|
55% |
|
97% |
|
96% |
|
1,348 |
|
1,317 |
|
49,000 |
|
Washington, D.C. |
|
The Apts at Wellington Trace |
|
240 |
|
12 |
|
2004 |
|
1,085 |
|
50% |
|
95% |
|
95% |
|
1,436 |
|
1,425 |
|
33,085 |
|
Washington, D.C. |
|
The Courts at Dulles |
|
411 |
|
14 |
|
2011 |
|
991 |
|
44% |
|
96% |
|
95% |
|
1,541 |
|
1,552 |
|
95,848 |
|
Washington, D.C. |
|
The Courts at Fair Oaks |
|
364 |
|
24 |
|
2010 |
|
798 |
|
44% |
|
95% |
|
96% |
|
1,542 |
|
1,545 |
|
78,301 |
|
Washington, D.C. |
|
The Manor - VA |
|
198 |
|
40 |
|
1999 |
|
819 |
|
40% |
|
94% |
|
95% |
|
1,210 |
|
1,160 |
|
16,479 |
|
Washington, D.C. |
|
The Manor East |
|
164 |
|
50 |
|
2012 |
|
841 |
|
46% |
|
93% |
|
93% |
|
1,171 |
|
1,122 |
|
20,677 |
|
Washington, D.C. |
|
The Sycamores |
|
185 |
|
36 |
|
2002 |
|
858 |
|
38% |
|
96% |
|
95% |
|
1,479 |
|
1,492 |
|
26,766 |
|
Washington, D.C. |
|
Village at Potomac Falls |
|
247 |
|
15 |
|
2010 |
|
940 |
|
46% |
|
96% |
|
96% |
|
1,473 |
|
1,452 |
|
41,693 |
|
Washington, D.C. |
|
West Springfield |
|
244 |
|
36 |
|
2002 |
|
957 |
|
31% |
|
96% |
|
96% |
|
1,587 |
|
1,597 |
|
43,351 |
|
Washington, D.C. |
|
Westchester West |
|
345 |
|
42 |
|
2008 |
|
985 |
|
31% |
|
93% |
|
93% |
|
1,434 |
|
1,390 |
|
55,256 |
|
Washington, D.C. |
|
Woodway at Trinity Centre |
|
504 |
|
17 |
|
2012 |
|
868 |
|
41% |
|
95% |
|
96% |
|
1,445 |
|
1,414 |
|
99,517 |
|
|
|
|
|
|
|
|
|
|
|
|
|
|
|
|
|
|
|
|
|
|
|
|
|
|
|
Core Total/Weighted Avg |
|
39,253 |
|
40 |
|
|
|
866 |
|
40% |
|
95% |
|
95% |
|
$ 1,329 |
|
$ 1,294 |
|
$ 5,150,191 |
|
|
|
|
|
|
|
|
|
|
|
|
|
|
|
|
|
|
|
|
|
|
|
|
|
|
|
|
|
|
|
|
|
|
|
|
|
|
| |||
|
Property Information |
|
|
|
|
|
|
|
|
|
|
|
|
|
|
|
|
|
(4) |
|
(4) |
|
|
| |||||||||||||||||
|
|
|
|
|
|
|
|
|
|
|
|
|
(2) |
|
(3) |
|
(3) |
|
2014 |
|
2013 |
|
|
| |||||||||||||||||
|
|
|
|
|
|
|
|
|
|
|
|
|
2014 |
|
2014 |
|
2013 |
|
Avg Mo |
|
Avg Mo |
|
12/31/2014 |
| |||||||||||||||||
|
|
|
|
|
# |
|
Age |
|
|
|
Average |
|
Resident |
|
Average |
|
Average |
|
Rent Rate |
|
Rent Rate |
|
Total Cost |
| |||||||||||||||||
|
|
|
|
|
Of |
|
In |
|
Year |
|
Apt Size |
|
Turnover |
|
Occupancy |
|
Occupancy |
|
per Apt |
|
per Apt |
|
(000) |
| |||||||||||||||||
|
Region |
|
|
|
Apts |
|
Years |
|
Acq/Dev |
|
(Sq Ft) |
|
% |
|
% |
|
% |
|
$ |
|
$ |
|
$ |
| |||||||||||||||||
|
|
|
|
|
|
|
|
|
|
|
|
|
|
|
|
|
|
|
|
|
|
|
|
|
|
|
|
|
|
|
|
|
|
|
|
|
|
| |||
|
|
|
Redevelopment Communities |
|
|
|
|
|
|
|
|
|
|
|
|
|
|
|
|
|
|
|
|
|
|
|
|
|
|
|
|
|
|
|
|
|
|
| |||
|
Washington, D.C. |
|
Arbor Park of Alexandria |
|
851 |
|
|
46 |
|
|
2000 |
|
|
1,038 |
|
|
|
47% |
|
|
|
79% |
|
|
|
82% |
|
|
|
$ |
1,642 |
|
|
|
$ |
1,552 |
|
|
$ |
138,413 |
|
|
|
|
|
|
|
|
|
|
|
|
|
|
|
|
|
|
|
|
|
|
|
|
|
|
|
|
|
|
|
|
|
|
|
|
|
|
|
| |||
|
|
|
2013 Acquisition Communities (5) |
|
|
|
|
|
|
|
|
|
|
|
|
|
|
|
|
|
|
|
|
|
|
|
|
|
|
|
|
|
|
|
|
|
|
| |||
|
Boston |
|
Middlesex Crossing |
|
252 |
|
|
40 |
|
|
2013 |
|
|
750 |
|
|
|
47% |
|
|
|
95% |
|
|
|
96% |
|
|
|
$ |
1,462 |
|
|
|
$ |
1,343 |
|
|
$ |
41,851 |
|
|
Philadelphia |
|
Stone Hill |
|
205 |
|
|
43 |
|
|
2013 |
|
|
812 |
|
|
|
34% |
|
|
|
92% |
|
|
|
90% |
|
|
|
936 |
|
|
|
900 |
|
|
18,016 |
| |||
|
|
|
|
|
|
|
|
|
|
|
|
|
|
|
|
|
|
|
|
|
|
|
|
|
|
|
|
|
|
|
|
|
|
|
|
|
|
| |||
|
|
|
2013 Total/Weighted Avg |
|
457 |
|
|
42 |
|
|
|
|
|
778 |
|
|
|
41% |
|
|
|
94% |
|
|
|
93% |
|
|
|
$ |
1,226 |
|
|
|
$ |
1,144 |
|
|
$ |
59,867 |
|
|
|
|
|
|
|
|
|
|
|
|
|
|
|
|
|
|
|
|
|
|
|
|
|
|
|
|
|
|
|
|
|
|
|
|
|
|
|
| |||
|
|
|
2014 Acquisition Communities (5) |
|
|
|
|
|
|
|
|
|
|
|
|
|
|
|
|
|
|
|
|
|
|
|
|
|
|
|
|
|
|
|
|
|
|
| |||
|
Chicago |
|
The Lakes of Schaumburg |
|
428 |
|
|
27 |
|
|
2014 |
|
|
800 |
|
|
|
35% |
|
|
|
96% |
|
|
|
n/a |
|
|
|
$ |
1,194 |
|
|
|
n/a |
|
|
$ |
67,602 |
| |
|
Philadelphia |
|
The Preserve at Milltown |
|
376 |
|
|
39 |
|
|
2014 |
|
|
901 |
|
|
|
36% |
|
|
|
96% |
|
|
|
n/a |
|
|
|
1,083 |
|
|
|
n/a |
|
|
45,577 |
| |||
|
Philadelphia |
|
Willowbrook |
|
248 |
|
|
42 |
|
|
2014 |
|
|
917 |
|
|
|
35% |
|
|
|
94% |
|
|
|
n/a |
|
|
|
1,212 |
|
|
|
n/a |
|
|
30,758 |
| |||
|
|
|
|
|
|
|
|
|
|
|
|
|
|
|
|
|
|
|
|
|
|
|
|
|
|
|
|
|
|
|
|
|
|
|
|
|
|
| |||
|
|
|
2014 Construction Communities (6) |
|
|
|
|
|
|
|
|
|
|
|
|
|
|
|
|
|
|
|
|
|
|
|
|
|
|
|
|
|
|
|
|
|
|
| |||
|
Philadelphia |
|
Courts at Spring Mill Station |
|
115 |
|
|
- |
|
|
2014 |
|
|
958 |
|
|
|
0% |
|
|
|
25% |
|
|
|
n/a |
|
|
|
$ |
1,824 |
|
|
|
n/a |
|
|
$ |
7,296 |
| |
|
Washington, D.C. |
|
Eleven55 Ripley |
|
379 |
|
|
- |
|
|
2014 |
|
|
799 |
|
|
|
3% |
|
|
|
38% |
|
|
|
0% |
|
|
|
1,971 |
|
|
|
n/a |
|
|
61,635 |
| |||
|
|
|
|
|
|
|
|
|
|
|
|
|
|
|
|
|
|
|
|
|
|
|
|
|
|
|
|
|
|
|
|
|
|
|
|
|
|
| |||
|
|
|
2014 Total/Weighted Avg |
|
1,546 |
|
|
22 |
|
|
|
|
|
855 |
|
|
|
20% |
|
|
|
68% |
|
|
|
n/a |
|
|
|
$ |
1,530 |
|
|
|
n/a |
|
|
$ |
212,868 |
| |
|
|
|
|
|
|
|
|
|
|
|
|
|
|
|
|
|
|
|
|
|
|
|
|
|
|
|
|
|
|
|
|
|
|
|
|
|
|
| |||
|
|
|
Property Total/Weighted Avg |
|
42,107 |
|
|
39 |
|
|
|
|
|
868 |
|
|
|
40% |
|
|
|
94% |
|
|
|
95% |
|
|
|
$ |
1,338 |
|
|
|
$ |
1,264 |
|
|
$ |
5,561,339 |
|
(1) “Core Communities” represents the 39,253 apartment units owned consistently throughout 2014 and 2013.
(2) “Resident Turnover” reflects, on an annual basis, the number of moveouts; divided by the total number of apartment units.
(3) “Average Occupancy %” is the average physical occupancy for the 12 months ended December 31, 2014 and 2013.
(4) “Avg Mo Rent Rate per Apt” takes into account current market rents and resident concessions.
(5) For communities acquired during 2014 and 2013, these are the averages from the date of acquisition.
(6) Courts at Spring Mill Station is under construction with 115 units in service and Eleven55 Ripley is substantially complete with all units available to rent at December 31, 2014.
Property Development and Redevelopment
Development
The Company announced in July 2014 that a strategic decision was made to discontinue the business of developing new apartment communities. It plans to complete construction on the current construction projects in process at December 31, 2014 as follows:
· Eleven55 Ripley, a 379 unit high rise development consisting of two buildings, a 21 story high-rise and a 5 story mid-rise, is located in Silver Spring, Maryland. Construction commenced in the fourth quarter of 2011, and is substantially complete. Initial occupancy was in the fourth quarter of 2013. The total projected cost for this development is $113.5 million. As of February 4, 2015, 84% of the units were leased and 75% of the units were occupied.
· The Courts at Spring Mill Station, a 385 unit development consisting of two buildings, being built in a combination donut/podium style, is located in Conshohocken, Pennsylvania. Construction commenced in the second quarter of 2012, and is expected to continue through the first half of 2015. Initial occupancy was in the fourth quarter of 2014. The total projected cost for this development is $89 million. As of February 4, 2015, 21% of the units were leased and 13% of the units were occupied.
Redevelopment
· The Company has one project under redevelopment which is nearing completion. Arbor Park, located in Alexandria, Virginia, has 851 garden apartments in fifty-two buildings built in 1967. The Company plans to extensively renovate all of the units over several years on a building by building basis. As of December 31, 2014, there were five buildings with 72 units under renovation and forty-seven buildings with 779 units completed and 657 units occupied. As of December 31, 2014, rents in the renovated units were averaging $1,689 compared to $1,361 for the existing non-renovated units. As of December 31, 2014, the Company has incurred costs of $30 million for the renovation which is included in buildings, improvements and equipment. The entire project is expected to be completed in early 2015 for a projected cost of $32 million.
Supplemental Property Information
At December 31, 2014, none of the Company’s properties have an individual net book value equal to or greater than 10% of the total assets of the Company or would have accounted for 10% or more of the Company’s aggregate gross revenues for 2014. There is no resident who has one or more leases which, in the aggregate, account for more than 10% of the aggregate gross revenues for 2014.
The Company is subject to a variety of legal actions for personal injury or property damage arising in the ordinary course of its business, most of which are covered by insurance. Various claims of employment and resident discrimination are also periodically brought. While the resolution of these matters cannot be predicted with certainty, management believes that the final outcome of such legal proceedings and claims will not have a material adverse effect on the Company’s liquidity, financial position or results of operations.
Item 4. Mine Safety Disclosures
Not applicable.
Item 5. Market for the Registrant’s Common Equity, Related Stockholder Matters and Issuer Purchases of Equity Securities
Market Information, Holders and Dividends
The common stock has been traded on the NYSE under the symbol “HME” since July 28, 1994. The following table sets forth for the previous two years the quarterly high and low sales prices per share reported on the NYSE, as well as all dividends paid with respect to the common stock.
|
2014 |
|
High |
|
Low |
|
Dividends |
|
|
Fourth Quarter |
|
$67.48 |
|
$58.13 |
|
$0.73 |
|
|
Third Quarter |
|
$66.74 |
|
$57.30 |
|
$0.73 |
|
|
Second Quarter |
|
$64.04 |
|
$59.13 |
|
$0.73 |
|
|
First Quarter |
|
$61.84 |
|
$53.60 |
|
$0.73 |
|
|
|
|
|
|
|
|
|
|
|
2013 |
|
|
|
|
|
|
|
|
Fourth Quarter |
|
$61.65 |
|
$52.16 |
|
$0.70 |
|
|
Third Quarter |
|
$67.04 |
|
$56.24 |
|
$0.70 |
|
|
Second Quarter |
|
$67.79 |
|
$59.51 |
|
$0.70 |
|
|
First Quarter |
|
$64.30 |
|
$59.93 |
|
$0.70 |
|
As of February 11, 2015, the Company had approximately 2,887 shareholders of record; 57,789,541 common shares (plus 10,076,705 UPREIT Units convertible into 10,076,705 common shares) were outstanding, and the closing price of the Company’s common stock on the NYSE was $68.19. It is the Company’s policy to pay dividends. The Company has historically paid dividends on a quarterly basis in the months of February or March, May, August and November.
On January 31, 2015, the Board declared a dividend of $0.76 per share for the quarter ended December 31, 2014. The dividend is payable February 27, 2015 to shareholders of record on February 17, 2015.
Performance Graph
The following graph compares the cumulative return on the Company’s common stock during the five year period ended December 31, 2014 to the cumulative return of the NAREIT All Equity REIT Index (“NAREIT Equity”) and the Standard and Poor’s 500 Index (“S&P 500”) for the same period. Management believes that the NAREIT Equity is an appropriate industry index and the S&P 500 is a broad equity market index for purposes of this graph. The total return on the Company’s common stock assumes that dividends were reinvested quarterly at the same price as provided under the Company’s Dividend Reinvestment and Direct Stock Purchase Plan. All comparisons are based on a $100.00 investment on December 31, 2009 and the reinvestment of all dividends during the comparison period. Data for the NAREIT Equity and S&P 500 were provided to the Company by NAREIT. Stockholders should note that past performance does not predict future results.
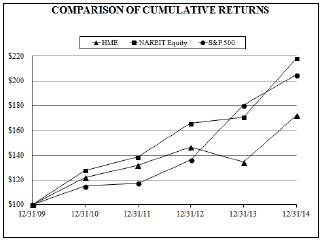
|
|
|
12/31/2009 |
|
12/31/2010 |
|
12/31/2011 |
|
12/31/2012 |
|
12/31/2013 |
|
12/31/2014 |
|
|
|
|
$100.00 |
|
121.91 |
|
131.95 |
|
146.70 |
|
134.35 |
|
172.27 |
|
|
|
|
$100.00 |
|
127.95 |
|
138.55 |
|
165.84 |
|
170.58 |
|
218.38 |
|
|
|
|
$100.00 |
|
115.06 |
|
117.49 |
|
136.30 |
|
180.44 |
|
205.14 |
|
Certain of our filings with the SEC may “incorporate information by reference” future filings, including this Form 10-K. Unless we specifically state otherwise, this Performance Graph shall not be deemed to be incorporated by reference and shall not constitute soliciting material or otherwise be considered filed under the Securities Act of 1933, as amended, or the Securities Exchange Act of 1934, as amended.
Issuer Purchases of Equity Securities
The Company has a stock repurchase program, approved by its Board of Directors (the “Board”), under which it may repurchase shares of its common stock or UPREIT Units (the “Company Program”). The shares and units may be repurchased through open market or privately negotiated transactions at the discretion of Company management. The Board’s action did not establish a specific target stock price or a specific timetable for share repurchase. At December 31, 2014, the Company had authorization to repurchase 2,291,160 shares of common stock and UPREIT Units under the Company Program. During the three months ended December 31, 2014, the Company did not repurchase any shares under the Company Program. The last year in which the Company repurchased any shares under that program was 2008.
Participants in the Company’s Stock Benefit Plan can use common stock of the Company that they already own to pay: 1) all or a portion of the exercise price payable to the Company upon the exercise of an option; and, 2) the taxes associated with option exercises and the vesting of restricted stock awards. In such event, the common stock used to pay the exercise price or taxes is returned to authorized but unissued status, and for purposes of this table is deemed to have been repurchased by the Company, but does not represent repurchases under the Company Program.
The following table summarizes the total number of shares (units) repurchased by the Company during the quarter ended December 31, 2014:
|
|
|
Total |
|
Average |
|
Maximum shares/units | ||||||
|
|
|
shares/units |
|
price per |
|
available under the | ||||||
|
Period |
|
Purchased (1)(2) |
|
share/unit |
|
Company Program | ||||||
|
Balance, September 30, 2014 |
|
|
|
|
|
|
|
|
2,291,160 |
| ||
|
October 1 to 31, 2014 |
|
|
137 |
|
|
|
$ 59.60 |
|
|
|
2,291,160 |
|
|
November 1 to 30, 2014 |
|
|
575 |
|
|
|
63.56 |
|
|
|
2,291,160 |
|
|
December 1 to 31, 2014 |
|
|
3,563 |
|
|
|
65.97 |
|
|
|
2,291,160 |
|
|
Balance, December 31, 2014 |
|
|
4,275 |
|
|
|
$ 65.44 |
|
|
|
2,291,160 |
|
(1) Shares of common stock in the amount of 3,719 already owned by restricted stock award holders were used by those holders to pay the taxes associated with their award vesting;
(2) The Company repurchased 556 shares of common stock through share repurchases by the transfer agent in the open market in connection with the Company’s 401(k) Savings Plan employee deferral and Company matching elections.
Item 6. Selected Financial Data
The following table sets forth selected financial and operating data on a historical basis for the Company and should be read in conjunction with the financial statements appearing in this Form 10-K (amounts in thousands, except share, per share/unit, communities and apartment data).
|
|
|
2014 |
|
|
2013 |
|
|
2012 |
|
|
2011 |
|
|
2010 |
| |||||
|
Revenues: |
|
|
|
|
|
|
|
|
|
|
|
|
|
|
| |||||
|
Rental income |
|
$ |
616,160 |
|
|
$ |
587,052 |
|
|
$ |
554,499 |
|
|
$ |
479,839 |
|
|
$ |
423,309 |
|
|
Property other income |
|
55,391 |
|
|
51,571 |
|
|
48,910 |
|
|
42,255 |
|
|
37,604 |
| |||||
|
Other income (1) |
|
364 |
|
|
1,179 |
|
|
311 |
|
|
154 |
|
|
106 |
| |||||
|
Total revenues |
|
671,915 |
|
|
639,802 |
|
|
603,720 |
|
|
522,248 |
|
|
461,019 |
| |||||
|
|
|
|
|
|
|
|
|
|
|
|
|
|
|
|
| |||||
|
Expenses: |
|
|
|
|
|
|
|
|
|
|
|
|
|
|
| |||||
|
Operating and maintenance |
|
249,509 |
|
|
230,098 |
|
|
220,853 |
|
|
202,770 |
|
|
188,819 |
| |||||
|
General and administrative |
|
26,686 |
|
|
28,507 |
|
|
34,174 |
|
|
29,145 |
|
|
25,138 |
| |||||
|
Interest |
|
99,635 |
|
|
110,076 |
|
|
119,871 |
|
|
121,122 |
|
|
115,403 |
| |||||
|
Depreciation and amortization |
|
181,123 |
|
|
167,375 |
|
|
155,532 |
|
|
131,067 |
|
|
113,410 |
| |||||
|
Other expenses (2) |
|
734 |
|
|
312 |
|
|
2,741 |
|
|
3,225 |
|
|
2,871 |
| |||||
|
Impairment and other charges (3) |
|
5,382 |
|
|
- |
|
|
- |
|
|
- |
|
|
- |
| |||||
|
Total expenses |
|
563,069 |
|
|
536,368 |
|
|
533,171 |
|
|
487,329 |
|
|
445,641 |
| |||||
|
|
|
|
|
|
|
|
|
|
|
|
|
|
|
|
| |||||
|
Income from continuing operations |
|
108,846 |
|
|
103,434 |
|
|
70,549 |
|
|
34,919 |
|
|
15,378 |
| |||||
|
|
|
|
|
|
|
|
|
|
|
|
|
|
|
|
| |||||
|
Discontinued operations: |
|
|
|
|
|
|
|
|
|
|
|
|
|
|
| |||||
|
Income (loss) from discontinued operations |
|
(1,206 |
) |
|
6,940 |
|
|
12,541 |
|
|
12,745 |
|
|
10,953 |
| |||||
|
Gain (loss) on disposition of property |
|
81,831 |
|
|
81,205 |
|
|
80,532 |
|
|
- |
|
|
(13 |
) | |||||
|
Discontinued operations |
|
80,625 |
|
|
88,145 |
|
|
93,073 |
|
|
12,745 |
|
|
10,940 |
| |||||
|
|
|
|
|
|
|
|
|
|
|
|
|
|
|
|
| |||||
|
Net income |
|
189,471 |
|
|
191,579 |
|
|
163,622 |
|
|
47,664 |
|
|
26,318 |
| |||||
|
Net income attributable to noncontrolling interest |
|
(28,533 |
) |
|
(30,706 |
) |
|
(28,320 |
) |
|
(9,808 |
) |
|
(6,237 |
) | |||||
|
Net income attributable to common stockholders |
|
$ |
160,938 |
|
|
$ |
160,873 |
|
|
$ |
135,302 |
|
|
$ |
37,856 |
|
|
$ |
20,081 |
|
|
|
|
|
|
|
|
|
|
|
|
|
|
|
|
|
| |||||
|
Basic earnings per share data: |
|
|
|
|
|
|
|
|
|
|
|
|
|
|
| |||||
|
Income from continuing operations |
|
$ |
1.61 |
|
|
$ |
1.60 |
|
|
$ |
1.17 |
|
|
$ |
0.66 |
|
|
$ |
0.32 |
|
|
Discontinued operations |
|
1.20 |
|
|
1.36 |
|
|
1.55 |
|
|
0.24 |
|
|
0.23 |
| |||||
|
Net income attributable to common stockholders |
|
$ |
2.81 |
|
|
$ |
2.96 |
|
|
$ |
2.72 |
|
|
$ |
0.90 |
|
|
$ |
0.55 |
|
|
Diluted earnings per share data: |
|
|
|
|
|
|
|
|
|
|
|
|
|
|
| |||||
|
Income from continuing operations |
|
$ |
1.60 |
|
|
$ |
1.58 |
|
|
$ |
1.16 |
|
|
$ |
0.65 |
|
|
$ |
0.32 |
|
|
Discontinued operations |
|
1.18 |
|
|
1.35 |
|
|
1.53 |
|
|
0.24 |
|
|
0.22 |
| |||||
|
Net income attributable to common stockholders |
|
$ |
2.78 |
|
|
$ |
2.93 |
|
|
$ |
2.69 |
|
|
$ |
0.89 |
|
|
$ |
0.54 |
|
|
Cash dividends declared per common share |
|
$ |
2.92 |
|
|
$ |
2.80 |
|
|
$ |
2.64 |
|
|
$ |
2.48 |
|
|
$ |
2.32 |
|
|
|
|
|
|
|
|
|
|
|
|
|
|
|
|
|
| |||||
|
Balance Sheet Data: |
|
|
|
|
|
|
|
|
|
|
|
|
|
|
| |||||
|
Real estate, before accumulated depreciation |
|
$ |
5,764,727 |
|
|
$ |
5,620,765 |
|
|
$ |
5,455,226 |
|
|
$ |
5,042,324 |
|
|
$ |
4,377,730 |
|
|
Total assets |
|
4,488,535 |
|
|
4,467,877 |
|
|
4,451,492 |
|
|
4,153,206 |
|
|
3,634,703 |
| |||||
|
Total debt |
|
2,456,175 |
|
|
2,457,217 |
|
|
2,777,527 |
|
|
2,663,336 |
|
|
2,618,932 |
| |||||
|
Common stockholders’ equity |
|
1,653,218 |
|
|
1,629,253 |
|
|
1,320,968 |
|
|
1,153,668 |
|
|
720,893 |
| |||||
|
|
|
|
|
|
|
|
|
|
|
|
|
|
|
|
| |||||
|
Other Data: |
|
|
|
|
|
|
|
|
|
|
|
|
|
|
| |||||
|
Net cash provided by operating activities |
|
$ |
301,876 |
|
|
$ |
295,080 |
|
|
$ |
267,580 |
|
|
$ |
197,705 |
|
|
$ |
160,019 |
|
|
Net cash used in investing activities |
|
(90,227 |
) |
|
(114,153 |
) |
|
(366,003 |
) |
|
(664,343 |
) |
|
(334,539 |
) | |||||
|
Net cash provided by (used in) financing activities |
|
(210,371 |
) |
|
(192,166 |
) |
|
111,218 |
|
|
464,153 |
|
|
176,493 |
| |||||
|
Funds From Operations – Diluted, as adjusted by the Company (4) |
|
294,256 |
|
|
284,780 |
|
|
251,658 |
|
|
189,723 |
|
|
151,134 |
| |||||
|
|
|
|
|
|
|
|
|
|
|
|
|
|
|
|
| |||||
|
Weighted average number of shares/units outstanding: |
|
|
|
|
|
|
|
|
|
|
|
|
|
|
| |||||
|
Shares – Basic |
|
57,315,391 |
|
|
54,328,514 |
|
|
49,744,636 |
|
|
41,860,139 |
|
|
36,682,191 |
| |||||
|
Shares – Diluted |
|
57,827,888 |
|
|
54,820,194 |
|
|
50,382,636 |
|
|
42,545,082 |
|
|
37,169,886 |
| |||||
|
Shares/units – Basic |
|
67,515,687 |
|
|
64,702,113 |
|
|
60,364,689 |
|
|
52,926,968 |
|
|
48,201,751 |
| |||||
|
Shares/units – Diluted |
|
68,028,184 |
|
|
65,193,793 |
|
|
61,002,689 |
|
|
53,611,911 |
|
|
48,689,446 |
| |||||
|
UPREIT Units |
|
10,200,296 |
|
|
10,373,599 |
|
|
10,620,053 |
|
|
11,066,829 |
|
|
11,519,560 |
| |||||
|
|
|
|
|
|
|
|
|
|
|
|
|
|
|
|
| |||||
|
Total communities owned at end of year |
|
121 |
|
|
120 |
|
|
121 |
|
|
124 |
|
|
116 |
| |||||
|
Total apartment units owned at end of year |
|
42,107 |
|
|
42,170 |
|
|
42,635 |
|
|
41,951 |
|
|
38,861 |
| |||||
Selected Financial Data (continued)
(1) Other income is primarily comprised of other real estate service fees.
(2) Other expenses are comprised of acquisition related costs for closed deals.
(3) Impairment and other charges are comprised of $3,942 in land impairment and other charges and $1,440 of employee severance costs in connection with the decision to discontinue new property development.
(4) Pursuant to the updated guidance for Funds From Operations (“FFO”) provided by the Board of Governors of the National Association of Real Estate Investment Trusts (“NAREIT”), FFO is defined as net income (computed in accordance with accounting principles generally accepted in the United States of America (“GAAP”)) excluding gains or losses from sales of property, impairment write-downs of depreciable real estate, noncontrolling interest, extraordinary items and cumulative effect of change in accounting principle plus depreciation from real property including adjustments for unconsolidated partnerships and joint ventures less dividends from non-convertible preferred shares. Because of the limitations of the FFO definition as published by NAREIT as set forth above, the Company has made certain interpretations in applying the definition. The Company believes all adjustments not specifically provided for are consistent with the definition.
In addition to presenting FFO in accordance with the NAREIT definition, we also disclose FFO after a specific and defined supplemental adjustment to exclude losses from early extinguishments of debt associated with the sales of real estate (“FFO as adjusted”). The adjustment to exclude losses from early extinguishments of debt results when the sale of real estate encumbered by debt requires us to pay the extinguishment costs prior to the debt’s stated maturity and to write-off unamortized loan costs at the date of the extinguishment. Such costs are excluded from the gains on sales of real estate reported in accordance with GAAP. However, we view the losses from early extinguishments of debt associated with the sales of real estate as an incremental cost of the sale transactions because we extinguished the debt in connection with the consummation of the sale transactions and we had no intent to extinguish the debt absent such transactions. We believe that this supplemental adjustment more appropriately reflects the results of our operations exclusive of the impact of our sale transactions.
Although our FFO as adjusted clearly differs from NAREIT’s definition of FFO, and may not be comparable to that of other REITs and real estate companies, we believe it provides a meaningful supplemental measure of our operating performance because we believe that, by excluding the effects of the losses from early extinguishments of debt associated with the sales of real estate, management and investors are presented with an indicator of our operating performance that more closely achieves the objectives of the real estate industry in presenting FFO.
Neither FFO, nor FFO as adjusted, should be considered as an alternative to net income (determined in accordance with GAAP) as an indication of our performance. Neither FFO, nor FFO as adjusted, represents cash generated from operating activities determined in accordance with GAAP, and neither is a measure of liquidity or an indicator of our ability to make cash distributions. We believe that to further understand our performance, FFO, and FFO as adjusted, should be compared with our reported net income and considered in addition to cash flows in accordance with GAAP, as presented in our consolidated financial statements.
FFO, and FFO as adjusted, fall within the definition of “non-GAAP financial measure” set forth in Item 10(e) of Regulation S-K and as a result the Company is required to include in this report a statement disclosing the reasons why management believes that presentation of this measure provides useful information to investors. Management believes that in order to facilitate a clear understanding of the combined historical operating results of the Company, FFO, and FFO as adjusted, should be considered in conjunction with net income as presented in the consolidated financial statements included herein. Management believes that by excluding gains or losses related to dispositions of property and excluding real estate depreciation (which can vary among owners of similar assets in similar condition based on historical cost accounting and useful life estimates), FFO, and FFO as adjusted, can help one compare the operating performance of a company’s real estate between periods or as compared to different companies. In addition, FFO as adjusted ties the losses on early extinguishment of debt to the real estate which was sold triggering the extinguishment. The Company also uses these measures to compare its performance to that of its peer group.
Selected Financial Data (continued)
(4) (continued)
The following table sets forth the calculation of FFO, and FFO as adjusted, for the previous five years, beginning with “net income attributable to common stockholders” from the Company’s audited financial statements prepared in accordance with GAAP (in thousands, except per share/unit data):
|
|
|
2014 |
|
|
2013 |
|
|
2012 |
|
|
2011 |
|
2010 |
| |||||
|
Net income attributable to common stockholders |
|
$ |
160,938 |
|
|
$ |
160,873 |
|
|
$ |
135,302 |
|
|
$ |
37,856 |
|
$ |
20,081 |
|
|
Real property depreciation and amortization |
|
181,284 |
|
|
172,624 |
|
|
166,411 |
|
|
142,059 |
|
124,803 |
| |||||
|
Noncontrolling interest |
|
28,533 |
|
|
30,706 |
|
|
28,320 |
|
|
9,808 |
|
6,237 |
| |||||
|
Loss (gain) on disposition of property |
|
(81,831 |
) |
|
(81,205 |
) |
|
(80,532 |
) |
|
- |
|
13 |
| |||||
|
FFO – Basic and Diluted, as defined by NAREIT |
|
288,924 |
|
|
282,998 |
|
|
249,501 |
|
|
189,723 |
|
151,134 |
| |||||
|
Loss from early extinguishment of debt in connection with sale of real estate |
|
5,332 |
|
|
1,782 |
|
|
2,157 |
|
|
- |
|
- |
| |||||
|
FFO – Basic and Diluted, as adjusted by the Company |
|
$ |
294,256 |
|
|
$ |
284,780 |
|
|
$ |
251,658 |
|
|
$ |
189,723 |
|
$ |
151,134 |
|
|
|
|
|
|
|
|
|
|
|
|
|
|
|
|
| |||||
|
Weighted average common shares/units outstanding(a): |
|
|
|
|
|
|
|
|
|
|
|
|
|
| |||||
|
Basic |
|
67,515.7 |
|
|
64,702.1 |
|
|
60,364.7 |
|
|
52,927.0 |
|
48,201.8 |
| |||||
|
Diluted |
|
68,028.2 |
|
|
65,193.8 |
|
|
61,002.7 |
|
|
53,611.9 |
|
48,689.4 |
| |||||
|
FFO – Diluted, as adjusted by the Company per share/unit |
|
$ |
4.33 |
|
|
$ |
4.37 |
|
|
$ |
4.13 |
|
|
$ |
3.54 |
|
$ |
3.10 |
|
(a) Basic includes common stock outstanding plus UPREIT Units which can be converted into shares of common stock. Diluted includes additional common stock equivalents.
All REITs may not be using the same definition for FFO. Accordingly, the above presentation may not be comparable to other similarly titled measures of FFO of other REITs.
Item 7. Management’s Discussion and Analysis of Financial Condition and Results of Operations
Overview
Management’s Discussion and Analysis of Financial Condition and Results of Operations is intended to facilitate an understanding of the Company’s business and results of operations. It should be read in conjunction with the Consolidated Financial Statements, the accompanying Notes to Consolidated Financial Statements and the selected financial data included in this Form 10-K. This Form 10-K, including the following discussion, contains forward-looking statements regarding future events or trends as described more fully under “Forward-Looking Statements” on page 59. Actual results could differ materially from those projected in such statements as a result of the risk factors described in Item 1A, “Risk Factors,” of this Form 10-K.
The Company is engaged in the ownership, management, acquisition and repositioning of apartment communities in suburbs of major metropolitan areas, primarily along the East Coast of the United States. As of December 31, 2014, the Company owned and operated 121 apartment communities with 42,107 apartments.
Executive Summary
The Company operated during 2014 in a stable economic environment, where the Company’s markets and the country as a whole experienced job growth of 1.2% and 2.3%, respectively. This is consistent with the job growth in the Company’s markets of 1.2% in 2013. An increase in job growth historically leads to household formations, which creates an increase in demand for rental housing. In addition, the credit crisis of the past recession has made it more difficult for apartment residents who may have considered purchasing a home to qualify for a mortgage. After years of home ownership being the number one reason our residents gave for moving out of our apartment communities, it dropped starting in 2007, such that it was the number five reason in 2013 and 2014. The combination of steady job growth and reduced flexibility for residents to purchase homes has created an environment supporting higher rental income growth and occupancy rates.
The Company owned 113 communities with 39,253 apartment units throughout 2013 and 2014 where comparable operating results are available for the years presented (the “2014 Core Properties”). Physical occupancies at the 2014 Core Properties remained constant at 95.2% between the years 2014 and 2013. Including bad debt in the calculation to arrive at “economic occupancy”, this metric also remained the same at 94.1%. The level of bad debt improved to 90 basis points in 2014 compared to 91 basis points in 2013. For 2015, we are projecting bad debt to be approximately 80 basis points of rental income plus utility recovery.
The Company uses a measurement referred to as Available to Rent, or “ATR”. This is a leading indicator of future occupancy rates and refers to units which will be available for rent, based upon leases signed or termination notices received relating to future move in/move out dates. As of the end of the first week of February, 2015 and 2014, our ATR was 5.1% and 7.1%, respectively. Average physical occupancy for the quarter ended December 31, 2014 was at a level of occupancy at 95.0%, with a continuation of low resident turnover for 2014 of 39.9%, down from the 40.3% experienced in 2013. For 2015, we are projecting physical occupancy to be 20 basis points higher than 2014 based on current occupancy trends.
Total 2014 Core Properties rental revenue growth for 2014 was projected to be 3.2%, consisting of an increase of 3.0% in rental rate growth with economic occupancy to increase 0.2%. Actual results were positive 2.7% in rental rate growth with no change in economic occupancy resulting in 2.7% total rental revenue growth.
Executive Summary (continued)
The guidance for 2015 Core Properties (apartment units owned throughout 2014 and 2015, the “2015 Core Properties”) total revenue growth is 3.0% at the midpoint of guidance. Rental rates are projected to increase 3.1%, including above-average rental increases at certain communities resulting from continued efforts to upgrade the properties. Economic occupancies are expected to increase 0.4% for the year, such that rental revenues are projected to increase 3.5%. The property other income growth rate is expected to be negative, decreasing total revenue growth by 0.5%, resulting in the net 3.0% total revenue growth projected. Property other income includes utility reimbursements which will be higher in years where we experience extreme winter weather conditions. For 2015, the Company has projected a normal winter resulting in lower utility reimbursements and corresponding utility expense.
After four consecutive years of expense decreases (2009-2012), and a slight increase of 1.8% in 2013, the Company projected 2014 expenses to increase 3.5% at the midpoint of guidance. Actual results were an increase of 5.6% which included above average increases in repairs and maintenance costs, real estate taxes, property insurance and snow removal costs. For 2015, the Company expects savings in utilities, property insurance and snow removal costs to be partially offset by increases in repairs and maintenance costs, personnel costs (specifically from health care and the effects of new regulations) and real estate taxes. Expenses for 2015 Core Properties are projected to increase 1.5% at the midpoint of guidance.
These revenue and expense projections result in 2015 Core Properties NOI growth of 4.0% at the midpoint of 2015 guidance. Markets where the Company expects NOI results above the average include: Boston 5.8%, Chicago 5.3%, Southeast Florida 5.1%, Philadelphia 4.7% and Northern New Jersey 4.2%. Markets with below average expectations include: Long Island 3.8%, Baltimore 3.6%, and Washington, D.C. 3.2%. Certain historical demographic information for these markets may be found in the tables on pages 10 and 11 of this report.
Of the two items comprising NOI, revenue and operating expenses, the operating expense component is likely to be more volatile. It is difficult to predict the weather, which can have a significant effect, and there continues to be growing concern about real estate tax reassessments.
The Company has anticipated acquisitions in the range of $250 million to $350 million in its budget for 2015. The Company is committed to a disciplined approach to acquisitions. If cap rates stabilize, interest rates continue to be historically low, and NOI growth rates improve, the Company may take a more aggressive approach. The Company expects to dispose of between $100 million and $200 million of properties for 2015. After being a net seller in both 2013 and 2014, the Company is looking to become a net acquirer in 2015.
During 2015, the Company will target leverage at a level equal to or slightly less than the level at December 31, 2014 of 38.0% of debt-to-total value (value as calculated under the terms of the line of credit facility) in order to meet the goals described above.
Results of Operations (dollars in thousands, except unit and per unit data)
Comparison of year ended December 31, 2014 to year ended December 31, 2013
The Company owned 113 communities with 39,253 apartment units throughout 2013 and 2014 where comparable operating results are available for the years presented (the “2014 Core Properties”). For the year ended December 31, 2014, the 2014 Core Properties showed an increase in total revenues of 2.9% and a net operating income increase of 1.5% over the 2013 period. Property level operating expenses increased 5.6%. Average physical occupancy for the 2014 Core Properties remained steady at 95.2% for both 2014 and 2013, and average monthly rental rates increased to $1,329 per apartment unit, an increase of 2.7% over the 2013 period.
A summary of the 2014 Core Properties NOI is as follows:
|
|
|
2014 |
|
|
2013 |
|
$ Variance |
|
% Variance |
| ||
|
Rent |
|
$589,056 |
|
|
$573,681 |
|
|
$15,375 |
|
|
2.7% |
|
|
Utility recovery revenue |
|
24,656 |
|
|
22,937 |
|
|
1,719 |
|
|
7.5% |
|
|
Rent including recoveries |
|
613,712 |
|
|
596,618 |
|
|
17,094 |
|
|
2.9% |
|
|
Other income |
|
28,964 |
|
|
27,651 |
|
|
1,313 |
|
|
4.7% |
|
|
Total revenue |
|
642,676 |
|
|
624,269 |
|
|
18,407 |
|
|
2.9% |
|
|
Operating and maintenance |
|
(237,529 |
) |
|
(225,023 |
) |
|
(12,506 |
) |
|
(5.6% |
) |
|
Net operating income |
|
$405,147 |
|
|
$399,246 |
|
|
$5,901 |
|
|
1.5% |
|
NOI falls within the definition of “non-GAAP financial measure” set forth in Item 10(e) of Regulation S-K and, as a result, the Company is required to include in this report a statement disclosing the reasons why management believes that presentation of this measure provides useful information to investors. The Company believes that NOI is helpful to investors as a supplemental measure of the operating performance of a real estate company because it is a direct measure of the actual operating results of the Company’s apartment communities. In addition, the apartment communities are valued and sold in the market by using a multiple of NOI. The Company also uses this measure to compare its performance to that of its peer group. For a reconciliation of NOI to income from continuing operations, please refer to Note 12 to Consolidated Financial Statements, under Part IV, Item 15 of this Form 10-K.
During 2014, the Company acquired three apartment communities with a total of 1,052 units and placed into service another 404 units at two development communities (the “2014 Acquisition Communities”). In addition, the Company experienced full year results for the two apartment communities with 457 units acquired and one development community with 90 units placed into service during 2013 (the “2013 Acquisition Communities”). The Company has one community with 851 units undergoing significant renovations beginning in 2011 such that the operating results are not comparable to 2014 due to units being taken out of service during the redevelopment period (the “Redevelopment Community”). The inclusion of these acquired and developed communities generally accounted for the significant changes in operating results for the year ended December 31, 2014.
Results of Operations (continued)
A summary of the NOI from continuing operations for the Company as a whole is as follows:
|
|
|
2014 |
|
|
2013 |
|
$ Variance |
|
% Variance |
| ||
|
Rent |
|
$616,160 |
|
|
$587,052 |
|
|
$29,108 |
|
|
5.0% |
|
|
Utility recovery revenue |
|
25,289 |
|
|
23,448 |
|
|
1,841 |
|
|
7.9% |
|
|
Rent including recoveries |
|
641,449 |
|
|
610,500 |
|
|
30,949 |
|
|
5.1% |
|
|
Other income |
|
30,102 |
|
|
28,123 |
|
|
1,979 |
|
|
7.0% |
|
|
Total revenue |
|
671,551 |
|
|
638,623 |
|
|
32,928 |
|
|
5.2% |
|
|
Operating and maintenance |
|
(249,509 |
) |
|
(230,098 |
) |
|
(19,411 |
) |
|
(8.4% |
) |
|
Net operating income |
|
$422,042 |
|
|
$408,525 |
|
|
$13,517 |
|
|
3.3% |
|
During 2014, the Company disposed of three properties in four transactions with a total of 1,527 units, which had partial results for 2014 and full year results for 2013. During 2013, the Company disposed of four properties in four transactions with a total of 1,013 units, which had partial results for 2013. The results of these disposed properties have been reflected in discontinued operations and are not included in the tables above.
For the year ended December 31, 2014, income from continuing operations increased by $5,412 when compared to the year ended December 31, 2013. The increase was primarily attributable to the following factors: an increase in rental income of $29,108, an increase in property other income of $3,820, a decrease in general and administrative expense of $1,821, and a decrease in interest expense of $10,441. These changes were partially offset by increases in operating and maintenance expense of $19,411, depreciation and amortization of $13,748, other expenses of $422, and impairment and other charges of $5,382. Each of the items are described in more detail below.
Of the $29,108 increase in rental income, $6,131 is attributable to the 2013 Acquisition Communities, $7,583 is attributable to the 2014 Acquisition Communities and $19 is attributable to the Redevelopment Community. The balance, an increase of $15,375, relates to a 2.7% increase from the 2014 Core Properties due primarily to an increase of 2.7% in weighted average rental rates to $1,329 from $1,294 per apartment unit, accompanied by consistent economic occupancy which was 94.1% for both periods.
Of the $1,841 increase in utility recovery revenue, $62 is attributable to the 2013 Acquisition Communities, $97 is attributable to the 2014 Acquisition Communities, and $1,719 relates to a 7.5% increase from the 2014 Core Properties, primarily due to a new trash recovery program that rolled out during 2013 and colder than normal temperatures in the winter of 2014 compared to warmer temperatures in the winter of 2013, leading to increased energy consumption and higher heat billed through to residents. These increases were partially offset by a $37 reduction for the Redevelopment Community.
The remaining property other income, which consists primarily of income from operation of laundry facilities, late charges, administrative fees, garage and carport rentals, revenue from corporate apartments, cable revenue, pet charges, and miscellaneous charges to residents, increased by $1,979. Of this increase, $249 is attributable to the 2013 Acquisition Communities, $389 is attributable to the 2014 Acquisition Communities, and $28 is attributable to the Redevelopment Community. The balance, an increase of $1,313, is attributable to the 2014 Core Properties resulting primarily from an increase of $610 due to higher late fees, damages and other charges and $462 relating to a higher level of incentive rebates. The remaining 2014 Core Properties increase of $241 primarily relates to increases in cable revenue, pet fee income and commercial rent, partially offset by lower corporate apartment revenue.
Of the $19,411 increase in operating and maintenance expenses, $2,501 is attributable to the 2013 Acquisition Communities, $4,350 is attributable to the 2014 Acquisition Communities and $54 is attributable to the Redevelopment Community. The balance, an increase of $12,506, relates to a 5.6% increase from the 2014 Core Properties primarily as a result of increases in repairs & maintenance, personnel expense, property insurance, real estate taxes and snow removal costs. These increases were partially offset by decreases in legal & professional and property management G&A.
Results of Operations (continued)
The breakdown of operating and maintenance costs for the 2014 Core Properties by line item is listed below:
|
|
|
2014 |
|
|
2013 |
|
$ Variance |
|
% Variance |
| |||||
|
Electricity |
|
$ |
7,980 |
|
|
$ |
7,824 |
|
|
$ |
(156 |
) |
|
(2.0% |
) |
|
Gas |
|
13,955 |
|
|
13,466 |
|
|
(489 |
) |
|
(3.6% |
) | |||
|
Water & sewer |
|
18,618 |
|
|
18,303 |
|
|
(315 |
) |
|
(1.7% |
) | |||
|
Repairs & maintenance |
|
33,243 |
|
|
31,666 |
|
|
(1,577 |
) |
|
(5.0% |
) | |||
|
Personnel expense |
|
53,575 |
|
|
52,209 |
|
|
(1,366 |
) |
|
(2.6% |
) | |||
|
Advertising |
|
4,991 |
|
|
4,985 |
|
|
(6 |
) |
|
(0.1% |
) | |||
|
Legal & professional |
|
1,152 |
|
|
1,750 |
|
|
598 |
|
|
34.2% |
| |||
|
Office & telephone |
|
6,611 |
|
|
6,354 |
|
|
(257 |
) |
|
(4.0% |
) | |||
|
Property insurance |
|
9,352 |
|
|
6,315 |
|
|
(3,037 |
) |
|
(48.1% |
) | |||
|
Real estate taxes |
|
65,551 |
|
|
60,589 |
|
|
(4,962 |
) |
|
(8.2% |
) | |||
|
Snow |
|
2,405 |
|
|
1,290 |
|
|
(1,115 |
) |
|
(86.4% |
) | |||
|
Trash |
|
3,670 |
|
|
3,511 |
|
|
(159 |
) |
|
(4.5% |
) | |||
|
Property management G&A |
|
16,426 |
|
|
16,761 |
|
|
335 |
|
|
2.0% |
| |||
|
Total |
|
$ |
237,529 |
|
|
$ |
225,023 |
|
|
$ |
(12,506 |
) |
|
(5.6% |
) |
Natural gas heating costs were up $489, or 3.6%, from a year ago due to increased consumption resulting from a colder heating season in 2014 as compared to 2013 partially offset by lower commodity rates and a decreased dependence on fuel oil at a number of our properties where we converted to natural gas during 2014. For 2014, the Company’s natural gas weighted average cost, including transportation of $3.00 per decatherm, was $7.62 per decatherm, compared to $7.78 per decatherm for the 2013 period, a 2.1% decrease.
In January, 2015, the Company has fixed-price contracts covering 100% of its natural gas exposure for the balance of the 2014-15 heating season. Risk is further diversified by staggering contract term expirations. For the balance of the 2014-15 heating season, the Company estimates the average price per decatherm will be approximately $4.43, excluding transportation, which has historically approximated $3.00 per decatherm. For the 2015-16 heating season, the Company has fixed-priced contracts covering approximately 99.1% of its natural gas exposure for an estimated weighted average cost for fixed and floating rate contracts of $4.39 per decatherm, excluding transportation.
Water & sewer costs were up $315, or 1.7%, from a year ago and are attributable to a new storm water tax experienced at several of our Maryland properties and general rate increases being assessed by local municipalities. The water & sewer recovery program enabled the Company to recapture much of these rate increases from our residents.
Repairs & maintenance expenses were up $1,577, or 5.0%, primarily due to proceeds from an insurance claim exceeding the cost basis of destroyed assets, related to a significant fire in the 2013 period of $1,227. Without the impact of the fire loss recovery, the recurring repairs & maintenance expenses increased $350, or 1.1%.
Personnel expenses were up $1,366, or 2.6%, primarily due to an increase of $349, or 8.8%, in health insurance, which was driven by new fees assessed as part of the Affordable Care Act in 2014, coupled with the annual wage increase of 2.7%, or $1,050. These increases were partially offset by $70, or 9.1%, lower workers compensation insurance costs driven by favorable claims experience and $129, or 5.2%, lower incentive compensation for property management personnel.
Advertising expenses were up $6, or 0.1%, reflecting a continuing shift of $65 lower spending on print media and more emphasis on internet advertising and referral programs of $54 which contributed to a 3.3% increase in signed leases despite a 5.5% decrease in traffic in 2014 compared to 2013.
Legal and professional costs were $598, or 34.2% lower, primarily due to fewer successful tax assessment challenges in 2014.
Results of Operations (continued)
Office & telephone expenses were up $257, or 4.0%, reflecting an increase in computer fees related to new internet-based application software which contributed to a 3.3% increase in signed leases in 2014 compared to 2013.
Property insurance costs increased by $3,037, or 48.1%, primarily due to higher self insured property losses in 2014 compared to 2013. The 2014 losses included $964 higher fire losses as compared to 2013, seventy-five properties experiencing $814 in losses due to pipe breaks caused by the extreme cold weather in all of our regions and $494 in water intrusion related losses due to heavy wind and severe rain storms that impacted a significant number of our properties in the Mid-Atlantic regions. The 2013 period contained a $288 one-time insurance reimbursement and experienced no significant storm or weather-related losses. The 2014 general liability losses were $189, or 11.3% higher than 2013, due to the impact of the harsher winter conditions experienced in 2014 compared to the mild winter of 2013. Without the impact of the major items above, recurring property and general liability insurance costs were up $288, or 8.9%.
Real estate taxes were up $4,962, or 8.2%, primarily due to typical rate increases and annual tax assessment increases in our markets, some of which are triggered by our investments in apartment upgrades and repositioning. If not for successful tax assessment challenges and tax incentive programs which resulted in savings of $170 and $2,013 in 2014 and 2013, respectively, property taxes increased $3,120, or 5.0%. The Company continues to challenge tax assessments and apply for tax incentive programs on existing properties where appropriate.
Snow removal costs were up $1,115, or 86.4%, primarily due to the Mid-Atlantic region experiencing significantly higher than normal snowfall and more numerous snow storms than in the 2013 period.
Property management general & administrative costs decreased $335, or 2.0%. Despite increases in the number of apartment communities and units, the Company has been able to offset costs of growth due to its scalable operating platform, including efficiencies enabled by key application software investments.
The operating expense ratio (the ratio of operating and maintenance expense compared to rental and property other income) for the 2014 Core Properties was 37.0% and 36.0% for 2014 and 2013, respectively. The 1.0% increase in 2014 is due in part to higher property insurance resulting from fire losses, lower level of tax refunds and the effects of a much harsher winter. In general, the Company’s operating expense ratio is higher than that experienced by apartment owners in other parts of the country due to relatively high real estate taxes and heating costs in its markets.
General and administrative expenses (“G&A”) decreased in 2014 by $1,821, or 6.4%, from $28,507 in 2013 to $26,686 in 2014. G&A as a percentage of total revenues (including discontinued operations) was 3.9% for 2014 as compared to 4.2% for 2013. Stock-based compensation costs were $298, or 3.3% lower due primarily to $679 lower stock option expense due to the discontinuance of stock option grants in 2014 which was partially offset by $181 increase in executive equity compensation from the performance based restricted stock unit program that began in 2012 and $200 higher director restricted grants due to the addition of two new directors in 2014. In addition, the 2014 corporate bonus costs were $1,366, or 39.4%, less than the 2013 period.
Interest expense decreased by $10,441, or 9.5%, in 2014 primarily as a result of paying off $79,000 in maturing loans on several Core Properties over the past year. In addition, only one of the three 2014 Acquisition Communities was acquired with assumed secured mortgage debt of $33,696 and both 2013 Acquisition Communities were acquired without secured mortgage debt. Refer to the information under the heading “Liquidity and Capital Resources” below for specific discussion of debt transactions impacting the average rate and overall interest expense.
Results of Operations (continued)
Depreciation and amortization expense increased $13,748, or 8.2%, due to a full year of depreciation expense for the 2013 Acquisition Communities, incremental depreciation on the capital expenditures for additions and improvements to the Core Properties of $122,379 and $128,357 in 2014 and 2013, respectively, as well as a partial year of depreciation expense for the 2014 Acquisition Communities.
Other expenses of $734 in 2014 and $312 in 2013 are property acquisition costs, primarily transfer taxes and title fees, which represent 0.52% and 0.56% of the total purchase price of the 2014 and 2013 Acquisition Communities, respectively.
Impairment and other charges of $5,382 were incurred in 2014 in connection with the decision to discontinue new property development.
Net income decreased $2,108 in 2014 primarily due to $8,146 lower income from discontinued operations in 2014 compared to 2013. This is partially offset by an increase in income from continuing operations of $5,412 due to improved operating results from the 2014 Core Properties, the full year results of the 2013 Acquisition Communities plus a partial year impact of the operating results of the 2014 Acquisition Communities.
Comparison of year ended December 31, 2013 to year ended December 31, 2012
The Company owned 109 communities with 36,921 apartment units throughout 2012 and 2013 where comparable operating results are available for the years presented (the “2013 Core Properties”). For the year ended December 31, 2013, the 2013 Core Properties showed an increase in total revenues of 3.2% and a net operating income increase of 4.0% over the 2012 period. Property level operating expenses increased 1.8%. Average physical occupancy for the 2013 Core Properties was 95.2%, down from 95.5% in 2012, with average monthly rental rates of $1,295 per apartment unit, an increase of 3.2% over the 2012 period.
A summary of the 2013 Core Properties NOI is as follows:
|
|
|
2013 |
|
|
2012 |
|
$ Variance |
|
% Variance |
| ||
|
Rent |
|
$541,514 |
|
|
$524,823 |
|
|
$16,691 |
|
|
3.2% |
|
|
Utility recovery revenue |
|
21,867 |
|
|
21,297 |
|
|
570 |
|
|
2.7% |
|
|
Rent including recoveries |
|
563,381 |
|
|
546,120 |
|
|
17,261 |
|
|
3.2% |
|
|
Other income |
|
26,424 |
|
|
25,296 |
|
|
1,128 |
|
|
4.5% |
|
|
Total revenue |
|
589,805 |
|
|
571,416 |
|
|
18,389 |
|
|
3.2% |
|
|
Operating and maintenance |
|
(213,056 |
) |
|
(209,189 |
) |
|
(3,867 |
) |
|
(1.8% |
) |
|
Net operating income |
|
$376,749 |
|
|
$362,227 |
|
|
$14,522 |
|
|
4.0% |
|
During 2012, the Company acquired three apartment communities with a total of 2,018 units and placed into service another 314 units at two development communities (the “2012 Acquisition Communities”). The inclusion of the 2013 Acquisition Communities and 2012 Acquisition Communities generally accounted for the significant changes in operating results for the year ended December 31, 2013.
Results of Operations (continued)
A summary of the NOI from continuing operations for the Company as a whole is as follows:
|
|
|
2013 |
|
|
2012 |
|
$Variance |
|
% Variance |
| ||
|
Rent |
|
$587,052 |
|
|
$554,499 |
|
|
$32,553 |
|
|
5.9% |
|
|
Utility recovery revenue |
|
23,448 |
|
|
22,291 |
|
|
1,157 |
|
|
5.2% |
|
|
Rent including recoveries |
|
610,500 |
|
|
576,790 |
|
|
33,710 |
|
|
5.8% |
|
|
Other income |
|
28,123 |
|
|
26,619 |
|
|
1,504 |
|
|
5.7% |
|
|
Total revenue |
|
638,623 |
|
|
603,409 |
|
|
35,214 |
|
|
5.8% |
|
|
Operating and maintenance |
|
(230,098 |
) |
|
(220,853 |
) |
|
(9,245 |
) |
|
(4.2% |
) |
|
Net operating income |
|
$408,525 |
|
|
$382,556 |
|
|
$25,969 |
|
|
6.8% |
|
During 2014, the Company disposed of three properties in three transactions with a total of 1,527 units, which had full year results for 2013 and 2012. During 2013, the Company disposed of four properties in four transactions with a total of 1,013 units, which had partial results for 2013 and full year results for 2012. The results of these disposed properties have been reflected in discontinued operations and are not included in the tables above.
For the year ended December 31, 2013, income from continuing operations increased by $32,885 when compared to the year ended December 31, 2012. The increase was primarily attributable to the following factors: an increase in rental income of $32,553, an increase in property other income of $2,661, a decrease in general and administrative expense of $5,667, a decrease in interest expense of $9,795, and a decrease in other expenses of $2,429. These changes were partially offset by increases in operating and maintenance expense of $9,245, and depreciation and amortization of $11,843. Each of the items are described in more detail below.
Of the $32,553 increase in rental income, $14,606 is attributable to the 2012 Acquisition Communities, $99 is attributable to the 2013 Acquisition Communities, and $1,157 is attributable to the Redevelopment Community. The balance, an increase of $16,691, relates to a 3.2% increase from the 2013 Core Properties due primarily to an increase of 3.2% in weighted average rental rates to $1,295 from $1,254 per apartment unit, accompanied by consistent economic occupancy, which was 94.4% for both periods.
Of the $1,157 increase in utility recovery revenue, $558 is attributable to the 2012 Acquisition Communities, and $29 is attributable to the Redevelopment Community. The balance, an increase of $570, relates to a 2.7% increase from the 2013 Core Properties, primarily due to a new trash recovery program in 2013 and an increase in water & sewer costs, which are billed to residents.
The remaining property other income, which consists primarily of income from operation of laundry facilities, late charges, administrative fees, garage and carport rentals, revenue from corporate apartments, cable revenue, pet charges, and miscellaneous charges to residents, increased by $1,504. Of this increase, $491 is attributable to the 2012 and 2013 Acquisition Communities and $1,128 is attributable to the 2013 Core Properties resulting primarily from an increase of $786 in damages and other charges due to increased resident turnover. The remaining Core Properties increase of $342 primarily relates to increases in renter’s insurance door fees, pet fee income, corporate apartment revenue, late fees and incentive rebates, partially offset by lower cable revenue due to the 2012 period including nonrecurring income as a result of signing new contracts with cable providers which offer enhanced services in addition to basic cable. These increases were partially offset by a $115 reduction for the Redevelopment Community.
Of the $9,245 increase in operating and maintenance expenses, $5,092 is attributable to the 2012 Acquisition Communities, $159 is attributable to the 2013 Acquisition Communities and $114 is attributable to the Redevelopment Community. The balance, an increase of $3,867, relates to a 1.8% increase from the 2013 Core Properties primarily as a result of increases in personnel expense, real estate taxes and snow removal costs. These increases were partially offset by decreases in property insurance and property management G&A.
Results of Operations (continued)
The breakdown of operating and maintenance costs for the 2013 Core Properties by line item is listed below:
|
|
|
|
2013 |
|
|
2012 |
|
$ Variance |
|
% Variance |
| |||||
|
Electricity |
|
|
$ |
7,270 |
|
|
$ |
7,275 |
|
|
$ |
5 |
|
|
0.1% |
|
|
Gas |
|
|
13,159 |
|
|
13,072 |
|
|
(87 |
) |
|
(0.7% |
) | |||
|
Water & sewer |
|
|
17,528 |
|
|
17,365 |
|
|
(163 |
) |
|
(0.9% |
) | |||
|
Repairs & maintenance |
|
|
30,024 |
|
|
30,136 |
|
|
112 |
|
|
0.4% |
| |||
|
Personnel expense |
|
|
49,352 |
|
|
47,528 |
|
|
(1,824 |
) |
|
(3.8% |
) | |||
|
Advertising |
|
|
4,636 |
|
|
4,684 |
|
|
48 |
|
|
1.0% |
| |||
|
Legal & professional |
|
|
1,665 |
|
|
1,671 |
|
|
6 |
|
|
0.4% |
| |||
|
Office & telephone |
|
|
6,067 |
|
|
6,254 |
|
|
187 |
|
|
3.0% |
| |||
|
Property insurance |
|
|
5,725 |
|
|
6,522 |
|
|
797 |
|
|
12.2% |
| |||
|
Real estate taxes |
|
|
57,375 |
|
|
54,927 |
|
|
(2,448 |
) |
|
(4.5% |
) | |||
|
Snow |
|
|
1,273 |
|
|
419 |
|
|
(854 |
) |
|
(203.8% |
) | |||
|
Trash |
|
|
3,182 |
|
|
3,212 |
|
|
30 |
|
|
0.9% |
| |||
|
Property management G&A |
|
|
15,800 |
|
|
16,124 |
|
|
324 |
|
|
2.0% |
| |||
|
Total |
|
|
$ |
213,056 |
|
|
$ |
209,189 |
|
|
$ |
(3,867 |
) |
|
(1.8% |
) |
Natural gas heating costs were up $87, or 0.7%, from 2012 due to increased consumption resulting from a colder heating season in 2013 as compared to 2012 partially offset by lower commodity rates. For 2013, the Company’s natural gas weighted average cost, including transportation of $3.00 per decatherm, was $7.78 per decatherm, compared to $8.32 per decatherm for the 2012 period, a 6.5% decrease.
Water & sewer costs were up $163, or 0.9%, from 2012 and are attributable to general rate increases being assessed by local municipalities. The water & sewer recovery program enabled the Company to recapture much of these rate increases from our residents.
Repairs & maintenance expenses were down $112, or 0.4%, primarily due to accounting for involuntary conversions related to fires and floods and the associated insurance claims at certain properties. Without the impact of these recoveries, the recurring repairs & maintenance expenses increased $839, or 2.8%, as a result of higher resident turnover of 40.5% in 2013 as compared to 39.0% in 2012, which leads to higher spending on apartment turnover costs.
Personnel expenses were up $1,824, or 3.8%, primarily due to a significant increase of $1,830, or 95.2%, in health insurance, which was driven by higher self-insured claims in 2013, coupled with the annual wage increase of 2.6%, or $1,100. These increases were partially offset by $814, or 54.3%, lower workers compensation insurance costs driven by favorable claims experience and $377, or 14.1%, lower incentive compensation for property management personnel.
Results of Operations (continued)
Advertising expenses were down $48, or 1.0%, in 2013 reflecting the resident marketing program which placed less emphasis and spending on print media than in 2012 and more focus on internet-based methods and resident programs which contributed to a 2.5% increase in signed leases in 2013 compared to 2012.
Office & telephone expenses were down $187, or 3.0%, primarily due to $249 non-recurring refunds of certain resident fees from prior years in 2012. Without the impact of this non-recurring expense, office & telephone expense decreased $62, or 1.0%.
Property insurance costs decreased by $797, or 12.2%, primarily due to continued favorable close-outs of prior year self insured general liability claims, which yielded $1,378 in savings in 2013 compared to $338 in 2012 and favorable close-outs of prior year property claims of $505 in 2013. These savings were offset by property losses in 2013 of $2,644 compared to $1,421 in 2012, with the 2013 increase attributable to a significant fire at one of the Company’s communities. Without the impact of the major items above, recurring property and general liability insurance costs were down $475, or 8.7%.
Real estate taxes were up $2,448, or 4.5%, primarily due to typical rate increases and annual tax assessment increases in our markets, some of which are triggered by our investments in apartment upgrades and repositioning. If not for successful tax assessment challenges and tax incentive programs which resulted in savings of $2,098 and $1,306 in 2013 and 2012, respectively, property taxes increased $3,240, or 5.8%. The Company continues to challenge tax assessments on existing properties and apply for tax incentive programs for newly developed properties where appropriate.
Snow removal costs were up $854, or 203.8%, primarily due to 2013 experiencing a more normal winter season compared to 2012 where most of our Northeast and Mid-Atlantic properties experienced the mildest winter on record.
Property management general & administrative costs decreased $324, or 2.0%. Despite increases in the number of apartment communities and units, the Company has been able to offset costs of growth due to its scalable operating platform, including efficiencies enabled by key application software investments.
The operating expense ratio (the ratio of operating and maintenance expense compared to rental and property other income) for the 2013 Core Properties was 36.1% and 36.6% for 2013 and 2012, respectively. The 0.5% favorable improvement in 2013 is due in part to deliberate cost savings and safety initiatives implemented at the communities and rental income growth. In general, the Company’s operating expense ratio is higher than that experienced by apartment owners in other parts of the country due to relatively high real estate taxes and heating costs in its markets.
General and administrative expenses (“G&A”) decreased in 2013 by $5,667, or 16.6%, from $34,174 in 2012 to $28,507 in 2013. G&A as a percentage of total revenues (including discontinued operations) was 4.2% for 2013 as compared to 5.2% for 2012. The 2012 costs included $1,580 in connection with the departure of an executive and represent acceleration of previously granted stock-based compensation as well as future payments for salary continuation. Employee stock-based compensation expenses were down $3,391, or 28.4%, in 2013, of which $3,910 was due to a final grant of arrears-based restricted stock and stock options in the 2012 period to executives, which did not occur in 2013 as the executive equity compensation switched primarily to a new three year performance restricted stock unit program in 2012. The cost of the performance based equity program was $519 higher in 2013 due to the impact of executives at, or near retirement age, being expensed immediately or over a one year shorter period in 2013. In addition, the 2013 corporate bonus costs were $922 less than the 2012 period.
Interest expense decreased by $9,795, or 8.2%, in 2013 primarily as a result of paying off $250,000 in maturing loans on several Core Properties over the past year. In addition, both 2013 Acquisition Communities were acquired without secured mortgage debt and only one 2012 Acquisition Community was acquired with assumed secured mortgage debt of $7,284. Refer to the information under the heading “Liquidity and Capital Resources” below for specific discussion of debt transactions impacting the average rate and overall interest expense.
Results of Operations (continued)
Depreciation and amortization expense increased $11,843, or 7.6%, due to a full year of depreciation expense for the 2012 Acquisition Communities, incremental depreciation on the capital expenditures for additions and improvements to the Core Properties of $119,260 and $137,779 in 2013 and 2012, respectively, as well as a partial year of depreciation expense for the 2013 Acquisition Communities.
Other expenses of $312 in 2013 and $2,741 in 2012 are property acquisition costs, primarily transfer taxes and title fees, which represent 0.56% and 0.92% of the total purchase price of the 2013 and 2012 Acquisition Communities, respectively.
Net income increased $27,957 in 2013 primarily due to an increase in income from continuing operations of $32,885 due to improved operating results from the 2013 Core Properties, the full year results of the 2012 Acquisition Communities plus a partial year impact of the operating results of the 2013 Acquisition Communities. This is partially offset by $5,601 lower income from discontinued operation in 2013 compared to 2012.
Liquidity and Capital Resources
General
The Company’s principal liquidity demands are expected to be distributions to the common stockholders and holders of UPREIT Units, capital improvements and repairs and maintenance for its properties, acquisition and debt repayments. The Company may also acquire equity ownership in other public or private companies that own and manage portfolios of apartment communities.
The Company intends to meet its short-term liquidity requirements through cash flows provided by operating activities and its existing bank line of credit, described below. The Company considers its ability to generate cash to be adequate to meet all operating requirements, including availability to pay dividends to its stockholders and make distributions to its Unit holders in accordance with the provisions of the Internal Revenue Code, as amended, applicable to REITs.
To the extent that the Company does not satisfy its short-term liquidity requirements through net cash flows provided by operating activities and its existing bank line of credit, it intends to satisfy such requirements through proceeds from the issuance of unsecured senior notes and from the issuance of its common stock through its equity offering programs, described below, and from the sale of properties.
On October 3, 2014, Standard & Poor’s Ratings Services assigned a BBB issuer rating to the Company with a rating outlook of stable. On October 6, 2014, Fitch, Inc. reaffirmed the Company’s corporate credit rating of BBB with a rating outlook of positive. On December 5, 2014, Moody’s Investors Service reaffirmed the Company’s issuer rating of Baa2 with a stable outlook.
For 2015, plans include increasing the level of the value of unencumbered properties to approximately 58% of the portfolio and maintaining the debt-to-total market capitalization ratio at a level equal to the level at December 31, 2014.
Liquidity and Capital Resources (continued)
Cash Flow Summary
The Company’s cash flow activities are summarized as follows (in millions):
|
|
|
Year Ended December 31, |
| |||||||||
|
Operating Cash Flow Activities |
|
2014 |
|
|
2013 |
|
|
2012 |
| |||
|
Net income |
|
$ |
189 |
|
|
$ |
192 |
|
|
$ |
164 |
|
|
Non-cash adjustments to net income |
|
118 |
|
|
105 |
|
|
106 |
| |||
|
Changes in operating assets and liabilities |
|
(5 |
) |
|
(2 |
) |
|
(2 |
) | |||
|
Cash provided by operating activities |
|
$ |
302 |
|
|
$ |
295 |
|
|
$ |
268 |
|
The Company’s cash flow from operating activities was $302 million in 2014 compared to $295 million in 2013. The increase is primarily attributable to interest expense savings as a result of paying off maturing debt over the past year.
The Company’s cash flow from operating activities was $295 million in 2013 compared to $268 million in 2012. The increase was a result of $27 million higher NOI in 2013 of which $15 million is from Core Properties and $12 million is primarily attributable to the 2013 and 2012 Acquisition Communities.
|
|
|
Year Ended December 31, |
| |||||||||
|
Investing Cash Flow Activities |
|
2014 |
|
|
2013 |
|
|
2012 |
| |||
|
Proceeds from sale of properties |
|
$ |
211 |
|
|
$ |
188 |
|
|
$ |
150 |
|
|
Purchase of properties and land for development, net of mortgage notes assumed |
|
(110 |
) |
|
(98 |
) |
|
(290 |
) | |||
|
Capital improvements to properties including redevelopment |
|
(139 |
) |
|
(144 |
) |
|
(165 |
) | |||
|
Construction in progress and predevelopment costs |
|
(48 |
) |
|
(62 |
) |
|
(62 |
) | |||
|
Other investing activities |
|
(4 |
) |
|
2 |
|
|
1 |
| |||
|
Cash used in investing activities |
|
$ |
(90 |
) |
|
$ |
(114 |
) |
|
$ |
(366 |
) |
Investing activities include the sale and purchase of properties and land for development, capital improvements to properties, redevelopment, construction in progress and predevelopment. The Company considers the sale of properties as a potential source of capital for funding acquisitions. Management’s strategy also includes continuous repositioning and performance of selective rehabilitation in markets that are able to support rent increases, with a demand in the market for upgraded apartments. Changes between periods are primarily due to net acquisition and disposition activity, the rate of capital improvements and construction in progress expenditures for active development projects.
Cash used in investing activities was $90 million during 2014. In 2014, the Company raised $211 million in net proceeds from the sale of three properties with 1,527 units. The Company purchased three properties with 1,052 units for $110 million. Cash outflows for capital improvements and redevelopment were $131 million and $8 million, respectively. Cash outflows for additions to construction in progress were $48 million which were primarily for the development of Eleven55 Ripley and The Courts at Spring Mill Station.
Cash used in investing activities was $114 million during 2013. In 2013, the Company raised $188 million in net proceeds from the sale of four properties with 1,013 units. These proceeds were used to fund the purchase of two properties with 457 units for $56 million and the purchase of two land parcels for development for $42 million. Cash outflows for capital improvements and redevelopment were $137 million and $7 million, respectively. Cash outflows for additions to construction in progress were $62 million which were primarily for the development of Eleven55 Ripley and The Courts at Spring Mill Station.
Liquidity and Capital Resources (continued)
Cash Flow Summary (continued)
Cash used in investing activities was $366 million during 2012. In 2012, the Company raised $150 million in net proceeds from the sale of six properties with 1,596 units. These proceeds were used to fund the purchase of three properties with 2,018 units for $290 million. Cash outflows for capital improvements and redevelopment were $153 million and $12 million, respectively. Cash outflows for additions to construction in progress were $62 million for development of The Apartments at Cobblestone Square, Eleven55 Ripley and The Courts at Spring Mill Station.
|
|
|
Year Ended December 31, |
| |||||||
|
Financing Cash Flow Activities |
|
2014 |
|
2013 |
|
2012 |
| |||
|
Proceeds from equity issuance |
|
$ |
22 |
|
$ |
312 |
|
$ |
162 |
|
|
Proceeds from unsecured debt |
|
176 |
|
31 |
|
210 |
| |||
|
Secured debt repayments |
|
(211) |
|
(351) |
|
(103 |
) | |||
|
Dividends and distributions paid |
|
(197) |
|
(182) |
|
(159 |
) | |||
|
Other financing activities |
|
- |
|
(2) |
|
1 |
| |||
|
Cash provided by (used in) financing activities |
|
$ |
(210) |
|
$ |
(192) |
|
$ |
111 |
|
Financing activities include proceeds from equity issuances, net debt proceeds or payments and dividend and distribution payments. Equity and debt activities are closely aligned with investing activities discussed above. The Company has elected to be taxed as a real estate investment trust (“REIT”) under the Internal Revenue Code of 1986, as amended, which requires the Company to distribute annually at least 90% of its REIT taxable income to its shareholders.
Cash used in financing activities totaled $210 million for 2014, primarily as a result of reducing secured indebtedness. Proceeds raised through the sale of common stock from stock option exercises of $22 million, combined with net proceeds from the unsecured line of credit of $76 million and proceeds from an unsecured loan of $100 million, were offset by scheduled payments on mortgages of $31 million, payoff of mortgages of $180 million and distributions paid to stockholders and UPREIT Unitholders of $197 million.
Cash used in financing activities totaled $192 million for 2013, primarily as a result of reducing secured indebtedness. Proceeds raised through the sale of common stock under the public offering of $268 million, the ATM offering of $29 million and from stock option exercises of $15 million, combined with net proceeds from the unsecured line of credit of $31 million were offset by scheduled payments on mortgages of $34 million, payoff of mortgages of $317 million and distributions paid to stockholders and UPREIT Unitholders of $182 million.
Cash provided by financing activities totaled $111 million for 2012. Net proceeds from the sale of common stock under the ATM offering were $145 million and $17 million from stock option exercises, for combined proceeds of $162 million. The Company raised an additional $210 million in combined net proceeds from the unsecured line of credit of $160 million and $50 million issued in unsecured notes. Total proceeds were partially offset by scheduled payments on mortgages of $36 million, payoff of mortgages of $67 million and distributions paid to stockholders and UPREIT Unitholders of $159 million.
Liquidity and Capital Resources (continued)
Unsecured Line of Credit
As of December 31, 2013, the Company had a $450 million unsecured line of credit agreement with M&T Bank and U.S. Bank National Association, as joint lead banks, and nine other participating commercial banks, with an initial maturity date of August 18, 2017 and a one-year extension, at the Company’s option. The Company had $269 million outstanding under the credit facility on December 31, 2014. The line of credit agreement provides the ability to issue up to $20 million in letters of credit. While the issuance of letters of credit does not increase the borrowings outstanding under the line of credit, it does reduce the amount available. At December 31, 2014, the Company had outstanding letters of credit of $3.8 million resulting in the amount available on the credit facility of $177.2 million. Borrowings under the line of credit bear interest at a variable rate based on LIBOR, plus a spread from 1.00% to 2.00% based on the Company’s leverage ratio. As of December 31, 2014, based on the Company’s leverage ratio, the LIBOR margin was 1.00%, and the one-month LIBOR was 0.19%; resulting in an effective rate of 1.19% for the Company.
Unsecured Term Loans
On December 9, 2011, the Company entered into a $250 million five-year unsecured term loan with M&T Bank as lead bank, and ten other participating lenders, which was set to mature on December 8, 2016. The term loan generated net proceeds of $248 million, after fees and closing costs, which were used to pay off an unsecured term loan, purchase an unencumbered property and acquire land for future development. On August 19, 2013, the Company amended the term loan agreement to extend the maturity date to August 18, 2018. No other changes were made to the terms of the unsecured term loan. The loan bears monthly interest at a variable rate based on LIBOR, plus a spread from 1.00% to 2.00% based on the Company’s leverage ratio. On July 19, 2012, the Company entered into two interest rate swap agreements with major financial institutions that effectively convert the variable LIBOR portion of this loan to a fixed rate of 0.685% through December 7, 2016. On November 4, 2013, the Company entered into three additional interest rate swap agreements that effectively convert the variable LIBOR portion of this loan to a fixed rate of 2.604% for the period of December 8, 2016 through August 18, 2018. As of December 31, 2014, based on the Company’s leverage ratio, the spread was 1.00%, and the swapped one-month LIBOR was 0.685%; resulting in an effective rate of 1.685% for the Company. The loan has covenants that align with the unsecured line of credit facility.
On June 28, 2013, the Company entered into an unsecured loan agreement with M&T Bank with a September 30, 2013 maturity date. The note had a maximum principal amount of $75 million with monthly interest at a variable rate based on LIBOR, plus a spread from 1.00% to 2.00% based on the Company’s leverage ratio. On June 28, 2013, the Company borrowed $25 million which was repaid in its entirety on July 12, 2013. Proceeds from this term loan were utilized to partially fund the repayment of secured debt. On August 19, 2013, the loan commitment was terminated in connection with an amendment to the unsecured line of credit, as more fully described in Note 6 to Consolidated Financial Statements of this Form 10-K.
On November 19, 2014, the Company entered into an unsecured loan agreement with M&T Bank and borrowed $100 million with a May 18, 2015 maturity date. The note has a maximum principal amount of $100 million with monthly interest at a variable rate based on LIBOR, plus a spread from 1.00% to 2.00% based on the Company’s leverage ratio. Proceeds from this term loan were utilized to pay down the line of credit. The loan has covenants that align with the unsecured line of credit facility.
Unsecured Demand Note
On June 27, 2012, the Company entered into a loan agreement with M&T Bank with a maximum principal amount of $100 million and monthly interest at a variable rate based on LIBOR, plus a spread from 1.00% to 2.00% based on the Company’s leverage ratio. The Company borrowed the maximum amount of $100 million. Proceeds from this demand note were utilized to partially fund the purchase of a 1,350 unit apartment community on June 28, 2012. During the fourth quarter, 2012, the Company repaid the $100 million note in full.
Liquidity and Capital Resources (continued)
Unsecured Senior Notes
On December 19, 2011, the Company issued $150 million of unsecured senior notes. The notes were offered in a private placement in two series: Series A: $90 million with a seven-year term due December 19, 2018 at a fixed interest rate of 4.46% (“Series A”); and, Series B: $60 million with a ten-year term due December 19, 2021 at a fixed interest rate of 5.00% (“Series B”). The net proceeds of $89 million and $60 million for Series A and Series B, respectively, after fees and closing costs, were used to purchase an unencumbered property and pay off a maturing mortgage note. The notes require semiannual interest payments on June 19 and December 19 of each year until maturity and are subject to various covenants and maintenance of certain financial ratios. Although the covenants of the notes do not duplicate all the covenants of the unsecured line of credit facility, any covenants applicable to both the notes and the line are identical.
On June 27, 2012, the Company issued a private placement note in the amount of $50 million with a seven-year term, a fixed rate of 4.16% and a June 27, 2019 due date. The proceeds from this note were used to partially fund the purchase of a 1,350 unit apartment community on June 28, 2012. The note requires semiannual interest payments on June 27 and December 27 of each year until maturity and is subject to various covenants and maintenance of certain financial ratios. Although the covenants of the note do not duplicate all the covenants of the unsecured line of credit facility, any covenants applicable to both the note and the line are identical.
Indebtedness
As of December 31, 2014, the weighted average interest rate on the Company’s total indebtedness of $2.5 billion was 4.16% with staggered maturities averaging approximately 3.4 years. Approximately 84% of total indebtedness is at fixed rates. This limits the exposure to changes in interest rates, minimizing the effect of interest rate fluctuations on the Company’s results of operations and cash flows.
Unencumbered Assets
The value of the unencumbered asset pool (as calculated pursuant to the covenants of the line of credit agreement) was 53% as of December 31, 2014 compared to 48% at the end of 2013. Higher levels of unsecured assets add borrowing flexibility because more capacity is available for unsecured debt under the terms of the Company’s unsecured line of credit agreement, and/or for the issuance of additional unsecured senior notes. It also permits the Company to place secured financing on unencumbered assets if desired.
UPREIT Units
The Company believes that the issuance of UPREIT Units for property acquisitions will continue to be a potential source of capital for the Company. During 2014, 2013 and 2012, there were no UPREIT Units issued for property acquisitions.
Universal Shelf Registration
On February 28, 2013, the Company filed a Form S-3 universal shelf registration statement with the SEC that registers the issuance, from time to time, of common stock, preferred stock or debt securities. The Company may offer and sell securities issued pursuant to the universal shelf registration statement after a prospectus supplement, describing the type of security and amount being offered, is filed with the SEC. Sales of common stock under the Company’s equity offerings on or after February 28, 2013, described below, were made under this registration statement.
On March 3, 2010, the Company filed a Form S-3 universal shelf registration statement with the SEC having substantially the same provisions and purposes as the February 2013 registration statement. The registration statement was set to expire in March 2013. Sales of common stock under the Company’s equity offerings through February 27, 2013, described below, as were made under this registration statement.
Liquidity and Capital Resources (continued)
Authorized Capital Stock
On April 29, 2014, the stockholders of the Company approved an amendment to the Company’s Articles of Incorporation to increase the shares of common stock authorized to be issued from 80,000,000 to 160,000,000 shares of common stock, par value $0.01 per share. The newly authorized shares of common stock can be issued from time to time for any corporate purpose deemed advisable by the Board, which may include capital raising transactions of equity or convertible debt securities, stock splits, stock dividends, issuance under current or future equity compensation and incentive plans, employee stock plans and savings plans, conversion of UPREIT Units, and acquisitions of individual properties or portfolios of multiple properties.
At-the-Market Equity Offering Programs
The Company has initiated “At-the-Market” (“ATM”) equity offering programs through which it is authorized to sell shares of common stock from time to time in ATM offerings or negotiated transactions. The Company did not issue any shares of common stock under the current ATM program during 2014. During 2013, the Company issued 0.5 million shares of common stock at an average price per share of $63.51, for aggregate gross proceeds of $29.2 million and aggregate net proceeds of $28.5 million after deducting commissions and other transaction costs of $0.7 million. During 2012, the Company issued 2.4 million shares of common stock at an average price per share of $62.47, for aggregate gross proceeds of $147.8 million and aggregate net proceeds of $144.8 million after deducting commissions and other transaction costs of $3.0 million. As of December 31, 2014, approximately 2.0 million shares remain available to be issued under the current ATM program.
The Company used the net proceeds from the ATM offerings primarily for general corporate purposes including acquisitions, development and redevelopment of apartment communities.
Public Equity Offering Program
On July 9, 2013, the Company issued a prospectus supplement offering 4.4 million shares of its common stock at a price of $63.00 per share, including 0.6 million shares issued pursuant to the exercise in full of an underwriters’ option to purchase additional shares. Net proceeds were $268 million after underwriting discounts, commissions and offering expenses and were used to pay off outstanding indebtedness. All of the 4.4 million shares offered were purchased and subsequently delivered on July 12, 2013.
Stock Repurchase Program
In 1997, the Board approved a stock repurchase program under which the Company may repurchase shares of its common stock or UPREIT Units (“Company Program”). The shares and units may be repurchased through open market or privately negotiated transactions at the discretion of Company management. The Board’s action did not establish a target stock price or a specific timetable for repurchase. There were no repurchases under the Company Program during 2014, 2013 and 2012. The remaining authorization level as of December 31, 2014 is 2.3 million shares. The Company will continue to monitor stock prices relative to the NAV to determine the current best use of capital among our major uses of capital: stock buybacks, debt paydown to increase the unencumbered pool, acquisitions and rehabilitation or redevelopment of owned properties.
Critical Accounting Policies
The preparation of financial statements in conformity with accounting principles generally accepted in the United States of America requires management to make estimates and assumptions in certain circumstances that affect amounts reported in the accompanying consolidated financial statements and related notes. In preparing these financial statements, management has utilized information available including industry practice and its own past history in forming its estimates and judgments of certain amounts included in the financial statements, giving due consideration to materiality. It is possible that the ultimate outcome as anticipated by management in formulating its estimates inherent in these financial statements may not materialize. Application of the accounting policies involves the exercise of judgment and use of assumptions as to future uncertainties and, as a result, actual results could differ from these estimates. In addition, other companies may utilize different estimates which may impact comparability of the Company’s financial position and results of operations to those of companies in similar businesses.
The Company’s significant accounting policies are described in Notes 2 and 3 to Consolidated Financial Statements. These policies were followed in preparing the Consolidated Financial Statements for the year ended December 31, 2014 and are consistent with the year ended December 31, 2013.
The Company has identified the following significant accounting policies as critical accounting policies. These critical accounting policies are those that have the most impact on the reporting of our financial condition and those requiring significant judgments and estimates. With respect to these critical accounting policies, management believes that the application of judgments and estimates is consistently applied and produces financial information that fairly presents the results of operations for all periods presented.
Acquisition of Investments in Real Estate
The Company accounts for its acquisitions of investments in real estate in accordance with the authoritative guidance for the initial measurement, which requires the assets and liabilities acquired to be recognized using fair value. Typical assets and liabilities acquired include land, building, and personal property and identified intangible assets and liabilities, consisting of the value of above-market and below-market leases, value of in-place leases and value of resident relationships, based in each case on their fair values. In making estimates of fair value for purposes of the initial accounting of the purchased real estate, the Company utilizes a number of sources, including our own analysis of recently acquired and existing comparable properties in our portfolio and other market data. The Company also considers information obtained about each property as a result of its pre-acquisition due diligence, marketing and leasing activities in estimating the fair value of the tangible and intangible assets acquired.
Cost Capitalization
The Company capitalizes the payroll and associated costs of employees directly responsible for the supervision and construction of major capital and rehabilitation projects. These costs are reflected on the balance sheet as an increase to buildings, improvements and equipment.
Critical Accounting Policies (continued)
Cost Capitalization (continued)
For development properties, the Company uses its professional judgment in determining whether such costs meet the criteria for capitalization or must be expensed as incurred. Costs directly related to the development of properties are capitalized. The Company capitalizes interest, real estate taxes and insurance and payroll and associated costs for those individuals directly responsible for and who spend all their time on development activities. Determination of when a development project commences and capitalization begins, and when a development project is substantially complete and capitalization must end involves a degree of judgment. We begin the capitalization of costs during the pre-construction period which we define as activities that are necessary to the development of the property. We consider a development property as substantially complete after major construction has ended and the property is available for occupancy. For properties that are built in phases, we end capitalization on the portion of a property that is considered substantially complete, and we capitalize only those costs associated with the portion under construction. These costs are reflected on the balance sheet as construction in progress.
Depreciation of Investments in Real Estate
The Company depreciates the building component of its investment in real estate over a 40-year estimated useful life, building improvements over a 3-year to 20-year estimated useful life and the furniture, fixtures and equipment over a 5-year to 10-year estimated useful life, all of which are judgmental determinations. These assessments have a direct impact on the Company’s net income.
Impairment of Long-Lived Assets
Management reviews its long-lived assets used in operations for impairment when, in accordance with the authoritative guidance for the accounting for the impairment or disposal of long-lived assets, there is an event or change in circumstances that indicates an impairment in value. The judgments regarding the existence of impairment indicators are based on factors such as operational performance, market conditions and legal and environmental concerns, as well as the Company’s ability to hold and its intent with regard to each asset. Future events could occur which could cause the Company to conclude that impairment indicators exist and an impairment charge is warranted.
Fair Value of Financial Instruments Not Carried at Fair Value
For purposes of disclosure, the Company calculates the fair value of its mortgage notes payable, unsecured term loan, unsecured senior notes and unsecured line of credit facility using a discounted future cash flow technique that incorporates observable market-based inputs, including a market interest yield curve with adjustments for duration, loan to value, and risk profile. As the valuation of financial instruments requires the Company to make estimates and judgments in the calculation of the fair value of these instruments, the actual fair value of these financial instruments for disclosure purposes may differ materially if these estimates do not prove to be accurate.
Fair Value of Financial Instruments Carried at Fair Value
The fair value of interest rate swaps are determined using the market standard of netting the discounted future fixed cash receipts (or payments) and the discounted expected variable cash payments (or receipts). The variable cash payments (or receipts) are based on an expectation of future interest rate forward curves derived from observable market interest rate curves. The Company incorporates credit valuation adjustments to appropriately reflect both its own nonperformance risk and the respective counterparty’s nonperformance risk in the fair value measurements. As the valuation of financial instruments requires the Company to make estimates and judgments in the calculation of the fair value of these instruments, the actual fair value of the interest rate swaps may differ materially if these estimates do not prove to be accurate.
Critical Accounting Policies (continued)
Derivative Instruments and Hedging Activities
Derivative instruments and hedging activities require the Company to make judgments on the nature of its derivatives and their effectiveness as hedges. These judgments determine if the changes in fair value of the derivative instruments are reported as a component of net income or as comprehensive income and equity. While the Company believes its judgments are reasonable, a change in a derivative’s effectiveness as a hedge could materially affect expenses, net income and equity.
Recent Accounting Pronouncements
There were no new accounting pronouncements issued or effective during the fiscal year which have had or are expected to have a material impact on the Consolidated Financial Statements. See Note 3 to the Consolidated Financial Statements for further detail on applicable accounting pronouncements that were adopted in 2014 or will be effective for 2015.
Derivative Instruments and Hedging Activities
The Company follows authoritative guidance for disclosure requirements for derivatives and hedging activities with the intent to provide users of financial statements with an enhanced understanding of: (a) how and why an entity uses derivative instruments, (b) how the entity accounts for derivative instruments and related hedged items, and (c) how derivative instruments and related hedged items affect an entity’s financial position, financial performance, and cash flows. Further, qualitative disclosures are required that explain the Company’s objectives and strategies for using derivatives, as well as quantitative disclosures about the fair value of and gains and losses on derivative instruments, and disclosures about credit-risk-related contingent features in derivative instruments.
The Company records all derivatives on the balance sheet at fair value. The accounting for changes in the fair value of derivatives depends on the intended use of the derivative, whether the Company has elected to designate a derivative in a hedging relationship and apply hedge accounting and whether the hedging relationship has satisfied the criteria necessary to apply hedge accounting. Derivatives designated and qualifying as a hedge of the exposure to changes in the fair value of an asset, liability, or firm commitment attributable to a particular risk, such as interest rate risk, are considered fair value hedges. Derivatives designated and qualifying as a hedge of the exposure to variability in expected future cash flows, or other types of forecasted transactions, are considered cash flow hedges. Hedge accounting generally provides for the matching of the timing of gain or loss recognition on the hedging instrument with the recognition of the changes in the fair value of the hedged asset or liability that are attributable to the hedged risk in a fair value hedge or the earnings effect of the hedged forecasted transactions in a cash flow hedge. The Company may enter into derivative contracts that are intended to economically hedge certain of its risks, even though hedge accounting does not apply or the Company elects not to apply hedge accounting.
Contractual Obligations and Other Commitments
The primary obligations of the Company relate to its borrowings under the unsecured line of credit, unsecured notes and mortgage notes. The Company’s line of credit matures in August 2017 (not including a one-year extension, at the option of the Company), and had $269 million in loans and $3.8 million in letters of credit outstanding at December 31, 2014. The $550 million in unsecured notes have maturities ranging from four and one-half months to seven years. The $1.6 billion in mortgage notes have varying maturities ranging from two months to seven years. The principal and interest payments on the borrowings for the years subsequent to December 31, 2014, are set forth in the table below.
The Company leases its corporate office space from a former affiliate and the office space for its regional offices from non-affiliated third parties. The rent for the corporate office space is a gross rent that includes real estate taxes and common area maintenance. The regional office leases are net leases which require an annual base rent plus a pro-rata portion of real estate taxes. These leases are set forth in the table below as “Operating leases.”
Contractual Obligations and Other Commitments (continued)
Purchase obligations represent those costs that the Company is contractually obligated to pay in the future. The significant components of this caption are costs for capital improvements at the Company’s properties, as well as costs for normal operating and maintenance expenses at the site level that are tied to contracts such as utilities, landscaping and grounds maintenance and advertising. The purchase obligations include amounts tied to contracts, some of which expire in 2015. It is the Company’s intention to renew these normal operating contracts, however, there has been no attempt to estimate the length or future costs of these contracts.
Tabular Disclosure of Contractual Obligations:
|
|
|
Payments Due by Period (in thousands) |
| ||||||||||||
|
Contractual Obligations (1) |
|
Total |
|
2015 |
|
2016 |
|
2017 |
|
2018 |
|
2019 |
|
Thereafter |
|
|
Mortgage notes, principal (2) |
|
$1,637,175 |
|
$245,870 |
|
$308,062 |
|
$200,995 |
|
$173,717 |
|
$257,647 |
|
$450,884 |
|
|
Mortgage notes, interest (3) |
|
276,320 |
|
79,651 |
|
58,630 |
|
52,013 |
|
39,214 |
|
26,664 |
|
20,148 |
|
|
Unsecured notes, principal (2) |
|
550,000 |
|
100,000 |
|
- |
|
- |
|
340,000 |
|
50,000 |
|
60,000 |
|
|
Unsecured notes, interest (3) (5) |
|
70,378 |
|
13,817 |
|
13,697 |
|
18,230 |
|
14,717 |
|
4,017 |
|
5,900 |
|
|
Line of credit, principal (2) (4) |
|
269,000 |
|
- |
|
- |
|
269,000 |
|
- |
|
- |
|
- |
|
|
Line of credit, interest (3) |
|
8,401 |
|
3,194 |
|
3,194 |
|
2,013 |
|
- |
|
- |
|
- |
|
|
Operating leases |
|
3,931 |
|
1,925 |
|
1,685 |
|
321 |
|
- |
|
- |
|
- |
|
|
Purchase obligations |
|
4,534 |
|
4,346 |
|
163 |
|
25 |
|
- |
|
- |
|
- |
|
|
|
|
|
|
|
|
|
|
|
|
|
|
|
|
|
|
|
Total |
|
$2,819,739 |
|
$448,803 |
|
$385,431 |
|
$542,597 |
|
$567,648 |
|
$338,328 |
|
$536,932 |
|
(1) The contractual obligations and other commitments in the table are set forth as required by Item 303(a)(5) of Regulation S-K promulgated by the SEC in January of 2003 and are not prepared in accordance with generally accepted accounting principles.
(2) Amounts include principal payments only. The Company will pay interest on outstanding indebtedness based on the rates and terms summarized in Note 6 to Consolidated Financial Statements.
(3) Amounts include interest expected to be incurred on the Company’s secured and unsecured debt based on obligations outstanding at December 31, 2014. For floating rate debt, the current rate in effect for the most recent payment through December 31, 2014 is assumed to be in effect through the respective maturity date of each instrument.
(4) The payment in 2017 assumes that the entire principal amount outstanding on the line of credit as described in Note 6 to Consolidated Financial Statements remains outstanding until the initial expiration in 2017, not including the one-year extension at the Company’s option, and that no new borrowings are made.
(5) For $250,000 unsecured notes subject to interest rate swaps, the swapped rates are assumed as more fully described in Note 8 to Consolidated Financial Statements, and no payments by the Company to the counterparty are assumed.
The Company has a secondary guarantee through 2015 on certain low income housing tax credits to limited partners in a partnership in which it previously was a general partner totaling approximately $3 million. With respect to the guarantee of the low income housing tax credits, the new unrelated general partner assumed operating deficit guarantee and primary tax credit guarantee positions, as more fully described in Note 14 to Consolidated Financial Statements. The Company believes the property’s operations conform to the applicable requirements and does not anticipate any payment on the guarantee; therefore, the secondary guarantee is excluded from the table above.
Off-Balance Sheet Arrangements
As of December 31, 2014, the Company did not have any off-balance sheet transactions, arrangements, or obligations, including contingent obligations, other than those disclosed under Contractual Obligations and Other Commitments.
Contingencies
The Company is not a party to any legal proceedings which are expected to have a material adverse effect on the Company’s liquidity, financial position or results of operations. The Company is subject to a variety of legal actions for personal injury or property damage arising in the ordinary course of its business, most of which are covered by liability and property insurance. Various claims of employment and resident discrimination are also periodically brought, most of which also are covered by insurance. While the resolution of these matters cannot be predicted with certainty, management believes that the final outcome of such legal proceedings and claims will not have a material adverse effect on the Company’s liquidity, financial position or results of operations.
Environmental Issues
Phase I environmental site assessments have been completed on substantially all of the Properties. As of December 31, 2014, there were no recorded amounts resulting from environmental liabilities as there were no known obligations with respect thereto. Furthermore, no condition is known to the Company’s management that would give rise to a liability for site restoration or other costs that may be incurred with respect to the sale or disposal of a property that would be material to the Company as a whole.
Capital Improvements (dollars in thousands, except unit and per unit data)
The Company’s policy is to capitalize costs related to the construction, development, rehabilitation and improvement of properties. Capital improvements are costs that increase the value and extend the useful life of an asset. Ordinary repair and maintenance costs that do not extend the useful life of the asset are expensed as incurred. Costs incurred on a lease turnover due to normal wear and tear by the resident are expensed on the turn. Recurring capital improvements typically include appliances, carpeting and flooring, HVAC equipment, kitchen and bath cabinets, new roofs, site improvements and various exterior building improvements. Non-recurring, revenue generating capital improvements include community centers, new windows, and kitchen and bath apartment upgrades. Revenue generating capital improvements are expected to directly result in rental earnings or expense savings. The Company capitalizes interest and certain internal personnel costs related to the communities under rehabilitation and construction.
Effective January 1, 2014, the Company updated its estimate of the amount of recurring, non-revenue enhancing capital expenditures incurred on an annual basis for a standard garden style apartment. The Company now estimates that the amount of these capital expenditures is $900 per unit compared to $848 per apartment unit in the prior year. This new amount better reflects current actual costs since the last update.
Capital Improvements (continued)
The table below is a list of the items that management considers recurring, non-revenue enhancing capital and maintenance expenditures for a standard garden style apartment. Included are the per unit replacement cost and the useful life that management estimates the Company incurs on an annual basis.
|
|
|
|
|
|
|
|
|
Maintenance |
|
|
| ||||
|
|
|
|
|
|
|
Capitalized |
|
Expense |
|
Total |
| ||||
|
|
|
Capitalized |
|
|
|
Expenditure |
|
Cost per |
|
Cost per |
| ||||
|
|
|
Cost per |
|
Useful |
|
Per Unit |
|
Unit |
|
Unit |
| ||||
|
Category |
|
Unit |
|
Life(1) |
|
Per Year(2) |
|
Per Year(3) |
|
Per Year |
| ||||
|
Appliances |
|
$ |
1,673 |
|
10 |
|
$ |
167 |
|
$ |
13 |
|
$ |
180 |
|
|
Blinds, shades |
|
148 |
|
3 |
|
49 |
|
6 |
|
55 |
| ||||
|
Carpets, cleaning |
|
924 |
|
4 |
|
231 |
|
155 |
|
386 |
| ||||
|
Computers, equipment, misc.(4) |
|
124 |
|
6 |
|
21 |
|
22 |
|
43 |
| ||||
|
Contract repairs |
|
- |
|
- |
|
- |
|
182 |
|
182 |
| ||||
|
Exterior painting (5) |
|
87 |
|
3 |
|
29 |
|
- |
|
29 |
| ||||
|
Flooring |
|
175 |
|
7 |
|
25 |
|
27 |
|
52 |
| ||||
|
Furnace, air (HVAC) |
|
880 |
|
19 |
|
46 |
|
84 |
|
130 |
| ||||
|
Hot water heater |
|
302 |
|
7 |
|
43 |
|
- |
|
43 |
| ||||
|
Interior painting |
|
- |
|
- |
|
- |
|
194 |
|
194 |
| ||||
|
Kitchen, bath cabinets upgrade |
|
1,272 |
|
15 |
|
85 |
|
- |
|
85 |
| ||||
|
Landscaping site |
|
- |
|
- |
|
- |
|
122 |
|
122 |
| ||||
|
New roof |
|
906 |
|
24 |
|
38 |
|
- |
|
38 |
| ||||
|
Parking lot site |
|
900 |
|
15 |
|
60 |
|
- |
|
60 |
| ||||
|
Pool, exercise facility |
|
130 |
|
15 |
|
9 |
|
56 |
|
65 |
| ||||
|
Windows major |
|
1,712 |
|
20 |
|
86 |
|
- |
|
86 |
| ||||
|
Miscellaneous (6) |
|
190 |
|
17 |
|
11 |
|
- |
|
11 |
| ||||
|
Total |
|
$ |
9,423 |
|
|
|
$ |
900 |
|
$ |
861 |
|
$ |
1,761 |
|
(1) Estimated weighted average actual physical useful life of the expenditure capitalized.
(2) This amount is not necessarily incurred each and every year. Some years will be higher, or lower depending on the timing of certain longer life expenditures.
(3) These expenses are included in the Operating and Maintenance line item of the Consolidated Statement of Operations. Maintenance labor costs are not included in the $861 per unit estimate. All personnel costs for site supervision, leasing agents, and maintenance staff are combined and disclosed in the Company’s Results of Operations section.
(4) Includes computers, office equipment, furniture, and maintenance vehicles.
(5) The level of exterior painting may be lower than other similarly titled presentations of other owners as the Company’s portfolio has a significant amount of brick exteriors. In addition, the other exposed surfaces are most often covered in aluminum or vinyl.
(6) Includes items such as balconies, siding, and concrete sidewalks.
Capital Improvements (continued)
The breakdown of costs above reflects the Company’s unique strategies to improve every property every year regardless of age, and to purchase older properties and rehabilitate and reposition them to enhance internal rates of return. These strategies result in higher costs of capital expenditures and maintenance costs which permit the Company to realize higher revenue growth, higher net operating income growth and a higher rate of property appreciation.
The Company estimates that on an annual basis approximately $900 and $848 per unit was spent on recurring capital expenditures in 2014 and 2013, respectively. The table below summarizes the breakdown of capital improvements by major categories between recurring and non-recurring, revenue generating capital improvements as follows:
|
|
|
For the year ended December 31, |
|
|
|
|
|
| ||||||||||||||||||||
|
|
|
2014 |
|
2013 |
| |||||||||||||||||||||||
|
|
|
Recurring |
|
(a) |
|
Non-recurring |
|
(a) |
|
Total Capital |
|
(a) |
|
Total Capital |
|
(a) |
| |||||||||||
|
|
|
Cap Ex |
|
Per Unit |
|
Cap Ex |
|
Per Unit |
|
Improvements |
|
Per Unit |
|
Improvements |
|
Per Unit |
| |||||||||||
|
New buildings |
|
$ |
- |
|
|
$ - |
|
$ |
1,780 |
|
$ |
44 |
|
|
$ |
1,780 |
|
$ |
44 |
|
|
$ |
504 |
|
$ |
13 |
| |
|
Major bldg improvements |
|
5,050 |
|
|
126 |
|
16,528 |
|
412 |
|
|
21,578 |
|
538 |
|
|
24,594 |
|
626 |
| ||||||||
|
Roof replacements |
|
1,523 |
|
|
38 |
|
2,664 |
|
66 |
|
|
4,187 |
|
104 |
|
|
4,046 |
|
103 |
| ||||||||
|
Site improvements |
|
2,766 |
|
|
69 |
|
16,766 |
|
418 |
|
|
19,532 |
|
487 |
|
|
14,006 |
|
357 |
| ||||||||
|
Apartment upgrades |
|
5,605 |
|
|
140 |
|
33,923 |
|
846 |
|
|
39,528 |
|
986 |
|
|
42,082 |
|
1,071 |
| ||||||||
|
Appliances |
|
6,460 |
|
|
161 |
|
52 |
|
1 |
|
|
6,512 |
|
162 |
|
|
6,756 |
|
172 |
| ||||||||
|
Carpeting, flooring |
|
10,261 |
|
|
256 |
|
3,665 |
|
91 |
|
|
13,926 |
|
347 |
|
|
13,845 |
|
352 |
| ||||||||
|
HVAC, mechanicals |
|
3,567 |
|
|
89 |
|
13,735 |
|
343 |
|
|
17,302 |
|
432 |
|
|
19,248 |
|
490 |
| ||||||||
|
Miscellaneous |
|
842 |
|
|
21 |
|
|
2,705 |
|
67 |
|
|
3,547 |
|
88 |
|
|
3,287 |
|
84 |
| |||||||
|
Totals |
|
$ |
36,074 |
|
|
$ 900 |
|
|
$ |
91,818 |
|
$ |
2,288 |
|
|
$ |
127,892 |
|
$ |
3,188 |
|
|
$ |
128,368 |
|
$ |
3,268 |
|
(a) Calculated using the weighted average number of units owned, including 39,253 core units, 2013 acquisition units of 457, and 2014 acquisition units of 371 for 2014; and 39,253 core units and 2013 acquisition units of 30 for 2013.
The schedule below summarizes the breakdown of total capital improvements between core and non-core:
|
|
|
For the year ended December 31, |
|
|
|
|
| ||||||||||||||||||||||
|
|
|
2014 |
|
2013 |
| ||||||||||||||||||||||||
|
|
|
Recurring |
|
(b) |
|
Non-recurring |
|
(b) |
|
Total Capital |
|
(b) |
|
Total Capital |
|
(b) |
| ||||||||||||
|
|
|
Cap Ex |
|
Per Unit |
|
Cap Ex |
|
Per Unit |
|
Improvements |
|
Per Unit |
|
Improvements |
|
Per Unit |
| ||||||||||||
|
Core Communities |
|
$ |
35,329 |
|
$ |
900 |
|
$ |
87,050 |
|
$ |
2,218 |
|
|
$ |
122,379 |
|
$ |
3,118 |
|
|
$ |
128,357 |
|
$ |
3,270 |
| ||
|
2014 Acquisition Communities |
|
334 |
|
900 |
|
797 |
|
2,148 |
|
|
1,131 |
|
3,049 |
|
|
- |
|
- |
| ||||||||||
|
2013 Acquisition Communities |
|
411 |
|
900 |
|
|
3,971 |
|
8,689 |
|
|
4,382 |
|
9,589 |
|
|
11 |
|
367 |
| |||||||||
|
Subtotal |
|
36,074 |
|
900 |
|
91,818 |
|
2,288 |
|
|
127,892 |
|
3,188 |
|
|
128,368 |
|
3,268 |
| ||||||||||
|
2014 Disposed Communities |
|
709 |
|
900 |
|
26 |
|
33 |
|
|
735 |
|
933 |
|
|
1,884 |
|
1,234 |
| ||||||||||
|
2013 Disposed Communities |
|
- |
|
- |
|
- |
|
- |
|
|
- |
|
- |
|
|
382 |
|
877 |
| ||||||||||
|
Corporate office (1) |
|
- |
|
|
- |
|
|
- |
|
- |
|
|
1,867 |
|
- |
|
|
2,153 |
|
- |
| ||||||||
|
Totals |
|
$ |
36,783 |
|
|
$ |
900 |
|
|
$ |
91,844 |
|
$ |
2,247 |
|
|
$ |
130,494 |
|
$ |
3,147 |
|
|
$ |
132,787 |
|
$ |
3,167 |
|
(1) No distinction is made between recurring and non-recurring expenditures for corporate office. Corporate office expenditures include principally computer hardware, software, office furniture, fixtures and leasehold improvements. Corporate office expenditures are excluded from per unit figures.
(b) Calculated using the weighted average number of units owned, including 39,253 core units, 2013 acquisition units of 457, 2014 acquisition units of 371, and 2014 disposed units of 788 for 2014; and 39,253 core units, 2013 acquisition units of 30, 2013 disposed units of 435, and 2014 disposed units of 1,527 for 2013.
Inflation
Substantially all of the leases at the communities are for a term of one year or less, which enables the Company to seek increased rents upon renewal of existing leases or commencement of new leases. These short-term leases minimize the potential adverse effect of inflation on rental income, although residents may leave without penalty at the end of their lease terms and may do so if rents are increased significantly.
Forward-Looking Statements
This Form 10-K contains “forward-looking statements” within the meaning of Section 27A of the Securities Exchange Act of 1933 and Section 21E of the Securities Exchange Act of 1934, both as amended. Some examples of forward-looking statements include statements related to revenue growth, rental rates, occupancy, expense, NOI and other estimates for 2014, acquisitions (including any related pro forma financial information), future capital expenditures, potential redevelopment opportunities, projected costs and rental rates for development and redevelopment projects, financing sources and availability, and the effects of environmental and other regulations. Although management believes that the expectations reflected in those forward-looking statements are based upon reasonable assumptions, it can give no assurance that expectations will be achieved. Factors that may cause actual results to differ include general economic and local real estate conditions, the weather and other conditions that might affect operating expenses, the timely completion of repositioning activities within anticipated budgets, the actual pace of future acquisitions and dispositions, and continued access to capital to fund growth. For this purpose, any statements contained in this Form 10-K that are not statements of historical fact should be considered to be forward-looking statements. Some of the words used to identify forward-looking statements include “believes”, “anticipates”, “plans”, “expects”, “seeks”, “estimates”, “intends”, and any other similar expressions. Readers should exercise caution in interpreting and relying on forward-looking statements since they involve known and unknown risks, uncertainties and other factors which are, in some cases, beyond the Company’s control and could materially affect the Company’s actual results, performance or achievements.
Item 7A. Quantitative and Qualitative Disclosures About Market Risk
The Company’s primary market risk exposure is interest rate risk. The Company’s debt is summarized as follows:
|
|
|
December 31, 2014 |
|
December 31, 2013 |
| ||||||||||||||||||||
|
|
|
Amount |
|
Weighted- |
|
Weighted- |
|
Percentage |
|
Amount |
|
Weighted- |
|
Weighted- |
|
Percentage |
| ||||||||
|
Fixed rate secured debt |
|
$1,613 |
|
3.51 |
|
5.20% |
|
65.7% |
|
$1,731 |
|
4.42 |
|
5.21% |
|
70.5% |
| ||||||||
|
Variable rate secured debt |
|
24 |
|
2.25 |
|
2.90% |
|
1.0% |
|
83 |
|
3.08 |
|
3.02% |
|
3.4% |
| ||||||||
|
Fixed rate unsecured debt (a) |
|
450 |
|
4.24 |
|
2.96% |
|
18.3% |
|
450 |
|
5.24 |
|
2.96% |
|
18.2% |
| ||||||||
|
Variable rate unsecured debt |
|
|
369 |
|
|
2.02 |
|
|
1.19% |
|
|
15.0% |
|
|
193 |
|
|
3.63 |
|
|
1.19% |
|
|
7.9% |
|
|
Total |
|
|
$2,456 |
|
|
3.41 |
|
|
4.16% |
|
|
100.0% |
|
|
$2,457 |
|
|
4.46 |
|
|
4.41% |
|
|
100.0% |
|
(a) Includes $250 million of variable rate debt where the one-month LIBOR was swapped to a fixed rate of 0.685% at December 31, 2014 and 2013.
The Company uses a combination of fixed and variable rate secured and unsecured debt. The Company intends to use cash flow provided by operating activities and its existing bank line of credit to repay indebtedness and fund capital expenditures. On occasion, the Company may use its unsecured line of credit in connection with a property acquisition with the intention to refinance at a later date. The Company believes that increases in interest expense as a result of inflation would not significantly impact the Company’s distributable cash flow.
On July 19, 2012, the Company entered into two interest rate swap agreements that effectively convert the one-month LIBOR portion of a $250 million five-year variable rate unsecured term loan, originally due on December 8, 2016, from a variable rate of one-month LIBOR plus a spread of 1.00% to 2.00% based on the Company’s leverage ratio to a fixed rate of 0.685% plus the applicable spread. On August 19, 2013, the Company amended the five-year variable rate unsecured term loan agreement to extend the maturity date to August 18, 2018. On November 4, 2013, the Company entered into three additional interest rate swap agreements that effectively convert the LIBOR portion of this loan to a fixed rate of 2.604% plus the applicable spread for the period of December 8, 2016 through August 18, 2018. The Company is exposed to credit risk in the event of non-performance by the counterparties to the swaps. The Company minimizes this risk exposure by limiting counterparties to major banks who meet established credit and capital guidelines.
At December 31, 2014 and December 31, 2013, the fair value of the Company’s total debt, including the unsecured notes payable and line of credit, amounted to a liability of $2.55 billion and $2.55 billion, respectively, compared to its carrying amount of $2.46 billion and $2.46 billion, respectively. The Company estimates that a 100 basis point increase in market interest rates at December 31, 2014 would have changed the fair value of the Company’s total debt to a liability of $2.47 billion and would result in $3.3 million higher interest expense on the variable rate debt on an annualized basis.
The Company intends to continuously monitor and actively manage interest costs on its variable rate debt portfolio and may enter into swap positions based upon market fluctuations. Accordingly, the cost of obtaining such interest rate protection agreements in relation to the Company’s access to capital markets will continue to be evaluated. The Company has not, and does not plan to, enter into any derivative financial instruments for trading or speculative purposes. In addition, the Company believes that it has the ability to obtain funds through additional debt and equity offerings and the issuance of UPREIT Units for property acquisitions. As of December 31, 2014, the Company had no other material exposure to market risk.
Additional disclosure about market risk is incorporated herein by reference to the discussion under the heading “Results of Operations” in Item 7: Management’s Discussion and Analysis of Financial Condition and Results of Operations.
Item 8. Financial Statements and Supplementary Data
The financial statements and supplementary data are listed under Item 15(a) and filed as part of this report on the pages indicated.
Item 9. Changes in and Disagreements with Accountants on Accounting and Financial Disclosure
None.
Item 9A. Controls and Procedures
Evaluation of Disclosure Controls and Procedures
The Company maintains disclosure controls and procedures that are designed to ensure that information required to be disclosed in the reports filed or submitted by the Company under the Securities Exchange Act of 1934 is recorded, processed, summarized and reported within the time periods specified in the Securities and Exchange Commission’s rules and forms, and that such information is accumulated and communicated to the officers who certify the Company’s financial reports and to the other members of senior management and the Board.
The principal executive officer and principal financial officer evaluated, as of December 31, 2014, the effectiveness of the disclosure controls and procedures (as defined in Rules 13a-15(e) and 15d-15(e) under the Securities Exchange Act of 1934, as amended (the “Exchange Act”)) and have determined that such disclosure controls and procedures are effective.
Management’s Annual Report on Internal Control Over Financial Reporting
The Company’s management is responsible for establishing and maintaining adequate internal control over financial reporting, as such term is defined in Exchange Act Rule 13a-15(f). Because of its inherent limitations, internal control over financial reporting may not prevent or detect misstatements. Also, projections of any evaluation of effectiveness to future periods are subject to the risk that controls may become inadequate because of changes in conditions, or that the degree of compliance with the policies or procedures may deteriorate. The Company’s internal control over financial reporting is a process designed under the supervision of the Company’s principal executive officer and principal financial officer to provide reasonable assurance regarding the reliability of financial reporting and the preparation of the Company’s financial statements for external reporting purposes in accordance with GAAP.
Under the supervision and with the participation of management, including the Company’s principal executive officer and principal financial officer, the Company conducted an evaluation of the effectiveness of its internal control over financial reporting based on the framework in Internal Control — Integrated Framework (2013) issued by the Committee of Sponsoring Organizations of the Treadway Commission. Based on its evaluation under that framework, management concluded that the Company’s internal control over financial reporting was effective as of December 31, 2014. Additionally, based on our assessment, we determined that there were no material weaknesses in internal controls over financial reporting as of December 31, 2014.
Attestation Report of the Registered Public Accounting Firm
The effectiveness of the Company’s internal control over financial reporting as of December 31, 2014, has been audited by PricewaterhouseCoopers LLP, an independent registered public accounting firm, as stated in their report, which appears herein.
Changes in Internal Control Over Financial Reporting
There were no changes in the internal controls over financial reporting that occurred during the fourth quarter of the year ended December 31, 2014, that have materially affected, or are reasonably likely to materially affect, the Company’s internal control over financial reporting.
None.
Items 10, 11, 12, 13 and 14. Directors, Executive Officers and Corporate Governance; Executive Compensation; Security Ownership of Certain Beneficial Owners and Management and Related Stockholder Matters; Certain Relationships and Related Transactions, and Director Independence; and Principal Accounting Fees and Services
The information required by Items 10, 11, 12, 13 and 14 is incorporated herein by reference to the Company’s Proxy Statement to be issued in connection with the Annual Meeting of Stockholders of the Company to be held on April 28, 2015. The Proxy Statement will be filed within 120 days after the end of the Company’s last fiscal year.
Item 15. Exhibits, Financial Statement Schedules
(a) 1 and (a) 2. Financial Statements and Schedules
The financial statements and schedules listed below are filed as part of this annual report on the pages indicated.
HOME PROPERTIES, INC.
Consolidated Financial Statements
|
|
Page |
|
|
|
|
65 | |
|
|
|
|
| |
|
66 | |
|
|
|
|
| |
|
67 | |
|
|
|
|
| |
|
68 | |
|
|
|
|
| |
|
69 | |
|
|
|
|
| |
|
70 | |
|
|
|
|
71 | |
|
|
|
|
| |
|
102 | |
|
|
|
|
| |
|
103 | |
|
|
|
|
All other schedules are omitted because they are not applicable or the required information is shown in the financial statements or notes thereto. |
|
(a) 3. Exhibits
|
108 |
Report of Independent Registered Public Accounting Firm
To the Board of Directors and Shareholders of Home Properties, Inc.:
In our opinion, the consolidated financial statements listed in the index appearing under Item 15(a) present fairly, in all material respects, the financial position of Home Properties, Inc. and its subsidiaries (the “Company”) at December 31, 2014 and 2013, and the results of their operations and their cash flows for each of the three years in the period ended December 31, 2014 in conformity with accounting principles generally accepted in the United States of America. In addition, in our opinion, the financial statement schedules listed in the index appearing under Item 15(a) present fairly, in all material respects, the information set forth therein when read in conjunction with the related consolidated financial statements. Also in our opinion, the Company maintained, in all material respects, effective internal control over financial reporting as of December 31, 2014, based on criteria established in Internal Control - Integrated Framework (2013) issued by the Committee of Sponsoring Organizations of the Treadway Commission (COSO). The Company’s management is responsible for these financial statements and financial statement schedules, for maintaining effective internal control over financial reporting and for its assessment of the effectiveness of internal control over financial reporting, included in Management’s Annual Report on Internal Control over Financial Reporting appearing under Item 9A. Our responsibility is to express opinions on these financial statements, on the financial statement schedules, and on the Company’s internal control over financial reporting based on our integrated audits. We conducted our audits in accordance with the standards of the Public Company Accounting Oversight Board (United States). Those standards require that we plan and perform the audits to obtain reasonable assurance about whether the financial statements are free of material misstatement and whether effective internal control over financial reporting was maintained in all material respects. Our audits of the financial statements included examining, on a test basis, evidence supporting the amounts and disclosures in the financial statements, assessing the accounting principles used and significant estimates made by management, and evaluating the overall financial statement presentation. Our audit of internal control over financial reporting included obtaining an understanding of internal control over financial reporting, assessing the risk that a material weakness exists, and testing and evaluating the design and operating effectiveness of internal control based on the assessed risk. Our audits also included performing such other procedures as we considered necessary in the circumstances. We believe that our audits provide a reasonable basis for our opinions.
A company’s internal control over financial reporting is a process designed to provide reasonable assurance regarding the reliability of financial reporting and the preparation of financial statements for external purposes in accordance with generally accepted accounting principles. A company’s internal control over financial reporting includes those policies and procedures that (i) pertain to the maintenance of records that, in reasonable detail, accurately and fairly reflect the transactions and dispositions of the assets of the company; (ii) provide reasonable assurance that transactions are recorded as necessary to permit preparation of financial statements in accordance with generally accepted accounting principles, and that receipts and expenditures of the company are being made only in accordance with authorizations of management and directors of the company; and (iii) provide reasonable assurance regarding prevention or timely detection of unauthorized acquisition, use, or disposition of the company’s assets that could have a material effect on the financial statements.
Because of its inherent limitations, internal control over financial reporting may not prevent or detect misstatements. Also, projections of any evaluation of effectiveness to future periods are subject to the risk that controls may become inadequate because of changes in conditions, or that the degree of compliance with the policies or procedures may deteriorate.
|
/s/ PricewaterhouseCoopers LLP |
|
|
Boston, Massachusetts |
|
|
February 24, 2015 |
|
HOME PROPERTIES, INC.
DECEMBER 31, 2014 and 2013
(Dollars in thousands, except per share data)
|
|
|
2014 |
|
|
2013 |
| ||
|
ASSETS |
|
|
|
|
|
| ||
|
Real estate: |
|
|
|
|
|
| ||
|
Land |
|
$ |
815,565 |
|
|
$ |
786,868 |
|
|
Land held for sale |
|
13,114 |
|
|
- |
| ||
|
Construction in progress |
|
118,595 |
|
|
187,976 |
| ||
|
Buildings, improvements and equipment |
|
4,817,453 |
|
|
4,645,921 |
| ||
|
|
|
5,764,727 |
|
|
5,620,765 |
| ||
|
Less: accumulated depreciation |
|
(1,371,227 |
) |
|
(1,243,243 |
) | ||
|
Real estate, net |
|
4,393,500 |
|
|
4,377,522 |
| ||
|
Cash and cash equivalents |
|
11,131 |
|
|
9,853 |
| ||
|
Cash in escrows |
|
24,118 |
|
|
23,738 |
| ||
|
Accounts receivable, net |
|
19,556 |
|
|
14,937 |
| ||
|
Prepaid expenses |
|
23,484 |
|
|
22,089 |
| ||
|
Deferred charges, net |
|
9,250 |
|
|
11,945 |
| ||
|
Other assets |
|
7,496 |
|
|
7,793 |
| ||
|
Total assets |
|
$ |
4,488,535 |
|
|
$ |
4,467,877 |
|
|
LIABILITIES AND EQUITY |
|
|
|
|
|
| ||
|
Mortgage notes payable |
|
$ |
1,637,175 |
|
|
$ |
1,814,217 |
|
|
Unsecured notes payable |
|
550,000 |
|
|
450,000 |
| ||
|
Unsecured line of credit |
|
269,000 |
|
|
193,000 |
| ||
|
Accounts payable |
|
25,835 |
|
|
27,540 |
| ||
|
Accrued interest payable |
|
7,732 |
|
|
8,392 |
| ||
|
Accrued expenses and other liabilities |
|
38,732 |
|
|
33,936 |
| ||
|
Security deposits |
|
18,631 |
|
|
18,479 |
| ||
|
Total liabilities |
|
2,547,105 |
|
|
2,545,564 |
| ||
|
Commitments and contingencies |
|
|
|
|
|
| ||
|
Equity: |
|
|
|
|
|
| ||
|
Preferred stock, $0.01 par value; 10,000,000 shares authorized; no shares issued or outstanding |
|
- |
|
|
- |
| ||
|
Common stock, $0.01 par value; 160,000,000 and 80,000,000 shares authorized with 57,703,957 and 56,961,646 shares issued and outstanding at December 31, 2014 and December 31, 2013, respectively |
|
577 |
|
|
570 |
| ||
|
Excess stock, $0.01 par value; 10,000,000 shares authorized; no shares issued or outstanding |
|
- |
|
|
- |
| ||
|
Additional paid-in capital |
|
2,041,394 |
|
|
2,007,300 |
| ||
|
Distributions in excess of accumulated earnings |
|
(387,004 |
) |
|
(380,168 |
) | ||
|
Accumulated other comprehensive income (loss) |
|
(1,749 |
) |
|
1,551 |
| ||
|
Total common stockholders’ equity |
|
1,653,218 |
|
|
1,629,253 |
| ||
|
Noncontrolling interest |
|
288,212 |
|
|
293,060 |
| ||
|
Total equity |
|
1,941,430 |
|
|
1,922,313 |
| ||
|
Total liabilities and equity |
|
$ |
4,488,535 |
|
|
$ |
4,467,877 |
|
The accompanying notes are an integral part of these consolidated financial statements.
HOME PROPERTIES, INC.
CONSOLIDATED STATEMENTS OF OPERATIONS
FOR THE YEARS ENDED DECEMBER 31, 2014, 2013 AND 2012
(Dollars in thousands, except per share data)
|
|
|
2014 |
|
|
2013 |
|
|
2012 |
| |||
|
Revenues: |
|
|
|
|
|
|
|
|
| |||
|
Rental income |
|
$ |
616,160 |
|
|
$ |
587,052 |
|
|
$ |
554,499 |
|
|
Property other income |
|
55,391 |
|
|
51,571 |
|
|
48,910 |
| |||
|
Other income |
|
364 |
|
|
1,179 |
|
|
311 |
| |||
|
Total revenues |
|
671,915 |
|
|
639,802 |
|
|
603,720 |
| |||
|
Expenses: |
|
|
|
|
|
|
|
|
| |||
|
Operating and maintenance |
|
249,509 |
|
|
230,098 |
|
|
220,853 |
| |||
|
General and administrative |
|
26,686 |
|
|
28,507 |
|
|
34,174 |
| |||
|
Interest |
|
99,635 |
|
|
110,076 |
|
|
119,871 |
| |||
|
Depreciation and amortization |
|
181,123 |
|
|
167,375 |
|
|
155,532 |
| |||
|
Other expenses |
|
734 |
|
|
312 |
|
|
2,741 |
| |||
|
Impairment and other charges |
|
5,382 |
|
|
- |
|
|
- |
| |||
|
Total expenses |
|
563,069 |
|
|
536,368 |
|
|
533,171 |
| |||
|
|
|
|
|
|
|
|
|
|
| |||
|
Income from continuing operations |
|
108,846 |
|
|
103,434 |
|
|
70,549 |
| |||
|
|
|
|
|
|
|
|
|
|
| |||
|
Discontinued operations: |
|
|
|
|
|
|
|
|
| |||
|
Income (loss) from discontinued operations |
|
(1,206 |
) |
|
6,940 |
|
|
12,541 |
| |||
|
Gain on disposition of property |
|
81,831 |
|
|
81,205 |
|
|
80,532 |
| |||
|
Discontinued operations |
|
80,625 |
|
|
88,145 |
|
|
93,073 |
| |||
|
Net income |
|
189,471 |
|
|
191,579 |
|
|
163,622 |
| |||
|
Net income attributable to noncontrolling interest |
|
(28,533 |
) |
|
(30,706 |
) |
|
(28,320 |
) | |||
|
|
|
|
|
|
|
|
|
|
| |||
|
Net income attributable to common stockholders |
|
$ |
160,938 |
|
|
$ |
160,873 |
|
|
$ |
135,302 |
|
|
|
|
|
|
|
|
|
|
|
| |||
|
|
|
|
|
|
|
|
|
|
| |||
|
Basic earnings per share data: |
|
|
|
|
|
|
|
|
| |||
|
Income from continuing operations |
|
$ |
1.61 |
|
|
$ |
1.60 |
|
|
$ |
1.17 |
|
|
Discontinued operations |
|
1.20 |
|
|
1.36 |
|
|
1.55 |
| |||
|
Net income attributable to common stockholders |
|
$ |
2.81 |
|
|
$ |
2.96 |
|
|
$ |
2.72 |
|
|
|
|
|
|
|
|
|
|
|
| |||
|
Diluted earnings per share data: |
|
|
|
|
|
|
|
|
| |||
|
Income from continuing operations |
|
$ |
1.60 |
|
|
$ |
1.58 |
|
|
$ |
1.16 |
|
|
Discontinued operations |
|
1.18 |
|
|
1.35 |
|
|
1.53 |
| |||
|
Net income attributable to common stockholders |
|
$ |
2.78 |
|
|
$ |
2.93 |
|
|
$ |
2.69 |
|
|
|
|
|
|
|
|
|
|
|
| |||
|
Weighted average number of shares outstanding: |
|
|
|
|
|
|
|
|
| |||
|
Basic |
|
57,315,391 |
|
|
54,328,514 |
|
|
49,744,636 |
| |||
|
Diluted |
|
57,827,888 |
|
|
54,820,194 |
|
|
50,382,636 |
| |||
The accompanying notes are an integral part of these consolidated financial statements.
HOME PROPERTIES, INC.
CONSOLIDATED STATEMENTS OF COMPREHENSIVE INCOME
FOR THE YEARS ENDED DECEMBER 31, 2014, 2013 AND 2012
(Dollars in thousands)
|
|
|
2014 |
|
2013 |
|
2012 |
| |||||
|
|
|
|
|
|
|
|
|
|
|
|
|
|
|
Net income |
|
$ |
189,471 |
|
|
$ |
191,579 |
|
|
$ |
163,622 |
|
|
|
|
|
|
|
|
|
|
|
|
|
|
|
|
Other comprehensive income (loss): |
|
|
|
|
|
|
|
|
| |||
|
Unrealized gain (loss) on interest rate swap agreements |
|
(3,886 |
) |
|
3,136 |
|
|
(1,296 |
) | |||
|
Other comprehensive income (loss) |
|
(3,886 |
) |
|
3,136 |
|
|
(1,296 |
) | |||
|
|
|
|
|
|
|
|
|
|
| |||
|
Comprehensive income |
|
185,585 |
|
|
194,715 |
|
|
162,326 |
| |||
|
Net income attributable to noncontrolling interest |
|
(28,533 |
) |
|
(30,706 |
) |
|
(28,320 |
) | |||
|
Other comprehensive (income) loss attributable to noncontrolling interest |
|
586 |
|
|
(516 |
) |
|
227 |
| |||
|
|
|
|
|
|
|
|
|
|
| |||
|
Comprehensive income attributable to common stockholders |
|
$ |
157,638 |
|
|
$ |
163,493 |
|
|
$ |
134,233 |
|
The accompanying notes are an integral part of these consolidated financial statements.
HOME PROPERTIES, INC.
CONSOLIDATED STATEMENTS OF EQUITY
FOR THE YEARS ENDED DECEMBER 31, 2014, 2013 AND 2012
(Dollars in thousands)
|
|
|
|
|
|
|
|
|
Distributions |
|
Accumulated |
|
|
|
| ||||||
|
|
|
|
|
|
|
Additional |
|
in Excess of |
|
Other |
|
Non- |
|
| ||||||
|
|
|
Common Stock |
|
Paid-In |
|
Accumulated |
|
Comprehensive |
|
controlling |
|
| ||||||||
|
|
|
Shares |
|
Amount |
|
Capital |
|
Earnings |
|
Income (Loss) |
|
Interest |
|
Total | ||||||
|
Balance, December 31, 2011 |
|
48,321,305 |
|
$ |
483 |
|
$ |
1,545,563 |
|
$ |
(392,378) |
|
$ |
0 |
|
$ |
255,976 |
|
$ |
1,409,644 |
|
Net income |
|
- |
|
- |
|
- |
|
135,302 |
|
- |
|
28,320 |
|
163,622 | ||||||
|
Unrealized gain (loss) on interest rate swap agreements |
|
- |
|
- |
|
- |
|
- |
|
(1,069) |
|
(227) |
|
(1,296) | ||||||
|
Issuance of common stock, net |
|
2,966,742 |
|
30 |
|
165,938 |
|
- |
|
- |
|
- |
|
165,968 | ||||||
|
Stock-based compensation |
|
4,199 |
|
- |
|
13,923 |
|
- |
|
- |
|
- |
|
13,923 | ||||||
|
Repurchase of common stock |
|
(68,284) |
|
(1) |
|
(4,244) |
|
- |
|
- |
|
- |
|
(4,245) | ||||||
|
Conversion of UPREIT Units for common stock |
|
284,180 |
|
3 |
|
6,896 |
|
- |
|
- |
|
(6,899) |
|
0 | ||||||
|
Adjustment of noncontrolling interest |
|
- |
|
- |
|
(18,157) |
|
- |
|
- |
|
18,157 |
|
0 | ||||||
|
Dividends and distributions declared |
|
- |
|
- |
|
- |
|
(131,321) |
|
- |
|
(28,028) |
|
(159,349) | ||||||
|
Balance, December 31, 2012 |
|
51,508,142 |
|
$ |
515 |
|
$ |
1,709,919 |
|
$ |
(388,397) |
|
$ |
(1,069) |
|
$ |
267,299 |
|
$ |
1,588,267 |
|
Net income |
|
- |
|
- |
|
- |
|
160,873 |
|
- |
|
30,706 |
|
191,579 | ||||||
|
Unrealized gain (loss) on interest rate swap agreements |
|
- |
|
- |
|
- |
|
- |
|
2,620 |
|
516 |
|
3,136 | ||||||
|
Issuance of common stock, net |
|
902,934 |
|
9 |
|
47,477 |
|
- |
|
- |
|
- |
|
47,486 | ||||||
|
Issuance of common stock through public offering, net |
|
4,427,500 |
|
44 |
|
267,589 |
|
- |
|
- |
|
- |
|
267,633 | ||||||
|
Stock-based compensation |
|
3,137 |
|
- |
|
9,055 |
|
- |
|
- |
|
- |
|
9,055 | ||||||
|
Repurchase of common stock |
|
(48,484) |
|
- |
|
(3,133) |
|
- |
|
- |
|
- |
|
(3,133) | ||||||
|
Conversion of UPREIT Units for common stock |
|
168,417 |
|
2 |
|
4,493 |
|
- |
|
- |
|
(4,495) |
|
0 | ||||||
|
Adjustment of noncontrolling interest |
|
- |
|
- |
|
(28,100) |
|
- |
|
- |
|
28,100 |
|
0 | ||||||
|
Dividends and distributions declared |
|
- |
|
- |
|
- |
|
(152,644) |
|
- |
|
(29,066) |
|
(181,710) | ||||||
|
Balance, December 31, 2013 |
|
56,961,646 |
|
$ |
570 |
|
$ |
2,007,300 |
|
$ |
(380,168) |
|
$ |
1,551 |
|
$ |
293,060 |
|
$ |
1,922,313 |
|
Net income |
|
- |
|
- |
|
- |
|
160,938 |
|
- |
|
28,533 |
|
189,471 | ||||||
|
Unrealized gain (loss) on interest rate swap agreements |
|
- |
|
- |
|
- |
|
- |
|
(3,300) |
|
(586) |
|
(3,886) | ||||||
|
Issuance of common stock, net |
|
622,128 |
|
6 |
|
25,277 |
|
- |
|
- |
|
- |
|
25,283 | ||||||
|
Stock-based compensation |
|
5,318 |
|
- |
|
9,386 |
|
- |
|
|
|
- |
|
9,386 | ||||||
|
Repurchase of common stock |
|
(57,956) |
|
(1) |
|
(3,563) |
|
- |
|
- |
|
- |
|
(3,564) | ||||||
|
Conversion of UPREIT Units for common stock |
|
172,821 |
|
2 |
|
4,885 |
|
- |
|
- |
|
(4,887) |
|
0 | ||||||
|
Adjustment of noncontrolling interest |
|
- |
|
- |
|
(1,891) |
|
- |
|
- |
|
1,891 |
|
0 | ||||||
|
Dividends and distributions declared |
|
- |
|
- |
|
- |
|
(167,774) |
|
- |
|
(29,799) |
|
(197,573) | ||||||
|
Balance, December 31, 2014 |
|
57,703,957 |
|
$ |
577 |
|
$ |
2,041,394 |
|
$ |
(387,004) |
|
$ |
(1,749) |
|
$ |
288,212 |
|
$ |
1,941,430 |
The accompanying notes are an integral part of these consolidated financial statements.
HOME PROPERTIES, INC.
CONSOLIDATED STATEMENTS OF CASH FLOWS
FOR THE YEARS ENDED DECEMBER 31, 2014, 2013 AND 2012
(Dollars in thousands)
|
|
|
2014 |
|
2013 |
|
2012 |
| |||
|
Cash flows from operating activities: |
|
|
|
|
|
|
| |||
|
Net income |
|
$ |
189,471 |
|
$ |
191,579 |
|
$ |
163,622 |
|
|
Adjustments to reconcile net income to net cash provided by operating activities: |
|
|
|
|
|
|
| |||
|
Depreciation and amortization |
|
186,227 |
|
177,885 |
|
172,558 |
| |||
|
Impairment and other charges |
|
3,942 |
|
- |
|
- |
| |||
|
Gain on disposition of property |
|
(81,831 |
) |
(81,205 |
) |
(80,532 |
) | |||
|
Stock-based compensation |
|
9,386 |
|
9,055 |
|
13,923 |
| |||
|
Changes in assets and liabilities: |
|
|
|
|
|
|
| |||
|
Cash in escrows, net |
|
(869 |
) |
1,825 |
|
1,881 |
| |||
|
Other assets |
|
(6,346 |
) |
(5,101 |
) |
(8,250 |
) | |||
|
Accounts payable and accrued liabilities |
|
1,896 |
|
1,042 |
|
4,378 |
| |||
|
Total adjustments |
|
112,405 |
|
103,501 |
|
103,958 |
| |||
|
Net cash provided by operating activities |
|
301,876 |
|
295,080 |
|
267,580 |
| |||
|
|
|
|
|
|
|
|
| |||
|
Cash flows from investing activities: |
|
|
|
|
|
|
| |||
|
Deposits on real estate acquisitions |
|
(4,450 |
) |
(800 |
) |
- |
| |||
|
Purchase of properties, net of mortgage notes assumed |
|
(109,934 |
) |
(55,821 |
) |
(289,759 |
) | |||
|
Purchase of land for development |
|
- |
|
(41,889 |
) |
- |
| |||
|
Capital improvements to properties including redevelopment |
|
(139,265 |
) |
(144,304 |
) |
(164,987 |
) | |||
|
Additions to construction in progress |
|
(48,461 |
) |
(60,947 |
) |
(61,806 |
) | |||
|
Additions to predevelopment |
|
- |
|
(938 |
) |
(535 |
) | |||
|
Proceeds from sale of properties, net |
|
210,807 |
|
187,993 |
|
149,783 |
| |||
|
Proceeds from insurance for property losses |
|
587 |
|
1,145 |
|
- |
| |||
|
Withdrawals from cash held in escrow, net |
|
489 |
|
1,408 |
|
1,301 |
| |||
|
Net cash used in investing activities |
|
(90,227 |
) |
(114,153 |
) |
(366,003 |
) | |||
|
|
|
|
|
|
|
|
| |||
|
Cash flows from financing activities: |
|
|
|
|
|
|
| |||
|
Proceeds from sale of common stock, net |
|
25,283 |
|
47,486 |
|
165,968 |
| |||
|
Proceeds from issuance of common stock through public offering, net |
|
- |
|
267,633 |
|
- |
| |||
|
Repurchase of common stock |
|
(3,564 |
) |
(3,133 |
) |
(4,245 |
) | |||
|
Scheduled payments of mortgage notes payable |
|
(30,670 |
) |
(33,974 |
) |
(35,873 |
) | |||
|
Payoff mortgage notes payable |
|
(179,852 |
) |
(316,836 |
) |
(67,324 |
) | |||
|
Proceeds from unsecured notes payable |
|
100,000 |
|
25,000 |
|
150,000 |
| |||
|
Payments of unsecured notes payable |
|
- |
|
(25,000 |
) |
(100,000 |
) | |||
|
Proceeds from unsecured line of credit |
|
542,000 |
|
743,000 |
|
524,000 |
| |||
|
Payments of unsecured line of credit |
|
(466,000 |
) |
(712,500 |
) |
(364,000 |
) | |||
|
Payments of deferred loan costs |
|
(528 |
) |
(2,132 |
) |
(410 |
) | |||
|
Withdrawals from cash held in escrow, net |
|
- |
|
- |
|
2,451 |
| |||
|
Dividends and distributions |
|
(197,040 |
) |
(181,710 |
) |
(159,349 |
) | |||
|
Net cash provided by (used in) financing activities |
|
(210,371 |
) |
(192,166 |
) |
111,218 |
| |||
|
|
|
|
|
|
|
|
| |||
|
Net increase (decrease) in cash and cash equivalents |
|
1,278 |
|
(11,239 |
) |
12,795 |
| |||
|
Cash and cash equivalents: |
|
|
|
|
|
|
| |||
|
Beginning of year |
|
9,853 |
|
21,092 |
|
8,297 |
| |||
|
End of year |
|
$ |
11,131 |
|
$ |
9,853 |
|
$ |
21,092 |
|
The accompanying notes are an integral part of these consolidated financial statements.
HOME PROPERTIES, INC.
NOTES TO CONSOLIDATED FINANCIAL STATEMENTS
(Dollars in thousands, except per share data)
1 ORGANIZATION AND BASIS OF PRESENTATION
Organization
Home Properties, Inc. (the “Company”) was formed in November 1993 as a Maryland corporation. Home Properties is a self-administered and self-managed real estate investment trust (“REIT”) that owns, operates, acquires and repositions apartment communities in suburbs of major metropolitan areas, primarily along the East Coast of the United States. The Company completed an initial public offering of 5,408,000 shares of common stock on August 4, 1994 and is traded on the New York Stock Exchange (“NYSE”) under the symbol “HME”. The Company is included in S&P’s MidCap 400 Index.
The Company conducts its business through Home Properties, L.P. (the “Operating Partnership”), a New York limited partnership. As of December 31, 2014, the Company owned and operated 121 apartment communities with 42,107 apartments.
Basis of Presentation
The accompanying consolidated financial statements include the accounts of the Company and its ownership of 85.2% of the limited partnership units in the Operating Partnership (“UPREIT Units”) at December 31, 2014 (84.8% at December 31, 2013). The remaining 14.8% is included as noncontrolling interest in these consolidated financial statements at December 31, 2014 (15.2% at December 31, 2013). The Company periodically adjusts the carrying value of noncontrolling interest to reflect its share of the book value of the Operating Partnership. Such adjustments are recorded to additional paid in capital as a reallocation of noncontrolling interest in the accompanying consolidated statements of equity. The Company owns a 1.0% general partner interest in the Operating Partnership and the remainder indirectly as a limited partner through its wholly owned subsidiary, Home Properties I, LLC, which owns 100% of Home Properties Trust, which is the limited partner. Home Properties Trust was formed in September 1997, as a Maryland real estate trust and as a qualified REIT subsidiary (“QRS”), and owns the Company’s share of the limited partner interests in the Operating Partnership.
The accompanying consolidated financial statements include the accounts of Home Properties Resident Services, Inc. (“HPRS”). HPRS is a wholly owned subsidiary of the Company. All significant inter-company balances and transactions have been eliminated in these consolidated financial statements.
2 SUMMARY OF SIGNIFICANT ACCOUNTING POLICIES
Real Estate
Real estate is recorded at cost. Costs related to the development, construction and improvement of properties are capitalized. Recurring capital replacements typically include carpeting and tile, appliances, HVAC equipment, new roofs, site improvements and various exterior building improvements. Non-recurring upgrades include, among other items, community centers, new windows, kitchens and bathrooms. Costs incurred on a lease turnover due to normal wear and tear by the resident are expensed on the turn. Ordinary repairs and maintenance that do not extend the life of the asset are expensed as incurred. When retired or otherwise disposed of, the related asset cost and accumulated depreciation are cleared from the respective accounts and the net difference, less any amount realized from disposition, is reflected in income.
The Company capitalizes the payroll and associated costs of employees directly responsible for the supervision and construction of development properties, major capital and rehabilitation projects. Interest costs for development properties, major capital projects and properties under rehabilitation are capitalized during the construction period. These costs are reflected on the balance sheet as an increase to depreciable property. Payroll and associated costs capitalized were $4,321, $4,263 and $3,895 for the years ended December 31, 2014, 2013 and 2012, respectively.
HOME PROPERTIES, INC.
NOTES TO CONSOLIDATED FINANCIAL STATEMENTS
(Dollars in thousands, except per share data)
2 SUMMARY OF SIGNIFICANT ACCOUNTING POLICIES (continued)
Real Estate (continued)
For development properties, the Company uses its professional judgment in determining whether such costs meet the criteria for capitalization or must be expensed as incurred. Costs directly related to the development of properties are capitalized. The Company capitalizes interest, real estate taxes, insurance, and payroll including associated costs for those individuals directly responsible for and who spend all their time on development activities. Determination of when a development project commences and capitalization begins, and when a development project is substantially complete and capitalization must end involves a degree of judgment. We begin the capitalization of costs during the pre-construction period which we define as activities that are necessary to the development of the property. We consider a development property as substantially complete after major construction has ended and the property is available for occupancy. For properties that are built in phases, we end capitalization on the portion of a property that is considered substantially complete, and we capitalize only those costs associated with the portion under construction. These costs are reflected on the balance sheet as construction in progress.
The interest rate used for capitalization is the weighted average interest rate for all Company indebtedness, including amortization of debt issuance costs. In connection with development properties, major capital projects and rehabilitation projects, there was $6,993, $7,281 and $4,380 of interest capitalized for the years ended December 31, 2014, 2013 and 2012, respectively.
Management reviews its long-lived assets used in operations for impairment when, in accordance with the authoritative guidance for the accounting for the impairment or disposal of long-lived assets, there is an event or change in circumstances that indicates an impairment in value. An asset is considered impaired when the undiscounted future cash flows are not sufficient to recover the asset’s carrying value. If such impairment is present, an impairment loss is recognized based on the excess of the carrying amount of the asset over its fair value. The Company records impairment losses and reduces the carrying amounts of assets held for sale when the carrying amounts exceed the estimated selling proceeds less the costs to sell.
The Company accounts for its acquisitions of investments in real estate in accordance with the authoritative guidance for business combinations, which requires the assets and liabilities acquired to be recognized using fair value. Typical assets and liabilities acquired include land, building, and personal property and identified intangible assets and liabilities, consisting of the value of above-market and below-market leases, value of in-place leases and value of resident relationships, based in each case on their fair values. Additionally, acquisition related costs are expensed in the periods in which the costs are incurred and the services are received. The Company considers acquisitions of operating real estate assets to be businesses as that term is defined in the authoritative guidance.
The Company determines the fair value of the tangible assets of an acquired property (which includes the land, building, and personal property) by valuing the property as if it were vacant. The as-if-vacant value is assigned to land, buildings, and personal property based on management’s determination of the relative fair values of these assets.
Above-market and below-market in-place lease values for acquired properties are recorded based on the present value (using an interest rate which reflects the risks associated with the leases acquired) of the difference between (i) the contractual amounts to be paid pursuant to the in-place leases and (ii) management’s estimate of fair market lease rates for the corresponding in-place leases, measured over a period equal to the remaining non-cancelable term of the lease. The capitalized above-market lease values are included in other assets and are amortized as a reduction of rental income over the remaining non-cancelable terms of the respective leases. The capitalized below-market lease values are included in accrued expenses and other liabilities and are amortized as an increase to rental income over the initial term of the respective leases.
HOME PROPERTIES, INC.
NOTES TO CONSOLIDATED FINANCIAL STATEMENTS
(Dollars in thousands, except per share data)
2 SUMMARY OF SIGNIFICANT ACCOUNTING POLICIES (continued)
Real Estate (continued)
The fair value of in-place leases is based upon the Company’s evaluation of the specific characteristics of the leases. Factors considered in these analyses include an estimate of carrying costs during hypothetical expected lease-up periods considering current market conditions, and costs to execute similar leases. The Company also considers information obtained about each property as a result of its pre-acquisition due diligence, marketing and leasing activities in estimating the fair value of the tangible and intangible assets acquired. In estimating carrying costs, management also includes real estate taxes, insurance and other operating expenses and estimates of lost rentals at market rates during the expected lease-up periods depending on the property acquired.
The fair value of resident relationships is based on management’s evaluation of the specific characteristics of the residential leases and the Company’s resident retention history.
The in-place leases and resident relationships are amortized and included in depreciation and amortization expense over a six month and a three year period, respectively.
Exchange of UPREIT Units for shares
Exchanges of UPREIT Units for shares of the Company’s common stock are recorded under the historical cost method with UPREIT Units acquired reflected at their book value (“exchange value”). The exchange value of UPREIT Units is allocated to common stock and additional paid in capital.
There were 172,821, 168,417 and 284,180 shares of UPREIT Units exchanged for common stock, during 2014, 2013 and 2012, respectively. The Company made adjustments within equity in the amount of $4,887, $4,495 and $6,899, during 2014, 2013 and 2012, respectively, to record the exchange value of the transactions.
Costs Incurred for Stock Issuances
Costs incurred in connection with the Company’s stock issuances are reflected as a reduction of additional paid in capital.
Discontinued Operations
The Company reports its property dispositions as discontinued operations as prescribed by the authoritative guidance. Pursuant to the definition of a component of an entity in the authoritative guidance for discontinued operations, assuming no significant continuing involvement by the former owner after the sale, the sale of an apartment community is considered a discontinued operation. In addition, apartment communities classified as held for sale are also considered a discontinued operation. The Company generally considers assets to be held for sale when all significant contingencies surrounding the closing have been resolved, which often corresponds with the actual closing date. For purposes of the discontinued operations presentation, the Company includes interest expense and losses from early extinguishment of debt associated with specific mortgage indebtedness of the properties that are considered discontinued operations.
On April 10, 2014, the Financial Accounting Standards Board issued a new standard which raises the threshold for determining which disposals are required to be presented as discontinued operations and modifies related disclosure requirements, is applied prospectively and is effective in 2015 with early adoption permitted. The Company did not elect to early adopt this standard in 2014. The standard is described more fully in Note 3.
HOME PROPERTIES, INC.
NOTES TO CONSOLIDATED FINANCIAL STATEMENTS
(Dollars in thousands, except per share data)
2 SUMMARY OF SIGNIFICANT ACCOUNTING POLICIES (continued)
Depreciation
The Company is required to make subjective assessments as to the useful lives of its properties and improvements for purposes of determining the amount of depreciation to record on an annual basis. These assessments have a direct impact on the Company’s net income.
Assets are depreciated using a straight-line method over the following estimated useful lives:
|
Land improvements |
3-20 years |
|
Buildings and improvements |
3-40 years |
|
Furniture, fixtures and equipment |
5-10 years |
|
Computer software |
5 years |
Depreciation expense charged to operations was $180,013, $166,537 and $152,914 from continuing operations and $2,460, $7,366 and $13,465 from discontinued operations for the years ended December 31, 2014, 2013 and 2012, respectively.
Cash and Cash Equivalents
Cash and cash equivalents include all cash and highly liquid investments purchased with original maturities of three months or less. The Company estimates that the fair value of cash equivalents approximates the carrying value due to the relatively short maturity of these instruments. The majority of the Company’s cash and cash equivalents are held at major commercial banks which at times may exceed the Federal Deposit Insurance Corporation limit of $250. The Company has not experienced any losses to date on its invested cash.
Cash in Escrows
Cash in escrows consists of resident security deposits for residential properties, cash restricted under the terms of various loan agreements to be used for the payment of property taxes and insurance as well as required replacement reserves, and occasionally funds held in escrow from tax-free exchanges.
Accounts Receivable and Allowance for Doubtful Receivables
Accounts receivable are generally comprised of amounts receivable from residents and other miscellaneous receivables from non-affiliated entities. We evaluate the collectability of accounts receivable from residents and establish an allowance for accounts greater than 60 days past due for current residents and all receivables due from former residents, after the application of security deposits. The allowance for doubtful resident receivables was $2,494 and $2,499 as of December 31, 2014 and 2013, respectively.
Deferred Charges
Costs relating to the financing of properties are deferred and amortized over the life of the related financing agreement. Amortization is reflected as interest expense in the consolidated statements of operations, with remaining terms ranging from 6 months to 7 years. Unamortized financing costs are written off when the financing agreement is retired before the maturity date. Accumulated amortization was $11,464 and $9,908, as of December 31, 2014 and 2013, respectively.
HOME PROPERTIES, INC.
NOTES TO CONSOLIDATED FINANCIAL STATEMENTS
(Dollars in thousands, except per share data)
2 SUMMARY OF SIGNIFICANT ACCOUNTING POLICIES (continued)
Intangible Assets
Intangible assets of $14,939 and $14,304 at December 31, 2014 and 2013, respectively, included in other assets, consist solely of intangible assets recorded in connection with the authoritative guidance for the acquisition of real estate assets. These intangible assets are amortized on a straight-line basis over their estimated useful lives of 6 months to 3 years. Accumulated amortization of intangible assets was $14,213 and $13,292 as of December 31, 2014 and 2013, respectively. Amortization expense for the years ended December 31, 2014, 2013 and 2012 was $1,110, $838 and $2,618 from continuing operations, respectively. There was no amortization expense charged to discontinued operations for the years ended December 31, 2014, 2013 and 2012. The carrying value of intangible assets is periodically reviewed by the Company and impairments are recognized when the expected future operating cash flows derived from such intangible assets are less than their carrying value.
Insurance Reserves
The Company has self insured retentions and aggregates up to certain limits for general liability, workers’ compensation and property claims. The Company relies on third-party actuaries in the development of reserve requirements. Reserves are currently funded for the estimated cost of claims incurred, both reported and unreported.
Derivative Instruments and Hedging Activities
The Company follows authoritative guidance for disclosure requirements for derivatives and hedging activities with the intent to provide users of financial statements with an enhanced understanding of: (a) how and why an entity uses derivative instruments, (b) how the entity accounts for derivative instruments and related hedged items, and (c) how derivative instruments and related hedged items affect an entity’s financial position, financial performance, and cash flows. Further, qualitative disclosures are required that explain the Company’s objectives and strategies for using derivatives, as well as quantitative disclosures about the fair value of and gains and losses on derivative instruments, and disclosures about credit-risk-related contingent features in derivative instruments.
The Company records all derivatives on the balance sheet at fair value. The accounting for changes in the fair value of derivatives depends on the intended use of the derivative, whether the Company has elected to designate a derivative in a hedging relationship and apply hedge accounting and whether the hedging relationship has satisfied the criteria necessary to apply hedge accounting. Derivatives designated and qualifying as a hedge of the exposure to changes in the fair value of an asset, liability, or firm commitment attributable to a particular risk, such as interest rate risk, are considered fair value hedges. Derivatives designated and qualifying as a hedge of the exposure to variability in expected future cash flows, or other types of forecasted transactions, are considered cash flow hedges. Hedge accounting generally provides for the matching of the timing of gain or loss recognition on the hedging instrument with the recognition of the changes in the fair value of the hedged asset or liability that are attributable to the hedged risk in a fair value hedge or the earnings effect of the hedged forecasted transactions in a cash flow hedge. The Company may enter into derivative contracts that are intended to economically hedge certain of its risks, even though hedge accounting does not apply or the Company elects not to apply hedge accounting.
Revenue Recognition
The Company leases its residential apartment units under leases with terms generally one year or less. Rental income is recognized on a straight-line basis over the related lease term. As a result, deferred rents receivable are created when rental income is recognized during the concession period of certain negotiated leases and amortized over the remaining term of the lease. In accordance with the authoritative guidance for business combinations, the Company recognizes rental revenue of acquired in-place “above and below” market leases at their fair value over the weighted average remaining lease term. Property other income, which consists primarily of income from operation of laundry facilities, utility recovery, administrative fees, garage and carport rentals and miscellaneous charges to residents, is recognized when earned (when the services are provided, or when the resident incurs the charge).
HOME PROPERTIES, INC.
NOTES TO CONSOLIDATED FINANCIAL STATEMENTS
(Dollars in thousands, except per share data)
2 SUMMARY OF SIGNIFICANT ACCOUNTING POLICIES (continued)
Other Income
Other income for the years ended December 31, 2014, 2013 and 2012 is primarily comprised of other real estate service fees.
Other Expenses
Other expenses for the years ended December 31, 2014, 2013 and 2012 are the transaction costs from the apartment communities acquired during 2014, 2013 and 2012 that were expensed according to authoritative guidance for business combinations. These costs, which are primarily transfer taxes and title fees, represent 0.41%, 0.42% and 0.90% of the total purchase price of the apartment communities acquired during 2014, 2013 and 2012, respectively.
Gain on Real Estate Sales
Gain on disposition of properties is recognized using the full accrual method in accordance with the authoritative guidance, provided that various criteria relating to the terms of sale and any subsequent involvement by the Company with the properties sold are met.
Advertising
Advertising expenses are charged to operations during the year in which they are incurred. Advertising expenses incurred and charged to operating and maintenance expenses in the consolidated statements of operations were $5,541, $5,162 and $5,060 from continuing operations, and $94, $191 and $395 from discontinued operations, for the years ended December 31, 2014, 2013 and 2012, respectively.
Federal Income Taxes
The Company has elected to be taxed as a real estate investment trust (“REIT”) under the Internal Revenue Code of 1986, as amended, commencing with the taxable year ended December 31, 1994. As a result, the Company generally is not subject to federal or state income taxation at the corporate level to the extent it distributes annually at least 90% of its REIT taxable income to its shareholders and satisfies certain other requirements. For the years ended December 31, 2014, 2013 and 2012, the Company distributed in excess of 100% of its taxable income; accordingly, no provision has been made for federal income taxes in the accompanying consolidated financial statements. Stockholders of the Company are taxed on dividends and must report distributions from the Company as either ordinary income, capital gains, or as return of capital; as more fully described in Note 9.
The Company follows the authoritative guidance for accounting for uncertainty in income taxes which addresses the recognition and measurement of assets and liabilities associated with tax positions taken or expected to be taken in a tax return. The Company reviewed its potential uncertain tax positions and made no adjustments to its existing financial and tax accounting treatment for all periods presented. The authoritative guidance also requires a public enterprise to disclose the aggregate difference in the basis of its net assets for financial and tax reporting purposes. The tax basis of assets is less than the amounts reported in the accompanying consolidated financial statements by approximately $496,780 and $508,787 at December 31, 2014 and 2013, respectively.
HOME PROPERTIES, INC.
NOTES TO CONSOLIDATED FINANCIAL STATEMENTS
(Dollars in thousands, except per share data)
2 SUMMARY OF SIGNIFICANT ACCOUNTING POLICIES (continued)
Federal Income Taxes (continued)
The following table reconciles net income to taxable income for the years ended December 31, 2014, 2013 and 2012:
|
|
|
2014 |
|
2013 |
|
2012 | |||
|
Net income |
|
$ |
189,471 |
|
$ |
191,579 |
|
$ |
163,622 |
|
Net income attributable to noncontrolling interest |
|
(28,533) |
|
(30,706) |
|
(28,320) | |||
|
Net (income) loss of taxable REIT Subsidiary included in net income |
|
(112) |
|
(123) |
|
5 | |||
|
Net income from REIT operations |
|
160,826 |
|
160,750 |
|
135,307 | |||
|
Book to tax differences: |
|
|
|
|
|
| |||
|
Book depreciation and amortization |
|
155,829 |
|
146,675 |
|
139,067 | |||
|
Tax depreciation and amortization |
|
(158,288) |
|
(153,975) |
|
(143,893) | |||
|
Gains/losses from capital transactions |
|
(20,459) |
|
(9,026) |
|
(62,507) | |||
|
Carrying value of mortgages |
|
(1,362) |
|
(884) |
|
(784) | |||
|
Equity compensation |
|
(5,702) |
|
(2,905) |
|
(857) | |||
|
Property acquisition costs |
|
619 |
|
212 |
|
2,210 | |||
|
Other, net |
|
7,104 |
|
958 |
|
(1,934) | |||
|
Adjusted taxable income subject to 90% REIT dividend requirement |
|
$ |
138,567 |
|
$ |
141,805 |
|
$ |
66,609 |
The Company made actual distributions in excess of 100% of taxable income before capital gains. All adjustments to net income from REIT operations are net of amounts attributable to noncontrolling interest and the taxable REIT subsidiary, HPRS.
Included in total assets on the consolidated balance sheets are deferred tax assets of $13,052 and $13,107 as of December 31, 2014 and 2013, respectively. The deferred tax assets were a result of the net losses associated with the affordable property portfolio sales during 2004 and 2003. The deferred tax assets expire between 2020 and 2032. Management does not believe it is more likely than not that these deferred assets will be used, and accordingly has recorded a reserve against the deferred tax assets of $13,052 and $13,107 at December 31, 2014 and 2013, respectively. The deferred tax assets are associated with HPRS which performed certain residential and development activities of the Company. HPRS historically provided commercial management services and provided loan advances to affordable housing entities owned through general partnership interests. As these activities are no longer provided, Management does not currently believe there is a source for future material taxable earnings for HPRS that would give rise to value for the deferred tax assets.
Use of Estimates
The preparation of financial statements in conformity with accounting principles generally accepted in the United States of America requires management to make estimates and assumptions that affect the reported amount of assets and liabilities and disclosures of contingent assets and liabilities at the date of the financial statements and the reported amounts of revenues and expenses during the reporting period. Actual results could differ from those estimates.
HOME PROPERTIES, INC.
NOTES TO CONSOLIDATED FINANCIAL STATEMENTS
(Dollars in thousands, except per share data)
3 RECENTLY ISSUED ACCOUNTING STANDARDS
On April 10, 2014, the Financial Accounting Standards Board (“FASB”) issued ASC 2014-08, Reporting Discontinued Operations and Disclosures of Disposals of Components of an Entity, which raises the threshold for determining which disposals are required to be presented as discontinued operations and modifies related disclosure requirements. The standard is applied prospectively and is effective in 2015 with early adoption permitted. The Company does not expect the adoption of this guidance to have a material effect on its financial position and results of operations.
On May 28, 2014, the FASB issued Accounting Standards Update 2014-09, Revenue from Contracts with Customers (Topic 606) (“ASU 2014-09”). ASU 2014-09 is a comprehensive new revenue recognition model requiring a company to recognize revenue to depict the transfer of goods or services to a customer at an amount reflecting the consideration it expects to receive in exchange for those goods or services. In adopting ASU 2014-09, companies may use either a full retrospective or a modified retrospective approach. Additionally, this guidance requires improved disclosures regarding the nature, amount, timing and uncertainty of revenue and cash flows arising from contracts with customers. ASU 2014-09 is effective for the first interim period within annual reporting periods beginning after December 15, 2016, and early adoption is not permitted. The Company is currently assessing the potential impact that the adoption of this guidance will have on its financial position and results of operations.
4 ACQUISITIONS
Property Acquisitions
During the years ended December 31, 2014 and 2013, the Company acquired the communities listed below:
|
|
|
|
|
|
|
|
|
|
|
|
|
Cost of |
| ||||||||
|
|
|
|
|
Date |
|
Year |
|
Number |
|
Cost of |
|
Acquisition |
| ||||||||
|
Apartment Community |
|
Region |
|
Acquired |
|
Constructed |
|
of Units |
|
Acquisition |
|
Per Unit |
| ||||||||
|
The Preserve at Milltown |
|
Philadelphia |
|
6/19/2014 |
|
1975 |
|
|
376 |
|
|
|
$ |
45,000 |
|
|
|
$ |
120 |
|
|
|
Willowbrook |
|
Philadelphia |
|
7/30/2014 |
|
1972 |
|
|
248 |
|
|
|
30,500 |
|
|
|
123 |
|
| ||
|
The Lakes of Schaumburg |
|
Chicago |
|
11/12/2014 |
|
1987 |
|
|
428 |
|
|
|
66,000 |
|
|
|
154 |
|
| ||
|
|
|
|
|
|
|
|
|
|
1,052 |
|
|
|
$ |
141,500 |
|
|
|
|
|
| |
|
|
|
|
|
|
|
|
|
|
|
|
|
|
|
|
|
|
|
|
| ||
|
Stone Hill |
|
Philadelphia |
|
11/27/2013 |
|
1971 |
|
|
205 |
|
|
|
$ |
15,500 |
|
|
|
$ |
76 |
|
|
|
Middlesex Crossing |
|
Boston |
|
12/18/2013 |
|
1969-1974 |
|
|
252 |
|
|
|
40,250 |
|
|
|
160 |
|
| ||
|
|
|
|
|
|
|
|
|
|
457 |
|
|
|
$ |
55,750 |
|
|
|
|
|
| |
All of the 2014 and 2013 acquired apartment communities were recorded at fair value which approximated actual purchase price. None of the acquisitions were subject to bargain purchase options or resulted in goodwill being recorded. In connection with these acquisitions, closing costs of $734 and $312 were incurred and are included in other expenses for the years ended December 31, 2014 and 2013, respectively.
The Company accounts for its acquisitions of investments in real estate in accordance with the authoritative guidance for business combinations and recorded the purchase price to acquired tangible assets consisting of land, building, and personal property and identified intangible assets and liabilities, consisting of the value of above-market and below-market leases, value of in-place leases and value of resident relationships, based in each case on their fair values.
HOME PROPERTIES, INC.
NOTES TO CONSOLIDATED FINANCIAL STATEMENTS
(Dollars in thousands, except per share data)
4 ACQUISITIONS (continued)
Property Acquisitions (continued)
The following table summarizes the Company’s aggregate purchase price allocation for the 2014 Acquisition Communities and the 2013 Acquisition Communities:
|
|
|
2014 |
|
2013 |
| ||
|
Land |
|
$ |
20,810 |
|
$ |
11,640 |
|
|
Buildings, improvements and equipment |
|
120,027 |
|
43,799 |
| ||
|
Fair market value adjustment for loan and liabilities assumed |
|
1,969 |
|
- |
| ||
|
Below-market rents |
|
(161 |
) |
(36 |
) | ||
|
In-place lease intangibles |
|
471 |
|
201 |
| ||
|
Customer relationships |
|
353 |
|
146 |
| ||
|
Net assets acquired |
|
$ |
143,469 |
|
$ |
55,750 |
|
Included in the consolidated statements of income for the years ended December 31, 2014 and 2013, are total revenues of $11,803 and $351, respectively, and net income attributable to common shareholders of $3,341 and $79, respectively, since the respective date of acquisition through December 31, 2014 for the 2014 and 2013 acquired apartment communities.
Pro Forma Information
The following unaudited pro forma information was prepared as if the 2014 and 2013 transactions related to the acquisition of apartment communities occurred as of January 1 of the preceding year. The pro forma financial information is based upon the historical consolidated financial statements of the Company and the acquired communities, and is not necessarily indicative of the consolidated results which actually would have occurred if the transactions had been consummated at January 1, 2013, nor does it purport to represent the results of operations for future periods. Adjustments to the pro forma financial information for the years ended December 31, 2014 and 2013 consist principally of providing net operating activity and recording interest, depreciation and amortization from January 1, 2013 to the acquisition date as appropriate. Acquisition related costs in the amount of $734 were excluded from the 2014 pro forma net income attributable to common stockholders. An adjustment was made to include these costs in the 2013 pro forma net income attributable to common stockholders.
|
|
|
2014 |
|
2013 |
| ||
|
|
|
(Unaudited) |
|
(Unaudited) |
| ||
|
Pro forma total revenues |
|
$ |
681,656 |
|
$ |
660,201 |
|
|
Pro forma net income attributable to common stockholders |
|
162,935 |
|
163,430 |
| ||
|
Pro forma earnings per common share: |
|
|
|
|
| ||
|
Basic |
|
$ |
2.84 |
|
$ |
3.01 |
|
|
Diluted |
|
2.82 |
|
2.98 |
| ||
5 DEVELOPMENT
Land Held for Sale
During the second quarter of 2014, the Board of Directors of the Company approved a strategic decision to discontinue the Company’s new development business. Development activities will be limited to the development of the two new apartment communities currently under construction: Eleven55 Ripley in Silver Spring, MD and The Courts at Spring Mill Station in Conshohocken, PA. No additional new apartment communities will be started. Land parcels that will not be developed and are being marketed for sale have been reclassified as land held for sale.
HOME PROPERTIES, INC.
NOTES TO CONSOLIDATED FINANCIAL STATEMENTS
(Dollars in thousands, except per share data)
5 DEVELOPMENT (continued)
Land Held for Sale (continued)
It is the Company’s policy to perform a quarterly review of its long-lived assets for impairment when, in accordance with the authoritative guidance for the accounting for the impairment or disposal of long-lived assets, there is an event or change in circumstances that indicates an impairment in value. An asset is considered impaired when the carrying amounts exceed the estimated selling proceeds less the costs to sell. Management has reviewed its land held for future development and recorded impairment losses to reduce the carrying amounts of the assets to the estimated selling proceeds less the costs to sell. As of December 31, 2014, the Company has $13,114 recorded as land held for sale. During the year ended December 31, 2014, the Company recognized impairment and other charges in the amount of $5,382 in connection with the decision to discontinue new development.
Severance Costs
The Company expects to incur severance charges in connection with the elimination of development positions in the amount of $1,800. Severance costs include severance, a stay bonus and unamortized equity compensation. Employees are required to fulfill specific service requirements in order to earn the severance compensation. Severance expense is recorded ratably over the requisite service period during the third and fourth quarters of 2014 and the first quarter of 2015. During the year ended December 31, 2014, the Company recognized severance costs in the amount of $1,440 which is included in impairment and other charges.
Redevelopment
The Company has one project under redevelopment which is nearing completion. Arbor Park, located in Alexandria, Virginia, has 851 garden apartments in fifty-two buildings built in 1967. The project, which began in 2011, involves extensively renovating all of the units over several years on a building by building basis. As of December 31, 2014, there were five buildings with 72 units under renovation and forty-seven buildings with 779 units completed and 657 of those units occupied. As of December 31, 2014, the Company has incurred costs of $30,019 for the renovation which is included in buildings, improvements and equipment. The entire project is expected to be completed in 2015.
Development
During the fourth quarter of 2011, the Company started construction on Eleven55 Ripley, located in Silver Spring, Maryland, consisting of two buildings, a 21 story high-rise and a 5 story mid-rise, for a total of 379 apartment units. Initial occupancy occurred in the fourth quarter of 2013. As of December 31, 2014, 262 apartment units were occupied and $61,525 was placed into service and included in buildings, improvements and equipment. Construction is expected to be completed in the first quarter of 2015. The construction in progress for this development was $51,858 as of December 31, 2014.
During the second quarter of 2012, the Company started construction on The Courts at Spring Mill Station, located in Conshohocken, Pennsylvania, a suburb of Philadelphia. The combination donut/podium style project, consisting of two buildings, will have a total of 385 apartment units. Initial occupancy occurred in the fourth quarter of 2014. As of December 31, 2014, 34 apartment units were occupied and $7,296 was placed into service and included in buildings, improvements and equipment. Construction is expected to be completed in the second quarter of 2015. The construction in progress for this development was $66,737 as of December 31, 2014.
HOME PROPERTIES, INC.
NOTES TO CONSOLIDATED FINANCIAL STATEMENTS
(Dollars in thousands, except per share data)
6 DEBT
Mortgage Notes Payable
The Company’s mortgage notes payable are summarized as follows:
|
|
|
2014 |
|
2013 |
| ||
|
Fixed rate mortgage notes payable |
|
$ |
1,613,465 |
|
$ |
1,731,177 |
|
|
Variable rate mortgage notes payable |
|
23,710 |
|
83,040 |
| ||
|
Mortgage notes payable |
|
$ |
1,637,175 |
|
$ |
1,814,217 |
|
During the year ended December 31, 2014, the Company repaid $179,852 of mortgage loans of which $78,005 were paid off at or before maturity, $101,847 related to property sales and $30,670 were scheduled payments. Two of the loans repaid had been accounted for at fair value on the date the mortgage loans were assumed by the Company in connection with the acquisition of those communities. Upon retirement, an adjustment was recorded to reduce interest expense in the amount of $216 to write-off the difference between the carrying value and the contractual balance of the loans. During the year ended December 31, 2014, the Company assumed one mortgage with a fair value of $33,696 in connection with a property acquisition.
For 2014 and 2013, mortgage notes payable were collateralized by certain apartment communities as detailed in Schedule III. The mortgage notes payable outstanding as of December 31, 2014 mature at various dates from 2015 through 2021, with a weighted average remaining term of approximately three and one-half years. The weighted average interest rate of the Company’s fixed rate notes was 5.20% and 5.21% at December 31, 2014 and 2013, respectively. The weighted average interest rate of the Company’s variable rate notes was 2.90% and 3.02% at December 31, 2014 and 2013, respectively.
Principal payments on the mortgage notes payable for years subsequent to December 31, 2014 are as follows:
|
2015 |
|
$ 245,870 |
|
|
2016 |
|
308,062 |
|
|
2017 |
|
200,995 |
|
|
2018 |
|
173,717 |
|
|
2019 |
|
257,647 |
|
|
Thereafter |
|
450,884 |
|
|
|
|
$ 1,637,175 |
|
Prepayment penalties of $5,169, $2,229 and $2,202 were incurred for the years ended December 31, 2014, 2013 and 2012, respectively, and are included in interest expense. Included in the 2014, 2013 and 2012 prepayment penalties of $5,169, $2,229 and $2,202, respectively, are penalties of $5,001, $1,613 and $2,115, respectively, which were incurred in connection with the sale of property and are included in discontinued operations.
Deferred financing costs of $297, $518 and $45 were written off for the years ended December 31, 2014, 2013 and 2012, respectively, and are included in interest expense. For 2014, 2013 and 2012, deferred financing costs written off of $289, $169 and $42, respectively, were incurred in connection with the sale of properties and are included in discontinued operations. For 2014, 2013 and 2012, deferred financing costs written off of $8, $349 and $3, respectively, were incurred in connection with the early repayment of mortgages and are included in interest expense from continuing operations.
HOME PROPERTIES, INC.
NOTES TO CONSOLIDATED FINANCIAL STATEMENTS
(Dollars in thousands, except per share data)
6 DEBT (continued)
Unsecured Term Loans
In December 2011, the Company entered into a five-year unsecured term loan for $250,000 with M&T Bank as lead bank, and ten other participating lenders, which was set to mature on December 8, 2016. On August 19, 2013, the Company amended the loan agreement to extend the maturity date to August 18, 2018. No other changes were made to the terms of the unsecured term loan. The loan bears monthly interest at a variable rate based on LIBOR, plus a spread from 1.00% to 2.00% based on the Company’s leverage ratio.
On July 19, 2012, the Company entered into two interest rate swap agreements that effectively convert the variable LIBOR portion of this loan to a fixed rate of 0.685% through December 7, 2016. On November 4, 2013, the Company entered into three additional interest rate swap agreements that effectively convert the variable LIBOR portion of this loan to a fixed rate of 2.604% for the period of December 8, 2016 through August 18, 2018. The interest rate swap agreements are more fully described in Note 8. As of December 31, 2014, based on the Company’s leverage ratio, the spread was 1.00%, and the one-month LIBOR was swapped at 0.685%; resulting in an effective rate of 1.685% for the Company.
On June 28, 2013, the Company entered into an unsecured loan agreement with M&T Bank with a September 30, 2013 maturity date. The note had a maximum principal amount of $75,000, with monthly interest at a variable rate based on LIBOR, plus a spread from 1.00% to 2.00% based on the Company’s leverage ratio. On June 28, 2013, the Company borrowed $25,000 which was repaid in its entirety on July 12, 2013. Proceeds from this term loan were utilized to partially fund the repayment of secured debt. On August 19, 2013, the loan commitment was terminated in connection with an amendment to the unsecured line of credit, as more fully described below.
On November 19, 2014, the Company entered into an unsecured loan agreement with M&T Bank with a May 18, 2015 maturity date. The note has a maximum principal amount of $100,000, with monthly interest at a variable rate based on LIBOR, plus a spread from 1.00% to 2.00% based on the Company’s leverage ratio. On November 19, 2014, the Company borrowed $100,000. Proceeds from this term loan were utilized to pay down the line of credit.
The unsecured term loans have covenants that align with the unsecured line of credit facility described below. The Company was in compliance with these financial covenants for all periods presented.
Unsecured Senior Notes
In December 2011, the Company issued $150,000 of unsecured senior notes. The notes were offered in a private placement in two series: Series A: $90,000 with a seven-year term due December 19, 2018 at a fixed interest rate of 4.46% (“Series A”); and, Series B: $60,000 with a ten-year term due December 19, 2021 at a fixed interest rate of 5.00% (“Series B”).
On June 27, 2012, the Company issued another private placement note in the amount of $50,000 with a seven-year term, a fixed rate of 4.16% and a June 27, 2019 due date. The proceeds from this note were used to partially fund the purchase of a 1,350 unit apartment community on June 28, 2012.
The unsecured senior notes are subject to various covenants and maintenance of certain financial ratios. Although the covenants of the notes do not duplicate all the covenants of the unsecured line of credit facility, any covenants applicable to both the notes and the line are identical. The Company was in compliance with these financial covenants for all periods presented.
HOME PROPERTIES, INC.
NOTES TO CONSOLIDATED FINANCIAL STATEMENTS
(Dollars in thousands, except per share data)
6 DEBT (continued)
Unsecured Line Of Credit
On August 19, 2013, the Company entered into a First Amendment to the Amended and Restated Credit Agreement (the “Credit Agreement”), which provides for a $450,000 revolving credit facility with an initial maturity date of August 18, 2017 and a one-year extension at the Company’s option. The Credit Agreement amended the Company’s prior $275,000 facility, which was scheduled to expire on December 8, 2015, not including a one-year extension at the Company’s option. The Credit Agreement is with M&T Bank and U.S. Bank National Association as joint lead arrangers, M&T Bank as administrative agent and nine other commercial banks as participants. The Company had $269,000 outstanding under the credit facility as of December 31, 2014. Borrowings under the line of credit bear interest at a variable rate based on LIBOR, plus a spread from 1.00% to 2.00% based on the Company’s leverage ratio. As of December 31, 2014, based on the Company’s leverage ratio, the spread was 1.00%, and the one-month LIBOR was 0.19%; resulting in an effective rate of 1.19% for the Company.
The Credit Agreement requires the Company to maintain certain financial ratios and measurements including a limitation on outstanding indebtedness and a minimum interest coverage ratio. The Company was in compliance with these financial covenants for all periods presented.
The Credit Agreement also provides the ability to issue up to $20,000 in letters of credit. While the issuance of letters of credit does not increase borrowings outstanding under the line of credit, it does reduce the amount available. At December 31, 2014, the Company had outstanding letters of credit of $3,840 and the amount available on the credit facility was $177,160.
7 FAIR VALUE OF FINANCIAL INSTRUMENTS AND REAL ESTATE ASSETS
Financial Instruments Carried at Fair Value
The fair value of interest rate swaps, which are more fully described in Note 8, are determined using the market standard of netting the discounted future fixed cash receipts (or payments) and the discounted expected variable cash payments (or receipts). The variable cash payments (or receipts) are based on an expectation of future interest rate forward curves derived from observable market interest rate curves (level 2 inputs, as defined by the authoritative guidance). The Company incorporates credit valuation adjustments to appropriately reflect both its own nonperformance risk and the respective counterparty’s nonperformance risk in the fair value measurements. The Company has determined that the significant inputs used in this model are observable in active markets, therefore considers the interest rate swap asset valuation of $294 and forward interest rate swap liability valuation of $2,339 at December 31, 2014 and the asset valuation of $1,840 at December 31, 2013 as level 2 classifications within the fair value hierarchy.
Real Estate Assets Carried at Fair Value
The Company has real estate assets that are required to be recorded at fair value on a nonrecurring basis when certain circumstances occur. During the year ended December 31, 2014, in connection with the decision to discontinue new property development, the Company recorded impairment and other charges of $3,942 on land parcels previously held for future development. These impairment charges are reported in impairment and other charges in the consolidated statements of operations. The land impairment charges reflect the excess of the carrying amounts over the estimated selling proceeds less the costs to sell the land parcels using sales contract price. The Company has determined that the significant inputs used in this model are unobservable in active markets, therefore considers the land held for sale valuation as a level 3 classification within the fair value hierarchy.
HOME PROPERTIES, INC.
NOTES TO CONSOLIDATED FINANCIAL STATEMENTS
(Dollars in thousands, except per share data)
7 FAIR VALUE OF FINANCIAL INSTRUMENTS AND REAL ESTATE ASSETS (continued)
Financial Instruments Not Carried at Fair Value
The Company follows the authoritative guidance for fair value measurements when valuing its financial instruments for disclosure purposes. The valuation of financial instruments requires the Company to make estimates and judgments that affect the fair value of the instruments.
Cash and cash equivalents, cash in escrows, accounts receivable, other assets, accounts payable, accrued interest payable, accrued expenses and other liabilities, except for interest rate swaps, are all carried at their face amounts, which approximate their fair values due to their relatively short-term nature and high probability of realization.
The Company determined the fair value of its mortgage notes payable, unsecured term loans, unsecured senior notes and unsecured line of credit facility using a discounted future cash flow technique that incorporates observable market-based inputs, including a market interest yield curve with adjustments for duration, loan to value (level 2 inputs), and risk profile (level 3 inputs). In determining the market interest yield curve, the Company considered its investment grade credit ratings (level 2 inputs). The Company has determined that the significant inputs used in this model are observable in active markets, therefore considers the valuation classified as level 2 of the fair value hierarchy. At December 31, 2014 and December 31, 2013, the fair value of the Company’s total debt, consisting of the mortgage notes, the unsecured term loans, unsecured senior notes and unsecured line of credit, amounted to a liability of $2,552,416 and $2,552,145, respectively, compared to its carrying amount of $2,456,175 and $2,457,217, respectively.
8 DERIVATIVE AND HEDGING ACTIVITIES
Risk Management Objective of Using Derivatives
The Company’s objectives in using interest rate derivatives are to add stability to interest expense and to manage its exposure to interest rate movements. To accomplish this objective, the Company primarily uses interest rate swaps as part of its interest rate risk management strategy. Interest rate swaps designated as cash flow hedges involve the receipt of variable amounts from a counterparty in exchange for the Company making fixed-rate payments over the life of the agreements without exchange of the underlying notional amount. The Company does not utilize these arrangements for trading or speculative purposes.
Cash Flow Hedges of Interest Rate Risk
On July 19, 2012, the Company entered into two interest rate swap agreements that effectively convert the one-month LIBOR portion of a $250,000 five-year variable rate unsecured term loan, originally due on December 8, 2016, from a variable rate of one-month LIBOR plus a spread of 1.00% to 2.00% based on the Company’s leverage ratio to a fixed rate of 0.685% plus the applicable spread. As further described in Note 6, the $250,000 unsecured term loan was amended to extend the maturity date to August 18, 2018. On November 4, 2013, the Company entered into three additional interest rate swap agreements for the period of December 8, 2016 through August 18, 2018 to succeed the original two swaps. These three forward swaps effectively convert the variable rate of one-month LIBOR plus a spread of 1.00% to 2.00% based on the Company’s leverage ratio to a fixed rate of 2.604% plus the applicable spread.
HOME PROPERTIES, INC.
NOTES TO CONSOLIDATED FINANCIAL STATEMENTS
(Dollars in thousands, except per share data)
8 DERIVATIVE AND HEDGING ACTIVITIES (continued)
Cash Flow Hedges of Interest Rate Risk (continued)
As of December 31, 2014, the Company had the following outstanding interest rate derivatives that were designated as cash flow hedges of interest rate risk:
|
Interest Rate |
|
Notional |
|
Fixed |
|
Variable |
|
Effective Date |
|
Maturity Date |
| |
|
Interest rate swap |
|
$ |
150,000 |
|
0.6800% |
|
One-month LIBOR |
|
August 13, 2012 |
|
December 8, 2016 |
|
|
Interest rate swap |
|
$ |
100,000 |
|
0.6925% |
|
One-month LIBOR |
|
August 13, 2012 |
|
December 8, 2016 |
|
|
Interest rate swap |
|
$ |
100,000 |
|
2.6010% |
|
One-month LIBOR |
|
December 8, 2016 |
|
August 18, 2018 |
|
|
Interest rate swap |
|
$ |
75,000 |
|
2.6010% |
|
One-month LIBOR |
|
December 8, 2016 |
|
August 18, 2018 |
|
|
Interest rate swap |
|
$ |
75,000 |
|
2.6125% |
|
One-month LIBOR |
|
December 8, 2016 |
|
August 18, 2018 |
|
The table below presents the fair value of the Company’s derivative financial instruments as well as their classification on the balance sheets as of December 31, 2014 and December 31, 2013:
|
|
|
Fair Value of Derivative Instruments |
| ||||||||||||||
|
|
|
Asset Derivatives |
|
Liability Derivatives |
| ||||||||||||
|
|
|
Balance |
|
Fair Value at |
|
Balance |
|
Fair Value at |
| ||||||||
|
|
|
Sheet Location |
|
12/31/2014 |
|
12/31/2013 |
|
Sheet Location |
|
12/31/2014 |
|
12/31/2013 |
| ||||
|
Interest Rate Swap |
|
Other Assets |
|
$ |
294 |
|
$ |
1,840 |
|
Other Liabilities |
|
$ |
2,339 |
|
$ |
- |
|
The effective portion of changes in the fair value of derivatives designated and that qualify as cash flow hedges are recorded in accumulated other comprehensive income and are subsequently reclassified into earnings in the period that the hedged forecasted transaction affects earnings. During 2014 and 2013, such derivatives were used to hedge the variable cash flows associated with certain variable-rate debt. The ineffective portion of the change in fair value of the derivatives is recognized directly in earnings. During the years ended December 31, 2014 and 2013, the Company did not record any hedge ineffectiveness.
Amounts reported in accumulated other comprehensive income related to derivatives will be reclassified to interest expense as interest payments are made on the Company’s variable-rate debt. The Company estimates that an additional $819 will be reclassified from accumulated other comprehensive income as an increase to interest expense over the next twelve months.
The table below details the location in the financial statements of the gain or loss recognized on interest rate derivatives designated as cash flow hedges for the years ended December 31, 2014 and 2013, respectively:
|
|
|
2014 |
|
2013 |
| ||
|
|
|
|
|
|
| ||
|
Amount of gain (loss) recognized in accumulated other comprehensive income on interest rate derivatives (effective portion) |
|
$ |
(5,147) |
|
$ |
1,972 |
|
|
Amount of gain (loss) reclassified from accumulated other comprehensive income into income as interest expense (effective portion) |
|
$ |
(1,261) |
|
$ |
(1,164) |
|
|
Amount of gain (loss) recognized in income on derivative (ineffective portion and amount excluded from effectiveness testing) |
|
$ |
- |
|
$ |
- |
|
HOME PROPERTIES, INC.
NOTES TO CONSOLIDATED FINANCIAL STATEMENTS
(Dollars in thousands, except per share data)
8 DERIVATIVE AND HEDGING ACTIVITIES (continued)
Disclosure of Offsetting Derivatives
As of December 31, 2014 and December 31, 2013, the gross amount of derivative assets classified on the balance sheet in other assets was $294 and $1,840, respectively. As of December 31, 2014 and December 31, 2013, the gross amount of derivative liabilities classified on the balance sheet in accrued expenses and other liabilities was $2,339 and $0, respectively. The Company does not have any derivative instruments offset on the balance sheet or subject to master netting arrangements or similar agreements.
Credit-risk-related Contingent Features
The Company is exposed to credit risk in the event of non-performance by the counterparties to the swaps. The Company minimizes this risk exposure by limiting counterparties to major banks who meet established credit and capital guidelines.
The Company has agreements with each of its derivative counterparties that provide, among other defaults, that if the Company defaults on indebtedness having an aggregate principal amount in excess of $20,000, including default where repayment of the indebtedness has not been accelerated by the lender, the counterparty could declare the Company in default on its derivative obligations.
As of December 31, 2014, the Company has not posted any collateral related to these agreements and was not in breach of any agreement provisions. If the Company had breached any of these provisions, it could have been required to settle its obligations under the agreements at their aggregate termination value of $2,356 at December 31, 2014.
9 STOCKHOLDERS’ EQUITY
Common Stock
In 1997, the Company’s Board of Directors approved a stock repurchase program under which the Company may repurchase shares of its outstanding common stock and UPREIT Units (“Company Program”). The shares and units may be repurchased through open market or privately negotiated transactions at the discretion of Company management. The Board’s action did not establish a target price or a specific timetable for repurchase. At December 31, 2014 the Company had authorization to repurchase 2,291,160 shares of common stock and UPREIT Units under the Company Program. There were no repurchases in 2014, 2013 or 2012 under the Company Program.
In addition, participants in the Company’s stock benefit plans can use common stock of the Company that they already own to pay all or a portion of the exercise price payable to the Company upon the exercise of an option. In such event, the common stock used to pay the exercise price is returned to authorized but unissued status, and is deemed to have been repurchased by the Company, but does not represent repurchases under the Company Program.
HOME PROPERTIES, INC.
NOTES TO CONSOLIDATED FINANCIAL STATEMENTS
(Dollars in thousands, except per share data)
9 STOCKHOLDERS’ EQUITY (continued)
At-The-Market Equity Offering Programs
On September 17, 2010, the Company initiated an At-The-Market (“ATM”) equity offering program through which it was authorized to sell up to 3,600,000 shares of common stock from time to time in ATM offerings or negotiated transactions. There were no shares issued from this program during 2010 or during the fourth quarter of 2011. The following summarizes issuances of common stock from this program since inception through the completion of the program on May 11, 2012:
|
Period |
|
Number of |
|
Gross |
|
Net Proceeds |
|
Average |
| |||||||||||
|
First quarter 2011 |
|
|
841,000 |
|
|
|
$ |
47,524 |
|
|
|
$ |
46,572 |
|
|
|
$ |
56.51 |
|
|
|
Second quarter 2011 |
|
|
1,485,707 |
|
|
|
90,102 |
|
|
|
88,299 |
|
|
|
60.65 |
|
| |||
|
Third quarter 2011 |
|
|
877,400 |
|
|
|
56,542 |
|
|
|
55,273 |
|
|
|
64.44 |
|
| |||
|
First quarter 2012 |
|
|
188,393 |
|
|
|
11,156 |
|
|
|
10,897 |
|
|
|
59.22 |
|
| |||
|
Second quarter 2012 |
|
|
207,500 |
|
|
|
13,224 |
|
|
|
12,957 |
|
|
|
63.73 |
|
| |||
|
Total |
|
|
3,600,000 |
|
|
|
$ |
218,548 |
|
|
|
$ |
213,998 |
|
|
|
$ |
60.71 |
|
|
On May 14, 2012, the Company initiated another ATM equity offering program through which it is authorized to sell up to 4,400,000 shares of common stock from time to time in ATM offerings or negotiated transactions. The following summarizes issuances of common stock from this program since inception through December 31, 2014:
|
Period |
|
Number of |
|
Gross |
|
Net Proceeds |
|
Average |
| |||||||||||
|
Second quarter 2012 |
|
|
698,599 |
|
|
|
$ |
42,528 |
|
|
|
$ |
41,617 |
|
|
|
$ |
60.88 |
|
|
|
Third quarter 2012 |
|
|
1,262,125 |
|
|
|
80,303 |
|
|
|
78,682 |
|
|
|
63.63 |
|
| |||
|
Fourth quarter 2012 |
|
|
10,100 |
|
|
|
628 |
|
|
|
609 |
|
|
|
62.18 |
|
| |||
|
First quarter 2013 |
|
|
407,296 |
|
|
|
25,855 |
|
|
|
25,282 |
|
|
|
63.48 |
|
| |||
|
Second quarter 2013 |
|
|
52,113 |
|
|
|
3,322 |
|
|
|
3,228 |
|
|
|
63.75 |
|
| |||
|
Total |
|
|
2,430,233 |
|
|
|
$ |
152,636 |
|
|
|
$ |
149,418 |
|
|
|
$ |
62.81 |
|
|
There were no shares issued from this program during the third and fourth quarters of 2013 or during 2014. As of December 31, 2014, 1,969,767 shares remain available under this ATM program.
The Company used the net proceeds from the ATM offerings primarily for general corporate purposes including acquisitions, development and redevelopment of apartment communities.
Public Equity Offering Programs
On July 9, 2013, the Company filed a prospectus supplement for a follow-on offering of 4,427,500 shares of its common stock at a price of $63.00 per share, including 577,500 shares issued pursuant to the exercise in full of an underwriters’ option to purchase additional shares. Net proceeds were $267,633 after underwriting discounts, commissions and offering expenses and were used to pay off outstanding indebtedness. All of the 4,427,500 shares offered were purchased and subsequently delivered on July 12, 2013.
HOME PROPERTIES, INC.
NOTES TO CONSOLIDATED FINANCIAL STATEMENTS
(Dollars in thousands, except per share data)
9 STOCKHOLDERS’ EQUITY (continued)
Dividend Reinvestment and Direct Stock Purchase Plan
The Company has a Dividend Reinvestment and Direct Stock Purchase Plan (the “DRIP”). The DRIP provides the stockholders of the Company an opportunity to automatically invest their cash dividends in common stock. In addition, eligible participants may make monthly payments or other voluntary cash investments in shares of common stock. The maximum monthly investment without prior Company approval is currently $10. There is no discount offered on the investment. The Company can meet share demand under the DRIP through share repurchases by the transfer agent in the open market on the Company’s behalf or new share issuance.
Dividends and Distributions
Stockholders are taxed on dividends and must report such dividends as ordinary income, capital gains, or return of capital. The Company has declared and paid a $2.92 distribution per common share (CUSIP 437306103) during its most recent fiscal year. Pursuant to Internal Revenue Code Section 857(b)(3)(C), for the year ended December 31, 2014, the Company designated the taxable composition of the following cash distributions to holders of common shares in the amounts set forth in the tables below:
|
|
|
|
|
|
|
|
|
Distribution Type | ||||||||||||
|
Declaration |
|
Record |
|
Payable |
|
Distributions |
|
Ordinary |
|
Qualified |
|
Return of |
|
Long- |
|
Unrecaptured | ||||
|
2/1/2014 |
|
2/13/2014 |
|
2/25/2014 |
|
|
$0.73 |
|
|
70.5110% |
|
0.0000% |
|
0.0000% |
|
0.0000% |
|
|
29.4890% |
|
|
5/1/2014 |
|
5/12/2014 |
|
5/23/2014 |
|
|
$0.73 |
|
|
70.5110% |
|
0.0000% |
|
0.0000% |
|
0.0000% |
|
|
29.4890% |
|
|
7/30/2014 |
|
8/13/2014 |
|
8/27/2014 |
|
|
$0.73 |
|
|
70.5110% |
|
0.0000% |
|
0.0000% |
|
0.0000% |
|
|
29.4890% |
|
|
10/28/2014 |
|
11/10/2014 |
|
11/21/2014 |
|
|
$0.73 |
|
|
70.5110% |
|
0.0000% |
|
0.0000% |
|
0.0000% |
|
|
29.4890% |
|
|
|
|
|
|
|
|
|
|
|
|
|
|
|
|
|
|
|
|
|
|
|
|
|
|
|
|
Totals |
|
|
$2.92 |
|
|
70.5110% |
|
0.0000% |
|
0.0000% |
|
0.0000% |
|
|
29.4890% |
|
The taxable composition of cash distributions for each common share for 2013 and 2012 is as follows:
|
|
|
|
|
|
|
|
|
Distribution Type | ||||||
|
Year |
|
|
|
Distributions |
|
Ordinary |
|
Qualified |
|
Return of |
|
Long- |
|
Unrecaptured |
|
2013 |
|
|
|
$2.80 |
|
63.0720% |
|
0.0000% |
|
0.0000% |
|
22.3642% |
|
14.5638% |
|
2012 |
|
|
|
$2.64 |
|
75.9761% |
|
0.0000% |
|
21.7871% |
|
1.2194% |
|
1.0174% |
Total Shares and Units Outstanding
At December 31, 2014, 57,703,957 common shares, and 10,114,355 UPREIT Units were outstanding for a total of 67,818,312 common share equivalents.
HOME PROPERTIES, INC.
NOTES TO CONSOLIDATED FINANCIAL STATEMENTS
(Dollars in thousands, except per share data)
9 STOCKHOLDERS’ EQUITY (continued)
Earnings Per Share
Basic earnings per share (“EPS”) is computed as net income attributable to common stockholders divided by the weighted average number of common shares outstanding for the period. Diluted EPS reflects the potential dilution that could occur from common shares issuable through stock-based compensation including stock options (using the treasury stock method). The exchange of an UPREIT Unit for a share of common stock has no effect on diluted EPS as unitholders and stockholders effectively share equally in the net income of the Operating Partnership. Income from continuing operations and discontinued operations is the same for both the basic and diluted calculation.
The reconciliation of basic and diluted earnings per share for the years ended December 31, 2014, 2013 and 2012, is as follows:
|
|
|
2014 |
|
2013 |
|
2012 | ||||||||||||
|
Numerator: |
|
|
|
|
|
| ||||||||||||
|
Income from continuing operations |
|
$ |
108,846 |
|
$ |
103,434 |
|
$ |
70,549 |
| ||||||||
|
Less: Income from continuing operations attributable to noncontrolling interest |
|
(16,395 |
) |
|
(16,503 |
) |
|
(12,343 |
) | |||||||||
|
Income from continuing operations attributable to common stockholders |
|
$ |
92,451 |
|
$ |
86,931 |
|
$ |
58,206 |
| ||||||||
|
Discontinued operations |
|
$ |
80,625 |
|
$ |
88,145 |
|
$ |
93,073 |
| ||||||||
|
Less: Discontinued operations attributable to noncontrolling interest |
|
(12,138 |
) |
|
(14,203 |
) |
|
(15,977 |
) | |||||||||
|
Discontinued operations attributable to common stockholders |
|
$ |
68,487 |
|
$ |
73,942 |
|
$ |
77,096 |
| ||||||||
|
Denominator: |
|
|
|
|
|
| ||||||||||||
|
Basic weighted average number of common shares outstanding |
|
57,315,391 |
|
54,328,514 |
|
49,744,636 |
| |||||||||||
|
Effect of dilutive stock options |
|
375,367 |
|
459,303 |
|
566,732 |
| |||||||||||
|
Effect of restricted shares and restricted stock units |
|
137,130 |
|
32,377 |
|
71,268 |
| |||||||||||
|
Diluted weighted average number of common shares outstanding |
|
57,827,888 |
|
54,820,194 |
|
50,382,636 |
| |||||||||||
|
Earnings per common share: |
|
|
|
|
|
| ||||||||||||
|
|
|
|
|
|
|
| ||||||||||||
|
Basic earnings per share: |
|
|
|
|
|
| ||||||||||||
|
Income from continuing operations |
|
|
$ |
1.61 |
|
|
$ |
1.60 |
|
|
$ |
1.17 |
| |||||
|
Discontinued operations |
|
|
1.20 |
|
|
1.36 |
|
|
1.55 |
| ||||||||
|
Net income attributable to common stockholders |
|
|
$ |
2.81 |
|
|
$ |
2.96 |
|
|
$ |
2.72 |
| |||||
|
Diluted earnings per share: |
|
|
|
|
|
|
|
|
| |||||||||
|
Income from continuing operations |
|
|
$ |
1.60 |
|
|
$ |
1.58 |
|
|
$ |
1.16 |
| |||||
|
Discontinued operations |
|
|
1.18 |
|
|
1.35 |
|
|
1.53 |
| ||||||||
|
Net income attributable to common stockholders |
|
|
$ |
2.78 |
|
|
$ |
2.93 |
|
|
$ |
2.69 |
| |||||
Unexercised stock options to purchase 337,207, 411,779 and 334,659 shares of the Company’s common stock were not included in the computations of diluted EPS because the options’ exercise prices were greater than the average market price of the Company’s stock during the years ended December 31, 2014, 2013 and 2012, respectively.
HOME PROPERTIES, INC.
NOTES TO CONSOLIDATED FINANCIAL STATEMENTS
(Dollars in thousands, except per share data)
10 STOCK BENEFIT PLANS
Description of Stock Benefit Plans
The Company has established stock benefit plans for the purpose of attracting and retaining the services of individuals who are important to the future success of the Company, including key employees, non-employee Directors and other key persons, and to provide them with increased motivation and incentive to exert their best efforts to enhance the long term value of the Company by enlarging their personal stake in its success.
On May 3, 2011, the stockholders of the Company approved the 2011 Stock Benefit Plan (the “2011 Plan”). The types of awards that may be granted under the 2011 Plan include stock options, stock appreciation rights, restricted stock, restricted stock units, unrestricted stock, and dividend equivalent rights. The 2011 Plan included an authorization to issue up to 3,000,000 newly authorized shares of the Company’s common stock plus the number of shares available for grant under a predecessor plan, the 2008 Stock Benefit Plan, which were 523,284 as of December 31, 2014. The grant of any full value awards (awards other than stock options or stock appreciation rights) was deemed, for purposes of determining the number of shares available under the 2011 Plan, as an award of 4.28 shares of common stock for each share of common stock subject to the award. On April 29, 2014, the stockholders of the Company approved an amendment to the 2011 Plan to increase the maximum number of shares of common stock which may be subject to awards issued under the 2011 Plan by 4,000,000 shares; and to provide that each full value award granted after April 29, 2014 will count as 5.45 shares available for issuance under the 2011 Plan. The grant of a stock option or stock appreciation right, which was not affected by the amendment, is deemed, for purposes of determining the number of shares available under the 2011 Plan, as an award of one share of common stock for each share of common stock subject to the option or stock appreciation right. Any forfeitures or cancellations of awards will be returned to the reserved pool under the 2011 Plan in the same manner. As of December 31, 2014, awards of 11,053 shares which have been forfeited or cancelled have been returned to the 2011 Plan and are available for future grants. The 2011 Plan succeeds previous plans as described below.
In November 2011, the Company’s Board of Directors approved a multiyear performance-based equity plan (the “Executive Performance-Based Equity Program”). The Executive Performance-Based Equity Program is governed by the 2011 Plan. Awards are in the form of restricted stock units with a service condition and market conditions.
There were several plans prior to the 2011 Plan adopted by the Company and approved by the stockholders including the 1994 Stock Benefit Plan, the 2000 Stock Benefit Plan, the 2003 Stock Benefit Plan, the Amended and Restated 2003 Stock Benefit Plan and the 2008 Stock Benefit Plan. Participants in each of the above referenced plans (the “Previous Plans”) included officers, non-employee Directors, and key employees of the Company. The Previous Plans allowed for the award of options, stock appreciation rights and restricted stock; though, no stock appreciation rights were awarded. Effective May 3, 2011, no additional awards may be issued under the Previous Plans.
The 2008 Stock Benefit Plan limited the number of shares issuable under the plan to 2,450,000. Stock options awarded reduced the number of shares available for awards by one share for every one share granted. Awards of restricted stock reduced the number of shares available for award by one share for every one share awarded, up to 250,000; beyond that, restricted stock reduced the number of shares available for award by 3.5 shares for every one share awarded. The number of options and shares of restricted stock issued to each non-employee Director were subject to a 2008 Plan provision that they not exceed 6,000 options and 2,000 shares annually for the years 2009 and 2010.
HOME PROPERTIES, INC.
NOTES TO CONSOLIDATED FINANCIAL STATEMENTS
(Dollars in thousands, except per share data)
10 STOCK BENEFIT PLANS (continued)
Description of Stock Benefit Plans (continued)
Stock option, restricted stock and restricted stock unit awards granted to employees and non-employee Directors under the all stock benefit plans are as follows:
|
|
Employee Awards |
|
Non-Employee Director Awards |
| |||||
|
Name of Plan |
Stock |
Restricted |
Restricted |
Total |
|
Stock |
Restricted |
Total |
Available |
|
Previous Plans |
7,735,580 |
737,655 |
N/A |
8,473,235 |
|
669,283 |
67,948 |
737,231 |
- |
|
2011 Plan |
446,567 |
273,807 |
369,168 |
1,089,542 |
|
- |
39,920 |
39,920 |
4,118,696 |
(a) Represents service-based awards of 55,279 and market-based awards of 313,889 at the maximum achievable level.
Terms and provisions applicable to an award granted, including vesting provisions, are specified in an award certificate. Options granted under the 2011 Plan during the years 2013 and 2012 vest 20% for each year of service until 100% vested on the fifth anniversary and expire after ten years from the grant date. There were no options granted during 2014. The exercise price per share for stock options issued under all of the stock benefit plans may not be less than 100% of the closing price of a share of common stock on the date the stock option is granted. Restricted stock awards granted to Directors vest 100% on the fifth anniversary of the grant date. All of the 42,336, 35,493 and 108,065 restricted stock awards granted to employees during 2014, 2013 and 2012 vest 25% on each anniversary of the grant date for a period of four years. Vesting conditions for restricted stock unit awards are more fully described under the heading “Restricted Stock Units” below. The Company has a policy of issuing new shares upon the exercise of stock options and upon the vesting of restricted stock and restricted stock units.
Stock Options
Stock-based compensation cost for a stock option is estimated at the grant date based on each option’s fair value as calculated using the Black-Scholes option pricing model, which incorporates various assumptions including expected dividend yields, volatility, option lives and interest rates. The Company recognizes stock-based compensation cost as expense ratably on a straight-line basis over the requisite service period. In determining the service period, the Company considers service requirements, the vesting period and retirement eligibility of the grantee. Authoritative guidance requires the estimation of forfeitures when recognizing compensation expense and that this estimate of forfeitures be adjusted over the requisite service period should actual forfeitures differ from such estimates. Changes in estimated forfeitures are recognized through a cumulative catch-up adjustment, which is recognized in the period of change, and impacts the amount of unamortized compensation expense to be recognized in future periods.
HOME PROPERTIES, INC.
NOTES TO CONSOLIDATED FINANCIAL STATEMENTS
(Dollars in thousands, except per share data)
10 STOCK BENEFIT PLANS (continued)
Stock Options (continued)
The following weighted average assumptions were used for the years ended December 31, 2013 and 2012:
|
Assumption |
|
2013 |
|
2012 |
|
|
Expected dividend yield |
|
4.34% |
|
4.22% |
|
|
Expected volatility |
|
26.25% |
|
26.53% |
|
|
Expected lives |
|
6.0 Years |
|
6.0 Years |
|
|
Risk free interest rate |
|
0.99% |
|
1.03% |
|
The expected dividend yield was based on the historical dividend growth rates and the historical annual dividends. The expected volatility was based on the historical volatility of the Company’s common stock. The weighted average expected option lives for options, with a lifetime of ten years, was based on the Company’s historical data for prior period stock option exercise and cancellation activity. The risk free interest rates for the expected life of the options were based on the implied U.S. Treasury yield curve.
A summary of stock option activity for the year ended December 31, 2014 is as follows:
|
|
|
Number of |
|
Weighted |
|
Weighted |
|
Aggregate |
| |||||||||||
|
Options outstanding at December 31, 2013 |
|
|
2,289,522 |
|
|
|
|
$ |
49.41 |
|
|
|
|
|
|
|
|
|
| |
|
Granted |
|
|
- |
|
|
|
|
- |
|
|
|
|
|
|
|
|
|
| ||
|
Exercised |
|
|
(510,001 |
) |
|
|
|
43.59 |
|
|
|
|
|
|
|
|
|
| ||
|
Cancelled |
|
|
(18,401 |
) |
|
|
|
57.59 |
|
|
|
|
|
|
|
|
|
| ||
|
Options outstanding at December 31, 2014 |
|
|
1,761,120 |
|
|
|
|
$ |
51.01 |
|
|
|
4.3 |
|
|
|
$ |
25,695 |
|
|
|
Options exercisable at December 31, 2014 |
|
|
1,473,051 |
|
|
|
|
$ |
49.22 |
|
|
|
3.8 |
|
|
|
$ |
24,129 |
|
|
A summary of unvested stock option activity for the year ended December 31, 2014 is as follows:
|
|
|
Number of |
|
Weighted | ||||
|
Unvested stock options at December 31, 2013 |
|
|
555,459 |
|
|
$ 54.43 |
| |
|
Granted |
|
|
- |
|
|
- |
| |
|
Vested |
|
|
(265,929 |
) |
|
48.18 |
| |
|
Cancelled |
|
|
(1,461 |
) |
|
64.50 |
| |
|
Unvested stock options at December 31, 2014 |
|
|
288,069 |
|
|
$ 60.14 |
| |
As of December 31, 2014, there was $442 of total unrecognized compensation cost related to unvested stock options that is expected to be recognized over a weighted average period of 1.71 years.
HOME PROPERTIES, INC.
NOTES TO CONSOLIDATED FINANCIAL STATEMENTS
(Dollars in thousands, except per share data)
10 STOCK BENEFIT PLANS (continued)
Stock Options (continued)
A summary of stock option activity for the years ended December 31, 2014 and 2013 and 2012 is as follows:
|
|
|
2014 |
|
2013 |
|
2012 |
| |||
|
Stock-based compensation costs recognized |
|
$ |
681 |
|
$ |
1,360 |
|
$ |
3,052 |
|
|
Fair value of options vested |
|
1,655 |
|
2,029 |
|
2,717 |
| |||
|
Cash received from the exercise of options |
|
22,233 |
|
14,494 |
|
18,228 |
| |||
|
Intrinsic value of options exercised |
|
10,351 |
|
6,644 |
|
8,737 |
| |||
|
Grant date fair value of options granted, per share |
|
- |
|
9.17 |
|
9.32 |
| |||
|
|
|
|
|
|
|
|
| |||
|
Number of options granted |
|
- |
|
59,958 |
|
219,799 |
| |||
Restricted Stock
Stock-based compensation cost for restricted stock is measured based on the closing price of the Company’s common stock on the grant date and is recognized ratably on a straight-line basis over the requisite service period. In determining the service period, the Company considers service requirements, the vesting period and retirement eligibility of the grantee.
A summary of restricted stock activity for the year ended December 31, 2014 is as follows:
|
|
|
Number of |
|
Weighted Grant Date Per Share | ||||
|
Restricted stock outstanding and unvested at December 31, 2013 |
|
|
234,673 |
|
|
$ 59.11 |
| |
|
Granted |
|
|
53,578 |
|
|
62.24 |
| |
|
Vested and issued |
|
|
(94,917 |
) |
|
55.77 |
| |
|
Cancelled |
|
|
(1,133 |
) |
|
63.74 |
| |
|
Restricted stock outstanding and unvested at December 31, 2014 |
|
|
192,201 |
|
|
$ 61.61 |
| |
As of December 31, 2014, there was $3,230 of total unrecognized compensation cost related to unvested restricted stock that is expected to be recognized over a weighted-average period of 2.41 years.
A summary of restricted stock activity for the years ended December 31, 2014, 2013 and 2012 is as follows:
|
|
|
2014 |
|
2013 |
|
2012 |
| |||
|
Stock-based compensation costs recognized |
|
$ |
3,239 |
|
$ |
3,956 |
|
$ |
7,659 |
|
|
Fair value of restricted shares vested |
|
5,925 |
|
6,603 |
|
6,707 |
| |||
|
Weighted average price of shares granted, per share |
|
62.24 |
|
65.14 |
|
63.62 |
| |||
|
|
|
|
|
|
|
|
| |||
|
Number of restricted shares granted to employees |
|
42,336 |
|
35,493 |
|
108,065 |
| |||
|
Number of restricted shares granted to Directors |
|
11,242 |
|
7,675 |
|
11,539 |
| |||
HOME PROPERTIES, INC.
NOTES TO CONSOLIDATED FINANCIAL STATEMENTS
(Dollars in thousands, except per share data)
10 STOCK BENEFIT PLANS (continued)
Restricted Stock Units
The Company has granted awards under a multiyear performance-based equity plan referred to as the Executive Performance-Based Equity Program. Awards are in the form of restricted stock units with a service condition and market conditions, with dividend equivalent rights. Seventy-five percent of a total award value is market-based and subject to three Total Shareholder Return (“TSR”) market measures: 50% absolute Home Properties TSR (“Absolute TSR”), 25% relative NAREIT All Equity REIT Index (“All REIT TSR Index”), and 25% relative NAREIT Apartment Index (“Apartment TSR Index”). The remaining twenty-five percent is service-based and vests over three years.
On February 11, 2014, January 2, 2013 and February 14, 2012, awards in connection with the Executive Performance-Based Equity Program, with an estimated fair value of $4,642, $3,653 and $4,084, respectively, were granted to executive officers of the Company. The measurement period for the awards granted in 2014 began on January 1, 2014 and will end on December 31, 2016. The measurement period for the awards granted in 2013 began on January 1, 2013 and will end on December 31, 2015. The measurement period for the awards granted in 2012 began on January 1, 2012 and ended on December 31, 2014.
At the end of the three-year measurement periods described above, the Company’s TSR results will be compared to the Threshold, Target and High hurdles established at the beginning of the three-year measurement periods. If the Company’s TSR results meet or exceed the Threshold hurdle for any of the three performance measures, an equity award will be granted in accordance with the vesting conditions as outlined in the Executive Performance-Based Equity Program. Actual results achieved that fall between the Threshold and High hurdles will result in a prorated number of awards granted.
The absolute and relative metrics for the awards granted in 2012 and 2013 are as follows:
|
|
|
Three-Year Performance Goals | ||||
|
|
|
|
|
|
|
|
|
Market Requirements |
|
Threshold |
|
Target |
|
High |
|
|
|
|
|
|
|
|
|
Absolute TSR |
|
7% |
|
9% |
|
11% |
|
|
|
|
|
|
|
|
|
All REIT TSR Index |
|
Absolute TSR is within 350 basis points below the index return |
|
Absolute TSR is within 100 basis points below or above the index return |
|
Absolute TSR is greater than 250 basis points above the index return |
|
|
|
|
|
|
|
|
|
Apartment TSR Index |
|
Absolute TSR is within 350 basis points below the index return |
|
Absolute TSR is within 100 basis points below or above the index return |
|
Absolute TSR is greater than 250 basis points above the index return |
The absolute and relative metrics for the awards granted in 2014 are as follows:
|
|
|
Three-Year Performance Goals | ||||
|
|
|
|
|
|
|
|
|
Market Requirements |
|
Threshold |
|
Target |
|
High |
|
|
|
|
|
|
|
|
|
Absolute TSR |
|
7% |
|
9% |
|
11% |
|
|
|
|
|
|
|
|
|
All REIT TSR Index |
|
Absolute TSR is better than -350 basis points from the index return |
|
Absolute TSR is 50 basis points above the index return |
|
Absolute TSR is at least 500 basis points above the index return |
|
|
|
|
|
|
|
|
|
Apartment TSR Index |
|
Absolute TSR is better than -350 basis points from the index return |
|
Absolute TSR is 50 basis points above the index return |
|
Absolute TSR is at least 500 basis points above the index return |
HOME PROPERTIES, INC.
NOTES TO CONSOLIDATED FINANCIAL STATEMENTS
(Dollars in thousands, except per share data)
10 STOCK BENEFIT PLANS (continued)
Restricted Stock Units (continued)
The fair value of the restricted stock unit awards was estimated on the grant date using a multifactor Monte Carlo simulation model, which incorporates various assumptions including the baseline share value, dividend yield, estimated volatility figures and risk free rates over the three-year measurement period. The Company recognizes compensation expense for the Executive Performance-Based Equity Program over the three-year measurement periods for 100% of each award with a service condition and 50% of each award with a market condition. For the remaining 50% of each award with a market condition, the Company recognizes compensation expense over a four year period which includes the three-year measurement period and a one-year vesting period subsequent to the end of the measurement period. The recognition of compensation cost takes into account retirement eligibility.
The following weighted average assumptions were used for grants awarded during the years ended December 31, 2014, 2013 and 2012:
|
Assumption |
|
2014 |
|
2013 |
|
2012 |
|
|
Baseline share value |
|
$53.84 |
|
$60.20 |
|
$55.87 |
|
|
Expected dividend yield |
|
4.97% |
|
4.27% |
|
4.45% |
|
|
Expected volatility |
|
17.86% |
|
21.19% |
|
31.24% |
|
|
Risk free interest rate |
|
0.27% |
|
0.21% |
|
0.22% |
|
|
Estimated fair value per share of the market-based awards |
|
$63.11 |
|
$49.17 |
|
$51.40 |
|
|
Estimated fair value per share of the service-based awards |
|
$58.70 |
|
$61.83 |
|
$59.32 |
|
A summary of unvested restricted stock unit activity for the year ended December 31, 2014 is as follows:
|
|
|
Number of |
|
Weighted Average |
| ||||||
|
Restricted stock units unvested at December 31, 2013 (a) |
|
|
203,864 |
|
|
|
|
$ |
52.61 |
|
|
|
Granted (b) |
|
|
149,738 |
|
|
|
|
62.01 |
|
| |
|
Vested |
|
|
(11,646 |
) |
|
|
|
60.58 |
|
| |
|
Restricted stock units unvested at December 31, 2014 (c) |
|
|
341,956 |
|
|
|
|
$ |
55.76 |
|
|
(a) Represents service-based awards of 29,112 and market-based awards of 174,752 at the maximum achievable level.
(b) Represents service-based awards of 18,714 and market-based awards of 131,024 at the maximum achievable level.
(c) Represents service-based awards of 36,180 and market-based awards of 305,776 at the maximum achievable level.
During the years ended December 31, 2014, 2013 and 2012, the Company recognized stock-based compensation expense of $4,844, $3,746 and $3,240, respectively, for the Executive Performance-Based Equity Program. As of December 31, 2014, there was $549 of total unrecognized compensation cost related to unvested restricted stock units that is expected to be recognized over a weighted-average period of 1.97 years.
HOME PROPERTIES, INC.
NOTES TO CONSOLIDATED FINANCIAL STATEMENTS
(Dollars in thousands, except per share data)
11 EMPLOYEE BENEFIT PLANS
401(k) Savings Plan
The Company sponsors a defined contribution plan. Under the plan, the Company will match 75% of the first 4% of each employee’s contributions not to exceed 3% of that employee’s eligible compensation. The matching expense under this plan charged to operations were $1,016, $1,141 and $1,005 from continuing operations, and $12, $31 and $61 from discontinued operations, for the years ended December 31, 2014, 2013 and 2012, respectively.
Incentive Bonus Plans
The Company sponsors two incentive bonus plans. The quarterly site bonus plan is designed to encourage and reward property operations employees for superior financial performance as measured versus budget. The annual incentive bonus plan is designed to motivate executive officers and certain other corporate and regional employees to maximize the Company’s annual operating and financial performance as measured in year over year actual financial measures, annual performance as compared to a peer group and, beginning in 2011, attainment of certain individual and team objectives. The expense under these plans was $3,974, $5,567 and $7,034 for the years ended December 31, 2014, 2013 and 2012, respectively.
Deferred Bonus Plan
The Company sponsors a deferred bonus plan, which permits certain employees to defer receipt of up to 100% of their annual incentive bonus for three, five or ten years. Under the plan, the Company will match 10% of the amount deferred and the match vests after three years. Each deferral and match is credited to an individual employee account with the number of shares of the Company’s common stock that could be purchased with the amounts deferred and matched at the common stock closing price the day before the bonus would have otherwise been paid. An equivalent of dividends on those shares is also credited to the employee account on dividend payment dates based upon the DRIP price on those dates. Payments out of deferred accounts are made by issuance of common stock. The total amounts deferred were $1,718 and $1,504 at December 31, 2014 and 2013, respectively. The matching expense under this plan was $7, $8 and $10 for the years ended December 31, 2014, 2013 and 2012, respectively.
Deferred Compensation Plan
In 2011, the Company initiated a deferred compensation plan, which permits certain employees to defer up to 50% of their annual base pay until retirement. Upon retirement, the employee can elect a lump sum distribution or annual payments over two to ten years. There is no Company match and all deferred amounts are 100% vested. The total amount deferred was $1,056 and $807 at December 31, 2014 and 2013, respectively.
12 SEGMENT REPORTING
The Company is engaged in the ownership and management of market rate apartment communities. Each apartment community is considered a separate operating segment. Each segment on a standalone basis is less than 10% of the revenues, net operating income and assets of the combined reported operating segment and meets a majority of the aggregation criteria under authoritative guidance. There is no resident who has one or more leases which, in the aggregate, account for more than 10% of the aggregate gross revenues for the years ended December 31, 2014, 2013 or 2012. The operating segments are aggregated as Core and Non-core properties.
Non-segment revenue to reconcile to total revenue consists of other income. Non-segment assets to reconcile to total assets include cash and cash equivalents, cash in escrows, accounts receivable, prepaid expenses, deferred charges and other assets.
HOME PROPERTIES, INC.
NOTES TO CONSOLIDATED FINANCIAL STATEMENTS
(Dollars in thousands, except per share data)
12 SEGMENT REPORTING (continued)
Core properties consist of apartment communities which have been owned more than one full calendar year. Therefore, the Core properties represent communities owned as of January 1, 2013. Non-core properties consist of apartment communities acquired, developed or redeveloped during 2013 and 2014, such that comparable operating results are not available.
The Company assesses and measures segment operating results based on a performance measure referred to as net operating income. Net operating income is defined as total revenues less operating and maintenance expenses. The accounting policies of the segments are the same as those described in Notes 1, 2 and 3.
The revenues and net operating income for each of the reportable segments are summarized as follows for the years ended December 31, 2014, 2013 and 2012:
|
|
|
2014 |
|
2013 |
|
2012 |
| |||||||
|
Revenues |
|
|
|
|
|
|
| |||||||
|
Apartments owned |
|
|
|
|
|
|
| |||||||
|
Core properties |
|
|
$ |
642,676 |
|
|
$ |
624,269 |
|
|
$ |
603,409 |
| |
|
Non-core properties |
|
|
28,875 |
|
|
14,354 |
|
|
- |
| ||||
|
Reconciling items |
|
|
364 |
|
|
1,179 |
|
|
311 |
| ||||
|
Total revenues |
|
|
$ |
671,915 |
|
|
$ |
639,802 |
|
|
$ |
603,720 |
| |
|
|
|
|
|
|
|
|
|
|
|
| ||||
|
Net operating income |
|
|
|
|
|
|
|
|
|
| ||||
|
Apartments owned |
|
|
|
|
|
|
|
|
|
| ||||
|
Core properties |
|
|
$ |
405,147 |
|
|
$ |
399,246 |
|
|
$ |
382,556 |
| |
|
Non-core properties |
|
|
16,895 |
|
|
9,279 |
|
|
- |
| ||||
|
Reconciling items |
|
|
364 |
|
|
1,179 |
|
|
311 |
| ||||
|
Net operating income, including reconciling items |
|
|
422,406 |
|
|
409,704 |
|
|
382,867 |
| ||||
|
|
|
|
|
|
|
|
|
|
|
| ||||
|
General and administrative expenses |
|
|
(26,686 |
) |
|
(28,507 |
) |
|
(34,174 |
) | ||||
|
Interest expense |
|
|
(99,635 |
) |
|
(110,076 |
) |
|
(119,871 |
) | ||||
|
Depreciation and amortization |
|
|
(181,123 |
) |
|
(167,375 |
) |
|
(155,532 |
) | ||||
|
Other expenses |
|
|
(734 |
) |
|
(312 |
) |
|
(2,741 |
) | ||||
|
Impairment and other charges |
|
|
(5,382 |
) |
|
|
- |
|
|
- |
| |||
|
Income from continuing operations |
|
|
$ |
108,846 |
|
|
$ |
103,434 |
|
|
$ |
70,549 |
| |
The assets for each of the reportable segments are summarized as follows as of December 31, 2014 and 2013:
|
Assets |
|
|
2014 |
|
|
2013 |
|
|
|
|
|
Apartments owned |
|
|
|
|
|
|
|
|
|
|
|
Core properties |
|
|
$3,857,527 |
|
|
$3,902,741 |
|
|
|
|
|
Non-core properties |
|
|
535,973 |
|
|
474,781 |
|
|
|
|
|
Reconciling items |
|
|
95,035 |
|
|
90,355 |
|
|
|
|
|
Total assets |
|
|
$4,488,535 |
|
|
$4,467,877 |
|
|
|
|
HOME PROPERTIES, INC.
NOTES TO CONSOLIDATED FINANCIAL STATEMENTS
(Dollars in thousands, except per share data)
13 TRANSACTIONS WITH AFFILIATES
The Company leases its corporate office space from a former affiliate. The rent for the corporate office space is a gross rent that includes real estate taxes and common area maintenance. In July 2009, the Company extended the lease on its corporate office space through September 2019 (with a right to terminate the lease in 2016, at the Company’s option), plus two five-year renewal options. Rental expense was $1,432, $1,404 and $1,377 for each of the years ended December 31, 2014, 2013 and 2012, respectively.
14 COMMITMENTS AND CONTINGENCIES
Lease Commitments
The Company has entered into operating leases for office space and office equipment with remaining terms of 1 to 3 years. Future minimum rental payments under non-cancelable operating leases in effect as of December 31, 2014 were as follows:
|
2015 |
|
$ |
1,925 |
|
|
2016 |
|
1,685 |
| |
|
2017 |
|
321 |
| |
|
2018 |
|
- |
| |
|
Thereafter |
|
- |
| |
|
|
|
$ |
3,931 |
|
The Company incurred $2,624, $2,588 and $2,574 of rent expense under operating leases in 2014, 2013 and 2012, respectively.
Letters of Credit
As of December 31, 2014, the Company had issued $3,840 in letters of credit, which were provided under the Company’s $450,000 unsecured Credit Agreement. The letters of credit were required to be issued under certain construction projects, workers’ compensation and health insurance policies.
Debt Covenants
The unsecured notes payable and unsecured Credit Agreement contain restrictions which, among other things, require maintenance of certain financial ratios. The Company was in compliance with these financial ratios for all periods presented.
Included in the Company’s consolidated balance sheet at December 31, 2014 are assets of its subsidiary Home Properties Fair Oaks, LLC, owner of The Courts at Fair Oaks, Fairfax County, VA, that are pledged as collateral for specific indebtedness and are not available to satisfy any other obligations of the Company. Also included in the Company’s consolidated balance sheet at December 31, 2014 are assets of its subsidiary Home Properties Schaumburg, LLC, owner of The Lakes of Schaumburg, Cook County, IL, that are pledged as collateral for specific indebtedness and are not available to satisfy any other obligations of the Company.
Tax Protection Obligations
In connection with various UPREIT transactions, the Company has agreed to maintain certain levels of nonrecourse debt for a period of 7 to 10 years associated with the contributed properties acquired. In addition, the Company is restricted in its ability to sell certain contributed properties (3% of the owned portfolio at December 31, 2014) for a contract period of 7 to 10 years except through a tax deferred Internal Revenue Code Section 1031 like-kind exchange. The remaining terms on the sale restrictions range from 1 year to 2.5 years.
HOME PROPERTIES, INC.
NOTES TO CONSOLIDATED FINANCIAL STATEMENTS
(Dollars in thousands, except per share data)
14 COMMITMENTS AND CONTINGENCIES (continued)
Tax Credit Guarantee
For periods before October 13, 2010, the Company, through its general partnership interest in an affordable property limited partnership, had guaranteed certain low income housing tax credits to limited partners in this partnership through 2015 totaling approximately $3,000. The Company’s general partner interest in this entity was sold on October 13, 2010. The tax credit guarantee was reduced to a $3,000 secondary guarantee. As of December 31, 2014, there were no known conditions that would make such payments necessary relating to the tax credit guarantee; therefore, no liability has been recorded in the financial statements.
Executive Retention Plan
The Executive Retention Plan provides for severance benefits and other compensation to be paid to certain employees in the event of a change in control of the Company and a subsequent termination of their employment.
Contingencies
The Company is not a party to any legal proceedings that are expected to have a material adverse effect on the Company’s liquidity, financial position or results of operations. The Company is subject to a variety of legal actions for personal injury or property damage arising in the ordinary course of its business, most of which are covered by liability insurance. Various claims of employment and resident discrimination are also periodically brought, most of which also are covered by insurance. While the resolution of these matters cannot be predicted with certainty, management believes that the final outcome of such legal proceedings and claims will not have a material adverse effect on the Company’s liquidity, financial position or results of operations.
15 DISPOSITION OF PROPERTY AND DISCONTINUED OPERATIONS
Included in discontinued operations for the three years ended December 31, 2014 are the operating results of thirteen apartment community dispositions (three sold in 2014, four sold in 2013 and six sold in 2012). For purposes of the discontinued operations presentation, the Company only includes interest expense and losses from early extinguishment of debt associated with specific mortgage indebtedness of the properties that are sold or held for sale. A summary of the 2014, 2013 and 2012 community dispositions is as follows:
|
Apartment Community |
|
Region |
|
Date Sold |
|
Number of |
|
Sales Price |
|
Gain on Sale |
| ||||||||
|
Cider Mill |
|
Washington, D.C. |
|
2/26/2014 |
|
|
864 |
|
|
|
|
$ |
110,000 |
|
|
$ |
31,305 |
| |
|
Woodleaf |
|
Washington, D.C. |
|
12/19/2014 |
|
|
228 |
|
|
|
|
33,500 |
|
|
14,297 |
| |||
|
The Manor - MD |
|
Washington, D.C. |
|
12/29/2014 |
|
|
435 |
|
|
|
|
73,300 |
|
|
36,229 |
| |||
|
|
|
|
|
|
|
|
1,527 |
|
|
|
|
$ |
216,800 |
|
|
$ |
81,831 |
| |
|
|
|
|
|
|
|
|
|
|
|
|
|
|
|
|
|
| |||
|
South Bay Manor |
|
Long Island |
|
3/14/2013 |
|
|
61 |
|
|
|
|
$ |
11,100 |
|
|
$ |
5,222 |
| |
|
Falkland Chase |
|
Washington, D.C. |
|
3/29/2013 |
|
|
450 |
|
|
|
|
|
98,000 |
|
|
|
36,511 |
| |
|
Castle Club |
|
Philadelphia |
|
4/10/2013 |
|
|
158 |
|
|
|
|
|
15,000 |
|
|
|
3,307 |
| |
|
Virginia Village |
|
Washington, D.C. |
|
10/15/2013 |
|
|
344 |
|
|
|
|
|
68,000 |
|
|
|
36,201 |
| |
|
|
|
|
|
|
|
|
1,013 |
|
|
|
|
$ |
192,100 |
|
|
$ |
81,241 |
| |
|
|
|
|
|
|
|
|
|
|
|
|
|
|
|
|
|
| |||
|
Chesterfield Apartments |
|
Philadelphia |
|
9/13/2012 |
|
|
247 |
|
|
|
|
$ |
25,155 |
|
|
$ |
12,209 |
| |
|
Woodholme Manor |
|
Baltimore |
|
9/20/2012 |
|
|
177 |
|
|
|
|
16,000 |
|
|
7,449 |
| |||
|
Curren Terrace |
|
Philadelphia |
|
10/11/2012 |
|
|
318 |
|
|
|
|
29,793 |
|
|
15,872 |
| |||
|
Falcon Crest |
|
Baltimore |
|
11/8/2012 |
|
|
396 |
|
|
|
|
46,000 |
|
|
27,801 |
| |||
|
Timbercroft |
|
Baltimore |
|
12/13/2012 |
|
|
284 |
|
|
|
|
29,150 |
|
|
12,126 |
| |||
|
Glen Brook |
|
Philadelphia |
|
12/21/2012 |
|
|
174 |
|
|
|
|
13,500 |
|
|
5,075 |
| |||
|
|
|
|
|
|
|
|
1,596 |
|
|
|
|
$ |
159,598 |
|
|
$ |
80,532 |
| |
HOME PROPERTIES, INC.
NOTES TO CONSOLIDATED FINANCIAL STATEMENTS
(Dollars in thousands, except per share data)
15 DISPOSITION OF PROPERTY AND DISCONTINUED OPERATIONS (continued)
The operating results of discontinued operations are summarized as follows for the years ended December 31, 2014, 2013 and 2012:
|
|
|
2014 |
|
2013 |
|
2012 |
| |||
|
Revenues: |
|
|
|
|
|
|
| |||
|
Rental income |
|
$ |
12,015 |
|
$ |
29,038 |
|
$ |
51,794 |
|
|
Property other income |
|
1,186 |
|
2,624 |
|
5,028 |
| |||
|
Total revenues |
|
13,201 |
|
31,662 |
|
56,822 |
| |||
|
Expenses: |
|
|
|
|
|
|
| |||
|
Operating and maintenance |
|
4,393 |
|
10,895 |
|
20,388 |
| |||
|
Interest expense, including prepayment penalties |
|
7,553 |
|
6,461 |
|
10,428 |
| |||
|
Depreciation and amortization |
|
2,461 |
|
7,366 |
|
13,465 |
| |||
|
Total expenses |
|
14,407 |
|
24,722 |
|
44,281 |
| |||
|
Income (loss) from discontinued operations |
|
(1,206 |
) |
6,940 |
|
12,541 |
| |||
|
Gain on disposition of property |
|
81,831 |
|
81,205 |
|
80,532 |
| |||
|
Discontinued operations |
|
$ |
80,625 |
|
$ |
88,145 |
|
$ |
93,073 |
|
16 SUPPLEMENTAL CASH FLOW DISCLOSURES
Supplemental cash flow information including non-cash financing and investing activities for the years ended December 31, 2014, 2013 and 2012 are as follows:
|
|
|
2014 |
|
2013 |
|
2012 |
| |||
|
Supplemental disclosures: |
|
|
|
|
|
|
| |||
|
Cash paid for interest, net of capitalized interest |
|
$ |
104,878 |
|
$ |
115,079 |
|
$ |
127,249 |
|
|
Interest capitalized |
|
6,993 |
|
7,281 |
|
4,380 |
| |||
|
Non-cash investing and financing activities: |
|
|
|
|
|
|
| |||
|
Note receivable converted to real estate |
|
- |
|
- |
|
608 |
| |||
|
Mortgage loan assumed associated with property acquisition |
|
33,696 |
|
- |
|
7,284 |
| |||
|
Mortgage note (premium) or discount written off |
|
(216 |
) |
- |
|
104 |
| |||
|
Exchange of UPREIT Units for common shares |
|
4,887 |
|
4,495 |
|
6,899 |
| |||
|
Transfers of construction in progress to buildings, improvements and equipment |
|
99,986 |
|
4,480 |
|
42,732 |
| |||
|
Transfers of other assets to construction in progress |
|
- |
|
836 |
|
- |
| |||
|
Transfers of construction in progress to land held for sale |
|
15,300 |
|
- |
|
- |
| |||
|
Capital improvements to properties and construction in progress included in accounts payable |
|
6,908 |
|
9,261 |
|
6,130 |
| |||
|
Dividends payable included in accounts payable |
|
533 |
|
- |
|
- |
| |||
HOME PROPERTIES, INC.
NOTES TO CONSOLIDATED FINANCIAL STATEMENTS
(Dollars in thousands, except per share data)
17 QUARTERLY FINANCIAL STATEMENT INFORMATION (UNAUDITED)
Quarterly financial information for the years ended December 31, 2014 and 2013 are as follows:
|
|
|
2014 | ||||||||||
|
|
|
First |
|
Second |
|
Third |
|
Fourth | ||||
|
Total revenue |
|
$ |
165,298 |
|
$ |
165,583 |
|
$ |
168,543 |
|
$ |
172,491 |
|
Net income attributable to common stockholders |
|
45,791 |
|
22,469 |
|
26,244 |
|
66,434 | ||||
|
Basic earnings per share data: |
|
|
|
|
|
|
|
| ||||
|
Net income attributable to common stockholders |
|
0.80 |
|
0.39 |
|
0.46 |
|
1.16 | ||||
|
Diluted earnings per share data: |
|
|
|
|
|
|
|
| ||||
|
Net income attributable to common stockholders |
|
0.79 |
|
0.39 |
|
0.45 |
|
1.14 | ||||
|
|
|
|
|
|
|
|
|
| ||||
|
|
|
2013 | ||||||||||
|
|
|
First |
|
Second |
|
Third |
|
Fourth | ||||
|
Total revenue |
|
$ |
158,999 |
|
$ |
159,639 |
|
$ |
159,369 |
|
$ |
161,795 |
|
Net income attributable to common stockholders |
|
51,880 |
|
27,036 |
|
25,038 |
|
56,919 | ||||
|
Basic earnings per share data: |
|
|
|
|
|
|
|
| ||||
|
Net income attributable to common stockholders |
|
1.01 |
|
0.52 |
|
0.44 |
|
1.00 | ||||
|
Diluted earnings per share data: |
|
|
|
|
|
|
|
| ||||
|
Net income attributable to common stockholders |
|
0.99 |
|
0.51 |
|
0.44 |
|
0.99 | ||||
The sum of the quarterly earnings per common share amounts may not equal the annual earnings per common share amounts due primarily to changes in the number of common shares outstanding quarter to quarter. The quarterly reports for the years ended December 31, 2014 and 2013 have been reclassified to reflect discontinued operations in accordance with authoritative guidance.
18 SUBSEQUENT EVENTS
On January 7, 2015, the Company acquired two adjacent apartment communities with a combined 710 units located in Mt. Prospect, Illinois for a total purchase price of $92,000, paid in cash. The accounting for this transaction has not been completed, therefore the disclosures required by authoritative guidance have not been made. The Company intends to operate the property as one community.
On January 26, 2015, the Company sold an apartment community, with a total of 672 units, for $49,318. The community was located in Steger, Illinois. A gain on sale of approximately $27,000 will be recorded in the first quarter of 2015 related to this sale.
On January 31, 2015, the Board of Directors declared a dividend of $0.76 per share on the Company’s common stock and approved a distribution of $0.76 per UPREIT Unit for the quarter ended December 31, 2014. The dividend and distribution is payable February 27, 2015, to stockholders and unitholders of record on February 17, 2015.
HOME PROPERTIES, INC.
VALUATION AND QUALIFYING ACCOUNTS
FOR THE YEARS ENDED DECEMBER 31, 2014, 2013 AND 2012
(Dollars in thousands)
|
|
|
Balance at |
|
Charged to |
|
Adjustments/ |
|
| ||||
|
|
|
Beginning |
|
Costs and |
|
Amounts |
|
Balance at | ||||
|
|
|
of Year |
|
Expenses |
|
Written Off |
|
End of Year | ||||
|
Allowance for Doubtful Receivables |
|
|
|
|
|
|
|
| ||||
|
2014 |
|
$ |
2,499 |
|
$ |
5,769 |
|
$ |
(5,774) |
|
$ |
2,494 |
|
2013 |
|
2,778 |
|
6,028 |
|
(6,307) |
|
2,499 | ||||
|
2012 |
|
2,869 |
|
5,886 |
|
(5,977) |
|
2,778 | ||||
|
Deferred Tax Asset Valuation Allowance |
|
|
|
|
|
|
|
| ||||
|
2014 |
|
$ |
13,107 |
|
$ |
- |
|
$ |
(55) |
|
$ |
13,052 |
|
2013 |
|
13,168 |
|
- |
|
(61) |
|
13,107 | ||||
|
2012 |
|
13,185 |
|
- |
|
(17) |
|
13,168 | ||||
HOME PROPERTIES, INC.
REAL ESTATE AND ACCUMULATED DEPRECIATION
DECEMBER 31, 2014
(Dollars in thousands)
|
|
|
|
|
|
|
Initial Cost |
|
Costs |
|
Total Cost |
|
|
|
|
|
Total Cost, |
|
|
| ||||||||
|
|
|
|
|
|
|
Buildings, |
|
Capitalized |
|
Buildings, |
|
|
|
|
|
Net of |
|
Year of |
| ||||||||
|
|
|
|
|
|
|
Improvements |
|
Subsequent to |
|
Improvements |
|
|
|
Accumulated |
|
Accumulated |
|
Acquisition or |
| ||||||||
|
Community |
|
Encumbrances |
|
Land (a) |
|
& Equipment (a) |
|
Acquisition |
|
& Equipment |
|
Total(d) |
|
Depreciation(e) |
|
Depreciation |
|
Completion |
| ||||||||
|
1200 East West |
|
$ |
- |
|
$ |
13,068 |
|
$ |
69,908 |
|
$ |
2,796 |
|
$ |
72,704 |
|
$ |
85,772 |
|
$ |
10,403 |
|
$ |
75,369 |
|
2010 (b) |
|
|
Annapolis Roads |
|
22,599 |
|
14,400 |
|
18,035 |
|
9,100 |
|
27,135 |
|
41,535 |
|
4,524 |
|
37,011 |
|
2010 |
| ||||||||
|
Arbor Park of Alexandria |
|
90,853 |
|
9,447 |
|
63,198 |
|
65,768 |
|
128,966 |
|
138,413 |
|
46,787 |
|
91,626 |
|
2000 |
| ||||||||
|
Barrington Gardens |
|
- |
|
923 |
|
6,954 |
|
6,977 |
|
13,931 |
|
14,854 |
|
5,054 |
|
9,800 |
|
2005 |
| ||||||||
|
Bayview/Colonial |
|
- |
|
1,671 |
|
9,180 |
|
6,582 |
|
15,762 |
|
17,433 |
|
6,824 |
|
10,609 |
|
2000 |
| ||||||||
|
Blackhawk |
|
- |
|
3,051 |
|
15,426 |
|
10,546 |
|
25,972 |
|
29,023 |
|
10,847 |
|
18,176 |
|
2000 |
| ||||||||
|
Bonnie Ridge |
|
45,601 |
|
5,241 |
|
46,916 |
|
40,003 |
|
86,919 |
|
92,160 |
|
41,459 |
|
50,701 |
|
1999 |
| ||||||||
|
Braddock Lee |
|
- |
|
3,962 |
|
10,330 |
|
9,679 |
|
20,009 |
|
23,971 |
|
10,198 |
|
13,773 |
|
1998 |
| ||||||||
|
Cambridge Village |
|
- |
|
2,514 |
|
3,708 |
|
3,015 |
|
6,723 |
|
9,237 |
|
2,782 |
|
6,455 |
|
2002 |
| ||||||||
|
Canterbury |
|
- |
|
5,179 |
|
23,737 |
|
19,958 |
|
43,695 |
|
48,874 |
|
18,201 |
|
30,673 |
|
1999 |
| ||||||||
|
Charleston Place |
|
71,567 |
|
22,764 |
|
84,648 |
|
15,373 |
|
100,021 |
|
122,785 |
|
13,383 |
|
109,402 |
|
2010 |
| ||||||||
|
Chatham Hill |
|
41,720 |
|
2,134 |
|
48,584 |
|
18,106 |
|
66,690 |
|
68,824 |
|
20,834 |
|
47,990 |
|
2004 |
| ||||||||
|
Cinnamon Run |
|
51,130 |
|
7,962 |
|
61,627 |
|
11,022 |
|
72,649 |
|
80,611 |
|
19,060 |
|
61,551 |
|
2005 |
| ||||||||
|
Country Village |
|
17,184 |
|
2,349 |
|
12,269 |
|
13,763 |
|
26,032 |
|
28,381 |
|
12,629 |
|
15,752 |
|
1998 |
| ||||||||
|
Courts at Huntington Station |
|
- |
|
33,409 |
|
88,522 |
|
534 |
|
89,056 |
|
122,465 |
|
12,018 |
|
110,447 |
|
2011 (b) |
| ||||||||
|
Courtyards Village |
|
- |
|
3,405 |
|
10,349 |
|
6,833 |
|
17,182 |
|
20,587 |
|
6,672 |
|
13,915 |
|
2001 |
| ||||||||
|
Crescent Club |
|
- |
|
2,338 |
|
28,792 |
|
8,746 |
|
37,538 |
|
39,876 |
|
5,070 |
|
34,806 |
|
2010 |
| ||||||||
|
Cypress Place |
|
9,614 |
|
2,349 |
|
8,340 |
|
7,448 |
|
15,788 |
|
18,137 |
|
6,516 |
|
11,621 |
|
2000 |
| ||||||||
|
Devonshire Hills |
|
70,563 |
|
27,988 |
|
72,440 |
|
29,391 |
|
101,831 |
|
129,819 |
|
36,344 |
|
93,475 |
|
2001 |
| ||||||||
|
Dunfield Townhomes |
|
- |
|
1,683 |
|
30,302 |
|
9,336 |
|
39,638 |
|
41,321 |
|
8,893 |
|
32,428 |
|
2007 |
| ||||||||
|
East Hill Gardens |
|
- |
|
255 |
|
1,802 |
|
1,699 |
|
3,501 |
|
3,756 |
|
1,704 |
|
2,052 |
|
1998 |
| ||||||||
|
East Meadow |
|
13,853 |
|
2,339 |
|
11,666 |
|
5,351 |
|
17,017 |
|
19,356 |
|
6,511 |
|
12,845 |
|
2000 |
| ||||||||
|
Elmwood Terrace |
|
25,219 |
|
6,203 |
|
16,242 |
|
15,684 |
|
31,926 |
|
38,129 |
|
13,383 |
|
24,746 |
|
2000 |
| ||||||||
|
Fox Hall |
|
47,000 |
|
9,959 |
|
51,875 |
|
21,375 |
|
73,250 |
|
83,209 |
|
17,890 |
|
65,319 |
|
2007 |
| ||||||||
|
Gardencrest |
|
- |
|
25,181 |
|
66,500 |
|
30,533 |
|
97,033 |
|
122,214 |
|
36,371 |
|
85,843 |
|
2002 |
| ||||||||
|
Gateway Village |
|
- |
|
1,391 |
|
7,316 |
|
5,195 |
|
12,511 |
|
13,902 |
|
5,128 |
|
8,774 |
|
1999 |
| ||||||||
|
Glen Manor |
|
7,476 |
|
1,088 |
|
5,004 |
|
5,272 |
|
10,276 |
|
11,364 |
|
4,655 |
|
6,709 |
|
1997 |
| ||||||||
|
Golf Club |
|
30,951 |
|
4,177 |
|
23,138 |
|
20,010 |
|
43,148 |
|
47,325 |
|
18,832 |
|
28,493 |
|
2000 |
| ||||||||
|
Hackensack Gardens |
|
- |
|
2,426 |
|
11,323 |
|
7,865 |
|
19,188 |
|
21,614 |
|
6,461 |
|
15,153 |
|
2005 |
| ||||||||
|
Hawthorne Court |
|
- |
|
9,200 |
|
25,967 |
|
25,320 |
|
51,287 |
|
60,487 |
|
19,520 |
|
40,967 |
|
2002 |
| ||||||||
|
Heritage Square |
|
- |
|
2,058 |
|
5,372 |
|
3,256 |
|
8,628 |
|
10,686 |
|
3,377 |
|
7,309 |
|
2002 |
| ||||||||
|
Heritage Woods |
|
13,701 |
|
1,602 |
|
12,420 |
|
4,991 |
|
17,411 |
|
19,013 |
|
4,699 |
|
14,314 |
|
2006 |
| ||||||||
|
Highland House |
|
- |
|
3,414 |
|
14,761 |
|
4,080 |
|
18,841 |
|
22,255 |
|
4,866 |
|
17,389 |
|
2006 |
| ||||||||
|
Hill Brook Place |
|
- |
|
2,277 |
|
9,966 |
|
11,748 |
|
21,714 |
|
23,991 |
|
9,209 |
|
14,782 |
|
1999 |
| ||||||||
|
Holiday Square |
|
- |
|
3,652 |
|
6,830 |
|
3,480 |
|
10,310 |
|
13,962 |
|
3,665 |
|
10,297 |
|
2002 |
| ||||||||
|
Home Properties of Bryn Mawr |
|
- |
|
3,314 |
|
19,492 |
|
18,864 |
|
38,356 |
|
41,670 |
|
16,195 |
|
25,475 |
|
2000 |
| ||||||||
|
Home Properties of Devon |
|
57,323 |
|
6,612 |
|
38,923 |
|
39,691 |
|
78,614 |
|
85,226 |
|
34,377 |
|
50,849 |
|
2000 |
| ||||||||
|
Howard Crossing |
|
- |
|
46,044 |
|
138,871 |
|
13,138 |
|
152,009 |
|
198,053 |
|
11,527 |
|
186,526 |
|
2012 |
| ||||||||
|
|
|
|
|
|
|
Initial Cost |
|
Costs |
|
Total Cost |
|
|
|
|
|
Total Cost, |
|
|
|
|
|
|
|
|
|
|
Buildings, |
|
Capitalized |
|
Buildings, |
|
|
|
|
|
Net of |
|
Year of |
|
|
|
|
|
|
|
|
Improvements |
|
Subsequent to |
|
Improvements |
|
|
|
Accumulated |
|
Accumulated |
|
Acquisition or |
|
|
Community |
|
Encumbrances |
|
Land (a) |
|
& Equipment (a) |
|
Acquisition |
|
& Equipment |
|
Total(d) |
|
Depreciation(e) |
|
Depreciation |
|
Completion |
|
|
Hunters Glen |
|
- |
|
2,239 |
|
4,729 |
|
1,833 |
|
6,562 |
|
8,801 |
|
942 |
|
7,859 |
|
2011 |
|
|
Jacob Ford Village |
|
- |
|
6,750 |
|
20,022 |
|
11,400 |
|
31,422 |
|
38,172 |
|
8,057 |
|
30,115 |
|
2007 |
|
|
Lake Grove |
|
- |
|
7,614 |
|
14,509 |
|
23,214 |
|
37,723 |
|
45,337 |
|
18,370 |
|
26,967 |
|
1997 |
|
|
Lakeview |
|
8,547 |
|
695 |
|
5,143 |
|
5,152 |
|
10,295 |
|
10,990 |
|
4,852 |
|
6,138 |
|
1998 |
|
|
Lakeview Townhomes |
|
- |
|
1,118 |
|
13,335 |
|
3,081 |
|
16,416 |
|
17,534 |
|
2,449 |
|
15,085 |
|
2010 |
|
|
Liberty Commons |
|
- |
|
1,345 |
|
13,253 |
|
468 |
|
13,721 |
|
15,066 |
|
5,963 |
|
9,103 |
|
2006 (b) |
|
|
Liberty Place |
|
- |
|
2,033 |
|
13,125 |
|
3,518 |
|
16,643 |
|
18,676 |
|
4,347 |
|
14,329 |
|
2006 |
|
|
Mid-Island Estates |
|
18,173 |
|
4,288 |
|
7,836 |
|
8,514 |
|
16,350 |
|
20,638 |
|
8,326 |
|
12,312 |
|
1997 |
|
|
Middlebrooke |
|
- |
|
2,888 |
|
14,369 |
|
4,343 |
|
18,712 |
|
21,600 |
|
3,067 |
|
18,533 |
|
2010 |
|
|
Middlesex Crossing |
|
- |
|
7,560 |
|
32,454 |
|
1,837 |
|
34,291 |
|
41,851 |
|
1,010 |
|
40,841 |
|
2013 |
|
|
Mill Towne Village |
|
24,239 |
|
3,942 |
|
14,765 |
|
15,917 |
|
30,682 |
|
34,624 |
|
13,168 |
|
21,456 |
|
2001 |
|
|
Morningside Heights |
|
- |
|
6,553 |
|
32,699 |
|
41,016 |
|
73,715 |
|
80,268 |
|
35,462 |
|
44,806 |
|
1998 |
|
|
Mount Vernon Square |
|
- |
|
55,810 |
|
86,946 |
|
29,513 |
|
116,459 |
|
172,269 |
|
29,247 |
|
143,022 |
|
2006 |
|
|
New Orleans Park |
|
22,127 |
|
3,044 |
|
14,442 |
|
17,329 |
|
31,771 |
|
34,815 |
|
14,647 |
|
20,168 |
|
1997 |
|
|
Newport Village |
|
- |
|
56,501 |
|
147,420 |
|
25,078 |
|
172,498 |
|
228,999 |
|
15,916 |
|
213,083 |
|
2011 |
|
|
Northwood |
|
9,870 |
|
875 |
|
14,901 |
|
5,909 |
|
20,810 |
|
21,685 |
|
6,327 |
|
15,358 |
|
2004 |
|
|
Oak Manor |
|
- |
|
686 |
|
4,801 |
|
4,361 |
|
9,162 |
|
9,848 |
|
4,384 |
|
5,464 |
|
1998 |
|
|
Owings Run |
|
39,382 |
|
5,788 |
|
35,160 |
|
13,362 |
|
48,522 |
|
54,310 |
|
19,873 |
|
34,437 |
|
1999 |
|
|
Park Shirlington |
|
- |
|
4,567 |
|
11,761 |
|
11,039 |
|
22,800 |
|
27,367 |
|
11,671 |
|
15,696 |
|
1998 |
|
|
Peppertree Farm |
|
73,036 |
|
12,888 |
|
86,459 |
|
27,307 |
|
113,766 |
|
126,654 |
|
31,333 |
|
95,321 |
|
2005 |
|
|
Pleasant View Gardens |
|
90,014 |
|
6,209 |
|
52,837 |
|
38,264 |
|
91,101 |
|
97,310 |
|
41,511 |
|
55,799 |
|
1998 |
|
|
Pleasure Bay |
|
- |
|
1,744 |
|
7,445 |
|
13,003 |
|
20,448 |
|
22,192 |
|
9,112 |
|
13,080 |
|
1998 |
|
|
Racquet Club East |
|
35,469 |
|
2,086 |
|
25,244 |
|
20,904 |
|
46,148 |
|
48,234 |
|
19,182 |
|
29,052 |
|
1998 |
|
|
Racquet Club South |
|
- |
|
344 |
|
4,243 |
|
4,126 |
|
8,369 |
|
8,713 |
|
3,732 |
|
4,981 |
|
1999 |
|
|
Redbank Village |
|
- |
|
2,164 |
|
15,716 |
|
17,498 |
|
33,214 |
|
35,378 |
|
14,204 |
|
21,174 |
|
1998 |
|
|
Ridgeview at Wakefield Valley |
|
17,126 |
|
2,372 |
|
17,882 |
|
5,936 |
|
23,818 |
|
26,190 |
|
7,540 |
|
18,650 |
|
2005 |
|
|
Ridley Brook |
|
12,411 |
|
2,026 |
|
8,467 |
|
8,329 |
|
16,796 |
|
18,822 |
|
7,225 |
|
11,597 |
|
1999 |
|
|
Royal Gardens |
|
47,000 |
|
5,758 |
|
16,670 |
|
22,170 |
|
38,840 |
|
44,598 |
|
19,115 |
|
25,483 |
|
1997 |
|
|
Saddle Brooke |
|
- |
|
7,609 |
|
44,040 |
|
11,524 |
|
55,564 |
|
63,173 |
|
10,808 |
|
52,365 |
|
2008 |
|
|
Sayville Commons |
|
36,143 |
|
8,192 |
|
56,945 |
|
4,459 |
|
61,404 |
|
69,596 |
|
15,176 |
|
54,420 |
|
2005 |
|
|
Selford Townhomes |
|
8,375 |
|
1,281 |
|
4,766 |
|
4,026 |
|
8,792 |
|
10,073 |
|
4,022 |
|
6,051 |
|
1999 |
|
|
Seminary Hill |
|
- |
|
3,095 |
|
11,538 |
|
13,645 |
|
25,183 |
|
28,278 |
|
11,017 |
|
17,261 |
|
1999 |
|
|
Seminary Towers |
|
53,515 |
|
5,772 |
|
22,216 |
|
26,633 |
|
48,849 |
|
54,621 |
|
21,894 |
|
32,727 |
|
1999 |
|
|
Sherry Lake |
|
23,709 |
|
2,593 |
|
17,236 |
|
14,513 |
|
31,749 |
|
34,342 |
|
14,529 |
|
19,813 |
|
1998 |
|
|
Somerset Park |
|
- |
|
7,253 |
|
12,937 |
|
637 |
|
13,574 |
|
20,827 |
|
1,276 |
|
19,551 |
|
2011 |
|
|
Southern Meadows |
|
38,339 |
|
9,383 |
|
35,272 |
|
13,434 |
|
48,706 |
|
58,089 |
|
18,790 |
|
39,299 |
|
2001 |
|
|
Stone Ends |
|
23,590 |
|
5,766 |
|
30,022 |
|
8,081 |
|
38,103 |
|
43,869 |
|
12,430 |
|
31,439 |
|
2003 |
|
|
Stone Hill |
|
- |
|
4,080 |
|
11,381 |
|
2,555 |
|
13,936 |
|
18,016 |
|
514 |
|
17,502 |
|
2013 |
|
|
Tamarron |
|
13,861 |
|
1,412 |
|
9,370 |
|
5,344 |
|
14,714 |
|
16,126 |
|
6,067 |
|
10,059 |
|
1999 |
|
|
The Apts at Cambridge Court |
|
- |
|
7,378 |
|
82,641 |
|
4,915 |
|
87,556 |
|
94,934 |
|
8,535 |
|
86,399 |
|
2011 |
|
|
The Apts at Cobblestone Square |
|
- |
|
12,127 |
|
36,482 |
|
391 |
|
36,873 |
|
49,000 |
|
3,439 |
|
45,561 |
|
2012 (b) |
|
|
The Apts at Wellington Trace |
|
- |
|
3,227 |
|
27,722 |
|
2,136 |
|
29,858 |
|
33,085 |
|
8,557 |
|
24,528 |
|
2004 |
|
|
The Brooke at Peachtree Village |
|
11,553 |
|
1,043 |
|
15,574 |
|
5,621 |
|
21,195 |
|
22,238 |
|
5,883 |
|
16,355 |
|
2005 |
|
|
The Colony |
|
- |
|
8,027 |
|
36,146 |
|
19,838 |
|
55,984 |
|
64,011 |
|
23,517 |
|
40,494 |
|
1999 |
|
|
The Commons at Haynes Farm |
|
- |
|
7,550 |
|
32,771 |
|
5,963 |
|
38,734 |
|
46,284 |
|
4,383 |
|
41,901 |
|
2011 |
|
|
The Courts at Dulles |
|
- |
|
15,413 |
|
76,946 |
|
3,489 |
|
80,435 |
|
95,848 |
|
6,938 |
|
88,910 |
|
2011 |
|
|
|
|
|
|
|
|
Initial Cost |
|
Costs |
|
Total Cost |
|
|
|
|
|
Total Cost, |
|
| ||||||||
|
|
|
|
|
|
|
Buildings, |
|
Capitalized |
|
Buildings, |
|
|
|
|
|
Net of |
|
Year of | ||||||||
|
|
|
|
|
|
|
Improvements |
|
Subsequent to |
|
Improvements |
|
|
|
Accumulated |
|
Accumulated |
|
Acquisition or | ||||||||
|
Community |
|
Encumbrances |
|
Land (a) |
|
& Equipment (a) |
|
Acquisition |
|
& Equipment |
|
Total(d) |
|
Depreciation(e) |
|
Depreciation |
|
Completion | ||||||||
|
The Courts at Fair Oaks |
|
46,090 |
|
12,377 |
|
61,107 |
|
4,817 |
|
65,924 |
|
78,301 |
|
8,041 |
|
70,260 |
|
2010 | ||||||||
|
The Coves at Chesapeake |
|
- |
|
8,915 |
|
57,974 |
|
12,850 |
|
70,824 |
|
79,739 |
|
17,368 |
|
62,371 |
|
2006 | ||||||||
|
The Gates of Deer Grove |
|
- |
|
1,247 |
|
18,973 |
|
1,744 |
|
20,717 |
|
21,964 |
|
1,855 |
|
20,109 |
|
2011 | ||||||||
|
The Greens at Columbia |
|
- |
|
5,040 |
|
20,886 |
|
3,653 |
|
24,539 |
|
29,579 |
|
3,390 |
|
26,189 |
|
2010 | ||||||||
|
The Hamptons |
|
46,717 |
|
6,052 |
|
53,087 |
|
18,210 |
|
71,297 |
|
77,349 |
|
22,922 |
|
54,427 |
|
2004 | ||||||||
|
The Heights at Marlborough |
|
- |
|
6,253 |
|
44,268 |
|
11,838 |
|
56,106 |
|
62,359 |
|
13,396 |
|
48,963 |
|
2006 | ||||||||
|
The Lakes of Schaumburg |
|
33,625 |
|
10,700 |
|
56,878 |
|
24 |
|
56,902 |
|
67,602 |
|
250 |
|
67,352 |
|
2014 | ||||||||
|
The Landings |
|
24,618 |
|
2,621 |
|
18,348 |
|
16,032 |
|
34,380 |
|
37,001 |
|
16,216 |
|
20,785 |
|
1996 | ||||||||
|
The Manor - (VA) |
|
13,009 |
|
1,441 |
|
6,570 |
|
8,468 |
|
15,038 |
|
16,479 |
|
6,986 |
|
9,493 |
|
1999 | ||||||||
|
The Manor East |
|
6,610 |
|
5,330 |
|
11,407 |
|
3,940 |
|
15,347 |
|
20,677 |
|
1,425 |
|
19,252 |
|
2012 | ||||||||
|
The Meadows at Marlborough |
|
20,028 |
|
6,598 |
|
28,736 |
|
8,366 |
|
37,102 |
|
43,700 |
|
8,935 |
|
34,765 |
|
2006 | ||||||||
|
The New Colonies |
|
- |
|
1,831 |
|
22,895 |
|
15,547 |
|
38,442 |
|
40,273 |
|
19,206 |
|
21,067 |
|
1998 | ||||||||
|
The Preserve at Milltown |
|
- |
|
6,110 |
|
38,706 |
|
761 |
|
39,467 |
|
45,577 |
|
623 |
|
44,954 |
|
2014 | ||||||||
|
The Sycamores |
|
19,959 |
|
4,761 |
|
17,019 |
|
4,986 |
|
22,005 |
|
26,766 |
|
7,501 |
|
19,265 |
|
2002 | ||||||||
|
The Townhomes of Beverly |
|
- |
|
5,820 |
|
30,465 |
|
7,006 |
|
37,471 |
|
43,291 |
|
8,830 |
|
34,461 |
|
2007 | ||||||||
|
The Village at Marshfield |
|
- |
|
3,247 |
|
29,512 |
|
9,628 |
|
39,140 |
|
42,387 |
|
11,554 |
|
30,833 |
|
2004 | ||||||||
|
Top Field |
|
15,610 |
|
1,635 |
|
16,684 |
|
5,513 |
|
22,197 |
|
23,832 |
|
5,672 |
|
18,160 |
|
2006 | ||||||||
|
Trexler Park |
|
36,015 |
|
2,604 |
|
14,970 |
|
11,095 |
|
26,065 |
|
28,669 |
|
11,115 |
|
17,554 |
|
2000 | ||||||||
|
Trexler Park West |
|
- |
|
2,684 |
|
23,064 |
|
780 |
|
23,844 |
|
26,528 |
|
10,342 |
|
16,186 |
|
2008 (b) | ||||||||
|
Village at Potomac Falls |
|
- |
|
7,380 |
|
30,960 |
|
3,353 |
|
34,313 |
|
41,693 |
|
4,529 |
|
37,164 |
|
2010 | ||||||||
|
Village Square |
|
39,285 |
|
2,781 |
|
15,205 |
|
13,356 |
|
28,561 |
|
31,342 |
|
12,156 |
|
19,186 |
|
1999 | ||||||||
|
Vinings at Hampton Village |
|
- |
|
1,849 |
|
12,805 |
|
5,175 |
|
17,980 |
|
19,829 |
|
6,038 |
|
13,791 |
|
2004 | ||||||||
|
Waterview |
|
- |
|
1,531 |
|
23,030 |
|
5,836 |
|
28,866 |
|
30,397 |
|
3,379 |
|
27,018 |
|
2011 | ||||||||
|
Wayne Village |
|
- |
|
2,026 |
|
14,639 |
|
11,503 |
|
26,142 |
|
28,168 |
|
12,040 |
|
16,128 |
|
1998 | ||||||||
|
West Springfield |
|
- |
|
2,634 |
|
33,610 |
|
7,107 |
|
40,717 |
|
43,351 |
|
13,220 |
|
30,131 |
|
2002 | ||||||||
|
Westbrooke |
|
- |
|
1,103 |
|
5,229 |
|
2,175 |
|
7,404 |
|
8,507 |
|
1,346 |
|
7,161 |
|
2010 | ||||||||
|
Westchester West |
|
32,763 |
|
6,978 |
|
41,513 |
|
6,765 |
|
48,278 |
|
55,256 |
|
8,735 |
|
46,521 |
|
2008 | ||||||||
|
Westwood Village |
|
43,722 |
|
7,530 |
|
25,386 |
|
15,499 |
|
40,885 |
|
48,415 |
|
15,422 |
|
32,993 |
|
2002 | ||||||||
|
Westwoods |
|
- |
|
1,260 |
|
2,694 |
|
792 |
|
3,486 |
|
4,746 |
|
889 |
|
3,857 |
|
2007 | ||||||||
|
William Henry |
|
26,904 |
|
4,853 |
|
24,116 |
|
20,321 |
|
44,437 |
|
49,290 |
|
18,107 |
|
31,183 |
|
2000 | ||||||||
|
Willowbrook |
|
- |
|
4,000 |
|
26,412 |
|
346 |
|
26,758 |
|
30,758 |
|
359 |
|
30,399 |
|
2014 | ||||||||
|
Windsor Realty |
|
- |
|
436 |
|
3,637 |
|
2,957 |
|
6,594 |
|
7,030 |
|
3,201 |
|
3,829 |
|
1998 | ||||||||
|
Woodmont Village |
|
9,387 |
|
2,943 |
|
6,321 |
|
3,925 |
|
10,246 |
|
13,189 |
|
3,913 |
|
9,276 |
|
2002 | ||||||||
|
Woodway at Trinity Centre |
|
- |
|
17,136 |
|
78,253 |
|
4,128 |
|
82,381 |
|
99,517 |
|
5,997 |
|
93,520 |
|
2012 | ||||||||
|
Yorkshire Village |
|
- |
|
1,227 |
|
2,275 |
|
1,704 |
|
3,979 |
|
5,206 |
|
1,573 |
|
3,633 |
|
2002 | ||||||||
|
Other Assets (c) |
|
- |
|
49,629 |
|
187,416 |
|
35,274 |
|
222,690 |
|
272,319 |
|
29,021 |
|
243,298 |
|
Various | ||||||||
|
|
|
$ |
1,637,175 |
|
$ |
828,679 |
|
$ |
3,586,421 |
|
$ |
1,349,627 |
|
$ |
4,936,048 |
|
$ |
5,764,727 |
|
$ |
1,371,227 |
|
$ |
4,393,500 |
|
|
(a) For 2008 and prior periods, authoritative guidance required the exchange of noncontrolling interests (UPREIT Units) for shares to be recorded under the purchase method with the difference between the fair value and book value of an exchanged UPREIT Unit allocated to real estate. These costs are included as part of the initial cost of Land and Buildings, Improvements & Equipment.
(b) Property was constructed by the Company and completed in the year indicated.
(c) Includes land of $36,515, land held for sale of $13,114, assets of two development communities placed into service of $68,821, construction in progress of $118,595 and corporate office assets of $35,274.
(d) The aggregate cost for Federal Income Tax purposes was approximately $5,267,947.
(e) Depreciation and amortization of the Company’s investments in real estate assets reflected in the consolidated statements of operations are calculated over estimated useful lives of 3 to 40 years.
SCHEDULE III
HOME PROPERTIES, INC.
REAL ESTATE AND ACCUMULATED DEPRECIATION
DECEMBER 31, 2014
(Dollars in thousands)
The changes in total real estate assets are as follows:
|
|
|
|
|
|
|
|
|
|
|
|
|
|
|
2014 |
|
|
2013 |
|
|
2012 |
| |
|
|
|
|
|
|
|
|
|
|
| |
|
Balance, beginning of year |
|
$5,620,765 |
|
|
$ 5,455,226 |
|
|
$5,042,324 |
| |
|
New property acquisitions |
|
142,806 |
|
|
98,199 |
|
|
297,650 |
| |
|
Additions |
|
184,465 |
|
|
204,717 |
|
|
226,348 |
| |
|
Disposals and retirements |
|
(183,309 |
) |
|
(137,377 |
) |
|
(111,096 |
) | |
|
Balance, end of year |
|
$5,764,727 |
|
|
$5,620,765 |
|
|
$5,455,226 |
| |
|
|
|
|
|
|
|
|
|
|
|
|
|
|
|
|
|
|
|
|
|
|
| |
|
The changes in accumulated depreciation are as follows: |
|
|
|
|
|
|
|
|
| |
|
|
|
|
|
|
|
|
|
|
| |
|
|
|
|
|
|
|
|
|
|
|
|
|
|
|
2014 |
|
|
2013 |
|
|
2012 |
| |
|
|
|
|
|
|
|
|
|
|
| |
|
Balance, beginning of year |
|
$1,243,243 |
|
|
$ 1,108,840 |
|
|
$ 983,759 |
| |
|
Depreciation |
|
182,455 |
|
|
173,872 |
|
|
166,339 |
| |
|
Disposals and retirements |
|
(54,471 |
) |
|
(39,469 |
) |
|
(41,258 |
) | |
|
Balance, end of year |
|
|
$1,371,227 |
|
|
$1,243,243 |
|
|
$1,108,840 |
|
|
|
|
|
|
|
|
|
|
|
|
|
Pursuant to the requirements of Section 13 or 15(d) of the Securities Exchange Act of 1934, the registrant has duly caused this report to be signed on its behalf by the undersigned thereunto duly authorized.
|
|
HOME PROPERTIES, INC. | |
|
|
|
|
|
|
By: |
/s/ Edward J. Pettinella |
|
|
|
Edward J. Pettinella |
|
|
|
President and Chief Executive Officer |
|
|
|
|
|
|
Date: |
February 24, 2015 |
Pursuant to the requirements of the Securities Exchange Act of 1934, the report has been signed by the following persons on behalf of Home Properties, Inc. and in the capacities and on the dates indicated.
|
Signature |
|
Title |
|
Date |
|
|
|
|
|
|
|
/s/ Edward J. Pettinella |
|
Director, President and Chief Executive Officer |
|
February 24, 2015 |
|
Edward J. Pettinella |
|
|
|
|
|
|
|
|
|
|
|
/s/ David P. Gardner |
|
Executive Vice President, Chief Financial Officer |
|
February 24, 2015 |
|
David P. Gardner |
|
(Principal Financial Officer) |
|
|
|
|
|
|
|
|
|
/s/ Robert J. Luken |
|
Senior Vice President, Chief Administrative Officer, |
|
February 24, 2015 |
|
Robert J. Luken |
|
Chief Accounting Officer and Treasurer |
|
|
|
|
|
(Principal Accounting Officer) |
|
|
|
|
|
|
|
|
|
/s/ Kenneth O. Hall |
|
Vice President and Controller |
|
February 24, 2015 |
|
Kenneth O. Hall |
|
|
|
|
|
|
|
|
|
|
|
/s/ Michael D. Barnello |
|
Director |
|
February 24, 2015 |
|
Michael D. Barnello |
|
|
|
|
|
|
|
|
|
|
|
/s/ Bonnie S. Biumi |
|
Director |
|
February 24, 2015 |
|
Bonnie S. Biumi |
|
|
|
|
|
|
|
|
|
|
|
/s/ Stephen R. Blank |
|
Director |
|
February 24, 2015 |
|
Stephen R. Blank |
|
|
|
|
|
|
|
|
|
|
|
/s/ Alan L. Gosule |
|
Director |
|
February 24, 2015 |
|
Alan L. Gosule |
|
|
|
|
|
|
|
|
|
|
|
/s/ Leonard F. Helbig, III |
|
Director |
|
February 24, 2015 |
|
Leonard F. Helbig, III |
|
|
|
|
|
|
|
|
|
|
|
/s/ Thomas P. Lydon, Jr. |
|
Director |
|
February 24, 2015 |
|
Thomas P. Lydon, Jr. |
|
|
|
|
|
|
|
|
|
|
|
/s/ Clifford W. Smith, Jr. |
|
Director |
|
February 24, 2015 |
|
Clifford W. Smith, Jr. |
|
|
|
|
HOME PROPERTIES, INC.
FORM 10-K
For The Year Ended December 31, 2014
Except as otherwise indicated, the exhibits listed below are filed as part of this report. References to exhibits or other filings under the caption “Location” indicate that exhibit or other filing has been filed, that the indexed exhibit and the exhibit referred to are the same and that the exhibit referred to is incorporated by reference.
|
Exhibit |
|
|
|
|
|
Number |
|
Exhibit |
|
Location |
|
3.1 |
|
Articles of Amendment and Restatement of Articles of Incorporation of Home Properties of New York, Inc. |
|
Incorporated by reference to Home Properties of New York, Registration Statement on Form S-11, File No. 33-78862 |
|
3.2 |
|
Articles of Amendment of the Articles of Incorporation of Home Properties of New York, Inc. |
|
Incorporated by reference to the Home Properties of New York, Inc. Registration Statement on Form S-3 File No. 333-52601 filed 5/14/98 |
|
3.3 |
|
Articles of Amendment of the Articles of Incorporation of Home Properties of New York, Inc. |
|
Incorporated by reference to Form 8-K filed by Home Properties of New York, Inc. dated 7/2/99 |
|
3.4 |
|
Articles of Amendment of the Articles of Incorporation of Home Properties of New York, Inc. |
|
Incorporated by reference to the Form 10-Q filed by Home Properties, Inc. for the quarter ended 3/31/04 |
|
3.5 |
|
Third Amended and Restated By-laws of Home Properties, Inc. |
|
Incorporated by reference to the Form 8-K filed by Home Properties, Inc. on 2/3/14 |
|
3.6 |
|
Articles of Amendment to the Articles of Incorporation of Conifer Realty Corporation Changing the name to Home Properties Resident Services, Inc. |
|
Incorporated by reference to the Form 10-K filed by Home Properties of New York, Inc. for the annual period ended 12/31/00 |
|
3.7 |
|
By-Laws of Conifer Realty Corporation (now Home Properties Resident Services, Inc.) |
|
Incorporated by reference to the 12/31/95 10-K |
|
3.8 |
|
Home Properties Trust Declaration of Trust, dated September 19, 1997 |
|
Incorporated by reference to the Form 8-K filed by Home Properties of New York, Inc. dated 9/26/97 (the “9/26/97 8-K”) |
|
4.1 |
|
Form of certificate representing Shares of Common Stock |
|
Incorporated by reference to the Form 10- K filed by Home Properties of New York, Inc. for the period ended 12/31/94 (the “12/31/94 10-K”) |
|
4.2 |
|
Agreement of Home Properties of New York, Inc. to file instruments defining the rights of holders of long-term debt of it or its subsidiaries with the Commission upon request |
|
Incorporated by reference to the 12/31/94 10-K |
|
10.1 |
|
Second Amended and Restated Agreement of Limited Partnership of Home Properties of New York, L.P. |
|
Incorporated by reference to the 9/26/97 8-K |
|
10.2 |
|
Amendment No. Four to the Second Amended and Restated Agreement of Limited Partnership of Home Properties of New York, L.P. |
|
Incorporated by reference to Form 10-K filed by Home Properties of New York, Inc. for the annual period ended 12/31/97 |
|
Exhibit |
|
|
|
|
|
Number |
|
Exhibit |
|
Location |
|
10.3 |
|
Amendment No. Sixty-Two to the Second Amended and Restated Limited Partnership Agreement |
|
Incorporated by reference to Form 10-K filed by Home Properties of New York, Inc. for the annual period ended 12/31/03 |
|
10.4 |
|
Indemnification Agreement between Home Properties of New York, Inc. and certain officers and Directors* |
|
Incorporated by reference to the Form 10-Q filed by Home Properties of New York, Inc. for the quarter ended 6/30/94 |
|
10.5 |
|
Indemnification Agreement between Home Properties of New York, Inc. and Alan L. Gosule* |
|
Incorporated by reference to the Form 10-K filed by Home Properties of New York, Inc. for the annual period ended 12/31/96 |
|
10.6 |
|
Articles of Merger of Home Properties Management, Inc. into Home Properties Resident Services, Inc. |
|
Incorporated by reference to the Form 10-K filed by Home Properties, Inc. for the annual period ended 12/31/06 |
|
10.7 |
|
Amended and Restated 2003 Stock Benefit Plan* |
|
Incorporated by reference to the Form 8-K filed by Home Properties, Inc. dated 5/6/05 |
|
10.8 |
|
Amendment No. One to Amended and Restated Home Properties, Inc. 2003 Stock Benefit Plan* |
|
Incorporated by reference to the 9/30/08 10-Q |
|
10.9 |
|
Home Properties, Inc. 2008 Stock Benefit Plan* |
|
Incorporated by reference to the Schedule 14A filed on 3/24/08 |
|
10.10 |
|
Amendment No. One to Home Properties, Inc. 2008 Stock Benefit Plan* |
|
Incorporated by reference to the 9/30/08 10-Q |
|
10.11 |
|
Seventh Amended and Restated Dividend Reinvestment and Direct Stock Purchase Plan |
|
Incorporated by reference to the Form 8-K filed by Home Properties, Inc. on 9/28/06 |
|
10.12 |
|
Deferred Bonus Plan (Amended and Restated as of January 1, 2008)* |
|
Incorporated by reference to the Form 10-K filed by Home Properties, Inc. for the period ended 12/31/07 (the “12/31/07 10-K”) |
|
10.13 |
|
Director Deferred Compensation Plan (Amended and Restated as of January 1, 2008)* |
|
Incorporated by reference to the 12/31/07 10-K |
|
10.14 |
|
Amendment No. One to Home Properties, Inc. Deferred Bonus Plan (Amended and Restated January 1, 2008)* |
|
Incorporated by reference to the Form 10-K filed by Home Properties, Inc. for the period ended 12/31/09 (the “12/31/09 10-K”) |
|
10.15 |
|
Indemnification Agreement between Home Properties, Inc. and Stephen R. Blank* |
|
Incorporated by reference to the Form 10-K filed by Home Properties, Inc. for the period ended 12/31/08 |
|
10.16 |
|
Amended and Restated Lease Agreement Between Clinton Square Asset Holding Associates, L.P. and Home Properties, L.P. dated July 6, 2009 |
|
Incorporated by reference to the Form 10-Q filed by Home Properties, Inc. for the quarter ended 6/30/09 |
|
10.17 |
|
Amendment No. Eighty-Nine to Second Amended and Restated Limited Partnership Agreement |
|
Incorporated by reference to the 12/31/09 10-K |
|
10.18 |
|
Indemnification Agreement between Home Properties, Inc. and Charles J. Koch* |
|
Incorporated by reference to the 12/31/09 10-K |
|
Exhibit |
|
|
|
|
|
Number |
|
Exhibit |
|
Location |
|
10.19 |
|
Employment Agreement between Edward J. Pettinella, the Company’s President and Chief Executive Officer and Home Properties, Inc. effective January 1, 2011* |
|
Incorporated by reference to the Form 8-K filed by Home Properties, Inc. on 12/29/10 |
|
10.20 |
|
Amended and Restated Executive Retention Plan* |
|
Incorporated by reference to the Form 8-K filed by Home Properties, Inc. on 2/16/11 (the “2/16/11 8-K”) |
|
10.21 |
|
Executive Stock Ownership Guidelines, adopted February 12, 2011 |
|
Incorporated by reference to the 2/16/11 8-K |
|
10.22 |
|
Indemnification Agreement between Home Properties, Inc. and Thomas P. Lydon, Jr.* |
|
Incorporated by reference to the Form 10-K filed by Home Properties, Inc. for the period ended 12/31/10 |
|
10.23 |
|
Home Properties, Inc. Incentive Compensation Plan* |
|
Incorporated by reference to the Form 8-K filed by Home Properties, Inc. on 5/5/11 |
|
10.24 |
|
Home Properties, Inc. 2011 Stock Benefit Plan* |
|
Incorporated by reference to the Home Properties Registration Statement on Form S-8, File No. 333-173947 filed on 5/5/11 (the “5/5/11 S-8”) |
|
10.25 |
|
Form of Employee Incentive Stock Option Certificate* |
|
Incorporated by reference to the 5/5/11 S-8 |
|
10.26 |
|
Form of Director Non-Qualified Stock Option Certificate* |
|
Incorporated by reference to the 5/5/11 S-8 |
|
10.27 |
|
Form of Employee Non-Qualified Stock Option Certificate* |
|
Incorporated by reference to the 5/5/11 S-8 |
|
10.28 |
|
Form of Director Restricted Stock Certificate* |
|
Incorporated by reference to the 5/5/11 S-8 |
|
10.29 |
|
Form of Employee Restricted Stock Certificate* |
|
Incorporated by reference to the 5/5/11 S-8 |
|
10.30 |
|
Underwriting Agreement, dated September 20, 2011 between the Company and Merrill Lynch, Pierce, Fenner & Smith Incorporated, as representative of the several Underwriters |
|
Incorporated by reference to the Form 8-K filed by Home Properties, Inc. on 9/20/11 |
|
10.31 |
|
Nonqualified Voluntary Deferred Compensation Plan* |
|
Incorporated by reference to the Form 10-Q filed by Home Properties, Inc. for the quarter ended 9/30/11 (the “9/30/11 10-Q”) |
|
10.32 |
|
Amendment Number Two to Deferred Bonus Plan* |
|
Incorporated by reference to the 9/30/11 10-Q |
|
10.33 |
|
Amended and Restated Credit Agreement |
|
Incorporated by reference to the Form 8-K filed by Home Properties, Inc. on 12/13/11 (the “12/13/11 8-K”) |
|
10.34 |
|
Amended and Restated Guaranty |
|
Incorporated by reference to the 12/13/11 8-K |
|
10.35 |
|
Note Purchase Agreement relating to Series A and Series B Senior Guaranteed Notes |
|
Incorporated by reference to the Form 8-K filed by Home Properties, Inc. on 12/20/11 (the “12/20/11 8-K”) |
|
10.36 |
|
Affiliate Guaranty |
|
Incorporated by reference to the 12/20/11 8-K |
|
10.37 |
|
Home Properties, Inc. 2011 Stock Benefit Plan 2012 Restricted Stock Unit Master Agreement* |
|
Incorporated by reference to the Form 8-K filed by Home Properties, Inc. on 2/9/12 |
|
Exhibit |
|
|
|
|
|
Number |
|
Exhibit |
|
Location |
|
10.38 |
|
Home Properties, Inc. 2011 Stock Benefit Plan 2013 Restricted Stock Unit Master Agreement and Form of Award Certificate* |
|
Incorporated by reference to the Form 8-K filed by Home Properties, Inc. on 1/3/2013 |
|
10.39 |
|
ATM Equity Offering Sales Agreement dated February 28, 2013 between Home Properties, Inc., Merrill Lynch, Pierce, Fenner & Smith Incorporated, Jefferies & Company, Inc., J.P. Morgan Securities LLC and RBS Securities, Inc. |
|
Incorporated by reference to the Form 8-K filed by Home Properties, Inc. on 2/28/13 |
|
10.40 |
|
Underwriting Agreement, dated July 9, 2013 between the Company and Merrill Lynch, Pierce, Fenner & Smith Incorporated, as representative of the several Underwriters |
|
Incorporated by reference to the Form 8-K filed by Home Properties, Inc. on 7/9/13 |
|
10.41 |
|
First Amendment to Credit Agreement |
|
Incorporated by reference to the Form 8-K filed by Home Properties, Inc. on 8/22/13 |
|
10.42 |
|
Indemnification Agreement between Home Properties, Inc. and Bonnie S. Biumi* |
|
Incorporated by reference to the Form 10-Q filed by Home Properties, Inc. for the period ended 9/30/13 (the “9/30/13 10Q”) |
|
10.43 |
|
Indemnification Agreement between Home Properties, Inc. and Michael D. Barnello* |
|
Incorporated by reference to the 9/30/13 10Q |
|
10.44 |
|
Employment Agreement between Edward J. Pettinella, the Company’s President and Chief Executive Officer and Home Properties, Inc. effective January 1, 2014* |
|
Incorporated by reference to the Form 8-K filed by Home Properties, Inc. on 12/23/2013 |
|
10.45 |
|
Home Properties, Inc. 2011 Stock Benefit Plan 2014 Restricted Stock Unit Master Agreement and Form of Award Certificate* |
|
Incorporated by reference to the Form 8-K filed by Home Properties, Inc. on 2/13/2014 |
|
10.46 |
|
Home Properties, Inc. 2011 Stock Benefit Plan 2015 Restricted Stock Unit Master Agreement and Form of Award Certificate |
|
Incorporated by reference to the Form 8-K filed by Home Properties, Inc. on 2/6/2015 |
|
11 |
|
Computation of Per Share Earnings Schedule |
|
Filed herewith |
|
21 |
|
List of Subsidiaries of Home Properties, Inc. |
|
Filed herewith |
|
23 |
|
Consent of PricewaterhouseCoopers LLP |
|
Filed herewith |
|
31.1 |
|
Section 302 Certification of Chief Executive Officer |
|
Filed herewith |
|
31.2 |
|
Section 302 Certification of Chief Financial Officer |
|
Filed herewith |
|
32.1 |
|
Section 906 Certification of Chief Executive Officer** |
|
Furnished herewith |
|
32.2 |
|
Section 906 Certification of Chief Financial Officer** |
|
Furnished herewith |
|
99 |
|
Additional Exhibits - Debt Summary Schedule |
|
Filed herewith |
|
101 |
|
XBRL (eXtensible Business Reporting Language). The following materials from the Home Properties, Inc. Annual Report on Form 10-K for the period ended December 31, 2014, formatted in XBRL: (i) consolidated balance sheets, (ii) consolidated statements of operations, (iii) consolidated statements of comprehensive income, (iv) consolidated statements of equity, (v) consolidated statements of cash flows and (vi) notes to consolidated financial statements. As provided in Rule 406T of Regulation S-T, this information is filed for purposes of Sections 11 and 12 of the Securities Act of 1933 and Section 18 of the Securities Exchange Act of 1934. |
|
Filed herewith |
|
* |
|
Management contract or compensatory plan or arrangement required to be filed as an exhibit to this Form 10-K pursuant to Item 15(b) of Form 10-K. |
|
|
|
|
|
** |
|
These exhibits are not incorporated by reference in any registration statement or report which incorporates this Annual Report on Form 10-K for the year ended December 31, 2014. |