Attached files
| file | filename |
|---|---|
| EXCEL - IDEA: XBRL DOCUMENT - XERIANT, INC. | Financial_Report.xls |
| EX-31.1 - CERTIFICATION - XERIANT, INC. | banj_ex311.htm |
| EX-32.1 - CERTIFICATION - XERIANT, INC. | banj_ex321.htm |
UNITED STATES
SECURITIES AND EXCHANGE COMMISSION
WASHINGTON, DC 20549
FORM 10-Q
x Quarterly report pursuant to Section 13 or 15(d) of the Securities Exchange Act of 1934
For the quarterly period ended December 31, 2014
¨ Transition report pursuant to Section 13 or 15(d) of the Securities Exchange Act of 1934
For the transition period from __________ to __________.
Commission File Number 000-54277
|
BANJO & MATILDA, INC. |
|
(Exact name of registrant as specified in its charter) |
|
Nevada |
27-1519178 |
|
|
(State or other jurisdiction of incorporation or organization) |
(I.R.S. employer identification number) |
76 William Street
Paddington NSW 2021
Australia
(Address of principal executive offices and zip code)
+61 2 8069-2665
(Registrant’s telephone number, including area code)
Indicate by check mark whether the registrant (1) has filed all reports required to be filed by Section 13 or 15(d) of the Securities Exchange Act of 1934 during the preceding 12 months (or for such shorter period that the registrant was required to file such reports) and (2) has been subject to such filing requirements for the past 90 days. Yes x No ¨
Indicate by check mark whether the registrant has submitted electronically and posted on its corporate Web site, if any, every Interactive Data File required to be submitted and posted pursuant to Rule 405 of Regulation S-T (§232.405 of this chapter) during the preceding 12 months (or for such shorter period that the registrant was required to submit and post such files). Yes x No ¨
Indicate by check mark whether the registrant is a large accelerated filer, an accelerated filer, a non-accelerated filer, or a smaller reporting company.
|
Large accelerated filer |
¨ |
Accelerated filer |
¨ |
|
Non-accelerated filer |
¨ |
Smaller reporting company |
x |
|
(Do not check if a smaller reporting company) |
|||
Indicate by check mark whether the registrant is a shell company (as defined in Rule 12b-2 of the Exchange Act). Yes ¨ No x
Indicate the number of shares outstanding of each of the issuer’s classes of common stock, as of the latest practicable date. As of December 31 2014, the Registrant had outstanding 34,140,644 shares of common stock.
BANJO & MATILDA, INC.
FORM 10-Q
TABLE OF CONTENTS
| Page | |||||
|
SPECIAL NOTE REGARDING FORWARD-LOOKING STATEMENTS |
3 |
||||
|
PART I – FINANCIAL INFORMATION |
4 |
||||
|
Item 1. |
Financial statements |
|
|||
|
CONDENSED CONSOLIDATED BALANCE SHEETS |
5 |
||||
|
CONDENSED CONSOLIDATED STATEMENTS OF OPERATIONS AND COMPREHENSIVE LOSS |
6 |
||||
|
CONDENSED CONSOLIDATED STATEMENT OF CASH FLOWS |
7 |
||||
|
NOTES TO CONDENSED CONSOLIDATED FINANCIAL STATEMENTS |
8 |
||||
|
Item 2. |
Management’s Discussion and Analysis of Financial Condition and Results of Operations |
19 | |||
|
|
|
||||
|
Item 3. |
Quantitative and Qualitative Disclosures about Market Risk |
27 | |||
|
|
|
||||
|
Item 4. |
Controls and Procedures |
27 | |||
|
PART II – OTHER INFORMATION |
28 | ||||
|
Item 1A. |
Risk Factors |
28 | |||
|
|
|
||||
|
Item 2. |
Unregistered Sales of Securities |
28 | |||
|
|
|
||||
|
Item 6. |
Exhibits |
29 | |||
|
SIGNATURES |
30 | ||||
|
2
|
SPECIAL NOTE REGARDING FORWARD-LOOKING STATEMENTS
This document contains certain statements of a forward-looking nature. Such forward-looking statements, including but not limited to statements regarding projected growth, trends and strategies, future operating and financial results, financial expectations and current business indicators are based upon current information and expectations and are subject to change based on factors beyond the control of the Company. Forward-looking statements typically are identified by the use of terms such as “look,” “may,” “should,” “might,” “believe,” “plan,” “expect,” “anticipate,” “estimate” and similar words, although some forward-looking statements are expressed differently. The accuracy of such statements may be impacted by a number of risks and uncertainties that could cause actual results to differ materially from those projected or anticipated, including but not limited to those set forth herein and in our Annual Report on Form 10-K filed on October 14, 2014.
Readers are cautioned not to place undue reliance on these forward-looking statements, which speak only as of the date hereof. Except as required by the federal securities laws, we undertake no obligation to update forward-looking information. Nonetheless, the Company reserves the right to make such updates from time to time by press release, periodic report or other method of public disclosure without the need for specific reference to this Report. No such update shall be deemed to indicate that other statements not addressed by such update remain correct or create an obligation to provide any other updates.
|
3
|
PART I – FINANCIAL INFORMATION
Item 1. Financial statements
BANJO & MATILDA, INC. AND SUBSIDIARY
CONDENSED CONSOLIDATED FINANCIAL STATEMENTS
DECEMBER 31, 2014
(UNAUDITED)
INDEX TO UNAUDITED CONDENSED CONSOLIDATED FINANCIAL STATEMENTS
|
Condensed Consolidated Balance Sheets |
5 |
|||
|
Condensed Consolidated Statements of Operations and Comprehensive Loss |
6 |
|||
|
Condensed Consolidated Statements of Cash Flows |
7 |
|||
|
Notes to Condensed Consolidated Financial Statements |
8 |
|
4
|
|
BANJO & MATILDA, INC. AND SUBSIDIARY |
||||
|
CONDENSED CONSOLIDATED BALANCE SHEETS |
| December 31, 2014 |
June 30, 2014 |
|||||||
| (Unaudited) | ||||||||
|
ASSETS |
||||||||
|
|
||||||||
|
CURRENT ASSETS |
||||||||
|
Cash and cash equivalents |
$ |
11,132 |
$ |
33,367 |
||||
|
Trade receivables, net |
559,592 |
333,174 |
||||||
|
Inventory |
684,640 |
630,235 |
||||||
|
Other assets |
1,223 |
8,212 |
||||||
|
TOTAL CURRENT ASSETS |
1,256,587 |
1,004,988 |
||||||
|
NON-CURRENT ASSETS |
||||||||
|
Intangible assets |
52,725 |
62,637 |
||||||
|
Other receivable |
89,482 |
128,228 |
||||||
|
Property, plant and equipment |
7,136 |
10,225 |
||||||
|
TOTAL NON-CURRENT ASSETS |
149,343 |
201,090 |
||||||
|
TOTAL ASSETS |
$ |
1,405,930 |
$ |
1,206,078 |
||||
|
LIABILITIES AND STOCKHOLDERS' DEFICIT |
||||||||
|
CURRENT LIABILITIES |
||||||||
|
Trade and other payables |
$ |
539,228 |
$ |
360,737 |
||||
|
Deposit payable |
- |
2,547 |
||||||
|
Trade financing |
560,623 |
267,637 |
||||||
|
Accrued interest |
86,253 |
13,035 |
||||||
|
Loans payable |
545,348 |
643,440 |
||||||
|
TOTAL CURRENT LIABILITIES |
1,731,452 |
1,287,396 |
||||||
|
NON-CURRENT LIABILITIES |
||||||||
|
Loan from related parties |
22,427 |
123,082 |
||||||
|
TOTAL NON-CURRENT LIABILITIES |
22,427 |
123,082 |
||||||
|
TOTAL LIABILITIES |
1,753,879 |
1,410,478 |
||||||
|
STOCKHOLDERS' DEFICIT |
||||||||
|
Preferred stock, $0.00001 par value, 100,000,000 shares authorized and 1,000,000 shares issued and outstanding, respectively |
10 |
10 |
||||||
|
Common stock, $0.00001 par value, 100,000,000 shares authorized and 34,140,644 and 27,886,484 shares issued and outstanding, respectively |
341 |
279 |
||||||
|
Additional paid in capital |
895,861 |
836,273 |
||||||
|
Other accumulated comprehensive gain |
69,445 |
56,321 |
||||||
|
Accumulated deficit |
(1,313,606 |
) |
(1,097,283 |
) |
||||
|
TOTAL STOCKHOLDERS' DEFICIT |
(347,949 |
) |
(204,400 |
) |
||||
|
TOTAL LIABILITIES AND STOCKHOLDERS' DEFICIT |
$ |
1,405,930 |
$ |
1,206,078 |
||||
The accompanying notes are an integral part of these consolidated financial statements
|
5
|
|
BANJO & MATILDA, INC. AND SUBSIDIARY |
||||||||
|
CONDENSED CONSOLIDATED STATEMENTS OF OPERATIONS AND COMPREHENSIVE LOSS |
||||||||
|
FOR THE THREE AND SIX MONTHS ENDED DECEMBER 31, 2014 AND 2013 |
||||||||
|
(UNAUDITED) |
| Three Months Ended | Six Months Ended | |||||||||||||||
| December 31, 2014 |
December 31, 2013 |
December 31, 2014 |
December 31, 2013 |
|||||||||||||
|
Revenue |
$ |
1,038,418 |
$ |
426,015 |
$ |
1,785,181 |
$ |
955,229 |
||||||||
|
Cost of sales |
581,999 |
242,683 |
993,732 |
584,976 |
||||||||||||
|
Gross profit |
456,419 |
183,332 |
791,449 |
370,253 |
||||||||||||
|
Bad debt expense |
38,813 |
- |
49,876 |
- |
||||||||||||
|
Payroll and employee related expense |
193,226 |
118,120 |
365,630 |
200,357 |
||||||||||||
|
Administration expense |
84,297 |
30,395 |
127,782 |
63,047 |
||||||||||||
|
Marketing expense |
41,454 |
39,291 |
147,246 |
60,231 |
||||||||||||
|
Occupancy expense |
11,398 |
27,106 |
24,637 |
36,590 |
||||||||||||
|
Depreciation and amortization |
3,020 |
3,276 |
6,289 |
6,507 |
||||||||||||
|
Corporate and public company expense |
61,333 |
99,138 |
97,872 |
99,138 |
||||||||||||
|
433,541 |
317,326 |
819,332 |
465,870 |
|||||||||||||
|
Income (loss) from operations |
22,878 |
(133,994 |
) |
(27,883 |
) |
(95,617 |
) |
|||||||||
|
Other Income (Expense) |
||||||||||||||||
|
Finance costs |
(101,510 |
) |
(44,755 |
) |
(188,440 |
) |
(96,289 |
) |
||||||||
|
Total Other Expense |
(101,510 |
) |
(44,755 |
) |
(188,440 |
) |
(96,289 |
) |
||||||||
|
Loss before income tax |
(78,632 |
) |
(178,749 |
) |
(216,323 |
) |
(191,906 |
) |
||||||||
|
Provision for income taxes |
- |
- |
- |
- |
||||||||||||
|
Net loss |
(78,632 |
) |
(178,749 |
) |
(216,323 |
) |
(191,906 |
) |
||||||||
|
Other comprehensive income |
||||||||||||||||
|
Foreign currency translation |
18,548 |
9,081 |
13,124 |
5,458 |
||||||||||||
|
Comprehensive loss |
$ |
(60,084 |
) |
$ |
(169,668 |
) |
$ |
(203,199 |
) |
$ |
(186,448 |
) |
||||
|
Net loss per share from net loss |
||||||||||||||||
|
Basic |
$ |
(0.002 |
) |
$ |
(0.008 |
) |
$ |
(0.007 |
) |
$ |
(0.009 |
) |
||||
|
Diluted |
$ |
(0.002 |
) |
$ |
(0.008 |
) |
$ |
(0.007 |
) |
$ |
(0.009 |
) |
||||
|
Weighted average number of shares outstanding: |
||||||||||||||||
|
Basic |
31,790,918 |
23,089,880 |
29,493,137 |
21,679,314 |
||||||||||||
|
Diluted |
31,790,918 |
23,089,880 |
29,493,137 |
21,679,314 |
||||||||||||
The accompanying notes are an integral part of these consolidated financial statements
|
6
|
BANJO & MATILDA, INC. AND SUBSIDIARY
CONDENSED CONSOLIDATED STATEMENTS OF CASH FLOWS
FOR THE SIX MONTHS ENDED DECEMBER 31, 2014 AND 2013
(UNAUDITED)
| December 31, 2014 |
December 31, 2013 |
|||||||
|
Net loss |
$ |
(216,323 |
) |
$ |
(191,906 |
) |
||
|
Adjustments to reconcile net loss to net cash used in operating activities: |
||||||||
|
Depreciation and amortization |
6,289 |
6,507 |
||||||
|
Issuance of shares as compensation |
14,878 |
- |
||||||
|
(Increase) / decrease in assets: |
||||||||
|
Trade receivables |
(296,032 |
) |
(210,669 |
) |
||||
|
Inventory |
(151,707 |
) |
(275,783 |
) |
||||
|
Other assets |
6,429 |
(58,411 |
) |
|||||
|
Other receivable |
23,529 |
32,896 |
||||||
|
Increase/ (decrease) in current liabilities: |
||||||||
|
Trade payables and other liabilities |
247,716 |
1,767 |
||||||
|
Accrued interest |
81,265 |
- |
||||||
|
Deposits payable |
(2,408 |
) |
- |
|||||
|
Net cash used in operating activities |
(286,364 |
) |
(695,599 |
) |
||||
|
CASH FLOWS FROM INVESTING ACTIVITIES |
||||||||
|
Purchase of intangible assets |
- |
(5,160 |
) |
|||||
|
Purchase of property, plant and equipment |
(2,764 |
) |
(4,325 |
) |
||||
|
Net cash used in investing activities |
(2,764 |
) |
(9,485 |
) |
||||
|
CASH FLOWS FROM FINANCING ACTIVITIES |
||||||||
|
Proceeds from issuance of stock |
44,770 |
120,000 |
||||||
|
Convertible loans, net |
(38,205 |
) |
338,083 |
|||||
|
Related party loan, net |
(120,385 |
) |
134,361 |
|||||
|
Net trade financing |
357,094 |
130,767 |
||||||
|
Net cash provided by financing activities |
243,274 |
723,211 |
||||||
|
Effect of exchange rate changes on cash and cash equivalents |
23,619 |
(2,071 |
) |
|||||
|
Net (decrease) / increase in cash and cash equivalents |
(22,235 |
) |
16,056 |
|||||
|
Cash and cash equivalents at the beginning of the period |
33,367 |
11,104 |
||||||
|
Cash and cash equivalents at the end of the period |
$ |
11,132 |
$ |
27,160 |
||||
|
SUPPLEMENTAL DISCLOSURES: |
||||||||
|
Conversion of debt to equity |
$ |
12,000 |
$ |
338,083 |
||||
|
Cash paid during the year for: |
||||||||
|
Income tax payments |
$ |
- |
$ |
- |
||||
|
Interest payments |
$ |
76,836 |
$ |
44,838 |
||||
The accompanying notes are an integral part of these consolidated financial statements
|
7
|
BANJO & MATILDA, INC. AND SUBSIDIARY
NOTES TO CONDENSED CONSOLIDATED FINANCIAL STATEMENTS
DECEMBER 31, 2014
Note 1 – BASIS OF PRESENTATION
The accompanying condensed consolidated financial statements were prepared in conformity with generally accepted accounting principles in the United States (“US GAAP”) and with the instructions to Form 10-Q.
Certain information and footnote disclosures normally included in financial statements prepared in accordance with U.S. GAAP have been condensed or omitted pursuant to U.S. GAAP rules and regulations for presentation of interim financial information. Therefore, the unaudited condensed interim consolidated financial statements should be read in conjunction with the financial statements and the notes thereto, included in the Company’s Annual Report on the Form 10-K for the fiscal year ended June 30, 2014. Current and future financial statements may not be directly comparable to the Company’s historical financial statements. However, except as disclosed herein, there has been no material changes in the information disclosed in the notes to the financial statements for the year ended June 30, 2014 included in the Company’s Annual Report on Form 10-K filed with the Securities and Exchange Commission. The unaudited consolidated financial statements should be read in conjunction with the financial statements included in the Form10-K. In the opinion of Management, all adjustments considered necessary for a fair presentation, consisting solely of normal recurring adjustments, have been made. Operating results for the three and six months ended December 31, 2014 are not necessarily indicative of the results that may be expected for the year ending June 30, 2015.
When used in these notes, the terms "Company," "we," "our," or "us" mean Banjo & Matilda, Inc. and its subsidiary.
Note 2 – SUMMARY OF SIGNIFICANT ACCOUNTING POLICIES
Exchange Gain (Loss)
During the three and six months ended December 31, 2014 and 2013, the transactions of the Company were denominated in foreign currency and were recorded in Australian dollar (AUD) at the rates of exchange in effect when the transactions occurred. Exchange gains and losses are recognized for the different foreign exchange rates applied when the foreign currency assets and liabilities are settled.
Foreign Currency Translation and Comprehensive Income (Loss)
The accounts of the Company were maintained, and its financial statements were expressed, in AUD. Such financial statements were translated into USD with the AUD as the functional currency. All assets and liabilities were translated at the exchange rate at the balance sheet date, stockholder’s equity is translated at the historical rates and income statement items are translated at the average exchange rate for the period. Transactions in foreign currencies are initially recorded at the functional currency rate ruling at the date of transaction. Any differences between the initially recorded amount and the settlement amount are recorded as a gain or loss on foreign currency transaction in the statements of operations. The resulting translation adjustments are reported under other comprehensive income as a component of shareholders’ equity. There were no significant fluctuations in the exchange rate for the conversion of AUD to USD after the balance sheet date.
|
8
|
Use of Estimates
The preparation of financial statements in conformity with US GAAP requires management to make certain estimates and assumptions that affect the reported amounts of assets and liabilities and disclosure of contingent assets and liabilities at the date of the financial statements and the reported amounts of revenues and expenses during the reporting period. Actual results could differ from those estimates. Significant estimates include collectability of accounts receivable, accounts payable, sales returns and recoverability of long-term assets.
Reportable Segment
The Company has one reportable segment. The Company’s activities are interrelated and each activity is dependent upon and supportive of the other. Accordingly, all significant operating decisions are based on analysis of financial products provided as a single global business.
Liquidity Matters
Based upon its current projection of revenue, management believes that its current cash position and available financing provide sufficient resources and operating flexibility through at least the next twelve months. However, there can be no assurance that projected revenue growth and improvement in operating results will occur or that the Company will successfully implement its plans. In the event cash flow from operations is not sufficient, additional sources of financing will be required in order to maintain the Company’s current operations. Whereas management believes it will have access to other financing sources, no assurance can be given that such additional sources of financing will be available on acceptable terms, on a timely basis or at all.
Revenue Recognition
Revenue is recognized when persuasive evidence of an arrangement exists, delivery has occurred, the fee is fixed or determinable, and collectability is probable. Revenue generally is recognized net of allowances for returns and any taxes collected from customers and subsequently remitted to governmental authorities.
Cost of Sales
Cost of sales consists primarily of inventory costs, as well as warehousing costs (including the cost of warehouse labor), shipping, importation duties and charges, third party royalties, and product sampling.
|
9
|
Operating Overhead Expense
Operating overhead expense consists primarily of payroll and benefit related costs, rent, depreciation and amortization, professional services, and meetings and travel.
Income Taxes
The Company utilizes the liability method of accounting for income tax. Under the liability method, deferred income tax assets and liabilities are provided based on the difference between the financial statements and tax basis of assets and liabilities measured by the current enacted tax rates in effect for the years in which these differences are expected to reverse.
The Company has adopted accounting standards for the accounting for uncertain income taxes. These standards provide guidance for the accounting and disclosure about uncertain tax positions taken. Management believes that all of the positions taken in its federal and states income tax returns are more likely than not to be sustained upon examination.
At December 31, 2014 and 2013, the Company had not taken any significant uncertain tax positions on its tax returns for 2013 and prior years or in computing its tax provision for 2014.
Concentration of Credit Risk
Financial instruments that potentially subject the Company to concentrations of credit risk are cash, accounts receivable and other receivables arising from its normal business activities. The Company places its cash in what it believes to be credit-worthy financial institutions. The Company has a diversified customer base across many markets, predominantly Australia, United States of America, United Kingdom, Europe and the Middle East. The Company controls credit risk related to accounts receivable through credit approvals, credit limits and monitoring procedures. The Company routinely assesses the financial strength of its customers and, based upon factors surrounding the credit risk, establishes an allowance, if required, for uncollectible accounts and, as a consequence, believes that its accounts receivable credit risk exposure beyond such allowance is limited. In addition, Receivables that are factored through the Company’s Receivable finance facility are guaranteed by the finance company that further mitigates Credit Risk.
Risks and Uncertainties
The Company is subject to risks from, among other things, competition associated with the industry in general, other risks associated with financing, liquidity requirements, rapidly changing customer requirements, limited operating history, foreign currency exchange rates and the volatility of public markets.
Contingencies
Certain conditions may exist as of the date the financial statements are issued, which may result in a loss to the Company but which will only be resolved when one or more future events occur or fail to occur. The Company’s management and legal counsel assess such contingent liabilities, and such assessment inherently involves judgment. In assessing loss contingencies related to legal proceedings that are pending against the Company or unasserted claims that may result in such proceedings, the Company’s legal counsel evaluates the perceived merits of any legal proceedings or unasserted claims as well as the perceived merits of the amount of relief sought or expected to be sought.
|
10
|
If the assessment of a contingency indicates it is probable that a material loss has been incurred and the amount of the liability can be estimated, then the estimated liability would be accrued in the Company’s financial statements. If the assessment indicates that a potential material loss contingency is not probable but is reasonably possible, or is probable but cannot be estimated, then the nature of the contingent liability, together with an estimate of the range of possible loss if determinable and material would be disclosed. Loss contingencies considered to be remote by management are generally not disclosed unless they involve guarantees, in which case the guarantee would be disclosed.
Cash and Equivalents
Cash and equivalents include cash in hand and cash in demand deposits, certificates of deposit and all highly liquid debt instruments with original maturities of three months or less. At December 31, 2014 and June 30, 2014, the Company had $11,132 and $33,367 in cash in Australia and not covered by insurance. The Company has not experienced any losses in such accounts and believes it is not exposed to any risks on its cash in bank accounts.
Allowance for Doubtful Accounts
The Company maintains reserves for potential credit losses on accounts receivable. Management reviews the composition of accounts receivable and analyzes historical bad debts, customer concentrations, customer credit worthiness, current economic trends and changes in customer payment patterns to evaluate the adequacy of these reserves. There were no allowances for doubtful accounts as of December 31, 2014 and June 30, 2014.
Inventory
Inventories are valued at the lower of cost (determined on a weighted average basis) or market. Management compares the cost of inventories with the market value and allowance is made to write down inventories to market value, if lower. As of December 31, 2014 and June 30, 2014, inventory only consisted of the following:
| December 31, 2014 |
June 30, |
|||||||
| Work in progress | $ | 160,344 | $ | 132,821 | ||||
| Finished goods | 520,458 | 489,833 | ||||||
| Raw materials | 3,838 | 7,581 | ||||||
| $ | 684,640 | $ | 630,235 | |||||
Fixed Assets
Fixed assets are stated at cost and depreciated using the straight-line method over the shorter of the estimated useful life of the asset or the lease term. The estimated useful lives of our property and equipment are generally as follows: computer software developed or acquired for internal use, three to 10 years; computer equipment, two to three years; buildings and improvements, five to 15 years; leasehold improvements, two to 10 years; and furniture and equipment, one to five years.
|
11
|
As of December 31, 2014 and June 30, 2014, fixed assets consisted of the following:
| December 31, 2014 | June 30, 2014 |
|||||||
| Plant and Equipment | $ | 27,437 | $ | 30,352 | ||||
| Accumulated depreciation | (20,301 | ) | (20,127 | ) | ||||
| $ | 7,136 | $ | 10,225 | |||||
Depreciation was $1,311 and $2,180 for three months ended December 31, 2014 and 2013, respectively.
Depreciation was $2,003 and $3,527 for six months ended December 31, 2014 and 2013, respectively.
Fair Value of Financial Instruments
For certain of the Company’s financial instruments, including cash and equivalents, restricted cash, accounts receivable, accounts payable, accrued liabilities and short-term debt, the carrying amounts approximate their fair values due to their short maturities. ASC Topic 820, “Fair Value Measurements and Disclosures,” requires disclosure of the fair value of financial instruments held by the Company. ASC Topic 825, “Financial Instruments,” defines fair value, and establishes a three-level valuation hierarchy for disclosures of fair value measurement that enhances disclosure requirements for fair value measures. The carrying amounts reported in the balance sheets for receivables and current liabilities each qualify as financial instruments and are a reasonable estimate of their fair values because of the short period of time between the origination of such instruments and their expected realization and their current market rate of interest. The three levels of valuation hierarchy are defined as follows:
Level 1 inputs to the valuation methodology are quoted prices for identical assets or liabilities in active markets.
Level 2 inputs to the valuation methodology include quoted prices for similar assets and liabilities in active markets, and inputs that are observable for the asset or liability, either directly or indirectly, for substantially the full term of the financial instrument.
Level 3 inputs to the valuation methodology are unobservable and significant to the fair value measurement.
The Company analyzes all financial instruments with features of both liabilities and equity under ASC 480, “Distinguishing Liabilities from Equity,” and ASC 815.
As of December 31, 2014 and June 30, 2014, the Company did not identify any assets and liabilities that are required to be presented on the balance sheet at fair value.
Earnings Per Share (EPS)
Basic EPS is computed by dividing income available to common shareholders by the weighted average number of common shares outstanding for the period. Diluted EPS is computed similar to basic net income per share except that the denominator is increased to include the number of additional common shares that would have been outstanding if all the potential common shares, warrants and stock options had been issued and if the additional common shares were dilutive. Diluted EPS is based on the assumption that all dilutive convertible shares and stock options were converted or exercised. Dilution is computed by applying the treasury stock method for the outstanding options and the if-converted method for the outstanding convertible preferred shares. Under the treasury stock method, options and warrants are assumed to be exercised at the beginning of the period (or at the time of issuance, if later), and as if funds obtained thereby were used to purchase common stock at the average market price during the period. Under the if-converted method, convertible outstanding instruments are assumed to be converted into common stock at the beginning of the period (or at the time of issuance, if later).
|
12
|
The following table sets forth the computation of basic and diluted earnings per share for three and six months ended December 31, 2014 and 2013:
| Three Months Ended | Six Months Ended | |||||||||||||||
| Basic and diluted | December 31, 2014 | December 31, 2013 | December 31, 2014 | December 31, 2013 | ||||||||||||
| Net loss | $ | (78,632 | ) | $ | (178,749 | ) | $ | (216,323 | ) | $ | (191,906 | ) | ||||
| Weighted average number of shares in computing basic and diluted net loss | ||||||||||||||||
| Basic | 31,790,918 | 23,089,880 | 29,493,137 | 21,679,314 | ||||||||||||
| Diluted | 31,790,918 | 23,089,880 | 29,493,137 | 21,679,314 | ||||||||||||
| Net loss per share | ||||||||||||||||
| Basic and diluted | $ | (0.002 | ) | $ | (0.008 | ) | $ | (0.007 | ) | $ | (0.009 | ) | ||||
Diluted EPS reflects the potential dilution of securities that could share in the earnings or losses of the entity. For the three and six months ended December 31, 2014 and 2013, basic and diluted loss per share are the same since the calculation of diluted per share amounts would result in an anti-dilutive calculation.
Intangible Assets
The Company records identifiable intangible assets at fair value on the date of acquisition and evaluates the useful life of each asset.
Finite-lived intangible assets primarily consist of software development capitalized. Finite-lived intangible assets are amortized on a straight-line basis and are tested for recoverability if events or changes in circumstances indicate that their carrying amounts may not be recoverable. These intangibles have useful lives ranging from 1 to 10 years. No events or changes in circumstances indicate that impairment existed as of December 31, 2014.
Recently Issued Accounting Pronouncements
There have been no new accounting pronouncements during the three months ended December 31, 2014 that the Company believes would have a material impact on its financial position or results of operations.
Reclassification
Certain prior year amounts have been reclassified for consistency with the current period presentation. These reclassifications had no effect on the reported results of operations or cash flow.
|
13
|
Note 3 – GOING CONCERN
As reflected in the accompanying financial statements, the Company had an accumulated deficit of $1,313,606 as of December 31, 2014.
While the Company is attempting to improve operations and generate profits, the Company’s cash position may not be significant enough to support the Company’s daily operations. Management intends to raise additional funds by way of a public or private offering. Management believes that the actions presently being taken to further implement its business plan and generate profits provide the opportunity for the Company to continue as a going concern. While the Company believes in the viability of its strategy to generate revenues and in its ability to raise additional funds, there can be no assurances to that effect. The ability of the Company to continue as a going concern is dependent upon the Company’s ability to further implement its business plan and generate revenues.
The financial statements do not include any adjustments that might be necessary if the Company is unable to continue as a going concern.
Note 4 – OTHER ASSETS
Other assets consist of the following as of December 31, 2014 and June 30, 2014:
| December 31, 2014 | June 30, 2014 |
|||||||
| Prepaid and other assets | $ | 1,223 | $ | 8,212 | ||||
| $ | 1,223 | $ | 8,212 | |||||
Note 5 – OTHER RECEIVABLE
Other receivable consist of the following as of December 31, 2014 and June 30, 2014:
| December 31, 2014 | June 30, 2014 |
|||||||
| Development grant | $ | 125,358 | $ | 128,228 | ||||
| Allowance for reserve | (35,876 | ) | - | |||||
| $ | 89,482 | $ | 128,228 | |||||
Note 6 – INTANGIBLE ASSETS
Intangible assets consist of the following as of December 31, 2014 and June 30, 2014:
| December 31, 2014 | June 30, 2014 |
|||||||
| Website | $ | 65,866 | $ | 74,478 | ||||
| Accumulated amortisation | (13,140 | ) | (11,841 | ) | ||||
| $ | 52,725 | $ | 62,637 | |||||
The intangible assets are amortized over 1 to 10 years. Amortization expense was $1,709 and $1,096 for the three months ended December 31, 2014 and 2013 respectively. Amortization expense was $4,286 and $2,980 for the six months ended December 31, 2014 and 2013 respectively.
|
14
|
Amortization for the Company’s intangible assets over the next five years from December 31, 2014 is estimated to be:
| December 31, | |||||
| 2015 | $ | 6,479 | |||
| 2016 | 6,479 | ||||
| 2017 | 6,479 | ||||
| 2018 | 6,479 | ||||
| 2019 | 6,479 | ||||
| Thereafter | 20,329 | ||||
| $ | 52,725 | ||||
Note 7 – TRADE AND OTHER PAYABLES
As of December 31, 2014 and June 30, 2014, trade and other payable are comprised of the following:
| December 31, 2014 | June 30, 2014 |
|||||||
| Trade payable | $ | 438,575 | $ | 340,468 | ||||
| Other liabilities | 100,653 | 20,269 | ||||||
| $ | 539,228 | $ | 360,737 | |||||
Note 8 – TRADE FINANCING
The Company has a trade financing agreement with a financial institution in Australia with a maximum limit of AUD $150,000 at an interest rate of 20.95% per annum. As of December 31, 2014 and June 30, 2014, the Company had outstanding balances of $125,464 and $146,202, respectively.
On August 14, 2014 the Company entered into a new trade finance agreement with an entity in the United States with a total maximum facility of $1,500,000 based on $1,000,000 towards sales invoiced and $500,000 towards purchase order financing at interest rates of 2% per month and 7.75% per year, respectively. As of December 31, 2014, the Company had outstanding balances of $374,867.
On November 20, 2014 the Company entered into a new retail trade finance agreement with an entity in Australia for AUD $75,000 with 100 equal payments of AUD$871.80 daily. As of December 31, 2014, the Company had outstanding balances of AUD $73,923 or USD $60,292.
|
15
|
Note 9 – LOANS
In November 2013, the Company entered into a short term loan arrangement totalling AUD $100,000 with a shareholder of the Company. Terms of the note were interest rate at 15% per annum or .0329% per day due 30 days from the loan date. The short term note was converted into a 30 day callable convertible note in January 2014.
In December 2013, the Company entered into a short term loan arrangement in the amount of $100,000 with an individual. Terms of the note require an interest payment of $5,000 on the repayment date, 30 days after the note date. If not repaid at that time, interest will accrue at the rate of $166 per day until the note is repaid.
In January 2014, the Company entered into a convertible loan agreement totaling AUD $250,000 with a shareholder of the Company. The Convertible Note bears interest at the rate of 9% per annum and is due on the first anniversary of the date of issuance, January 12, 2015. All or any portion of the principal amount of the Convertible Note and all accrued interest is convertible at the option of the holder into common stock of the Company at a conversion price of thirty cents ($0.30) per share, provided that if the Volume Weighted Average Price (VWAP) for the 30 days immediately preceding the receipt of a conversion notice is less than sixty cents ($.60) per share, the conversion price shall be reduced to twenty cents ($.20) per share. The Company is currently re-negotiating the terms of this loan.
In May 2014 the Company entered into a convertible loan agreement in the amount of $72,800 with a corporation in New York. Interest is to accrue at the rate of 8% per annum. Loan and accrued interest is due on December 1, 2014. The loan may be converted into common stock of the Company at any time by the election of the lender at a predetermined conversion price. On December 1, 2014, $12,000 was converted into 133,185 shares or $0.0901 per share.
In June 2014 the Company entered into a loan agreement in the amount of AUD$100,000 with a shareholder of the Company. The note bears interest at 6% per month and is due and payable in July 2014. The loan was repaid in the amount of AUD $80,000 and the balance of AUD $20,000 was extended to December 31, 2014. The Company is currently re-negotiating the terms of this loan.
In July 2014 the Company entered into a second convertible loan agreement in the amount of $72,800 with a corporation in New York. Interest is to accrue at the rate of 8% per annum. Loan and accrued interest is due in April 2015. The loan may be converted into common stock of the Company at any time by the election of the lender at a predetermined conversion price.
Related Party Payable
The Company has liabilities payable in the amount of $22,427 and $123,082 to shareholders and officers of the Company as of December 31, 2014 and June 30, 2014, respectively. Interest expense on these loans for the six months ended December 31, 2014 and June 30, 2014 was $0 and $2,610, respectively.
|
16
|
Note 10 – STOCKHOLDERS’ DEFICIT
Preferred Stock
Pursuant to an Employment Agreement (the “Agreement”) with the Chief Executive Officer on November 15, 2013, the Company issued 1,000,000 undesignated shares of Preferred Stock each having a par value of $0.00001. The preferred shares shall be entitled to 100 votes to every one share of common stock. The Preferred Shares shall only valid during the term of this Agreement. At the end of the Agreement, November 15, 2016, the shares shall be cancelled and returned to Treasury and the Executive shall have no preferential voting rights. If this Agreement is renewed the preferred shares remain the Executives.
Common Stock
Pursuant to the Exchange Agreement on November 14, 2013, the Company issued 18,505,539 Common Stock, par value $0.00001 per share for the acquisition of Banjo & Matilda, Pty Ltd.
On November 22, 2013, the Company agreed to issue 250,000 shares of the Company stock for $50,000 or $0.20 per share to an individual investor.
On November 27, 2013, the Company agreed to issue 250,000 shares of the Company stock for $50,000 or $0.20 per share to an individual investor.
On December 2, 2013, the Company agreed to issue 100,000 shares of the Company stock for $20,000 or $0.20 per share to an individual investor.
On January 9, 2014, the Company agreed to issue 250,000 shares of the Company stock for $50,000 or $0.20 per share to a corporate investor.
On January 10, 2014, the Company agreed to issue 125,000 shares of the Company stock for $25,000 or $0.20 per share to a corporate investor.
On May 29, 2014, the Company agreed to issue 250,000 shares of the Company stock for $50,000 or $0.20 per share to a corporate investor.
On June 4, 2014, the Company agreed to issue 225,000 shares of the Company stock for $45,000 or $0.20 per share to a corporate investor.
On July 24, 2014, the Company agreed to issue 55,200 shares of the Company stock for $13,800 or $0.25 per share to an individual investor.
On September 9, 2014, the Company agreed to issue 94,850 shares of the Company stock for $18,870 or $0.20 per share to a corporate investor.
On October 28, 2014, the Company agreed to issue 5,833,333 shares of the Company stock to the original shareholders of Banjo & Matilda Pty Ltd related to the merger and reorganization based on the original agreement.
On October 28, 2104, the Company agreed to issue 137,593 shares of common stock to three individuals for compensation and interest for loan balances in Banjo Australia. The shares were valued at $14,878 or approximately $0.11 per share.
On December 1, 2014, the Company agreed to convert $12,000 of convertible debt for 133,185 shares of common stock at $0.0901 per share to a corporate investor.
|
17
|
Note 11 – INCOME TAX
The following is a reconciliation of the provision for income taxes as the US federal income tax rate to the income taxes reflected in the Statements of Operations and Comprehensive Loss for the three and six months ended December 31, 2014 and 2013, respectively:
|
The following is a reconciliation of income tax expenses: |
||||||||||||||||||||||||
|
Three Months Ended December 31, 2014 and 2013: |
Three months ended | Three months ended | Three months ended | |||||||||||||||||||||
| December 31, | December 31, | December 31, | ||||||||||||||||||||||
|
2014 |
2013 |
2014 |
2013 |
2014 |
2013 |
|||||||||||||||||||
|
Australia |
United States |
Total |
||||||||||||||||||||||
|
Income tax expense - current |
$ | - | $ | - | $ | - | $ | - | $ | - | $ | - | ||||||||||||
|
Income tax expense - deferred |
- | - | - | - | - | - | ||||||||||||||||||
|
Total |
$ | - | $ | - | $ | - | $ | - | $ | - | $ | - | ||||||||||||
|
Six Months Ended December 31, 2014 and 2013: |
Six months ended | Six months ended | Six months ended | |||||||||||||||||||||
| December 31, | December 31, | December 31, | ||||||||||||||||||||||
| 2014 | 2013 | 2014 | 2013 | 2014 | 2013 | |||||||||||||||||||
|
Australia |
United States |
Total |
||||||||||||||||||||||
|
Income tax expense - current |
$ | - | $ | - | $ | - | $ | - | $ | - | $ | - | ||||||||||||
|
Income tax expense - deferred |
- | - | - | - | - | - | ||||||||||||||||||
|
Total |
$ | - | $ | - | $ | - | $ | - | $ | - | $ | - | ||||||||||||
|
Reconciliation of the differences between statutory U.S. Federal income tax rate and effective rate is as follows: |
||||||||||||||||
|
|
||||||||||||||||
| Three months ended | Six months ended | |||||||||||||||
| December 31, | December 31, | |||||||||||||||
| 2014 | 2013 | 2014 | 2013 | |||||||||||||
|
US statutory rates |
34 | % | 34 | % | 34 | % | 34 | % | ||||||||
|
Tax rate difference |
(4 | )% | (4 | )% | (4 | )% | (4 | )% | ||||||||
|
Net operating loss |
(30 | )% | (30 | )% | (30 | )% | (30 | )% | ||||||||
|
Tax expenses at actual rate |
- | % | - | % | - | % | - | % | ||||||||
Note 12 – SUBSEQUENT EVENTS
Management has evaluated events subsequent through February 20, 2015 for transactions and other events that may require adjustment of and/or disclosure in such financial statements.
In January and February 2015 we issued 2,268,956 shares of common stock to repay the convertible loan from May 2014.
On February 11, 2015 we issued 943,396 shares of common stock to repay $20,000 principal on the convertible loan dated July 2014. The remaining principal balance on this note was repaid on February 18, 2015.
|
18
|
Item 2. Management’s Discussion and Analysis of Financial Condition and Results of Operations
The following discussion and analysis of our Company’s financial condition and results of operations should be read in conjunction with our unaudited financial statements and the related notes included elsewhere in this report and with the financial statements and notes thereto for and as at the year ended June 30, 2014 included in the Company’s Annual Report on Form 10-K filed on October 14, 2014. This discussion contains forward-looking statements that involve risks and uncertainties. Actual results and the timing of selected events could differ materially from those anticipated in these forward-looking statements.
Company background
On November 14, 2013, we, then known as Banjo & Matilda, Inc., a Nevada corporation, consummated a Share Exchange Agreement (the “Share Exchange”) with Banjo & Matilda Pty Ltd, a corporation organized under the laws of Australia (“Banjo & Matilda”) and the shareholders of Banjo & Matilda (“B&M Shareholders”). Pursuant to the Exchange Agreement, we acquired 100% of the issued and outstanding capital stock of Banjo & Matilda, making it our wholly-owned subsidiary.
The Share Exchange was accounted for as a recapitalization of Banjo & Matilda effected by a share exchange, where Banjo & Matilda is considered the acquirer for accounting and financial reporting purposes. Consequently, the historical consolidated financial statements of Bano & Matilda, the Australian entity, are now the historical financial statements of Banjo & Matilda, Inc., the reporting company. The net assets and liabilities of Banjo & Matilda, Inc., as of the date of the consummation of the Share Exchange were brought forward at their book value and no goodwill was recognized. Unless the context otherwise requires, references herein to “we,” “us, “our company” and the like, for periods prior to the consummation of the Share Exchange should be understood to be references to Banjo & Matilda, the Australian entity and, from and after the consummation of the Share Exchange to the ongoing reporting company and its subsidiaries.
Founded in 2008 by Sydney designer Belinda Storelli Macpherson and her husband, Ben Macpherson, Banjo & Matilda designs, manufactures, sells and distributes premium contemporary luxury knitwear. Our products principally consist of cashmere products targeted at the premium contemporary knitwear category. Knitwear represents approximately 30% of all apparel sales in the Northern Hemisphere, and there are very few knitwear only brands. By focusing exclusively on this market our company will have a large global sales opportunity.
We do not own any manufacturing facilities and rely upon third party contract manufacturers, mainly in China, to produce our products. Our products are distributed and sold through our website, www.banjoandmatilda.com, augmented by e-media campaigns and advertising; through our own branded store, and through wholesalers to major department stores and independent retailers. Our brand has experienced strong and consistent year-on-year revenue growth.
Our revenues are largely determined by the volume of products we sell and our ability to sell these products timely and at full, as opposed to discounted prices. Our cost of sales is largely determined by the price we pay to have our products manufactured, which, in turn, is determined by the quality of the fabrics used in our products and the intricacies of the manufacturing process. In addition to our cost of sales, our profitability is determined by such corporate and overhead items as marketing, payroll, administration and occupancy expenses, and the cost of financing used to increase our sales.
|
19
|
Results of Operations
The following discussion of the results of operations constitutes management’s view of the factors that affected the financial and operating performance for the three months and six months ended December 31, 2014 and 2013. This discussion should be read in conjunction with the financial statements and notes thereto contained elsewhere in this report. The Company has a June 30 fiscal year end.
The accounts of Banjo & Matilda are maintained, and its consolidated financial statements are expressed, in Australian dollars.Such financial statements were translated into United States Dollars with the Australian Dollar as the functional currency to prepare the consolidated financial statements included in this Report. All assets and liabilities were translated at the exchange rate at the balance sheet date, stockholders’ equity is translated at the historical rates and income statement items are translated at the average exchange rate for the period. Transactions in foreign currencies are initially recorded at the functional currency rate ruling at the date of transaction. Any differences between the initially recorded amount and the settlement amount are recorded as a gain or loss on foreign currency transaction in the consolidated statements of operations. The resulting translation adjustments are reported under other comprehensive income as a component of stockholders’ deficit.
Management summary for the three months ended December 31, 2014
Revenues grew by 144% from the corresponding quarter last year. However the full impact of adding additional wholesale accounts is not yet fully reflected in our sales. While the company has increased revenues, gross profit and gross margins, the company is still recording a loss while it is increasing resources to grow and achieve critical mass and profitability.
December 2014 Quarter Financial Highlights
|
· |
Total Revenue increased 144% to $1,038,418 compared to the same period in the prior year. |
|
· |
The majority of revenue growth has come from wholesale sales. E-commerce sales are also up moderately from the corresponding period last year. |
|
· |
Gross Margin increased from 43% in the corresponding quarter last year to 44%. |
|
· |
Income from operations was $22,878 compared to a loss of $133,994 for the same period prior year. |
|
· |
Financing costs decreased from 11% of sales in the same period prior year to 10%. |
|
· |
Net loss of ($78,632) compared to ($178,749) for the same quarter in the prior year. |
|
20
|
|
Three Months Ended |
Dollar |
Percentage |
||||||||||||||
|
December 31, 2014 |
December 31, 2013 |
Increase (Decreased) |
Increase (Decreased) |
|||||||||||||
|
Revenue |
$ |
1,038,418 |
$ |
426,015 |
$ |
612,403 |
144 |
% |
||||||||
|
Cost of sales |
581,999 |
242,683 |
339,316 |
140 |
% |
|||||||||||
|
Gross profit |
456,419 |
183,332 |
273,087 |
149 |
% |
|||||||||||
|
Bad debt expenses |
38,813 |
- |
38,813 |
- |
% |
|||||||||||
|
Payroll and employee related expenses |
193,226 |
118,120 |
75,106 |
64 |
% |
|||||||||||
|
Administration expense |
84,297 |
30,395 |
53,902 |
177 |
% |
|||||||||||
|
Marketing expense |
41,454 |
39,291 |
2,163 |
6 |
% |
|||||||||||
|
Occupancy expenses |
11,398 |
27,106 |
(15,708 |
) |
(58 |
)% |
||||||||||
|
Depreciation and amortization expense |
3,020 |
3,276 |
(256 |
) |
(8 |
)% |
||||||||||
|
Corporate and public company expense |
61,333 |
99,138 |
(37,805 |
) |
(38 |
)% |
||||||||||
|
433,541 |
317,326 |
116,215 |
37 |
% |
||||||||||||
|
Income (loss) from operations |
22,878 |
(133,994 |
) |
156,872 |
(117 |
)% |
||||||||||
|
Other Income (Expense) |
||||||||||||||||
|
Finance costs |
(101,510 |
) |
(44,755 |
) |
(56,755 |
) |
127 |
% |
||||||||
|
Total Other Expense |
(101,510 |
) |
(44,755 |
) |
(56,755 |
) |
127 |
% |
||||||||
|
Loss before incometax |
(78,632 |
) |
(178,749 |
) |
100,117 |
(56 |
)% |
|||||||||
|
Provision for income taxes |
- |
- |
- |
- |
% |
|||||||||||
|
Net loss |
$ |
(78,632 |
) |
$ |
(178,749 |
) |
100,117 |
(56 |
)% |
|||||||
|
21
|
Revenue:
Revenue continued to increase during the quarter by 144% to $1,038,418 compared to the same period prior year as new wholesale accounts were added and previously secured wholesale accounts impacted revenue. Online and retail sales increased as brand awareness, web site visitors and repeat customer transactions grew.
Wholesale sales increased 173% over the prior year, as a result of the increased number of retailers selling our products. Wholesale retail outlet "Doors" increased 1,017% to 201 from 18 at the end of December 2013. Wholesale sales were 72% of total sales compared to 62% on the prior year.
Online sales through our e-commerce websites increased 21%, however visits increased 264% from the prior year, transaction volume increased 10%, and, Average Order Value (AOV) increased 14%. Online sales were 26% of total sales compared with 23% for the same period prior year. E-commerce visit to sale conversion rates decreased as the company focused on its growing wholesale business, but we have now hired a senior director of e-commerce with significant experience in driving conversion rates and e-commerce marketing to capitalize on the significant growth in visits.
Retail sales increased 418% due to a more integrated e-commerce and physical store program where online orders can be made in store and vice versa, retail sales increased significantly as a significant portion of online sales were recorded through our retail store.
Total DTC sales (Direct to Consumer inclusive of e-commerce and physical stores) increased 69%.
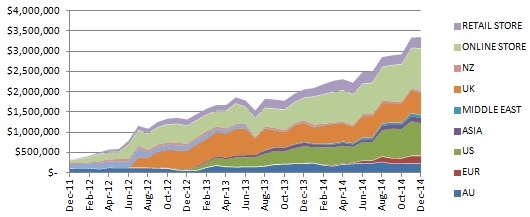
See chart of Last Twelve Months revenue build up (LTM) from December 2011 to December 2014 by country for wholesale, and by online e-commerce and retail sales channels (expressed in AUD before USD conversion).
Cost of Sales, Gross Profit and Gross Margin:
Gross Profit increased from 43% to 44% or $456,419 compared to the same period in the prior year. There were no significant movements in margin or cost of sales from the previous year.
|
22
|
Operating Expenses (Sales, General & Administrative – SG&A):
SG&A consisting of payroll, selling, marketing and design, e-commerce, retail overhead expenses, administrative and occupancy increased 37% over the prior year as the company added resources to support the current and projected growth of the business.
Selling, marketing and design increased to $41,454 from $39,291 in the same period prior year, as we expanded our distribution, increased product development and increased our e-commerce marketing programs.
Payroll and related expenses increased to $193,226 from $118,120 for the same period prior year, as corporate salaries were accrued for our Chief Executive Officer and Chief Creative Officer and the Company continues to add more staff and resources to support each area of the business.
General administrative and operating expenses increased to $84,297 from $30,395 compared to the same period prior year mainly as a result of additional warehousing costs in-line with increased distribution and travel.
Corporate and public company expenses have decreased by $37,805 to $61,333 from the corresponding period last year. This is because the company incurred listing and advisory setup costs in the previous period.
Financing costs:
Financing costs decreased to 10% of revenue compared to 11% for the same period the prior year.
Management summary for the six months ended December 31, 2014
December 2014 Six Months Financial Highlights
|
· |
Total Revenue increased 87% to $1,785,181 compared to the same period in the prior year. |
|
· |
The majority of revenue growth has come from wholesale sales which increased 94% compared to the same period last year. Direct to consumer, retail and E-commerce sales increased 30% from the corresponding period last year. |
|
· |
Gross Margin increased from 38% in the corresponding period last year to 44% in the current year. |
|
· |
Loss from operations was $(27,833) compared to a loss of $(95,617) for the same period prior year. |
|
· |
Financing costs remained constant at about 10% of revenue for each period. |
|
|
|
|
· |
Net loss of ($216,323) compared to ($191,906) for the same period in the prior year. |
|
23
|
|
|
Six Months Ended | Dollar | Percentage | |||||||||||||
|
|
December 31, 2014 |
December 31, 2013 |
Increase (Decreased) | Increase (Decreased) | ||||||||||||
|
|
||||||||||||||||
|
Revenue |
$ | 1,785,181 | $ | 955,229 | $ | 829,952 | 87 | % | ||||||||
|
Cost of sales |
993,732 | 584,976 | 408,756 | 70 | % | |||||||||||
|
Gross profit |
791,449 | 370,253 | 421,196 | 114 | % | |||||||||||
|
|
||||||||||||||||
|
Bad debt expenses |
49,876 | - | 49,876 | - | % | |||||||||||
|
Payroll and employee related expenses |
365,630 | 200,357 | 165,273 | 82 | % | |||||||||||
|
Administration expense |
127,782 | 63,047 | 64,735 | 103 | % | |||||||||||
|
Marketing expense |
147,246 | 60,231 | 87,015 | 144 | % | |||||||||||
|
Occupancy expenses |
24,637 | 36,590 | (11,953 | ) | (33 | )% | ||||||||||
|
Depreciation and amortization expense |
6,289 | 6,507 | (218 | ) | (3 | )% | ||||||||||
|
Corporate and publiccompany expense |
97,872 | 99,138 | (1,266 | ) | (1 | )% | ||||||||||
| 819,332 | 465,870 | 353,462 | 76 | % | ||||||||||||
| Income (loss) from operations | (27,883 | ) | (95,617 | ) | 67,734 | (71 | )% | |||||||||
|
|
||||||||||||||||
|
Other Income (Expense) |
||||||||||||||||
|
Finance costs |
(188,440 | ) | (96,289 | ) | (92,151 | ) | 96 | % | ||||||||
|
Total Other Expense |
(188,440 | ) | (96,289 | ) | (92,151 | ) | 96 | % | ||||||||
|
|
||||||||||||||||
|
Loss before income tax |
(216,323 | ) | (191,906 | ) | (24,417 | ) | 13 | % | ||||||||
|
|
||||||||||||||||
|
Provision for income taxes |
- | - | - | - | % | |||||||||||
|
|
||||||||||||||||
|
Net loss |
$ | (216,323 | ) | $ | (191,906 | ) | (24,417 | ) | 13 | % | ||||||
|
24
|
Revenue:
Revenue for the six months ending December 31 2014 increased 87% to $1,785,181 compared to the same period prior year as the start of the wholesale program began to impact sales, and e-commerce grew based on our increased presence in North American retail outlets and resultant general brand awareness.
Wholesale sales increased 94% over the prior year, as a result of the increased number of retailers selling our products. Wholesale retail outlet "Doors" increased 1,017% to 201 from 18 at the end of December 2013. Wholesale sales were 70% of total sales compared to 61% on the prior year.
Online sales through our e-commerce websites increased 21%, however visits increased 207% from the prior year. The significant increase in traffic, mainly due to the greater brand awareness through the growth of our wholesale distribution program, yet lower visitor to sale e-commerce conversion rates, primarily due to greater focus on our wholesale distribution program, represents a significant revenue opportunity by improving e-commerce conversion rates.
Our retail sales increased 55% through the period, and DTC sales (Direct to Consumer inclusive of e-commerce and physical store) increased 30%.
Cost of Sales, Gross Profit and Gross Margin:
Gross Profit increased from 38% to 44% or $791,449 compared to the same period in the prior year. Increases are due to our ability to lower costs with increased volume.
Operating Expenses (Sales, General & Administrative – SG&A):
SG&A consisting of payroll, selling, marketing and design, e-commerce, retail overhead expenses, administrative and occupancy increased 76% over the prior year as the company added resources to support the current and projected growth of the business, and increased marketing activities.
Payroll and related expenses increased 82% to $365,630 compared to the same period prior year, as corporate salaries were accrued for our Chief Executive Officer and Chief Creative Officer and the Company continues to add more staff and resources to support each area of the business.
General administrative and operating expenses increased 103% to $127,782 compared to the same period prior year mainly as a result of additional warehousing costs in-line with increased distribution and e-commerce sales.
Selling, marketing and design increased 144% to $147,246 compared to the same period prior year, as we expanded our distribution, increased product development and increased our e-commerce marketing programs.
Corporate and public company expenses are in line with prior year as they have decreased 1% to $97,872 compared to the same period last year.
|
25
|
Financing costs:
Financing costs decreased to 10% of revenue compared to 11% for the same period the prior year.
LIQUIDITY and CAPITAL RESOURCES
We will continue to borrow to acquire inventory and fund sales. The rates at which we can acquire funds will directly impact our ability to operate profitably and generate positive cash flow. In addition to relying upon debt, we will seek to raise equity to support our efforts to grow. There is no assurance that debt or equity financing will be available to us on acceptable terms, if at all, and, in all events, the sale of equity or instruments convertible into equity will dilute the interests of our current shareholders.
Cash Used in Operating Activities
During the six months ended December 31, 2014, we used $286,364 of cash in our operating activities. This reflects our net loss from continuing operations of $216,323 and the use of cash to increase our trade receivables and inventory which grew by $296,032 and $151,707 respectively, as well as a decrease in trade payables of $247,716 and $81,265 respectively.
During the six months ended December 31, 2013, we used approximately $695,599 of cash in our operating activities. This reflects our net loss from continuing operations of $191,906 and increases in our trade receivable and inventory of $210,669 and $275,783 respectively.
Cash Used in Investing Activities
During the six months ended December 31, 2014, cash used in investing activities of $2,764 consisted of cash used to purchase fixed assets.
During the six months ended December 31, 2013, cash used in investing activities of $9,485 consisted of cash used to purchase fixed and intangible assets.
Cash Provided by Financing Activities
During the six months ended December 31, 2014, cash provided by financing activities of $243,274 primarily reflects proceeds from issuances of common stock for $44,770, increases in trade financing of $357,094, offset by repayments of convertible loans and related party loans of $38,205 and $120,385 respectively.
During the six months ended December 31, 2013, cash provided by financing activities of $723,211 primarily reflects increases in convertible loans and related party loans of $338,083 and 134,361 respectively, as well as issuances of common stock of $120,000.
|
26
|
Item 3. Quantitative and Qualitative Disclosures about Market Risk
Not applicable as the Company is a smaller reporting company
Item 4. Controls and Procedures
a) Disclosure Controls and Procedures
We maintain "disclosure controls and procedures," as such term is defined in Rules 13a-15(e) and 15d-15(e) under the Securities Exchange Act of 1934 (the "Exchange Act"), that are designed to ensure that information required to be disclosed by us in reports that we file or submit under the Exchange Act is recorded, processed, summarized, and reported within the time periods specified in Securities and Exchange Commission rules and forms, and that such information is accumulated and communicated to our management, including our Chief Executive Officer and Chief Financial Officer, as appropriate, to allow timely decisions regarding required disclosure. In designing and evaluating our disclosure controls and procedures, management recognized that disclosure controls and procedures, no matter how well conceived and operated, can provide only reasonable, not absolute, assurance that the objectives of the disclosure controls and procedures are met. Additionally, in designing disclosure controls and procedures, our management was required to apply its judgment in evaluating the cost-benefit relationship of possible disclosure controls and procedures. The design of any disclosure controls and procedures also is based in part upon certain assumptions about the likelihood of future events, and there can be no assurance that any design will succeed in achieving its stated goals under all potential future conditions.
At the end of the period covered by this report we carried out an evaluation, under the supervision and with the participation of our Chief Executive Officer and Chief Financial Officer, Brendan Macpherson, of the effectiveness of the design and operation of our disclosure controls and procedures. This evaluation included an evaluation of our financial controls. Since our Chief Executive Officer also serves as our Chief Financial Officer and we do not have financial and accounting personnel thoroughly familiar with U.S. GAAP and U.S. securities laws and regulations, we have a deficiency in our financial controls. This deficiency in our financial controls and procedures constitutes a deficiency in our disclosure controls and procedures in that our disclosure controls and procedures were not effective to ensure that information required to be disclosed by us in our periodic reports is recorded, processed, summarized and reported, within the time periods specified for each report and that such information is accumulated and communicated to our management, including our principal executive and principal financial officers, or persons performing similar functions, as appropriate to allow timely decisions regarding required disclosure. This deficiency will not be considered remediated until we hire accounting personnel with the requisite knowledge and experience concerning U.S. GAAP and the U.S. securities laws.
b) Changes in Internal Control over Financial Reporting
There have been no changes in the Company’s internal control over financial reporting during the quarterly period covered by this report that have materially affected, or are reasonably likely to materially affect, the Company’s internal control over financial reporting.
|
27
|
PART II – OTHER INFORMATION
Item 1A. Risk Factors
Our business is subject to numerous risks and uncertainties including but not limited to those discussed in "Risk Factors" in our Annual Report on Form 10-K, filed with the Securities and Exchange Commission on October 14, 2014 which are incorporated by reference into this report.
Item 2. Unregistered Sales of Equity Securities
We have issued shares of common stock to KBM Worldwide, Inc. upon conversion of our convertible promissory notes as follows:
1. Convertible promissory note issued May 16, 2014 in the principal amount of $72,800
| Date | Amount Converted |
Number of Shares Issued | Conversion Price | |||||||||
| 12/1/2014 | $ | 12,000 | 133,185 | 0.0901 | ||||||||
| 01/08/2015 | 15,000 | 236,593 | 0.0634 | |||||||||
| 01/22/2015 | 15,000 | 535,714 | 0.028 | |||||||||
| 1/26/2015 | 15,000 | 570,342 | 0.0263 | |||||||||
| 2/3/2015 | 18,712* | 926,307 | 0.0202 | |||||||||
____________________
*Includes $2,912 accrued interest
There is no remaining balance outstanding under this note.
2. Convertible promissory note issued July 3, 2014 in the principal amount of $72,800
On February 11, 2015, we issued 943,396 shares of common stock upon conversion of $20,000 principal amount of this note at a conversion price of $0.0212. The outstanding principal balance of this note is $52,800 and was satisfied by a cash payment by us in February 2015.
The shares of common stock described above were issued in reliance upon the exemption from registration pursuant to Section 3(a)(9) of the Securities Act.
|
28
|
Item 6. Exhibits
The following exhibits are filed herewith:
|
Exhibit Number |
Document |
|
|
31.1 |
Certifications of the principal executive officer and principal financial officer pursuant to Rule 13a-14(a) or 15d-14(a) under the Securities Exchange Act of 1934, as amended, as adopted pursuant to Section 302 of the Sarbanes-Oxley Act of 2002. |
|
|
32.1 |
Certifications of the principal executive officer and principal financial officer pursuant to 18 U.S.C. Section 1350, as adopted pursuant to Section 906 of the Sarbanes-Oxley Act of 2002. |
|
101.INS |
XBRL Instance Document |
|
|
101.SCH |
XBRL Taxonomy Extension Schema |
|
|
101.CAL |
XBRL Taxonomy Extension Calculation |
|
|
101.DEF |
XBRL Taxonomy Extension Definition |
|
|
101.LAB |
XBRL Taxonomy Extension Label |
|
|
101.PRE |
XBRL Taxonomy Extension Presentation |
|
29
|
SIGNATURES
In accordance with the requirements of the Exchange Act, the Company caused this report to be signed on its behalf by the undersigned, thereunto duly authorized.
|
BANJO & MATILDA, INC. |
|||
|
February 24, 2015 |
By: |
/s/ Brendan Macpherson |
|
|
Brendan Macpherson Chief Executive Officer and Chief Financial Officer (Principal Executive and Financial Officer) |
|||
30