Attached files
| file | filename |
|---|---|
| 8-K - 8-K - Ancestry.com LLC | d878652d8k.htm |
 February 24, 2015
Business Update
Exhibit 99.1 |
| Safe
Harbor Slide 2
This presentation has been prepared by Ancestry.com LLC (the “Company”) for the
exclusive use of the party to whom the Company delivers this presentation (such party, together with its
subsidiaries and affiliates, the “Recipient”). Although the Company believes the
information is accurate in all material respects, the Company does not make any representation or
warranty, either express or implied, as to the accuracy, completeness or reliability of the
information contained in this presentation. Any estimates or projections contained in this
presentation as to events that may occur in the future (including projections of future
financial performance and forward-looking statements) are based upon the reasonable judgment of
the Company.
The presentation may include certain forward-looking statements provided by the Company.
Any such statements and projections reflect various estimates and assumptions by the
Company concerning anticipated results. No representations or warranties are made by the
Company as to the accuracy of any such statements. Whether or not any such forward-looking
statements are in fact achieved will depend upon future events, some of which are not within
the control of the Company. Information concerning factors that could cause events or
results to differ materially from those projected in the forward-looking statements is
contained under the caption “risk factors” in our form 10-k for the year ended December 31, 2014
(the “Annual Report”) and in discussions in other of our securities and exchange
commission filings. Statements contained herein describing documents and agreements are summaries
only and the Annual Report summaries are qualified in their entirety by such documents and
agreements. Nothing contained herein is, or shall be relied upon as, a promise or representation as to the
past or future. The Company expressly disclaims any and all liability relating to or resulting
from the use of this presentation. In addition, the information contained in this presentation
is as of the date hereof, and the Company has no obligation to update such information,
including in the event that such information becomes inaccurate.
This presentation has been prepared solely for informational purposes only. The Recipient
should not construe the contents of this presentation as legal, tax, accounting or investment
advice or a recommendation. The Recipient should consult its own counsel and tax and financial
advisors as to legal and related matters concerning the matters described herein, and, by
accepting this presentation, the Recipient confirms that it is not relying upon the
information contained herein to make any decision. This presentation does not purport to be all-inclusive
or to contain all of the information that the Recipient may require.
We present Non-GAAP Revenues, Adjusted EBITDA, and Free Cash Flow as non-U.S. GAAP
financial measures in various places throughout this presentation. We believe Non-GAAP
Revenues, Adjusted EBITDA, and Free Cash Flow are useful to investors as supplemental measures
to evaluate the overall operating performance of our business. Non-GAAP Revenues,
Adjusted EBITDA, and Free Cash Flow are financial data that are not calculated in accordance
with U.S. GAAP. We prepare Non-GAAP Revenues, Adjusted EBITDA, and Free Cash Flow to
eliminate the impact of items that we do not consider indicative of our core operating
performance. We encourage you to evaluate these adjustments and the reasons we consider them
appropriate, as well as the material limitations on non-U.S. GAAP measures. A
reconciliation of these measures to the applicable GAAP measure can be found in our Annual Report.
Our combined results for the year ended December 31 2012 represent the addition of our
predecessor financials for the period from January 1, 2012 to December 28, 2012 and our
successor financials for the period from December 29, 2012 to December 31, 2012. This
combination does not comply with U.S. GAAP or with the rules for pro forma presentation, but is
presented as we believe the presentation is useful to the reader for comparison with the prior
periods. |
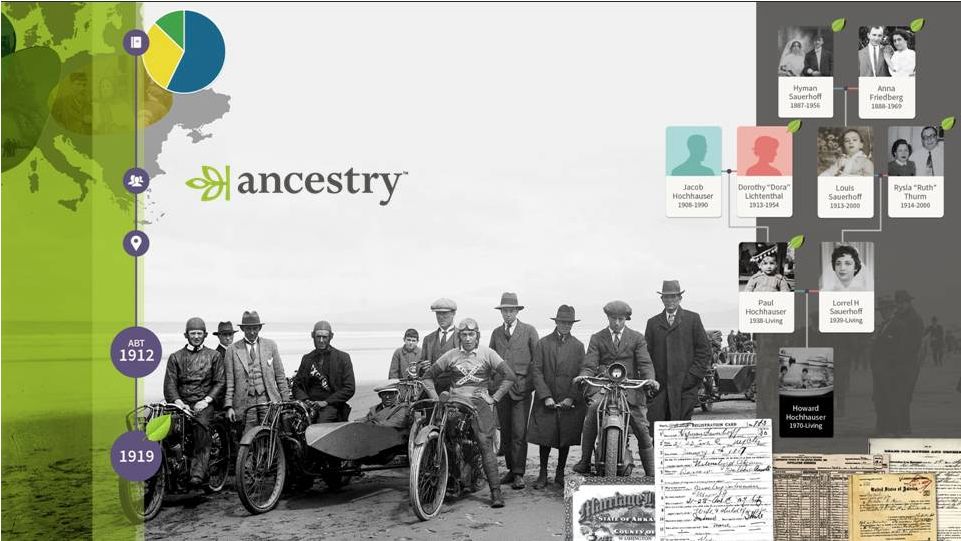
 Ancestry
Refresher •
Our mission is to help everyone
discover, preserve and share their
family history
•
More than 2 million subscribers
•
Clear Category Leader . . . we
created the category
•
Great Business Model
•
Revenue of $620 and $225 million of
Adj. EBITDA before one-time items
•
Clear growth thesis
3 |
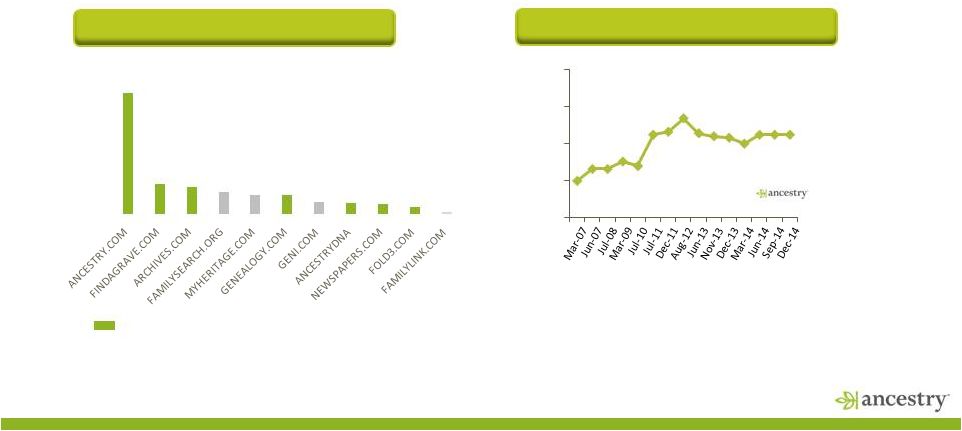 Competitive Position
4
A clear category leader with tremendous brand awareness
US Monthly Unique Visitors
(# of Monthly Unique Visitors in millions)
Ancestry owned websites
Source: Compete US data as of December 2014
Notes: MyHeritage acquired Geni in November 2012
Unaided Brand Awareness
8.2
2.1
1.8
1.5
1.3
1.3
0.8
0.7
0.7
0.4
0.1
0.0
1.0
2.0
3.0
4.0
5.0
6.0
7.0
8.0
9.0
25%
33%
33%
38%
35%
56%
58%
67%
57%
55%
54%
50%
56%
56%
56%
0%
25%
50%
75%
100%
* Other websites had less than 2% unaided brand awareness
Source:
For
March
2007
through
August
2012,
data
from
studies
by
Ipsos
conducted
on
our
behalf. For
June 2013 through December 2014, data from studies by Millward Brown Optimor conducted on our
behalf. Each of Ipsos and Millward Brown Optimor may have used different
methodologies. |
 Poised
for Growth in 2015 •
Improving subscriber growth trends entering 2015
•
Return to Adj. EBITDA growth exiting 2014; revenue
to follow
•
2014 was a year of investment; 2015 is about
execution:
o
Content drives retention, deepens the moat and drives growth
o
Expansion into DNA creates stand alone value, and fuels
profitable subscriber growth
o
International expansion into Germany and Mexico expands
global footprint
o
New product features and tools enhance customer experience
o
Multiple complementary brands/product opportunities with
solid Adj. EBITDA contribution
5 |
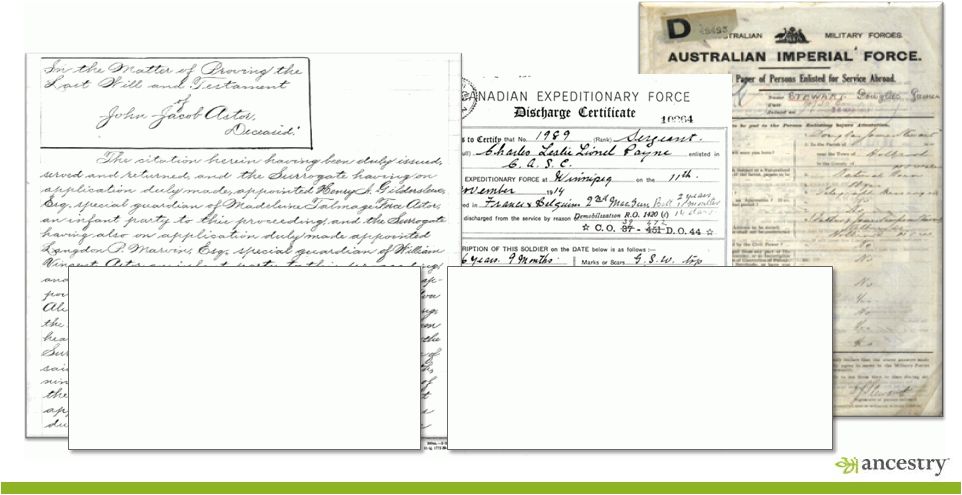 US Probate
Project World War One
AUS
CA
Growth Through New Content
6
•
170M Images, 73M principal records
•
49 of 50 states represented
•
3 year digitization effort ending in 2015
•
Records from early-1800’s to mid-1900’s
•
Developing new product experience to support
multi-image records and guided tour
•
Marketing launch is Labor Day, September 2015
•
375,000 records and 12.3 million images describing
all the servicemen and women serving in the AIF in
World War One
•
640,000 records and 32 million images describing all
the Canadian servicemen serving in World War One |
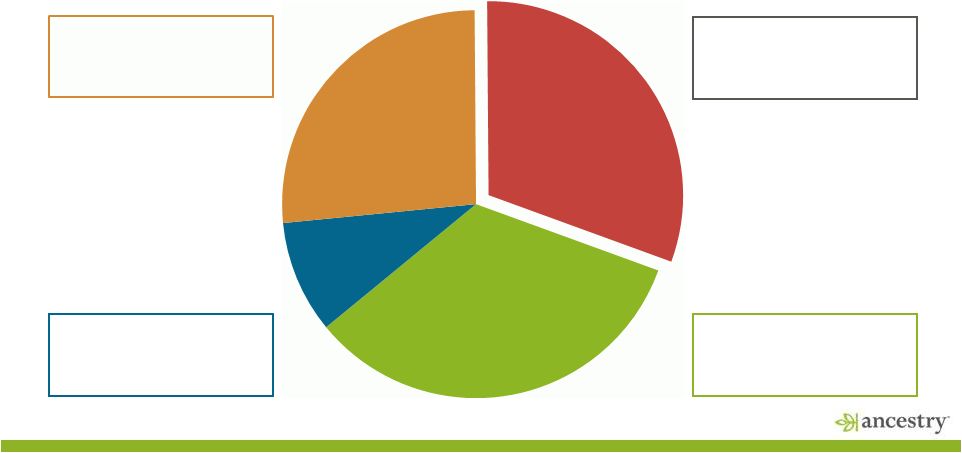 Deep
Content Relationships Contractually
Exclusive
–
exclusive publishing rights from
archive or institution for an
extended period of time
Digitization
Barrier
–
archives
reluctant to digitize again, or
digitized utilizing proprietary
unique technology
User
Generated
–
user
contributed content including
trees, photos, stories and
documents
Commoditized
–
currently
distributed across commercial
competitors or with minimal
barriers to acquire
* Includes key 2015 content releases
7
Contractually
Exclusive
34%
Digitization
Barrier
9%
User
Generated
26%
Commoditized
31% |
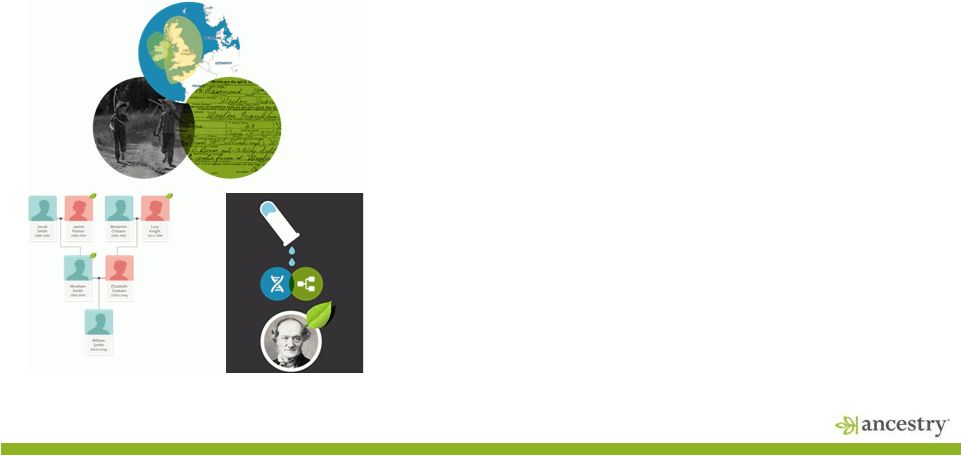
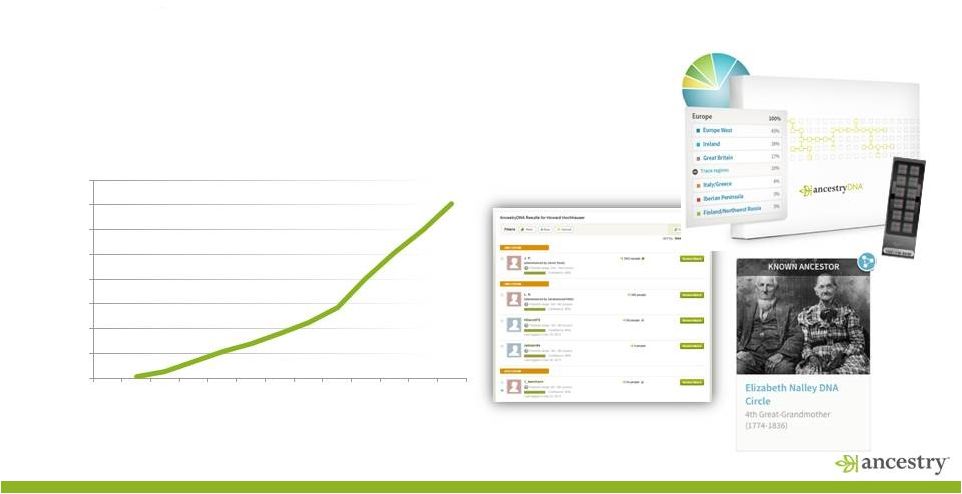 DNA
Expansion Drives Growth 8
•
Market expanding opportunity . . . DNA Touches Everyone
•
10% of kit purchasers become incremental subscribers
•
Database is growing fast, leading to more discoveries
0
100000
200000
300000
400000
500000
600000
700000
800000
Jan-12
Jul-12
Jan-13
Jul-13
Jan-14
Jul-14
Jan-15
DNA Database Sample Size |
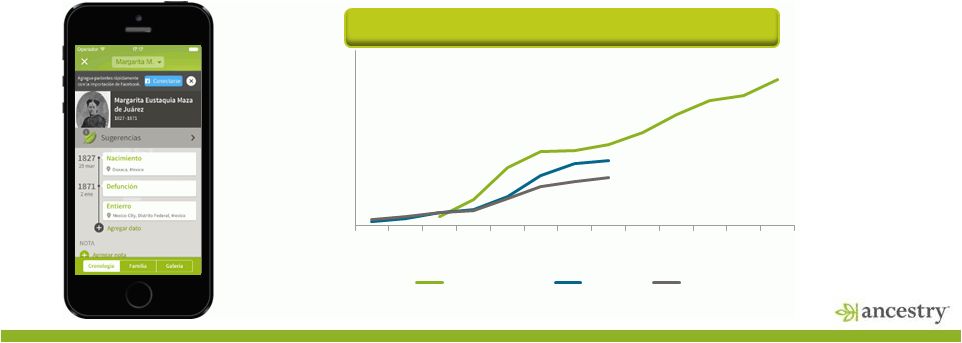 •
31% of Ancestry subscribers located outside the U.S.
•
New market opportunities…starting with Mexico and Germany
•
2014 international revenues surpassed $130 million
International Growth by Geo Since Launch
(1)
(1)
Represents billings data from the respective geographies.
(2)
The UK website launched in 2002. Billings data unavailable for the first two years.
(3)
AU and CA sites were launched in 2006.
(2)
(3)
(3)
We’re a Global Business Today and Expanding
9
Year
1
Year
2
Year
3
Year
4
Year
5
Year
6
Year
7
Year
8
Year
9
Year
10
Year
11
Year
12
Year
13
United Kingdom
Australia
Canada |
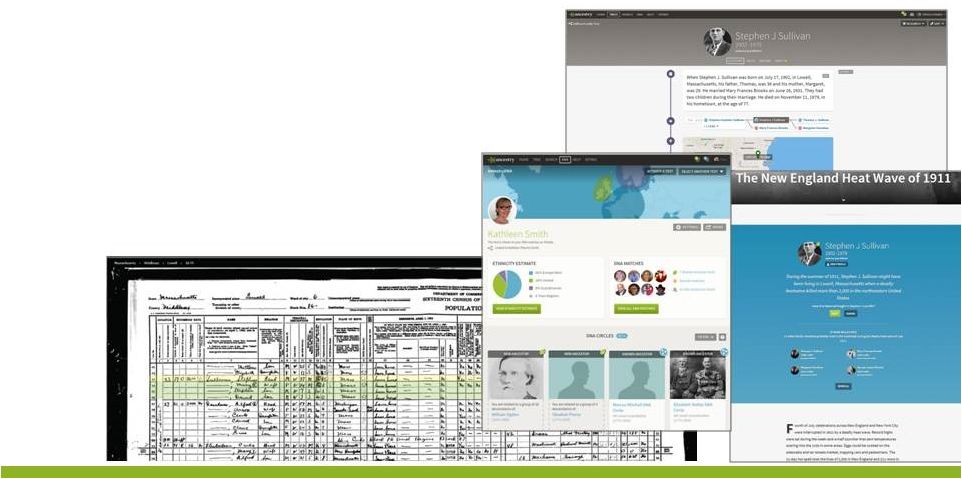 Great
Product Experience Drives Growth •
Significant core product innovation story
•
It’s becoming easier and more accessible
10 |
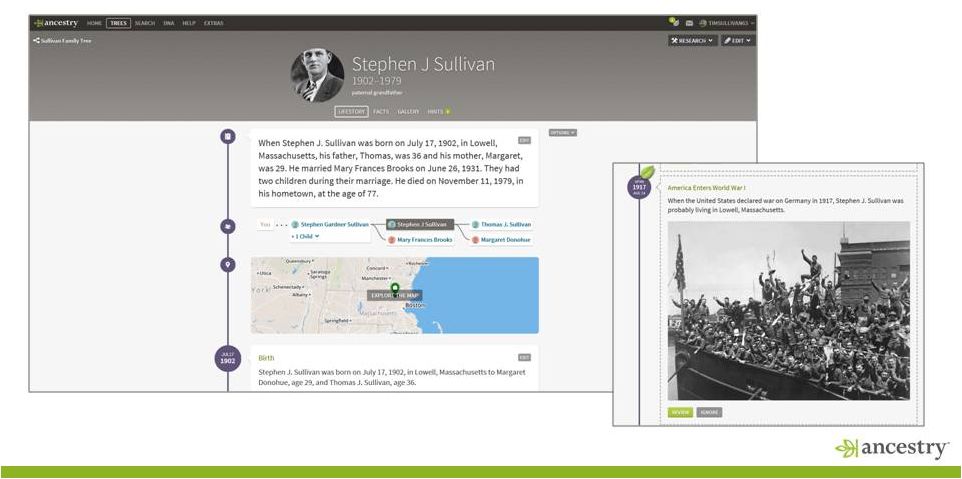 LifeStory
11
Historical Insights |
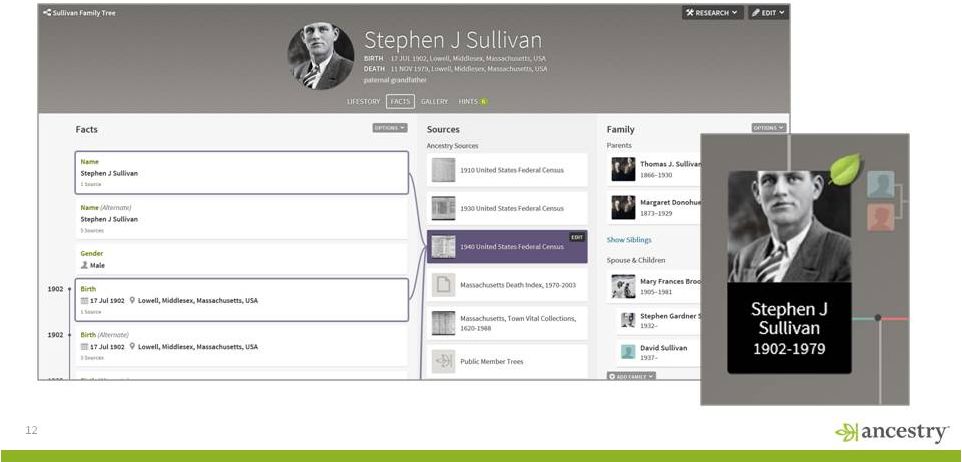 12
Facts and Hints |
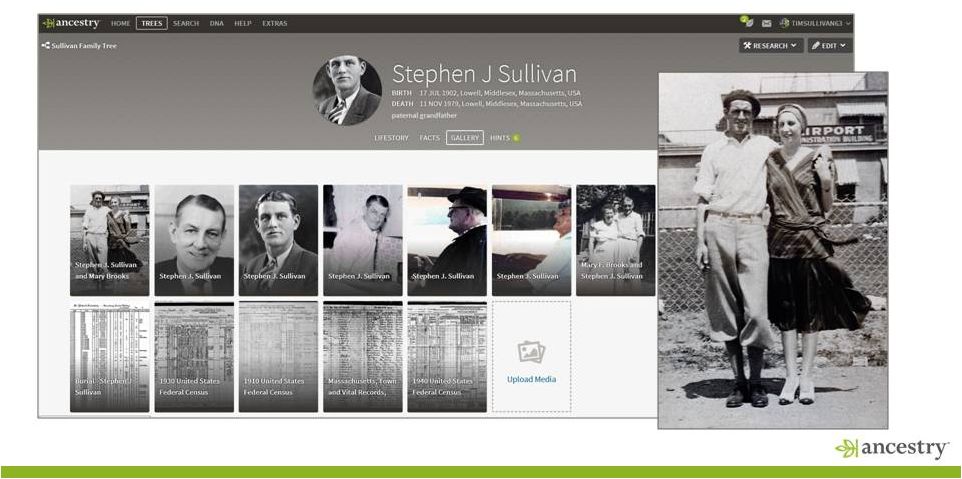 Media
Gallery 13 |
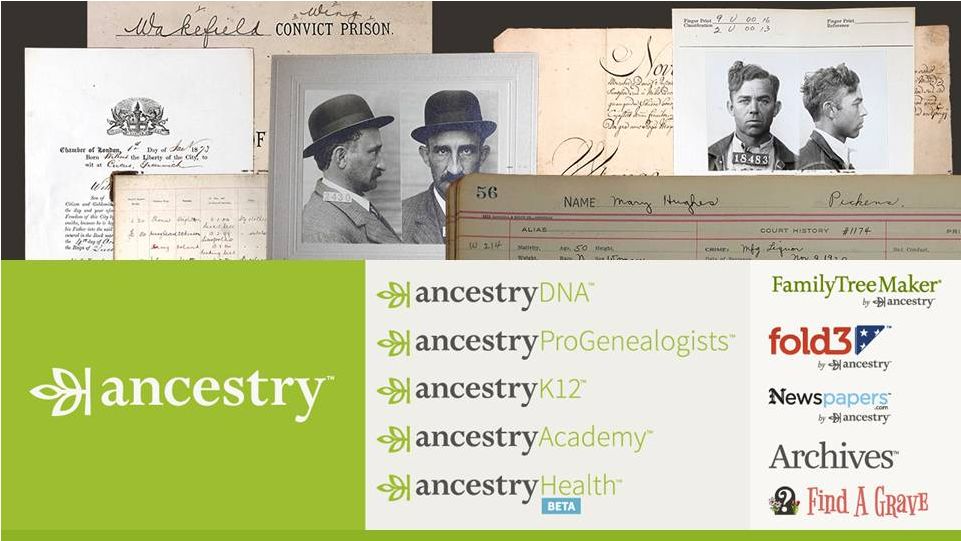
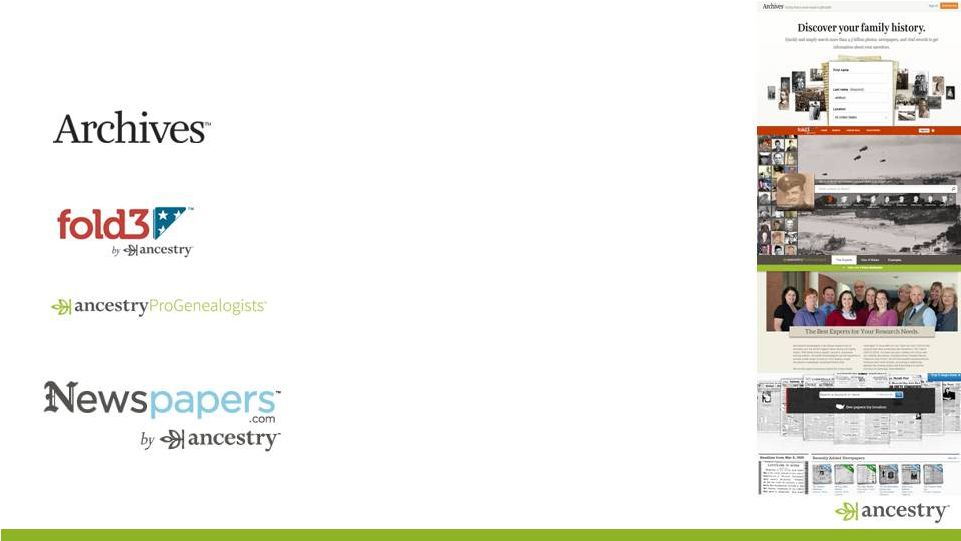 Family
history made simple and affordable with access to more than 4.5 billion digital
records The web’s premier collection of original military records.
The official research arm of Ancestry.
Professional genealogists with extensive research and
genealogical experience.
Find historical newspapers from the 1700s–2000s across
the United States and beyond.
14
Brand Family Complements Growth |
 Financial Overview
15 |
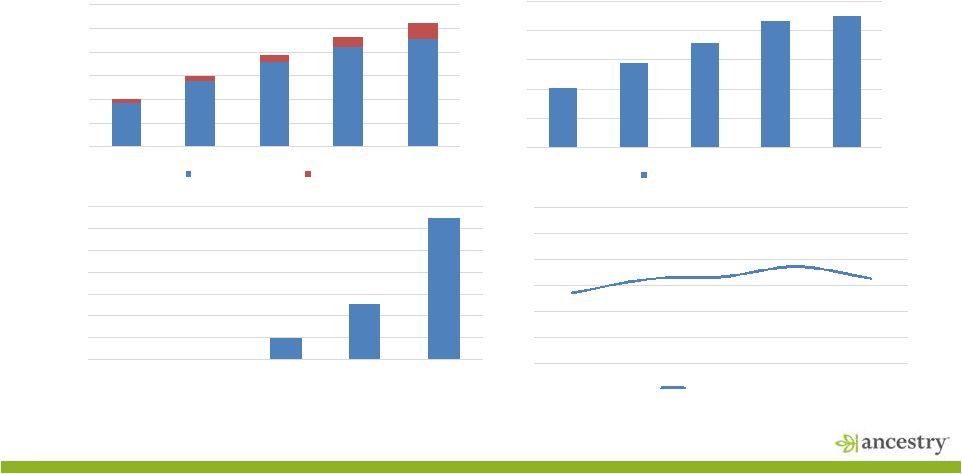 Key
Performance Metrics – 5 Year Trend
16
$100
$200
$300
$400
$500
$600
$700
2010
2011
2012
2013
2014
Non-GAAP Revenue ($MMs)
Subscription
Product
0
100
200
300
400
500
600
700
2010
2011
2012
2013
2014
DNA Database
0
50
100
150
200
250
2010
2011
2012
2013
2014
Adj EBITDA
Adj EBITDA (exc. 1x items)
20%
25%
30%
35%
40%
45%
50%
2010
2011
2012
2013
2014
Adj EBITDA Margin %
Adj EBITDA margin (exc. 1x items)
(1)
Adjusted EBITDA is defined as net income (loss) plus non-cash adjustments to revenue from
purchase accounting; interest expense, net; other (income) expense; income tax expense (benefit); and
non-cash charges, including depreciation, amortization and stock-based compensation
expense. Adjusted EBITDA for the twelve months ended December 31, 2014 also excludes $10.6 million of
accrued interest to be paid on restricted cash held pending resolution of the shareholder
appraisal litigation, professional service fees related to litigation and costs associated with the return-of-
capital distribution paid in February 2014 by our parent company, Holdings LLC. Adjusted EBITDA
for the twelve months ended December 31, 2013 also excludes $5.6 million of professional services
related to litigation, reorganizing our corporate structure, registering our existing Notes
with the SEC, costs associated with the return-of-capital distribution paid in September 2013 by our parent
company, Holdings LLC, and costs related to the settlement of litigation.
|
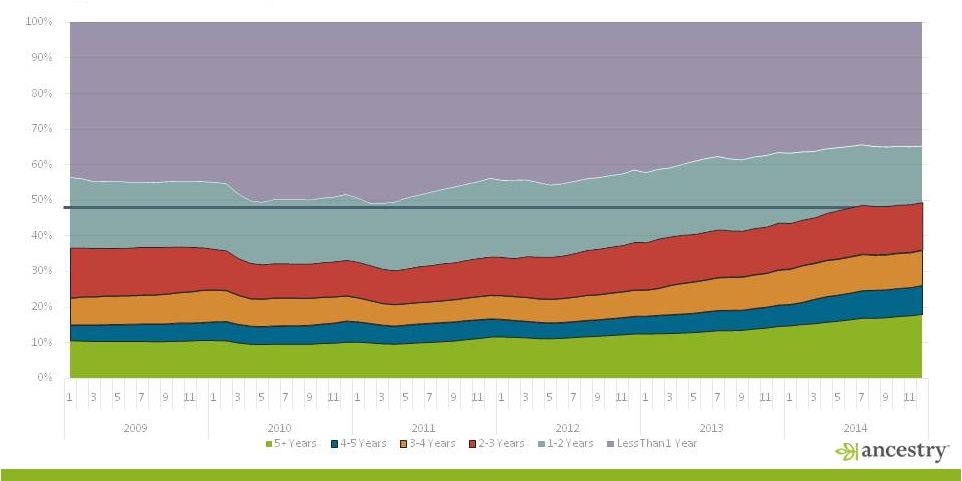 Large
Base of Loyal Subscribers 17 |
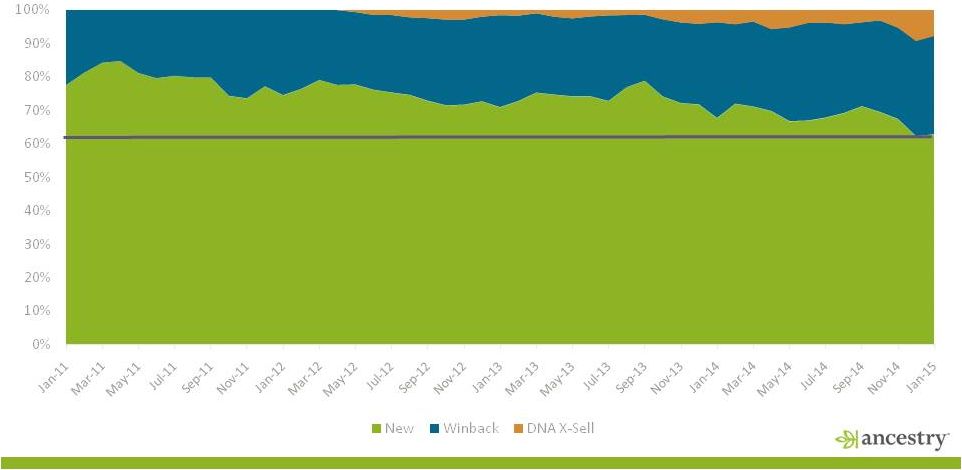 Stable
Subscriber Model Provides Revenue Visibility 18 |
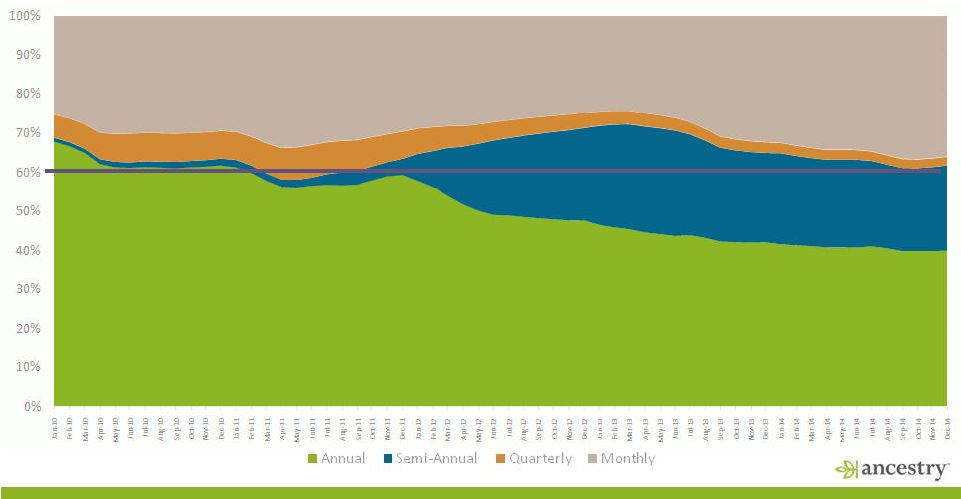 Inventory Duration Mix
19 |
 ($000’s)
2010
2011
2012
2013
2014
Non-GAAP Revenues
(A)
300,931
399,661
487,635
561,506
619,544
Adj. EBITDA
100,974
144,807
178,825
217,176
225,405
Less: Cash paid
(received) for income taxes
11,128
3,683
27,156
(40,601)
1,334
Less: Capitalization of content
database costs
13,874
20,408
23,538
22,239
37,566
Less: Purchases of property
and equipment
12,968
13,895
20,776
26,714
21,821
Pre-Interest
Expense
FCF
(B)
63,004
106,821
107,355
208,824
164,684
% Margin [(B)/(A)]
21%
27%
22%
37%
27%
High free cash flow conversion
20
(1)
Adjusted EBITDA is defined as net income (loss) plus non-cash adjustments to revenue from
purchase accounting; interest expense, net; other (income) expense; income tax expense (benefit); and non-cash charges,
including depreciation, amortization and stock-based compensation expense. Adjusted EBITDA
and therefore free cash flow for the twelve months ended December 31, 2014 also exclude $10.6 million of accrued interest
to be paid on restricted cash held pending resolution of the shareholder appraisal litigation,
professional service fees related to litigation and costs associated with the
return-of-capital distribution paid in February 2014 by our parent company,
Holdings LLC. Adjusted EBITDA and therefore free cash flow for the twelve months ended December 31, 2013 also exclude $5.6 million of professional services related to litigation, reorganizing
our corporate structure, registering our existing Notes with the
SEC, costs associated with the return-of-capital distribution paid in September 2013
by our parent company, Holdings LLC, and costs related to the settlement of litigation.
|
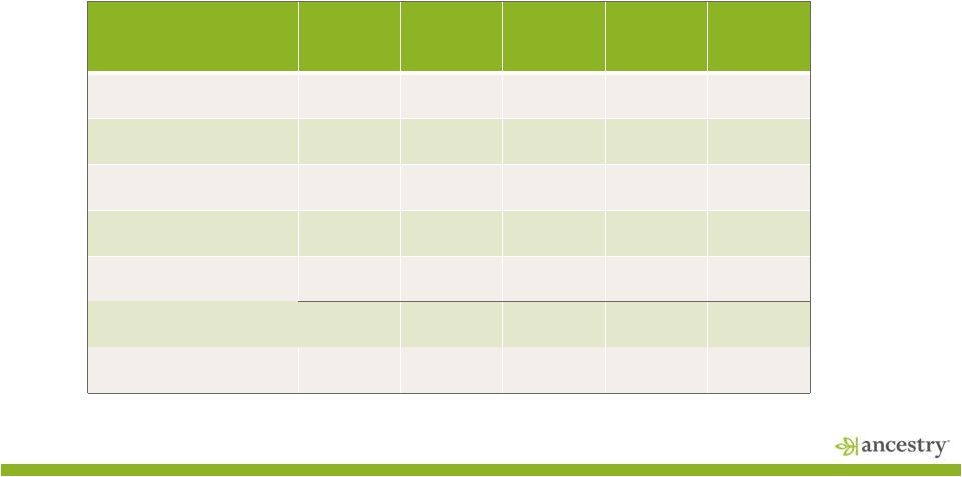
 Debt
Capitalization Overview 21
$MM
PF Acq.
9/30/2012
12/31/2013
12/31/2014
Cash and Cash Equivalents
$25
$87
$108
Revolver ($50MM Capacity)
–
–
–
Senior Secured Term Loan
670
–
–
Senior Secured Term Loan B-1
–
457
453
Senior Secured Term Loan B-2
–
165
132
11% Senior Unsecured OpCo Notes
300
300
300
Total OpCo Debt
$970
$922
$885
Net OpCo Debt
945
835
777
9.63%/10.38% PIK Toggle HoldCo Notes
–
300
400
Total Holdco Debt
$970
$1,222
$1,285
Net Debt
945
1,135
1,177
Pro Forma Credit Ratios
Senior
Secured
Debt
/
Adj.
EBITDA
3.9x
2.9x
2.6x
Total OpCo Debt / Adj. EBITDA
5.6x
4.2x
3.9x
Net OpCo Debt / Adj. EBITDA
5.5x
3.8x
3.5x
Total HoldCo Debt / Adj. EBITDA
5.6x
5.6x
5.7x
Net Holdco Debt / Adj. EBITDA
5.5x
5.2x
5.2x
LTM Adjusted EBITDA
(1)
$173
$217
$225
(1)
Adjusted EBITDA is defined as net income (loss) plus non-cash adjustments to revenue from
purchase accounting; interest expense, net; other (income) expense; income tax expense (benefit); and
non-cash charges, including depreciation, amortization and stock-based compensation
expense. Adjusted EBITDA for the twelve months ended December 31, 2014 also excludes $10.6 million of
accrued interest to be paid on restricted cash held pending resolution of the shareholder
appraisal litigation, professional service fees related to litigation and costs associated with the return-of-
capital distribution paid in February 2014 by our parent company, Holdings LLC. Adjusted
EBITDA for the twelve months ended December 31, 2013 also excludes $5.6 million of professional services
related to litigation, reorganizing our corporate structure, registering our existing Notes
with the SEC, costs associated with the return-of-capital distribution paid in September 2013 by our parent
company, Holdings LLC, and costs related to the settlement of litigation. |
 |