Attached files
| file | filename |
|---|---|
| EX-95 - MINE SAFETY DISCLOSURES - STILLWATER MINING CO /DE/ | swc-12x31x14x10xkex95.htm |
| EX-21.1 - LIST OF SUBSIDIARIES - STILLWATER MINING CO /DE/ | swc-12x31x14x10xkex211.htm |
| EX-32.1 - SECTION 1350 CERTIFICATION - STILLWATER MINING CO /DE/ | swc-12x31x14x10xkex321.htm |
| EX-31.2 - CERTIFICATION OF CFO, PURSUANT TO SECTION 302 OF THE SARBANES OXLEY ACT OF 2002 - STILLWATER MINING CO /DE/ | swc-12x31x14x10xkex312.htm |
| EX-32.2 - SECTION 1350 CERTIFICATION - STILLWATER MINING CO /DE/ | swc-12x31x14x10xkex322.htm |
| EX-31.1 - CERTIFICATION OF CEO, PURSUANT TO SECTION 302 OF THE SARBANES OXLEY ACT OF 2002 - STILLWATER MINING CO /DE/ | swc-12x31x14x10xkex311.htm |
| EX-23.2 - CONSENT OF BEHRE DOLBEAR & COMPANY, INC. - STILLWATER MINING CO /DE/ | swc-12x31x2014x10xkex232.htm |
| EXCEL - IDEA: XBRL DOCUMENT - STILLWATER MINING CO /DE/ | Financial_Report.xls |
| EX-23.1 - CONSENT OF KPMG LLP, INDEPENDENT REGISTERED PUBLIC ACCOUNTING FIRM - STILLWATER MINING CO /DE/ | swc-12x31x14x10xkex231.htm |
UNITED STATES
SECURITIES AND EXCHANGE COMMISSION
Washington, D.C. 20549
FORM 10-K
ý ANNUAL REPORT PURSUANT TO SECTION 13 OR 15(d) OF THE SECURITIES EXCHANGE ACT OF 1934 FOR THE FISCAL YEAR ENDED DECEMBER 31, 2014.
or
¨ TRANSITION REPORT PURSUANT TO SECTION 13 OR 15(d) OF THE SECURITIES EXCHANGE ACT OF 1934 FOR THE TRANSITION PERIOD FROM ________ TO ________
Commission File Number 1-13053
STILLWATER MINING COMPANY
(Exact name of registrant as specified in its charter)
Delaware | 81-0480654 | |
(State or other jurisdiction of incorporation or organization) | (I.R.S. Employer Identification No.) | |
1321 Discovery Drive, Billings, Montana 59102
(Address of principal executive offices and zip code)
(Registrant’s telephone number, including area code) (406) 373-8700
Securities registered pursuant to Section 12(b) of the Act:
Title of each class | Name of each exchange on which registered | |
Common Stock, $0.01 par value | The New York Stock Exchange | |
Securities registered pursuant to Section 12(g) of the Act: None
Indicate by check mark if the registrant is a well-known seasoned issuer, as defined in Rule 405 of the Securities Act. ý YES ¨ NO
Indicate by check mark if the registrant is not required to file reports pursuant to Section 13 or Section 15(d) of the Act. ¨ YES ý NO
Indicate by check mark whether the registrant (1) has filed all reports required to be filed by Section 13 or 15(d) of the Securities Exchange Act of 1934 during the preceding 12 months (or for such shorter period that the registrant was required to file such reports), and (2) has been subject to such filing requirements for the past 90 days. ý YES ¨ NO
Indicate by check mark whether the registrant has submitted electronically and posted on its corporate Web site, if any, every Interactive Data File required to be submitted and posted pursuant to Rule 405 of Regulation S-T (§232.405 of this chapter) during the preceding 12 months (or for such shorter period that the registrant was required to submit and post such files). ý YES ¨ NO
Indicate by check mark if disclosure of delinquent filers pursuant to Item 405 of Regulation S-K is not contained herein, and will not be contained, to the best of registrant’s knowledge, in definitive proxy or information statements incorporated by reference in Part III of this Form 10-K or any amendment to this Form 10-K. ¨
Indicate by check mark whether the registrant is a large accelerated filer, an accelerated filer, a non-accelerated filer, or a smaller reporting company. See the definitions of “large accelerated filer,” “accelerated filer” and “smaller reporting company” in Rule 12b-2 of the Exchange Act. (Check one):
Large Accelerated Filer ý | Accelerated File ¨ | Non-Accelerated Filer ¨ | Smaller reporting company ¨ | |||
Indicate by check mark whether the registrant is a shell company (as defined in Exchange Act Rule 12b-2). ¨ YES ý NO
At June 30, 2014, the aggregate market value of the registrant's voting and non-voting common equity held by non-affiliates of the registrant (treating all executive officers and directors of the registrant and holders of 10% or more of the common shares outstanding, for this purpose, as if they may be affiliates of the registrant) was approximately $1.8 billion based on the closing sale price as reported on the New York Stock Exchange on such date.
There were 120,518,662 shares of common stock, par value $0.01 per share, outstanding on February 12, 2015.
1
DOCUMENTS INCORPORATED BY REFERENCE
Certain information required in Part III of this Annual Report on Form 10-K is incorporated herein by reference to the Registrant’s Proxy Statement for its 2015 Annual Meeting of Stockholders to be filed within 120 days of December 31, 2014.
2
TABLE OF CONTENTS
GLOSSARY OF SELECTED MINING TERMS | ||
ITEM 1A | ||
ITEM 3 | ||
ITEM 4 | ||
ITEM 5 | ||
ITEM 6 | ||
ITEM 7 | ||
ITEM 7A | ||
ITEM 8 | ||
ITEM 9A | ||
ITEM 10 | ||
ITEM 11 | ||
ITEM 12 | ||
ITEM 13 | ||
ITEM 14 | ||
ITEM 15 | ||
3
GLOSSARY OF SELECTED MINING TERMS
The following is a glossary of selected mining terms used in the United States and Canada and referenced in the Form 10-K that may be technical in nature:
Adit | A horizontal tunnel or drive, open to the surface at one end, which is used as an entrance or access to a mine. | |
Concentrate | A mineral processing product that generally describes the material that is produced after crushing and grinding ore, effecting significant separation of gangue (waste) minerals from the metal and / or metal minerals, and discarding the waste and minor amounts of metal and / or metal minerals. The resulting “concentrate” of metal and/or metal minerals typically has an order of magnitude higher content of metal and / or metal minerals than the beginning ore material. | |
Cut-off grade | The lowest grade of mineralized material that qualifies as ore in a given deposit. The grade above which minerals are considered economically mineable considering the following parameters: estimates over the relevant period of mining costs, ore treatment costs, smelting and refining costs, process and refining recovery rates, royalty expenses, by-product credits, general and administrative costs and PGM prices. | |
Dilution | An estimate of the percentage of waste or low-grade mineralized rock which is included with the ore as part of normal mining practices in extracting an ore body. | |
Developed state | The portion of proven and probable ore reserves that are fully accessible and ready to mine at any point in time. | |
ETF | An exchange- traded fund is a security that tracks an underlying index, commodity or basket of assets like an index fund, but trades continuously like a stock on an exchange. | |
Exploration stage | The earliest stage of mineral commercialization, in which a potential mineral asset is being investigated, explored, defined and evaluated, but for which no decision has yet been reached to actively prepare it for commercial development. | |
Grade | The average metal content, as determined by assay of a volume of ore. For precious metals, grade is normally expressed as troy ounces per ton of ore or as grams per metric tonne of ore. One troy ounce per short ton is equivalent to approximately 34.3 grams per tonne. | |
Mill | A processing plant that produces a concentrate of the valuable minerals or metals contained in an ore. The concentrate must then be treated in some other type of plant, such as a smelter, to effect recovery of the pure metal. Term used interchangeably with concentrator. | |
MSHA | Mine Safety and Health Administration is the U.S. federal regulatory agency charged with overseeing and enforcing regulations pertaining to the safety and health of workers in the nation's mines. The Company's mining properties fall under MSHA jurisdiction. | |
Mineral deposit | Geologic term measuring an aggregate of a mineral or metal in an unusually high concentration. The term deposit does not distinguish whether the mineral can be extracted economically. | |
Mineralization | The concentration of metals and their compounds in rocks, and the processes involved therein. | |
Mineralized material | A mineralized body which has been delineated by appropriately spaced drilling and / or sampling to support a general estimate of available tonnage and average grade of metals. Such a deposit does not qualify as a reserve until a comprehensive evaluation based upon unit cost, grade, recoveries, and other material factors conclude legal and economic feasibility. | |
OSHA | Occupational Safety and Health Administration is the U.S. federal regulatory agency charged with overseeing and enforcing regulations pertaining to workplace health and safety. The Company's processing facilities in Columbus, Montana fall under OSHA jurisdiction. | |
Ore | That part of a mineral deposit which could be economically and legally extracted or produced at the time of reserve determination. | |
PGM | The platinum group metals collectively and in any combination of palladium, platinum, rhodium, ruthenium, osmium, and iridium. Reference to PGM grades for the Company’s mine operations include measured quantities of palladium and platinum only. References to PGM grades associated with recycle materials typically include palladium, platinum and rhodium. | |
PGM-rich matte | Matte is an intermediate product of smelting, an impure metallic sulfide mixture made by melting sulfide ore concentrates. PGM-rich matte is a matte with an elevated level of platinum group metals. | |
4
Probable reserves | Reserves for which quantity and grade and / or quality are computed from information similar to that used for proven reserves, but the sites for inspection, sampling, and measurement are farther apart or are otherwise less adequately spaced. The degree of assurance, although lower than that for proven reserves, is high enough to assume continuity between points of observation. | |
Proven reserves | Reserves for which (a) quantity is computed from dimensions revealed in outcrops, trenches, workings or drill holes; grade and / or quality are computed from the results of detailed sampling; and (b) the sites for inspection, sampling and measurement are spaced so closely and the geologic character is so well defined that size, shape, depth and mineral content of reserves are well established. | |
Recovery | The percentage of contained metal actually extracted from ore in the course of processing such ore. | |
Reef | A layer precipitated within the Stillwater Layered Igneous Complex enriched in platinum group metal-bearing minerals, chalcopyrite, pyrrhotite, pentlandite, and other sulfide materials. The J-M Reef, which the Company mines, occurs at a regular stratigraphic position within the Stillwater Complex. Note: this use of “reef” is uncommon and originated in South Africa where it is used to describe the PGM-bearing Merensky, Upper Group 2, and other similar layers in the Bushveld Complex. | |
Refining | The final stage of metal production in which residual impurities are removed from the metal. | |
Reserves | That part of a mineral deposit which could be economically and legally extracted or produced at the time of the reserve determination. | |
Sill | With respect to a mine opening, the base or floor of the excavated area (stope); With respect to intrusive rock, a tabular intrusive unit that is conformable with surrounding rock layers. | |
Stope | A localized area of underground excavation from which ore is extracted. | |
Tailings | The portion of the mined material that remains after the valuable minerals have been extracted. | |
TBRC | A “top-blown rotary converter,” a rotating furnace vessel which processes PGM-rich matte received from the smelter furnace, removing iron from the molten material by injecting a stream of oxygen. This process converts iron sulfides into an iron oxide slag which floats to the surface for separation. | |
CAUTIONARY INFORMATION REGARDING FORWARD-LOOKING STATEMENTS
Some statements contained in this report are forward-looking statements within the meaning of Section 27A of the Securities Act of 1933, as amended (Securities Act), and Section 21E of the Securities Exchange Act of 1934, as amended (Exchange Act), and, therefore, involve uncertainties or risks that could cause actual results to differ materially from management's expectations. These statements may contain words such as “believes,” “anticipates,” “plans,” “expects,” “intends,” “estimates,” “predicts,” “should,” “will,” “may” or similar expressions. Such statements also include, but are not limited to, comments regarding growing profitability; controlling costs; improving the efficiency of our operations; strengthening our financial and operating performance; managing our business through volatile metal prices; estimated 2015 production, cash costs per mined ounce, AISC, general and administrative costs, exploration expense and capital expenditures; and the usefulness of non-GAAP financial measures. The forward-looking statements in this report are based on assumptions and analyses made by the Company in light of its experience and the Company's perception of historical trends, current conditions, expected future developments, and other factors that the Company believes are appropriate under the circumstances. These statements are not guarantees of the Company’s future performance and are subject to risks, uncertainties and other important factors that could cause its actual performance or achievements to differ materially from those expressed or implied by these forward-looking statements. Additional information regarding factors that could cause results to differ materially from management's expectations is described in "Item 1A - Risk Factors" in this Form 10-K.
The Company intends that the forward-looking statements contained herein be subject to the above-mentioned statutory safe harbors. Investors are cautioned that forward-looking statements are not guarantees of future performance and that actual results of performance may be materially different from those expressed or implied in the forward looking statements. Investors should not to rely on forward-looking statements. The forward-looking statements in this report speak as of the filing date of this report. Although the Company may from time to time voluntarily update its prior forward-looking statements, we disclaim any obligation to update forward-looking statements except as required by securities laws.
5
PART I
ITEMS 1 AND 2
BUSINESS AND PROPERTIES
SUMMARY OF THE COMPANY
Stillwater Mining Company (the "Company") is a Delaware corporation, incorporated in 1992 and headquartered in Billings, Montana, and is listed on the New York Stock Exchange under the symbol "SWC." The Company is engaged in the development, extraction, processing, smelting and refining of palladium, platinum and associated metals (platinum group metals or PGMs) produced by mining a geological formation in south-central Montana known as the J-M Reef and recycling spent catalytic converters and other industrial sources. The Company is also engaged in expanding its mining development along the J-M Reef, and holds significant exploration-stage properties at the Marathon PGM copper property adjacent to Lake Superior in northern Ontario, Canada ("Marathon") and at the Altar copper-gold property in San Juan province, Argentina.
The J-M Reef is the only actively mined primary source of PGMs within the United States and one of the more significant resources outside South Africa and the Russian Federation. The J-M Reef is a narrow but extensive mineralized zone containing PGMs, which has been traced over a strike length of approximately 28 miles. In addition to palladium and platinum, the Company's operations produce associated by-product metals including nickel, copper and minor amounts of gold, silver and rhodium.
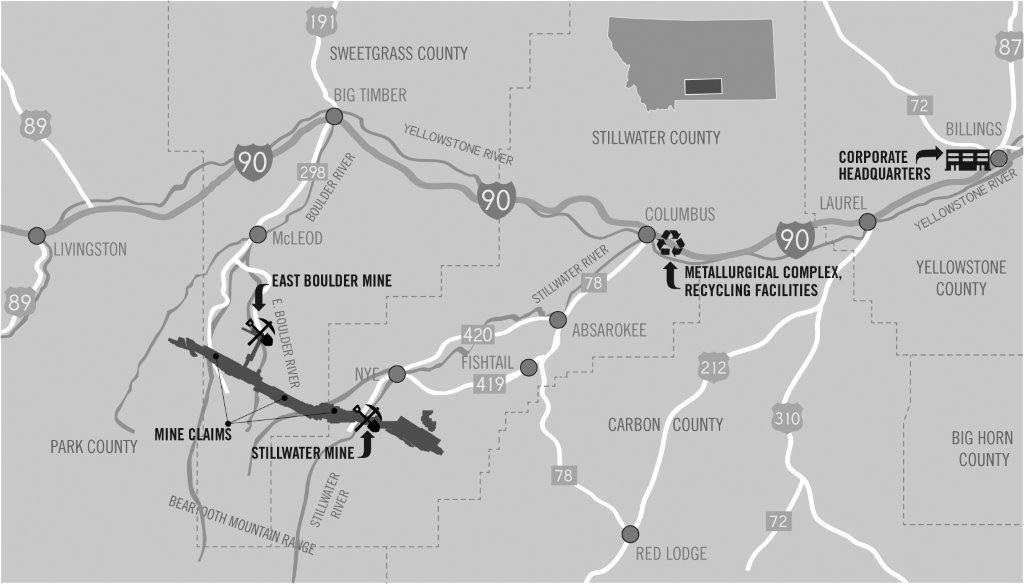
The Company conducts mining operations at its Stillwater Mine near Nye, Montana and at its East Boulder Mine south of Big Timber, Montana. Ore extraction at both mines takes place within the J-M Reef. A mill at each of the mining operations upgrades the mined production into a concentrated form. The Company operates a smelter and base metal refinery in Columbus, Montana which further upgrades the mined concentrates into a PGM-rich filter cake. The filter cake is then shipped to a third-party refiner for final refining before the PGMs are sold to third-parties. The Company is currently developing the Blitz project, which is situated adjacent to its current operations at the Stillwater Mine.
Along with processing mine concentrates, the Company also recycles spent catalyst material acquired from third-parties in its smelter and base metal refinery facilities to recover the contained PGMs, which consist mainly of palladium, platinum and rhodium. The Company currently has catalyst sourcing arrangements with various suppliers who deliver spent catalysts to the Company for processing. The spent catalysts are commingled with the mine concentrates in the smelter and base metal refinery. The Company purchases recycling materials for its own account and also toll processes recycling materials on behalf of others for a fee.
The Company operates five reportable business segments: Mine Production, PGM Recycling, Canadian Properties, South American Properties and All Other. These segments are managed separately based on fundamental differences in their operations and geographic separation. See "Note 10 - Segment Information" to the Company's 2014 consolidated financial statements for more information.
2014 – YEAR IN REVIEW:
The Company’s liquidity strengthened during the year, as cash and cash equivalents plus short-term investments, after the repayment of $30.0 million of debt, increased by $35.5 million to $531.5 million at December 31, 2014. The Company reported consolidated net income attributable to common stockholders of $70.3 million, or $0.56 per diluted share, for the year ended December 31, 2014, compared to consolidated net loss attributable to common stockholders of $270.2 million, or $2.28 per share, for the year ended December 31, 2013. The improvement in net income in 2014 compared to 2013 was mainly due to charges for the $290.4 million ($226.5 million, after-tax) impairment of the Peregrine property in Argentina and the $171.4 million, ($123.6 million, after-tax) impairment of the Marathon properties that the Company recorded during 2013, combined with better cost performance in the Company's Montana operations. The Company’s revenues for 2014, 2013 and 2012 totaled $943.6 million, $1.04 billion and $800.2 million, respectively. Mine Production segment revenues were $536.0 million, an increase of 11.9% from 2013, as a result of increased PGM prices and sales volume, compared to the $478.9 million in 2013, which included $7.1 million of revenues generated from reprocessed internal furnace brick in the third and fourth quarters.
PGM Recycling segment revenues decreased by 28.3% during 2014 to $401.7 million from $560.6 million in 2013, the result of a reduction in total volumes processed and sold during 2014. Recycling revenues in the third quarter of 2013 included incremental revenue of $16.4 million from the sale of approximately 12,000 PGM ounces recovered internally from reprocessed furnace brick. See “Management’s Discussion and Analysis of Financial Condition and Results of Operations – Year Ended December 31, 2014 Compared to Year Ended December 31, 2013” and the Company's 2014 consolidated financial statements, each contained in this report, for more information.
6
The following table sets forth the Company's revenues and ounces sold for the years 2014, 2013 and 2012, respectively:
Year ended December 31, (In thousands) | Revenues | Ounces Sold | |||||||||||||||||||||||||||||||||
Palladium | Platinum | Rhodium | Other (1) | Total | Palladium | Platinum | Rhodium | Other (2) | Total | ||||||||||||||||||||||||||
2014 | |||||||||||||||||||||||||||||||||||
Mine Production | $ | 338,526 | $ | 167,892 | $ | 4,650 | $ | 24,942 | $ | 536,010 | 421 | 121 | 4 | 16 | 562 | ||||||||||||||||||||
PGM Recycling | 173,767 | 191,448 | 31,039 | 5,430 | 401,684 | 221 | 134 | 29 | — | 384 | |||||||||||||||||||||||||
Other (1) | 5,517 | — | 5 | 403 | 5,925 | 6 | — | — | — | 6 | |||||||||||||||||||||||||
Total | $ | 517,810 | $ | 359,340 | $ | 35,694 | $ | 30,775 | $ | 943,619 | 648 | 255 | 33 | 16 | 952 | ||||||||||||||||||||
2013 | |||||||||||||||||||||||||||||||||||
Mine Production | $ | 287,167 | $ | 164,666 | $ | 3,402 | $ | 23,683 | $ | 478,918 | 398 | 111 | 3 | 14 | 526 | ||||||||||||||||||||
PGM Recycling | 218,190 | 292,818 | 47,803 | 1,777 | 560,588 | 306 | 192 | 44 | — | 542 | |||||||||||||||||||||||||
Total | $ | 505,357 | $ | 457,484 | $ | 51,205 | $ | 25,460 | $ | 1,039,506 | 704 | 303 | 47 | 14 | 1,068 | ||||||||||||||||||||
2012 | |||||||||||||||||||||||||||||||||||
Mine Production | $ | 247,847 | $ | 176,937 | $ | 4,877 | $ | 25,765 | $ | 455,426 | 386 | 114 | 4 | 15 | 519 | ||||||||||||||||||||
PGM Recycling | 123,876 | 183,719 | 34,817 | 2,406 | 344,818 | 192 | 119 | 25 | — | 336 | |||||||||||||||||||||||||
Total | $ | 371,723 | $ | 360,656 | $ | 39,694 | $ | 28,171 | $ | 800,244 | 578 | 233 | 29 | 15 | 855 | ||||||||||||||||||||
(1) “Revenues - Other” includes gold, silver, nickel and copper by-product revenues from mine production; revenue from processing recycling materials on a toll basis and ounces acquired periodically in the open market and simultaneously resold to third parties.
(2) “Ounces Sold - Other” column includes gold and silver by-product ounces and recycled ounces sold. Not reflected in the “other” ounce column in the table above are approximately 1.5 million pounds, 1.4 million pounds and 1.1 million pounds of nickel sold in 2014, 2013 and 2012, respectively, and approximately 0.9 million pounds, 0.9 million pounds and 0.7 million pounds of copper sold in 2014, 2013 and 2012, respectively.
The Company's mining operations produced a total of 517,700 ounces of palladium and platinum in 2014, a decrease of 1.2% from the 523,900 ounces produced in 2013. Total consolidated cash costs per ounce, net of by-product and recycling credits, (a non-GAAP financial measure of extraction efficiency further defined in Part II, Item 6 of this Form 10-K) averaged $538 in 2014, compared with $496 per ounce in 2013. Higher total consolidated cash costs in 2014 were a result of higher labor costs, general inflation on materials and supplies, a decrease in mine production and lower recycling credits. Total consolidated cash costs per ounce in 2013 benefited from an unusually high recycling credit, reflecting the value of PGM ounces allocated from reprocessing internal furnace brick. Higher labor costs in 2014 were due to increases in contractual wage and benefit rates, offset in part by the effect of manpower reductions.
Approximately 384,400 ounces of PGMs were extracted and sold from recycling materials purchased (at prices reflecting the value of the contained PGMs) for the Company's own account in 2014, a decrease of 29.1% from the 541,800 ounces sold in 2013. The Company’s combined average realization on recycling revenues (which include sales of palladium, platinum and rhodium) was $1,031 per ounce in 2014, unchanged from 2013. In addition to processing spent catalyst material purchased for its own account, the Company processed and returned 72,800 ounces of PGMs treated on a tolling basis in 2014, up from 65,400 toll ounces in 2013. Recycling volumes fed to the smelter totaled 469,400 ounces of PGMs in 2014, down 23.9% from the 616,700 ounces fed in 2013, driven by the greater availability of recycling materials in the market during 2013 and by volumes attributed to the reprocessed internal furnace brick. Working capital associated with recycling activities (in the form of inventories and advances) was $61.5 million, $76.1 million and $87.8 million at December 31, 2014, 2013 and 2012, respectively. Included in these working capital totals were outstanding cash advances to recycling suppliers for material in transit totaling $7.3 million, $6.9 million and $10.2 million at December 31, 2014, 2013 and 2012, respectively.
During the first half of 2014, the Company made all of its sales of mined PGMs either in the spot market or under mutually agreed short-term (one year or less) supply agreements. On July 1, 2014, the Company executed five-year supply and refining agreements with Johnson Matthey, at competitive market prices. See "Note 3 - Sales” to the Company’s 2014 consolidated financial statements for more information.
7
Capital Spend
(In thousands) | December 31, | |||||||
2014 | 2013 | |||||||
Sustaining capital: | ||||||||
Stillwater Mine | $ | 60,131 | $ | 67,413 | ||||
East Boulder Mine | 19,656 | 15,880 | ||||||
Processing and Other | 4,972 | 5,022 | ||||||
Total sustaining capital | $ | 84,759 | $ | 88,315 | ||||
Project capital | ||||||||
Blitz Project * | $ | 23,209 | $ | 21,195 | ||||
Graham Creek Project * | 2,105 | 8,082 | ||||||
Hertzler Tailings Expansion | 9,382 | 247 | ||||||
Other Projects | 10,313 | 6,515 | ||||||
Total project capital | $ | 45,009 | $ | 36,039 | ||||
Total U.S. capital | $ | 129,768 | $ | 124,354 | ||||
Foreign project capital * | 45 | 14,182 | ||||||
Total capital | $ | 129,813 | $ | 138,536 | ||||
Non-cash and accruals at December 31, 2014 | (10,131 | ) | (9,507 | ) | ||||
Cash capital spend for the period | $ | 119,682 | $ | 129,029 | ||||
* Capital spend for Blitz and Graham Creek in 2014 includes approximately $10.3 million of capitalized interest and capitalized depreciation. Total capitalized interest and capitalized depreciation included in capital spend for Blitz, Graham Creek and foreign projects in 2013 was approximately $10.2 million.
The Company spent $2.8 million on exploration during 2014, of which $2.0 million was spent at the Altar property in Argentina and $0.8 million at the Marathon properties in Canada, primarily for updating the project feasibility study. Exploration expenditures during 2013 totaled $11.2 million, of which $8.0 million was spent on drilling and evaluation at Altar and $3.2 million on the Marathon properties. Exploration spending in 2012 totaled approximately $15.0 million, of which $14.2 million was spent on drilling at the Altar property and $0.8 million on the Marathon properties.
At December 31, 2014, the Company reported balance sheet debt and capital lease obligations totaling $296.2 million. This debt is comprised of (i) $291.1 million (face amount of $396.75 million) of highly discounted 1.75% convertible debentures, first redeemable at the option of the holders on October 15, 2019; (ii) $2.2 million of 1.875% convertible debentures, next redeemable at the option of the holders on March 15, 2018; and (iii) various minor secured obligations totaling $2.9 million with maturities over the next three years. Annual cash interest cost on the Company’s debt obligations is expected to be approximately $7.1 million in 2015. In addition to this balance sheet debt, the Company also has outstanding undrawn letters of credit under its revolving line of credit, mostly in support of long-term reclamation obligations, totaling $18.1 million at December 31, 2014. Interest is charged on these letters of credit and on the unused portion of the revolving credit facility at rates determined based on the percent of the total line that is in use in any period. At the rates prevailing on December 31, 2014, the Company would expect to pay cash interest of approximately $1.0 million on its revolving credit facility during 2015.
8
SAFETY
Mining operations at the Stillwater Mine and at the East Boulder Mine are labor intensive, and involve the use of heavy machinery and drilling and blasting techniques specific to a narrow-vein underground working environment. These operations are inherently dangerous and therefore are at the center of the Company’s extensive workplace safety program. In addition, the Company’s metallurgical complex in Columbus, Montana utilizes smelting and refining processes that require careful attention to safety awareness. To partially mitigate worker exposures in these environments, the Company's safety and health management system focuses on accident prevention through managing risk, continually seeking safer methods of mining and processing, and emphasizing employee awareness and training. Specific areas of focus include detailed workplace examinations; regular hazard recognition training; safety audits that focus on continual improvement and industry best practices; consistent adherence to safety standards; accident and incident investigations; near miss reporting and analysis; and use of focus teams drawn from the mining workforce. These proactive focus teams have succeeded in identifying and resolving many safety related challenges. In recent years, the Company has enhanced its successful "G.E.T. (Guide, Educate and Train) Safe" program, incorporating principles from CORESafety, a U.S. mining industry safety initiative endorsed in April 2012 by the National Mining Association's executive Board.
Under the CORESafety system, the Company and its mining industry peers are working together toward a collective five-year goal of eliminating fatal accidents and sharply reducing the frequency and severity of on-the-job injuries within the mining industry. The CORESafety system is based on specific principles and programs, including creating an industry-wide safety forum to share knowledge of safety issues, providing tools to continuously improve safety and health performance, and establishing industry peer groups to share best practices. The CORESafety system is comprised of a series of 20 modules, which can be prioritized to address specific gaps in safety and health performance based on the Company's own "gap analysis." To date, the Company has integrated sixteen of these modules into its existing G.E.T. Safe program and plans to complete the integration effort in 2015. The Company views implementing CORESafety as a significant opportunity to enhance the already successful G.E.T Safe program and continue the pursuit of safety excellence.
For the year ended December 31, 2014, neither of the Company’s mines received any written notices from MSHA of (i) a flagrant violation under section 110(b)(2) of the Mine Act; (ii) a pattern of violations of mandatory health or safety standards that are of such nature as could have significantly and substantially contributed to the cause and effect of other mine health or safety hazards under section 104(e) of the Mine Act; or (iii) the potential to have such a pattern. In addition, the Company's metallurgical complex did not receive any OSHA violations in 2014. The metallurgical complex has been recognized repeatedly by the Montana Department of Labor and by OSHA as a leader in workplace safety.
At year-end 2014 the Company's overall reportable incidence rate of 3.3 (measured as reportable incidents per 200,000 man hours worked) was essentially unchanged from the Company's 2013 incidence rate. The 2014 results do however represent a 73.4% reduction in incidence rates for Company employees and contractors since the inception of the “G.E.T. Safe” Safety and Health Management Systems in 2001.
2015 – LOOKING FORWARD
Pricing Background and Outlook
Since the beginning of 2013, the price of platinum has closely tracked the price of gold, generally trending downward in response to a strengthening U.S. dollar and the end of bond purchases under the Federal Reserve's quantitative easing program. After declining during the first half of 2013, platinum prices did strengthen modestly in mid to late 2013 and during the first half of 2014, the Company believes as a result of the effect of labor disruptions at the major South African PGM mines. Following resolution of these labor issues, however, the platinum price declined sharply in the second half of 2014 and ended the year quoted in the London market at $1,210 per ounce, an 11.1% decline from previous year-end, a price level last previously seen in mid-2009.
The price of palladium, while not immune to currency movements, held up relatively well during 2013 and 2014. Palladium appears not to be linked as closely with gold as is platinum, which may be explained by the key role industrial demand plays in the palladium market. The large and growing production deficit relative to total industrial and automotive demand for palladium is generally met out of above-ground inventories, and this has tended to keep upward pressure on the palladium price. Uncertainty among investors as to the implications of economic sanctions against Russia may also have benefited the palladium price, as Russia is the largest producer of the metal. The palladium price did decline, along with platinum and gold, as the U.S. dollar began to strengthen in September of 2014, but palladium ended 2014 quoted in the London market at $798 per ounce, up 12.2% for the year.
9
The outlook for PGM pricing in 2015 is mixed, reflecting disparate economic forces at work in the world. Worldwide automotive demand looks fairly encouraging, with recovery in the European auto markets apparently continuing (although off a very low base by historical standards) and demand in both North America and China still growing. As automotive demand is the largest use for palladium, the Company expects that demand for palladium will be healthy in 2015. On the supply side, given major labor disruptions in South Africa and barring any expansion of Russian economic sanctions affecting the PGM markets, 2015 could be a relatively quiet year in comparison to 2014. The other uncertainty, as always, is the direction of the world economy as 2015 progresses - if world economic conditions deteriorate, demand for PGMs could falter. See “Risk Factors - Volatility in the price of the metals sold by the Company, and changes in the supply and demand of these metals could reduce profitability" for more information.
The Company's financial performance is closely linked to the price of palladium and, to a lesser extent, platinum. The Company's earnings and cash flows are sensitive to changes in PGM prices - based on 2014 revenues and costs, a 1% (or approximately $9 per ounce) change in the Company's average combined realized price for palladium and platinum would result in approximately a 5.6% change to before-tax net income and a 2.6% change to cash flow from operations of approximately $5 million.
While changes in the PGM market prices directly affect the Company's profitability, another important competitive consideration for the Company is the relative level of and relationship between the price of palladium and platinum. The Company’s mines generally produce approximately 3.4 times as much saleable palladium as platinum, while its South African competitors in many cases produce nearly twice as much platinum as palladium. Consequently, the Company benefits competitively relative to these producers whenever the spread between the palladium price and the platinum price narrows. From 2003 through to the first half of 2010, the price of palladium averaged 20% - 25% of the price of platinum. However, the gap has narrowed to approximately 60%, a shift that has benefited the Company significantly. It is difficult to predict how this relationship might evolve during 2015, but the sharp decline in oil prices in early 2015 could benefit automotive demand for PGMs, both because lower oil prices may make larger vehicles (with higher PGM loadings per vehicle) more attractive, and because consumers may have more discretionary income available for major purchases.
One other key element of PGM markets in 2015 will be the relationship between various key currencies. Virtually all PGM sales transactions worldwide (with the possible exception of retail sales of platinum jewelry) are denominated in U.S. dollars. However, mining costs typically are incurred mostly in the local currencies of the country in which the mine is located. Weakening of the South African rand and Russian rouble relative to the U.S. dollar has served to increase the competitiveness of the South African and Russian PGM producers, as their costs in U.S. dollar terms have declined (or their revenues in local currency terms have increased, depending on the perspective).
Operational and Development Outlook
Capital spending in 2015 anticipates customary spending for equipment replacement and mine development, plus ongoing development spending (including capitalized interest and capitalized depreciation) for the Blitz development area adjacent to the Stillwater Mine. The Company expects to undertake a limited exploration program at Marathon and will maintain baseline environmental monitoring activities at Marathon and Altar. However, that work will be expensed as incurred and is included in capital spending.
As noted, the Company is continuing its development of the Blitz mine expansion infrastructure. Blitz is adjacent to the existing Stillwater Mine operations and it will ultimately extend new underground development approximately 23,000 feet to the east of the current mine works on two levels. A new portal and decline from surface is expected to be permitted and installed approximately four miles to the east of the existing Stillwater Mine surface facilities, intersecting the two new drifts and providing ventilation and emergency egress for the Blitz area. As now contemplated, Blitz is estimated to cost approximately $200 million (of which approximately $62 million has been incurred through the end of 2014), with the basic infrastructure expected to be completed in late 2018.
The Company completed development work and the installation of basic infrastructure for its Graham Creek project, located adjacent to and west of the East Boulder Mine, during 2014. A continuing program of definitional drilling during 2015 will better define attractive mining areas along the 8,800 feet of new development.
10
ORE RESERVES DETERMINATION METHODOLOGY
The Company utilizes statistical methodologies to calculate ore reserves based on interpolation between and projection beyond sample points. Interpolation and projection are limited by certain modifying factors including geologic boundaries, economic considerations and constraints imposed by safe mining practices. Sample points consist of variably spaced drill core intervals through the J-M Reef obtained from drill sites located on the surface and in underground development workings. Results from all sample points within the ore reserve area are evaluated and applied in determining the ore reserve.
For proven ore reserves, distances between samples range from 25 to 100 feet but are typically spaced at 50 foot intervals both horizontally and vertically. The sample data for proven ore reserves consists of survey data, lithologic data and assay results. Quality Assurance / Quality Control (QA / QC) protocols are in place at both mine sites to test the sampling and analysis procedures. To test assay accuracy and reproducibility, pulps from core samples are resubmitted and compared. To test for sample label errors or cross-contamination, blank core (waste core) samples are submitted with the mineralized sample lots and compared. The QA / QC protocols are practiced on both resource delineation and development and production samples. The resulting data is entered into a 3-dimensional modeling software package and is analyzed to produce a 3-dimensional solid block model of the resource. The assay values are further analyzed by a geostatistical modeling technique (kriging) to establish a grade distribution within the 3-dimensional block model. Dilution is then applied to the model and a diluted tonnage and grade are calculated for each block. Ore and waste tons, contained ounces and grade are then calculated and summed for all blocks.
Two types of cut-off grades are recognized for the J-M Reef, a geologic cut-off grade and an economic cut-off grade. The geologic cut-off grade for both the Stillwater and East Boulder mines falls in the range of 0.2 to 0.3 troy ounces of palladium plus platinum (Pd+Pt) per ton. The economic cut-off grade is lower than the geologic cut-off and can vary between the mines based on cost and efficiency factors. The determination of the economic cut-off grade is completed on a round by round basis and is driven primarily by available mill capacity, geologic character encountered at the mining face and incremental costs of processing the broken rock. See “Business and Properties – Proven and Probable Ore Reserves – Discussion” for discussion of reserve sensitivity to changes in PGM pricing.
Probable ore reserves estimations are based on longer projections than proven reserves, and projections up to a maximum radius of 1,000 feet beyond the limit of existing drill hole sample intercepts of the J-M Reef are acceptable. Statistical modeling and the established continuity of the J-M Reef, as determined from results of 28 years of mining activity to date, support the Company’s technical confidence in estimates of tonnage and grade over this projection distance. Where appropriate, projections for the probable ore reserve determination are constrained by any known or anticipated restrictive geologic features.
The Company reviews its methodology for calculating ore reserves on an annual basis. Conversion, an indicator of the success in upgrading probable ore reserves to proven ore reserves, is evaluated annually as part of the reserve estimation process. The annual review examines the effect of new geologic information, changes implemented or planned in mining practices and mine economics on the measures used for the estimation of probable ore reserves. The review includes an evaluation of the Company’s rate of conversion of probable reserves to proven reserves.
The proven and probable ore reserves are then modeled as a long-term mine plan and additional factors including mining methods, process recoveries, metal prices, mine operating productivities and costs and capital estimates are applied to determine the overall economics of the ore reserves. The Company has made available on its website (www.stillwatermining.com) in the Investor Relations section a report entitled “Technical Report for the Mining Operations at Stillwater Mining Company”, dated as of March 2011 and furnished to the United States Securities and Exchange Commission (SEC) on Form 8-K on June 23, 2011, that discusses the Company’s ore reserve methodology in greater detail. The information contained on the Company's website or connected to its website is not incorporated by reference into this Annual Report on Form 10-K and should not be considered part of this report.
SEC ORE RESERVE GUIDELINES
The SEC has established guidelines contained in Industry Guide No. 7 to assist registered companies as they estimate ore reserves. These guidelines set forth technical, legal, and economic criteria for determining whether the Company’s ore reserves can be classified as proven and probable.
The SEC’s economic guidelines historically have not constrained the Company’s ore reserves, and did not constrain the Company's ore reserves at December 31, 2014. Under these guidelines, ore may be classified as proven or probable if extraction and sale will result in positive cumulative undiscounted cash flow. The Company utilizes the historical trailing twelve-quarter average combined PGM market price in ascertaining these cumulative undiscounted cash flows.
11
The Company believes that it is appropriate to use a long-term average price for measuring ore reserves; as such a price better matches the period over which the reserves will ultimately be mined. However, should metal prices decline substantially from their present level for an extended period, the twelve-quarter trailing average price might also decline and could result in a reduction of the Company’s reported ore reserves.
The Company’s Technical and Ore Reserve Committee, a committee of the Board, met four times during 2014 with management and third-party independent outside experts to review ore reserve methodology, to identify best practices in the industry and to receive reports on the progress and results of the Company’s mine development efforts. The Committee has reviewed the Company’s ore reserves as reported at December 31, 2014, and has met with management and with the Company’s independent consultant on ore reserves to discuss the conclusions of this review.
RESULTS
The December 31, 2014, ore reserves for the Montana operations were reviewed by Behre Dolbear & Company, Inc. (Behre Dolbear), third-party independent consultants, who are experts in mining, geology and ore reserve determination. The Company has utilized Behre Dolbear to carry out independent reviews and inventories of the Company’s ore reserves since 1990. Behre Dolbear has consented to be a named expert herein. See “Risk Factors – Ore reserve estimates are inherently imprecise and may require adjustment in the future; changes in ore grades, mining practices and economic factors could materially affect the Company’s production and reported results.”
PROVEN AND PROBABLE ORE RESERVES
The Company’s proven ore reserves are generally expected to be extracted utilizing existing mine infrastructure. However, additional infrastructure development will be required to extract the Company’s probable ore reserves. Based on the 2015 mining plans at each mine, the year-end 2014 proven ore reserves of 3.4 million tons at the Stillwater Mine and 2.8 million tons at the East Boulder Mine represent an adequate level of proven ore reserves to support planned mining activities.
The grade of the Company’s J-M Reef ore reserves, measured in combined palladium and platinum ounces per ton, is a composite average of samples in all reserve areas. As is common in underground mines, the grade mined and the recovery rate achieved varies depending on the area being mined. In particular, mill head grade varies significantly between the Stillwater and East Boulder mines, as well as within different areas of each mine. The average mill head grade for each of the years 2014 and 2013 for all tons processed from the Stillwater Mine was 0.50 PGM ounces per ton of ore and for 2012 the average mill head grade was 0.58 PGM ounces per ton of ore. During 2014 the average mill head grade for all tons processed from the East Boulder Mine was approximately 0.38 PGM ounces per ton of ore compared to an average mill head grade of 0.37 PGM and 0.35 PGM ounces per ton of ore in 2013 and 2012, respectively. Concentrator feeds at both mines typically include, along with the ore, some PGM-bearing material that is below the cut-off grade for reserves (reef waste) but that is economic to process so long as there is available capacity in the concentrator. See “Risk Factors – An extended period of low PGM prices could result in a reduction of ore reserves and potential asset impairment charge."
At December 31, 2014, 2013 and 2012 the Company’s proven and probable ore reserves in the J-M Reef were as follows:
TOTAL MONTANA MINES | ||||||||||||
ORE TONS (000’s) | AVERAGE GRADE (OZ/TON) | CONTAINED OUNCES (000’S) | SALEABLE OUNCES (2) (000’S) | |||||||||
At December 31, 2014 | ||||||||||||
Proven Reserves | 6,166 | 0.51 | 3,140 | 2,634 | ||||||||
Probable Reserves | 42,732 | 0.45 | 19,086 | 16,206 | ||||||||
Total Proven and Probable Reserves (1) | 48,898 | 0.45 | 22,226 | 18,840 | ||||||||
At December 31, 2013 | ||||||||||||
Proven Reserves | 6,098 | 0.50 | 3,037 | 2,547 | ||||||||
Probable Reserves | 42,411 | 0.45 | 19,027 | 16,030 | ||||||||
Total Proven and Probable Reserves (1) | 48,509 | 0.45 | 22,064 | 18,577 | ||||||||
At December 31, 2012 | ||||||||||||
Proven Reserves | 6,023 | 0.51 | 3,078 | 2,590 | ||||||||
Probable Reserves | 40,119 | 0.46 | 18,377 | 15,491 | ||||||||
Total Proven and Probable Reserves (1) | 46,142 | 0.46 | 21,455 | 18,081 | ||||||||
12
STILLWATER MINE | ||||||||||||
ORE TONS (000’s) | AVERAGE GRADE (OZ/TON) | CONTAINED OUNCES (000’S) | SALEABLE OUNCES (2) (000’S) | |||||||||
At December 31, 2014 | ||||||||||||
Proven Reserves | 3,351 | 0.57 | 1,984 | 1,635 | ||||||||
Palladium | 0.46 | 1,551 | 1,270 | |||||||||
Platinum | 0.13 | 433 | 365 | |||||||||
Probable Reserves | 12,619 | 0.56 | 7,120 | 5,868 | ||||||||
Palladium | 0.44 | 5,564 | 4,559 | |||||||||
Platinum | 0.12 | 1,556 | 1,309 | |||||||||
Total Proven and Probable Reserves (1) | 15,970 | 0.57 | 9,104 | 7,503 | ||||||||
Palladium | 0.45 | 7,115 | 5,829 | |||||||||
Platinum | 0.12 | 1,989 | 1,674 | |||||||||
At December 31, 2013 | ||||||||||||
Proven Reserves | 3,246 | 0.57 | 1,856 | 1,545 | ||||||||
Palladium | 0.45 | 1,449 | 1,199 | |||||||||
Platinum | 0.12 | 407 | 346 | |||||||||
Probable Reserves | 12,314 | 0.57 | 6,989 | 5,818 | ||||||||
Palladium | 0.44 | 5,457 | 4,516 | |||||||||
Platinum | 0.13 | 1,532 | 1,302 | |||||||||
Total Proven and Probable Reserves (1) | 15,560 | 0.57 | 8,845 | 7,363 | ||||||||
Palladium | 0.44 | 6,906 | 5,715 | |||||||||
Platinum | 0.13 | 1,939 | 1,648 | |||||||||
At December 31, 2012 | ||||||||||||
Proven Reserves | 3,333 | 0.59 | 1,952 | 1,639 | ||||||||
Palladium | 0.46 | 1,524 | 1,272 | |||||||||
Platinum | 0.13 | 428 | 367 | |||||||||
Probable Reserves | 12,149 | 0.59 | 7,189 | 6,035 | ||||||||
Palladium | 0.46 | 5,612 | 4,684 | |||||||||
Platinum | 0.13 | 1,577 | 1,351 | |||||||||
Total Proven and Probable Reserves (1) | 15,482 | 0.59 | 9,141 | 7,674 | ||||||||
Palladium | 0.46 | 7,136 | 5,956 | |||||||||
Platinum | 0.13 | 2,005 | 1,718 | |||||||||
13
EAST BOULDER MINE | ||||||||||||
ORE TONS (000’s) | AVERAGE GRADE (OZ/TON) | CONTAINED OUNCES (000’S) | SALEABLE OUNCES (2) (000’S) | |||||||||
At December 31, 2014 | ||||||||||||
Proven Reserves | 2,815 | 0.41 | 1,156 | 999 | ||||||||
Palladium | 0.32 | 905 | 776 | |||||||||
Platinum | 0.09 | 251 | 223 | |||||||||
Probable Reserves | 30,113 | 0.40 | 11,966 | 10,338 | ||||||||
Palladium | 0.31 | 9,365 | 8,035 | |||||||||
Platinum | 0.09 | 2,601 | 2,303 | |||||||||
Total Proven and Probable Reserves (1) | 32,928 | 0.40 | 13,122 | 11,337 | ||||||||
Palladium | 0.31 | 10,270 | 8,811 | |||||||||
Platinum | 0.09 | 2,852 | 2,526 | |||||||||
At December 31, 2013 | ||||||||||||
Proven Reserves | 2,852 | 0.41 | 1,181 | 1,002 | ||||||||
Palladium | 0.32 | 924 | 779 | |||||||||
Platinum | 0.09 | 257 | 223 | |||||||||
Probable Reserves | 30,097 | 0.40 | 12,038 | 10,212 | ||||||||
Palladium | 0.31 | 9,422 | 7,937 | |||||||||
Platinum | 0.09 | 2,616 | 2,275 | |||||||||
Total Proven and Probable Reserves (1) | 32,949 | 0.40 | 13,219 | 11,214 | ||||||||
Palladium | 0.31 | 10,346 | 8,716 | |||||||||
Platinum | 0.09 | 2,873 | 2,498 | |||||||||
At December 31, 2012 | ||||||||||||
Proven Reserves | 2,690 | 0.42 | 1,126 | 951 | ||||||||
Palladium | 0.33 | 881 | 739 | |||||||||
Platinum | 0.09 | 245 | 212 | |||||||||
Probable Reserves | 27,970 | 0.40 | 11,188 | 9,456 | ||||||||
Palladium | 0.31 | 8,756 | 7,349 | |||||||||
Platinum | 0.09 | 2,432 | 2,107 | |||||||||
Total Proven and Probable Reserves (1) | 30,660 | 0.40 | 12,314 | 10,407 | ||||||||
Palladium | 0.31 | 9,638 | 8,088 | |||||||||
Platinum | 0.09 | 2,676 | 2,319 | |||||||||
(1) Reserves are defined as that part of a mineral deposit that could be economically and legally extracted or produced at the time of the reserve determination. Proven ore reserves are defined as ore reserves for which (a) quantity is computed from dimensions revealed in outcrops, trenches, workings or drill holes; grade and / or quality are computed from the results of detailed sampling and (b) the sites for inspection, sampling and measurement are spaced so closely and the geologic character is so well defined that size, shape, depth and mineral content of ore reserves are well-established. Probable ore reserves are defined as ore reserves for which quantity and grade and / or quality are computed from information similar to that used for proven ore reserves, but the sites for inspection, sampling, and measurement are farther apart or are otherwise less adequately spaced. The degree of assurance, although lower than that for proven ore reserves, is high enough to assume continuity between points of observation. The proven and probable ore reserves reflect variations in the PGM content and structural impacts on the J-M Reef. These variations are the result of localized depositional and structural influences on the distributions of economic PGM mineralization. Geologic domains within the reserve boundaries of the two mines include areas where as little as 0% and up to 100% of the J-M Reef is economically mineable. The ore reserve estimate gives effect to these assumptions. Using the Company’s combined twelve-quarter trailing weighted average price for palladium and platinum at December 31, 2014, of approximately $891 per ounce ($724/oz. for palladium and $1,474/oz. for platinum), the Company’s ore reserves at each mine are projected to generate (undiscounted) positive cash flow over the life of the reserve. See “Risk Factors” and “Cautionary Information Regarding Forward-Looking Statements.”
(2) Contained ounces net of estimated mining and processing losses.
14
DISCUSSION
The Company’s mine development efforts over the past several years have focused on converting probable reserves to proven reserves. At December 31, 2014, the Company’s total proven palladium and platinum ore reserves in the J-M Reef were 6.2 million tons at an average grade of 0.51 ounces per ton, containing an estimated 3.1 million ounces of palladium and platinum. This represented a net increase of 3.4% in proven contained ounces compared to the proven ore reserves reported at December 31, 2013. The Company’s total probable palladium and platinum ore reserves at December 31, 2014, were 42.7 million tons at an average grade of 0.45 ounces per ton, containing approximately 19.1 million ounces of palladium and platinum. This represented a net increase of 0.3% in probable contained ounces compared to the probable reserves reported at December 31, 2013. Combined, the Company’s total proven and probable palladium and platinum ore reserves at December 31, 2014, were 48.9 million tons at an average grade of 0.45 ounces per ton, containing an estimated 22.2 million ounces of palladium plus platinum – a net increase of approximately 0.7% in total proven and probable contained ounces from the 22.1 million ounces reported at December 31, 2013.
In 2014, proven and probable ore tons increased 0.8% and contained ounces reflected an increase of 0.7% from the respective amounts reported at December 31, 2013. In 2013 proven and probable ore tons increased 5.1% while contained ounces increased by 2.8% from those reported at December 31, 2012. The Company’s total proven and probable ore reserve tonnage in the J-M Reef at December 31, 2014, has increased by approximately 6.0% or 2.8 million tons over the past two years. However, total contained ounces in proven and probable reserves have increased by approximately 3.6% from those reported December 31, 2012.
The Stillwater Mine proven and probable ore reserves at year-end 2014 increased by 2.6% in terms of ore tons from the respective proven and probable amounts reported at year-end 2013. The East Boulder Mine proven and probable ore reserves at year-end 2014 decreased by 0.1% in ore tons from those reported at year-end 2013. Overall, the Company’s estimated proven and probable ore reserves based on ore tons increased by 0.8% in 2014. The Company’s ore reserve determination for 2014, calculated at December 31, 2014, was limited by geologic certainty and not by economic constraints.
The following table compares 2014 and 2013 year-on-year proven and probable ore reserves for the Montana operations:
At December 31, 2014 | At December 31, 2013 | Tonnage | Ounce | |||||||||||||||||
Tons | Grade | Ounce | Tons | Grade | Ounce | Change | Change | |||||||||||||
Stillwater Mine | ||||||||||||||||||||
Proven | 3,351 | 0.57 | 1,984 | 3,246 | 0.57 | 1,856 | 3.2 | % | 6.9 | % | ||||||||||
Probable | 12,619 | 0.56 | 7,120 | 12,314 | 0.57 | 6,989 | 2.5 | % | 1.9 | % | ||||||||||
Sub-Total | 15,970 | 0.57 | 9,104 | 15,560 | 0.57 | 8,845 | 2.6 | % | 2.9 | % | ||||||||||
East Boulder Mine | ||||||||||||||||||||
Proven | 2,815 | 0.41 | 1,156 | 2,852 | 0.41 | 1,181 | -1.3 | % | -2.1 | % | ||||||||||
Probable | 30,113 | 0.40 | 11,966 | 30,097 | 0.40 | 12,038 | 0.1 | % | -0.6 | % | ||||||||||
Sub-Total | 32,928 | 0.40 | 13,122 | 32,949 | 0.40 | 13,219 | -0.1 | % | -0.7 | % | ||||||||||
Total | ||||||||||||||||||||
Proven | 6,166 | 0.51 | 3,140 | 6,098 | 0.50 | 3,037 | 1.1 | % | 3.4 | % | ||||||||||
Probable | 42,732 | 0.45 | 19,086 | 42,411 | 0.45 | 19,027 | 0.8 | % | 0.3 | % | ||||||||||
Total | 48,898 | 0.45 | 22,226 | 48,509 | 0.45 | 22,064 | 0.8 | % | 0.7 | % | ||||||||||
Changes in proven and probable ore reserves are due to the net effect of the following:
• | Additions to proven ore reserves from new definition drilling, |
• | Deletions as proven reserves are mined, (See Item 6 - Selected Financial Data for prior year production data and concentrator recoveries), |
• | Deletions from probable ore reserves as areas are converted by new drilling from probable to proven ore reserves, |
• | Additions from development activity to convert mineralized inventory to probable ore reserves, and |
• | Additions and deletions from adjustments to ore reserve estimation factors and mine planning criteria. The cut-off grade used in mine planning ranges from 0.2 to 0.3 troy ounces of palladium and platinum per ton for the Stillwater Mine and is 0.2 troy ounces of palladium and platinum per ton for the East Boulder Mine. The economic value of this cut-off grade varies with palladium and platinum prices and with the cost and efficiency of the different mining methods employed. |
15
CURRENT OPERATIONS
Montana Properties and Facilities - February 2015
MINING OPERATIONS
Mine production of palladium and platinum totaled 517,700 ounces for the year ended December 31, 2014, a decrease of 1.2% from the 523,900 ounces produced from the mines in 2013. Changes in mining conditions and the array of stopes available for mining in any period generally account for any slight variability in total mined ounces produced.
Combined total cash costs per mined ounce, net of by-product and recycling credits, (a non-GAAP financial measure) averaged $538 per ounce for the year ended December 31, 2014. See "Item 6 - Selected Financial Data - Reconciliation of Non-GAAP Financial Measures to Consolidated Costs of Revenues." Note that, for historical reasons, the Company’s measurement of total cash costs per mined ounce customarily has been reported net of credits for sales of by-products from mining and also net of PGM Recycling segment margins. The table below illustrates the effect of by-product and recycling credits on the average cash costs per mined ounce net of credits for the combined Montana mining operations.
Cash Costs Per Mined Ounce - Combined Montana Mining Operations | Full Year 2014 | Full Year 2013 | ||||||
Reported Total Cash Costs per Mined Ounce net of Credits* | $ | 538 | $ | 496 | ||||
Add Back By-Product Revenue Credit | 57 | 52 | ||||||
Add Back PGM Recycling Income Credit | 23 | 68 | ||||||
Total Cash Costs per Mined Ounce before Credits* | $ | 618 | $ | 616 | ||||
* These are non-GAAP financial measures. For a reconciliation of non-GAAP financial measures to GAAP accounting measures, see "Reconciliation of Non-GAAP Financial Measures to Consolidated Costs of Revenues" in Part II, Item 6 of this report.
16
STILLWATER MINE
The underground Stillwater Mine facility near Nye, Montana accesses, extracts and processes PGM ores from the eastern portion of the J-M Reef using mine openings located in the Stillwater River Valley. The mine began operating 29 years ago in 1986. All surface structures and tailings management facilities are located within the 2,613 acre Stillwater Mine Operating Permit area which is administered collectively by the Montana Department of Environmental Quality (DEQ) and the United States Forest Service (USFS). Ore reserves developed at the Stillwater Mine are controlled by patented mining claims either leased or owned outright by the Company. The mine is located approximately 85 miles southwest of Billings, Montana and is accessed by a paved road. The mine has adequate water and power from established sources to conduct its current operations. See “Risk Factors – Certain of the Company's properties are subject to title risk, particularly related to the validity of unpatented mining claims.”
The Stillwater Mine accesses and has developed a 5.9 mile-long underground segment of the J-M Reef, on various levels between 1,900 and 7,500 feet above sea level. Access to the ore at the Stillwater Mine is accomplished by means of a 1,950 foot vertical shaft from the valley floor and by a system of horizontal adits and drifts driven parallel to the strike of the J-M Reef at vertical intervals of between 150 feet and 300 feet. Seven main adits have been driven from surface portals on the west and east slopes of the Stillwater Valley at various elevations between 5,000 and 5,900 feet above sea level. Additional principal levels have been developed below the 5000 level, accessed from the vertical shaft and associated ramp systems. Extensive underground rail haulage has been installed on the 5000 and 3500 levels to the west of the shaft, with future rail planned on the 2000 level. Ore from this region of the mine is hauled by truck and / or rail to the shaft, where it is crushed and hoisted out of the mine. The Company is continuing to develop a decline system and additional principal mining levels to access and develop deeper areas in the central part of the mine. At the end of 2014 this decline system extended down to the 1900 level.
The headframe for the shaft at the Stillwater Mine is situated in the Stillwater Valley adjacent to the concentrator, at 5,000 feet above sea level. Ore and any waste rock to be transported to the surface from the off-shaft and deeper areas of the mine are crushed prior to being hoisted up the shaft. The production shaft and underground crushing station reduce haulage times and costs, facilitate the handling of ore and waste, and improve the grinding capabilities of the concentrator. Ore produced from above the 5,000 foot elevation on the west side of the mine is hauled to the surface by rail. Waste material not used for backfilling in underground excavations is transported to the surface and placed in permitted waste rock disposal sites.
During 2007 the Company began construction of a major dedicated decline ramp for electric truck haulage of material mined from below the 3500 rail level. The Kiruna electric trucks haul material up to the 3500 level of the shaft, where it can then be hoisted to the surface. This ramp currently services down to the 2500 level of the mine, but it is planned to extend down ultimately to approximately the 1,400 foot elevation. The first-phase installation of the Kiruna electric trucks at Stillwater Mine was completed and the first two trucks were placed into operation during the first quarter of 2011. A third Kiruna electric truck was received and placed in service during 2013. In the future, the Company expects the horizontal rail haulage system on the 2000 level will transport ore and waste material from the deeper mining faces to the electric truck ramps. By the end of 2014 the Kiruna ramp had been developed down to the 1900 level, although it is not yet electrified to that depth.
Since 1994, the Company has used two mechanized mining methods: ramp-and-fill and sub-level stoping. Ramp-and-fill is a mining method in which a series of horizontal cuts are extracted from the ore body using mobile equipment. Access to the ore body is from ramps driven within or adjacent to the ore body, allowing the use of hydraulic drills and load-haul-dump equipment. Sub-level stoping is a mining method in which blocks of the reef approximately 50 feet high and up to 75 feet in length are extracted in 30 foot intervals utilizing mobile long-hole drills and remote-control rubber tired load-haul-dump equipment. The reef is mined in a retreat sequence and mined out areas are filled with development waste or sand backfill as appropriate. Traditionally, captive cut-and-fill has been viewed as being more selective in nature than either ramp-and-fill or sub-level stoping, but it also requires miners with specialized skills and is generally less productive. Other factors considered in determining the most appropriate mining method for each area include the amount of ancillary development required, as well as the ore grade and ground conditions expected. The Company determines the appropriate mining method to be used on a stope-by-stope basis utilizing engineering and economic analysis.
The Company processes ore from the Stillwater Mine through a surface concentrator facility (mill) adjacent to the Stillwater Mine shaft. The mill has a design capacity of 3,000 tons per day. Crushed mine ore is fed into the concentrator, mixed with water and ground to slurry in the concentrator’s mill circuits to liberate the PGM-bearing sulfide minerals from the rock matrix. Various reagents are added to the slurry, which then is agitated in a froth flotation circuit to separate the valuable sulfides from the waste rock. In this circuit, the sulfide minerals are successively floated, recycled, reground and refloated to produce a concentrate suitable for further processing. The final flotation concentrate, which represents approximately 2.0% of the original ore weight, is filtered, placed in large bins and then transported by truck to the Company’s metallurgical complex in Columbus, Montana.
17
In 2014 approximately 57.8% of the tailings material from the mill was returned to the mine and used as underground fill material to provide support for additional mining activities. The balance was placed in permitted tailings containment areas on the surface. Tailings are disposed of into the impoundment areas pursuant to the Company’s operating permits. In 1998 the Company received an amendment to its existing operating permit providing for the construction of a lined surface tailings impoundment that would serve the Stillwater Mine for approximately the next 30 years. This facility, located approximately eight miles from the mine and generally referred to as the Hertzler impoundment, was placed into operation in late 2000. See “Business and Properties - Regulatory and Environmental Matters – Permitting and Reclamation.”
During 2014, ore and reef waste production at the Stillwater Mine averaged 2,051 tons, a decrease from the 2,194 tons produced in 2013. Historically, mill recovery of the PGMs contained in the ore have been approximately 92%. The Stillwater Mine produced 340,800 ounces of palladium and platinum, a decrease of 6.9% from the 366,100 ounces produced in 2013. The Stillwater Mine’s total cash costs, net of by-product and recycling credits, (a non-GAAP financial measure) averaged $533 per ounce in 2014 compared to $484 per ounce in 2013. Total cash costs per ounce in 2013 benefited from an exceptionally high recycling credit, reflecting PGM ounces extracted and sold from reprocessing internal furnace brick from the smelter. Before taking the benefit of recycling and by-product sales credits, the Stillwater Mine’s total cash costs averaged $606 per ounce in 2014 and $595 per ounce in 2013. The 1.8% increase in average total cash costs (before credits) was attributable to the lower total mine production in 2014 which was 6.5% lower than 2013.
Cash Costs Per Mined Ounce - Stillwater Mine | Full Year 2014 | Full Year 2013 | ||||||
Reported Total Cash Costs per Mined Ounce net of Credits* | $ | 533 | $ | 484 | ||||
Add Back By-Product Revenue Credit | 50 | 44 | ||||||
Add Back PGM Recycling Income Credit | 23 | 67 | ||||||
Total Cash Costs per Mined Ounce before Credits* | $ | 606 | $ | 595 | ||||
* These are non-GAAP financial measures. For a reconciliation of non-GAAP financial measures to GAAP accounting measures, see "Reconciliation of Non-GAAP Financial Measures to Consolidated Costs of Revenues" in Part II, Item 6 of this report.
EAST BOULDER MINE
The East Boulder Mine is located in Sweet Grass County, Montana, approximately 32 miles south of the town of Big Timber and is accessed by a public road. The East Boulder Mine is fully permitted independently of the Stillwater Mine and comprises a second distinct mining operation accessing the western portion of the J-M Reef. The mine was commissioned in 2002 and is actively mining approximately 2.5 horizontal miles underground along the J-M Reef. The mine consists of underground mine development and surface support facilities, including a concentrator, shop and warehouse, changing facilities, storage facilities, office and tailings management facility. All mine facilities are wholly-owned and operated by the Company. Surface facilities for the East Boulder Mine are situated on unpatented mill site claims maintained on federal lands located within the Gallatin National Forest and administered by the USFS and the Montana DEQ. All surface facilities, including the tailings management complex, are located within a 986 acre operating permit area. Proven and probable ore reserves for the mine are controlled by patented mining claims owned by the Company. Development of the East Boulder Mine began in 1998, and the mine commenced commercial production effective January 1, 2002.
From the surface facilities at the East Boulder Mine, the J-M Reef is accessed by two 18,500 foot long, 15 foot diameter horizontal rail adits driven into the mountain. These two parallel tunnels intersect the ore body deep within the mountain at an elevation 6,450 feet above sea level. Within the mine, the ore body currently is accessed from seven levels of horizontal footwall lateral drifts driven parallel to the J-M Reef totaling approximately 37,500 feet in length, and from four primary ramps totaling approximately 16,815 feet of development. The ore body is accessed vertically by ramp systems tying together the footwall laterals and driven approximately every 2,500 feet along the length of the deposit. The mined ore is transported horizontally out of the East Boulder Mine by rail haulage to the mine portal, where it is processed through the East Boulder Mine concentrator facility. The East Boulder Mine concentrator has a permitted throughput capacity of 2,000 tons per day.
18
In 2014, approximately 49.0% of the East Boulder Mine tailings material was returned to the mine and used for backfill in mined out voids to provide a foundation upon which additional mining activities can occur. The balance was placed in surface tailings containment areas. Tailings placed into the impoundment areas are disposed of pursuant to requirements in the Company’s operating permits. The remaining permitted impoundment area has an estimated staged life of approximately 16 years at the original planned production and processing rate of 2,000 tons per day. During 2014, ore and reef waste production at the East Boulder Mine averaged 1,434 tons per day, compared to 1,299 tons per day during 2013. Mill recovery of the PGMs contained in the ore was approximately 90% for the years ended December 31, 2014, 2013 and 2012, respectively. The East Boulder Mine produced 176,900 ounces of PGMs in 2014, an increase of 12.1% compared to the 157,800 ounces of PGMs produced in 2013, reflecting some initial 2014 production from a stope block in the Graham Creek area. The East Boulder Mine’s total cash costs net of by-product and recycling credits, (a non-GAAP financial measure) were $547 per ounce in 2014 compared to $525 per ounce in 2013. As at the Stillwater Mine, East Boulder Mine's 2013 total cash costs benefited from an unusually high recycling credit attributable to recycling PGM ounces in internal furnace brick. Excluding the benefit of recycling and by-product credits, total cash costs before credits were $641 per ounce in 2014 and $664 per ounce in 2013.
Cash Costs Per Mined Ounce - East Boulder Mine | Full Year 2014 | Full Year 2013 | ||||||
Reported Total Cash Costs per Mined Ounce net of Credits* | $ | 547 | $ | 525 | ||||
Add Back By-Product Revenue Credit | 71 | 69 | ||||||
Add Back PGM Recycling Income Credit | 23 | 70 | ||||||
Total Cash Costs per Mined Ounce before Credits* | $ | 641 | $ | 664 | ||||
* These are non-GAAP financial measures. For a reconciliation of non-GAAP financial measures to GAAP accounting measures, see "Reconciliation of Non-GAAP Financial Measures to Consolidated Costs of Revenues" in Part II, Item 6 of this report.
METALLURGICAL COMPLEX
SMELTER
The Company owns and operates a smelter facility situated along Interstate 90 in Columbus, Montana. The smelter facility consists of two electric furnaces, two top blown rotary converters (TBRCs), a matte granulator, and gas handling and solution regeneration systems. During 2009 the Company completed construction of a new primary 150 ton-per-day smelter furnace at the Columbus facility. This second, larger furnace allows room for growth in future processing volumes, partially mitigates potential operational risk by providing some redundancy (virtually all of the Company’s metal production is dependent on the availability of the smelter facility), and provides capacity for the Company to continue processing during periodic scheduled maintenance shutdowns. After stripping out the old refractory material from the original furnace during 2010, the furnace structure was re-bricked during 2011 and reconfigured during 2012 as a “slag cleaning” furnace. In this configuration, slag tapped from the primary furnace is transferred into the original furnace, providing additional residence time for PGM matte to separate from the slag material, with the intent of increasing metal recoveries. Reconfigured as such, the slag cleaning furnace also serves as a backup for the primary furnace if needed.
Concentrates from the mine sites are transported by truck to the smelter, dried, and fed into the electric furnace. In the furnace, the concentrates are commingled with spent catalyst materials collected by the Company’s recycling business segment. The combined feed is melted in the furnace, where the lighter silica-rich slag separates out into a distinct layer that floats on top of the heavier nickel-copper PGM-rich matte. The matte is tapped from the furnace periodically and granulated. This granulated furnace matte is then re-melted and processed in a TBRC, which extracts iron from the converter matte. The converter matte is poured from the TBRC, granulated and transferred to the base metal refinery for further processing. The granulated converter matte, approximately 6% of the original smelter feed by weight, consists principally of copper and nickel sulfides containing approximately 1.5% to 2.5% PGMs. Any residual slag from the slag cleaning furnace is periodically tapped from the furnace, cooled and returned to the Stillwater Mine concentrator for reprocessing.
The gases released from the smelting operations are routed through a gas / liquid scrubbing system, which removes approximately 99.8% of the contained sulfur dioxide. Spent scrubbing solution is treated in a process that converts the sulfur dioxide into gypsum, or calcium sulfate, and regenerates clean scrubbing solution. The gypsum is used by farmers as a soil amendment and as a water treatment additive by the coal bed methane industry.
19
BASE METAL REFINERY
The Company’s base metal refinery is located on property the Company owns adjacent to the smelter in Columbus, Montana.
The base metal refinery utilizes the patented Sherritt Process, whereby a sulfuric acid solution dissolves out the nickel, copper, cobalt and any residual iron from the PGM-bearing converter matte. The copper and nickel ultimately are marketed as by-products. A nickel crystallizer circuit produces a crystalline nickel sulfate by-product containing minor amounts of cobalt, which is marketed under sales contracts with various companies. A copper electrowinning circuit removes copper from solution as cathode copper that is marketed to copper refiners for upgrading to commercial grade material. The removal of these metals upgrades the PGM fraction of the converter matte product from approximately 2% PGMs to approximately 40% PGMs.
The base metal refinery produces a palladium, platinum and rhodium-rich filter cake, which also contains minor amounts of gold and silver. This filter cake is shipped to a third-party precious metal refinery in New Jersey under a toll-processing agreement that provides the Company with returns of finished metal. The palladium and platinum metals are returned to the Company’s account as 99.95% purity palladium and platinum sponge; and refined rhodium, gold and silver are also separately returned to the Company’s account. Refined metals from the Company's mine production are sold to Johnson Matthey and Tiffany & Co.; refined metals from the Company's recycling segment are normally delivered to the Company’s counterparties. The Company pays its refiner a per-ounce refining charge for toll processing of the refined filter cake, and the refiner also retains a small percentage of the contained metals.
PGM RECYCLING
The Company regularly sources spent catalytic converter materials containing PGMs from third-party suppliers and processes them through its metallurgical complex. The recycling materials are either purchased outright by the Company for its own account or are toll processed on a fee basis with the contained metals being returned to the supplier of the material. The third-party suppliers collect recycling materials primarily from automobile repair shops and automobile yards that process scrapped vehicles. The Company also extracts PGMs from petroleum refinery catalyst and other sources, normally on a tolling basis.
Upon receipt of the recycling materials at the Columbus smelter, they are weighed, crushed and sampled prior to being commingled with mine concentrates for smelting in the electric furnace. Nickel and copper sulfides which occur naturally in the mine concentrates act as a metallurgical collector in the smelter furnace to facilitate extraction of the PGMs from the recycled material.
In connection with acquiring spent automotive catalysts for recycling, the Company may advance funds to its established suppliers prior to receiving the physical material in order to facilitate procurement efforts. Total outstanding procurement advances to recycling suppliers totaled $7.3 million, $6.9 million and $10.2 million at December 31, 2014, 2013 and 2012, respectively. The Company normally advances against a portion of the value of specific shipments that either are on the dock or are physically in transit to the Company’s processing facilities.
Recycled PGM ounces sold in 2014 decreased to 384,400 ounces compared to 541,800 ounces in 2013. In addition to material purchased for its own account, the Company processed 72,800 ounces of PGMs on a tolling basis in 2014, an 11.3% increase over the 65,400 tolled ounces in 2013. In total, recycled volumes fed to the smelter in 2014 were 469,400 ounces of PGMs, a decrease of 23.9% from 616,700 ounces in 2013. The decreased volumes in 2014 mostly resulted from reduced PGM market prices. In the Company’s experience, the volume of spent catalyst available in the market is sensitive to PGM market prices, as suppliers tend to withhold material from the market when prices fall and then release it for sale when prices rise.
The Company records revenue and costs of metals sold for the processing of these recycled materials separately from mine production revenue and costs. Revenues from PGM recycling decreased to $401.7 million in 2014, from $560.6 million in 2013 and increased over the $344.8 million in 2012. Recycling costs of metals sold were $391.5 million, $527.4 million and $334.9 million for 2014, 2013 and 2012, respectively. The largest share of recycling costs is associated with purchasing material for processing. Earnings before tax from the PGM Recycling segment in 2014, 2013 and 2012, including financing charges to customers, were $11.7 million, $35.5 million and $10.5 million, respectively. As noted previously, in 2013 the PGM Recycling segment earnings benefited from 12,000 PGM ounces allocated to the PGM Recycling segment from the reprocessing of internal furnace brick.
20
Because of the significant quantities of recycling material typically processed through its smelter and base metal refinery and the substantial time required for processing, the Company normally carries large inventories of recycling material in process. As part of the Company's risk mitigation program the related ounces are typically hedged so the Company is not exposed to commodity price fluctuation on this material. Working capital associated with these recycling activities, which includes inventories and advances, was $61.5 million, $76.1 million and $87.8 million at December 31, 2014, 2013 and 2012, respectively.
EXPLORATION AND DEVELOPMENT
Montana, U.S.A.
The J-M Reef has been explored from the surface along its entire 28-mile strike length by surface sampling and drilling which consists of an array of over 900 drill holes. Historical exploration activities also included driving two exploratory underground adits that are not currently in active use, the West Fork adit and the Frog Pond adit, and then drilling core samples from within these adits to access areas of the J-M Reef not readily accessible by surface drilling. Comprehensive evaluation of PGM mineralization encountered along the J-M Reef suggests the existence of mineralized material over much of the remaining strike length. Exploration to date has defined sufficient proven and probable ore reserves, based upon historical conversion rates, to sustain mining for a number of years into the future at current mining rates. It is the Company’s practice to systematically convert its established probable ore reserves to the proven ore reserve category as mine development progresses by performing definition drilling and evaluation coincident with planned advances of underground development.
A key element of the Company’s development activities at its Montana mines consists of ongoing efforts to convert its established probable ore reserves into proven ore reserves by extending the lateral and vertical development of the Stillwater and East Boulder mines, which provides access for definition drilling and evaluation. These ongoing activities also include constructing and extending mine development workings to access established ore reserves and continuously advancing definition drilling, engineering and mine planning to replace depleted ore reserves. Costs incurred in connection with capitalized mine development at the Company's existing operations (excluding Blitz and Graham Creek development projects) were $68.6 million in 2014 compared to $60.0 million in 2013 and $53.5 million 2012. These capitalized mine development costs are included in total capital outlays. Development spending at the Montana operations in 2015 is planned to be broadly similar to 2014.
The following table outlines measures that are used by the Company to gauge progress on resource development activities:
Location and Development Activity | 2014 | 2013 | 2012 | ||||||
Stillwater Mine | |||||||||
Primary development (equivalent feet)(1) | 30,930 | 24,130 | 26,427 | ||||||
Footwall lateral (equivalent feet)(1) | 10,760 | 8,647 | 9,595 | ||||||
Definition drilling (feet) | 354,500 | 306,500 | 307,717 | ||||||
East Boulder Mine | |||||||||
Primary development (equivalent feet)(1) | 11,460 | 11,570 | 13,869 | ||||||
Footwall lateral (equivalent feet)(1) | 7,850 | 5,947 | 8,306 | ||||||
Definition drilling (feet) | 172,800 | 156,750 | 152,093 | ||||||
(1) Based on one linear foot of excavation, 11 feet wide by 12 feet high (cross-section of 132 ft.2).
The Company is continuing to develop new mining infrastructure adjacent to its current operations along the J-M Reef. In addition to the development spending planned within the Montana mines, approximately $29 million of total capital outlay (including $8 million of capitalized interest and capitalized depreciation) is planned in 2015 for the Blitz development adjacent to the Stillwater Mine.
21
The Blitz development includes three principal elements: (i) a tunnel boring machine, or TBM, targeting to drive approximately 23,000 feet of access tunnel to the east from the existing Stillwater Mine infrastructure; (ii) a second underground drift parallel to the TBM drive and approximately 600 feet above it, driven by conventional methods; and (iii) the permitting and construction of a new surface portal and decline intended to intersect the two Blitz drifts approximately four miles to the east of the existing Stillwater Mine facilities. The new surface portal will be conventionally driven and is intended to provide ventilation and emergency egress for the Blitz area. The TBM acquired for Blitz was fully commissioned during the fourth quarter of 2012 and is currently in operation. Construction of the second conventional drift is also in progress. As these drives advance, definitional and probe drilling will be performed to further enhance the Company’s understanding of the geology in this area. Total cost of the Blitz development is expected to be approximately $200 million, of which approximately $62 million has been incurred through the end of 2014.
The scope of the infrastructure development at Graham Creek was completed in the fourth quarter of 2014, along with the installation of the ventilation fan in the Graham Creek raise. Some initial ore has already been mined from the Graham Creek area and processed during 2014. Ore grades at Graham Creek appear consistent with current grades in the existing portion of the East Boulder Mine. The Graham Creek development extended underground access from the existing East Boulder Mine infrastructure approximately 8,800 feet to the west. This area is positioned to support an expanded mining program at the East Boulder Mine facilities. The Company is conducting a substantial diamond drilling program that is intended to identify the optimal location for the next mining ramp system for development within the Graham Creek area. The total cost of the Graham Creek project, including the ventilation shafts but excluding any subsequent definition drilling and development, was approximately $11.8 million.
Ontario, Canada
The Marathon properties are located 10 kilometers north of the town of Marathon, Ontario, on the eastern margin of the Coldwell Complex, a Proterozoic layered intrusion. The palladium, platinum and copper mineralization occurs principally in the Two Duck Lake gabbro. The known zones of significant mineralization have a total north-south strike length of approximately 3 kilometers and dip 30° to 40° toward the west. The mineralization has a true thickness ranging from 4 meters to 100 meters.
At the time it acquired the Marathon project in 2010, the Company regarded the project as a development-stage asset, with proven and probable reserves established by a favorable technical feasibility study completed earlier in 2010. Subsequently, the Company worked to advance the project toward environmental approval and simultaneously undertook detailed engineering work to update and finalize plans for the design and construction of an open pit mine and processing facility. The detailed engineering study also aimed to provide an updated economic assessment of the Marathon project.
In March 2012, Mitsubishi Corporation acquired a 25% interest in the Marathon project and associated properties from the Company. Mitsubishi assumed responsibility for funding its 25% share of operating, capital and exploration expenditures on the Marathon project. Under a related supply agreement, Mitsubishi is entitled to purchase up to 100% of the project's PGM production.
During 2012 the Company commissioned an updated third-party engineering feasibility study of the Marathon project, with the intent of verifying work done previously and completing detailed project design and economics. However, the updated feasibility study which became available in late 2013 showed that the project, as designed, did not provide an acceptable rate of return to justify development. The proposed mining plan was burdened by high third-party processing charges, increased capital and operating costs, a relatively short operational life and low copper concentrate grades. Consequently, at the end of 2013 the Company put on hold further environmental assessment review, reclassified Marathon as an exploration-stage asset, and ceased reporting proven and probable ore reserves on the property. The Company also recognized impairment, reducing the Marathon properties' carrying value from $228.6 million to their estimated fair value of $57.2 million at December 31, 2013. See "Management's Discussion and Analysis of Financial Condition and Results of Operations - Critical Accounting Policies - Asset Impairment" and "Note 4 - Asset Impairment" to the Company's 2014 consolidated financial statements for more information.
During 2014, the Company conducted a limited exploration program at Marathon in an effort to extend the potential mine life and thereby improve the project economics. The Company expects to continue this same level of activity at Marathon in 2015. In the meantime, the Company has scaled back the staffing associated with the Marathon assets.
22
San Juan Province, Argentina
In October 2011, the Company completed the acquisition of Peregrine Metals Ltd., a Canadian exploration company whose principal asset is the Altar project, a large Andean Porphyry copper-gold deposit located in the San Juan Province of Argentina. The property consists of eight wholly-owned mining concessions and five optioned mining concessions. Seven of these mining concessions are subject to production royalties, including a 1% net smelter royalty, and four other concessions are subject to a 2% net smelter royalty.
The Altar project is located in the Andes Mountains of Argentina, approximately 10 kilometers from the Argentina-Chile border, and approximately 180 kilometers west of the city of San Juan.
The Altar copper-gold project is an exploration-stage project. The project is primarily a copper-gold porphyry deposit with potential for discrete peripheral gold system targets. The Altar deposit currently exhibits open mineralization in most directions.
The annual drilling season in the Andes Mountains typically extends from December through April. The Company's 2014 exploration program did not include drilling and was limited to surface mapping and collection of baseline environmental data. The objectives for the 2015 exploration season include a limited exploration program of surface mapping, geophysical surveys and collection of baseline environmental data. The Company has posted a report that summarizes the cumulative drill results through 2013 on its webpage, www.stillwatermining.com.
During the third quarter of 2013, the Company identified certain events and changes in circumstances with regard to the Altar property that in the opinion of management were indicators of possible impairment. Continuing uncertainty in the legal and business climate in Argentina, announcements of reduced investment or the placement on care and maintenance of certain projects in the vicinity of the Company's Altar mineral property, significant changes in the global mining industry and on-going technical reviews within the Company were all considered in the Company's assessment. Considering these events individually and in the aggregate, the Company concluded to test the Altar mineral property for impairment as of September 30, 2013. As a result, the Company's third quarter 2013 financial results included a $290.4 million ($226.5 million, net after taxes) impairment charge to net income for the Altar mineral property. Please see "Note 4 - Asset Impairment" to the accompanying consolidated financial statements for a more complete discussion of asset impairment.
Notwithstanding this impairment charge, the Company is continuing to review alternatives for optimizing its investment in the Altar mineral property. In view of the present political environment in Argentina and the anticipated very large scale of any ultimate development of the Altar resource, the Company has concluded that, although the project appears to be a strong candidate for ultimate development, it is a poor strategic fit for the Company at this time. The Company intends to make the necessary annual expenditures required in order to maintain the Company's good standing and preserve its asset position at Altar while it evaluates alternatives for the Altar project. Future levels of exploration spending at Altar will be evaluated year by year.
OTHER PROPERTIES
The Company owns a warehouse facility in Columbus, Montana and leases office space in Columbus and Billings, Montana. The Company owns parcels of rural land in Stillwater and Sweet Grass Counties in Montana near its mines and metallurgical complex and additional commercial properties in the communities of Columbus and Big Timber, Montana. Subsidiaries of the Company own residential and commercial properties in Marathon, Ontario which are used as support facilities for operations and exploration projects at the Marathon properties. The Company’s subsidiaries lease office and warehouse space at various locations in Canada, Argentina and Chile. The Company’s corporate office is located in the office space leased in Billings, Montana. The annual expense for office leases in Montana totals approximately $0.3 million per year.
23
EMPLOYEES
At December 31, 2014, the Company employed 1,619 people. The following table shows the distribution of Company employees (excluding contractors) involved in each of the Company's activities:
Number of Employees | |||||||||
SITE | at December 31, | ||||||||
2014 | 2013 | 2012 | |||||||
Stillwater Mine | 942 | 1,057 | 989 | ||||||
East Boulder Mine | 419 | 414 | 373 | ||||||
Smelter and Refinery Complex | 187 | 196 | 190 | ||||||
Administrative Support | 61 | 75 | 80 | ||||||
Canadian Operations | 3 | 18 | 14 | ||||||
South American Operations | 7 | 13 | 18 | ||||||
Total | 1,619 | 1,773 | 1,664 | ||||||
All of the Company’s hourly employees at the Stillwater Mine, the East Boulder Mine, the smelter and the base metal refinery are represented by the United Steel Workers of America (USW). The Company is party to a four-year labor agreement expiring on June 1, 2015, that covers substantially all hourly workers at the Stillwater Mine, the smelter and the base metal refinery and provided for an annual wage increase of 5% per annum in 2011 and 2012 and 4% per annum increases in 2013 and 2014. Separately, the Company is party to a four-year labor agreement covering all hourly workers at the East Boulder Mine that is scheduled to expire on December 31, 2015. Provisions of the East Boulder Mine labor agreement are similar to those agreed at the Stillwater Mine and processing facilities. See “Risk Factors – Limited availability of skilled mining and management personnel may affect the Company’s ability to achieve its production targets."
MAJOR CUSTOMERS
Under the terms of the Company's agreements with Johnson Matthey, the Company utilizes Johnson Matthey for all of its precious metals refining services. In addition, with the exception of certain pre-existing platinum sales commitments to Tiffany & Co., all of the Company's current mined palladium and platinum is committed for sale to Johnson Matthey. Approximately 56.8% of the Company's total revenues for the year ended December 31, 2014, were derived from mine production. Separately, Johnson Matthey has the right to bid on any recycling PGM ounces the Company has available.
This significant concentration of business with Johnson Matthey could leave the Company without precious metals refining services should Johnson Matthey experience significant financial or operating difficulties during the contract period. See Risk Factors - "The Company's sales arrangements concentrate all of the Company's final refining activity and a large portion of its PGM sales from mine production with one entity."
PGM SALES AND HEDGING
MINE PRODUCTION
Palladium, platinum, rhodium, gold and silver are sold to several customers with whom the Company has established trading relationships. Refined PGMs of 99.95% purity (rhodium of 99.9%) in sponge-form are transferred upon sale from the Company’s account at the third-party refiner to the account of the purchaser. After final refining, by-product gold, silver and rhodium are normally sold at market prices to customers, brokers or outside refiners. Copper and nickel by-products from the Company’s base metal refinery are produced at less than commercial grade, so prices for these metals typically reflect a modest quality discount. By-product sales are included in revenues from mine production. During 2014, 2013 and 2012, total revenues from by-product (copper, nickel, gold, silver and mined rhodium) sales were $29.6 million, $27.1 million and $30.6 million, respectively.
The Company has a market-based platinum supply agreement in place with Tiffany & Co., through the end of 2015. At present the Company sells the remainder of its PGM mine production to Johnson Matthey under a five-year arrangement that commenced on July 1, 2014. Pricing is based on spot prices.
Currently, none of the Company’s mine production is committed under forward sales or other hedging arrangements that would result in a firm price well in advance of delivery. See "Note 6 - Derivative Instruments” to the Company’s 2014 consolidated financial statements for further information.
24
PGM RECYCLING
The Company has capacity available in its smelter and base metal refinery and purchases catalyst materials from third-parties for recycling in those facilities to recover PGMs. Some third-party material is toll processed for a fee and returned to the supplier after processing is complete. Toll processing is typically provided for recycled chemical and petroleum catalysts and less commonly for some suppliers of automotive catalysts.
The Company has entered into sourcing arrangements for spent catalyst material with several suppliers. Under these sourcing arrangements, the Company may advance cash to the suppliers, based on a percentage of the estimated PGM content, as spent catalyst materials are ready for shipment or in-transit to the Company’s facilities. These advances are reflected as advances on inventory purchases and included in Other current assets on the Company’s Consolidated Balance Sheets until such time as the material has been physically received and title has transferred to the Company. See “Risk Factors – The Company's recycling business segment is dependent on relationships with third-party suppliers.”
The Company regularly enters into fixed forward sales related to recycling of catalysts. These fixed forward sales transactions in the recycling business are not accounted for as derivatives because they qualify as “normal purchases / normal sales” under generally accepted accounting principles. Metals contained in recycled materials are generally sold forward at the time the material is purchased and then are delivered against the forward sales contracts when processing is completed and the finished ounces are recovered. Volumes sold forward are trued up as final assays are completed.
All of the Company’s recycling forward sales transactions open at December 31, 2014, will settle at various periods through August 2015. See "Note 6 - Derivative Instruments” to the Company’s 2014 consolidated financial statements for more information. The Company has credit agreements with certain of its major trading partners that would require the Company to make margin deposits in the event that forward prices for metals exceed the Company’s hedged prices by a predetermined margin limit. No margin deposits were required or outstanding at December 31, 2014, 2013 or 2012.
OTHER
Periodically, the Company acquires PGMs in the open market for resale to third parties or to settle small volume differences. The Company recognized revenue of $5.3 million on PGMs acquired in the open market and simultaneously resold to third parties during the year ended December 31, 2014. Most of these purchases for 2014 resale were essentially breakeven transactions undertaken for the convenience of certain customers. This revenue is shown as Other revenues and the associated acquisition cost is shown as Other costs and expenses in the Consolidated Statements of Comprehensive Income (Loss) contained in the Company's 2014 consolidated financial statements.
TITLE AND ROYALTIES
Montana, USA
The Company holds 1,511 patented and unpatented lode, tunnel site or mill site claims in Montana comprising approximately 23,111 acres along the trend of the J-M Reef mineral zone and on adjacent private or federal lands utilized for the Company’s operations facilities. The Company believes that approximately 130 of these claims cover the known apex of the J-M Reef. The Company’s remaining unpatented claims either adjoin the apex of the J-M Reef or secure sites for ongoing exploration and surface operations. The Company presently maintains 1,341 active unpatented lode, placer, tunnel site or mill site claims. See “Risk Factors – Certain of the Company's properties are subject to title risk, particularly related to the validity of unpatented mining claims.”
Of the Company’s 1,511 controlled claims, 868 claims are subject to production royalties, including 840 claims subject to a 5% net smelter royalty payable to Franco Nevada U.S. Corporation, 143 claims subject to a 0.35% net smelter royalty payable to the Mouat family, and 115 claims subject to both royalties. During 2014, 2013 and 2012, the Company incurred royalty expenses of $22.8 million, $17.9 million and $24.1 million, respectively.
Ontario, Canada
The Company currently holds mining claims and Crown leases covering the more prospective portions of the Port Coldwell Intrusive Complex. The Coldwell Complex is located near the northern shore of Lake Superior adjacent to the town of Marathon, Ontario and hosts the Marathon PGM-copper deposit. The Company’s aggregate property holdings in the Coldwell Complex include 44 crown leases and 82 mining claims. Each of the crown leases conveys to the Company certain mining rights, surface use rights, or combined surface and mining rights. Of the total area controlled under crown leases approximately 96% includes both surface and mining rights. Applications have been submitted for mining and surface leases on an additional 21 mining claims in order to expand the Company's crown leasehold position across the entire footprint of the Marathon property.
25
The Company’s Ontario properties in the Coldwell Complex remain subject to certain underlying provisions and production royalty interests. Production royalty interests include: a 2% net smelter return royalty in respect to the ‘Bamoos leases’; a 1% net smelter return royalty in respect to the ‘Bermuda claim’: a 2% net smelter return royalty in respect to the Par Lake, et.al. leases; a 1% net smelter return royalty in respect to certain of the 'Bermuda Properties'; a conditional 2% net smelter return royalty payable in respect to the ‘Coubran Lake’ claims; and a conditional 2.5% net smelter return royalty in respect to the ‘Geordie Lake claims’.
At the Company’s Geordie Lake exploration property, located approximately 8 kilometers west of the Marathon PGM-copper deposit, Gryphon Metals, Inc. retains a back-in option to a 12.5% working interest on the ‘Geordie Lake claims’. The option can be exercised upon completion and delivery of a feasibility study by the Company and Gryphon making a cash payment to the Company equal to 31.25% of all costs incurred on the property through completion of the feasibility study.
San Juan Province, Argentina
Altar contains a large porphyry-style copper-gold deposit and is comprised of six mining concessions acquired from Rio Tinto by Peregrine Metals Ltd. in 2009 (the original "Altar property"), five mining concessions known as the "Rio Cenicero concessions” held under option since 2008, one exploration concession staked in 2008, two mining concessions acquired in 2010, one exploration concession acquired in 2014, as well as five mining access rights of way and three occupancy easements. The original Altar property, the Rio Cenicero concessions, the mineral concession staked by Peregrine in 2008 and the mineral concessions acquired since are known collectively as the “Altar project.”
Vaaldiam Mining Inc. retains a 1% net smelter return royalty on all mineral products produced from the first six mining concessions at Altar. The original underlying concession owners also jointly hold a net smelter return royalty of 1% (the Robledo royalty) on four of the first six concessions, which the Company has the right to purchase at any time for $1.0 million. Until the mine achieves commercial production or the Company exercises its right to purchase the Robledo royalty, aggregate payments of $80,000 are payable annually. On the date of commencement of commercial production, the annual payments cease and the Robledo royalty becomes effective. The annual payments are in addition to, and not an advance against, the Robledo royalty.
The conditions of the Rio Cenicero Option Agreement include an initial five-year term for conducting exploration after which the Company has the option to convert its rights on the Rio Cenicero concessions from exploration to exploitation status. The Company has satisfied all payment and expenditure requirements for the exploration phase of the Option. As the result of defining substantial additional resource potential on the Rio Cenicero concessions during the Company’s recent exploration activities, the Company negotiated a two-year extension of the exploration phase of the Option Agreement. At commencement of commercial production monthly option payments cease and a net smelter return royalty of 1% becomes payable for all mineral products produced from the Rio Cenicero concessions.
26
REGULATORY AND ENVIRONMENTAL MATTERS
United States
The Company’s business is subject to extensive federal, state and local government controls and regulations, including regulation of mining and exploration activities which could involve the discharge of materials and contaminants into the environment, the investigation and cleanup of such discharges, disturbance of land, reclamation of disturbed lands, associated potential impacts to threatened or endangered species and other environmental concerns. In particular, statutes including, but not limited to, the Clean Air Act, the Clean Water Act, the Resource Conservation and Recovery Act, the Emergency Planning and Community Right-to-Know Act, the Endangered Species Act, the National Environmental Policy Act and the Comprehensive Environmental Response, Compensation and Liability Act impose permit requirements, effluent standards, air emission standards, waste handling and disposal restrictions and other design and operational requirements, as well as record keeping and reporting requirements, upon various aspects of mineral exploration, extraction and processing. In addition, the Company’s existing mining operations may become subject to additional environmental control and mitigation requirements if applicable federal, state and local laws and regulations governing environmental protection, land use and species protection are amended or become more stringent in the future. The Company is aware that federal regulation under the Resource Conservation and Recovery Act governing the manner in which secondary materials and by-products of mineral extraction and beneficiation are handled, stored and reclaimed or reused is subject to frequency review by the regulatory agencies which could affect the Company’s facility design, operations, and permitting requirements. In addition, expansions, modifications or upgrades to the Company’s mines and other systems may be delayed by permit review processes, and any operations deemed to be non-compliant with permits could be ordered to cease operations pursuant to applicable environmental laws and regulations. The Company could be required to conduct investigatory and remedial actions to mitigate pollution conditions caused by or attributed to its operations or former operations. See “Risk Factors – The Company is required to obtain and renew governmental permits in order to conduct operations, a process which is often costly and time-consuming.”
Generally, compliance with the above statutes requires the Company to obtain permits issued by federal, state and local regulatory agencies and to file various and numerous reports that track operational monitoring, compliance, performance and records maintenance activities, measuring its operational effect on the environment. Certain permits require periodic renewal or review of their conditions. The Company cannot predict whether it will be able to renew such permits or whether material changes in permit conditions will be imposed. Non-renewal of permits or the imposition of additional conditions could have a material adverse effect on the Company’s financial condition and results of operations.
Failure to comply with environmental laws and regulations may trigger a variety of administrative, civil and criminal enforcement measures, including the assessment of monetary penalties, orders requiring curtailment or cessation of operations and corrective measures requiring capital expenditures. Certain environmental statutes impose strict joint and several liability for costs required to clean up and restore sites where hazardous substances, hydrocarbons or wastes have been disposed or otherwise released. Moreover, it is not uncommon for neighboring landowners and other third parties to assert claims for personal injury and property damage allegedly caused by the Company's activities.
The trend in environmental regulation is to place more restrictions and limitations on activities that may affect the environment, and thus, there can be no assurance as to the amount or timing of future expenditures for environmental compliance or remediation and actual future expenditures may be different from the amounts the Company currently anticipates. The Company attempts to anticipate future regulatory requirements that might be imposed and plan accordingly to remain in compliance with changing environmental laws and regulations and to minimize the costs of such compliance.
27
Hazardous Substances and Waste
The Company’s operations are subject to environmental laws and regulations relating to the management and release of hazardous substances, solid wastes and hazardous wastes. These laws generally regulate the generation, storage, treatment, transportation and disposal of solid and hazardous waste and may impose strict joint and several liability for the investigation and remediation of affected areas where hazardous substances may have been released or disposed. For instance, the CERCLA, and comparable state laws impose liability, without regard to fault or the legality of the original conduct, on certain classes of persons that contributed to the release of a hazardous substance into the environment.
While some of the industrial waste generated by the Company’s operations is excluded from hazardous waste regulations, the Company also generates industrial waste that is subject to the requirements of the Resource Conservation and Recovery Act (RCRA), and comparable state statutes. The Company generates relatively little hazardous waste; however, it is possible that other wastes, which could include wastes currently generated during the Company’s operations, will in the future be designated as “hazardous wastes” and therefore, be subject to more rigorous and costly disposal requirements. Any such changes in the laws and regulations could have a material adverse effect on the Company’s capital expenditures and operating expenses.
The Company currently owns or leases properties where hazardous substances and wastes are being or have been handled for many years. These properties and the wastes disposed thereon may be subject to CERCLA, RCRA and analogous state laws. Under these laws, the Company could be required to remove or remediate previously disposed wastes (including wastes disposed of or released by prior owners or operators, or wastes disposed of by the Company in compliance with laws in effect in the past that have been subsequently amended), to clean up contaminated property (including contaminated soil and groundwater) or to perform remedial operations to prevent future contamination. The Company is not currently aware of any facts, events or conditions relating to such requirements that could materially impact its operations or financial condition. The Company annually reports to the EPA releases of hazardous or toxic substances to the extent they exceed certain federal thresholds.
Air Emissions
The Company’s operations are subject to the federal Clean Air Act and comparable state and local laws and regulations. These laws and regulations regulate emissions of air pollutants from various industrial sources, including combustion engines used at the Company’s mines and processing facility, and also impose various monitoring and reporting requirements. For example, the mining and smelting operations are subject to particulate matter limits under the federal New Source Performance Standards, and the smelting facility is subject to stringent SO2 limits. In June 2010, the EPA issued new National Ambient Air Quality Standards (NAAQS) for SO2, and replaced 24-hour and annual standards with a more stringent hourly standard. In May 2014, the EPA proposed to allow states to use single-source modeling, as well as monitoring, to assess whatever areas meet the standard. The EPA has designated only portions of the country, and is delaying designations for most counties, including Stillwater County. Such laws and regulations may require that the Company obtain pre-approval for the construction or modification of certain projects or facilities expected to produce or significantly increase air emissions, obtain and strictly comply with air permits containing various emission and operational limitations and utilize specific emission control technologies to limit emissions. The Company’s failure to comply with these requirements could result in monetary penalties, injunctions, conditions or restrictions on operations and, potentially, criminal enforcement actions. The Company may be required to incur certain capital expenditures in the future for air pollution control equipment in connection with newly issued NAAQS, as well as obtaining and maintaining operating permits and approvals for air emissions.
Water Discharges
The Federal Water Pollution Control Act (Clean Water Act) and analogous state laws impose restrictions and strict controls on the discharge of pollutants into state waters as well as waters of the U.S. and on construction activities in waters and wetlands. Certain state regulations and the general permits issued under the Federal National Pollutant Discharge Elimination System program prohibit the discharge of pollutants and chemicals. Spill prevention, control and countermeasure requirements of federal laws require appropriate containment berms and similar structures to help prevent the contamination of regulated waters in the event of a tank spill, rupture or leak. In addition, the Clean Water Act and analogous state laws require individual permits or coverage under general permits for discharges of storm water runoff from certain types of facilities. These permits may require the Company to monitor and sample the storm water runoff from certain of its facilities. Federal and state regulatory agencies can impose administrative, civil and criminal penalties for non-compliance with discharge permits or other requirements of the Clean Water Act and analogous state laws and regulations. As permits are periodically renewed, discharge restrictions may be added or modified, which could result in significant additional compliance cost to the Company. The Company believes that compliance with existing permits and with foreseeable new permit requirements will not have a material adverse effect on its financial condition, results of operations or cash flows.
28
Climate Change and Greenhouse Gas Emissions
Recent scientific studies have suggested that emissions of certain gases, commonly referred to as “greenhouse gases” (GHG) and including carbon dioxide and methane, may be contributing to warming of the Earth’s atmosphere. In response to the scientific studies, international negotiations to address climate change have occurred. The United Nations Framework Convention on Climate Change, also known as the “Kyoto Protocol,” became effective on February 16, 2005, as a result of these negotiations, but the United States did not ratify the Kyoto Protocol. At the end of 2009, an international conference to develop a successor to the Kyoto Protocol issued a document known as the Copenhagen Accord. Pursuant to the Copenhagen Accord, the United States submitted a GHG emission reduction target of 17 percent compared to 2005 levels. In November 2014, President Obama expanded this goal, proposing to cut U.S. GHG emissions by 26% to 28% of 2005 levels by the end of 2025. The effect of these international efforts to address climate change on the Company’s operations cannot be determined with any certainty at this time.
In the U.S., legislative and regulatory initiatives are underway to limit GHG emissions. The U.S. Congress has considered legislation that would control GHG emissions through a “cap and trade” program and several states have already implemented programs to reduce GHG emissions. In addition, The U.S. Supreme Court determined in a 2007 ruling that GHG emissions are "air pollutants" within the meaning of the federal Clean Air Act (CAA), and in response the EPA promulgated an endangerment finding paving the way for regulation of GHG emissions under the CAA. In 2010, the EPA issued a final rule, known as the “Tailoring Rule,” that makes certain large stationary sources and modification projects subject to permitting requirements for greenhouse gas emissions under the Clean Air Act. In June 2014, however, the Supreme Court invalidated portions of the federal Tailoring Rule, but the ruling upheld the EPA's authority to require new or modified facilities that already are subject to permitting requirements for conventional pollutants to comply with Best Available Control Technologies for GHGs, as well.
In 2009, the EPA issued a final rule requiring the reporting of GHGs from specified large GHG emission sources in the U.S. beginning in 2011 for emissions in 2010. The Company’s facilities annually calculate the GHG emissions and compare these amounts against reporting thresholds however the Company is not required to report GHG emissions at this time. Additionally, the assessment of GHG emissions is becoming an increasingly important part of NEPA assessments, and as a result the Company may be required to mitigate its GHG emissions in connection with any future NEPA review.
Because regulation of GHG emissions is relatively new, further regulatory, legislative and judicial developments are likely to occur. Due to the uncertainties surrounding the regulation of and other risks associated with GHG emissions, the Company cannot predict the financial impact of future GHG regulations and related developments.
Other Environmental Matters
In an effort to protect the health of the Company's workforce, the Company employs various measures to ensure it is complying fully with strict MSHA limits on diesel particulate matter (DPM) exposure for underground miners. These measures include using catalytic converters, filters, and enhanced ventilation regimens, modifying certain mining practices underground that tend to create concentrations of DPM, and utilizing various blends of cleaner-burning biodiesel fuel. The Company believes its underground operations at the Stillwater and East Boulder mines are in compliance with MSHA’s existing stringent DPM standards. However, no assurance can be given that any lack of compliance in the future will not impact the Company.
Nitrate concentrations in groundwater samples taken near the Company's operations in some cases have shown readings elevated above background and permit levels at both the Stillwater Mine and the East Boulder Mine. These readings result from operational activities and discharges that currently are authorized under permit. Noncompliance with groundwater nitrate standards has occurred in some instances. The Company is addressing this issue through action plans approved by the appropriate federal and state regulatory agencies. In view of its good-faith efforts to comply and progress to date in implementing remedial and advanced treatment technologies, the Company does not believe that its current failure to be in strict compliance will have a material adverse effect on the Company. The Company fully expects that the remedial measures it is taking will be effective in reducing groundwater nitrate concentrations to a level that meets permit and statutory water quality standards.
29
The Company believes that its operations and facilities comply in all material respects with current federal, state and local permits and regulations, and that it holds all necessary permits for its operations at the Stillwater and East Boulder mines and to complete essentially all of its planned expansion projects along the J-M Reef. However, compliance with existing and future laws and regulations may require additional control measures and expenditures, which cannot be estimated at this time. Compliance requirements for new or expanded mines and mills may require substantial additional control measures that could materially affect permitting and proposed construction schedules for such facilities. Under certain circumstances, facility construction may be delayed pending regulatory approvals. The cost of complying with future laws and regulations may render currently operating or future properties less profitable and could adversely affect the level of the Company’s ore reserves and, in the extreme, render its mining operations uneconomic.
PERMITTING AND RECLAMATION
Operating Permits 00118 and 00149 issued by the Montana Department of Environmental Quality (DEQ) encompass approximately 2,613 acres at the Stillwater Mine located in Stillwater County, Montana and 986 acres at the East Boulder Mine located in Sweet Grass County, Montana. The permits delineate lands that may be subject to surface disturbance. At present, approximately 847 acres have been disturbed at the Stillwater Mine, and 210 acres have been disturbed at the East Boulder Mine. The Company employs concurrent reclamation wherever feasible.
Reclamation regulations affecting the Company’s operations are promulgated and enforced by the Hard Rock Bureau of the Montana DEQ. The USFS may impose additional reclamation requirements during the permitting process. For regulatory purposes, reclamation means returning the post-mining land to a state which has stability and utility comparable to pre-mining conditions. Major reclamation requirements include stabilization and re-vegetation of disturbed lands, controlling storm water and drainage from portals and waste rock dumps, removal of roads and structures, the treatment and elimination of process solutions, the reclamation of major tailings storage facilities and the treatment and elimination of mine water prior to discharge in compliance with standards and visual mitigation.
Permits governing air and water quality are issued to the Company by the Montana DEQ, which has been delegated such authority by the federal government. Operating permits issued to the Company by the Montana DEQ and the USFS do not have an expiration date but are subject to periodic reviews. The reviews evaluate bonding levels, monitor reclamation progress, and assess compliance with all applicable permit requirements, mitigation measures and state and federal environmental standards. Closure and reclamation obligations are reviewed and reassessed by the agencies and the Company on a five year rotating schedule. Bonding and financial guarantees are posted with the agencies to cover final reclamation costs at the end of the reconciliation and reassessment process.
The Company’s environmental expenses for Montana operations were $4.7 million, $4.6 million, and $4.3 million in 2014, 2013 and 2012, respectively. The Company had capital outlays for environmental facilities during 2014, 2013 and 2012 of $16.3 million, $2.0 million and $3.1 million, respectively. The primary driver of the increase in capital outlays for 2014 was the Hertzler tailings expansion taking place at the Stillwater Mine. The Company’s ongoing operating expenditures for environmental compliance are expected to be broadly in the range of previous years and will be expensed as incurred.
Ontario, Canada
During 2015 the Company expects to advance with a modest exploration program for the Marathon project in Canada. The Company's prior focus was on completing the updated feasibility study and on exploring various options and opportunities to improve the project economics. It was determined that through future exploration success, an increase in mine life may be a significant factor to improve project economics. The Company believes that such changes and enhancements, some of which could alter the scope of the Marathon development, will be required to make development of the Marathon project economically viable at recently prevailing and anticipated PGM prices. Because the scope of the project and resulting project design could be significantly modified, in early 2014 the Company asked the Canadian federal and provincial Joint Review Panel charged with completing an environmental assessment of the project to suspend its review process until the Company determines how and if the project is going to proceed. See “Risk Factors – The Company's foreign assets subject the Company to additional risks.” During 2015 the Company expects to conduct a limited exploration program on its Marathon properties in Canada to determine if there is opportunity to extend the potential project life.
30
San Juan Province, Argentina
The Altar project, described in more detail in “Business and Properties - Title and Royalties” is currently an exploration stage project. In Argentina, the Environmental Law for Mining Business, Law No 24.585, is incorporated into the Mining Code. It aims to protect the environment and preserve natural and cultural heritage, which may be susceptible to impact by mining activities. Activities specified in the above-mentioned regulations cover the following activities or project stages:
• | Prospecting |
• | Exploration |
• | Development |
• | Preparation |
• | Extraction |
• | Final Closure of the Mine |
COMPETITION: PALLADIUM AND PLATINUM MARKET
GENERAL
Palladium and platinum are rare precious metals with unique physical qualities that are used in diverse industrial applications and in the jewelry industry. The development of a less expensive alternative alloy or synthetic material with the same characteristics as PGMs for industrial purposes could reduce demand for the Company’s products and drive down PGM prices, as would alternate technology which would significantly reduce or eliminate the use of PGMs in the handling of vehicle emissions. Although the Company is unaware of any such alloy, material or technology there can be no assurance that none will be developed. Jewelry demand is influenced by a variety of external factors, including fashion trends, metal prices and the general state of the economy. Adverse changes in any of these factors could negatively affect the Company’s financial performance.
Significant quantities of palladium and platinum are held in inventory by investors, trading houses and government entities. The number of ounces in each of these inventories is not always disclosed publicly, nor is it clear under what circumstances these holdings might be brought to market. For example, in the past the Russian Federation has held large inventories of palladium as a strategic stockpile, exporting and selling substantial volumes from time to time without warning into the market. There is no official disclosure of the current size of the Russian palladium inventories or clarity as to plans for future sales, but some observers have suggested that reduced exports in recent years indicate the Russian government inventories now are nearly depleted. Also, ETFs for palladium and platinum have been introduced in recent years that enable more investors to participate in the PGM markets, potentially resulting in more metal being held in inventory. The overhang from these significant investment holdings of palladium and platinum makes it more difficult to predict accurately future supply and demand for these metals and may contribute to added PGM price volatility.
The Company competes with other suppliers of PGMs, some of which are significantly larger than the Company. Some significant suppliers produce platinum in greater quantities than palladium and thus currently enjoy higher average revenue per PGM ounce than the Company. Some significant suppliers of PGMs produce palladium and platinum as by-products of other production and consequently, on a relative basis, are not as directly affected by changes in the prices of palladium and platinum as the Company is. See “Global Supply” below. New mines may be developed over the next several years, potentially increasing supply. Furthermore, the volume of PGMs recovered through recycling of scrap sources, mostly spent automotive and industrial catalysts, is increasing. There can be no assurance that the Company will be successful in competing with these existing and emerging PGM producers. See “Risk Factors” and “Management’s Discussion and Analysis of Financial Condition and Results of Operations.”
GLOBAL DEMAND
Johnson Matthey estimates that in 2014 gross demand for palladium grew by approximately 10.7% to 10.51 million ounces from 9.50 million ounces in 2013. Their Platinum 2013 Headline Data published in November 2014 (Johnson Matthey PLCs "Platinum 2013 Interim Review"; Johnson Matthey or the Johnson Matthey report), reported that during 2014 palladium demand increased in the automotive catalyst market; however, demand for palladium in jewelry and industrial applications declined. Net investment demand for palladium totaled approximately 837,000 ounces in 2014 after declining slightly in 2013; the Company believes the increase in 2014 in part reflected new demand stimulated by the introduction in 2014 of two palladium ETF investment vehicles in South Africa during 2014.
31
•The principal application for palladium is in automotive catalytic converters that reduce harmful emissions from internal combustion engines. In 2014, this industry consumed approximately 7.30 million ounces or approximately 69% of 2014 gross worldwide palladium demand. (If investment demand is excluded, automotive consumption represented approximately 75.4% of total palladium demand in 2014, up from 73.2% in 2013.)
•Palladium is used industrially in the production of electronic components for personal computers, cellular telephones, facsimile machines and other devices; in dentistry as a component of some fillings; and in chemical processes as a catalyst. Johnson Matthey indicates gross year-on-year industrial sector demand for palladium decreased during 2014 by 5.1% to approximately 2.08 million ounces. Johnson Matthey estimates that this sector comprised approximately 19.8% of total 2014 palladium demand (21.5% excluding net investment demand).
•Total palladium jewelry demand worldwide for 2014 is estimated by Johnson Matthey to have decreased by approximately 16% from the previous year to approximately 300,000 ounces. Palladium is used directly in jewelry fabrication, and in some regions it is alloyed with gold to make white gold.
•As noted, Johnson Matthey reported net investment demand for palladium of 837,000 ounces in 2014 compared to net liquidation of approximately 8,000 ounces during 2013.
Over the past decade, platinum's considerable pricing premium over palladium has driven substitution of palladium for platinum in diesel catalytic converters. The technical limit on palladium substitution reportedly has risen to as much as 50% of the total PGMs in diesel catalytic converters, although Johnson Matthey has estimated that current diesel production models on average contain approximately 30% palladium. For gasoline-powered cars, many current models use only palladium and rhodium, with no platinum at all in the catalytic converter.
The effect of introducing ETFs for palladium and platinum has been to broaden access for retail investors seeking exposure to PGMs but also seems to have increased market pricing volatility, particularly for palladium. Johnson Matthey estimates that in 2014 there was a worldwide deficit of approximately 1.6 million ounces in global palladium supply (including PGMs from recycling), as continuing growth in automotive demand has outstripped new production. The deficit was presumably made up through drawing down above-ground inventories of finished metal and investment holdings. Based on the London market, the market price of palladium during 2014 ranged from a low on February 4, 2014, of $702 per ounce, to a high of $911 per ounce on September 1, 2014, and closed 2014 at a price of $811 per ounce.
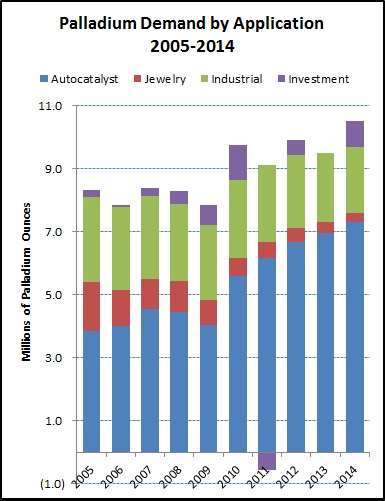
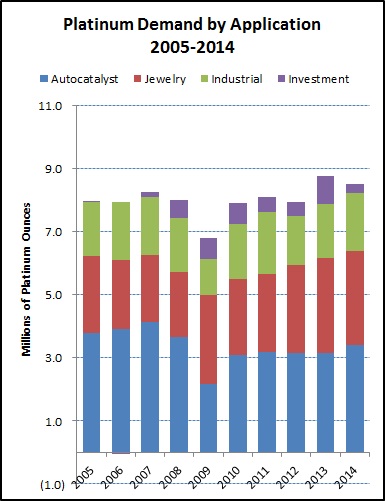
Charts reproduced from the Johnson Matthey "Headline Data" and historical data tables.
Johnson Matthey has estimated that in 2014 total demand for platinum declined by approximately 2.7% to approximately 8.52 million ounces from 8.75 million ounces in 2013. Most of the decline was attributable to lower investment demand in 2014, following a boost to investment demand in 2013 from the introduction of a new platinum ETF.
32
•Platinum purchases by the auto catalyst sector grew during 2014 to 3.39 million ounces from 3.15 million ounces in 2013, primarily reflecting a gradual recovery during 2014 in the European auto market.
•Jewelry demand for platinum in 2014 stayed relatively even with 2013, at approximately 3.0 million ounces, although by historical standards this suggests a strong market. This level of interest reflects consumer response in China and other Asian markets to comparatively low platinum prices during both years.
•Industrial uses of platinum include the production of data storage disks, fiberglass, paints, nitric acid, anti-cancer drugs, fiber optic cables, fertilizers, unleaded and high-octane gasoline and fuel cells. Johnson Matthey projects that gross industrial consumption of platinum during 2014 increased by approximately 7.7% to 1.84 million ounces.
The outlook for platinum demand during 2015 will depend on the health of the auto market in Europe, which remains the largest market for platinum. Jewelry demand also plays a key role in the demand for platinum and, as a discretionary market, is particularly sensitive to metal prices. Jewelry has been a bright spot for platinum in recent years. However, the platinum pricing outlook in 2015 probably will depend on supply side issues as well as on European economic recovery and jewelry demand.
Johnson Matthey estimates that worldwide platinum production in 2014 (including recycling) trailed total demand by approximately 1.1 million ounces. Again, this shortfall presumably was met from above-ground inventories and from stocks in the production pipeline. The price of platinum during 2014, based on the London market, ranged from a high of $1,512 per ounce reached on July 10, 2014, compared to a low of $1,178 per ounce on November 14, 2014. Platinum closed the year trading at $1,206 per ounce. See “Risk Factors – Users of PGMs may reduce their consumption and substitute other materials for palladium and platinum.”
GLOBAL SUPPLY
Johnson Matthey estimates that total palladium supplied to market in 2014 (including recycled material) totaled approximately 8.89 million ounces, down 2.4% from 9.11 million ounces in 2013. Much of this decline is attributable to production lost during the first five months of 2014 as a result of labor difficulties in South Africa.
The leading global sources of palladium and platinum are mines located in the Republic of South Africa and the Russian Federation. Johnson Matthey estimates that (excluding recycling) South Africa provided approximately 34% of the palladium and 68% of the platinum sold worldwide during 2014. The same report also estimates that the Russian Federation, mainly as a by-product of nickel production from Norilsk Nickel, provided approximately 42% of the palladium and nearly 15% of the platinum sold worldwide in 2014 (see charts below). (These charts include recycling as part of new supply.)
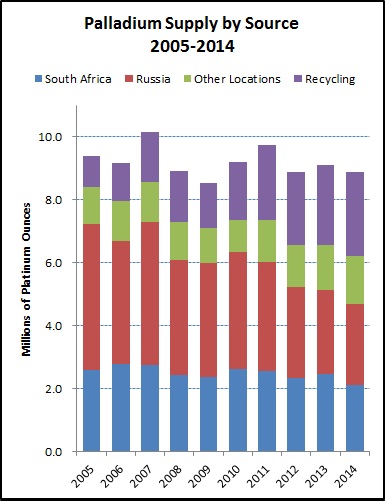
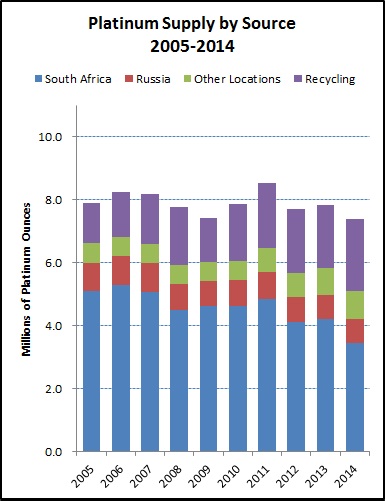
Chart data extracted from Johnson Matthey 'Headline Data" and historical data tables.
33
Supply numbers provided by Johnson Matthey are for metals entering the market and do not necessarily represent metals actually produced during the years shown. For palladium, historically this may constitute a significant year-to-year difference because of unpredictable releases out of the strategic state inventories held by the Russian Federation, as well as those held by the auto companies and investors. According to Johnson Matthey, worldwide mine production of palladium in 2014 is estimated at 6.20 million ounces, down approximately 5.8% from the 6.58 million ounces produced in 2013. Annual worldwide mine production of platinum for 2014 is estimated to be 5.10 million ounces, down 12.4% from approximately 5.82 million ounces in 2013, again mostly reflecting labor interruptions in South Africa.
Various analysts have commented that the outlook for palladium in the future is particularly sensitive to the status of the above-ground inventories. Specific information on these inventory stocks is not readily available, and releases from stockpiles are not predictable in timing or size. Analyst outlooks projecting a significant palladium supply deficit generally assume any shortfall will be offset by liquidating these above-ground stocks. At some level, enticing liquidation of these inventories may require higher metal prices.
Similar issues also exist in the platinum market. It is generally estimated that, at least until European auto demand fully recovers, there is excess platinum available in the market. In prior years, the South African platinum producers have seen their profit margins squeezed by weak platinum prices, reflecting this oversupply. Efforts to close down uneconomic operations have met with fierce political opposition, slowing if not altogether blocking efforts to rationalize South African platinum production. Of late, however, the South African rand has weakened sharply against the U.S. dollar, marginally improving South African producers' profitability and potentially reducing the urgency to rationalize their production levels.
In addition to mine sources, PGMs are recovered from recycling of automotive catalytic converters acquired from scrap dealers, and to a lesser extent from industrial catalyst materials, jewelry and electronic scrap. A growing industry has developed in the collection and recovery of PGMs from scrap sources, including automotive catalytic converters, electronic and communications equipment and petroleum catalysts. Johnson Matthey estimates 2014 worldwide recoveries from recycling provided 2.69 million ounces of palladium and 2.28 million ounces of platinum, up from 2.53 million ounces of palladium and 2.03 million ounces of platinum in 2013.
34
PRICES
The Company’s revenue and earnings depend significantly on world palladium and platinum market prices. The Company has no direct control over these prices, and PGM prices can fluctuate widely. The Company does have the ability to hedge prices in order to mitigate some of the Company’s price exposure, although management believes that in general the Company's shareholders prefer to accept its unhedged PGM price exposure for mined production. Except for materials purchased in its recycling activities, the Company does not currently hedge any of its PGM production and is fully exposed to fluctuations in PGM prices. See “Management’s Discussion and Analysis of Financial Condition and Results of Operations – Principal Factors Affecting the Company” and “Cautionary Information Regarding Forward-Looking Statements.”
The volatility of palladium and platinum prices is illustrated in the following table of the London market of annual high, low and average prices per ounce since 2005. The accompanying charts also demonstrate this volatility. See “Risk Factors – Volatility in the market price of the metals sold by the Company, and changes in the supply and demand of these metals could reduce profitability.”
PALLADIUM | PLATINUM | |||||||||||||||||||||||
YEAR | HIGH | LOW | AVERAGE | HIGH | LOW | AVERAGE | ||||||||||||||||||
2005 | $ | 295 | $ | 172 | $ | 201 | $ | 1,012 | $ | 844 | $ | 897 | ||||||||||||
2006 | $ | 404 | $ | 261 | $ | 320 | $ | 1,355 | $ | 982 | $ | 1,143 | ||||||||||||
2007 | $ | 382 | $ | 320 | $ | 355 | $ | 1,544 | $ | 1,118 | $ | 1,303 | ||||||||||||
2008 | $ | 582 | $ | 164 | $ | 352 | $ | 2,273 | $ | 763 | $ | 1,576 | ||||||||||||
2009 | $ | 393 | $ | 179 | $ | 264 | $ | 1,494 | $ | 918 | $ | 1,204 | ||||||||||||
2010 | $ | 797 | $ | 395 | $ | 526 | $ | 1,786 | $ | 1,475 | $ | 1,610 | ||||||||||||
2011 | $ | 858 | $ | 549 | $ | 734 | $ | 1,887 | $ | 1,354 | $ | 1,720 | ||||||||||||
2012 | $ | 722 | $ | 565 | $ | 644 | $ | 1,729 | $ | 1,390 | $ | 1,552 | ||||||||||||
2013 | $ | 774 | $ | 643 | $ | 725 | $ | 1,736 | $ | 1,317 | $ | 1,487 | ||||||||||||
2014 | $ | 911 | $ | 702 | $ | 803 | $ | 1,512 | $ | 1,178 | $ | 1,385 | ||||||||||||
2015* | $ | 817 | $ | 757 | $ | 784 | $ | 1,285 | $ | 1,193 | $ | 1,243 | ||||||||||||
* (Through February 12, 2015)
History has shown that the market price of palladium can be extremely volatile. During the last 10 years the price of palladium has fluctuated from a low of $164 per ounce in December 2008 to a high of $911 per ounce in September 2014. During 2014 palladium averaged $803 per ounce for the year overall, ending the year quoted in the London market at $811 per ounce. At February 12, 2015, the market price of palladium in the London market was $772 per ounce.
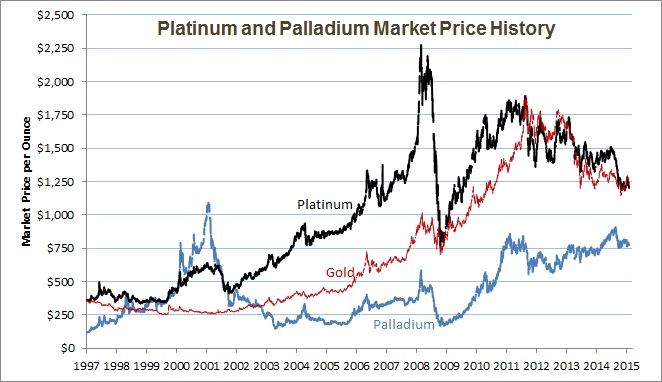
35
The market price of platinum trended generally upward from $440 per ounce at the end of 2001 to $1,530 at the end of 2007. In late January 2008, following the announcement of electrical power shortages in South Africa, the price rose sharply, peaking in March 2008 at $2,273 per ounce in the London market. Beginning in June 2008, however, the price declined steeply as the economy deteriorated in the second half of 2008, hitting a low of $763 per ounce and, like palladium, subsequently has recovered strongly. The year 2014 saw volatility in the platinum price, directionally tracking the price of gold. The platinum price averaged $1,385 per ounce for the year overall, ending 2014 quoted in the London market at $1,206 per ounce. On February 12, 2015, the London market price for platinum was $1,204 per ounce.
AVAILABLE INFORMATION
The Company’s Internet website is www.stillwatermining.com. The Company makes available free of charge through its Internet website its annual reports on Form 10-K, quarterly reports on Form 10-Q, current reports on Form 8-K, corporate proxy statements and any amendments to those reports, as soon as reasonably practicable after the Company electronically files such materials with, or furnishes them to, the Securities and Exchange Commission. These documents will also be provided free of charge in print upon request.
The Company also makes available on its website its Corporate Governance Principles, Business Ethics and Code of Conduct Policy, Code of Ethics for Chief Executive and Senior Financial Officers and the Charters of the Audit, Compensation, Corporate Governance and Nominating, Health, Safety and Environment and Technical and Ore Reserve Committees of its Board of Directors. Information on the Company’s website is not incorporated by reference into this report and should not be considered part of this document.
The Company's business, operations and financial condition are subject to various risks and uncertainties. Set forth below are certain risks faced by the Company. Investors should carefully consider the risks and uncertainties described below, together with all of the other information in this Annual Report on Form 10-K and in other documents that the Company files with the U.S. Securities and Exchange Commission.
The Company's sales arrangements concentrate all of the Company's final refining activity and a large portion of its PGM sales from mine production with one entity.
Under the terms of the Company’s agreements with Johnson Matthey, the Company utilizes Johnson Matthey for all of its precious metals refining services. In addition, with the exception of certain pre-existing platinum sales commitments to Tiffany & Co., all of the Company’s current mined palladium and platinum is committed for sale to Johnson Matthey. Approximately 56.8% of the Company’s total revenues for the year ended December 31, 2014, were derived from mine production. Separately, Johnson Matthey has the right to bid on any recycling PGM ounces the Company has available.
This significant concentration of business with Johnson Matthey could leave the Company without precious metal refining services should Johnson Matthey experience significant financial or operating difficulties during the contract period. Under such circumstances, it is not clear that sufficient alternate processing capacity would be available to cover the Company’s requirements, nor that the terms of any such alternate processing arrangements as might be available would be financially acceptable to the Company. Any such disruption in refining services would have a negative effect on the Company’s ability to generate revenues, profits, and cash flows.
Volatility in the market price of the metals sold by the Company, and changes in the supply and demand of these metals could reduce profitability.
Because the Company’s primary source of revenue is the sale of PGMs, changes in the market price of PGMs will affect the Company's profitability. Many factors beyond the Company’s control influence the market prices of these metals. These factors include global supply and demand, speculative activities, international political and economic developments, currency exchange rates, and production levels and costs in other PGM-producing countries, principally South Africa and Russia.
36
A prolonged or significant economic contraction in North America, Europe or in any of several other key regions worldwide can put downward pressure on market prices of PGMs, particularly if demand for PGMs declines in connection with reduced automobile demand and more restricted availability of investment credit. If investors release substantial volumes of PGMs into the market from stockpiles, ETF holdings or otherwise, the increased supply can reduce the prices of palladium and platinum. Changes in currency exchange rates, and particularly the significant weakening of the South African rand or Russian rouble, can reduce relative costs of production and improve the competitive cost position of South African and Russian PGM producers. This in turn could reduce the worldwide competitiveness of the Company’s North American operations and make new PGM investment more attractive in South Africa and Russia.
ETFs for palladium and platinum have been introduced in recent years that enable more investors to participate in the PGM markets, potentially resulting in more metal being held in inventory. The overhang from these significant investment holdings of palladium and platinum makes it more difficult to predict accurately future supply and demand for these metals and may contribute to added PGM price volatility.
Reductions in PGM prices would adversely affect the Company’s revenues, profits and cash flows. Protracted periods of low metal prices could significantly reduce revenues and the availability of required development funds to levels that could cause portions of the Company’s ore reserves and production plan to become uneconomical. This could lead to substantial reductions in PGM production or to suspension of mining operations, as well as to impairment of asset values and reductions in the Company’s proven and probable ore reserves. See “Business and Properties – Competition: Palladium and Platinum Market” for further explanation of these factors.
Extended periods of high commodity prices may create economic dislocations that may be destabilizing to PGM supply and demand and ultimately to the broader markets. Periods of high PGM market prices generally are beneficial to the Company’s financial performance. However, strong PGM prices also create economic pressure to identify or create alternate technologies that ultimately could depress future long-term demand for PGMs, and at the same time may incentivize development of otherwise marginal mining properties. See “Risk Factors – Users of PGMs may reduce their consumption and substitute other materials for palladium and platinum” for additional discussion of these risks.
The Company has significant financial obligations.
At December 31, 2014, the Company had outstanding aggregate balance sheet indebtedness of approximately $296.2 million and a debt-to-equity ratio of 0.32. The Company’s level of indebtedness may, among other things:
• | Result in higher interest charges and reduce the Company's net income in future periods; |
• | Limit the Company’s ability to obtain additional debt financing in the future for working capital, capital expenditures, acquisitions, or other general corporate purposes; |
• | Require the Company to dedicate a substantial portion of its cash flow from operations to service its debt, reducing the availability of cash flow for other purposes; |
• | Increase the Company’s vulnerability to economic downturns, limit its ability to capitalize on significant business opportunities, and restrict its flexibility to react to changes in market or industry conditions; or |
• | Make it more difficult to pay its debts. |
The Company’s credit rating currently is below investment grade and is not expected to achieve investment grade in the immediate future. There is no assurance that the Company will be able to access the financial markets when it so desires nor, if it is able to access the financial markets, that terms and rates offered will be acceptable. As a result of its credit rating and market conditions generally, in the past the Company has on occasion been unable to secure financing on terms acceptable to the Company.
Interest rates at present are near historic lows, and borrowing costs appear likely to rise in the future in step with any significant improvement in economic conditions. Higher interest rates would increase the Company's cost of borrowing under its revolving credit facility and for any new borrowings.
The Company does not provide any formal sinking fund for retiring its outstanding long-term debt. Prior to debt coming due, the Company normally attempts to arrange replacement financing or use internal funds sufficient to retire its maturing debt. However, there can be no assurance that the Company will be able to obtain alternate financing or accumulate sufficient funds internally to meet its repayment obligations as debt comes due in the future. The Company is restricted under the terms of its revolving credit lines from drawing against them to redeem outstanding debt. If the Company does not have adequate liquidity available and is unable to fund the timely repayment of its outstanding debt, it would be in default and could be forced to sell assets or seek protection from creditors.
37
The Company's recycling business segment is dependent on relationships with third-party suppliers.
The Company purchases automotive and industrial catalyst materials from third-parties. The Company has entered into sourcing arrangements for recycled materials with various suppliers, and it depends on those suppliers to provide catalyst and other industrial sources for recycling. The Company is subject to the suppliers’ compliance with the terms of these arrangements and to their contractual right to terminate or suspend the agreement. Should one or more of these sourcing arrangements be terminated, the Company might be unable to purchase replacement recyclable materials on terms that are acceptable to the Company. If the Company is unable to acquire sufficient quantities of recycled materials, the recycling business would become less profitable, and this loss could negatively affect the Company’s business and results of operations. Similarly, these suppliers in turn typically source material from various other third-parties in a competitive market, and there can be no assurance of the suppliers’ continuing ability or willingness to source material on behalf of the Company at current volumes and prices. Any constraint on the suppliers’ ability to source material could reduce the profitability of the Company’s recycling business.
From time to time the Company advances cash to third party brokers and suppliers to support the purchase and collection of spent catalyst materials and other industrial sources. These advances normally are made at the time material is ready for shipment or already in transit to the Company’s facilities. In some cases, the Company has a security interest in the materials that the suppliers have procured but for which the Company has not yet received. The unsecured portion of these advances is fully at risk.
The Company regularly advances money to its established recycling suppliers for catalyst material that the Company has physically received and carries in its processing inventories. These advances typically represent some portion of the estimated total value of each shipment until final assays are completed determining the actual PGM content of the shipment. Upon completion of the shipment assays, a final settlement takes place based on the actual value of the shipment. However, pending completion of the assays, the payments are based on the estimated PGM content of each shipment, which could vary significantly from the actual PGM content upon assay. Should the estimated PGM content upon assay significantly exceed the actual PGM content, the Company may be at risk for a portion of the amount advanced. This risk normally is mitigated by the established nature of the business relationship with the supplier and by advancing less than a shipment's estimated total value, but should the supplier be unable to settle such an overpayment or seek protection from creditors, the Company could incur a loss to the extent of any overpayment.
In its recycling business, the Company regularly enters into fixed forward sales contracts and, rarely, into financially settled forward contracts for metal produced from catalyst recycling, normally making these commitments at the time the catalyst material is purchased. For the Company’s fixed forward sales related to recycling of catalysts, the Company is subject to the customers’ compliance with the terms of the agreements, their ability to terminate or suspend the agreements and their willingness and ability to pay. The loss of any of these agreements or failure of a counterparty to perform could require the Company to sell or purchase the contracted metal in the open market, potentially at a significant loss. The Company’s revenues for the year ended December 31, 2014, included 42.6% from recycling sales and tolling fees.
Many of the Company's recycling suppliers are comparatively small businesses with limited assets and relatively little credit capacity. While the Company monitors funds being advanced to such businesses and seeks to limit its exposure to any one supplier, if a problem develops with such a supplier, the Company might not be able to fully recover amounts previously advanced to that supplier.
Volumes of recycling materials available in the marketplace fluctuate substantially in response to changes in PGM prices. Lower PGM prices normally reduce the volume of recycling material available in the market, resulting in less earnings and cash flow from the recycling segment, and therefore less economic support for the mining operations. Should it become necessary at any point to reduce or suspend operations at the mines, the proportion of processing costs allocated to the recycling segment would increase substantially, making the recycling segment less profitable. Further, the ability to operate the smelter and refinery without significant volumes of mine concentrates and the contained copper and nickel has never been demonstrated and would likely require modification to the processing facilities. There is no assurance that the recycling facilities can operate profitably in the absence of significant mine concentrates, or that capital would be available to complete necessary modifications to the processing facilities.
38
The Company may be competitively disadvantaged as primarily a palladium producer with a U.S. dollar-based cost structure.
The Company’s products compete in a global marketplace with the products of other primary producers of PGMs and with companies that produce PGMs as a by-product. In many cases, the other primary PGM producers mine ore reserves with a higher ratio of platinum to palladium than the Company, and as a result they normally enjoy higher average realizations per ounce. The Company also competes with mining companies that produce PGMs as a by-product of their primary commodity, principally nickel.
Because the Company’s U.S.-based cost structure is denominated in dollars, in periods when the U.S. dollar is relatively strong the Company’s competitors, which have cost structures denominated in other currencies, may still operate profitably, while the Company may not. Furthermore, non-primary producers of PGMs who regard PGMs as a by-product may continue to produce and sell PGMs when prices are low, as PGMs are not their principal commodity. In the past, labor arrangements and local legal or political considerations reportedly have driven competitors to continue operating unprofitable facilities even in the face of negative cash margins.
Achievement of the Company’s production goals is subject to uncertainties.
Based on the complexity and uncertainty involved in operating underground mines, it is challenging to provide precise production and cost forecasts. The Company cannot be certain that either the Stillwater Mine or the East Boulder Mine will achieve the production levels forecast, that the projected operating cost levels will be achieved, or that adequate funding will be available from internal and external sources to sustain necessary ongoing development work. Failure to achieve the Company’s production forecast may negatively affect the Company’s revenues, profits and cash flows. As the travel distances underground continue to expand both at depth and laterally, it is likely that operating costs will tend to increase from year to year and profitability will therefore decline unless productivity is increased commensurately. Also, as additional underground infrastructure is constructed, amortization expense may increase unless additional ore reserves are identified. Such increased costs could adversely affect the Company’s profitability.
The Company has put in place various operating plans and programs that are intended to reduce or limit increases in production costs at both the East Boulder Mine and the Stillwater Mine; however, there can be no assurance that these plans and programs will be implemented effectively or that they can be sustained. Actual production, cash operating costs and economic returns achieved in the future may differ significantly from those currently estimated or those predicted in future studies and estimates.
If metal prices increase significantly in the future, the competition for skilled miners may also increase and the Company may see its employee attrition rates climb. This could prove disruptive to the Company’s workforce, resulting in lower productivity. Lack of available manpower also could restrict the Company's ability to expand its annual production rates if the Company is unable to fully staff its expansion projects. See “Risk Factors – Limited availability of skilled mining and management personnel may affect the Company’s ability to achieve its production targets.” below for further discussion of this and related issues.
Capital costs for new mine developments are difficult to estimate and may change over time.
The Company may from time to time become involved in various exploration and development activities, some of which may require substantial future capital and resource commitments to bring into production. The Company normally performs engineering studies before committing to such projects, which studies include a detailed review of the project design and anticipated costs to construct and operate the proposed facilities. Experience in the mining industry has demonstrated that as a project progresses, various factors may cause the initial estimates of such costs to escalate, sometimes significantly. Examples of these factors include unforeseen construction delays, background inflation, lack of timely availability of contractors or required equipment, labor unrest, political and environmental obstacles, late changes to the project design, and so forth. There is no assurance that the Company's projects will not experience such cost escalation as they advance, which could impair the economics of these projects, require additional funding that might not be available or might be costly to secure, and could weaken the Company's financial position.
Ore reserves estimates are inherently imprecise and may require adjustment in the future; changes in ore grades, mining practices and economic factors could materially affect the Company’s production and reported results.
Ore reserve estimates are necessarily imprecise and depend to some extent on statistical inferences drawn from limited drilling samples, which may prove unreliable or unrepresentative. Reported ore reserves are comprised of a proven component and a probable component. Probable ore reserve estimates are less reliable than estimates of proven ore reserves. See “Glossary” for definitions and “Business and Properties – Ore Reserve Determination Methodology” for a discussion of the Company's estimation process for proven and probable ore reserves.
39
Conversion of probable ore reserves to proven ore reserves is calculated by dividing the actual proven tons converted for a given area by the expected tonnage based on a probable yield expectation for that given area. Actual period-to-period conversion of probable ore reserves to proven ore reserves may result in increases or decreases to the total reported amount of ore reserves. Conversion, an indicator of the success in upgrading probable ore reserves to proven ore reserves, is evaluated annually as described under “Business and Properties – Proven and Probable Ore Reserves”. Conversion rates are affected by a number of factors, including geological variability, quantity of tonnage represented by the period drilling, applicable mining methods and changes in safe mining practices, economic considerations and new regulatory requirements.
The following table illustrates, for each year’s development program, the actual percent conversion rates of probable ore reserve into proven ore reserves experienced by year from 2005 through 2014:
Year ended December 31, | 2014 | 2013 | 2012 | 2011 | 2010 | 2009 | 2008 | 2007 | 2006 | 2005 | ||||||||||
(In percent) | ||||||||||||||||||||
Stillwater Mine | 99 | 92 | 100 | 80 | 70 | 83 | 74 | 68 | 94 | 101 | ||||||||||
East Boulder Mine | 103 | 129 | 126 | 116 | 97 | 24 | 71 | 107 | 91 | 110 | ||||||||||
Ore reserve estimates are expressions of professional judgment based on knowledge, experience and industry practice. The Company cannot be certain that its estimated ore reserves are accurate, and future conversion and production experience could differ materially from such estimates. Should the Company encounter mineralization or formations at any of its mines or projects different from those predicted by drilling, sampling and similar examinations, reserve estimates may have to be adjusted and mining plans may have to be altered in a way that might adversely affect the Company’s operations. Declines in the market prices of PGMs may render the mining of some or all of the Company’s ore reserves uneconomic and so reduce ore reserve estimates. The grade of ore may vary significantly from time to time and between the Stillwater Mine and the East Boulder Mine, as with any mining operation. The Company cannot provide assurance that any particular quantity of metal will be recovered from the ore reserves. Moreover, short-term factors relating to the ore reserves, such as the availability of production workplaces, the need for additional development of the ore body or the processing of new or different ore types or grades, may impair the Company’s profitability in any particular accounting period.
An extended period of low PGM prices could result in a reduction of ore reserves and potential asset impairment charge.
Lower PGM prices can also affect the economic justification of ore reserves. If the price of PGMs declines to the point that the cost of mining certain reserves outweighs the probable gain upon sale, then such resources may no longer be classified as reserves. In each of the past three years, the Company has engaged Behre Dolbear as third-party independent geological experts to review and provide an opinion on the Company’s year-end ore reserve calculations. The Company performs its ore reserve economic assessment using a twelve-quarter trailing price in order to level out short-term volatility in metals prices, viewing the twelve-quarter trailing average as a reasonable surrogate for long-term future PGM prices over the period when the reserves will be mined. Using the Company’s combined twelve-quarter trailing weighted average price for palladium and platinum at December 31, 2014, of approximately $891 per ounce, ($724/oz. for palladium and $1,474/oz. for platinum). The Company’s ore reserves at each mine are projected to generate (undiscounted) positive cash flow over the life of the reserve. Consequently, the Company’s ore reserves were not constrained economically at December 31, 2014.
However, it is important to note that if PGM prices were to fall for an extended period, the trailing twelve-quarter price would gradually decline. Also, underlying inflation and increasing travel distances within the mine exert upward pressure on mining and processing costs, which in a stable or declining pricing environment may reduce operating margins. If the trailing twelve-quarter price falls significantly and / or costs increase for an extended period of time, there can be no assurance that the Company’s reported proven and probable ore reserves will not be constrained economically in the future.
The Company reviews and evaluates its long-lived assets for impairment when events or changes in circumstances indicate that the related carrying amounts of its assets may not be recoverable. Were the Company to experience a prolonged period of low PGM prices, the Company could face one or more impairment adjustments to its mining assets. See "Note 4 - Asset Impairment” to the Company’s 2014 consolidated financial statements for further information.
40
Users of PGMs may reduce their consumption and substitute other materials for palladium and platinum
High PGM prices or pricing volatility may lead users of PGMs to look for other materials to substitute for palladium and platinum or to reduce the quantities of these metals they consume. The automobile, electronics, jewelry and dental industries are the largest consumers of palladium. In varying degrees, demand from each of these applications is sensitive to prices. During periods of high palladium prices in the past, there has been some substitution of other materials for palladium in electronics and dental applications. In some cases this substitution has not reversed when palladium prices returned to more normal levels, resulting in a permanent or prolonged decrease in demand from that industry. High platinum prices likewise tend to reduce demand by driving consumers toward alternative materials. The principal demand for platinum comes from the automobile and chemical industries, which utilize platinum as a catalyst in emissions control systems similar to palladium, and from jewelry makers. Substitution in these industries may increase if PGM market prices rise or if supply becomes unreliable. Significant substitution for any reason, in the absence of alternative uses for PGMs being identified, could result in a material and sustained decrease in the price of PGMs, which would negatively affect the Company’s revenues and profitability.
High PGM prices also tend to drive consumers toward ever more efficient utilization of PGMs. In the past, the development of new flow geometries and substrate configurations has resulted in manufacturers “thrifting down” the amount of PGMs in catalytic converters required to meet specific emission standards. From time to time, various researchers have announced technological innovations that if realized could significantly reduce the volume of PGMs required in each catalytic converter. Such emerging applications could tend to drive down PGM demand in the future and result in lower PGM prices, as well as reducing the volume of material available for recycling at the end of a catalytic converter’s useful life.
To the extent existing and future environmental regulations or fundamental technological change in the auto industry tend to create disincentives for the use of internal combustion engines, demand for palladium and platinum in automotive catalytic converters could be reduced. Small engines in general tend to have smaller catalytic converters and require less PGMs than those used with larger engines. Less demand for PGMs as a result of these trends could drive down PGM prices and could impair the Company’s financial performance.
The Company’s mining activities are subject to risks that may not be covered by insurance.
Underground mining and milling, smelting and refining operations involve a number of risks and hazards, including:
• | unusual and unexpected rock formations affecting ore or wall rock characteristics; |
• | ground or slope failures; |
• | cave-ins, ground water influx, rock bursts and other mining or ground-related problems; |
• | environmental hazards; |
• | industrial accidents; |
• | organized labor disputes or work slow-downs; |
• | metallurgical and other processing, smelting or refining problems; |
• | wild fires, flooding and periodic interruptions due to inclement or hazardous weather conditions or other acts of God; |
• | mechanical equipment failure and facility performance problems; and |
• | availability and cost of critical materials, power, equipment and skilled manpower. |
Such risks could result in damage to or destruction of mining assets or production facilities, personal injuries or death, environmental damage, delays in mining or processing, monetary losses and possible legal liability. Some fatal accidents and other non-fatal serious injuries have occurred at the Company’s mines since operations began in 1986. Future industrial accidents or occupational disease occurrences could have a material adverse effect on the Company’s business and operations. The Company cannot be certain that its insurance will cover certain risks associated with mining or that it will be able to maintain insurance to cover these risks at economically feasible premiums. The Company might also become subject to liability for environmental damage or other hazards which may be uninsurable or for which it may elect not to insure because of high premium costs or commercial impracticality. Such events could result in a prolonged interruption in operations that would have a negative effect on the Company’s ability to generate revenues, profits, and cash flows.
41
Limited availability of skilled mining and management personnel may affect the Company’s ability to achieve its production targets.
The Company’s success depends in part on its ability to attract, retain and motivate skilled professional employees. Achieving this objective may be difficult at times due to a variety of factors, including fluctuations in the global economic and industry conditions, competitors' hiring practices, cost reduction activities, and the effectiveness of compensation programs. Competition for qualified personnel can be intense and the pool of fully qualified candidates is limited. The Company must continue to recruit, retain, and motivate its management, miners and other key personnel in order to maintain its business and support its projects. A loss of key management or other personnel could prevent the Company from capitalizing on business opportunities, and its operating results could be adversely affected.
Union represented labor creates an increased risk of work stoppages and higher labor costs; the Company's labor agreements expire and will need to be renegotiated during 2015.
The Company had 1,619 employees worldwide at December 31, 2014. Of these, 911 employees located at the Stillwater Mine and the Columbus processing facilities are covered by a collective bargaining agreement with the United Steel Workers (USW) Local 11-0001, expiring June 1, 2015. At December 31, 2014, a total of 328 employees at the East Boulder Mine were covered by a separate collective bargaining agreement with USW Local 11-0001, which expires December 31, 2015. As a majority of the Company’s workforce is unionized, the Company is subject to an ongoing risk of strikes and other labor disputes, and its ability to alter labor costs is restricted by the fact that unionized employees are party to collective bargaining agreements. Collective bargaining agreements are negotiated on a periodic basis, and the risk exists that such agreements may not be renewed on reasonably satisfactory terms to the Company or at all. The Company cannot predict what issues may be raised by the unions representing its unionized employees and, if raised, whether negotiations concerning those issues will be concluded successfully. While the Company focuses on maintaining positive relationships with its represented employees and their respective unions, any labor disputes or disruptions, such as strikes, work stoppages or slowdowns, could have a significant adverse effect on the Company. The associated loss of production and resulting revenues for even a short time could have a material adverse effect on the Company’s financial results. Additionally, if the Company enters into a new labor agreement with any union that significantly increases the Company's labor costs relative to its competitors the Company’s ability to compete may be materially and adversely affected.
Certain of the Company’s properties are subject to title risk, particularly related to the validity of unpatented mining claims.
Montana
The Company's Montana properties include a number of unpatented mining and mill site claims. See “Business and Properties – Title and Royalties.” The validity of unpatented mining claims on public lands is often uncertain, and possessory rights of claimants may be subject to challenge. The rights to use such claims are granted under the Mining Law of 1872. Unpatented mining claims may be located on lands open to appropriation of mineral rights and are generally considered to be subject to greater title risk than other real property interests because the validity of unpatented mining claims is often uncertain and vulnerable to challenges by third-parties or the federal government. This uncertainty arises, in part, out of the complex federal and state laws and regulations under the 1872 Mining Law and the interaction of the 1872 Mining Law with other federal and state laws, such as those enacted for the protection of the environment. Maintaining the validity of an unpatented mining or mill site claim requires strict compliance with this complex body of federal and state statutory and decisional law and, for unpatented mining claims (as opposed to mill sites), the existence of a discovery of valuable minerals. In addition, few public records exist to definitively control the issues of validity and ownership of unpatented mining claims or mill sites.
The Company pays annual maintenance fees and has obtained mineral title reports and legal opinions for some of the unpatented mining claims or mill sites making up portions of its properties, in accordance with applicable laws and what the Company believes is standard industry practice. However, the Company cannot be certain that applicable laws will not be changed nor that the Company’s possessory rights to any of its unpatented claims may not be deemed defective and challenged. In particular, Members of the U.S. Congress have repeatedly introduced bills which would supplant or alter the provisions of the Mining Law of 1872. If adopted, such legislation could, among other things:
• | Impose a royalty on the production of metals or minerals from unpatented mining claims; |
• | Reduce or prohibit the ability of a mining company to expand its operations; and |
• | Require a material change in the method of exploiting the reserves located on unpatented mining claims. |
42
As a result, such legislation could change the cost of holding unpatented mining claims and could significantly affect the Company’s ability to develop reserves located on unpatented mining claims. All of the foregoing could adversely affect the economic and financial viability of future mining operations at the Company’s Montana mines. Although it is impossible to predict at this point what any legislated royalties might be, enactment could adversely affect the potential for development of such federal unpatented mining claims.
Canada
In Canada, paramount title to minerals typically vests in the Crown, subject only to any standing claims of Aboriginal title, while the various Ministries of the Provinces enjoy legislative powers to administer the disposition of minerals within their jurisdiction. In Ontario, mining claims grant the claimant conditional rights of access for exploration of hard rock minerals conducted in compliance with regulations regarding surface disturbance, environmental stewardship and annual expenditures to maintain the validity of the claims. New regulations began taking effect in Ontario in November 2012 providing, among other requirements, additional Aboriginal consultation and environmental protection in conjunction with new exploration activities. Mining claims in Ontario do not authorize removal of minerals for other than test work and analyses. To commercially extract minerals, a mining lease is necessary. Crown mining leases provide the claimant with a preference right to develop and extract minerals for a (renewable) 21-year term, under more specific conditions of Aboriginal consultation, environmental protection, approved closure / reclamation plans and financial assurances provided to the Crown over the life of the project. While the Company believes that its mining claims and crown leases provide adequate security of mineral and surface tenure to sustain its mineral exploration activities in the Marathon region of Ontario, there can be no assurance that this tenure will not be challenged in the future nor that all necessary mining leases will ultimately be issued.
The Company holds mining claims and crown leases covering the more prospective portions of the Port Coldwell Intrusive Complex. The Company’s aggregate property holdings in the Coldwell Complex include 44 crown leases and 82 mining claims comprised of 832 claim units. Thirty-eight of the leases grant both surface and mineral rights while five of the leases presently grant mineral rights only and one lease grants surface rights only. Applications have been submitted for surface leases on the 5 mineral leases as well as for both mineral and surface crown leases on certain additional property currently held by the Company under valid mining claims. There can be no assurance that these surface leases will be forthcoming.
Argentina
The Company holds a 100% interest in nine mining concessions and holds options on five other mining concessions associated with the Altar project in Argentina. Several of these concessions require that the Company make periodic option payments, meet minimum exploration expenditure commitments, or both. All concessions require periodic mining concession fees. Failure to meet these minimum obligations could result in the forfeiture of such concessions. Future mining on these properties will require securing mining permits and obtaining control of surface rights on these properties. There is no guarantee that the Company will be able to secure these permits or acquire the surface rights on acceptable terms.
The Company’s operation of ore concentration, smelting and refining facilities subjects it to operating and environmental risks.
The Company’s processing facilities include concentrators at each mine site that grind produced ore and extract the contained metal sulfides, and a smelter and base metal refinery located in Columbus, Montana. The Columbus operations involve pyrometallurgical and hydrometallurgical processes that utilize high temperatures, pressures, caustic chemicals and acids to extract PGMs and other metals from the concentrates. These processes also generate waste gases that are scrubbed to significantly reduce sulfur dioxide emissions. While the environmental and safety performance of these facilities to date has been in material compliance with all applicable laws, there can be no assurance that incidents such as solution spills, sulfur dioxide discharges, explosions or accidents involving hot metals and product spills in transportation will not occur in the future. Such incidents potentially could result in losses or claims for damages being brought against the Company, more stringent environmental or operating restrictions on these facilities and additional expenses to the Company, which could negatively affect its results of operations and cash flows. Further, the Company processes virtually all its metals through these processing facilities, and any incident interrupting processing operations for an extended period would have a material adverse effect on the Company’s performance.
43
The Company is required to obtain and renew governmental permits in order to conduct operations, a process which is often costly and time-consuming.
In the normal course of its business, the Company is required to obtain and renew governmental permits for exploration, operations and expansion of existing operations and for the development of new projects. Obtaining and renewing governmental permits is a complex and time-consuming process, especially where federal agency analysis and review of the potential environmental impact is required under the National Environmental Policy Act (NEPA), the U.S. Forest Service (USFS) or the Bureau of Land Management (BLM). The timeliness and success of permitting efforts are contingent upon many variables not within the Company's control, including the interpretation of permit approval requirements administered by the applicable permitting authority. The Company may not be able to obtain or renew permits that are necessary to its operations or the cost and time required to obtain or renew permits may exceed the Company's expectations. Any unexpected delays or costs associated with the permitting process could delay the development or impede the operation of a mine, which in turn could materially adversely affect the Company's revenues and future growth.
Compliance with current and future statutes and regulations could affect production, increase costs and cause delays.
The Company’s business is subject to extensive federal, state and local environmental controls and regulations, including regulations associated with the implementation of the Clean Air Act, Clean Water Act, Resource Conservation and Recovery Act, Metals Mines Reclamation Act and numerous permit stipulations as documented in the Record of Decision for each operating entity, including those relating to the protection of threatened and endangered species under the Endangered Species Act. Properties controlled by the Company in Canada and Argentina are subject to analogous federal and provincial controls and regulations in those respective countries. The body of environmental laws is continually changing and, as a general matter, is becoming more restrictive. Compliance with these regulations requires the Company to obtain permits issued by federal, state, provincial and local regulatory agencies. Failure to comply with applicable environmental laws, regulations and permitting requirements, whether now or in the future, may result in enforcement actions, including orders issued by regulatory or judicial authorities, causing operations to cease or to be curtailed, and may include corrective measures requiring capital expenditures, installation of additional equipment or remedial actions. Non-renewal of permits, the inability to secure new permits, or the imposition of additional conditions could eliminate or severely restrict the Company’s ability to conduct its operations. See “Business and Properties - Regulatory and Environmental Matters.”
The Company’s existing mining operations are located adjacent to the Absaroka-Beartooth Wilderness Area and are situated approximately 30 miles from the northern boundary of Yellowstone National Park. While the Company works closely and cooperatively with local environmental organizations, the Montana DEQ and the USFS, there can be no assurance that future political or regulatory efforts will not further restrict or seek to terminate the Company’s operations in this sensitive area. In addition, environmental hazards or damage may exist on mineral properties held by the Company that were caused by previous owners or operators or that may have occurred naturally, and that are unknown to the Company at the present time. In some cases, the Company could be required to remedy such damage.
Mining activities also are subject to extensive laws and regulations governing occupational health and safety, including mine safety, toxic substances and other matters. The costs associated with compliance with such laws and regulations are substantial. The Company employs various measures in its operating facilities in an effort to protect the health and safety of the Company’s workforce. Underground mines in the U.S., including the Stillwater and East Boulder mines, are continuously inspected by MSHA, which inspections often lead to notices of violation. Any of the Company's U.S. mines could be subject to a temporary or extended shut down as a result of a violation alleged by MSHA. Possible future laws and regulations, or more restrictive interpretations of current laws and regulations by governmental authorities, could cause additional expense, capital expenditures, restrictions on or suspensions of operations and delays in the development of new properties.
In addition to environmental and health and safety standards, the Company is subject to extensive federal, state and local laws and regulations related to mine prospecting, development, transportation, production, exports, taxes, labor standards, waste disposal, hazardous materials, toxic substances, protected species and other matters. In response to public policy changes over time, numerous government departments and agencies have issued extensive rules and regulations binding on the mining industry and its individual members, some of which carry substantial penalties for failure to comply. Existing laws and regulations can also require the Company to incur substantial costs to maintain regulatory compliance. The Company’s operating and other compliance costs could increase further if existing laws and regulations are revised or reinterpreted or if new laws and regulations become applicable to its operations. Although the Company is unable to predict changes to existing laws and regulations, such changes could significantly affect its profitability, financial condition and liquidity.
The Company is required to post and maintain surety for its reclamation obligations, which are substantial. As of December 31, 2014, the Company had outstanding $37.8 million of environmental surety bonds. Such reclamation obligations generally increase over time as costs rise and the physical extent of mining operations expands. Failure to secure and maintain adequate surety coverage could result in the Company's operating permits being revoked and mining operations terminated.
44
Parties engaged in mining operations or in the exploration or development of mineral properties may be required to compensate those suffering loss or damage by reason of the mining activities and may be subject to civil or criminal fines or penalties imposed for violations of applicable laws or regulations. Any such costs could have a material adverse effect on the Company's business and results of operations.
Current and future litigation and regulatory proceedings may affect the revenues, profits and cash flows of the Company.
The Company may be subject to civil claims (including class action claims) based on allegations of negligence, breach of statutory duty, public nuisance or private nuisance or otherwise in connection with its operations or investigations relating thereto. While the Company is presently unable to quantify its potential liability under any of the above, such liability may be material to the Company and may have a material adverse effect on its ability to continue in operation.
In addition, the Company may be subject to actions or related investigations by governmental or regulatory authorities. Such actions may include civil or criminal prosecution for breach of relevant statues, regulations or rules or failure to comply with the terms of the Company's licenses and permits and may result in liability for pollution, other fines or penalties, revocation of consents, permits, approvals or licenses or similar action, which could be material and may affect the Company's results of operations. Exposures to fines and penalties generally are uninsurable as a matter of public policy.
The Company is subject to income taxes in various jurisdictions; income tax structures are subject to changes that could increase the Company’s effective tax rate.
In the U.S., the Company enjoys certain beneficial tax provisions afforded to natural resource companies that have the effect of reducing the Company’s overall effective tax rate. Preliminary discussions in the U.S. Congress with regard to restructuring the corporate income tax include consideration of reducing or eliminating some or all of these preferential benefits. The revenue needs of state and local jurisdictions may lead to revisions in tax structures or nexus considerations that may adversely affect the Company. While it is not possible at this time to predict the direction such changes might ultimately take, if such changes were enacted they could increase the effective tax rate paid by the Company for federal and state income taxes.
The Company's foreign assets subject the Company to additional risks.
Through its ownership of Marathon and Peregrine, which represent significant resource properties in Canada and Argentina, respectively, the Company is subject to risks inherent in operating in foreign jurisdictions outside of the United States. These risks include without limitation:
• | The effect of currency exchange rate fluctuations, which may reduce the U.S. dollar value of the revenues, profits and cash flows the Company receives from non-U.S. markets or its assets in non-U.S. countries, or increase the Company’s costs, as measured in U.S. dollars in those markets; |
• | Political or economic instability, social or labor unrest or changing macroeconomic conditions or other changes in political, economic or social conditions in the respective jurisdictions; |
• | Different legal and regulatory structures (including creditor rights that may be different than in the United States) and unexpected changes in regulatory environments, including changes resulting in potentially adverse tax consequences or imposition of onerous trade restrictions or barriers, price and currency controls, industry constraints, employee welfare schemes or other government regulations; |
• | Increased financial accounting and reporting burdens and complexities; and |
• | Disruptions in shipping or reduced availability of freight transportation. |
In addition, the Company’s management has limited experience managing foreign operations, and may be required to devote significant time and resources to adapting its systems, policies and procedures in order to successfully manage the integration and operation of foreign assets.
The Company is dependent on information technology and its systems and infrastructure face certain risks, including cybersecurity risks and data leakage risks.
The Company utilizes a variety of information technology systems and infrastructure. Any significant breakdown, invasion, destruction or interruption of these systems by employees, others with authorized access to the systems, or unauthorized persons could negatively impact operations. There is also a risk that the Company could experience a business interruption, theft of information, or reputational damage as a result of a cyber-attack, such as an infiltration of a data center, or data leakage of confidential information either internally or by third-party providers. While the Company has invested in the protection of its data and information technology to reduce these risks and periodically tests the security of its information systems network, there can be no assurance that these efforts will prevent breakdowns or breaches in the Company's systems that could adversely affect its business.
45
The Company's information technology and infrastructure is based on specific platforms and architectures that to some extent are dependent on third-party maintenance and support. The Company is required to regularly update many of its key systems to ensure that the suppliers of those systems will continue to support and maintain them. If support for one or more of the Company's critical information technology systems were to be withdrawn, the Company's activities that depend on those systems could be at risk.
ITEM 3
LEGAL PROCEEDINGS
The Company is involved in various claims and legal actions arising in the ordinary course of business, primarily employee lawsuits and employee injury claims. In the opinion of management, the ultimate disposition of these types of matters is not expected to have a material adverse effect on the Company’s consolidated financial position, results of operations or liquidity.
ITEM 4
MINE SAFETY DISCLOSURE
Valuing the people in the Company's workforce means being committed to their safety and well-being at all times. The Company's goal is that “Everyone Goes Home Safe - Every Day”. The Company's Safety & Health Management System, Guide, Educate and Train (GET) Safe, promotes a safety culture based on safety leadership and teamwork to improve safety performance. GET Safe includes incidence tracking and analysis, near miss reporting, hazard recognition, workplace inspections, pre-operational equipment inspections, team safety meetings, annual refresher training, task training, standard operating procedures training, safety sweeps, audits, stand-downs and employee engagement activities focused on working safely. The Company works closely with MSHA inspectors to act on their findings and incorporate their suggestions. Management also strives to maintain a consistent “tone at the top” that working safely every day is paramount to the overall success of the Company.
Under the Dodd-Frank Act, each operator of a coal or other mine is required to include certain mine safety results within its periodic reports filed with the Securities and Exchange Commission. In accordance with the reporting requirements included in Section 1503(a) of the Dodd-Frank Wall Street Reform and Consumer Protection Act and Item 104 of Regulation S-K (17 CFR 229.104), the required mine safety results regarding certain mining safety and health matters for each of the Company’s mine locations that are covered under the scope of the Dodd-Frank Act are included in "Exhibit 95 Mine Safety Disclosures" of this 2014 Annual Report on Form 10-K. In 2014, the Company received a total of 43 violations of mandatory health or safety standards that could significantly and substantially contribute to the cause and effect of a coal or other mine safety or health hazard under section 104 of the Federal Mine Safety and Health Act. See "Exhibit 95 Mine Safety Disclosures” of this 2014 annual report for more information.
46
PART II
47
ITEM 5
MARKET FOR REGISTRANT’S COMMON EQUITY, RELATED STOCKHOLDER MATTERS AND ISSUER PURCHASES OF EQUITY SECURITIES
PRICE RANGE OF COMMON STOCK
The Company's common stock is listed on the New York Stock Exchange (NYSE) under the symbol SWC.
The following table sets forth, for the periods indicated, the high and low closing sales prices of the common stock as reported by the NYSE:
2014 | 2013 | |||||||||||||||
High | Low | High | Low | |||||||||||||
First Quarter | $ | 15.69 | $ | 11.94 | $ | 14.63 | $ | 11.86 | ||||||||
Second Quarter | $ | 17.94 | $ | 14.89 | $ | 13.00 | $ | 10.02 | ||||||||
Third Quarter | $ | 19.23 | $ | 15.03 | $ | 12.45 | $ | 10.66 | ||||||||
Fourth Quarter | $ | 15.09 | $ | 11.91 | $ | 12.34 | $ | 10.64 | ||||||||
2015 | ||||||||||||||||
First Quarter through February 12, 2015 | $ | 14.89 | $ | 13.25 | ||||||||||||
The Company has not historically paid a dividend. Payment of dividends in the future will be at the discretion of the Company's Board of Directors.
48
PERFORMANCE GRAPH
COMPARISON OF 5 YEAR CUMULATIVE TOTAL RETURN
Among Stillwater Mining Company, the Russell 2000 Index and a Peer Group
The following chart compares the yearly percentage change in the Company’s cumulative total stockholder return on Common Stock, with the cumulative total return on the following indices, assuming an initial investment of $100 on December 31, 2009 and the reinvestment of all dividends: (i) the Russell 2000 and (ii) the Peer Group (as defined below). The performance shown is not necessarily indicative of future performance.
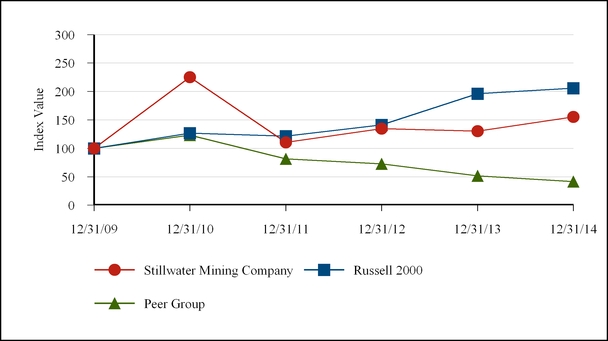
$100 invested on 12/31/2009 in stock or index, including reinvestment of dividends.
Fiscal year ending December 31.
Cumulative Total Return
12/31/2010 | 12/31/2011 | 12/31/2012 | 12/31/2013 | 12/31/2014 | ||||||||||||||||
Stillwater Mining Company | $ | 225.21 | $ | 110.34 | $ | 134.81 | $ | 130.17 | $ | 155.49 | ||||||||||
Russell 2000 | 126.86 | 121.56 | 141.43 | 196.34 | 205.95 | |||||||||||||||
Peer Group | 123.29 | 81.48 | 72.49 | 51.78 | 41.34 | |||||||||||||||
Notwithstanding anything to the contrary set forth in any of the Company’s previous or future filings made under the Securities Act or the Exchange Act that might incorporate this report or future filings made by the Company under those statutes, the preceding stock performance graph is not to be incorporated by reference into any such prior filings, nor shall such graph or report be incorporated by reference into any future filings made by the Company under those statutes. The Peer Group referenced above includes Anglo American Platinum Limited, Impala Platinum Holdings Limited, Lonmin PLC, and North American Palladium Limited.
49
ITEM 6
SELECTED FINANCIAL DATA
(In thousands, except per share and current ratio data) | 2014 | 2013 | 2012 | 2011 | 2010 | |||||||||||||||
INCOME STATEMENT DATA | ||||||||||||||||||||
Revenues | ||||||||||||||||||||
Mine Production | $ | 536,010 | $ | 478,918 | $ | 455,426 | $ | 528,007 | $ | 381,044 | ||||||||||
PGM Recycling | 401,684 | 560,588 | 344,818 | 376,820 | 168,612 | |||||||||||||||
Other | 5,925 | — | — | 1,142 | 6,222 | |||||||||||||||
Total revenues | $ | 943,619 | $ | 1,039,506 | $ | 800,244 | $ | 905,969 | $ | 555,878 | ||||||||||
Costs and Expenses | ||||||||||||||||||||
Costs of metals sold: | ||||||||||||||||||||
Mine Production | 332,632 | 313,963 | 288,922 | 269,573 | 229,986 | |||||||||||||||
PGM Recycling | 391,481 | 527,384 | 334,949 | 358,566 | 157,310 | |||||||||||||||
Other | 5,357 | — | — | 1,141 | 6,379 | |||||||||||||||
Total costs of metals sold (excludes depletion, depreciation and amortization) | $ | 729,470 | $ | 841,347 | $ | 623,871 | $ | 629,280 | $ | 393,675 | ||||||||||
Depletion, depreciation and amortization | ||||||||||||||||||||
Mine Production | 66,387 | 58,201 | 56,960 | 61,312 | 71,121 | |||||||||||||||
PGM Recycling | 1,019 | 1,116 | 1,055 | 1,066 | 472 | |||||||||||||||
Total depletion, depreciation and amortization | $ | 67,406 | $ | 59,317 | $ | 58,015 | $ | 62,378 | $ | 71,593 | ||||||||||
General and administrative | 35,067 | 46,577 | 53,277 | 56,120 | 35,431 | |||||||||||||||
Impairment of non-producing mineral properties and property, plant and equipment | (550 | ) | (461,755 | ) | — | — | — | |||||||||||||
Operating income (loss) | 98,168 | (396,623 | ) | 43,636 | 155,206 | 54,712 | ||||||||||||||
Total income tax (provision) benefit | (16,258 | ) | 93,653 | 4,039 | (11,235 | ) | — | |||||||||||||
Net income (loss) | 68,883 | (302,073 | ) | 54,416 | 144,295 | 50,365 | ||||||||||||||
Net unrealized gains/losses on investments available-for-sale | 11 | 105 | 862 | (109 | ) | (762 | ) | |||||||||||||
Comprehensive income (loss) attributable to common stockholders | 70,308 | (270,101 | ) | 55,907 | 144,186 | 49,603 | ||||||||||||||
Weighted average common shares outstanding | ||||||||||||||||||||
Basic | 119,953 | 118,607 | 116,162 | 105,846 | 97,967 | |||||||||||||||
Diluted | 156,233 | 118,607 | 131,441 | 113,946 | 99,209 | |||||||||||||||
Basic earnings (loss) per share attributable to common stockholders | 0.59 | (2.28 | ) | 0.47 | 1.36 | 0.51 | ||||||||||||||
Diluted earnings (loss) per share attributable to common stockholders | 0.56 | (2.28 | ) | 0.46 | 1.30 | 0.51 | ||||||||||||||
CASH FLOW DATA | ||||||||||||||||||||
Net cash provided by operating activities | 187,552 | 149,433 | 103,894 | 219,683 | 123,897 | |||||||||||||||
Net cash used in investing activities | (162,957 | ) | (79,123 | ) | (324,808 | ) | (129,593 | ) | (272,034 | ) | ||||||||||
Net cash (used in) provided by financing activities | (30,996 | ) | (163,303 | ) | 491,497 | (356 | ) | 844 | ||||||||||||
BALANCE SHEET DATA | ||||||||||||||||||||
Cash and cash equivalents | 280,286 | 286,687 | 379,680 | 109,097 | 19,363 | |||||||||||||||
Investments, at fair market value | 251,254 | 209,338 | 261,983 | 49,533 | 188,988 | |||||||||||||||
Inventories | 130,307 | 158,650 | 153,208 | 131,856 | 101,806 | |||||||||||||||
Total current assets | 701,396 | 703,879 | 852,862 | 325,926 | 349,367 | |||||||||||||||
Mineral properties and mine development, net | 569,006 | 505,598 | 899,225 | 865,034 | 428,983 | |||||||||||||||
Property, plant and equipment, net | 118,881 | 124,731 | 122,677 | 99,379 | 80,804 | |||||||||||||||
Total assets | 1,399,327 | 1,346,680 | 1,890,763 | 1,327,324 | 909,470 | |||||||||||||||
Current portion of long-term debt and capital lease obligations | 2,144 | 2,035 | 168,432 | — | — | |||||||||||||||
Total current liabilities | 82,039 | 89,048 | 246,848 | 74,335 | 58,202 | |||||||||||||||
Long-term debt and capital lease obligations | 294,023 | 308,667 | 292,685 | 196,046 | 196,010 | |||||||||||||||
Total liabilities | 467,619 | 498,821 | 758,183 | 483,356 | 326,398 | |||||||||||||||
Stockholders’ equity | 913,228 | 827,965 | 1,080,819 | 843,968 | 583,072 | |||||||||||||||
Working capital | 619,357 | 614,831 | 606,014 | 251,591 | 291,165 | |||||||||||||||
Current ratio | 8.5 | 7.9 | 3.5 | 4.4 | 6.0 | |||||||||||||||
50
SELECTED FINANCIAL DATA (Continued)
(In thousands, except per ounce and per ton costs) | 2014 | 2013 | 2012 | 2011 | 2010 | |||||||||||||||
OPERATING AND COST DATA FOR MINE PRODUCTION | ||||||||||||||||||||
Consolidated: | ||||||||||||||||||||
Ounces produced: | ||||||||||||||||||||
Palladium | 400 | 404 | 396 | 399 | 374 | |||||||||||||||
Platinum | 118 | 120 | 118 | 119 | 111 | |||||||||||||||
Total | 518 | 524 | 514 | 518 | 485 | |||||||||||||||
Tons milled | 1,174 | 1,201 | 1,081 | 1,131 | 1,095 | |||||||||||||||
Mill head grade (ounce per ton) | 0.47 | 0.47 | 0.51 | 0.49 | 0.48 | |||||||||||||||
Sub-grade tons milled (1) | 91 | 73 | 69 | 79 | 86 | |||||||||||||||
Sub-grade mill head grade (ounce per ton) | 0.16 | 0.17 | 0.16 | 0.17 | 0.17 | |||||||||||||||
Total tons milled (1) | 1,265 | 1,274 | 1,150 | 1,210 | 1,181 | |||||||||||||||
Combined mill head grade (ounce per ton) | 0.45 | 0.45 | 0.49 | 0.47 | 0.46 | |||||||||||||||
Total mill recovery (%) | 92 | 92 | 92 | 91 | 91 | |||||||||||||||
Total mine concentrate shipped (tons) (4) | 29,350 | 28,669 | 23,843 | 24,415 | 23,868 | |||||||||||||||
Platinum grade in concentrate (ounce per ton) (4) | 4.31 | 4.50 | 5.17 | 5.31 | 4.96 | |||||||||||||||
Palladium grade in concentrate (ounce per ton) (4) | 14.27 | 14.59 | 17.15 | 17.05 | 16.19 | |||||||||||||||
Total cash costs per ounce - net of credits (Non-GAAP) (2) | $ | 538 | $ | 496 | $ | 484 | $ | 420 | $ | 397 | ||||||||||
Total cash costs per ton milled - net of credits (Non-GAAP) (2) | $ | 220 | $ | 204 | $ | 216 | $ | 180 | $ | 163 | ||||||||||
Stillwater Mine: | ||||||||||||||||||||
Ounces produced: | ||||||||||||||||||||
Palladium | 263 | 282 | 290 | 297 | 271 | |||||||||||||||
Platinum | 78 | 84 | 88 | 90 | 81 | |||||||||||||||
Total | 341 | 366 | 378 | 387 | 352 | |||||||||||||||
Tons milled | 703 | 765 | 673 | 736 | 713 | |||||||||||||||
Mill head grade (ounce per ton) | 0.51 | 0.51 | 0.60 | 0.56 | 0.53 | |||||||||||||||
Sub-grade tons milled (1) | 46 | 36 | 36 | 57 | 68 | |||||||||||||||
Sub-grade mill head grade (ounce per ton) | 0.21 | 0.23 | 0.21 | 0.20 | 0.18 | |||||||||||||||
Total tons milled (1) | 749 | 801 | 709 | 793 | 781 | |||||||||||||||
Combined mill head grade (ounce per ton) | 0.50 | 0.50 | 0.58 | 0.53 | 0.50 | |||||||||||||||
Total mill recovery (%) | 93 | 92 | 92 | 92 | 92 | |||||||||||||||
Total mine concentrate shipped (tons) (4) | 16,463 | 16,975 | 13,645 | 15,421 | 15,138 | |||||||||||||||
Platinum grade in concentrate (ounce per ton) (4) | 5.19 | 5.22 | 6.71 | 6.23 | 5.83 | |||||||||||||||
Palladium grade in concentrate (ounce per ton) (4) | 16.83 | 17.12 | 21.94 | 20.08 | 18.63 | |||||||||||||||
Total cash costs per ounce - net of credits (Non-GAAP) (2) | $ | 533 | $ | 484 | $ | 456 | $ | 401 | $ | 380 | ||||||||||
Total cash costs per ton milled - net of credits (Non-GAAP) (2) | $ | 243 | $ | 221 | $ | 243 | $ | 195 | $ | 171 | ||||||||||
East Boulder Mine: | ||||||||||||||||||||
Ounces produced: | ||||||||||||||||||||
Palladium | 137 | 122 | 106 | 102 | 103 | |||||||||||||||
Platinum | 40 | 36 | 30 | 29 | 30 | |||||||||||||||
Total | 177 | 158 | 136 | 131 | 133 | |||||||||||||||
Tons milled | 471 | 436 | 408 | 395 | 382 | |||||||||||||||
Mill head grade (ounce per ton) | 0.41 | 0.40 | 0.37 | 0.37 | 0.39 | |||||||||||||||
Sub-grade tons milled (1) | 45 | 37 | 33 | 22 | 18 | |||||||||||||||
Sub-grade mill head grade (ounce per ton) | 0.10 | 0.10 | 0.10 | 0.10 | 0.15 | |||||||||||||||
Total tons milled (1) | 516 | 473 | 441 | 417 | 400 | |||||||||||||||
Combined mill head grade (ounce per ton) | 0.38 | 0.37 | 0.35 | 0.35 | 0.37 | |||||||||||||||
Total mill recovery (%) | 90 | 90 | 90 | 89 | 89 | |||||||||||||||
Total mine concentrate shipped (tons) (4) | 12,887 | 11,694 | 10,198 | 8,994 | 8,730 | |||||||||||||||
Platinum grade in concentrate (ounce per ton) (4) | 3.19 | 3.45 | 3.12 | 3.72 | 3.45 | |||||||||||||||
Palladium grade in concentrate(ounce per ton) (4) | 11.00 | 10.93 | 10.74 | 11.87 | 11.95 | |||||||||||||||
Total cash costs per ounce - net of credits (Non-GAAP) (2) | $ | 547 | $ | 525 | $ | 562 | $ | 475 | $ | 442 | ||||||||||
Total cash costs per ton milled - net of credits (Non-GAAP) (2) | $ | 187 | $ | 175 | $ | 174 | $ | 150 | $ | 147 | ||||||||||
51
SELECTED FINANCIAL DATA (Continued)
(In thousands, where noted) | 2014 | 2013 | 2012 | 2011 | 2010 | |||||||||||||||
SALES AND PRICE DATA | ||||||||||||||||||||
Ounces sold (000) | ||||||||||||||||||||
Mine Production: | ||||||||||||||||||||
Palladium (oz.) | 421 | 398 | 386 | 402 | 377 | |||||||||||||||
Platinum (oz.) | 121 | 111 | 114 | 114 | 112 | |||||||||||||||
Total | 542 | 509 | 500 | 516 | 489 | |||||||||||||||
PGM Recycling: (6) | ||||||||||||||||||||
Palladium (oz.) | 221 | 306 | 192 | 169 | 81 | |||||||||||||||
Platinum (oz.) | 134 | 192 | 119 | 114 | 62 | |||||||||||||||
Rhodium (oz.) | 29 | 44 | 25 | 23 | 13 | |||||||||||||||
Total | 384 | 542 | 336 | 306 | 156 | |||||||||||||||
Other: (7) | ||||||||||||||||||||
Palladium (oz.) | 6 | — | — | — | 13 | |||||||||||||||
Platinum (oz.) | — | — | — | 1 | — | |||||||||||||||
Total | 6 | — | — | 1 | 13 | |||||||||||||||
By-products from mining: (8) | ||||||||||||||||||||
Rhodium (oz.) | 4 | 3 | 4 | 5 | 2 | |||||||||||||||
Gold (oz.) | 10 | 9 | 9 | 9 | 9 | |||||||||||||||
Silver (oz.) | 6 | 5 | 6 | 6 | 5 | |||||||||||||||
Copper (lb.) | 875 | 903 | 742 | 788 | 824 | |||||||||||||||
Nickel (lb.) | 1,454 | 1,350 | 1,120 | 1,263 | 1,157 | |||||||||||||||
Average realized price per ounce (3) | ||||||||||||||||||||
Mine Production: | ||||||||||||||||||||
Palladium ($/oz.) | $ | 804 | $ | 721 | $ | 641 | $ | 739 | $ | 495 | ||||||||||
Platinum ($/oz.) | $ | 1,386 | $ | 1,481 | $ | 1,551 | $ | 1,705 | $ | 1,488 | ||||||||||
Combined ($/oz.) (5) | $ | 934 | $ | 887 | $ | 849 | $ | 953 | $ | 721 | ||||||||||
PGM Recycling: (6) | ||||||||||||||||||||
Palladium ($/oz.) | $ | 786 | $ | 713 | $ | 645 | $ | 736 | $ | 456 | ||||||||||
Platinum ($/oz.) | $ | 1,428 | $ | 1,526 | $ | 1,542 | $ | 1,757 | $ | 1,539 | ||||||||||
Rhodium ($/oz.) | $ | 1,059 | $ | 1,091 | $ | 1,377 | $ | 2,098 | $ | 2,354 | ||||||||||
Combined ($/oz.) (5) | $ | 1,031 | $ | 1,031 | $ | 1,018 | $ | 1,218 | $ | 1,046 | ||||||||||
Other: (7) | ||||||||||||||||||||
Palladium ($/oz.) | $ | 882 | $ | — | $ | — | $ | — | $ | 479 | ||||||||||
Platinum ($/oz.) | $ | — | $ | — | $ | — | $ | 1,774 | $ | — | ||||||||||
By-products from mining: (8) | ||||||||||||||||||||
Rhodium ($/oz.) | $ | 1,177 | $ | 1,047 | $ | 1,258 | $ | 1,668 | $ | 2,503 | ||||||||||
Gold ($/oz.) | $ | 1,261 | $ | 1,394 | $ | 1,667 | $ | 1,563 | $ | 1,223 | ||||||||||
Silver ($/oz.) | $ | 19 | $ | 24 | $ | 31 | $ | 35 | $ | 19 | ||||||||||
Copper ($/lb.) | $ | 2.92 | $ | 3.14 | $ | 3.42 | $ | 3.82 | $ | 3.24 | ||||||||||
Nickel ($/lb.) | $ | 6.47 | $ | 5.47 | $ | 6.74 | $ | 9.03 | $ | 8.74 | ||||||||||
Average market price per ounce (5) | ||||||||||||||||||||
Palladium ($/oz.) | $ | 803 | $ | 725 | $ | 643 | $ | 734 | $ | 525 | ||||||||||
Platinum ($/oz.) | $ | 1,386 | $ | 1,487 | $ | 1,551 | $ | 1,722 | $ | 1,609 | ||||||||||
Combined ($/oz.) (5) | $ | 933 | $ | 891 | $ | 850 | $ | 952 | $ | 773 | ||||||||||
(1) | Sub-grade tons milled includes reef waste material only. Total tons milled includes ore tons and sub-grade tons only. |
(2) | Total cash costs include total operating costs plus royalties, insurance and taxes other than income taxes. Total cash costs per ounce, is a non-GAAP financial measure that management uses to monitor and evaluate the efficiency of its mining operations. This measure of cost is not defined under U.S. Generally Accepted Accounting Principles (GAAP). See “Item 6 - Selected Financial Data - Reconciliation of Non-GAAP Financial Measures to Consolidated Costs of Revenues” and the accompanying discussion for additional detail. |
(3) | The Company’s average realized price represents revenues, which include the effect of any applicable agreement floor and ceiling prices (for the year 2010 only), hedging gains and losses realized on commodity instruments and agreement discounts, divided by ounces sold. The average market price represents the average London market for the actual months of the period. |
(4) | The concentrate tonnage and grade values are inclusive of periodic re-processing of smelter slag and internal furnace brick PGM bearing materials. |
52
(5) | The Company reports a combined average realized and market price of palladium and platinum at the same ratio as ounces that are produced from the base metal refinery. |
(6) | Ounces sold and average realized price per ounce from PGM Recycling relate to ounces produced from processing of spent catalyst from catalytic converters and other industrial sources. |
(7) | Ounces sold and average realized price per ounce from Other relate to ounces acquired periodically in the open market and simultaneously resold to third parties. |
(8) | By-product metals sold reflect contained metal. Realized prices reflect net values (discounted due to product form and transportation and marketing charges) per unit received. |
RECONCILIATION OF NON-GAAP FINANCIAL MEASURES TO CONSOLIDATED COSTS OF REVENUES
The Company utilizes certain non-GAAP financial measures as indicators in assessing the performance of its mining and processing operations during any period. Because of the processing time required to complete the extraction of finished PGM products, there are typically lags of one to three months between ore production and sale of the finished product. Revenues in any period include some portion of material mined and processed from prior periods as the revenue recognition process is completed. Consequently, while costs of revenues (a GAAP financial measure included in the Company’s Consolidated Statements of Comprehensive Income (Loss)) appropriately reflects the expense associated with the materials sold in any period, the Company has developed certain non-GAAP financial measures to assess the costs associated with its producing and processing activities in a particular period and to compare those costs between periods.
While the Company believes that these non-GAAP financial measures may also be of value to outside readers, both as general indicators of the Company’s mining efficiency from period to period and as insight into how the Company internally measures its operating performance, these non-GAAP financial measures are not standardized across the mining industry and in most cases will not be directly comparable to similar measures that may be provided by other companies. These non-GAAP financial measures are only useful as indicators of relative operational performance in any period, and because they do not take into account the inventory timing differences that are included in costs of revenues, they cannot meaningfully be used to develop measures of earnings or profitability. A reconciliation of these measures to costs of revenues, the most directly comparable GAAP financial measure, for each period shown is provided as part of the following tables, and a description of each non-GAAP financial measure is provided below.
Total Consolidated Costs of Revenues: For the Company as a whole, this measure is equal to total costs of revenues, as reported in the Consolidated Statements of Comprehensive Income (Loss). For the Stillwater Mine, the East Boulder Mine, and PGM Recycling and Other, the Company segregates the expenses within total costs of revenues that are directly associated with each of these activities and then allocates the remaining facility costs included in total cost of revenues in proportion to the monthly volumes from each activity. The resulting total costs of revenues measures for the Stillwater Mine, the East Boulder Mine and PGM Recycling and Other are equal in total to total consolidated costs of revenues as reported in the Company’s Consolidated Statements of Comprehensive Income (Loss).
Total Cash Costs (Non-GAAP): This non-GAAP financial measure is calculated as total costs of revenues (for each mine or combined) adjusted to exclude gains or losses on asset dispositions, costs and profit from recycling activities, revenues from the sale of mine by-products, depreciation and amortization and asset retirement costs, and timing differences resulting from changes in product inventories. The Company uses this measure as a comparative indication of the cash costs related to mine production and processing operations in any period. It is a measure of extraction efficiency.
When divided by the total tons milled in the respective period, Total Cash Costs per Ton Milled (Non-GAAP) – measured for each mine or combined – provides an indication of the level of cash costs incurred per ton milled in that period. Because of variability of ore grade in the Company’s mining operations, production efficiency underground is frequently measured against ore tons produced rather than contained PGM ounces. Because ore tons are first weighed as they are fed into the mill, mill feed is the first point at which mine production tons are measured precisely. Consequently, Total Cash Costs per Ton Milled (Non-GAAP) is a general measure of mine production efficiency, and is affected both by the level of Total Cash Costs (Non-GAAP) and by the volume of tons produced and fed to the mill.
When divided by the total recoverable PGM ounces from mine production in the respective period, Total Cash Costs per Ounce (Non-GAAP) – measured for each mine or combined – provides an indication of the level of cash costs incurred per PGM ounce produced in that period. Recoverable PGM ounces from mine production are an indication of the amount of PGM product extracted through mining in any period. Because ultimately extracting PGM material is the objective of mining, the cash costs per ounce of extracting and processing PGM ounces in a period is a useful measure for comparing extraction efficiency between periods and between the Company’s mines. Consequently, Total Cash Costs per Ounce (Non-GAAP) in any period is a general measure of extraction efficiency, and is affected by the level of Total Cash Costs (Non-GAAP), by the grade of the ore produced and by the volume of ore produced in the period.
53
RECONCILIATION OF NON-GAAP FINANCIAL MEASURES TO CONSOLIDATED COSTS OF REVENUES (Continued)
(In thousands, except per ounce and per ton data) | 2014 | 2013 | 2012 | 2011 | 2010 | |||||||||||||||
Consolidated: | ||||||||||||||||||||
Total cash costs before by-product and recycling credits (Non-GAAP) | $ | 319,676 | $ | 322,564 | $ | 290,346 | $ | 272,719 | $ | 232,835 | ||||||||||
Less: By-product credit | (29,592 | ) | (27,085 | ) | (30,642 | ) | (35,963 | ) | (27,980 | ) | ||||||||||
Less: Recycling income credit | (11,702 | ) | (35,463 | ) | (11,042 | ) | (19,416 | ) | (12,070 | ) | ||||||||||
Total cash costs net of by-product and recycling credits (Non-GAAP) | $ | 278,382 | $ | 260,016 | $ | 248,662 | $ | 217,340 | $ | 192,785 | ||||||||||
Divided by platinum/palladium ounces produced | 518 | 524 | 514 | 518 | 485 | |||||||||||||||
Total cash costs before by-product and recycling credits per ounce Pt/Pd produced (Non-GAAP) | $ | 618 | $ | 616 | $ | 565 | $ | 526 | $ | 480 | ||||||||||
Less: By-product credit per ounce Pt/Pd produced | (57 | ) | (52 | ) | (60 | ) | (69 | ) | (58 | ) | ||||||||||
Less: Recycling income credit per ounce Pt/Pd produced | (23 | ) | (68 | ) | (21 | ) | (37 | ) | (25 | ) | ||||||||||
Total cash costs net of by-product and recycling credits per ounce Pt/Pd produced (Non-GAAP) | $ | 538 | $ | 496 | $ | 484 | $ | 420 | $ | 397 | ||||||||||
Divided by ore tons milled | 1,265 | 1,274 | 1,150 | 1,210 | 1,181 | |||||||||||||||
Total cash costs before by-product and recycling credits per ore ton milled (Non-GAAP) | $ | 252 | $ | 253 | $ | 252 | $ | 225 | $ | 197 | ||||||||||
By-product credit per ore ton milled | (23 | ) | (21 | ) | (27 | ) | (30 | ) | (24 | ) | ||||||||||
Recycling income credit per ore ton milled | (9 | ) | (28 | ) | (10 | ) | (16 | ) | (10 | ) | ||||||||||
Total cash costs net of by-product and recycling credits per ore ton milled (Non-GAAP) | $ | 220 | $ | 204 | $ | 215 | $ | 179 | $ | 163 | ||||||||||
Reconciliation to consolidated costs of revenues: | ||||||||||||||||||||
Total cash costs net of by-product and recycling credits (Non-GAAP) | $ | 278,382 | $ | 260,016 | $ | 248,662 | $ | 217,340 | $ | 192,785 | ||||||||||
Asset retirement costs | 747 | 689 | 635 | 584 | 538 | |||||||||||||||
Depletion, depreciation and amortization | 66,387 | 58,201 | 56,960 | 61,312 | 71,121 | |||||||||||||||
Depletion, depreciation and amortization (in inventory) | (1,281 | ) | 1,190 | 1,393 | (3,492 | ) | 365 | |||||||||||||
Change in product inventories | 18,847 | (10,480 | ) | (3,452 | ) | 903 | 2,627 | |||||||||||||
Cost of PGM Recycling | 391,481 | 527,384 | 334,949 | 358,566 | 157,310 | |||||||||||||||
PGM Recycling - depreciation | 1,019 | 1,116 | 1,055 | 1,066 | 472 | |||||||||||||||
By-product credit | 29,592 | 27,085 | 30,642 | 35,963 | 27,980 | |||||||||||||||
Profit from PGM Recycling (before bad debt expense and gain/loss on asset disposals) | 11,702 | 35,463 | 11,042 | 19,416 | 12,070 | |||||||||||||||
Total consolidated cost of revenues | $ | 796,876 | $ | 900,664 | $ | 681,886 | $ | 691,658 | $ | 465,268 | ||||||||||
54
RECONCILIATION OF NON-GAAP FINANCIAL MEASURES TO CONSOLIDATED COSTS OF REVENUES (Continued)
(In thousands, except per ounce and per ton data) | 2014 | 2013 | 2012 | 2011 | 2010 | |||||||||||||||
Stillwater Mine: | ||||||||||||||||||||
Total cash costs before by-product and recycling credits (Non-GAAP) | $ | 206,496 | $ | 217,921 | $ | 200,016 | $ | 192,840 | $ | 160,912 | ||||||||||
By-product credit | (17,115 | ) | (16,270 | ) | (19,793 | ) | (23,397 | ) | (18,389 | ) | ||||||||||
Recycling income credit | (7,695 | ) | (24,470 | ) | (8,124 | ) | (14,387 | ) | (8,733 | ) | ||||||||||
Total cash costs net of by-product and recycling credits (Non-GAAP) | $ | 181,686 | $ | 177,181 | $ | 172,099 | $ | 155,056 | $ | 133,790 | ||||||||||
Divided by platinum/palladium ounces produced | 341 | 366 | 378 | 387 | 352 | |||||||||||||||
Total cash costs before by-product and recycling credits per ounce Pt/Pd produced (Non-GAAP) | $ | 606 | $ | 595 | $ | 529 | $ | 498 | $ | 457 | ||||||||||
By-product credit per ounce Pt/Pd produced | (50 | ) | (44 | ) | (52 | ) | (60 | ) | (52 | ) | ||||||||||
Recycling income credit per ounce Pt/Pd produced | (23 | ) | (67 | ) | (21 | ) | (37 | ) | (25 | ) | ||||||||||
Total cash costs net of by-product and recycling credits per ounce Pt/Pd produced (Non-GAAP) | $ | 533 | $ | 484 | $ | 456 | $ | 401 | $ | 380 | ||||||||||
Divided by ore tons milled | 749 | 801 | 709 | 794 | 781 | |||||||||||||||
Total cash costs before by-product and recycling credits per ore ton milled (Non-GAAP) | $ | 276 | $ | 272 | $ | 282 | $ | 243 | $ | 206 | ||||||||||
By-product credit per ore ton milled | (23 | ) | (20 | ) | (28 | ) | (29 | ) | (24 | ) | ||||||||||
Recycling income credit per ore ton milled | (10 | ) | (31 | ) | (11 | ) | (18 | ) | (11 | ) | ||||||||||
Total cash costs net of by-product and recycling credits per ore ton milled (Non-GAAP) | $ | 243 | $ | 221 | $ | 243 | $ | 196 | $ | 171 | ||||||||||
Reconciliation to costs of revenues: | ||||||||||||||||||||
Total cash costs net of by-product and recycling credits (Non-GAAP) | $ | 181,686 | $ | 177,181 | $ | 172,099 | $ | 155,056 | $ | 133,790 | ||||||||||
Asset retirement costs | 700 | 639 | 588 | 541 | 498 | |||||||||||||||
Depletion, depreciation and amortization | 49,271 | 44,696 | 43,329 | 47,759 | 49,309 | |||||||||||||||
Depletion, depreciation and amortization (in inventory) | (1,716 | ) | 896 | 924 | (2,144 | ) | 629 | |||||||||||||
Change in product inventories | 11,309 | (5,110 | ) | (2,326 | ) | (252 | ) | (2,887 | ) | |||||||||||
By-product credit | 17,115 | 16,270 | 19,793 | 23,397 | 18,389 | |||||||||||||||
Profit from PGM Recycling (before bad debt expense and gain/loss on asset disposals) | 7,695 | 24,470 | 8,124 | 14,387 | 8,733 | |||||||||||||||
Total cost of revenues | $ | 266,060 | $ | 259,042 | $ | 242,531 | $ | 238,744 | $ | 208,461 | ||||||||||
55
RECONCILIATION OF NON-GAAP FINANCIAL MEASURES TO CONSOLIDATED COSTS OF REVENUES (Continued)
(In thousands, except per ounce and per ton data) | 2014 | 2013 | 2012 | 2011 | 2010 | |||||||||||||||
East Boulder | ||||||||||||||||||||
Total cash costs before by-product and recycling credits (Non-GAAP) | $ | 113,180 | $ | 104,643 | $ | 90,330 | $ | 79,879 | $ | 71,923 | ||||||||||
By-product credit | (12,477 | ) | (10,815 | ) | (10,849 | ) | (12,566 | ) | (9,591 | ) | ||||||||||
Recycling income credit | (4,007 | ) | (10,993 | ) | (2,918 | ) | (5,029 | ) | (3,337 | ) | ||||||||||
Total cash costs net of by-product and recycling credits (Non-GAAP) | $ | 96,696 | $ | 82,835 | $ | 76,563 | $ | 62,284 | $ | 58,995 | ||||||||||
Divided by platinum/palladium ounces produced | 177 | 158 | 136 | 131 | 133 | |||||||||||||||
Total cash costs before by-product and recycling credits per ounce Pt/Pd produced (Non-GAAP) | $ | 641 | $ | 664 | $ | 663 | $ | 610 | $ | 541 | ||||||||||
By-product credit per ounce Pt/Pd produced | (71 | ) | (69 | ) | (80 | ) | (96 | ) | (72 | ) | ||||||||||
Recycling income credit per ounce Pt/Pd produced | (23 | ) | (70 | ) | (21 | ) | (38 | ) | (25 | ) | ||||||||||
Total cash costs net of by-product and recycling credits per ounce Pt/Pd produced (Non-GAAP) | $ | 547 | $ | 525 | $ | 562 | $ | 476 | $ | 444 | ||||||||||
Divided by ore tons milled | 516 | 473 | 441 | 416 | 400 | |||||||||||||||
Total cash costs before by-product and recycling credits per ore ton milled (Non-GAAP) | $ | 219 | $ | 221 | $ | 205 | $ | 192 | $ | 180 | ||||||||||
By-product credit per ore ton milled | (24 | ) | (23 | ) | (25 | ) | (30 | ) | (24 | ) | ||||||||||
Recycling income credit per ore ton milled | (8 | ) | (23 | ) | (7 | ) | (12 | ) | (8 | ) | ||||||||||
Total cash costs net of by-product and recycling credits per ore ton milled (Non-GAAP) | $ | 187 | $ | 175 | $ | 173 | $ | 150 | $ | 148 | ||||||||||
Reconciliation to costs of revenues: | ||||||||||||||||||||
Total cash costs net of by-product and recycling credits (Non-GAAP) | $ | 96,696 | $ | 82,835 | $ | 76,563 | $ | 62,284 | $ | 58,995 | ||||||||||
Asset retirement costs | 47 | 50 | 47 | 43 | 40 | |||||||||||||||
Depletion, depreciation and amortization | 17,116 | 13,505 | 13,631 | 13,553 | 21,812 | |||||||||||||||
Depletion, depreciation and amortization (in inventory) | 435 | 294 | 469 | (1,348 | ) | (264 | ) | |||||||||||||
Change in product inventories | 2,182 | (5,370 | ) | (1,126 | ) | 14 | (865 | ) | ||||||||||||
By-product credit | 12,477 | 10,815 | 10,849 | 12,566 | 9,591 | |||||||||||||||
Profit from PGM Recycling (before bad debt expense and gain/loss on asset disposals) | 4,007 | 10,993 | 2,918 | 5,029 | 3,337 | |||||||||||||||
Total cost of revenues | $ | 132,960 | $ | 113,122 | $ | 103,351 | $ | 92,141 | $ | 92,646 | ||||||||||
PGM Recycling and Other: (1) | ||||||||||||||||||||
Cost of open market acquisitions | $ | 5,357 | $ | — | $ | — | $ | 1,141 | $ | 6,379 | ||||||||||
Cost of PGM Recycling | 391,481 | 527,384 | 334,949 | 358,566 | 157,310 | |||||||||||||||
PGM Recycling - depreciation | 1,019 | 1,116 | 1,055 | 1,066 | 472 | |||||||||||||||
Total cost of revenues | $ | 397,857 | $ | 528,500 | $ | 336,004 | $ | 360,773 | $ | 164,161 | ||||||||||
(1) PGM Recycling and Other include PGM recycling and metal acquired periodically in the open market and simultaneously resold to third parties.
56
All-In Sustaining Costs (Non-GAAP): This non-GAAP financial measure is used as an indicator from period to period of the level of total cash required by the Company to maintain and operate the existing mines, including corporate administrative costs and replacement capital. The measure is calculated beginning with total cash costs (another non-GAAP financial measure, described above), and adding to it the recycling income credit, domestic corporate overhead and marketing costs (excluding any depreciation, research and development, and reorganization costs included in corporate overhead costs) and that portion of total capital expenditures associated with sustaining the current level of mining operations. (Capital expenditures for Blitz, Graham Creek and certain other one-time projects are not included in the calculation.)
When divided by the total recoverable PGM ounces in the respective period, All-In Sustaining Costs per Mined Ounce (Non-GAAP) provides an indication of the level of total cash required to maintain and operate the mines per PGM ounce produced in the period. Recoverable PGM ounces from production are an indication of the amount of PGM product extracted through mining in any period. Because the objective of PGM mining activity is to extract PGM material, the all-in cash costs per ounce to produce PGM material, administer the business and sustain the operating capacity of the mines is a useful measure for comparing overall extraction efficiency between periods. This measure is affected by the total level of spending in the period and by the grade and volume of mined ore produced.
Stillwater Mining Company
All-In Sustaining Costs
(Non-GAAP Financial Measure)
(In thousands, except $/oz.) | 2014 | 2013 | 2012 | 2011 | 2010 | |||||||||||||||
All-In Sustaining Costs | ||||||||||||||||||||
Total cash costs net of by-product and recycling credits (Non-GAAP) | $ | 278,382 | $ | 260,016 | $ | 248,662 | $ | 217,340 | $ | 192,785 | ||||||||||
Recycling income credit | 11,702 | 35,463 | 11,042 | 19,416 | 12,070 | |||||||||||||||
$ | 290,084 | $ | 295,479 | $ | 259,704 | $ | 236,756 | $ | 204,855 | |||||||||||
Consolidated Corporate General & Administrative costs | $ | 35,067 | $ | 46,577 | $ | 53,277 | $ | 56,120 | $ | 35,431 | ||||||||||
Corporate depreciation and R&D included in Consolidated Corporate General & Administrative costs * | (482 | ) | (610 | ) | (1,530 | ) | (2,436 | ) | (217 | ) | ||||||||||
General & Administrative Costs - Foreign Subsidiaries | (3,588 | ) | (3,661 | ) | (7,119 | ) | (4,674 | ) | (40 | ) | ||||||||||
$ | 30,997 | $ | 42,306 | $ | 44,628 | $ | 49,010 | $ | 35,174 | |||||||||||
Total capitalized costs | $ | 129,813 | $ | 139,011 | $ | 116,878 | $ | 96,983 | $ | 50,262 | ||||||||||
Capital associated with expansion projects | (45,054 | ) | (50,696 | ) | (37,756 | ) | (26,937 | ) | (4,794 | ) | ||||||||||
Total Capital incurred to sustain existing operations | $ | 84,759 | $ | 88,315 | $ | 79,122 | $ | 70,046 | $ | 45,468 | ||||||||||
All-In Sustaining Costs (Non-GAAP) | $ | 405,840 | $ | 426,100 | $ | 383,454 | $ | 355,812 | $ | 285,497 | ||||||||||
Mined ounces produced | 517.7 | 523.9 | 513.7 | 517.9 | 485.0 | |||||||||||||||
All-In Sustaining Costs per Mined Ounce ($/oz.) (Non-GAAP) | $ | 784 | $ | 813 | $ | 746 | $ | 687 | $ | 589 | ||||||||||
For a full reconciliation of this non-GAAP financial measure to a GAAP financial measure, see the Reconciliation of Non-GAAP Financial Measures to Consolidated Costs of Revenues section.
* Consolidated Corporate General & Administrative Costs includes Marketing and Research and Development (R&D) costs. The Marketing and R&D costs in prior years were separate line items on the Company's Consolidated Statements of Comprehensive Income (Loss).
Prior year numbers have been restated to conform to current year presentation.
57
ITEM 7
MANAGEMENT’S DISCUSSION AND ANALYSIS OF
FINANCIAL CONDITION AND RESULTS OF OPERATIONS
The following discussion should be read in conjunction with the Company’s Consolidated Financial Statements and Notes, included elsewhere in this report, and the information contained in Part II, Item 6 “Selected Financial Data.”
EXECUTIVE OVERVIEW
Stillwater Mining Company enjoyed a profitable year reporting 2014 full year consolidated net income attributable to common stockholders of $70.3 million, or $0.56 per diluted share. In 2013 the Company reported a loss of $270.2 million, or $2.28 per common share, which included substantial impairment charges for the Company's Altar and Marathon assets. Revenues in 2014 included $536.0 million from mine production and $401.7 million of recycling sales. Comparable revenues in 2013 included $478.9 million from mine production, of which $7.1 million was generated from reprocessed internal furnace brick in the third and fourth quarters and $560.6 million of recycling revenues, of which $16.4 million was from metals recovered from the reprocessed internal furnace brick. Market prices for palladium and platinum, the Company’s principal products, were comparatively strong in 2014, averaging approximately $803 and $1,385 per ounce respectively during the year. In 2013, the market price for palladium averaged $725 per ounce and for platinum, $1,487 per ounce.
Cash capital expenditures in 2014 totaled $119.7 million. The Company’s liquidity strengthened during the year, as cash and cash equivalents plus short-term investments, after the repayment of $30.0 million of long-term debt, increased by $35.5 million to $531.5 million at December 31, 2014. Significant progress was made in the Company’s efforts to control costs during 2014, with all-in sustaining costs (a non-GAAP financial measure of extraction efficiency) declining to $784 per ounce from $813 per ounce in 2013. Total cash costs per mined ounce of palladium and platinum, net of by-product and recycling credits (a non-GAAP financial measure) averaged $538 per ounce for the year.
The Company’s two operating mines in Montana, the Stillwater Mine and the East Boulder Mine, continued to operate well. Total mine production of palladium and platinum in 2014 was 517,700 ounces. Production at the East Boulder Mine increased 12.1% during 2014 to 176,900 ounces of palladium and platinum, up from 157,800 ounces in 2013, as productivity increased and initial production began from the Graham Creek area. Production declined 7% at the Stillwater Mine to 340,800 saleable ounces in 2014 due in large part to the decision to cease mining in some stopes until appropriate infrastructure can be put into place to optimize their profitability.
Along with its mined material, the Company also processes recycled palladium, platinum, and rhodium through its smelter in Columbus, Montana. In 2014, the Company processed an average of 18.6 tons per day of recycled material, down from a record 25.4 tons per day processed in 2013. The Company earned $11.7 million (before tax) on this business during 2014, down from $35.5 million in 2013. The 2013 recycling results included revenues of $16.4 million on metal recovered from reprocessing the Company’s own internal furnace brick.
The Company’s expansion projects in Montana made good progress during 2014. The Graham Creek project, which extends the underground infrastructure at the East Boulder Mine by approximately 8,800 feet to the west, was completed as planned during the year. Underground diamond core resource drilling continues at Graham Creek. The first stoping in the Graham Creek area also was brought into production during the second half of 2014.
Development of the Blitz project, which ultimately will extend the underground infrastructure at the Stillwater Mine by approximately 23,000 feet to the east, also progressed during 2014. Tunnel boring machine development totaled 5,000 equivalent feet during the year. Development of the core Blitz infrastructure is expected to be completed in mid to late 2018.
Activity at the Company’s foreign exploration ventures was scaled back during 2014 as focus shifted to the Montana operations. At the Altar property in Argentina the study team focused on completing technical reviews of various processing alternatives. As the Company has disclosed previously, although the Altar property shows excellent promise for future copper-gold production, strategically it is not a core asset for the Company. At Marathon, studies of various project alternatives were completed during the first half of 2014. A modest targeted exploration program is planned at Marathon during 2015.
58
Market demand for palladium and platinum increased during 2014, driven by growing automotive production and sales in North America, China and, to a lesser extent, in Western Europe. Two new palladium ETFs were also introduced in South Africa early in the year that has absorbed nearly a million ounces of palladium metal. Supplies of platinum and palladium were somewhat constrained during the first half of the year as a result of labor disruptions in South Africa, although it appears that significant volumes from above-ground inventories and stocks in process largely served to offset any resulting shortfall in the metals. Overall, demand for palladium and platinum reportedly exceeded production from primary and secondary sources, continuing a production deficit in both metals that has existed since 2012.
On the environmental front, 2014 saw a continuation of the Company’s excellent record, with no notices of violation. In addition, the Company made good progress on projects at both mines designed to mitigate seepage into groundwater of residual nitrates from its waste rock management practices. Safety performance in 2014, in terms of the Company’s reportable incidence rate, improved slightly in 2014 relative to 2013.
The Company saw an overall net increase in its proven and probable ore reserves of palladium and platinum during 2014, more than replacing the ounces it produced. Expressed on an in-situ basis, total proven reserves of palladium and platinum increased by a net 3.4% to 3.14 million ounces, while total proven and probable reserves increased by 0.7% to 22.23 million combined ounces of palladium and platinum.
The Company's emphasis during 2015 will include continuing focus on cost containment and productivity improvements including renewal of its union agreements. Analyst forecasts suggest that demand for palladium is likely to continue to increase in 2015, while worldwide production will remain constrained, putting upward pressure on prices. However, a countervailing trend in 2015 may be continued strengthening of the U.S. dollar relative to other major currencies, putting downward pressure on all commodity prices. The Company is pursuing opportunities to grow its processing business to better utilize the capacity available in the Columbus metallurgical facilities. The definitional drilling program at Graham Creek will continue during 2015, which should position the Company for growth in production in late 2015/early 2016. With regard to the other exploration stage projects, the Company will continue pursuing opportunities to realize value appropriately from its assets at Marathon and Altar.
PRINCIPAL FACTORS AFFECTING THE COMPANY
Resources
The Company controls a 28-mile long segment of the PGM-rich J-M Reef, which represents an uplifted portion of the much larger Stillwater Intrusive Complex, a deep geologic structure that extends underground several miles toward the north from the Beartooth front where the Company's mines are located. The PGM reef structure itself averages approximately five feet in thickness and is uplifted typically at an angle of approximately 55 degrees - although there is considerable variability in different portions of the reef. To date, the Company has actively mined or developed portions of the reef along approximately 11 miles of the total 28 mile resource on underground levels ranging from approximately 1,900 feet above sea level at the lowest to 7,500 feet above sea level at maximum.
The PGM ores in the J-M Reef contain some of the highest PGM grades in the world. These ores are palladium dominant and normally yield approximately 3.4 times as much palladium as platinum, along with lesser values of by-product gold, nickel, rhodium, copper and silver. However, the narrow mining widths and steeply dipping configuration of the reef make the deposit relatively complex to mine. The Company's mines compete primarily with the platinum-rich PGM ore reserves found in South Africa's Bushveld Complex and with the significant palladium-rich by-products of Norilsk Nickel's primary nickel mines in northern Russia. The platinum-dominant Bushveld PGM deposits also occur in narrow reef structures, but they typically dip only gradually to depth in comparison to the J-M Reef. However, most of the shallower Bushveld ores have now largely been depleted, leaving deeper, hotter and more complex mining conditions and comparatively higher mining costs per ounce. The Russian nickel mines of Norilsk Nickel, which provide over 40% of all palladium mined each year, produce palladium-rich PGMs as a major by-product of their primary nickel operations at a very low marginal cost. Other global sources of primary PGMs include the Great Dyke in Zimbabwe, the predominantly nickel-copper operations of Vale and Glencore Xstrata at Sudbury in Canada, and North American Palladium's operations at Lac des Îles, also in Canada.
59
The Company's financial performance is sensitive to both the absolute level of PGM prices and to the relationship between the price of platinum and the price of palladium. Historically, the Company's financial and share price performance has correlated closely with the price of palladium, the Company's principal product. As the price of palladium increases relative to the price of platinum, the Company's competitive position relative to the South African PGM producers generally improves. However, in periods of low PGM prices, and in particular when palladium prices decline relative to platinum prices, the Company's palladium-rich production may put it at a disadvantage to comparable mines in South Africa with a higher proportion of platinum in their ores. Currency exchange rates also play a role in the Company's competitive standing. During 2013 and 2014, the South African rand weakened significantly, reducing South African rand-denominated costs relative to U.S. dollar costs and somewhat improving the South Africans' competitive position. The Russian ruble also weakened against the U.S. dollar in this period, but the by-product nature of Russian palladium production makes it more directly driven by conditions in the nickel market than by cost and currency considerations. See “Risk Factors – The Company may be competitively disadvantaged as primarily a palladium producer with a U.S. dollar-based cost structure" for further discussion.
Operations
Stillwater Mine
The mine to date has developed portions of the reef along approximately six horizontal miles on various levels underground, ranging from approximately the 1900 level at the deepest up to the 7500 level in the Upper West area of the mine. Typically, the lower portion of the Stillwater Mine that is accessed from the shaft - referred to as the “Off-Shaft” area - has produced relatively high average ore grades; however, mineable ore zones in this area tend to exhibit less continuity of grade and thickness along the reef. By contrast, the western portion of the mine above the 5000 level - the “Upper West” area - generally has lower average ore grades, but the ore continuity, grade and thickness in this area is more consistent. Consequently, overall ounce production at the Stillwater Mine is sensitive not only to the total ore tons produced, but also to the mix of ore grades produced from different areas of the mine. Grades to the mill at the Stillwater Mine can range between approximately 0.45 and 0.65 ounces per ton, and in 2014 averaged 0.50 ounces per ton. In 2014 the Stillwater Mine produced 340,800 ounces of PGMs, down from 366,100 ounces in 2013 – and generated 2014 revenues of $357.9 million. At December 31, 2014, the Stillwater Mine had 942 employees.
East Boulder Mine
The Graham Creek drive, completed during 2014, provides access to another 1.5 miles of the reef that will be drilled and brought into production over the next several years. As production from the first Graham Creek area stope came online in the second half of 2014, the Company added an additional working crew in the concentrator to accommodate the added tonnage. Thus far, mining operations at the East Boulder Mine have been developed vertically on seven primary levels between the elevations of 6,500 and 7,900 feet above sea level, with some limited mining down to the 6,200 level. The continuity of grade and thickness in the PGM mineralization at East Boulder Mine is characteristically higher than that observed at the Stillwater Mine. However, average ore grades at the East Boulder Mine are lower, with grades to the mill typically averaging between 0.35 and 0.40 ounces per ton; in 2014 they averaged 0.38 ounces per ton. During 2014 the East Boulder Mine produced 176,900 ounces of PGMs, compared to 157,800 ounces in 2013 – with 2014 revenues of $178.1 million. At December 31, 2014, the East Boulder Mine had 419 employees.
Columbus Processing and PGM Recycling
The Company's processing facilities process mineral concentrates from the two mines, along with recycling material from automotive catalysts and other industrial sources. Recycling materials and mine concentrates are weighed and sampled upon arrival at the Columbus smelter, and then are commingled and fed into the smelter and base metals refinery. The final primary output from these facilities is a PGM-rich filtercake that is shipped to Johnson Matthey for final processing. Johnson Matthey recovers palladium, platinum and recycled rhodium from these materials, along with lesser values of mine by-products including rhodium, gold and silver. The base metals refinery also recovers and sells by-product nickel sulfate and copper, both at less than commercial grades. The full cost of operating the Company's processing facilities is allocated back to the mines and to the recycling business. At December 31, 2014, the processing facilities and analytical laboratory had 187 employees combined.
Recycling has proven to be a consistently profitable line of business for the Company. However, it also has proven to be very sensitive to PGM prices: volumes of recycling material available in the market drop sharply when PGM prices decline, as does the overall profitability of the business.
60
The Company believes it enjoys certain competitive advantages in the recycling business. The concentrates from the Montana mines contain not only PGMs, but also significant quantities of nickel and copper, which are vital to the efficient recovery of the PGMs in the recycled materials. Copper and nickel sulfides from the ore concentrates bind with the elemental PGMs from recycling in the smelter and so aid in collecting the recycled PGMs. Because of this affinity, the Company believes that it is able to recycle catalyst material within its system at an incremental cost lower than most other processors. Moreover, the Company also believes the physical location of its processing facilities provides a logistical advantage over smelters in Europe and South Africa, particularly for North American collectors.
The Company employs certain technological and other innovations that may contribute further to its competitive advantage. The Company utilizes its secondary electric furnace in the Columbus smelter as a slag-cleaning circuit, improving PGM recoveries while also providing increased throughput capacity and creating backup capacity in the event of planned or unforeseen outages. The Company has constructed a dedicated catalyst processing and sampling plant that allows for the segregation and handling of multiple batches of recycling material simultaneously. The Company also has installed a state-of-the-art assay laboratory, utilizing an automated x-ray facility to provide accurate results with faster turnaround times than are possible with conventional fire assay methods.
In acquiring recycled automotive catalysts, the Company may advance certain funds to its suppliers ahead of actually receiving material in order to facilitate procurement efforts. In most cases, the Company advances funds to suppliers when the associated material for recycling is either pending transit or is already in transit to the Columbus processing facilities. The state-of-the-art recycling, sampling and assay facilities allow the Company to accelerate final settlements with suppliers, thereby allowing them to turn over their working capital faster. Outstanding advances that were not backed up by inventory physically in the Company’s possession totaled $7.3 million and $6.9 million at December 31, 2014, and 2013, respectively.
Cost Structure
The table that follows indicates the relative contribution to total costs of various cost components for the Company's Montana operations.
Mining and Processing Cost Components | 2014 | 2013 | 2012 | ||||||
Labor and Benefits | 49.1 | % | 48.6 | % | 48.8 | % | |||
Materials and Supplies | 23.3 | % | 24.0 | % | 23.1 | % | |||
Utilities and Fuel | 7.0 | % | 6.7 | % | 7.7 | % | |||
Contracted Services | 7.9 | % | 9.0 | % | 8.6 | % | |||
Royalties, Non-Income Taxes and Other | 12.7 | % | 11.7 | % | 11.8 | % | |||
Total | 100.0 | % | 100.0 | % | 100.0 | % | |||
Excludes unallocated corporate overhead costs and costs to purchase recycling materials.
Costs are shown gross and do not reflect the portion of these costs that are allocated to mined material carried in inventory.
Labor and benefits comprise the largest share of costs in the Company's operations. In total the Company saw a reduction of 154 workers during 2014, partially the result of corporate reorganization and the remainder from not hiring to fully replace normal attrition. Excluding reorganization initiatives, the Company's attrition rate during 2014 averaged 8.3%, essentially unchanged from 2013.
The Company is dependent on its skilled workforce in conducting its operations. At times in the past the Company has had difficulty in hiring skilled miners and other professionals. When necessary, the Company has conducted internal training programs in order to ensure that its manpower needs were met. At present, the decline in commodity prices has reduced the competition for skilled miners, and the Company believes it can hire to cover its needs for the immediate future.
Material and supply costs are the other significant component of the Company's operating costs. As part of the Company's initiative to control operating costs, management has met with its major suppliers in an effort to identify opportunities for cost savings. Such savings may come not only from more competitive pricing, but also from assistance from suppliers in improving efficiency and productivity in the Company's operations.
61
SOCIAL AND ENVIRONMENTAL CONSIDERATIONS
Management believes that effectively addressing the Company's social and environmental obligations is essential to maximizing value for shareholders. Thus, the Company's environmental approach focuses on operational integrity; on the essential environmental role played by its products; and on valuing the areas in which the Company's operations are located. The Company is a key employer in the communities where it operates and actively supports selected community programs where its employees and their families live. Commitment to the community, attractive wages and benefits, and maintaining a safe work environment not only allow the Company to be competitive in the market for employees, but also contribute to the health and economic vigor of the communities where it operates. The Company believes its investment in state-of-the-art facilities and technologies allows the Company to continually deliver high-quality products to its customers at a competitive price.
The Good Neighbor Agreement signed in 2000 and now in its fifteenth year, legally commits the Company to work closely with and provide full environmental disclosure to its neighbors and certain regional environmental NGOs (non-governmental organizations). Provisions of the agreement include transporting the majority of Company employees to and from work in buses so as to minimize traffic on rural roads; periodic meetings among the parties to the agreement to discuss concerns and consider environmental performance; ongoing Company funding of an independent engineering firm to monitor and report on the Company's environmental outcomes; and open community involvement in Company dealings with regulatory agencies. In addition, the Company has traditionally hosted an annual dinner where leaders in the environmental community can meet directly with the Company's board of directors and management.
The Company's processes overall are designed to minimize their impact on the environment, complying with all applicable regulatory standards. Approximately 50% of the mined tailings typically are returned to the mines after processing and are used as underground fill. The remaining tailings are placed in lined tailings ponds where the constructed embankments are contemporaneously re-vegetated and contoured to match the surrounding topography. Mine effluent water generally meets drinking water standards aside from elevated concentrations of nitrates from the explosives used underground. These nitrates are treated and removed biologically before any water is discharged. Tailings water is recycled through lined facilities back to the concentrators and not discharged to the environment. Regular bioassays of tailings water consistently show 100% survival of trout fingerlings. Biodiesel blends are used as fuel underground, both for their cleaner exhaust and to reduce carbon footprint. Likewise, in an area noted for its abundance of deer, elk and bear, the Stillwater Mine also hosts a large herd of bighorn sheep that winter on the mine property and can be regular visitors to the mine parking lot.
In light of the Environmental Protection Agency's efforts to regulate carbon dioxide emissions as a greenhouse gas, the Company has reassessed its exposure to likely restrictions on such emissions. The Company's principal sources of CO2 emissions are internal combustion engines, including vehicles and mining equipment, and to stationary sources such as mine ventilation and process heaters, dryers and converters that consume natural gas.
The Company employs a proactive approach with regard to employee health. The Company's medical benefits include a “wellness” program for employees and their families intended to encourage and educate regarding good health practices. The program also includes annual physical checkups for employees and their families, targeted programs for specific health risks, and themes related to physical, emotional and mental health issues. On the safety front, the Company has engineered safe practices into all work tasks and trains to those standards. The Company continually works to establish and maintain a multifaceted “culture of safety,” summarized by the slogan, “Everyone Goes Home Safe - Every Day.” Safety programs include incident tracking and analysis, near-miss reporting, workplace start-of-shift inspection checklists, team safety meetings, annual refresher training, safety stand-downs and financial incentives for working safely. The Company also works closely with MSHA inspectors to act on their findings and incorporate their suggestions. The Company has implemented the National Mining Association CORESafety system, which is comprised of 20 separate modules addressing all aspects of mining safety. Management also strives to maintain a consistent “tone at the top” that gives working safely priority over all other objectives.
LIQUIDITY AND CAPITAL RESOURCES
For 2014, net cash provided by operating activities was $187.6 million compared to $149.4 million and $103.9 million for 2013 and 2012, respectively. The Company’s net cash flow from operating activities is affected by several key factors, including net realized prices for its products, cash costs of production, and the level of PGM production from the mines. Mining productivity rates and ore grades in turn can affect both the level of PGM production and cash costs of production.
62
At December 31, 2014, and 2013, the Company’s available balance of cash and cash equivalents was $280.3 million and $286.7 million, respectively. Including highly-liquid investments with cash and cash equivalents, the Company's available liquidity was $531.5 million at December 31, 2014, and $496.0 million at December 31, 2013. In addition to the increased available liquidity at year end, the Company also redeemed $30.0 million of Exempt Facility Revenue Bonds. Of the Company's year-end 2014 available cash balance, $18.4 million was held in the Company's 75%-owned Canadian subsidiary, Stillwater Canada Inc, on behalf of the Marathon properties and was unavailable for other corporate purposes.
The Company has outstanding balance sheet debt obligations of $296.2 million at December 31, 2014. Included in this total is the highly discounted debt portion of the Company's 1.75% convertible debentures. These notes, if not converted, are redeemable upon demand by the holders on October 15, 2019, for $396.75 million in cash and / or Company shares. The undiscounted future repayment obligations represented by all the Company's outstanding debt (excluding undrawn letters of credit and the interest portion of capital lease payments) total $401.8 million at December 31, 2014.
The Company will be required to fund approximately $7.1 million in total interest payments during 2015 related to its outstanding debt obligations. The Company's $2.2 million of outstanding 1.875% senior convertible debentures are redeemable at par at the discretion of the holders on March 15, 2018. The Company expects all of the outstanding 1.875% debentures to be redeemed at that time.
The Company's financial performance is affected by changes in PGM prices. Absent separate hedging arrangements, a one percent change in the price of platinum would affect annual cash generated from mining operations by approximately $1.6 million, and a corresponding change in the price of palladium would affect annual cash generation from mining operations by approximately $3.1 million. The sensitivity of the recycling business to changes in palladium and platinum prices is more muted and varies according to the provisions in the various recycling agreements. In the Company’s recycling activities, upon purchasing recycled material for processing the Company simultaneously enters into a fixed forward contract that determines the future selling price of the contained PGMs, effectively locking in a sales margin. During 2014, the average before-tax margin realized on recycling revenues (including financing income) was approximately 2.9%.
Changes in the Company's cash costs of production generally flow through dollar-for-dollar into cash flow from operations. A reduction due to grade in total mine production of 10%, or approximately 51,800 ounces per year, would reduce cash flow from operations by an estimated $43 million per year at the price and cost levels prevailing at December 31, 2014.
Net cash used in investing activities was $163.0 million, $79.1 million and $324.8 million in 2014, 2013 and 2012, respectively. The Company’s investing activities primarily consist of capital spending and net sales and purchases of short-term investments. Cash utilized for capital expenditures totaled $119.7 million in 2014, $129.0 million in 2013, and $112.1 million in 2012.
Net cash used in financing activities was $31.0 million and $163.3 million in 2014 and 2013, respectively. Financing activities in 2014 included the early redemption of $30.0 million of 8% State of Montana industrial revenue bonds, otherwise due in July 2020, and $2.0 million of other debt payments. Partially offsetting these debt repayments was proceeds of $1.0 million from the exercise of outstanding stock options. Financing activity in 2013 mostly represented the redemption of $164.3 million of the 1.875% convertible debentures, leaving $2.2 million outstanding. Financing activities provided net proceeds of $491.5 million in 2012. This amount included approximately $403.9 million related to the net proceeds of the issue of the 1.75% convertible debentures and approximately $93.8 million related to the sale of a 25% interest in the Marathon project.
1.875% Convertible Debentures
In March 2013, holders of $164.3 million of the 1.875% debentures exercised their option to require the Company to repurchase their outstanding 1.875% debentures. Holders of the remaining $2.2 million of outstanding 1.875% debentures may require the Company to repurchase all or a portion of their 1.875% debentures on March 15, 2018 or March 15, 2023, or at any time before March 15, 2028 upon the occurrence of certain specified events. The Company has the option to redeem the remaining $2.2 million of outstanding 1.875% debentures for cash at its discretion. This outstanding balance of $2.2 million is reported as a long-term debt obligation at December 31, 2014. For further information regarding the Company's 1.875% convertible debentures, see "Note 14 - Debt and Capital Lease Obligations" in the Company's 2014 consolidated financial statements included in this document.
1.75% Convertible Debentures
In October 2012, the Company issued $396.75 million of 1.75% senior unsecured convertible debentures, due October 15, 2032. Holders of these convertible debentures have the right to redeem them at face value plus accrued and unpaid interest, to, but excluding, the relevant repurchase date on October 15 of each of 2019, 2024, 2029, and upon the occurrence of certain corporate events. The Company will have the right to call the 1.75% debentures at any time on or after October 20, 2019.
63
The 1.75% debentures were bifurcated under U.S. GAAP into separate debt and equity components, and reflect an effective maturity (to the first optional redemption date) of seven years. The 1.75% debentures have an effective interest rate of 8.50% and a stated interest rate of 1.75% with interest paid semi-annually. The discounted debt balance outstanding associated with these debentures at December 31, 2014, was $291.1 million, which is net of unamortized discount of $105.6 million. For further information regarding these 1.75% convertible debentures, see "Note 14 - Debt and Capital Lease Obligations" in the Company's 2014 consolidated financial statements included in this document.
Asset-Backed Revolving Credit Facility
The Company has access to a nominal $125.0 million asset-backed revolving credit facility. Maximum permitted borrowings under this working capital facility at any time are determined by a borrowing base comprised of 85% of eligible accounts receivable and 70% of eligible inventories. Borrowings are secured by the Company's accounts receivable, metals inventories and other accounts. The facility includes a $60.0 million letter of credit sub-facility, of which approximately $18.1 million was utilized at December 31, 2014. Outstanding letters of credit under this facility accrue interest at a rate that varies from 2.25% to 2.75%, decreasing progressively as the percentage drawn against the facility increases. The Company also pays an unused line fee on committed but unutilized commitments under the facility at a rate per annum of 0.375% or 0.5%, depending on utilization of the facility. At December 31, 2014, the Company’s remaining availability under the borrowing base was approximately $52.1 million. For further information regarding this facility, see "Note 14 - Debt and Capital Lease Obligations" in the Company's 2014 consolidated financial statements included in this document.
Capital Lease Obligation
In June 2012, the Company entered into a four-year capital lease agreement with General Electric Capital Corporation (GECC) covering the acquisition of a tunnel-boring machine for use on the Blitz development adjacent to the Stillwater Mine. Lease payments are due quarterly in advance. At December 31, 2014, the outstanding principal balance under the capital lease was $2.6 million. For further information regarding this lease, see "Note 14 - Debt and Capital Lease Obligations" in the Company's 2014 consolidated financial statements included in this document.
RESULTS OF OPERATIONS
YEAR ENDED DECEMBER 31, 2014 COMPARED TO YEAR ENDED DECEMBER 31, 2013
The Company’s total revenues, including proceeds from the sale of by-products, totaled $943.6 million in 2014, a decrease of 9.2% compared to revenues of $1.04 billion in 2013. Offset by a 6.5 % increase in mine sales volume in 2014, this decrease in total revenues reflects reduced PGM prices and significantly lower volume of recycled material in 2014, as compared to 2013.
Revenues from the Mine Production segment totaled $536.0 million in 2014 (including $29.6 million from by-products), an increase of 11.9% compared to $478.9 million in 2013 (of which $27.1 million was from by-products). Palladium and platinum ounces sold from mine production were 542,300 in 2014, compared to 509,200 ounces in 2013. The combined average realization on these palladium and platinum sales was $934 per ounce in 2014 and $887 per ounce in 2013. The Mine Production segment generated approximately $7.1 million of incremental revenue in the third and fourth quarters of 2013 from reprocessed internal furnace brick.
Revenues from the PGM Recycling segment reflected a decrease of 28.3% during 2014, to $401.7 million from $560.6 million in 2013. Recycling ounces sold during 2014 totaled 384,400 ounces, a decrease of 29.1% compared to the 541,800 sold in 2013. The Company’s combined average realization on recycling sales (which include palladium, platinum and rhodium) remained at $1,031 per ounce in 2014 and in 2013. In addition to purchased recycling material, the Company toll processed 72,800 ounces of PGMs during 2014, an increase from 65,400 tolled ounces in 2013. Overall, recycling volumes processed during 2014 totaled 469,400 ounces of PGMs, a decrease of 23.9% from the 616,700 ounces processed in 2013, as weaker PGM prices in 2014 reduced the volume of recycled catalytic converters available in the market. Included in the 2013 PGM Recycling segment revenues was approximately $16.4 million of incremental revenue from reprocessed internal furnace brick.
Costs of metals sold, which excludes depletion, depreciation and amortization expense, was $729.5 million in 2014, compared to $841.3 million in 2013, a decrease of 13.3%. Overall, recycling cost of metals sold decreased to $391.5 million in 2014 from $527.4 million in 2013. The average acquisition cost of metal purchased in the Company’s recycling segment (including palladium, platinum and rhodium) increased to $996 per ounce in 2014 from $959 per ounce in 2013. The cost of metals sold from mine production, totaled $332.6 million in 2014, compared to $314.0 million in the prior year, an increase of 5.9%.
64
In addition to Mine Production and PGM Recycling metal sales, the Company recognized other revenue of $5.3 million for metal acquired in the open market and simultaneously resold to third parties during the year ended December 31, 2014. The cost of metals sold in the open market for the year ended December 31, 2014, totaled $5.3 million. The Company made no comparable acquisitions in the open market during 2013.
During 2014, the Company’s mining operations produced 517,700 ounces of PGMs, including 400,200 ounces of palladium and 117,500 ounces of platinum. This represents an overall decrease of 1.2% from 2013, when the Company’s mining operations produced 523,900 ounces of PGMs, including 404,200 ounces of palladium and 119,700 ounces of platinum. The Stillwater Mine produced 340,800 ounces of PGMs in 2014, compared with 366,100 ounces of PGMs in 2013, a decrease of 6.9%. The East Boulder Mine produced 176,900 ounces of PGMs in 2014, an increase of 12.1% compared with the 157,800 ounces of PGMs produced there in 2013.
Depletion, depreciation and amortization expense was $67.4 million in 2014, compared to $59.3 million in 2013. The increase in expense in 2014 was primarily due to ongoing depletion of mine development costs.
General and administrative costs were $35.1 million in 2014, compared to $46.6 million in 2013, a decrease of approximately 24.7%. The decrease for 2014 is due primarily to reductions in marketing expenditures, reflecting the curtailment of marketing palladium for jewelry ($0.4 million in 2014 compared to $4.4 million in 2013), and reduced personnel costs due to reorganization efforts. The higher costs in 2013 were related to the proxy contest (legal, outside financial advisory, solicitation and consulting fees), of $4.3 million and $9.1 million (non-cash charge) in connection with accelerated vesting of stock options and restricted stock previously granted under the 2004 and 2012 Equity Incentive Plans, as a result of the technical change-in-control event in the first half of 2013. Reorganization costs of $10.4 million were recognized during 2014. Company recognized $2.8 million in total exploration expenses related to its mineral properties in Canada and South America in 2014, compared to $11.2 million in 2013.
Interest income decreased to $3.6 million in 2014 from $4.5 million in 2013, reflecting decreased financing income on recycling balances in 2014, offset in part by higher average cash balances through the year. The Company’s outstanding long-term debt balance was $294.0 million at December 31, 2014, a decrease from $308.7 million at December 31, 2013. The lower debt balance at the end of 2014 was attributable to the redemption of $30.0 million of State of Montana 8.0% Exempt Facility Revenue Bonds, partially offset by accretion of the debt discount associated with the $396.75 million 1.75% convertible debentures. Interest expense for the years ended December 31, 2014 and 2013 was $22.7 million and $23.0 million, respectively, net of $5.1 million and $4.8 million, respectively, that was capitalized.
The Company recorded an income tax provision of $16.3 million in 2014, compared to an income tax benefit of $93.7 million in 2013. The income tax benefit in 2013 resulted from the effect on deferred taxes of the impairment charges recognized during 2013 to reduce the carrying values of the Company's Altar mineral property in Argentina and its Marathon properties in Canada. The Altar impairment charge was $290.4 million ($226.5 million, after-tax) and the Marathon impairment charge was $171.4 million, ($123.6 million, after-tax). The income tax benefit described above primarily relates to the reversal of the deferred tax liabilities recorded (and subsequently revalued upon impairment) in association with the acquisition of Peregrine Metals Ltd. and Marathon PGM Corporation.
The Company recorded a foreign currency transaction gain of $5.2 million in 2014, compared to a gain of $18.2 million in 2013. Approximately $5.2 million and $19.2 million of the 2014 and 2013 gain, respectively, related principally to the remeasurement into U.S. dollars of the Argentine deferred tax balances recorded in association with the acquisition of Peregrine Metals Ltd.
65
YEAR ENDED DECEMBER 31, 2013 COMPARED TO YEAR ENDED DECEMBER 31, 2012
The Company’s total revenues, including proceeds from the sale of by-products, totaled $1.04 billion in 2013, an increase of 29.9% compared to revenues of $800.2 million in 2012. This year-on-year increase in total revenues reflects higher PGM prices in 2013, as compared to 2012, as well as higher mine sales volume and significantly higher volumes of recycled material in 2013.
Revenues from the Mine Production segment totaled $478.9 million in 2013 (including $27.1 million from by-products), an increase of 5.2% compared to $455.4 million in 2012 (of which $30.6 million was from by-products). Palladium and platinum ounces sold from mine production were 509,200 in 2013, compared to 500,400 ounces in 2012. The combined average realization on these palladium and platinum sales was $887 per ounce in 2013 and $849 per ounce in 2012. The Mine Production segment generated approximately $7.1 million of incremental revenue in the third and fourth quarters of 2013 from reprocessed internal furnace brick.
Revenues from the PGM Recycling segment reflected an increase of 62.6% during 2013, to $560.6 million from $344.8 million in 2012. Recycling ounces sold during 2013 totaled 541,800 ounces, an increase of 61.0% compared to the 336,500 sold in 2012. The Company’s combined average realization on recycling sales (which include palladium, platinum and rhodium) increased to $1,031 per ounce in 2013 from $1,018 per ounce in 2012, paralleling the increases in PGM prices generally. In addition to purchased recycling material, the Company toll processed 65,400 ounces of PGMs during 2013, a decrease from 98,800 tolled ounces in 2012. Overall, recycling volumes processed during 2013 totaled 616,700 ounces of PGMs, an increase of 38.5% from the 445,200 ounces processed in 2012, as stronger PGM prices in 2013 increased the volume of recycled catalytic converters available in the market. The PGM Recycling segment generated approximately $16.4 million of incremental revenue in the third quarter of 2013 from reprocessed internal furnace brick.
Costs of metals sold, which excludes depletion, depreciation and amortization expense, was $841.3 million in 2013, compared to $623.9 million in 2012, an increase of 34.8%. Overall, recycling cost of metals sold increased to $527.4 million in 2013 from $334.9 million in 2012. The average acquisition cost of metal purchased in the Company’s recycling segment (including palladium, platinum and rhodium) increased to $959 per ounce in 2013 from $946 per ounce in 2012, reflecting higher PGM prices in 2013. The cost of metals sold from mine production, totaled $314.0 million in 2013, compared to $288.9 million in the prior year, an increase of 8.7%.
During 2013, the Company’s mining operations produced 523,900 ounces of PGMs, including 404,200 ounces of palladium and 119,700 ounces of platinum. This represents an overall increase of 2.0% from 2012, when the Company’s mining operations produced 513,700 ounces of PGMs, including 396,000 ounces of palladium and 117,700 ounces of platinum. The Stillwater Mine produced 366,100 ounces of PGMs in 2013, compared with 377,400 ounces of PGMs in 2012, a decrease of 3.0%. The East Boulder Mine produced 157,800 ounces of PGMs in 2013, an increase of 15.8% compared with the 136,300 ounces of PGMs produced there in 2012.
Depletion, depreciation and amortization expense was $59.3 million in 2013, compared to $58.0 million in 2012. The increase in expense in 2013 was partially due to increased mine production.
General and administrative costs, including marketing and research and development expenses, were $46.6 million in 2013, compared to $53.3 million in 2012, a decrease of approximately 12.6%. The Company incurred $4.4 million in marketing efforts and $0.2 million in research and development expenses related to refining processes in 2013 compared to $11.2 million in marketing and $1.2 million in research and development expenses in 2012.
The Company also recognized costs in 2013 related to the proxy contest (legal, outside financial advisory, solicitation and consulting fees), of $4.3 million, and $9.1 million (non-cash charge) in connection with accelerated vesting of stock options and restricted stock previously granted under the 2004 and 2012 Equity Incentive Plans, as a result of the technical change-in-control event in the first half of 2013. The Company recognized $11.2 million in total exploration expenses related to its mineral properties in Canada and South America in 2013, compared to $15.0 million in 2012.
Interest income increased to $4.5 million in 2013 from $2.3 million in 2012, reflecting increased financing income on recycling balances in 2013 and higher average cash balances through the year. The Company’s total outstanding long-term debt balance was $310.7 million at December 31, 2013, down from $461.1 million at December 31, 2012, mainly reflecting the redemption of $164.3 million of the Company's 1.875% convertible debentures in March 2013, offset in part by accretion of the debt discount associated with the $396.75 million of 1.75% convertible debentures. Interest expense for years 2013 and 2012 was $23.0 million and $10.9 million, net of $4.8 million and $0.9 million of capitalized interest, respectively. The increase was attributable to higher average face value of debt outstanding throughout the year.
66
The Company recorded an income tax benefit of $93.7 million in 2013, compared to an income tax benefit of $4.0 million in 2012. The increase in the income tax benefit resulted from the effect on deferred taxes of impairment charges recognized during 2013 to reduce the carrying values of the Company's Altar mineral property in Argentina and its Marathon properties in Canada. The Altar impairment charge was $290.4 million ($226.5 million, after-tax) and the Marathon impairment charge was $171.4 million, ($123.6 million, after-tax).
The Company recorded a foreign currency transaction gain of $18.2 million in 2013, compared to a gain of $15.2 million in 2012. Approximately $19.2 million and $14.9 million of the 2013 and 2012 gain, respectively, related to the remeasurement into U.S. dollars of the Argentine deferred tax balances recorded in association with the acquisition of Peregrine Metals Ltd.
CONTRACTUAL OBLIGATIONS
The Company is obligated to make future payments under various debt agreements, regulatory obligations, and contractual obligations (employee benefits and operating leases).
The following table represents significant contractual future cash obligations and other commercial commitments and regulatory commitments, including related interest payments, as of December 31, 2014:
(In thousands) | 2015 | 2016 | 2017 | 2018 | 2019 | Thereafter | Total | |||||||||||||||||||||
1.875% Convertible debentures | $ | — | $ | — | $ | — | $ | 2,245 | $ | — | $ | — | $ | 2,245 | ||||||||||||||
1.75% Convertible debentures | — | — | — | — | 396,750 | — | 396,750 | |||||||||||||||||||||
Land purchase obligation | 85 | 81 | — | — | — | — | 166 | |||||||||||||||||||||
Operating lease obligations | 373 | 146 | 130 | — | — | — | 649 | |||||||||||||||||||||
Capital lease obligations | 2,067 | 580 | — | — | — | — | 2,647 | |||||||||||||||||||||
Asset retirement obligations | — | — | — | — | — | 152,907 | 152,907 | |||||||||||||||||||||
Payments of interest (1) | 7,087 | 6,994 | 6,985 | 6,964 | 6,943 | — | 34,973 | |||||||||||||||||||||
Liability classified compensation (2) | — | 504 | — | — | — | — | 504 | |||||||||||||||||||||
Directors' deferred share plan(3) | — | — | — | — | — | 374 | 374 | |||||||||||||||||||||
Other liabilities (4) | 15,791 | 6,310 | — | — | — | — | 22,101 | |||||||||||||||||||||
Total | $ | 25,403 | $ | 14,615 | $ | 7,115 | $ | 9,209 | $ | 403,693 | $ | 153,281 | $ | 613,316 | ||||||||||||||
(1) | Interest payments on the 1.875% convertible debentures noted in the above table are calculated up to March 15, 2018, the next date when the holders of the 1.875% debentures can exercise their put option. Interest payments on the 1.75% convertible debentures noted in the above table are calculated up to October 15, 2019, the first date the holders of the 1.75% debentures can exercise their put option (absent a "fundamental change" prior to that date). Interest payments noted in the table above all are based on fixed rates of interest. |
(2) | Liability-classified compensation reflects the Company's estimated future obligation to redeem certain performance-based restricted stock units to |
be valued based on the Company's cumulative three-year share-price performance relative to an underlying PGM basket price.
(3) Amount represents the Independent Directors' Deferred Share Plan to be paid out in cash upon each director's separation from service.
(4) Amounts included in other liabilities that are anticipated to be paid in 2015 and 2016 include property taxes and severance/license taxes.
67
CRITICAL ACCOUNTING POLICIES
Listed below are the accounting policies that the Company believes are critical to its financial statements due to the degree of uncertainty regarding the estimates and assumptions involved and the magnitude of the asset, liability, revenue, and expense being reported.
MINE DEVELOPMENT EXPENDITURES – CAPITALIZATION AND AMORTIZATION
Mining operations are inherently capital intensive, generally requiring substantial capital investment both for initial mine construction and for ongoing infrastructure development as mining progresses. Such ongoing development expenditures are necessary in order to access and support future mining areas. Many of these expenditures are necessarily incurred well in advance of actual extraction of the associated ore. Underground mining operations such as those conducted by the Company require driving adits and sinking shafts that provide access to the underground ore body and continuing construction or extension of infrastructure, including electrical and ventilation systems, rail and other forms of transportation, shop facilities, material handling areas and hoisting systems. The Company's mining operations utilize significant underground infrastructure to conduct mining operations and to transport mined material from the mining face to processing facilities located on the surface.
Mine development expenditures intended to increase existing production or to facilitate development of new mining areas substantially in advance of production are capitalized as incurred. These primary mine development expenditures include construction of vertical shafts and multiple surface adits, as well as development of underground infrastructure including footwall laterals, ramps, rail and transportation, electrical and ventilation systems, shop facilities, material handling areas, ore handling facilities, dewatering and pumping facilities. Typically such facilities not only are required for current mining operations but also will serve to support future mining activities in the same area of the mine.
Expenditures incurred to access specific ore reserve blocks or stopes and to support existing ore reserve production in a specific area (secondary development) are not capitalized but are charged to operations as incurred. Such expenditures generally do not provide further value once a particular reserve block has been mined out. Secondary development costs include ramp and stope access excavations from primary haulage levels (footwall laterals), local material rehandling and laydown excavations, stope ore and waste pass excavations and chute installations, stope ventilation raise excavations and stope utility and pipe raise excavations.
The Company calculates amortization of capitalized mine development costs by applying an amortization rate to current production. The amortization rate for each relevant geological area within a mine is calculated based upon the total unamortized capitalized mine development costs and the related ore reserves associated with that area. Development expenditures are capitalized as the related development assets are placed into service and are accumulated with the unamortized balance of existing development assets in the same area. The relevant amortization rate is recalculated as additional assets are placed into service. In calculating the amortization rate, changes in ore reserves are accounted for as a prospective change in estimate.
The Company's proven ore reserves are generally expected to be extracted utilizing its existing mine development infrastructure. Additional capital expenditures will be required to access the Company's estimated probable ore reserves. These anticipated capital expenditures are not included in the current calculation of depletion, depreciation and amortization.
Ore reserves, and consequently amortization rates, are based on significant management assumptions and estimates. The calculation of the amortization rate, and therefore the annual amortization charge to operations, could be materially affected to the extent that actual production in the future is different from current forecasts of production based on proven and probable ore reserves. This would generally occur to the extent that there were significant changes in any of the factors or assumptions used in determining ore reserves. These factors could include: (1) an expansion of proven and probable ore reserves through development activities, (2) differences between estimated and actual costs of mining due to differences in ore grades or metal recovery rates, and (3) differences between actual commodity prices and commodity price assumptions used in the estimation of ore reserves.
All significant company-wide repair and maintenance costs associated with planned major maintenance activities are expensed as incurred. The Company does not accrue in advance for major maintenance activities, but, when practicable, attempts to disclose in advance in its public filings any planned major maintenance activities that may affect operations.
68
ASSET IMPAIRMENT
Please refer to the Asset Impairment section included in "Note 2 - Summary of Significant Accounting Policies" to the accompanying consolidated financial statements for discussion of the accounting policies related to assessing impairment of the Company's long-lived assets. Also, please refer to "Note 4 - Asset Impairment", in the consolidated financial statements for a discussion of the methods, assumptions and estimates related to the Company's 2013 exploration property asset impairments.
Determining the fair value of an exploration-stage property involves significant estimation uncertainties and management judgment. Various estimation methods may result in a wide range of outcomes, and competent valuation experts may reach different conclusions. Therefore, estimates will often be imprecise. Factors used to determine the fair value of an exploration-stage property include estimates of the in-situ resource and the percentage of the resource that ultimately may be recoverable, longer-term price forecasts, consideration of the timing and costs of construction, the likely range of mining and processing costs, and an assessment of political and environmental risks. In some cases multiple scenarios may be considered and assigned relative probabilities. Indications of value gathered from transactions involving other similar properties normally will be taken into account, with various adjustments for relative scale and risk.
As discussed in Note 4 to the accompanying consolidated financial statements, several factors contributed to the Marathon project's weakened financial outlook, including adjustments to third-party offtake terms, operating costs, and the initial capital cost, along with lower palladium grades. Sensitivity analyses on the updated economic model suggested that factors that could improve the project economics in the future would include higher sustained metal prices, an addition to the resource life through additional discoveries in the project area, favorable concentrate processing arrangements, or a substantial decline in the Canadian dollar exchange rate. Consequently, potential future scenarios exist in which the project could be economically viable.
In assessing the fair value of the Marathon assets, the Company and its third-party valuation expert determined reasonable probabilities for such scenarios and gave consideration to the remaining exploration potential of the Marathon landholdings. In the end, given the wide range of possible outcomes, the Company, along with its third-party valuation expert, concluded that using a combination of market comparable transactions and the appraised-value method resulted in the best indication of fair value.
The market comparables method relies on estimating the resource value of metal in the ground at the time of sale for similar exploration-stage prospects. The appraised-value method is based on the premise that the real value of an exploration-stage property stems from its expected potential to result in the discovery, control and ultimate development of an economic mineral deposit. This method assumes the amount of exploration expenditure justified on a property is related to its value, which takes into account both past exploration expenditures and future costs.
For the market comparables analysis, transactions involving projects of similar scale in terms of estimated resource tonnage were examined. The analysis gave greater weighting to projects similar in nature and to more recent transactions. Factors considered included the size or operating rate of a project, the technologies employed (e.g., open pit truck-and-shovel operation; concentrator) and the capital required to construct the project. As any future Marathon revenues would be derived primarily from copper, palladium and platinum, and to allow projects with dissimilar metal mixes to be included in the analysis, all metal values were converted into copper equivalents.
For Marathon, the value derived from the appraised-value method intersected the range of valued derived from the market-comparables analysis at approximately the middle of the range. The Company, after discussion with its third-party expert, concluded that the most appropriate estimate of fair value for the Marathon assets as on December 31, 2013, was approximately the midpoint of the range derived from the market comparable analysis.
The Company has continued to monitor indications of impairment at Marathon in each reporting period subsequent to December 31, 2013. Further impairment of the Marathon mineral properties at this stage is currently most sensitive to a sustained decline in long-term metal prices or to adverse constraints on mining or access to resources in Canada.
As discussed in Note 4, the Company also employed various methodologies in determining the fair value of the Altar assets in Argentina. Additional issues requiring consideration in the case of Altar included the political and business risks associated with operating in Argentina, and the need to access power, water and other infrastructure for any eventual development there. The Company also engaged a third-party valuation expert to assist in its Altar valuation. For Altar, there were enough market comparable transactions in the region to provide a good indication of value for projects with similar risk profiles. Subsequent to developing the Altar valuation at September 30, 2013, the political and business climate in Argentina appears to have improved, and a more recent transaction in Argentina suggests mineral property values there may be recovering.
69
INCOME TAXES
The Company is subject to federal and state income taxes in the U.S. as well as federal and provincial income taxes on its Canadian activities and federal income taxes on its South American activities.
Income taxes are determined using the asset and liability method. This method gives consideration to the future tax consequences of temporary differences between the carrying amounts and the tax bases of assets and liabilities based on currently enacted tax rates. The effect on deferred tax assets and liabilities of a change in tax rates is recognized in income in the period that includes the enactment date. Deferred taxes associated with the Company's Canadian and South American activities are recorded using the assumption that any future earnings and profits associated with these activities will not be repatriated into the U.S. but will be fully utilized in Canada and South America.
In assessing the realizability of deferred tax assets, management considers whether it is more likely than not that some portion or all of the deferred tax assets will not be realized. Each quarter, management considers the scheduled reversal of deferred tax liabilities, projected future taxable income, and tax planning strategies in making this assessment. A valuation allowance has been provided at December 31, 2014 and 2013, for the portion of the Company's net deferred tax assets and certain credits for which it is considered “more likely than not” that they will not be realized.
POST-CLOSURE RECLAMATION COSTS
The Company recognizes the fair value of a liability for an asset retirement obligation in the period in which it is incurred if a reasonable estimate of fair value can be made. The fair value of the liability is added to the carrying amount of the associated asset and this additional carrying amount is depreciated over the life of the asset. The liability is accreted at the end of each period through charges to operating expense. If the obligation ultimately is settled for other than the carrying amount of the liability, the Company will recognize a gain or loss at the time of settlement.
Accounting for reclamation obligations requires management to make estimates for each mining operation of the timing and amount of future costs the Company will incur to complete final reclamation work required to comply with existing laws and regulations. Actual costs incurred in future periods could differ from amounts estimated. Additionally, future changes to environmental laws and regulations could increase the extent of reclamation and remediation work that the Company is required to perform. Any such increases in future costs could materially affect the amounts charged to operations for reclamation and remediation.
The Company reviewed its asset retirement assumptions at December 31, 2014, and 2013, and determined no corresponding adjustment was required at December 31, 2014, and 2013. See "Note 17 - Asset Retirement Obligation” to the Company’s 2014 consolidated financial statements for further information.
ITEM 7A
QUANTITATIVE AND QUALITATIVE DISCLOSURES ABOUT MARKET RISK
The Company is exposed to market risk, including the effects of adverse changes in metal prices, interest rates and foreign currencies as discussed below.
QUANTITATIVE INFORMATION ABOUT MARKET RISK
The information required by this item is provided in "Items 1 and 2 - Business and Properties - Competition: Palladium and Platinum Market" and "Note 6 - Derivative Instruments" and "Note 11 - Investments" to the Company's 2014 consolidated financial statements and is incorporated herein by reference.
COMMODITY PRICE RISK
The Company produces and sells palladium, platinum and associated by-product metals directly to its customers and through third-parties. As a result, financial performance can be materially affected when prices for these commodities fluctuate. In order to manage commodity price risk and to reduce the impact of fluctuation in prices, the Company has entered into supply agreements with suppliers and customers, from time to time has employed various derivative financial instruments and attempts to maintain adequate liquidity to sustain operations during a downturn in PGM prices.
70
In its PGM recycling activities, the Company customarily enters into fixed forward sales, and from time to time in the past has entered into financially settled forward sales transactions to mitigate pricing exposure. Under these fixed forward transactions, typically metals contained in the spent catalytic materials are sold forward at the time the materials are purchased and then are delivered against the fixed forward contracts when the finished ounces are recovered. Because the forward price is also used to determine the acquisition price, this arrangement significantly reduces exposure to PGM price volatility. The Company believes such transactions qualify for the exception to hedge accounting treatment and so has elected to account for these transactions as normal purchases and normal sales.
Financially settled forward sales, which the Company uses only rarely, provide a mechanism to offset fluctuations in metal prices associated with future production in those circumstances where the Company elects to retain control of the final disposition of the metal. In financially settled forward sales, the parties agree in advance to a net financial settlement in the future based on the difference between the market price of the metal on the settlement date and a forward price set at inception. Consequently, at the settlement date, the Company receives the difference between the forward price and the market price if the market price is below the forward price, and the Company pays the difference between the forward price and the market price if the market price is above the forward price. No metal changes hands between the parties in these financially settled transactions. The Company generally has accounted for financially settled forward transactions as cash flow hedges, as they are not eligible for treatment as normal purchases and normal sales. However, if the Company determines not to document them as cash flow hedges, these transactions are marked to market in each accounting period and the realized and unrealized gains or losses are recognized in net income in each period. At December 31, 2014, and 2013, the Company was not party to any financially settled forward agreements.
INTEREST RATE RISK AND INVESTMENT RISK
At December 31, 2014, all the Company's outstanding long-term debt was subject to fixed rates of interest. Interest income received from the Company's recycling suppliers is generally linked to short-term inter-bank rates. Undrawn letters of credit issued under the Company's asset-backed revolving credit facility carry a fixed contractual rate of interest, although any cash drawings against the facility would be subject to a floating interest rate. There were no such drawings outstanding as of December 31, 2014, and 2013.
The Company's convertible debentures do not contain financial covenants. The Company's asset-backed revolving credit facility includes a single fixed charge coverage covenant that only takes effect when less than 30% of the total borrowing capacity under the line remains available. Because there were no drawings under the asset-backed revolving credit facility at December 31, 2014, the Company is not constrained by conventional financial covenants at this time. Following the issuance of the $396.75 million 1.75% convertible debentures during the fourth quarter of 2012, the Company has increased its level of indebtedness, which could affect the Company's ability to repay the principal of and interest on the notes and put pressure on its creditworthiness in general.
The Company may from time to time invest excess cash balances in short-term instruments. The Company prioritizes its objectives for these investments in order of (1) preservation of principal, (2) maintenance of liquidity, and (3) return on investment, with the first two objectives taking precedence. However, there can be no guarantee that further market disruptions affecting various short-term investments or the potential failure of financial institutions will not have a negative effect on the price and liquidity of investments made by the Company.
FOREIGN CURRENCY RISK
The Company has some nominal exposure to Canadian, Argentine and other foreign currencies. These exposures currently are limited to foreign cash deposits and expenses incurred for the services of foreign-based employees and contractors, along with some associated support costs. The Company does not specifically hedge this exposure.
The Company has been exposed to a significant inflation rate on its Argentine holdings. During 2014, the Company recorded a foreign currency transaction gain of $5.2 million on deferred tax balances recorded in association with the acquisition of Peregrine Metals Ltd. The gain was a result of the strengthening of the U.S. dollar in comparison with the Argentine peso. As the deferred taxes will be settled at a future date in pesos, changes in the relative currency values are recognized in each period and reflected as Foreign currency transaction (loss) gain, net on the Company's Consolidated Statements of Comprehensive Income (Loss).
71
ITEM 8
CONSOLIDATED FINANCIAL STATEMENTS AND SUPPLEMENTARY DATA
Report of Independent Registered Public Accounting Firm
The Board of Directors and Stockholders
Stillwater Mining Company and Subsidiaries:
We have audited the accompanying consolidated balance sheets of Stillwater Mining Company and subsidiaries as of December 31, 2014 and 2013, and the related consolidated statements of comprehensive income (loss), changes in equity, and cash flows for each of the years in the three‑year period ended December 31, 2014. These consolidated financial statements are the responsibility of the Company’s management. Our responsibility is to express an opinion on these consolidated financial statements based on our audits.
We conducted our audits in accordance with the standards of the Public Company Accounting Oversight Board (United States). Those standards require that we plan and perform the audit to obtain reasonable assurance about whether the financial statements are free of material misstatement. An audit includes examining, on a test basis, evidence supporting the amounts and disclosures in the financial statements. An audit also includes assessing the accounting principles used and significant estimates made by management, as well as evaluating the overall financial statement presentation. We believe that our audits provide a reasonable basis for our opinion.
In our opinion, the consolidated financial statements referred to above present fairly, in all material respects, the financial position of Stillwater Mining Company and subsidiaries as of December 31, 2014 and 2013, and the results of their operations and their cash flows for each of the years in the three‑year period ended December 31, 2014, in conformity with U.S. generally accepted accounting principles.
We also have audited, in accordance with the standards of the Public Company Accounting Oversight Board (United States), Stillwater Mining Company’s internal control over financial reporting as of December 31, 2014, based on criteria established in Internal Control - Integrated Framework (1992) issued by the Committee of Sponsoring Organizations of the Treadway Commission (COSO), and our report dated February 20, 2015 expressed an unqualified opinion on the effectiveness of the Company’s internal control over financial reporting.
/s/ KPMG LLP
Billings, Montana
February 20, 2015
72
Report of Independent Registered Public Accounting Firm
The Board of Directors and Stockholders
Stillwater Mining Company and Subsidiaries:
We have audited Stillwater Mining Company’s internal control over financial reporting as of December 31, 2014, based on criteria established in Internal Control - Integrated Framework (1992) issued by the Committee of Sponsoring Organizations of the Treadway Commission (COSO). Stillwater Mining Company’s management is responsible for maintaining effective internal control over financial reporting and for its assessment of the effectiveness of internal control over financial reporting, included in the accompanying Management’s Report on Internal Control over Financial Reporting. Our responsibility is to express an opinion on the Company’s internal control over financial reporting based on our audit.
We conducted our audit in accordance with the standards of the Public Company Accounting Oversight Board (United States). Those standards require that we plan and perform the audit to obtain reasonable assurance about whether effective internal control over financial reporting was maintained in all material respects. Our audit included obtaining an understanding of internal control over financial reporting, assessing the risk that a material weakness exists, and testing and evaluating the design and operating effectiveness of internal control based on the assessed risk. Our audit also included performing such other procedures as we considered necessary in the circumstances. We believe that our audit provides a reasonable basis for our opinion.
A company’s internal control over financial reporting is a process designed to provide reasonable assurance regarding the reliability of financial reporting and the preparation of financial statements for external purposes in accordance with generally accepted accounting principles. A company’s internal control over financial reporting includes those policies and procedures that (1) pertain to the maintenance of records that, in reasonable detail, accurately and fairly reflect the transactions and dispositions of the assets of the company; (2) provide reasonable assurance that transactions are recorded as necessary to permit preparation of financial statements in accordance with generally accepted accounting principles, and that receipts and expenditures of the company are being made only in accordance with authorizations of management and directors of the company; and (3) provide reasonable assurance regarding prevention or timely detection of unauthorized acquisition, use, or disposition of the company’s assets that could have a material effect on the financial statements.
Because of its inherent limitations, internal control over financial reporting may not prevent or detect misstatements. Also, projections of any evaluation of effectiveness to future periods are subject to the risk that controls may become inadequate because of changes in conditions, or that the degree of compliance with the policies or procedures may deteriorate.
In our opinion, Stillwater Mining Company maintained, in all material respects, effective internal control over financial reporting as of December 31, 2014, based on criteria established in Internal Control - Integrated Framework (1992) issued by the Committee of Sponsoring Organizations of the Treadway Commission (COSO).
We also have audited, in accordance with the standards of the Public Company Accounting Oversight Board (United States), the consolidated balance sheets of Stillwater Mining Company and subsidiaries as of December 31, 2014 and 2013, and the related consolidated statements of comprehensive income (loss), changes in equity, and cash flows for each of the years in the three‑year period ended December 31, 2014, and our report dated February 20, 2015, expressed an unqualified opinion on those consolidated financial statements.
/s/ KPMG LLP
Billings, Montana
February 20, 2015
73
STILLWATER MINING COMPANY
CONSOLIDATED STATEMENTS OF COMPREHENSIVE INCOME (LOSS)
(In thousands, except per share data) | ||||||||||||
Year ended December 31, | 2014 | 2013 | 2012 | |||||||||
REVENUES | ||||||||||||
Mine Production | $ | 536,010 | $ | 478,918 | $ | 455,426 | ||||||
PGM Recycling | 401,684 | 560,588 | 344,818 | |||||||||
Other | 5,925 | — | — | |||||||||
Total revenues | 943,619 | 1,039,506 | 800,244 | |||||||||
COSTS AND EXPENSES | ||||||||||||
Costs of metals sold | ||||||||||||
Mine Production | 332,632 | 313,963 | 288,922 | |||||||||
PGM Recycling | 391,481 | 527,384 | 334,949 | |||||||||
Other | 5,357 | — | — | |||||||||
Total costs of metals sold (excludes depletion, depreciation and amortization) | 729,470 | 841,347 | 623,871 | |||||||||
Depletion, depreciation and amortization | ||||||||||||
Mine Production | 66,387 | 58,201 | 56,960 | |||||||||
PGM Recycling | 1,019 | 1,116 | 1,055 | |||||||||
Total depletion, depreciation and amortization | 67,406 | 59,317 | 58,015 | |||||||||
Total costs of revenues | 796,876 | 900,664 | 681,886 | |||||||||
Losses on trade receivable and inventory purchases | — | 632 | 590 | |||||||||
(Gain) Loss on disposal of property, plant and equipment | (337 | ) | 68 | 448 | ||||||||
Loss on long-term investments | 125 | 1,894 | 2,562 | |||||||||
Impairment of property, plant and equipment and non-producing mineral properties | 550 | 461,755 | — | |||||||||
Abandonment of non-producing property | — | — | 2,835 | |||||||||
Exploration | 2,768 | 11,169 | 15,010 | |||||||||
Proxy contest | — | 4,307 | — | |||||||||
Accelerated equity based compensation for change-in-control | — | 9,063 | — | |||||||||
Reorganization | 10,402 | — | — | |||||||||
General and administrative | 35,067 | 46,577 | 53,277 | |||||||||
Total costs and expenses | 845,451 | 1,436,129 | 756,608 | |||||||||
OPERATING INCOME (LOSS) | 98,168 | (396,623 | ) | 43,636 | ||||||||
OTHER INCOME (EXPENSE) | ||||||||||||
Other | 904 | 1,173 | 181 | |||||||||
Interest income | 3,551 | 4,481 | 2,325 | |||||||||
Interest expense | (22,719 | ) | (22,957 | ) | (10,920 | ) | ||||||
Foreign currency transaction (loss) gain, net | 5,237 | 18,200 | 15,155 | |||||||||
INCOME (LOSS) BEFORE INCOME TAX (PROVISION) BENEFIT | 85,141 | (395,726 | ) | 50,377 | ||||||||
Income tax (provision) benefit | (16,258 | ) | 93,653 | 4,039 | ||||||||
NET INCOME (LOSS) | $ | 68,883 | $ | (302,073 | ) | $ | 54,416 | |||||
Net loss attributable to noncontrolling interest | (1,414 | ) | (31,867 | ) | (629 | ) | ||||||
NET INCOME (LOSS) ATTRIBUTABLE TO COMMON STOCKHOLDERS | $ | 70,297 | $ | (270,206 | ) | $ | 55,045 | |||||
Other comprehensive income, net of tax | ||||||||||||
Net unrealized gains (losses) on investments available-for-sale | 11 | 105 | 862 | |||||||||
COMPREHENSIVE INCOME (LOSS) ATTRIBUTABLE TO COMMON STOCKHOLDERS | $ | 70,308 | $ | (270,101 | ) | $ | 55,907 | |||||
Comprehensive loss attributable to noncontrolling interest | (1,414 | ) | (31,867 | ) | (629 | ) | ||||||
TOTAL COMPREHENSIVE INCOME (LOSS) | $ | 68,894 | $ | (301,968 | ) | $ | 55,278 | |||||
Weighted average common shares outstanding | ||||||||||||
Basic | 119,953 | 118,607 | 116,162 | |||||||||
Diluted | 156,233 | 118,607 | 131,441 | |||||||||
Basic earnings (loss) per share attributable to common stockholders | $ | 0.59 | $ | (2.28 | ) | $ | 0.47 | |||||
Diluted earnings (loss) per share attributable to common stockholders | $ | 0.56 | $ | (2.28 | ) | $ | 0.46 | |||||
See Accompanying Notes to Consolidated Financial Statements
74
STILLWATER MINING COMPANY
CONSOLIDATED BALANCE SHEETS
(In thousands, except share and per share data) | ||||||||
December 31, | 2014 | 2013 | ||||||
ASSETS | ||||||||
Current assets | ||||||||
Cash and cash equivalents | $ | 280,286 | $ | 286,687 | ||||
Investments, at fair market value | 251,254 | 209,338 | ||||||
Inventories | 130,307 | 158,650 | ||||||
Trade receivables | 1,277 | 8,988 | ||||||
Deferred income taxes | 21,055 | 21,547 | ||||||
Prepaids | 2,546 | 3,912 | ||||||
Other current assets | 14,671 | 14,757 | ||||||
Total current assets | 701,396 | 703,879 | ||||||
Mineral properties | 159,252 | 159,252 | ||||||
Mine development, net | 409,754 | 346,346 | ||||||
Property, plant and equipment, net | 118,881 | 124,731 | ||||||
Deferred debt issuance costs | 6,032 | 7,945 | ||||||
Other noncurrent assets | 4,012 | 4,527 | ||||||
Total assets | $ | 1,399,327 | $ | 1,346,680 | ||||
LIABILITIES AND EQUITY | ||||||||
Current liabilities | ||||||||
Accounts payable | $ | 26,806 | $ | 32,088 | ||||
Accrued compensation and benefits | 29,973 | 30,646 | ||||||
Property, production and franchise taxes payable | 15,828 | 14,495 | ||||||
Current portion of long-term debt and capital lease obligations | 2,144 | 2,035 | ||||||
Income taxes payable | — | 4,416 | ||||||
Other current liabilities | 7,288 | 5,368 | ||||||
Total current liabilities | 82,039 | 89,048 | ||||||
Long-term debt and capital lease obligations | 294,023 | 308,667 | ||||||
Deferred income taxes | 68,896 | 79,159 | ||||||
Accrued workers compensation | 6,060 | 6,031 | ||||||
Asset retirement obligation | 9,401 | 8,654 | ||||||
Other noncurrent liabilities | 7,200 | 7,262 | ||||||
Total liabilities | 467,619 | 498,821 | ||||||
EQUITY | ||||||||
Stockholders’ equity | ||||||||
Preferred stock, $0.01 par value, 1,000,000 shares authorized; none issued | — | — | ||||||
Common stock, $0.01 par value, 200,000,000 shares authorized; 120,381,746 and 119,466,449 shares issued and outstanding | 1,204 | 1,195 | ||||||
Paid-in capital | 1,091,146 | 1,076,200 | ||||||
Accumulated deficit | (179,139 | ) | (249,436 | ) | ||||
Accumulated other comprehensive income | 17 | 6 | ||||||
Total stockholders’ equity | 913,228 | 827,965 | ||||||
Noncontrolling interest | 18,480 | 19,894 | ||||||
Total equity | 931,708 | 847,859 | ||||||
Total liabilities and equity | $ | 1,399,327 | $ | 1,346,680 | ||||
See Accompanying Notes to Consolidated Financial Statements
75
STILLWATER MINING COMPANY
CONSOLIDATED STATEMENTS OF CASH FLOWS
Year ended December 31, | 2014 | 2013 | 2012 | |||||||||
(In thousands) | ||||||||||||
CASH FLOWS FROM OPERATING ACTIVITIES | ||||||||||||
Net income (loss) | $ | 68,883 | $ | (302,073 | ) | $ | 54,416 | |||||
Adjustments to reconcile net income (loss) to net cash provided by operating activities: | ||||||||||||
Depletion, depreciation and amortization | 67,406 | 59,317 | 58,015 | |||||||||
Losses on trade receivable and inventory purchases | — | 632 | 590 | |||||||||
(Gain) Loss on disposal of property, plant and equipment | (337 | ) | 68 | 448 | ||||||||
Impairment of property, plant and equipment and non-producing mineral properties | 550 | 461,755 | — | |||||||||
Loss on long-term investments | 125 | 1,894 | 2,562 | |||||||||
Amortization/accretion of premiums/discounts for investments | 1,810 | 3,079 | 900 | |||||||||
Deferred taxes | (4,590 | ) | (108,543 | ) | (3,937 | ) | ||||||
Foreign currency transaction gain, net | (5,237 | ) | (18,200 | ) | (15,155 | ) | ||||||
Abandonment of non-producing property | — | — | 2,835 | |||||||||
Accretion of asset retirement obligation | 747 | 689 | 634 | |||||||||
Amortization of deferred debt issuance costs | 2,265 | 1,664 | 1,495 | |||||||||
Accretion of convertible debenture debt discount | 17,156 | 15,783 | 3,097 | |||||||||
Accelerated equity based compensation for change-in-control | — | 9,063 | — | |||||||||
Share based compensation and other benefits | 14,001 | 15,242 | 16,369 | |||||||||
Non-cash capitalized interest | (3,278 | ) | (2,878 | ) | — | |||||||
Excess tax benefit from stock-based compensation | (46 | ) | (2,756 | ) | (7,737 | ) | ||||||
Changes in operating assets and liabilities: | ||||||||||||
Inventories | 27,062 | (4,252 | ) | (19,958 | ) | |||||||
Trade receivables | 7,711 | 333 | (3,765 | ) | ||||||||
Prepaids | 1,366 | 1,108 | 39 | |||||||||
Accounts payable | (7,952 | ) | 3,187 | (1,772 | ) | |||||||
Accrued compensation and benefits | (673 | ) | (723 | ) | 3,575 | |||||||
Property, production and franchise taxes payable | 1,271 | 2,006 | (970 | ) | ||||||||
Income taxes payable | (4,416 | ) | 4,416 | (1,235 | ) | |||||||
Accrued workers compensation | 29 | 216 | (241 | ) | ||||||||
Restricted cash | — | — | 25,035 | |||||||||
Other operating assets | 1,206 | 6,790 | (2,250 | ) | ||||||||
Other operating liabilities | 2,493 | 1,616 | (9,096 | ) | ||||||||
NET CASH PROVIDED BY OPERATING ACTIVITIES | 187,552 | 149,433 | 103,894 | |||||||||
CASH FLOWS FROM INVESTING ACTIVITIES | ||||||||||||
Capital expenditures | (119,682 | ) | (129,029 | ) | (112,071 | ) | ||||||
Proceeds from disposal of property, plant and equipment | 465 | 218 | 222 | |||||||||
Purchases of investments | (229,462 | ) | (151,567 | ) | (280,273 | ) | ||||||
Proceeds from maturities of investments | 185,722 | 201,255 | 67,314 | |||||||||
NET CASH USED IN INVESTING ACTIVITIES | (162,957 | ) | (79,123 | ) | (324,808 | ) | ||||||
CASH FLOWS FROM FINANCING ACTIVITIES | ||||||||||||
Proceeds from sale of noncontrolling interest, net of transaction costs | — | — | 93,821 | |||||||||
Excess tax benefit from stock-based compensation | 46 | 2,756 | 7,737 | |||||||||
Issuance of long-term debt | — | — | 403,926 | |||||||||
Payments on debt and capital lease obligations | (32,035 | ) | (166,187 | ) | (1,394 | ) | ||||||
Payments for debt issuance costs | — | — | (12,637 | ) | ||||||||
Proceeds from issuance of common stock | 993 | 128 | 44 | |||||||||
NET CASH (USED IN) PROVIDED BY FINANCING ACTIVITIES | (30,996 | ) | (163,303 | ) | 491,497 | |||||||
CASH AND CASH EQUIVALENTS | ||||||||||||
Net (decrease) increase | (6,401 | ) | (92,993 | ) | 270,583 | |||||||
Balance at beginning of period | 286,687 | 379,680 | 109,097 | |||||||||
BALANCE AT END OF PERIOD | $ | 280,286 | $ | 286,687 | $ | 379,680 | ||||||
See Accompanying Notes to Consolidated Financial Statements
76
STILLWATER MINING COMPANY
CONSOLIDATED STATEMENTS OF CHANGES IN EQUITY
(In thousands) | Common Shares Outstanding | Common Stock | Paid-in Capital | Accumulated Earnings (Deficit) | Accumulated Other Comprehensive (Loss) Income | Non-controlling Interest | Total Equity | |||||||||||||||||||
BALANCE AT DECEMBER 31, 2011 | 115,376 | $ | 1,154 | $ | 878,050 | $ | (34,275 | ) | $ | (961 | ) | $ | — | $ | 843,968 | |||||||||||
Net income | — | — | — | 55,045 | — | (629 | ) | 54,416 | ||||||||||||||||||
Change in fair market value of investments | — | — | — | — | 862 | — | 862 | |||||||||||||||||||
Common stock issued under employee benefit plans | 749 | 8 | 7,890 | — | — | — | 7,898 | |||||||||||||||||||
Income tax benefit on share-based compensation | — | — | 7,737 | — | — | — | 7,737 | |||||||||||||||||||
Stock option expense | — | — | 97 | — | — | — | 97 | |||||||||||||||||||
Common stock issued under stock plans | 16 | 1 | 43 | — | — | — | 44 | |||||||||||||||||||
Common stock issued under Directors’ deferral plan | 12 | — | 76 | — | — | — | 76 | |||||||||||||||||||
Nonvested shares of common stock granted to officers and employees | 798 | 7 | 47 | — | — | — | 54 | |||||||||||||||||||
Equity component of 1.75% Convertible debenture | — | — | 137,173 | — | — | — | 137,173 | |||||||||||||||||||
Noncontrolling interest | — | — | 41,431 | — | — | 52,390 | 93,821 | |||||||||||||||||||
Valuation allowance | — | — | 35,799 | — | — | — | 35,799 | |||||||||||||||||||
Deferred taxes on 1.75% Convertible debentures | — | — | (57,526 | ) | — | — | — | (57,526 | ) | |||||||||||||||||
Amortization of unearned nonvested stock | — | — | 8,341 | — | — | — | 8,341 | |||||||||||||||||||
Forfeiture of nonvested stock | — | — | (180 | ) | — | — | — | (180 | ) | |||||||||||||||||
BALANCE AT DECEMBER 31, 2012 | 116,951 | $ | 1,170 | $ | 1,058,978 | $ | 20,770 | $ | (99 | ) | $ | 51,761 | $ | 1,132,580 | ||||||||||||
Net loss | — | — | — | (270,206 | ) | — | (31,867 | ) | (302,073 | ) | ||||||||||||||||
Change in fair market value of investments | — | — | — | — | 105 | — | 105 | |||||||||||||||||||
Common stock issued under employee benefit plans | 873 | 8 | 10,256 | — | — | — | 10,264 | |||||||||||||||||||
Income tax benefit on share-based compensation | — | 2,756 | — | — | — | 2,756 | ||||||||||||||||||||
Stock option expense | — | — | 41 | — | — | — | 41 | |||||||||||||||||||
Common stock issued under stock plans | 25 | — | 128 | — | — | — | 128 | |||||||||||||||||||
Common stock issued under deferral plans | 14 | — | 315 | — | — | — | 315 | |||||||||||||||||||
Nonvested shares of common stock granted to officers and employees | 1,790 | 18 | (18 | ) | — | — | — | — | ||||||||||||||||||
Canceled shares in excess of plan limit | (187 | ) | (1 | ) | 1 | — | — | — | — | |||||||||||||||||
Valuation allowance | — | — | (9,942 | ) | — | — | — | (9,942 | ) | |||||||||||||||||
Amortization of unearned nonvested stock | — | — | 13,687 | — | — | — | 13,687 | |||||||||||||||||||
Forfeiture of nonvested stock | — | — | (2 | ) | — | — | — | (2 | ) | |||||||||||||||||
BALANCE AT DECEMBER 31, 2013 | 119,466 | $ | 1,195 | $ | 1,076,200 | $ | (249,436 | ) | $ | 6 | $ | 19,894 | $ | 847,859 | ||||||||||||
Net income | — | — | — | 70,297 | — | (1,414 | ) | 68,883 | ||||||||||||||||||
Change in fair market value of investments | — | — | — | — | 11 | — | 11 | |||||||||||||||||||
Common stock issued under employee benefit plans | 681 | 7 | 10,252 | — | — | — | 10,259 | |||||||||||||||||||
Income tax benefit for share-based compensation | — | — | 46 | — | — | — | 46 | |||||||||||||||||||
Income tax effect of deferred compensation | — | — | — | — | — | — | — | |||||||||||||||||||
Shares withheld to pay taxes | (29 | ) | — | (2 | ) | — | — | — | (2 | ) | ||||||||||||||||
Common stock issued under stock plans | 105 | 1 | 992 | — | — | — | 993 | |||||||||||||||||||
Common stock issued under deferral plans | 1 | — | 14 | — | — | — | 14 | |||||||||||||||||||
Nonvested shares of common stock granted to officers and employees | 158 | 1 | (414 | ) | — | — | — | (413 | ) | |||||||||||||||||
Deferred taxes | — | — | (83 | ) | — | — | — | (83 | ) | |||||||||||||||||
Amortization of unearned nonvested stock | — | — | 4,181 | — | — | — | 4,181 | |||||||||||||||||||
Forfeiture of nonvested stock | — | — | (40 | ) | — | — | — | (40 | ) | |||||||||||||||||
BALANCE AT DECEMBER 31, 2014 | 120,382 | $ | 1,204 | $ | 1,091,146 | $ | (179,139 | ) | $ | 17 | $ | 18,480 | $ | 931,708 | ||||||||||||
See Accompanying Notes to Consolidated Financial Statements
77
STILLWATER MINING COMPANY
NOTES TO THE CONSOLIDATED FINANCIAL STATEMENTS
NOTE 1
NATURE OF OPERATIONS
Stillwater Mining Company (the Company) is engaged in the development, extraction, processing, smelting, and refining of palladium, platinum and associated metals (platinum group metals or PGMs) from a geological formation in south-central Montana known as the J-M Reef and from the recycling of spent catalytic converters. The Company is also engaged in expanding its mining operations on the J-M Reef, and holds the Marathon PGM-copper property adjacent to Lake Superior in northern Ontario, Canada and the Altar copper-gold property in the province of San Juan, Argentina.
NOTE 2
SUMMARY OF SIGNIFICANT ACCOUNTING POLICIES
PRINCIPLES OF CONSOLIDATION
The accompanying consolidated financial statements include the accounts of Stillwater Mining Company, its wholly-owned subsidiaries and entities in which it holds a controlling interest (collectively referred to as the “Company”). All intercompany transactions and balances have been eliminated upon consolidation.
CASH AND CASH EQUIVALENTS
Cash and cash equivalents consist of all cash balances and all highly liquid investments purchased with an original maturity of three months or less.
INVESTMENTS
Investment securities at December 31, 2014, and 2013, consist of mutual funds, federal agency notes and commercial paper with stated maturities less than two years. All securities are deemed by management to be available-for-sale and are reported at fair value. Unrealized holding gains and losses on available-for-sale securities are excluded from earnings and are reported as a separate component of other comprehensive income (loss) until realized. Realized gains and losses are based on the carrying value (cost, net of discounts or premiums) of the sold investment and recorded as a component of other income. A decline in the market value of any available-for-sale security below cost that is deemed to be other-than-temporary results in a reduction of the carrying amount of the security to fair value. The impairment is charged to earnings and a new cost basis for the security is established.
The Company’s long-term investments in several junior exploration companies were originally recorded at cost due to less than 20% equity ownership interest and no significant Company control over the investees. A decline in the market value of these long-term investments that is deemed to be other-than-temporary will result in a reduction of the carrying amount of the investment to fair value. The impairment is charged to earnings and a new cost basis for the investment is established.
INVENTORIES
Mined inventories are carried at the lower of current realizable value or average cost. Production costs include the cost of direct labor and materials, depletion, depreciation and amortization, and overhead costs relating to mining and processing activities. The value of recycled inventories is determined based on the acquisition cost of the recycled material and includes all inventoriable processing costs, including direct labor, direct materials, depreciation, transportation and third-party refining costs which relate to the processing activities. Materials and supplies inventories are valued at the lower of average cost or fair market value.
RECEIVABLES
Trade receivables and other receivable balances recorded in other current assets are reported at outstanding principal amounts, net of an allowance for doubtful accounts, if deemed necessary. Management evaluates the collectability of receivable account balances to determine the allowance, if any. Management considers the other party’s credit risk and financial condition, as well as current and projected economic and market conditions, in determining the amount of the allowance. Receivable balances are written off when management determines that the balance is uncollectable. The Company determined that no allowance against its receivable balances at December 31, 2014 and 2013 was necessary.
78
MINERAL PROPERTIES AND MINE DEVELOPMENT
Costs of acquiring mineral properties and mineral rights are capitalized as incurred. Prior to acquiring such mineral properties or mineral rights, the Company makes a preliminary evaluation to determine that the mineral property has significant potential to develop an economic ore body. The time between initial acquisition and full evaluation of a mineral property’s potential is variable and is determined by many factors including its location relative to existing infrastructure, stage of development, geological controls and relevant metal prices. When it has been determined that proven and probable ore reserves have been established in compliance with the Securities and Exchange Commission's Industry Guide 7, and a determination has been made to proceed toward commercial development, mining development costs incurred to develop the mineral property are capitalized. Mining exploration costs are expensed as incurred. If a mineable ore body is discovered, such costs are amortized when production begins using the units-of-production method based on the estimated quantities of recoverable metal. If no mineable ore body is discovered, such costs are expensed in the period in which it is determined the mineral property has no future economic value. Costs incurred to maintain assets on a standby basis are charged to operations. Costs of abandoned projects are charged to operations upon abandonment.
Capitalized mine development costs are expenditures incurred to increase existing production, develop new ore bodies or develop mineral property substantially in advance of production. Capitalized mine development costs include a vertical shaft, multiple surface adits and underground infrastructure development including footwall laterals, ramps, rail and transportation, electrical and ventilation systems, shop facilities, material handling areas, ore handling facilities, dewatering and pumping facilities. These expenditures are capitalized and amortized over the life of the mine or over a shorter mining period, depending on the period benefited by those expenditures, using the units-of-production method. The Company utilizes Industry Guide 7 compliant total proven and probable ore reserves, measured in tons, as the basis for determining the life of mine and uses the ore reserves in the immediate and relevant vicinity as the basis for determining the shorter mining period.
The Company calculates amortization of capitalized mine development costs in any vicinity by applying an amortization rate to the relevant current production. The amortization rates are each based upon a ratio of unamortized capitalized mine development costs to the related ore reserves. Capital development expenditures are added to the unamortized capitalized mine development costs and amortization rates are updated as the related assets are placed into service. In calculating the amortization rate, changes in ore reserves are accounted for as a prospective change in estimate. Ore reserves and the further benefit of capitalized mine development costs are determined based on management assumptions. Any significant changes in these assumptions, such as a change in the mine plan or a change in estimated proven and probable ore reserves could have a material effect on the expected period of benefit resulting in a potentially significant change in the amortization rate and/or the valuations of related assets. The Company’s proven ore reserves are generally expected to be extracted utilizing its existing mine development infrastructure. Additional capital expenditures will be required to access the Company’s estimated probable ore reserves. These anticipated capital expenditures are not included in the current calculation of depletion, depreciation and amortization.
Expenditures incurred to sustain existing production and directly access specific ore reserve blocks or stopes provide benefit to ore reserve production over limited periods of time (secondary development) and are charged to operations as incurred. These costs include ramp and stope access excavations from the primary haulage levels (footwall laterals), stope material re-handling / laydown excavations, stope ore and waste pass excavations and chute installations, stope ventilation raise excavations and stope utility and pipe raise excavations.
PROPERTY, PLANT AND EQUIPMENT
Plant facilities and equipment are recorded at cost and depreciated using the straight-line method over estimated useful lives ranging from one to fifteen years. Interest is capitalized on expenditures related to major construction or development projects and is amortized using the same method as the related asset. Interest capitalization is discontinued when the asset is placed into operation or when development and construction cease. Maintenance and repairs are charged to cost of revenues as incurred.
LEASES
The Company classifies a lease as either capital or operating. All capital leases are depreciated over the shorter of the useful life of the asset or the lease term.
79
ASSET IMPAIRMENT
The Company reviews and evaluates its long-lived assets, including mineral properties and mine development, for impairment when events or changes in circumstances indicate that the related carrying amounts for such an asset may not be recoverable. For purposes of determining impairment, assets are grouped at the lowest level for which identifiable cash flows are largely independent of the cash flows of other groups of assets and liabilities. Impairment is considered to exist if the carrying amount of any long-lived asset or asset group is not recoverable and exceeds its fair value; the carrying value of a long-lived asset is considered not recoverable if it exceeds the sum of the undiscounted future cash flows expected to result from the use and eventual disposition of the asset or asset group. If impairment exists, the associated impairment loss to be recognized is the amount by which the carrying amount of the long-lived asset or asset group exceeds the fair value. In the Company’s case, the estimation of future cash flows takes into account estimates of recoverable ounces, prices for PGMs and other relevant metals (using twelve-quarter historical trailing prices and third-party projections of future prices, rather than prices at a single point in time, as indicators of longer-term future prices), any structural shifts in supply and demand or in competitive position, anticipated production levels, and future capital and reclamation expenditures, all based on life-of-mine plans and projections and measured as of the reporting date.
The Company assesses, at least quarterly, whether there has been any event or change in circumstances that might indicate that the carrying value of capitalized mining costs and related property, plant and equipment, if any, may not be recoverable out of expected undiscounted future cash flows plus any estimated salvage value. In estimating the fair value of an asset or asset group, the Company takes into account various measurement alternatives, often engaging third-party advisors to assist in the process. Such alternatives will vary depending on the circumstances but could include information from recent sales of comparable assets, third-party professional appraisals, bona fide purchase offers, and valuations derived from discounted future cash flow models.
Assumptions underlying future cash flows are subject to risks and uncertainties. Any differences between significant assumptions and market conditions such as PGM prices, lower than expected recoverable ounces, and/or the Company’s operating performance could have a material effect on the Company’s determination of ore reserves, or its ability to recover the carrying amounts of its long-lived assets resulting in potential additional impairment charges.
In April 2014, the Financial Accounting Standards Board (FASB) issued Accounting Standards Update (ASU) 2014-08, Reporting Discontinued Operations and Disclosures of Disposals of Components of an Entity, which includes amendments that change the requirements for reporting discontinued operations and requires additional disclosures about discontinued operations and long-lived assets classified as held for resale. Under new guidance, only disposals representing a strategic shift in operations should be presented as discontinued operations. The guidance is effective for annual periods beginning on or after December 15, 2014. The Company is evaluating the effect this standard may have on its consolidated financial statements.
FAIR VALUE OF FINANCIAL INSTRUMENTS
The Company’s non-derivative financial instruments consist primarily of cash equivalents, trade receivables, payables, investments, convertible debentures and capital lease obligations. The carrying amounts of cash equivalents, trade receivables and payables approximate fair value due to their short maturities. The carrying amounts of investments approximate fair value based on market quotes.
Fair value is defined as the price that would be received to sell an asset or paid to transfer a liability (an exit price) in an orderly transaction between market participants. A fair value hierarchy was established which requires an entity to maximize the use of observable inputs and minimize the use of unobservable inputs when measuring fair value. The fair value hierarchy distinguishes among three levels of inputs that may be utilized when measuring fair value: Level 1 inputs (using quoted prices in active markets for identical assets or liabilities), Level 2 inputs (using external inputs other than Level 1 prices such as quoted prices for similar assets and liabilities in active markets or inputs that are observable for the asset or liability) and Level 3 inputs (unobservable inputs supported by little or no market activity and based on internal assumptions used to measure assets and liabilities). The classification of each financial asset or liability within the above hierarchy is determined based on the lowest level input that is significant to the fair value measurement.
80
REVENUE RECOGNITION
Revenue is comprised of Mine Production revenue, PGM Recycling revenue and other sales revenue. Mine Production revenue consists of the sales of palladium and platinum extracted by the Company’s mining operations, including any realized hedging gains or losses. Mine Production revenue also consists of the sales of by-products (rhodium, gold, silver, copper and nickel) extracted by mining operations. PGM Recycling revenue consists of the sales of recycled palladium, platinum and rhodium derived from spent catalytic materials, including any unrealized and realized hedging gains or losses. PGM recycling revenue also includes revenue from toll processing. Other sales revenue consists of sales of PGMs that are acquired periodically in the open market and simultaneously resold to third parties.
Revenue is recognized when persuasive evidence of an arrangement exists, delivery has occurred either physically or through an irrevocable transfer of metals to customers’ accounts, the price is fixed or determinable, no related obligations remain and collectability is probable. Under the terms of sales contracts and purchase orders received from customers, the Company recognizes revenue when the product is in a refined and saleable form and title passes, which is typically when the product is transferred from the account of the Company to the account of the customer. Under certain of its sales agreements, the Company instructs a third-party refiner to transfer metal from the Company’s account to the customer’s account; at this point, the Company’s account at the third-party refinery is reduced and the purchaser’s account is increased by the number of ounces of metal sold. These transfers are irrevocable and the Company has no further responsibility for the delivery of the metals. Under other sales agreements, physical conveyance occurs by the Company arranging for shipment of metal from the third-party refinery to the purchaser. In these cases, revenue is recognized at the point when title passes contractually to the purchaser. Sales discounts are recognized when the related revenue is recorded. The Company classifies any sales discounts as a reduction in revenue.
On May 28, 2014, the FASB issued Accounting Standards Update (ASU) No. 2014-09, Revenue from Contracts with Customers, which requires an entity to recognize the amount of revenue it expects to be entitled to for the transfer of promised goods or services to customers. The new standard becomes effective on January 1, 2017, and will replace most existing revenue recognition guidance in U.S. GAAP. The standard permits the use of either the retrospective or cumulative effect transition method. The Company is evaluating the effect that ASU 2014-09 will have on its consolidated financial statements and disclosures and has not yet selected a transition method nor has it determined the effect of the standard on its ongoing financial reporting. Early application is not permitted.
NONCONTROLLING INTEREST
Noncontrolling interest relates to the sale of a 25% ownership interest in Stillwater Canada Inc during 2012. Noncontrolling interest is classified in the Company's Consolidated Statements of Comprehensive Income (Loss) as part of consolidated net income (loss) and the accumulated amount of noncontrolling interest in the Company's Consolidated Balance Sheets as a component of equity.
HEDGING PROGRAM
From time to time, the Company enters into derivative financial instruments, including fixed forward sales, cashless put and call option collars and financially settled forwards to manage the effect of changes in the prices of palladium and platinum on the Company’s revenue and to manage interest rate risk. Derivatives are reported on the balance sheet at fair value and, if the derivative is not designated as a hedging instrument, changes in fair value must be recognized in earnings in the period of change. If the derivative is designated as a hedge, and to the extent such hedge is determined to be highly effective, changes in fair value are either (a) offset by the change in fair value of the hedged asset or liability (if applicable) or (b) reported as a component of other comprehensive income (loss) in the period of change, and subsequently recognized in the determination of net income (loss) in the period the offsetting hedged transaction occurs. If an instrument is settled early, any gains or losses are deferred and recognized as adjustments to the revenue recorded for the related hedged production when the transaction related to the original hedge instrument settles.
Unrealized derivative gains and losses recorded in current and non-current assets and liabilities and amounts recorded in other comprehensive income (loss) and in current period earnings are non-cash items and therefore are taken into account in the preparation of the Company's Consolidated Statements of Cash Flows based on their respective balance sheet classifications.
81
RECLAMATION AND ENVIRONMENTAL COSTS
The fair value of a liability for an asset retirement obligation is recognized in the period in which it is incurred if a reasonable estimate of fair value can be made. The fair value of the liability is added to the carrying amount of the associated asset and this additional carrying amount is depreciated over the life of the asset. The liability is accreted at the end of each period through charges to operating expense. If the obligation is settled for other than the carrying amount of the liability, the Company will recognize a gain or loss on settlement.
Accounting for reclamation obligations requires management to make estimates for each mining operation of the future costs the Company will incur to complete final reclamation work required to comply with existing laws and regulations. Actual costs incurred in future periods could differ from amounts estimated. Additionally, future changes to environmental laws and regulations could increase the extent of reclamation and remediation work that the Company is required to perform. Any such increases in future costs could materially impact the amounts charged in future periods to operations for reclamation and remediation.
INCOME TAXES
The Company determines income taxes using the asset and liability method which results in the recognition of deferred tax assets and liabilities for the expected future tax consequences of temporary differences between the carrying amounts and the tax bases of those assets and liabilities, as well as operating loss and tax credit carryforwards, using enacted tax rates in effect in the years in which the differences are expected to reverse. The effect on deferred tax assets and liabilities of a change in tax rates is recognized in income in the period that includes the enactment date. Deferred tax assets and liabilities are recorded on a jurisdictional basis.
In assessing the realizability of U.S. and foreign deferred tax assets, management considers whether it is more likely than not that some portion or all of the deferred tax assets will not be realized. Each quarter, management considers the scheduled reversal of deferred tax liabilities, projected future taxable income, and tax planning strategies in making this assessment. A valuation allowance has been provided at December 31, 2014, and 2013, for the portion of the Company’s net deferred tax assets for which it is more likely than not that they will not be realized.
STOCK-BASED COMPENSATION
The Company estimates the fair value of performance-based restricted stock awards using a Monte Carlo simulation valuation model. The fair value of time-based restricted stock awards is determined by the market value of the underlying shares on the date of grant. Costs resulting from all share-based payment transactions are recognized in the financial statements over the respective vesting periods. All liability classified performance-based restricted stock awards are revalued each period with a charge to earnings.
EARNINGS (LOSS) PER COMMON SHARE
Basic earnings (loss) per share attributable to common stockholders is computed by dividing net income (loss) attributable to common stockholders by the weighted average number of common shares outstanding during the period. Diluted earnings (loss) per share attributable to common stockholders reflects the potential dilution that could occur if the Company’s dilutive outstanding stock options or nonvested shares were exercised and the Company’s convertible debentures were converted. Reported net income (loss) attributable to common stockholders is adjusted for the interest expense net of capitalized interest (including amortization expense of deferred debt and equity fees), the related income tax effect and the income (loss) attributable to the noncontrolling interest in the computation of basic and diluted earnings per share attributable to common stockholders. The Company currently has only one class of equity shares outstanding.
COMPREHENSIVE INCOME (LOSS)
Comprehensive income (loss) includes net income (loss), as well as other changes in stockholders’ equity that result from transactions and events other than those with stockholders. The Company’s only significant elements of other comprehensive income (loss) in 2014, 2013 and 2012 consisted of unrealized gains and losses related to available-for-sale marketable securities.
DEBT ISSUANCE COSTS
Debt issuance costs are capitalized and amortized to interest expense using the effective interest method over the lives of the related debt agreements.
82
ADVERTISING COSTS
Advertising (marketing) costs are expensed as incurred and included in General and administrative in the Company's Consolidated Statements of Comprehensive Income (Loss). Advertising expenses were approximately $0.4 million, $4.4 million, and $10.8 million in 2014, 2013 and 2012, respectively.
FOREIGN CURRENCY TRANSACTIONS
The functional currency of the Company’s Canadian and South American subsidiaries is the U.S. dollar. Gains or losses resulting from transactions denominated in Canadian and South American currencies are included in Foreign currency transaction (loss) gain, net in the Company's Consolidated Statements of Comprehensive Income (Loss).
USE OF ESTIMATES
The preparation of the Company’s consolidated financial statements in conformity with United States generally accepted accounting principles requires management to make estimates and assumptions that affect the amounts reported in these consolidated financial statements and accompanying notes. The more significant areas requiring the use of management’s estimates relate to mineral reserves, reclamation and environmental obligations, valuation allowance for deferred tax assets, useful lives utilized for depletion, depreciation, amortization and accretion calculations, future cash flows from long-lived assets, fair value of long-lived assets, and fair value of derivatives. Actual results could differ from these estimates.
RECLASSIFICATION
Prior year amounts previously disclosed as marketing expense and research and development expense have been consolidated into general and administrative expense to conform to the current year presentation on the Company's consolidated statements of comprehensive income (loss).
NOTE 3
SALES
MINE PRODUCTION
The Company mines and processes ores containing palladium, platinum, rhodium, gold, silver, copper and nickel into intermediate and final products for sale to customers. Palladium, platinum, rhodium, gold and silver are sent to a third-party refiner for final processing from which they are sold to several customers with whom the Company has established trading relationships. Refined PGMs in sponge form are transferred upon sale from the Company’s account at the third-party refiner to the account of the purchaser. By-products metals are normally sold at market price to customers, brokers or outside refiners. Sales of copper and nickel by-products typically reflect a discount from market prices. By-product sales are included in revenues from Mine Production. For the respective years 2014, 2013 and 2012, sales of by-products (gold, nickel, mined rhodium, copper and silver) totaled $29.6 million, $27.1 million and $30.6 million.
In the first half of 2014, all Company sales of mined PGMs were either in the spot market or under mutually agreed short-term (one year or less) supply agreements. On July 1, 2014, the Company executed five-year supply and refining agreements with Johnson Matthey.
Under the terms of these new agreements, Johnson Matthey has an exclusive five-year right to refine all of the PGM filter cake the Company produces at its Columbus, Montana facilities. Johnson Matthey also has the right to purchase all of the Company's mine production of palladium and platinum at competitive market prices (except for platinum sales currently under the Company's sales agreement with Tiffany & Co., which are specifically excluded from the Johnson Matthey agreements) and has the right to bid for any recycling volumes the Company has available. Other provisions of the agreements include a good-faith effort by Johnson Matthey to assist in growing the Company's recycling volumes and the sharing of market intelligence to the extent permitted by law. The Company has the right to exit the Johnson Matthey PGM supply arrangement in return for the payment of a nominal fee. In addition, the Company, in its sole discretion, may elect to terminate the refining arrangement after four years.
83
PGM RECYCLING
The Company purchases spent catalyst materials from third-parties and processes this material within its facilities in Columbus, Montana to recover palladium, platinum and rhodium for sale. It also accepts material supplied from third-parties on a tolling basis, processing it for a fee and returning the recovered metals to the supplier. The Company has entered into sourcing arrangements for catalyst material with various suppliers. Under these sourcing arrangements as currently structured, the Company may advance cash against a shipment of material shortly before actually receiving the physical shipment at the Company's processing facility in Columbus, Montana. These advances are included in Other current assets on the Company’s Consolidated Balance Sheets until such time as the material has been physically received and title has transferred to the Company, at which time it is reclassified into Inventories. Finance charges collected on advances and inventories prior to being earned are included in Other current liabilities on the Company’s Consolidated Balance Sheets. Finance charges are reclassified from Other current liabilities to Interest income ratably from the time the cash advance was made until the out-turn date of the inventory from the final refiner. The Company recorded a write-down on a trade receivable of $0.6 million in 2013. Payment was received in full for this receivable in the third quarter of 2014. There were no corresponding recycling write-downs in 2014.
OTHER
In addition to Mine Production and PGM Recycling metal sales, the Company makes other open market purchases of PGMs from time to time for resale to third parties. The Company recognized other revenue of $5.9 million in 2014, including $5.3 million for metal acquired in the open market for immediate resale to third parties. There were no comparable acquisitions in the open market during 2013 and 2012.
NOTE 4
ASSET IMPAIRMENT
In accordance with the FASB Accounting Standards Codification 360, Property Plant and Equipment, (ASC 360-10), the Company reviews and evaluates its long-lived assets for impairment when events and changes in circumstances indicate that the related carrying amounts of such assets may not be recoverable and may exceed their fair value. For purposes of determining impairment, assets are grouped at the lowest level for which identifiable cash flows (including estimated future cash flows from non-operating properties) are largely independent of the cash flows of other groups of assets and liabilities.
The Company regards the Altar project, comprised of contiguous mineral exploration properties situated in Argentina that likely would be mined together as a unit, as a single long-lived asset in considering impairment. The list in ASC 360-10 of examples of events or changes in circumstances that might indicate impairment includes the following:
• | A significant decrease in the market price of a long-lived asset (asset group); |
• | A significant adverse change in legal factors or in the business climate that could affect the value of a long-lived asset (asset group), including an adverse action by a regulator. |
With regard to Altar, the Company identified certain events and/or changes in circumstances during the third quarter of 2013 that resulted in the testing of recoverability of the carrying value of the asset. In view of the significant scale of the Altar project, the Company believes it is unlikely that the Company could develop the project without involving other partners. In assessing recoverability, the Company took into account the effects on the Altar project of continuing deterioration in the legal and business climate in Argentina, coupled with industry announcements of investment cutbacks and the deferral of certain projects in the vicinity of the Altar property, a significant shift away from large greenfield projects by the global mining industry, and the ongoing technical review of the Altar project. Considering these events individually and in the aggregate, the Company concluded that “indicators of potential impairment” had occurred during the 2013 third quarter, requiring the Company to assess whether its investment in the Altar mineral property was recoverable.
These adverse changes required the Company to assess whether it reasonably expected to generate future undiscounted cash flows sufficient to recover its investment in the Altar mineral property, utilizing the potential development scenarios under current consideration. These scenarios included developing the project under various capital sensitivity cases, inviting third-party investment in portions of the project, abandoning the project outright, and considering a long-term sale. Probability weighting these scenarios for the Altar mineral property, which were developed in conjunction with the ongoing technical reviews noted above, the Company determined that the probability-weighted undiscounted future cash flows from the Altar mineral property were more likely than not, not sufficient to recover the carrying value of the assets at September 30, 2013.
84
Having made such determination, the Company undertook to determine an estimate of the fair value of the Altar assets. This effort, for which the Company engaged the assistance of a qualified third-party valuation expert, included examining recent comparable transactions for similar undeveloped mineral properties and market multiples for similar projects. Taking the result of this analysis into account, the Company recorded an impairment at September 30, 2013, of $290.4 million (before-tax) in the carrying value of the Altar mineral property, reducing the carrying value to its estimated fair value of $102.0 million. Subsequently, the Company has reviewed the recoverability of the Altar carrying value at December 31, 2013, and for each reporting period thereafter and has concluded that no further reduction to the carrying value of the Altar property is indicated to date.
The Company recognized impairment to its Marathon properties in Canada at December 31, 2013. In assessing impairment at Marathon, the Company segregated the assets associated with the proposed Marathon PGM-copper development project from the Company’s other nearby exploration holdings, which are in a less advanced stage of evaluation and therefore not yet integral to the proposed mining operation. Both asset groups were separately considered for impairment because in the Company’s view the value of the exploration properties was likely dependent upon the underlying viability of the Marathon PGM-copper development project.
During the fourth quarter of 2013, the detailed engineering feasibility study being undertaken on the Marathon project (following on an earlier study last revised in March 2012) reached a stage where the project economics could be reviewed. Several adverse changes emerged from the new study:
• | Less favorable third-party offtake terms (including the effect of lower concentrate grades and higher shipping costs); |
• | Higher operating costs; |
• | Higher initial capital cost; and |
• | Reductions in estimated palladium grades in a portion of the ore reserves. |
According to U.S. GAAP in ASC 360-10, one indication of possible impairment is the following:
* An accumulation of costs significantly in excess of the amount originally expected for the acquisition or construction of a long-lived asset group. For example, significant overruns on the construction of a new plant.
In reviewing the issues noted above, the Company concluded that the unfavorable changes identified in the updated feasibility study collectively constituted an “indicator of impairment” that could indicate the carrying value of Marathon, as recorded on the books of the Company at December 31, 2013 (pre-impairment), was unrecoverable.
Consequently, the Company was required by accounting principles to determine if the carrying value of the Marathon assets exceeded their expected future undiscounted cash flows and the fair value of the assets. The Company initiated a process, with assistance from a qualified third-party consulting firm, to validate the preliminary economics in the new feasibility study and determine if the carrying value of the assets was more likely than not recoverable. This consulting firm worked with the Company and the engineering firms that prepared the feasibility study, reviewing the assumptions and the cash flows included in the project financial model for reasonableness. The consulting firm’s preliminary report concluded that, more likely than not, if the Marathon PGM-copper project were developed by the Company as planned, the net undiscounted cash flows from the project would be insufficient to recover its pre-impairment carrying value.
The Company concurred with this conclusion and, with the continuing assistance of the third-party consulting firm, proceeded to estimate the fair value of its long-lived Marathon assets. In so doing, the Company considered the net present values indicated by the financial model over a range of metal prices (these values were consistently negative using what the Company judged to be a reasonable discount rate), as well as taking into account appropriate comparable sales transactions, adjusted for relative scale and risk, and a value using the appraised value method, based on exploration spending. As a result, in aggregate the Company wrote down the carrying value of its Marathon assets at December 31, 2013, from $228.6 million to $57.3 million, with a corresponding $171.4 million (before-tax) charge that included a charge against mineral properties and mine development of $170.5 million, and against depreciable fixed assets of $0.8 million. Because the Marathon economics at present do not support proceeding with development, the Company no longer is reporting proven and probable ore reserves at Marathon or accounting for Marathon as a development-stage project.
Assumptions underlying future cash flows associated with the Company’s long-lived assets are subject to risks and uncertainties. Future changes in such factors as supply and demand fundamentals, metals prices, recoverable reserve estimates, legal requirements and actual operating performance could have a material effect on the Company’s ability to recover the carrying amounts of its long-lived assets, potentially resulting in additional impairment charges. In the case of the Altar and Marathon exploration properties (for which future expected cash flows are difficult to estimate), a pattern of declining realized prices for sales of comparable mineral properties could provide an indication of impairment.
85
The Company determined at December 31, 2014, that certain real estate properties owned by the Company in the town of Marathon that previously were associated with the Marathon project should now be segregated and considered separately for impairment. The Company obtained an estimate of fair value from a real estate firm in the area and has impaired those properties by approximately $0.5 million at December 31, 2014. Other than those properties, in the opinion of management there have been no material events or changes in circumstances that would call into question the recoverability of asset carrying values and would require the Company to test its other long-lived assets for impairment at December 31, 2014.
NOTE 5
NONCONTROLLING INTEREST
In 2012, the Company sold to a subsidiary of Mitsubishi Corporation (Mitsubishi) a 25% interest in the Company's wholly-owned subsidiary, Stillwater Canada Inc (SCI), which holds the Marathon PGM-copper assets. Mitsubishi paid $81.25 million in cash for its 25% interest and contributed an additional $13.6 million to satisfy its 25% share of the venture's initial cash call. According to the acquisition terms, Mitsubishi will be responsible for funding its 25% share of operating, capital and exploration expenditures on the Marathon properties and also will have a first right to purchase up to 100% of Marathon's future PGM production at a relatively small discount to market. The change in the parent company's equity as a result of the sale of the noncontrolling interest in SCI was an increase to Additional paid in capital of $42.5 million, offset in part by expenses incurred of $1.1 million.
Mitsubishi's 25% interest in the SCI net loss in each period is shown as Net loss attributable to noncontrolling interest in the Company's Consolidated Statements of Comprehensive Income (Loss). The amount of this loss is added back to the Company's reported Net income (loss) in each period in arriving at Net income (loss) attributable to common stockholders. The reported Net loss attributable to noncontrolling interest for the years ended December 31, 2014 and 2013 was $1.4 million and $31.9 million, respectively.
The noncontrolling interest's share of equity in SCI is reflected as Noncontrolling interest in the Company's Consolidated Balance Sheets and was $18.5 million at December 31, 2014 and $19.9 million at December 31, 2013. The noncontrolling interest balance at December 31, 2013, reflects Mitsubishi's share of the impairment loss taken on the carrying value of the Marathon assets. The noncontrolling interest portion of the impairment loss was $42.3 million (before-tax).
NOTE 6
DERIVATIVE INSTRUMENTS
The Company uses derivative financial instruments to manage certain of its exposures to changes in PGM market commodity prices.
COMMODITY DERIVATIVES
PGM Recycling
The Company customarily enters into fixed forward sales relating to PGM recycling of catalysts materials. Under these fixed forward transactions, the Company agrees to deliver a stated quantity of metal on a specific future date at a price stipulated in advance. The Company uses fixed forward transactions to set in advance the pricing for metals acquired and processed in its recycling segment. The metals from PGM recycled materials are sold forward at the time of purchase and delivered against the fixed forward contracts when the ounces are recovered. Because this forward price is also used to set the acquisition price the Company pays for recycling materials, this arrangement significantly reduces exposure to PGM price volatility. The Company believes such transactions qualify for the exception to hedge accounting treatment and so has elected to account for these transactions as normal purchases and normal sales.
All of the Company's fixed forward sales contracts open at December 31, 2014, will settle at various periods through August 2015. The Company has credit agreements with its major trading partners that provide for margin deposits in the event that forward prices for metals exceed the Company’s hedged prices by a predetermined margin limit. At December 31, 2014, and 2013, no margin deposits were outstanding or due.
86
The following is a summary of the Company’s outstanding commodity derivatives in its Recycling Business Segment at December 31, 2014:
PGM Recycling: | |||||||||||||||||||||
Fixed Forward Contracts | Platinum | Palladium | Rhodium | ||||||||||||||||||
Settlement Period | Ounces | Average Price/Ounce | Ounces | Average Price/Ounce | Ounces | Average Price/Ounce | |||||||||||||||
First Quarter 2015 | 20,952 | $ | 1,258 | 37,385 | $ | 798 | 5,205 | $ | 1,223 | ||||||||||||
Second Quarter 2015 | 2,940 | $ | 1,218 | 3,237 | $ | 805 | 938 | $ | 1,188 | ||||||||||||
Third Quarter 2015 | 32 | $ | 1,198 | 32 | $ | 812 | 13 | $ | 1,225 | ||||||||||||
Mine Production
The Company was not a party to any derivative instruments involving its mined production during 2014, 2013 or 2012.
NOTE 7
SHARE COMPENSATION PLANS
EQUITY PLANS
The Company sponsors equity plans (the “Plans”) that enable the Company to grant equity based compensation to employees and non-employee directors. Effective March 2011, the Company ceased offering stock options as incentive compensation to employees and non-employee directors and began to issue only cash awards or restricted stock units in lieu of stock options. The Company continues to have previously issued stock options that remain outstanding under the General Employee Plan and the 2004 Equity Incentive Plan. In April 2012, stockholders approved the 2012 Equity Incentive Plan. In total approximately 11.6 million shares of common stock were originally authorized under the Plans, including approximately 5.0 million, 5.2 million and 1.4 million authorized shares for the 2012 Equity Incentive Plan, 2004 Equity Incentive Plan and the General Employee Plan, respectively. Approximately 4.5 million shares were available and reserved for grant under the 2012 Equity Incentive Plan as of December 31, 2014.
The Compensation Committee of the Company’s Board of Directors administers the Plans and determines the type of equity awards to be issued, the exercise period, vesting period and all other terms of instruments issued under the Plans. Employees’ options and restricted stock units vest in equal annual installments over a three year period after date of grant. Options expire ten years after the date of grant. Certain of the Company's equity incentive plans and award agreements contain "change in control" provisions which provide that, among other "triggering events", a "change in control" occurs if following the election of new directors to the Board of Directors, a majority of the members of the Board of Directors are not considered "incumbent directors."
NONVESTED SHARES
Time-Based Restricted Stock Unit Awards
Time-based restricted stock unit awards provide the participant with the right to receive a number of shares of the Company's common stock upon vesting of the awards provided the participant is employed by the Company on the vesting date. Time-based awards are valued using the Company common stock price on the date of grant. Time-based awards are not entitled to any dividend equivalents with respect to the restricted stock units or to any accumulated dividends on stock that may be delivered in settlement of the restricted stock units unless and until the stock is issued in settlement of restricted stock units.
87
Nonvested time-based share activity during 2014, 2013 and 2012, is detailed in the following table:
Year ended December 31, | Nonvested Shares | Weighted- Average Grant- Date Fair Value | |||||
Nonvested time-based shares at December 31, 2011 | 1,502,611 | $ | 10.95 | ||||
Granted | 653,712 | 13.12 | |||||
Vested | (797,971 | ) | 6.94 | ||||
Forfeited | (79,762 | ) | 13.80 | ||||
Nonvested time-based shares at December 31, 2012 | 1,278,590 | $ | 14.38 | ||||
Granted | 544,122 | 13.64 | |||||
Vested (1) | (1,791,040 | ) | 14.19 | ||||
Forfeited | (615 | ) | 13.99 | ||||
Nonvested time-based shares at December 31, 2013 | 31,057 | $ | 11.55 | ||||
Granted | 348,056 | 14.68 | |||||
Vested | (158,412 | ) | 13.84 | ||||
Forfeited | (35,954 | ) | 14.22 | ||||
Nonvested time-based shares at December 31, 2014 | 184,747 | $ | 13.80 | ||||
(1) Pursuant to the terms of the Company's Equity Plans, the change in control that occurred in the second quarter of 2013 resulted in all outstanding nonvested shares granted under those Equity Plans immediately becoming fully vested.
Total compensation expense, included within General and administrative in the Company's Consolidated Statements of Comprehensive Income (Loss) related to grants of nonvested shares for the years ended December 31, 2014 and 2012 was $2.6 million and $8.2 million, respectively. Compensation expense for the year ended December 31, 2013, totaled $13.7 million, of which $4.6 million is included in General and administrative in the Company's Consolidated Statements of Comprehensive Income (Loss) and $9.1 million (non-cash charge) resulting from the triggering of the change in control provisions under the 2004 and 2012 Equity Incentive Plans is recorded as Accelerated equity based compensation for change-in-control in the Company's Consolidated Statements of Comprehensive Income (Loss).
Performance-Based Restricted Stock Unit Awards
A performance-based restricted stock unit award provides the participant with the right to receive a number of shares of the Company's common stock depending on achievement of specific measurable performance criteria. The number of shares earned is determined at the end of each performance period, generally three years, based on the actual performance criteria predetermined by the Compensation Committee at the time of grant. In the period it becomes probable that the performance criteria will be achieved, the Company recognizes expense for the proportionate share of the total fair value of the grant related to the vesting period that has already lapsed. The remaining cost of the grant is expensed over the balance of the vesting period. In the event the Company determines it is no longer probable that it will achieve the minimum performance criteria specified in the Plan, the Company reverses all of the previously recognized compensation expense in the period such a determination is made.
The Company granted performance-based stock unit awards under its 2014-2016 Long Term Incentive Plan (LTIP). The payout of the awards is dependent upon three distinct components with five separate sub-targets. Two of the sub-targets are market-based and equity classified; one sub-target is market-based and liability classified; and two sub-targets are performance-based and equity classified. Performance shares are valued using a Monte Carlo simulation valuation model on the date of grant. The fair value of the liability classified sub-target is remeasured each reporting period. The existence of a market condition requires recognition of compensation cost for the performance share awards over the requisite period regardless of whether the market condition is satisfied. Total compensation expense, included within General and administrative in the Company's Consolidated Statements of Comprehensive Income (Loss) related to grants of performance-based shares for the year ended December 31, 2014 was $1.5 million.
Performance-based awards are not entitled to any dividend equivalents with respect to the restricted stock units or to any accumulated dividends on stock that may be delivered in settlement of the restricted stock units unless and until the stock is issued in settlement of restricted stock units.
88
Nonvested performance-based share activity during 2014 is detailed in the following table:
Nonvested Shares | Weighted- Average Grant- Date Fair Value | ||||||
Nonvested performance-based shares at January 1, 2014 | — | $ | — | ||||
Granted * | 223,412 | 15.69 | |||||
Vested | — | — | |||||
Forfeited | (9,176 | ) | 15.69 | ||||
Nonvested performance-based shares at December 31, 2014 | 214,236 | $ | 15.69 | ||||
* The number of performance-based shares granted is based on the target award amounts in the performance share grant agreements.
The following table presents the compensation expense of the nonvested shares outstanding at December 31, 2014, to be recognized over the remaining vesting periods:
(In thousands) | Time-based shares | Performance -based shares | ||||||
2015 | $ | 6 | $ | 795 | ||||
2016 | 1,001 | 795 | ||||||
2017 | 86 | — | ||||||
Total | $ | 1,093 | $ | 1,590 | ||||
STOCK OPTIONS
Historically, the Company recognized compensation expense associated with its stock option grants based on their fair market value on the date of grant as determined using a Black-Scholes option pricing model. The Company experienced a change in control event in the second quarter of 2013 resulting in all outstanding, unvested stock options granted under the 2004 and 2012 Equity Plans becoming fully vested. Prior to this change in control event, the Company recognized stock option expense ratably over the vesting period of the options. If options were canceled or forfeited prior to vesting, the Company stopped recognizing the related expense effective with the date of forfeiture. Due to the accelerated vesting of all outstanding stock options in the second quarter of 2013, the Company recognized the remaining expense in 2013. The Company has not granted stock options subsequent to the change in control event in the second quarter of 2013.
Because all outstanding, unvested stock options vested in the second quarter of 2013, there was no compensation expense associated with stock options in 2014. Compensation expense related to the fair value of stock options for the period ended December 31, 2013 was $41,400. The compensation expense is recorded in General and administrative in the Company's Consolidated Statements of Comprehensive Income (Loss).
The Company received approximately $1.0 million, $0.1 million and less than $0.1 million in cash from the exercise of stock options for the years ended December 31, 2014, 2013 and 2012, respectively.
89
Stock option activity for the years ended December 31, 2014, 2013 and 2012, is summarized as follows:
Year Ended December 31, | Shares | Weighted Average Exercise Price | Weighted- Average Grant- Date Fair Value | ||||||
Options outstanding at December 31, 2011 | 492,112 | $ | 14.23 | ||||||
Options exercisable at December 31, 2011 | 454,966 | 14.06 | |||||||
2012 Activity | |||||||||
Options granted | — | — | |||||||
Options exercised | (16,552 | ) | 2.61 | ||||||
Options canceled/forfeited | (233,041 | ) | 18.86 | ||||||
Options outstanding at December 31, 2012 | 242,519 | $ | 10.57 | ||||||
Options exercisable at December 31, 2012 | 224,933 | 10.08 | |||||||
2013 Activity | |||||||||
Options granted | — | — | |||||||
Options exercised | (25,471 | ) | 5.02 | ||||||
Options canceled/forfeited | (17,757 | ) | 6.07 | ||||||
Options outstanding at December 31, 2013 | 199,291 | $ | 11.68 | ||||||
Options exercisable at December 31, 2013 | 199,291 | 11.68 | |||||||
2014 Activity | |||||||||
Options granted | — | — | |||||||
Options exercised | (105,047 | ) | 9.54 | ||||||
Options canceled/forfeited | (13,100 | ) | 14.32 | ||||||
Options outstanding at December 31, 2014 | 81,144 | $ | 14.03 | ||||||
Options exercisable at December 31, 2014 | 81,144 | 14.03 | |||||||
The total intrinsic value of stock options at December 31, 2014, was $0.2 million for both stock options outstanding and exercisable. For the year ended December 31, 2014 the total intrinsic value of stock options exercised was $0.7 million and for each of the years ended December 31, 2013 and 2012, the intrinsic value of stock options was $0.2 million.
The following table summarizes information for outstanding and exercisable options at December 31, 2014:
Options Outstanding | Options Exercisable | |||||||||||||||
Range of Exercise Price | Number Outstanding | Weighted Average Remaining Contract Life | Weighted Average Exercise Price | Number Exercisable | Weighted Average Exercise Price | |||||||||||
$ 3.96 - $ 8.08 | 13,017 | 2.0 | $ | 6.57 | 13,017 | $ | 6.57 | |||||||||
$ 8.09 - $11.73 | 13,559 | 2.5 | $ | 10.03 | 13,559 | $ | 10.03 | |||||||||
$11.74 - $13.09 | 13,692 | 3.1 | $ | 12.42 | 13,692 | $ | 12.42 | |||||||||
$13.10 - $16.97 | 14,851 | 3.7 | $ | 15.37 | 14,851 | $ | 15.37 | |||||||||
$16.98 - $19.55 | 13,975 | 5.9 | $ | 18.74 | 13,975 | $ | 18.74 | |||||||||
$19.56 - $24.55 | 12,050 | 5.2 | $ | 21.33 | 12,050 | $ | 21.33 | |||||||||
81,144 | 3.7 | $ | 14.03 | 81,144 | $ | 14.03 | ||||||||||
90
DEFERRAL PLANS
The Company suspended new deferrals into its Non-Employee Directors’ Deferral Plan in mid-2014. The Plan previously allowed non-employee directors to defer all or any portion of the compensation received as directors, in accordance with the provisions of Section 409A of the Internal Revenue Code and associated Treasury regulations. All amounts previously deferred under this plan are fully vested, and each participant elected the deferral period and form of the compensation (Company common stock or cash). The plan provided for a Company matching contribution equal to 20% of the participant’s deferred stock amount. Compensation expense that was deferred in common stock related to the Non-Employee Directors’ Deferral Plan prior to its suspension was $13,500, $64,200 and $83,400 in 2014, 2013 and 2012, respectively. The Company match was made in Company common stock. There were no cash deferrals related to the Non-Employee Directors’ Deferral Plan in 2014, 2013 and 2012.
The Company’s Independent Director Deferred Share Unit Plan was approved in August 2014. Each year, an independent director may irrevocably elect to defer up to 100% of annual fees (annual cash fees payable by the Company to an independent director with respect to service as a member of the Board). A deferred share unit (DSU) is a compensatory unit which represents a promise by the Company to deliver cash equal to the fair market value of one share of the Company's common stock for each awarded DSU. The DSUs are revalued at the end of each reporting period using the closing price of the Company's common stock on the last trading day. There were no cash deferrals for the year ended December 31, 2014. In consideration of the services to be rendered each director was granted 5,070 DSUs of the Company's common stock on August 19, 2014 at a closing share price of $18.69. The liability associated with the DSU plan for the year ended December 31, 2014 was $0.4 million. Upon separation of service from the Board an independent director's entire account balance is distributed in a lump sum cash payment. The Company paid out distributions of less than $0.1 million in 2014.
The Company's Nonqualified Deferred Compensation Plan, allows certain key personnel of the Company to defer up to 60% of their salaries; up to 100% of other cash compensation and up to 100% of their restricted stock units upon vesting in accordance with the provisions of Section 409A of the Internal Revenue Code and associated Treasury regulations. All amounts deferred under this plan are fully vested, and each participant elects the deferral period and form of the compensation (Company common stock or cash). For each Plan year, the Company matches the amount of compensation deferred during that year up to a maximum of 8% of the participant’s total compensation for the calendar year. Compensation expense deferred in cash was $154,200, $203,000 and $342,000 in 2014, 2013 and 2012, respectively.
EMPLOYEE BENEFIT PLANS
The Company has two savings plans, which qualify under section 401(k) of the U.S. Internal Revenue Code, covering essentially all non-bargaining and bargaining employees. Employees may elect to contribute up to 60% of their eligible compensation, subject to the Employee Retirement Income Security Act of 1974 (ERISA) limitations. The Company is required to make matching contributions equal to 100% of the employee’s contribution up to 8% of the employee’s compensation. Matching contributions are made with common stock of the Company. During 2014, 2013 and 2012, the Company issued approximately 0.7 million, 0.9 million and 0.7 million shares of common stock, respectively, with a market value on the respective grant dates of $10.3 million, $10.3 million and $7.9 million, respectively, to match employees’ contributions. The Company made no cash contributions to the plans in 2014, 2013 and 2012.
91
NOTE 8
INCOME TAXES
The components of the Company’s deferred income tax liabilities (assets) are comprised of the following temporary differences and carryforwards at December 31, 2014, and 2013.
December 31, (In thousands) | 2014 | 2013 | ||||||
Mine development and mineral interests-US | $ | 98,204 | $ | 105,366 | ||||
Mine development and mineral interests-Canada | (1,214 | ) | (1,234 | ) | ||||
Mineral interests-South America | 20,844 | 27,333 | ||||||
Long-term debt | 42,986 | 49,936 | ||||||
Total deferred tax liabilities | $ | 160,820 | $ | 181,401 | ||||
Noncurrent liabilities | (10,703 | ) | (9,928 | ) | ||||
Property and equipment | (15,683 | ) | (18,502 | ) | ||||
Current liabilities | (21,301 | ) | (20,696 | ) | ||||
Long-term investments | (3,158 | ) | (3,108 | ) | ||||
Inventory | (933 | ) | (1,972 | ) | ||||
AMT credit and other carryforwards | (30,956 | ) | (17,021 | ) | ||||
Exploration | (4,610 | ) | (5,391 | ) | ||||
Net operating loss (NOL) and other carryforwards | (48,444 | ) | (67,856 | ) | ||||
Total deferred tax assets | $ | (135,788 | ) | $ | (144,474 | ) | ||
Valuation allowance | 22,812 | 20,685 | ||||||
Net deferred tax assets | (112,976 | ) | (123,789 | ) | ||||
Net deferred tax liabilities | $ | 47,844 | $ | 57,612 | ||||
In assessing the realizability of deferred tax assets, the Company considers whether it is more likely than not that some portion or all of the deferred tax assets will not be realized. The Company considers the scheduled reversal of deferred tax liabilities, projected future taxable income, and tax planning strategies in making this assessment. The Company provided a valuation allowance in 2014 and 2013 to reflect the estimated amount of deferred tax assets which may not be realized, which principally relate to foreign and state net operating losses, and certain tax credits. The NOLs and other carryforwards for 2014 above represent $34.6 million from U.S. operations and $13.9 million from foreign operations. The NOLs for 2013 above represent $56.1 million from U.S. operations and $11.8 million from foreign operations.
Reconciliation of the income tax provision at the applicable statutory income tax rates to the effective rate is as follows:
Year ended December 31, (In thousands) | 2014 | 2013 | 2012 | |||||||||
Income / (loss) before income taxes | $ | 85,141 | $ | (395,726 | ) | $ | 50,377 | |||||
Income tax provision (benefit) at statutory rates | 29,799 | (138,504 | ) | 17,632 | ||||||||
State income tax expense, net of federal benefit | 3,553 | 3,995 | 4,173 | |||||||||
Percentage depletion | (17,302 | ) | (8,786 | ) | (4,985 | ) | ||||||
Foreign currency transaction (gain) loss, net | (1,353 | ) | 31,605 | (5,304 | ) | |||||||
NOL utilization adjustment | — | — | (4,277 | ) | ||||||||
Compensation related adjustment | 6 | 359 | 2,026 | |||||||||
Change in valuation allowance | 2,127 | 5,595 | (14,514 | ) | ||||||||
Return-to-provision | 92 | 1,097 | — | |||||||||
Impact of foreign operations | (52 | ) | 8,895 | 670 | ||||||||
Other | (612 | ) | 2,091 | 540 | ||||||||
Net income tax provision (benefit) | $ | 16,258 | $ | (93,653 | ) | $ | (4,039 | ) | ||||
92
At December 31, 2014, the Company had approximately $134.2 million of regular federal tax net operating loss carryforwards in the U.S. expiring from 2019 through 2028. Usage of $91.1 million of these net operating losses is limited to approximately $10.2 million annually as a result of the change in control of the Company that occurred in connection with the Norilsk Nickel transaction in 2003. The Company had $29.3 million of alternative minimum tax credit carryforwards which will not expire and $1.7 million in general business credits expiring during 2029 to 2034. The Company had approximately $3.3 million of state tax net operating loss carryforwards expiring during 2020 through 2029. The Company also had $51.6 million of foreign net operating loss carryforwards. The foreign net operating losses expire as follows: $19.4 million during 2015 to 2019 and $23.4 million during 2024 to 2034. Currently, $8.8 million of foreign net operating losses have an indefinite life.
Cash payments for state income taxes were made in 2014 and 2013 in the amount of $15.3 million and $0.1 million, respectively. No state payments were made in 2012. The Company made U.S. federal tax payments in the amount of $11.1 million, $5.2 million and $4.8 million in 2014, 2013 and 2012, respectively. The Company had a net tax receivable of $5.2 million relating to current and prior year anticipated U.S. and state tax filings.
The Company’s policy is to recognize interest and penalties on unrecognized tax benefits in Income tax (provision) benefit in the Company's Consolidated Statements of Comprehensive Income (Loss). The Company does not have any uncertain tax benefits at December 31, 2014. There were no interest and penalties accrued at December 31, 2014. For 2013 and 2012, interest and penalties accrued were $2.1 million and less than $0.1 million, respectively. The Company did not include expense for unrecognized tax benefits in 2014, the Company included $1.4 million for unrecognized tax benefits for the year ended December 31, 2013. The tax years subject to examination by the taxing authorities are the years ended December 31, 2013, 2012 and 2011, although, net operating loss and credit carryforwards from all years are subject to examination and adjustments for three years following the year in which utilized.
The income tax provision (benefit) is comprised of the following:
Year ended December 31, (In thousands) | 2014 | 2013 | 2012 | |||||||||
Current | ||||||||||||
Federal | $ | 13,902 | $ | 9,740 | $ | 1,721 | ||||||
State | 6,947 | 5,152 | 200 | |||||||||
Current income tax | $ | 20,849 | $ | 14,892 | $ | 1,921 | ||||||
Deferred | ||||||||||||
Federal | (1,577 | ) | 5,278 | — | ||||||||
State | (2,462 | ) | 252 | — | ||||||||
Foreign | (552 | ) | (114,075 | ) | (5,960 | ) | ||||||
Deferred income tax benefit | (4,591 | ) | (108,545 | ) | (5,960 | ) | ||||||
Income tax provision (benefit) | $ | 16,258 | $ | (93,653 | ) | $ | (4,039 | ) | ||||
The components of income (loss) before income tax (provision) benefit by tax jurisdiction for the years ended December 31, 2014, 2013 and 2012 were as follows:
(In millions) | 2014 | 2013 | 2012 | |||||||||
United States | $ | 88,281 | $ | 61,671 | $ | 60,166 | ||||||
Foreign | (3,140 | ) | (457,397 | ) | (9,789 | ) | ||||||
Income / (loss) before income tax (provision) benefit | $ | 85,141 | $ | (395,726 | ) | $ | 50,377 | |||||
93
NOTE 9
COMPREHENSIVE INCOME
Comprehensive gain / (loss) consists of earnings items and other gains and losses affecting stockholders’ equity that are excluded from current net income. At December 31, 2014, 2013 and 2012, such items consisted of unrealized gains / losses on available-for-sale marketable securities.
The following summary sets forth the changes in Accumulated other comprehensive income during 2014, 2013 and 2012:
(In thousands) | Available-for-Sale Securities | |||
Balance at December 31, 2011 | $ | (961 | ) | |
Change in value, net of tax | 862 | |||
Comprehensive gain | 862 | |||
Balance at December 31, 2012 | (99 | ) | ||
Change in value, net of tax | 110 | |||
Comprehensive loss | (5 | ) | ||
Balance at December 31, 2013 | 6 | |||
Change in value, net of tax | 19 | |||
Comprehensive loss | (8 | ) | ||
Balance at December 31, 2014 | $ | 17 | ||
NOTE 10
SEGMENT INFORMATION
The Company operates five reportable business segments: Mine Production, PGM Recycling, Canadian Properties, South American Properties and All Other. These segments are managed separately based on fundamental differences in their operations and geographic separation.
The Mine Production segment consists of two business components: the Stillwater Mine and the East Boulder Mine. The Mine Production segment is engaged in the development, extraction, processing and refining of PGMs. The Company sells PGMs from mine production under short-term and long-term sales agreements. The financial results for the Stillwater Mine and the East Boulder Mine have been aggregated, as both have similar products, processes, customers, distribution methods and economic characteristics.
The PGM Recycling segment is engaged in the recycling of spent catalyst material to recover the PGMs contained in the material. The Company purchases the majority of catalyst material processed by the PGM Recycling segment from third-party suppliers for its own account and sells the recovered metals directly, and it also accepts catalyst material supplied from third-parties on a tolling basis, processing it for a fee and returning the recovered metals to the supplier. The Company allocates costs of the Company's smelting and base metal refining facilities to both the Mine Production segment and to the PGM Recycling segment for internal and segment reporting purposes because these facilities support the PGM extraction requirements of both business segments.
The Canadian Properties segment consists of the Marathon mineral property assets. The exploration-stage Marathon mineral properties include a large PGM and copper deposit located near the town of Marathon, Ontario, Canada, as well as additional mineral properties located adjacent to the Marathon properties. In the fourth quarter of 2013, the Company took an impairment charge of $171.4 million on the Marathon properties. At December 31, 2013, the Company ceased reporting proven and probable ore reserves at Marathon or accounting for Marathon as a development-stage project. In general, the Company now expenses Marathon costs in the period in which they are incurred. See "Note 4 - Asset Impairment" for more information.
The South American Properties segment consists of the Peregrine Metals Ltd. assets. The principal Peregrine asset is the Altar property, an exploration-stage copper-gold resource located in the San Juan province of Argentina. In the third quarter of 2013, the Company took an impairment charge of $290.4 million on the Peregrine properties. See "Note 4 - Asset Impairment" for more information.
94
The All Other group primarily consists of assets, including investments, revenues, and expenses of various corporate and support functions and, historically, marketing expenditures related to promoting palladium.
The Company evaluates performance and allocates resources based on income or loss before income taxes.
95
The following financial information relates to the Company’s business segments:
(In thousands) | Mine Production | PGM Recycling | Canadian Properties | South American Properties | All Other | Total | ||||||||||||||||||
Year ended December 31, 2014 | ||||||||||||||||||||||||
Revenues | $ | 536,010 | $ | 401,684 | $ | — | $ | — | $ | 5,925 | $ | 943,619 | ||||||||||||
Depletion, depreciation and amortization | $ | 66,387 | $ | 1,019 | $ | — | $ | — | $ | — | $ | 67,406 | ||||||||||||
General and administrative expenses | $ | — | $ | — | $ | 3,251 | $ | 337 | $ | 31,479 | $ | 35,067 | ||||||||||||
Interest income | $ | — | $ | 2,535 | $ | 6 | $ | 68 | $ | 942 | $ | 3,551 | ||||||||||||
Interest expense | $ | — | $ | — | $ | 1 | $ | — | $ | 22,718 | $ | 22,719 | ||||||||||||
Income (loss) before impairment charge and income taxes | $ | 136,990 | $ | 11,719 | $ | (4,581 | ) | $ | 2,600 | $ | (61,037 | ) | $ | 85,691 | ||||||||||
Impairment charge | $ | — | $ | — | $ | 550 | $ | — | $ | — | $ | 550 | ||||||||||||
Income (loss) after impairment charge, before income taxes | $ | 136,990 | $ | 11,719 | $ | (5,131 | ) | $ | 2,600 | $ | (61,037 | ) | $ | 85,141 | ||||||||||
Capital expenditures | $ | 115,147 | $ | 181 | $ | — | $ | 45 | $ | 4,309 | $ | 119,682 | ||||||||||||
Total assets | $ | 596,653 | $ | 65,513 | $ | 75,250 | $ | 106,947 | $ | 554,964 | $ | 1,399,327 | ||||||||||||
(In thousands) | Mine Production | PGM Recycling | Canadian Properties | South American Properties | All Other | Total | ||||||||||||||||||
Year ended December 31, 2013 | ||||||||||||||||||||||||
Revenues | $ | 478,918 | $ | 560,588 | $ | — | $ | — | $ | — | $ | 1,039,506 | ||||||||||||
Depletion, depreciation and amortization | $ | 58,201 | $ | 1,116 | $ | — | $ | — | $ | — | $ | 59,317 | ||||||||||||
General and administrative expenses | $ | — | $ | — | $ | 1,112 | $ | 2,549 | $ | 42,916 | $ | 46,577 | ||||||||||||
Interest income | $ | — | $ | 3,375 | $ | 20 | $ | 184 | $ | 902 | $ | 4,481 | ||||||||||||
Interest expense | $ | — | $ | — | $ | — | $ | — | $ | 22,957 | $ | 22,957 | ||||||||||||
Income (loss) before impairment charge and income taxes | $ | 106,122 | $ | 35,463 | $ | (4,255 | ) | $ | 8,845 | $ | (80,146 | ) | $ | 66,029 | ||||||||||
Impairment charge | $ | — | $ | — | $ | 171,338 | $ | 290,417 | $ | — | $ | 461,755 | ||||||||||||
Income (loss) after impairment charge, before income taxes | $ | 106,122 | $ | 35,463 | $ | (175,593 | ) | $ | (281,572 | ) | $ | (80,146 | ) | $ | (395,726 | ) | ||||||||
Capital expenditures | $ | 108,527 | $ | 330 | $ | 12,380 | $ | 101 | $ | 7,691 | $ | 129,029 | ||||||||||||
Total assets | $ | 553,153 | $ | 80,555 | $ | 83,800 | $ | 109,960 | $ | 519,212 | $ | 1,346,680 | ||||||||||||
(In thousands) | Mine Production | PGM Recycling | Canadian Properties | South American Properties | All Other | Total | ||||||||||||||||||
Year ended December 31, 2012 | ||||||||||||||||||||||||
Revenues | $ | 455,426 | $ | 344,818 | $ | — | $ | — | $ | — | $ | 800,244 | ||||||||||||
Depletion, depreciation and amortization | $ | 56,960 | $ | 1,055 | $ | — | $ | — | $ | — | $ | 58,015 | ||||||||||||
General and administrative expenses | $ | — | $ | — | $ | 3,785 | $ | 3,334 | $ | 46,158 | $ | 53,277 | ||||||||||||
Interest income | $ | — | $ | 2,293 | $ | 29 | $ | 208 | $ | (205 | ) | $ | 2,325 | |||||||||||
Interest expense | $ | — | $ | — | $ | 12 | $ | — | $ | 10,908 | $ | 10,920 | ||||||||||||
Income (loss) before income taxes | $ | 109,255 | $ | 10,452 | $ | (7,344 | ) | $ | (2,254 | ) | $ | (59,732 | ) | $ | 50,377 | |||||||||
Capital expenditures | $ | 96,307 | $ | 353 | $ | 8,319 | $ | 18 | $ | 7,074 | $ | 112,071 | ||||||||||||
Total assets | $ | 470,251 | $ | 92,899 | $ | 258,918 | $ | 412,836 | $ | 655,859 | $ | 1,890,763 | ||||||||||||
96
NOTE 11
INVESTMENTS
The Company classifies the marketable securities in which it invests as available-for-sale securities. These securities are measured at fair market value in the financial statements with unrealized gains or losses recorded in Other comprehensive income (loss) in the Company's Consolidated Statements of Comprehensive Income (Loss). At the time the securities are sold or otherwise disposed of, gross realized gains and losses are included in Net income (loss). Gross realized gains and losses are based on the carrying value (cost, net of discounts or premiums) of the sold investment. Amounts reclassified out of Other comprehensive income (loss) during the periods ended December 31, 2014, and 2013 were insignificant. All of the marketable securities amounts are available to satisfy current obligations.
The amortized cost, gross unrealized gains, gross unrealized losses, and fair market value of available-for-sale investment securities by major security type and class of security at December 31, are as follows:
(In thousands) | Amortized Cost | Gross unrealized gains | Gross unrealized losses | Fair market value | ||||||||||||
2014 | ||||||||||||||||
Federal agency notes | $ | 143,132 | $ | 40 | $ | (33 | ) | $ | 143,139 | |||||||
Commercial paper | 108,371 | 1 | (257 | ) | 108,115 | |||||||||||
Mutual funds | 344 | 279 | — | 623 | ||||||||||||
Total | $ | 251,847 | $ | 320 | $ | (290 | ) | $ | 251,877 | |||||||
2013 | ||||||||||||||||
Federal agency notes | $ | 97,509 | $ | 76 | $ | — | $ | 97,585 | ||||||||
Commercial paper | 112,063 | 10 | (320 | ) | 111,753 | |||||||||||
Mutual funds | 359 | 245 | — | 604 | ||||||||||||
Total | $ | 209,931 | $ | 331 | $ | (320 | ) | $ | 209,942 | |||||||
The mutual funds included in the investment table above are included in Other noncurrent assets on the Company's Consolidated Balance Sheets.
The maturities of available-for-sale securities at December 31, 2014, are as follows:
(In thousands) | Amortized cost | Fair market value | ||||||
Federal agency notes | ||||||||
Due in one year or less | $ | 69,111 | $ | 69,151 | ||||
Due after one year through two years | 74,021 | 73,988 | ||||||
Total | $ | 143,132 | $ | 143,139 | ||||
Commercial paper | ||||||||
Due in one year or less | $ | 72,488 | $ | 72,450 | ||||
Due after one year through two years | 35,883 | 35,665 | ||||||
Total | $ | 108,371 | $ | 108,115 | ||||
The Company has long-term investments in several Canadian junior exploration companies, recorded on the balance sheet at cost. The Company determined that its long-term investments were other than temporarily impaired and recorded a loss of $0.1 million and $1.9 million for the years ended December 31, 2014, and 2013, respectively. At December 31, 2014, these long-term investments totaled $0.9 million and are recorded in Other noncurrent assets on the Company's Consolidated Balance Sheets.
97
NOTE 12
INVENTORIES
The Company carries items in its inventories at the lower of cost or market value. If market value in any period falls below the carrying value, the carrying value of the inventory item is reduced to its market value.
For purposes of inventory accounting, the market value of inventory is generally deemed equal to the Company’s current cost of replacing the inventory, provided that: (1) the market value of the inventory may not exceed the estimated selling price of such inventory in the ordinary course of business less reasonably predictable costs of completion and disposal, and (2) the market value may not be less than net realizable value reduced by an allowance for a normal profit margin. No reduction to inventory value was necessary during 2014 and 2013.
The costs of mined PGM inventories as of any date are determined based on combined production costs per ounce and include all inventoriable production costs, including direct labor, direct materials, depletion, depreciation and amortization and other overhead costs relating to mining and processing activities incurred as of such date. Costs are aggregated and averaged for mined material carried in inventory.
The costs of recycled PGM inventories as of any date are determined based on the acquisition cost of the recycled material and include all inventoriable processing costs, including direct labor, direct materials, depreciation and third-party refining costs which relate to the processing activities incurred as of such date. Costs incurred are allocated and tracked separately for each specific lot of recycling material.
Inventories reflected in the accompanying balance sheets at December 31, consisted of the following:
(In thousands) | 2014 | 2013 | ||||||
Metals inventory | ||||||||
Raw ore | $ | 4,984 | $ | 4,638 | ||||
Concentrate and in-process | 48,712 | 67,251 | ||||||
Finished goods | 49,885 | 60,100 | ||||||
$ | 103,581 | $ | 131,989 | |||||
Materials and supplies | 26,726 | 26,661 | ||||||
Total inventory | $ | 130,307 | $ | 158,650 | ||||
The Company also holds in its possession materials it processes on a toll basis for customers until the tolled material is transported to the third party refiner.
NOTE 13
EARNINGS PER COMMON SHARE
Basic earnings (loss) per share attributable to common stockholders is computed by dividing net earnings available to common stockholders by the weighted average number of common shares outstanding during the period. Diluted earnings (loss) per share attributable to common stockholders reflects the potential dilution that could occur if the Company’s dilutive outstanding stock options or nonvested shares were exercised or vested, the contingently issuable shares were issued and the Company’s convertible debt was converted. In calculating earnings per share attributable to common stockholders, reported consolidated net income (loss) attributable to common stockholders was adjusted for the interest expense, net of capitalized interest (including amortization expense of deferred debt fees), the related income tax effect and the income (loss) attributable to the noncontrolling interest, in computing basic and diluted earnings per share attributable to common stockholders. The Company currently has only one class of equity shares outstanding.
Outstanding options to purchase 34,259 and 121,569 weighted shares of common stock were excluded from the computation of diluted earnings per share attributable to common stockholders for 2014 and 2012, respectively, due to the average market price at the end of the period being lower than the exercise price, and therefore the effect would have been antidilutive.
98
Reconciliations showing the computation of basic and diluted shares and the related impact on income for the years ended December 31, 2014 and 2012 are shown in the following table:
Year Ended | Year Ended | |||||||||||||||||||||
December 31, 2014 | December 31, 2012 | |||||||||||||||||||||
(In thousands, except per share amounts) | Income (Numerator) | Weighted Average Shares (Denominator) | Per Share Amount | Income (Numerator) | Weighted Average Shares (Denominator) | Per Share Amount | ||||||||||||||||
Basic EPS | ||||||||||||||||||||||
Net income attributable to common stockholders | $ | 70,297 | 119,953 | $ | 0.59 | $ | 55,045 | 116,162 | $ | 0.47 | ||||||||||||
Effect of Dilutive Securities | ||||||||||||||||||||||
Stock options | — | 31 | — | 58 | ||||||||||||||||||
Nonvested shares | — | 53 | — | 762 | ||||||||||||||||||
Contingently issuable shares | — | 98 | — | — | ||||||||||||||||||
1.875% Convertible debentures, net of tax | — | 95 | 2,355 | 7,082 | ||||||||||||||||||
1.75% Convertible debentures, net of tax and capitalized interest | 16,613 | 36,003 | 2,774 | 7,377 | ||||||||||||||||||
Diluted EPS | ||||||||||||||||||||||
Net income attributable to common stockholders and assumed conversions | $ | 86,910 | 156,233 | $ | 0.56 | $ | 60,174 | 131,441 | $ | 0.46 | ||||||||||||
The Company made no adjustment in calculating earnings (loss) per share attributable to common stockholders, for the year ended December 31, 2013 because the Company reported a consolidated net loss attributable to common stockholders.
Potential dilutive common shares include those associated with outstanding stock options, restricted stock units, performance shares and convertible debentures. For periods in which the Company reports a net loss attributable to common stockholders, potential dilutive common shares are excluded, as their conversion and exercise would be anti-dilutive. For the year ended December 31, 2013, the Company reported a net loss attributable to common stockholders, resulting in all potentially dilutive shares being excluded from the computation of diluted weighted average shares.
NOTE 14
DEBT AND CAPITAL LEASE OBLIGATIONS
1.75% CONVERTIBLE DEBENTURES
In October 2012, the Company issued $396.75 million of 1.75% senior unsecured convertible debentures, due October 15, 2032. Each $1,000 principal amount of these 1.75% debentures is initially convertible, under certain circumstances and during certain periods, into 60.4961 shares (subject to customary anti-dilution adjustments) of the Company's common stock, which represents an initial conversion price of $16.53 per share. The 1.75% debentures also include an embedded conversion enhancement feature that is equivalent to including with each debenture a warrant initially exercisable for 30.2481 shares initially at $16.53 per share (also subject to customary anti-dilution adjustments). The Company, at its election, may settle conversions of the 1.75% debentures in cash, shares of its common stock or any combination of cash and shares of its common stock. Holders have the right to redeem their 1.75% debentures at face value plus accrued and unpaid interest on October 15, of each of 2019, 2024, 2029, and upon the occurrence of certain corporate events. The Company will have the right to call the 1.75% debentures at any time on or after October 20, 2019.
The 1.75% debentures were bifurcated under U.S. GAAP into separate debt and equity components, and reflect an effective maturity (to the first optional redemption date) of seven years. The residual amount of $141.6 million recorded in equity is treated for accounting purposes as additional debt discount and accreted as an additional non-cash interest charge to earnings over the expected life. Debt and equity issuance costs totaling approximately $12.4 million were deducted from the gross proceeds of the offering of the 1.75% debentures and the debt portion is being amortized ratably over seven years. Net proceeds of $384.3 million from the offering were used in part to retire $164.3 million of the Company's 1.875% convertible debentures upon their redemption in March 2013 with the remainder being used for general corporate purposes.
99
The 1.75% debentures have an effective interest rate of 8.50% and a stated interest rate of 1.75% with interest paid semi-annually. The balance outstanding for the year ended December 31, 2014, was $291.1 million, which is net of unamortized discount of $105.6 million.
Amortization of debt issuance costs related to the issuance of the 1.75% debentures was $1.1 million for the periods ended December 31, 2014 and 2013, and $0.2 million for the period ended December 31, 2012. Interest expense related to the 1.75% debentures was $19.4 million, $18.3 million and $4.5 million for the periods ended December 31, 2014, 2013, and 2012, respectively. The Company made $6.9 million in interest payments on the 1.75% debentures during each of the periods ended December 31, 2014 and 2013. The Company made no cash payments for the period ended December 31, 2012.
1.875% CONVERTIBLE DEBENTURES
Holders of the remaining $2.2 million of outstanding 1.875% debentures may require the Company to redeem their 1.875% debentures at face value on March 15, 2018 or March 15, 2023, or at any time before March 15, 2028 upon the occurrence of certain events including a change in control. Effective as of March 22, 2013, the Company has the right at its discretion to redeem the remaining $2.2 million of outstanding 1.875% debentures for cash at any time prior to maturity. The outstanding balance of $2.2 million is reported as a long-term debt obligation as of December 31, 2014.
There was no amortization expense related to the issuance costs of the 1.875% debentures for the year ended December 31, 2014. Amortization expense was $0.2 million and $0.9 million for the years ended December 31, 2013 and 2012, respectively. Interest expense on the 1.875% debentures was less than $0.1 million for the year ended December 31, 2014, $0.7 million for the year ended December 31, 2013 and $3.1 million for the year ended December 31, 2012. The Company made cash payments of less than $0.1 million for interest on the 1.875% debentures for the year ended December 31, 2014, and $1.6 million and $3.1 million for the years ended December 31, 2013 and 2012, respectively.
EXEMPT FACILITY REVENUE BONDS
During 2000, the Company completed a $30.0 million offering of Exempt Facility Revenue Bonds, Series 2000, through the State of Montana Board of Investments. The bonds were issued by the State of Montana Board of Investments to finance a portion of the costs of constructing and equipping certain sewage and solid waste disposal facilities at both the Stillwater Mine and the East Boulder Mine. The bonds mature on July 1, 2020, and have a stated interest rate of 8.00% with interest paid semi-annually. Net discounted proceeds from the offering were $28.7 million, yielding an effective interest rate of 8.57%.
The balance outstanding on these bonds at December 31, 2013, was $29.6 million, which was net of unamortized discount of $0.4 million. The Company made $1.2 million in regularly scheduled semi-annual cash interest payments on the revenue bonds during the year ended December 31, 2014 and $2.4 million in each of the years ended December 31, 2013 and 2012.
On July 7, 2014, the Company redeemed the entire $30.0 million of 8.0% Exempt Facility Revenue Bonds, Series 2000, which included accrued and unpaid interest of $40,000. The Company recognized approximately $0.8 million of debt retirement expense in 2014 associated with unamortized debt discount and origination fees related to these revenue bonds.
ASSET-BACKED REVOLVING CREDIT FACILITY
In December 2011, the Company signed a $100.0 million asset-backed revolving credit agreement, incurring debt issuance costs of $1.1 million. In January 2012, the Company completed the syndication of this facility and simultaneously expanded the maximum line of credit to $125.0 million, incurring additional debt issuance costs of $0.2 million. Borrowings under this working capital facility are limited to a borrowing base comprised of 85% of eligible accounts receivable and 70% of eligible inventories. Terms of the agreement state that the borrowings will be secured by the Company’s accounts receivable, metals inventories and other accounts. The asset-backed revolving credit facility includes a single fixed-charge coverage covenant that only takes effect when less than 30% of the total borrowing capacity under the line remains available. The facility also includes a $60.0 million letter of credit sub-facility. Outstanding borrowings under the facility accrue interest at a spread over the London Interbank Offer Rate that varies from 2.25% to 2.75%, decreasing progressively as the percentage drawn against the facility increases. The Company also pays an unused line fee on the committed but unutilized balance under the facility at a rate per annum of 0.375% or 0.5%, depending on utilization of the facility. The asset-backed revolving credit agreement contains a “change in control” provision which if triggered would constitute an event of default under the credit agreement. In July 2013, following the Company's 2013 election of directors that resulted in a change of control event, the Company was issued a waiver by the four banks that have provided commitments under the facility.
100
The Company recognized approximately $1.0 million in fees associated with the asset-backed revolving credit facility for the years ended December 31, 2014, and 2012. Fees in 2013 were approximately $1.1 million. Amortization expense related to the issuance costs of the credit agreement for each of the years ended December 31, 2014, 2013 and 2012 was approximately $0.3 million. At December 31, 2014, there was no drawn balance under this revolving credit facility, and approximately $18.1 million in undrawn irrevocable letters of credit have been issued under this facility as collateral for sureties.
CAPITAL LEASE OBLIGATIONS
The Company is party to a lease agreement with General Electric Capital Corporation (GECC) covering the acquisition of a tunnel-boring machine for use on the Blitz development adjacent to the Stillwater Mine. The transaction is structured as a capital lease with a four-year term maturing in 2016; lease payments are due quarterly in advance. The Company made cash payments of $2.2 million on its capital lease obligations for the year ended December 31, 2014. These cash payments included interest of $0.2 million. At December 31, 2014, the outstanding principal balance under the capital lease was $2.6 million.
The following is a schedule by year of the future minimum lease payments for the capital lease together with the present value of the net minimum lease payments:
Year ended December 31, 2014 (In thousands) | ||||
2015 | $ | 2,168 | ||
2016 | 590 | |||
Total minimum lease payments | $ | 2,758 | ||
Less interest at rates ranging from 5.21% to 5.46% (before-tax) | 111 | |||
Net minimum lease payments | $ | 2,647 | ||
Less current portion | 2,067 | |||
Total long-term capital lease obligation | $ | 580 | ||
CAPITALIZED INTEREST
The Company capitalizes interest incurred on its various debt instruments as a cost of specific and identified projects under development. For the years ended December 31, 2014, and 2013, the Company capitalized interest of $5.1 million and $4.8 million, respectively. Capitalized interest is recorded as a reduction to Interest expense in the Company's Consolidated Statements of Comprehensive Income (Loss).
101
NOTE 15
MINERAL PROPERTIES AND MINE DEVELOPMENT
Mineral properties and mine development at December 31, 2014, and 2013, consisted of the following:
(In thousands) | 2014 | 2013 | ||||||
Mineral Properties: | ||||||||
Montana, United States of America | ||||||||
Stillwater Mine | $ | 1,950 | $ | 1,950 | ||||
Ontario, Canada | ||||||||
Marathon properties | 55,332 | 55,332 | ||||||
San Juan, Argentina | ||||||||
Altar property | 101,970 | 101,970 | ||||||
Mine Development: | ||||||||
Montana, United States of America | ||||||||
Stillwater Mine | 616,872 | 532,480 | ||||||
East Boulder Mine | 204,483 | 179,263 | ||||||
$ | 980,607 | $ | 870,995 | |||||
Accumulated depletion and amortization | (411,601 | ) | (365,397 | ) | ||||
Total mineral properties and mine development, net | $ | 569,006 | $ | 505,598 | ||||
An impairment charge of $290.4 million (before-tax) was taken on the Altar mineral property in the third quarter of 2013, reflecting an estimated fair market value of $102.0 million. An impairment charge of $170.5 million (before-tax) was taken on the Marathon mineral properties and related mine development in the fourth quarter of 2013, reflecting an estimated fair market value of $55.3 million. See "Note 4 - Asset Impairment" for further information.
102
NOTE 16
PROPERTY, PLANT AND EQUIPMENT
Property, plant and equipment at December 31, consisted of the following:
(In thousands) | 2014 | 2013 | ||||||
Machinery and equipment | $ | 152,421 | $ | 138,351 | ||||
Buildings and structural components | 169,609 | 160,076 | ||||||
Land | 9,488 | 8,592 | ||||||
Construction-in-progress: | ||||||||
Stillwater Mine | 2,633 | 5,818 | ||||||
East Boulder Mine | 1,539 | 1,057 | ||||||
Marathon | 148 | 402 | ||||||
Processing facilities and other | 1,994 | 5,841 | ||||||
$ | 337,832 | $ | 320,137 | |||||
Accumulated depreciation | (218,951 | ) | (195,406 | ) | ||||
Total property, plant, and equipment, net | $ | 118,881 | $ | 124,731 | ||||
The Company’s capital outlay for the years ended December 31, was as follows:
(In thousands) | 2014 | 2013 | 2012 | |||||||||
Stillwater Mine | $ | 86,491 | $ | 83,548 | $ | 86,541 | ||||||
East Boulder Mine | 28,657 | 24,979 | 10,443 | |||||||||
Marathon project | — | 12,380 | 8,319 | |||||||||
Altar project | 45 | 101 | 18 | |||||||||
Other | 4,489 | 8,021 | 7,427 | |||||||||
Total capital outlay | $ | 119,682 | $ | 129,029 | $ | 112,748 | ||||||
Acquired by capital lease transactions | — | — | (677 | ) | ||||||||
Total cash paid | $ | 119,682 | $ | 129,029 | $ | 112,071 | ||||||
NOTE 17
ASSET RETIREMENT OBLIGATION
The following summary sets forth the annual changes to the Company’s asset retirement obligation in 2014, 2013 and 2012:
(In thousands) | Stillwater Mine | East Boulder Mine | Total | |||||||||
Balance at December 31, 2011 | $ | 6,794 | $ | 537 | $ | 7,331 | ||||||
Accretion expense | 587 | 47 | 634 | |||||||||
Balance at December 31, 2012 | $ | 7,381 | $ | 584 | $ | 7,965 | ||||||
Accretion expense | 639 | 50 | 689 | |||||||||
Balance at December 31, 2013 | $ | 8,020 | $ | 634 | $ | 8,654 | ||||||
Accretion expense | 700 | 47 | 747 | |||||||||
Balance at December 31, 2014 | $ | 8,720 | $ | 681 | $ | 9,401 | ||||||
No adjustments were made to the asset retirement obligations in 2014, 2013 and 2012. The Company estimates the mine life of the Stillwater Mine and the East Boulder Mine to the year 2033 and 2081, respectively.
103
At December 31, 2014, the Company had posted surety bonds with the State of Montana and the United States Forest Service in the amount of $37.8 million to satisfy the current financial guarantee requirements determined by the regulatory agencies. The final updated environmental impact statement (EIS) was completed during the second quarter of 2012 and the East Boulder financial guarantee was reviewed and revised in 2014. The Company is expecting the review process for the Stillwater Mine financial guarantee to extend through the first quarter of 2015 and anticipates these financial guarantee requirements may increase.
NOTE 18
FAIR VALUE MEASUREMENTS
Fair value is defined as the price that would be received to sell an asset or paid to transfer a liability (an exit price) in an orderly transaction between market participants. A three-level fair value hierarchy prioritizes the inputs used to measure fair value. This hierarchy requires an entity to maximize the use of observable inputs and minimize the use of unobservable inputs when measuring fair value. The classification of each financial asset or liability within the hierarchy is determined based on the lowest level input that is significant to the fair value measurement. The three levels of inputs used to measure fair value are as follows:
• | Level 1 – Quoted prices in active markets for identical assets or liabilities. |
• | Level 2 – Observable inputs other than quoted prices included in Level 1, such as quoted prices for similar assets and liabilities in active markets; quoted prices for identical or similar assets and liabilities in markets that are not active; or inputs that are observable or can be corroborated by observable market data. |
• | Level 3 – Unobservable inputs that are supported by little or no market activity and are significant to the fair value of the assets or liabilities. |
Financial assets and liabilities measured at fair value on a recurring basis at December 31, 2014, and 2013 consisted of the following:
(In thousands) | Fair Value Measurements | |||||||||||||||
At December 31, 2014 | Total | Level 1 | Level 2 | Level 3 | ||||||||||||
Mutual funds | $ | 623 | $ | 623 | $ | — | $ | — | ||||||||
Investments | ||||||||||||||||
Federal agency notes | $ | 143,139 | $ | — | $ | 143,139 | $ | — | ||||||||
Commercial paper | $ | 108,115 | $ | — | $ | 108,115 | $ | — | ||||||||
(In thousands) | Fair Value Measurements | |||||||||||||||
At December 31, 2013 | Total | Level 1 | Level 2 | Level 3 | ||||||||||||
Mutual funds | $ | 604 | $ | 604 | $ | — | $ | — | ||||||||
Investments | ||||||||||||||||
Federal agency notes | $ | 97,585 | $ | — | $ | 97,585 | $ | — | ||||||||
Commercial paper | $ | 111,753 | $ | — | $ | 111,753 | $ | — | ||||||||
The fair value of the mutual funds is based on market prices which are readily available and are recorded in Other noncurrent assets on the Company's Consolidated Balance Sheets. The balance of the money market fund at December 31, 2014 and 2013 is $120.0 million and $161.2 million, respectively and is classified as Level 1. The money market fund is recorded in Cash and cash equivalents on the Company's Consolidated Balance Sheets. The fair value of the investments is valued indirectly using observable data, quoted prices for similar assets or liabilities in active markets. Unrealized gains or losses on mutual funds and investments are recorded in Accumulated other comprehensive income on the Company's Consolidated Balance Sheets.
104
Assets and liabilities measured at fair value on a nonrecurring basis at December 31, 2014, and 2013 consisted of the following:
(In thousands) | Fair Value Measurements | |||||||||||||||
At December 31, 2014 | Total | Level 1 | Level 2 | Level 3 | ||||||||||||
Certain Marathon real estate properties | $ | 754 | $ | — | $ | — | $ | 754 | ||||||||
1.875 % Convertible debentures | $ | 2,245 | $ | — | $ | 2,245 | $ | — | ||||||||
1.75% Convertible debentures | $ | 303,108 | $ | — | $ | 303,108 | $ | — | ||||||||
Long-term investments | $ | 896 | $ | 896 | $ | — | $ | — | ||||||||
(In thousands) | Fair Value Measurements | |||||||||||||||
At December 31, 2013 | Total | Level 1 | Level 2 | Level 3 | ||||||||||||
Marathon mineral properties and property, plant and equipment | $ | 57,272 | $ | — | $ | — | $ | 57,272 | ||||||||
1.875% Convertible debentures | $ | 2,245 | $ | — | $ | 2,245 | $ | — | ||||||||
1.75% Convertible debentures | $ | 308,574 | $ | — | $ | 308,574 | $ | — | ||||||||
Exempt facility industrial revenue bonds | $ | 30,050 | $ | — | $ | — | $ | 30,050 | ||||||||
Long-term investments | $ | 1,021 | $ | 1,021 | $ | — | $ | — | ||||||||
The Company determined at December 31, 2014, that certain real estate properties owned by the Company in the town of Marathon should be considered for impairment. The Company obtained an estimate of fair value and has impaired those properties. See "Note 4 - Asset Impairment" for further information.
The Company determined the fair value of the liability component of its $396.75 million of outstanding 1.75% debentures at December 31, 2014 and December 31, 2013, by using observable market based information for debt instruments of similar amounts and duration. The Company used its current trading data to determine the fair value of its outstanding 1.875% convertible debentures at December 31, 2014 and 2013.
The carrying value of the Company’s Marathon assets (mineral properties and property, plant and equipment) in northern Ontario, Canada at December 31, 2013, was $228.6 million. An impairment charge of $171.4 million (before-tax) was taken on the Marathon assets in the fourth quarter of 2013 reflecting an estimated fair market value for the Marathon assets of $57.3 million. The impairment charge was included in earnings for the period.
The Company used implicit interest rates of comparable unsecured obligations to calculate the fair value of the Company’s $30.0 million, 8% Series 2000 exempt facility industrial revenue bonds at December 31, 2013.
The fair value of the Company's long-term investments in certain Canadian junior exploration companies at December 31, 2014, and 2013 is based on quoted market prices which are readily available. The fair market value of the Marathon mineral properties as of December 31, 2013, was based on comparable transactions for similar development stage mineral properties and market multiples for similar projects. The fair market value of the Company's Altar mineral property was remeasured at the end of the third quarter of 2013 based on Level 3 inputs such as comparable transactions for similar undeveloped mineral properties and market multiples for similar projects.
NOTE 19
RELATED PARTIES
Mitsubishi Corporation owns a 25% interest in the Company's previously wholly-owned subsidiary, Stillwater Canada Inc (SCI) which owns the Marathon PGM-copper project and related properties located in northern Ontario, Canada. The Company made PGM sales of $141.7 million, $296.6 million and $206.4 million to Mitsubishi Corporation in 2014, 2013 and 2012, respectively.
105
NOTE 20
COMMITMENTS AND CONTINGENCIES
The Company manages risk through insurance coverage, credit monitoring and diversification of suppliers and customers. The Company also seeks to maintain adequate liquidity to offset the risk of pricing cycles.
REFINING AGREEMENT AND SUPPLY AGREEMENT
Under the terms of the Company’s agreements with Johnson Matthey, the Company utilizes Johnson Matthey for all of its precious metals refining services. In addition, with the exception of certain pre-existing platinum sales commitments to Tiffany & Co., all of the Company’s current mined palladium and platinum is committed for sale to Johnson Matthey.
This significant concentration of business with Johnson Matthey could leave the Company without precious metal refining services should Johnson Matthey experience significant financial or operating difficulties during the contract period. Under such circumstances, it is not clear that sufficient alternate processing capacity would be available to cover the Company’s requirements, nor that the terms of any such alternate processing arrangements as might be available would be financially acceptable to the Company. Any such disruption in refining services would have a negative effect on the Company’s ability to generate revenues, profits, and cash flows.
OPERATING LEASES
The Company has operating leases for various mining equipment, office equipment and office space expiring at various dates through August 30, 2017. Total rental expense for cancelable and non-cancelable operating leases was $2.0 million, $2.3 million and $2.4 million in 2014, 2013 and 2012, respectively. Future minimum lease payments for operating leases with terms in excess of one year are as follows:
Year ended (In thousands) | Minimum Lease Payment | |||
2015 | $ | 373 | ||
2016 | 146 | |||
2017 | 130 | |||
Total | $ | 649 | ||
SIGNIFICANT CUSTOMERS
Total sales to significant customers as a percentage of total revenues for the years ended December 31, were as follows:
2014(1) | 2013(1) | 2012(1) | ||||||
Customer A | 51 | % | 14 | % | 17 | % | ||
Customer B | 15 | % | 29 | % | 26 | % | ||
Customer C | — | 14 | % | — | ||||
Customer D | — | 12 | % | 18 | % | |||
Customer E | — | — | 10 | % | ||||
66 | % | 69 | % | 71 | % | |||
(1) The “—” symbol represents less than 10% of total revenues
LABOR UNION CONTRACTS
At December 31, 2014, the Company had approximately 57% and 20% of its active labor force covered by collective bargaining agreements expiring on June 1, 2015 and December 31, 2015, respectively.
LEGAL PROCEEDINGS
The Company is involved in various claims and legal actions arising in the ordinary course of business, primarily employee lawsuits. In the opinion of management, the ultimate disposition of these matters is not expected to have a material adverse effect on the Company’s consolidated financial position, results of operations or liquidity.
106
NOTE 21
QUARTERLY DATA (UNAUDITED)
Quarterly earnings data for the years ended December 31, 2014, and 2013 were as follows:
(In thousands, except per share data) | 2014 Quarter Ended | |||||||||||||||
March 31 | June 30 | September 30 | December 31 | |||||||||||||
Revenue * | $ | 219,499 | $ | 249,887 | $ | 252,066 | $ | 222,167 | ||||||||
Depletion, depreciation and amortization | $ | 15,151 | $ | 17,802 | $ | 17,181 | $ | 17,272 | ||||||||
Operating income | $ | 24,977 | $ | 27,484 | $ | 26,758 | $ | 18,948 | ||||||||
Net income | $ | 19,039 | $ | 17,658 | $ | 17,835 | $ | 14,351 | ||||||||
Comprehensive income attributable to common stockholders | $ | 19,535 | $ | 18,073 | $ | 17,965 | $ | 14,735 | ||||||||
Basic earnings per share attributable to common stockholders * | $ | 0.16 | $ | 0.15 | $ | 0.15 | $ | 0.12 | ||||||||
Diluted earnings per share attributable to common stockholders * | $ | 0.15 | $ | 0.14 | $ | 0.14 | $ | 0.12 | ||||||||
* The amounts in the table above do not equal the year-to-date amounts due to the impact of rounding.
(In thousands, except per share data) | 2013 Quarter Ended | |||||||||||||||
March 31 | June 30 | September 30 | December 31 | |||||||||||||
Revenue | $ | 250,648 | $ | 266,491 | $ | 280,007 | $ | 242,360 | ||||||||
Depletion, depreciation and amortization | $ | 15,283 | $ | 14,003 | $ | 15,342 | $ | 14,689 | ||||||||
Operating income (loss) | $ | 19,224 | $ | (4,292 | ) | $ | (258,456 | ) | $ | (153,099 | ) | |||||
Net income (loss) | $ | 14,304 | $ | (5,657 | ) | $ | (201,984 | ) | $ | (108,736 | ) | |||||
Comprehensive income (loss) attributable to common stockholders | $ | 14,657 | $ | (5,313 | ) | $ | (201,276 | ) | $ | (78,169 | ) | |||||
Basic earnings (loss) per share attributable to common stockholders * | $ | 0.12 | $ | (0.04 | ) | $ | (1.69 | ) | $ | (0.65 | ) | |||||
Diluted earnings (loss) per share attributable to common stockholders * | $ | 0.12 | $ | (0.04 | ) | $ | (1.69 | ) | $ | (0.65 | ) | |||||
* The amounts in the table above do not equal the year-to-date amounts due to the impact of rounding.
107
ITEM 9A
CONTROLS AND PROCEDURES
(a) | Disclosure Controls and Procedures. |
The Company’s management, with the participation of the Company’s Chief Executive Officer and Chief Financial Officer, has evaluated the effectiveness of the Company’s disclosure controls and procedures (as such term is defined in Rules 13a-15(e) and 15d-15(e) under the Exchange Act), as of the end of the period covered by this report. Based on such evaluation, the Company’s Chief Executive Officer and Chief Financial Officer have concluded that, as of the end of such period, the Company’s disclosure controls and procedures are effective in recording, processing, summarizing and reporting, on a timely basis, information required to be disclosed by the Company in the reports that it files or submits under the Exchange Act.
(b) | Changes in Internal Control Over Financial Reporting. |
In evaluating the registrant’s internal control over financial reporting, as required by Rules 13a-15(d) and 15d-15(d) of the Exchange Act, for the year ended December 31, 2014, management determined that during the fourth quarter of 2014 there were no changes to the registrant's internal control over financial reporting (as such term is defined in Rules 13a-15(f) and 15d-15(f) of the Exchange Act) that have materially affected, or are reasonably likely to materially affect, the registrant's internal control over financial reporting.
(c) | Internal Control Over Financial Reporting. |
The Company, under the supervision and with the participation of the Company’s Chief Executive Officer and Chief Financial Officer, has conducted an evaluation of the effectiveness of its internal control over financial reporting as of December 31, 2014, and has concluded that, as of December 31, 2014, the Company’s internal control over financial reporting was effective.
The Company’s independent registered public accounting firm has issued an audit opinion on the effectiveness of the Company’s internal control over financial reporting. This report appears within Item 8 of this Annual Report on Form 10-K.
MANAGEMENT’S REPORT ON INTERNAL CONTROL OVER FINANCIAL REPORTING
The Company's management is responsible for establishing and maintaining adequate internal control over financial reporting, as such term is defined in Rule 13a-15(f) of the Exchange Act. Under the supervision and with the participation of the Company's management, including the Chief Executive Officer and Chief Financial Officer, the Company conducted an evaluation of the effectiveness of its internal control over financial reporting based upon the framework in Internal Control Integrated Framework (1992) issued by the Committee of Sponsoring Organizations of the Treadway Commission (COSO). Based on that evaluation, management concluded that the Company's internal control over financial reporting is effective, as of December 31, 2014.
PART III
ITEM 10
DIRECTORS, EXECUTIVE OFFICERS AND CORPORATE GOVERNANCE
With regard to directors and corporate governance, reference is made to the information set forth under the caption “Nominees for Election” in the Company’s Proxy Statement for the 2015 Annual Meeting of Stockholders to be filed pursuant to Regulation 14A, within 120 days from December 31, 2014, which information is incorporated herein by reference.
EXECUTIVE OFFICERS
Set forth below is certain information concerning the individuals who were executive officers of the Company as of December 31, 2014.
Name | Age | Position | ||
Michael J. McMullen | 44 | President and Chief Executive Officer | ||
Christopher M. Bateman | 50 | Chief Financial Officer | ||
Kristen K. Koss | 59 | Vice President of Safety, Health and Human Resources | ||
Brent R. Wadman | 42 | Vice President of Legal Affairs and Corporate Secretary | ||
108
The following are brief biographies of the Company’s executive officers:
Michael J. McMullen (age 44) is currently President and Chief Executive Officer of the Company effective December 3, 2013. On May 7, 2013, Mr. McMullen was elected to the Company’s Board of Directors where he currently serves on the Health, Safety and Environment Committee and the Technical and Ore Reserve Committee. Prior to these appointments with the Company Mr. McMullen served as a Principal at MRI Advisory AG. and as Executive Chairman of Nevada Iron Limited. In 2007, he became Executive Chairman of Lachlan Star Limited, a post he held until January 2014. Lachlan Star Limited announced the appointment of voluntary insolvency administrators in February 2015. Also, in 2007, Mr. McMullen formed Northern Iron Limited, which developed an iron ore mine in Norway and served as Managing Director from April 2007 to November 2009 and as President of Northern Iron Marketing AG until June 2010. From August 2005 to January 2006, he was Audit Manager at RSG Global Consulting Pty Ltd, a mining consultancy firm and in January 2006 Mr. McMullen became a Partner of the firm, a position he held until August 2007. From September 2002 to August 2005, he was Technical Director of Tritton Resources Limited. Mr. McMullen also served as Executive Technical Director of Lafayette Mining Limited from November 1998 to September 2002 and as Exploration Manager of Spinifex Gold Ltd. (Asia), from February 1997 to November 1998. He currently serves on the Board of Directors of Nevada Iron Limited. Mr. McMullen holds a Bachelor of Science degree in Geology from Newcastle University in New South Wales and pursued graduate studies in Mineral Economics at Western Australian School of Mines.
Christopher M. Bateman (age 50) was appointed Chief Financial Officer of the Company on December 1, 2014. Mr. Bateman served as the Chief Financial Officer of Turquoise Hill Resources, from 2012 to 2014. Prior to his appointment at Turquoise Hill Resources, he was Chief Financial and Business Development Officer of Rio Tinto Diamonds and Minerals from 2010 to 2012. From 2006 to 2009, Mr. Bateman served as Chief Financial Officer of Energy Resources of Australia Ltd. From 2003 to 2006, he held commercial and operational roles at Rio Tinto's Kennecott Utah Copper operations. Mr. Bateman also held the positions of Financial Planning and Analysis Director and Information Technology Director at Kaiser Aluminum. In addition, he spent eight years at Arthur Andersen's business consulting practice and qualified as a Chartered Accountant in England and in Wales in 1992. Mr. Bateman earned an Engineering degree in Production Engineering and Production Management from the University of Nottingham in Nottingham, United Kingdom.
Kristen K. Koss (age 59) is currently Vice President of Safety, Health and Human Resources, effective August 4, 2010. In January of 2008, Ms. Koss was promoted to the position of Corporate Safety Director. Since joining the Company in 1995, Ms. Koss has managed the Human Resources Departments at both mine sites, in addition to establishing a Central Recruiting function in Columbus to meet the hiring needs of the organization. Ms. Koss has over 25 years of experience in Human Resources and Benefits. During her career she has served on numerous committees, including the Montana Hard Rock Mining Impact Board and the National Mining Association Safety and Health Committee. Prior to joining Stillwater, Ms. Koss held various positions in Human Resources at Marathon Electric Manufacturing Corporation and Interstate Warehousing.
Brent R. Wadman (age 42) is currently the Vice President of Legal Affairs and Corporate Secretary, effective August 6, 2013. Mr. Wadman joined the Company in November 2010. Prior to joining the Company, he served as Senior Counsel at Combat Support Associates, a U.S. defense contractor in Kuwait City, Kuwait, and Deputy General Counsel at infoGroup Inc., a publicly traded, direct marketing company. Mr. Wadman has more than 15 years of broad legal experience. He currently supervises SEC compliance, international transactions, and corporate governance functions. Earlier in his career he worked as a trial attorney. Mr. Wadman received his Bachelor of Arts degree in Anthropology from the University of North Carolina and a Juris Doctorate from the University of Tulsa.
For information concerning the Company’s executive officers, reference is made to the information set forth under the caption “Section 16(a) Beneficial Ownership Compliance” in the Company’s Proxy Statement for the 2015 Annual Meeting of Stockholders to be filed pursuant to Regulation 14A, within 120 days from December 31, 2014, which information is incorporated herein by reference.
AUDIT COMMITTEE FINANCIAL EXPERT
Federal regulations and New York Stock Exchange (NYSE) listing requirements require the board to determine if a member of its audit committee is an “audit committee financial expert”. According to these requirements, an audit committee member can be designated an audit committee financial expert only when the audit committee member satisfies five specified qualification requirements, such as experience (or “experience actively supervising” others engaged) in preparing, auditing, analyzing, or evaluating financial statements presenting a level of accounting complexity comparable to what is encountered in connection with the Company’s financial statements. The regulations further require such qualifications to have been acquired through specified means of experience or education. The Board has designated Michael S. Parrett as an audit committee financial expert. Mr. Parrett meets the independence standards for audit committee members under the NYSE Listed Company and SEC rules.
109
CODE OF ETHICS
The Company’s code of ethics requires honest and ethical conduct; avoidance of conflicts of interest; compliance with applicable governmental laws, rules and regulations; full, fair, accurate, timely, and understandable disclosure in reports and documents filed with the SEC and in other public communications made; and accountability for adherence to the code. The code of ethics can be accessed under the Governance tab on the Company’s internet website at www.stillwatermining.com. Printed copies will be provided upon request.
CORPORATE GOVERNANCE
The Company’s corporate governance principles, corporate governance and nominating committee charter, compensation committee charter and audit committee charter can be accessed via the Governance tab on the Company’s internet website at www.stillwatermining.com.
NYSE CEO CERTIFICATION
Pursuant to Section 303A.12(a) of the NYSE Listed Company Manual, the Company’s chief executive officer submitted a certification, dated June 2, 2014, affirming that to his knowledge, as of such date, the Company was not in violation of any NYSE listing standards.
ITEM 11
EXECUTIVE COMPENSATION
Reference is made to the information to be set forth under the caption “Executive Compensation” in the Company’s Proxy Statement for the 2015 Annual Meeting of Stockholders to be filed pursuant to Regulation 14A, within 120 days from December 31, 2014, which information is incorporated herein by reference.
ITEM 12
SECURITY OWNERSHIP OF CERTAIN BENEFICIAL
OWNERS AND MANAGEMENT AND RELATED STOCKHOLDERS MATTERS
Reference is made to the information to be set forth under the caption “Security Ownership of Principal Stockholders and Management” in the Company’s Proxy Statement for the 2015 Annual Meeting of Stockholders to be filed pursuant to Regulation 14A, within 120 days from December 31, 2014, which information is incorporated herein by reference.
ITEM 13
CERTAIN RELATIONSHIPS AND RELATED TRANSACTIONS, AND DIRECTOR INDEPENDENCE
Reference is made to the information to be set forth under the caption “Certain Relationships and Related Transactions and Director Independence” in the Company’s Proxy Statement for the 2015 Annual Meeting of Stockholders to be filed pursuant to Regulation 14A, within 120 days from December 31, 2014, which information is incorporated herein by reference.
ITEM 14
PRINCIPAL ACCOUNTING FEES AND SERVICES
Reference is made to the information to be set forth under the caption “Principal Accounting Fees and Services” in the Company’s Proxy Statement for the 2015 Annual Meeting of Stockholders to be filed pursuant to Regulation 14A, within 120 days from December 31, 2014, which information is incorporated herein by reference.
110
PART IV
ITEM 15
EXHIBITS, FINANCIAL STATEMENT SCHEDULES
(a) Documents filed as part of this Form 10-K
1. Financial Statements and Supplementary Data
2. Financial Statement Schedules (not applicable)
(b) See Exhibit Index below
(c) Not applicable
111
EXHIBITS
Number | Description | |
2.1 | Exchange Agreement for 10,000 shares of common stock, dated October 1, 1993 (incorporated by reference to Exhibit 2.1 to the Registrant’s Registration Statement on Form S-1 (File No. 33-85904) as declared effective by the Commission on December 15, 1994 (the “1994 S-1”)). | |
3.1 | Restated Certificate of Incorporation of Stillwater Mining Company, dated October 23, 2003 (incorporated by reference to Exhibit 3.1 to the Registrant’s Form 10-Q for the quarterly period ended September 30, 2003, filed on October 27, 2003). | |
3.2 | Amended and Restated By-Laws of Stillwater Mining Company, as amended, dated May 21, 2013 (filed as Exhibit 3.2 to the Registrant's Current Report on Form 8-K filed on May 22, 2013, and incorporated herein by reference). | |
4.01 | Form of 1.875% Convertible Senior Notes due 2028 (incorporated by reference to Exhibit 4.2 to the Registrant’s Form 8-K, dated March 14, 2008). | |
4.02 | First Supplemental Indenture between Stillwater Mining Company and Law Debenture Trust Company of New York dated October 17, 2012 (incorporated by reference to Exhibit 4.1 to the Registrant's Form 8-K filed on October 17, 2012). | |
4.03 | Form of 1.75% Convertible Senior Notes due 2032 (incorporated by reference to Exhibit 4.2 to the Registrant's Form 8-K filed on October 17, 2012). | |
10.1 | Credit Agreement by and among Wells Fargo Capital Finance, LLC, and Stillwater Mining Company (incorporated by reference to Exhibit 10.1 of the Registrant’s Form 8-K, dated December 29, 2011). | |
10.2 | First Amendment Agreement between Stillwater Mining Company and Wells Fargo Capital Finance LLC, dated January 13, 2012 (incorporated by reference to Exhibit 10.1 to the Registrant’s Form 8-K filed on January 18, 2012). | |
10.3 | Conveyance of Royalty Interest and Agreement between Stillwater Mining Company and Manville Mining Company, dated October 1, 1993 (incorporated by reference to Exhibit 10.9 to the Registrant’s 1994 S-1). | |
10.7 | Executive Employment Agreement between Stillwater Mining Company and Ms. Kristen K. Koss, dated March 6, 2014 (incorporated by reference to Exhibit 10.1 to the Registrant's Form 8-K filed on March 12, 2014). | |
10.8 | Executive Employment Agreement between Stillwater Mining Company and Mr. Brent R. Wadman, dated March 6, 2014 (incorporated by reference to Exhibit 10.3 to the Registrant's Form 8-K filed on March 12, 2014). | |
10.17 | Employment Agreement between Terrell I. Ackerman and Stillwater Mining Company, dated May 8, 2002 (incorporated by reference to Exhibit 10.34 of the Registrant’s 2002 10-K). | |
10.18 | Amended and Restated General Employee Stock Plan, dated October 23, 2003 (incorporated by reference to Exhibit 10.1 to the Registrant’s Form 10-Q for the quarterly period ended September 30, 2003). | |
10.24 | Employment Agreement between Gregory A. Wing and Stillwater Mining Company, dated as of March 22, 2004 (incorporated by reference to Exhibit 10.40 to the Registrant’s Form 10-K filed on March 15, 2004). | |
10.25 | Executive Employment Agreement between Michael J. McMullen and Stillwater Mining Company, dated as of December 3, 2013 (incorporated by reference to Exhibit 10.1 to the Registrant’s Form 8-K filed on December 6, 2013). | |
10.26 | Side letter to the Executive Employment Agreement between Michael J. McMullen and Stillwater Mining Company, dated as of December 3, 2013 (incorporated by reference to Exhibit 10.2 to the Registrant’s Form 8-K filed on December 6, 2013). | |
10.34 | 409A Nonqualified Deferred Compensation Plan, (incorporated by reference to Exhibit 10.34 to the Registrant’s Form 10-K filed on March 16, 2006). | |
10.35 | 2004 Equity Incentive Plan (incorporated by reference to Appendix A to the Registrant’s Proxy statement, dated April 29, 2004). | |
10.36 | 409A Non-Employee Directors Deferred Compensation Plan (incorporated by reference to Exhibit 10.1 to the Registrant’s Form-8K dated May 9, 2005). | |
10.37 | 2012 Equity Incentive Plan (incorporated by reference to Appendix A to the Registrant’s Proxy statement, dated March 23, 2012). | |
112
Number | Description | |
10.39 | Articles of Agreement between Stillwater Mining Company (Stillwater Mine & Mill, and the Processing and Warehouse facilities) and United Steel Workers (USW) Local 11-0001, ratified July 9, 2011 (incorporated by reference to Exhibit 10.1 to the Registrant’s Form 10-Q filed on August 3, 2011). | |
10.44 | Articles of Agreement between Stillwater Mining Company East Boulder Operation and United Steel Workers International Union, Local 11-001, East Boulder Unit, dated January 1, 2012 (incorporated by reference to Exhibit 99.1 to the Registrant’s Form 8-K filed on April 5, 2012). | |
10.47 | Indenture, dated as of March 12, 2008, among Stillwater Mining Company, Law Debenture Trust Company of New York, and Deutsche Bank Trust Company Americas (incorporated by reference to Exhibit 4.1 to the Registrant's Form 8-K, dated March 14, 2008). | |
10.53 | Severance and General Release Agreement between Kevin Shiell and Stillwater Mining Company, dated April 15, 2014 (incorporated by reference to Exhibit 99.1 of the Registrant's Form 8-K filed on May 6, 2014). | |
10.55 | Amendment to Employment Agreement between Gregory A. Wing and Stillwater Mining Company, dated November 3, 2010 (incorporated by reference to Exhibit 10.55 to the Registrant's Form 10-K filed on February 22, 2011). | |
10.56 | Amendment to Employment Agreement between Terrell I. Ackerman and Stillwater Mining Company, dated November 3, 2010 (incorporated by reference to Exhibit 10.56 to the Registrant's Form 10-K filed on February 22, 2011). | |
10.58 | Second Amendment Agreement between Stillwater Mining Company and Wells Fargo Capital Finance, LLC, dated May 29, 2012 (incorporated by reference to the Registrant's Form 8-K filed on October 12, 2012). | |
10.67 | Independent Director Deferred Share Unit Plan (incorporated by reference to Exhibit 10.1 to the Registrant's Form 8-K dated August 13, 2014). | |
10.68 | Master Goods and Services Agreement between Stillwater Mining Company and Johnson Matthey Inc. effective July 1, 2014 (portions of the agreement have been omitted pursuant to a confidential treatment request) (incorporated by reference to Exhibit 10.2 to the Registrant's Form 10-Q filed on November 5, 2014). | |
10.69 | Precious Metals Supply Agreement between Stillwater Mining Company and Johnson Matthey Inc. effective July 1, 2014 (portions of the agreement have been omitted pursuant to a confidential treatment request) (incorporated by reference to Exhibit 10.3 to the Registrant's Form 10-Q filed on November 5, 2014). | |
10.70 | Severance and General Release Agreement between Terrell I. Ackerman and Stillwater Mining Company, dated October 13, 2014 (incorporated by reference to Exhibit 99.1 of the Registrant's Form 8-K filed on November 24, 2014). | |
10.71 | Severance and General Release Agreement between Gregory A. Wing and Stillwater Mining Company, dated December 1, 2014 (incorporated by reference to Exhibit 10.1 of the Registrant's Form 8-K/A filed on December 12, 2014). | |
10.72 | Executive Employment Agreement between Christopher M. Bateman and Stillwater Mining Company, dated November 13, 2014 (incorporated by reference to Exhibit 10.2 to the Registrant’s Form 8-K/A filed on December 12, 2014). | |
10.73 | Third Amended and Restated Secondary Materials Processing Agreement dated effective November 1, 2013, by and between Stillwater Mining Company and Power Mount Incorporated (incorporated by reference to Exhibit 10.65 of the Registrant's Form 10-K / A filed on March 5, 2014). | |
10.74 | First Amendment to the Stillwater Mining Company 2012 Equity Incentive Plan (incorporated by reference to Exhibit 10.66 of the Registrant's Form 10-K / A filed on March 5, 2014). | |
18.1 | Preferability letter from KPMG LLP dated March 30, 2005 (incorporated by reference to Exhibit 18.1 to the Registrant's Form 10-K filed on March 31, 2005). | |
18.2 | Preferability letter from KPMG LLP dated May 5, 2010 (incorporated by reference to Exhibit 18.1 to the Registrant’s Form 10-Q filed on May 5, 2010). | |
21.1 | List of Subsidiaries pursuant to Item 601(b)(21)(ii) of Regulation S-K (filed herewith). | |
23.1 | Consent of KPMG LLP, Independent Registered Public Accounting Firm (filed herewith). | |
23.2 | Consent of Behre Dolbear & Company, Inc., (filed herewith). | |
113
Number | Description | |
31.1 | Certification of Chief Executive Officer pursuant to Section 302 of the Sarbanes - Oxley Act of 2002 (filed herewith). | |
31.2 | Certification of Chief Financial Officer pursuant to Section 302 of the Sarbanes - Oxley Act of 2002 (filed herewith). | |
32.1 | Section 1350 Certification (filed herewith). | |
32.2 | Section 1350 Certification (filed herewith). | |
95.0 | Mine Safety Disclosures | |
101.INS | XBRL Instance | |
101.SCH | XBRL Taxonomy Extension Schema | |
101.CAL | XBRL Taxonomy Extension Calculation | |
101.DEF | XBRL Taxonomy Extension Definition | |
101.LAB | XBRL Taxonomy Extension Labels | |
101.PRE | XBRL Taxonomy Extension Presentation | |
114
SIGNATURES
Pursuant to the requirements of Section 13 or 15(d) of the Securities Exchange Act of 1934, the Registrant has duly caused this report to be signed on its behalf by the undersigned, thereunto duly authorized.
STILLWATER MINING COMPANY | |||||
(“Registrant”) | |||||
Dated: | February 20, 2015 | By: | /s/ Michael J. McMullen | ||
Michael J. McMullen | |||||
President and Chief Executive Officer | |||||
Pursuant to the requirements of the Securities Exchange Act of 1934, this report has been signed below by the following persons on behalf of the registrant and in the capacities and on the dates indicated.
Signature | Title | Date | ||
/s/ Michael J. McMullen | President, Chief Executive Officer and Director | February 20, 2015 | ||
Michael J. McMullen | (Principal Executive Officer) | |||
/s/ Christopher M. Bateman | Chief Financial Officer | February 20, 2015 | ||
Christopher M. Bateman | (Principal Financial and Accounting Officer) | |||
/s/ Brian Schweitzer | Chairman of the Board | February 20, 2015 | ||
Brian Schweitzer | ||||
/s/ George M. Bee | Director | February 20, 2015 | ||
George M. Bee | ||||
/s/ Patrice E. Merrin | Director | February 20, 2015 | ||
Patrice E. Merrin | ||||
/s/ Michael S. Parrett | Director | February 20, 2015 | ||
Michael S. Parrett | ||||
/s/ Gary A. Sugar | Director | February 20, 2015 | ||
Gary A. Sugar | ||||
115