Attached files
Exhibit 13
| TABLE OF CONTENTS | ||
| TABLE OF CONTENTS | ||
| 22 | Management’s Discussion & Analysis | |
| 50 | Management Report on Internal Control Over Financial Reporting | |
| 51 | Reports of Independent Registered Public Accounting Firm | |
| 53 | Consolidated Statements of Operations | |
| 53 | Consolidated Statements of Comprehensive Income | |
| 54 | Consolidated Balance Sheets | |
| 55 | Consolidated Statements of Cash Flows | |
| 56 | Consolidated Statements of Shareholders’ Equity | |
| 57 | Notes to Consolidated Financial Statements | |
| 91 | Selected Financial Data | |
| 91 | Performance Graph | |
| 92 | Principal Operating Units | |
| 93 | Corporate Information | |
| 22 |
MANAGEMENT’S DISCUSSION & ANALYSIS OF FINANCIAL CONDITION AND RESULTS OF OPERATIONS
BUSINESS OVERVIEW
ManpowerGroup Inc. is a world leader in innovative workforce solutions and services. Our global network of 3,000 offices in 80 countries and territories allows us to meet the needs of our global, multinational and local clients across all major industry segments. We develop solutions that drive organizations forward, accelerate individual success and help build more sustainable communities. We power the world of work.
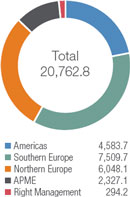
2014 Segment
Revenues
($ in millions)
Revenues
($ in millions)
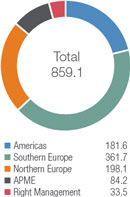
2014 Segment
Operating Unit Profit
($ in millions)
Operating Unit Profit
($ in millions)
By offering a comprehensive range of workforce solutions and services, we help companies at varying stages in their evolution increase productivity, improve strategy, quality and efficiency, and reduce costs across their workforce to achieve their business goals. ManpowerGroup’s suite of innovative workforce solutions and services includes:
| · | Recruitment and Assessment — By leveraging our trusted brand, industry knowledge and expertise, we identify the right talent in the right place to help our clients quickly access the people they need when they need them. Through our industry-leading assessments, we gain a deeper understanding of the people we serve to correctly identify candidates’ potential, resulting in a better cultural match. |
| · | Training and Development — Our unique insights into evolving employer needs and our expertise in training and development help us prepare candidates and associates to succeed in today’s competitive marketplace. We offer an extensive portfolio of training courses and leadership development solutions that help clients maximize talent and optimize performance. |
| · | Career Management — We understand the human side of business to help individuals and organizations unleash human potential to enhance skills, increase effectiveness and successfully manage career changes and workforce transitions. |
| · | Outsourcing — We provide clients with outsourcing services related to human resources functions primarily in the areas of large-scale recruiting and workforce-intensive initiatives that are outcome-based, thereby sharing in the risk and reward with our clients. |
| · | Workforce Consulting — We help clients create and align their workforce strategy to achieve their business strategy, increase business agility and flexibility, and accelerate personal and business success. |
This comprehensive and diverse business mix helps us to partially mitigate the cyclical effects of the national economies in which we operate. Our family of brands and offerings includes:
| · | Manpower — We are a global leader in contingent staffing and permanent recruitment. We provide businesses with rapid access to a highly qualified and productive pool of candidates to give them the flexibility and agility they need to respond to changing business needs. |
| · | Experis — We are a global leader in professional resourcing and project-based solutions. With operations in over 55 countries and territories, we delivered 51 million hours of professional talent in 2014 specializing in Information Technology (IT), Engineering, Finance and Accounting, and Healthcare. |
| · | Right Management — We are a global leader in career and talent development. Through our innovative and proprietary process, we leverage our expertise in employee assessment, leader development, career management and workforce transition and outplacement to increase productivity and optimize business performance. |
| · | ManpowerGroup Solutions — ManpowerGroup Solutions is a leader in outcome-based, talent-driven solutions. Our offerings include best-in-class Talent Based Outsourcing (TBO), TAPFIN — Managed Service Provider (MSP) and Recruitment Process Outsourcing (RPO). |
Management’s Discussion & Analysis of Financial Condition and Results of Operations
| ManpowerGroup | Annual Report 2014 | 23 |
Our leadership position allows us to be a center for quality employment opportunities for people at all points in their career paths. In 2014, the 3.4 million people whom we connected to opportunities and purpose worked to help our more than 400,000 clients meet their business objectives. Seasoned professionals, skilled laborers, temporary to permanent, parents returning to work, seniors wanting to supplement pensions, previously unemployed youth and disabled individuals all turn to the ManpowerGroup companies for employment possibilities. Similarly, governments in the nations in which we operate look to us to help provide employment opportunities and training to assist the unemployed in gaining the skills they need to enter the workforce. We provide a bridge to experience and employment, and help to build more sustainable communities.
Our industry is large and fragmented, comprised of thousands of firms employing millions of people and generating billions of United States dollars in annual revenues. It is also a highly competitive industry, reflecting several trends in the global marketplace, notably increasing demand for skilled people and consolidation among clients and in the employment services industry itself.
We manage these trends by leveraging established strengths, including one of the employment services industry’s most recognized and respected brands; geographic diversification; size and service scope; an innovative product mix; and a strong client base. While staffing is an important aspect of our business, our strategy is focused on providing both the skilled employees our clients need and high-value workforce management, outsourcing and consulting solutions.
Client demand for workforce solutions and services is dependent on the overall strength of the labor market and secular trends toward greater workforce flexibility within each of the countries and territories in which we operate. Improving economic growth typically results in increasing demand for labor, resulting in greater demand for our staffing services. During periods of increasing demand, we are generally able to improve our profitability and operating leverage as our current cost base can support some increase in business without a similar increase in selling and administrative expenses.
Correspondingly, during periods of weak economic growth or economic contraction, the demand for our staffing services typically declines. When demand drops, our operating profit is typically impacted unfavorably as we experience a deleveraging of our selling and administrative expense base as expenses may not decline at the same pace as revenues. In periods of economic contraction, we may have more significant expense deleveraging, as we believe it is prudent not to reduce selling and administrative expenses to levels that could negatively impact the long-term potential of our branch network and brands.
The nature of our operations is such that our most significant current asset is accounts receivable, with an average days sales outstanding of approximately 55 days based on the markets where we do business. Our most significant current liabilities are payroll related costs, which are generally paid either weekly or monthly. As the demand for our services increases, we generally see an increase in our working capital needs, as we continue to pay our associates on a weekly or monthly basis while the related accounts receivable are outstanding for much longer, which may result in a decline in operating cash flows. Conversely, as the demand for our services declines, we generally see a decrease in our working capital needs, as the existing accounts receivable are collected and not replaced at the same level, resulting in a decline of our accounts receivable balance, with less of an effect on current liabilities due to the shorter cycle time of the payroll related items. This may result in an increase in our operating cash flows; however, any such increase would not be sustainable in the event that an economic downturn continued for an extended period.
Our career management services are counter-cyclical to our staffing services, which helps to offset the impact of an economic downturn on our overall financial results.
Management’s Discussion & Analysis of Financial Condition and Results of Operations
| 24 |
MANAGEMENT’S DISCUSSION & ANALYSIS OF FINANCIAL CONDITION AND RESULTS OF OPERATIONS
Due to our industry’s sensitivity to economic factors, the inherent difficulty in forecasting the direction and strength of the economy and the short-term nature of staffing assignments, it is difficult to forecast future demand for our services with certainty. As a result, we monitor a number of economic indicators, as well as recent business trends, to predict future revenue trends for each of our reportable segments. Based upon these anticipated trends, we determine what level of personnel and office investments are necessary to take full advantage of growth opportunities.
Our business is organized and managed primarily on a geographic basis, with Right Management currently operating as a separate global business unit. Each country and business unit generally have their own distinct operations and management team, providing services under our global brands. We have an executive sponsor for each global brand who is responsible for ensuring the integrity and consistency of delivery locally. Each operation reports directly or indirectly through a regional manager, to a member of executive management. Given this reporting structure, all of our operations have been segregated into the following reporting segments: Americas, which includes United States and Other Americas; Southern Europe, which includes France, Italy and Other Southern Europe; Northern Europe; APME (Asia Pacific Middle East); and Right Management.
The Americas, Southern Europe, Northern Europe and APME segments derive a significant majority of their revenues from the placement of contingent workers. The remaining revenues within these segments are derived from other workforce solutions and services, including recruitment and assessment, training and development, and ManpowerGroup Solutions. ManpowerGroup Solutions includes TBO, MSP and RPO. Right Management’s revenues are derived from career management and workforce consulting services. Segment revenues represent sales to external clients. Due to the nature of our business, we generally do not have export sales. We provide services to a wide variety of clients, none of which individually comprises a significant portion of revenues for us as a whole or for any segment.
FINANCIAL MEASURES — CONSTANT CURRENCY AND ORGANIC CONSTANT CURRENCY
Changes in our financial results include the impact of changes in foreign currency exchange rates and acquisitions. We provide “constant currency” and “organic constant currency” calculations in this report to remove the impact of these items. We express year-over-year variances that are calculated in constant currency and organic constant currency as a percentage.
When we use the term “constant currency,” it means that we have translated financial data for a period into United States dollars using the same foreign currency exchange rates that we used to translate financial data for the previous period. We believe that this calculation is a useful measure, indicating the actual growth of our operations. We use constant currency results in our analysis of subsidiary or segment performance. We also use constant currency when analyzing our performance against that of our competitors. Substantially all of our subsidiaries derive revenues and incur expenses within a single country and, consequently, do not generally incur currency risks in connection with the conduct of their normal business operations. Changes in foreign currency exchange rates primarily impact reported earnings and not our actual cash flow unless earnings are repatriated.
When we use the term “organic constant currency,” it means that we have further removed the impact of acquisitions in the current period from our constant currency calculation. We believe that this calculation is useful because it allows us to show the actual growth of our pre-existing business.
The constant currency and organic constant currency financial measures are used to supplement those measures that are in accordance with United States Generally Accepted Accounting Principles (“GAAP”). These Non-GAAP financial measures may not provide information that is directly comparable to that provided by other companies in our industry, as other
Management’s Discussion & Analysis of Financial Condition and Results of Operations
| ManpowerGroup | Annual Report 2014 | 25 |
companies may calculate such financial results differently. These Non-GAAP financial measures are not measurements of financial performance under GAAP, and should not be considered as alternatives to measures presented in accordance with GAAP.
Constant currency and organic constant currency percent variances, along with a reconciliation of these amounts to certain of our reported results, are included on pages 36 and 37.
RESULTS OF OPERATIONS — YEARS ENDED DECEMBER 31, 2014, 2013 AND 2012
Client demand for workforce solutions and services is dependent on the overall strength of the labor market and secular trends toward greater workforce flexibility within each of the countries and territories in which we operate. Improving economic growth typically results in increasing demand for labor, resulting in greater demand for our staffing services and solutions. During periods of increased demand, as we saw in 2014, we are generally able to improve our profitability and operating leverage as our cost base can support some increase in business without a similar increase in selling and administrative expenses.
In 2014, we experienced revenue growth in most of our markets as the global economy continued to stabilize. The improving economic conditions contributed to our consolidated revenue growth of 2.5% (4.0% in constant currency) in 2014 compared to 2013, as we maintained a steady trend of improvement throughout 2014, from constant currency revenue growth of 3.0% in the first quarter to a 4.8% increase in the fourth quarter. We saw this similar trend in many of the markets within our staffing segments as we saw solid growth on the whole across the Americas and Europe, with APME showing a slight decline. Our staffing/interim business showed solid growth in 2014, along with a 13.3% constant currency increase in our permanent recruitment business and growth in all of our ManpowerGroup Solutions offerings. At Right Management, we continued to experience revenue declines as the demand for our counter-cyclical outplacement services decreased 9.8% in constant currency and revenues from our talent management services increased slightly in constant currency.
Our gross profit margin in 2014 compared to 2013 increased due to expansion of our staffing/interim gross profit margin and growth in our permanent recruitment business, partially offset by declining demand for our higher-margin Right Management outplacement services and decreased margins in our other offerings. Our staffing/interim gross profit margin improvement in 2014 compared to 2013 reflects strong price discipline, focused pricing initiatives, and additional payroll tax credits related to the Credit d’Impôt pour la Compétitivité et l’Emploi (“CICE”) in France. For additional information on the CICE payroll tax credit, see the Employment-Related Items section of Management’s Discussion and Analysis.
Our profitability improved in 2014, with operating profit up 40.6%, or 43.5% in constant currency, and operating profit margin up 100 basis points compared to 2013. Included in 2013 was $89.4 million of restructuring charges as a result of our simplification and cost recalibration plan that began in the fourth quarter of 2012. Excluding these charges, our operating profit was up 22.2% in constant currency and 50 basis points compared to 2013. Our simplification and cost recalibration plan initiatives have resulted in a lower cost base for the company as we streamlined our organization. We continue to monitor expenses closely to ensure we maintain the full benefit of these actions while investing appropriately to support the growth in the business. During 2014, we added recruiters and certain other staff to support the increased demand for our services. We have also seen an increase in our variable incentive costs due to the improved profitability. Even with these investments, we saw improved operational leverage in 2014 as we were able to support the higher revenue level without a similar increase in expenses.
Management’s Discussion & Analysis of Financial Condition and Results of Operations
| 26 |
MANAGEMENT’S DISCUSSION & ANALYSIS OF FINANCIAL CONDITION AND RESULTS OF OPERATIONS
Consolidated Results — 2014 Compared to 2013
The following table presents selected consolidated financial data for 2014 as compared to 2013.
| Variance in | Variance in | |||||||||||||||||||
| Reported | Constant | Organic Constant | ||||||||||||||||||
| (in millions, except per share data) | 2014 | 2013 | Variance | Currency | Currency | |||||||||||||||
| Revenues from services | $ | 20,762.8 | $ | 20,250.5 | 2.5 | % | 4.0 | % | 3.6 | % | ||||||||||
| Cost of services | 17,274.6 | 16,883.8 | 2.3 | 3.8 | ||||||||||||||||
| Gross profit | 3,488.2 | 3,366.7 | 3.6 | 5.2 | 4.1 | |||||||||||||||
| Gross profit margin | 16.8 | % | 16.6 | % | ||||||||||||||||
| Selling and administrative expenses | 2,768.3 | 2,854.8 | (3.0 | ) | (1.6 | ) | (2.6 | ) | ||||||||||||
| Selling and administrative expenses as a % of revenues | 13.3 | % | 14.1 | % | ||||||||||||||||
| Operating profit | 719.9 | 511.9 | 40.6 | 43.5 | 41.3 | |||||||||||||||
| Operating profit margin | 3.5 | % | 2.5 | % | ||||||||||||||||
| Net interest expense | 31.5 | 33.4 | ||||||||||||||||||
| Other expenses | 6.8 | 3.0 | ||||||||||||||||||
| Earnings before income taxes | 681.6 | 475.5 | 43.4 | 45.9 | ||||||||||||||||
| Provision for income taxes | 254.0 | 187.5 | 35.5 | |||||||||||||||||
| Effective income tax rate | 37.3 | % | 39.4 | % | ||||||||||||||||
| Net earnings | $ | 427.6 | $ | 288.0 | 48.5 | 51.4 | ||||||||||||||
| Net earnings per share — diluted | $ | 5.30 | $ | 3.62 | 46.4 | 49.2 | ||||||||||||||
| Weighted average shares — diluted | 80.7 | 79.6 | 1.5 | % | ||||||||||||||||
The year-over-year increase in revenues from services of 2.5% (4.0% in constant currency and 3.6% in organic constant currency) was attributed to:
| · | increased demand for services in several of our markets within Southern Europe and Northern Europe, where revenues increased 3.8% (3.8% in constant currency and 3.6% in organic constant currency) and 5.4% (5.7% in constant currency and 4.4% in organic constant currency), respectively. This included revenue increases in our larger markets of France and Italy of 1.3% (1.2% in constant currency) and 8.4% (8.5% in constant currency and 8.1% in organic constant currency), respectively, as we experienced stabilization in France, and improving demand in Italy, for much of the period. We also experienced organic constant currency revenue growth in Spain, the United Kingdom, and the Netherlands of 24.2%, 12.7%, and 5.1%, respectively; and |
| · | revenue increase in the United States of 4.0% driven by growth in our larger national accounts and in the small/medium-sized business within our Manpower business as well as solid growth in our MSP and RPO offerings within the ManpowerGroup Solutions business; partially offset by |
| · | revenue decrease in APME of 4.9% (–0.1% in constant currency and –0.6% in organic constant currency) primarily due to a decrease in our staffing/interim business in Japan as we were challenged to recruit candidates in a tight labor market even though we experienced gradual improvement in demand for our staffing/interim services, and in China where legislative changes restricted the use of temporary employment and we recently experienced a softer demand in the market; |
| · | decreased demand for outplacement services at Right Management, where these revenues decreased 10.2% (–9.8% in constant currency); and |
| · | our acquisitions in Southern Europe, Northern Europe and APME, which combined to add 0.4% of revenue growth to our consolidated results. |
Management’s Discussion & Analysis of Financial Condition and Results of Operations
| ManpowerGroup | Annual Report 2014 | 27 |
The year-over-year 20 basis point (0.20%) increase in gross profit margin was primarily attributed to:
| · | a 20 basis point (0.20%) favorable impact from the improvement in our staffing/interim margin as increases in Southern Europe and APME were partially offset by a decrease in Northern Europe, while the Americas remained flat; and |
| · | a 20 basis point (0.20%) favorable impact resulting from a 13.3% constant currency increase in our permanent recruitment business; partially offset by |
| · | a 10 basis point (–0.10%) unfavorable impact from decreased demand for our higher-margin outplacement services at Right Management; and |
| · | a 10 basis point (–0.10%) decline from our other business offerings, primarily a result of costs related to a contract termination. |
The 3.0% decline in selling and administrative expenses in 2014 (–1.6% in constant currency and –2.6% in organic constant currency) was attributed to:
| · | a decrease in restructuring costs with zero in 2014 and $89.4 million in 2013, comprised of $18.0 million in the Americas, $7.8 million in Southern Europe, $39.0 million in Northern Europe, $6.2 million in APME, $14.0 million at Right Management and $4.4 million in corporate expenses; |
| · | a 7.7% decrease in lease and office-related costs because we closed over 200 offices in 2014 as a result of office consolidations and delivery model changes; and |
| · | a decrease in other non-personnel related costs, excluding the lease and office-related costs noted above, as a result of the simplification and cost recalibration actions taken; partially offset by |
| · | legal costs of $9.0 million recorded in the United States related to a settlement agreement (see the Employment-Related Items section of Management’s Discussion and Analysis for additional information); |
| · | a 1.2% increase in organic salary-related costs primarily from an increase in our variable incentive-based costs due to improved operating results; and |
| · | the additional recurring selling and administrative costs incurred as a result of the acquisitions in Southern Europe, Northern Europe and APME. |
Selling and administrative expenses as a percent of revenues decreased 80 basis points (–0.80%) in 2014. The change in selling and administrative expense as a percent of revenues primarily consisted of:
| · | a 50 basis point (–0.50%) favorable impact due to the decrease of restructuring costs noted above; and |
| · | a 30 basis point (–0.30%) favorable impact due to the decrease of non-personnel related costs: –20 basis points due to the decrease in our lease and office-related costs and –10 basis points due to the decrease in other non-personnel related costs primarily as a result of the simplification and cost recalibration actions taken. |
Interest and other expenses are comprised of interest, foreign exchange gains and losses and other miscellaneous non-operating income and expenses. Interest and other expenses were $38.3 million in 2014 compared to $36.4 million in 2013. Net interest expense decreased $1.9 million in 2014 to $31.5 million from $33.4 million in 2013 due to lower debt levels as we repaid our €200 million Notes in June 2013 with cash. Other expenses were $6.8 million in 2014 compared to $3.0 million in 2013. Translation gains in 2014 were $2.2 million compared to translation losses of $2.3 million in 2013. The translation gains in 2014 were primarily due to payments received in Venezuela in foreign currencies other than Venezuelan Bolivar Fuerte and translated at favorable exchange rates other than the official exchange rate and translation gains resulting from intercompany transactions between our foreign subsidiaries and the United States. Miscellaneous expenses, net were $9.0 million in 2014 compared to $0.7 million in 2013. This increase in net expenses is primarily related to the earnings in a few of our equity investments and a loss on sale of an equity investment in the United States in 2014.
Management’s Discussion & Analysis of Financial Condition and Results of Operations
| 28 |
MANAGEMENT’S DISCUSSION & ANALYSIS OF FINANCIAL CONDITION AND RESULTS OF OPERATIONS
We recorded an income tax expense at an effective rate of 37.3% in 2014, as compared to an effective rate of 39.4% in 2013. The 2014 rate was favorably impacted by a change in the overall mix of earnings, primarily an increase in non-U.S. income, and a deemed repatriation. The 37.3% effective tax rate was higher than the United States Federal statutory rate of 35% due primarily to the French business tax, repatriations, valuation allowances and other permanent items.
Net earnings per share — diluted was $5.30 in 2014 compared to $3.62 in 2013. Foreign currency exchange rates unfavorably impacted net earnings per share — diluted by approximately $0.10 in 2014.
Weighted average shares — diluted increased 1.5% to 80.7 million in 2014 from 79.6 million in 2013. This increase was due to shares issued as a result of exercises and vesting of share-based awards in 2014 and the dilutive effect of share-based awards because of the increase in our average share price, partially offset by the impact of share repurchases completed in 2014.
Consolidated Results — 2013 Compared to 2012
The following table presents selected consolidated financial data for 2013 as compared to 2012.
| Variance in | Variance in | |||||||||||||||||||
| Reported | Constant | Organic Constant | ||||||||||||||||||
| (in millions, except per share data) | 2013 | 2012 | Variance | Currency | Currency | |||||||||||||||
| Revenues from services | $ | 20,250.5 | $ | 20,678.0 | (2.1 | )% | (2.1 | )% | (2.4 | )% | ||||||||||
| Cost of services | 16,883.8 | 17,236.0 | (2.0 | ) | (2.0 | ) | ||||||||||||||
| Gross profit | 3,366.7 | 3,442.0 | (2.2 | ) | (2.1 | ) | (2.4 | ) | ||||||||||||
| Gross profit margin | 16.6 | % | 16.6 | % | ||||||||||||||||
| Selling and administrative expenses | 2,854.8 | 3,030.3 | (5.8 | ) | (5.7 | ) | (6.0 | ) | ||||||||||||
| Selling and administrative expenses as a % of revenues | 14.1 | % | 14.7 | % | ||||||||||||||||
| Operating profit | 511.9 | 411.7 | 24.3 | 24.3 | 23.8 | |||||||||||||||
| Operating profit margin | 2.5 | % | 2.0 | % | ||||||||||||||||
| Net interest expense | 33.4 | 35.2 | (5.0 | ) | ||||||||||||||||
| Other expenses | 3.0 | 8.1 | (63.0 | ) | ||||||||||||||||
| Earnings before income taxes | 475.5 | 368.4 | 29.1 | 28.9 | ||||||||||||||||
| Provision for income taxes | 187.5 | 170.8 | 9.8 | |||||||||||||||||
| Effective income tax rate | 39.4 | % | 46.4 | % | ||||||||||||||||
| Net earnings | $ | 288.0 | $ | 197.6 | 45.8 | 46.4 | ||||||||||||||
| Net earnings per share — diluted | $ | 3.62 | $ | 2.47 | 46.6 | 47.0 | ||||||||||||||
| Weighted average shares — diluted | 79.6 | 80.1 | (0.7 | )% | ||||||||||||||||
The year-over-year decrease in revenues from services of 2.1% (–2.1% in constant currency and –2.4% in organic constant currency) was attributed to:
| · | decreased demand for services in several of our markets within the Americas, Southern Europe and Northern Europe, where revenues decreased 1.9% (–0.5% in constant currency), 0.2% (–3.6% in constant currency and –3.9% in organic constant currency) and 0.6% (–1.7% in constant currency and –2.3% in organic constant currency), respectively; |
| · | revenue declines in our larger markets of France and Italy of 5.8% (–6.0% in organic constant currency) and 0.3% in constant currency, respectively, due to the current economic environments in those countries; |
Management’s Discussion & Analysis of Financial Condition and Results of Operations
| ManpowerGroup | Annual Report 2014 | 29 |
| · | revenue decline in the United States of 1.4% primarily due to a decrease in our larger strategic account client revenues because of softening demand, a large client project in our Manpower business line that concluded in the first quarter of 2013 and strong price discipline on new business opportunities; |
| · | revenue decrease in APME of 10.3% (–1.4% in constant currency) primarily due to the decline in demand for our staffing/ interim services, resulting from two fewer billing days and legislative changes in China that restricted the use of temporary employment and to a decline in our TBO revenues due to the loss of a Japanese client; and |
| · | decreased demand for talent management services at Right Management, where these revenues decreased 7.1% (–6.6% in constant currency); partially offset by |
| · | our acquisitions of two entities in April 2012, one in Southern Europe and one in the Americas, and one entity in April 2013 in Northern Europe, which combined to add 0.3% of revenue growth to our consolidated results. |
The gross profit margin remained flat year-over-year as the 10 basis point (0.10%) favorable impact from the improvement in our staffing/interim margin was offset by a 10 basis point (0.10%) unfavorable impact resulting from the 7.3% year-over-year decline in our permanent recruitment business. Our staffing/interim margins improved slightly in 2013 as the increases in the United States and Southern Europe, due to the benefit of the CICE payroll tax credit, were offset by lower gross profit margins in many European and APME markets and a social security reserve recorded in France.
The 5.8% decline in selling and administrative expenses in 2013 (–5.7% in constant currency and –6.0% in organic constant currency) was attributed to:
| · | a 6.1% decrease in our organic salary-related costs, because of lower headcount; |
| · | a 6.3% decrease in lease costs because we closed over 300 offices in 2013, as a result of office consolidations and delivery model changes; |
| · | a decrease in legal costs in 2013 compared to 2012, primarily related to the $10 million settlement agreement in 2012 in connection with a lawsuit involving allegations regarding the Company’s vacation pay practices in Illinois; and |
| · | a 10.5% decrease in non-personnel related costs, excluding legal and lease costs noted above, as a result of the simplification and cost recalibration actions taken in the fourth quarter of 2012 and during 2013; partially offset by |
| · | restructuring costs of $89.4 million in 2013 compared to restructuring costs of $48.8 million in 2012, comprised of $9.8 million in the Americas, $3.8 million in Southern Europe, $13.2 million in Northern Europe, $0.7 million in APME, $10.9 million at Right Management and $10.4 million in corporate expenses; and |
| · | the additional recurring selling and administrative costs as a result of the acquisitions in Southern Europe, Northern Europe and the Americas. |
Selling and administrative expenses as a percent of revenues decreased 60 basis points (–0.60%) in 2013 compared to 2012. The change in selling and administrative expense as a percent of revenues consists of:
| · | a 50 basis point (–0.50%) favorable impact due to the decrease in our organic salary-related costs and lease costs; |
| · | a 20 basis point (–0.20%) favorable impact due to the decrease of non-personnel related costs, excluding legal and lease costs noted above, as a result of the simplification and cost recalibration actions taken; and |
| · | a 10 basis point (–0.10%) favorable impact due to the decrease in legal costs as noted above; partially offset by |
| · | a 20 basis point (0.20%) increase due to the restructuring costs of $89.4 million in 2013 compared to $48.8 million in 2012. |
Management’s Discussion & Analysis of Financial Condition and Results of Operations
| 30 |
MANAGEMENT’S DISCUSSION & ANALYSIS OF FINANCIAL CONDITION AND RESULTS OF OPERATIONS
Interest and other expenses are comprised of interest, foreign exchange gains and losses and other miscellaneous non-operating income and expenses. Interest and other expenses were $36.4 million in 2013 compared to $43.3 million in 2012. Net interest expense decreased $1.8 million in 2013 to $33.4 million from $35.2 million in 2012 due to lower debt levels as we repaid our €200 million Notes in June 2013 with cash. Other expenses were $3.0 million in 2013 compared to $8.1 million in 2012. This decrease is due partly to the increase in equity investment income in 2013 compared to 2012, primarily related to a gain on sale of investments by our minority-owned Swiss Franchise recorded in 2013.
We recorded an income tax expense at an effective rate of 39.4% for 2013, as compared to an effective rate of 46.4% for 2012. The 2013 rate was favorably impacted by a change in the overall mix of earnings, primarily an increase in non-U.S. income, utilization of net operating losses, and by the reinstatement of the United States Federal Work Opportunity Tax Credit (“WOTC”). The WOTC was retroactively reinstated to January 1, 2012 as part of the American Taxpayer Relief Act, which was enacted on January 2, 2013. We recognized the $7.0 million tax benefit related to 2012 during the first quarter of 2013, the period during which the law was enacted. The American Taxpayer Relief Act also extended the WOTC through December 31, 2013. The 39.4% rate is higher than the U.S. Federal statutory rate of 35% due primarily to the French business tax and other permanent items.
Net earnings per share — diluted was $3.62 in 2013 compared to $2.47 in 2012. Foreign currency exchange rates unfavorably impacted net earnings per share — diluted by approximately $0.01 in 2013.
Weighted average shares — diluted decreased 0.7% to 79.6 million in 2013 from 80.1 million in 2012. This decrease is the result of the full-year impact of share repurchases we made in 2012, partially offset by an increase in the dilutive effect of share-based awards due to the exercises in 2013 and the increase in our share price.
Segment Results
We evaluate performance based on operating unit profit (“OUP”), which is equal to segment revenues less direct costs and branch and national headquarters operating costs. This profit measure does not include goodwill and intangible asset impairment charges or amortization of intangible assets related to acquisitions, interest and other income and expense amounts or income taxes.
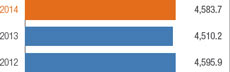
Americas — The Americas segment is comprised of 678 Company-owned branch offices and 180 stand-alone franchise offices. In the Americas, revenues from services increased 1.6% (5.4% in constant currency) in 2014 compared to 2013. In the United States, revenues from services increased 4.0% in 2014 compared to 2013. The revenue increase in the United States was attributable to growth in our larger national accounts and in the small/ medium-sized business within our Manpower business and solid growth in our MSP and RPO offerings within the ManpowerGroup Solutions business. These increases were partially offset by a decrease in revenues from our larger global accounts. In Other Americas, revenues from services declined 3.0% (8.0% increase in constant currency) in 2014 compared to 2013. We experienced constant currency revenue growth in Mexico, Canada, Argentina due to inflation, Colombia and Brazil of 0.1%, 1.8%, 18.3%, 40.0%, and 9.5%, respectively.
Americas Revenues
($ in millions)
($ in millions)
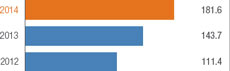
Americas Operating Unit Profit
($ in millions)
($ in millions)
Management’s Discussion & Analysis of Financial Condition and Results of Operations
| ManpowerGroup | Annual Report 2014 | 31 |
In 2013, revenues from services decreased 1.9% (–0.5% in constant currency) compared to 2012. In the United States, revenues from services declined 1.4% in 2013 compared to 2012. The revenue decline in the United States was attributable to a decline in staffing/interim services in the Manpower and Experis business lines due to softening demand from our larger strategic accounts in 2013 compared to 2012, a large client project in our Manpower business line that concluded in the first quarter of 2013 and strong price discipline by selectively accepting new business opportunities. These declines were partially offset by an increase in ManpowerGroup Solutions revenues of 14.2% and an increase in our permanent recruitment revenues of 4.4% in the United States in 2013 compared to 2012. In Other Americas, revenues from services declined 2.7% (1.2% increase in constant currency and 1.1% increase in organic constant currency) in 2013 compared to 2012, with a revenue decline in Argentina of 12.7%, partially offset by revenue increases in Canada of 1.8% (4.0% in organic constant currency) and Mexico of 2.5%.
Gross profit margin was flat in 2014 compared to 2013 as the favorable impact from improved Experis interim margins, resulting from strong price discipline by selectively accepting new business opportunities and effectively managing the pay bill gap with our clients, offset by business mix changes in our Manpower staffing revenue as growth came from some of our lower-margin business and pricing pressures within the small/medium-sized business in the United States. In 2013, gross profit margin increased due to the favorable impact of improved staffing/interim gross profit margin resulting from stronger pricing discipline in the United States, as well as continued growth in our ManpowerGroup Solutions and permanent recruitment businesses.
In 2014, selling and administrative expenses decreased 3.0% (–0.3% in constant currency). We experienced declines in non-personnel related costs as a result of the simplification and cost recalibration actions taken in 2013 and $18.0 million of restructuring costs recorded in 2013 that did not recur in 2014, that was offset by $9.0 million of legal costs recorded in 2014 and an increase in salary-related costs, because of an increase in our variable incentive-based costs due to improved operating results and higher headcount to support increased revenues. In 2013, selling and administrative expenses decreased 5.6% (–4.5% in constant currency) due to $10.0 million of legal costs incurred in 2012 and declines in salary-related and lease costs as a result of the cost recalibration actions, partially offset by an increase in restructuring costs to $18.0 million recorded in 2013 compared to $9.8 million in 2012.
OUP margin in the Americas was 4.0%, 3.2% and 2.4% for 2014, 2013 and 2012, respectively. In the United States, OUP margin was 4.1%, 3.4% and 2.0% in 2014, 2013 and 2012, respectively. The margin increase in 2014 in the United States was due to the decrease in restructuring costs and better operational leverage, as we were able to support an increase in revenues without a similar increase in expenses, partially offset by the legal costs noted above. Other Americas OUP margin was 3.8%, 2.8% and 3.2% in 2014, 2013 and 2012, respectively. The increase in the Other Americas OUP margin in 2014 was due to the declines in restructuring costs and in salary-related and lease costs as a result of the simplification and cost recalibration actions taken in 2013, partially offset by a decline in the gross profit margin in 2014 compared to 2013. The margin increase in the Americas in 2013 was primarily due to the United States, as a result of declines in salary-related and lease costs from the cost recalibration actions, the 2012 legal costs and the improvement in the gross profit margin as noted above, partially offset by the increase in restructuring costs in both the United States and Other Americas.
Management’s Discussion & Analysis of Financial Condition and Results of Operations
| 32 |
MANAGEMENT’S DISCUSSION & ANALYSIS OF FINANCIAL CONDITION AND RESULTS OF OPERATIONS
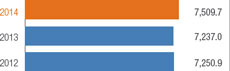
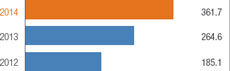
Southern Europe — In 2014, revenues from services in Southern Europe, which includes operations in France and Italy, increased 3.8% (3.8% in constant currency and 3.6% in organic constant currency) compared to 2013. In 2014, revenues from services increased 1.2% in constant currency in France (which represents 71.3% of Southern Europe’s revenues) and increased 8.1% in organic constant currency in Italy (which represents 15.7% of Southern Europe’s revenues). The increase in France was due primarily to market share gains in a stabilizing market. The increase in Italy was mostly due to increased demand for our Manpower staffing services as clients opted for more flexible labor solutions given the current economic conditions and a 27.4% constant currency increase in the permanent recruitment business, partially offset by three fewer billing days in 2014 compared to 2013. In Other Southern Europe, revenues from services increased 13.3% (13.7% in constant currency and 12.2% in organic constant currency) in 2014 compared to 2013 driven by the revenue increase in Spain due to improving economic conditions and clients acquired from a local competitor in July 2013.
Southern Europe Revenues
($ in millions)
($ in millions)
Southern Europe Operating Unit Profit
($ in millions)
($ in millions)
In 2013, revenues from services in Southern Europe decreased 0.2% (–3.6% in constant currency and –3.9% in organic constant currency) compared to 2012. In 2013, revenues from services decreased 6.0% in organic constant currency in France and decreased 0.3% in constant currency in Italy. The decrease in France was due primarily to softening demand in the staffing/interim business and a 23.5% decline in constant currency in the permanent recruitment business. The decrease in Italy was due to a slight decrease in our staffing/interim services. In Other Southern Europe, revenues from services increased 12.5% (7.9% in constant currency and 6.1% in organic constant currency) in 2013 compared to 2012 driven by the revenue increase in Portugal, due to increased demand in the Manpower staffing and ManpowerGroup Solutions businesses, and in Spain, due mostly to an acquisition of some clients from a local competitor in July 2013.
Gross profit margin increased in 2014 compared to 2013 due to strong price discipline, enhanced CICE payroll tax credits in France and an increase in our permanent recruitment business, partially offset by the continued pricing pressures in some markets. In 2013, gross profit margin increased compared to 2012 due primarily to the CICE payroll tax credit in France, which was partially offset by the additional social security reserve recorded in France in 2013, the decrease in our permanent recruitment business, and pricing pressures in the small/medium-sized business in France and in Italy that unfavorably impacted staffing/interim gross margins.
In 2014, selling and administrative expenses decreased 0.1% (–0.1% in constant currency and –0.2% in organic constant currency) compared to 2013. The decrease was due to the decline in non-personnel related costs as a result of the simplification and cost recalibration actions taken in 2013 and the $7.8 million of restructuring costs incurred in 2013 that did not recur in 2014, partially offset by an increase in organic salary-related costs, because of an increase in our variable incentive-based costs due to improved operating results. In 2013, selling and administrative expenses decreased 3.8% (–6.9% in constant currency and –7.2% in organic constant currency) compared to 2012 primarily related to the decrease in organic salary-related costs due to lower headcount, partially offset by an increase in restructuring costs to $7.8 million recorded in 2013 compared to $3.8 million in 2012 and the additional recurring selling and administrative costs resulting from the 2012 Damilo acquisition in France.
OUP margin in Southern Europe was 4.8%, 3.7% and 2.6% for 2014, 2013 and 2012, respectively. OUP margin increased in 2014 primarily due to France, where the OUP margin was 5.1%, 3.8%, and 2.4% in 2014, 2013 and 2012, respectively. France’s margin increase in 2014 was due to the improvement in our gross profit margin and improved operational leverage as we were able to support the higher revenue level with lower expenses. Italy’s OUP margin was 5.4%, 4.9% and 4.3% in
Management’s Discussion & Analysis of Financial Condition and Results of Operations
| ManpowerGroup | Annual Report 2014 | 33 |
2014, 2013 and 2012, respectively. Italy’s margin increase in 2014 was due to our ability to effectively manage selling and administrative expenses while revenues increased, partially offset by the decrease in our gross profit margin and the impact of three fewer billing days. Other Southern Europe’s OUP margin was 2.3%, 1.4% and 1.3% in 2014, 2013 and 2012, respectively. Other Southern Europe’s margin increased in 2014 as we were able to support an increase in revenues without a similar increase in expenses. The margin increase in Southern Europe in 2013 was due to the improvement in France’s gross profit margin and the decrease in salary-related costs due to lower headcount, partially offset by the increase in restructuring costs in 2013 compared to 2012.
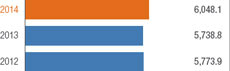
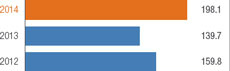
Northern Europe — In Northern Europe, which includes operations in the United Kingdom, the Nordics, Germany and the Netherlands (comprising 35.0%, 20.6%, 11.9%, and 9.9%, respectively, of Northern Europe’s revenues), revenues from services increased 5.4% (5.7% in constant currency and 4.4% in organic constant currency) in 2014 as compared to 2013. We experienced organic constant currency revenue growth in the United Kingdom and the Netherlands of 12.7% and 5.1%, respectively. The increase in revenues from services was primarily attributable to the increase in our staffing/interim business, as a result of the improving economic conditions in a majority of our larger Northern European markets, and a 22.2% constant currency increase (7.5% in organic constant currency) in our permanent recruitment business mostly due to 92.6% constant currency growth (33.7% in organic constant currency) in the United Kingdom.
Northern Europe Revenues
($ in millions)
($ in millions)
Northern Europe Operating Unit Profit
($ in millions)
($ in millions)
In 2013, revenues from services in Northern Europe decreased 0.6% (–1.7% in constant currency and –2.3% in organic constant currency) primarily attributable to the 8.2% decline in constant currency in our Experis business line, which saw softening demand for IT services among our larger clients, in both our interim and permanent recruitment businesses.
Gross profit margin decreased in 2014 compared to 2013 due to the decline in our staffing/interim margins as a result of business mix changes in our staffing/interim revenue as higher growth came from our lower-margin markets, general pricing pressures in several markets and client contract termination costs, partially offset by the increase in our permanent recruitment business. In 2013, gross profit margin decreased due to the decline in our staffing/interim margins as we experienced lower bench utilization in our Manpower business line in Sweden and new collective labor agreements and higher holiday pay costs in Germany, encountered general pricing pressures in several markets, and saw a 9.8% decrease in constant currency in our permanent recruitment business.
Selling and administrative expenses decreased 2.8% (–2.2% in constant currency and –4.8% in organic constant currency) in 2014 compared to 2013. The decrease in selling and administrative expenses was due primarily to the $39.0 million of restructuring costs incurred in 2013 that did not recur in 2014 and a decrease in lease costs as a result of the simplification and cost recalibration actions taken, partially offset by the additional recurring selling and administrative costs resulting from acquisitions and an increase in organic salary-related costs, because of an increase in our variable incentive-based costs due to improved operating results and higher headcount to support increased revenues. In 2013, selling and administrative expenses decreased 3.8% (–5.3% decrease in constant currency and –5.9% in organic constant currency) compared to 2012 due primarily to lower headcount, which reduced compensation-related expenses such as salaries and variable incentive-based costs, lower lease costs, and the additional cost savings from the simplification and cost recalibration actions, partially offset by an increase in restructuring costs to $39.0 million in 2013 compared to $13.2 million in 2012 and the additional recurring selling and administrative costs resulting from an acquisition in April 2013.
Management’s Discussion & Analysis of Financial Condition and Results of Operations
| 34 |
MANAGEMENT’S DISCUSSION & ANALYSIS OF FINANCIAL CONDITION AND RESULTS OF OPERATIONS
OUP margin for Northern Europe was 3.3%, 2.4% and 2.8% in 2014, 2013 and 2012, respectively. The increase in 2014 was the result of better operational leverage, as we were able to support the higher revenue levels with lower expenses, partially offset by a decline in the gross profit margin. The OUP margin declined in 2013 as the decrease in compensation-related expenses and lease costs as well as additional cost savings from the simplification and cost recalibration actions was not enough to offset the decrease in the gross profit margin and the increase in restructuring costs in 2013.
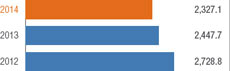
APME — Revenues from services decreased 4.9% (–0.1% in constant currency and –0.6% in organic constant currency) in 2014 compared to 2013. In Japan (which represents 36.0% of APME’s revenues), revenues from services decreased 9.3% (–1.7% in constant currency) as we were challenged to recruit candidates in a tight labor market even though we experienced gradual improvement in demand for our staffing/interim services, partially offset by the increase of 10.5% in constant currency in the permanent recruitment business. In Australia (which represents 22.8% of APME’s revenues), revenues from services were down 7.7% (–1.0% in constant currency and –2.3% in organic constant currency) in 2014 compared to 2013 due to the decreased demand for our staffing/interim services, partially offset by a 13.0% increase in constant currency in the permanent recruitment business. The remaining revenue decrease in APME is due to the staffing/ interim revenue decline in China as a result of legislative changes that restricted the use of temporary employment and a general softening of demand in the market.
APME Revenues
($ in millions)
($ in millions)
APME Operating Unit Profit
($ in millions)
($ in millions)
In 2013, revenues from services for APME decreased 10.3% (–1.4% in constant currency) compared to 2012. In Japan, revenues from services decreased 3.7% in constant currency in 2013 due primarily to soft demand for our staffing/interim services as a result of legislative changes and fewer billing days in 2013 compared to 2012, and the run-off of a large TBO client contract that began to wind down in early 2013, partially offset by a 31.7% increase in constant currency in the permanent recruitment business. In Australia, revenues from services were down 6.6% in constant currency compared to 2012 due to the decreased demand for interim services in our Experis business line, partially offset by an increase in the permanent recruitment business.
Gross profit margin increased in 2014 compared to 2013 due to an increase of 8.3% in constant currency in our permanent recruitment business. In 2013, gross profit margin decreased due to a decrease in our staffing/interim gross profit margin from modest pricing pressures and change in business mix, as well as the 5.3% decline in constant currency in our permanent recruitment business.
Selling and administrative expenses decreased 8.0% (–3.0% in constant currency and –4.3% in organic constant currency) in 2014 compared to 2013 related to reduced organic salary-related expenses due to lower headcount, a decrease in lease and office-related costs as a result of the simplification and cost recalibration actions taken in 2013 and $6.2 million of restructuring costs incurred in 2013 that did not recur in 2014, partially offset by the additional recurring selling and administrative costs resulting from acquisitions. In 2013, selling and administrative expenses decreased 10.4% (–1.6% in constant currency) compared to 2012 related to reduced compensation-related expenses such as salaries and variable incentive-based costs due to lower headcount, partially offset by an increase in restructuring costs to $6.2 million recorded in 2013 compared to $0.7 million in 2012.
Management’s Discussion & Analysis of Financial Condition and Results of Operations
| ManpowerGroup | Annual Report 2014 | 35 |
OUP margin for APME was 3.6%, 2.9%, and 3.3% in 2014, 2013 and 2012, respectively. The OUP margin increase in 2014 was due to the increase in our gross profit margin as well as the decrease in salary-related expenses, lease and office-related costs, and restructuring costs. The decrease in 2013 was due to the decrease in our gross profit margin, increase in restructuring costs and the impact of fewer billing days, partially offset by the decrease in salary-related costs due to lower headcount.
Right Management — Right Management is a leading global provider of talent and career management (also known as outplacement services) workforce solutions, operating in 139 offices in more than 50 countries and territories.
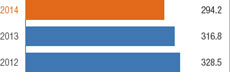
In 2014, revenues from services decreased 7.1% (–6.7% in constant currency) due to the 10.2% decrease (–9.8% in constant currency) in our outplacement services as we experienced softer demand in many of our markets due to the counter-cyclical nature of this business. Our talent management business experienced a slight decrease of 0.5% (0.1% increase in constant currency) in 2014 compared to 2013.
In 2013, revenues from services decreased 3.6% (–2.1% in constant currency) due to the 7.1% (–6.6% in constant currency) decline in demand for our talent management business. Our counter-cyclical outplacement services remained flat in constant currency in 2013 compared to 2012.
Right Management Revenues
($ in millions)
($ in millions)
Right Management Operating Unit Profit
($ in millions)
($ in millions)
Gross profit margin decreased in 2014 compared to 2013 due to margin deterioration in the outplacement business and the change in business mix as the lower-margin talent management business represented a greater percentage of the revenue mix, partially offset by the increase in the talent management business gross profit margin. In 2013, gross profit margin decreased due to the margin deterioration in both the outplacement business and talent management business, partially offset by the change in business mix as the higher-margin outplacement business represented a greater percentage of the revenue mix.
In 2014, selling and administrative expenses decreased 16.7% (–16.1% in constant currency) compared to 2013 due to the cost savings from more efficient delivery solutions and the simplification and cost recalibration actions favorably impacting expense levels, as well as the $14.0 million of restructuring costs incurred in 2013 that did not recur in 2014. In 2013, selling and administrative expenses decreased 8.5% (–7.5% in constant currency) compared to 2012 due to the cost savings from the simplification and cost recalibration actions, partially offset by an increase in restructuring costs to $14.0 million in 2013 compared to $10.9 million in 2012.
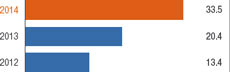
OUP margin for Right Management was 11.4%, 6.4% and 4.1% for 2014, 2013 and 2012, respectively. The OUP margin for 2014 improved due to the decrease in selling and administrative expenses as a result of the cost savings from more efficient delivery solutions and the simplification and cost recalibration actions and the decrease in restructuring costs, partially offset by the decline in the gross profit margin. The OUP margin for 2013 improved due to the decrease in selling and administrative expenses from the cost savings from the simplification and cost recalibration actions, partially offset by the decrease in the gross profit margin and the increase in restructuring costs in 2013.
Management’s Discussion & Analysis of Financial Condition and Results of Operations
| 36 |
MANAGEMENT’S DISCUSSION & ANALYSIS OF FINANCIAL CONDITION AND RESULTS OF OPERATIONS
FINANCIAL MEASURES — CONSTANT CURRENCY AND ORGANIC CONSTANT CURRENCY RECONCILIATION
Certain constant currency and organic constant currency percent variances are discussed throughout this annual report. A reconciliation of these Non-GAAP percent variances to the percent variances calculated based on our annual GAAP financial results is provided below. (See Constant Currency and Organic Constant Currency on pages 24 and 25 for further information.)
| Impact of | Organic | |||||||||||||||||||||||
| Reported | Variance in | Acquisitions | Constant | |||||||||||||||||||||
| Amount represent 2014 | Amount | Reported | Impact of | Constant | (in Constant | Currency | ||||||||||||||||||
| Percentages represent 2014 compared to 2013 | (in millions) | Variance | Currency | Currency | Currency) | Variance | ||||||||||||||||||
| Revenues from Services | ||||||||||||||||||||||||
| Americas: | ||||||||||||||||||||||||
| United States | $ | 3,086.4 | 4.0 | % | — | % | 4.0 | % | — | % | 4.0 | % | ||||||||||||
| Other Americas | 1,497.3 | (3.0 | ) | (11.0 | ) | 8.0 | — | 8.0 | ||||||||||||||||
| 4,583.7 | 1.6 | (3.8 | ) | 5.4 | — | 5.4 | ||||||||||||||||||
| Southern Europe: | ||||||||||||||||||||||||
| France | 5,351.6 | 1.3 | 0.1 | 1.2 | — | 1.2 | ||||||||||||||||||
| Italy | 1,178.8 | 8.4 | (0.1 | ) | 8.5 | 0.4 | 8.1 | |||||||||||||||||
| Other Southern Europe | 979.3 | 13.3 | (0.4 | ) | 13.7 | 1.5 | 12.2 | |||||||||||||||||
| 7,509.7 | 3.8 | — | 3.8 | 0.2 | 3.6 | |||||||||||||||||||
| Northern Europe | 6,048.1 | 5.4 | (0.3 | ) | 5.7 | 1.3 | 4.4 | |||||||||||||||||
| APME | 2,327.1 | (4.9 | ) | (4.8 | ) | (0.1 | ) | 0.5 | (0.6 | ) | ||||||||||||||
| Right Management | 294.2 | (7.1 | ) | (0.4 | ) | (6.7 | ) | — | (6.7 | ) | ||||||||||||||
| ManpowerGroup | $ | 20,762.8 | 2.5 | % | (1.5 | )% | 4.0 | % | 0.4 | % | 3.6 | % | ||||||||||||
| Gross Profit — ManpowerGroup | $ | 3,488.2 | 3.6 | % | (1.6 | )% | 5.2 | % | 1.1 | % | 4.1 | % | ||||||||||||
| Operating Unit Profit | ||||||||||||||||||||||||
| Americas: | ||||||||||||||||||||||||
| United States | $ | 125.4 | 25.7 | % | — | % | 25.7 | % | — | % | 25.7 | % | ||||||||||||
| Other Americas | 56.2 | 27.9 | (12.5 | ) | 40.4 | — | 40.4 | |||||||||||||||||
| 181.6 | 26.4 | (3.8 | ) | 30.2 | — | 30.2 | ||||||||||||||||||
| Southern Europe: | ||||||||||||||||||||||||
| France | 275.5 | 38.5 | (0.2 | ) | 38.7 | — | 38.7 | |||||||||||||||||
| Italy | 64.2 | 19.3 | (0.5 | ) | 19.8 | 1.6 | 18.2 | |||||||||||||||||
| Other Southern Europe | 22.0 | 83.9 | (0.9 | ) | 84.8 | 8.8 | 76.0 | |||||||||||||||||
| 361.7 | 36.7 | (0.3 | ) | 37.0 | 0.7 | 36.3 | ||||||||||||||||||
| Northern Europe | 198.1 | 41.8 | (3.1 | ) | 44.9 | 6.9 | 38.0 | |||||||||||||||||
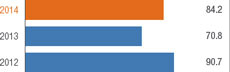
| APME | 84.2 | 19.0 | (6.2 | ) | 25.2 | 2.5 | 22.7 | |||||||||||||||||
| Right Management | 33.5 | 64.1 | 0.4 | 63.7 | — | 63.7 | ||||||||||||||||||
| Operating Profit — ManpowerGroup | $ | 719.9 | 40.6 | % | (2.9 | )% | 43.5 | % | 2.2 | % | 41.3 | % | ||||||||||||
Management’s Discussion & Analysis of Financial Condition and Results of Operations
| ManpowerGroup | Annual Report 2014 | 37 |
| Impact of | Organic | |||||||||||||||||||||||
| Reported | Variance in | Acquisitions | Constant | |||||||||||||||||||||
| Amount represent 2013 | Amount | Reported | Impact of | Constant | (in Constant | Currency | ||||||||||||||||||
| Percentages represent 2013 compared to 2012 | (in millions) | Variance | Currency | Currency | Currency) | Variance | ||||||||||||||||||
| Revenues from Services | ||||||||||||||||||||||||
| Americas: | ||||||||||||||||||||||||
| United States | $ | 2,967.0 | (1.4 | )% | — | % | (1.4 | )% | — | % | (1.4 | )% | ||||||||||||
| Other Americas | 1,543.2 | (2.7 | ) | (3.9 | ) | 1.2 | 0.1 | 1.1 | ||||||||||||||||
| 4,510.2 | (1.9 | ) | (1.4 | ) | (0.5 | ) | 0.1 | (0.6 | ) | |||||||||||||||
| Southern Europe: | ||||||||||||||||||||||||
| France | 5,284.9 | (2.6 | ) | 3.2 | (5.8 | ) | 0.2 | (6.0 | ) | |||||||||||||||
| Italy | 1,087.6 | 2.9 | 3.2 | (0.3 | ) | — | (0.3 | ) | ||||||||||||||||
| Other Southern Europe | 864.5 | 12.5 | 4.6 | 7.9 | 1.8 | 6.1 | ||||||||||||||||||
| 7,237.0 | (0.2 | ) | 3.4 | (3.6 | ) | 0.3 | (3.9 | ) | ||||||||||||||||
| Northern Europe | 5,738.8 | (0.6 | ) | 1.1 | (1.7 | ) | 0.6 | (2.3 | ) | |||||||||||||||
| APME | 2,447.7 | (10.3 | ) | (8.9 | ) | (1.4 | ) | — | (1.4 | ) | ||||||||||||||
| Right Management | 316.8 | (3.6 | ) | (1.5 | ) | (2.1 | ) | — | (2.1 | ) | ||||||||||||||
| ManpowerGroup | $ | 20,250.5 | (2.1 | )% | — | % | (2.1 | )% | 0.3 | % | (2.4 | )% | ||||||||||||
| Gross Profit — ManpowerGroup | $ | 3,366.7 | (2.2 | )% | (0.1 | )% | (2.1 | )% | 0.3 | % | (2.4 | )% | ||||||||||||
| Operating Unit Profit | ||||||||||||||||||||||||
| Americas: | ||||||||||||||||||||||||
| United States | $ | 99.8 | 64.2 | % | — | % | 64.2 | % | — | % | 64.2 | % | ||||||||||||
| Other Americas | 43.9 | (13.1 | ) | (1.6 | ) | (11.5 | ) | 0.6 | (12.1 | ) | ||||||||||||||
| 143.7 | 29.0 | (0.8 | ) | 29.8 | 0.3 | 29.5 | ||||||||||||||||||
| Southern Europe: | ||||||||||||||||||||||||
| France | 198.9 | 53.4 | 5.4 | 48.0 | (0.1 | ) | 48.1 | |||||||||||||||||
| Italy | 53.8 | 18.5 | 3.7 | 14.8 | — | 14.8 | ||||||||||||||||||
| Other Southern Europe | 11.9 | 18.1 | 6.5 | 11.6 | 9.3 | 2.3 | ||||||||||||||||||
| 264.6 | 42.9 | 5.0 | 37.9 | 0.5 | 37.4 | |||||||||||||||||||
| Northern Europe | 139.7 | (12.6 | ) | 0.5 | (13.1 | ) | 0.6 | (13.7 | ) | |||||||||||||||
| APME | 70.8 | (22.0 | ) | (8.7 | ) | (13.3 | ) | — | (13.3 | ) | ||||||||||||||
| Right Management | 20.4 | 52.3 | (7.3 | ) | 59.6 | — | 59.6 | |||||||||||||||||
| Operating Profit — ManpowerGroup | $ | 511.9 | 24.3 | % | — | % | 24.3 | % | 0.5 | % | 23.8 | % | ||||||||||||
CASH SOURCES AND USES
Cash used to fund our operations is primarily generated through operating activities and provided by our existing credit facilities. We believe that our available cash and our existing credit facilities are sufficient to cover our cash needs for the foreseeable future. We assess and monitor our liquidity and capital resources globally. We use a global cash pooling arrangement, intercompany lending, and some local credit lines to meet funding needs and allocate our capital resources among our various entities. As of December 31, 2014, we had $513.2 million of cash held by foreign subsidiaries that was not available to fund domestic operations unless repatriated. We anticipate cash repatriations to the United States from certain foreign subsidiaries and have provided for deferred taxes related to those foreign earnings not considered to be
Management’s Discussion & Analysis of Financial Condition and Results of Operations
| 38 |
MANAGEMENT’S DISCUSSION & ANALYSIS OF FINANCIAL CONDITION AND RESULTS OF OPERATIONS
permanently invested. As of December 31, 2014 and 2013, we identified approximately $452.8 million and $264.3 million, respectively, of non-United States earnings that are not permanently invested. Related to these non-United States earnings that may be remitted, we recorded a deferred tax liability of $53.1 million and $16.7 million as of December 31, 2014 and 2013, respectively. This deferred tax liability increased as of December 31, 2014 from December 31, 2013 due to the 2014 non-United States earnings that are not permanently invested, which had a higher tax cost due to lower foreign tax credits.
Our principal ongoing cash needs are to finance working capital, capital expenditures, debt payments, interest expense, share repurchases, dividends and acquisitions. Working capital is primarily in the form of trade receivables, which generally increase as revenues increase. The amount of financing necessary to support revenue growth depends on receivables turnover, which differs in each market where we operate.
Cash provided by operating activities was $306.2 million, $396.7 million and $331.6 million for 2014, 2013 and 2012, respectively. The decrease in cash generated from operating activities in 2014 from 2013 was primarily attributable to the increase in the CICE receivable, which by law is not collectible for three years. In 2013, we sold a portion of the 2013 receivable for net proceeds of $104.0 million. We also saw increased working capital needs in 2014 as a result of the growth in the business. The increase in 2013 compared to 2012 was primarily attributable to the higher operating earnings in 2013. Changes in operating assets and liabilities utilized $314.2 million of cash in 2014, primarily due to the increase in the CICE receivable, as compared to $50.9 million in 2013 and $13.8 million in 2012.
Accounts receivable decreased to $4,134.5 million as of December 31, 2014 from $4,277.9 million as of December 31, 2013, primarily due to the change in exchange rates, partially offset by increased business volume. Utilizing exchange rates as of December 31, 2013, the December 31, 2014 balance would have been approximately $417.6 million higher than reported.
Capital expenditures were $51.5 million, $44.7 million and $72.0 million during 2014, 2013 and 2012, respectively. These expenditures were primarily comprised of purchases of computer equipment, office furniture and other costs related to office openings and refurbishments, as well as capitalized software costs of $3.4 million, $0.5 million and $3.3 million in 2014, 2013 and 2012, respectively.
From time to time, we acquire and invest in companies throughout the world, including franchises. The total cash consideration paid for acquisitions, net of cash acquired, for the years ended December 31, 2014, 2013 and 2012 was $32.0 million, $46.3 million and $49.0 million, respectively. Goodwill and intangible assets resulting from the 2014 acquisitions, the majority of which took place in the Netherlands and the United Kingdom, were $39.4 million and $10.1 million, respectively, as of December 31, 2014. Goodwill and intangible assets resulting from the 2013 acquisitions, the majority of which took place in the United Kingdom and Norway, were $52.2 million and $10.1 million as of December 31, 2013, respectively.
In 2012, we acquired Damilo Group (“Damilo”), a French firm specializing in IT design solutions, for total consideration, net of cash acquired, of €21.2 ($28.0) million. Goodwill arising from this transaction was €30.8 ($40.6) million. The assumed liabilities and acquired assets, net of goodwill, related intangible assets and cash arising from the transaction were €33.8 ($44.6) million and €17.9 ($23.6) million, respectively. The related intangible assets were €5.0 ($6.8) million and €4.2 ($5.1) million as of December 31, 2013 and December 31, 2014, respectively.
Net debt borrowings were $13.4 million for 2014, as compared to net payments of $271.3 million in 2013 and net borrowings of $41.7 million in 2012. In June 2013, we paid off our €200.0 million 4.75% Notes with available cash upon maturity. We use excess cash to pay down borrowings under facilities when appropriate.
Management’s Discussion & Analysis of Financial Condition and Results of Operations
| ManpowerGroup | Annual Report 2014 | 39 |
We currently have authorization from our board of directors to repurchase 8.0 million shares of our common stock. Share repurchases may be made from time to time through a variety of methods, including open market purchases, block transactions, privately negotiated transactions, accelerated share repurchase programs, forward repurchase agreements or similar facilities. We repurchased 2.0 million shares at a cost of $143.5 million in 2014. No repurchases were made in 2013. In 2012, we repurchased a total of 3.6 million shares under previous authorizations at a total cost of $138.2 million. As of December 2014, there were 6.0 million shares remaining authorized for repurchase under this authorization and no shares remaining under any previous authorizations.
We have aggregate commitments of $1,343.1 million related to debt, operating leases, severances and office closure costs, and certain other commitments, as follows:
| (in millions) | Total | 2015 | 2016–2017 | 2018–2019 | Thereafter | |||||||||||||||
| Long-term debt including interest | $ | 491.7 | $ | 21.0 | $ | 38.6 | $ | 432.1 | $ | — | ||||||||||
| Short-term borrowings | 43.3 | 43.3 | — | — | — | |||||||||||||||
| Operating leases | 611.3 | 160.6 | 212.5 | 118.8 | 119.4 | |||||||||||||||
| Severances and other office closure costs | 12.9 | 9.2 | 2.8 | 0.9 | — | |||||||||||||||
| Other | 183.9 | 72.6 | 74.5 | 11.0 | 25.8 | |||||||||||||||
| $ | 1,343.1 | $ | 306.7 | $ | 328.4 | $ | 562.8 | $ | 145.2 | |||||||||||
Our liability for unrecognized tax benefits, including related interest and penalties, of $29.4 million is excluded from the commitments above as we cannot determine the years in which these positions might ultimately be settled.
We recorded net restructuring costs of $89.4 million and $48.8 million in 2013 and 2012, respectively, in selling and administrative expenses, primarily related to severances and office closures and consolidations in multiple countries. These expenses are net of reversals of previous accruals resulting mainly from larger-than-estimated cost savings from subleasing and lease buyouts. During 2014, we made payments of $35.5 million out of our restructuring reserve. We expect a majority of the remaining $12.9 million reserve will be paid by the end of 2015. (See Note 1 to the Consolidated Financial Statements for further information.)
We have entered into guarantee contracts and stand-by letters of credit that total approximately $172.6 million and $156.5 million as of December 31, 2014 and 2013, respectively ($126.8 million and $118.2 million for guarantees, respectively, and $45.8 million and $38.3 million for stand-by letters of credit, respectively). Guarantees primarily relate to bank accounts, operating leases and indebtedness. The stand-by letters of credit relate to workers’ compensation, operating leases and indebtedness. If certain conditions were met under these arrangements, we would be required to satisfy our obligation in cash. Due to the nature of these arrangements and our historical experience, we do not expect to make any significant payments under these arrangements. Therefore, they have been excluded from our aggregate commitments identified above. The cost of these guarantees and letters of credit was $1.9 million and $1.8 million in 2014 and 2013, respectively.
Total Capitalization
($ in millions)
($ in millions)
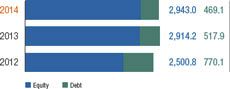
Total capitalization as of December 31, 2014 was $3,412.1 million, comprised of $469.1 million in debt and $2,943.0 million in equity. Debt as a percentage of total capitalization was 14%, 15% and 24% as of December 31, 2014, 2013 and 2012, respectively. The decrease in 2013 in debt as a percentage of total capitalization is primarily due to the repayment of the euro-denominated notes with available cash.
Management’s Discussion & Analysis of Financial Condition and Results of Operations
| 40 |
MANAGEMENT’S DISCUSSION & ANALYSIS OF FINANCIAL CONDITION AND RESULTS OF OPERATIONS
Euro Notes
We have €350.0 million aggregate principal amount 4.50% notes due June 22, 2018 (the “€350.0 million Notes”), which were issued at a price of 99.974% to yield an effective interest rate of 4.505%. Interest on the €350.0 million Notes is payable in arrears on June 22 of each year. The €350.0 million Notes are unsecured senior obligations and rank equally with all of our existing and future senior unsecured debt and other liabilities. We may redeem the €350.0 million Notes, in whole but not in part, at our option at any time for a redemption price determined in accordance with the term of the €350.0 million Notes. The €350.0 million Notes also contain certain customary non-financial restrictive covenants and events of default.
When the €350.0 million Notes mature, we plan to repay the amount with available cash, borrowings under our $600.0 million revolving credit facility or a new borrowing. The credit terms, including interest rate and facility fees, of any replacement borrowings will be dependent upon the condition of the credit markets at that time. We currently do not anticipate any problems accessing the credit markets should we decide to replace the €350.0 million Notes.
The €350.0 million Notes have been designated as a hedge of our net investment in subsidiaries with a euro-functional currency. Since our net investment in these subsidiaries exceeds the respective amount of the designated borrowings, translation gains or losses related to these borrowings are included as a component of accumulated other comprehensive (loss) income. (See Significant Matters Affecting Results of Operations and Notes 7 and 12 to the Consolidated Financial Statements for further information.)
Revolving Credit Agreement
On October 15, 2013, we amended and restated our Five-Year Credit Agreement (“the Amended Agreement”) with a syndicate of commercial banks. The Amended Agreement allows for borrowing of $600.0 million in various currencies, and up to $150.0 million may be used for the issuance of stand-by letters of credit. The Amended Agreement terminates on October 15, 2018 but permits the termination date of the facility to be extended by an additional year twice during the term of the Amended Agreement. We had no borrowings under this facility as of December 31, 2014 or 2013. Outstanding letters of credit issued under the Amended Agreement totaled $1.0 million and $0.9 million as of December 31, 2014 and 2013, respectively. Additional borrowings of $599.0 million and $599.1 million were available to us under the facility as of December 31, 2014 and 2013, respectively.
Under the Amended Agreement, a credit ratings-based pricing grid determines the facility fee and the credit spread that we add to the applicable interbank borrowing rate on all borrowings. At our current credit rating, the annual facility fee is 17.5 basis points paid on the entire $600.0 million facility and the credit spread is 107.5 basis points on any borrowings. A downgrade from both credit rating agencies would unfavorably impact our facility fees and result in additional costs ranging from approximately $0.3 million to $0.6 million annually.
The Amended Agreement contains customary restrictive covenants pertaining to our management and operations, including limitations on the amount of subsidiary debt that we may incur and limitations on our ability to pledge assets, as well as financial covenants requiring, among other things, that we comply with a leverage ratio (net Debt-to-EBITDA) of not greater than 3.5 to 1 and a fixed charge coverage ratio of not less than 1.5 to 1. The Amended Agreement also contains customary events of default, including, among others, payment defaults, material inaccuracy of representations and warranties, covenant defaults, bankruptcy or involuntary proceedings, certain monetary and non-monetary judgments, change of control and customary ERISA defaults.
Management’s Discussion & Analysis of Financial Condition and Results of Operations
| ManpowerGroup | Annual Report 2014 | 41 |
As defined in the Amended Agreement, we had a net Debt-to-EBITDA ratio of 0.21 to 1 (compared to the maximum allowable ratio of 3.5 to 1) and a Fixed Charge Coverage ratio of 4.25 to 1 (compared to the minimum required ratio of 1.5 to 1) as of December 31, 2014. Based on our current forecast, we expect to be in compliance with our financial covenants for the next 12 months.
Other
In addition to the previously mentioned facilities, we maintain separate bank credit lines with financial institutions to meet working capital needs of our subsidiary operations. As of December 31, 2014, such uncommitted credit lines totaled $331.9 million, of which $286.2 million was unused. Under the Amended Agreement, total subsidiary borrowings cannot exceed $300.0 million in the first, second and fourth quarters, and $600.0 million in the third quarter of each year. Due to these limitations, additional borrowings of $254.3 million could have been made under these lines as of December 31, 2014.
In April 2014, Standard and Poor’s raised our credit rating to BBB from BBB–, while maintaining the stable outlook. In December 2014, Moody’s Investors Services upgraded our long-term debt rating to Baa2 from Baa3 while changing the ratings outlook to stable from positive. The rating agencies use a proprietary methodology in determining their ratings and outlook which includes, among other things, financial ratios based upon debt levels and earnings performance. Both of the current credit ratings are investment grade.
APPLICATION OF CRITICAL ACCOUNTING POLICIES
The preparation of our financial statements in conformity with accounting principles generally accepted in the United States requires us to make estimates and assumptions that affect the reported amounts. A discussion of the more significant estimates follows. Management has discussed the development, selection and disclosure of these estimates and assumptions with the Audit Committee of our Board of Directors.
Allowance for Doubtful Accounts
We have an allowance for doubtful accounts recorded as an estimate of the accounts receivable balance that may not be collected. This allowance is calculated on an entity-by-entity basis with consideration for historical write-off experience, the current aging of receivables and a specific review for potential bad debts. Items that affect this balance mainly include bad debt expense and write-offs of accounts receivable balances.
Bad debt expense, which increases our allowance for doubtful accounts, is recorded as a selling and administrative expense and was $18.9 million, $24.1 million and $29.2 million for 2014, 2013 and 2012, respectively. Factors that would cause this provision to increase primarily relate to increased bankruptcies by our clients and other difficulties collecting amounts billed. On the other hand, an improved write-off experience and aging of receivables would result in a decrease to the provision.
Write-offs, which decrease our allowance for doubtful accounts, are recorded as a reduction to our accounts receivable balance and were $15.8 million, $26.4 million and $23.2 million for 2014, 2013 and 2012, respectively.
Employment-Related Items
The employment of contingent workers and permanent staff throughout the world results in the recognition of liabilities related to defined benefit pension plans, self-insured workers’ compensation, social program remittances and payroll tax audit exposures that require us to make estimates and assumptions in determining the proper reserve levels. These reserves involve significant estimates or judgments that are material to our financial statements.
Management’s Discussion & Analysis of Financial Condition and Results of Operations
| 42 |
MANAGEMENT’S DISCUSSION & ANALYSIS OF FINANCIAL CONDITION AND RESULTS OF OPERATIONS
Defined Benefit Pension Plans
We sponsor several qualified and nonqualified pension plans covering permanent employees. The most significant plans are located in the United Kingdom, the United States, the Netherlands, France and Norway. Annual expense relating to these plans is recorded in selling and administrative expenses and is estimated to be approximately $12.5 million in 2015, compared to $12.6 million, $11.8 million and $12.6 million in 2014, 2013 and 2012, respectively. Included in the 2013 expense was a $2.3 million curtailment gain resulting from an amendment to a defined benefit plan in the Netherlands. Effective January 1, 2013, the Netherlands’ defined benefit plan was frozen, and the participants were transitioned to a defined contribution plan.
The calculations of annual pension expense and the pension liability required at year-end include various actuarial assumptions such as discount rates, expected rate of return on plan assets, compensation increases and employee turnover rates. We review the actuarial assumptions on an annual basis and make modifications to the assumptions as necessary. We review market data and historical rates, on a country-by-country basis, to check for reasonableness in setting both the discount rate and the expected return on plan assets. We determine the discount rate based on an index of high-quality corporate bond yields and matched-funding yield curve analysis as of the end of each fiscal year. The expected return on plan assets is determined based on the expected returns of the various investment asset classes held in the plans. We estimate compensation increases and employee turnover rates for each plan based on the historical rates and the expected future rates for each respective country. Changes to any of these assumptions will impact the level of annual expense recorded related to the plans.
We used a weighted-average discount rate of 3.9% for the United States plans and 2.9% for non-United States plans in determining the estimated pension expense for 2015. These rates compare to the weighted-average discount rate of 4.6% for the United States plans and 4.1% for non-United States plans we used in determining the estimated pension expense for 2014, and reflect the current interest rate environment. Absent any other changes, a 25 basis point increase and decrease in the weighted-average discount rate would impact 2015 consolidated pension expense by approximately $0.1 million and $1.0 million for the United States plans and non-United States plans, respectively. We have selected a weighted-average expected return on plan assets of 5.5% for the United States plans and 3.2% for the non-United States plans in determining the estimated pension expense for 2015. The comparable rates used for the calculation of the 2014 pension expense were 6.0% and 4.5% for the United States plans and non-United States plans, respectively. A 25 basis point change in the weighted-average expected return on plan assets would impact 2015 consolidated pension expense by approximately $0.1 million for the United States plans and $0.9 million for the non-United States plans. Changes to these assumptions have historically not been significant in any jurisdiction for any reporting period, and no significant adjustments to the amounts recorded have been required in the past or are expected in the future. (See Note 8 to the Consolidated Financial Statements for further information.)
United States Workers’ Compensation
In the United States, we are under a self-insured retention program in most states covering workers’ compensation claims for our contingent workers. We determine the proper reserve balance using an actuarial valuation, which considers our historical payment experience and current employee demographics. Our reserve for such claims as of December 31, 2014 and 2013 was $79.8 million and $75.3 million, respectively. Workers’ compensation expense is recorded as a component of cost of services.
There are two main factors that impact workers’ compensation expense: the number of claims and the cost per claim. The number of claims is driven by the volume of hours worked, the business mix which reflects the type of work performed (for example, office and professional work has fewer claims than industrial work), and the safety of the environment where
Management’s Discussion & Analysis of Financial Condition and Results of Operations
| ManpowerGroup | Annual Report 2014 | 43 |
the work is performed. The cost per claim is driven primarily by the severity of the injury, related medical costs and lost-time wage costs. A 10% change in the number of claims or cost per claim would impact workers’ compensation expense in the United States by approximately $2.9 million.
Historically, we have not had significant changes in our assumptions used in calculating our reserve balance or significant adjustments to our reserve level. We continue our focus on safety, which includes training of contingent workers and client site reviews. Given our current claims experience and cost per claim, we do not expect a significant change in our workers’ compensation reserve in the near future.
Social Program Remittances and Payroll Tax Audit Exposure
On a routine basis, various governmental agencies in some of the countries and territories in which we operate audit our payroll tax calculations and our compliance with other payroll-related regulations. These audits focus primarily on documentation requirements and our support for our payroll tax remittances. Due to the nature of our business, the number of people that we employ, and the complexity of some payroll tax regulations, we may have some adjustments to the payroll tax remittances as a result of these audits.
We make an estimate of the additional remittances that may be required on a country-by-country basis, and record the estimate as a component of cost of services or selling and administrative expenses, as appropriate. Each country’s estimate is based on the results of past audits and the number of years that have not yet been audited, with consideration for changing business volumes and changes to the payroll tax regulations. To the extent that our actual experience differs from our estimates, we will need to make adjustments to our reserve balance, which will impact the results of the related operation and the operating segment in which it is reported. Other than France, we have not had any significant adjustments to the amounts recorded as a result of any payroll tax audits, and we do not expect any significant adjustments to the recorded amounts in the near term.
In particular, the French government has various social programs that are aimed at reducing the cost of labor and encouraging employment, particularly for low-wage workers, through the reduction of payroll taxes (or social contribution). Due to the number of new programs or program changes, and the complexity of compliance, we may have adjustments to the amount of reductions claimed as a result of the audits.
In France, we currently maintain a reserve related to these programs for 2007 through 2014, which has been estimated based on the results of past audits, changes in business volumes and the assessments related to the audit of 2009 through 2011. While some adjustment may be appropriate as we finalize the audits, we do not expect any significant adjustments to the recorded amount in the near term.
We experienced a significant increase in client claims against us in France during the second quarter of 2013, requesting refunds for various payroll tax subsidies that we had received dating back to 2003 related to our French temporary associates. In March 2014, the French Supreme Court ruled in our favor on this matter, confirming that, as a matter of law, the benefit of the payroll tax subsidies belongs to the direct employer of the temporary associates. We do not expect to incur any losses as all of these claims have now been withdrawn as a result of this ruling.
The French government passed legislation effective January 1, 2013 to improve the competitiveness and reduce employment costs by offering payroll tax credits to most French and foreign enterprises subject to corporate tax in France. This law, Credit d’Impôt pour la Compétitivité et l’Emploi (“CICE”), provides credits based on a percentage of wages paid to employees receiving less than two-and-a-half times the French minimum wage. The payroll tax credit is equal to 4% of eligible wages in 2013 and 6% of eligible wages in 2014 and beyond. We have used, and intend to use, the credit to invest
Management’s Discussion & Analysis of Financial Condition and Results of Operations
| 44 |
MANAGEMENT’S DISCUSSION & ANALYSIS OF FINANCIAL CONDITION AND RESULTS OF OPERATIONS
in employment opportunities and to improve our competitiveness, as required by the law. Due to the complexity of compliance with this law, we may have adjustments to the payroll tax credit amount as a result of any audits. The CICE credit is accounted for as a reduction of our cost of services in the period earned, and has had a favorable impact on our consolidated gross profit margin, as well as margins in France and Southern Europe.
The payroll tax credit is creditable against our current French income tax payable, with any remaining amount being paid after three years. Given the amount of our current income taxes payable, we would generally receive the vast majority of the CICE credits after the three-year period. In December 2013, we entered into an agreement to sell a portion of the credits earned in 2013 for net proceeds of $104.0 million. We derecognized these receivables upon the sale as the terms of the agreement are such that the transaction qualifies for sale treatment according to the accounting guidance on the transfer and servicing of assets. The discount on the sale of this receivable was recorded as a reduction of the payroll tax credits in cost of services. We received the cash from the sale in December 2013, which improved our operating cash flows in the fourth quarter of 2013.
Deferred Revenue
We recognize revenues under the current accounting guidance on revenue recognition. The accounting guidance generally provides that revenues for time-based services be recognized over the average length of the services being provided. For the outplacement line of business, we recognize revenues from individual programs and for larger projects over the estimated period in which services are rendered to candidates. In our consulting business, revenues are recognized upon the performance of the service under the consulting service contract. For performance-based contracts, we defer recognizing revenues until the performance criteria have been met.
The amounts billed for outplacement, consulting services and performance-based contracts in excess of the amount recognized as revenues are recorded as deferred revenue and included in accrued liabilities for the current portion and other long-term liabilities for the long-term portion in our Consolidated Balance Sheets.
Significant factors impacting deferred revenue are the type of programs and projects sold and the volume of current billings for new programs and projects. Over time, an increasing volume of new billings will generally result in higher amounts of deferred revenue, while decreasing levels of new billings will generally result in lower amounts of deferred revenue. As of December 31, 2014 and 2013, the current portion of deferred revenue was $35.5 million and $48.5 million, respectively, and the long-term portion of deferred revenue was zero and $10.0 million, respectively. The decrease in these amounts is primarily related to a client contract that ended in 2014.
Income Taxes
We account for income taxes in accordance with the accounting guidance on income taxes. Deferred tax assets and liabilities are recognized for the future tax consequences attributable to differences between financial statement carrying amounts of existing assets and liabilities and their respective tax basis, and net operating loss and tax credit carryforwards. Deferred tax assets and liabilities are measured using enacted tax rates expected to apply to taxable income in the years in which those temporary differences are expected to be recovered or settled. We record a valuation allowance against deferred tax assets for which utilization of the asset is not likely.
The accounting guidance related to uncertain tax positions requires an evaluation process for all tax positions taken that involves a review of probability for sustaining a tax position. If the probability for sustaining a tax position is more likely than not, which is a 50% threshold, then the tax position is warranted and the largest amount that would be realized upon ultimate settlement is recognized. An uncertain tax position, one which does not meet the 50% threshold, will not be recognized in the financial statements.
Management’s Discussion & Analysis of Financial Condition and Results of Operations
| ManpowerGroup | Annual Report 2014 | 45 |
Our judgment is required in determining our deferred tax assets and liabilities, and any valuation allowances recorded. Our net deferred tax assets may need to be adjusted in the event that tax rates are modified, or our estimates of future taxable income change, such that deferred tax assets or liabilities are expected to be recovered or settled at a different tax rate than currently estimated. In addition, valuation allowances may need to be adjusted in the event that our estimate of future taxable income changes from the amounts currently estimated. We have unrecognized tax benefits related to items in various countries and territories. To the extent these items are settled for an amount different than we currently expect, the unrecognized tax benefit will be adjusted.
We provide for income taxes on a quarterly basis based on an estimated annual tax rate. In determining this rate, we make estimates about taxable income for each of our largest locations worldwide, as well as the tax rate that will be in effect for each location. To the extent these estimates change during the year, or actual results differ from these estimates, our estimated annual tax rate may change between quarterly periods and may differ from the actual effective tax rate for the year.
Goodwill and Indefinite-Lived Intangible Asset Impairment
In accordance with the accounting guidance on goodwill and other intangible assets, we perform an annual impairment test of goodwill at our reporting unit level and indefinite-lived intangible assets at our unit of account level during the third quarter, or more frequently if events or circumstances change that would more likely than not reduce the fair value of our reporting units below their carrying value.
We performed our annual impairment test of our goodwill and indefinite-lived intangible assets during the third quarter of 2014, 2013 and 2012, and there was no impairment of our goodwill or our indefinite-lived intangible assets as a result of our annual tests.
Significant assumptions used in our annual goodwill impairment test during the third quarter of 2014 included: expected future revenue growth rates, operating unit profit margins, working capital levels, discount rates ranging from 11.7% to 17.8%, and a terminal value multiple. The expected future revenue growth rates and operating unit profit margins were determined after taking into consideration our historical revenue growth rates and operating unit profit margins, our assessment of future market potential, and our expectations of future business performance.
The table below provides our reporting units’ estimated fair values and carrying values, determined as part of our annual goodwill impairment test performed in the third quarter, representing approximately 76% of our consolidated goodwill balance as of September 30, 2014.
| Right | ||||||||||||||||||||
| (in millions) | France | United States | United Kingdom | Management | Netherlands | |||||||||||||||
| Estimated fair values | $ | 1,389.6 | $ | 1,287.6 | $ | 506.3 | $ | 294.4 | $ | 193.9 | ||||||||||
| Carrying values | 661.8 | 940.8 | 297.9 | 129.0 | 130.9 | |||||||||||||||
SIGNIFICANT MATTERS AFFECTING RESULTS OF OPERATIONS
Market Risks
We are exposed to the impact of foreign currency exchange rate fluctuations and interest rate changes.
Exchange Rates — Our exposure to foreign currency exchange rates relates primarily to our foreign subsidiaries and our euro-denominated borrowings. For our foreign subsidiaries, exchange rates impact the United States dollar value of our reported earnings, our investments in the subsidiaries and the intercompany transactions with the subsidiaries.
Management’s Discussion & Analysis of Financial Condition and Results of Operations
| 46 |
MANAGEMENT’S DISCUSSION & ANALYSIS OF FINANCIAL CONDITION AND RESULTS OF OPERATIONS
Approximately 85% of our revenues and profits are generated outside of the United States, with approximately 46% generated from our European operations with a euro-functional currency. As a result, fluctuations in the value of foreign currencies against the United States dollar, particularly the euro, may have a significant impact on our reported results. Revenues and expenses denominated in foreign currencies are translated into United States dollars at the monthly weighted-average exchange rates for the year. Consequently, as the value of the United States dollar changes relative to the currencies of our major markets, our reported results vary.
Throughout 2014, the United States dollar fluctuated, but generally strengthened, against many of the currencies of our major markets. Revenues from services in constant currency were approximately 1.5% higher than reported revenues in 2014. In 2013, the fluctuations in currencies resulted in no impact to our consolidated revenues from services. In both 2014 and 2013, a change in the strength of the United States dollar by 10% would have impacted our revenues from services by approximately 8.5% from the amounts reported.
During January 2015, the United States dollar strengthened by approximately 10% against certain currencies. If rates remain at this level, we will see a significant unfavorable impact on our reported revenues.
Fluctuations in currency exchange rates also impact the United States dollar amount of our shareholders’ equity. The assets and liabilities of our non-United States subsidiaries are translated into United States dollars at the exchange rates in effect at year-end. The resulting translation adjustments are recorded in shareholders’ equity as a component of accumulated other comprehensive (loss) income. The United States dollar strengthened relative to many foreign currencies as of December 31, 2014 compared to December 31, 2013. Consequently, shareholders’ equity decreased by $229.6 million as a result of the foreign currency translation as of December 31, 2014. If the United States dollar had strengthened an additional 10% as of December 31, 2014, resulting translation adjustments recorded in shareholders’ equity would have decreased by approximately $174.8 million from the amounts reported.
As of December 31, 2013, the United States dollar had weakened relative to many foreign currencies compared to December 31, 2012. Consequently, shareholders’ equity increased by $43.0 million as a result of the foreign currency translation as of December 31, 2013. If the United States dollar had weakened an additional 10% as of December 31, 2013, resulting translation adjustments recorded in shareholders’ equity would have increased by approximately $85.5 million from the amounts reported.
Although currency fluctuations impact our reported results and shareholders’ equity, such fluctuations generally do not affect our cash flow or result in actual economic gains or losses. Substantially all of our subsidiaries derive revenues and incur expenses within a single country and, consequently, do not generally incur currency risks in connection with the conduct of their normal business operations. We generally have few cross-border transfers of funds, except for transfers to the United States for payment of license fees and interest expense on intercompany loans, working capital loans made between the United States and our foreign subsidiaries, dividends from our foreign subsidiaries, and payments between certain countries and territories for services provided. To reduce the currency risk related to these transactions, we may borrow funds in the relevant foreign currency under our revolving credit agreement or we may enter into a forward contract to hedge the transfer.
As of December 31, 2014, there were £2.7 ($4.3) million of forward contracts that relate to cash flows owed to our foreign subsidiaries in 2015. Our forward contracts are not designated as hedges. Consequently, any gain or loss resulting from the change in fair value is recognized in the current period earnings as is the currency gain or loss on the amounts owed.
Management’s Discussion & Analysis of Financial Condition and Results of Operations
| ManpowerGroup | Annual Report 2014 | 47 |
As of December 31, 2014, we had outstanding $423.4 million in principal amount of euro-denominated notes (€350.0 million). The note has been designated as a hedge of our net investment in subsidiaries with a euro-functional currency. Since our net investment in these subsidiaries exceeds the respective amount of the designated borrowing, translation gains or losses related to the borrowing is included as a component of accumulated other comprehensive (loss) income. Shareholders’ equity increased by $36.1 million, net of tax, due to changes in accumulated other comprehensive (loss) income during the year due to the currency impact on these designated borrowings.
Interest Rates — Our exposure to market risk for changes in interest rates relates primarily to our variable rate long-term debt obligations. We have historically managed interest rates through the use of a combination of fixed- and variable-rate borrowings and interest rate swap agreements. As of December 31, 2014, we had the following fixed- and variable-rate borrowings:
| Weighted- | ||||||||
| Average |
||||||||
| (in millions) | Amount | Interest Rate(1) | ||||||
| Variable-rate borrowings | $ | 43.3 | 15.8 | % | ||||
| Fixed-rate borrowings | 425.8 | 4.5 | ||||||
| Total debt | $ | 469.1 | 5.5 | % | ||||
(1) The rates are impacted by currency exchange rate movements.
Sensitivity Analysis — The following tables summarize our debt and derivative instruments that are sensitive to foreign currency exchange rate and interest rate movements. All computations below are based on the United States dollar spot rate as of December 31, 2014 and 2013. The exchange rate computations assume a 10% appreciation or 10% depreciation of the euro and British pound to the United States dollar.
The hypothetical impact on 2014 and 2013 earnings and accumulated other comprehensive (loss) income of the stated change in rates is as follows:
| 2014 (in millions) | Movements In Exchange Rates | |||||||
| Market Sensitive Instrument | 10% Depreciation | 10% Appreciation | ||||||
| Euro notes: | ||||||||
| €350.0, 4.51% Notes due June 2018 | $ | 42.3 | (1) | $ | (42.3 | )(1) | ||
| Forward contracts: | ||||||||
| £2.7 to $4.3 | 0.4 | (0.4 | ) | |||||
| 2013 (in millions) | Movements In Exchange Rates | |||||||
| Market Sensitive Instrument | 10% Depreciation | 10% Appreciation | ||||||
| Euro notes: | ||||||||
| €350.0, 4.51% Notes due June 2018 | $ | 48.1 | (1) | $ | (48.1 | )(1) | ||
| Forward contracts: | ||||||||
| £7.8 to $12.5 | 1.3 | (1.3 | ) | |||||
| (1) | Exchange rate movements are recorded through accumulated other comprehensive (loss) income as these instruments have been designated as an economic hedge of our net investment in subsidiaries with a euro-functional currency. |
Management’s Discussion & Analysis of Financial Condition and Results of Operations
| 48 |
MANAGEMENT’S DISCUSSION & ANALYSIS OF FINANCIAL CONDITION AND RESULTS OF OPERATIONS
The hypothetical changes in the fair value of our market sensitive instruments due to changes in interest rates, and changes in foreign currency exchange rates for the forward contracts, are as follows:
| As of December 31, 2014 | ||||||||
| Market Sensitive Instrument (in millions) | 10% Decrease | 10% Increase | ||||||
| Fixed-rate debt: | ||||||||
| €350.0, 4.51% Notes due June 2018 | $ | 47.2 | (1) | $ | (47.2 | )(1) | ||
| Forward contracts: | ||||||||
| £2.7 to $4.3 | 0.4 | (0.4 | ) | |||||
| As of December 31, 2013 | ||||||||
| Market Sensitive Instrument (in millions) | 10% Decrease | 10% Increase | ||||||
| Fixed-rate debt: | ||||||||
| €350.0, 4.51% Notes due June 2018 | $ | 52.0 | (1) | $ | (52.0 | )(1) | ||
| Forward contracts: | ||||||||
| £7.8 to $12.5 | 1.3 | (1.3 | ) | |||||
| (1) | This change in fair value is not recorded in the Consolidated Financial Statements; however, disclosure of the fair value is included in Note 1 to the Consolidated Financial Statements. |
Impact of Economic Conditions
One of the principal attractions of using workforce solutions and service providers is to maintain a flexible supply of labor to meet changing economic conditions. Therefore, the industry has been and remains sensitive to economic cycles. To help minimize the effects of these economic cycles, we offer clients a continuum of services to meet their needs throughout the business cycle. We believe that the breadth of our operations and the diversity of our service mix cushion us against the impact of an adverse economic cycle in any single country or industry. However, adverse economic conditions in any of our largest markets, or in several markets simultaneously, would have a material impact on our consolidated financial results.
Legal Regulations
The workforce solutions and services industry is closely regulated in all of the major markets in which we operate except the United States and Canada. Many countries and territories impose licensing or registration requirements and substantive restrictions on employment services, either on the provider of recruitment services or the ultimate client company, or minimum benefits to be paid to the temporary employee either during or following the temporary assignment. Regulations also may restrict the length of assignments, the type of work permitted or the occasions on which contingent workers may be used. Changes in applicable laws or regulations have occurred in the past and are expected in the future to affect the extent to which workforce solutions and services firms may operate. These changes could impose additional costs, taxes, record keeping or reporting requirements; restrict the tasks to which contingent workers may be assigned; limit the duration of or otherwise impose restrictions on the nature of the relationship (with us or the client); or otherwise adversely affect the industry. All of our other service lines are currently not regulated.
In many markets, the existence or absence of collective bargaining agreements with labor organizations has a significant impact on our operations and the ability of clients to utilize our services. In some markets, labor agreements are structured on a national or industry-wide (rather than a company-by-company) basis. Changes in these collective bargaining agreements have occurred in the past, are expected to occur in the future, and may have a material impact on the operations of workforce solutions and services firms, including us.
Management’s Discussion & Analysis of Financial Condition and Results of Operations
| ManpowerGroup | Annual Report 2014 | 49 |
In Germany, the Confederation of German Trade Unions (representing eight German trade unions and over six million people) and the Employer’s Association of the Temporary Staffing Industry (representing two major temporary worker employers’ associations) entered into a new Collective Labor Agreement (CLA). The first phase of the CLA was effective in November 2013 and January 2014, and required higher wages to temporary employees and higher cost for vacation, sick pay, and temporary staff time accounts. In 2015, the second phase of the CLA will take effect with the creation of salary bands in January and approximately a 3.5% to 4.5% wage increase in April. These changes will have an unfavorable impact on our gross profit margin in Germany, as we pass on many of these additional costs to the client without a mark-up. However, the first phase of the CLA did not have a significant impact on our consolidated or Northern Europe financial results in 2014, and we currently do not expect the impact of the other changes will be significant.
The Agency Workers Directive (“AWD”) impacts all EU member states and was passed to ensure “equal treatment” for agency (temporary) workers. It also requires all member states to review and address unnecessary prohibitions and restrictions on the use of agency workers. Equal treatment had been in place by law in many countries; therefore, we have not seen any significant changes. We have seen a decline in gross profit margin in some countries, as any cost increases could not always be passed on with a normal mark-up, but there was no other significant impact on our business from these changes.
In June 2013, the employer mandate provisions of the new U.S. healthcare legislation, Patient Protection and Affordable Care Act (PPACA), were delayed until 2015 from the original effective date of 2014. The employer mandate provisions of PPACA are expected to have the greatest financial impact on us and our clients with U.S.-based employees. We expect this legislation will increase the employment costs of our permanent employees and our associates, but we continue to assess the potential impact. Our intention is to pass on to our U.S. clients any cost increases related to our associates; however, there is no assurance that we will be fully successful.
Recently Issued Accounting Standards
See Note 1 to the Consolidated Financial Statements.
Forward-Looking Statements
Statements made in this annual report that are not statements of historical fact are forward-looking statements. All forward-looking statements involve risks and uncertainties. The information under the heading “Forward-Looking Statements” in our annual report on Form 10-K for the year ended December 31, 2014, which information is incorporated herein by reference, provides cautionary statements identifying, for purposes of the safe harbor provisions of the Private Securities Litigation Reform Act of 1995, important factors that could cause our actual results to differ materially from those contained in the forward-looking statements. Some or all of the factors identified in our annual report on Form 10-K may be beyond our control. Forward-looking statements can be identified by words such as “expect,” “anticipate,” “intend,” “plan,” “may,” “believe,” “seek,” “estimate,” and similar expressions. We caution that any forward-looking statement reflects only our belief at the time the statement is made. We undertake no obligation to update any forward-looking statements to reflect subsequent events or circumstances.
Management’s Discussion & Analysis of Financial Condition and Results of Operations
| 50 |
MANAGEMENT REPORT ON INTERNAL CONTROL OVER FINANCIAL REPORTING
We are responsible for establishing and maintaining effective internal control over financial reporting as defined in Rule 13a-15(f) under the Securities Exchange Act of 1934. Our internal control over financial reporting is a process designed to provide reasonable assurance to management and the Board of Directors regarding the reliability of financial reporting and the preparation of financial statements for external purposes in accordance with generally accepted accounting principles.
Because of its inherent limitations, internal control over financial reporting may not prevent or detect misstatements. Also, projections of any evaluation of effectiveness to future periods are subject to the risk that controls may become inadequate because of changes in conditions, or that the degree of compliance with the policies or procedures may deteriorate.
Under the supervision and with the participation of management, including our Chief Executive Officer and our Executive Vice President and Chief Financial Officer, we conducted an evaluation of the effectiveness of our internal control over financial reporting based on the framework in Internal Control — Integrated Framework (2013) issued by the Committee of Sponsoring Organizations of the Treadway Commission. This evaluation included review of the documentation of controls, evaluation of the design effectiveness of controls, testing of the operating effectiveness of controls and a conclusion on this evaluation. Deloitte & Touche LLP, our independent registered public accounting firm, issued an attestation report on the effectiveness of our internal control over financial reporting as of December 31, 2014, which is included herein. Based on our evaluation we have concluded that our internal control over financial reporting was effective as of December 31, 2014.
February 20, 2015
Management Report on Internal Control Over Financial Reporting
| ManpowerGroup | Annual Report 2014 | 51 |
REPORT OF INDEPENDENT REGISTERED PUBLIC ACCOUNTING FIRM
TO THE BOARD OF DIRECTORS AND SHAREHOLDERS OF MANPOWERGROUP INC.
We have audited the accompanying consolidated balance sheets of ManpowerGroup Inc. and subsidiaries (the “Company”) as of December 31, 2014 and 2013, and the related consolidated statements of operations, comprehensive income (loss), shareholders’ equity, and cash flows for each of the three years in the period ended December 31, 2014. These financial statements are the responsibility of the Company’s management. Our responsibility is to express an opinion on these financial statements based on our audits.
We conducted our audits in accordance with the standards of the Public Company Accounting Oversight Board (United States). Those standards require that we plan and perform the audit to obtain reasonable assurance about whether the financial statements are free of material misstatement. An audit includes examining, on a test basis, evidence supporting the amounts and disclosures in the financial statements. An audit also includes assessing the accounting principles used and significant estimates made by management, as well as evaluating the overall financial statement presentation. We believe that our audits provide a reasonable basis for our opinion.
In our opinion, such consolidated financial statements present fairly, in all material respects, the financial position of the Company as of December 31, 2014 and 2013, and the results of their operations and their cash flows for each of the three years in the period ended December 31, 2014, in conformity with accounting principles generally accepted in the United States of America.
We have also audited, in accordance with the standards of the Public Company Accounting Oversight Board (United States), the Company’s internal control over financial reporting as of December 31, 2014, based on criteria established in Internal Control-Integrated Framework (2013) issued by the Committee of Sponsoring Organizations of the Treadway Commission and our report dated February 20, 2015 expressed an unqualified opinion on the Company’s internal control over financial reporting.

Milwaukee, Wisconsin
February 20, 2015
Report of Independent Registered Public Accounting Firm
| 52 |
REPORT OF INDEPENDENT REGISTERED PUBLIC ACCOUNTING FIRM
TO THE BOARD OF DIRECTORS AND SHAREHOLDERS OF MANPOWERGROUP INC.
We have audited the internal control over financial reporting of ManpowerGroup Inc. and subsidiaries (the “Company”) as of December 31, 2014, based on criteria established in Internal Control — Integrated Framework (2013) issued by the Committee of Sponsoring Organizations of the Treadway Commission. The Company’s management is responsible for maintaining effective internal control over financial reporting and for its assessment of the effectiveness of internal control over financial reporting, included in the accompanying Management Report on Internal Control over Financial Reporting. Our responsibility is to express an opinion on the Company’s internal control over financial reporting based on our audit.
We conducted our audit in accordance with the standards of the Public Company Accounting Oversight Board (United States). Those standards require that we plan and perform the audit to obtain reasonable assurance about whether effective internal control over financial reporting was maintained in all material respects. Our audit included obtaining an understanding of internal control over financial reporting, assessing the risk that a material weakness exists, testing and evaluating the design and operating effectiveness of internal control based on the assessed risk, and performing such other procedures as we considered necessary in the circumstances. We believe that our audit provides a reasonable basis for our opinion.
A company’s internal control over financial reporting is a process designed by, or under the supervision of, the company’s principal executive and principal financial officers, or persons performing similar functions, and effected by the company’s board of directors, management, and other personnel to provide reasonable assurance regarding the reliability of financial reporting and the preparation of financial statements for external purposes in accordance with generally accepted accounting principles. A company’s internal control over financial reporting includes those policies and procedures that (1) pertain to the maintenance of records that, in reasonable detail, accurately and fairly reflect the transactions and dispositions of the assets of the company; (2) provide reasonable assurance that transactions are recorded as necessary to permit preparation of financial statements in accordance with generally accepted accounting principles, and that receipts and expenditures of the company are being made only in accordance with authorizations of management and directors of the company; and (3) provide reasonable assurance regarding prevention or timely detection of unauthorized acquisition, use, or disposition of the company’s assets that could have a material effect on the financial statements.
Because of the inherent limitations of internal control over financial reporting, including the possibility of collusion or improper management override of controls, material misstatements due to error or fraud may not be prevented or detected on a timely basis. Also, projections of any evaluation of the effectiveness of the internal control over financial reporting to future periods are subject to the risk that the controls may become inadequate because of changes in conditions, or that the degree of compliance with the policies or procedures may deteriorate.
In our opinion, the Company maintained, in all material respects, effective internal control over financial reporting as of December 31, 2014, based on the criteria established in Internal Control — Integrated Framework (2013) issued by the Committee of Sponsoring Organizations of the Treadway Commission.
We have also audited, in accordance with the standards of the Public Company Accounting Oversight Board (United States), the consolidated financial statements as of and for the year ended December 31, 2014 of the Company and our report dated February 20, 2015 expressed an unqualified opinion on those financial statements.
Milwaukee, Wisconsin
February 20, 2015
Report of Independent Registered Public Accounting Firm
| ManpowerGroup | Annual Report 2014 | 53 |
CONSOLIDATED STATEMENTS OF OPERATIONS
in millions, except per share data
| Year Ended December 31 | 2014 | 2013 | 2012 | |||||||||
| Revenues from services | $ | 20,762.8 | $ | 20,250.5 | $ | 20,678.0 | ||||||
| Cost of services | 17,274.6 | 16,883.8 | 17,236.0 | |||||||||
| Gross profit | 3,488.2 | 3,366.7 | 3,442.0 | |||||||||
| Selling and administrative expenses | 2,768.3 | 2,854.8 | 3,030.3 | |||||||||
| Operating profit | 719.9 | 511.9 | 411.7 | |||||||||
| Interest and other expenses | 38.3 | 36.4 | 43.3 | |||||||||
| Earnings before income taxes | 681.6 | 475.5 | 368.4 | |||||||||
| Provision for income taxes | 254.0 | 187.5 | 170.8 | |||||||||
| Net earnings | $ | 427.6 | $ | 288.0 | $ | 197.6 | ||||||
| Net earnings per share — basic | $ | 5.38 | $ | 3.69 | $ | 2.49 | ||||||
| Net earnings per share — diluted | $ | 5.30 | $ | 3.62 | $ | 2.47 | ||||||
| Weighted average shares — basic | 79.5 | 78.0 | 79.5 | |||||||||
| Weighted average shares — diluted | 80.7 | 79.6 | 80.1 | |||||||||
The accompanying Notes to Consolidated Financial Statements are an integral part of these statements.
CONSOLIDATED STATEMENTS OF COMPREHENSIVE INCOME
in millions
| Year Ended December 31 | 2014 | 2013 | 2012 | |||||||||
| Net earnings | $ | 427.6 | $ | 288.0 | $ | 197.6 | ||||||
| Other comprehensive (loss) income: | ||||||||||||
| Foreign currency translation adjustments | (265.9 | ) | 52.7 | 0.2 | ||||||||
| Translation adjustments on net investment hedge, net of income taxes of $20.3, $(5.4) and $(4.8), respectively | 36.1 | (9.5 | ) | (7.9 | ) | |||||||
| Translation adjustments of long-term intercompany loans | 0.2 | (0.2 | ) | 15.7 | ||||||||
| Unrealized gain (loss) on investments, net of income taxes of $2.1, $(2.3) and $1.1, respectively | 5.2 | (0.3 | ) | 3.6 | ||||||||
| Defined benefit pension plans and retiree health care plan, net of income taxes of $(8.6), $5.2 and $(4.3), respectively | (13.0 | ) | 5.1 | (12.5 | ) | |||||||
| Total other comprehensive (loss) income | $ | (237.4 | ) | $ | 47.8 | $ | (0.9 | ) | ||||
| Comprehensive income | $ | 190.2 | $ | 335.8 | $ | 196.7 | ||||||
The accompanying Notes to Consolidated Financial Statements are an integral part of these statements.
Consolidated Statements of Operations and Consolidated Statements of Comprehensive Income
| 54 |
CONSOLIDATED BALANCE SHEETS
in millions, except share and per share data
| December 31 | 2014 | 2013 | ||||||
| ASSETS | ||||||||
| Current Assets | ||||||||
| Cash and cash equivalents | $ | 699.2 | $ | 737.6 | ||||
| Accounts receivable, less allowance for doubtful accounts of $111.4 and $118.6, respectively | 4,134.5 | 4,277.9 | ||||||
| Prepaid expenses and other assets | 147.8 | 161.3 | ||||||
| Future income tax benefits | 52.2 | 66.2 | ||||||
| Total current assets | 5,033.7 | 5,243.0 | ||||||
| Other Assets | ||||||||
| Goodwill | 1,075.2 | 1,090.9 | ||||||
| Intangible assets, less accumulated amortization of $276.2 and $247.9, respectively | 286.8 | 309.1 | ||||||
| Other assets | 637.7 | 479.3 | ||||||
| Total other assets | 1,999.7 | 1,879.3 | ||||||
| Property and Equipment | ||||||||
| Land, buildings, leasehold improvements and equipment | 633.5 | 706.2 | ||||||
| Less: accumulated depreciation and amortization | 484.4 | 540.2 | ||||||
| Net property and equipment | 149.1 | 166.0 | ||||||
| Total assets | $ | 7,182.5 | $ | 7,288.3 | ||||
| LIABILITIES AND SHAREHOLDERS’ EQUITY | ||||||||
| Current Liabilities | ||||||||
| Accounts payable | $ | 1,542.7 | $ | 1,523.9 | ||||
| Employee compensation payable | 204.5 | 230.4 | ||||||
| Accrued liabilities | 493.3 | 536.1 | ||||||
| Accrued payroll taxes and insurance | 622.4 | 680.7 | ||||||
| Value added taxes payable | 466.3 | 502.5 | ||||||
| Short-term borrowings and current maturities of long-term debt | 45.2 | 36.0 | ||||||
| Total current liabilities | 3,374.4 | 3,509.6 | ||||||
| Other Liabilities | ||||||||
| Long-term debt | 423.9 | 481.9 | ||||||
| Other long-term liabilities | 441.2 | 382.6 | ||||||
| Total other liabilities | 865.1 | 864.5 | ||||||
| Shareholders’ Equity | ||||||||
| Preferred stock, $.01 par value, authorized 25,000,000 shares, none issued | — | — | ||||||
| Common stock, $.01 par value, authorized 125,000,000 shares, issued 112,876,552 and 112,014,673 shares, respectively | 1.1 | 1.1 | ||||||
| Capital in excess of par value | 3,084.2 | 3,014.0 | ||||||
| Retained earnings | 1,667.8 | 1,317.5 | ||||||
| Accumulated other comprehensive (loss) income | (155.2 | ) | 82.2 | |||||
| Treasury stock at cost, 34,762,316 and 32,658,685 shares, respectively | (1,654.9 | ) | (1,500.6 | ) | ||||
| Total shareholders’ equity | 2,943.0 | 2,914.2 | ||||||
| Total liabilities and shareholders’ equity | $ | 7,182.5 | $ | 7,288.3 | ||||
The accompanying Notes to Consolidated Financial Statements are an integral part of these statements.
Consolidated Balance Sheets
| ManpowerGroup | Annual Report 2014 | 55 |
CONSOLIDATED STATEMENTS OF CASH FLOWS
in millions
| Year Ended December 31 | 2014 | 2013 | 2012 | |||||||||
| Cash Flows from Operating Activities | ||||||||||||
| Net earnings | $ | 427.6 | $ | 288.0 | $ | 197.6 | ||||||
| Adjustments to reconcile net earnings to net cash provided by operating activities: | ||||||||||||
| Depreciation and amortization | 83.8 | 94.3 | 100.5 | |||||||||
| Deferred income taxes | 54.0 | 17.0 | (11.6 | ) | ||||||||
| Provision for doubtful accounts | 18.9 | 24.1 | 29.2 | |||||||||
| Share-based compensation | 40.6 | 31.5 | 30.0 | |||||||||
| Excess tax benefit on exercise of share-based awards | (4.5 | ) | (7.3 | ) | (0.3 | ) | ||||||
| Change in operating assets and liabilities, excluding the impact of acquisitions: | ||||||||||||
| Accounts receivable | (270.5 | ) | (82.6 | ) | 48.3 | |||||||
| Other assets | (198.7 | ) | (35.9 | ) | (9.2 | ) | ||||||
| Other liabilities | 155.0 | 67.6 | (52.9 | ) | ||||||||
| Cash provided by operating activities | 306.2 | 396.7 | 331.6 | |||||||||
| Cash Flows from Investing Activities | ||||||||||||
| Capital expenditures | (51.5 | ) | (44.7 | ) | (72.0 | ) | ||||||
| Acquisitions of businesses, net of cash acquired | (32.0 | ) | (46.3 | ) | (49.0 | ) | ||||||
| Proceeds from the sale of property and equipment | 2.1 | 3.4 | 3.7 | |||||||||
| Cash used in investing activities | (81.4 | ) | (87.6 | ) | (117.3 | ) | ||||||
| Cash Flows from Financing Activities | ||||||||||||
| Net change in short-term borrowings | 16.0 | (5.7 | ) | (6.7 | ) | |||||||
| Proceeds from long-term debt | — | 3.9 | 751.6 | |||||||||
| Repayments of long-term debt | (2.6 | ) | (269.5 | ) | (703.2 | ) | ||||||
| Proceeds from share-based awards | 25.5 | 101.0 | 6.0 | |||||||||
| Other share-based award transactions, net | (6.3 | ) | 16.1 | (6.3 | ) | |||||||
| Repurchases of common stock | (143.5 | ) | — | (138.2 | ) | |||||||
| Dividends paid | (77.3 | ) | (72.0 | ) | (67.8 | ) | ||||||
| Cash used in financing activities | (188.2 | ) | (226.2 | ) | (164.6 | ) | ||||||
| Effect of exchange rate changes on cash | (75.0 | ) | 6.6 | 17.9 | ||||||||
| Net (decrease) increase in cash and cash equivalents | (38.4 | ) | 89.5 | 67.6 | ||||||||
| Cash and cash equivalents, beginning of year | 737.6 | 648.1 | 580.5 | |||||||||
| Cash and cash equivalents, end of year | $ | 699.2 | $ | 737.6 | $ | 648.1 | ||||||
| Supplemental Cash Flow Information | ||||||||||||
| Interest paid | $ | 36.6 | $ | 43.5 | $ | 39.9 | ||||||
| Income taxes paid, net | $ | 105.8 | $ | 60.3 | $ | 123.0 | ||||||
The accompanying Notes to Consolidated Financial Statements are an integral part of these statements.
Consolidated Statements of Cash Flows
| 56 |
CONSOLIDATED STATEMENTS OF SHAREHOLDERS’ EQUITY
in millions, except share and per share data
| Accumulated | ||||||||||||||||||||||||||||
| Capital in | Other | |||||||||||||||||||||||||||
| Common Stock | Excess of | Retained | Comprehensive | Treasury | ||||||||||||||||||||||||
| Shares Issued | Par Value | Par Value | Earnings | (Loss) Income | Stock | Total | ||||||||||||||||||||||
| Balance, January 1, 2012 | 109,076,337 | $ | 1.1 | $ | 2,839.9 | $ | 971.7 | $ | 35.3 | $ | (1,364.6 | ) | $ | 2,483.4 | ||||||||||||||
| Net earnings | 197.6 | 197.6 | ||||||||||||||||||||||||||
| Other comprehensive loss | (0.9 | ) | (0.9 | ) | ||||||||||||||||||||||||
| Issuances under equity plans, including tax benefits | 467,155 | 3.3 | (6.6 | ) | (3.3 | ) | ||||||||||||||||||||||
| Share-based compensation expense | 30.0 | 30.0 | ||||||||||||||||||||||||||
| Dividends ($0.86 per share) | (67.8 | ) | (67.8 | ) | ||||||||||||||||||||||||
| Repurchases of common stock | (138.2 | ) | (138.2 | ) | ||||||||||||||||||||||||
| Balance, December 31, 2012 | 109,543,492 | 1.1 | 2,873.2 | 1,101.5 | 34.4 | (1,509.4 | ) | 2,500.8 | ||||||||||||||||||||
| Net earnings | 288.0 | 288.0 | ||||||||||||||||||||||||||
| Other comprehensive income | 47.8 | 47.8 | ||||||||||||||||||||||||||
| Issuances under equity plans, including tax benefits | 2,471,181 | 109.3 | 8.8 | 118.1 | ||||||||||||||||||||||||
| Share-based compensation expense | 31.5 | 31.5 | ||||||||||||||||||||||||||
| Dividends ($0.92 per share) | (72.0 | ) | (72.0 | ) | ||||||||||||||||||||||||
| Balance, December 31, 2013 | 112,014,673 | 1.1 | 3,014.0 | 1,317.5 | 82.2 | (1,500.6 | ) | 2,914.2 | ||||||||||||||||||||
| Net earnings | 427.6 | 427.6 | ||||||||||||||||||||||||||
| Other comprehensive loss | (237.4 | ) | (237.4 | ) | ||||||||||||||||||||||||
| Issuances under equity plans, including tax benefits | 861,879 | 29.6 | (10.8 | ) | 18.8 | |||||||||||||||||||||||
| Share-based compensation expense | 40.6 | 40.6 | ||||||||||||||||||||||||||
| Dividends ($0.98 per share) | (77.3 | ) | (77.3 | ) | ||||||||||||||||||||||||
| Repurchases of common stock | (143.5 | ) | (143.5 | ) | ||||||||||||||||||||||||
| Balance, December 31, 2014 | 112,876,552 | $ | 1.1 | $ | 3,084.2 | $ | 1,667.8 | $ | (155.2 | ) | $ | (1,654.9 | ) | $ | 2,943.0 | |||||||||||||
The accompanying Notes to Consolidated Financial Statements are an integral part of these statements.
Consolidated Statements of Shareholders’ Equity
| ManpowerGroup | Annual Report 2014 | 57 |
NOTES TO CONSOLIDATED FINANCIAL STATEMENTS
in millions, except share and per share data
Note 01. Summary of Significant Accounting Policies
Nature of Operations
ManpowerGroup Inc. is a world leader in the innovative workforce solutions and services industry. Our global network of 3,000 offices in 80 countries and territories allows us to meet the needs of our global, multinational and local clients across all major industry segments. Our largest operations, based on revenues, are located in the United States, France, Italy and the United Kingdom. We specialize in permanent, temporary and contract recruitment and assessment; training and development; outsourcing; career management and workforce consulting services. We provide services to a wide variety of clients, none of which individually comprise a significant portion of revenues for us as a whole.
Use of Estimates
The preparation of financial statements in conformity with accounting principles generally accepted in the United States requires us to make estimates and assumptions that affect the reported amounts of assets and liabilities and disclosure of contingent assets and liabilities at the date of the financial statements and the reported amounts of revenues and expenses for the reporting period. Actual results could differ from these estimates.
Basis of Consolidation
The Consolidated Financial Statements include our operating results and the operating results of all of our subsidiaries. For subsidiaries in which we have an ownership interest of 50% or less, but more than 20%, the Consolidated Financial Statements reflect our ownership share of those earnings using the equity method of accounting. These investments, as well as certain other relationships, are also evaluated for consolidation under the accounting guidance on consolidation of variable interest entities. These investments were $132.3 and $140.2 as of December 31, 2014 and 2013, respectively, and are included in other assets in the Consolidated Balance Sheets. Included in shareholders’ equity as of December 31, 2014 and 2013 are $77.4 and $74.4, respectively, of unremitted earnings from investments accounted for using the equity method. All significant intercompany accounts and transactions have been eliminated in consolidation.
Revenues and Receivables
We generate revenues from sales of services by our company-owned branch operations and from fees earned on sales of services by our franchise operations. Revenues are recognized as services are performed. The majority of our revenues are generated by our recruitment business, where billings are generally negotiated and invoiced on a per-hour basis. Accordingly, as contingent workers are placed, we record revenues based on the hours worked. Permanent recruitment revenues are recorded as placements are made. Provisions for sales allowances, based on historical experience, are recognized at the time the related sale is recognized.
Our franchise agreements generally state that franchise fees are calculated based on a percentage of revenues. We record franchise fee revenues monthly based on the amounts due under the franchise agreements for that month. Franchise fees, which are included in revenues from services, were $25.4, $24.4 and $23.9 for the years ended December 31, 2014, 2013 and 2012, respectively.
Notes to Consolidated Financial Statements
| 58 |
NOTES TO CONSOLIDATED FINANCIAL STATEMENTS
in millions, except share and per share data
In our outplacement business, we recognize revenues from individual programs and for large projects over the estimated period in which services are rendered to candidates. In our consulting business, revenues are recognized upon the performance of the service under the consulting service contract. For performance-based contracts, we defer recognizing revenues until the performance criteria have been met.
The amounts billed for outplacement, consulting services and performance-based contracts in excess of the amount recognized as revenues are recorded as deferred revenue and included in accrued liabilities for the current portion and other long-term liabilities for the long-term portion in our Consolidated Balance Sheets. As of December 31, 2014 and 2013, the current portion of deferred revenue was $35.5 and $48.5, respectively, and the long-term portion of deferred revenue was zero and $10.0, respectively. The decrease in these amounts is primarily related to a client contract that ended in 2014.
We record revenues from sales of services and the related direct costs in accordance with the accounting guidance on reporting revenue gross as a principal versus net as an agent. In situations where we act as a principal in the transaction, we report gross revenues and cost of services. When we act as an agent, we report the revenues on a net basis. Amounts billed to clients for out-of-pocket or other cost reimbursements are included in revenues from services, and the related costs are included in cost of services.
Allowance for Doubtful Accounts
We have an allowance for doubtful accounts recorded as an estimate of the accounts receivable balance that may not be collected. This allowance is calculated on an entity-by-entity basis with consideration for historical write-off experience, the current aging of receivables and a specific review for potential bad debts. Items that affect this balance mainly include bad debt expense and the write-off of accounts receivable balances.
Bad debt expense is recorded as selling and administrative expenses in our Consolidated Statements of Operations and was $18.9, $24.1 and $29.2 in 2014, 2013 and 2012, respectively. Factors that would cause this provision to increase primarily relate to increased bankruptcies by our clients and other difficulties collecting amounts billed. On the other hand, an improved write-off experience and aging of receivables would result in a decrease to the provision. Write-offs were $15.8, $26.4 and $23.2 for 2014, 2013 and 2012, respectively.
Advertising Costs
We expense production costs of advertising as they are incurred. Advertising expenses were $25.7, $22.3 and $27.2 in 2014, 2013 and 2012, respectively.
Restructuring Costs
We recorded net restructuring costs of $89.4 and $48.8 in 2013 and 2012, respectively, in selling and administrative expenses, primarily related to severances and office closures and consolidations in multiple countries and territories. These expenses are net of reversals of previous accruals resulting mainly from larger-than-estimated cost savings from subleasing and lease buyouts. During 2014, we made payments of $35.5 out of our restructuring reserve. We expect a majority of the
Notes to Consolidated Financial Statements
| ManpowerGroup | Annual Report 2014 | 59 |
remaining $12.9 reserve will be paid by the end of 2015. Changes in the restructuring liability balances for each reportable segment and Corporate are as follows:
| Southern | Northern | Right | ||||||||||||||||||||||||||
| Americas(1) | Europe(2) | Europe | APME | Management | Corporate | Total | ||||||||||||||||||||||
| Balance, January 1, 2013 | $ | 4.5 | $ | 4.7 | $ | 15.6 | $ | — | $ | 6.6 | $ | 10.0 | $ | 41.4 | ||||||||||||||
| Severance costs, net | 15.2 | 6.2 | 24.7 | 2.7 | 9.1 | 4.4 | 62.3 | |||||||||||||||||||||
| Office closure costs, net | 2.8 | 1.6 | 14.3 | 3.5 | 4.9 | — | 27.1 | |||||||||||||||||||||
| Costs paid or utilized | (15.7 | ) | (8.0 | ) | (32.4 | ) | (4.4 | ) | (8.3 | ) | (13.6 | ) | (82.4 | ) | ||||||||||||||
| Balance, December 31, 2013 | 6.8 | 4.5 | 22.2 | 1.8 | 12.3 | 0.8 | 48.4 | |||||||||||||||||||||
| Costs paid or utilized | (5.7 | ) | (2.2 | ) | (16.4 | ) | (1.3 | ) | (10.0 | ) | 0.1 | (35.5 | ) | |||||||||||||||
| Balance, December 31, 2014 | $ | 1.1 | $ | 2.3 | $ | 5.8 | $ | 0.5 | $ | 2.3 | $ | 0.9 | $ | 12.9 | ||||||||||||||
| (1) | Balance related to United States was $3.8 as of January 1, 2013. In 2013, United States incurred $7.8 for severance costs and $1.8 for office closure costs and paid/utilized $8.3, leaving a $5.1 liability as of December 31, 2013. In 2014, United States paid/utilized $4.1, leaving a $1.0 liability as of December 31, 2014. |
| (2) | Balance related to France was $3.8 as of January 1, 2013. In 2013, France incurred $0.6 for severance costs and $1.6 for office closure costs and paid/utilized $2.5, leaving a $3.5 liability as of December 31, 2013. In 2014, France paid/utilized $1.4, leaving a $2.1 liability as of December 31, 2014. Italy had a $0.9 liability as of January 1, 2013. In 2013, Italy recorded severance costs of $3.4 and paid out $3.4, leaving a $0.9 liability as of December 31, 2013. In 2014, Italy paid/utilized $0.9, leaving no liability as of December 31, 2014. |
Income Taxes
We account for income taxes in accordance with the accounting guidance on income taxes. Deferred tax assets and liabilities are recognized for the future tax consequences attributable to differences between financial statement carrying amounts of existing assets and liabilities and their respective tax basis, and net operating loss and tax credit carryforwards. Deferred tax assets and liabilities are measured using enacted tax rates expected to apply to taxable income in the years in which those temporary differences are expected to be recovered or settled. We record a valuation allowance against deferred tax assets for which utilization of the asset is not likely.
Fair Value Measurements
The assets and liabilities measured and recorded at fair value on a recurring basis were as follows:
| Fair Value Measurements Using | Fair Value Measurements Using | |||||||||||||||||||||||||||||||
| Quoted | Quoted | |||||||||||||||||||||||||||||||
| Prices in | Prices in | |||||||||||||||||||||||||||||||
| Active | Significant | Active | Significant | |||||||||||||||||||||||||||||
| Markets for | Other | Significant | Markets for | Other | Significant | |||||||||||||||||||||||||||
| Identical | Observable | Unobservable | Identical | Observable | Unobservable | |||||||||||||||||||||||||||
| December 31, | Assets | Inputs | Inputs | December 31, | Assets | Inputs | Inputs | |||||||||||||||||||||||||
| 2014 | (Level 1) | (Level 2) | (Level 3) | 2013 | (Level 1) | (Level 2) | (Level 3) | |||||||||||||||||||||||||
| Assets | ||||||||||||||||||||||||||||||||
| Foreign currency forward contracts | $ | 0.1 | $ | — | $ | 0.1 | $ | — | $ | 0.3 | $ | — | $ | 0.3 | $ | — | ||||||||||||||||
| Deferred compensation plan assets | 81.4 | 81.4 | — | — | 71.6 | 71.6 | — | — | ||||||||||||||||||||||||
| $ | 81.5 | $ | 81.4 | $ | 0.1 | $ | — | $ | 71.9 | $ | 71.6 | $ | 0.3 | $ | — | |||||||||||||||||
Notes to Consolidated Financial Statements
| 60 |
NOTES TO CONSOLIDATED FINANCIAL STATEMENTS
in millions, except share and per share data
We determine the fair value of our deferred compensation plan assets, comprised of publicly traded securities, by using market quotes as of the last day of the period. The fair value of the foreign currency forward contracts is measured at the value from either directly or indirectly observable third parties.
The carrying values of cash and cash equivalents, accounts receivable, accounts payable, and other current assets and liabilities approximate their fair values because of the short-term nature of these instruments. The carrying value of our variable-rate long-term debt approximates fair value. The fair value of the euro-denominated notes, as observable at commonly quoted intervals (Level 2 inputs), was $471.6 and $520.1 as of December 31, 2014 and 2013, respectively, compared to a carrying value of $423.4. and $480.9, respectively.
Goodwill and Other Intangible Assets
We have goodwill, finite-lived intangible assets and indefinite-lived intangible assets as follows:
| 2014 | 2013 | |||||||||||||||||||||||
| Accumulated | Accumulated | |||||||||||||||||||||||
| December 31 | Gross | Amortization | Net | Gross | Amortization | Net | ||||||||||||||||||
| Goodwill(1) | $ | 1,075.2 | $ | — | $ | 1,075.2 | $ | 1,090.9 | $ | — | $ | 1,090.9 | ||||||||||||
| Intangible assets: | ||||||||||||||||||||||||
| Finite-lived: | ||||||||||||||||||||||||
| Technology | $ | 19.6 | $ | 19.6 | $ | — | $ | 19.6 | $ | 19.6 | $ | — | ||||||||||||
| Franchise agreements | 18.0 | 18.0 | — | 18.0 | 17.9 | 0.1 | ||||||||||||||||||
| Customer relationships | 359.9 | 225.6 | 134.3 | 351.5 | 196.4 | 155.1 | ||||||||||||||||||
| Other | 14.2 | 13.0 | 1.2 | 16.2 | 14.0 | 2.2 | ||||||||||||||||||
| 411.7 | 276.2 | 135.5 | 405.3 | 247.9 | 157.4 | |||||||||||||||||||
| Indefinite-lived: | ||||||||||||||||||||||||
| Tradenames(2) | 54.0 | — | 54.0 | 54.0 | — | 54.0 | ||||||||||||||||||
| Reacquired franchise rights | 97.3 | — | 97.3 | 97.7 | — | 97.7 | ||||||||||||||||||
| 151.3 | — | 151.3 | 151.7 | — | 151.7 | |||||||||||||||||||
| Total intangible assets | $ | 563.0 | $ | 276.2 | $ | 286.8 | $ | 557.0 | $ | 247.9 | $ | 309.1 | ||||||||||||
| (1) | Balances were net of accumulated impairment loss of $513.4 as of both December 31, 2014 and 2013. |
| (2) | Balances were net of accumulated impairment loss of $139.5 as of both December 31, 2014 and 2013. |
Amortization expense related to intangibles was $33.4, $34.1 and $36.7 in 2014, 2013 and 2012, respectively. Amortization expense expected in each of the next five years related to acquisitions completed as of December 31, 2014 is as follows: 2015 — $29.5, 2016 — $26.3, 2017 — $23.0, 2018 — $20.2 and 2019 — $15.9. The weighted-average useful lives of the technology, franchise agreements, customer relationships and other are 5, 10, 14 and 3 years, respectively. The tradenames have been assigned an indefinite life based on our expectation of renewing the tradenames, as required, without material modifications and at a minimal cost, and our expectation of positive cash flows beyond the foreseeable future. The reacquired franchise rights result from our franchise acquisitions in the United States and Canada completed prior to 2009.
In accordance with the accounting guidance on goodwill and other intangible assets, we perform an annual impairment test of goodwill at our reporting unit level and indefinite-lived intangible assets at our unit of account level during the third quarter, or more frequently if events or circumstances change that would more likely than not reduce the fair value of our reporting units below their carrying value.
We performed our annual impairment test of our goodwill and indefinite-lived intangible assets during the third quarter of 2014, 2013 and 2012, and there was no impairment of our goodwill or indefinite-lived intangible as a result of our annual tests.
Notes to Consolidated Financial Statements
| ManpowerGroup | Annual Report 2014 | 61 |
We utilize a two-step method for determining goodwill impairment. In the first step, we determined the fair value of each reporting unit, generally by utilizing an income approach derived from a discounted cash flow methodology. For certain of our reporting units, a combination of the income approach (weighted 75%) and the market approach (weighted 25%) derived from comparable public companies was utilized. The income approach is developed from management’s forecasted cash flow data. Therefore, it represents an indication of fair market value reflecting management’s internal outlook for the reporting unit. The market approach utilizes the Guideline Public Company Method to quantify the respective reporting unit’s fair value based on revenues and earnings multiples realized by similar public companies. The market approach is more volatile as an indicator of fair value as compared to the income approach. We believe that each approach has its merits. However, in the instances where we have utilized both approaches, we have weighted the income approach more heavily than the market approach because we believe that management’s assumptions generally provide greater insight into the reporting unit’s fair value.
Significant assumptions used in our goodwill impairment tests during 2014, 2013 and 2012 included: expected revenue growth rates, operating unit profit margins, working capital levels, discount rates ranging from 11.7% to 17.8% for 2014, and a terminal value multiple. The expected future revenue growth rates and the expected operating unit profit margins were determined after considering our historical revenue growth rates and operating unit profit margins, our assessment of future market potential, and our expectations of future business performance.
If the reporting unit’s fair value is less than its carrying value, we are required to perform a second step. In the second step, we allocate the fair value of the reporting unit to all of the assets and liabilities of the reporting unit, including any unrecognized intangible assets, in a “hypothetical” calculation to determine the implied fair value of the goodwill. The impairment charge, if any, is measured as the difference between the implied fair value of the goodwill and its carrying value.
Under the current accounting guidance, we are also required to test our indefinite-lived intangible assets for impairment by comparing the fair value of the intangible asset with its carrying value. If the intangible asset’s fair value is less than its carrying value, an impairment loss is recognized for the difference.
Marketable Securities
We account for our marketable security investments under the accounting guidance on certain investments in debt and equity securities, and have historically determined that all such investments are classified as available-for-sale. Accordingly, unrealized gains and unrealized losses that are determined to be temporary, net of related income taxes, are included in accumulated other comprehensive (loss) income, which is a separate component of shareholders’ equity. Realized gains and losses, and unrealized losses determined to be other-than-temporary, are recorded in our Consolidated Statements of Operations. We had no available-for-sale investments as of December 31, 2014 or 2013.
We hold a 49% interest in our Swiss franchise, which maintained an investment portfolio with a market value of $200.9 and $204.2 as of December 31, 2014 and 2013, respectively. This portfolio is comprised of a wide variety of European and United States debt and equity securities as well as various professionally-managed funds, all of which are classified as available-for-sale. Our share of net realized gains and losses, and declines in value determined to be other-than-temporary, are included in our Consolidated Statements of Operations. For the years ended December 31, 2014, 2013 and 2012, realized gains totaled $2.5, $3.6 and $0.1, respectively, and realized losses totaled $0.5, $1.4 and $0.2, respectively. Our share of net unrealized gains and unrealized losses that are determined to be temporary related to these investments are included in accumulated other comprehensive (loss) income, with the offsetting amount increasing or decreasing our investment in the franchise.
Notes to Consolidated Financial Statements
| 62 |
NOTES TO CONSOLIDATED FINANCIAL STATEMENTS
in millions, except share and per share data
Capitalized Software for Internal Use
We capitalize purchased software as well as internally developed software. Internal software development costs are capitalized from the time the internal use software is considered probable of completion until the software is ready for use. Business analysis, system evaluation, selection and software maintenance costs are expensed as incurred. Capitalized software costs are amortized using the straight-line method over the estimated useful life of the software which ranges from 3 to 10 years. The net capitalized software balance of $5.3 and $4.6 as of December 31, 2014 and 2013, respectively, is included in other assets in the Consolidated Balance Sheets. Amortization expense related to the capitalized software costs was $2.2, $5.6 and $7.3 for 2014, 2013 and 2012, respectively.
Property and Equipment
A summary of property and equipment as of December 31 is as follows:
| 2014 | 2013 | |||||||
| Land | $ | 5.7 | $ | 6.2 | ||||
| Buildings | 19.2 | 20.8 | ||||||
| Furniture, fixtures, and autos | 178.2 | 194.1 | ||||||
| Computer equipment | 153.0 | 168.1 | ||||||
| Leasehold improvements | 277.4 | 317.0 | ||||||
| Property and equipment | $ | 633.5 | $ | 706.2 | ||||
Property and equipment are stated at cost and are depreciated using primarily the straight-line method over the following estimated useful lives: buildings — up to 40 years; furniture, fixtures, autos and computer equipment — 2 to 15 years; leasehold improvements — lesser of life of asset or expected lease term. Expenditures for renewals and betterments are capitalized whereas expenditures for repairs and maintenance are charged to income as incurred. Upon sale or disposition of property and equipment, the difference between the unamortized cost and the proceeds is recorded as either a gain or a loss and is included in our Consolidated Statements of Operations. Long-lived assets are evaluated for impairment in accordance with the provisions of the accounting guidance on the impairment or disposal of long-lived assets.
Derivative Financial Instruments
We account for our derivative instruments in accordance with the accounting guidance on derivative instruments and hedging activities. Derivative instruments are recorded on the balance sheet as either an asset or liability measured at their fair value. If the derivative is designated as a fair value hedge, the changes in the fair value of the derivative and of the hedged item attributable to the hedged risk are recognized in earnings. If the derivative is designated as a cash flow hedge, the effective portions of the changes in the fair value of the derivative are recorded as a component of accumulated other comprehensive (loss) income and recognized in the Consolidated Statements of Operations when the hedged item affects earnings. The ineffective portions of the changes in the fair value of cash flow hedges are recognized in earnings.
Foreign Currency Translation
The financial statements of our non-United States subsidiaries have been translated in accordance with the accounting guidance on foreign currency translation. Under the accounting guidance, asset and liability accounts are translated at the current exchange rate and income statement items are translated at the weighted-average exchange rate for the year. The resulting translation adjustments are recorded as a component of accumulated other comprehensive (loss) income, which is included in shareholders’ equity.
Notes to Consolidated Financial Statements
| ManpowerGroup | Annual Report 2014 | 63 |
Our euro-denominated notes are accounted for as a hedge of our net investment in our subsidiaries with a euro-functional currency. Since our net investment in these subsidiaries exceeds the amount of the related borrowings, all translation gains or losses related to these borrowings are included as a component of accumulated other comprehensive (loss) income.
Shareholders’ Equity
We currently have authorization from our board of directors to repurchase 8.0 million shares of our common stock. Share repurchases may be made from time to time through a variety of methods, including open market purchases, block transactions, privately negotiated transactions, accelerated share repurchase programs, forward repurchase agreements or similar facilities. We repurchased 2.0 million shares at a cost of $143.5 in 2014. No repurchases were made in 2013. In 2012, we repurchased a total of 3.6 million shares under previous authorizations at a total cost of $138.2. As of December 2014, there were 6.0 million shares remaining authorized for repurchase under this authorization and no shares remaining under any previous authorizations.
During 2014, 2013 and 2012, the Board of Directors declared total cash dividends of $0.98, $0.92 and $0.86 per share, respectively, resulting in total dividend payments of $77.3, $72.0 and $67.8, respectively.
Cash and Cash Equivalents
We consider all highly liquid investments with an original maturity of three months or less when purchased to be cash equivalents.
Payroll Tax Credit
In January 2013, the French government passed legislation, Credit d’Impôt pour la Compétitivité et l’Emploi (“CICE”), effective January 1, 2013, that provides payroll tax credits based on a percentage of wages paid to employees receiving less than two-and-a-half times the French minimum wage. The payroll tax credit was equal to 4% of eligible wages in 2013 and 6% of eligible wages in 2014 and beyond. The CICE payroll tax credit is accounted for as a reduction of our cost of services in the period earned.
The payroll tax credit is creditable against our current French income tax payable, with any remaining amount being paid after three years. Given the amount of our current income taxes payable, we would generally receive the vast majority of these payroll tax credits after the three-year period. In December 2013, we entered into an agreement to sell a portion of the credits earned in 2013 for net proceeds of $104.0. We derecognized these receivables upon the sale as the terms of the agreement are such that the transaction qualifies for sale treatment according to the accounting guidance on the transfer and servicing of assets. The discount on the sale of this receivable was recorded as a reduction of the 2013 payroll tax credits in cost of services.
Recently Issued Accounting Standards
In March 2013, the FASB issued new accounting guidance on cumulative translation adjustment. The new guidance requires that currency translation adjustments should be released into net income only if the sale of a foreign subsidiary results in the complete liquidation of the entity. For an equity method investment that is a foreign entity, a pro rata portion of the currency translation adjustments should be released into net income upon a partial sale of such an equity method investment. The new guidance also clarifies that the sale of an investment in a foreign entity includes both (1) events that result in the loss of a controlling financial interest in the foreign entity and (2) events that result in an acquirer’s obtaining control of an acquiree in which it held an equity interest immediately before the acquisition date, otherwise known as a “step acquisition.” Accordingly, the cumulative translation adjustment should be released into net income upon the occurrence of those events. We adopted this guidance effective January 1, 2014. There was no impact of this adoption on our Consolidated Financial Statements.
Notes to Consolidated Financial Statements
| 64 |
NOTES TO CONSOLIDATED FINANCIAL STATEMENTS
in millions, except share and per share data
In July 2013, the FASB issued new accounting guidance on presentation of an unrecognized tax benefit. The new guidance requires that, in certain cases, an unrecognized tax benefit should be presented in the financial statements as a reduction to the deferred tax asset when there is an existing net operating loss carryforward, a similar tax loss or an existing tax credit carryforward. We adopted this guidance effective January 1, 2014. There was no impact of this adoption on our Consolidated Financial Statements.
In April 2014, the FASB issued new accounting guidance on reporting discontinued operations and disclosures of disposals of components of an entity. The new guidance changes the requirements for reporting discontinued operations. A discontinued operation may include a component of an entity or a group of components of an entity. A disposal of a component of an entity or a group of components of an entity is required to be reported in discontinued operations if the disposal represents a strategic shift that has (or will have) a major effect on an entity’s operations and financial results and when the component or group of components meets the criteria to be classified as held for sale, is disposed by sale or is disposed of by other than by sale. The guidance is effective for us in 2015. We do not expect the adoption of this guidance to have a material impact on our Consolidated Financial Statements.
In May 2014, the FASB issued new accounting guidance on revenue from contracts with customers. The core principle of this amendment is that an entity should recognize revenue to depict the transfer of promised goods or services to customers in an amount that reflects the consideration to which the entity expects to be entitled in exchange for those goods or services. The guidance is effective for us in 2017 and can be adopted either retrospectively to each prior reporting period presented or as a cumulative-effect adjustment as of the date of adoption. We are currently assessing the impact of the adoption of this guidance on our Consolidated Financial Statements.
In September 2014, the FASB issued new accounting guidance on disclosure of uncertainties about an entity’s ability to continue as a going concern. The new guidance requires an entity’s management to evaluate whether there are conditions or events, considered in the aggregate, that raise substantial doubt about the entity’s ability to continue as a going concern within one year after the date that the financial statements are issued, and if so, disclose that fact. Management is also required to evaluate and disclose whether its plans alleviate that doubt. The guidance is effective for us in 2017 and will be applicable to both annual and interim reporting periods. We do not expect the adoption of this guidance to have an impact on our Consolidated Financial Statements.
Subsequent Events
We have evaluated events and transactions occurring after the balance sheet date through our filing date and noted no events that are subject to recognition or disclosure.
Note 02. Acquisitions
From time to time, we acquire and invest in companies throughout the world, including franchises. The total cash consideration paid for acquisitions, net of cash acquired, for the years ended December 31, 2014, 2013 and 2012 was $32.0, $46.3 and $49.0, respectively. Goodwill and intangible assets resulting from the 2014 acquisitions, the majority of which took place in the Netherlands and the United Kingdom, were $39.4 and $10.1, respectively, as of December 31, 2014. Goodwill and intangible assets resulting from the 2013 acquisitions, the majority of which took place in the United Kingdom and Norway, were $52.2 and $10.1 as of December 31, 2013, respectively.
In 2012, we acquired Damilo Group (“Damilo”), a French firm specializing in IT design solutions, for total consideration, net of cash acquired, of €21.2 ($28.0). Goodwill arising from this transaction was €30.8 ($40.6). The assumed liabilities and acquired assets, net of goodwill, related intangible assets and cash arising from the transaction were €33.8 ($44.6) and €17.9 ($23.6), respectively. The related intangible assets were €5.0 ($6.8) and €4.2 ($5.1) as of December 31, 2013 and December 31, 2014, respectively.
Notes to Consolidated Financial Statements
| ManpowerGroup | Annual Report 2014 | 65 |
Note 03. Share-Based Compensation Plans
We account for share-based payments according to the accounting guidance on share-based payments. During 2014, 2013 and 2012, we recognized $40.6, $31.5 and $30.0, respectively, in share-based compensation expense related to stock options, deferred stock, restricted stock and performance share units, all of which is recorded in selling and administrative expenses. The total income tax benefit recognized related to share-based compensation during 2014, 2013 and 2012 was $12.2, $21.2 and $2.4, respectively. Consideration received from share-based awards for 2014, 2013 and 2012 was $25.5, $101.0 and $6.0, respectively. The excess income tax benefit/(deficit) recognized related to share-based compensation awards, which is recorded in capital in excess of par value, for 2014, 2013 and 2012 was approximately $4.6, $8.4 and $(2.1), respectively. We recognize compensation expense on grants of share-based compensation awards on a straight-line basis over the vesting period of each award.
Stock Options
All share-based compensation is granted under the 2011 Equity Incentive Plan of Manpower Inc. (“2011 Plan”). Options and stock appreciation rights are granted at a price not less than 100% of the fair market value of the common stock at the date of grant. Generally, options are granted with a ratable vesting period of up to four years and expire ten years from date of grant. No stock appreciation rights had been granted or were outstanding as of December 31, 2014 or 2013.
A summary of stock option activity is as follows:
| Wtd. Avg. | ||||||||||||||||
| Wtd. Avg. | Remaining | Aggregate | ||||||||||||||
| Exercise Price | Contractual Term | Intrinsic Value | ||||||||||||||
| Shares (000) | Per Share | (years) | (in millions) | |||||||||||||
| Outstanding, January 1, 2012 | 5,265 | $ | 50 | |||||||||||||
| Granted | 302 | 45 | ||||||||||||||
| Exercised | (116 | ) | 34 | $ | 1 | |||||||||||
| Expired or cancelled | (107 | ) | 51 | |||||||||||||
| Outstanding, December 31, 2012 | 5,344 | $ | 50 | 5.0 | $ | 14 | ||||||||||
| Vested or expected to vest, December 31, 2012 | 5,326 | $ | 50 | 4.9 | ||||||||||||
| Exercisable, December 31, 2012 | 4,210 | $ | 51 | 4.3 | $ | 11 | ||||||||||
| Outstanding, January 1, 2013 | 5,344 | $ | 50 | |||||||||||||
| Granted | 221 | 53 | ||||||||||||||
| Exercised | (2,576 | ) | 43 | $ | 63 | |||||||||||
| Expired or cancelled | (206 | ) | 51 | |||||||||||||
| Outstanding, December 31, 2013 | 2,783 | $ | 57 | 5.1 | $ | 81 | ||||||||||
| Vested or expected to vest, December 31, 2013 | 2,769 | $ | 57 | 4.8 | ||||||||||||
| Exercisable, December 31, 2013 | 2,153 | $ | 58 | 4.2 | $ | 60 | ||||||||||
| Outstanding, January 1, 2014 | 2,783 | $ | 57 | |||||||||||||
| Granted | 204 | 77 | ||||||||||||||
| Exercised | (473 | ) | 53 | $ | 13 | |||||||||||
| Expired or cancelled | (30 | ) | 43 | |||||||||||||
| Outstanding, December 31, 2014 | 2,484 | $ | 59 | 4.7 | $ | 28 | ||||||||||
| Vested or expected to vest, December 31, 2014 | 2,476 | $ | 59 | 4.5 | ||||||||||||
| Exercisable, December 31, 2014 | 1,957 | $ | 59 | 3.7 | $ | 23 | ||||||||||
Notes to Consolidated Financial Statements
| 66 |
NOTES TO CONSOLIDATED FINANCIAL STATEMENTS
in millions, except share and per share data
Options outstanding and exercisable as of December 31, 2014 are as follows:
| Options Outstanding | Options Exercisable | |||||||||||||||||||
| Weighted- | ||||||||||||||||||||
| Average | ||||||||||||||||||||
| Remaining | Weighted- | Weighted- | ||||||||||||||||||
| Contractual | Average | Average | ||||||||||||||||||
| Exercise Price | Shares (000) | Life (years) | Exercise Price | Shares (000) | Exercise Price | |||||||||||||||
| $27–$34 | 150 | 3.8 | $ | 31 | 150 | $ | 31 | |||||||||||||
| $35–$44 | 212 | 5.4 | 45 | 93 | 45 | |||||||||||||||
| $45–$55 | 818 | 5.2 | 53 | 658 | 53 | |||||||||||||||
| $56–$93 | 1,304 | 4.0 | 69 | 1,056 | 67 | |||||||||||||||
| 2,484 | 4.7 | $ | 59 | 1,957 | $ | 59 | ||||||||||||||
We have recognized expense of $6.8, $7.5 and $9.4 related to stock options for the years ended December 31, 2014, 2013 and 2012, respectively. The total fair value of options vested during the same periods was $11.1, $9.0 and $11.4, respectively. As of December 31, 2014, total unrecognized compensation cost was approximately $3.9, net of estimated forfeitures, which we expect to recognize over a weighted-average period of approximately 1.8 years.
We estimated the fair value of each stock option on the date of grant using the Black-Scholes option pricing model and the following assumptions:
| Year Ended December 31 | 2014 | 2013 | 2012 | |||||||||
| Average risk-free interest rate | 1.8 | % | 1.1 | % | 1.1 | % | ||||||
| Expected dividend yield | 1.2 | % | 1.7 | % | 1.8 | % | ||||||
| Expected volatility | 37.0 | % | 42.0 | % | 44.0 | % | ||||||
| Expected term (years) | 5.9 | 5.9 | 5.9 | |||||||||
The average risk-free interest rate is based on the five-year United States Treasury security rate in effect as of the grant date. The expected dividend yield is based on the expected annual dividend as a percentage of the market value of our common stock as of the grant date. We determined expected volatility using a weighted average of daily historical volatility (weighted 75%) of our stock price over the past five years and implied volatility (weighted 25%) based upon exchange traded options for our common stock. We believe that a blend of historical volatility and implied volatility better reflects future market conditions and better indicates expected volatility than considering purely historical volatility. We determined the expected term of the stock options using historical data. The weighted-average grant-date fair value per option granted during the year was $25.64, $17.99 and $15.88 in 2014, 2013 and 2012, respectively.
Deferred Stock
Our non-employee directors may elect to receive deferred stock in lieu of part or all of their annual cash retainer otherwise payable to them. The number of shares of deferred stock is determined pursuant to a formula set forth in the terms and conditions adopted under the 2011 Plan; the deferred stock is settled in shares of common stock according to these terms and conditions. As of December 31, 2014, 2013 and 2012, there were 33,985, 31,733 and 28,400, respectively, shares of deferred stock awarded under this arrangement, all of which are vested.
Non-employee directors also receive an annual grant of deferred stock (or restricted stock, if they so elect) as additional compensation for board service. The award vests in equal quarterly installments over one year and the vested portion of the deferred stock is settled in shares of common stock either upon a director’s termination of service or three years after the date of grant (which may in most cases be extended at the directors’ election) in accordance with the terms and conditions
Notes to Consolidated Financial Statements
| ManpowerGroup | Annual Report 2014 | 67 |
under the 2011 Plan. As of December 31, 2014, 2013 and 2012, there were 5,199, 14,844 and 14,685, respectively, shares of deferred stock and 10,248, 14,844 and 20,559, respectively, shares of restricted stock granted under this arrangement, all of which are vested. We recognized expense of $0.7, $0.9 and $0.8 related to deferred stock in 2014, 2013 and 2012, respectively.
Restricted Stock
We grant restricted stock and restricted stock unit awards to certain employees and to non-employee directors who may elect to receive restricted stock rather than deferred stock as described above. Restrictions lapse over periods ranging up to six years, and in some cases upon retirement. We value restricted stock awards at the closing market value of our common stock on the date of grant.
A summary of restricted stock activity is as follows:
| Wtd. Avg | ||||||||||||||||
| Remaining | Aggregate | |||||||||||||||
| Wtd. Avg. | Contractual | Intrinsic Value | ||||||||||||||
| Shares (000) | Price Per Share | Term (years) | (in millions) | |||||||||||||
| Unvested, January 1, 2012 | 409 | $ | 59 | 1.8 | ||||||||||||
| Granted | 309 | 44 | ||||||||||||||
| Vested | (124 | ) | 40 | |||||||||||||
| Forfeited | (5 | ) | 67 | |||||||||||||
| Unvested, December 31, 2012 | 589 | $ | 55 | 1.7 | ||||||||||||
| Granted | 192 | $ | 52 | |||||||||||||
| Vested | (90 | ) | 52 | |||||||||||||
| Forfeited | (64 | ) | 56 | |||||||||||||
| Unvested, December 31, 2013 | 627 | $ | 54 | 1.3 | ||||||||||||
| Granted | 169 | $ | 77 | |||||||||||||
| Vested | (283 | ) | 63 | |||||||||||||
| Forfeited | (50 | ) | 53 | |||||||||||||
| Unvested, December 31, 2014 | 463 | $ | 57 | 1.2 | $ | 32 | ||||||||||
During 2014, 2013 and 2012, we recognized $12.9, $9.8 and $10.0, respectively, of expense related to restricted stock awards. As of December 31, 2014, there was approximately $10.0 of total unrecognized compensation cost related to unvested restricted stock, which we expect to recognize over a weighted-average period of approximately 2.0 years.
Performance Share Units
Our 2011 Plan allows us to grant performance share units. We grant performance share units with a performance period ranging from one to three years. Vesting of units occurs at the end of the performance period or after a subsequent holding period, except in the case of termination of employment where the units are forfeited immediately. Upon retirement, a prorated number of units vest depending on the period worked from the grant date to retirement date or in certain cases all of the units vest. In the case of death or disability, the units immediately vest at the Target Award level if the death or disability date is during the performance period, or at the level determined by the performance criteria met during the performance period if the death or disability occurs during the subsequent holding period. The units are settled in shares of our common stock. A payout multiple is applied to the units awarded based on the performance criteria determined by the Executive Compensation and Human Resources Committee of the Board of Directors at the time of grant.
Notes to Consolidated Financial Statements
| 68 |
NOTES TO CONSOLIDATED FINANCIAL STATEMENTS
in millions, except share and per share data
In the event the performance criteria exceeds the target performance level, an additional number of shares, up to the Outstanding Award level, may be granted. In the event the performance criteria falls below the target performance level, a reduced number of shares, as low as the Threshold Award level, may be granted. If the performance criteria falls below the threshold performance level, no shares will be granted.
A summary of the performance share units detail by grant year is as follows:
| July 2012 and | ||||||||||||||||
| 2012 | February 2013 | 2013(a) | 2014(b) | |||||||||||||
| Grant Date(s) | February 15, | July 1, 2012 and | February 14, | February 11, | ||||||||||||
| 2012 | February 14, | 2013 | 2014 and | |||||||||||||
| 2013 | May 1, 2014 | |||||||||||||||
| Performance Period (Years) | 2012 | 2012–2014 | 2013 | 2014–2016 | ||||||||||||
| Vesting Date(s) | 50% on | 50% on | 50% on | 100% on | ||||||||||||
| December 31, | July 1, | December 31, | December 31, | |||||||||||||
| 2013 and 2014 | 2015 and 2016 | 2014 and 2015 | 2016 | |||||||||||||
| Payout Levels (in units): | ||||||||||||||||
| Threshold Award | 84,480 | 66,949 | 76,120 | 94,608 | ||||||||||||
| Target Award | 168,960 | 133,898 | 152,240 | 189,215 | ||||||||||||
| Outstanding Award | 337,920 | 267,796 | 304,480 | 378,430 | ||||||||||||
| Units Forfeited in 2014 (at Target Award level) | — | — | — | — | ||||||||||||
| Shares Issued in 2014 | 72,843 | — | 101,239 | — | ||||||||||||
| Shares Subject to Holding Period as of December 31, 2014 | — | — | 108,853 | — | ||||||||||||
| % of the Target Performance Level based on the Current/Expected Average Operating Profit Margin over the Performance Period | 96 | % | 0 | % | 140 | % | 200 | % | ||||||||
| (a) | Included in these figures are 7,612 of performance share units that were granted on February 14, 2013 with a separate performance period, performance criteria and vesting date. The performance period is 2013 through 2015, with a vesting date of July 1, 2016. The award’s current performance level is at Target. |
| (b) | Included in these figures are 3,046 of performance share units that were granted on October 29, 2014 with a separate performance period, performance criteria and vesting date. The performance period is June 1, 2015 through December 31, 2016, with a vesting date of October 29, 2017. The award’s current performance level is at Target. |
We recognize and adjust compensation expense based on the likelihood of the performance criteria specified in the award being achieved. The compensation expense is recognized over the performance and holding periods and is recorded in selling and administrative expenses. We have recognized total compensation expense of $20.1, $13.1 and $9.6 in 2014, 2013 and 2012, respectively, related to the performance share units.
Notes to Consolidated Financial Statements
| ManpowerGroup | Annual Report 2014 | 69 |
Other Stock Plans
Under the 1990 Employee Stock Purchase Plan, designated employees meeting certain service requirements may purchase shares of our common stock through payroll deductions. These shares may be purchased at their fair market value on a monthly basis. The current plan is non-compensatory according to the accounting guidance on share-based payments.
We also maintain the Savings Related Share Option Scheme for United Kingdom employees with at least one year of service. The employees are offered the opportunity to obtain an option for a specified number of shares of common stock at not less than 85% of its market value on the day prior to the offer to participate in the plan. Options vest after either three, five or seven years, but may lapse earlier. Funds used to purchase the shares are accumulated through specified payroll deductions over a 60-month period. We recognized an expense of $0.1, $0.2, and $0.2 for shares purchased under the plan in 2014, 2013 and 2012, respectively.
Note 04. Net Earnings Per Share
The calculation of net earnings per share — basic was as follows:
| Year Ended December 31 | 2014 | 2013 | 2012 | |||||||||
| Net earnings available to common shareholders | $ | 427.6 | $ | 288.0 | $ | 197.6 | ||||||
| Weighted-average common shares outstanding (in millions) | 79.5 | 78.0 | 79.5 | |||||||||
| Net earnings per share — basic | $ | 5.38 | $ | 3.69 | $ | 2.49 | ||||||
| The calculation of net earnings per share — diluted was as follows: | ||||||||||||
| Year Ended December 31 | 2014 | 2013 | 2012 | |||||||||
| Net earnings available to common shareholders | $ | 427.6 | $ | 288.0 | $ | 197.6 | ||||||
| Weighted-average common shares outstanding (in millions) | 79.5 | 78.0 | 79.5 | |||||||||
| Effect of dilutive securities — stock options (in millions) | 0.6 | 0.8 | 0.3 | |||||||||
| Effect of other share-based awards (in millions) | 0.6 | 0.8 | 0.3 | |||||||||
| 80.7 | 79.6 | 80.1 | ||||||||||
| Net earnings per share — diluted | $ | 5.30 | $ | 3.62 | $ | 2.47 | ||||||
There were certain share-based awards excluded from the calculation of net earnings per share — diluted for the year ended December 31, 2014, 2013 and 2012, respectively, as the exercise prices for these awards were greater than the average market price of the common shares during the period. The number, exercise prices and weighted-average remaining life of these antidilutive awards were as follows:
| 2014 | 2013 | 2012 | ||||||||||
| Shares (in thousands) | 692 | 995 | 4,257 | |||||||||
| Exercise price ranges | $76–$93 | $67–$93 | $40–$93 | |||||||||
| Weighted-average remaining life | 4.1 years | 5.2 years | 4.8 years | |||||||||
Notes to Consolidated Financial Statements
| 70 |
NOTES TO CONSOLIDATED FINANCIAL STATEMENTS
in millions, except share and per share data
Note 05. Income Taxes
The provision for income taxes was as follows:
| Year Ended December 31 | 2014 | 2013 | 2012 | |||||||||
| Current | ||||||||||||
| United States | ||||||||||||
| Federal | $ | 44.8 | $ | (0.8 | ) | $ | 17.5 | |||||
| State | 7.0 | 3.4 | 9.6 | |||||||||
| Non-United States | 148.2 | 167.9 | 155.3 | |||||||||
| Total current | 200.0 | 170.5 | 182.4 | |||||||||
| Deferred | ||||||||||||
| United States | ||||||||||||
| Federal | 53.2 | 21.0 | (20.4 | ) | ||||||||
| State | (1.9 | ) | 0.9 | 0.5 | ||||||||
| Non-United States | 2.7 | (4.9 | ) | 8.3 | ||||||||
| Total deferred | 54.0 | 17.0 | (11.6 | ) | ||||||||
| Total provision | $ | 254.0 | $ | 187.5 | $ | 170.8 | ||||||
| A reconciliation between taxes computed at the United States Federal statutory rate of 35% and the consolidated effective tax rate is as follows: | ||||||||||||
| Year Ended December 31 | 2014 | 2013 | 2012 | |||||||||
| Income tax based on statutory rate | $ | 238.6 | $ | 166.4 | $ | 128.9 | ||||||
| Increase (decrease) resulting from: | ||||||||||||
| Non-United States tax rate difference | 20.1 | 27.7 | 40.8 | |||||||||
| Repatriation of non-United States earnings | (10.1 | ) | (20.5 | ) | (16.9 | ) | ||||||
| State income taxes, net of Federal benefit | 2.9 | 3.2 | 6.7 | |||||||||
| Change in valuation reserve | 5.0 | (0.5 | ) | 4.7 | ||||||||
| Other, net | (2.5 | ) | 11.2 | 6.6 | ||||||||
| Tax provision | $ | 254.0 | $ | 187.5 | $ | 170.8 | ||||||
Included in non-United States tax rate difference are benefits of $2.8 and $5.9 for 2014 and 2013, respectively, related to the French CICE payroll tax credit because the CICE credit is tax-free for French tax purposes. The tax benefits related to the CICE credit in excess of these amounts are offset by related increases in United States tax expense. For United States tax purposes, certain French earnings impacted by the CICE credit are treated as a deemed dividend in the current year or future years, resulting in an increase in United States tax expense.
Notes to Consolidated Financial Statements
| ManpowerGroup | Annual Report 2014 | 71 |
Deferred income taxes are recorded on temporary differences at the tax rate expected to be in effect when the temporary differences reverse. Temporary differences, which gave rise to the deferred taxes, were as follows:
| December 31 | 2014 | 2013 | ||||||
| Current Future Income Tax Benefits (Expense) | ||||||||
| Accrued payroll taxes and insurance | $ | 11.4 | $ | 17.9 | ||||
| Employee compensation payable | 28.1 | 26.5 | ||||||
| Pension and postretirement benefits | (5.2 | ) | (4.7 | ) | ||||
| Repatriation of non-United States earnings | (53.1 | ) | (16.7 | ) | ||||
| Other | 50.8 | 46.0 | ||||||
| Valuation allowance | (4.1 | ) | (15.7 | ) | ||||
| 27.9 | 53.3 | |||||||
| Noncurrent Future Income Tax Benefits (Expense) | ||||||||
| Accrued payroll taxes and insurance | 21.4 | 19.7 | ||||||
| Pension and postretirement benefits | 65.7 | 54.9 | ||||||
| Intangible assets | (124.7 | ) | (122.1 | ) | ||||
| Net operating losses | 129.7 | 151.0 | ||||||
| Other | 43.3 | 70.3 | ||||||
| Valuation allowance | (103.8 | ) | (111.4 | ) | ||||
| 31.6 | 62.4 | |||||||
| Total future tax benefits | $ | 59.5 | $ | 115.7 | ||||
| Current tax asset | $ | 52.2 | $ | 66.2 | ||||
| Current tax liability | (20.6 | ) | (4.4 | ) | ||||
| Noncurrent tax asset | 54.0 | 68.2 | ||||||
| Noncurrent tax liability | (26.1 | ) | (14.3 | ) | ||||
| Total future tax benefits | $ | 59.5 | $ | 115.7 | ||||
The current tax liability is recorded in accrued liabilities, the noncurrent tax asset is recorded in other assets and the noncurrent tax liability is recorded in other long-term liabilities in the Consolidated Balance Sheets.
We have United States Federal and non-United States net operating loss carryforwards and United States state net operating loss carryforwards totaling $435.5 and $317.6, respectively, as of December 31, 2014. The net operating loss carryforwards expire as follows:
| United States Federal | United States | |||||||
| and Non-United States | State | |||||||
| 2015 | $ | 3.3 | $ | 3.8 | ||||
| 2016 | 7.4 | 2.0 | ||||||
| 2017 | 5.6 | 6.8 | ||||||
| 2018 | 4.0 | 6.0 | ||||||
| 2019 | 9.9 | — | ||||||
| Thereafter | 48.8 | 299.0 | ||||||
| No expirations | 356.5 | — | ||||||
| Total net operating loss carryforwards | $ | 435.5 | $ | 317.6 | ||||
Notes to Consolidated Financial Statements
| 72 |
NOTES TO CONSOLIDATED FINANCIAL STATEMENTS
in millions, except share and per share data
We have recorded a deferred tax asset of $129.7 as of December 31, 2014, for the benefit of these net operating losses. Realization of this asset is dependent on generating sufficient taxable income prior to the expiration of the loss carryforwards. A related valuation allowance of $103.4 has been recorded as of December 31, 2014, as management believes that realization of certain net operating loss carryforwards is unlikely.
Pretax earnings of non-United States operations was $485.9, $298.1 and $234.6 in 2014, 2013 and 2012, respectively. We have not provided United States income taxes or non-United States withholding taxes on $733.0 of unremitted earnings of non-United States subsidiaries that are considered to be permanently invested. Deferred taxes are provided on $452.8 of unremitted earnings of non-United States subsidiaries that may be remitted to the United States. As of December 31, 2014 and 2013, we have recorded a deferred tax liability of $53.1 and $16.7, respectively, related to these non-United States earnings that may be remitted.
As of December 31, 2014, we had gross unrecognized tax benefits related to various tax jurisdictions, including interest and penalties, of $30.8. We have related tax benefits of $1.4, and the net amount of $29.4 would favorably affect the effective tax rate if recognized. We do not expect our unrecognized tax benefits to change significantly over the next year.
As of December 31, 2013, we had gross unrecognized tax benefits related to various tax jurisdictions, including interest and penalties, of $32.3. We had related tax benefits of $1.9 for a net amount of $30.4.
We recognize accrued interest and penalties related to unrecognized tax benefits in income tax expense. We recorded a benefit of $0.6 related to our net interest and penalties during 2014, and accrued net interest and penalties of $6.3 and $0.1 during 2013 and 2012, respectively.
The following table summarizes the activity related to our unrecognized tax benefits during 2014, 2013 and 2012:
| 2014 | 2013 | 2012 | ||||||||||
| Gross unrecognized tax benefits, beginning of year | $ | 23.9 | $ | 26.4 | $ | 25.0 | ||||||
| Increases in prior year tax positions | 0.7 | 2.1 | 5.8 | |||||||||
| Decreases in prior year tax positions | (1.2 | ) | (5.6 | ) | (0.8 | ) | ||||||
| Increases for current year tax positions | 2.2 | 3.4 | 3.1 | |||||||||
| Expiration of statute of limitations and audit settlements | (2.6 | ) | (2.4 | ) | (6.7 | ) | ||||||
| Gross unrecognized tax benefits, end of year | $ | 23.0 | $ | 23.9 | $ | 26.4 | ||||||
| Potential interest and penalties | 7.8 | 8.4 | 2.1 | |||||||||
| Balance, end of year | $ | 30.8 | $ | 32.3 | $ | 28.5 | ||||||
We conduct business globally in 80 countries and territories. We are routinely audited by the tax authorities of the various tax jurisdictions in which we operate. Generally, the tax years that could be subject to examination are 2008 through 2014 for our major operations in Germany, Italy, France, Japan, the United States and the United Kingdom. As of December 31, 2014, we were subject to tax audits in France, Germany, Denmark, Austria, Italy, Norway and Spain. We believe that the resolution of these audits will not have a material impact on earnings.
Notes to Consolidated Financial Statements
| ManpowerGroup | Annual Report 2014 | 73 |
Note 06. Goodwill
Changes in the carrying value of goodwill by reportable segment and Corporate were as follows:
| Southern | Northern | Right | ||||||||||||||||||||||||||
| Americas(1) | Europe(2) | Europe | APME | Management | Corporate(3) | Total(4) | ||||||||||||||||||||||
| Balance, January 1, 2013 | $ | 467.1 | $ | 103.3 | $ | 270.7 | $ | 73.2 | $ | 62.1 | $ | 64.9 | $ | 1,041.3 | ||||||||||||||
| Goodwill acquired | — | — | 43.2 | 9.0 | — | — | 52.2 | |||||||||||||||||||||
| Currency impact and other | (1.2 | ) | 4.5 | 4.3 | (10.2 | ) | — | — | (2.6 | ) | ||||||||||||||||||
| Balance, December 31, 2013 | 465.9 | 107.8 | 318.2 | 72.0 | 62.1 | 64.9 | 1,090.9 | |||||||||||||||||||||
| Goodwill acquired | 1.9 | 5.6 | 28.0 | 3.9 | — | — | 39.4 | |||||||||||||||||||||
| Currency impact and other | (1.5 | ) | (12.9 | ) | (34.9 | ) | (5.8 | ) | — | — | (55.1 | ) | ||||||||||||||||
| Balance, December 31, 2014 | $ | 466.3 | $ | 100.5 | $ | 311.3 | $ | 70.1 | $ | 62.1 | $ | 64.9 | $ | 1,075.2 | ||||||||||||||
| (1) | Balances related to United States were $448.5, $448.5 and $450.4 as of January 1, 2013, December 31, 2013 and December 31, 2014, respectively. |
| (2) | Balances related to France were $83.8, $87.3 and $76.9 as of January 1, 2013, December 31, 2013 and December 31, 2014, respectively. Balances related to Italy were $5.5, $5.7 and $5.0 as of January 1, 2013, December 31, 2013 and December 31, 2014, respectively. |
| (3) | The majority of the Corporate balance as of December 31, 2014 relates to goodwill attributable to our acquisition of Jefferson Wells ($55.5) which is part of the United States reporting unit. For purposes of monitoring our total assets by segment, we do not allocate the Corporate balance to the respective reportable segments. We do, however, include these balances within the appropriate reporting units for our goodwill impairment testing. See the table below for the breakout of goodwill balances by reporting unit. |
| (4) | Balances were net of accumulated impairment loss of $513.4 as of January 1, 2013, December 31, 2013 and December 31, 2014. |
Goodwill balances by reporting unit were as follows:
| December 31 | 2014 | 2013 | ||||||
| United States | $ | 505.9 | $ | 504.0 | ||||
| France | 76.9 | 87.3 | ||||||
| United Kingdom | 85.9 | 84.6 | ||||||
| Netherlands | 85.9 | 84.1 | ||||||
| Right Management | 62.1 | 62.1 | ||||||
| Other reporting units | 258.5 | 268.8 | ||||||
| Total goodwill | $ | 1,075.2 | $ | 1,090.9 | ||||
Note 07. Debt
Information concerning short-term borrowings is as follows:
| December 31 | 2014 | 2013 | ||||||
| Short-term borrowings | $ | 43.3 | $ | 34.2 | ||||
| Weighted-average interest rates | 15.8 | % | 12.5 | % | ||||
We maintain separate bank credit lines with financial institutions to meet working capital needs of our subsidiary operations. As of December 31, 2014, such uncommitted credit lines totaled $331.9, of which $286.2 was unused. Due to limitations on subsidiary borrowings in our revolving credit agreement, additional subsidiary borrowings of $254.3 could be made under these facilities as of December 31, 2014.
Notes to Consolidated Financial Statements
| 74 |
NOTES TO CONSOLIDATED FINANCIAL STATEMENTS
in millions, except share and per share data
A summary of long-term debt is as follows:
| December 31 | 2014 | 2013 | ||||||
| Euro-denominated notes (€350.0 due June 2018) | $ | 423.4 | $ | 480.9 | ||||
| Other | 2.4 | 2.8 | ||||||
| 425.8 | 483.7 | |||||||
| Less — current maturities | 1.9 | 1.8 | ||||||
| Long-term debt | $ | 423.9 | $ | 481.9 | ||||
Euro Notes
We have €350.0 aggregate principal amount 4.50% notes due June 22, 2018 (the “€350.0 Notes”), which were issued at a price of 99.974% to yield an effective interest rate of 4.505%. Interest on the €350.0 Notes is payable in arrears on June 22 of each year. The €350.0 Notes are unsecured senior obligations and rank equally with all of our existing and future senior unsecured debt and other liabilities. We may redeem the €350.0 Notes, in whole but not in part, at our option at any time for a redemption price determined in accordance with the term of the €350.0 Notes. The €350.0 Notes also contain certain customary non-financial restrictive covenants and events of default.
When the €350.0 Notes mature, we plan to repay the amount with available cash, borrowings under our $600.0 revolving credit facility or a new borrowing. The credit terms, including interest rate and facility fees, of any replacement borrowings will be dependent upon the condition of the credit markets at that time. We currently do not anticipate any problems accessing the credit markets should we decide to replace the €350.0 Notes.
The €350.0 Notes have been designated as a hedge of our net investment in subsidiaries with a euro-functional currency. Since our net investment in these subsidiaries exceeds the respective amount of the designated borrowings, translation gains or losses related to these borrowings are included as a component of accumulated other comprehensive (loss) income. (See the Significant Matters Affecting Results of Operations section of Management’s Discussion & Analysis and Note 12 to the Consolidated Financial Statements for further information.)
Revolving Credit Agreement
On October 15, 2013, we amended and restated our Five-Year Credit Agreement (“the Amended Agreement”) with a syndicate of commercial banks. The Amended Agreement allows for borrowing of $600.0 in various currencies, and up to $150.0 may be used for the issuance of stand-by letters of credit. The Amended Agreement terminates on October 15, 2018 but permits the termination date of the facility to be extended by an additional year twice during the term of the Amended Agreement. We had no borrowings under this facility as of both December 31, 2014 and 2013. Outstanding letters of credit issued under the Amended Agreement totaled $1.0 and $0.9 as of December 31, 2014 and 2013, respectively. Additional borrowings of $599.0 and $599.1 were available to us under the facility as of December 31, 2014 and 2013, respectively.
Under the Amended Agreement, a credit ratings-based pricing grid determines the facility fee and the credit spread that we add to the applicable interbank borrowing rate on all borrowings. At our current credit rating, the annual facility fee is 17.5 basis points paid on the entire $600.0 facility and the credit spread is 107.5 basis points on any borrowings. A downgrade from both credit agencies would unfavorably impact our facility fees and result in additional costs ranging from approximately $0.3 to $0.6 annually.
Notes to Consolidated Financial Statements
| ManpowerGroup | Annual Report 2014 | 75 |
The Amended Agreement contains customary restrictive covenants pertaining to our management and operations, including limitations on the amount of subsidiary debt that we may incur and limitations on our ability to pledge assets, as well as financial covenants requiring, among other things, that we comply with a leverage ratio (net Debt-to-EBITDA) of not greater than 3.5 to 1 and a fixed charge coverage ratio of not less than 1.5 to 1. The Amended Agreement also contains customary events of default, including, among others, payment defaults, material inaccuracy of representations and warranties, covenant defaults, bankruptcy or involuntary proceedings, certain monetary and non-monetary judgments, change of control and customary ERISA defaults.
As defined in the Amended Agreement, we had a net Debt-to-EBITDA ratio of 0.21 to 1 (compared to the maximum allowable ratio of 3.5 to 1) and a Fixed Charge Coverage ratio of 4.25 to 1 (compared to the minimum required ratio of 1.5 to 1) as of December 31, 2014.
Debt Maturities
The maturities of long-term debt payable within each of the four years subsequent to December 31, 2015 are as follows: 2016 — $0.4, 2017 — $0.0, 2018 — $423.4, 2019 — $0.0.
Note 08. Retirement and Deferred Compensation Plans
For all of our United States defined benefit and retiree health care plans, we adopted the Society of Actuaries’ RP-2014 mortality table with MP-2014 projection scale in determining the plans’ benefit obligations as of December 31, 2014.
Defined Benefit Plans
We sponsor several qualified and nonqualified pension plans covering permanent employees. The reconciliation of the changes in the plans’ benefit obligations and the fair value of plan assets and the funded status of the plans are as follows:
| United States Plans | Non-United States Plans | |||||||||||||||
| Year Ended December 31 | 2014 | 2013 | 2014 | 2013 | ||||||||||||
| Change in Benefit Obligation | ||||||||||||||||
| Benefit obligation, beginning of year | $ | 53.8 | $ | 61.9 | $ | 331.6 | $ | 315.2 | ||||||||
| Service cost | — | — | 8.3 | 8.7 | ||||||||||||
| Interest cost | 2.4 | 2.2 | 13.4 | 12.6 | ||||||||||||
| Curtailments | — | — | — | (3.4 | ) | |||||||||||
| Transfers | — | — | 1.1 | (0.3 | ) | |||||||||||
| Actuarial loss (gain) | 4.5 | (5.9 | ) | 77.5 | (0.6 | ) | ||||||||||
| Plan participant contributions | — | — | 0.3 | 0.4 | ||||||||||||
| Benefits paid | (4.1 | ) | (4.4 | ) | (6.9 | ) | (6.7 | ) | ||||||||
| Currency exchange rate changes | — | — | (39.9 | ) | 5.7 | |||||||||||
| Benefit obligation, end of year | $ | 56.6 | $ | 53.8 | $ | 385.4 | $ | 331.6 | ||||||||
Notes to Consolidated Financial Statements
| 76 |
NOTES TO CONSOLIDATED FINANCIAL STATEMENTS
in millions, except share and per share data
| United States Plans | Non-United States Plans | |||||||||||||||
| Year Ended December 31 | 2014 | 2013 | 2014 | 2013 | ||||||||||||
| Change in Plan Assets | ||||||||||||||||
| Fair value of plan assets, beginning of year | $ | 39.1 | $ | 36.0 | $ | 305.8 | $ | 296.4 | ||||||||
| Actual return on plan assets | 3.0 | 4.6 | 71.6 | (4.2 | ) | |||||||||||
| Plan participant contributions | — | — | 0.3 | 0.4 | ||||||||||||
| Company contributions | 2.6 | 2.9 | 11.8 | 15.0 | ||||||||||||
| Benefits paid | (4.1 | ) | (4.4 | ) | (6.9 | ) | (6.7 | ) | ||||||||
| Currency exchange rate changes | — | — | (33.5 | ) | 4.9 | |||||||||||
| Fair value of plan assets, end of year | $ | 40.6 | $ | 39.1 | $ | 349.1 | $ | 305.8 | ||||||||
| Funded Status at End of Year | ||||||||||||||||
| Funded status, end of year | $ | (16.0 | ) | $ | (14.7 | ) | $ | (36.3 | ) | $ | (25.8 | ) | ||||
| Amounts Recognized | ||||||||||||||||
| Noncurrent assets | $ | 16.0 | $ | 17.2 | $ | 32.2 | $ | 30.8 | ||||||||
| Current liabilities | (2.3 | ) | (2.9 | ) | (0.3 | ) | (0.2 | ) | ||||||||
| Noncurrent liabilities | (29.7 | ) | (29.0 | ) | (68.2 | ) | (56.4 | ) | ||||||||
| Net amount recognized | $ | (16.0 | ) | $ | (14.7 | ) | $ | (36.3 | ) | $ | (25.8 | ) | ||||
Amounts recognized in accumulated other comprehensive (loss) income, net of tax, consist of:
| United States Plans | Non-United States Plans | |||||||||||||||
| December 31 | 2014 | 2013 | 2014 | 2013 | ||||||||||||
| Net loss | $ | 11.3 | $ | 9.5 | $ | 36.0 | $ | 25.3 | ||||||||
| Prior service cost | — | 0.1 | 4.8 | 4.8 | ||||||||||||
| Total | $ | 11.3 | $ | 9.6 | $ | 40.8 | $ | 30.1 | ||||||||
The accumulated benefit obligation for our plans that have plan assets was $340.7 and $291.7 as of December 31, 2014 and 2013, respectively. The accumulated benefit obligation for certain of our plans exceeded the fair value of plan assets as follows:
| December 31 | 2014 | 2013 | ||||||
| Accumulated benefit obligation | $ | 10.8 | $ | 10.3 | ||||
| Plan assets | 9.6 | 9.8 | ||||||
The projected benefit obligation for certain of our plans exceeded the fair value of plan assets as follows:
| December 31 | 2014 | 2013 | ||||||
| Projected benefit obligation | $ | 52.1 | $ | 53.4 | ||||
| Plan assets | 42.0 | 44.8 | ||||||
By their nature, certain of our plans do not have plan assets. The accumulated benefit obligation for these plans was $76.1 and $68.4 as of December 31, 2014 and 2013, respectively.
Notes to Consolidated Financial Statements
| ManpowerGroup | Annual Report 2014 | 77 |
The components of the net periodic benefit cost and other amounts recognized in other comprehensive loss for all plans were as follows:
| Year Ended December 31 | 2014 | 2013 | 2012 | |||||||||
| Service cost | $ | 8.3 | $ | 8.7 | $ | 10.4 | ||||||
| Interest cost | 15.8 | 14.8 | 15.1 | |||||||||
| Expected return on assets | (15.6 | ) | (13.2 | ) | (14.7 | ) | ||||||
| Curtailment and settlement | — | (2.3 | ) | — | ||||||||
| Net loss | 3.5 | 3.3 | 1.1 | |||||||||
| Prior service cost | 0.6 | 0.5 | 0.7 | |||||||||
| Net periodic benefit cost | 12.6 | 11.8 | 12.6 | |||||||||
| Other Changes in Plan Assets and Benefit Obligations Recognized in Other Comprehensive Loss | ||||||||||||
| Net loss | 23.5 | 6.8 | 15.4 | |||||||||
| Prior service cost (credit) | 1.3 | (1.1 | ) | — | ||||||||
| Amortization of net loss | (3.5 | ) | (3.3 | ) | (1.1 | ) | ||||||
| Amortization of prior service cost | (0.6 | ) | (0.5 | ) | (0.7 | ) | ||||||
| Total recognized in other comprehensive loss | 20.7 | 1.9 | 13.6 | |||||||||
| Total recognized in net periodic benefit cost and other comprehensive loss | $ | 33.3 | $ | 13.7 | $ | 26.2 | ||||||
Effective January 1, 2013, we amended a defined benefit plan in the Netherlands. The defined benefit plan was frozen, and the participants were transitioned to a defined contribution plan, resulting in a curtailment gain of $2.3.
The estimated net loss and prior service cost for the defined benefit pension plans that will be amortized from accumulated other comprehensive (loss) income into net periodic benefit cost during 2015 are $4.2 and $0.5, respectively.
The weighted-average assumptions used in the measurement of the benefit obligation were as follows:
| United States Plans | Non-United States Plans | |||||||||||||||
| Year Ended December 31 | 2014 | 2013 | 2014 | 2013 | ||||||||||||
| Discount rate | 3.9 | % | 4.6 | % | 2.9 | % | 4.1 | % | ||||||||
| Rate of compensation increase | 3.0 | % | 3.0 | % | 3.4 | % | 3.8 | % | ||||||||
The weighted-average assumptions used in the measurement of the net periodic benefit cost were as follows:
| United States Plans | Non-United States Plans | |||||||||||||||||||||||
| Year Ended December 31 | 2014 | 2013 | 2012 | 2014 | 2013 | 2012 | ||||||||||||||||||
| Discount rate | 4.6 | % | 3.7 | % | 4.6 | % | 4.1 | % | 4.2 | % | 4.7 | % | ||||||||||||
| Expected long-term return on plan assets | 6.0 | % | 6.0 | % | 6.3 | % | 4.5 | % | 4.0 | % | 4.7 | % | ||||||||||||
| Rate of compensation increase | 3.0 | % | 3.0 | % | 3.0 | % | 3.8 | % | 3.6 | % | 4.0 | % | ||||||||||||
We determine our assumption for the discount rate based on an index of high-quality corporate bond yields and matched-funding yield curve analysis as of the end of each fiscal year.
Our overall expected long-term rate of return used in the measurement of the 2014 net periodic benefit cost on United States plan assets was 6.0%, while the rates of return on our non-United States plans varied by country and ranged from 2.8% to 5.3%. For a majority of our plans, a building block approach has been employed to establish this return. Historical markets are studied and long-term historical relationships between equity securities and fixed income instruments are
Notes to Consolidated Financial Statements
| 78 |
NOTES TO CONSOLIDATED FINANCIAL STATEMENTS
in millions, except share and per share data
preserved consistent with the widely accepted capital market principle that assets with higher volatility generate a greater return over time. Current market factors such as inflation and interest rates are evaluated before long-term capital market assumptions are determined. The long-term portfolio return is established with proper consideration of diversification and rebalancing. We also use guaranteed insurance contracts for four of our foreign plans. Peer data and historical returns are reviewed to check for reasonableness and appropriateness of our expected rate of return.
Projected salary levels utilized in the determination of the projected benefit obligation for the pension plans are based upon historical experience and the future expectations for each respective country.
Our plans’ investment policies are to optimize the long-term return on plan assets at an acceptable level of risk and to maintain careful control of the risk level within each asset class. Our long-term objective is to minimize plan expenses and contributions by outperforming plan liabilities. We have historically used a balanced portfolio strategy based primarily on a target allocation of equity securities and fixed-income instruments, which vary by location. These target allocations, which are similar to the 2014 allocations, are determined based on the favorable risk tolerance characteristics of the plan and, at times, may be adjusted within a specified range to advance our overall objective.
The fair values of our pension plan assets are primarily determined by using market quotes and other relevant information that is generated by market transactions involving identical or comparable assets, except for the insurance contract that is measured at the present value of expected future benefit payments using the Deutsche National Bank interest curve. The fair value of our pension plan assets by asset category was as follows:
|
United States Plans
|
Non-United States Plans
|
|||||||||||||||||||||||||||||||
| Fair Value Measurements Using | Fair Value Measurements Using | |||||||||||||||||||||||||||||||
| Quoted Prices | Quoted Prices | |||||||||||||||||||||||||||||||
| in Active | Significant | in Active | Significant | |||||||||||||||||||||||||||||
| Markets for | Other | Significant | Markets for | Other | Significant | |||||||||||||||||||||||||||
| Identical | Observable | Unobservable | Identical | Observable | Unobservable | |||||||||||||||||||||||||||
| December 31, | Assets | Inputs | Inputs | December 31, | Assets | Inputs | Inputs | |||||||||||||||||||||||||
| 2014 | (Level 1) | (Level 2) | (Level 3) | 2014 | (Level 1) | (Level 2) | (Level 3) | |||||||||||||||||||||||||
| Asset Category | ||||||||||||||||||||||||||||||||
| Cash and cash equivalents(1) | $ | 1.0 | $ | 1.0 | $ | — | $ | — | $ | 0.3 | $ | 0.3 | $ | — | $ | — | ||||||||||||||||
| Equity securities: | ||||||||||||||||||||||||||||||||
| United States companies | 15.6 | 15.6 | — | — | — | — | — | — | ||||||||||||||||||||||||
| International companies | — | — | — | — | 19.1 | 19.1 | — | — | ||||||||||||||||||||||||
| Fixed income securities: | ||||||||||||||||||||||||||||||||
| Government bonds(2) | 24.0 | — | 24.0 | — | 45.3 | 45.3 | — | — | ||||||||||||||||||||||||
| Corporate bonds | — | — | — | — | 62.5 | 62.5 | — | — | ||||||||||||||||||||||||
| Guaranteed insurance contracts | — | — | — | — | 42.0 | — | 42.0 | — | ||||||||||||||||||||||||
| Annuity contract | — | — | — | — | 35.5 | — | 35.5 | — | ||||||||||||||||||||||||
| Other types of investments: | ||||||||||||||||||||||||||||||||
| Unitized funds(3) | — | — | — | — | 31.5 | 31.5 | — | — | ||||||||||||||||||||||||
| Insurance contract | — | — | — | — | 104.9 | — | — | 104.9 | ||||||||||||||||||||||||
| Real estate funds | — | — | — | — | 8.0 | — | 8.0 | — | ||||||||||||||||||||||||
| $ | 40.6 | $ | 16.6 | $ | 24.0 | $ | — | $ | 349.1 | $ | 158.7 | $ | 85.5 | $ | 104.9 | |||||||||||||||||
| (1) | This category includes a prime obligations money market portfolio. |
| (2) | This category includes United States Treasury/Federal agency securities and foreign government securities. |
| (3) | This category includes investments in approximately 70% equity securities, 20% fixed income securities and 10% cash. |
Notes to Consolidated Financial Statements
| ManpowerGroup | Annual Report 2014 | 79 |
| United States Plans | Non-United States Plans | |||||||||||||||||||||||||||||||
| Fair Value Measurements Using | Fair Value Measurements Using | |||||||||||||||||||||||||||||||
| Quoted Prices | Quoted Prices | |||||||||||||||||||||||||||||||
| in Active | Significant | in Active | Significant | |||||||||||||||||||||||||||||
| Markets for | Other | Significant | Markets for | Other | Significant | |||||||||||||||||||||||||||
| Identical | Observable | Unobservable | Identical | Observable | Unobservable | |||||||||||||||||||||||||||
| December 31, | Assets | Inputs | Inputs | December 31, | Assets | Inputs | Inputs | |||||||||||||||||||||||||
| 2013 | (Level 1) | (Level 2) | (Level 3) | 2013 | (Level 1) | (Level 2) | (Level 3) | |||||||||||||||||||||||||
| Asset Category | ||||||||||||||||||||||||||||||||
| Cash and cash equivalents(1) | $ | 0.9 | $ | 0.9 | $ | — | $ | — | $ | 1.7 | $ | 1.7 | $ | — | $ | — | ||||||||||||||||
| Equity securities: | ||||||||||||||||||||||||||||||||
| United States companies | 15.5 | 15.5 | — | — | — | — | — | — | ||||||||||||||||||||||||
| International companies | — | — | — | — | 36.6 | 36.6 | — | — | ||||||||||||||||||||||||
| Fixed income securities: | ||||||||||||||||||||||||||||||||
| Government bonds(2) | 22.7 | — | 22.7 | — | — | — | — | — | ||||||||||||||||||||||||
| Guaranteed insurance contracts | — | — | — | — | 44.8 | — | 44.8 | — | ||||||||||||||||||||||||
| Annuity contract | — | — | — | — | 33.4 | — | 33.4 | — | ||||||||||||||||||||||||
| Other types of investments: | ||||||||||||||||||||||||||||||||
| Unitized funds(3) | — | — | — | — | 101.3 | 101.3 | — | — | ||||||||||||||||||||||||
| Insurance contract | — | — | — | — | 80.9 | — | — | 80.9 | ||||||||||||||||||||||||
| Real estate funds | — | — | — | — | 7.1 | — | 7.1 | — | ||||||||||||||||||||||||
| $ | 39.1 | $ | 16.4 | $ | 22.7 | $ | — | $ | 305.8 | $ | 139.6 | $ | 85.3 | $ | 80.9 | |||||||||||||||||
| (1) | This category includes a prime obligations money market portfolio. |
| (2) | This category includes United States Treasury/Federal agency securities and foreign government securities. |
| (3) | This category includes investments in approximately 80% fixed income securities and 20% equity securities. |
The following table summarizes the changes in fair value of the insurance contract, which is measured using Level 3 inputs. These contracts were purchased upon amendment of our Dutch pension plan effective as of January 1, 2013. We determine that transfers between fair-value-measurement levels occur on the date of the event that caused the transfer.
| Year Ended December 31 | 2014 | 2013 | ||||||
| Balance, beginning of year | $ | 80.9 | $ | — | ||||
| Transfers into Level 3 | — | 85.9 | ||||||
| Unrealized gain (loss) | 37.6 | (7.7 | ) | |||||
| Purchases, sales and settlements, net | (0.6 | ) | (0.6 | ) | ||||
| Currency exchange rate changes | (13.0 | ) | 3.3 | |||||
| Balance, end of year | $ | 104.9 | $ | 80.9 | ||||
Notes to Consolidated Financial Statements
| 80 |
NOTES TO CONSOLIDATED FINANCIAL STATEMENTS
in millions, except share and per share data
Retiree Health Care Plan
We provide medical and dental benefits to certain eligible retired employees in the United States. Due to the nature of the plan, there are no plan assets. The reconciliation of the changes in the plan’s benefit obligation and the statement of the funded status of the plan were as follows:
| Year Ended December 31 | 2014 | 2013 | ||||||
| Change in Benefit Obligation | ||||||||
| Benefit obligation, beginning of year | $ | 18.5 | $ | 31.5 | ||||
| Service cost | — | — | ||||||
| Interest cost | 0.8 | 1.1 | ||||||
| Actuarial loss (gain) | 0.2 | (0.9 | ) | |||||
| Benefits paid | (1.9 | ) | (2.3 | ) | ||||
| Plan participant contributions | 0.1 | 0.2 | ||||||
| Retiree drug subsidy reimbursement | 0.1 | 0.1 | ||||||
| Plan amendment | — | (11.2 | ) | |||||
| Benefit obligation, end of year | $ | 17.8 | $ | 18.5 | ||||
| Funded Status at End of Year | ||||||||
| Funded status, end of year | $ | (17.8 | ) | $ | (18.5 | ) | ||
| Amounts Recognized | ||||||||
| Current liabilities | $ | (1.3 | ) | $ | (2.0 | ) | ||
| Noncurrent liabilities | (16.5 | ) | (16.5 | ) | ||||
| Net amount recognized | $ | (17.8 | ) | $ | (18.5 | ) | ||
The amount recognized in accumulated other comprehensive (loss) income, net of tax, consists of a net loss of $2.0 and a prior service credit of $6.5 in 2014, and a net loss of $1.9 and a prior service credit of $7.0 in 2013.
In June 2013, the Board of Directors approved an amendment related to the post-65 healthcare benefits of the plan that became effective as of July 1, 2014. The plan change included the introduction of a Health Reimbursement Account for Medicare eligible retirees and dependents. The plan change was communicated to retirees in October 2013, and the plan was re-measured as of October 1, 2013 to reflect this amendment.
Notes to Consolidated Financial Statements
| ManpowerGroup | Annual Report 2014 | 81 |
The discount rate used in the measurement of the benefit obligation was 3.9% and 4.7% in 2014 and 2013, respectively. The discount rate used in the measurement of net periodic benefit cost was 4.7% in 2014, 3.9% (January through September) and 4.8% (October through December) in 2013 and 4.8% in 2012, respectively. The components of net periodic benefit cost and other amounts recognized in other comprehensive loss (income) for this plan were as follows:
| Year Ended December 31 | 2014 | 2013 | 2012 | |||||||||
| Net Periodic Benefit Cost | ||||||||||||
| Service cost | $ | — | $ | — | $ | 0.1 | ||||||
| Interest cost | 0.8 | 1.1 | 1.3 | |||||||||
| Net loss | 0.1 | 0.3 | — | |||||||||
| Prior service credit | (0.8 | ) | (0.2 | ) | — | |||||||
| Net periodic benefit cost | 0.1 | 1.2 | 1.4 | |||||||||
| Other Changes in Plan Assets and Benefit Obligations Recognized in Other Comprehensive Loss (Income) | ||||||||||||
| Net loss (gain) | 0.2 | (0.9 | ) | 3.2 | ||||||||
| Prior service credit | — | (11.2 | ) | — | ||||||||
| Amortization of net loss | (0.1 | ) | (0.3 | ) | — | |||||||
| Amortization of prior service credit | 0.8 | 0.2 | — | |||||||||
| Total recognized in other comprehensive loss (income) | 0.9 | (12.2 | ) | 3.2 | ||||||||
| Total recognized in net periodic benefit cost and other comprehensive loss (income) | $ | 1.0 | $ | (11.0 | ) | $ | 4.6 | |||||
The estimated net loss and prior service credit for the retiree health care plan that will be amortized from accumulated other comprehensive (loss) income into net periodic benefit cost during 2015 is $0.1 and $0.8, respectively.
The health care cost trend rate is assumed to be 7.0% for 2015, decreasing gradually to an ultimate rate of 5.0% in 2020. Assumed health care cost trend rates could have a significant effect on the amounts reported. A one-percentage point change in the assumed health care cost trend rate would have the following effects:
| 1% Increase | 1% Decrease | |||||||
| Effect on total of service and interest cost components | $ | — | $ | — | ||||
| Effect on benefit obligation | 0.4 | (0.3 | ) | |||||
Notes to Consolidated Financial Statements
| 82 |
NOTES TO CONSOLIDATED FINANCIAL STATEMENTS
in millions, except share and per share data
Future Contributions and Payments
During 2015, we plan to contribute $12.4 to our pension plans and to fund our retiree health care payments as incurred. Projected benefit payments from the plans as of December 31, 2014 were estimated as follows:
| Retiree Health | ||||||||
| Year | Pension Plans | Care Plan | ||||||
| 2015 | $ | 9.8 | $ | 1.3 | ||||
| 2016 | 9.6 | 1.3 | ||||||
| 2017 | 10.9 | 1.3 | ||||||
| 2018 | 11.1 | 1.2 | ||||||
| 2019 | 12.7 | 1.1 | ||||||
| 2020–2024 | 78.0 | 5.5 | ||||||
| Total projected benefit payments | $ | 132.1 | $ | 11.7 | ||||
Defined Contribution Plans and Deferred Compensation Plans
We have defined contribution plans covering substantially all permanent United States employees and various other employees throughout the world. Employees may elect to contribute a portion of their salary to the plans and we match a portion of their contributions up to a maximum percentage of the employee’s salary. In addition, profit sharing contributions are made if a targeted earnings level is reached. The total expense for our match and any profit sharing contributions was $19.8, $22.4 and $21.5 for the years ended December 31, 2014, 2013 and 2012, respectively.
We also have deferred compensation plans in the United States. One of the plans had an asset and liability of $80.0 and $69.4 as of December 31, 2014 and 2013, respectively.
Note 09. Accumulated Other Comprehensive (Loss) Income
The components of accumulated other comprehensive (loss) income, net of tax, were as follows:
| December 31 | 2014 | 2013 | ||||||
| Foreign currency translation | $ | (26.4 | ) | $ | 239.5 | |||
| Translation loss on net investment hedge, net of income taxes of $(16.4) and $(36.7), respectively | (24.5 | ) | (60.6 | ) | ||||
| Translation loss on long-term intercompany loans | (73.4 | ) | (73.6 | ) | ||||
| Unrealized gain on investments, net of income taxes of $3.7 and $1.6, respectively | 16.7 | 11.5 | ||||||
| Defined benefit pension plans, net of income taxes of $(30.1) and $(21.8), respectively | (52.1 | ) | (39.7 | ) | ||||
| Retiree health care plan, net of income taxes of $2.4 and $2.7, respectively | 4.5 | 5.1 | ||||||
| Accumulated other comprehensive (loss) income | $ | (155.2 | ) | $ | 82.2 | |||
Notes to Consolidated Financial Statements
| ManpowerGroup | Annual Report 2014 | 83 |
Note 10. Leases
We lease property and equipment primarily under operating leases. Renewal options exist for substantially all leases. Future minimum payments, by year and in the aggregate, under noncancelable operating leases with any remaining terms consist of the following as of December 31, 2014:
| Year | ||||
| 2015 | $ | 160.6 | ||
| 2016 | 122.2 | |||
| 2017 | 90.3 | |||
| 2018 | 66.4 | |||
| 2019 | 52.4 | |||
| Thereafter | 119.4 | |||
| Total minimum lease payments | $ | 611.3 | ||
Rental expense for all operating leases was $197.0, $232.9 and $245.1 for the years ended December 31, 2014, 2013 and 2012, respectively.
Note 11. Interest and Other Expenses
Interest and other expenses consisted of the following:
| Year Ended December 31 | 2014 | 2013 | 2012 | |||||||||
| Interest expense | $ | 35.9 | $ | 37.1 | $ | 41.8 | ||||||
| Interest income | (4.4 | ) | (3.7 | ) | (6.6 | ) | ||||||
| Foreign exchange (gain) loss | (2.2 | ) | 2.3 | 0.9 | ||||||||
| Miscellaneous expenses, net | 9.0 | 0.7 | 7.2 | |||||||||
| Interest and other expenses | $ | 38.3 | $ | 36.4 | $ | 43.3 | ||||||
Note 12. Derivative Financial Instruments
We are exposed to various risks relating to our ongoing business operations. The primary risks, which are managed through the use of derivative instruments, are foreign currency exchange rate risk and interest rate risk. In certain circumstances, we enter into foreign currency forward exchange contracts (“forward contracts”) to reduce the effects of fluctuating foreign currency exchange rates on our cash flows denominated in foreign currencies. Our exposure to market risk for changes in interest rates relates primarily to our long-term debt obligations. We manage interest rate risk through the use of a combination of fixed and variable rate borrowings. In the past, we have also used interest rate swap agreements; however, we have not had any such agreements in 2014, 2013 or 2012. In accordance with the current accounting guidance for derivative instruments and hedging activities, we record all of our derivative instruments as either an asset or liability measured at their fair values.
Notes to Consolidated Financial Statements
| 84 |
NOTES TO CONSOLIDATED FINANCIAL STATEMENTS
in millions, except share and per share data
Foreign Currency Exchange Rate Risk Management
The €350.0 ($423.4) Notes were designated as economic hedges of our net investment in our foreign subsidiaries with a euro-functional currency as of December 31, 2014.
For derivatives designated as an economic hedge of the foreign currency exposure of a net investment in a foreign subsidiary, the gain or loss associated with foreign currency translation is recorded as a component of accumulated other comprehensive (loss) income, net of taxes. As of December 31, 2014, we had a $24.5 unrealized loss included in accumulated other comprehensive (loss) income, net of taxes, as the net investment hedge was deemed effective.
Our forward contracts are not designated as hedges. Consequently, any gain or loss resulting from the change in fair value is recognized in the current period earnings. These gains or losses are offset by the exposure related to receivables and payables with our foreign subsidiaries and to interest due on our euro-denominated notes, which is paid annually in June. We recorded a gain of $0.2 associated with our forward contracts in interest and other expenses for the year ended December 31, 2014, partially offsetting the losses recorded for the items noted above.
The fair value measurements of these items recorded in our Consolidated Balance Sheets as of December 31, 2014 and 2013 are disclosed in Note 1 to the Consolidated Financial Statements.
Note 13. Contingencies
Litigation
In the normal course of business, the Company is named as defendant in various legal proceedings in which claims are asserted against the Company. We record accruals for loss contingencies based on the circumstances of each claim, when it is probable that a loss has been incurred as of the balance sheet date and can be reasonably estimated. Although the outcome of litigation cannot be predicted with certainty, we believe the ultimate resolution of these legal proceedings will not have a material effect on our business or financial condition.
In 2014, we recorded legal costs of $9.0 in the US related to a settlement agreement in connection with a lawsuit in California involving allegations regarding our wage statements. The settlement agreement was preliminarily approved by the court in January 2015, with a final ruling expected in June 2015. We believe that the settlement is in our best interest to avoid the costs and disruption of ongoing litigation.
We experienced a significant increase in client claims against us in France during the second quarter of 2013, requesting refunds for various payroll tax subsidies that we had received dating back to 2003 related to our French temporary associates. In March 2014, the French Supreme Court ruled in our favor on this matter, confirming that, as a matter of law, the benefit of the payroll tax subsidies belongs to the direct employer of the temporary associates. We do not expect to incur any losses as all of these claims have now been withdrawn as a result of this ruling.
Notes to Consolidated Financial Statements
| ManpowerGroup | Annual Report 2014 | 85 |
In June 2012, we recorded legal costs of $10.0 in the United States for various legal matters, the majority of which was related to our entry into a settlement agreement in connection with a purported class action lawsuit involving allegations regarding our vacation pay policies in Illinois. Under the settlement agreement, we agreed to pay $8.0 plus certain related taxes and administrative fees. We maintain that our vacation pay policies were appropriate and we admit no liability or wrongdoing, but we believe that settlement is in our best interest to avoid the costs and disruption of ongoing litigation.
Guarantees
We have entered into certain guarantee contracts and stand-by letters of credit that total $172.6 ($126.8 for guarantees and $45.8 for stand-by letters of credit) as of December 31, 2014. The guarantees primarily relate to operating leases and indebtedness. The stand-by letters of credit relate to insurance requirements and debt facilities. If certain conditions were met under these arrangements, we would be required to satisfy our obligation in cash. Due to the nature of these arrangements and our historical experience, we do not expect to make any significant payments under these arrangements.
Note 14. Segment Data
We are organized and managed primarily on a geographic basis, with Right Management currently operating as a separate global business unit. Each country and business unit generally have their own distinct operations and management team, providing services under our global brands, and maintains its own financial reports. We have an executive sponsor for each global brand who is responsible for ensuring the integrity and consistency of delivery locally. We develop and implement global workforce solutions for our clients that deliver the outcomes that help them achieve their business strategy. Each operation reports directly or indirectly through a regional manager to a member of executive management. Given this reporting structure, all of our operations have been segregated into the following reporting segments: Americas, which includes United States and Other Americas; Southern Europe, which includes France, Italy and Other Southern Europe; Northern Europe; APME; and Right Management.
The Americas, Southern Europe, Northern Europe and APME segments derive a significant majority of their revenues from the placement of contingent workers. The remaining revenues within these segments are derived from other workforce solutions and services, including recruitment and assessment, training and development, and ManpowerGroup Solutions. ManpowerGroup Solutions includes Talent Based Outsourcing (TBO), TAPFIN — Managed Service Provider (MSP) and Recruitment Process Outsourcing (RPO). The Right Management segment revenues are derived from career management and workforce consulting services. Segment revenues represent sales to external clients. Due to the nature of our business, we generally do not have export sales. We provide services to a wide variety of clients, none of which individually comprise a significant portion of revenues for us as a whole.
The accounting policies of the segments are the same as those described in the summary of significant accounting policies. We evaluate performance based on operating unit profit, which is equal to segment revenues less direct costs and branch and national headquarters operating costs. This profit measure does not include goodwill and intangible asset impairment charges or amortization of intangible assets related to acquisitions, interest and other income and expense amounts or income taxes.
Total assets for the segments are reported after the elimination of investments in subsidiaries and intercompany accounts.
Notes to Consolidated Financial Statements
| 86 |
NOTES TO CONSOLIDATED FINANCIAL STATEMENTS
in millions, except share and per share data
| Year Ended December 31 | 2014 | 2013 | 2012 | |||||||||
| Revenues from Services(a) | ||||||||||||
| Americas: | ||||||||||||
| United States(b) | $ | 3,086.4 | $ | 2,967.0 | $ | 3,010.5 | ||||||
| Other Americas | 1,497.3 | 1,543.2 | 1,585.4 | |||||||||
| 4,583.7 | 4,510.2 | 4,595.9 | ||||||||||
| Southern Europe: | ||||||||||||
| France | 5,351.6 | 5,284.9 | 5,425.6 | |||||||||
| Italy | 1,178.8 | 1,087.6 | 1,056.8 | |||||||||
| Other Southern Europe | 979.3 | 864.5 | 768.5 | |||||||||
| 7,509.7 | 7,237.0 | 7,250.9 | ||||||||||
| Northern Europe | 6,048.1 | 5,738.8 | 5,773.9 | |||||||||
| APME | 2,327.1 | 2,447.7 | 2,728.8 | |||||||||
| Right Management | 294.2 | 316.8 | 328.5 | |||||||||
| $ | 20,762.8 | $ | 20,250.5 | $ | 20,678.0 | |||||||
| Operating Unit Profit | ||||||||||||
| Americas: | ||||||||||||
| United States | $ | 125.4 | $ | 99.8 | $ | 60.8 | ||||||
| Other Americas | 56.2 | 43.9 | 50.6 | |||||||||
| 181.6 | 143.7 | 111.4 | ||||||||||
| Southern Europe: | ||||||||||||
| France | 275.5 | 198.9 | 129.6 | |||||||||
| Italy | 64.2 | 53.8 | 45.4 | |||||||||
| Other Southern Europe | 22.0 | 11.9 | 10.1 | |||||||||
| 361.7 | 264.6 | 185.1 | ||||||||||
| Northern Europe | 198.1 | 139.7 | 159.8 | |||||||||
| APME | 84.2 | 70.8 | 90.7 | |||||||||
| Right Management | 33.5 | 20.4 | 13.4 | |||||||||
| 859.1 | 639.2 | 560.4 | ||||||||||
| Corporate expenses | (105.8 | ) | (93.2 | ) | (112.0 | ) | ||||||
| Intangible asset amortization expense(c) | (33.4 | ) | (34.1 | ) | (36.7 | ) | ||||||
| Interest and other expenses | (38.3 | ) | (36.4 | ) | (43.3 | ) | ||||||
| Earnings before income taxes | $ | 681.6 | $ | 475.5 | $ | 368.4 | ||||||
| (a) Further breakdown of revenues from services by geographical region is as follows: | ||||||||||||
| Revenues from Services | 2014 | 2013 | 2012 | |||||||||
| United States | $ | 3,190.6 | $ | 3,080.8 | $ | 3,132.0 | ||||||
| France | 5,378.6 | 5,313.6 | 5,448.3 | |||||||||
| Italy | 1,183.4 | 1,093.0 | 1,061.6 | |||||||||
| United Kingdom | 2,168.6 | 1,884.5 | 1,898.1 | |||||||||
| Total Foreign | 17,572.2 | 17,169.7 | 17,546.0 | |||||||||
| (b) | The United States revenues above represent revenues from our company-owned branches and franchise fees received from our franchise operations, which were $16.1, $15.2 and $14.6 for 2014, 2013 and 2012, respectively. |
| (c) | Intangible asset amortization related to acquisitions is excluded from operating costs within the reportable segments and corporate expenses, and shown separately. |
Notes to Consolidated Financial Statements
| ManpowerGroup | Annual Report 2014 | 87 |
| Year Ended December 31 | 2014 | 2013 | 2012 | |||||||||
| Depreciation and Amortization Expense | ||||||||||||
| Americas: | ||||||||||||
| United States | $ | 9.4 | $ | 12.3 | $ | 13.4 | ||||||
| Other Americas | 4.1 | 4.5 | 4.2 | |||||||||
| 13.5 | 16.8 | 17.6 | ||||||||||
| Southern Europe: | ||||||||||||
| France | 13.0 | 14.1 | 13.1 | |||||||||
| Italy | 2.4 | 2.6 | 2.7 | |||||||||
| Other Southern Europe | 2.2 | 2.2 | 2.4 | |||||||||
| 17.6 | 18.9 | 18.2 | ||||||||||
| Northern Europe | 11.2 | 14.0 | 15.8 | |||||||||
| APME | 4.4 | 4.8 | 4.9 | |||||||||
| Right Management | 3.6 | 4.3 | 5.1 | |||||||||
| Corporate expenses | 0.1 | 1.4 | 2.2 | |||||||||
| Amortization of intangible assets(a) | 33.4 | 34.1 | 36.7 | |||||||||
| $ | 83.8 | $ | 94.3 | $ | 100.5 | |||||||
| Earnings from Equity Investments | ||||||||||||
| Americas: | ||||||||||||
| United States | $ | — | $ | — | $ | — | ||||||
| Other Americas | — | — | — | |||||||||
| — | — | — | ||||||||||
| Southern Europe: | ||||||||||||
| France | 0.4 | 0.3 | — | |||||||||
| Italy | — | — | — | |||||||||
| Other Southern Europe | — | — | — | |||||||||
| 0.4 | 0.3 | — | ||||||||||
| Northern Europe | 2.6 | 6.9 | 2.5 | |||||||||
| APME | — | — | — | |||||||||
| Right Management | — | — | — | |||||||||
| $ | 3.0 | $ | 7.2 | $ | 2.5 | |||||||
| (a) | Intangible asset amortization related to acquisitions is excluded from operating costs within the reportable segments and corporate expenses, and shown separately. |
Notes to Consolidated Financial Statements
| 88 |
NOTES TO CONSOLIDATED FINANCIAL STATEMENTS
in millions, except share and per share data
| Year Ended December 31 | 2014 | 2013 | 2012 | |||||||||
| Total Assets | ||||||||||||
| Americas: | ||||||||||||
| United States | $ | 1,532.7 | $ | 1,476.3 | $ | 1,511.0 | ||||||
| Other Americas | 284.1 | 266.9 | 317.5 | |||||||||
| 1,816.8 | 1,743.2 | 1,828.5 | ||||||||||
| Southern Europe: | ||||||||||||
| France | 1,922.7 | 1,950.3 | 1,756.2 | |||||||||
| Italy | 230.0 | 218.3 | 301.2 | |||||||||
| Other Southern Europe | 218.4 | 209.1 | 187.8 | |||||||||
| 2,371.1 | 2,377.7 | 2,245.2 | ||||||||||
| Northern Europe | 1,862.6 | 1,951.8 | 1,732.5 | |||||||||
| APME | 501.4 | 466.7 | 491.7 | |||||||||
| Right Management | 139.1 | 134.4 | 95.4 | |||||||||
| Corporate(a) | 491.5 | 614.5 | 619.3 | |||||||||
| $ | 7,182.5 | $ | 7,288.3 | $ | 7,012.6 | |||||||
| Equity Investments | ||||||||||||
| Americas: | ||||||||||||
| United States | $ | — | $ | 3.0 | $ | 3.0 | ||||||
| Other Americas | — | — | — | |||||||||
| — | 3.0 | 3.0 | ||||||||||
| Southern Europe: | ||||||||||||
| France | 0.7 | 0.4 | 0.1 | |||||||||
| Italy | 0.2 | — | — | |||||||||
| Other Southern Europe | — | — | — | |||||||||
| 0.9 | 0.4 | 0.1 | ||||||||||
| Northern Europe | 131.1 | 136.5 | 81.5 | |||||||||
| APME | 0.3 | 0.3 | 0.7 | |||||||||
| Right Management | — | — | — | |||||||||
| $ | 132.3 | $ | 140.2 | $ | 85.3 | |||||||
| (a) | Corporate assets include assets that were not used in the operations of any segment, the most significant of which were purchased intangibles and cash. |
Notes to Consolidated Financial Statements
| ManpowerGroup | Annual Report 2014 | 89 |
| Year Ended December 31 | 2014 | 2013 | 2012 | |||||||||
| Long-Lived Assets(a) | ||||||||||||
| Americas: | ||||||||||||
| United States | $ | 25.4 | $ | 25.8 | $ | 32.8 | ||||||
| Other Americas | 8.3 | 10.4 | 11.2 | |||||||||
| 33.7 | 36.2 | 44.0 | ||||||||||
| Southern Europe: | ||||||||||||
| France | 44.6 | 56.3 | 59.4 | |||||||||
| Italy | 4.7 | 6.5 | 7.0 | |||||||||
| Other Southern Europe | 11.1 | 10.3 | 8.6 | |||||||||
| 60.4 | 73.1 | 75.0 | ||||||||||
| Northern Europe | 29.0 | 30.6 | 40.4 | |||||||||
| APME | 20.6 | 19.2 | 22.4 | |||||||||
| Right Management | 10.6 | 11.3 | 12.4 | |||||||||
| Corporate | 0.1 | 0.2 | 1.2 | |||||||||
| $ | 154.4 | $ | 170.6 | $ | 195.4 | |||||||
| Additions to Long-Lived Assets | ||||||||||||
| Americas: | ||||||||||||
| United States | $ | 9.1 | $ | 6.0 | $ | 11.6 | ||||||
| Other Americas | 3.9 | 4.8 | 5.0 | |||||||||
| 13.0 | 10.8 | 16.6 | ||||||||||
| Southern Europe: | ||||||||||||
| France | 7.8 | 10.7 | 25.6 | |||||||||
| Italy | 1.3 | 1.9 | 1.8 | |||||||||
| Other Southern Europe | 4.8 | 3.7 | 2.2 | |||||||||
| 13.9 | 16.3 | 29.6 | ||||||||||
| Northern Europe | 13.6 | 8.8 | 12.8 | |||||||||
| APME | 7.9 | 4.3 | 5.6 | |||||||||
| Right Management | 3.6 | 4.5 | 7.4 | |||||||||
| $ | 52.0 | $ | 44.7 | $ | 72.0 | |||||||
| (a) Further breakdown of long-lived assets by geographical region was as follows: | ||||||||||||
| Long-Lived Assets | 2014 | 2013 | 2012 | |||||||||
| United States | $ | 30.2 | $ | 30.6 | $ | 39.7 | ||||||
| France | 46.0 | 57.8 | 61.0 | |||||||||
| Italy | 4.7 | 6.5 | 7.1 | |||||||||
| United Kingdom | 10.3 | 7.4 | 11.0 | |||||||||
| Total Foreign | 124.2 | 140.0 | 155.7 | |||||||||
Notes to Consolidated Financial Statements
| 90 |
NOTES TO CONSOLIDATED FINANCIAL STATEMENTS
in millions, except share and per share data
Note 15. Quarterly Data (Unaudited)
| First | Second | Third | Fourth | |||||||||||||||||
| Quarter | Quarter | Quarter | Quarter | Total | ||||||||||||||||
| Year Ended December 31, 2014 | ||||||||||||||||||||
| Revenues from services | $ | 4,904.0 | $ | 5,321.7 | $ | 5,416.0 | $ | 5,121.1 | $ | 20,762.8 | ||||||||||
| Gross profit | 816.5 | 897.3 | 905.6 | 868.8 | 3,488.2 | |||||||||||||||
| Operating profit | 126.9 | 187.4 | 212.3 | 193.3 | 719.9 | |||||||||||||||
| Net earnings | 70.1 | 109.8 | 130.5 | 117.2 | 427.6 | |||||||||||||||
| Net earnings per share — basic | $ | 0.88 | $ | 1.37 | $ | 1.64 | $ | 1.49 | $ | 5.38 | ||||||||||
| Net earnings per share — diluted | 0.86 | 1.35 | 1.61 | 1.47 | 5.30 | |||||||||||||||
| Dividends per share | — | 0.49 | — | 0.49 | 0.98 | |||||||||||||||
| Market price: | ||||||||||||||||||||
| High | $ | 86.73 | $ | 86.26 | $ | 86.15 | $ | 71.17 | ||||||||||||
| Low | 72.45 | 74.00 | 70.10 | 59.00 | ||||||||||||||||
| Year Ended December 31, 2013 | ||||||||||||||||||||
| Revenues from services | $ | 4,768.9 | $ | 5,040.7 | $ | 5,188.8 | $ | 5,252.1 | $ | 20,250.5 | ||||||||||
| Gross profit | 790.1 | 836.4 | 853.6 | 886.6 | 3,366.7 | |||||||||||||||
| Operating profit(a) | 54.4 | 128.1 | 162.4 | 167.0 | 511.9 | |||||||||||||||
| Net earnings | 23.9 | 68.2 | 94.7 | 101.2 | 288.0 | |||||||||||||||
| Net earnings per share — basic | $ | 0.31 | $ | 0.88 | $ | 1.21 | $ | 1.28 | $ | 3.69 | ||||||||||
| Net earnings per share — diluted(b) | 0.31 | 0.87 | 1.18 | 1.25 | 3.62 | |||||||||||||||
| Dividends per share | — | 0.46 | — | 0.46 | 0.92 | |||||||||||||||
| Market price: | ||||||||||||||||||||
| High | $ | 57.31 | $ | 58.23 | $ | 75.18 | $ | 86.66 | ||||||||||||
| Low | 43.49 | 51.27 | 54.65 | 72.28 | ||||||||||||||||
| (a) | Included restructuring costs of $34.8, $20.0, $8.1 and $26.5 recorded in the first, second, third and fourth quarters, respectively. |
| (b) | Included in the results are restructuring costs per diluted share of ($0.32), ($0.18), ($0.08) and ($0.24) for the first, second, third and fourth quarters, respectively. |
****
Notes to Consolidated Financial Statements
| ManpowerGroup | Annual Report 2014 | 91 |
SELECTED FINANCIAL DATA
in millions, except per share data
| As of and for the Year Ended December 31 | 2014 | 2013 | 2012 | 2011 | 2010 | |||||||||||||||
| Operations Data | ||||||||||||||||||||
| Revenues from services | $ | 20,762.8 | $ | 20,250.5 | $ | 20,678.0 | $ | 22,006.0 | $ | 18,866.5 | ||||||||||
| Gross profit | 3,488.2 | 3,366.7 | 3,442.0 | 3,706.3 | 3,245.4 | |||||||||||||||
| Operating profit (loss) | 719.9 | 511.9 | 411.7 | 524.2 | (122.0 | ) | ||||||||||||||
| Net earnings (loss) | 427.6 | 288.0 | 197.6 | 251.6 | (263.6 | ) | ||||||||||||||
| Per Share Data | ||||||||||||||||||||
| Net earnings (loss) — basic | $ | 5.38 | $ | 3.69 | $ | 2.49 | $ | 3.08 | $ | (3.26 | ) | |||||||||
| Net earnings (loss) — diluted | 5.30 | 3.62 | 2.47 | 3.04 | (3.26 | ) | ||||||||||||||
| Dividends | 0.98 | 0.92 | 0.86 | 0.80 | 0.74 | |||||||||||||||
| Balance Sheet Data | ||||||||||||||||||||
| Total assets | $ | 7,182.5 | $ | 7,288.3 | $ | 7,012.6 | $ | 6,899.7 | $ | 6,729.7 | ||||||||||
| Long-term debt | 423.9 | 481.9 | 462.1 | 266.0 | 669.3 | |||||||||||||||
PERFORMANCE GRAPH
Set forth below is a graph for the periods ending December 31, 2009–2014 comparing the cumulative total shareholder return on our common stock with the cumulative total return of companies in the Standard & Poor’s 400 Midcap Stock Index and the Standard & Poor’s Supercomposite Human Resources and Employment Services Index. We are included in the Standard & Poor’s Supercomposite Human Resources and Employment Services Index and we estimate that we constituted approximately 18% of the total market capitalization of the companies included in the index. The graph assumes a $100 investment on December 31, 2009 in our common stock, the Standard & Poor’s 400 Midcap Stock Index and the Standard & Poor’s Supercomposite Human Resources and Employment Services Index and assumes the reinvestment of all dividends.
Performance Graph
(in dollars)

| December 31 | 2014 | 2013 | 2012 | 2011 | 2010 | 2009 | ||||||||||||||||||
| ManpowerGroup | 125 | 157 | 78 | 66 | 115 | 100 | ||||||||||||||||||
| S&P 400 Midcap Stock Index | 200 | 185 | 140 | 121 | 125 | 100 | ||||||||||||||||||
| S&P Supercomposite Human Resources and Employment Services Index | 182 | 183 | 105 | 95 | 114 | 100 | ||||||||||||||||||
Selected Financial Data
| 92 |
PRINCIPAL OPERATING UNITS
Argentina, Australia, Austria, Bahrain, Belarus, Belgium, Bolivia, Brazil, Bulgaria, Canada, Chile, China, Colombia, Costa Rica, Croatia, Cyprus, Czech Republic, Denmark, Dominican Republic, Ecuador, El Salvador, Estonia, Finland, France, Germany, Greece, Guatemala, Honduras, Hong Kong, Hungary, India, Ireland, Israel, Italy, Japan, Kazakhstan, Korea, Latvia, Lithuania, Luxembourg, Macau, Malaysia, Mexico, Monaco, Morocco, Netherlands, New Caledonia, New Zealand, Nicaragua, Norway, Panama, Paraguay, Peru, Philippines, Poland, Portugal, Puerto Rico, Romania, Russia, Serbia, Singapore, Slovakia, Slovenia, South Africa, Spain, Sweden, Switzerland, Taiwan, Thailand, Tunisia, Turkey, Ukraine, United Arab Emirates, United Kingdom, United States, Uruguay, Venezuela and Vietnam

ManpowerGroup™ (NYSE: MAN) has been the world’s workforce expert, creating innovative workforce solutions, for more than 65 years. As workforce experts, we connect more than 600,000 men and women to meaningful work across a wide range of skills and industries every day. Through our ManpowerGroup family of brands — Manpower®, Experis™, Right Management® and ManpowerGroup™ Solutions— we help more than 400,000 clients in 80 countries and territories address their critical talent needs, providing comprehensive solutions to resource, manage and develop talent. In 2014, ManpowerGroup was named one of the World’s Most Ethical Companies for the fourth consecutive year and one of Fortune’s Most Admired Companies, confirming our position as the most trusted and admired brand in the industry. See how ManpowerGroup makes powering the world of work humanly possible: www.manpowergroup.com.
Principal Operating Units
| ManpowerGroup | Annual Report 2014 | 93 |
CORPORATE INFORMATION
DIRECTORS
Jeffrey A. Joerres
Executive Chairman
ManpowerGroup
Jonas Prising
Chief Executive Officer
ManpowerGroup
Gina R. Boswell1*,3
Executive Vice President —
Personal Care, North America
Unilever
Cari M. Dominguez2
Former Chair of the Equal Employment
Opportunity Commission
William A. Downe2
President and CEO
BMO Financial Group
Patricia A. Hemingway Hall1
President and CEO
Health Care Service Corporation
Roberto Mendoza1
Senior Managing Director
Atlas Advisors
Ulice Payne Jr.1,3*
President and CEO
Addison-Clifton, LLC
Paul Read1
President and CEO
Ingram Micro Inc.
Elizabeth P. Sartain2
Founder of Libby Sartain LLC
Former CHRO Yahoo! Inc. and Southwest Airlines
John R. Walter2,3
Retired President and COO
AT&T Corp.
Former Chairman, President and CEO
R.R. Donnelley & Sons
Edward J. Zore2*,3
Lead Director
Retired President and CEO
Northwestern Mutual
MANAGEMENT
Jeffrey A. Joerres
Executive Chairman
Jonas Prising
Chief Executive Officer
Darryl Green
President and Chief Operating Officer
Michael J. Van Handel
Executive Vice President
Chief Financial Officer
Ram Chandrashekar
Executive Vice President
Operational Excellence and IT;
President — APME
Hans Leentjes
Executive Vice President
President — Northern Europe
Mara Swan
Executive Vice President
Global Strategy and Talent
Richard Buchband
Senior Vice President
General Counsel and Secretary
Board Committees
1 Audit Committee
2 Executive Compensation and
Human Resources Committee
3 Nominating and Governance Committee
*Denotes Committee Chair
Corporate Information
| 94 |
CORPORATE INFORMATION
World Headquarters
P.O. Box 2053
100 Manpower Place
Milwaukee, WI 53212 USA
+1.414.961.1000
www.manpowergroup.com
Transfer Agent and Registrar
Computershare
PO Box 30170
College Station, TX 77842-3170
Or for overnight deliveries:
Computershare
211 Quality Circle, Suite 210
College Station, TX 77845
Shareowners Toll Free: +1.800.874.1547
Foreign Shareowners: +1.201.680.6578
Website: www.computershare.com/investor
Stock Exchange Listing
NYSE Symbol: MAN
Form 10-K
A copy of Form 10-K filed with the Securities and Exchange Commission for the year ended December 31, 2014 is available without charge after March 20, 2015 and can be obtained at www.manpowergroup.com in the section titled “Investor Relations” or by writing to:
Richard Buchband
ManpowerGroup
100 Manpower Place
Milwaukee, WI 53212 USA
Shareholders
As of February 17, 2015, ManpowerGroup common stock was held by approximately 3,600 record holders.
Annual Meeting of Shareholders
April 28, 2015 at 10 a.m.
ManpowerGroup World Headquarters
100 Manpower Place
Milwaukee, WI 53212 USA
Investor Relations Website
The most current corporate and investor information can be found on the ManpowerGroup corporate website at www.manpowergroup.com. Interested individuals may also choose to receive ManpowerGroup press releases and other information via e-mail by subscribing to our E-mail Alert service at www.manpowergroup.com in the section titled “Investor Relations.”
Corporate Information