Attached files
| file | filename |
|---|---|
| EX-31.2 - EX-31.2 - LogMeIn, Inc. | d845471dex312.htm |
| EX-21.1 - EX-21.1 - LogMeIn, Inc. | d845471dex211.htm |
| EX-32.1 - EX-32.1 - LogMeIn, Inc. | d845471dex321.htm |
| EX-32.2 - EX-32.2 - LogMeIn, Inc. | d845471dex322.htm |
| EX-31.1 - EX-31.1 - LogMeIn, Inc. | d845471dex311.htm |
| EX-23.2 - EX-23.2 - LogMeIn, Inc. | d845471dex232.htm |
| EX-10.18 - EX-10.18 - LogMeIn, Inc. | d845471dex1018.htm |
| EXCEL - IDEA: XBRL DOCUMENT - LogMeIn, Inc. | Financial_Report.xls |
| EX-23.1 - EX-23.1 - LogMeIn, Inc. | d845471dex231.htm |
Table of Contents
UNITED STATES SECURITIES AND EXCHANGE COMMISSION
Washington, D.C. 20549
Form 10-K
(Mark One)
| þ | ANNUAL REPORT PURSUANT TO SECTION 13 OR 15(d) OF THE SECURITIES EXCHANGE ACT OF 1934 |
For the fiscal year ended December 31, 2014
or
| ¨ | TRANSITION REPORT PURSUANT TO SECTION 13 OR 15(d) OF THE SECURITIES EXCHANGE ACT OF 1934 |
For the transition period from to
Commission file number 001-34391
LOGMEIN, INC.
(Exact name of registrant as specified in its charter)
| Delaware | 20-1515952 | |
| (State or other jurisdiction of incorporation or organization) |
(I.R.S. Employer Identification No.) | |
| 320 Summer Street Boston, Massachusetts |
02210 | |
| (Address of principal executive offices) | (Zip Code) | |
(781) 638-9050
(Registrant’s telephone number, including area code)
Securities registered pursuant to Section 12(b) of the Act:
| Title of Each Class |
Name of Exchange on Which Registered | |
| Common Stock, $.01 par value | NASDAQ Global Select Market |
Securities registered pursuant to Section 12(g) of the Act:
None.
Indicate by check mark if the registrant is a well-known seasoned issuer, as defined in Rule 405 of the Securities Act. Yes þ No ¨
Indicate by check mark if the registrant is not required to file reports pursuant to Section 13 or Section 15(d) of the Act. Yes ¨ No þ
Indicate by check mark whether the registrant: (1) has filed all reports required to be filed by Section 13 or 15(d) of the Securities Exchange Act of 1934 during the preceding 12 months (or for such shorter period that the registrant was required to file such reports), and (2) has been subject to such filing requirements for the past 90 days. Yes þ No ¨
Indicate by check mark whether the registrant has submitted electronically and posted on its corporate Web site, if any, every Interactive Data File required to be submitted and posted pursuant to Rule 405 of Regulation S-T (§ 232.405 of this chapter) during the preceding 12 months (or for such shorter period that the registrant was required to submit and post such files). Yes þ No ¨
Indicate by check mark if disclosure of delinquent filers pursuant to Item 405 of Regulation S-K (§ 229.405 of this chapter) is not contained herein, and will not be contained, to the best of registrant’s knowledge, in definitive proxy or information statements incorporated by reference in Part III of this Form 10-K or any amendment to this Form 10-K. þ
Indicate by check mark whether the registrant is a large accelerated filer, an accelerated filer, a non-accelerated filer, or a smaller reporting company. See the definitions of “large accelerated filer,” “accelerated filer” and “smaller reporting company” in Rule 12b-2 of the Exchange Act. (Check one):
| Large accelerated filer þ | Accelerated filer ¨ | Non-accelerated filer ¨ | Smaller reporting company ¨ | |||
| (Do not check if a smaller reporting company) | ||||||
Indicate by check mark whether the registrant is a shell company (as defined in Rule 12b-2 of the Act). Yes ¨ No þ
The aggregate market value of the voting and non-voting common equity held by non-affiliates computed by reference to the price at which the common equity was last sold on the NASDAQ Global Select Market on June 30, 2014 was $872,638,381.
As of February 13, 2015, the registrant had 24,463,959 shares of Common Stock, $0.01 par value per share, outstanding.
Portions of the registrant’s definitive proxy statement to be filed with the Securities and Exchange Commission for the 2015 annual stockholders’ meeting to be held on May 21, 2015 are incorporated by reference into Items 10, 11, 12, 13 and 14 of Part III of this Annual Report on Form 10-K.
Table of Contents
INDEX
Table of Contents
Forward-Looking Statements
Matters discussed in this Annual Report on Form 10-K relating to future events or our future performance, including any discussion, express or implied, of our anticipated growth, operating results, future earnings per share, market opportunity, plans and objectives, are “forward-looking statements” within the meaning of Section 27A of the Securities Act of 1933, as amended, and Section 21E of the Securities Exchange Act of 1934, as amended. These statements are often identified by the words “may,” “will,” “expect,” “believe,” “anticipate,” “intend,” “could,” “estimate,” or “continue,” and similar expressions or variations. Such forward-looking statements are subject to risks, uncertainties and other factors that could cause actual results and the timing of certain events to differ materially from future results expressed or implied by such forward-looking statements. Factors that could cause or contribute to such differences include, but are not limited to, those discussed in the section titled “Risk Factors,” set forth in Item 1A of this Annual Report on Form 10-K and elsewhere in this Report. The forward-looking statements in this Annual Report on Form 10-K represent our views as of the date of this Annual Report on Form 10-K. We anticipate that subsequent events and developments will cause our views to change. However, while we may elect to update these forward-looking statements at some point in the future, we have no current intention of doing so except to the extent required by applicable law. You should, therefore, not rely on these forward-looking statements as representing our views as of any date subsequent to the date of this Annual Report on Form 10-K.
PART I
| ITEM 1. | BUSINESS |
Overview
LogMeIn provides a portfolio of cloud-based service offerings which make it possible for people and businesses to simply and securely connect to their workplace, colleagues and customers. Our services free millions of people to work from virtually anywhere on any Internet enabled device, empower IT professionals to securely embrace today’s mobile and cloud-centric workplace, transform how companies engage and support their customers, and help businesses bring the next generation of connected products to market. These services range from free downloadable mobile and web-based collaboration apps to enterprise grade professional helpdesk solutions to a cloud-based platform for the Internet of Things, all of which are accessible from anywhere with an Internet connection.
We incorporated under the laws of Bermuda as 3am Labs Ltd in February 2003. In August 2004, we completed a domestication in the State of Delaware under the name 3am Labs, Inc. We changed our name to LogMeIn, Inc. in March 2006. Our principal executive offices are located at 320 Summer Street, Boston MA 02210. Our website address is www.LogMeIn.com. We have included our website address in this report solely as an inactive textual reference. In 2004, we introduced our first cloud-based connectivity offering, which allowed users to securely connect to remote computer resources, including files, applications and the remote device itself. Used primarily by mobile professionals for the purposes of working remotely and by IT service providers to remotely manage computers and servers, this remote access solution was designed to give users the flexibility to work and interact with their computer resources from any other Internet-connected computer. We have since used this scalable technical foundation to expand the types of devices and data that can be accessed remotely, while introducing a variety of cloud-based offerings or applications built off of this foundation that address today’s collaboration, customer service, IT management and connected product development use cases.
Our services are delivered via the cloud as hosted services, meaning that the technology enabling the use of our services primarily resides on our servers, data centers and IT hardware, rather than those of our users. We call the software, hardware and networking technology used to deliver our cloud-based services “Gravity”. Gravity establishes secure connections over the Internet between two or more Internet-enabled devices and manages the direct transmission of data between remotely connected devices. With tens of millions of users and hundreds of millions of sessions brokered, we believe our services are used to connect more Internet-enabled devices worldwide, than any other connectivity platform on the market.
We offer both free and fee based, or premium, services. Sales of our premium services are generated through word-of-mouth referrals, web-based advertising, online search, off-line advertising, broadcast advertising, the conversion of free users and expiring free trials to paid subscriptions and direct marketing to new and
1
Table of Contents
existing customers. We complement our free services with our fee-based, or premium, services that can be easily accessed by users via time-bound free trials. The majority of these premium services are sold on an annual or monthly subscription basis.
We derive our revenue principally from subscription fees from SMBs, IT service providers, mobile carriers, customer service centers, original equipment manufacturers, or OEMs, and consumers and, to a lesser extent, from the delivery of professional services primarily related to our Xively business. The majority of our customers subscribe to our services on an annual basis. Our revenue is driven primarily by the number and type of our premium services for which our paying customers subscribe. During the fiscal years ended December 31, 2012, 2013 and 2014, we generated revenues of $138.8 million, $166.3 million, and $222.0 million, respectively.
Our Market Opportunity
Our cloud-based connectivity services allow our users to work remotely, use a mix of personal and employer-procured technology for work purposes, support and manage remote computers and other Internet-enabled devices, and collaborate with other users. We believe our services benefit users in the following ways:
| • | Increased productivity both in and outside of traditional office environments. Our collaboration and remote access services allow users to simply host and/or attend web-based meetings, access and control remote computers, access and secure cloud or web applications, run applications across different platforms and devices and save and share data with the cloud, thereby increasing their mobility and allowing them to remain productive from virtually anywhere on virtually any Internet-enabled device. |
| • | Reduced set-up, support and management costs. Our services enable IT staff to administer, monitor and support workers, their applications, their data, and their computers and other Internet-enabled devices from a remote location. Businesses can easily set up our cloud-based services with little or no modification to the remote location’s network or security systems and without the need for upfront technology or software investment. Additionally, our customers are often able to lower their support and management costs by performing their management-related tasks remotely, thereby reducing or eliminating the costs of on-site support and management. |
| • | Increased end-user and customer satisfaction. Our customers rely on our services to improve the efficiency and effectiveness of end-user support and customer service. Satisfaction with support and other customer engagement services is primarily measured by customer satisfaction, sales conversions, call-handling time and whether or not an issue is resolved on the first call. Our services enable helpdesk technicians, as well as customer service staff, to quickly and easily engage with users, gain access to and take control over a remote user’s Internet-enabled device. Once connected, technicians can diagnose and resolve problems while interacting with and possibly training the end user. Technicians can also answer questions and resolve common dilemmas via web chat, email, SMS and even social channels, like Twitter. |
| • | Reliable, fast and secure service. Our cloud-based services are delivered by a common proprietary platform called “Gravity,” which is designed to ensure that our services are reliable, fast and secure. Gravity achieves redundancy by being physically hosted in seven geographically diverse data centers, four of which are located in the United States, one of which is located in the United Kingdom, one of which is located in Asia and one of which is located in Australia. Gravity transmits data directly between end-point devices, which helps us reduce our bandwidth related costs and enables our services to connect and manage devices at enhanced speeds. Gravity also utilizes industry standard security protocols and is designed to authenticate and authorize users of our services without storing passwords. |
| • | Easy to try, buy and use. Our services are simple to install, which allows our prospective customers to use our services within minutes of registering for a trial. Additionally, our low service-delivery costs and hosted delivery model allow us to offer each of our services at competitive prices and to offer flexible payment options. |
2
Table of Contents
Our Business Strengths
We believe that the following strengths differentiate us from our competitors and are key to our success:
| • | Large established user community. As of December 31, 2014, tens of millions of customers have connected hundreds of millions of Internet-enabled devices to our services. These users drive awareness of our services through personal recommendations, blogs, social media and other online communication methods and provide us with a significant audience to which we can market and sell premium services. |
| • | Efficient customer acquisition model. We believe our free products and our large installed user base help to generate word-of-mouth referrals, which in turn increases the efficiency of our paid marketing activities. Sales of our premium services are generated through word-of-mouth referrals, web-based advertising, online search, off-line advertising, broadcast advertising, the conversion of free users and expiring free trials to paid subscriptions and marketing to our existing customer and user base. We believe this direct approach to acquiring new customers generates an attractive and predictable return on our sales and marketing expenditures. |
| • | Technology-enabled cost advantage. Our service delivery platform, Gravity, establishes secure connections over the Internet between devices and manages the direct transmission of data between them. This patented platform reduces our bandwidth and other infrastructure requirements, which we believe makes our services faster and less expensive to deliver. We believe this cost advantage allows us to offer free services and serve a broader user community than our competitors. |
| • | Online, cloud-based delivery. Delivering our services online via the cloud allows us to serve additional customers with little incremental expense and to deploy new applications and upgrades quickly and efficiently to our existing customers. |
| • | High recurring revenue and high transaction volumes. We sell a majority of our premium services on a monthly or annual subscription basis, which provides greater levels of recurring revenues and predictability compared to traditional perpetual license-based business models. Approximately 99% of our subscriptions have a one-year term. We believe that our sales model of a high volume of new and renewed subscriptions at low transaction prices increases the predictability of our revenues compared to perpetual licensed-based software businesses. |
Growth Strategy
Our objective is to extend our position as a leading provider of essential cloud-based services for all Internet connected devices. To accomplish this, we intend to:
| • | Acquire new customers. We acquire new customers through word-of-mouth referrals from our existing user community and from paid, online advertising designed to attract visitors to our website. We also encourage our website visitors to register for free trials of our premium services. We supplement our online efforts with email and other traditional marketing campaigns and by participating in trade events and web-based seminars. To increase our sales, we plan to continue to aggressively market our solutions and encourage trials of our services while expanding our sales force. |
| • | Increase sales to existing customers. We upsell and cross-sell our broad portfolio of services to our existing premium subscriber customer base. To further penetrate this base, we plan to continue to actively market our portfolio of services through e-commerce and by expanding our sales force. |
| • | Continue to expand our service portfolio. We intend to continue to invest in the development of new cloud-based connectivity services for businesses, IT service providers, consumers and mobile professionals. |
| • | Pursue strategic acquisitions. We pursue acquisitions that complement our existing business, represent a strong strategic fit and are consistent with our overall growth strategy. We also target future acquisitions to expand or add functionality and capabilities to our existing portfolio of services, as well as add new services to our portfolio. |
3
Table of Contents
| • | Expand internationally. We offer services in 12 different languages and our services are used in more than 240 countries. We believe there is a significant opportunity to increase our sales internationally. We intend to continue to expand our international sales and marketing personnel and increase our international marketing expenditures to take advantage of this opportunity. |
| • | Continue to build our user community. We grow our community of users by marketing our services through paid advertising that targets prospective customers who are seeking essential cloud connectivity services and by offering popular free services, like join me. This strategy improves the effectiveness of our online advertising by increasing our response rates when people seeking remote access, collaboration, customer engagement and data services conduct online searches. In addition, our large and growing community of users drives awareness of our services and increases referrals of potential customers and users. |
Our Services
Our core cloud-based services can generally be categorized into four business lines based on customer needs and respective use cases.
Collaboration. Our collaboration business is comprised of services designed to make it easy for users to interact with and access the computers, devices, data and people that make up their digital world. These individual services are as follows:
| • | join.me, join.me pro and join.me enterprise are our free and premium browser-based online meeting and screen sharing services that give users the ability to quickly and securely host an online meeting with other people. These services can be initiated through a visit to the http://join.me website, through a small downloadable desktop application or through mobile applications. The free version of join.me provides users with access to basic online meeting and collaboration tools such as file sharing, use of a dedicated VoIP conference line, remote control and in-meeting chat. Users who upgrade to join.me pro receive access to additional key features such as presenter swap, a scheduling tool, Google Calendar and Micosoft Outlook plugins, the ability to record and recap meetings, on-screen annotation tools and detailed session reporting. Users and businesses who upgrade to join.me enterprise receive additional account management, policy control and provisioning capabilities, as well as Salesforce.com integration. |
| • | Cubby Basic, Cubby Pro and Cubby Enterprise are our cloud-based file syncing, storage and sharing services that allow users to simply and securely share data and files with other people and across all of their Internet-enabled devices, such as smartphones, tablets and computers. All three services can be accessed and used via a web-browser, a downloadable desktop application and free mobile applications. Users can choose to replicate or “sync” any folder and its contents on their computer with any other computer, mobile device and the cloud, thereby ensuring that their data is available across all of their devices and accessible from virtually anywhere with an Internet connection. Files stored within a user’s “Cubby,” or synced folder, can also be shared with other people by either sending read-only web links or by sending a direct message inviting others into a particular “Cubby,” for access to and collaboration around sets of files. Cubby utilizes the same encryption standards used by many banks to encrypt online banking transactions to ensure that data is secure and can only be decrypted using a combination of encryption keys maintained by LogMeIn and/or the owner of the Cubby account. Cubby Basic provides users with access to 5GB of free cloud storage space. Cubby Pro is a premium offering for individual users that extends the benefits of Cubby Basic through additional, personal security features, the ability to sync files and folders directly between two or more computers without using the cloud, and offers users the ability to purchase additional storage space. Cubby Enterprise is designed for use by teams or entire businesses. It contains all of the features of Cubby Pro in addition to multi-user data sharing and security, and administrative and management controls that be customized by IT professionals or other administrators. |
| • | LogMeIn Pro is our premium remote access service that provides secure access to a remote computer or other Internet-enabled device from any other Internet connected computer, as well as most modern smartphones and tablets. Once a Pro host is installed on a device, a user can quickly and easily access that |
4
Table of Contents
| device’s desktop, files, applications and network resources remotely from their other Internet-enabled devices. LogMeIn Pro can be rapidly deployed and installed without the need for IT expertise. Users typically engage in a free trial prior to purchase. |
Service and Support. The services that comprise our service and support business are used by external customer service and support organizations, online retail and web-based businesses, as well as IT outsourcers and internal IT departments to deliver online, cloud-based service and support to customers and their Internet-enabled devices. These services are as follows:
| • | LogMeIn Rescue and LogMeIn Rescue+Mobile are our Web-based remote support and customer care services, which are used by helpdesk professionals to provide remote support via the Internet, without the need of pre-installed software. Using LogMeIn Rescue, support and service professionals can communicate with end users through an Internet chat window while diagnosing and repairing computer problems. If given permission by the computer user, the support professional can access, view or even take control of the end user’s computer to take necessary support actions and to train the end user on the use of software and operating system applications. LogMeIn Rescue+Mobile is an add-on of LogMeIn Rescue’s web-based remote support service that allows call center technicians and IT professionals to remotely access and support Blackberry, Symbian, iOS and Android smartphones and tablets. Technicians can send a text message directing users to download a small software application onto their mobile device, which, once installed, allows the technician to remotely access, control and troubleshoot the phone or tablet. |
| • | BoldChat is our Web-based live chat service that helps customer service staff, ranging from sales to pre-and-post sale support, to directly engage and provide assistance to visitors to their organization’s website. Key features include real-time visitor monitoring, co-browsing, detailed reporting on chat activity and its overall effectiveness, the ability to define rules that automatically trigger the initiation of a chat window, the ability to route and distribute chats to improve efficiency and the ability to monitor and manage customer conversations on Twitter, email and via SMS messages. Our BoldChat service offerings range from a basic free offering to a fully-featured enterprise offering, with multiple pricing tiers based on the number of users and desired features. |
IT Management. Our IT management business is comprised of services that are used by internal and external IT professionals to manage and secure remote computers and other Internet-enabled devices, automate common IT tasks, manage and secure sensitive data and help ensure the productivity of mobile workers.
| • | LogMeIn Central is a web-based management console that helps IT professionals access, manage and monitor remote computers, deploy software updates and patches, automate IT tasks, and run hundreds of versions of antivirus software. LogMeIn Central is offered as a premium service and works in conjunction with either basic hosts, which are free, or managed hosts, which are an additional premium offering and are priced per computer. |
| • | Meldium is a password and identity management product designed to help IT professionals and knowledge workers securely manage, store and share login credentials to over 1,600 third party cloud and web-based applications. Meldium allows for simple security and provisioning for applications used by employees to help ensure access to work-based applications and related data can be granted or revoked as necessary by managers or IT professionals. Meldium is offered as a free product for individual use and is also sold as a premium product for team use. |
| • | AppGuru is an application management product designed to help IT professionals and IT service providers discover, provision and secure both company procured and employee procured cloud and/or Software-as-a-Service applications being used within the workplace. AppGuru works in conjunction with LogMeIn applications like join.me and Cubby, as well as dozens of popular third-party applications like Salesforce.com, Dropbox, Box and NetSuite. |
Connected Products. Our connected product business is comprised solely of Xively, our Internet of Things cloud platform, which may be used by businesses to connect deploy, manage and support Internet connected products that lack a traditional operating system. The Xively platform provides the infrastructure needed to help businesses reduce the costs of, and accelerate the time-to-market for, new Internet-connected products, applications and customer services.
5
Table of Contents
Additional Service Offerings. In addition to the above-described core cloud-based services, we continue to offer the following legacy services:
| • | RemotelyAnywhere is a LAN-based systems administration product used to manage personal computers and servers from within the IT system of an enterprise. Unlike our core cloud-based service offerings, RemotelyAnywhere is licensed to customers on a perpetual basis. We also offer annual maintenance services that include software upgrades and support services for this application. |
| • | LogMeIn Backup is a service that subscribers install on two or more computers to create a backup network and is generally sold as a complement to LogMeIn Central or LogMeIn Pro subscriptions. LogMeIn Backup provides IT service providers a simple backup alternative to offer their customers using storage capacity that they can control. Files can be stored on, and restored to, any PC that the subscriber chooses, using industry-standard encryption protocols for the transmission and storage of the data. |
| • | LogMeIn Hamachi is a hosted virtual private network, or VPN, service that establishes a computer network among remote computers. LogMeIn Hamachi typically works with existing network and firewall configurations and can be managed from a web browser or the user’s software. Using LogMeIn Hamachi, users can securely communicate over the Internet as if their computers are on the same LAN, allowing for remote access and virtual networking. LogMeIn Hamachi is offered both as a free and paid service, with tiered pricing based on the number of devices connected in each network. |
Sales and Marketing
Our sales and marketing efforts are designed to attract prospective customers to our website, enroll them in free trials of our services and convert them to and retain them as paying customers. We expend sales and marketing resources through a combination of paid and unpaid sources. We also invest in public relations to broaden the general awareness of our services and to highlight the quality and reliability of our services for specific audiences. We are constantly seeking and employing new methods to reach more users and to convert them to paid subscribers. For the twelve months ended December 31, 2012, 2013 and 2014, we spent $70.1 million, $88.8 million and $119.5 million, respectively, on sales and marketing.
New Account Sales. Our sales are typically preceded by a trial of one of our services, and 98% of our sales transactions are settled via credit card. Our sales operations team manages the processes, systems and procedures that determine whether or not a trial should be managed by a telephone-based sales representative or handled via our e-commerce sales process. As of December 31, 2014, we employed 164 telephone-based sales representatives to manage newly generated trials. In addition, a small sales and business development team concentrates on sales to larger organizations and the formulation of strategic technology partnerships that are intended to generate additional sales.
International Sales. We currently have sales teams located in Ireland, the United Kingdom, Asia, and Australia focusing on international sales. In the years ended December 31, 2012, 2013 and 2014, we generated approximately 35%, 34% and 33%, respectively, of our revenue outside of the United States. As of December 31, 2012, 2013 and 2014, approximately 37%, 23% and 28% of our long-lived assets were located outside of the United States.
Online Advertising. We advertise online through pay-per-click spending with search engines, banner advertising with online advertising networks and other websites and email newsletters likely to be frequented by our target consumers, SMBs and IT professionals.
Tradeshows and Events. We showcase our services at technology and industry-specific tradeshows and events. Our participation in these shows ranges from elaborate presentations in front of large groups to one-on-one discussions and demonstrations at manned booths. In 2014, we attended approximately 60 trade shows and events in the United States, Europe, Asia and Australia.
Offline Advertising. Our offline print advertising is comprised of publications targeted at IT professionals and consumers. We also sponsor advertorials in regional newspapers, which target IT consumers. Additionally, from time-to-time we have advertised using more traditional methods, such as outdoor advertising, in regional markets.
6
Table of Contents
Radio Advertising. Our radio advertising includes 30-second “spots” as well as radio program sponsorships, and is primarily conducted on satellite and Internet radio networks, with some select advertising on traditional FM and AM radio stations. Show, channel and program selection is based on our key target audiences, most notably IT professionals and knowledge workers.
Word-of-Mouth Referrals. We believe that we have developed a loyal customer and user base, and new customers frequently claim to have heard about us from a current LogMeIn user. Many of our users arrive at our website via word-of-mouth referrals from existing users of our services.
Direct Advertising Into Our User Community. We have a large existing user community comprised of both free users and paying customers. Users of most of our services come to our website each time they log-in to their account and we use this opportunity to promote additional premium services to them.
Social Media Marketing. We participate in online communities such as Twitter, Facebook, LinkedIn and YouTube for the purpose of marketing, public relations and customer service. Through these online collaboration sites, we actively engage our users, learn about their needs, and foster word-of-mouth by creating and responding to content about LogMeIn events, promotions, product news and user questions.
Web-Based Seminars. We offer free online seminars to current and prospective customers designed to educate them about the benefits of online collaboration, remote access, support and administration, particularly with LogMeIn, and guide them in the use of our services. We often highlight customer success stories and focus the seminar on common business problems and key market and IT trends.
Public Relations. We engage in targeted public relations programs, including issuing press releases announcing important company events and product releases, participating in interviews with reporters and analysts, both general and industry specific and by, attending panel and group discussions and speeches at industry events. We also register our services in awards competitions and encourage bloggers to comment on our products.
Our Infrastructure, Technology and Developments
LogMeIn Gravity Service Delivery Platform. The majority of our services are delivered via a common proprietary cloud connectivity and data platform called “Gravity,” which consists of software applications, customized databases and web servers. Gravity establishes secure connections over the Internet between remote computers and other Internet-enabled devices and manages the direct transmission of data between remotely connected devices. Gravity is designed to be scalable and serve our large user community at low costs by reducing our bandwidth and other infrastructure requirements, which we believe makes our services faster and less expensive to deliver than other competing services.
The infrastructure-related costs of delivering our services include bandwidth, power, server depreciation and co-location fees. Gravity transmits data using a combination of methods designed to relay data via our data centers and to transmit data over the Internet directly between end-point devices. During the twelve months ended December 31, 2014, more than 93% of the data transmitted by our services was transmitted directly between end-point devices, reducing our bandwidth and bandwidth-related costs.
Gravity also implements multiple layers of security. Our services utilize industry-standard security protocols for encryption and authentication. Access to a device through our services requires system passwords such as the username and password for Windows. We also add additional layers of security such as single-use passwords, IP address filtering and IP address lockout. For security purposes, Gravity does not save end-user passwords for devices.
Gravity is physically hosted in seven third-party co-location facilities located in the United States, Europe, Australia and Asia. Our goal is to maintain sufficient excess capacity such that any one of the data centers could fail and the remaining data centers could handle the service load without extensive disruption to our services. During the twelve months ended December 31, 2014, our Gravity service was available 99.99% of the time.
Research and Development. We have made and intend to continue making significant investments in research and development in order to continue to improve the efficiency of our service delivery platform,
7
Table of Contents
improve our existing services and bring new services to market. Our primary engineering organization is based in Budapest, Hungary, where the first version of our remote access service was developed. Approximately 43% of our employees, as of December 31, 2014, work in research and development. Research and development expenses totaled $26.4 million, $29.0 million and $33.5 million in the years ended December 31, 2012, 2013 and 2014, respectively.
Intellectual Property. Our intellectual property rights are important to our business. We rely on a combination of copyright, trade secret, trademark, patent and other rights in the United States and other jurisdictions, as well as confidentiality procedures and contractual provisions to protect our proprietary technology, processes and other intellectual property. We also have twelve issued patents and eleven patents pending and are in the process of filing additional patent applications that cover other features of our services.
We enter into confidentiality and other written agreements with our employees, customers, consultants and partners, and through these and other written agreements, we attempt to control access to and distribution of our software, documentation and other proprietary technology and other information. Despite our efforts to protect our proprietary rights, third parties may, in an unauthorized manner, attempt to use, copy or otherwise obtain and market or distribute our intellectual property rights or technology or otherwise develop products or services with the same functionality as our services. In addition, U.S. patent filings are intended to provide the holder with a right to exclude others from making, using, selling or importing in the United States the inventions covered by the claims of granted patents. If granted, our patents may be contested, circumvented or invalidated. Moreover, the rights that may be granted in those pending patents may not provide us with proprietary protection or competitive advantages, and we may not be able to prevent third parties from infringing these patents. Therefore, the exact effect of our pending patents, if issued, and the other steps we have taken to protect our intellectual property cannot be predicted with certainty.
Although the protection afforded by copyright, trade secret and trademark law, written agreements and common law may provide some advantages, we believe that the following factors help us maintain a competitive advantage:
| • | our large user and customer base; |
| • | the technological skills of our research and development personnel; |
| • | frequent enhancements to our services; and |
| • | continued expansion of our proprietary technology. |
“LogMeIn” is a registered trademark in the United States and in the European Union. We also hold a number of other trademarks and service marks identifying certain of our services or features of our services. We also have a number of trademark applications pending.
Competition
The market that we compete in is evolving, and we expect to face additional competition in the future. We believe that the key competitive factors in the market include:
| • | service reliability and security; |
| • | ease of initial setup and use; |
| • | fitness for use and the design of features that best meet the needs of the target customer; |
| • | the ability to support multiple device types and operating systems; |
| • | cost of customer acquisition; |
| • | product and brand awareness; |
| • | the ability to reach large fragmented groups of users; |
| • | cost of service delivery; and |
| • | pricing flexibility. |
8
Table of Contents
We believe that our large user base, efficient customer acquisition model and low service delivery costs enable us to compete effectively against our largest competitors, including Citrix’s Online division and Cisco’s WebEx division. Both companies offer hosted collaboration and remote access-based services. Both of these competitors attract new customers through traditional marketing and sales efforts, while we have primarily focused on building a large-scale community of users. We believe we reach significantly more users than Citrix and WebEx, which allows us to attract paying customers efficiently.
Certain of our solutions also compete with current or potential services offered by Adobe, Apple, Cisco/WebEx, Citrix, Google, IBM, TeamViewer, Splashtop, GFI, OKTA, BlueJeans, LivePerson, Dropbox, Box, SugarSync, Microsoft, Oracle and PTC. Some of our competitors may also offer, currently or in the future, lower priced, or even free, products or services that compete with our services, including, but not limited to, Symantec’s pcAnywhere, Google’s Chrome Remote Desktop and Microsoft’s Remote Desktop, which comes bundled into most current versions of the Microsoft operating system.
Many of our actual and potential competitors enjoy greater name recognition, longer operating histories, more varied products and services and larger marketing budgets, as well as substantially greater financial, technical and other resources, than we do. In addition, we may also face future competition from new market entrants. We believe that our large user base, efficient customer acquisition model and low service delivery position us well to compete effectively in the future.
Available Information
Copies of the periodic reports that we file with the Securities and Exchange Commission, or SEC, such as our Annual Report on Form 10-K, Quarterly Reports on Form 10-Q, Current Reports on Form 8-K, and any other filings may be obtained by the public, free of charge, by visiting the Investors section of our website at https://investor.logmein.com/sec.cfm, as soon as reasonably practicable after they have been filed with the SEC, or by contacting our Investor Relations department at our office address listed above. Additionally, the SEC maintains copies of any materials that we may file with the SEC at the SEC’s Public Reference Room at 100 F Street, NE, Room 1580, Washington, DC 20549. The public may obtain information on the operation of the Public Reference Room by calling the SEC at 1-800-SEC-0330. The SEC also maintains an Internet site that contains periodic reports, proxy and information statements and other information regarding issuers that file electronically with the SEC at www.sec.gov. The contents of these websites are not incorporated into this filing. Further, our references to the URLs for these websites are intended to be inactive textual references only.
Employees
As of December 31, 2014, we had 804 full-time employees. None of our employees are represented by labor unions or covered by collective bargaining agreements. We consider our relationship with our employees to be good.
Segments
We have determined that we have one operating segment. For more information about our segments, see Note 2 to our Consolidated Financial Statements.
| ITEM 1A. | RISK FACTORS |
Our business is subject to numerous risks. We caution you that the following important factors, among others, could cause our actual results to differ materially from those expressed in forward-looking statements made by us or on our behalf in filings with the SEC, press releases, communications with investors and oral statements. Any or all of our forward-looking statements in this Annual Report or Form 10-K and in any other public statements we make may turn out to be wrong. They can be affected by inaccurate assumptions we might make or by known or unknown risks and uncertainties. Many factors mentioned in the discussion below will be important in determining future results. Consequently, no forward-looking statement can be guaranteed. Actual future results may differ materially from those anticipated in forward looking statements. We undertake no obligation to update any forward-looking statements, whether as a result of new information, future events or otherwise. You are advised, however, to consult any further disclosure we make in our reports filed with the SEC.
9
Table of Contents
RISKS RELATED TO OUR BUSINESS
We may be unable to maintain profitability.
We reported a net loss of $7.7 million for fiscal 2013, primarily due to patent litigation related expenses, and we reported net income of $8.0 million for the year ended December 31, 2014. However, given our operating history, we cannot be certain that we will be able to maintain this profitability in the future. Our growth in revenue and customer base may not be sustainable, and we may not achieve sufficient revenue to achieve or maintain profitability. We may incur significant losses in the future for a number of reasons, including, but not limited to, unforeseen expenses, operating difficulties, complications and delays or due to the other risks described in this report. Accordingly, we may not be able to maintain our profitability, and we may incur significant losses for the foreseeable future.
Assertions by a third party that our services and solutions infringe its intellectual property, whether or not correct, could subject us to costly and time-consuming litigation or expensive licenses.
There is frequent litigation in the software and technology industries based on allegations of infringement or other violations of intellectual property rights. We have been, and may in the future be, subject to third party patent infringement or other intellectual property-related lawsuits as we face increasing competition and become increasingly visible. Regardless of the merit of these claims, they can be time-consuming, result in costly litigation and diversion of technical and management personnel or require us to develop a non-infringing technology or enter into license agreements. There can be no assurance that such licenses will be available on acceptable terms and conditions, if at all, and although we have previously licensed proprietary technology, we cannot be certain that the owners’ rights in such technology will not be challenged, invalidated or circumvented. For these reasons and because of the potential for court awards that are difficult to predict, it is not unusual to find even arguably unmeritorious claims settled for significant amounts. In addition, many of our service agreements require us to indemnify our customers from certain third-party intellectual property infringement claims, which could increase our costs as a result of defending such claims and may require that we pay damages if there were an adverse ruling related to any such claims. These types of claims could harm our relationships with our customers, deter future customers from subscribing to our services or expose us to further litigation. These costs, monetary or otherwise, associated with defending against third party allegations of infringement could have negative effects on our business, financial condition and operating results.
For additional information please refer to Part I, Item 3 entitled “Legal Proceedings” and Note 11 of the Consolidated Financial Statements.
If the security of our customers’ confidential information stored in our systems is breached or otherwise subjected to unauthorized access, our reputation may be harmed, and we may be exposed to liability and a loss of customers.
Our systems store our customers’ confidential information, which may include credit card information, account and device information and other critical data. Any accidental or willful security breaches or other unauthorized access could expose us to liability for the loss of such information, time consuming and expensive litigation and other potential liabilities, as well as negative publicity. Many states have also enacted laws requiring companies to notify individuals of data security breaches involving their personal data. These mandatory disclosures regarding a security breach often lead to widespread negative publicity, which may cause our customers to lose confidence in the effectiveness of our data security measures.
Additionally, techniques used by computer hackers and cyber criminals to obtain unauthorized access or to sabotage systems change frequently and generally are difficult to recognize and react to. Our services and systems, including the systems of our outsourced service providers, have been and may in the future continue to be the target of various forms of cyber-attacks such as DNS attacks, wireless network attacks, viruses and worms, malicious software, application centric attacks, peer-to-peer attacks, phishing attempts, backdoor trojans and distributed denial of service (DDoS) attacks. While we make significant efforts to maintain the security and integrity of our services and computer systems, our cybersecurity measures and the cybersecurity measures taken by our third-party data center facilities may be unable to anticipate, detect or prevent all attempts to compromise our systems. Any security breach, whether successful or not, could harm our reputation, subject us to lawsuits and other potential liabilities and ultimately could result in the loss of customers.
10
Table of Contents
If our services are used to commit fraud or other similar intentional or illegal acts, we may incur significant liabilities, our services may be perceived as not secure and customers may curtail or stop using our services.
Certain services we provide enable direct remote access to third-party computer systems. We do not control the use or content of information accessed by our customers through our services. If our services are used to commit fraud or other bad or illegal acts, including, but not limited to, posting, distributing or transmitting any software or other computer files that contain a virus or other harmful component, interfering or disrupting third-party networks, infringing any third party’s copyright, patent, trademark, trade secret or other proprietary rights or rights of publicity or privacy, transmitting any unlawful, harassing, libelous, abusive, threatening, vulgar or otherwise objectionable material, or accessing unauthorized third-party data, we may become subject to claims for defamation, negligence or intellectual property infringement and subject to other potential liabilities. As a result, defending such claims could be expensive and time-consuming, and we could incur significant liability to our customers and to individuals or businesses who were the targets of such acts. As a result, our business may suffer and our reputation may be damaged.
We depend on search engines to attract a significant percentage of our customers, and if those search engines change their listings or increase their pricing, it would limit our ability to attract new customers.
Many of our customers locate our website through search engines, such as Google. Search engines typically provide two types of search results, algorithmic and purchased listings, and we rely on both types. Algorithmic listings cannot be purchased and are determined and displayed solely by a set of formulas designed by the search engine. Search engines revise their algorithms from time to time in an attempt to optimize search result listings. If the search engines on which we rely for algorithmic listings modify their algorithms in a manner that reduces the prominence of our listing, fewer potential customers may click through to our website, requiring us to resort to other costly resources to replace this traffic. Any failure to replace this traffic could reduce our revenue and increase our costs. In addition, costs for purchased listings have increased in the past and may increase in the future, and further increases could have negative effects on our financial condition.
If we are unable to attract new customers to our services on a cost-effective basis, our revenue and results of operations will be adversely affected.
We must continue to attract a large number of customers on a cost-effective basis, many of whom have not previously used cloud-based, remote-connectivity solutions. We rely on a variety of marketing methods to attract new customers to our services, such as paying providers of online services and search engines for advertising space and priority placement of our website in response to Internet searches. Our ability to attract new customers also depends on the competitiveness of the pricing of our services. If our current marketing initiatives are not successful or become unavailable, if the cost of such initiatives were to significantly increase, or if our competitors offer similar services at lower prices, we may not be able to attract new customers on a cost-effective basis and, as a result, our revenue and results of operations would be adversely affected.
If we are unable to retain our existing customers, our revenue and results of operations would be adversely affected.
We sell our services pursuant to agreements that are generally one year in duration. Our customers have no obligation to renew their subscriptions after their subscription period expires, and these subscriptions may not be renewed on the same or on more profitable terms. As a result, our ability to grow depends in part on subscription renewals. We may not be able to accurately predict future trends in customer renewals, and our customers’ renewal rates may decline or fluctuate because of several factors, including their satisfaction or dissatisfaction with our services, the prices of our services, the prices of services offered by our competitors or reductions in our customers’ spending levels. If our customers do not renew their subscriptions for our services, renew on less favorable terms, or do not purchase additional functionality or subscriptions, our revenue may grow more slowly than expected or decline, and our profitability and gross margins may be harmed.
11
Table of Contents
If we fail to convert our free users to paying customers, our revenue and financial results will be harmed.
A significant portion of our user base utilizes our services free of charge through our free services or free trials of our premium services. We seek to convert these free and trial users to paying customers of our premium services. If our rate of conversion suffers for any reason, our revenue may decline and our business may suffer.
If our efforts to build a strong brand identity are not successful, we may not be able to attract or retain subscribers and our operating results may be adversely affected.
We believe that building and maintaining a strong brand identity plays an important role in attracting and retaining subscribers to our services, who may have other options from which to obtain their remote connectivity services. In order to build a strong brand, we believe that we must continue to offer innovative remote connectivity services that our subscribers value and enjoy using, and also market and promote those services through effective marketing campaigns, promotions and communications with our user base. From time-to-time, subscribers may express dissatisfaction with our services or react negatively to our strategic business decisions, such as changes that we make in pricing, features or service offerings, including the discontinuance of our free services. To the extent that user dissatisfaction with our services or strategic business decisions is widespread or not adequately addressed, our overall brand identity may suffer and as a result our ability to attract and retain subscribers may be adversely affected, which could adversely affect our operating results.
Our business strategy includes acquiring or investing in other companies, which may divert our management’s attention, result in additional dilution to our stockholders and consume resources that are necessary to sustain our business.
Our business strategy includes acquiring complementary services, technologies or businesses. We also may enter into relationships with other businesses to expand our portfolio of services or our ability to provide our services in foreign jurisdictions, which could involve preferred or exclusive licenses, additional channels of distribution, discount pricing or investments in other companies. Negotiating these transactions can be time-consuming, difficult and expensive, and our ability to close these transactions may often be subject to conditions or approvals that are beyond our control. Consequently, these transactions, even if undertaken and announced, may not close.
An acquisition, investment or new business relationship may result in unforeseen operating difficulties and expenditures. In particular, we may encounter difficulties assimilating or integrating the businesses, technologies, products, personnel or operations of the acquired companies, particularly if the key personnel of the acquired company choose not to work for us, the company’s software is not easily adapted to work with ours or we have difficulty retaining the customers of any acquired business due to changes in management or otherwise. Acquisitions may also disrupt our business, divert our resources and require significant management attention that would otherwise be available for development of our business. Moreover, the anticipated benefits of any acquisition, investment or business relationship may not be realized or we may be exposed to unknown liabilities. For one or more of those transactions, we may:
| • | issue additional equity securities that would dilute our stockholders; |
| • | use cash that we may need in the future to operate our business; |
| • | incur debt on terms unfavorable to us or that we are unable to repay; |
| • | incur large charges or substantial liabilities; |
| • | encounter difficulties retaining key employees of the acquired company or integrating diverse software codes or business cultures; and |
| • | become subject to adverse tax consequences, substantial depreciation or deferred compensation charges. |
Any of these risks could harm our business and operating results.
12
Table of Contents
We expect that integrating an acquired company’s operations may present challenges.
The integration of an acquired company requires, among other things, coordination of administrative, sales and marketing, accounting and finance functions and expansion of information and management systems. Integration may prove to be difficult initially due to the necessity of coordinating geographically separate organizations and integrating personnel with disparate business backgrounds and corporate cultures. We may not be able to retain key employees of an acquired company. Additionally, the process of integrating a new product or service may require a disproportionate amount of time and attention of our management and financial and other resources. Any difficulties or problems encountered in the integration of a new product or service could have a material adverse effect on our business.
The integration of an acquired company may cost more than we anticipate, and it is possible that we will incur significant additional unforeseen costs in connection with the integration that may negatively impact our earnings.
In addition, we may only be able to conduct limited due diligence on an acquired company’s operations. Following an acquisition, we may be subject to unforeseen liabilities arising from an acquired company’s past or present operations. These liabilities may be greater than the warranty and indemnity limitations we negotiate. Any unforeseen liability that is greater than these warranty and indemnity limitations could have a negative impact on our financial condition.
Even if successfully integrated, there can be no assurance that our operating performance after an acquisition will be successful or will fulfill management’s objectives.
We may not be able to respond to rapid technological changes in time to address the needs of our customers, which could have a material adverse effect on our sales and profitability.
The cloud-based, remote-connectivity services market is characterized by rapid technological change, the frequent introduction of new services and evolving industry standards. Our ability to remain competitive will depend in large part on our ability to continue to enhance our existing services and develop new service offerings that keep pace with the market’s rapid technological developments. Additionally, to achieve market acceptance for our services, we must effectively anticipate and offer services that meet changing customer demands in a timely manner. Customers may require features and capabilities that our current services do not have. If we fail to develop services that satisfy customer requirements in a timely and cost-effective manner, our ability to renew our services with existing customers and our ability to create or increase demand for our services will be harmed and our revenue and results of operations would be adversely affected.
We may not be able to capitalize on potential emerging market opportunities and new services that we introduce may not generate the revenue and earnings we anticipated, which may adversely affect our business.
Our business strategy involves identifying emerging market opportunities which we can capitalize on by successfully developing and introducing new services designed to address those market opportunities. We have made and expect to continue to make significant investments in research and development in order to capitalize on potential emerging market opportunities that we have identified. If, despite our research and development efforts, we are not able to successfully develop new services or if we are not able to fully penetrate the emerging markets we have targeted, we may not be able to generate the revenue and earnings we anticipated and our business and results of operations would be adversely affected.
We use a limited number of data centers to deliver our services. Any disruption of service at these facilities could harm our business.
We host our services and serve all of our customers from seven third-party data center facilities located throughout the world. We do not control the operation of these facilities. The owners of our data center facilities have no obligation to renew their agreements with us on commercially reasonable terms, or at all. If we are unable to renew these agreements on commercially reasonable terms, we may be required to transfer to new data center facilities, and we may incur significant costs and possible service interruption in connection with doing so.
13
Table of Contents
Any changes in third-party service levels at our data centers or any errors, defects, disruptions or other performance problems with our services could harm our reputation and may damage our customers’ businesses. Interruptions in our services might reduce our revenue, cause us to issue credits to customers, subject us to potential liability, cause customers to terminate their subscriptions or harm our renewal rates.
Our data centers are vulnerable to damage or interruption from human error, intentional bad acts, pandemics, earthquakes, hurricanes, floods, fires, war, terrorist attacks, power losses, hardware failures, systems failures, telecommunications failures and similar events. At least one of our data facilities is located in an area known for seismic activity, increasing our susceptibility to the risk that an earthquake could significantly harm the operations of these facilities. The occurrence of a natural disaster or an act of terrorism, or vandalism or other misconduct, a decision to close the facilities without adequate notice or other unanticipated problems could result in lengthy interruptions in our services.
Failure to comply with data protection standards may cause us to lose the ability to offer our customers a credit card payment option which would increase our costs of processing customer orders and make our services less attractive to our customers, the majority of which purchase our services with a credit card.
Major credit card issuers have adopted data protection standards and have incorporated these standards into their contracts with us. If we fail to maintain our compliance with the data protection and documentation standards adopted by the major credit card issuers and applicable to us, these issuers could terminate their agreements with us, and we could lose our ability to offer our customers a credit card payment option. Most of our individual and SMB customers purchase our services online with a credit card, and our business depends substantially upon our ability to offer the credit card payment option. Any loss of our ability to offer our customers a credit card payment option would make our services less attractive to them and hurt our business. Our administrative costs related to customer payment processing would also increase significantly if we were not able to accept credit card payments for our services.
Failure to effectively and efficiently service SMBs would adversely affect our ability to increase our revenue.
We market and sell a significant amount of our services to SMBs. SMBs are challenging to reach, acquire and retain in a cost-effective manner. To grow our revenue quickly, we must add new customers, sell additional services to existing customers and encourage existing customers to renew their subscriptions. Selling to and retaining SMBs is more difficult than selling to and retaining large enterprise customers because SMB customers generally:
| • | have high failure rates; |
| • | are price sensitive; |
| • | are difficult to reach with targeted sales campaigns; |
| • | have high churn rates in part because of the scale of their businesses and the ease of switching services; and |
| • | generate less revenues per customer and per transaction. |
In addition, SMBs frequently have limited budgets and may choose to spend funds on items other than our services. Moreover, SMBs are more likely to be significantly affected by economic downturns than larger, more established companies, and if these organizations experience economic hardship, they may be unwilling or unable to expend resources on IT.
If we are unable to market and sell our services to SMBs with competitive pricing and in a cost-effective manner, our ability to grow our revenue quickly and become profitable will be harmed.
14
Table of Contents
The markets in which we participate are competitive, with low barriers to entry, and if we do not compete effectively, our operating results may be harmed.
The markets for remote-connectivity solutions are competitive and rapidly changing, with relatively low barriers to entry. With the introduction of new technologies and market entrants, we expect competition to intensify in the future. In addition, pricing pressures and increased competition generally could result in reduced sales, reduced margins or the failure of our services to achieve or maintain widespread market acceptance. Often we compete against existing services that our potential customers have already made significant expenditures to acquire and implement.
Certain of our competitors offer, or may in the future offer, lower priced, or free, products or services that compete with our services. This competition may result in reduced prices and a substantial loss of customers for our services or a reduction in our revenue.
Our services compete with large, established competitors like Citrix Systems, WebEx (a division of Cisco Systems), Microsoft, IBM, Apple, Google and Adobe. Certain of our services also compete with smaller competitors such as GFI, TeamViewer, Splashtop, OKTA, BlueJeans, LivePerson, Dropbox, BOX, SugarSync and PTC. Many of our actual and potential competitors enjoy competitive advantages over us, such as greater name recognition, longer operating histories, more varied services and larger marketing budgets, as well as greater financial, technical and other resources. In addition, many of our competitors have established marketing relationships and access to larger customer bases, and have major distribution agreements with consultants, system integrators and resellers. If we are not able to compete effectively, our operating results will be harmed.
Industry consolidation may result in increased competition.
Some of our competitors have made or may make acquisitions or may enter into partnerships or other strategic relationships to offer a more comprehensive service than they individually had offered. In addition, new entrants not currently considered to be competitors may enter the market through acquisitions, partnerships or strategic relationships. We expect these trends to continue as companies attempt to strengthen or maintain their market positions. Many of the companies driving this trend have significantly greater financial, technical and other resources than we do and may be better positioned to acquire and offer complementary services and technologies. The companies resulting from such combinations may create more compelling service offerings and may offer greater pricing flexibility than we can or may engage in business practices that make it more difficult for us to compete effectively, including on the basis of price, sales and marketing programs, technology or service functionality. These pressures could result in a substantial loss of customers or a reduction in our revenues.
Original equipment manufacturers may adopt solutions provided by our competitors.
Original equipment manufacturers may in the future seek to build the capability for remote-connectivity solutions into their products. We may compete with our competitors to sell our services to, or partner with, these manufacturers. Our ability to attract and partner with these manufacturers will, in large part, depend on the competitiveness of our services. If we fail to attract or partner with, or our competitors are successful in attracting or partnering with, these manufacturers, our revenue and results of operations would be affected adversely.
Our quarterly operating results may fluctuate in the future. As a result, we may fail to meet or exceed the expectations of research analysts or investors, which could cause our stock price to decline.
Our quarterly operating results may fluctuate as a result of a variety of factors, many of which are outside of our control. If our quarterly operating results or guidance fall below the expectations of research analysts or investors, the price of our common stock could decline substantially. Fluctuations in our quarterly operating results or guidance may be due to a number of factors, including, but not limited to, those listed below:
| • | our ability to renew existing customers, increase sales to existing customers and attract new customers; |
| • | the amount and timing of operating costs and capital expenditures related to the operation, maintenance and expansion of our business; |
| • | service outages or security breaches; |
15
Table of Contents
| • | whether we meet the service level commitments in our agreements with our customers; |
| • | changes in our pricing policies or those of our competitors; |
| • | our ability to successfully implement strategic business model changes; |
| • | the timing and success of new application and service introductions and upgrades by us or our competitors; |
| • | changes in sales compensation plans or organizational structure; |
| • | the timing of costs related to the development or acquisition of technologies, services or businesses; |
| • | seasonal variations or other cyclicality in the demand for our services; |
| • | general economic, industry and market conditions and those conditions specific to Internet usage and online businesses; |
| • | litigation, including class action litigation, involving our company, our services, or our general industry; |
| • | the purchasing and budgeting cycles of our customers; |
| • | the financial condition of our customers; and |
| • | geopolitical events such as war, threat of war or terrorist acts. |
We believe that our quarterly revenue and operating results may vary significantly in the future and that period-to-period comparisons of our operating results may not be meaningful. You should not rely on past results as an indication of future performance.
If we fail to maintain proper and effective internal controls, our ability to produce accurate and timely financial statements could be impaired, which could harm our operating results, our ability to operate our business and investors’ views of us.
Ensuring that we have adequate internal financial and accounting controls and procedures in place so that we can produce accurate financial statements on a timely basis is a costly and time-consuming effort. Our internal controls over financial reporting is a process designed to provide reasonable assurance regarding the reliability of financial reporting and the preparation of financial statements in accordance with generally accepted accounting principles in the United States of America. In addition, Section 404 of the Sarbanes-Oxley Act of 2002, or the Sarbanes-Oxley Act, requires an annual management assessment of the effectiveness of our internal controls over financial reporting and a report from our independent registered public accounting firm addressing the effectiveness of our internal controls over financial reporting. We have documented, tested and improved, to the extent necessary, our internal controls over financial reporting for the year ended December 31, 2014. If in the future we are not able to comply with the requirements of Section 404 of the Sarbanes-Oxley Act in a timely manner, or if as part of our process of documenting and testing our internal controls over financial reporting, we or our independent registered public accounting firm identify deficiencies or areas for further attention and improvement, implementing appropriate changes to our internal controls may distract our officers and employees, entail substantial costs to modify our existing processes and take significant time to complete. These changes may not, however, be effective in maintaining the adequacy of our internal controls, and any failure to maintain that adequacy, or consequent inability to produce accurate financial statements on a timely basis, could increase our operating costs and harm our business. In addition, investors’ perceptions that our internal controls are inadequate or that we are unable to produce accurate financial statements on a timely basis may harm our stock price and make it more difficult for us to effectively market and sell our services to new and existing customers.
We provide minimum service level commitments to some of our customers, the failure of which to meet could cause us to issue credits for future services or pay penalties, which could significantly harm our revenue.
Some of our customer agreements now, and may in the future, provide minimum service level commitments regarding items such as uptime, functionality or performance. If we are unable to meet the stated service level commitments for these customers or our services suffer extended periods of unavailability, we are or may be
16
Table of Contents
contractually obligated to provide these customers with credits for future services or pay other penalties. Our revenue could be significantly impacted if we are unable to meet our service level commitments and are required to provide a significant amount of our services at no cost or pay other penalties. We do not currently have any reserves on our balance sheet for these commitments.
If we fail to manage our growth effectively, we may be unable to execute our business plan, maintain high levels of service or address competitive challenges adequately.
For the last three fiscal years, our revenue has grown from $138.8 million in 2012 to $166.3 million in 2013 and to $222.0 million in 2014. Our growth has placed, and may continue to place, a significant strain on our managerial, administrative, operational, financial and other resources. We intend to further expand our overall business, customer base, headcount and operations both domestically and internationally. Creating a global organization and managing a geographically dispersed workforce will require substantial management effort and significant additional investment in our infrastructure. We will be required to continue to improve our operational, financial and management controls and our reporting procedures and we may not be able to do so effectively. As such, we may be unable to manage our expenses effectively in the future, which may negatively impact our gross profit or operating expenses in any particular quarter.
If we do not effectively expand and train our work force, our future operating results will suffer.
We plan to continue to expand our work force both domestically and internationally to increase our customer base and revenue. We believe that there is significant competition for qualified personnel with the skills and technical knowledge that we require. Our ability to achieve significant revenue growth will depend, in large part, on our success in recruiting, training and retaining sufficient numbers of personnel to support our growth. New hires require significant training and, in most cases, take significant time before they achieve full productivity. Our recent hires and planned hires may not become as productive as we expect, and we may be unable to hire or retain sufficient numbers of qualified individuals. If our recruiting, training and retention efforts are not successful or do not generate a corresponding increase in revenue, our business will be harmed.
Our sales cycles for enterprise customers can be long, unpredictable and require considerable time and expense, which may cause our operating results to fluctuate.
The timing of our revenue from sales to enterprise customers is difficult to predict. These efforts require us to educate our customers about the use and benefit of our services, including the technical capabilities and potential cost savings to an organization. Enterprise customers typically undertake a significant evaluation process that has in the past resulted in a lengthy sales cycle, typically several months. We spend substantial time, effort and money on our enterprise sales efforts without any assurance that our efforts will produce any sales. In addition, service subscriptions are frequently subject to budget constraints and unplanned administrative, processing and other delays. If sales expected from a specific customer for a particular quarter are not realized in that quarter or at all, our results could fall short of public expectations and our business, operating results and financial condition could be adversely affected.
Our long-term success depends, in part, on our ability to expand the sales of our services to customers located outside of the United States, and thus our business is susceptible to risks associated with international sales and operations.
We currently maintain offices and have sales personnel outside of the United States and are expanding our international operations. Our international expansion efforts may not be successful. In addition, conducting international operations subjects us to new risks that we have not generally faced in the United States. These risks include:
| • | localization of our services, including translation into foreign languages and adaptation for local practices and regulatory requirements; |
| • | lack of familiarity with and unexpected changes in foreign regulatory requirements; |
| • | longer accounts receivable payment cycles and difficulties in collecting accounts receivable; |
17
Table of Contents
| • | difficulties in managing and staffing international operations; |
| • | fluctuations in currency exchange rates; |
| • | potentially adverse tax consequences, including the complexities of foreign value added or other tax systems and restrictions on the repatriation of earnings; |
| • | dependence on certain third parties, including channel partners with whom we do not have extensive experience; |
| • | the burdens of complying with a wide variety of foreign laws and legal standards; |
| • | increased financial accounting and reporting burdens and complexities; |
| • | political, social and economic instability abroad, terrorist attacks and security concerns in general; and |
| • | reduced or varied protection for intellectual property rights in some countries. |
Operating in international markets also requires significant management attention and financial resources. The investment and additional resources required to establish operations and manage growth in other countries may not produce desired levels of revenue or profitability.
Adverse economic conditions or reduced IT spending may adversely impact our revenues and profitability.
Our business depends on the overall demand for IT and on the economic health of our current and prospective customers. The use of our service is often discretionary and may involve a commitment of capital and other resources. Weak economic conditions in the United States, European Union and other key international economies may affect the rate of IT spending and could adversely impact our customers’ ability or willingness to purchase our services, delay prospective customers’ purchasing decisions, reduce the value or duration of their subscription contracts, or affect renewal rates, all of which could have an adverse effect on our business, operating results and financial condition.
Our success depends in large part on our ability to protect and enforce our intellectual property rights.
We rely on a combination of copyright, service mark, trademark and trade secret laws, as well as confidentiality procedures and contractual restrictions, to establish and protect our proprietary rights, all of which provide only limited protection. In addition, we have twelve issued patents and eleven patents pending, and we are in the process of filing additional patents. We cannot assure you that any patents will issue from our currently pending patent applications in a manner that gives us the protection that we seek, if at all, or that any future patents issued to us will not be challenged, invalidated or circumvented. Any patents that may issue in the future from pending or future patent applications may not provide sufficiently broad protection or they may not prove to be enforceable in actions against alleged infringers. Also, we cannot assure you that any future service mark or trademark registrations will be issued for pending or future applications or that any registered service marks or trademarks will be enforceable or provide adequate protection of our proprietary rights.
We endeavor to enter into agreements with our employees and contractors and agreements with parties with whom we do business to limit access to and disclosure of our proprietary information. The steps we have taken, however, may not prevent unauthorized use or the reverse engineering of our technology. Moreover, others may independently develop technologies that are competitive to ours or infringe our intellectual property. Enforcement of our intellectual property rights also depends on our successful legal actions against these infringers, but these actions may not be successful, even when our rights have been infringed.
Furthermore, effective patent, trademark, service mark, copyright and trade secret protection may not be available in every country in which our services are available. In addition, the legal standards relating to the validity, enforceability and scope of protection of intellectual property rights in Internet-related industries are uncertain and still evolving.
18
Table of Contents
Our use of “open source” software could negatively affect our ability to sell our services and subject us to possible litigation.
A portion of the technologies we license incorporate so-called “open source” software, and we may incorporate additional open source software in the future. Open source software is generally licensed by its authors or other third parties under open source licenses. If we fail to comply with these licenses, we may be subject to certain conditions, including requirements that we offer our services that incorporate the open source software for no cost, that we make available source code for modifications or derivative works we create based upon, incorporating or using the open source software and/or that we license such modifications or derivative works under the terms of the particular open source license. If an author or other third party that distributes such open source software were to allege that we had not complied with the conditions of one or more of these licenses, we could be required to incur significant legal expenses defending against such allegations and could be subject to significant damages, enjoined from the sale of our services that contained the open source software and required to comply with the foregoing conditions, which could disrupt the distribution and sale of some of our services.
We rely on third-party software, including server software and licenses from third parties to use patented intellectual property that is required for the development of our services, which may be difficult to obtain or which could cause errors or failures of our services.
We rely on software licensed from third parties to offer our services, including server software from Microsoft and patented third-party technology. In addition, we may need to obtain future licenses from third parties to use intellectual property associated with the development of our services, which might not be available to us on acceptable terms, or at all. Any loss of the right to use any software required for the development and maintenance of our services could result in delays in the provision of our services until equivalent technology is either developed by us, or, if available, is identified, obtained and integrated, which could harm our business. Any errors or defects in third-party software could result in errors or a failure of our services which could harm our business.
Material defects or errors in the software we use to deliver our services could harm our reputation, result in significant costs to us and impair our ability to sell our services.
The software applications underlying our services are inherently complex and may contain material defects or errors, particularly when first introduced or when new versions or enhancements are released. We have from time to time found defects in our services, and new errors in our existing services may be detected in the future. Any defects that cause interruptions to the availability of our services could result in:
| • | a reduction in sales or delay in market acceptance of our services; |
| • | sales credits or refunds to our customers; |
| • | loss of existing customers and difficulty in attracting new customers; |
| • | diversion of development resources; |
| • | harm to our reputation; and |
| • | increased insurance costs. |
After the release of our services, defects or errors may also be identified from time to time by our internal team and by our customers. The costs incurred in correcting any material defects or errors in our services may be substantial and could harm our operating results.
Government regulation of the Internet and e-commerce and of the international exchange of certain technologies is subject to possible unfavorable changes, and our failure to comply with applicable regulations could harm our business and operating results.
As Internet commerce continues to evolve, increasing regulation by federal, state or foreign governments becomes more likely. For example, we believe increased regulation is likely in the area of data privacy, and laws
19
Table of Contents
and regulations applying to the solicitation, collection, processing or use of personal or consumer information could affect our customers’ ability to use and share data, potentially reducing demand for our products and services. In addition, taxation of products and services provided over the Internet or other charges imposed by government agencies or by private organizations for accessing the Internet may also be imposed. Any regulation imposing greater fees for Internet use or restricting the exchange of information over the Internet could result in reduced growth or a decline in the use of the Internet and could diminish the viability of our Internet-based services, which could harm our business and operating results.
Our software products contain encryption technologies, certain types of which are subject to U.S. and foreign export control regulations and, in some foreign countries, restrictions on importation and/or use. We have submitted our encryption products for technical review under U.S. export regulations and have received the necessary approvals. Any failure on our part to comply with encryption or other applicable export control requirements could result in financial penalties or other sanctions under the U.S. export regulations, which could harm our business and operating results. Foreign regulatory restrictions could impair our access to technologies that we seek for improving our products and services and may also limit or reduce the demand for our products and services outside of the United States.
Our operating results may be harmed if we are required to collect sales or other related taxes for our subscription services in jurisdictions where we have not historically done so.
Primarily due to the nature of our services in certain states and countries, we do not believe we are required to collect sales or other related taxes from our customers in certain states or countries. However, one or more other states or countries may seek to impose sales or other tax collection obligations on us, including for past sales by us or our resellers and other partners. A successful assertion that we should be collecting sales or other related taxes on our services could result in substantial tax liabilities for past sales, discourage customers from purchasing our services or otherwise harm our business and operating results.
The loss of key employees or an inability to attract and retain additional personnel may impair our ability to grow our business.
We are highly dependent upon the continued service and performance of our executive management team as well as other key technical and sales employees. These key employees are not party to an employment agreement with us, and they may terminate employment with us at any time with no advance notice. The replacement of these key employees likely would involve significant time and costs, and the loss of these key employees may significantly delay or prevent the achievement of our business objectives.
We face intense competition for qualified individuals from numerous technology, software and manufacturing companies. For example, our competitors may be able attract and retain a more qualified engineering team by offering more competitive compensation packages. If we are unable to attract new engineers and retain our current engineers, we may not be able to develop and maintain our services at the same levels as our competitors and we may, therefore, lose potential customers and sales penetration in certain markets. Our failure to attract and retain suitably qualified individuals could have an adverse effect on our ability to implement our business plan and, as a result, our ability to compete would decrease, our operating results would suffer and our revenues would decrease.
Our business is substantially dependent on market demand for, and acceptance of, the cloud-based model for the use of software.
We derive, and expect to continue to derive, substantially all of our revenue from the sale of cloud-based services. As a result, widespread acceptance and use of the cloud-based business model is critical to our future growth and success. Under the perpetual or periodic license model for software procurement, users of the software typically run applications on their hardware. Because companies are generally predisposed to maintaining control of their IT systems and infrastructure, there may be resistance to the concept of accessing the functionality that software provides as a service through a third party. If the market for cloud-based, software solutions ceases to grow or grows more slowly than we currently anticipate, demand for our services could be negatively affected.
20
Table of Contents
Growth of our business may be adversely affected if businesses, IT support providers or consumers do not adopt remote access, support and collaboration solutions more widely.
Our services employ new and emerging technologies for remote access, support and collaboration. Our target customers may hesitate to accept the risks inherent in applying and relying on new technologies or methodologies to supplant traditional methods of remote connectivity. Our business will not be successful if our target customers do not accept the use of our remote access and remote support technologies.
Our success depends on our customers’ continued high-speed access to the Internet and the continued reliability of the Internet infrastructure.
Because our services are designed to work over the Internet, our revenue growth depends on our customers’ high-speed access to the Internet, as well as the continued maintenance and development of the Internet infrastructure. The future delivery of our services will depend on third-party Internet service providers to expand high-speed Internet access, to maintain a reliable network with the necessary speed, data capacity and security, and to develop complementary products and services, including high-speed modems, for providing reliable and timely Internet access and services. The success of our business depends directly on the continued accessibility, maintenance and improvement of the Internet as a convenient means of customer interaction, as well as an efficient medium for the delivery and distribution of information by businesses to their employees. All of these factors are out of our control.
To the extent that the Internet continues to experience increased numbers of users, frequency of use or bandwidth requirements, the Internet may become congested and be unable to support the demands placed on it, and its performance or reliability may decline. Any future Internet outages or delays could adversely affect our ability to provide services to our customers.
RISKS RELATED TO OWNERSHIP OF OUR COMMON STOCK
Our failure to raise additional capital or generate the cash flows necessary to expand our operations and invest in our services could reduce our ability to compete successfully.
We may need to raise additional funds, and we may not be able to obtain additional debt or equity financing on favorable terms, if at all. If we raise additional equity financing, our stockholders may experience significant dilution of their ownership interests, and the per share value of our common stock could decline. If we engage in debt financing, we may be required to accept terms that restrict our ability to pay dividends or make distributions, incur additional indebtedness and force us to maintain specified liquidity or other ratios. If we need additional capital and cannot raise it on acceptable terms, we may not be able to, among other things:
| • | develop or enhance our services; |
| • | continue to expand our development, sales and marketing organizations; |
| • | acquire complementary technologies, products or businesses; |
| • | expand our operations, in the United States or internationally; |
| • | hire, train and retain employees; or |
| • | respond to competitive pressures or unanticipated working capital requirements. |
Our stock price may be volatile, and the market price of our common stock may drop in the future.
Prior to the completion of our initial public offering, or IPO, in July 2009, there was no public market for shares of our common stock. During the period from our IPO until February 13, 2015, our common stock has traded as high as $53.38 and as low as $15.15. An active, liquid and orderly market for our common stock may not be sustained, which could depress the trading price of our common stock. Some of the factors that may cause the market price of our common stock to fluctuate include:
| • | fluctuations in our quarterly financial results or the quarterly financial results of companies perceived to be similar to us; |
| • | fluctuations in our recorded revenue, even during periods of significant sales order activity; |
21
Table of Contents
| • | changes in estimates of our financial results or recommendations by securities analysts; |
| • | failure of any of our services to achieve or maintain market acceptance; |
| • | changes in market valuations of similar companies; |
| • | announcements regarding changes to our current or planned products or services; |
| • | success of competitive products or services; |
| • | changes in our capital structure, such as future issuances of securities or the incurrence of debt; |
| • | announcements by us or our competitors of significant services, contracts, acquisitions or strategic alliances; |
| • | regulatory developments in the United States, foreign countries or both; |
| • | litigation, including class action litigation, involving our company, our services, or our general industry, including announcements regarding developments in on-going litigation matters; |
| • | additions or departures of key personnel; |
| • | general perception of the future of the remote-connectivity market or our services; |
| • | investors’ general perception of us; and |
| • | changes in general economic, industry and market conditions. |
In addition, if the market for technology stocks or the stock market in general experiences a loss of investor confidence, the trading price of our common stock could decline for reasons unrelated to our business, financial condition or results of operations. If any of the foregoing occurs, it could cause our stock price to fall and may expose us to class action lawsuits that, even if unsuccessful, could be costly to defend and a distraction to management.
A significant portion of our total outstanding shares may be sold into the public market at any time, which could cause the market price of our common stock to drop significantly, even if our business is doing well.
If our existing stockholders sell a large number of shares of our common stock or the public market perceives that such existing stockholders might sell shares of common stock, the trading price of our common stock could decline significantly.
If securities or industry analysts do not publish or cease publishing research or reports about us, our business or our market, or if they publish a negative report or change their recommendations regarding our stock adversely, our stock price and trading volume could decline.
The trading market for our common stock is influenced by the research and reports that industry or securities analysts publish about us, our business, our market or our competitors. If any of the analysts who cover us or may cover us in the future publish a negative report or change their recommendation regarding our stock adversely, or provide more favorable relative recommendations about our competitors, our stock price would likely decline. If any analyst who covers us or may cover us in the future were to cease coverage of our company or fail to regularly publish reports on us, we could lose visibility in the financial markets, which in turn could cause our stock price or trading volume to decline.
Our management has broad discretion over the use of our existing cash resources and might not use such funds in ways that increase the value of our common stock.
Our management will continue to have broad discretion to use our cash resources. Our management might not apply these cash resources in ways that increase the value of our common stock.
22
Table of Contents
We do not expect to declare any dividends in the foreseeable future.
We do not anticipate declaring any cash dividends to holders of our common stock in the foreseeable future. Consequently, stockholders must rely on sales of their common stock after price appreciation, which may never occur, as the only way to realize any future gains on the value of their shares of our common stock.
As a public company, we incur significant additional costs which could harm our operating results.
As a public company, we incur significant legal, accounting and other expenses, including costs associated with public company reporting requirements. We also have incurred and will continue to incur costs associated with current corporate governance requirements, including requirements under Section 404 and other provisions of the Sarbanes-Oxley Act, as well as rules implemented by the Securities and Exchange Commission, or SEC, and The NASDAQ Global Select Market. The expenses incurred by public companies for reporting and corporate governance purposes have increased dramatically. We expect these rules and regulations to substantially increase our legal and financial compliance costs and to make some activities more time-consuming and costly. We also expect these new rules and regulations may make it more difficult and more expensive for us to maintain director and officer liability insurance, and we may be required to accept reduced policy limits and coverage or incur substantially higher costs to obtain the same or similar coverage previously available. As a result, it may be more difficult for us to attract and retain qualified individuals to serve on our board of directors or as our executive officers.
Certain stockholders could attempt to influence changes within the Company which could adversely affect the Company’s operations, financial condition and the value of our common stock.
Our stockholders may from time-to-time seek to acquire a controlling stake in our company, engage in proxy solicitations, advance shareholder proposals or otherwise attempt to effect changes. Campaigns by stockholders to effect changes at publicly traded companies are sometimes led by investors seeking to increase short-term stockholder value through actions such as financial restructuring, increased debt, special dividends, stock repurchases or sales of assets or the entire company. Responding to proxy contests and other actions by activist stockholders can be costly and time-consuming, disrupting our operations and diverting the attention of our Board of Directors and senior management from the pursuit of business strategies. These actions could adversely affect our operations, financial condition and the value of our common stock.
Anti-takeover provisions contained in our certificate of incorporation and bylaws, as well as provisions of Delaware law, could impair a takeover attempt.
Our certificate of incorporation, bylaws and Delaware law contain provisions that could have the effect of rendering more difficult or discouraging an acquisition deemed undesirable by our board of directors. Our corporate governance documents include provisions:
| • | authorizing blank check preferred stock, which could be issued with voting, liquidation, dividend and other rights superior to our common stock; |
| • | limiting the liability of, and providing indemnification to, our directors and officers; |
| • | limiting the ability of our stockholders to call and bring business before special meetings and to take action by written consent in lieu of a meeting; |
| • | requiring advance notice of stockholder proposals for business to be conducted at meetings of our stockholders and for nominations of candidates for election to our board of directors; |
| • | controlling the procedures for the conduct and scheduling of board of directors and stockholder meetings; |
| • | providing the board of directors with the express power to postpone previously scheduled annual meetings and to cancel previously scheduled special meetings; |
| • | limiting the determination of the number of directors on our board of directors and the filling of vacancies or newly created seats on the board to our board of directors then in office; and |
| • | providing that directors may be removed by stockholders only for cause. |
23
Table of Contents
These provisions, alone or together, could delay hostile takeovers and changes in control of our company or changes in our management.
As a Delaware corporation, we are also subject to provisions of Delaware law, including Section 203 of the Delaware General Corporation law, which prevents some stockholders holding more than 15% of our outstanding common stock from engaging in certain business combinations without approval of the holders of substantially all of our outstanding common stock. Any provision of our certificate of incorporation or bylaws or Delaware law that has the effect of delaying or deterring a change in control could limit the opportunity for our stockholders to receive a premium for their shares of our common stock, and could also affect the price that some investors are willing to pay for our common stock.
| ITEM 1B. UNRESOLVED | STAFF COMMENTS |
None.
| ITEM 2. PROPERTIES |
As of February 20, 2015, our principal facilities consist of approximately 101,821 square feet of office space at our U.S. headquarters located at 320 Summer Street, Boston, MA 02210 and approximately 37,725 square feet of space at our development facility located in Hungary. In December 2014, we entered into a lease for additional office space in Boston, MA which consists of approximately 117,801 square feet of office space located at 333 Summer Street, Boston, MA 02210. We also have leased additional office space in San Francisco, California, Wichita, Kansas and in Hungary, Ireland, Australia, the United Kingdom and India. We believe our facilities are sufficient to support our needs through 2015 and that additional space will be available in the future on commercially reasonable terms as needed.
We lease space in third-party facilities from which we operate our seven data centers, four of which are located in the United States, one of which is located in Europe, one of which is located in Asia and one of which is located in Australia.
| ITEM 3. LEGAL | PROCEEDINGS |
On September 8, 2010, 01 Communique Laboratory, Inc., or 01, filed a complaint that named us as a defendant in a lawsuit in the U.S. District Court for the Eastern District of Virginia (Civil Action No. 1:10cv1007) alleging that we infringed U.S. Patent No. 6,928,479, or the ‘479 Patent, which is owned by 01 and has claims directed to a particular application or system for providing a private communication portal from one computer to a second computer. The complaint sought damages in an unspecified amount and injunctive relief. On April 1, 2011, the U.S. District Court for the Eastern District of Virginia granted our motion for summary judgment of non-infringement. The court issued a written order regarding this decision on May 4, 2011. On May 13, 2011, 01 filed a notice of appeal appealing the court’s ruling granting summary judgment. On July 31, 2012, the U.S. Court of Appeals for the Federal Circuit vacated the lower court’s summary judgment of non-infringement ruling and remanded the case back to the U.S. District Court for the Eastern District of Virginia with revised claim construction. The trial commenced on March 18, 2013 and on March 26, 2013, a jury in the Eastern District of Virginia found that our products do not infringe the ‘479 Patent as previously asserted by 01. The court issued a written order regarding this decision on April 2, 2013. On June 26, 2013, 01 filed a notice of appeal seeking to appeal the jury’s non-infringement verdict. On June 9, 2014, the U.S. Court of Appeals for the Federal Circuit affirmed the jury’s non-infringement verdict. On November 21, 2014, the U.S. District Court for the Eastern District of Virginia issued its final order, awarding costs to us, which 01 paid on December 3, 2014, formally concluding this matter.
On August 26, 2014, Sensory Technologies, LLC, or Sensory, filed a complaint against us in the U.S. District Court for the Southern District of Indiana (Case No. 1:14-cv-1406). The complaint, which was served upon us on August 27, 2014, alleges, among other things, that we have infringed upon Sensory’s JOIN® trademark, which is registered to Sensory under U.S. Trademark Registration No. 3622883. The complaint seeks damages in an unspecified amount and injunctive relief. We believe we have meritorious defenses to the claims and intend to defend the lawsuit vigorously. Given the inherent unpredictability of litigation and the fact that this litigation is still in its early stages, we are unable to predict the outcome of this litigation or reasonably estimate a possible loss or range of loss associated with this litigation at this time.
24
Table of Contents
On August 28, 2014, a putative class action complaint was filed against us in the U.S. District Court for the Eastern District of California (Case No. 1:14-cv-01355) by an individual on behalf of himself and on behalf of all other similarly situated individuals, or collectively, the Plaintiffs. After we filed a motion to dismiss the complaint on January 30, 2015, the Plaintiffs filed an amended complaint on February 17, 2015. The amended complaint includes claims made under California’s False Advertising Act and Unfair Competition Law and relates to the marketing and sale of our Ignition for iOS application, or the App, and the Plaintiffs’ continued use of the App. The Plaintiffs’ complaint seeks restitution, damages in an unspecified amount, attorneys’ fees and costs, and unspecified equitable and injunctive relief. We believe we have meritorious defenses to the claims and intend to defend the lawsuit vigorously. Given the inherent unpredictability of litigation and the fact that this litigation is still in its early stages, we are unable to predict the outcome of this litigation or reasonably estimate a possible loss or range of loss associated with this litigation at this time.
We are from time to time subject to various legal proceedings and claims, either asserted or unasserted, which arise in the ordinary course of business. While the outcome of these other claims cannot be predicted with certainty, management does not believe that the outcome of any of these other legal matters will have a material adverse effect on our results of operations or financial condition.
| ITEM 4. MINE | SAFETY DISCLOSURES |
None.
25
Table of Contents
PART II
| ITEM 5. | MARKET FOR REGISTRANT’S COMMON EQUITY, RELATED STOCKHOLDER MATTERS AND ISSUER PURCHASES OF EQUITY SECURITIES |
Certain Information Regarding the Trading of Our Common Stock
Our common stock began trading under the symbol “LOGM” on the NASDAQ Global Select Market on July 1, 2009. Prior to that date, there was no established public trading market for our common stock. The following table sets forth, for the periods indicated, the high and low sale price per share of our common stock on the NASDAQ Global Select Market:
| High | Low | |||||||
| 2013 |
||||||||
| First Quarter |
$ | 24.51 | $ | 16.12 | ||||
| Second Quarter |
$ | 26.54 | $ | 16.74 | ||||
| Third Quarter |
$ | 32.29 | $ | 24.49 | ||||
| Fourth Quarter |
$ | 34.56 | $ | 29.25 | ||||
| 2014 |
||||||||
| First Quarter |
$ | 47.57 | $ | 31.08 | ||||
| Second Quarter |
$ | 47.69 | $ | 37.06 | ||||
| Third Quarter |
$ | 50.00 | $ | 39.06 | ||||
| Fourth Quarter |
$ | 53.38 | $ | 40.92 | ||||
Holders of Our Common Stock
As of February 13, 2015, there were 10 holders of record of shares of our common stock.
Dividends
We have never declared or paid dividends on our common stock. We currently intend to retain any future earnings to finance our research and development efforts, improvements to our existing services, the development of our proprietary technologies and the expansion of our business. We do not intend to declare or pay cash dividends on our capital stock in the foreseeable future. Any future determination to pay dividends will be at the discretion of our board of directors and will depend upon a number of factors, including our results of operations, financial condition, future prospects, contractual restrictions, restrictions imposed by applicable law and other factors our board of directors deems relevant.
Recent Sales of Unregistered Securities; Use of Proceeds from Registered Securities
(a) Recent Sales of Unregistered Securities
We did not sell any unregistered securities during the year ended December 31, 2014.
Securities Authorized for Issuance Under Equity Compensation Plans
Information regarding our equity compensation plans and the securities authorized for issuance thereunder is set forth herein under Part III, Item 12 below.
26
Table of Contents
Purchases of Equity Securities
| Period |
Total Number of Shares Purchased |
Average Price per Share |
Total Number of Shares Purchased as Part of Publicly Announced Plans or Programs(1) |
Maximum Number (or Approximate Dollar Value) of Shares that may yet be Purchased Under the Plans or Programs(1) |
||||||||||||
| October 1, 2014 — October 31, 2014 |
57,500 | $ | 44.58 | 57,500 | 82,323,944 | |||||||||||
| November 1, 2014 — November 30, 2014 |
67,901 | 49.99 | 67,901 | 78,929,805 | ||||||||||||
| December 1, 2014 — December 31, 2014 |
90,330 | 49.82 | 90,330 | 74,429,151 | ||||||||||||
|
|
|
|
|
|
|
|||||||||||
| Total |
215,731 | $ | 48.48 | 215,731 | ||||||||||||
|
|
|
|
|
|
|
|||||||||||
| (1) | Effective October 20, 2014, our board of directors approved a new $75 million share repurchase program, which is in addition to our existing $50 million share repurchase program which had been approved on August 13, 2013. Share repurchases are made from time-to-time in the open market, in privately negotiated transactions or otherwise, in accordance with applicable securities laws and regulations. During the year ended December 31, 2014, we repurchased 843,574 shares of our common stock. |
27
Table of Contents
Stock Performance Graph
The following graph compares the cumulative total return to stockholders for our common stock for the period from July 1, 2009, the effective date of our initial public offering, through December 31, 2014 against the NASDAQ Composite Index and the NASDAQ Computer and Data Processing Index.
The comparison assumes $100.00 was invested in our common stock, the NASDAQ Composite Index and the NASDAQ Computer and Data Processing Index and assumes reinvestment of dividends, if any. The graph assumes the initial value of our common stock on July 1, 2009 was the closing sale price on that day of $20.02 per share and not the initial offering price to the public of $16.00 per share. The stock performance on the graph below is not necessarily indicative of future price performance.
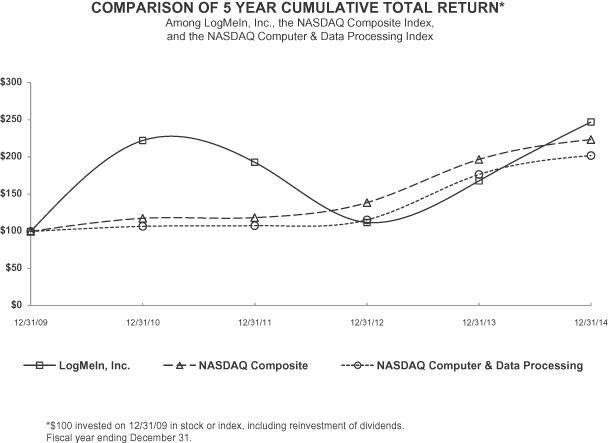
This performance graph shall not be deemed “filed” for purposes of Section 18 of the Securities Exchange Act of 1934, as amended, or the Exchange Act, or incorporated by reference into any filing under the Securities Act of 1933, as amended, or the Exchange Act, except as shall be expressly set forth by specific reference in such filing.
28
Table of Contents
| ITEM 6. | SELECTED FINANCIAL DATA |
You should read the following selected financial data together with our consolidated financial statements and the related notes appearing at the end of this Annual Report on Form 10-K and the “Management’s Discussion and Analysis of Financial Condition and Results of Operations” section of this Annual Report on Form 10-K. Our historical results for any prior period are not necessarily indicative of results to be expected in any future period.
| Years Ended December 31, | ||||||||||||||||||||
| 2010 | 2011 | 2012 | 2013 | 2014 | ||||||||||||||||
| (In thousands, except for per share data) | ||||||||||||||||||||
| Consolidated Statement of Operations Data: |
||||||||||||||||||||
| Revenue |
$ | 101,057 | $ | 119,461 | $ | 138,837 | $ | 166,258 | $ | 221,956 | ||||||||||
| Cost of revenue(1) |
9,124 | 10,574 | 14,504 | 18,816 | 28,732 | |||||||||||||||
|
|
|
|
|
|
|
|
|
|
|
|||||||||||
| Gross profit |
91,933 | 108,887 | 124,333 | 147,442 | 193,224 | |||||||||||||||
|
|
|
|
|
|
|
|
|
|
|
|||||||||||
| Operating expenses: |
||||||||||||||||||||
| Research and development(1) |
15,214 | 20,780 | 26,361 | 29,023 | 33,516 | |||||||||||||||
| Sales and marketing(1) |
45,869 | 57,156 | 70,058 | 88,794 | 119,508 | |||||||||||||||
| General and administrative(1) |
12,319 | 19,975 | 21,338 | 29,181 | 30,526 | |||||||||||||||
| Legal settlements |
— | 1,250 | — | 1,688 | — | |||||||||||||||
| Amortization of acquired intangibles(1) |
338 | 228 | 565 | 682 | 987 | |||||||||||||||
|
|
|
|
|
|
|
|
|
|
|
|||||||||||
| Total operating expenses |
73,740 | 99,389 | 118,322 | 149,368 | 184,537 | |||||||||||||||
|
|
|
|
|
|
|
|
|
|
|
|||||||||||
| Income (loss) from operations |
18,193 | 9,498 | 6,011 | (1,926 | ) | 8,687 | ||||||||||||||
| Interest income, net |
634 | 862 | 887 | 547 | 602 | |||||||||||||||
| Other (expense) income |
(219 | ) | (565 | ) | (641 | ) | (89 | ) | 105 | |||||||||||
|
|
|
|
|
|
|
|
|
|
|
|||||||||||
| Income (loss) before income taxes |
18,608 | 9,795 | 6,257 | (1,468 | ) | 9,394 | ||||||||||||||
| Benefit from (provision for) income taxes |
2,491 | (4,034 | ) | (2,691 | ) | (6,214 | ) | (1,439 | ) | |||||||||||
|
|
|
|
|
|
|
|
|
|
|
|||||||||||
| Net income (loss) |
$ | 21,099 | $ | 5,761 | $ | 3,566 | $ | (7,682 | ) | $ | 7,955 | |||||||||
|
|
|
|
|
|
|
|
|
|
|
|||||||||||
| Net income (loss) per share: |
||||||||||||||||||||
| Basic |
$ | 0.91 | $ | 0.24 | $ | 0.14 | $ | (0.32 | ) | $ | 0.33 | |||||||||
| Diluted |
$ | 0.85 | $ | 0.23 | $ | 0.14 | $ | (0.32 | ) | $ | 0.31 | |||||||||
| Weighted average shares outstanding: |
||||||||||||||||||||
| Basic |
23,244 | 24,176 | 24,711 | 24,351 | 24,385 | |||||||||||||||
| Diluted |
24,840 | 25,155 | 25,356 | 24,351 | 25,386 | |||||||||||||||
29
Table of Contents
| (1) | Includes stock-based compensation expense and intangible amortization expense as indicated in the following table: |
| Years Ended December 31, | ||||||||||||||||||||
| 2010 | 2011 | 2012 | 2013 | 2014 | ||||||||||||||||
| (In thousands) | ||||||||||||||||||||
| Cost of revenue: |
||||||||||||||||||||
| Stock-based compensation |
$ | 261 | $ | 316 | $ | 484 | $ | 706 | $ | 1,107 | ||||||||||
|
|
|
|
|
|
|
|
|
|
|
|||||||||||
| Intangible amortization |
251 | 566 | 1,552 | 1,820 | 3,959 | |||||||||||||||
|
|
|
|
|
|
|
|
|
|
|
|||||||||||
| Research and development: |
||||||||||||||||||||
| Stock-based compensation |
638 | 1,477 | 2,826 | 3,761 | 3,653 | |||||||||||||||
|
|
|
|
|
|
|
|
|
|
|
|||||||||||
| Sales and marketing: |
||||||||||||||||||||
| Stock-based compensation |
1,553 | 2,700 | 4,962 | 7,242 | 9,033 | |||||||||||||||
|
|
|
|
|
|
|
|
|
|
|
|||||||||||
| General and administrative: |
||||||||||||||||||||
| Stock-based compensation |
2,540 | 4,432 | 6,520 | 8,005 | 10,976 | |||||||||||||||
|
|
|
|
|
|
|
|
|
|
|
|||||||||||
| Amortization of acquired intangibles: |
||||||||||||||||||||
| Intangible amortization |
338 | 228 | 565 | 682 | 987 | |||||||||||||||
|
|
|
|
|
|
|
|
|
|
|
|||||||||||
| As of December 31, | ||||||||||||||||||||
| 2010 | 2011 | 2012 | 2013 | 2014 | ||||||||||||||||
| (In thousands) | ||||||||||||||||||||
| Consolidated Balance Sheet Data: |
||||||||||||||||||||
| Cash and cash equivalents and short-term marketable securities |
$ | 167,424 | $ | 198,644 | $ | 212,092 | $ | 189,556 | $ | 201,169 | ||||||||||
| Total assets |
186,677 | 232,057 | 279,538 | 279,613 | 317,849 | |||||||||||||||
| Deferred revenue, including long-term portion |
42,793 | 58,264 | 69,649 | 85,163 | 105,250 | |||||||||||||||
| Total liabilities |
56,299 | 76,251 | 94,901 | 112,274 | 144,005 | |||||||||||||||
| Total equity |
130,378 | 155,806 | 184,637 | 167,339 | 173,844 | |||||||||||||||
30
Table of Contents
| ITEM 7. | MANAGEMENT’S DISCUSSION AND ANALYSIS OF FINANCIAL CONDITION AND RESULTS OF OPERATIONS |
You should read the following discussion and analysis of our financial condition and results of operations together with our consolidated financial statements and the related notes and other financial information included elsewhere in this Annual Report on Form 10-K. Some of the information contained in this discussion and analysis or set forth elsewhere in this Annual Report on Form 10-K, including information with respect to our plans and strategy for our business and related financing, includes forward-looking statements that involve risks and uncertainties. You should review the “Risk Factors” section of this Annual Report on Form 10-K for a discussion of important factors that could cause actual results to differ materially from the results described in or implied by the forward-looking statements contained in the following discussion and analysis.
Overview
LogMeIn provides a portfolio of cloud-based service offerings which make it possible for people and businesses to simply and securely connect to their workplace, colleagues and customers. Our services free millions of people to work from virtually anywhere on any Internet enabled device, empower IT professionals to securely embrace today’s mobile and cloud-centric workplace, transform how companies engage and support their customers, and help businesses bring the next generation of connected products to market. These services range from free downloadable mobile and web-based collaboration apps to enterprise grade professional helpdesk solutions to a cloud-based platform for the Internet of Things, all of which are accessible from anywhere with an Internet connection.
We offer both free and fee based, or premium, services. Sales of our premium services are generated through word-of-mouth referrals, web-based advertising, online search, off-line advertising the conversion of free users and expiring free trials to paid subscriptions and direct marketing to new and existing customers.
We derive our revenue principally from subscription fees from SMBs, IT service providers, mobile carriers, customer service centers, original equipment manufacturers, or OEMs, and consumers and to a lesser extent, from the delivery of professional services primarily related to our Xively business. The majority of our customers subscribe to our services on an annual basis. Our revenue is driven primarily by the number and type of our premium services for which our paying customers subscribe. For the year ended December 31, 2014, we generated revenues of $222.0 million, compared to $166.3 million for the year ended December 31, 2013, an increase of approximately 34%.
Through December 31, 2014, we have primarily funded our operations through the sale of common stock in connection with our initial and secondary offerings which resulted in proceeds of $85.7 million, the sale of redeemable convertible preferred stock which resulted in proceeds of approximately $27.8 million and cash flows from operations. We earned net income of $3.6 million for 2012, incurred a net loss of $7.7 million for 2013, and earned net income of $8.0 million for 2014. We expect to continue making significant future expenditures to develop and expand our business.
Certain Trends and Uncertainties
The following represents a summary of certain trends and uncertainties, which could have a significant impact on our financial condition and results of operations. This summary is not intended to be a complete list of potential trends and uncertainties that could impact our business in the long or short term. The summary, however, should be considered along with the factors identified in the section titled “Risk Factors” of this Annual Report on Form 10-K.
| • | There is frequent litigation in the software and technology industries based on allegations of infringement or other violations of intellectual property rights. We have been, and may in the future be, subject to third party patent infringement or other intellectual property-related lawsuits as we face increasing competition and become increasingly visible. Any adverse determination related to intellectual property claims or litigation could adversely affect our business, financial condition and operating results. |
31
Table of Contents
| • | The risk of a data security breach or service disruption caused by computer hackers and cyber criminals has increased as the frequency, intensity and sophistication of attempted attacks and intrusions from around the world have increased. Our services and systems have been, and may in the future be, the target of various forms of cyber-attacks. While we make significant efforts to maintain the security and integrity of our services and computer systems, our cybersecurity measures and the cybersecurity measures taken by our third-party data center facilities may be unable to anticipate, detect or prevent all attempts to compromise our systems. Any security breach, whether successful or not, could harm our reputation, subject us to lawsuits and other potential liabilities and ultimately could result in the loss of customers. |
| • | We believe that competition will continue to increase. Increased competition could result from existing competitors or new competitors that enter the market because of the potential opportunity. We will continue to closely monitor competitive activity and respond accordingly. Increased competition could have an adverse effect on our financial condition and results of operations. |
| • | We believe that as we continue to grow revenue at expected rates, our cost of revenue and operating expenses, including sales and marketing, research and development and general and administrative expenses will increase in absolute dollar amounts. For a description of the general trends we anticipate in various expense categories, see “Cost of Revenue and Operating Expenses” below. |
Sources of Revenue
We derive our revenue primarily from subscription fees for our premium services from SMBs, IT service providers, mobile carriers, customer service centers, original equipment manufacturers, or OEMs, and consumers and to a lesser extent, from the delivery of professional services primarily related to our Xively business. The majority of our customers subscribe to our services on an annual basis and pay in advance, typically with a credit card, for their subscription. A smaller percentage of our customers subscribe to our services on a monthly basis through either month-to-month commitments or annual commitments that are then paid monthly with a credit card. We initially record a subscription fee as deferred revenue and then recognize it ratably, on a daily basis, over the life of the subscription period. Typically, a subscription automatically renews at the end of a subscription period unless the customer specifically terminates it prior to the end of the period. For the twelve months ended December 31, 2014, our gross annualized renewal rate was approximately 80%. We calculate our gross renewal rate on an annualized dollar basis across all product lines as of the end of each period. We expect our gross renewal rate to remain relatively consistent as we continue to invest in our products, customer support organization, and related retention programs.
Employees
We have increased our number of full-time employees to 804 at December 31, 2014 as compared to 613 at December 31, 2013.
Cost of Revenue and Operating Expenses
We allocate certain overhead expenses, such as rent and utilities, to expense categories based on the headcount in or office space occupied by personnel in that expense category as a percentage of our total headcount or office space. As a result, an overhead allocation associated with these costs is reflected in the cost of revenue and each operating expense category.
Cost of Revenue. Cost of revenue consists primarily of costs associated with our data center operations, customer support centers and our Xively professional services team. Included in these costs are wages and benefits for personnel, telecommunication, hosting fees, hardware and software maintenance costs and depreciation associated with our data centers, and contingent bonus expense related to the Ionia acquisition (see Note 4 to the Consolidated Financial Statements). Additionally, amortization expense associated with the acquired software, technology and documented know-how, as well as internally developed software is included in cost of revenue. The expenses related to hosting our services and supporting our free and premium customers are dependent on the number of customers who subscribe to our services and the complexity and redundancy of our services and hosting infrastructure. The expenses related to our professional services team are driven by our investment and
32
Table of Contents
efforts to support the growth of our Xively business. We expect cost of revenue expenses to increase in absolute dollars but remain relatively constant as a percentage of revenue as we continue to invest in our data center operations and customer support centers to support the growth of our customer base and as we expand our professional services team.
Research and Development. Research and development expenses consist primarily of wages and benefits for development personnel, rent expense primarily related to our offices in Hungary, consulting fees associated with outsourced development projects, travel-related costs for development personnel, and depreciation of assets used in development. Our research and development efforts are focused on both improving ease of use and functionality of our existing services, as well as developing new offerings. The majority of our research and development employees are located in our development centers in Europe. Therefore, a majority of research and development expense is subject to fluctuations in foreign exchange rates. We capitalized approximately $0.7 million, $1.2 million and $2.1 million for the years ended December 31, 2012, 2013 and 2014, respectively, of costs related to internally developed computer software to be sold as a service, which was incurred during the application development stage. The majority of research and development costs have been expensed as incurred. We expect that research and development expenses will increase in absolute dollars as we continue to enhance and expand our services but will remain relatively constant as a percentage of revenue.
Sales and Marketing. Sales and marketing expenses consist primarily of online search and advertising costs, wages, commissions and benefits for sales and marketing personnel, offline marketing costs such as media advertising and trade shows, consulting fees and credit card processing fees. Online search and advertising costs consist primarily of pay-per-click payments to search engines and other online advertising media such as banner ads. Offline marketing costs include radio and print advertisements as well as the costs to create and produce these advertisements, and tradeshows, including the costs of space at tradeshows and costs to design and construct tradeshow booths. Advertising costs are expensed as incurred. In order to continue to grow our business and awareness of our services, we expect that we will continue to invest in our sales and marketing efforts. We expect that sales and marketing expenses will increase in absolute dollars but remain relatively constant as a percentage of revenue.
General and Administrative. General and administrative expenses consist primarily of wages and benefits for management, human resources, internal IT support, legal, finance and accounting personnel, professional fees, insurance and other corporate expenses. We expect general and administrative expenses related to personnel, recruiting, internal information systems, audit, accounting and insurance costs will increase in absolute dollars but remain relatively constant as a percentage of revenue as we continue to support the growth of our business. We also expect to incur increased litigation-related expenses in connection with our defense against the legal claims described in Part I, Item 3 and Note 11 to the Consolidated Financial Statements.
Critical Accounting Policies
Our financial statements are prepared in accordance with accounting principles generally accepted in the United States of America. The preparation of our financial statements and related disclosures requires us to make estimates, assumptions and judgments that affect the reported amount of assets, liabilities, revenue, costs and expenses, and related disclosures. We base our estimates and assumptions on historical experience and other factors that we believe to be reasonable under the circumstances. We evaluate our estimates and assumptions on an ongoing basis. Our actual results may differ from these estimates under different assumptions and conditions. Our most critical accounting policies are summarized below. See Note 2 to the Consolidated Financial Statements included elsewhere in this Annual Report on Form 10-K for additional information about these critical accounting policies, as well as a description of our other significant accounting policies.
Revenue Recognition. We derive our revenue primarily from subscription fees related to our premium services and to a lesser extent, the delivery of professional services, primarily related to our Xively business.
Revenue from our premium subscription services is recognized on a daily basis over the subscription term as the services are delivered, provided that there is persuasive evidence of an arrangement, the fee is fixed or determinable and collectability is deemed reasonably assured. Subscription periods range from monthly to five years, but are generally one year in duration. Our software cannot be run on another entity’s hardware nor do customers have the right to take possession of the software and use it on their own or another entity’s hardware.
33
Table of Contents
We currently only offer free versions of our iPhone, iPad and Android software products. We had formerly sold these iPhone, iPad and Android software products as perpetually licensed software, the revenue from which was recognized when there was persuasive evidence of an arrangement, the product had been provided to the customer, the collection of the fee was probable, and the amount of the fees to be paid by the customer was fixed and determinable.
Our multi-element arrangements typically include subscription and professional services, which may include development services. We evaluate each element within the arrangement to determine if they can be accounted for as separate units of accounting. If the delivered item or items have value to the customer on a standalone basis, either because they are sold separately by any vendor or the customer could resell the delivered item or items on a standalone basis, we have determined that the deliverables within these arrangements qualify for treatment as separate units of accounting. Accordingly, we recognize revenue for each delivered item or items as a separate earnings process commencing when all of the significant performance obligations have been performed and when all the revenue recognition criteria have been met. In cases where we have determined that the delivered items within our multi-element arrangements do not have value to the customer on a stand-alone basis, the arrangement is accounted for as a single unit of accounting and the related consideration is recognized ratably over the estimated customer life, commencing when all of the significant performance obligations have been delivered and when all the revenue recognition criteria have been met.
Income Taxes. We are subject to federal, state, and foreign income taxes for jurisdictions in which we operate, and we use estimates in determining our provision for these income taxes and deferred tax assets. Deferred tax assets, related valuation allowances, current tax liabilities and deferred tax liabilities are determined separately by tax jurisdiction. In making these determinations, we estimate deferred tax assets, current tax liabilities and deferred tax liabilities, and we assess temporary differences resulting from differing treatment of items for tax and accounting purposes. At December 31, 2013 and 2014, our deferred tax assets consisted primarily of net operating losses and stock compensation expense. We assess the likelihood that deferred tax assets will be realized, and we recognize a valuation allowance if it is more likely than not that some portion of the deferred tax assets will not be recognized. This assessment requires judgment as to the likelihood and amounts of future taxable income by tax jurisdiction. During 2012, we reassessed the need for a valuation allowance against our deferred tax assets related to our Xively subsidiary and concluded that we would be able to realize the deferred tax assets as a result of future profitability. Accordingly, we reversed the valuation allowance related to our Xively subsidiary of approximately $677,000 during the year ended December 31, 2012. As of December 31, 2013 and 2014, we maintained a full valuation allowance against the deferred tax assets of our Hungarian subsidiary. This entity has historical losses and we concluded it was not more likely than not that these deferred tax assets are realizable.
We evaluate our uncertain tax positions based on a determination of whether and how much of a tax benefit we have taken in our tax filings or positions is more likely than not to be realized. Potential interest and penalties associated with any uncertain tax positions are recorded as a component of income tax expense. As of December 31, 2013 and 2014, we provided a liability of approximately $304,000 and $652,000, respectively for uncertain tax positions. Although we believe that our tax estimates are reasonable, the ultimate tax determination involves significant judgment that is subject to audit by tax authorities in the ordinary course of business.
Goodwill and acquired intangible assets. We record goodwill as the excess of the acquisition price over the fair value of the net tangible and identifiable intangible assets acquired. We do not amortize goodwill, but instead perform an annual impairment test of goodwill or whenever events and circumstances indicate that the carrying amount of goodwill may exceed its fair value. We operate as a single operating segment with one reporting unit and consequently evaluate goodwill for impairment based on an evaluation of the fair value of the Company as a whole. As of December 31, 2014, our fair value as a whole significantly exceeds our carrying value. We continuously monitor our intangible assets for indicators of impairment. If an indicator exists, we compare the undiscounted expected future cash flows from the intangible asset to its carrying value. If the carrying value exceeds the undiscounted, expected cash flows, we record an impairment based on the difference between the carrying value and determined fair value. Projected future cash flows are an estimate made by management which based on their nature include risks and uncertainties, primarily related to acceptance of
34
Table of Contents
products in the marketplace. To the extent that estimates of cash flows do not come to fruition, future impairments of intangible assets may be required. No material impairments have been recorded through December 31, 2014.
We record intangible assets at their respective estimated fair values at the date of acquisition. Intangible assets are amortized based upon the pattern in which their economic benefit will be realized, or if this pattern cannot be reliably determined, using the straight-line method over their estimated useful lives, which range from four months to eight years.
Stock-Based Compensation. We value all stock-based compensation, including grants of stock options and restricted stock units, at fair value on date of grant and expense the fair value over the applicable service period.
The assumptions used in determining the fair value of share-based awards represent management’s best estimates, but these estimates involve inherent uncertainties and the application of management’s judgment. As a result, if factors change, and we use different assumptions, our share-based compensation could be materially different in the future. The risk-free interest rate used for each grant is based on a U.S. Treasury instrument with a term similar to the expected term of the share-based award. The expected term of stock options has been estimated utilizing the vesting period of the option, the contractual life of the option and our option exercise history. We estimate the expected volatility of our common stock at the date of grant based on the historical volatility of comparable public companies over the option’s expected term as well as our own stock price volatility since our IPO.
Restricted stock units with time-based vesting conditions are valued on the grant date using the grant date closing price of our common stock. Restricted stock units with market-based vesting conditions are valued using a Monte Carlo simulation model. The number of shares expected to be earned, based on market conditions, is factored into the grant date Monte Carlo valuation for the awards. The grant date fair value is not subsequently adjusted regardless of the eventual number of shares that are earned based on the market condition.
We recognize compensation expense for only the portion of share-based awards that are expected to vest. Accordingly, we have estimated expected forfeitures of share-based awards based on our historical forfeiture rate and we use these rates to develop future forfeiture rates. If our actual forfeiture rate varies from our historical rates and estimates, additional adjustments to compensation expense may be required in future periods. Past fair value of share-based awards grants may not be a reliable indicator of future fair values as assumptions such as volatility may change over time.
Loss Contingencies. We have been involved in various legal claims and legal proceedings and may be subject to additional legal claims and proceedings in the future that arise in the ordinary course of business. We consider the likelihood of a loss or the incurrence of a liability, as well as our ability to reasonably estimate the amount of loss, in determining loss contingencies. An estimated loss contingency is accrued when we believe that it is both probable that a liability has been incurred and the amount of loss can be reasonably estimated. Significant judgment is required to determine both probability and the estimated amount. We regularly evaluate current information available and reflect the impact of negotiations, settlements, rulings, advice of legal counsel, and updated information to determine whether such accruals should be adjusted and whether new accruals are required and update our disclosures accordingly. Litigation is inherently unpredictable and is subject to significant uncertainties, some of which are beyond our control. Should any of these estimates and assumptions change or prove to have been incorrect, it could have a material adverse effect on our results of operations, financial position and cash flows. See Note 11 to the Consolidated Financial Statements for a further discussion of litigation and contingencies as well as “Legal Proceedings” in Part I, Item 3.
35
Table of Contents
Results of Consolidated Operations
The following table sets forth selected consolidated statements of operations data for each of the periods indicated as a percentage of total revenue.
| Years Ended December 31, | ||||||||||||
| 2012 | 2013 | 2014 | ||||||||||
| Operations Data: |
||||||||||||
| Revenue |
100 | % | 100 | % | 100 | % | ||||||
| Cost of revenue |
10 | 11 | 13 | |||||||||
|
|
|
|
|
|
|
|||||||
| Gross profit |
90 | 89 | 87 | |||||||||
|
|
|
|
|
|
|
|||||||
| Operating expenses: |
||||||||||||
| Research and development |
19 | 18 | 15 | |||||||||
| Sales and marketing |
51 | 53 | 54 | |||||||||
| General and administrative |
15 | 18 | 14 | |||||||||
| Legal settlements |
— | 1 | — | |||||||||
| Amortization of acquired intangibles |
— | — | — | |||||||||
|
|
|
|
|
|
|
|||||||
| Total operating expenses |
85 | 90 | 83 | |||||||||
|
|
|
|
|
|
|
|||||||
| Income (loss) from operations |
5 | (1 | ) | 4 | ||||||||
| Interest and other income (expense), net |
— | — | — | |||||||||
|
|
|
|
|
|
|
|||||||
| Income (loss) before income taxes |
5 | (1 | ) | 4 | ||||||||
| Provision for income taxes |
(2 | ) | (4 | ) | — | |||||||
|
|
|
|
|
|
|
|||||||
| Net income (loss) |
3 | % | (5 | )% | 4 | % | ||||||
|
|
|
|
|
|
|
|||||||
Years Ended December 31, 2013 and 2014
Revenue. Revenue increased $55.7 million, or 34%, from $166.3 million for the year ended December 31, 2013 to $222.0 million for the year ended December 31, 2014. The majority of the increase was attributable to an increase in revenue from new customers, as our total number of subscribers increased significantly during the period. The increase in revenue from new customers and in our total number of subscribers was attributable to continued increased sales of join.me pro, our premium collaboration service, and our strategic decision to discontinue offering LogMeIn Free, our free remote access service, to instead focus our marketing spend and efforts on our faster growing free services, specifically join.me. As a result of this change, we experienced significant growth in total sales and total subscribers as former LogMeIn Free users transitioned to either our premium remote access service, LogMeIn Pro, or our premium IT management product, LogMeIn Central. We believe that the majority of those LogMeIn Free users who would have converted to LogMeIn Pro or LogMeIn Central subscribers have already converted at this time.
Cost of Revenue. Cost of revenue increased $9.9 million from $18.8 million for the year ended December 31, 2013 to $28.7 million for the year ended December 31, 2014. As a percentage of revenue, cost of revenue was 11% and 13% for the years ended December 31, 2013 and 2014, respectively. The increase in absolute dollars was primarily due to a $2.5 million increase in contingent retention-based bonuses incurred in connection with the Ionia acquisition (see Note 4 to the Consolidated Financial Statements). The increase was also due to a $2.1 million increase in amortization expense related to a software asset purchased in November 2013, a $1.9 million increase in personnel-related costs, including salary, wages, bonus and benefits and tax, recruiting and relocation expense, as we retained professional services employees from the Ionia acquisition and increased the number of customer support employees to support our overall growth, a $1.9 million increase in hosting costs
36
Table of Contents
associated with managing our data centers and hosting our services as a result of an increase in both the number of customers using our services and the total number of devices that connected to our services, a $1.0 million increase in consulting fees, and a $0.1 million increase in hardware and software maintenance costs. Included in the increase in personnel-related costs is a $0.4 million increase in stock-based compensation expense.
Research and Development Expenses. Research and development expenses increased $4.5 million, or 15%, from $29.0 million for the year ended December 31, 2013 to $33.5 million for the year ended December 31, 2014. As a percentage of revenue, research and development expenses were 18% and 15% for the years ended December 31, 2013 and 2014, respectively. The increase in absolute dollars was primarily due to a $3.7 million increase in personnel-related costs including salary, wages, bonus, recruiting and relocation costs, and benefits and taxes, as we increased the number of research and development employees to support our overall growth and a $1.0 million increase in contingent bonus expense related to the Meldium acquisition (see Note 4 to the Consolidated Financial Statements). The increase was also due to a $0.6 million increase in travel-related costs, a $0.4 million increase in hardware and software maintenance costs, a $0.3 million increase in consulting fees, and a $0.2 million increase in rent expense. These amounts were offset by a $1.1 million decrease in contingent bonus expense related to the Xively and Bold acquisitions as the final contingent bonus payments were earned and paid in July 2013 and January 2014, respectively, and a $0.8 million increase in costs related to internally developed computer software to be sold as a service, which were incurred during the application development stage and therefore capitalized rather than expensed.
Sales and Marketing Expenses. Sales and marketing expenses increased $30.7 million, or 35%, from $88.8 million for the year ended December 31, 2013 to $119.5 million for the year ended December 31, 2014. As a percentage of revenue, sales and marketing expenses were 53% and 54% for the years ended December 31, 2013 and 2014. The increase in absolute dollars was primarily due to a $12.8 million increase in personnel-related and recruiting costs, including salary, wages, commissions, bonus, and benefits and taxes, from the hiring of additional employees to support our growth in sales and expand our marketing efforts and a $10.8 million increase in marketing program costs. Included in the increase in personnel-related and recruiting costs is a $1.8 million increase in stock-based compensation expense. The total increase in sales and marketing expense was also due to a $1.9 million increase in credit card transaction fees related to an increase in e-commerce sales, a $1.8 million increase in consulting fees, a $1.1 million increase in travel-related and department meeting costs, a $0.8 million increase in rent expense, a $0.4 million increase in hardware and software maintenance costs, and a $0.3 million increase in telecommunications expense.
General and Administrative Expenses. General and administrative expenses increased $1.3 million, or 5%, from $29.2 million for the year ended December 31, 2013 to $30.5 million for the year ended December 31, 2014. As a percentage of revenue, general and administrative expenses were 18% and 14% for the years ended December 31, 2013 and 2014, respectively. The increase in absolute dollars was primarily due to a $4.3 million increase in personnel-related and recruiting costs, including salary, wages, bonus, and benefits and taxes, as we increased the number of general and administrative employees to support our overall growth. Included in the increase in personnel-related and recruiting costs is a $3.0 million increase in stock-based compensation expense. The total increase in general and administrative expense was also due to a $0.7 million increase in legal fees, $0.4 million increase in audit and accounting fees, a $0.3 million increase in consulting fees, a $0.2 million increase in rent expense, a $0.1 million increase in hardware and software maintenance costs, a $0.1 million increase in depreciation expense, a $0.1 million increase in telecommunications expense, and a $0.1 million increase in travel related costs. These amounts were offset by a $5.3 million decrease in litigation related costs, which had been primarily related to our defense against the patent infringement claims made by 01 Communique.
Legal Settlement Expenses. Legal settlement expenses were $1.7 million for the year ended December 31 2013 and were primarily associated with the Pragmatus License Agreement in April 2013 (see Note 11 to the Consolidated Financial Statements). We did not incur legal settlement expenses for the year ended December 31, 2014.
Amortization of Acquired Intangibles. Amortization of acquired intangibles increased $0.3 million, or 45% from $0.7 million for the year ended December 31, 2013 to $1.0 million for the year ended December 31, 2014. The increase in amortization of acquired intangibles for the year ended December 31, 2014 is primarily related to the intangible assets acquired in the Ionia acquisition in March 2014.
37
Table of Contents
Interest and Other Income (Expense), Net. Interest and other income (expense), net was income of approximately $0.5 million and $0.6 million for the years ended December 31, 2013 and 2014, respectively. The increase was primarily related to an increase in foreign currency gains and an increase in interest income earned on marketable securities.
Income Taxes. We recorded a provision for federal, state and foreign income taxes of approximately $6.2 million for the year ended December 31, 2013, on a loss before income taxes of $1.5 million as a result of income generated in the United States offset by losses incurred in certain foreign jurisdictions where there is no corresponding benefit. For the year ended December 31, 2014, we recorded a tax provision for income taxes of approximately $1.4 million on profit before taxes of $9.4 million resulting in an effective tax rate of approximately 15%. Our effective tax rate is lower than the U.S. federal statutory rate of 35% primarily due to profits earned in certain foreign jurisdictions, primarily our Irish subsidiaries, which are subject to significantly lower tax rates than the U.S. federal statutory rate.
Net (Loss) Income. We recognized a net loss of $7.7 million for the year ended December 31, 2013 compared to net income of $8.0 million for the year ended December 31, 2014.
Years Ended December 31, 2012 and 2013
Revenue. Revenue increased $27.4 million, or 20%, from $138.8 million for the year ended December 31, 2012 to $166.3 million for the year ended December 31, 2013. The majority of the increase was due to an increase in revenue from new subscribers to our premium services, as our total number of subscribers increased from approximately 462,000 subscribers at December 31, 2012 to approximately 577,000 subscribers at December 31, 2013, and incremental add-on revenues from our existing customer base. This increase in new subscribers was driven in part by significant growth in new sales in join.me, our collaboration product and by a business model change that required users with LogMeIn Free installed on more than ten host computers to purchase a Central subscription.
Cost of Revenue. Cost of revenue increased $4.3 million, or 30%, from $14.5 million for the year ended December 31, 2012 to $18.8 million for year ended December 31, 2013. As a percentage of revenue, cost of revenue was 10% and 11% for the years ended December 31, 2012 and 2013, respectively. The increase in absolute dollars was primarily a result of an increase in both the number of customers using our premium services and the total number of devices that connected to our services, including devices owned by free users, which resulted in increased hosting and customer support costs. The costs associated with managing our data centers and the hosting of our services increased by $3.5 million in the year ended December 31, 2013 compared to the year ended December 31, 2012 due to the expansion of our data center capacity. The total increase in cost of revenue was also due to a $0.4 million increase in rent expense.
Research and Development Expenses. Research and development expenses increased $2.7 million, or 10%, from $26.4 million for the year ended December 31, 2012 to $29.0 million for the year ended December 31, 2013. As a percentage of revenue, research and development expenses were 19% and 18% for the years ended December 31, 2012 and 2013, respectively. The increase in absolute dollars was primarily due to a $2.4 million increase in personnel-related costs from the hiring of additional employees to improve the ease of use and functionality of our existing services and develop new service offerings. Included in the increase in personnel-related costs is a $3.9 million increase in salary, wages, bonus and benefits and tax expense and a $0.9 million increase in stock-based compensation. This was offset by a $1.8 million decrease in contingent bonus expense related to the Xively and Bold acquisitions and a $0.5 million increase in costs related to internally developed software to be sold as a service, which was incurred during the application development stage and therefore capitalized rather than expensed. The total increase in research and development expenses was also due to a $0.1 million increase in department meeting expenses and a $0.1 million increase in rent expense.
Sales and Marketing Expenses. Sales and marketing expenses increased $18.7 million, or 27%, from $70.1 million for the year ended December 31, 2012 to $88.8 million for the year ended December 31, 2013. As a percentage of revenue, sales and marketing expenses were 51% and 53% for the years ended December 31, 2012 and 2013. The increase in absolute dollars was primarily due to a $9.0 million increase in personnel-related costs, including salary, wages, commissions, bonus and benefits and tax expense, from the hiring of additional employees
38
Table of Contents
to support our growth in sales and expand our marketing efforts. Included in the increase in personnel-related costs is a $2.3 million increase in stock-based compensation. The total increase in sales and marketing expenses was also due to a $5.2 million increase in marketing program costs, a $1.7 million increase in rent expense, a $0.9 million increase in professional fees, a $0.7 million increase in credit card transaction fees, a $0.6 million increase in department meeting expenses and a $0.5 million increase in hardware and software maintenance costs.
General and Administrative Expenses. General and administrative expenses increased $7.8 million, or 37%, from $21.3 million for the year ended December 31, 2012 to $29.2 million for the year ended December 31, 2013. As a percentage of revenue, general and administrative expenses were 15% and 18% for the years ended December 31, 2012 and 2013, respectively. The increase in absolute dollars was primarily due to a $4.3 million increase in legal costs associated with our defense against the patent infringement claims made by 01 Communique. The increase was also a result of a $3.4 million increase in personnel-related costs, including salary, wages, bonus and benefits and tax expense, as we increased the number of general and administrative employees to support our overall growth. Included in the increase in personnel-related costs is a $1.5 million increase in stock-based compensation.
Legal Settlement Expenses. Legal settlement expenses for the year ended December 31, 2013 were $1.7 million compared to $0 million for the year ended December 31, 2012. Legal settlement expenses for the year ended December 31, 2013 were associated with patent litigation related expenses (see Note 11 to the Consolidated Financial Statements).
Amortization of Acquired Intangibles. Amortization of acquired intangibles increased $0.1 million, or 21% from $0.6 million for the year ended December 31, 2012 and $0.7 million for the year ended December 31, 2013. As a percentage of revenue, amortization of acquired intangibles were 0% for both the years ended December 31, 2012 and 2013. The amortization of acquired intangibles for the years ended December 31, 2012 and 2013 related primarily to intangible assets acquired as part of our January 2012 acquisition of Bold. The $0.1 million increase in amortization of acquired intangibles is primarily related to an increase in amortization of domain names.
Interest and Other Income, Net. Interest and other income, net was income of approximately $0.2 million and $0.5 million for the years ended December 31, 2012 and 2013, respectively. The increase in income was primarily related to a decrease in foreign currency losses offset by a decrease in interest income earned on marketable securities.
Income Taxes. We recorded a provision for federal, state and foreign income taxes of approximately $2.7 million and $6.2 million for the years ended December 31, 2012 and 2013, respectively. The increase in the tax provision recorded in the year ended December 31, 2013 is primarily the result of increased taxable income in the United States, while certain foreign jurisdictions incurred losses without a related tax benefit. Our effective tax rate for the year ended December 31, 2013 was impacted by these foreign losses and by permanent differences related to certain non-deductible stock-based compensation. In the future, we expect our effective tax rate to return to historical levels as our foreign losses decrease.
Net Income (Loss). For the year ended December 31, 2013, revenue increased $27.4 million while cost of revenue increased $4.3 million, operating expenses increased $31.0 million, interest and other income increased $0.2 million, and our tax provision increased $3.5 million, resulting in a $11.2 million decrease in net income.
The $27.4 million increase in revenue is primarily due to an increase in revenue from new customers and add-on revenues from our existing customer base.
The $4.3 million increase in cost of revenue is primarily due to a $3.5 million increase in costs to manage our data centers and the hosting of our services and a $0.4 million increase in rent expense.
The $31.0 million increase in operating expenses is primarily due to a $16.9 million increase in personnel-related costs, including salary, wages, commissions, bonus and benefits and tax expense. Included in the increase in personnel-related costs is a $4.7 million increase in stock-based compensation. The increase in operating expenses were also due to a $6.0 million increase in patent litigation related expenses, a $5.2 million increase in marketing programs, a $2.3 million increase in rent related costs, a $0.8 million increase in consulting fees, a $0.7 million increase in department meeting expenses, a $0.7 million increase in credit card transaction fees, a
39
Table of Contents
$0.4 million increase in hardware and software maintenance costs and a $0.3 million increase in depreciation expense. These were offset by a $1.9 million decrease in acquisition related costs and amortization and a $0.3 million decrease in legal fees.
The $3.6 million increase in our tax provision is primarily due to a provision for federal, state, and foreign income taxes of $2.7 million for the year ended December 31, 2012, compared to a provision of $6.2 million for the year ended December 31, 2013.
Liquidity and Capital Resources
The following table sets forth the major sources and uses of cash for each of the periods set forth below:
| Years Ended December 31, | ||||||||||||
| 2012 | 2013 | 2014 | ||||||||||
| (In thousands) | ||||||||||||
| Net cash provided by operations |
$ | 28,257 | $ | 30,020 | $ | 74,153 | ||||||
| Net cash used in investing activities |
(29,800 | ) | (24,368 | ) | (32,942 | ) | ||||||
| Net cash provided by (used in) financing activities |
9,228 | (28,648 | ) | (24,288 | ) | |||||||
| Effect of exchange rate changes |
643 | 321 | (5,220 | ) | ||||||||
|
|
|
|
|
|
|
|||||||
| Net increase (decrease) in cash |
$ | 8,328 | $ | (22,675 | ) | $ | 11,703 | |||||
|
|
|
|
|
|
|
|||||||
At December 31, 2014, our principal source of liquidity was cash and cash equivalents and short-term marketable securities totaling $201.2 million. As of December 31, 2014, $52.7 million of the $201.2 million of cash and cash equivalents and short-term marketable securities was held by our foreign subsidiaries. If the undistributed earnings of our foreign subsidiaries are needed for our operations in the United States, we would be required to accrue and pay U.S. taxes upon repatriation. Our current plans are not expected to require repatriation of cash and investments to fund our U.S. operations and, as a result, we intend to indefinitely reinvest our foreign earnings to fund our foreign subsidiaries.
Cash Flows From Operating Activities
Net cash provided by operating activities was $28.3 million, $30.0 million, and $74.2 million for the years ended December 31, 2012, 2013, and 2014, respectively.
Net cash inflows from operating activities during the year ended December 31, 2012 were mainly attributable to a $11.0 million increase in deferred revenue associated with the increase in subscription sales orders and customer growth. Net cash inflows from operating activities were also attributable to non-cash operating expenses, including $14.8 million for stock compensation, $6.1 million for depreciation and amortization, offset by a $6.6 million income tax benefit from the exercise of stock options and a $0.8 million benefit from deferred income taxes. The increase in net cash inflows from operating activities were also attributable to a $7.4 million increase in accounts payable and accrued expenses, offset by a $4.5 million increase in accounts receivable, a $1.1 million increase in prepaid expenses and other current assets and a $1.3 million increase in other assets.
Net cash inflows from operating activities during the year ended December 31, 2013 were mainly attributable to a $14.5 million increase in deferred revenue associated with upfront payments received from our customers for services. The net cash inflows from operating activities were also attributable to a $3.5 million increase in accrued expenses, offset by a $3.8 million increase in other assets, a $3.0 million increase in prepaid expenses and other current assets and a $2.2 million decrease in accounts payable. The increase in accrued expenses is primarily driven by a $1.9 million increase in accrued marketing programs and a $1.7 million increase in payroll and payroll related costs. The increase in other assets is primarily driven by a $1.9 million increase in prepaid tax and a $1.8 million increase in long-term prepaid rent for our Boston office. The increase in prepaid expense and other current assets is primarily related to a $3.0 million increase in prepaid taxes. Additionally, included in net cash inflows from operating activities are add-backs of non-cash expense items, including $19.7 million for stock compensation, $7.7 million for depreciation and amortization, and a $0.9 million provision for deferred income taxes resulting from differing treatment of items for tax and accounting purposes.
40
Table of Contents
Net cash inflows from operating activities during the year ended December 31, 2014 were mainly attributable to a $24.0 million increase in deferred revenue associated with upfront payments received from our customers for services. The net cash inflows from operating activities were also attributable to a $9.2 million increase in accrued expenses, our net income of $8.0 million, a $1.8 million decrease in prepaid expenses and other current assets, a $1.7 million increase in accounts payable, and a $1.6 million increase in other long-term liabilities. The net cash inflows from operating activities were offset by a $5.8 million increase in accounts receivable. The increase in accrued expenses is primarily driven by a $5.2 million increase in payroll and payroll related costs and a $3.0 million increase in accrued marketing programs. The decrease in prepaid expenses and other current assets is primarily driven by a $2.2 million decrease in prepaid tax. The decrease in prepaid expenses and other current assets is offset by a $1.0 million increase in prepaid software subscription fees. Additionally, included in net cash inflows from operating activities are add-backs of non-cash charges, including $24.8 million for stock compensation, $11.1 million for depreciation and amortization, and a $2.7 million benefit from deferred income taxes resulting from differing treatment of items for tax and accounting purposes.
Cash Flows From Investing Activities
Net cash used in investing activities was $29.8 million, $24.4 million, and $32.9 million for the years ended December 31, 2012, 2013, and 2014, respectively.
Net cash used in investing for the year ended December 31, 2012 was primarily related to the acquisition of Bold for $14.8 million, net of cash acquired, and the purchase of $135.1 million of marketable securities offset by proceeds of $130.0 million from redemption and maturity of marketable securities. Net cash used in investing activities also related to the addition of $5.3 million in property and equipment mainly related to the expansion and upgrade of our data center capacity, the expansion and upgrade of our internal IT infrastructure and the expansion of our offices. Restricted cash and deposits also increased $3.6 million as a result of the letter of credit associated with the lease of our new corporate headquarters in Boston. We also had $1.0 million in intangible asset additions related to internally developed software and the purchase of domain names and trademarks.
Net cash used in investing for the year ended December 31, 2013 was primarily related to an increase in intangible assets associated with the acquisition of a software asset for $11.5 million and the addition of $10.9 million in property and equipment mainly related to the expansion and upgrade of our data center capacity, the expansion and upgrade of our internal IT infrastructure and the expansion of our offices. Net cash used in investing activities also related to $1.6 million in intangible asset additions related to internally developed software and the purchase of domain names and trademarks and the purchase of $90.4 million of marketable securities offset by proceeds of $90.0 million from redemption and maturity of marketable securities.
Net cash used in investing for the year ended December 31, 2014 was primarily related to the acquisitions of Ionia in March 2014, Meldium in August 2014, and a San Francisco-based collaboration software provider in September 2014, which resulted in a $22.4 million increase in acquired intangible assets, and the purchase of $7.5 million in property and equipment mainly related to the expansion and upgrade of our data center capacity, the expansion and upgrade of our internal IT infrastructure, and the expansion of our offices. Net cash used in investing activities also related to $2.5 million in intangible asset additions, primarily for capitalized costs related to internally developed computer software to be sold as a service which were incurred during the application development stage.
Cash Flows From Financing Activities
Net cash provided by financing activities was $9.2 million for the year ended December 31, 2012. Net cash used by financing activities was $28.6 million and $24.3 million for the years ended December 31, 2013 and 2014, respectively.
Net cash provided by financing activities for the year ended December 31, 2012 was primarily related to a $6.6 million income tax benefit from the exercise of stock options as well as $2.7 million in proceeds from the issuance of common stock upon exercise of stock options. These were offset by a $0.1 million payment for contingent consideration.
41
Table of Contents
Net cash used in financing activities for the year ended December 31, 2013 was primarily related to $30.5 million for the purchase of treasury stock pursuant to our share repurchase program as well as $1.8 million for payroll taxes paid related to vesting of restricted stock units, and $0.1 million payment for contingent consideration, offset by $3.8 million in proceeds received from the issuance of common stock upon exercise of stock options.
Net cash used in financing activities for the year ended December 31, 2014 was primarily related to the purchase of $36.5 million of treasury stock pursuant to our share repurchase program as well as the payment of $5.8 million for payroll taxes related to vesting of restricted stock units, offset by $17.6 million in proceeds received from the issuance of common stock upon exercise of stock options.
While we believe that our current cash and cash equivalents will be sufficient to meet our working capital and capital expenditure requirements for at least the next twelve months, we may elect to raise additional capital through the sale of additional equity or debt securities or expand our credit facility to develop or enhance our services, to fund expansion, to respond to competitive pressures or to acquire complementary products, businesses or technologies. If we elect, additional financing may not be available in amounts or on terms that are favorable to us, if at all. If we raise additional funds through the issuance of equity or convertible debt securities, our existing stockholders could suffer significant dilution, and any new equity securities we issue could have rights, preferences and privileges superior to those of holders of our common stock.
During the last three years, inflation and changing prices have not had a material effect on our business and we do not expect that inflation or changing prices will materially affect our business in the foreseeable future.
Key Non-GAAP Financial Measures
Regulations S-K Item 10(e), “Use of Non-GAAP Financial Measures in Commission Filings,” defines and prescribes the condition for use of non-GAAP financial information. We have presented the following non-GAAP measures in accordance with this standard. We believe that these non-GAAP measures of financial results provide useful information to management and investors regarding certain financial and business trends relating to our financial condition and results of operations. Management uses these non-GAAP measures to compare our performance to that of prior periods and uses these measures in financial reports prepared for management and our board of directors. We believe that the use of these non-GAAP financial measures provides an additional tool for investors to use in evaluating ongoing operating results and trends and in comparing our financial measures with other software-as-a-service companies, many of which present similar non-GAAP financial measures to investors.
In addition to our consolidated financial statements prepared in accordance with GAAP, to date, we have considered the following non-GAAP financial measures to be key indicators of our financial performance:
| • | “Non-GAAP operating income,” which we define as GAAP operating income less acquisition related costs and amortization, stock-based compensation expense, and litigation related expenses; |
| • | “Adjusted EBITDA,” which we define as GAAP income, less interest income and other expense (net), provision for income taxes, depreciation and amortization expenses, acquisition related costs, stock-based compensation expense, and litigation related expenses; |
| • | “Non-GAAP provision for income taxes,” which we define as GAAP provision for income taxes less the tax impact from acquisition related costs and amortization, stock compensation expense, litigation related expenses, and tax benefits associated with the reversal of a valuation allowance; |
| • | “Non-GAAP net income,” which we define as GAAP net income (loss) before stock-based compensation expense, litigation related expense, and acquisition related costs and amortization, less the tax effect of the non-GAAP items; and |
| • | “Non-GAAP earnings per share,” which we define as non-GAAP net income divided by diluted average weighted shares outstanding. |
The expenses described below have been excluded from our GAAP results to arrive at our non-GAAP measures, as outlined above:
Acquisition related costs and amortization relate to costs associated with acquisitions of intellectual property and businesses and include legal costs, audit and accounting fees, contingent retention bonuses and the amortization of intangible assets.
42
Table of Contents
Acquisition related costs relate to costs associated with the acquisitions of intellectual property and businesses and include legal costs, audit and accounting fees and contingent retention bonuses.
Stock-based compensation expense relates to stock-based compensation awards granted to our executive officers, employees, and outside directors.
Litigation related expenses relate to costs associated with the defense and settlement of claims brought against us including intellectual property infringement claims and other material litigation (see Note 11 to the Consolidated Financial Statements).
Depreciation and amortization expenses relate to costs associated with the depreciation and amortization of fixed and intangible assets.
Interest income and other expense (income), net relates to the interest earned on outstanding cash balances during the period as well as foreign currency, realized and unrealized, gains and losses as a result of multi-currency settlements occurring during the period and period end translation adjustments.
Income tax expense relates to the total income tax levied based on GAAP income during the period.
Tax benefits related to the reversal of a valuation allowance relate to the reversal of a valuation allowance against certain foreign deferred tax assets (see Note 8 to the Consolidated Financial Statements).
We consider our non-GAAP financial measures and these certain financial and operating metrics important to understanding our historical results, improving our business, benchmarking our performance against peer companies, and identifying current and future trends impacting our business.
The exclusion of certain expenses in the calculation of non-GAAP financial measures should not be construed as an inference that these costs are unusual or infrequent. We anticipate excluding these expenses in future presentations of our non-GAAP financial measures. We believe that these non-GAAP measures of financial results provide useful information to management and investors regarding certain financial and business trends related to our financial condition and results of operations.
We do not consider these non-GAAP measures in isolation or as an alternative to financial measures determined in accordance with GAAP. The principal limitation of these non-GAAP financial measures is that they exclude significant elements that are required to be recorded in our financial statements pursuant to GAAP. In addition, they are subject to inherent limitations as they reflect the exercise of judgments by management in determining these non-GAAP financial measures. In order to compensate for these limitations, management presents our non-GAAP financial measures in connection with our GAAP results. We urge investors to review the reconciliation of our non-GAAP financial measures to the comparable GAAP financial measures, which we have included in this Form 10-K and in our press releases announcing our quarterly financial results, and not to rely on any single financial measure to evaluate our business.
Reconciliation tables of the most comparable GAAP financial measures to the non-GAAP measures are presented as follows (in thousands, except share and per share data):
| For the Year Ended December 31, | ||||||||||||
| Non-GAAP Income from operations |
2012 | 2013 | 2014 | |||||||||
| GAAP income (loss) from operations |
$ | 6,011 | $ | (1,926 | ) | $ | 8,687 | |||||
| Add Back: |
||||||||||||
| Stock-based compensation expense |
14,792 | 19,714 | 24,769 | |||||||||
| Litigation related expenses |
1,470 | 7,476 | 475 | |||||||||
| Acquisition related costs and amortization |
5,450 | 3,537 | 8,237 | |||||||||
|
|
|
|
|
|
|
|||||||
| Non-GAAP operating income |
$ | 27,723 | $ | 28,801 | $ | 42,168 | ||||||
|
|
|
|
|
|
|
|||||||
43
Table of Contents
| For the Year Ended December 31, | ||||||||||||
| Adjusted EBITDA |
2012 | 2013 | 2014 | |||||||||
| GAAP net income (loss) |
$ | 3,566 | $ | (7,682 | ) | $ | 7,955 | |||||
| Add Back: |
||||||||||||
| Stock-based compensation expense |
14,792 | 19,714 | 24,769 | |||||||||
| Litigation related expenses |
1,470 | 7,476 | 475 | |||||||||
| Acquisition related costs |
3,597 | 1,540 | 4,466 | |||||||||
| Interest income and other income, net |
(246 | ) | (458 | ) | (707 | ) | ||||||
| Income tax expense |
2,691 | 6,214 | 1,439 | |||||||||
| Depreciation and Amortization expense |
6,100 | 7,704 | 11,137 | |||||||||
|
|
|
|
|
|
|
|||||||
| Adjusted EBITDA |
$ | 31,970 | $ | 34,508 | $ | 49,534 | ||||||
|
|
|
|
|
|
|
|||||||
| For the Year Ended December 31, | ||||||||||||
| Non-GAAP Net Income |
2012 | 2013 | 2014 | |||||||||
| GAAP net income (loss) |
$ | 3,566 | $ | (7,682 | ) | $ | 7,955 | |||||
| Add Back: |
||||||||||||
| Stock-based compensation expense |
14,792 | 19,714 | 24,769 | |||||||||
| Litigation related expenses |
1,470 | 7,476 | 475 | |||||||||
| Acquisition related costs and amortization |
5,450 | 3,537 | 8,237 | |||||||||
| Less: |
||||||||||||
| Income tax effect of non-GAAP items |
(6,922 | ) | (9,194 | ) | (11,509 | ) | ||||||
|
|
|
|
|
|
|
|||||||
| Non-GAAP net income |
$ | 18,356 | $ | 13,851 | $ | 29,927 | ||||||
|
|
|
|
|
|
|
|||||||
| For the Year Ended December 31, | ||||||||||||
| Non-GAAP Earnings per share |
2012 | 2013 | 2014 | |||||||||
| GAAP diluted earnings (loss) per share |
$ | 0.14 | $ | (0.32 | ) | $ | 0.31 | |||||
| Add Back: |
||||||||||||
| Stock-based compensation expense |
0.58 | 0.79 | 0.98 | |||||||||
| Litigation related expenses |
0.06 | 0.30 | 0.02 | |||||||||
| Acquisition related costs and amortization |
0.21 | 0.14 | 0.32 | |||||||||
| Less: |
||||||||||||
| Income tax effect of non-GAAP items |
(0.27 | ) | (0.36 | ) | (0.45 | ) | ||||||
|
|
|
|
|
|
|
|||||||
| Non-GAAP earnings per share |
$ | 0.72 | $ | 0.55 | $ | 1.18 | ||||||
|
|
|
|
|
|
|
|||||||
| Shares used in computing diluted net income per share |
25,356,305 | 25,018,758 | 25,386,199 | |||||||||
|
|
|
|
|
|
|
|||||||
Off-Balance Sheet Arrangements
We do not engage in any off-balance sheet financing activities, nor do we have any interest in entities referred to as variable interest entities.
Contractual Obligations
The following table summarizes our contractual obligations at December 31, 2014 and the effect such obligations are expected to have on our liquidity and cash flow in future periods.
| Payments Due by Period (in thousands)(1) | ||||||||||||||||||||
| Total | Less Than 1 Year |
1-3 Years | 3-5 Years | More Than 5 Years |
||||||||||||||||
| Operating lease obligations |
$ | 99,921 | $ | 7,013 | $ | 19,366 | $ | 20,290 | $ | 53,252 | ||||||||||
| Hosting service agreements |
3,559 | 3,334 | 225 | — | — | |||||||||||||||
|
|
|
|
|
|
|
|
|
|
|
|||||||||||
| Total |
$ | 103,480 | $ | 10,347 | $ | 19,591 | $ | 20,290 | $ | 53,252 | ||||||||||
|
|
|
|
|
|
|
|
|
|
|
|||||||||||
| (1) | Excluded from the table above is $652,000 related to uncertain tax positions as we are uncertain as to when a cash settlement for these liabilities will occur. |
44
Table of Contents
The commitments under our operating leases shown above consist primarily of lease payments for our corporate headquarters located in Boston, Massachusetts (see Note 11 to the Consolidated Financial Statements), our research and development offices in Hungary, our international sales and marketing offices located in Australia, the United Kingdom, Ireland, and India, and contractual obligations related to our data centers.
In December 2014, we entered into a lease for new office space in Boston, Massachusetts. The landlord is obligated to rehabilitate the existing building and we expect that the lease term will begin in November 2015 and extend through April 2028. The aggregate amount of minimum lease payments to be made over the term of the lease is approximately $47.0 million. Pursuant to the terms of the lease, the landlord is responsible for making certain improvements to the leased space up to an agreed upon cost to the landlord. Any excess costs for these improvements will be billed by the landlord to us as additional rent. We estimate these excess costs to be approximately $7.0 million. The lease required a security deposit of approximately $3.3 million in the form of an irrevocable, unsecured standby letter of credit. The lease includes an option to extend the original term of the lease for two successive five year periods.
In December 2014, we entered into a lease for new office space in San Francisco, California. The term of the new office space begins in February 2015 and extends through December 2019. The aggregate amount of minimum lease payments to be made over the term of the lease is approximately $2.4 million. The lease required a security deposit of approximately $41,000. The security deposit is classified as a long-term deposit.
In October 2014, we entered into a lease for new office space in Dublin, Ireland. The term of the new office space began in October 2014 and extends through September 2024. The aggregate amount of minimum lease payments to be made over the term of the lease is approximately $5.8 million (EUR 4.8 million).
In April 2014, we amended our current lease for our Budapest, Hungary office space to provide for an expansion of leased space and to extend the term of the lease. The term of the amended lease began in July 2014 and will extend through June 2019. The aggregate amount of minimum lease payments to be made over the term of the lease is approximately $6.9 million (EUR 5.7 million). The amended lease agreement required a bank guarantee of approximately $430,000 (EUR 354,000). The bank guarantee is classified as restricted cash.
Recent Accounting Pronouncements
On May 28, 2014, the FASB issued ASU 2014-09, Revenue from Contracts with Customers (“ASU 2014-09”), its final standard on revenue from contracts with customers. ASU 2014-9 outlines a single comprehensive model for entities to use in accounting for revenue arising from contracts with customers and supersedes most current revenue recognition guidance, including industry-specific guidance. The core principle of the revenue model is that an entity recognizes revenue to depict the transfer of promised goods or services to customers in an amount that reflects the consideration to which the entity expects to be entitled to in exchange for those goods or services. In applying the revenue model to contracts within its scope, an entity identifies the contract(s) with a customer, identifies the performance obligations in the contract, determines the transaction price, allocates the transaction price to the performance obligations in the contract and recognizes revenue when (or as) the entity satisfies a performance obligation. ASU 2014-09 applies to all contracts with customers that are within the scope of other topics in the FASB Accounting Standards Codification. Certain of ASU 2014-09’s provisions also apply to transfers of nonfinancial assets, including in-substance nonfinancial assets that are not an output of an entity’s ordinary activities (i.e., property plant and equipment; real estate; or intangible assets). Existing accounting guidance applicable to these transfers has been amended or superseded. ASU 2014-09 also requires significantly expanded disclosures about revenue recognition. ASU 2014-09 is effective for us on January 1, 2017. We are currently assessing the potential impact of the adoption of ASU 2014-09 on our consolidated financial statements.
On June 19, 2014, the FASB issued ASU 2014-12, Stock Compensation (“ASU 2014-12”), providing guidance on accounting for share-based payment awards when the terms of an award provide that a performance target could be achieved after the requisite service period. The update clarifies that performance targets that can be achieved after the requisite service period of a share-based payment award be treated as performance conditions that affect vesting. These awards should be accounted for under Accounting Standards Codification Topic 718, Compensation — Stock Compensation, and existing guidance should be applied as it relates to awards with per-
45
Table of Contents
formance conditions that affect vesting. The update is effective for us for the interim and annual periods beginning after December 15, 2015. We are currently evaluating the impact of the adoption of this standard, if any, on our consolidated financial statements.
On August 27, 2014, the FASB issued ASU 2014-15, Presentation of Financial Statements — Going Concern: Disclosure of Uncertainties about an Entity’s Ability to Continue as a Going Concern (“ASU 2014-15”). The standard requires that we evaluate, at each interim and annual reporting period, whether there are conditions or events that raise substantial doubt about our ability to continue as a going concern within one year after the date the financial statements are issued, and provide related disclosures. ASU 2014-15 is effective for annual periods ending after December 15, 2016, and for annual and interim periods thereafter, and early adoption is permitted. We do not expect to early adopt ASU 2014-15, which will be effective for our fiscal year ending December 31, 2016. We do not believe the standard will have a material impact on our consolidated financial statements.
On January 9, 2015, the FASB issued ASU 2015-01, Simplifying Income Statement Presentation by Eliminating the Concept of Extraordinary Items (“ASU 2015-01”). The standard eliminates the requirement of Extraordinary Items to be separately classified on the income statement. ASU 2015-01 is effective for annual periods ending after December 15, 2015, and for annual and interim periods thereafter, and early adoption is permitted. We do not expect to early adopt ASU 2015-01, which will be effective for our fiscal year ending December 31, 2016. We do not believe the standard will have a material impact on our financial statements.
| Item 7A. | QUANTITATIVE AND QUALITATIVE DISCLOSURE ABOUT MARKET RISK. |
Foreign Currency Exchange Risk. Our results of operations and cash flows are subject to fluctuations due to changes in foreign currency exchange rates as a majority of our non-U.S. sales are recorded by our Irish subsidiary and as we incur significant operating expenses in our foreign subsidiaries including our Hungarian research and development facilities and our sales and marketing operations in Ireland, the United Kingdom, Australia and India. In the years ended December 31, 2014 and 2013, approximately 32% and 18%, respectively, of our revenues were generated by our Irish subsidiary. In the year ended December 31, 2014, approximately 13%, 7%, 6%, 3% and 1% of our operating expenses occurred in our operations in Hungary, Ireland, the United Kingdom, Australia and India, respectively, and less than 1% occurred in Brazil. In the year ended December 31, 2013, approximately 13%, 7%, 4% and 2% of our operating expenses occurred in our operations in Hungary, the United Kingdom, Ireland and Australia, respectively, and less than 1% each in Brazil, India, the Netherlands and Japan.
To date, changes in foreign currency exchange rates have not had a material impact on our operations, and a future change of 20% or less in foreign currency exchange rates would not materially affect our operations. At this time we do not, but may in the future, enter into any foreign currency hedging programs or instruments that would hedge or help offset such foreign currency exchange rate risk.
Interest Rate Sensitivity. Interest income is sensitive to changes in the general level of U.S. interest rates. However, based on the nature and current level of our cash and cash equivalents and short-term marketable securities, which primarily consist of cash, money market instruments, government securities, and corporate and agency bonds with maturities of two years or less, we believe there is no material risk of exposure to changes in the fair value of our cash and cash equivalents and marketable securities as a result of changes in interest rates.
46
Table of Contents
| ITEM 8. | FINANCIAL STATEMENTS AND SUPPLEMENTARY DATA |
Index to Consolidated Financial Statements
| Page(s) | ||||
| 48 | ||||
| Financial Statements: |
||||
| 49 | ||||
| 50 | ||||
| 51 | ||||
| 52 | ||||
| 53 | ||||
| 54 | ||||
47
Table of Contents
REPORT OF INDEPENDENT REGISTERED PUBLIC ACCOUNTING FIRM
To the Stockholders and Board of Directors of
LogMeIn, Inc.
Boston, Massachusetts
We have audited the accompanying consolidated balance sheets of LogMeIn, Inc. and subsidiaries (the “Company”) as of December 31, 2013 and 2014, and the related consolidated statements of operations, comprehensive income (loss), equity, and cash flows for each of the three years in the period ended December 31, 2014. These financial statements are the responsibility of the Company’s management. Our responsibility is to express an opinion on these financial statements based on our audits.
We conducted our audits in accordance with the standards of the Public Company Accounting Oversight Board (United States). Those standards require that we plan and perform the audit to obtain reasonable assurance about whether the financial statements are free of material misstatement. An audit includes examining, on a test basis, evidence supporting the amounts and disclosures in the financial statements. An audit also includes assessing the accounting principles used and significant estimates made by management, as well as evaluating the overall financial statement presentation. We believe that our audits provide a reasonable basis for our opinion.
In our opinion, such consolidated financial statements present fairly, in all material respects, the financial position of LogMeIn, Inc. and subsidiaries as of December 31, 2013 and 2014, and the results of their operations and their cash flows for each of the three years in the period ended December 31, 2014, in conformity with accounting principles generally accepted in the United States of America.
We have also audited, in accordance with the standards of the Public Company Accounting Oversight Board (United States), the Company’s internal control over financial reporting as of December 31, 2014, based on the criteria established in Internal Control — Integrated Framework (2013) issued by the Committee of Sponsoring Organizations of the Treadway Commission and our report dated February 20, 2015 expressed an unqualified opinion on the Company’s internal control over financial reporting.
/s/ Deloitte & Touche LLP
Boston, Massachusetts
February 20, 2015
48
Table of Contents
Consolidated Balance Sheets
(In thousands, except share and per share data)
| December 31, 2013 |
December 31, 2014 |
|||||||
| ASSETS | ||||||||
| Current assets: |
||||||||
| Cash and cash equivalents |
$ | 89,257 | $ | 100,960 | ||||
| Marketable securities |
100,299 | 100,209 | ||||||
| Accounts receivable (net of allowance for doubtful accounts of $269 and $301 as of December 31, 2013 and December 31, 2014, respectively) |
12,957 | 18,286 | ||||||
| Prepaid expenses and other current assets |
6,508 | 4,545 | ||||||
| Restricted cash, current portion |
23 | 1,492 | ||||||
| Deferred income tax assets |
3,053 | 5,403 | ||||||
|
|
|
|
|
|||||
| Total current assets |
212,097 | 230,895 | ||||||
| Property and equipment, net |
13,198 | 13,476 | ||||||
| Restricted cash, net of current portion |
3,902 | 2,531 | ||||||
| Intangibles, net |
16,886 | 18,983 | ||||||
| Goodwill |
18,712 | 37,928 | ||||||
| Other assets |
5,348 | 4,756 | ||||||
| Deferred income tax assets |
9,470 | 9,280 | ||||||
|
|
|
|
|
|||||
| Total assets |
$ | 279,613 | $ | 317,849 | ||||
|
|
|
|
|
|||||
| LIABILITIES AND EQUITY | ||||||||
| Current liabilities: |
||||||||
| Accounts payable |
$ | 6,390 | $ | 7,055 | ||||
| Accrued liabilities |
20,110 | 29,482 | ||||||
| Deferred revenue, current portion |
82,496 | 101,672 | ||||||
|
|
|
|
|
|||||
| Total current liabilities |
108,996 | 138,209 | ||||||
| Deferred revenue, net of current portion |
2,667 | 3,578 | ||||||
| Other long-term liabilities |
611 | 2,218 | ||||||
|
|
|
|
|
|||||
| Total liabilities |
112,274 | 144,005 | ||||||
|
|
|
|
|
|||||
| Commitments and contingencies (Note 11) |
||||||||
| Preferred stock, $0.01 par value — 5,000,000 shares authorized, 0 shares outstanding as of December 31, 2013 and December 31, 2014 |
— | — | ||||||
| Equity: |
||||||||
| Common stock, $0.01 par value — 75,000,000 shares authorized as of December 31, 2013 and December 31, 2014; 25,371,844 and 26,530,977 shares issued as of December 31, 2013 and December 31, 2014, respectively; 24,103,201 and 24,418,760 outstanding as of December 31, 2013 and December 31, 2014, respectively |
254 | 267 | ||||||
| Additional paid-in capital |
200,235 | 237,203 | ||||||
| (Accumulated deficit) retained earnings |
(1,439 | ) | 6,516 | |||||
| Accumulated other comprehensive loss |
(1,186 | ) | (3,117 | ) | ||||
| Treasury stock, at cost — 1,268,643 and 2,112,217 shares as of December 31, 2013 and December 31, 2014, respectively |
(30,525 | ) | (67,025 | ) | ||||
|
|
|
|
|
|||||
| Total equity |
167,339 | 173,844 | ||||||
|
|
|
|
|
|||||
| Total liabilities and equity |
$ | 279,613 | $ | 317,849 | ||||
|
|
|
|
|
|||||
See notes to consolidated financial statements.
49
Table of Contents
Consolidated Statements of Operations
(In thousands, except share and per share data)
| Years Ended December 31, | ||||||||||||
| 2012 | 2013 | 2014 | ||||||||||
| Revenue |
$ | 138,837 | $ | 166,258 | $ | 221,956 | ||||||
| Cost of revenue |
14,504 | 18,816 | 28,732 | |||||||||
|
|
|
|
|
|
|
|||||||
| Gross profit |
124,333 | 147,442 | 193,224 | |||||||||
|
|
|
|
|
|
|
|||||||
| Operating expenses |
||||||||||||
| Research and development |
26,361 | 29,023 | 33,516 | |||||||||
| Sales and marketing |
70,058 | 88,794 | 119,508 | |||||||||
| General and administrative |
21,338 | 29,181 | 30,526 | |||||||||
| Legal Settlements |
— | 1,688 | — | |||||||||
| Amortization of acquired intangibles |
565 | 682 | 987 | |||||||||
|
|
|
|
|
|
|
|||||||
| Total operating expenses |
118,322 | 149,368 | 184,537 | |||||||||
|
|
|
|
|
|
|
|||||||
| Income (loss) from operations |
6,011 | (1,926 | ) | 8,687 | ||||||||
| Interest income, net |
887 | 547 | 602 | |||||||||
| Other (expense) income |
(641 | ) | (89 | ) | 105 | |||||||
|
|
|
|
|
|
|
|||||||
| Income (loss) before income taxes |
6,257 | (1,468 | ) | 9,394 | ||||||||
| Provision for income taxes |
(2,691 | ) | (6,214 | ) | (1,439 | ) | ||||||
|
|
|
|
|
|
|
|||||||
| Net income (loss) |
$ | 3,566 | $ | (7,682 | ) | $ | 7,955 | |||||
|
|
|
|
|
|
|
|||||||
| Net income (loss) per share: |
||||||||||||
| Basic |
$ | 0.14 | $ | (0.32 | ) | $ | 0.33 | |||||
| Diluted |
$ | 0.14 | $ | (0.32 | ) | $ | 0.31 | |||||
| Weighted average shares outstanding: |
||||||||||||
| Basic |
24,711,242 | 24,350,913 | 24,385,297 | |||||||||
| Diluted |
25,356,305 | 24,350,913 | 25,386,199 | |||||||||
See notes to consolidated financial statements.
50
Table of Contents
Consolidated Statements of Comprehensive Income (Loss)
(In thousands)
| Years Ended December 31, | ||||||||||||
| 2012 | 2013 | 2014 | ||||||||||
| Net income (loss) |
$ | 3,566 | $ | (7,682 | ) | $ | 7,955 | |||||
|
|
|
|
|
|
|
|||||||
| Other comprehensive gain (loss): |
||||||||||||
| Net unrealized gains (losses) on marketable securities, net of tax |
57 | (25 | ) | (107 | ) | |||||||
| Net translation gains (losses) |
1,100 | (761 | ) | (1,824 | ) | |||||||
|
|
|
|
|
|
|
|||||||
| Total other comprehensive gain (loss) |
1,157 | (786 | ) | (1,931 | ) | |||||||
|
|
|
|
|
|
|
|||||||
| Comprehensive income (loss) |
$ | 4,723 | $ | (8,468 | ) | $ | 6,024 | |||||
|
|
|
|
|
|
|
|||||||
See notes to consolidated financial statements.
51
Table of Contents
Consolidated Statements of Equity
(In thousands, except share data)
| Common Stock | Additional Paid-In Capital |
Retained Earnings (Accumulated Deficit) |
Accumulated Other Comprehensive Loss |
Treasury Stock |
Total Equity |
|||||||||||||||||||||||
| Number of Shares |
Amount | |||||||||||||||||||||||||||
| Balance at January 1, 2012 |
24,551,641 | $ | 246 | $ | 154,440 | $ | 2,677 | $ | (1,557 | ) | $ | — | $ | 155,806 | ||||||||||||||
| Issuance of common stock upon exercise of stock options |
262,366 | 2 | 2,679 | — | — | — | 2,681 | |||||||||||||||||||||
| Income tax benefit from stock options exercises |
— | — | 6,635 | — | — | — | 6,635 | |||||||||||||||||||||
| Stock-based compensation |
— | — | 14,792 | — | — | — | 14,792 | |||||||||||||||||||||
| Net income |
— | — | — | 3,566 | — | — | 3,566 | |||||||||||||||||||||
| Unrealized gain on available-for-sale securities, net of tax |
— | — | — | — | 57 | — | 57 | |||||||||||||||||||||
| Cumulative translation adjustments |
— | — | — | — | 1,100 | — | 1,100 | |||||||||||||||||||||
|
|
|
|
|
|
|
|
|
|
|
|
|
|
|
|||||||||||||||
| Balance at December 31, 2012 |
24,814,007 | $ | 248 | $ | 178,546 | $ | 6,243 | $ | (400 | ) | $ | — | $ | 184,637 | ||||||||||||||
| Issuance of common stock upon exercise of stock options |
373,761 | 4 | 3,794 | — | — | — | 3,798 | |||||||||||||||||||||
| Net issuance of common stock upon vesting of restricted stock units |
184,076 | 2 | (1,836 | ) | — | — | — | (1,834 | ) | |||||||||||||||||||
| Income tax benefit from stock options exercises |
— | — | 17 | — | — | — | 17 | |||||||||||||||||||||
| Stock-based compensation |
— | — | 19,714 | — | — | — | 19,714 | |||||||||||||||||||||
| Treasury stock |
(1,268,643 | ) | — | — | — | — | (30,525 | ) | (30,525 | ) | ||||||||||||||||||
| Net loss |
— | — | — | (7,682 | ) | — | — | (7,682 | ) | |||||||||||||||||||
| Unrealized loss on available-for-sale securities, net of tax |
— | — | — | — | (25 | ) | — | (25 | ) | |||||||||||||||||||
| Cumulative translation adjustments |
— | — | — | — | (761 | ) | — | (761 | ) | |||||||||||||||||||
|
|
|
|
|
|
|
|
|
|
|
|
|
|
|
|||||||||||||||
| Balance at December 31, 2013 |
24,103,201 | $ | 254 | $ | 200,235 | $ | (1,439 | ) | $ | (1,186 | ) | $ | (30,525 | ) | $ | 167,339 | ||||||||||||
| Issuance of common stock upon exercise of stock options |
858,988 | 9 | 17,586 | — | — | — | 17,595 | |||||||||||||||||||||
| Net issuance of common stock upon vesting of restricted stock units |
300,145 | 4 | (5,770 | ) | — | — | — | (5,766 | ) | |||||||||||||||||||
| Income tax benefit from stock options exercises |
— | — | 383 | — | — | — | 383 | |||||||||||||||||||||
| Stock-based compensation |
— | — | 24,769 | — | — | — | 24,769 | |||||||||||||||||||||
| Treasury stock |
(843,574 | ) | — | — | — | — | (36,500 | ) | (36,500 | ) | ||||||||||||||||||
| Net income |
— | — | — | 7,955 | — | — | 7,955 | |||||||||||||||||||||
| Unrealized loss on available-for-sale securities, net of tax |
— | — | — | — | (107 | ) | — | (107 | ) | |||||||||||||||||||
| Cumulative translation adjustments |
— | — | — | — | (1,824 | ) | — | (1,824 | ) | |||||||||||||||||||
|
|
|
|
|
|
|
|
|
|
|
|
|
|
|
|||||||||||||||
| Balance at December 31, 2014 |
24,418,760 | $ | 267 | $ | 237,203 | $ | 6,516 | $ | (3,117 | ) | $ | (67,025 | ) | $ | 173,844 | |||||||||||||
|
|
|
|
|
|
|
|
|
|
|
|
|
|
|
|||||||||||||||
See notes to consolidated financial statements.
52
Table of Contents
Consolidated Statements of Cash Flows
(In thousands)
| Years Ended December 31, | ||||||||||||
| 2012 | 2013 | 2014 | ||||||||||
| Cash flows from operating activities |
||||||||||||
| Net income (loss) |
$ | 3,566 | $ | (7,682 | ) | $ | 7,955 | |||||
| Adjustments to reconcile net income (loss) to net cash provided by operating activities |
||||||||||||
| Depreciation and amortization |
6,100 | 7,704 | 11,137 | |||||||||
| Amortization of premium on investments |
54 | 198 | 224 | |||||||||
| Provision for bad debts |
100 | 116 | 102 | |||||||||
| Gain on sales of marketable securities |
— | — | (5 | ) | ||||||||
| (Benefit from) provision for deferred income taxes |
(831 | ) | 926 | (2,707 | ) | |||||||
| Income tax benefit from the exercise of stock options |
(6,635 | ) | (17 | ) | (383 | ) | ||||||
| Stock-based compensation |
14,792 | 19,714 | 24,769 | |||||||||
| Loss on disposal of equipment |
12 | — | 26 | |||||||||
| Changes in assets and liabilities: |
||||||||||||
| Accounts receivable |
(4,471 | ) | 302 | (5,804 | ) | |||||||
| Prepaid expenses and other current assets |
(1,070 | ) | (2,986 | ) | 1,822 | |||||||
| Other assets |
(1,308 | ) | (3,764 | ) | 476 | |||||||
| Accounts payable |
1,552 | (2,233 | ) | 1,727 | ||||||||
| Accrued liabilities |
5,854 | 3,457 | 9,234 | |||||||||
| Deferred revenue |
10,960 | 14,493 | 23,983 | |||||||||
| Other long-term liabilities |
(418 | ) | (208 | ) | 1,597 | |||||||
|
|
|
|
|
|
|
|||||||
| Net cash provided by operating activities |
28,257 | 30,020 | 74,153 | |||||||||
|
|
|
|
|
|
|
|||||||
| Cash flows from investing activities |
||||||||||||
| Purchases of marketable securities |
(135,085 | ) | (90,376 | ) | (95,342 | ) | ||||||
| Proceeds from maturities of marketable securities |
130,000 | 90,000 | 75,000 | |||||||||
| Proceeds from sale of marketable securities |
— | — | 20,045 | |||||||||
| Purchases of property and equipment |
(5,277 | ) | (10,938 | ) | (7,471 | ) | ||||||
| Intangible asset additions |
(1,049 | ) | (13,061 | ) | (2,529 | ) | ||||||
| Cash paid for acquisition, net of cash acquired |
(14,831 | ) | — | (22,449 | ) | |||||||
| (Increase) decrease in restricted cash and deposits |
(3,558 | ) | 7 | (196 | ) | |||||||
|
|
|
|
|
|
|
|||||||
| Net cash used in investing activities |
(29,800 | ) | (24,368 | ) | (32,942 | ) | ||||||
|
|
|
|
|
|
|
|||||||
| Cash flows from financing activities |
||||||||||||
| Proceeds from issuance of common stock upon option exercises |
2,682 | 3,798 | 17,595 | |||||||||
| Income tax benefit from the exercise of stock options |
6,634 | 17 | 383 | |||||||||
| Payment of contingent consideration |
(89 | ) | (104 | ) | — | |||||||
| Common stock withheld to satisfy income tax withholdings for restricted stock unit vesting |
— | (1,834 | ) | (5,766 | ) | |||||||
| Purchase of treasury stock |
— | (30,525 | ) | (36,500 | ) | |||||||
|
|
|
|
|
|
|
|||||||
| Net cash provided by (used in) financing activities |
9,227 | (28,648 | ) | (24,288 | ) | |||||||
|
|
|
|
|
|
|
|||||||
| Effect of exchange rate changes on cash and cash equivalents and restricted cash |
644 | 321 | (5,220 | ) | ||||||||
|
|
|
|
|
|
|
|||||||
| Net increase (decrease) in cash and cash equivalents |
8,328 | (22,675 | ) | 11,703 | ||||||||
| Cash and cash equivalents, beginning of period |
103,604 | 111,932 | 89,257 | |||||||||
|
|
|
|
|
|
|
|||||||
| Cash and cash equivalents, end of period |
$ | 111,932 | $ | 89,257 | $ | 100,960 | ||||||
|
|
|
|
|
|
|
|||||||
| Supplemental disclosure of cash flow information |
||||||||||||
| Cash paid for interest |
$ | — | $ | 2 | $ | 2 | ||||||
| Cash paid for income taxes |
$ | 1,802 | $ | 10,094 | $ | 1,489 | ||||||
| Noncash investing and financing activities |
||||||||||||
| Purchases of property and equipment included in accounts payable and accrued liabilities |
$ | 742 | $ | 1,510 | $ | 1,032 | ||||||
| Fair value of contingent consideration in connection with acquisition included in accrued liabilities and other long term liabilities |
$ | 161 | $ | — | $ | 249 | ||||||
| Deferred financing costs included in accounts payable and accrued liabilities |
$ | — | $ | — | $ | 13 | ||||||
See notes to consolidated financial statements.
53
Table of Contents
Notes to Consolidated Financial Statements
| 1. | Nature of the Business |
LogMeIn, Inc. (the “Company”) provides a portfolio of cloud-based service offerings which make it possible for people and businesses to simply and securely connect to their workplace, colleagues and customers. The Company’s product line includes AppGuru™, BoldChat® , Cubby™, join.me® , LogMeIn Pro® , LogMeIn ® Central™, LogMeIn Rescue®, LogMeIn® Rescue+Mobile™, LogMeIn Backup®, LogMeIn for iOS, LogMeIn Hamachi®, MeldiumTM, Xively™ and RemotelyAnywhere®. The Company is headquartered in Boston, Massachusetts with wholly-owned subsidiaries located in Hungary, The Netherlands, Australia, the United Kingdom, Brazil, Bermuda, Japan, Ireland, and India.
| 2. | Summary of Significant Accounting Policies |
Principles of Consolidation — The accompanying consolidated financial statements include the results of operations of the Company and its wholly-owned subsidiaries. All intercompany transactions and balances have been eliminated in consolidation. The Company has prepared the accompanying consolidated financial statements in conformity with accounting principles generally accepted in the United States of America (“GAAP”).
Use of Estimates — The preparation of consolidated financial statements in conformity with GAAP requires management to make estimates and assumptions that affect the reported amounts of assets and liabilities and disclosure of contingent assets and liabilities at the date of the financial statements and the reported amounts of revenue and expenses during the reporting period. By their nature, estimates are subject to an inherent degree of uncertainty. Actual results could differ from those estimates.
Cash Equivalents — Cash equivalents consist of highly liquid investments with an original or remaining maturity of less than three months at the date of purchase. Cash equivalents consist of investments in money market funds which primarily invest in U.S. Treasury obligations. Cash equivalents are stated at cost, which approximates fair value.
Marketable Securities — The Company’s marketable securities are classified as available-for-sale and are carried at fair value with the unrealized gains and losses, net of tax, reported as a component of accumulated other comprehensive loss in equity. Realized gains and losses and declines in value judged to be other than temporary are included as a component of earnings based on the specific identification method. Fair value is determined based on quoted market prices. At December 31, 2013 and 2014, marketable securities consisted of U.S. government agency securities and corporate bonds that have remaining maturities within two years and have an aggregate amortized cost of $100.3 million. The securities have an aggregate fair value of $100.3 million and $100.2 million, including $67,000 and $9,000 of unrealized gains and $28,000 and $138,000 of unrealized losses, at December 31, 2013 and 2014 respectively.
Restricted Cash — In May 2013, $125,000 of restricted cash associated with the Company’s Woburn, Massachusetts office lease was returned to the Company in connection with the expiration of the lease. In April 2012, the Company entered into a lease for a new corporate headquarters located in Boston, Massachusetts. The lease required a security deposit of approximately $3.3 million in the form of an irrevocable standby letter of credit which is collateralized by a bank deposit in the amount of approximately $3.5 million or 105 percent of the security deposit. Such amounts are classified as restricted cash in the accompanying consolidated balance sheets. In addition, the Company has made security deposits for various other leased facilities, which are also classified as restricted cash.
Accounts Receivable — The Company reviews accounts receivable on a periodic basis to determine if any receivables will potentially be uncollectible. Estimates are used to determine the amount of the allowance for doubtful accounts necessary to reduce accounts receivable to its estimated net realizable value. The estimates are based on an analysis of past due receivables, historical bad debt trends, current economic conditions, and customer specific information. After the Company has exhausted all collection efforts, the outstanding receivable balance relating to services provided is written off against the allowance and the balance related to services not yet delivered is charged as an offset to deferred revenue.
54
Table of Contents
Activity in the allowance for doubtful accounts was as follows (in thousands):
| December 31, | ||||||||||||
| 2012 | 2013 | 2014 | ||||||||||
| Balance, beginning |
$ | 109 | $ | 180 | $ | 269 | ||||||
| Provision for bad debt |
100 | 116 | 102 | |||||||||
| Uncollectible accounts written off |
29 | 27 | 70 | |||||||||
|
|
|
|
|
|
|
|||||||
| Balance, ending |
$ | 180 | $ | 269 | $ | 301 | ||||||
|
|
|
|
|
|
|
|||||||
Property and Equipment — Property and equipment are recorded at cost and depreciated using the straight-line method over the estimated useful lives of the related assets. Upon retirement or sale, the cost of the assets disposed of and the related accumulated depreciation are eliminated from the accounts, and any resulting gain or loss is reflected in the consolidated statements of operations. Expenditures for maintenance and repairs are charged to expense as incurred.
Estimated useful lives of assets are as follows:
| Computer equipment and software |
2 —3 years | |||
| Office equipment |
3 years | |||
| Furniture and fixtures |
5 years | |||
| Leasehold Improvements |
|
Shorter of lease term or estimated useful life |
|
Goodwill — Goodwill is the excess of the acquisition price over the fair value of the tangible and identifiable intangible net assets acquired. The Company does not amortize goodwill, but performs an impairment test of goodwill annually or whenever events and circumstances indicate that the carrying amount of goodwill may exceed its fair value. The Company operates as a single operating segment with one reporting unit and consequently evaluates goodwill for impairment based on an evaluation of the fair value of the Company as a whole. As of December 31, 2014, the fair value of the Company as a whole significantly exceeds the carrying amount of the Company. Through December 31, 2014, no impairments have occurred.
Long-Lived Assets and Intangible Assets — The Company records intangible assets at their respective estimated fair values at the date of acquisition. Intangible assets are being amortized based upon the pattern in which their economic benefit will be realized, or if this pattern cannot be reliably determined, using the straight-line method over their estimated useful lives, which range from four months to eight years.
The Company reviews long-lived assets for impairment whenever events or changes in circumstances indicate that the carrying amount of the assets, including intangible assets, may not be recoverable. When such events occur, the Company compares the carrying amounts of the assets to their undiscounted expected future cash flows. If this comparison indicates that there is impairment, the amount of the impairment is calculated as the difference between the carrying value and fair value. Through December 31, 2014, the Company recorded no material impairments.
Revenue Recognition — The Company derives revenue primarily from subscription fees related to its LogMeIn premium services and to a lesser extent, the delivery of professional services, primarily related to its Xively business.
Revenue from the Company’s LogMeIn premium services is recognized on a daily basis over the subscription term as the services are delivered, provided that there is persuasive evidence of an arrangement, the fee is fixed or determinable and collectability is deemed reasonably assured. Subscription periods range from monthly to five years, but are generally one year in duration. The Company’s software cannot be run on another entity’s hardware nor do customers have the right to take possession of the software and use it on their own or another entity’s hardware.
55
Table of Contents
The Company’s multi-element arrangements typically include subscription and professional services, which may include development services. The Company evaluates each element within the arrangement to determine if they can be accounted for as separate units of accounting. If the delivered item or items have value to the customer on a standalone basis, either because they are sold separately by any vendor or the customer could resell the delivered item or items on a standalone basis, the Company has determined that the deliverables within these arrangements qualify for treatment as separate units of accounting. Accordingly, the Company recognizes revenue for each delivered item or items as a separate earnings process commencing when all of the significant performance obligations have been performed and when all of the revenue recognition criteria have been met. Professional services revenue recognized as a separate earnings process under multi-element arrangements has been immaterial to date. In cases where the Company has determined that the delivered items within its multi-element arrangements do not have value to the customer on a stand-alone basis, the arrangement is accounted for as a single unit of accounting and the related consideration is recognized ratably over the estimated customer life, commencing when all of the significant performance obligations have been delivered and when all of the revenue recognition criteria have been met.
The Company currently only offers free versions of its iPhone, iPad and Android software products. The Company had formerly sold these iPhone, iPad and Android software products as perpetually licensed software, the revenue from which was recognized when there was persuasive evidence of an arrangement, the product had been provided to the customer, the collection of the fee was probable, and the amount of fees to be paid by the customer was fixed or determinable.
Revenues are reported net of applicable sales and use tax, value-added tax, and other transaction taxes imposed on the related transaction.
Deferred Revenue — Deferred revenue primarily consists of billings and payments received in advance of revenue recognition. The Company primarily bills and collects payments from customers for products and services in advance on a monthly and annual basis. Deferred revenue to be recognized in the next twelve months is included in current deferred revenue, and the remaining amounts are included in long-term deferred revenue in the consolidated balance sheets.
Concentrations of Credit Risk and Significant Customers — The Company’s principal credit risk relates to its cash, cash equivalents, marketable securities, restricted cash, and accounts receivable. Cash, cash equivalents, and restricted cash are deposited primarily with financial institutions that management believes to be of high-credit quality and custody of its marketable securities is with an accredited financial institution. To manage accounts receivable credit risk, the Company regularly evaluates the creditworthiness of its customers and maintains allowances for potential credit losses. To date, losses resulting from uncollected receivables have not exceeded management’s expectations.
As of December 31, 2013 no customers accounted for more than 10% of accounts receivable and there were no customers that represented 10% or more of revenue for the years ended December 31, 2012, 2013, or 2014. As of December 31, 2014, one customer accounted for 15% of accounts receivable.
Legal Costs — Legal expenditures are expensed as incurred.
Research and Development — Research and development expenditures are expensed as incurred.
Software Development Costs — The Company has determined that technological feasibility of its software products that are sold as a perpetual license is reached shortly before their introduction to the marketplace.
The Company capitalizes certain direct costs to develop functionality as well as certain upgrades and enhancements of its on-demand products that are probable to result in additional functionality. The costs incurred in the preliminary stages of development are expensed as incurred. Once an application has reached the development stage, internal and external costs, if direct and incremental, are capitalized as part of intangible assets until the software is substantially complete and ready for its intended use. Internally developed software costs that are capitalized are classified as intangible assets and amortized over a three year period.
56
Table of Contents
Foreign Currency Translation — The functional currency of operations outside the United States of America is deemed to be the currency of the local country, unless otherwise determined that the United States dollar would serve as a more appropriate functional currency given the economic operations of the entity. Accordingly, the assets and liabilities of the Company’s foreign subsidiaries are translated into United States dollars using the period-end exchange rate, and income and expense items are translated using the average exchange rate during the period. Cumulative translation adjustments are reflected as a separate component of equity. Foreign currency transaction gains and losses are charged to operations. The Company had foreign currency losses of approximately $641,000, and $89,000 for the years ended December 31, 2012 and 2013, and Foreign currency gains of approximately $105,000 for the year ended December 31 2014 included in other (expense) income in the consolidated statements of operations.
Stock-Based Compensation — The Company values all stock-based compensation, including grants of stock options and restricted stock units, at fair value on the date of grant and recognizes the expense over the requisite service period, which is generally the vesting period of the award, for those awards expected to vest, on a straight-line basis. The Company uses the with-or-without method to determine when it will realize excess tax benefits from stock based compensation. Under this method, the Company will realize these excess tax benefits only after it realizes the tax benefits of net operating losses from operations.
Income Taxes — Deferred income taxes are provided for the tax effects of temporary differences between the carrying amounts of assets and liabilities for financial reporting purposes and the amounts used for income tax purposes, and operating loss carry-forwards and credits using enacted tax rates expected to be in effect in the years in which the differences are expected to reverse. At each balance sheet date, the Company assesses the likelihood that deferred tax assets will be realized, and recognizes a valuation allowance if it is more likely than not that some portion of the deferred tax assets will not be realized. This assessment requires judgment as to the likelihood and amounts of future taxable income by tax jurisdiction.
The Company evaluates its uncertain tax positions based on a determination of whether and how much of a tax benefit taken by the Company in its tax filings is more likely than not to be realized. Potential interest and penalties associated with any uncertain tax positions are recorded as a component of income tax expense. As of December 31, 2014, the Company has provided a liability for approximately $652,000 for uncertain tax positions. These uncertain tax positions would impact the Company’s effective tax rate if recognized.
Advertising Costs — The Company expenses advertising costs as incurred. Advertising expense for the years ended December 31, 2012, 2013, and 2014 was approximately $23.8 million, $27.8 million, and $36.8 million respectively, which consisted primarily of online paid searches, banner advertising, and other online marketing and is included in sales and marketing expense in the accompanying consolidated statements of operations.
Comprehensive Income (Loss) — Comprehensive income (loss) is the change in stockholders’ equity during a period relating to transactions and other events and circumstances from non-owner sources and currently consists of net income, foreign currency translation adjustments, and unrealized gains and losses, net of tax on available-for-sale securities. Accumulated comprehensive loss was approximately $1.2 million at December 31, 2013 and consisted of $1.2 million related to foreign currency translation adjustments offset by $25,000 of unrealized losses, net of tax on available-for sale securities. Accumulated comprehensive income was approximately $3.1 million at December 31, 2014 and consisted of $3.0 million related to foreign currency translation adjustments in addition to $82,000 in unrealized losses, net of tax on available-for sale securities.
Fair Value of Financial Instruments — The carrying value of the Company’s financial instruments, including cash equivalents, restricted cash, accounts receivable, and accounts payable, approximate their fair values due to their short maturities.
Segment Data — Operating segments are identified as components of an enterprise about which separate discrete financial information is available for evaluation by the chief operating decision-maker, or decision making group, in making decisions regarding resource allocation and assessing performance. The Company, which uses consolidated financial information in determining how to allocate resources and assess performance, has determined that it operates in one segment.
57
Table of Contents
The Company’s revenue (based on customer address) and long-lived assets by geography are as follows (in thousands):
| Years Ended December 31, | ||||||||||||
| 2012 | 2013 | 2014 | ||||||||||
| Revenues: |
||||||||||||
| United States |
$ | 90,233 | $ | 109,444 | $ | 148,532 | ||||||
| United Kingdom |
12,846 | 15,058 | 19,452 | |||||||||
| International — all other |
35,758 | 41,756 | 53,972 | |||||||||
|
|
|
|
|
|
|
|||||||
| Total revenue |
$ | 138,837 | $ | 166,258 | $ | 221,956 | ||||||
|
|
|
|
|
|
|
|||||||
| Long-lived assets: |
||||||||||||
| United States |
$ | 4,129 | $ | 10,207 | $ | 9,731 | ||||||
| Hungary |
1,599 | 1,224 | 2,018 | |||||||||
| Ireland |
234 | 1,057 | 1,139 | |||||||||
| International — all other |
614 | 710 | 588 | |||||||||
|
|
|
|
|
|
|
|||||||
| Total long-lived assets |
$ | 6,576 | $ | 13,198 | $ | 13,476 | ||||||
|
|
|
|
|
|
|
|||||||
Net Income (Loss) Per Share — Basic net income (loss) per share is computed by dividing net income (loss) by the weighted average number of common shares outstanding for the period. Diluted net income (loss) per share is computed by dividing net income (loss) by the sum of the weighted average number of common shares outstanding during the period and the weighted average number of potential common shares outstanding from the assumed exercise of stock options and the vesting of restricted stock units. For the year ended December 31, 2013, the Company incurred a net loss and therefore, the effect of the Company’s outstanding common stock equivalents were not included in the calculation of diluted loss per share as they were anti-dilutive. Accordingly, basic and dilutive net loss per share for each period were identical.
The Company excluded the following options to purchase common shares and restricted stock units from the computation of diluted net income (loss) per share either because they had an anti-dilutive impact or because the Company had a net loss in the period (in thousands):
| Years Ended December 31, | ||||||||||||
| 2012 | 2013 | 2014 | ||||||||||
| Options to purchase common shares |
1,679 | 2,389 | 57 | |||||||||
| Restricted stock units |
147 | 1,192 | 18 | |||||||||
|
|
|
|
|
|
|
|||||||
| Total options and restricted stock units |
1,826 | 3,581 | 75 | |||||||||
|
|
|
|
|
|
|
|||||||
58
Table of Contents
Basic and diluted net income per share was calculated as follows (in thousands, except share and per share data):
| Year Ended December 31, 2012 |
||||
| Basic: |
||||
| Net income |
$ | 3,566 | ||
|
|
|
|||
| Weighted average common shares outstanding, basic |
24,711,242 | |||
|
|
|
|||
| Net income, basic |
$ | 0.14 | ||
|
|
|
|||
| Diluted: |
||||
| Net income |
$ | 3,566 | ||
|
|
|
|||
| Weighted average common shares outstanding |
24,711,242 | |||
| Add: Options to purchase common shares and restricted stock units |
645,063 | |||
|
|
|
|||
| Weighted average common shares outstanding, diluted |
25,356,305 | |||
|
|
|
|||
| Net income, diluted |
$ | 0.14 | ||
|
|
|
|||
| Year Ended December 31, 2013 |
||||
| Basic and Diluted Net Loss per Share: |
||||
| Net loss |
$ | (7,682 | ) | |
|
|
|
|||
| Weighted average common shares outstanding |
24,350,913 | |||
|
|
|
|||
| Basic and diluted net loss per share |
$ | (0.32 | ) | |
|
|
|
|||
| Year Ended December 31, 2014 |
||||
| Basic: |
||||
| Net income |
$ | 7,955 | ||
|
|
|
|||
| Weighted average common shares outstanding, basic |
24,385,297 | |||
|
|
|
|||
| Net income, basic |
$ | 0.33 | ||
|
|
|
|||
| Diluted: |
||||
| Net income |
$ | 7,955 | ||
|
|
|
|||
| Weighted average common shares outstanding |
24,385,297 | |||
| Add: Options to purchase common shares and restricted stock units |
1,000,902 | |||
|
|
|
|||
| Weighted average common shares outstanding, diluted |
25,386,199 | |||
|
|
|
|||
| Net income, diluted |
$ | 0.31 | ||
|
|
|
|||
Guarantees and Indemnification Obligations — As permitted under Delaware law, the Company has agreements whereby the Company indemnifies certain of its officers and directors for certain events or occurrences while the officer or director is, or was, serving at the Company’s request in such capacity. The term of the indemnification period is for the officer’s or director’s lifetime. As permitted under Delaware law, the Company also has similar indemnification obligations under its certificate of incorporation and by-laws. The maximum potential amount of future payments the Company could be required to make under these indemnification agreements is unlimited; however, the Company has director’s and officer’s insurance coverage that the Company believes limits its exposure and enables it to recover a portion of any future amounts paid.
59
Table of Contents
The Company has entered into agreements with certain customers that contractually obligate the Company to indemnify the customer from certain claims, including claims alleging that the Company’s products infringe third-party patents, copyrights, or trademarks. The term of these indemnification obligations is generally perpetual. The maximum potential amount of future payments the Company could be required to make under these indemnification obligations is unlimited. Through December 31, 2014, the Company has not experienced any losses related to these indemnification obligations.
In November 2012, the Company filed suit against Pragmatus Telecom LLC (“Pragmatus”), seeking declaratory judgment after certain of the Company’s customers received letters from Pragmatus claiming that their use of certain LogMeIn services infringed upon three patents allegedly owned by Pragmatus. On March 29, 2013, the Company and Pragmatus entered into a License Agreement, which granted the Company a fully-paid license covering the patents at issue. The Company paid Pragmatus a one-time licensing fee in April 2013, after a portion of the fee was reimbursed in March 2013 from a designated escrow arrangement associated with a prior acquisition. The Company recorded approximately $1.2 million of expense related to this matter in general and administrative expenses in March 2013. As a result, the Company’s declaratory judgment action against Pragmatus was dismissed by the court on May 3, 2013.
Recently Issued Accounting Pronouncements — On May 28, 2014, the FASB issued ASU 2014-09, Revenue from Contracts with Customers (“ASU 2014-09”), its final standard on revenue from contracts with customers. ASU 2014-9 outlines a single comprehensive model for entities to use in accounting for revenue arising from contracts with customers and supersedes most current revenue recognition guidance, including industry-specific guidance. The core principle of the revenue model is that an entity recognizes revenue to depict the transfer of promised goods or services to customers in an amount that reflects the consideration to which the entity expects to be entitled in exchange for those goods or services. In applying the revenue model to contracts within its scope, an entity identifies the contract(s) with a customer, identifies the performance obligations in the contract, determines the transaction price, allocates the transaction price to the performance obligations in the contract and recognizes revenue when (or as) the entity satisfies a performance obligation. ASU 2014-09 applies to all contracts with customers that are within the scope of other topics in the FASB Accounting Standards Codification. Certain of ASU 2014-09’s provisions also apply to transfers of nonfinancial assets, including in-substance nonfinancial assets that are not an output of an entity’s ordinary activities (i.e., property plant and equipment; real estate; or intangible assets). Existing accounting guidance applicable to these transfers has been amended or superseded. ASU 2014-09 also requires significantly expanded disclosures about revenue recognition. ASU 2014-09 is effective for the Company on January 1, 2017. The Company is currently assessing the potential impact of the adoption of ASU 2014-09 on its consolidated financial statements.
On June 19, 2014, the FASB issued ASU 2014-12, Stock Compensation (“ASU 2014-12”), providing guidance on accounting for share-based payment awards when the terms of an award provide that a performance target could be achieved after the requisite service period. The update clarifies that performance targets that can be achieved after the requisite service period of a share-based payment award be treated as performance conditions that affect vesting. These awards should be accounted for under Accounting Standards Codification Topic 718, Compensation — Stock Compensation, and existing guidance should be applied as it relates to awards with performance conditions that affect vesting. The update is effective for the Company for the interim and annual periods beginning after December 15, 2015. The Company is currently evaluating the impact of the adoption of this standard, if any, on its consolidated financial statements.
On August 27, 2014, the FASB issued ASU 2014-15, Presentation of Financial Statements — Going Concern: Disclosure of Uncertainties about an Entity’s Ability to Continue as a Going Concern (“ASU 2014-15”). The standard requires that the Company evaluates, at each interim and annual reporting period, whether there are conditions or events that raise substantial doubt about its ability to continue as a going concern within one year after the date the financial statements are issued, and provide related disclosures. ASU 2014-15 is effective for annual periods ending after December 15, 2016, and for annual and interim periods thereafter, and early adoption is permitted. The Company does not expect to early adopt ASU 2014-15, which will be effective for its fiscal year ending December 31, 2016. The Company does not believe the standard will have a material impact on its financial statements.
On January 9, 2015, the FASB issued ASU 2015-01, Simplifying Income Statement Presentation by Eliminating the Concept of Extraordinary Items (“ASU 2015-01”). The standard eliminates the requirement of Extra-
60
Table of Contents
ordinary Items to be separately classified on the income statement. ASU 2015-01 is effective for annual periods ending after December 15, 2015, and for annual and interim periods thereafter, and early adoption is permitted. The Company does not expect to early adopt ASU 2015-01, which will be effective for its fiscal year ending December 31, 2016. The Company does not believe the standard will have a material impact on its consolidated financial statements.
| 3. | Fair Value of Financial Instruments |
The carrying value of the Company’s financial instruments, including cash equivalents, restricted cash, accounts receivable, and accounts payable, approximate their fair values due to their short maturities. The Company’s financial assets and liabilities are measured using inputs from the three levels of the fair value hierarchy. A financial asset or liability’s classification within the hierarchy is determined based on the lowest level input that is significant to the fair value measurement. The three levels are as follows:
Level 1: Unadjusted quoted prices for identical assets or liabilities in active markets accessible by the Company at the measurement date.
Level 2: Inputs include quoted prices for similar assets and liabilities in active markets, quoted prices for identical or similar assets and liabilities in markets that are not active, inputs other than quoted prices that are observable for the asset or liability, and inputs that are derived principally from or corroborated by observable market data by correlation or other means.
Level 3: Unobservable inputs that are supported by little or no market activity and that are significant to the fair value of the assets or liabilities.
The following table summarizes the basis used to measure certain of the Company’s financial assets that are carried at fair value (in thousands):
| Fair Value Measurements at December 31, 2013 Using | ||||||||||||||||
| Level 1 | Level 2 | Level 3 | Total | |||||||||||||
| Financial Assets: |
||||||||||||||||
| Cash equivalents — money market funds |
$ | 28,210 | $ | — | $ | — | $ | 28,210 | ||||||||
| Cash equivalents — bank deposits |
— | 5,001 | — | 5,001 | ||||||||||||
| Short-term marketable securities — U.S. government agency securities |
75,288 | 25,011 | — | 100,299 | ||||||||||||
|
|
|
|
|
|
|
|
|
|||||||||
| Total |
$ | 103,498 | $ | 30,012 | $ | — | $ | 133,510 | ||||||||
|
|
|
|
|
|
|
|
|
|||||||||
| Fair Value Measurements at December 31, 2014 Using | ||||||||||||||||
| Level 1 | Level 2 | Level 3 | Total | |||||||||||||
| Financial Assets: |
||||||||||||||||
| Cash equivalents — money market funds |
$ | 13,139 | $ | — | $ | — | $ | 13,139 | ||||||||
| Cash equivalents — bank deposits |
— | 5,003 | — | 5,003 | ||||||||||||
| Short-term marketable securities — U.S. government agency securities |
59,903 | 19,950 | — | 79,853 | ||||||||||||
| Corporate bond securities |
— | 20,356 | — | 20,356 | ||||||||||||
| Contingent consideration liability |
— | — | 249 | 249 | ||||||||||||
|
|
|
|
|
|
|
|
|
|||||||||
| Total |
$ | 73,042 | $ | 45,309 | $ | 249 | $ | 118,600 | ||||||||
|
|
|
|
|
|
|
|
|
|||||||||
Bank deposits, corporate bonds and certain U.S. government agency securities are classified within the second level of the fair value hierarchy as the fair value of those assets are determined based upon quoted prices for similar assets.
The Level 3 liability consists of contingent consideration related to the August 27, 2014 acquisition of Meldium and the September 5, 2014 acquisition of a San Francisco-based collaboration software provider. The fair value of the contingent consideration was estimated by applying a probability based model, which utilizes sig-
61
Table of Contents
nificant inputs that are unobservable in the market. Key assumptions include a 12% discount rate and an assumption that the earn-out will be achieved. The current portion of contingent consideration is included in Accrued liabilities and the non-current portion is included in Other long-term liabilities. A reconciliation of the beginning and ending Level 3 liability is as follows (in thousands):
| Years Ended December 31, |
||||||||
| 2013 | 2014 | |||||||
| Balance beginning of period |
$ | 161 | $ | — | ||||
| Additions to Level 3 |
— | 239 | ||||||
| Payments |
(178 | ) | — | |||||
| Change in fair value of contingent consideration liability |
17 | 10 | ||||||
|
|
|
|
|
|||||
| Balance end of period |
$ | — | $ | 249 | ||||
|
|
|
|
|
|||||
| 4. | Acquisitions |
On March 7, 2014, the Company acquired all of the outstanding capital stock of Ionia Corporation, or Ionia, a Boston, Massachusetts based systems integrator, for a cash purchase price of $7.5 million plus contingent retention-based bonuses totaling up to $4.0 million, which are expected to be paid over a two-year period from the date of acquisition. The operating results, which are comprised of approximately $2.1 million of revenue, as well as $5.4 million of expenses for the year ended December 31, 2014, are included in the condensed consolidated financial statements beginning on the acquisition date.
The acquisition has been accounted for as a business combination. The assets acquired and the liabilities assumed were recorded at their estimated fair values as of the acquisition date. The Company retained an independent third party valuation firm to assist in the determination of the fair value of the intangible assets with estimates and assumptions provided by Company management. The excess of the purchase price over the tangible net assets and identifiable intangible assets was recorded as goodwill.
The purchase price was allocated as follows (in thousands):
| Amount | ||||
| Cash |
$ | 67 | ||
| Current assets |
296 | |||
| Other assets |
26 | |||
| Deferred revenue |
(70 | ) | ||
| Other liabilities |
(864 | ) | ||
| Customer backlog |
120 | |||
| Trade name and trademark |
10 | |||
| Customer relationships |
1,340 | |||
| Documented know-how |
280 | |||
| Goodwill |
6,295 | |||
|
|
|
|||
| Total purchase price |
$ | 7,500 | ||
|
|
|
|||
The pro forma results of operations for the years ended December 31, 2013 and 2014, assuming the Company had acquired Ionia on January 1, 2013, do not differ materially from those reported in the Company’s consolidated statement of operations for those years.
The stock purchase agreement included a contingent, retention-based bonus program provision requiring the Company to make additional payments to employees, including former Ionia stockholders now employed by the Company, on the first and second anniversaries of the acquisition, contingent upon their continued employment and achievement of certain bookings goals. The range of the contingent, retention-based bonus payments that the
62
Table of Contents
Company could pay is between $0 to $4.0 million. The Company has concluded that the arrangement is a compensation arrangement and is accruing the maximum payout ratably over the performance period, as it believes it is probable that the criteria will be met. The Company expects to pay $2.0 million in March 2015 and the remainder in March 2016.
The goodwill recorded in connection with this transaction is primarily related to the expected synergies to be achieved related to the Company’s ability to leverage its Xively platform, customer base, sales force and Internet of Things business plan with Ionia’s technical expertise and customer base. All goodwill and intangible assets acquired are not deductible for income tax purposes.
The Company recorded a long-term deferred tax liability of approximately $700,000 related to the amortization of intangible assets which cannot be deducted for tax purposes and is included in the accompanying table above as Other liabilities.
On August 27, 2014, the Company acquired BBA, Inc., d/b/a Meldium, a San Francisco, California-based provider of single sign-on password management software, through a merger transaction for a cash purchase price of $10.6 million plus contingent bonuses totaling up to $4.6 million, which are expected to be paid over a two-year period from the date of acquisition. Meldium’s operating results, which are comprised of approximately $1.8 million of expenses during the year ended December 31, 2014, are included in the condensed consolidated financial statements beginning on the acquisition date.
The acquisition has been accounted for as a business combination. The assets acquired and the liabilities assumed were recorded at their estimated fair values as of the acquisition date. The Company retained an independent third party valuation firm to assist in the determination of the fair value of the intangible assets with estimates and assumptions provided by Company management. The excess of the purchase price over the tangible net assets and identifiable intangible assets was recorded as goodwill.
The following table summarizes the fair value (in thousands) of the assets acquired and liabilities assumed at the date of acquisition:
| Amount | ||||
| Cash |
$ | 120 | ||
| Current assets |
90 | |||
| Other assets |
436 | |||
| Deferred revenue |
(5 | ) | ||
| Other liabilities |
(935 | ) | ||
| Completed technology |
1,580 | |||
| Trade name and trademark |
30 | |||
| Customer relationships |
100 | |||
| Goodwill |
9,437 | |||
|
|
|
|||
| Total purchase price |
10,853 | |||
|
|
|
|||
| Liability for contingent consideration |
(216 | ) | ||
|
|
|
|||
| Cash paid |
$ | 10,637 | ||
|
|
|
|||
The Company’s pro forma results of operations for the year ended December 31, 2013 and 2014, assuming the Company had acquired Meldium on January 1, 2013, do not differ materially from those reported in the Company’s consolidated statement of operations for those years.
The merger agreement included a contingent, retention-based bonus program requiring the Company to make additional payments to employees, including former Meldium stockholders now employed by the Com-
63
Table of Contents
pany, in the first quarter of 2015 and on the first and second anniversaries of the date of acquisition, contingent upon their continued employment and achievement of certain product integration goals. The range of the contingent, retention-based bonus payments that the Company could pay is between $0 to $4.3 million. The Company has concluded that the arrangement is a compensation arrangement and is accruing the maximum payout ratably over the performance period, as it believes it is probable that the criteria will be met. The contingent bonus program also includes payments to non-employee stockholders for an amount between $0 and $226,000, which the Company has concluded is contingent consideration and is part of the purchase price. This contingent liability was recorded at its fair value of $216,000 at the acquisition date. The Company continues to re-measure the fair value of the contingent consideration at each subsequent reporting period and recognizes any adjustments to fair value as part of earnings. The Company paid approximately $1.0 million of contingent payments in February 2015.
The goodwill recorded in connection with this transaction is primarily related to the expected synergies to be achieved related to the Company’s ability to leverage its IT management offerings, customer base, sales force and IT management business plan with Meldium’s product, technical expertise and customer base. All goodwill and intangible assets acquired are not deductible for income tax purposes.
The Company recorded both a current and a long-term deferred tax asset of approximately $88,000 and $433,000, respectively, primarily related to net operating losses that were acquired as a part of the acquisition and are shown in the accompanying table above as Current assets and Other assets respectively. The Company also recorded a long-term deferred tax liability of approximately $694,000 related to the amortization of intangible assets which cannot be deducted for tax purposes and are included in the accompanying table above as Other liabilities.
On September 5, 2014, the Company acquired all of the outstanding capital stock of a San Francisco, California-based collaboration software provider, for a cash purchase price of $4.5 million plus contingent bonuses totaling up to $1.5 million, which are expected to be paid two years from the date of acquisition. The acquired company’s operating results, which are comprised of approximately $490,000 of expenses during the year ended December 31, 2014 are included in the consolidated financial statements beginning on the acquisition date.
This acquisition has been accounted for as a business combination. The assets acquired and the liabilities assumed were recorded at their estimated fair values as of the acquisition date. The Company retained an independent third party valuation firm to assist in the determination of the fair value of the intangible assets with estimates and assumptions provided by Company management. The excess of the purchase price over the tangible net assets and identifiable intangible assets was recorded as goodwill.
The following table summarizes the fair value (in thousands) of the assets acquired and liabilities assumed at the date of acquisition:
| Amount | ||||
| Cash |
$ | 2 | ||
| Current assets |
13 | |||
| Other assets |
404 | |||
| Other liabilities |
(439 | ) | ||
| Completed technology |
960 | |||
| Trade name and trademark |
100 | |||
| Goodwill |
3,484 | |||
|
|
|
|||
| Total purchase price |
4,524 | |||
| Liability for contingent consideration |
(24 | ) | ||
|
|
|
|||
| Cash paid |
$ | 4,500 | ||
|
|
|
|||
64
Table of Contents
The Company’s pro forma results of operations for the year ended December 31, 2013 and 2014, assuming the Company had acquired the San Francisco, California-based collaboration software company on January 1, 2013, do not differ materially from those reported in the Company’s consolidated statement of operations for those years.
The stock purchase agreement included a contingent, retention-based bonus program provision requiring the Company to make additional payments to employees, including former stockholders now employed by the Company, on the second anniversary of the acquisition, contingent upon their continued employment and achievement of certain product integration goals. The range of the contingent, retention-based bonus payments that the Company could pay is between $0 to $1.5 million. The Company has concluded that the arrangement is a compensation arrangement and is accruing the maximum payout ratably over the performance period, as it believes it is probable that the criteria will be met. The contingent bonus program also includes payments to non-employee stockholders for an amount between $0 and $30,000, which the Company has concluded is contingent consideration and is part of the purchase price. This contingent liability was recorded at its fair value of $24,000 at the acquisition date. The Company continues to re-measure the fair value of the contingent consideration at each subsequent reporting period and recognizes any adjustments to fair value as part of earnings.
The goodwill recorded in connection with this transaction is primarily related to the expected synergies to be achieved related to the Company’s ability to leverage its join.me product, customer base, sales force and join.me business plan with the collaboration software provider’s product, technical expertise and customer base. All goodwill and intangible assets acquired are not deductible for income tax purposes.
The Company recorded a long-term deferred tax asset of approximately $402,000 related to net operating losses that were acquired as a part of the acquisition, which is included in the accompanying table above as Other assets. The Company also recorded a long-term deferred tax liability of approximately $430,000 related to the amortization of intangible assets which cannot be deducted for tax purposes and is included in the accompanying table above as Other liabilities.
For the year ended December 31, 2014, the Company incurred approximately $356,000 of acquisition-related costs for the three acquisitions that closed in 2014 and these costs are included in general and administrative expense.
| 5. | Goodwill and Intangible Assets |
The changes in the carrying amounts of goodwill for the years ended December 31, 2013 and 2014 are due to the addition of goodwill resulting from the acquisitions of Ionia, Meldium and the San Francisco-based collaboration software provider (See Note 4 to the Consolidated Financial Statements).
Changes in goodwill for the years ended December 31, 2013 and 2014 are as follows (in thousands):
| Balance, December 31, 2012 |
$ | 18,883 | ||
| Foreign currency translation adjustments |
(171 | ) | ||
|
|
|
|||
| Balance, December 31, 2013 |
$ | 18,712 | ||
| Goodwill related to the acquisition of Ionia |
6,295 | |||
| Goodwill related to the acquisition of Meldium |
9,437 | |||
| Goodwill related to the acquisition of the San Francisco-based collaboration software provider |
3,484 | |||
|
|
|
|||
| Balance, December 31, 2014 |
$ | 37,928 | ||
|
|
|
65
Table of Contents
Intangible assets consist of the following (in thousands):
| December 31, 2013 | December 31, 2014 | |||||||||||||||||||||||||||
| Estimated Useful Life |
Gross Carrying Amount |
Accumulated Amortization |
Net Carrying Amount |
Gross Carrying Amount |
Accumulated Amortization |
Net Carrying Amount |
||||||||||||||||||||||
| Identifiable intangible assets: |
||||||||||||||||||||||||||||
| Trade names and trademarks |
1-5 years | $ | 666 | $ | 666 | $ | — | $ | 806 | $ | 682 | $ | 124 | |||||||||||||||
| Customer relationships |
5-8 years | 3,789 | 1,901 | 1,888 | 5,229 | 2,546 | 2,683 | |||||||||||||||||||||
| Customer backlog |
4 months | — | — | — | 120 | 120 | — | |||||||||||||||||||||
| Domain names |
5 years | 894 | 341 | 553 | 907 | 507 | 400 | |||||||||||||||||||||
| Software |
4 years | 299 | 299 | — | 299 | 299 | — | |||||||||||||||||||||
| Completed technology |
3-8 years | 13,963 | 1,835 | 12,128 | 16,903 | 3,981 | 12,922 | |||||||||||||||||||||
| Technology and know-how |
3 years | 3,176 | 2,597 | 579 | 3,176 | 3,176 | — | |||||||||||||||||||||
| Documented know-how |
4 years | — | — | — | 280 | 57 | 223 | |||||||||||||||||||||
| Non-Compete agreements |
5 years | 162 | 34 | 128 | 162 | 71 | 91 | |||||||||||||||||||||
| Internally developed software |
3 years | 2,485 | 875 | 1,610 | 4,591 | 2,051 | 2,540 | |||||||||||||||||||||
|
|
|
|
|
|
|
|
|
|
|
|
|
|||||||||||||||||
| $ | 25,434 | $ | 8,548 | $ | 16,886 | $ | 32,473 | $ | 13,490 | $ | 18,983 | |||||||||||||||||
|
|
|
|
|
|
|
|
|
|
|
|
|
|||||||||||||||||
As a result of the acquisition of Ionia, the Company capitalized $120,000 of customer backlog, $280,000 of documented know-how, $10,000 of trade name and trademark, and $1.3 million of customer relationships as intangible assets. As a result of the acquisition of Meldium, the Company capitalized $1.6 million of completed technology, $30,000 of trade name and trademark, and $100,000 of customer relationships. As a result of the acquisition of the San Francisco-based collaboration software provider, the Company capitalized $960,000 of completed technology and $100,000 of trade name and trademark. Changes in the gross carrying amount of domain names are due to foreign currency translation adjustments. The Company is amortizing the intangible assets based upon the pattern in which their economic benefit will be realized, or if this pattern cannot be reliably determined, using the straight-line method over their estimated useful lives. The intangible assets have estimated useful lives which range from four months to eight years.
On November 6, 2013, the Company purchased a software asset for $11.5 million which is classified as technology. During 2014, the Company incurred an additional $500,000 to develop this technology. The technology will be incorporated into certain of the Company’s products, and is being amortized straight-line over its estimated useful life of 5 years.
The Company capitalized costs related to internally developed computer software to be sold as a service incurred during the application development stage of $1.2 million and $2.1 million during 2013 and 2014, respectively, and is amortizing these costs over the expected lives of the related services. The Company paid $358,000 and $22,000 during 2013 and 2014, respectively, to acquire domain names.
66
Table of Contents
The Company is amortizing the intangible assets over the estimated useful lives noted above. Amortization expense for intangible assets was $2.1 million, $2.5 million and $4.9 million for the years ended December 31, 2012, 2013 and 2014, respectively. Amortization relating to software, technology and know-how, documented know-how, and internally developed software is recorded within cost of revenues and the amortization of tradename and trademark, customer base, customer backlog, domain names, and non-compete agreements is recorded within operating expenses. Future estimated amortization expense for intangible assets is as follows at December 31, 2014 (in thousands):
| Amortization Expense (Years Ending December 31) |
Amount | |||
| 2015 |
$ | 5,037 | ||
| 2016 |
4,609 | |||
| 2017 |
4,270 | |||
| 2018 |
3,435 | |||
| 2019 |
1,096 | |||
| Thereafter |
536 | |||
|
|
|
|||
| Total |
$ | 18,983 | ||
|
|
|
|||
| 6. | Property and Equipment |
Property and equipment consisted of the following (in thousands):
| December 31, | ||||||||
| 2013 | 2014 | |||||||
| Computer equipment and software |
$ | 22,276 | $ | 24,968 | ||||
| Office equipment |
3,235 | 3,624 | ||||||
| Furniture & fixtures |
3,083 | 4,075 | ||||||
| Construction in progress |
456 | 684 | ||||||
| Leasehold improvements |
2,967 | 3,752 | ||||||
|
|
|
|
|
|||||
| Total property and equipment |
32,017 | 37,103 | ||||||
| Less accumulated depreciation and amortization |
(18,819 | ) | (23,627 | ) | ||||
|
|
|
|
|
|||||
| Property and equipment, net |
$ | 13,198 | $ | 13,476 | ||||
|
|
|
|
|
|||||
Depreciation expense for property and equipment was $4.0 million, $5.2 million and $6.2 million for the years ended December 31, 2012, 2013 and 2014.
| 7. | Accrued Liabilities |
Accrued liabilities consisted of the following (in thousands):
| December 31, 2013 |
December 31, 2014 |
|||||||
| Marketing programs |
$ | 4,631 | $ | 7,626 | ||||
| Payroll and payroll related |
9,719 | 14,873 | ||||||
| Professional fees |
1,064 | 1,961 | ||||||
| Other accrued liabilities |
4,696 | 5,022 | ||||||
|
|
|
|
|
|||||
| Total accrued liabilities |
$ | 20,110 | $ | 29,482 | ||||
|
|
|
|
|
|||||
67
Table of Contents
| 8. | Income Taxes |
The domestic and foreign components of income before provision for income taxes are as follows (in thousands):
| Years Ended December 31, | ||||||||||||
| 2012 | 2013 | 2014 | ||||||||||
| Domestic |
$ | 7,789 | $ | 10,389 | $ | (4,462 | ) | |||||
| Foreign |
(1,532 | ) | (11,857 | ) | 13,856 | |||||||
|
|
|
|
|
|
|
|||||||
| Total income (loss) before provision for income taxes |
$ | 6,257 | $ | (1,468 | ) | $ | 9,394 | |||||
|
|
|
|
|
|
|
|||||||
The provision for income taxes is as follows (in thousands):
| Years Ended December 31, | ||||||||||||
| 2012 | 2013 | 2014 | ||||||||||
| Current |
||||||||||||
| Federal |
$ | 8,324 | $ | 5,480 | $ | 2,804 | ||||||
| State |
1,181 | 1,346 | 1,184 | |||||||||
| Foreign |
126 | 952 | 1,052 | |||||||||
|
|
|
|
|
|
|
|||||||
| Total |
9,631 | 7,778 | 5,040 | |||||||||
|
|
|
|
|
|
|
|||||||
| Deferred |
||||||||||||
| Federal |
(4,926 | ) | (1,379 | ) | (3,069 | ) | ||||||
| State |
44 | (177 | ) | (748 | ) | |||||||
| Foreign |
(2,058 | ) | (8 | ) | 216 | |||||||
|
|
|
|
|
|
|
|||||||
| Total |
(6,940 | ) | (1,564 | ) | (3,601 | ) | ||||||
|
|
|
|
|
|
|
|||||||
| Total provision for income taxes |
$ | 2,691 | $ | 6,214 | $ | 1,439 | ||||||
|
|
|
|
|
|
|
|||||||
A reconciliation of the Company’s effective tax rate to the statutory federal income tax rate is as follows:
| For the Years Ended December 31, | ||||||||||||
| 2012 | 2013 | 2014 | ||||||||||
| Statutory tax rate |
35.0 | % | 35.0 | % | 35.0 | % | ||||||
| Change in valuation allowance |
(10.8 | ) | — | — | ||||||||
| Impact of permanent differences |
15.6 | (82.3 | ) | 16.2 | ||||||||
| Foreign tax rate differential |
(11.5 | ) | (346.9 | ) | (39.1 | ) | ||||||
| Research and development credits |
— | 23.1 | (2.6 | ) | ||||||||
| State taxes, net of federal benefit |
13.8 | (51.9 | ) | 2.9 | ||||||||
| Impact of uncertain tax positions |
0.8 | (3.6 | ) | 3.8 | ||||||||
| Other |
0.1 | 3.4 | (0.8 | ) | ||||||||
|
|
|
|
|
|
|
|||||||
| Effective tax rate |
43.0 | % | (423.2 | )% | 15.4 | % | ||||||
|
|
|
|
|
|
|
|||||||
For the year ended December 31, 2012, the Company recorded a tax provision for income taxes of $2.7 million on profit before income taxes of $6.3 million. The Company recorded a provision as a result of taxable income generated in the United States. The Company’s effective tax rate for the year ended December 31, 2012 was impacted by permanent differences related to certain non-deductible stock based compensation and the release of a valuation allowance related to our Xively subsidiary.
For the year ended December 31, 2013, the Company recorded a tax provision for income taxes of $6.2 million on a loss before income taxes of $1.5 million. The Company recorded a provision as a result of the taxable income generated in the United States, while certain foreign jurisdictions incurred losses before income taxes without related tax benefits. The Company’s effective tax rate for the year ended December 31, 2013 was impacted by these foreign losses and by permanent differences related to certain non-deductible and stock based compensation.
68
Table of Contents
For the year ended December 31, 2014, the Company recorded a tax provision for income taxes of $1.4 million on profit before income taxes of $9.4 million. The Company recorded a provision as a result of taxable income generated in the United States as well as in certain foreign jurisdictions. The Company’s effective tax rate for the year ended December 31, 2014 is lower than the U.S. federal statutory rate of 35% due to profits earned in certain foreign jurisdictions, primarily by our Irish subsidiaries, which are subject to significantly lower tax rates than the U.S. federal statutory rate.
The Company has deferred tax assets related to temporary differences and operating loss carryforwards as follows (in thousands):
| December 31, | ||||||||
| 2013 | 2014 | |||||||
| Deferred tax assets: |
||||||||
| Net operating loss carryforwards |
$ | 2,375 | $ | 2,783 | ||||
| Deferred revenue |
627 | 775 | ||||||
| Amortization |
1,211 | 1,806 | ||||||
| Research and development credit carryforwards |
404 | 12 | ||||||
| Bad debt reserves |
56 | 79 | ||||||
| Stock compensation associated with non-qualified awards |
10,423 | 11,584 | ||||||
| Accrued Bonus |
1,530 | 3,579 | ||||||
| Depreciation |
326 | 171 | ||||||
| Other |
839 | 1,016 | ||||||
|
|
|
|
|
|||||
| Total deferred tax assets |
17,791 | 21,805 | ||||||
| Deferred tax asset valuation allowance |
(2,836 | ) | (2,203 | ) | ||||
|
|
|
|
|
|||||
| Net deferred tax assets |
14,955 | 19,602 | ||||||
|
|
|
|
|
|||||
| Deferred tax liabilities: |
||||||||
| Depreciation |
(1,212 | ) | (1,234 | ) | ||||
| Goodwill amortization |
(1,236 | ) | (3,640 | ) | ||||
| Other |
(14 | ) | (45 | ) | ||||
|
|
|
|
|
|||||
| Total deferred tax liabilities |
(2,462 | ) | (4,919 | ) | ||||
|
|
|
|
|
|||||
| Total |
$ | 12,493 | $ | 14,683 | ||||
|
|
|
|
|
|||||
At December 31, 2013 and 2014, deferred tax liabilities of approximately $15,000 and $1,000 respectively, are included in accrued liabilities, and approximately $15,000 and $3,000 respectively, are included in long term liabilities.
Deferred tax assets, related valuation allowances, current tax liabilities, and deferred tax liabilities are determined separately by tax jurisdiction. In making these determinations, we estimate deferred tax assets, current tax liabilities, and deferred tax liabilities, and we assess temporary differences resulting from differing treatment of items for tax and accounting purposes. During 2012, the Company reassessed the need for a valuation allowance against its deferred tax assets relating to its Xively subsidiary and concluded that it was more likely than not that it would be able to realize its deferred tax assets as a result of forecasted future earnings. Accordingly, the Company reversed the valuation allowance related to its Xively deferred tax assets of approximately $677,000. As of December 31, 2014, the Company maintained a full valuation allowance against the deferred tax assets of its Hungarian subsidiary. This entity has historical losses and the Company concluded it was not more likely than not that these deferred tax assets are realizable. The valuation allowance decreased by approximately $633,000 primarily as a result of the expiration of research and development tax credits.
As of December 31, 2014, the Company had federal, state, and foreign net operating loss carryforwards of approximately $1,559,000, $1,551,000 and $21,480,000, respectively. The Company’s federal and state net operating loss carryforwards are subject to limitation under Section 382 of the Internal Revenue Code. As of December 31, 2014, all federal and state net operating loss carryforwards are expected to be utilized before
69
Table of Contents
expiration. The Company’s foreign net operating loss carryforwards are not subject to expiration. The Company recognized a full valuation allowance against its Hungarian net operating loss carryfowards.
As of December 31, 2014, the Company had federal, state and foreign research and development credit carryforwards of approximately $0, $12,000 and $0, respectively, which are available to offset future state taxes.
The Company generally considers all earnings generated outside of the U.S. to be indefinitely reinvested offshore. Therefore, the Company does not accrue U.S. tax for the repatriation of the foreign earnings it considers to be indefinitely reinvested outside the U.S. As of December 31, 2014, the Company has not provided for federal income tax on approximately $14,000,000 of accumulated undistributed earnings of its foreign subsidiaries. It is not practicable to estimate the amount of additional tax that might be payable on the undistributed foreign earnings.
The Company files income tax returns in the U.S. federal jurisdiction and various state and foreign jurisdictions. The statute of limitations in the Company’s various tax jurisdictions remain open for various periods between 2004 and the present.
As of December 31, 2013 and 2014, the Company has provided a liability of $304,000 and $652,000 respectively for uncertain tax positions. These uncertain tax positions would impact the Company’s effective tax rate if recognized.
The Company has provided liabilities for uncertain tax provisions as follows (in thousands):
| Years Ended December 31, |
||||||||
| 2013 | 2014 | |||||||
| Beginning balance |
$ | 251 | $ | 304 | ||||
| Gross decreases — tax positions in prior period |
— | (56 | ) | |||||
| Gross increases — tax positions in current period |
53 | 404 | ||||||
|
|
|
|
|
|||||
| Ending balance |
$ | 304 | $ | 652 | ||||
|
|
|
|
|
|||||
The Company’s policy is to record estimated interest and penalties related to the underpayment of income taxes or unrecognized tax benefits as a component of its income tax provision. The Company recognized approximately $4,000 and $15,000 of interest expense during the years ended December 31, 2013 and 2014, respectively.
| 9. | Common Stock and Equity |
Authorized Shares — On June 9, 2009, the Company’s Board of Directors approved a Restated Certificate of Incorporation to be effective upon the closing of the Company’s IPO. This Restated Certificate of Incorporation, among other things, increased the Company’s authorized common shares to 75,000,000 and authorized 5,000,000 shares of undesignated preferred stock.
Common Stock Reserved — As of December 31, 2013 and 2014, the Company has reserved the following number of shares of common stock for the exercise of stock options and restricted stock units (in thousands):
| Number of Shares as of | ||||||||
| December 31, 2013 |
December 31, 2014 |
|||||||
| Common stock options and restricted stock units |
5,231 | 4,906 | ||||||
|
|
|
|
|
|||||
| Total reserved |
5,231 | 4,906 | ||||||
|
|
|
|
|
|||||
In February 2013, the Company’s board of directors approved a $25 million share repurchase program. On August 13, 2013, the board of directors approved a new $50 million share repurchase program, which replaced the previous $25 million share repurchase program. On October 20, 2014, the Board of Directors approved a new
70
Table of Contents
$75 million share repurchase program. This new share repurchase program is in addition to the Company’s existing $50 million share repurchase program. Share repurchases are made from time-to-time in the open market, in privately negotiated transactions or otherwise, in accordance with applicable securities laws and regulations. The timing and amount of any share repurchases are determined by the Company’s management based on its evaluation of market conditions, the trading price of the stock, regulatory requirements and other factors. The share repurchase program may be suspended, modified or discontinued at any time at the Company’s discretion without prior notice.
During the year ended December 31, 2013 and 2014, the Company repurchased 1,268,643 and 843,574 shares of its common stock at an average price of $24.06 and $43.27 per share for a total cost of approximately $30.5 million and $36.5 million, respectively. At December 31, 2014, approximately $74.4 million remained available under the Company’s current share repurchase program.
| 10. | Stock Incentive Plan |
The Company’s 2009 Stock Incentive Plan (“2009 Plan”) is administered by the Board of Directors and Compensation Committee, which have the authority to designate participants and determine the number and type of awards to be granted and any other terms or conditions of the awards. Options generally vest over a four-year period and expire ten years from the date of grant. Restricted stock units with service-based vesting conditions generally vest over a three-year period while restricted stock units with market-based vesting conditions generally vest over two or three-year periods. Certain stock-based awards provide for accelerated vesting if there is a change in control. On May 22, 2014, the Company’s stockholders approved an amendment to the 2009 Plan that increased the shares available to grant under the plan by 1,200,000 shares. As of December 31, 2014, there were 2,220,348 shares available for grant under the 2009 Plan.
The Company generally issues previously unissued shares of common stock for the exercise of stock options and restricted stock units. The Company received $2.7 million, $3.8 million and $17.6 million in cash from stock option exercises during the years ended December 31, 2012, 2013 and 2014, respectively.
The Company uses the Black-Scholes option-pricing model to estimate the grant date fair value of stock options. The Company estimates the expected volatility of its common stock at the date of grant based on the historical volatility of comparable public companies over the option’s expected term as well as its own stock price volatility since the Company’s IPO. The Company estimates expected term based on historical exercise activity and giving consideration to the contractual term of the options, vesting schedules, employee turnover, and expectation of employee exercise behavior. The assumed dividend yield is based upon the Company’s expectation of not paying dividends in the foreseeable future. The risk-free rate for periods within the estimated life of the stock option is based on the U.S. Treasury yield curve in effect at the time of grant. Historical employee turnover data is used to estimate pre-vesting stock option forfeiture rates. The compensation expense is amortized on a straight-line basis over the requisite service period of the stock award, which is generally four years for options.
The Company used the following assumptions to apply the Black-Scholes option-pricing model:
| Years Ended December 31, | ||||||
| 2012 | 2013 | 2014 | ||||
| Expected dividend yield |
0.00% | 0.00% | 0.00% | |||
| Risk-free interest rate |
0.64% - 0.87% | 0.87 - 1.36% | 1.48% | |||
| Expected term (in years) |
5.56 - 6.25 | 6.25 | 6.25 | |||
| Volatility |
55% - 60% | 55% | 55% | |||
71
Table of Contents
The following table summarizes stock option activity (shares and intrinsic value in thousands):
| Number of Options |
Weighted Average Exercise Price |
Weighted Average Remaining Contractual Term (Years) |
Aggregate Intrinsic Value |
|||||||||||||
| Outstanding, January 1, 2014 |
2,389 | $ | 26.85 | 6.4 | ||||||||||||
|
|
|
|||||||||||||||
| Granted |
35 | 41.03 | ||||||||||||||
| Exercised |
(859 | ) | 20.48 | $ | 20,566 | |||||||||||
|
|
|
|||||||||||||||
| Forfeited |
(158 | ) | 36.40 | |||||||||||||
|
|
|
|
|
|||||||||||||
| Outstanding, December 31, 2014 |
1,407 | $ | 30.02 | 6.2 | $ | 27,186 | ||||||||||
|
|
|
|
|
|
|
|
|
|||||||||
| Exercisable at December 31, 2014 |
957 | $ | 28.24 | 5.7 | $ | 20,190 | ||||||||||
|
|
|
|
|
|
|
|
|
|||||||||
| Vested or expected to vest at December 31, 2014 |
1,389 | $ | 30.05 | 6.2 | $ | 26,805 | ||||||||||
|
|
|
|
|
|
|
|
|
|||||||||
The aggregate intrinsic value was calculated based on the positive differences between the estimated fair value of the Company’s common stock on December 31, 2014 of $49.34 per share or at time of exercise, and the exercise price of the options.
The weighted average grant date fair value of stock options issued was $18.57, $11.60 and $21.78 per share for the years ended December 31, 2012, 2013 and 2014, respectively.
During the year ended December 31, 2014, the Company granted 633,696 restricted stock units, containing time-based vesting conditions. Restricted stock units with time-based vesting conditions are valued on the grant date using the grant date closing price of the underlying shares. The Company recognizes the expense on a straight-line basis over the requisite service period of the restricted stock unit, which is generally three years.
In August 2013 and May 2014, the Company granted 74,000 and 71,000 restricted stock units with market-based vesting conditions, respectively, which were tied to the Company’s achievement of a relative total shareholder return target measured over an applicable performance period which ranges from two to three years (the “TSR Units”). The number of shares underlying these TSR Units that will vest upon the conclusion of the applicable performance periods can range from 0% of the shares awarded to 200% of the shares awarded, or up to 148,000 shares and 142,000 shares for the August 2013 grant and May 2014 grant, respectively. Vesting of such shares is also contingent upon the continued employment of the participant throughout the vesting period. All TSR Units granted by the Company are valued using a Monte Carlo simulation model. The number of awards expected to be earned is factored into the grant date Monte Carlo valuation for the TSR Unit. Compensation cost is recognized regardless of the actual number of awards that are earned based on the market condition. Expected volatility is based on the Company’s historical volatility. The risk-free interest rate is based upon U.S. Treasury securities with a term similar to the vesting term of the TSR Units.
The assumptions used in the Monte Carlo simulation model include (but are not limited to) the following:
| August 2013 Grant | May 2014 Grant | |||||||
| Risk-free interest rate |
0.62 | % | 0.78 | % | ||||
| Volatility |
54 | % | 54 | % | ||||
Compensation cost is recognized on a straight-line basis over the requisite service period. At December 31, 2014, all of the TSR Units granted in August 2013 and May 2014 remain outstanding.
72
Table of Contents
The following table summarizes all restricted stock unit activity, including performance-based restricted stock units (shares in thousands):
| Number of shares Underlying Restricted Stock Units |
Weighted Average Grant Date Fair Value |
|||||||
| Unvested as of January 1, 2014 |
1,192 | $ | 28.47 | |||||
| Restricted stock units granted |
705 | 44.63 | ||||||
| Restricted stock units vested |
(430 | ) | 27.63 | |||||
| Restricted stock units forfeited |
(188 | ) | 30.10 | |||||
|
|
|
|
|
|||||
| Unvested as of December 31, 2014 |
1,279 | $ | 37.42 | |||||
|
|
|
|
|
|||||
The Company recognized stock-based compensation expense within the accompanying consolidated statements of operations as summarized in the following table (in thousands):
| Years Ended December 31, | ||||||||||||
| 2012 | 2013 | 2014 | ||||||||||
| Cost of revenue |
$ | 484 | $ | 706 | $ | 1,107 | ||||||
| Research and development |
2,826 | 3,761 | 3,653 | |||||||||
| Sales and marketing |
4,962 | 7,242 | 9,033 | |||||||||
| General and administrative |
6,520 | 8,005 | 10,976 | |||||||||
|
|
|
|
|
|
|
|||||||
| $ | 14,792 | $ | 19,714 | $ | 24,769 | |||||||
|
|
|
|
|
|
|
|||||||
As of December 31, 2014, there was approximately $37.3 million of total unrecognized share-based compensation cost, net of estimated forfeitures, related to unvested stock awards which are expected to be recognized over a weighted average period of 1.9 years. The total unrecognized share-based compensation cost will be adjusted for future changes in estimated forfeitures.
| 11. | Commitments and Contingencies |
Operating Leases — The Company has operating lease agreements for offices in the United States, Hungary, Australia, the United Kingdom, Ireland and India that expire through 2028.
In December 2014, the Company entered into a lease for new office space in Boston, Massachusetts. The landlord is obligated to rehabilitate the existing building and the Company expects that the lease term will begin in November 2015 and extend through April 2028. The aggregate amount of minimum lease payments to be made over the term of the lease is approximately $47.0 million. Pursuant to the terms of the lease, the landlord is responsible for making certain improvements to the leased space up to an agreed upon cost to the landlord. Any excess costs for these improvements will be billed by the landlord to the Company as additional rent. The Company estimates these excess costs to be approximately $7.0 million. The lease required a security deposit of approximately $3.3 million in the form of an irrevocable, unsecured standby letter of credit. The lease includes an option to extend the original term of the lease for two successive five year periods.
In December 2014, the Company entered into a lease for new office space in San Francisco, California. The term of the new office space begins in February 2015 and extends through December 2019. The aggregate amount of minimum lease payments to be made over the term of the lease is approximately $2.4 million. The lease required a security deposit of approximately $41,000. The security deposit is classified as a long-term deposit.
In October 2014, the Company entered into a lease for new office space in Dublin, Ireland. The term of the new office space began in October 2014 and extends through September 2024. The aggregate amount of minimum lease payments to be made over the term of the lease is approximately $5.8 million (EUR 4.8 million).
In April 2014, the Company amended its current lease for its Budapest, Hungary office space to provide for an expansion of leased space and to extend the term of the lease. The term of the amended lease began in July
73
Table of Contents
2014 and will extend through June 2019. The aggregate amount of minimum lease payments to be made over the term of the lease increased to approximately $6.9 million (EUR 5.7 million). The amended lease agreement required a bank guarantee of approximately $430,000 (EUR 354,000). The bank guarantee is classified as restricted cash.
Rent expense under all leases was approximately $3.2 million, $6.0 million and $7.1 million for the years ended December 31, 2012, 2013 and 2014, respectively. The Company records rent expense on a straight-line basis for leases with scheduled escalation clauses or free rent periods.
The Company also enters into hosting services agreements with third-party data centers and internet service providers that are subject to annual renewal. Hosting fees incurred under these arrangements aggregated approximately $3.2 million, $4.7 million and $5.1 million for the years ended December 31, 2012, 2013 and 2014, respectively.
Future minimum lease payments under non-cancelable operating leases including one year commitments associated with the Company’s hosting services arrangements are approximately as follows at December 31, 2014 (in thousands):
| Years Ending December 31 |
||||
| 2015 |
$ | 10,347 | ||
| 2016 |
9,501 | |||
| 2017 |
10,090 | |||
| 2018 |
10,453 | |||
| 2019 |
9,837 | |||
| Thereafter |
53,252 | |||
|
|
|
|||
| Total minimum lease payments |
$ | 103,480 | ||
|
|
|
|||
Litigation — On September 8, 2010, 01 Communique Laboratory, Inc., or 01, filed a complaint that named the Company as a defendant in a lawsuit in the U.S. District Court for the Eastern District of Virginia (Civil Action No. 1:10cv1007) alleging that the Company infringed U.S. Patent No. 6,928,479, or the ‘479 Patent, which is owned by 01 and has claims directed to a particular application or system for providing a private communication portal from one computer to a second computer. The complaint sought damages in an unspecified amount and injunctive relief. The trial commenced on March 18, 2013 and on March 26, 2013, a jury in the Eastern District of Virginia found that the Company’s products do not infringe the ‘479 Patent as previously asserted by 01. 01 appealed the jury’s non-infringement verdict and on June 9, 2014, the jury’s non-infringement verdict was affirmed by the U.S. Court of Appeals for the Federal Circuit. On November 21, 2014, the U.S. District Court for the Eastern District of Virginia issued its final order, awarding costs to the Company, which 01 paid on December 3, 2014, formally concluding this matter.
On November 21, 2012, the Company filed suit against Pragmatus Telecom LLC, or Pragmatus, in the U.S. District Court for the District of Delaware (Civil Action No. 12-1507) seeking a declaratory judgment that the Company’s products do not infringe three patents allegedly owned by Pragmatus after certain of the Company’s customers received letters from Pragmatus claiming that their use of certain LogMeIn services infringed upon those patents. On March 29, 2013, the Company and Pragmatus entered into a License Agreement, which granted the Company a fully-paid license covering the patents at issue. The Company paid Pragmatus a one-time license fee in connection with the License Agreement in April 2013. As a result, the Company’s declaratory judgment action was dismissed by the court on May 3, 2013.
On August 26, 2014, Sensory Technologies, LLC, or Sensory, filed a complaint against the Company in the U.S. District Court for the Southern District of Indiana (Case No. 1:14-cv-1406). The complaint alleges, among other things, that the Company has infringed upon Sensory’s JOIN ® trademark, which is registered to Sensory under U.S. Trademark Registration No. 3622883. The complaint seeks damages in an unspecified amount and injunctive relief. The Company believes it has meritorious defenses to the claims and intends to defend the lawsuit vigorously. Given the inherent unpredictability of litigation and the fact that this litigation is still in its early stages, the Company is unable to predict the outcome of this litigation or reasonably estimate a possible loss or range of loss associated with this litigation at this time.
74
Table of Contents
On August 28, 2014, a putative class action complaint was filed against the Company in the U.S. District Court for the Eastern District of California (Case No. 1:14-cv-01355) by an individual on behalf of himself and on behalf of all other similarly situated individuals, or collectively, the Plaintiffs. After the Company filed a motion to dismiss the complaint on January 30, 2015, the Plaintiffs filed an amended complaint on February 17, 2015. The amended complaint includes claims made under California’s False Advertising Act and Unfair Competition Law and relates to the Company’s sale of its Ignition for iOS application, or the App, and the Plaintiffs’ continued use of the App. The Plaintiffs’ complaint seeks restitution, damages in an unspecified amount, attorney’s fees and costs, and unspecified equitable and injunctive relief. The Company believes it has meritorious defenses to the claims and intends to defend the lawsuit vigorously. Given the inherent unpredictability of litigation and the fact that this litigation is still in its early stages, the Company is unable to predict the outcome of this litigation or reasonably estimate a possible loss or range of loss associated with this litigation at this time.
The Company is from time to time subject to various other legal proceedings and claims, either asserted or unasserted, which arise in the ordinary course of business. The Company routinely assesses its current litigation and/or threatened litigation as to the probability of ultimately incurring a liability, and records its best estimate of the ultimate loss in situations where the Company assesses the likelihood of loss as probable. While the outcome of these other claims cannot be predicted with certainty, management does not believe that the outcome of any of these other legal matters will have a material adverse effect on the Company’s consolidated financial statements.
| 12. | 401(k) Plan |
On January 1, 2007, the Company established a defined contribution savings plan under Section 401(k) of the Internal Revenue Code. The plan is available to all employees upon employment and allows participants to defer a portion of their annual compensation on a pre-tax basis. The Company may contribute to the plan at the discretion of the Board of Directors. The Company has not made any contributions to the plan through December 31, 2014.
| 13. | Subsequent Event |
On February 18, 2015, the Company entered into a multi-currency credit agreement with a syndicated bank group for which JPMorgan Chase Bank, N.A. acts as administrative agent. The credit agreement provides for a secured revolving credit facility of up to $100 million, and may be increased by an additional $50 million subject to further commitment from the lenders. The credit facility matures on February 18, 2020 and includes certain financial covenants with which the Company must comply. The Company and its subsidiaries expect to use the credit facility for general corporate purposes, including the potential acquisition of complementary products or businesses, share repurchases, as well as for working capital.
75
Table of Contents
| 14. | Quarterly Information (Unaudited) |
| For the Three Months Ended, | ||||||||||||||||||||||||||||||||
| March 31, 2013 |
June 30, 2013 |
September 30, 2013 |
December 31, 2013 |
March 31, 2014 |
June 30, 2014 |
September 30, 2014 |
December 31, 2014 |
|||||||||||||||||||||||||
| (in thousands, except for per share data) | ||||||||||||||||||||||||||||||||
| Statement of Operations Data: |
||||||||||||||||||||||||||||||||
| Revenue |
$ | 37,437 | $ | 40,670 | $ | 42,970 | $ | 45,181 | $ | 49,020 | $ | 54,975 | $ | 58,062 | $ | 59,899 | ||||||||||||||||
| Gross profit |
33,028 | 35,894 | 38,285 | 40,235 | 42,900 | 47,578 | 50,728 | 52,018 | ||||||||||||||||||||||||
| (Loss) income from operations |
(6,630 | ) | (123 | ) | 2,191 | 2,636 | 1,598 | 782 | 2,771 | 3,536 | ||||||||||||||||||||||
| Net (loss) income |
(5,807 | ) | (1,360 | ) | (56 | ) | (459 | ) | 1,004 | 1,330 | 2,308 | 3,313 | ||||||||||||||||||||
| Net (loss) income per share-basic |
(0.24 | ) | (0.06 | ) | 0.00 | (0.02 | ) | 0.04 | 0.05 | 0.09 | 0.14 | |||||||||||||||||||||
| Net (loss) income per share-diluted |
(0.24 | ) | (0.06 | ) | 0.00 | (0.02 | ) | 0.04 | 0.05 | 0.09 | 0.14 | |||||||||||||||||||||
76
Table of Contents
| ITEM 9. | CHANGES IN AND DISAGREEMENTS WITH ACCOUNTANTS ON ACCOUNTING AND FINANCIAL DISCLOSURE |
None.
| ITEM 9A. | CONTROLS AND PROCEDURES |
Disclosure Controls and Procedures
Our management, with the participation of our chief executive officer and chief financial officer, evaluated the effectiveness of our disclosure controls and procedures as of December 31, 2014. The term “disclosure controls and procedures,” as defined in Rules 13a-15(e) and 15d-15(e) under the Exchange Act of 1934, as amended, means controls and other procedures of a company that are designed to ensure that information required to be disclosed by a company in the reports that it files or submits under the Exchange Act is recorded, processed, summarized and reported, within the time periods specified in the SEC’s rules and forms. Disclosure controls and procedures include, without limitation, controls and procedures designed to ensure that information required to be disclosed by a company in the reports that it files or submits under the Exchange Act is accumulated and communicated to the company’s management, including its principal executive and principal financial officers, as appropriate to allow timely decisions regarding required disclosure. Management recognizes that any controls and procedures, no matter how well designed and operated, can provide only reasonable assurance of achieving their objectives and management necessarily applies its judgment in evaluating the cost-benefit relationship of possible controls and procedures. Based on the evaluation of our disclosure controls and procedures as of December 31, 2014, our chief executive officer and chief financial officer concluded that, as of such date, our disclosure controls and procedures were effective at the reasonable assurance level.
Management’s Annual Report on Internal Control Over Financial Reporting
Our management is responsible for establishing and maintaining adequate internal control over financial reporting. Internal control over financial reporting is defined in Rules 13a-15(f) and 15d-15(f) under the Exchange Act as a process designed by, or under the supervision of, our principal executive and principal financial officer and effected by our board of directors, management and other personnel, to provide reasonable assurance regarding the reliability of financial reporting and the preparation of financial statements for external purposes in accordance with generally accepted accounting principles and includes those policies and procedures that:
| • | Pertain to the maintenance of records that in reasonable detail accurately and fairly reflect the transactions and dispositions of our assets; |
| • | Provide reasonable assurance that transactions are recorded as necessary to permit preparation of financial statements in accordance with generally accepted accounting principles, and that our receipts and expenditures are being made only in accordance with authorizations of our management and directors; and |
| • | Provide reasonable assurance regarding prevention or timely detection of unauthorized acquisition, use or disposition of our assets that could have a material effect on our financial statements. |
Because of its inherent limitations, internal control over financial reporting may not prevent or detect misstatements. Also, projections of any evaluation of effectiveness to future periods are subject to the risk that controls may become inadequate because of changes in conditions, or that the degree of compliance with the policies or procedures may deteriorate.
Under the supervision and with the participation of management, including our principal executive and financial officers, we assessed our internal control over financial reporting as of December 31, 2014, based on criteria for effective internal control over financial reporting established in Internal Control — Integrated Framework (2013) issued by the Committee of Sponsoring Organizations of the Treadway Commission (COSO).
Based on this assessment, our management concluded that we maintained effective internal control over financial reporting as of December 31, 2014 based on the specified criteria.
77
Table of Contents
The Company’s Independent Registered Public Accounting Firm has issued an attestation report on the Company’s internal control over financial reporting as of December 31, 2014.
Changes in Internal Control Over Financial Reporting
No change in our internal control over financial reporting (as defined in Rule 13a-15(f) and 15d-(f) under the Exchange Act) occurred during the quarter ended December 31, 2014 that has materially affected, or is reasonably likely to materially affect, our internal controls over financial reporting.
78
Table of Contents
REPORT OF INDEPENDENT REGISTERED PUBLIC ACCOUNTING FIRM
To the Stockholders and Board of Directors of
LogMeIn, Inc.
Boston, Massachusetts
We have audited the internal control over financial reporting of LogMeIn, Inc. and subsidiaries (the “Company”) as of December 31, 2014, based on criteria established in Internal Control — Integrated Framework (2013) issued by the Committee of Sponsoring Organizations of the Treadway Commission. The Company’s management is responsible for maintaining effective internal control over financial reporting and for its assessment of the effectiveness of internal control over financial reporting, included in the accompanying Management’s Annual Report on Internal Control over Financial Reporting. Our responsibility is to express an opinion on the Company’s internal control over financial reporting based on our audit.
We conducted our audit in accordance with the standards of the Public Company Accounting Oversight Board (United States). Those standards require that we plan and perform the audit to obtain reasonable assurance about whether effective internal control over financial reporting was maintained in all material respects. Our audit included obtaining an understanding of internal control over financial reporting, assessing the risk that a material weakness exists, testing and evaluating the design and operating effectiveness of internal control based on the assessed risk, and performing such other procedures as we considered necessary in the circumstances. We believe that our audit provides a reasonable basis for our opinion.
A company’s internal control over financial reporting is a process designed by, or under the supervision of, the company’s principal executive and principal financial officers, or persons performing similar functions, and effected by the company’s board of directors, management, and other personnel to provide reasonable assurance regarding the reliability of financial reporting and the preparation of financial statements for external purposes in accordance with generally accepted accounting principles. A company’s internal control over financial reporting includes those policies and procedures that (1) pertain to the maintenance of records that, in reasonable detail, accurately and fairly reflect the transactions and dispositions of the assets of the company; (2) provide reasonable assurance that transactions are recorded as necessary to permit preparation of financial statements in accordance with generally accepted accounting principles, and that receipts and expenditures of the company are being made only in accordance with authorizations of management and directors of the company; and (3) provide reasonable assurance regarding prevention or timely detection of unauthorized acquisition, use, or disposition of the company’s assets that could have a material effect on the financial statements.
Because of the inherent limitations of internal control over financial reporting, including the possibility of collusion or improper management override of controls, material misstatements due to error or fraud may not be prevented or detected on a timely basis. Also, projections of any evaluation of the effectiveness of the internal control over financial reporting to future periods are subject to the risk that the controls may become inadequate because of changes in conditions, or that the degree of compliance with the policies or procedures may deteriorate.
In our opinion, the Company maintained, in all material respects, effective internal control over financial reporting as of December 31, 2014, based on the criteria established in Internal Control — Integrated Framework (2013) issued by the Committee of Sponsoring Organizations of the Treadway Commission.
We have also audited, in accordance with the standards of the Public Company Accounting Oversight Board (United States), the consolidated financial statements as of and for the year ended December 31, 2014 of the Company and our report dated February 20, 2015 expressed an unqualified opinion on those financial statements.
/s/ Deloitte & Touche LLP
Boston, Massachusetts
February 20, 2015
79
Table of Contents
| ITEM 9B. | OTHER INFORMATION |
None.
PART III
| ITEM 10. | DIRECTORS, EXECUTIVE OFFICERS AND CORPORATE GOVERNANCE |
Information required by this item is incorporated by reference from the information in our proxy statement for the 2015 Annual Meeting of Stockholders, which we will file with the Securities and Exchange Commission within 120 days of December 31, 2014.
We have adopted a code of ethics, called the Code of Business Conduct and Ethics, which applies to our officers, including our principal executive, financial and accounting officers, and our directors and employees. We have posted the Code of Business Conduct and Ethics on our website at https://secure.logmein.com/ under the “Investors” section. We intend to make all required disclosures concerning any amendments to, or waivers from, the Code of Business Conduct and Ethics on our website.
| ITEM 11. | EXECUTIVE COMPENSATION |
Information required by this item is incorporated by reference from the information in our proxy statement for the 2015 Annual Meeting of Stockholders, which we will file with the Securities and Exchange Commission within 120 days of December 31, 2014.
| ITEM 12. | SECURITY OWNERSHIP OF CERTAIN BENEFICIAL OWNERS AND MANAGEMENT AND RELATED STOCKHOLDER MATTERS |
Information required by this item is incorporated by reference from the information in our proxy statement for the 2015 Annual Meeting of Stockholders, which we will file with the Securities and Exchange Commission within 120 days of December 31, 2014.
| ITEM 13. | CERTAIN RELATIONSHIPS AND RELATED TRANSACTIONS, AND DIRECTOR INDEPENDENCE |
Information required by this item is incorporated by reference from the information in our proxy statement for the 2015 Annual Meeting of Stockholders, which we will file with the Securities and Exchange Commission within 120 days of December 31, 2014.
| ITEM 14. | PRINCIPAL ACCOUNTING FEES AND SERVICES |
Information required by this item is incorporated by reference from the information in our proxy statement for the 2015 Annual Meeting of Stockholders, which we will file with the Securities and Exchange Commission within 120 days of December 31, 2014.
PART IV
| ITEM 15. | EXHIBITS AND FINANCIAL STATEMENT SCHEDULES |
(a) (1) Financial Statements
See Index to the Consolidated Financial Statements on page 47 of this Annual Report on Form 10-K, which is incorporated into this item by reference.
(a) (2) Financial Statement Schedules
No financial statement schedules have been submitted because they are not required or are not applicable or because the information required is included in the consolidated financial statements or the notes thereto.
(a) (3) Exhibits
See Exhibit Index on page 82 of this Annual Report on Form 10-K, which is incorporated into this item by reference.
80
Table of Contents
Pursuant to the requirements of Section 13 or 15(d) of the Securities Exchange Act of 1934, the registrant has duly caused this report to be signed on its behalf by the undersigned, thereunto duly authorized.
| LOGMEIN, INC. | ||
| By: |
/s/ Michael K. Simon | |
| Michael K. Simon | ||
| Chief Executive Officer | ||
| (Principal Executive Officer) | ||
Date: February 20, 2015
Pursuant to the requirements of the Securities Exchange Act of 1934, this report has been signed below by the following persons on behalf of the registrant and in the capacities and on the dates indicated.
| Signature |
Title |
Date | ||
| /s/ MICHAEL K. SIMON Michael K. Simon |
Chief Executive Officer and Director (Principal Executive Officer) |
February 20, 2015 | ||
| /s/ EDWARD K. HERDIECH Edward K. Herdiech |
Chief Financial Officer (Principal Financial and Accounting Officer) |
February 20, 2015 | ||
| /s/ STEVEN J. BENSON Steven J. Benson |
Director | February 20, 2015 | ||
| /s/ STEVEN G. CHAMBERS Steven G. Chambers |
Director | February 20, 2015 | ||
| /s/ MICHAEL J. CHRISTENSON Michael J. Christenson |
Director | February 20, 2015 | ||
| /s/ EDWIN J. GILLIS Edwin J. Gillis |
Director | February 20, 2015 | ||
| /s/ GREGORY W. HUGHES Gregory W. Hughes |
Director | February 20, 2015 | ||
| /s/ MARILYN MATZ Marilyn Matz |
Director | February 20, 2015 | ||
| /s/ IRFAN SALIM Irfan Salim |
Director | February 20, 2015 | ||
81
Table of Contents
EXHIBIT INDEX
| Exhibit |
Description | |
| 3.1(1) | Restated Certificate of Incorporation of the Registrant | |
| 3.2(2) | Second Amended and Restated Bylaws of the Registrant | |
| 4.1(1) | Specimen Certificate evidencing shares of common stock | |
| 10.1(1) | 2004 Equity Incentive Plan, as amended | |
| 10.2(1) | Form of Incentive Stock Option Agreement under the 2004 Equity Incentive Plan | |
| 10.3(1) | Form of Nonstatutory Stock Option Agreement under the 2004 Equity Incentive Plan | |
| 10.4(1) | 2007 Stock Incentive Plan | |
| 10.5(1) | Form of Incentive Stock Option Agreement under the 2007 Stock Incentive Plan | |
| 10.6(1) | Form of Nonstatutory Stock Option Agreement under the 2007 Stock Incentive Plan | |
| 10.7(1) | Form of Restricted Stock Agreement under the 2007 Stock Incentive Plan | |
| 10.8(1) | Indemnification Agreement, dated as of July 23, 2008, between the Registrant and Steven Benson | |
| 10.9(1) | Indemnification Agreement, dated as of July 23, 2008, between the Registrant and Edwin Gillis | |
| 10.10(1) | Indemnification Agreement, dated as of July 23, 2008, between the Registrant and Irfan Salim | |
| 10.11(1) | Indemnification Agreement, dated as of July 23, 2008, between the Registrant and Michael Simon | |
| 10.12(3) | Indemnification Agreement, dated as of August 10, 2010, between the Registrant and Michael Christenson | |
| 10.13(3) | Indemnification Agreement, dated as of January19, 2011, between the Registrant and Greg Hughes | |
| 10.14(9) | Indemnification Agreement, dated as of August 26, 2014, between the Registrant and Steven G. Chambers | |
| 10.15(9) | Indemnification Agreement, dated as of August 27, 2014, between the Registrant and Marilyn Matz | |
| 10.16(3) | Form of Director Indemnification Agreement | |
| 10.17(4) | Lease Agreement, dated April 11, 2012, between Lincoln Summer Street Venture, LLC and the Registrant | |
| 10.18* | Lease Agreement, dated December 19, 2014, between DWF III Synergy, LLC and the Registrant | |
| 10.19(1) | Amended and Restated Letter Agreement, dated as of April 23, 2008, between the Registrant and Michael Simon | |
| 10.20(1) | Form of Management Incentive Stock Option Agreement under the 2009 Stock Incentive Plan | |
| 10.21(1) | Form of Management Nonstatutory Stock Option Agreement under the 2009 Stock Incentive Plan | |
| 10.22(1) | Form of Director Nonstatutory Stock Option Agreement under the 2009 Stock Incentive Plan | |
| 10.23(1) | Form of Employment Offer Letter | |
| 10.24(8) | Amended and Restated 2009 Stock Incentive Plan | |
| 10.25(5) | Form of Restricted Stock Unit Agreement under the 2009 Stock Incentive Plan | |
| 10.26(6) | Form of Director Restricted Stock Unit Agreement under the 2009 Stock Incentive Plan | |
| 10.27(7) | Form of Restricted Stock Unit Agreement (Performance-based Vesting) under the 2009 Stock Incentive Plan | |
82
Table of Contents
| Exhibit |
Description | |
| 21.1* | Subsidiaries of the Registrant | |
| 23.1* | Consent of Independent Registered Public Accounting Firm | |
| 23.2* | Consent of Shields & Company, Inc. | |
| 31.1* | Certification of Chief Executive Officer pursuant to Section 302 of the Sarbanes-Oxley Act of 2002 | |
| 31.2* | Certification of Chief Financial Officer pursuant to Section 302 of the Sarbanes-Oxley Act of 2002 | |
| 32.1* | Certification of the Chief Executive Officer pursuant to Section 906 of the Sarbanes-Oxley Act of 2002 | |
| 32.2* | Certification of the Chief Financial Officer pursuant to Section 906 of the Sarbanes-Oxley Act of 2002 | |
| 101 | The following materials from LogMeIn, Inc.’s Annual Report on Form 10-K for the year ended December 31, 2014, formatted in XBRL (Extensible Business Reporting Language): (i) the Consolidated Balance Sheets, (ii) the Consolidated Statements of Income, (iii) the Consolidated Statements of Cash Flows, and (iv) Notes to Consolidated Financial Statements | |
| * | Filed herewith. |
| (1) | Incorporated by reference to the Registrant’s Registration Statement on Form S-1, as amended (Reg 333-148620) |
| (2) | Incorporated by reference to the Registrant’s Current Report on Form 8-K dated March 15, 2013 (001-34391) |
| (3) | Incorporated by reference to Registrant’s Form 10-K for the fiscal year ended December 31, 2010 (001-34391) |
| (4) | Incorporated by reference to Registrant’s Form 10-Q for the quarter ended March 31, 2012 (001-34391) |
| (5) | Incorporated by reference to Registrant’s Form 10-Q for the quarter ended June 30, 2012 (001-34391) |
| (6) | Incorporated by reference to Registrant’s Current Report on Form 8-K dated June 24, 2013 (001-34391) |
| (7) | Incorporated by reference to Registrant’s Current Report on Form 8-K dated August 20, 2013 (001-34391) |
| (8) | Incorporated by reference to Registrant’s Current Report on Form 8-K dated May 23, 2014 (001-34391) |
| (9) | Incorporated by reference to Registrant’s Form 10-Q for the quarter ended September 30, 2014 (001-34391) |
83