Attached files
| file | filename |
|---|---|
| EX-21 - EX-21 - THORATEC CORP | a2223085zex-21.htm |
| EX-10.21 - EX-10.21 - THORATEC CORP | a2223085zex-10_21.htm |
| EXCEL - IDEA: XBRL DOCUMENT - THORATEC CORP | Financial_Report.xls |
| EX-31.1 - EX-31.1 - THORATEC CORP | a2223085zex-31_1.htm |
| EX-31.2 - EX-31.2 - THORATEC CORP | a2223085zex-31_2.htm |
| EX-32.2 - EX-32.2 - THORATEC CORP | a2223085zex-32_2.htm |
| EX-32.1 - EX-32.1 - THORATEC CORP | a2223085zex-32_1.htm |
| EX-23.1 - EX-23.1 - THORATEC CORP | a2223085zex-23_1.htm |
Use these links to rapidly review the document
TABLE OF CONTENTS
Item 8. Financial Statements and Supplementary Data
UNITED STATES
SECURITIES AND EXCHANGE COMMISSION
Washington, D.C. 20549
Form 10-K
| (Mark one) | ||
ý |
ANNUAL REPORT UNDER SECTION 13 OR 15(d) OF THE SECURITIES EXCHANGE ACT OF 1934 |
|
For the fiscal year ended January 3, 2015 |
||
o |
TRANSITION REPORT UNDER SECTION 13 OR 15(d) OF THE SECURITIES EXCHANGE ACT OF 1934 |
|
For the transition period from to |
||
Commission file number: 000-49798
Thoratec Corporation
(Exact Name of Registrant as Specified in Its Charter)
| California (State or Other Jurisdiction of Incorporation or Organization) |
94-2340464 (I.R.S. Employer Identification No.) |
|
6035 Stoneridge Drive, Pleasanton, California (Address of Principal Executive Offices) |
94588 (Zip Code) |
Registrant's telephone number, including area code: (925) 847-8600
Securities registered pursuant to Section 12(b) of the Exchange Act:
| Title of Each Class | Name of Each Exchange of which Registered | |
|---|---|---|
| Common Stock, no par value per share | NASDAQ Global Select Market |
Securities registered pursuant to Section 12(g) of the Exchange Act: None
Indicate by a check mark if the registrant is a well-known seasoned issuer, as defined in Rule 405 of the Securities Act. Yes ý No o
Indicate by a check mark if the registrant is not required to file reports pursuant to Section 13 or Section 15(d) of the Exchange Act. Yes o No ý
Indicate by a check mark whether the registrant: (1) has filed all reports required to be filed by Section 13 or 15(d) of the Securities Exchange Act of 1934 during the preceding 12 months (or for such shorter period that the registrant was required to file such reports), and (2) has been subject to such filing requirements for the past 90 days. Yes ý No o
Indicate by check mark whether the registrant has submitted electronically and posted on its corporate Web site, if any, every Interactive Data File required to be submitted and posted pursuant to Rule 405 of Regulation S-T during the preceding 12 months (or for such shorter period that the registrant was required to submit and post such files). Yes ý No o
Indicate by a check mark if disclosure of delinquent filers pursuant to Item 405 of Regulation S-K is not contained herein, and will not be contained, to the best of registrant's knowledge, in definitive proxy or information statements incorporated by reference in Part III of this Form 10-K or any amendment to this Form 10-K o.
Indicate by check mark whether the registrant is a large accelerated filer, an accelerated filer, a non-accelerated filer, or a smaller reporting company. See the definitions of "large accelerated filer," "accelerated filer" and "smaller reporting company" in Rule 12b-2 of the Exchange Act. (Check one):
| Large accelerated filer ý | Accelerated filer o | Non-accelerated filer o (Do not check if a smaller reporting company) |
Smaller Reporting Company o |
Indicate by a check mark whether the registrant is a shell company (as defined in Exchange Act Rule 12(b)-2) Yes o No ý
The aggregate market value of the voting stock held by non-affiliates computed by reference to the last sale reported of such stock on June 28, 2014, the last business day of the Registrant's second fiscal quarter, was $1,705,023.
As of February 6, 2015, the Registrant had 53.7 million shares of common stock outstanding.
DOCUMENTS INCORPORATED BY REFERENCE
Designated portions of Thoratec's definitive proxy statement for its 2015 annual meeting of shareholders are incorporated by reference into Part III of this Form 10-K.
2
Thoratec Corporation ("we," "our," "us," or the "Company") is a world leader in mechanical circulatory support with a product portfolio to treat the full range of clinical needs for advanced heart failure patients. We develop, manufacture and market proprietary medical devices used for circulatory support. Heart failure is a chronic disease that occurs when degeneration of the heart muscle reduces the pumping power of the heart, causing the heart to become too weak to pump blood at a level sufficient to meet the body's demands.
Incorporated in the State of California in 1976, Thoratec Corporation trades on the NASDAQ Global Select Market under the ticker symbol THOR and is headquartered in Pleasanton, California.
Our principal executive offices are located at 6035 Stoneridge Drive, Pleasanton, California, 94588. The telephone number at that address is (925) 847-8600. We make available, free of charge on our website located at www.thoratec.com, our annual report on Form 10-K, quarterly reports on Form 10-Q, current reports on Form 8-K, and any amendments to those reports, as soon as reasonably practicable after filing such reports with the Securities and Exchange Commission. Our code of ethics, corporate governance guidelines, company compliance program, audit committee charter, corporate governance and nominating committee charter, compensation committee charter, and audit committee complaint procedures are also posted on our website and are each available in print to any shareholder upon request by writing to: Thoratec Corporation, Investor Relations, 6035 Stoneridge Drive, Pleasanton, California, 94588. The contents of our website are not incorporated by reference into this report.
We develop, manufacture and market proprietary medical devices used for mechanical circulatory support ("MCS") for the treatment of heart failure ("HF") patients. For chronic circulatory support for HF patients, our primary product lines are our ventricular assist devices ("VADs"): HeartMate II Left Ventricular Assist System ("HeartMate II"), HeartMate III Left Ventricular Assist System ("HeartMate III"), Thoratec Paracorporeal Ventricular Assist Device ("PVAD"), and Thoratec Implantable Ventricular Assist Device ("IVAD"). We refer to HeartMate II and HeartMate III collectively as the "HeartMate product line" and PVAD and IVAD collectively as the "Thoratec product line." For acute circulatory support, our product lines are CentriMag Acute Circulatory System ("CentriMag") and for pediatric patients PediMag/PediVAS Acute Circulatory System ("PediMag/PediVAS"). HeartMate II, PVAD, IVAD, CentriMag and PediMag/PediVAS are approved by the U.S. Food and Drug Administration ("FDA"), and have received Conformité Européene ("CE") Mark approval in Europe.
MCS devices supplement the pumping function of the heart in patients with HF. In most cases, a cannula connects the left ventricle of the heart to a blood pump. Blood flows from the left ventricle to the pump chamber via the cannula, powered by an electric or air driven mechanism that drives the blood through another cannula into the aorta. From the aorta, the blood then circulates throughout the body. Mechanical or tissue valves enable unidirectional flow in some devices. Currently, the power source remains outside the body for all FDA-approved MCS devices. Some of our devices can also provide support for the right side of the heart.
3
HeartMate III, a centrifugal-flow, chronic, left ventricular assist system, is currently in U.S. Investigational Device Exemption ("IDE") and Conformité Européene Mark clinical trials and has not yet been approved for commercial sales. The HeartMate III U.S. clinical trial is a randomized non-inferiority study comparing HeartMate III with HeartMate II and includes a primary endpoint of survival free of device replacement and debilitating stroke. In 2014, the trial began enrollment in a safety phase under conditional approval from the FDA for 30 patients at five sites. Enrollment is planned to broaden to up to 60 sites following full approval from the FDA based on 30-day follow-up data from the initial safety phase. The trial provides that the first 294 randomized patients will be followed for six months to evaluate a short-term indication such as Bridge-to-Transplantation. The first 366 randomized patients will be followed for 24 months to evaluate a long-term indication such as Destination Therapy. The trial also allows for approximately 600 additional randomized patients to be enrolled beyond the pivotal cohort in order to assess secondary endpoints. In 2014, fifty patients were enrolled in the CE Mark trial at ten locations in Europe, Central Asia, Canada and Australia. The CE Mark trial will evaluate patient survival with a six-month follow-up period, which will be reached in May 2015. HeartMate III, which incorporates a fully magnetically levitated technology foundation, is designed to lower adverse event rates through improved hemocompatibility and to enhance the ease of surgical placement through a compact size.
Our product portfolio of commercially approved implantable and external MCS devices is described below.
HeartMate II
HeartMate II is an implantable, electrically powered, continuous flow, left ventricular assist device ("LVAD") consisting of a rotary blood pump designed to provide intermediate and long-term MCS. HeartMate II is designed to improve survival and quality of life for a broad range of advanced HF patients. Significantly smaller than our previous generation device and with only one moving part, HeartMate II is simpler and designed to operate more quietly than pulsatile devices.
HeartMate II received FDA approval in April 2008 for bridge-to-transplantation ("BTT") and received FDA approval for use in HF patients who are not eligible for heart transplantation ("Destination Therapy" or "DT") in January 2010. In November 2005, we completed the required conformity assessment procedure and design dossier reviews to be given authority from our Notified Body to affix the CE Mark to the HeartMate II for marketing in Europe. HeartMate II is the world's most widely used LVAD.
CentriMag
The CentriMag is an extracorporeal circulatory support device that provides hemodynamic stabilization in patients in need of cardiopulmonary support. The CentriMag Pump is electronically driven, centrifugal pump based on bearingless motor technology. CentriMag is cleared by the FDA for use up to six hours in patients requiring short-term extracorporeal circulatory support during cardiac surgery. Additionally, CentriMag is approved under an FDA humanitarian device exemption ("HDE") to be used as a right ventricular assist device for periods of support up to thirty days in patients in cardiogenic shock due to acute right ventricular failure. The device is marketed in Europe to provide support for up to thirty days for both cardiac and respiratory failure.
PediMag/PediVAS
PediMag and PediVAS are identical, extracorporeal full-flow acute surgical support platforms incorporating a polycarbonate pump, based on magnetically levitated bearingless motor technology, designed to provide acute surgical support to pediatric patients. The brand names differ according to indication for use, duration of support, and regulatory approval. PediMag is cleared by the FDA for use, in conjunction with the CentriMag console and motor, for support periods of up to six hours. Outside the U.S., the device is branded as PediVAS. This device has been CE Marked for marketing in Europe to provide support for up to 30 days for both cardiac and respiratory failure.
4
PVAD
PVAD is an external, pulsatile VAD, FDA-approved for BTT and post-cardiotomy myocardial recovery. PVAD is a paracorporeal device that is less invasive than implantable VADs since only the cannula are implanted. The paracorporeal nature of PVAD provides several benefits including shorter implantation times and the ability to use the device in smaller patients.
PVAD is designed for short-to-intermediate duration for post-cardiotomy myocardial recovery following cardiac surgery and BTT. PVAD and IVAD, described below, offer left, right or biventricular support for use for BTT. This characteristic is significant because the vast majority of BTT patients treated with PVAD and IVAD require right as well as left-side ventricular assistance. PVAD and IVAD are also the only devices approved for both BTT and recovery following cardiac surgery. PVAD incorporates our proprietary biomaterial, Thoralon, which has high tissue and blood compatibility and is resistant to blood clots.
PVAD received FDA approval for BTT in December 1995 and for recovery (post-cardiotomy) in May 1998. In June 1998, we completed the required conformity assessment procedure and design dossier reviews to be given authority from our Notified Body to affix the CE Mark to the PVAD, allowing for its commercial sale in Europe.
IVAD
IVAD is an implantable, pulsatile, VAD, FDA-approved for BTT, including home discharge, and post-cardiotomy myocardial recovery and provides left, right or biventricular MCS. IVAD maintains the same blood flow path, valves and blood pumping mechanism as PVAD, but has an outer housing made of a titanium alloy that makes it suitable for implantation.
IVAD received FDA approval for BTT and recovery (post-cardiotomy) in August 2004. In June 2003, we completed the required conformity assessment procedure and design dossier reviews to be given authority from our Notified Body to affix the CE Mark to the IVAD, allowing for its commercial sale in Europe.
We have one operating segment (Cardiovascular group). This segment is organized and operates to develop and manufacture mechanical circulatory products to support the cardiovascular systems of humans and to provide product-related services. Information concerning revenues is set forth in Note 13 in the Notes to Consolidated Financial Statements, contained in this Annual Report on Form 10-K.
Our VAD products primarily serve patients suffering from late-stage HF. HF is a chronic disease that occurs when degeneration of the heart muscle reduces the pumping power of the heart, causing the heart to become too weak to pump blood at a level sufficient to meet the body's demands. The condition can be caused by arterial and valvular diseases or a cardiomyopathy, which is a disease of the heart muscle itself. Other conditions, such as high blood pressure or diabetes, also can lead to HF.
According to estimates by the American Heart Association, 6.6 million people suffer from HF in the U.S. and approximately 600,000 new cases are diagnosed each year. While the number of treatment options for earlier stage HF has increased in recent years, pharmacologic therapies remain the most widely used approach for treatment of HF. These drug therapies include angiotensin-converting enzyme ("ACE") inhibitors, anti-coagulants and beta-blockers, which facilitate blood flow, thin the blood or help the heart work in a more efficient manner. In addition to the use of VADs, other procedures addressing HF include angioplasty, biventricular pacing, valve replacement, bypass and left ventricular reduction surgery.
5
Despite attempts to manage HF through drug therapy, the only curative treatment for late stages of the disease is heart transplantation. The number of donor hearts available each year can meet the needs of only a small number of patients who could benefit from transplantation. The United Network for Organ Sharing reported that approximately 2,200 hearts became available for transplant in the U.S. during the twelve months reported to December 2014, the most recent period for which data is available. At January 31, 2015, approximately 4,000 patients were on the U.S. national transplant waiting list, and we believe a comparable number of patients are currently waiting in Europe. The median wait time for a donor heart is approximately nine months; many patients have to wait as long as two years.
In the U.S., there are currently two FDA-approved indications for the long-term use of VADs in patients with HF: for DT and as a BTT. In addition to the chronic HF markets, MCS devices are also approved for use for acute HF following and during cardiac surgery. All four indications are summarized below.
Destination Therapy
On January 20, 2010, we received approval to market HeartMate II for DT in patients with New York Heart Association Class III B and IV end-stage left ventricular failure who have received optimal medical therapy for at least 45 of the last 60 days, and who are not candidates for cardiac transplantation. In 2012, we completed the FDA-required post-market study of 247 patients who received the HeartMate II for DT. The HeartMate II is the only device that is FDA-approved and commercially marketed in the U.S. for DT support in adults.
The National Institute for Health estimated that the DT application represents a market opportunity of 50,000 to 100,000 patients in the U.S. For these late-stage HF patients, drug therapy is currently the only other treatment available. With drug therapy, the two-year survival rate for these patients is approximately 8%. We believe that the success in transitioning this market from maximum drug therapy to VADs is partially dependent on the development of the market for our HeartMate product line.
Bridge-to-Transplantation
VADs provide additional cardiac support for patients with late-stage HF waiting for a donor heart. Approximately 40% to 50% of the patients on the waiting list for a heart transplant in the U.S. receive a VAD. We believe that the percentage of BTT patients will continue to increase as surgeons' level of comfort with the technology increases, particularly for longer-term support cases. We currently have two devices that are FDA-approved and commercially marketed in the U.S. for BTT support in adults.
Post-Cardiotomy Myocardial Recovery Following Cardiac Surgery
In addition to chronic HF, our devices are also used for patients who suffer from acute cardiac failure after undergoing cardiac surgery. Some patients have difficulty being weaned off heart/lung machines after surgery, a complication that arises in open-heart procedures. Many of these patients ultimately die from HF when the heart, weakened by disease and the additional trauma of surgery, fails to maintain adequate blood circulation. We believe that only a small portion of this market is currently being treated with VADs and that this patient population could benefit substantially from the use of our FDA-approved PVAD and IVAD products.
Cardiac Surgery Support
In addition to the longer term mechanical circulatory support indications, the CentriMag is approved to provide MCS for periods appropriate to cardiopulmonary bypass and for circulatory support when complete cardiopulmonary bypass is not necessary, for example during valvuloplasty, mitral valve reoperation, surgery of the vena cava or aorta, or liver transplants.
6
Our strategy is to maintain and expand our leadership position through execution of the following market and product development initiatives:
- •
- Focus on and partner with leading heart
centers. We have developed long-standing relationships with leading cardiovascular surgeons, heart failure cardiologists and heart
centers worldwide. These relationships are an important part of our growth strategy, particularly for the development and introduction of new products and the pursuit of additional indications for our
existing products. We continue our investment in building these relationships through cardiology education outreach programs. Our Market Development Managers work in partnership with our VAD centers
to increase the awareness of MCS therapy in the cardiology community.
- •
- Clinician education and
outreach. We continue to expand awareness of MCS through education and outreach programs, both at implanting centers and within the
referring cardiology community. We are building upon our existing relationships with cardiac surgeons and heart failure cardiologists in both transplant and open heart centers and using our existing
sales channels to gain acceptance and adoption of our products in the major hospitals that perform open heart surgery. Additionally, we are educating community cardiologists and other potential
referring clinicians about the benefits of MCS through our team of approximately 40 Market Development Managers in the U.S. as well as through clinical symposia, on-line education programs, and
other outreach efforts.
- •
- Center
expansion. We ended 2014 with 396 HeartMate II centers globally, including 180 centers in the U.S. and 216 centers internationally, an
increase of 31 centers during the year. In addition, there are now 136 U.S. centers with Joint Commission certification for reimbursement for DT.
- •
- Geographic
expansion. We are focused on increased worldwide adoption of MCS by developing MCS therapy in important emerging markets through
obtaining regulatory approval, developing centers of excellence, and increasing awareness.
- •
- Patient education and awareness. We also continue to expand awareness and education for patients and their care givers about the benefits of MCS therapy that include improved survival and quality of life.
Expand the utilization of MCS therapy worldwide in patients with advanced heart failure.
Offer a broad range of products. We currently offer the widest range of MCS devices to cover indications for use ranging from acute to long-term support. We believe that the breadth of our product offering represents an important competitive advantage because it allows us to address the various preferences of clinicians, the needs of a wide variety of patients, and the economic requirements of third-party payors. We intend to further broaden our product line through internal development, acquisition and licensing.
Develop and obtain approval for new products and new indications for our products. Our product pipeline includes new technologies to augment the performance and ease of use of the HeartMate II system as well as next-generation pump platforms.
As part of our ongoing evolution of the HeartMate product line, in 2009 we launched our external peripherals, Go Gear, including new batteries, charger and power module. These external peripherals improve quality of life of patients by offering them additional freedom and mobility. We launched sealed inflow and outflow grafts for HeartMate II in 2011, which improved ease of implant. In 2013, we launched the Pocket Controller for the HeartMate II system. The Pocket Controller is designed to be smaller, lighter, and easier to use than previous controllers, and it incorporates a backup battery for enhanced patient safety.
7
We also continue to invest in next-generation pump platforms, including HeartMate III, HeartMate PHP, and DuraHeart II. HeartMate III is a fully magnetically levitated, centrifugal, continuous flow pump. The full magnetic levitation allows for wide blood gaps and pulsatility, which we believe will result in a lower rate of adverse events. We are also developing the HeartMate PHP, which is a catheter based axial flow heart pump for application in an unstable HF patient population. The device features a collapsible elastomeric impeller and nitinol cannula that expand to nearly double its size upon insertion. HeartMate PHP is designed to deliver four to five liters per minute of average blood flow. DuraHeart II is an ultra-compact, full-support, centrifugal flow chronic ventricular assist system that is designed to use a unique technology foundation known as "force balance" suspension. DuraHeart II is designed to use magnetic forces, balanced by hydrodynamic support, to achieve consistent gaps across the operating range of the pump, independent of pump speed.
Increase the cost effectiveness of the therapies that employ our products. While Medicare data indicates the cost of implanting a VAD for Destination Therapy is tracking similarly to that of a heart, liver or other major organ transplant, cost remains a concern for our customers. We work closely with VAD centers to continue to improve patient selection, reduce adverse events, and enhance the efficiency of follow-up care, which we believe will ultimately improve the cost effectiveness of this therapy. We also are expanding our market education and training programs, and will continue to make improvements that enhance the performance and cost effectiveness of our products.
Increase our market presence through strategic alliances, joint ventures and acquisitions. In addition to increasing our presence in heart failure and other cardiovascular disease markets through internal growth, we continue to evaluate strategic alliances, joint ventures, acquisitions and related business development opportunities. For instance, we acquired the intellectual property assets of HeartMate PHP from Getinge AB in 2010, Levitronix Medical in 2011, DuraHeart II from Terumo Corporation in 2013, and Apica Cardiovascular Limited in 2014.
We recruit and train experienced cardiovascular sales specialists who sell our circulatory support systems throughout the world. Our sales force is complemented by direct clinical specialists and market development managers. The clinical specialists conduct clinical educational seminars, assist with VAD implants and resolve clinical questions or issues.
Our sales and marketing initiatives include education seminars, symposia, journal advertisements, and direct consumer marketing, all common initiatives in the cardiovascular device market. We partner with universities, experienced clinicians and opinion leaders to assist with expanding clinical educational needs. Our market development managers work with our leading VAD centers to generate referrals through increasing awareness in the cardiology community regarding MCS. In addition to our direct selling efforts, we have a network of international distributors who cover other geographic markets.
The time from the initial contact with the cardiac surgeon until purchase is generally between nine and eighteen months, due to the expense of the product and common hospital capital equipment acquisition procedures. The introduction of a VAD system in a hospital or other medical facility requires that the surgical and clinical support personnel possess certain product expertise. We provide initial training and "best practice" instruction for these personnel, along with a variety of training materials that accompany the initial delivery of our VAD products, including instructions for use, patient management manuals and assorted videos. We provide clinical support during implants and provide twenty-four hour access to clinically trained personnel. In addition, our health economic team helps customers understand and manage reimbursement from third-party payors. We believe that these VAD-related services are an important part of the value that we provide to hospitals and patients.
8
Competition from medical device companies and medical device divisions of healthcare companies, pharmaceutical companies and gene- and cell-based therapies is intense and is expected to increase. The vast majority of VAD-eligible patients still receive pharmacological treatment instead of a VAD. We therefore continue to expect new competitors both from the pharmacological and the medical device space. Among the medical device competitors are Aachen Innovative Solutions GmbH, AbioMed, Inc., Berlin Heart GmbH, HeartWare International Inc., Jarvik Heart, Inc., Maquet Cardiovascular, LLC (a division of Getinge AB), ReliantHeart, Inc., Sun Medical Technology Research Corporation, SynCardia Systems, Inc., and Terumo Heart, Inc.
We believe that key competitive factors include the relative speed with which we can develop products, complete clinical testing, receive regulatory approvals, achieve market acceptance, provide high-quality, ongoing support, and manufacture and sell commercial quantities of our products.
PATENTS AND PROPRIETARY RIGHTS
We seek to protect our technology and intellectual property rights through obtaining and maintaining patent, trademark, copyright and trade secret protection.
We own, or have exclusive rights to, various U.S. and foreign patents. U.S. patents are typically granted for a term of about 20 years from the date a patent application is filed. The remaining durations on our patents range from less than one year to up to 20 years. The actual protection afforded by a foreign patent, which can vary from country to country, depends upon the type of patent, the scope of its coverage and the availability of legal remedies in the country. In those instances where we have acquired technology from third parties, we have sought to obtain rights to the technology through the acquisition of underlying patents or licenses.
Our patents and patent applications relate to a number of important aspects of our technology. We intend to continue to file additional patent applications both in the U.S. and in foreign jurisdictions to seek protection for our technology.
We have developed technical knowledge that, although non-patentable, we consider significant to our competitive position. It is our policy to enter into confidentiality agreements with each of our employees and consultants prohibiting the disclosure of any confidential information or trade secrets. In addition, these agreements provide that any inventions or discoveries by employees and consultants relating to our business will be assigned to us and become our sole property.
While we believe design, development, clinical performance and regulatory aspects of the medical device business represent the principal barriers to entry, we also recognize that our patents and license rights may make it more difficult for others to market products similar to those we manufacture and market. Despite our patents, license rights and policies with regard to confidential information, trade secrets and inventions, we may be subject to challenges to the validity of our patents, claims that our products allegedly infringe the patent rights of others and the disclosure of our confidential information or trade secrets. These and other related risks are described more fully under the heading "Our inability to protect our proprietary technologies or an infringement of others' patents could harm our competitive position" in the "Risk Factors" section of this Annual Report on Form 10-K.
At this time, we are not a party to any material legal proceedings that relate to patents or proprietary rights.
9
Regulation by governmental authorities in the U.S. and foreign countries is a significant factor in the manufacture and marketing of our current and future products and in our ongoing product research and development activities. All of our proposed products will require regulatory approval prior to commercialization. In particular, medical devices are subject to rigorous clinical testing as a condition of approval by the FDA and by similar authorities in foreign countries.
FDA Regulations
In the U.S., the FDA regulates the design, manufacture, distribution and promotion of medical devices pursuant to the Federal Food, Drug, and Cosmetic Act, as amended ("FDCA"), and its regulations.
Our mechanical circulatory support ("MCS") systems are regulated as medical devices. Unless an exemption applies, each medical device we wish to commercially distribute in the United States will require either prior 510(k) clearance or prior approval of a premarket approval ("PMA") application from the FDA. The FDA classifies medical devices into one of three classes. Devices deemed to pose lower risk are placed in either class I or II, which requires the manufacturer to submit to the FDA a pre-market notification requesting permission for commercial distribution. This process is known as 510(k) clearance. Some low risk devices are exempt from this requirement. Devices deemed by the FDA to pose the greatest risk, such as life-sustaining, life-supporting or implantable devices, or devices deemed not substantially equivalent to a previously cleared 510(k) device are placed in class III, requiring approval of a PMA application.
To market MCS systems similar to those under development, the FDA requires approval of a PMA. A PMA application must be supported by extensive data including, but not limited to, technical information regarding device design and development, preclinical and clinical trials, data and manufacturing and labeling to support the FDA's determination that the device is safe and effective for its intended use. After a PMA application is complete, the FDA begins an in-depth review of the submitted information, which generally takes between one and three years, but may take significantly longer. During this review period, the FDA may request additional information or clarification of information already provided. Also during the review period, an advisory panel of experts from outside the FDA may be convened to review and evaluate the application and provide recommendations to the FDA as to the approvability of the device. In addition, the FDA will conduct a preapproval inspection of the manufacturing facility to ensure compliance with Quality System Regulation, or QSR, which imposes elaborate design, development, testing, control, documentation and other quality assurance procedures in the design and manufacturing process. New PMA applications or PMA application supplements are required for significant modifications to the manufacturing process, labeling and design of a device that is approved through the PMA process. PMA supplements often require submission of the same type of information as a PMA application, except that the supplement is limited to information needed to support any changes from the device covered by the original PMA application, and may not require as extensive clinical data or the convening of an advisory panel.
Under the FDA's requirements, to obtain 510(k) clearance, a manufacturer must submit a premarket notification demonstrating that a newly developed device is "substantially equivalent" to a previously-cleared 510(k) device or a device that was in commercial distribution before May 28, 1976 for which the FDA has not yet called for the submission of PMA applications. The FDA's 510(k) clearance pathway usually takes from three to 12 months from the date the application is completed, but it can take significantly longer and clearance is never assured. Although many 510(k) pre-market notifications are cleared without clinical data, in some cases, the FDA requires significant clinical data to support substantial equivalence. If substantial equivalence cannot be established, or if the FDA determines that the device should be subjected to a more rigorous review, the FDA will require that the manufacturer submit a PMA application that must be approved by the FDA prior to marketing the device in the U.S.
10
A clinical trial is almost always required to support a PMA application and may be required for a 510(k) premarket notification. These trials generally require submission of an application for an Investigational Device Exemption ("IDE"). An IDE application must contain pre-clinical test data supporting the safety of the product for human investigational use, information on manufacturing processes and procedures, proposed clinical protocols and other information. If the IDE application is accepted and approval is obtained from the responsible institutional review boards, human clinical trials may begin. The IDE application must be approved in advance by the FDA for a specified number of subjects, unless the product is deemed a non-significant risk device and eligible for more abbreviated IDE requirements. Clinical trials must be conducted in compliance with FDA regulations and are subject to central registration requirements on www.clinicaltrials.gov (none of the information available at this website is, or should be deemed to be, incorporated by reference into this Annual Report on Form 10-K). The results obtained from these trials, if satisfactory, are accumulated and submitted to the FDA in support of a PMA, a PMA Supplement or a 510(k) premarket notification.
Both a 510(k) premarket notification, if cleared, and a PMA application, if approved, may include significant limitations on the indicated uses for which a product may be marketed. FDA prohibits the promotion of cleared or approved medical devices for uses that are not cleared or approved. In addition, approved devices such as MCS devices may be subject to requirements for post market approval studies which can be lengthy and costly to the manufacturer. Medical device clearances and approvals can be withdrawn for failure to comply with regulatory requirements or the occurrence of unforeseen problems following initial marketing.
Both 510(k) pre-market notifications and PMA applications and supplements are subject to the payment of substantial user fees, paid at the time of submission for FDA review. Most recently, the Food and Drug Administration Safety and Innovation Act (FDASIA), signed into law on July 9, 2012, reauthorized medical device user fees for fiscal years 2013-2017 and enacted several "Medical Device Regulatory Improvements" and miscellaneous reforms which are further intended to clarify and improve medical device regulation both pre- and post-clearance or approval. Our activities require that we make many filings with the FDA that are subject to user fee payments. Although the precise amount of fees that we will incur each year will be dependent upon the specific quantity and nature of our filings, these fees could be a significant amount per year.
In addition, any products distributed pursuant to the above authorizations are subject to continuing regulation by the FDA. Products must be manufactured in registered establishments and must be manufactured in accordance with the QSR. The FDA may at any time inspect our facilities to determine whether we have adequate compliance with FDA regulations, including the QSR. The Medical Device Reporting ("MDR") regulations require that we report to the FDA any incident in which our products may have caused or contributed to a death or serious injury or in which our product malfunctioned and, if the malfunction were to recur, would likely cause or contribute to death or serious injury. Furthermore, we are subject to correction and removal reporting regulations, which require that manufacturers report to the FDA field corrections and product recalls or removals if undertaken to reduce a risk to health posed by the device or to remedy a violation of the FDCA that may present a risk to health. The FDA enforces these requirements by inspection and market surveillance. Failure to comply with applicable regulatory requirements can result in enforcement action by the FDA, which may include any of the following sanctions: untitled letters, warning letters, fines, injunctions, civil penalties, recall, seizure of products, operating restrictions, partial suspension or total shutdown of production, refusing requests for 510(k) clearance or PMA approval, withdrawing 510(k) clearance or PMA approval that has already been granted, and criminal prosecution.
We are also subject to regulation by various state authorities, which may inspect our facilities and manufacturing processes and enforce state regulations. Failure to comply with applicable state regulations may result in seizures, injunctions or other types of enforcement actions.
11
Healthcare Regulation
Our business is subject to extensive federal and state healthcare regulation. This includes the federal Anti-Kickback Statute and similar state anti-kickback laws, the federal False Claims Act, the Physician Payments Sunshine Act and similar state healthcare professional payment transparency laws, the Health Insurance Portability and Accountability Act of 1996 ("HIPAA"), as amended by the Health Information Technology for Economic and Clinical Health ("HITECH") Act of 2009, and similar state laws addressing privacy and security. Although we believe that we have structured our operations to comply with the laws governing our industry, it is possible that non-compliance with existing laws or the adoption of new laws or interpretations of existing laws could adversely affect our financial performance.
Fraud and Abuse Laws
The healthcare industry is subject to extensive federal and state regulation. In particular, the federal Anti-Kickback Statute prohibits persons from knowingly and willfully soliciting, receiving, offering or providing remuneration, directly or indirectly, to induce either the referral of an individual, or the furnishing, recommending or arranging for a good or service, for which payment may be made under a federal healthcare program such as the Medicare and Medicaid programs. The definition of "remuneration" has been broadly interpreted to include anything of value, including for example gifts, discounts, the furnishing of supplies or equipment, credit arrangements, payments of cash, waivers of payments, ownership interests, and providing anything at less than its fair market value.
The Anti-Kickback Statute is broad, and it prohibits many arrangements and practices that are lawful in businesses outside of the healthcare industry. Recognizing that the Anti-Kickback Statute is broad and may technically prohibit many innocuous or beneficial arrangements within the healthcare industry, the U.S. Department of Health and Human Services issued regulations in July of 1991, which are referred to as "safe harbors." These safe harbor regulations set forth certain provisions which, if met in form and substance, will assure healthcare providers and other parties that they will not be prosecuted under the federal Anti-Kickback Statute. Additional safe harbor provisions providing similar protections have been published intermittently since 1991. Our arrangements with physicians, physician practice groups, hospitals and other persons or entities who are in a position to refer may not fully meet the stringent criteria specified in the various safe harbors. Although full compliance with these provisions ensures against prosecution under the federal Anti-Kickback Statute, the failure of a transaction or arrangement to fit within a specific safe harbor does not necessarily mean that the transaction or arrangement is illegal or that prosecution under the federal Anti-Kickback Statute will be pursued. Conduct and business arrangements that do not fully satisfy one of these safe harbor provisions may result in increased scrutiny by government enforcement authorities such as the U.S. Department of Health and Human Services Office of Inspector General ("OIG").
Many states have adopted laws similar to the federal Anti-Kickback Statute. Some of these state prohibitions apply to referral of patients for healthcare services reimbursed by any source, not only the Medicare and Medicaid programs. Although we believe that we have structured our operations to comply with both federal and state anti-kickback laws, any finding of a violation of these laws could subject us to criminal and civil penalties or possible exclusion from federal or state healthcare programs. Such penalties would adversely affect our financial performance and our ability to operate our business.
12
HIPAA created new federal statutes to prevent healthcare fraud and false statements relating to healthcare matters. The healthcare fraud statute prohibits knowingly and willfully executing a scheme to defraud any healthcare benefit program, including private payors. A violation of this statute is a felony and may result in fines, imprisonment or exclusion from government sponsored programs such as the Medicare and Medicaid programs. The false statements statute prohibits knowingly and willfully falsifying, concealing or covering up a material fact or making any materially false, fictitious or fraudulent statement in connection with the delivery of or payment for healthcare benefits, items or services. A violation of this statute is a felony and may result in fines or imprisonment or exclusion from government sponsored programs. Both federal and state government agencies are continuing heightened and coordinated civil and criminal enforcement efforts. As part of announced enforcement agency work plans, the federal government will continue to scrutinize, among other things, the billing practices of hospitals and other providers of healthcare services. The federal government also has increased funding to fight healthcare fraud, and it is coordinating its enforcement efforts among various agencies, such as the U.S. Department of Justice, the OIG and state Medicaid fraud control units. We believe that the healthcare industry will continue to be subject to increased government scrutiny and investigations.
Further, recent health care reform legislation has strengthened these laws. For example, the Patient Protection and Affordable Care Act, as amended by the Health Care and Education Reconciliation Act, collectively, the PPACA, among other things, amends the intent requirement of the federal anti-kickback and criminal health care fraud statutes; a person or entity no longer needs to have actual knowledge of this statute or specific intent to violate it. In addition, the PPACA provides that the government may assert that a claim including items or services resulting from a violation of the federal Anti-Kickback Statute constitutes a false or fraudulent claim for purposes of the false claims statutes. The penalties for violating the Anti-Kickback Statute can be severe. These sanctions include criminal penalties and civil sanctions, including fines, imprisonment and possible exclusion from the Medicare and Medicaid programs.
The Physician Payments Sunshine Act, which was included in the PPACA, also imposes new reporting and disclosure requirements on device and drug manufacturers for any "transfer of value" made or distributed to prescribers and other healthcare providers. In addition, device and drug manufacturers will also be required to report and disclose any investment interests held by physicians and their immediate family members during the preceding calendar year. Failure to submit required information may result in civil monetary penalties of up to an aggregate of $150,000 per year (and up to an aggregate of $1 million per year for "knowing failures"), for all payments, transfers of value or ownership or investment interests not reported in an annual submission. Manufacturers were required to begin data collection on August 1, 2013 and were required to report such data to the Centers for Medicare and Medicaid Services ("CMS") by June 30, 2014 and will be required to report such data to CMS by the 90th day of each subsequent calendar year.
In addition, there has been a recent trend of increased federal and state regulation of payments made to healthcare professionals for marketing. Certain states mandate implementation of compliance programs and/or, tracking and reporting of gifts, compensation and other remuneration to healthcare professionals. The shifting commercial compliance environment and the need to build and maintain robust and expandable systems to comply with different compliance and/or reporting requirements in multiple jurisdictions increase the possibility that a healthcare company may run afoul of one or more of the requirements.
13
Federal False Claims Act
Another trend affecting the healthcare industry is the increased use of the federal False Claims Act and, in particular, actions under the False Claims Act's "whistleblower" provisions. Those provisions allow a private individual to bring actions on behalf of the government alleging that the defendant has defrauded the federal government. After the individual has initiated the lawsuit, the government must decide whether to intervene in the lawsuit and to become the primary prosecutor. If the government declines to join the lawsuit, then the individual may choose to pursue the case alone, in which case the individual's counsel will have primary control over the prosecution, although the government must be kept apprised of the progress of the lawsuit. Whether or not the federal government intervenes in the case, it will receive the majority of any recovery. If the litigation is successful, the individual is entitled to no less than 15%, but no more than 30%, of whatever amount the government recovers. The percentage of the individual's recovery varies, depending on whether the government intervened in the case and other factors. Recently, the number of suits brought against healthcare providers by private individuals has increased dramatically. In addition, various states are considering or have enacted laws modeled after the federal False Claims Act. Under the Deficit Reduction Act of 2005 ("DRA"), states are being encouraged to adopt false claims acts similar to the federal False Claims Act, which establish liability for submission of fraudulent claims to the State Medicaid program and contain whistleblower provisions. Even in instances when a whistleblower action is dismissed with no judgment or settlement, we may incur substantial legal fees and other costs relating to an investigation. Future actions under the False Claims Act may result in significant fines and legal fees, which would adversely affect our financial performance and our ability to operate our business.
Further, on May 20, 2009, President Obama signed into law the Fraud Enforcement and Recovery Act of 2009, which greatly expanded the types of entities and conduct subject to the False Claims Act. We strive to ensure that we comply with all such laws. However, the costs of defending claims under the False Claims Act, as well as sanctions imposed under the Act, could significantly affect our financial performance.
Health Insurance Portability and Accountability Act of 1996
In addition to creating the new federal statutes discussed above, HIPAA also establishes uniform standards governing the conduct of certain electronic healthcare transactions and protecting the security and privacy of individually identifiable health information maintained or transmitted by healthcare providers, health plans and healthcare clearinghouses.
The American Recovery and Reinvestment Act of 2009, commonly referred to as the economic stimulus package, signed into law on February 17, 2009, included the HITECH Act, which dramatically expanded, among other things, (1) the scope of HIPAA to also include direct liability of a "business associate," or an individual or entity who performs functions or activities on behalf of, or provides certain services to, a covered entity that involve access by the business associate to protected health information ('PHI") or a subcontractor that creates, receives, maintains, or transmits PHI on behalf of another business associate, (2) substantive security and privacy obligations, including new federal security breach notification requirements to affected individuals and Department of Health and Human Services and potentially media outlets, (3) restrictions on marketing communications and a prohibition on covered entities or business associates from receiving remuneration in exchange for PHI with limited exceptions, and (4) the civil and criminal penalties that may be imposed for HIPAA violations, increasing the annual cap in penalties from $25,000 to $1.5 million per year. HIPAA and HITECH are enforced by regulations promulgated by the U.S. Department of Health and Human Services, including a final omnibus rule published on January 25, 2013. If we fail to comply with these standards, we could be subject to criminal penalties and civil sanctions. In addition to federal regulations issued under HIPAA and HITECH, some states have enacted privacy and security statutes or regulations that, in some cases, are more stringent than those issued under HIPAA and HITECH. In those cases it may be necessary to modify our operations and procedures to comply with the more stringent state laws, which may entail significant and costly changes for us. If we fail to comply with applicable state laws and regulations, we could be subject to additional sanctions.
14
International Regulations
We are also subject to regulation in each of the foreign countries where our products are sold. These regulations relate to product standards, packaging and labeling requirements, import restrictions, tariff regulations, duties and tax requirements. Many of the regulations applicable to our products in these countries are similar to those of the FDA. The national health or social security organizations of certain countries require our products to be qualified before they can be marketed in those countries.
In order to be positioned for access to European and other international markets, we sought and obtained certification under the International Standards Organization ("ISO") 13485 standards. ISO 13485 is a set of integrated requirements, which when implemented, form the foundation and framework for an effective quality management system. These standards were developed and published by the ISO, a worldwide federation of national bodies, founded in Geneva, Switzerland in 1947. ISO has more than 90 member countries and ISO certification is widely regarded as essential to enter Western European markets. We obtained ISO 13485:2003 Certification from our Notified Body, British Standard Institute (BSI) in February 2006. Since 1998, all companies are required to obtain authority from a Notified Body to affix CE Marks for medical devices sold or distributed in the European Union. With the CE Mark, medical devices can be distributed within the European Union. A prerequisite for obtaining authority to CE Mark products is to achieve full quality system certification in accordance with ISO 13485 and European Directives, such as the Medical Device Directive ("MDD"), and the Active Implantable Medical Device Directive ("AIMD"). These are quality standards and Directives that cover design, production, installation and servicing of medical devices manufactured by us. We have obtained ISO 13485 certification and have completed the required conformity assessment procedure and design dossier reviews from our Notified Body to affix the CE Mark pursuant to the MDD, IVDD or AIMD for all of our devices in commercial distribution, including our VAD systems. We are also certified to be in compliance with the requirements of the Canadian Medical Device Regulations at all Thoratec manufacturing sites, which certification is required to sell medical devices in Canada.
Other Regulations
We are also subject to various international, federal, state and local laws and regulations relating to such matters as safe working conditions, laboratory and manufacturing practices and the use, handling and disposal of hazardous or potentially hazardous substances used in connection with our research and development and manufacturing activities. Specifically, the manufacture of our biomaterials is subject to compliance with federal environmental regulations and by various state and local agencies. Although we believe we are in compliance with these laws and regulations in all material respects, we cannot provide assurance that we will not be required to incur significant costs to comply with these and other laws or regulations in the future.
The Dodd-Frank Wall Street Reform and Consumer Protection Act imposes new disclosure requirements regarding the use of "Conflict Minerals" mined from the Democratic Republic of Congo and adjoining countries in products, whether or not these products are manufactured by third parties. The conflict minerals include tin, tantalum, tungsten and gold, and their derivatives. These new requirements could affect the pricing, sourcing and availability of minerals used in the manufacture of our products. There will be additional costs associated with complying with the disclosure requirements, such as costs related to determining the source of any conflict minerals used in our products. Our supply chain is complex and we may be unable to verify the origins for all metals used in our products. We may also encounter challenges with our customers and shareholders if we are unable to certify that our products are conflict free.
15
In addition, compliance with complex international and U.S. laws and regulations that apply to our international operations increases our cost of doing business. These numerous and sometimes conflicting laws and regulations include, among others, the Foreign Corrupt Practices Act, the U. K. Bribery Act of 2010, and similar worldwide and local anti-bribery laws in non-U.S. jurisdictions, which generally prohibit companies and their intermediaries from making improper payments to non-U.S. officials for the purpose of obtaining or retaining business. Violations of these laws and regulations could result in fines and penalties, criminal sanctions against us, our officers, or our employees, prohibitions on the conduct of our business and damage to our reputation. Although we have implemented policies and procedures designed to ensure compliance with these laws and regulations as well as training on such policies and procedures, there can be no assurance that our employees, contractors, distributors and agents will not violate our policies.
THIRD-PARTY COVERAGE AND REIMBURSEMENT
Our products are purchased primarily by customers, such as hospitals, who then bill various third party payors for the services provided to the patients. These payors, which include Medicare, Medicaid, private health insurance companies and managed care organizations, reimburse our customers based on established payment formulas that take into account part or all of the cost associated with these devices and the related procedures performed.
CMS, the agency responsible for administering the Medicare program, and a majority of private insurers have approved reimbursement for our FDA-approved MCS products. With approval by the FDA for HeartMate II for DT on January 20, 2010, CMS expanded coverage effective November 9, 2010 to a slightly broader population for treating Destination Therapy in late-stage HF patients. As of January 3, 2015, 136 centers in the U.S. are now Joint Commission certified for Destination Therapy and eligible for reimbursement by Medicare.
The majority of national insurance carriers, including Aetna, Cigna, Humana, United Health Group and UNICARE, as well as the majority of local Blue Cross and Blue Shield plans, now have policies covering the use of ventricular assist devices for FDA-approved indications, including BTT and DT.
Healthcare laws in the U.S. are subject to ongoing changes, including changes to the amount of reimbursement for hospital services and the manner in which such services are paid. Federal legislation in particular can substantially change the way healthcare is financed by both governmental and private insurers and may negatively impact payment rates for our products. For example, the PPACA, which was passed in March 2010, imposes significant new measures and responsibilities on the U.S. pharmaceutical and medical device industries. Among other things, the PPACA establishes annual fees and taxes on manufacturers of certain medical devices, including our devices, and promotes programs that increase the federal government's comparative effectiveness research, which may be used to evaluate the selection of medical services by clinicians and others. PPACA also implements payment system reforms such as a national pilot program on payment bundling to encourage hospitals, physicians and other providers to improve the coordination, quality and efficiency of certain healthcare services through bundled payment models, and creates an independent payment advisory board that will submit recommendations to reduce Medicare spending if projections of such spending exceed a specified growth rate.
16
In addition, other legislative changes have been proposed and adopted in the United States since the PPACA was enacted. The Budget Control Act of 2011, signed into law on August 2, 2011, created measures for spending reductions by Congress. A Joint Select Committee on Deficit Reduction, tasked with recommending a targeted deficit reduction of at least $1.2 trillion for the years 2013 through 2021, was unable to reach required goals, thereby triggering the legislation's automatic reduction to several government programs. This includes aggregate reductions to Medicare payments to providers of 2% per fiscal year, which went into effect on April 1, 2013, and, due to subsequent legislative amendments, will remain in effect through 2024 unless additional Congressional action is taken. On January 2, 2013, President Obama signed into law the American Taxpayer Relief Act of 2012, which, among other things, further reduced Medicare payments to several providers, including hospitals, imaging centers and cancer treatment centers, and increased the statute of limitations period for the government to recover overpayments to providers from three to five years. These new laws may result in additional reductions in Medicare and other health care funding, which could have a material adverse effect on our customers and accordingly, our financial operations.
At any given time, there are a number of legislative, regulatory and other proposals under consideration that could affect our business, both within the U.S. at the federal and state levels and in foreign jurisdictions. We are unable to predict whether any such proposals will become law or in what form, and it remains uncertain how such proposals would affect our business.
VADs are manufactured at our facilities located in Pleasanton, California and Zurich, Switzerland. These facilities are subject to inspection by the FDA and/or European Notified Bodies to assess compliance with applicable regulatory requirements for the manufacture of medical devices, and we have received the ISO 13485 Quality Systems certification. The manufacturing processes consist of utilizing precision components fabricated from a variety of materials and assembling these components into specific configurations governed by the VAD design requirements. During the manufacturing process, the VAD assemblies are rigorously tested to meet rigid operational and quality standards.
The manufacturing process relies on single sources of supply for several of the components used to manufacture VADs. We are working to identify and validate alternate sources of supply for critical components. Where alternate sources are not available, we are working to develop strategic alliances with the supplier and closely manage inventories to assure the ongoing supply of product.
During 2009 and 2010, we expanded the manufacturing facility located in Pleasanton, California. The main focus of the expansion project was to provide adequate manufacturing capacity to meet demand expectations for HeartMate II. As of January 3, 2015, the renovated facility has the necessary capacity to meet the estimated requirements for our VAD products for at least the next four years.
We typically have been able to fill orders from inventory and historically have not had significant backlog orders. With the expanded manufacturing capacity we believe we are in a position to accommodate the increased demand for our products. Total backlog as of the end of fiscal 2014, 2013, and 2012 was not significant.
Our research and development expenses in fiscal years 2014, 2013, and 2012 totaled $105.5 million, $97.4 million, and $87.7 million, respectively. Research and development costs are largely project driven, and fluctuate based on the level of project activity planned and subsequently approved and conducted. The primary components of our research and development costs are employee salaries and benefits, outside consulting, equipment and supplies, and the re-measurement of the contingent consideration from our acquisitions. Projects include advancing the HeartMate II platform, such as efforts to improve the operation and performance of our VAD products and accessories, along with efforts to develop new products, such as the development of the HeartMate III, HeartMate PHP, and DuraHeart II. Research and development costs also include regulatory and clinical costs associated with our compliance with FDA regulations and clinical trials such as the HeartMate II DT pivotal trial completed in 2009 and the ongoing HeartMate III clinical trials which began in 2014.
17
MAJOR CUSTOMERS AND FOREIGN SALES
We sell our products primarily to large hospitals and distributors. No customer accounted for more than 10% of total product sales in fiscal years 2014, 2013, and 2012.
Sales originating outside of the U.S. and U.S. export sales accounted for approximately 21%, 22%, and 19% of our total product sales in 2014, 2013, and 2012, respectively. No individual foreign country accounted for more than 10% of our total product sales in any of the last three fiscal years.
As of January 3, 2015, we had a total of 1,048 employees, consisting of 954 full-time employees and 94 temporary employees. Of our total employees, 945 are employed in the U.S. and 103 are employed outside the U.S. None of our employees is covered by a collective bargaining agreement. We consider relations with our employees to be good.
Our quarterly product sales are influenced by many factors, including new product introductions, acquisitions, divestitures, regulatory approvals, and other factors. Product sales in the third quarter are typically lower than other quarters of the year due to the seasonality of the U.S. and European markets, where summer vacation schedules can result in fewer procedures.
Our businesses face many risks. The risks described below are what we believe to be the material risks facing our company; however, they may not be the only risks we face. Our business operations could also be impaired by other risks of which we are not aware or that we currently believe are immaterial. If any of the events or circumstances described in the following risk factors actually occurs, our business, financial condition or results of operations could suffer, and the trading price of our common stock could decline significantly. Investors should consider the following risks, as well as the other information included in this Annual Report on Form 10-K, and other documents we file from time-to-time with the SEC, such as our quarterly reports on Form 10-Q, our current reports on Form 8-K and any public announcements we make from time to time.
If we fail to obtain clearance or approval from the FDA and from foreign regulatory authorities for our products, we will not be able to market and sell such products in the U.S. and such other countries where clearance or approval has not been obtained, and if we fail to comply with government regulations, including the FDA Quality System Regulation, or if our products experience certain adverse events, the FDA or foreign regulatory authorities may withdraw our marketing clearance or approval or take other enforcement action.
Before we can market new products in the U.S., we must obtain premarket approval or 510(k) clearance from the FDA unless an exemption applies. These processes are lengthy, expensive and uncertain. If the FDA concludes that any of our products does not meet the requirements to obtain clearance under Section 510(k) of the FDCA, then we will be required to obtain a PMA for that product. A PMA application typically requires extensive pre-clinical and clinical trial data.
We may not obtain clearance of a 510(k) premarket notification or approval of a PMA application with respect to any of our products on a timely basis, if at all. If we fail to obtain timely clearance or approval for our products, we will not be able to market and sell them, thereby harming our ability to generate sales. The FDA also may limit the claims that we can make about our products. We also may be required to obtain clearance of a 510(k) notification, a new PMA, or a PMA Supplement from the FDA before we can market products that have already been cleared, but that have since been modified or that we subsequently wish to market for new indications. In the U.S., our currently commercialized products have either received premarket clearance or approval of a PMA.
18
In addition, our medical device products and operations are subject to extensive and ongoing regulation by the FDA pursuant to the FDCA and by various other federal, state and foreign governmental authorities. Government regulations and foreign requirements specific to medical devices are wide ranging and govern, among other things, design, development, manufacture, testing, labeling, storage, marketing, distribution, promotion, record keeping, and approval or clearance. The FDA requires us and certain of our third-party suppliers to adhere to Quality System Regulations ("QSR"), which include production design controls, testing, quality control, and labeling, packaging, sterilization, and storage and documentation procedures. The FDA may at any time inspect our facilities to determine whether we have adequate compliance with the FDA's QSR and other regulatory requirements. Compliance with the QSR for medical devices is difficult and costly. If our facilities or those of our suppliers fail to take satisfactory corrective action in response to an adverse QSR inspection, the FDA could take enforcement action. For example, the FDA has issued and could in the future issue warning letters or other communications to us. If we fail to satisfy or remediate the matters discussed in any such warning letters or communications, the FDA could take further enforcement action, including prohibiting the sale or marketing of the affected product. The FDA also strictly regulates labeling, advertising, promotion, and other activities relating to the marketing of our products. Medical devices may be promoted only for their cleared or approved indications and in accordance with the provisions of the cleared or approved label. It is possible that federal or state enforcement authorities might take action if they consider our promotional or training materials to constitute promotion of an unapproved use, which could result in significant fines or penalties under a variety of statutory authorities, including under the FDCA as well as laws prohibiting false claims for reimbursement.
In addition, the FDA or other regulatory agencies may change their policies, adopt additional regulations or revise existing regulations, or take other actions which may prevent or delay approval or clearance of our products under development or impact our ability to modify our currently approved or cleared products on a timely basis. For example, as part of FDASIA, Congress reauthorized the Medical Device User Fee Amendments with various FDA performance goal commitments and enacted several "Medical Device Regulatory Improvements" and miscellaneous reforms which are further intended to clarify and improve medical device regulation both pre- and post-approval. Moreover, the FDA and Congress continue to propose initiatives that are designed to, among other things, improve the efficiency and transparency of the regulatory review and clearance process and bolster patient safety. It is unclear what, if any, of these proposals will be finalized or enacted. We may be found noncompliant as a result of future changes in, or interpretations of, regulations by the FDA or other regulatory agencies.
Sales of our products outside the U.S. are subject to foreign regulatory requirements that vary from country to country. The time required to obtain approvals from foreign countries may be longer or shorter than that required for FDA approval, and requirements for foreign licensing may differ from FDA requirements. In any event, if we fail to obtain the necessary clearance or approvals to sell any of our products in a foreign country, or if any obtained clearance or approval is revoked or suspended, we will not be able to sell those products there.
The federal, state and foreign laws and regulations regarding the manufacture and sale of our products are subject to future changes, as are administrative interpretations and policies of regulatory agencies. If we fail to comply with applicable federal, state or foreign laws or regulations, we could be subject to enforcement actions. Enforcement actions could include product seizures, recalls, withdrawal of clearances or approvals, and civil and criminal penalties, which in each case would harm our business.
19
If hospitals do not continue to conduct Destination Therapy procedures using our VADs, the market opportunities for our products will be diminished.
The use of certain of our VADs as long-term therapy in patients who are not candidates for heart transplantation (i.e., Destination Therapy patients) was approved by the FDA in 2002, and was approved for coverage and reimbursement by the CMS, the agency responsible for administering the Medicare program, in late 2003. We received FDA approval for the HeartMate II in Destination Therapy on January 20, 2010.
The number of Destination Therapy procedures actually performed depends on many factors, many of which are out of our direct control, including, but not limited to, the following:
- •
- the number of CMS sites approved for Destination Therapy;
- •
- the clinical outcomes of Destination Therapy procedures relative to pharmacological, gene- and cell-based therapies, and other device
based alternatives;
- •
- cardiologists' and referring physicians' education regarding, and their commitment to, Destination Therapy;
- •
- the economics of the Destination Therapy procedure for individual hospitals, which include the costs of the VAD and related pre- and
post- operative procedures and their reimbursement;
- •
- the impact of changes in reimbursement rates on the timing of purchases of VADs for Destination Therapy; and
- •
- the economics for individual hospitals of not conducting a Destination Therapy procedure, including the costs and related reimbursements of long- term hospitalization.
The different outcomes of these and other factors, and their timing, will have a significant impact on our future product sales.
Physicians may not accept or continue to accept our current products and products under development.
The success of our current and future products will require acceptance or continued acceptance by cardiovascular and vascular surgeons, cardiologists and other medical professionals. Such acceptance will depend on clinical results, as well as the results of any post-approval clinical trials that we may conduct, and the conclusion by these professionals that our products are and continue to be safe, cost-effective and acceptable methods of treatment. Even if the safety and efficacy of our future products are established, physicians may elect not to use them for a number of reasons. These reasons could include the high cost of our VAD systems, restrictions on insurance coverage, unfavorable reimbursement from healthcare payors, or use of alternative therapies including pharmacological, gene- and cell-based therapies, and other device based alternatives. Also, economic, psychological, ethical and other concerns may limit general acceptance of our ventricular assist products.
If we fail to compete successfully against our existing or potential competitors, our product sales or operating results may be harmed.
Competition from medical device companies and medical device divisions of healthcare companies, pharmaceutical companies and gene- and cell-based therapies is intense and is expected to increase. The vast majority of VAD- eligible patients still receive pharmacological treatment instead of a VAD. We continue to expect new competitors both from the pharmacological and the medical device space. Among the medical device competitors are Aachen Innovative Solutions GmbH, AbioMed, Inc., Berlin Heart GmbH, HeartWare International Inc., Jarvik Heart, Inc., Maquet Cardiovascular, LLC (a division of Getinge AB), ReliantHeart, Inc., Sun Medical Technology Research Corporation, SynCardia Systems, Inc., and Terumo Heart, Inc.
20
Some of our competitors have substantially greater financial, technical, distribution, marketing and manufacturing resources than we do, while other competitors have different technologies that may achieve broader customer acceptance or better cost structures than our products. Accordingly, our competitors may be able to develop, manufacture and market products more efficiently, at a lower cost and with more market acceptance than we can. In addition, new drugs or other devices may provide additional alternatives to VADs. We expect that the key competitive factors will include the relative speed with which we can:
- •
- develop products;
- •
- complete clinical testing;
- •
- receive regulatory approvals;
- •
- achieve market acceptance;
- •
- achieve favorable clinical results; and
- •
- manufacture and sell commercial quantities of products.
Any of the devices of our competitors currently available, in clinical trials or in development could prove to be, or be perceived by our customers as being, clinically superior, easier to implant, and/or less expensive than current commercialized devices, thereby impacting our market share.
We rely on specialized and single source suppliers for certain components and materials in our products and alternative suppliers may not be available.
We depend on a number of custom designed components and materials supplied by other companies including, in some cases, single source suppliers for components, instruments and materials used in our VAD products. For example, a single source supplier currently manufactures and supplies components used to manufacture the ruby bearings used in the HeartMate II pump. We do not have long-term written agreements with most of our suppliers and receive components from these suppliers on a purchase order basis only. If we need alternative sources for key raw materials or component parts for any reason, such alternative sources may not be available and our inventory may not be sufficient to fill orders before we find alternative suppliers or begin manufacturing these components or materials ourselves. Cessation or interruption of sales of circulatory support products may seriously harm our business, financial condition and results of operations.
Alternative suppliers, if available, may not agree to supply us. In addition, FDA approval may be required before using new suppliers or manufacturing our own components or materials, which can take additional time to procure. Existing suppliers could also become subject to an FDA enforcement action, which could also disrupt our supplies. If alternative suppliers are not available, we may not have the expertise or resources necessary to produce these materials or component parts internally.
Because of the long product development cycle in our business, or because we do not always purchase goods in significant quantities, suppliers may discontinue components upon which we rely before the end of life of our products. In addition, the timing of the discontinuation may not allow us time to develop and obtain FDA approval for a replacement component before we exhaust our inventory of the legacy component.
If suppliers discontinue components on which we rely, we may have to:
- •
- pay premium prices to keep our existing suppliers' production lines open or to obtain alternative suppliers;
- •
- buy substantial inventory to last through the scheduled end of life of our products, or through such time that we expect to have a replacement product developed and approved by the FDA; or
21
- •
- stop shipping the product in which the legacy component is used once our inventory of the discontinued component is exhausted.
Any of these interruptions in the supply of our materials could result in substantial reductions in product sales and increases in our production costs.
We may encounter problems manufacturing our products.
We may encounter difficulties manufacturing products in quantities sufficient to meet demand. If, for instance, the FDA approves or clears a new product or a new indication for an existing product, we may not be able to manufacture such product in the quantities needed to meet the increased commercial demand for such product on a timely basis. In addition, any alterations or modifications to an existing product may result in increased manufacturing lead times for such products. Moreover, we and some of our third-party manufacturers and suppliers are required to comply with the FDA's QSR and the regulations of foreign jurisdictions regarding the manufacturing process for products marketed abroad. Our facilities are subject to periodic and unannounced inspection by U.S. and foreign regulatory agencies to audit compliance with the QSR and comparable foreign regulations. If our facilities or those of our manufacturers or suppliers are found to be in violation of applicable laws and regulations, or if we or our manufacturers or suppliers fail to take satisfactory corrective action in response to an adverse QSR inspection, the regulatory authority could take enforcement action. If we have difficulty manufacturing any of our products, or we or our suppliers fail to comply with applicable regulatory requirements, our ability to produce products in a cost-effective and timely manner will be impaired, our sales may prove lower than would otherwise be the case, and our reputation, business, financial condition and results of operations could be harmed.
Identified quality problems can result in substantial costs and write-downs.
FDA regulations require us to track materials used in the manufacture of our products, so that any problems identified in a finished product can easily be traced back to other finished products containing the defective materials. In some instances, identified quality issues require scrapping or expensive rework of the affected lot(s), not just the tested defective product, and could also require us to stop shipments.
In addition, because some of our products are used in situations where a malfunction can be life threatening, identified material deficiencies or defects in design or manufacture or labeling can result in the recall and replacement, generally free of charge, of substantial amounts of products already implanted or otherwise in the marketplace. Manufacturers may, on their own initiative, initiate actions, including a non-reportable market withdrawal or a reportable product recall, for the purpose of correcting a material deficiency or improving device performance, or for other reasons. Additionally, the FDA and similar foreign governmental authorities have the authority to require the recall of commercialized products. In the case of the FDA, the authority to require a recall must be based on an FDA finding that there is a reasonable probability that the device would cause serious injury or death. A government mandated or voluntary recall by us or one of our distributors could occur as a result of component failures, manufacturing errors, design or labeling defects or other deficiencies and issues. Recalls of any of our products would divert managerial and financial resources and have an adverse effect on our financial condition and results of operations. We may initiate certain voluntary recalls, which can include field safety notices or physical product removal, involving our products in the future. Companies are required to maintain certain records of recalls, even if they are not reportable to the FDA. If we determine that certain of those recalls do not require notification of the FDA, the FDA may disagree with our determinations and require us to report those actions as recalls. A future recall announcement could harm our reputation with customers, negatively affect our sales, and subject us to additional FDA enforcement actions.
22
Moreover, depending on the corrective action we take to redress a product's deficiencies or defects, the FDA may require, or we may decide, that we will need to obtain new approvals or clearances for the device before we may market or distribute the corrected device. Seeking such approvals or clearances may delay our ability to replace the recalled devices in a timely manner. If we do not adequately address problems associated with our devices, we may face additional regulatory enforcement action, including FDA warning letters, product seizure, injunctions, administrative penalties, or civil or criminal fines.
Any identified quality issue can therefore both harm our business reputation and result in substantial costs and write-offs, which in either case could materially harm our business and financial results.
If we fail to successfully introduce new products, our future growth may suffer.
As part of our growth strategy, we intend to develop and introduce a number of new products and product improvements. We also intend to develop new indications for our existing products. If we fail to obtain clearance or approval from the FDA or other foreign governmental authorities and fail to successfully commercialize any of these new products or product improvements or to develop new indications on a timely basis, or if such products, product improvements or indications are not well accepted by the market, our future growth may suffer.
If we are unable to successfully complete the pre-clinical studies or clinical trials necessary to support our PMA applications or PMA supplements, our ability to obtain new approvals will be limited.
Before submitting a PMA application, we must successfully complete pre-clinical studies and clinical trials to demonstrate that the product is safe and effective. Product development, including pre-clinical studies and clinical trials, is a long, expensive and uncertain process and is subject to delays, and failure may occur at any stage. Furthermore, the data obtained from the trial may be inadequate to support approval of a PMA application. The commencement or completion of any of our clinical trials may be delayed or halted, or be inadequate to support approval of a PMA application, for numerous reasons, including, but not limited to, the following:
- •
- the FDA or other regulatory authorities do not approve a clinical trial protocol or a clinical trial, or place a clinical trial on
hold;
- •
- patients do not enroll in clinical trials at the rate we expect;
- •
- patients do not comply with trial protocols;
- •
- patient follow-up is not at the rate we expect;
- •
- patients experience adverse side effects;
- •
- patients die during a clinical trial, even though their death may not be related to our products;
- •
- institutional review boards and third-party clinical investigators delay or reject our trial protocol;
- •
- third-party clinical investigators decline to participate in a trial or do not perform a trial on our anticipated schedule or
consistent with the clinical trial protocol, good clinical practices or other regulatory requirements;
- •
- third-party organizations do not perform data collection and analysis in a timely and accurate manner;
- •
- regulators inspect our clinical trials or manufacturing facilities, which may, among other things, require us to undertake corrective
action or suspend or terminate our clinical trials;
- •
- there are changes in governmental regulations or administrative actions;
23
- •
- the interim or final results of a clinical trial are inconclusive or unfavorable as to safety or efficacy; and
- •
- the FDA concludes that our trial design is inadequate to demonstrate safety and efficacy.
The results of pre-clinical studies do not necessarily predict future clinical trial results, and predecessor clinical trial results may not be repeated in subsequent clinical trials. Additionally, the FDA may disagree with our interpretation of the data from our pre-clinical studies and clinical trials, or may find the clinical trial design, conduct or results inadequate to prove safety or efficacy, and may require us to pursue additional pre-clinical studies or clinical trials, which could further delay the approval of our products. If we are unable to demonstrate the safety and efficacy of our products in our clinical trials, we will be unable to obtain regulatory approval to market our products. The data we collect from our current clinical trials, our pre-clinical studies and other clinical trials may not be sufficient to support FDA approval. Moreover, if the results of any post-market clinical studies are not favorable, our existing clearances or approvals may be impacted.
Our inability to protect our proprietary technologies or an infringement of others' patents could harm our competitive position.
We rely on patents, trade secrets, copyrights, know-how, trademarks, license agreements and contractual provisions to establish our intellectual property rights and protect our products. These legal means, however, afford only limited protection and may not adequately protect our rights. In addition, we cannot assure you that any of our pending patent applications will issue. Governmental intellectual property authorities, in the U.S. and abroad, may deny or significantly narrow claims made under patent applications and the issued patents, if any, may not provide us with commercial protection. We could incur substantial costs in any future litigation to enforce our patents in court. These proceedings could result in adverse decisions as to the validity and/or enforceability of our patents. In addition, the laws of some of the countries in which our products are or may be sold may not protect our products and intellectual property to the same extent as U.S. laws, if at all. We may be unable to protect our rights in trade secrets and unpatented proprietary technology in these countries.
Many aspects of VAD products are not protected by any patents and, in such instances, we generally rely on trade secret protection and contractual provisions to protect our rights to our products and technology.
We seek to protect our trade secrets and unpatented proprietary technology, in part, with confidentiality agreements with our employees and consultants. Although it is our policy to require that all employees and consultants sign such agreements, we cannot assure you that every person who gains or has gained access to such information has done or will do so. Moreover, these agreements may be breached and we may not have an adequate remedy when we learn of such breach, if at all.
Intellectual property litigation is inherently complex and the results uncertain. Our products may be found to infringe prior or future patents owned by others. We may need to pay significant monetary damages and/or acquire patent licenses with royalty payments. Additionally, adverse outcomes in intellectual property trial proceedings could limit our ability to sell current or future products. We could incur substantial costs in defending suits brought against us on such patents or in bringing suits to protect our patents or patents licensed by us against infringement.
Because we depend upon distributors in certain foreign markets, if we lose a distributor or a distributor fails to perform, our operations may be harmed.
With the exception of Canada, Australia, and certain countries in Europe, we sell our Thoratec, HeartMate, and CentriMag product lines in foreign markets through distributors.
24
To the extent we rely on distributors, our success will depend upon the efforts of others, over whom we may have little or no control. Further, contractual, regulatory and legal considerations may make it difficult to terminate an underperforming distributor and to appoint suitable replacements when distributors are terminated or lost, which could harm our product sales, results of operations and reputation in the affected territories.
Our non-U.S. sales present additional risks, which could harm our operations or financial results.
A substantial portion of our total sales occurs outside the U.S. We anticipate that sales outside the U.S. and U.S. export sales will continue to account for a significant percentage of our product sales and we intend to continue to expand our presence in international markets. Non-U.S. sales are subject to a number of additional risks. For example:
- •
- we sell some of our products at lower prices outside the U.S.;
- •
- sales agreements with foreign customers and distributors may be difficult to enforce;
- •
- receivables may be difficult to collect through a foreign country's legal system;
- •
- fluctuations in exchange rates may affect product demand and adversely affect the profitability, in U.S. dollars, of products sold in
foreign markets where payments are made in other currencies;
- •
- foreign customers and distributors may have longer payment cycles;
- •
- foreign countries may impose additional withholding taxes or otherwise tax our foreign income, impose tariffs or adopt other
restrictions on foreign trade;
- •
- U.S. export licenses may be difficult to obtain;
- •
- intellectual property rights may be (and often are) more difficult to enforce in foreign countries;
- •
- terrorist activity or war may interrupt distribution channels or adversely impact our customers or employees; and
- •
- fluctuations in macroeconomic conditions, specifically among emerging markets, could materially impact demand for our products in individual countries.
Any of these events could harm our operations or financial results.
Fluctuations in foreign currency exchange rates could result in declines in our reported sales and earnings.
Because some of our international sales are denominated in currencies other than U.S. dollars, our reported sales and earnings are subject to fluctuations in foreign currency exchange rates. At present, we use forward foreign currency contracts to protect the gains and losses created by the re-measurement of non-functional currency denominated assets and liabilities. However, we do not hedge foreign currency exposures that will arise from future sales. As a result, sales occurring in the future that are denominated in foreign currencies may be translated into U.S. dollars at a less favorable rate than our current exchange rate resulting in reduced revenues and earnings.
The long and variable sales and deployment cycles for our VAD systems may cause our product sales and operating results to vary significantly, which increases the risk of an operating loss for any given fiscal period.
Our VAD systems have lengthy sales cycles and we may incur substantial sales and marketing expenses and expend significant effort without making a sale. Even after making the decision to purchase our VAD systems, our customers often deploy our products slowly. For example, the length of time between initial contact with potential customers and the purchase of our VAD systems is generally between nine and eighteen months. In addition, cardiac centers that buy the majority of our products are usually led by cardiac surgeons who are heavily recruited by competing centers or by centers looking to increase their profiles. When one of these surgeons moves to a new center we sometimes experience a temporary but significant reduction in purchases by the departed center while it replaces its lead surgeon. As a result, it is difficult for us to predict the quarter in which customers may purchase our VAD systems and our product sales and operating results may vary significantly from quarter to quarter, which increases the risk of an operating loss for us for any given quarter.
25
Because our physician and hospital customers depend on third-party reimbursement, if third party payors, including government agencies such as the Centers for Medicare & Medicaid Services, fail to provide appropriate levels of reimbursement for our products, our results of operations will be harmed. Similarly, if third party payors decide to restrict coverage or the ability of hospital customers to treat patients using VAD therapy, our results of operations could also be harmed.
Governmental and other third-party payors are increasingly attempting to contain healthcare costs. Payors are attempting to contain costs by, for example, limiting coverage and the level of reimbursement of new therapeutic products. Payors are also attempting to contain costs, in some cases by refusing to provide any coverage for uses of approved products for disease indications other than those for which the FDA has granted marketing approval.
To date, a majority of private insurers with whom we have been involved, as well as CMS, which is responsible for implementing the Medicare program, have determined to reimburse some or all of the cost associated with the implantation of our VADs, but we cannot predict whether our products or the services performed with the use of our products will continue to be approved for reimbursement in whole or in part. In addition, changes in the healthcare system may affect the reimbursability of future products. If coverage were partially or completely reduced, our revenues and results of operations would be harmed. This uncertainty could delay or prevent adoption by hospitals of our products.
Healthcare laws and regulations may change significantly in the future, which could adversely affect our financial condition and results of operations. We continuously monitor these developments and modify our operations from time to time as the legislative and regulatory environment changes. We are unable to predict whether any current congressional proposals will become law or in what form, whether any additional or similar changes to statutes or regulations (including interpretations) will occur in the future, or what effect any such legislation or regulation, if implemented, would have on our business. The federal government is expected to have increasing involvement in the healthcare industry, and such increasing involvement may adversely affect our financial condition and results of operations. For a more detailed discussion of the various state and federal legislative changes see "Business—Third Party Coverage and Reimbursement."
Complying with federal, state and international laws and regulations is an expensive and time-consuming process, and any failure to comply could result in substantial penalties.
We are directly or indirectly through our customers subject to extensive regulation by both the federal government and the states in which we conduct our business, including the regulation under the federal Anti-Kickback Statute and similar state anti-kickback laws, the federal False Claims Act, HIPAA, HITECH and similar state laws addressing information privacy and security, federal and state healthcare professional payment transparency laws, state corporate practice of medicine and fee splitting prohibitions, state certificate of need laws, the Medicare and Medicaid statutes and regulations, the Medicare Prescription Drug, Improvement and Modernization Act of 2003 and the Foreign Corrupt Practices Act ("FCPA"), among other federal and state regulations. Both federal and state government agencies have heightened and coordinated civil and criminal enforcement efforts as part of numerous ongoing investigations of healthcare companies, as well as their executives and managers. These investigations relate to a wide variety of matters, including referral and billing practices. The OIG and the Department of Justice have, from time-to-time, established national enforcement initiatives that focus on specific billing practices or other suspected areas of abuse. Some of our activities could become the subject of governmental investigations or inquiries.
26
In addition, the Dodd-Frank Wall Street Reform and Consumer Protection Act imposes disclosure requirements regarding the use of "Conflict Minerals" mined from the Democratic Republic of Congo and adjoining countries in products, whether or not these products are manufactured by third parties. The conflict minerals include tin, tantalum, tungsten and gold, and their derivatives. These requirements could affect the pricing, sourcing and availability of minerals used in the manufacture of our products. There are costs associated with complying with the disclosure requirements, such as costs related to determining the source of any conflict minerals used in our products. Our supply chain is complex and we may be unable to verify the origins for all metals used in our products. We may also encounter challenges with our customers and shareholders if we are unable to certify that our products are conflict free.
As a result of our international operations, we are also subject to numerous and sometimes conflicting U.S. and foreign laws and regulations that increase the cost of doing business in each of the foreign countries where our products are sold. These laws and regulations include the FCPA, the U.K. Bribery Act of 2010 and similar worldwide and local anti-bribery laws in non-U.S. jurisdictions, transparency laws and laws addressing information privacy and security. Although, we have implemented policies and procedures designed to ensure compliance with these laws and regulations as well as training on such policies and procedures, there can be no assurance that our employees, contractors, distributors and agents will not violate our policies.
If our operations are found to be in violation of any of the laws and regulations to which we are subject, we may be subject to the applicable penalty associated with the violation, including civil and criminal penalties, damages, fines and the curtailment of our operations. Any penalties, damages, fines or curtailment of our operations, individually or in the aggregate, could adversely affect our ability to operate our business and our financial results. Our risk of being found in violation of these laws and regulations is increased by the fact that many of them have not been fully interpreted by the regulatory authorities or the courts, and their provisions are open to a variety of interpretations. Any action against us for violation of these laws or regulations, even if we successfully defend against it, could cause us to incur significant legal expenses and divert management's attention from the operation of our business. For a more detailed discussion of the various state, federal, and international regulations to which we are subject see "Business—Government Regulations" and "Business—Third Party Coverage and Reimbursement." See also the risks described under the heading "If we fail to comply with federal and state anti-kickback laws, our operations and income may be adversely affected" in this "Risk Factors" section.
We depend on HeartMate II for a significant portion of our revenues.
We derive, and expect to continue to derive, a significant portion of our revenues from sales of our HeartMate II product. While we cannot predict what level of revenues our HeartMate II product will generate, we anticipate that HeartMate II pump sales will continue to account for a significant portion of our revenues in the foreseeable future. Implementation of our strategy depends on continued sales of our HeartMate II product. Sales of our HeartMate II product are subject to the factors described in this "Risk Factors" section, including, but not limited to, the following:
- •
- failure to obtain clearance or approval from the FDA and foreign regulatory authorities or to comply with government regulations, or
the withdrawal of market clearance or approval or the taking of other enforcement actions;
- •
- lack of Destination Therapy procedures conducted by hospitals using our VADs;
- •
- lack of acceptance or continued acceptance by physicians;
- •
- reliance on specialized suppliers for certain components and materials;
- •
- manufacturing problems;
27
- •
- any identified quality problems;
- •
- inability to protect our proprietary technologies or an infringement of others' patents;
- •
- loss of a distributor or distributor failure to perform;
- •
- failure to compete successfully against our existing or potential competitors;
- •
- special risks associated with non-U.S. sales;
- •
- long and variable sales and deployment cycles;
- •
- failure by third party payors to provide appropriate levels of reimbursement;
- •
- failure to comply with federal and state regulations; and
- •
- product liability claims.
The outcomes of these and other factors will have a significant impact on our future HeartMate II product sales and our revenues.
Healthcare legislative reform measures may adversely affect our business and results of operations.
In March 2010, the U.S. President signed the PPACA, which makes changes that are expected to significantly impact the pharmaceutical and medical device industries. We are continuing to evaluate the impact of this legislation on our business as its various provisions are implemented. It may adversely affect the demand for our products and services, and therefore our financial position and results of operations, possibly materially.
Specifically, one of the components of the new law is an excise tax on sales of most medical devices, which include our MCS products that began in 2013. Though there are some exceptions to the excise tax, this excise tax applies to most of our product revenue generated within the U.S. The Congressional Budget Office estimates that the total cost to the medical device industry could exceed $30 billion over ten years. This tax may put increased pressure on medical device manufacturers and purchasers, decrease profits to us, and/or reduce medical procedure volumes, which may adversely affect our business, financial condition and results of operations. Other elements of the PPACA, including comparative effectiveness research, an independent payment advisory board, payment system reforms (including shared savings pilots) and the reporting of certain payments by us to healthcare professionals and hospitals (the "Physician Payment Sunshine Act"), could meaningfully change the way healthcare is developed and delivered, and may materially impact numerous aspects of our business.
Various healthcare reform proposals have also emerged at the state and federal levels, and we are unable to predict which, if any of these proposals will be enacted. We believe that the uncertainty created by healthcare reform in the U.S. has complicated our customers' decision-making process and may impact our MCS business, and we expect that this uncertainty will persist until there is greater clarity on how the PPACA and state and federal proposals will affect healthcare providers. We are unable to predict what effect the ongoing uncertainty surrounding these matters will have on our customers' purchasing decisions. However, an expansion in government's role in the U.S. healthcare industry may adversely affect our business, possibly materially.
28
If we fail to comply with federal and state anti-kickback laws, our operations and income may be adversely affected.
Various federal and state laws govern financial arrangements among healthcare providers. The federal Anti-Kickback Statute prohibits the knowing and willful offer, payment, solicitation or receipt of any form of remuneration in return for, or to induce, the referral of Medicare, Medicaid or other federal healthcare program patients, or in return for, or to induce, the purchase, lease or order of items or services that are covered by Medicare, Medicaid or other federal healthcare programs. Many state laws also prohibit the solicitation, payment or receipt of remuneration in return for, or to induce, the referral of patients in private as well as government programs. Violation of these laws may result in substantial civil or criminal penalties and/or exclusion from participation in federal or state healthcare programs. While we believe that we have structured our operations and our arrangements with providers to comply with the federal and state anti-kickback laws, it is possible that these laws could be interpreted in a manner that could have an adverse effect on our operations.
In addition, under the DRA, states are encouraged to adopt false claims acts, similar to the federal False Claims Act, which establish liability for submission of fraudulent claims to the State Medicaid program and contain qui tam or whistleblower provisions. States enacting such false claims statutes will receive an increased percentage of any recovery from a State Medicaid judgment or settlement.
Adoption of new false claims statutes in states where we operate may impose additional requirements or burdens on us, which could adversely affect our operations and income.
For a more detailed discussion of the various state and federal anti- kickback regulations to which we are subject see "Business—Government Regulations".
Our liabilities expose us to risks that could adversely affect our business, operating results and financial condition.
If we experience a decline in product sales due to any of the factors described in this "Risk Factors" section or otherwise, we could have difficulty paying current and total liabilities. If we are unable to generate sufficient cash flow or otherwise obtain funds necessary to make required payments, or if we fail to comply with the various requirements of our current and total liabilities, we would be in default.
It may be difficult for us to obtain any necessary financing in the future for working capital, capital expenditures, debt service, acquisitions or general corporate purposes, and therefore limit our flexibility in planning for or reacting to changes in our business by reducing funds available for use in our operations. This could make us more vulnerable in the event of a downturn in our business or an increase in interest rates and place us at a possible competitive disadvantage relative to less leveraged competitors and competitors that have better access to capital resources.
Any failure to meet our obligations under our current and long-term liabilities could have a material adverse effect on our business, operating results and financial condition.
Valuation adjustments to goodwill and intangible assets, which represent a significant portion of our total assets, may adversely affect our net income and we may never realize the full value of our intangible assets.
A substantial portion of our assets is comprised of goodwill and intangible assets, recorded as a result of our merger with Thermo Cardiosystems, Inc. in 2001, the acquisition of Levitronix Medical in 2011, the acquisition of DuraHeart II in 2013, and the acquisition of Apica Cardiovascular Limited in 2014. We may not receive the recorded value for our intangible assets if we sell or liquidate our business or assets. The material concentration of intangible assets or goodwill increases the risk of a large charge to earnings if recoverability of these intangible assets or goodwill is impaired, which would have an adverse effect on our net income. For example, in fiscal 2012 we recorded an impairment charge of $50.2 million related to the intangibles assets from our merger with Thermo Cardiosystems, Inc.
29
Product liability claims could damage our reputation and hurt our financial results.
Our business exposes us to an inherent risk of potential product liability claims related to the manufacturing, marketing, and sale of medical devices. We maintain a limited amount of product liability insurance. Our insurance policies generally must be renewed on an annual basis. We may not be able to maintain or increase such insurance on acceptable terms or at reasonable costs, and such insurance may not provide us with adequate coverage against all potential liabilities. A successful claim brought against us in excess, or outside, of our insurance coverage could seriously harm our financial condition and results of operations. Claims against us, regardless of their merit or potential outcome, may also reduce our ability to obtain physician acceptance of our products or expand our business.
The competition for qualified personnel is particularly intense in our industry. If we are unable to retain or hire key personnel, we may not be able to sustain or grow our business.
Our ability to operate successfully and manage our potential future growth depends significantly upon retaining key research, technical, clinical, regulatory, sales, marketing, managerial and financial personnel, and attracting and retaining additional highly qualified personnel in these areas. We face intense competition for such personnel, and we may not be able to attract and retain these individuals. We compete for talent with numerous companies, as well as universities and nonprofit research organizations, throughout all our locations. The loss of key personnel for any reason or our inability to hire and retain additional qualified personnel in the future could prevent us from sustaining or growing our business. Our success will depend in large part on the continued services of our research, managerial and manufacturing personnel. We cannot assure you that we will continue to be able to attract and retain sufficient qualified personnel.
The price of our common stock may fluctuate significantly.
The price of our common stock has been, and is likely to continue to be, volatile, which means that it could decline substantially within a short period of time. For example, our closing stock price ranged from $22.74 to $38.66 during the twelve months ended January 3, 2015. The price of our common stock could fluctuate significantly for many reasons, including but not limited to the following:
- •
- future announcements concerning us or our competitors;
- •
- regulatory developments, including ongoing healthcare reform initiatives, enforcement actions bearing on advertising, marketing or
sales, and disclosure regarding completed ongoing or future clinical trials;
- •
- enforcement actions or civil or criminal investigations or suits by the FDA, SEC, DOJ, OCR, OIG or state or foreign regulatory
authorities;
- •
- reports of adverse events or poor clinical results, including in the form of scientific papers;
- •
- initiation or resolution of product liability claims involving one or more of our devices;
- •
- quarterly variations in operating results, which we have experienced in the past and expect to experience in the future;
- •
- introduction of new products or changes in product pricing policies by us or our competitors;
- •
- acquisition or loss of significant customers, distributors or suppliers;
- •
- reaction to our estimates of business operations, product development or financial performance;
- •
- business acquisitions or divestitures;
- •
- changes in our capital structure, liquidity profile or ability to access capital markets for additional financing;
30
- •
- changes in earnings estimates by analysts;
- •
- changes in third party reimbursement practices;
- •
- announced common stock repurchases;
- •
- charges, amortization and other financial effects relating to our business;
- •
- fluctuations in the economy, world political events or general market conditions; and
- •
- the realization or occurrence of a situation or event described in this Risk Factors section.
In addition, stock markets in general and the market for shares of healthcare stocks in particular, have experienced extreme price and volume fluctuations, including recently as a result of the global financial crisis. These fluctuations can be unrelated to the operating performance of the affected companies. These broad market fluctuations may adversely affect the market price of our common stock. The market price of our common stock could decline below its current price and the market price of our stock may fluctuate significantly in the future. These fluctuations may be unrelated to our performance.
Shareholders often have instituted securities class action litigation after periods of volatility in the market price of a company's securities. Securities class action suits have been filed against us in the past, including most recently in January 2014, resulting in substantial legal fees and our management's attention and resources being diverted from operating our business in order to respond to the litigation.
Global economic, political and market conditions could adversely affect our business and liquidity.
Our operations and performance depend significantly on global economic, political and market conditions. Uncertainty about global economic, political and market conditions poses a risk as consumers and businesses decrease or postpone spending in response to tighter credit, unemployment, negative financial news and/or declines in income or asset values. Renewed concerns about the systemic impact of the recent recession, energy costs, geopolitical issues, the availability and cost of credit, or the global housing and mortgage markets could contribute to increased market volatility and diminished expectations for mature and emerging economies. The cost and availability of credit may be adversely affected by illiquid credit markets and wider credit spreads, potentially leading to a decrease in spending by businesses and consumers alike.
Global economic, political and material conditions could have a material adverse effect on our business and the demand for our products and services. In addition, turbulence in the U.S. and international markets and economies and prolonged declines in spending may adversely affect our liquidity and financial condition, and the liquidity and financial condition of our distributors, customers and suppliers, including ours and their ability to refinance maturing liabilities and access the capital markets to meet liquidity needs.
If we make acquisitions or divestitures, we could encounter difficulties that harm our business.
We may acquire other companies or their products or technologies that we believe to be complementary to our business, such as the purchase of Levitronix Medical in August 2011, DuraHeart II in June 2013, and Apica Cardiovascular Limited in 2014. We may have difficulty integrating the acquired personnel and operations, or developing the products or technologies, and we may not realize the expected benefits of any such acquisition. As with any product or technology still under development, the products or technologies we acquire may never be commercialized. In addition, acquisitions may dilute our earnings per share, disrupt our ongoing business, distract our management and employees and increase our expenses, any of which could harm our business. We may also sell businesses or assets, such as the 2010 sale of our wholly owned subsidiary, International Technidyne Corporation, and we may sell an asset or business for less than its carrying value.
31
We have experienced rapid growth and changes in our business, and our failure to manage this and any future growth could harm our business.
The number of our employees has substantially increased during the past several years. We expect to continue to increase the number of our employees, and our business may suffer if we do not manage and train our new employees effectively. Our product sales may not continue to grow at a rate sufficient to support the costs associated with an increasing number of employees. Any future periods of rapid growth may place significant strains on our managerial, financial and other resources. The rate of any future expansion, in combination with our complex technologies and products, may demand an unusually high level of managerial effectiveness in anticipating, planning, coordinating and meeting our operational needs, as well as the needs of our customers. If we are unable to meet these demands our reputation, revenue and results of operations could be harmed.
Revisions to accounting standards and financial reporting and corporate governance requirements could result in changes to our standard practices and could require a significant expenditure of time, attention and resources, especially by senior management.
We must follow accounting standards and financial reporting and corporate governance requirements and tax laws set by the governing bodies and lawmakers in the U.S. and in other jurisdictions where we do business, as well as NASDAQ. From time to time, these governing bodies and lawmakers implement new and revised rules and laws. These new and revised accounting standards and financial reporting and corporate governance requirements may require changes to our financial statements, the composition of our Board of Directors, the responsibility and manner of operation of various board level committees and the information filed by us with the governing bodies. Our accounting practices that recently have been or may be affected by changes in the accounting principles are as follows:
- •
- accounting for revenue recognition;
- •
- accounting for intangibles—goodwill and other;
- •
- fair value measurement;
- •
- accounting for convertible debt instruments;
- •
- accounting for income taxes;
- •
- accounting for leases; and
- •
- accounting for business combinations.
Implementing changes required by new standards, requirements or laws likely will require a significant expenditure of time, attention and resources. It is impossible to completely predict the impact, if any, on us of future changes to accounting standards and financial reporting and corporate governance requirements.
We use estimates, make judgments and apply certain methods in measuring the progress of our business in determining our financial results and in applying our accounting policies. As these estimates, judgments and methods change, our assessment of the progress of our business and our results of operations could vary.
The methods, estimates and judgments we use in applying our accounting policies have a significant impact on our results of operations. Such methods, estimates and judgments are, by their nature, subject to substantial risks, uncertainties and assumptions, and factors may arise over time that may lead us to change our methods, estimates and judgments. Changes in any of our assumptions may cause variation in our reporting and may adversely affect our reported financial results.
32
The occurrence of a catastrophic disaster or other similar events could cause damage to our facilities and equipment, or those of our suppliers, which would require us to cease or curtail operations.
We are vulnerable to damage from various types of disasters, including earthquakes, fires, terrorist acts, floods, power losses, communications failures and similar events. If any such disaster were to occur, we might not be able to operate our business at our facilities, and because our premises require FDA approval, we could experience significant delays before we could manufacture products from a replacement facility. Our Pleasanton facility is located in an area of frequent seismic activity. In addition, our suppliers and customers also have operations in locations vulnerable to various types of disasters. Any insurance we maintain may not be adequate to cover our losses resulting from disasters or other business interruptions and our emergency response plans may not be effective in preventing or minimizing losses in the future. Therefore, any such catastrophe could seriously harm our business and consolidated results of operations.
We are subject to taxation in a number of jurisdictions and changes to the corporate tax rate and laws of any of these jurisdictions could increase the amount of corporate taxes we have to pay.
We pay taxes principally in the U.S., U.K., Switzerland, Germany and France and these tax jurisdictions have in the past and may in the future make changes to their corporate tax rates and other tax laws, which could increase our future tax obligations.
Unanticipated changes in our tax rates could affect our future results of operations. Our future effective tax rates could be unfavorably affected by changes in tax laws or the interpretation of tax laws, by unanticipated decreases in the percentage of revenue or earnings in states with low statutory tax rates, or by changes in the valuation of our deferred tax assets and liabilities. In addition, we are subject to the continual examination of our income tax returns by the Internal Revenue Service, state tax authorities, and other domestic and foreign tax authorities, primarily related to our intercompany transfer pricing. We regularly assess the likelihood of outcomes resulting from these examinations to determine the adequacy of our income tax expense and our reserves for potential adjustments, including tax credits and other tax benefits that can be challenged under audit by various taxing authorities resulting in potential reduction in the amount of credits or other benefits eventually realized. We believe such estimates to be reasonable; however, there can be no assurance that the final determination of any of these examinations will not have an adverse effect on our operating results and financial position.
Future levels of research and development spending, capital investment, and export sales may impact our entitlement to related tax credits and benefits, which have the effect of lowering our tax rate.
For a more detailed discussion of the additional taxes to which we are subject see "Business—Third Party Coverage and Reimbursement."
Any claims relating to improper handling, storage or disposal of hazardous chemicals and biomaterials could be time consuming and costly to address.
Manufacturing and research and development of our products require the use of hazardous materials, including chemicals and biomaterials. We cannot eliminate the risk of accidental contamination or discharge and any resultant injury from these materials.
We could be subject to both criminal liability and civil damages in the event of an improper or unauthorized release of, or exposure of individuals to, hazardous materials. In addition, claimants may sue us for injury or contamination that results from our use or the use by third parties of these materials, and our liability may exceed our total assets. Compliance with environmental laws and regulations is expensive, and current or future environmental regulations may impair our research, development or production efforts or harm our operating results.
33
Anti-takeover defenses in our governing documents could prevent an acquisition of our company or limit the price that investors might be willing to pay for our common stock.
Our governing documents could make it difficult for another company to acquire control of our company. For example, our Articles of Incorporation allow our Board of Directors to issue, at any time and without shareholder approval, preferred stock with such terms as it may determine. No shares of preferred stock are currently outstanding. However, the rights of holders of any of our preferred stock that may be issued in the future may be superior to the rights of holders of our common stock. This could limit the price that certain potential acquirers would be willing to pay for shares of our common stock and could delay, prevent or allow our Board of Directors to resist an acquisition of our company, even if the proposed transaction was favored by a majority of our independent shareholders.
Disruptions of critical information systems or material breaches in the security of our systems could harm our business, customer relations and financial condition.
We rely in part on information technology to store information, interface with customers, maintain financial accuracy and accurately produce our financial statements. If our information technology systems do not effectively and securely collect, store, process and report relevant data for the operation of our business, whether due to equipment malfunction or constraints, software deficiencies or human error, our ability to effectively plan, forecast and execute our business plan and comply with applicable laws and regulations will be impaired, perhaps materially. Any such impairment could have a material adverse effect on our results of operations, financial condition and the timeliness with which we report our internal and external operating results.
Our business requires us to use and store customer, employee and business partner and, in certain instances patient, personally identifiable information. We are subject to various domestic and international privacy and security regulations, including but not limited to HIPAA. HIPAA mandates, among other things, the adoption of uniform standards for the electronic exchange of information in common healthcare transactions, as well as standards relating to the privacy and security of individually identifiable health information, which require the adoption of administrative, physical and technical safeguards to protect such information. In addition, many states have enacted comparable laws addressing the privacy and security of health information, some of which are more stringent than HIPAA. If we fail to comply with these standards, we could be subject to criminal penalties and civil sanctions.
While we devote significant resources to network security, data encryption and other security measures to protect our systems and data, including our own proprietary information and the confidential and personally identifiable information of our customers, employees, business partners and patients, these security measures cannot provide absolute security. The costs to us to eliminate or alleviate network security problems, bugs, viruses, worms, malicious software programs and security vulnerabilities could be significant, and our efforts to address these problems may not be successful, resulting potentially in the theft, loss, destruction or corruption of information we store electronically, as well as unexpected interruptions, delays or cessation of service, any of which could cause harm to our business operations. Moreover, if a computer security breach or cyber-attack affects our systems or results in the unauthorized release of proprietary or personally identifiable information, our reputation could be materially damaged and our operations could be impaired. We would also be exposed to a risk of loss or litigation and potential liability, which could have a material adverse effect on our business, results of operations and financial condition.
Item 1B. Unresolved Staff Comments
None.
34
We are headquartered in Pleasanton, California, where we own an approximately 66,000 square-foot office building for our corporate offices. We consider our operating properties to be in satisfactory condition and adequate to meet our needs for the next several years without making capital expenditures materially higher than historical levels.
Additionally, we lease the following facilities:
- •
- Approximately 4,700 square feet of office facilities in Gainesville, Florida, expiring in 2019.
- •
- Approximately 8,700 square feet of office and warehouse facilities in the U.K., expiring in 2022.
- •
- Approximately 11,300 square feet of office and research facilities in Rancho Cordova, California, expiring in 2017.
- •
- Approximately 13,500 square feet of research, office, manufacturing, and warehouse facilities in Zurich, Switzerland, expiring in
2019.
- •
- Approximately 13,600 square feet of office and research facilities in Sunnyvale, California, expiring in 2015.
- •
- Approximately 24,400 square feet of warehouse space in San Ramon, California, expiring in 2023.
- •
- Approximately 27,200 square feet of office and research facilities in Ann Arbor, Michigan, expiring in 2017.
- •
- Approximately 30,000 square feet of office and research facilities in Burlington, Massachusetts, expiring in 2024.
- •
- Approximately 30,000 square feet of office and research facilities in Pleasanton, California, expiring in 2022.
- •
- Approximately 39,000 square feet of office and research facilities in Burlington, Massachusetts, expiring in 2024.
- •
- Approximately 62,000 square feet of office, manufacturing, and research facilities in Pleasanton, California, expiring in 2027.
Our Pleasanton (California, U.S.A.) manufacturing facility, San Ramon (California, U.S.A.) warehouse space, and Zurich (Switzerland) manufacturing facility have been inspected, approved, and licensed for the manufacture of medical devices by the FDA and European Notified Body. Additionally, the Pleasanton and San Ramon facilities are subject to inspections, approvals and licensing by the State of California Department of Health Services (Food and Drug Section).
From time to time we are involved in litigation arising out of claims in the normal course of business. Based on the information presently available, management believes that there are no claims or actions pending or threatened against us, the ultimate resolution of which will have a material effect on our financial position, liquidity or results of operations, although the results of litigation are inherently uncertain.
35
On January 24, 2014, we and three of our present and former officers were named as defendants in a complaint filed in the United States District Court for the Northern District of California. The action, entitled Cooper v. Thoratec Corp., Case No. 4:14-cv-00360, is a putative class action brought on behalf of purchasers of our securities between April 29, 2010, and November 27, 2013, inclusive (the "Class Period"), and alleges violations of Section 10(b) of the Securities Exchange Act of 1934 (the "Exchange Act"), and Rule 10b-5 promulgated thereunder, as well as Section 20(a) of the Exchange Act. On April 21, 2014, the Court appointed Bradley Cooper as Lead Plaintiff ("Plaintiff"). On June 20, 2014, Plaintiff filed an amended class action complaint ("Complaint"), adding a former officer of the Company as a defendant. The Complaint alleges that during the Class Period, Defendants made false or misleading statements in various SEC filings, press releases, earnings calls, and healthcare conferences regarding the Company's business and outlook, focusing primarily on Defendants' alleged failure to disclose that the HeartMate II Left Ventricular Assist Device had a purported increased rate of pump thrombosis during the Class Period. Plaintiff seeks unspecified damages, among other relief. Defendants moved to dismiss the Complaint on August 19, 2014. On November 26, 2014, the Court granted Defendants' motion to dismiss the Complaint in its entirety with leave to amend. Plaintiff filed a second amended complaint on January 20, 2015 ("Amended Complaint"). In the Amended Complaint, Plaintiff amended the Class Period from May 11, 2011 to August 6, 2014, inclusive, dropped a former officer of the Company as a defendant, and added Plaintiff Todd Labak, who is intended to replace Mr. Cooper because Mr. Cooper no longer has Thoratec stock purchases within the proposed Class Period, among other changes. Defendants intend to move to dismiss the Amended Complaint by March 23, 2015. Although the results of litigation are inherently uncertain, based on the information currently available, we do not believe the ultimate resolution of this action will have a material effect on our financial position, liquidity or results of operations.
Item 4. Mine Safety Disclosures
Not applicable.
D. Keith Grossman, 54, became our President and Chief Executive Officer in September 2014. Mr. Grossman has served as a director of our Company since February 1996. From December 2011 until its sale to Bayer Healthcare in September 2013, Mr. Grossman served as President and Chief Executive Officer and a director of Conceptus, Inc., a women's health medical device company. From September 2007 to December 2011, Mr. Grossman served as a Managing Director with TPG (Texas Pacific Group), a private equity firm, in their healthcare investment team. From January 1996 until January 2006, Mr. Grossman served as our President and Chief Executive Officer. Prior to joining us, Mr. Grossman was a Division President of Major Pharmaceuticals, Inc., a pharmaceutical distributor, from June 1992 to September 1995, at which time it was sold. From July 1988 to June 1992, Mr. Grossman served as the Vice President of Sales and Marketing for Calcitek, Inc., a manufacturer of implantable medical devices and a division of Sulzermedica (formerly Intermedics, Inc.). Prior to 1988, Mr. Grossman held various other sales and marketing management positions within the McGaw Laboratories Division of American Hospital Supply Corporation. Mr. Grossman serves as a member of the board of directors of ZELTIQ Aesthetics, Inc. and has served as a member of the board of directors of Intuitive Surgical, Inc. within the last five years. Mr. Grossman holds a B.S. in life sciences from Ohio State University and an M.B.A. from Pepperdine University.
36
Taylor C. Harris, 39, Vice President and Chief Financial Officer, joined our Company as Senior Director of Investor Relations and Business Development in February 2010. Mr. Harris was appointed as Vice President and Chief Financial Officer in October 2012. Prior to joining Thoratec, Mr. Harris worked at JPMorgan Chase & Co. for over a decade in several capacities, including as a Vice President in the firm's Healthcare Investment Banking and Equity Research departments. Mr. Harris holds a B.A. in Physics and Economics from the University of North Carolina at Chapel Hill.
Niamh Pellegrini, 48, President, North America, joined our Company as President, North America, in October 2014. Prior to joining Thoratec, Ms. Pellegrini was Vice President, Rhinology with Acclarent, a medical device manufacturer and subsidiary of Johnson & Johnson, from January 2011 until October 2014. Prior to that, Ms. Pellegrini served as Vice President, Venture Investments at Johnson & Johnson Development Corporation from June 2009 to January 2011. From 2000 through 2009, Ms. Pellegrini held various sales and marketing leadership positions at LifeScan, Inc., a medical device manufacturer and subsidiary of Johnson & Johnson. Prior to 2000, Ms. Pellegrini held various management roles with Avocet Medical, Inc. and Johnson & Johnson. Ms. Pellegrini holds a B.S. in Finance and an M.B.A. from Santa Clara University.
David A. Lehman, 54, Senior Vice President, General Counsel and Secretary, joined our Company as Vice President and General Counsel in May 2003. Mr. Lehman was appointed as Secretary in December 2004 and became Senior Vice President in February 2007. Prior to joining us, Mr. Lehman served as Vice President and General Counsel of Brigade Corporation, a provider of business process outsourcing services, from June 2000 to May 2003. From November 1997 to June 2000, Mr. Lehman was Assistant General Counsel at Bio-Rad Laboratories, Inc., a diagnostic and life science products company. Prior to November 1997, Mr. Lehman was in the legal department of Mitsubishi International Corporation, in New York and Tokyo, for more than seven years. Mr. Lehman started his career as an associate attorney at the law firm of Hall, Dickler, Kent, Friedman and Wood. Mr. Lehman has a Bachelor of Arts in political science from the University of California, San Diego, and a Juris Doctor from Cornell University Law School.
Vasant Padmanabhan, Ph.D. 47, Senior Vice President, Technical Operations, joined our Company as Senior Vice President, Technical Operations in June 2014. Prior to joining Thoratec, Dr. Padmanabhan was Vice President, Product Development, Implantable Defibrillator Business at Medtronic, Inc., a medical device manufacturer, from May 2012 until May 2014. Prior to that, Dr. Padmanabhan served as Vice President, Product Development, CRDM Patient Management Development with Medtronic, from July 2007 until May 2012. From January 1996 through July 2007, Dr. Padmanabhan held various research and development positions with Medtronic and its subsidiaries, in both the United States and Europe. Dr. Padmanabhan holds a bachelor's degree in Electronics and Communication Engineering from National Institute of Technology, Trichy, India, and a Ph.D. in Biomedical Engineering from Rutgers University.
37
Item 5. Market for Registrant's Common Equity, Related Stockholder Matters and Issuer Purchases of Equity Securities
Our common stock is traded on the NASDAQ Global Select Market under the symbol "THOR." The following table sets forth, for the periods indicated, the high and low sales price per share of our common stock, as reported by the NASDAQ Global Select Market. As of February 6, 2015 there were 53.7 million shares of our common stock outstanding with approximately 303 holders of record, including multiple beneficial holders at depositories, banks and brokerages listed as a single holder in the "street" name of each respective depository, bank or broker.
| |
High | Low | |||||
|---|---|---|---|---|---|---|---|
Fiscal Year 2014 |
|||||||
First Quarter |
$ | 38.66 | $ | 33.80 | |||
Second Quarter |
$ | 36.14 | $ | 30.89 | |||
Third Quarter |
$ | 35.53 | $ | 22.74 | |||
Fourth Quarter |
$ | 32.91 | $ | 25.49 | |||
Fiscal Year 2013 |
|||||||
First Quarter |
$ | 38.12 | $ | 35.22 | |||
Second Quarter |
$ | 37.64 | $ | 30.09 | |||
Third Quarter |
$ | 37.64 | $ | 30.70 | |||
Fourth Quarter |
$ | 43.30 | $ | 35.85 | |||
We have not declared or paid any dividends on our common stock and we do not anticipate doing so in the foreseeable future.
There were no unregistered sales of our equity securities during the three months ended January 3, 2015.
Information regarding securities authorized for issuance under equity compensation plans is incorporated by reference into the information in Item 12 of this Annual Report on Form 10-K.
38
Stock Price Performance Graph
The graph below compares the cumulative total shareholder return on an investment in our common stock, the NASDAQ Composite Index (U.S. companies only) and the NASDAQ Medical Equipment Index for the five-year period ended January 2, 2015, the last trading day in our 2014 fiscal year.
The graph assumes the value of an investment of $100 in our common stock at January 2, 2010 and each index at December 31, 2009 with the reinvestment of all dividends, if any.
COMPARISON OF 5 YEAR CUMULATIVE TOTAL RETURN*
Among Thoratec Corporation, the NASDAQ Composite Index,
and the NASDAQ Medical Equipment Index
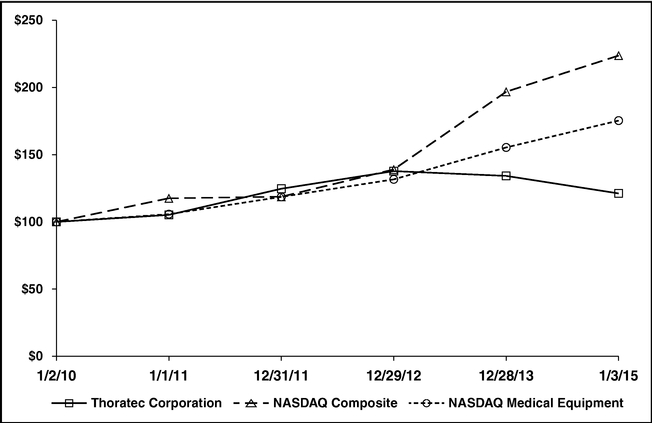
|
||
- *
- $100 invested on January 2, 2010 in stock or December 31, 2009 in index, including reinvestment of dividends. Indexes calculated on a month-end basis.
| |
As of Year-End(1) | ||||||||||||||||||
|---|---|---|---|---|---|---|---|---|---|---|---|---|---|---|---|---|---|---|---|
| |
2009 | 2010 | 2011 | 2012 | 2013 | 2014 | |||||||||||||
Thoratec Corporation |
$ | 100.00 | $ | 105.20 | $ | 124.67 | $ | 137.78 | $ | 134.21 | $ | 121.17 | |||||||
NASDAQ Composite |
$ | 100.00 | $ | 117.61 | $ | 118.70 | $ | 139.00 | $ | 196.83 | $ | 223.74 | |||||||
NASDAQ Medical Equipment |
$ | 100.00 | $ | 105.75 | $ | 118.61 | $ | 131.64 | $ | 155.38 | $ | 175.37 | |||||||
- (1)
- Thoratec Corporation stock prices are reported as of the end of our fiscal year and indices are reported as of the end of the calendar year.
39
Issuer Purchases of Equity Securities
The following table sets forth certain information about our common stock repurchased during the three months ended January 3, 2015:
| |
Total number of shares purchased(1)(2) |
Average price paid per share |
Total number of shares purchased as part of publicly announced plans or programs(2) |
Approximate dollar value of shares that may yet be purchased under the plans or programs(2) |
|||||||||
|---|---|---|---|---|---|---|---|---|---|---|---|---|---|
September 28 - October 31, 2014 |
177,081 | $ | 26.35 | 170,200 | $ | 127.5 million | |||||||
| | | | | | | | | | | | | | |
November 1 - November 30, 2014 |
148,764 | $ | 28.85 | 129,600 | $ | 123.7 million | |||||||
| | | | | | | | | | | | | | |
December 1 - January 3, 2015 |
906,853 | $ | 32.08 | 896,100 | $ | 95.0 million | |||||||
| | | | | | | | | | | | | | |
Total |
1,232,698 | $ | 30.87 | 1,195,900 | $ | 95.0 million | |||||||
| | | | | | | | | | | | | | |
- (1)
- Includes 36,798 shares purchased at an average price of $29.29 that were not part of our publicly announced repurchase programs for the three months ending January 3, 2015. These shares represent the surrender value of restricted stock units used to pay income taxes due upon vesting, and do not reduce the dollar value that may yet be purchased under our publicly announced repurchase programs.
- (2)
- Cumulative amounts through each respective month ending in 2014.
On December 5, 2013, the Board of Directors authorized a new program to repurchase up to $200.0 million of our shares of common stock ("December 2013 program"), which will expire on December 31, 2015. In the three months ended January 3, 2015, we repurchased $37.0 million worth of shares of our common stock under the December 2013 program. As of January 3, 2015, $95.0 million was available for repurchases of shares of our common stock under the December 2013 program. The December 2013 program may be accelerated, suspended, delayed or discontinued at any time.
Item 6. Selected Consolidated Financial Data
The selected consolidated financial data presented below for the five fiscal years ended January 3, 2015 are derived from our audited financial statements. The data set forth below should be read in conjunction with "Management's Discussion and Analysis of Financial Condition and Results of Operations" below and our audited consolidated financial statements and notes thereto appearing elsewhere in this Annual Report on Form 10-K in Item 8.
40
We report on a 52-53 week fiscal year, which ends on the Saturday closest to December 31. Accordingly, our fiscal year contains more or less than 365 days. The fiscal years ended January 1, 2011 ("Fiscal 2010"), December 31, 2011 ("Fiscal 2011"), December 29, 2012 ("Fiscal 2012"), and December 28, 2013 ("Fiscal 2013") all included 52 weeks. The fiscal year ended January 3, 2015 ("Fiscal 2014") included 53 weeks. On November 4, 2010, we sold our wholly owned subsidiary, International Technidyne Corporation ("ITC"). As a result, ITC is presented as discontinued operations in our consolidated financial statements for all applicable periods.
| |
Fiscal Years | |||||||||||||||
|---|---|---|---|---|---|---|---|---|---|---|---|---|---|---|---|---|
| |
2014 | 2013 | 2012 | 2011 | 2010 | |||||||||||
| |
(In thousands, except per share data) |
|||||||||||||||
Statements of Operations Data: |
||||||||||||||||
Continuing Operations(1): |
||||||||||||||||
Product sales |
$ | 477,560 | $ | 502,821 | $ | 491,654 | $ | 422,713 | $ | 382,973 | ||||||
Gross profit(5) |
316,145 | 339,269 | 291,375 | 287,651 | 250,539 | |||||||||||
Net income from continuing operations |
$ | 50,391 | $ | 73,326 | $ | 56,163 | $ | 72,575 | $ | 59,005 | ||||||
Net income per share from continuing operations: |
||||||||||||||||
Basic |
$ | 0.90 | $ | 1.28 | $ | 0.96 | $ | 1.23 | $ | 1.02 | ||||||
Diluted |
$ | 0.89 | $ | 1.26 | $ | 0.94 | $ | 1.20 | $ | 0.99 | ||||||
Discontinued Operations(1): |
||||||||||||||||
Net loss from discontinued operations |
$ | — | $ | — | $ | — | $ | (1,031 | ) | $ | (5,839 | ) | ||||
Net loss per share from discontinued operations: |
||||||||||||||||
Basic |
$ | — | $ | — | $ | — | $ | (0.02 | ) | $ | (0.10 | ) | ||||
Diluted |
$ | — | $ | — | $ | — | $ | (0.01 | ) | $ | (0.10 | ) | ||||
Consolidated Operations: |
||||||||||||||||
Net income |
$ | 50,391 | $ | 73,326 | $ | 56,163 | $ | 71,544 | $ | 53,166 | ||||||
Net income per share: |
||||||||||||||||
Basic |
$ | 0.90 | $ | 1.28 | $ | 0.96 | $ | 1.21 | $ | 0.92 | ||||||
Diluted |
$ | 0.89 | $ | 1.26 | $ | 0.94 | $ | 1.19 | $ | 0.89 | ||||||
Consolidated Balance Sheet Data(1): |
||||||||||||||||
Cash and cash equivalents and short-term available-for-sale investments |
$ | 230,478 | $ | 305,790 | $ | 249,748 | $ | 193,414 | $ | 448,143 | ||||||
Working capital |
323,012 | 391,346 | 328,371 | 294,031 | 403,050 | |||||||||||
Total assets |
763,983 | 791,707 | 698,364 | 680,988 | 837,743 | |||||||||||
Contingent liabilities—current portion(3) |
14,902 | 6,962 | 4,220 | 1,518 | — | |||||||||||
Senior subordinated convertible notes(2) |
— | — | — | — | 138,165 | |||||||||||
Long-term deferred tax liability |
3,592 | 2,224 | 2,780 | 20,429 | 20,109 | |||||||||||
Contingent liabilities—non-current portion(4)(6) |
31,656 | 36,384 | 17,832 | 22,052 | — | |||||||||||
Total shareholders' equity(2) |
$ | 632,797 | $ | 666,673 | $ | 596,743 | $ | 584,450 | $ | 621,360 | ||||||
- (1)
- In fiscal 2010, we completed the sale of ITC and accounted for the transaction as discontinued operations. We have reclassified the results of operations and any losses resulting from the disposition for all applicable periods presented to reflect them as such. Loss from discontinued operations in fiscal 2010 included a loss on disposal of $0.6 million. In fiscal 2011, we recorded a charge of $1.0 million ($1.8 million net loss less tax benefit of $0.8 million) for ITC primarily related to post-close severance payments.
- (2)
- In May 2011, all remaining outstanding senior subordinated convertible notes were redeemed for $164.4 million in cash and issuance of 2,397,535 shares of common stock with an estimated fair value at redemption of $82.7 million. The difference of $105.7 million between the fair value of the aggregate consideration paid of $247.1 million and the face value of $141.4 million was recorded to additional paid-in-capital.
- (3)
- In August 2011, we acquired the medical business of Levitronix LLC ("Levitronix Medical") for an initial purchase consideration of approximately $110 million, plus additional cash earn-out amounts (not to exceed $40 million in aggregate). This earn-out is contingent upon achievement of certain product revenue targets and is payable over the four year period starting on August 3, 2011. At January 3, 2015, the remaining portion of the contingent consideration was $14.9 million and will be settled in fiscal 2015.
41
- (4)
- In June 2013, we acquired certain assets from Terumo Corporation ("Terumo") related to the DuraHeart II Left Ventricular Assist System product line previously under development by Terumo. Under the terms of the acquisition, the initial purchase consideration was $13.0 million and we will be obligated to make potential future milestone payments, based on regulatory approvals and product sales, of up to $43.5 million. At January 3, 2015, the contingent consideration related to these future milestone payments consists of a non-current portion of $5.2 million and no current portion.
- (5)
- Gross profit in 2012 includes an impairment charge of $50.2 million. Refer to Note 6 for additional discussion of the impairment charge in the Notes to Consolidated Financial Statements contained elsewhere in this Annual Report on Form 10-K.
- (6)
- In July 2014, we acquired all of the outstanding equity interests of Apica Cardiovascular Limited ("Apica") and certain related subsidiaries from the former stockholders of Apica (the "Apica Acquisition"). Under the terms of the Apica Acquisition, the initial purchase consideration was approximately $35.1 million (net of acquired cash and inclusive of the settlement of existing debt and Apica's direct acquisition-related transaction costs) and we will be obligated to make potential future milestone payments, based on regulatory approvals and commercial sales, of up to $40.0 million. At January 3, 2015, the contingent consideration related to these future milestone payments consists of a non-current portion of $26.5 million and no current portion.
Item 7. Management's Discussion and Analysis of Financial Condition and Results of Operations
This Annual Report on Form 10-K, including the documents incorporated by reference in this Annual Report, includes forward-looking statements within the meaning of Section 27A of the Securities Act of 1933, as amended, and Section 21E on Form 10-K of the Securities Exchange Act of 1934, as amended. These statements can be identified by the words "expects," "projects," "hopes," "believes," "intends," "should," "estimate," "will," "would," "may," "anticipates," "plans," "could" and other similar words. Actual results, events or performance could differ materially from these forward-looking statements based on a variety of factors, many of which are beyond our control. Therefore, readers are cautioned not to put undue reliance on these statements. Factors that could cause actual results or conditions to differ from those anticipated by these and other forward-looking statements include those more fully described in the "Risk Factors" section of this Annual Report and in other documents we file with the SEC. These forward- looking statements speak only as of the date hereof. We undertake no obligation, except as required by law, to publicly release the results of any revisions to these forward-looking statements that may be made to reflect events or circumstances after the date hereof, or to reflect the occurrence of unanticipated events.
The following presentation of management's discussion and analysis of our financial condition and results of operations should be read together with our consolidated financial statements included elsewhere in this Annual Report on Form 10-K.
Cardiovascular Business
We develop, manufacture and market proprietary medical devices used for mechanical circulatory support ("MCS") for the treatment of heart failure ("HF") patients. For chronic circulatory support for HF patients, our primary product lines are our ventricular assist devices ("VADs"): HeartMate II Left Ventricular Assist System ("HeartMate II"), HeartMate III Left Ventricular Assist System ("HeartMate III"), Thoratec Paracorporeal Ventricular Assist Device ("PVAD"), and Thoratec Implantable Ventricular Assist Device ("IVAD"). We refer to HeartMate II and HeartMate III collectively as the "HeartMate product line" and PVAD and IVAD collectively as the "Thoratec product line." For acute circulatory support, our product lines are CentriMag Acute Circulatory System ("CentriMag") and for pediatric patients PediMag/PediVAS Acute Circulatory System ("PediMag/PediVAS"). HeartMate II, PVAD, IVAD, CentriMag and PediMag/PediVAS are approved by the U.S. Food and Drug Administration ("FDA"), and have received Conformité Européene ("CE") Mark approval in Europe.
42
MCS devices supplement the pumping function of the heart in patients with HF. In most cases, a cannula connects the left ventricle of the heart to a blood pump. Blood flows from the left ventricle to the pump chamber via the cannula, powered by an electric or air driven mechanism that drives the blood through another cannula into the aorta. From the aorta, the blood then circulates throughout the body. Mechanical or tissue valves enable unidirectional flow in some devices. Currently, the power source remains outside the body for all FDA-approved MCS devices. Some of our devices can also provide support for the right side of the heart.
For a discussion of our products, please refer to Part I, Item 1—Business in this Annual Report on Form 10-K.
Critical Accounting Policies and Estimates
We have adopted various accounting policies to prepare the consolidated financial statements in accordance with accounting principles generally accepted in the U.S. ("U.S. GAAP"). The preparation of the consolidated financial statements, in conformity with U.S. GAAP, requires us to make estimates and assumptions that affect the amounts reported in the consolidated financial statements and accompanying notes.
Our estimates and assumptions, including those related to bad debts, inventories, goodwill and intangible assets, long-lived asset impairments, warranty provisions, contingent consideration, income taxes, and share-based compensation, are updated as appropriate, on an on-going basis. We base our estimates on historical experience and on various other assumptions that are believed to be reasonable under the circumstances, the results of which form the basis for making judgments about the carrying values of assets and liabilities that are not readily apparent from other sources. There can be no assurance that actual results will not differ from those estimates and assumptions. We believe the following critical accounting policies affect our more significant judgments and estimates used in the preparation of our consolidated financial statements.
Revenue Recognition
We recognize revenue from product sales to customers when persuasive evidence of an arrangement exists, the product has been delivered or service has been performed, the selling price is fixed or determinable, collection is reasonably assured, and there are no further obligations to customers. Delivery of the product is considered to have occurred generally when shipped. Sales from products are not subject to rights of return and, historically, actual sales returns have not been significant. We sell products through our direct sales force and through distributors. Sales through distributors are recognized as revenue upon sale to the distributor as these sales are considered to be final and no right of return or price protection exists. We recognize sales of certain products to first-time customers when it has been determined that the customer has the ability to use the products.
Reserves for Accounts Receivable, Inventory and Warranty
We maintain allowances for doubtful accounts for estimated losses resulting from the inability of our customers and distributors to pay amounts due. The allowance for doubtful accounts is management's best estimate of the amount of probable credit losses in existing accounts receivable. We determine the allowance based on specific identification and historical write-off experience. Past due balances are reviewed individually for collectability. Account balances are charged off against the allowance when we believe it is probable the receivable will not be recovered.
Estimated excess and obsolete inventory charges are recorded when inventory levels exceed projected sales volume. In determining the excess and obsolete charges, management makes judgments and estimates on matters such as forecasted sales volume. Actual sales volume may differ from forecasted sales volume and such differences may have a material effect on recorded inventory values. Based on management's estimate, adjustments to reduce the cost of inventory to its net realizable value, if required, are made for estimated excess or obsolete inventory.
43
The sales of our products generally include a limited one-year warranty on product quality. Warranty and related costs are accrued for based on our best estimates when management determines that it is probable a charge or liability has been incurred and the amount of loss can be reasonably estimated. While we believe that historical experience provides a reliable basis for estimating such warranty cost, unforeseen quality issues or component failure rates could result in future costs in excess of such estimates, or alternatively, improved quality and reliability in our products could result in actual expenses that are below those currently estimated.
Long-Lived Assets, Intangible Assets and Goodwill
We evaluate the carrying value of long-lived assets, including intangible assets (subject to amortization), whenever events, changes in business circumstances or our planned use of long-lived assets indicate that their carrying amounts may not be fully recoverable or that their useful lives are no longer appropriate. If these facts and circumstances exist, we assess for recovery by comparing the carrying values of long-lived assets with their future undiscounted net cash flows. If the comparison indicates that impairment exists, long-lived assets are written down to their respective fair value based on discounted cash flows. Significant management judgment is required in the forecast of future operating results that are used in the preparation of expected undiscounted cash flows. Product sales from our PVAD and IVAD product lines, collectively known as the Thoratec product line, were $29.5 million and $28.1 million in fiscal 2010 and 2011, respectively, and significantly declined to $19.0 million in fiscal 2012 as a result of recent changes in the market in which these products compete. Accordingly, we assessed for recovery the associated intangible assets with their future undiscounted net cash flows in the fourth quarter of 2012. The comparison resulted in the existence of impairment, and accordingly the intangible assets were written down to the fair value totaling $12.6 million, resulting in an impairment charge of $50.2 million in 2012. Additionally, in the fourth quarter of 2014, as a result of management's decision to discontinue the commercialization of the ASC device included in the Apica acquisition, we recorded an impairment charge of $4.5 million related to the ASC intangible asset. No impairment indicators were present for any other intangible assets in 2014, 2013 and 2012.
We also evaluate the carrying value of intangible assets (not subject to amortization) related to in-process research and development (IPR&D) assets which are considered to be indefinite-lived until the completion or abandonment of the associated research and development projects. Accordingly, amortization of the IPR&D assets will not occur until the product reaches commercialization. During the period the assets are considered indefinite-lived, they will be tested for impairment on an annual basis in the fourth quarter, as well as between annual tests if we become aware of any events occurring or changes in circumstances that would indicate that the fair values of the IPR&D assets are less than their carrying amounts. If and when development is complete, which generally occurs when regulatory approval to market the product is obtained, the associated IPR&D assets would be deemed definite-lived and would then be amortized based on their estimated useful lives at that point in time. If the related project is terminated or abandoned, we may have an impairment related to the IPR&D assets, calculated as the excess of their carrying value over fair value. In the fourth quarter of fiscal 2014, we recorded an impairment charge of $7.7 million related to the IPR&D assets related to the DuraHeart II acquisition.
We test goodwill for impairment on an annual basis in the fourth quarter of each fiscal year or more frequently if we believe indicators of impairment exist. The performance of the test involves a two-step process. The first step requires comparing the fair value of the reporting unit to its net book value, including goodwill. A potential impairment exists if the fair value of the reporting unit is lower than its net book value. The second step of the process is only performed if a potential impairment exists, and it involves comparing the aggregate fair value of the reporting unit's net assets other than goodwill to the fair value of the reporting unit as a whole. Goodwill is considered impaired, and an impairment charge is recorded, if the excess of the fair value of the reporting unit over the fair value of
44
the net assets is less than the carrying value of goodwill. We found no impairment as a result of our fiscal 2014, 2013, and 2012 annual impairment reviews, as the fair value of our reporting unit was in excess of the carrying value.
Contingent Consideration
On August 3, 2011, we acquired 100% of Levitronix Medical for initial purchase consideration of approximately $110.0 million, plus additional cash earn-out amounts (not to exceed $40.0 million in aggregate). The earn out ("Levitronix contingent consideration") is calculated based on 36% of sales from Levitronix Medical in excess of sales of $24.0 million per year over the next four years commencing from the date of acquisition. The fair value of the Levitronix contingent consideration is calculated using the income approach, utilizing various revenue assumptions and applying a probability to each outcome. By applying this method, the estimated undiscounted range of outcomes was from $9.7 million to $37.4 million at the acquisition date. The fair value of the contingent consideration as of the acquisition date was estimated and recorded at $23.6 million. The fair value of the contingent consideration is re-measured at the estimated fair value at each reporting period with the change in fair value recorded in operating expenses on our consolidated statements of operations. Actual amounts paid may differ from the obligations recorded. In 2014 and 2013, we paid $7.0 million and $4.2 million, respectively, of the contingent consideration. As of January 3, 2015, the estimated fair value of the remaining contingent consideration was $14.9 million and will be settled in fiscal 2015.
On June 30, 2013, we acquired certain assets and assumed certain liabilities from Terumo related to the DuraHeart II product line previously under development by Terumo. Under the terms of the acquisition, the initial purchase consideration was $13.0 million and we will be obligated to make potential future milestone payments, based on regulatory approvals and product sales, of up to $43.5 million. The fair value of the DuraHeart II contingent consideration is based on various estimates related to regulatory and commercial sales milestones, including probabilities of success, discount rates and estimated amount of time until the conditions of the milestone payments are met. The key assumptions used to determine the fair value of the DuraHeart II contingent consideration at the acquisition date in connection with the regulatory milestones include a discount rate and probability adjusted milestone payment date ranges. The key assumptions used to determine the fair value of contingent consideration at the acquisition date in connection with the commercial sales milestones include a discount rate and probability-weighted expected milestone payment date ranges, based on the aggregate number of commercial units sold. The fair value of the contingent consideration as of the acquisition date was estimated at $18.8 million. The fair value of the contingent consideration is re-measured at the estimated fair value at each reporting period with the change in fair value recorded in operating expenses on our consolidated statements of operations. Actual amounts paid may differ from the obligations recorded. In 2014 and 2013, no payments were made to Terumo related to the DuraHeart II contingent consideration. As of January 3, 2015, the estimated fair value of the DuraHeart II contingent consideration was $5.2 million. A decrease in DuraHeart II contingent consideration at January 3, 2015 from the acquisition date was a result of changes in estimated probabilities of success and timing of regulatory and commercial milestones. The underlying assumptions utilized in the valuation of the contingent consideration were updated based on management's decision to re-scope the project in the fourth quarter of 2014.
On July 2, 2014, we acquired all of the outstanding equity interests of Apica Cardiovascular Limited ("Apica") and certain related subsidiaries from the former stockholders of Apica (the "Apica Acquisition"). Under the terms of the Apica Acquisition, the initial purchase consideration was $35.1 million (net of acquired cash and inclusive of the settlement of existing debt and Apica's direct acquisition-related transaction costs) and we will be obligated to make potential future milestone payments, based on regulatory approvals and commercial sales, of up to $40.0 million. The fair value of the Apica contingent consideration is based on various estimates related to regulatory and commercial sales milestones, including probabilities of success, discount rates and estimated amount of time until
45
the conditions of the milestone payments are met. The key assumptions used to determine the fair value of the Apica contingent consideration at the acquisition date in connection with the regulatory milestones include a discount rate and probability adjusted milestone payment date ranges. The key assumptions used to determine the fair value of contingent consideration at the acquisition date in connection with the commercial sales milestones include a discount rate and probability-weighted expected milestone payment date ranges, based on the aggregate number of commercial units sold. The fair value of the contingent consideration as of the acquisition date was estimated at $25.7 million. The fair value of the contingent consideration is re-measured at the estimated fair value at each reporting period with the change in fair value recorded in operating expenses on our consolidated statements of operations. Actual amounts paid may differ from the obligations recorded. In 2014, no payments were made related to the contingent consideration. As of January 3, 2015, the estimated fair value of the Apica contingent consideration was $26.5 million.
Income Taxes
As part of the process of preparing the consolidated financial statements, we estimate income taxes in each jurisdiction in which we operate. The determination of our tax provision is subject to judgments and estimates due to the complexity of the tax laws that we are subject to in several tax jurisdictions. This process involves our estimate of our actual current tax exposure together with assessing temporary differences resulting from differing treatment of items, such as depreciation, amortization and inventory reserves for tax and accounting purposes. These differences result in deferred tax assets and liabilities, which are included within our consolidated balance sheets.
We account for income taxes in accordance with the accounting standards for income taxes, which require that deferred tax assets and liabilities be recognized for the effect of temporary differences between the carrying amounts of assets and liabilities for financial reporting purposes and the amounts used for income tax purposes. These accounting standards also require that deferred tax assets be reduced by a valuation allowance if it is more likely than not that some or all of the deferred tax asset will not be realized.
We account for uncertainty in income taxes recognized in the consolidated financial statements based on accounting standards that prescribe a recognition threshold and measurement attribute for the financial statement recognition and measurement of a tax position taken or expected to be taken in a tax return. As a result, we recognize the tax liability for uncertain income tax positions on the income tax return based on the two-step process prescribed in the standards. The first step is to determine whether it is more likely than not that each income tax position would be sustained upon audit. The second step is to estimate and measure the tax benefit as the amount that has a greater than 50% likelihood of being realized upon ultimate settlement with the tax authority. Estimating these amounts requires us to determine the probability of various possible outcomes. We evaluate these uncertain tax positions on a quarterly basis. This evaluation is based on the consideration of several factors, including changes in facts or circumstances, changes in applicable tax law, settlement of issues under audit, and new exposures. If we later determine that the exposure is lower or that the liability is not sufficient to cover our revised expectations, we will adjust the liability and effect a related change in tax provision during the period in which we make such determination.
Valuation of Share-Based Awards
We account for share-based compensation costs in accordance with the accounting standards for share-based compensation, which require that all share-based payments to employees be recognized in the statements of operations based on their fair values. The fair value of each stock option on the date of grant is estimated using the Black-Scholes option-pricing model under the multiple-options approach. We recognize the expense on an accelerated attribution method over the requisite service period.
46
We also issue Performance Share Unit (PSU) representing hypothetical shares of our common stock. Each PSU reflects multiple shares that may be issued to the award recipient, with the number of shares to be issued determined based on performance and market conditions (referred to as either a "Performance Condition PSU" or a "Market Condition PSU"). The fair value of each Performance Condition PSU is based on estimated number of units which will depend on the achievement of the performance target over the performance period. We recognize expense for each Performance Condition PSU when it is probable that the performance condition will be met using the accelerated attribution method over the performance and service period. The fair value of each Market Condition PSU is estimated using a Monte Carlo simulation model applying a multiple-awards approach. We recognize the expense for each Market Condition PSU on an accelerated attribution method over the requisite service period.
The share-based compensation expense recognized in the consolidated statements of operations is based on awards that ultimately are expected to vest; therefore, the amount of expense has been reduced for estimated forfeitures. The accounting standards require forfeitures to be estimated at the time of grant and revised, if necessary, in subsequent periods if actual forfeitures differ from those estimates. Forfeitures were estimated based on historical experience. In addition, expected volatility is based on a combination of historical volatility trends and market-based implied volatility. If actual results differ significantly from these estimates, share-based compensation expense and our results of operations could be materially impacted. In addition, if we employ different assumptions in the application of this accounting standard, the compensation expense that we record in the future periods may differ significantly from what we have recorded in the current period.
Fair Value of Financial Instruments
We measure certain financial assets and liabilities at fair value based on valuation techniques using the best information available, which may include quoted market prices, market comparables and discounted cash flow projections. Financial instruments are primarily comprised of money market funds, certificate of deposits, municipal and corporate bonds, commercial paper, U.S. government agency securities, variable demand notes, asset-backed securities, auction rate securities, forward contracts, certain investments held as assets under the deferred compensation plan, and marketable equity securities.
Cash equivalents and investments: in general, we use quoted prices in active markets for identical assets to determine fair value. If quoted prices in active markets for identical assets are not available to determine fair value, then we use quoted prices for similar assets and liabilities or inputs that are observable either directly or indirectly. If quoted prices for identical or similar assets are not available, we use internally developed valuation models, whose inputs are unobservable data points that are not corroborated by market data.
Derivative Instruments: we hold non-speculative foreign currency forwards to hedge certain foreign currency exposures. We use internally developed valuation models that project future cash flows and discount the future amounts to present value using significant market-based observable inputs including interest rate curves, foreign exchange rates, and forward and spot prices for currencies.
47
Results of Operations
The following table summarizes our consolidated statements of operations for the last three fiscal years with each line item shown as a percentage of total product sales.
| |
Fiscal Years | |||||||||
|---|---|---|---|---|---|---|---|---|---|---|
| |
2014 | 2013 | 2012 | |||||||
Product sales |
100.0 | % | 100.0 | % | 100.0 | % | ||||
Cost of product sales, excluding impairment of PVAD and IVAD intangible assets |
33.8 | 32.5 | 30.5 | |||||||
Impairment of PVAD and IVAD intangible assets |
— | — | 10.2 | |||||||
| | | | | | | | | | | |
Gross margin |
66.2 | 67.5 | 59.3 | |||||||
Operating expenses: |
||||||||||
Selling, general and administrative |
29.5 | 28.7 | 26.0 | |||||||
Research and development |
22.1 | 19.4 | 17.9 | |||||||
| | | | | | | | | | | |
Total operating expenses |
51.6 | 48.1 | 43.9 | |||||||
| | | | | | | | | | | |
Income from operations |
14.6 | 19.4 | 15.4 | |||||||
Other income (expense): |
||||||||||
Interest income and other |
(0.4 | ) | 0.5 | 0.3 | ||||||
| | | | | | | | | | | |
Income before taxes |
14.2 | 19.9 | 15.7 | |||||||
Income tax expense |
3.7 | 5.3 | 4.3 | |||||||
| | | | | | | | | | | |
Net income |
10.5 | % | 14.6 | % | 11.4 | % | ||||
| | | | | | | | | | | |
Product Sales
Product sales consisted of the following:
| |
|
|
|
Annual Percentage Change |
||||||||||||
|---|---|---|---|---|---|---|---|---|---|---|---|---|---|---|---|---|
| |
Fiscal Years | |||||||||||||||
| |
2014 vs. 2013 | 2013 vs. 2012 | ||||||||||||||
| |
2014 | 2013 | 2012 | |||||||||||||
| |
(in thousands, except percentages) |
|||||||||||||||
Product sales |
$ | 477,560 | $ | 502,821 | $ | 491,654 | (5.0 | )% | 2.3 | % | ||||||
| | | | | | | | | | | | | | | | | |
| | | | | | | | | | | | | | | | | |
| | | | | | | | | | | | | | | | | |
In 2014 as compared to 2013, product sales decreased by $25.3 million, or 5.0%, driven by decreased sales volume of HeartMate II, which was partially offset by an increase in sales volume of our CentriMag products. HeartMate II contributed $28.4 million to the decrease due primarily to reduced market growth relative to prior periods in conjunction with market share loss to a competitive device, dynamics that may continue to affect our results. The PVAD and IVAD product line declined by $3.3 million. These decreases were partially offset by an increase in sales volume of our CentriMag and PediMag product line of $6.7 million. From a regional perspective, U.S. and international sales declined by $15.3 million and $10.0 million in 2014 as compared to 2013, respectively.
In 2013 as compared to 2012, product sales increased by $11.2 million, or 2.3%. HeartMate II contributed $9.8 million to the increase, while the CentriMag and PediMag product line contributed $7.6 million to the increase. The increase was partially offset by a decline of $6.5 million in sales of the Thoratec product line. Other revenue contributed $0.3 million. From a regional perspective, U.S. sales declined by $10.1 million, while international sales increased by $21.3 million. Sales of HeartMate II in the United States in 2013 experienced pressure due to the recent launch of a competitive device, a dynamic which we anticipate will continue to affect our results. International growth was driven by the launch of HeartMate II in Japan.
Sales originating outside of the U.S. and U.S. export sales accounted for approximately 21.4%, 22.3%, and 18.5% of our total product sales in fiscal 2014, 2013, and 2012, respectively.
48
Gross Profit
| |
Fiscal Years | |||||||||
|---|---|---|---|---|---|---|---|---|---|---|
| |
2014 | 2013 | 2012 | |||||||
| |
(in thousands, except percentages) |
|||||||||
Total gross profit |
$ | 316,145 | $ | 339,269 | $ | 291,375 | ||||
| | | | | | | | | | | |
| | | | | | | | | | | |
| | | | | | | | | | | |
Total gross margin |
66.2 | % | 67.5 | % | 59.3 | % | ||||
| | | | | | | | | | | |
| | | | | | | | | | | |
| | | | | | | | | | | |
In 2014 as compared to 2013, gross margin decreased by approximately 1.3 percentage points due to higher warranty and related reserves and excess and obsolete inventory charges in 2014 and the impairment of the ASC intangible asset as a result of management's decision to discontinue the commercialization of the ASC device.
In 2013 as compared to 2012, gross margin increased by 8.2 percentage points due to the impairment recorded in 2012 related to PVAD and IVAD intangible assets which did not reoccur in 2013, offset by charges comprised of warranty expense and excess and obsolete inventory charges, and the impact of the U.S. medical device excise tax, which we recorded for the first time in 2013. The increase of $9.0 million in the warranty reserve in 2013 as compared to 2012 was primarily due to the volume of warranty-related claims and anticipated future warranty activity associated with sales of the HeartMate II Pocket Controller that was launched in 2013.
Selling, General and Administrative
| |
|
|
|
Annual Percentage Change | ||||||||||||
|---|---|---|---|---|---|---|---|---|---|---|---|---|---|---|---|---|
| |
Fiscal Years | |||||||||||||||
| |
2014 vs. 2013 | 2013 vs. 2012 | ||||||||||||||
| |
2014 | 2013 | 2012 | |||||||||||||
| |
(in thousands, except percentages) |
|||||||||||||||
Total selling, general and administrative expenses |
$ | 140,732 | $ | 144,274 | $ | 127,984 | (2.5 | )% | 12.7 | % | ||||||
| | | | | | | | | | | | | | | | | |
| | | | | | | | | | | | | | | | | |
| | | | | | | | | | | | | | | | | |
Selling, general and administrative (SG&A) expenses as a percentage of product sales were 29.5%, 28.7%, and 26.0% in 2014, 2013, and 2012, respectively. In 2014 as compared to 2013, SG&A expenses decreased by $3.5 million primarily due to a $12.2 million reduction in expenses from the re-measurement of acquisition-related contingent consideration, partially offset by $8.2 million of higher personnel and stock-based compensation expenses.
In 2013 as compared to 2012, SG&A expenses increased by $16.3 million primarily due to incremental expenses of $5.9 million from the re-measurement of acquisition-related contingent consideration, $9.0 million of higher personnel and stock-based compensation expenses, and $1.3 million of higher acquisition-related transaction costs.
Research and Development
| |
|
|
|
Annual Percentage Change | ||||||||||||
|---|---|---|---|---|---|---|---|---|---|---|---|---|---|---|---|---|
| |
Fiscal Years | |||||||||||||||
| |
2014 vs. 2013 | 2013 vs. 2012 | ||||||||||||||
| |
2014 | 2013 | 2012 | |||||||||||||
| |
(in thousands, except percentages) |
|||||||||||||||
Total research and development expenses |
$ | 105,475 | $ | 97,447 | $ | 87,729 | 8.2 | % | 11.1 | % | ||||||
| | | | | | | | | | | | | | | | | |
| | | | | | | | | | | | | | | | | |
| | | | | | | | | | | | | | | | | |
Research and development (R&D) expenses as a percentage of product sales were 22.1%, 19.4%, and 17.8%, in 2014, 2013, and 2012, respectively. In 2014 as compared to 2013, R&D expenses increased by $8.0 million primarily due to a $7.7 million impairment of the DuraHeart II IPR&D asset, $9.6 million of higher clinical trial and personnel expenses, partially offset by a $10.1 million reduction in expenses from the re-measurement of acquisition-related contingent consideration.
49
In 2013 as compared to 2012, R&D expenses increased by $9.7 million primarily due to $4.7 million of incremental personnel costs from our DuraHeart II acquisition, a $2.0 million fixed asset write-down, $6.8 million of higher personnel and stock-based compensation expenses, partially offset by $4.0 million reduction in expenses related to various product development programs.
Interest Income and Other
Interest income and other consisted of the following:
| |
|
|
|
Annual Percentage Change | ||||||||||||
|---|---|---|---|---|---|---|---|---|---|---|---|---|---|---|---|---|
| |
Fiscal Years | |||||||||||||||
| |
2014 vs. 2013 | 2013 vs. 2012 | ||||||||||||||
| |
2014 | 2013 | 2012 | |||||||||||||
| |
(in thousands, except percentages) |
|||||||||||||||
Interest income |
$ | 728 | $ | 910 | $ | 1,183 | (20.0 | )% | (23.1 | )% | ||||||
Foreign currency, net |
(3,073 | ) | 334 | 126 | (1020.1 | )% | * | |||||||||
Other |
524 | 967 | 349 | (45.8 | )% | 177.1 | % | |||||||||
| | | | | | | | | | | | | | | | | |
Total interest income and other |
$ | (1,821 | ) | $ | 2,211 | $ | 1,658 | |||||||||
| | | | | | | | | | | | | | | | | |
| | | | | | | | | | | | | | | | | |
| | | | | | | | | | | | | | | | | |
- *
- Not meaningful.
The change in interest income was due primarily to lower interest rates and yields on the investments. The change in foreign currency (net) in 2014 as compared to 2013 was primarily due to the unfavorable foreign currency impact related to the Apica contingent consideration in 2014. The change in other items was due to the mark-to-market value of our deferred compensation plan assets during the current period.
Income Taxes
Our effective tax rate was 26.0% in 2014 compared to 26.5% in 2013. The decrease is primarily attributable to increased earnings in lower taxed international jurisdictions, offset by the effect of recognizing the benefit of two years of federal research credits in 2013.
Our effective tax rate was 26.5% in 2013 compared to 27.4% in 2012. The decrease is primarily attributable to the recognition of both 2012 and 2013 federal research credits in 2013 as a result of the reinstatement of the federal research tax credits on January 2, 2013, when the U.S. President signed into law The American Taxpayer Relief Act of 2012. This Act extended the research tax credit for two years to December 31, 2013. The extension of the research tax credit was retroactive and included amounts paid or incurred after December 31, 2011. In addition, the 2013 rate decrease was attributable to the recognition of tax benefits due to the expiration of statutes of limitations in 2013, in part offset by the effect of the higher proportionate impact of permanent differences as a result of lower pre-tax income in 2012.
Liquidity and Capital Resources
Cash, Cash Equivalents and Investments
Consolidated working capital was $323.0 million as of January 3, 2015, compared to $391.3 million as of December 28, 2013. Included in working capital were cash, cash equivalents and short-term investments of $230.5 million as of January 3, 2015 compared to $305.8 million as of December 28, 2013.
We believe that cash held in the United States, in addition to amounts available under credit facilities and cash from operations, are sufficient to fund our United States operating requirements. Cash and cash equivalents held outside the United States have historically been used to fund international operations and acquire businesses outside of the United States, although a portion of
50
those amounts may from time to time be subject to temporary intercompany loans into the United States. As of January 3, 2015, cash and cash equivalents held outside the United States were approximately $25.0 million. The majority of cash and cash equivalents held outside the United States relates to undistributed earnings of certain of our foreign subsidiaries which are considered by us to be indefinitely reinvested. Repatriations of cash and cash equivalents held outside the United States are subject to restrictions in certain jurisdictions and may be subject to withholding and other taxes. The potential tax liability related to any repatriation would be dependent on the facts and circumstances that exist at the time such repatriation is made and the complexities of the tax laws of the United States and the respective foreign jurisdictions.
Our cash, cash equivalents and investments balance is as follows:
| |
January 3, 2015 | December 28, 2013 | |||||
|---|---|---|---|---|---|---|---|
| |
(in thousands) |
||||||
Cash and cash equivalents |
$ | 72,814 | $ | 139,099 | |||
Short-term available-for-sale investments |
157,664 | 166,691 | |||||
Long-term available-for-sale investments |
4,239 | 4,234 | |||||
| | | | | | | | |
Total cash and equivalents and available-for-sale investments |
$ | 234,717 | $ | 310,024 | |||
| | | | | | | | |
| | | | | | | | |
| | | | | | | | |
We believe that cash and cash equivalents, short-term available-for-sale investments on hand and expected cash flows from operations will be sufficient to fund our operations, capital requirements and stock repurchase programs for at least the next twelve months.
Cash Flow Activities
Following is a summary of our cash flow from operating, investing and financing activities:
| |
Fiscal Years | |||||||||
|---|---|---|---|---|---|---|---|---|---|---|
| |
2014 | 2013 | 2012 | |||||||
| |
(in thousands) |
|||||||||
Cash provided by operating activities |
$ | 90,766 | $ | 109,768 | $ | 139,538 | ||||
Cash used in investing activities |
(45,773 | ) | (37,883 | ) | (11,043 | ) | ||||
Cash used in financing activities |
(111,619 | ) | (34,585 | ) | (70,192 | ) | ||||
Effect of exchange rate changes on cash and cash equivalents |
341 | 477 | 358 | |||||||
| | | | | | | | | | | |
Net increase (decrease) in cash and cash equivalents |
$ | (66,285 | ) | $ | 37,777 | $ | 58,661 | |||
| | | | | | | | | | | |
| | | | | | | | | | | |
| | | | | | | | | | | |
Cash Provided by Operating Activities
In 2014, cash provided by operating activities was $90.8 million consisting primarily of net income of $50.4 million and adjustments for non-cash items consisting of $16.6 million from depreciation and amortization, $12.2 million related to the impairment of intangible assets, $34.3 million related to share-based compensation expenses, and $(15.5) million from the re-measurement of acquisition-related contingent consideration. These non-cash contributions were partially offset by the decrease of $5.7 million in our net deferred taxes. Changes in assets and liabilities used additional cash of $16.5 million primarily due to the increase in the inventory from higher levels of HeartMate II product line (specifically pump and Pocket Controller inventories) and decreases in accounts payable and income tax (net).
In 2013, cash provided by operating activities was $109.8 million consisting primarily of net income of $73.3 million and adjustments for non-cash items consisting of $18.0 million from depreciation and amortization, $6.7 million from the re-measurement of acquisition-related contingent consideration, $27.0 million related to share-based compensation expenses, and a $2.4 million tax benefit related to the exercise of stock options. These non-cash contributions were partially offset by the decrease from
51
excess tax benefits from share-based compensation of $2.4 million and the decrease of $9.9 million in our net deferred taxes. Changes in assets and liabilities used additional cash of $8.4 million primarily due to the increase in inventory from higher levels of HeartMate II product line (specifically pump and Pocket Controller inventories) and a decrease in accounts payable, offset by an increase in income taxes payable and other current and non-current liabilities (in part due to the warranty provision related to our Pocket Controller which was launched in the current year).
In 2012, cash provided by operating activities was $139.5 million, consisting primarily of net income from continuing operations of $56.2 million and adjustments for non-cash items consisting of $19.7 million from depreciation and amortization, $50.2 million related to the impairment of intangible assets, $21.7 million related to share-based compensation expenses, and a $3.4 million tax benefit related to the exercise of stock options. These non-cash contributions were partially offset by the decrease from excess tax benefits from share-based compensation of $3.2 million and the decrease of $27.3 million in our net deferred tax liability primarily related to the impairment of the intangible assets discussed above. Changes in assets and liabilities provided additional cash of $17.0 million primarily due to the increase in accounts payable due to higher volume and higher incentive compensation as well as a decrease in inventory, offset by an increase in account receivables in the current year.
Cash Used in Investing Activities
In 2014, cash used in investing activities was $45.8 million due to the initial purchase consideration of $35.1 million for the Apica acquisition in 2014, $8.2 million for purchases of property, plant and equipment, $5.9 million for purchases of non-marketable equity securities, and $180.3 million for purchases of investments, offset by $183.8 million provided by the net sales and maturities of investments. The purchases of property, plant and equipment are related to leasehold improvements, furniture and fixtures, and equipment purchases to support our manufacturing, research and development facilities, and administration growth.
In 2013, cash used in investing activities was $37.9 million due to the initial purchase consideration of $13.0 million for the DuraHeart II acquisition in 2013, $8.7 million for purchases of property, plant and equipment, and $165.5 million for purchases of investments, offset by $149.3 million provided by the net sales and maturity of investments.
In 2012, cash used in investing activities was $11.0 million, as the purchase of investments of $181.0 million, the use of $3.1 million for an acquisition of a business and $10.7 million for purchases of property, plant and equipment were partially offset by net sales and maturity of investments of $183.8 million.
Cash Used in Financing Activities
In 2014, cash used in financing activities was $111.6 million, which was primarily comprised of $105.3 million used to repurchase shares of our common stock under the stock repurchase programs authorized, $8.3 million used to repurchase vested restricted stock units for settlement of income tax withholding liabilities, and the payment of contingent consideration of $6.1 million related to the Levitronix Medical acquisition. These uses were partially offset by proceeds of $3.3 million related to stock option exercises and $4.9 million from stock issued under the employee stock purchase plan.
In 2013, cash used in financing activities was $34.6 million, which was primarily comprised of $46.2 million used to repurchase shares of our common stock under the stock repurchase programs authorized, $7.6 million used to repurchase vested restricted stock units for settlement of income tax withholding liabilities, and the payment of Levitronix contingent consideration of $4.2 million. These uses were partially offset by proceeds of $16.7 million related to stock option exercises, $4.4 million
52
proceeds from stock issued under the employee stock purchase plan, and $2.4 million from excess tax benefits for share-based compensation.
In 2012, cash used in financing activities was $70.2 million, which was primarily comprised of $80.4 million used to repurchase shares of our common stock under the stock repurchase programs authorized, $5.1 million used to repurchase vested restricted stock units and awards for settlement of income tax withholding liabilities, and the payment of contingent consideration of $1.5 million. These uses were partially offset by proceeds of $10.1 million related to stock option exercises, $3.5 million proceeds from stock issued under the employee stock purchase plan, and $3.2 million from excess tax benefits for share-based compensation.
Stock Repurchase Program
On December 5, 2013, the Board of Directors authorized a new program to repurchase up to $200.0 million of our shares of common stock ("December 2013 program"), which will expire on December 31, 2015. In the three and twelve months ended January 3, 2015, we repurchased $37.0 million and $105.0 million, respectively, worth of shares of our common stock under the December 2013 program. In addition, we repurchased $1.2 million worth of shares of our common stock in the first quarter of 2014 under our previous November 2012 program which expired in the first quarter of fiscal 2014. As of January 3, 2015, $95.0 million was available for repurchases of shares of our common stock under the December 2013 program. The December 2013 program may be accelerated, suspended, delayed or discontinued at any time.
We are incorporated in California, and as California law does not recognize treasury stock, the shares repurchased decreased the common shares outstanding. We recorded the $106.2 million of shares repurchased in fiscal 2015 by reducing the additional paid-in capital (APIC) balance by the average value per share reflected in the account prior to the repurchase and allocating the excess as a reduction of retained earnings. Based on this allocation, APIC decreased by $43.8 million and retained earnings decreased by $62.4 million in the consolidated statement of shareholders' equity.
We also purchased shares of our common stock that were not part of our publicly announced repurchase program, which represent the surrender value of shares of RSUs withheld in order to satisfy tax withholding obligations upon vesting. The shares purchased do not reduce the dollar value that may yet be purchased under our publicly announced repurchase programs. The aggregate value of shares purchased in 2014 was $8.3 million, which decreased APIC and retained earnings by $2.9 million and $5.4 million, respectively, based on the same allocation methodology discussed above. The aggregate value of shares purchased in 2013 was $7.6 million, which decreased APIC and retained earnings by $2.5 million and $5.1 million, respectively.
Off Balance Sheet Arrangements
Credit Facility
On December 19, 2011, we obtained an unsecured revolving credit facility that provides for up to $50 million revolving credit that will expire on December 19, 2016. The interest rate charged on the amounts borrowed is LIBOR plus a margin (ranging from 0.75% to 1.25%). The agreement contains financial covenants with which we were in compliance as of January 3, 2015. The credit agreement permits us to use the facility for working capital and general corporate purposes. We have not had any borrowings under this credit facility in fiscal 2014, 2013, and 2012.
53
Contractual Obligations
As of January 3, 2015, we had the following contractual obligations:
| |
Total | 2015 | 2016 | 2017 | 2018 | 2019 | Thereafter | |||||||||||||||
|---|---|---|---|---|---|---|---|---|---|---|---|---|---|---|---|---|---|---|---|---|---|---|
| |
(in millions) |
|||||||||||||||||||||
Operating lease obligations(a) |
$ | 31.4 | $ | 3.0 | $ | 3.1 | $ | 3.0 | $ | 3.1 | $ | 3.0 | $ | 16.2 | ||||||||
Deferred compensation obligations(b) |
6.7 | 6.7 | — | — | — | — | — | |||||||||||||||
Purchase obligations(c) |
73.8 | 57.2 | 4.8 | 4.4 | 4.6 | 2.8 | — | |||||||||||||||
Other long-term liabilities reflected on the consolidated balance sheet under U.S. GAAP(d) |
31.7 | — | 6.9 | 13.8 | 3.0 | 7.5 | 0.5 | |||||||||||||||
| | | | | | | | | | | | | | | | | | | | | | | |
Total |
$ | 143.6 | $ | 66.9 | $ | 14.8 | $ | 21.2 | $ | 10.7 | $ | 13.3 | $ | 16.7 | ||||||||
| | | | | | | | | | | | | | | | | | | | | | | |
| | | | | | | | | | | | | | | | | | | | | | | |
| | | | | | | | | | | | | | | | | | | | | | | |
- (a)
- Our operating lease obligations of $31.4 million are comprised primarily of our various U.S. and European leased facilities.
- (b)
- Our deferred compensation obligations of $6.7 million are comprised of future distributions to plan participants.
- (c)
- Our purchase obligations include $53.3 million for open purchase orders and $20.5 million of supply agreements in effect at January 3, 2015.
- (d)
- Our Other long-term liabilities reflected on the consolidated balance sheet under U.S. GAAP are comprised of the long-term portions of contingent consideration associated with our acquisitions.
As of January 3, 2015, the liability for uncertain tax positions was $10.4 million including interest and penalties. Due to the high degree of uncertainty regarding the timing of potential future cash flows associated with these liabilities, we are unable to make a reasonably reliable estimate of the amount and period in which these liabilities might be paid.
Item 7A. Quantitative and Qualitative Disclosures About Market Risk
Interest Rate Risk
Our investment portfolio and cash equivalents that bear variable interest would have an immaterial impact to interest income, on the consolidated statements of operations, if interest rates would have fallen by 0.5%. In addition, if interest rates rise, the market value of our investment portfolio may decline, which could result in a loss if we choose or are forced to sell an investment before its scheduled maturity. If interest rates were to rise or fall from current levels by 1.00%, the change in our net unrealized loss on our short and long-term investments would be $1.1 million. We do not utilize derivative financial instruments to manage interest rate risks.
Foreign Currency Rate Fluctuations
The fair value of forward currency-exchange contracts is sensitive to changes in currency exchange rates and is estimated based on the amount that we would pay or receive upon termination of the contract, taking into account the change in currency exchange rates. A 10% change in the non-functional currency exchange rates as of January 3, 2015 related to our contracts would result in an increase in the unrealized gain or loss on forward currency-exchange contracts of $10.0 million. The unrealized gains or losses on forward currency-exchange contracts resulting from changes in currency exchange rates are expected to approximately offset losses or gains on the currency exposures resulting from our operations, with the exception of the Apica contingent consideration which is not hedged.
54
Item 8. Financial Statements and Supplementary Data
INDEX TO CONSOLIDATED FINANCIAL STATEMENTS
55
REPORT OF INDEPENDENT REGISTERED PUBLIC ACCOUNTING FIRM
To
the Board of Directors and Shareholders of
Thoratec Corporation
Pleasanton, California
We have audited the accompanying consolidated balance sheets of Thoratec Corporation and subsidiaries (the "Company") as of January 3, 2015, and December 28, 2013, and the related consolidated statements of operations, comprehensive income, shareholders' equity, and cash flows for each of the three fiscal years in the period ended January 3, 2015. Our audits also included the consolidated financial statement schedule listed in the Index at Item 15(a) 2. These financial statements and financial statement schedule are the responsibility of the Company's management. Our responsibility is to express an opinion on the financial statements and financial statement schedule based on our audits.
We conducted our audits in accordance with the standards of the Public Company Accounting Oversight Board (United States). Those standards require that we plan and perform the audit to obtain reasonable assurance about whether the financial statements are free of material misstatement. An audit includes examining, on a test basis, evidence supporting the amounts and disclosures in the financial statements. An audit also includes assessing the accounting principles used and significant estimates made by management, as well as evaluating the overall financial statement presentation. We believe that our audits provide a reasonable basis for our opinion.
In our opinion, such consolidated financial statements present fairly, in all material respects, the financial position of Thoratec Corporation and subsidiaries as of January 3, 2015, and December 28, 2013, and the results of their operations and their cash flows for each of the three fiscal years in the period ended January 3, 2015, in conformity with accounting principles generally accepted in the United States of America. Also, in our opinion, such consolidated financial statement schedule, when considered in relation to the basic consolidated financial statements taken as a whole, presents fairly, in all material respects, the information set forth therein.
We have also audited, in accordance with the standards of the Public Company Accounting Oversight Board (United States), the Company's internal control over financial reporting as of January 3, 2015, based on the criteria established in Internal Control—Integrated Framework (2013) issued by the Committee of Sponsoring Organizations of the Treadway Commission and our report dated February 19, 2015 expressed an unqualified opinion on the Company's internal control over financial reporting.
/s/ DELOITTE & TOUCHE LLP
San
Jose, California
February 19, 2015
56
REPORT OF INDEPENDENT REGISTERED PUBLIC ACCOUNTING FIRM
To
the Board of Directors and Shareholders of
Thoratec Corporation
Pleasanton, California
We have audited the internal control over financial reporting of Thoratec Corporation and its subsidiaries (the "Company") as of January 3, 2015, based on criteria established in Internal Control—Integrated Framework (2013) issued by the Committee of Sponsoring Organizations of the Treadway Commission. The Company's management is responsible for maintaining effective internal control over financial reporting and for its assessment of the effectiveness of internal control over financial reporting, included in the accompanying Management's Report on Internal Control over Financial Reporting. Our responsibility is to express an opinion on the Company's internal control over financial reporting based on our audit.
We conducted our audit in accordance with the standards of the Public Company Accounting Oversight Board (United States). Those standards require that we plan and perform the audit to obtain reasonable assurance about whether effective internal control over financial reporting was maintained in all material respects. Our audit included obtaining an understanding of internal control over financial reporting, assessing the risk that a material weakness exists, testing and evaluating the design and operating effectiveness of internal control based on the assessed risk, and performing such other procedures as we considered necessary in the circumstances. We believe that our audit provides a reasonable basis for our opinion.
A company's internal control over financial reporting is a process designed by, or under the supervision of, the company's principal executive and principal financial officers, or persons performing similar functions, and effected by the company's Board of Directors, management, and other personnel to provide reasonable assurance regarding the reliability of financial reporting and the preparation of financial statements for external purposes in accordance with generally accepted accounting principles. A company's internal control over financial reporting includes those policies and procedures that (1) pertain to the maintenance of records that, in reasonable detail, accurately and fairly reflect the transactions and dispositions of the assets of the company; (2) provide reasonable assurance that transactions are recorded as necessary to permit preparation of financial statements in accordance with generally accepted accounting principles, and that receipts and expenditures of the company are being made only in accordance with authorizations of management and directors of the company; and (3) provide reasonable assurance regarding prevention or timely detection of unauthorized acquisition, use, or disposition of the company's assets that could have a material effect on the financial statements.
Because of the inherent limitations of internal control over financial reporting, including the possibility of collusion or improper management override of controls, material misstatements due to error or fraud may not be prevented or detected on a timely basis. Also, projections of any evaluation of the effectiveness of the internal control over financial reporting to future periods are subject to the risk that the controls may become inadequate because of changes in conditions, or that the degree of compliance with the policies or procedures may deteriorate.
In our opinion, the Company maintained, in all material respects, effective internal control over financial reporting as of January 3, 2015, based on the criteria established in Internal Control—Integrated Framework (2013) issued by the Committee of Sponsoring Organizations of the Treadway Commission.
We have also audited, in accordance with the standards of the Public Company Accounting Oversight Board (United States), the consolidated financial statements and consolidated financial statement schedule as of and for the fiscal year ended January 3, 2015 of the Company and our report dated February 19, 2015 expressed an unqualified opinion on those financial statements and financial statement schedule.
/s/ DELOITTE & TOUCHE LLP
San
Jose, California
February 19, 2015
57
THORATEC CORPORATION
CONSOLIDATED BALANCE SHEETS
(In thousands)
| |
January 3, 2015 | December 28, 2013 | |||||
|---|---|---|---|---|---|---|---|
ASSETS |
|||||||
Current assets: |
|||||||
Cash and cash equivalents |
$ | 72,814 | $ | 139,099 | |||
Short-term available-for-sale investments |
157,664 | 166,691 | |||||
Receivables, net of allowances of $1,504 in 2014 and $2,163 in 2013 |
72,847 | 71,418 | |||||
Inventories |
62,204 | 60,293 | |||||
Deferred tax assets |
15,727 | 15,161 | |||||
Income tax receivable |
10,778 | 5,733 | |||||
Prepaid expenses and other assets |
12,458 | 7,272 | |||||
| | | | | | | | |
Total current assets |
404,492 | 465,667 | |||||
Property, plant and equipment, net |
51,231 | 55,163 | |||||
Goodwill |
225,293 | 205,764 | |||||
Intangible assets, net |
44,488 | 36,403 | |||||
Long-term available-for-sale investments |
4,239 | 4,234 | |||||
Other long-term assets |
34,240 | 24,476 | |||||
| | | | | | | | |
Total Assets |
$ | 763,983 | $ | 791,707 | |||
| | | | | | | | |
| | | | | | | | |
| | | | | | | | |
LIABILITIES AND SHAREHOLDERS' EQUITY |
|||||||
Current liabilities: |
|||||||
Accounts payable |
$ | 12,662 | $ | 17,599 | |||
Accrued compensation |
22,836 | 22,759 | |||||
Warranty and related accrual |
10,639 | 9,899 | |||||
Contingent liabilities, current portion |
14,902 | 6,962 | |||||
Other accrued liabilities |
20,441 | 17,102 | |||||
| | | | | | | | |
Total current liabilities |
81,480 | 74,321 | |||||
Long-term deferred tax liability |
3,592 | 2,224 | |||||
Other long-term liabilities |
14,458 | 12,105 | |||||
Contingent liabilities, non-current portion (Notes 2 and 7) |
31,656 | 36,384 | |||||
| | | | | | | | |
Total Liabilities |
131,186 | 125,034 | |||||
Commitments and contingencies (Note 7) |
|||||||
Shareholders' equity: |
|||||||
Common shares: no par, authorized 100,000; issued and outstanding 54,109 in 2014 and 56,904 in 2013 |
— | — | |||||
Additional paid-in-capital |
614,577 | 621,589 | |||||
Retained earnings |
40,242 | 57,587 | |||||
Accumulated other comprehensive loss |
(22,022 | ) | (12,503 | ) | |||
| | | | | | | | |
Total Shareholders' Equity |
632,797 | 666,673 | |||||
| | | | | | | | |
Total Liabilities and Shareholders' Equity |
$ | 763,983 | $ | 791,707 | |||
| | | | | | | | |
| | | | | | | | |
| | | | | | | | |
See notes to consolidated financial statements
58
THORATEC CORPORATION
CONSOLIDATED STATEMENTS OF OPERATIONS
(In thousands, except per share data)
| |
Fiscal Years | |||||||||
|---|---|---|---|---|---|---|---|---|---|---|
| |
2014 | 2013 | 2012 | |||||||
Product sales |
$ | 477,560 | $ | 502,821 | $ | 491,654 | ||||
Cost of product sales, excluding impairment of PVAD and IVAD intangible assets |
161,415 | 163,552 | 150,037 | |||||||
Impairment of PVAD and IVAD intangible assets |
— | — | 50,242 | |||||||
| | | | | | | | | | | |
Gross profit |
316,145 | 339,269 | 291,375 | |||||||
| | | | | | | | | | | |
Operating expenses: |
||||||||||
Selling, general and administrative |
140,732 | 144,274 | 127,984 | |||||||
Research and development |
105,475 | 97,447 | 87,729 | |||||||
| | | | | | | | | | | |
Total operating expenses |
246,207 | 241,721 | 215,713 | |||||||
| | | | | | | | | | | |
Income from operations |
69,938 | 97,548 | 75,662 | |||||||
Other income (expense): |
||||||||||
Interest expense |
(24 | ) | (4 | ) | (3 | ) | ||||
Interest income and other |
(1,821 | ) | 2,211 | 1,658 | ||||||
| | | | | | | | | | | |
Income before taxes |
68,093 | 99,755 | 77,317 | |||||||
Income tax expense |
17,702 | 26,429 | 21,154 | |||||||
| | | | | | | | | | | |
Net income |
$ | 50,391 | $ | 73,326 | $ | 56,163 | ||||
| | | | | | | | | | | |
| | | | | | | | | | | |
| | | | | | | | | | | |
Net income per share: |
||||||||||
Basic |
$ | 0.90 | $ | 1.28 | $ | 0.96 | ||||
| | | | | | | | | | | |
| | | | | | | | | | | |
| | | | | | | | | | | |
Diluted |
$ | 0.89 | $ | 1.26 | $ | 0.94 | ||||
| | | | | | | | | | | |
| | | | | | | | | | | |
| | | | | | | | | | | |
Shares used to compute net income per share: |
||||||||||
Basic |
56,008 | 57,332 | 58,563 | |||||||
Diluted |
56,704 | 58,324 | 59,580 | |||||||
See notes to consolidated financial statements
59
THORATEC CORPORATION
CONSOLIDATED STATEMENTS OF COMPREHENSIVE INCOME
(In thousands)
| |
Fiscal Years | |||||||||
|---|---|---|---|---|---|---|---|---|---|---|
| |
2014 | 2013 | 2012 | |||||||
Net income |
$ | 50,391 | $ | 73,326 | $ | 56,163 | ||||
Unrealized gains (losses) on investments (net of taxes of $(530), $399, $445, for 2014, 2013 and 2012, respectively) |
(1,777 | ) | 1,677 | 523 | ||||||
Foreign currency translation adjustments (net of taxes of $0, $0, $926 for 2014, 2013, and 2012, respectively) |
(7,742 | ) | 889 | 2,441 | ||||||
| | | | | | | | | | | |
Total other comprehensive income (loss) |
(9,519 | ) | 2,566 | 2,964 | ||||||
| | | | | | | | | | | |
Comprehensive income |
$ | 40,872 | $ | 75,892 | $ | 59,127 | ||||
| | | | | | | | | | | |
| | | | | | | | | | | |
| | | | | | | | | | | |
See notes to consolidated financial statements
60
THORATEC CORPORATION
CONSOLIDATED STATEMENTS OF SHAREHOLDERS' EQUITY
(In thousands)
| |
Common Shares |
Additional Paid-in Capital |
Retained Earnings |
Accumulated Other Comprehensive Loss |
Total Shareholders' Equity |
|||||||||||
|---|---|---|---|---|---|---|---|---|---|---|---|---|---|---|---|---|
BALANCE, DECEMBER 31, 2011 |
58,368 | $ | 578,293 | $ | 24,190 | $ | (18,033 | ) | $ | 584,450 | ||||||
| | | | | | | | | | | | | | | | | |
Exercise of common stock options for cash |
566 | 10,067 | 10,067 | |||||||||||||
Issuance of common shares under Employee Stock Purchase Plan (ESPP) |
119 | 3,508 | 3,508 | |||||||||||||
Issuance of common stock upon restricted stock units (RSU) release |
327 | — | ||||||||||||||
Tax benefit related to stock plans |
3,388 | 3,388 | ||||||||||||||
Repurchase of common shares, net |
(1,796 | ) | (20,759 | ) | (45,989 | ) | (66,748 | ) | ||||||||
Share-based compensation |
21,701 | 21,701 | ||||||||||||||
Equity forward contract |
(18,750 | ) | (18,750 | ) | ||||||||||||
Unrealized gain on available-for-sale investments |
523 | 523 | ||||||||||||||
Foreign currency translation adjustment |
2,441 | 2,441 | ||||||||||||||
Net income |
56,163 | 56,163 | ||||||||||||||
| | | | | | | | | | | | | | | | | |
BALANCE, DECEMBER 29, 2012 |
57,584 | $ | 577,448 | $ | 34,364 | $ | (15,069 | ) | $ | 596,743 | ||||||
| | | | | | | | | | | | | | | | | |
| | | | | | | | | | | | | | | | | |
| | | | | | | | | | | | | | | | | |
Exercise of common stock options for cash |
759 | 16,686 | 16,686 | |||||||||||||
Issuance of common shares under ESPP |
144 | 4,386 | 4,386 | |||||||||||||
Issuance of common stock upon RSU release |
553 | — | ||||||||||||||
Tax benefit related to stock plans |
2,367 | 2,367 | ||||||||||||||
Repurchase of common shares, net |
(2,136 | ) | (25,206 | ) | (50,103 | ) | (75,309 | ) | ||||||||
Settlement of equity forward contract |
18,750 | 18,750 | ||||||||||||||
Share-based compensation |
27,158 | 27,158 | ||||||||||||||
Unrealized gain on available-for-sale investments |
1,677 | 1,677 | ||||||||||||||
Foreign currency translation adjustment |
889 | 889 | ||||||||||||||
Net income |
73,326 | 73,326 | ||||||||||||||
| | | | | | | | | | | | | | | | | |
BALANCE, DECEMBER 28, 2013 |
56,904 | $ | 621,589 | $ | 57,587 | $ | (12,503 | ) | $ | 666,673 | ||||||
| | | | | | | | | | | | | | | | | |
| | | | | | | | | | | | | | | | | |
| | | | | | | | | | | | | | | | | |
Exercise of common stock options for cash |
166 | 3,277 | 3,277 | |||||||||||||
Issuance of common shares under ESPP |
188 | 4,883 | 4,883 | |||||||||||||
Issuance of common stock upon RSU release |
397 | — | ||||||||||||||
Tax benefit (expense) related to stock plans |
(377 | ) | (377 | ) | ||||||||||||
Repurchase of common shares, net |
(3,546 | ) | (46,803 | ) | (67,736 | ) | (114,539 | ) | ||||||||
Share-based compensation |
32,008 | 32,008 | ||||||||||||||
Unrealized loss on available-for-sale investments |
(1,777 | ) | (1,777 | ) | ||||||||||||
Foreign currency translation adjustment |
(7,742 | ) | (7,742 | ) | ||||||||||||
Net income |
50,391 | 50,391 | ||||||||||||||
| | | | | | | | | | | | | | | | | |
BALANCE, JANUARY 3, 2015 |
54,109 | $ | 614,577 | $ | 40,242 | $ | (22,022 | ) | $ | 632,797 | ||||||
| | | | | | | | | | | | | | | | | |
| | | | | | | | | | | | | | | | | |
| | | | | | | | | | | | | | | | | |
See notes to consolidated financial statements
61
THORATEC CORPORATION
CONSOLIDATED STATEMENTS OF CASH FLOWS
(In thousands)
| |
Fiscal Years | |||||||||
|---|---|---|---|---|---|---|---|---|---|---|
| |
2014 | 2013 | 2012 | |||||||
Cash flows from operating activities: |
||||||||||
Net Income |
$ | 50,391 | $ | 73,326 | $ | 56,163 | ||||
Adjustments to reconcile net income to net cash provided by operating activities: |
||||||||||
Depreciation and amortization |
16,567 | 17,962 | 19,688 | |||||||
Impairment of intangible assets |
12,179 | — | 50,242 | |||||||
Fixed assets write-down |
3,742 | 1,970 | — | |||||||
Investment premium amortization, net |
3,901 | 3,592 | 2,209 | |||||||
Allowance (benefit) for bad debt |
(1,299 | ) | (40 | ) | (92 | ) | ||||
Change in fair value of contingent consideration |
(15,526 | ) | 6,714 | — | ||||||
Foreign currency re-measurement and other |
8,632 | (2,537 | ) | (435 | ) | |||||
Tax benefit (expense) related to stock plans |
(377 | ) | 2,367 | 3,388 | ||||||
Share-based compensation expense |
34,309 | 26,997 | 21,692 | |||||||
Excess tax (benefits) expense from share-based compensation |
77 | (2,377 | ) | (3,249 | ) | |||||
Loss on disposal of assets |
309 | 78 | 180 | |||||||
Change in deferred taxes, net |
(5,676 | ) | (9,934 | ) | (27,277 | ) | ||||
Changes in assets and liabilities (net of acquisition of business): |
||||||||||
Receivables |
(2,373 | ) | (353 | ) | (10,692 | ) | ||||
Inventories |
(5,169 | ) | (14,805 | ) | 5,201 | |||||
Other current and non-current assets |
(1,431 | ) | 369 | (302 | ) | |||||
Accounts payable |
(3,920 | ) | (2,245 | ) | 6,343 | |||||
Income taxes, net |
(4,744 | ) | 3,901 | 2,243 | ||||||
Other current and non-current liabilities |
1,174 | 4,783 | 14,236 | |||||||
| | | | | | | | | | | |
Cash provided by operating activities |
90,766 | 109,768 | 139,538 | |||||||
| | | | | | | | | | | |
Cash flows from investing activities: |
||||||||||
Purchases of available-for-sale investments |
(180,325 | ) | (165,507 | ) | (181,045 | ) | ||||
Sales and maturities of available-for-sale investments |
183,784 | 149,324 | 183,767 | |||||||
Acquisition of a business, net of cash acquired |
(35,114 | ) | (13,000 | ) | (3,050 | ) | ||||
Purchases of property, plant and equipment |
(8,243 | ) | (8,700 | ) | (10,715 | ) | ||||
Purchases of non-marketable equity investments |
(5,875 | ) | — | — | ||||||
| | | | | | | | | | | |
Cash used in investing activities |
(45,773 | ) | (37,883 | ) | (11,043 | ) | ||||
| | | | | | | | | | | |
Cash flows from financing activities: |
||||||||||
Proceeds from stock option exercises |
3,277 | 16,686 | 10,067 | |||||||
Proceeds from stock issued under employee stock purchase plan |
4,883 | 4,386 | 3,508 | |||||||
Excess tax benefits (expense) from share-based compensation |
(77 | ) | 2,377 | 3,249 | ||||||
Repurchase and retirement of common shares |
(113,595 | ) | (53,814 | ) | (85,498 | ) | ||||
Contingent consideration payment |
(6,107 | ) | (4,220 | ) | (1,518 | ) | ||||
| | | | | | | | | | | |
Cash used in financing activities |
(111,619 | ) | (34,585 | ) | (70,192 | ) | ||||
Effect of exchange rate changes on cash and cash equivalents |
341 | 477 | 358 | |||||||
| | | | | | | | | | | |
Net increase (decrease) in cash and cash equivalents |
(66,285 | ) | 37,777 | 58,661 | ||||||
Cash and cash equivalents at beginning of fiscal year |
139,099 | 101,322 | 42,661 | |||||||
| | | | | | | | | | | |
Cash and cash equivalents at end of fiscal year |
$ | 72,814 | $ | 139,099 | $ | 101,322 | ||||
| | | | | | | | | | | |
| | | | | | | | | | | |
| | | | | | | | | | | |
Supplemental disclosure of consolidated cash flow information: |
||||||||||
Cash paid for income taxes |
$ | 28,804 | $ | 30,333 | $ | 42,890 | ||||
| | | | | | | | | | | |
| | | | | | | | | | | |
| | | | | | | | | | | |
Cash paid for interest |
$ | 24 | $ | 4 | $ | 3 | ||||
| | | | | | | | | | | |
| | | | | | | | | | | |
| | | | | | | | | | | |
Supplemental disclosure of consolidated non-cash investing and financing activities: |
||||||||||
Transfers of equipment from inventory |
$ | 1,927 | $ | 1,994 | $ | 3,644 | ||||
| | | | | | | | | | | |
| | | | | | | | | | | |
| | | | | | | | | | | |
Purchases of property, plant and equipment through accounts payable and other accrued liabilities |
$ | 370 | $ | 1,093 | $ | 1,300 | ||||
| | | | | | | | | | | |
| | | | | | | | | | | |
| | | | | | | | | | | |
Repurchases and retirement of common shares through other accrued liabilities |
$ | 3,690 | $ | 2,745 | $ | — | ||||
| | | | | | | | | | | |
| | | | | | | | | | | |
| | | | | | | | | | | |
Acquisitions of Apica (2014) and DuraHeart II (2013) |
||||||||||
Contingent consideration included in contingent liabilities, non-current portion |
$ | 25,700 | $ | 18,800 | $ | — | ||||
| | | | | | | | | | | |
| | | | | | | | | | | |
| | | | | | | | | | | |
See notes to consolidated financial statements
62
THORATEC CORPORATION
NOTES TO CONSOLIDATED FINANCIAL STATEMENTS
Note 1. Operations and Summary of Significant Accounting Policies
Basis of Presentation
Thoratec Corporation (referred to in these Notes as "we," "our," "us," or the "Company"), is headquartered in Pleasanton, California and is a manufacturer of mechanical circulatory support products for use by patients with heart failure. Thoratec develops, manufactures and markets products that are used by physicians and hospitals for cardiac assist applications. Thoratec conducts business both domestically and internationally.
We report on a 52 or 53 week fiscal year, which ends on the Saturday closest to December 31. The fiscal year ended December 29, 2012, ("Fiscal 2012") included 52 weeks, the fiscal year ended December 28, 2013, ("Fiscal 2013") included 52 weeks and the fiscal year ended January 3, 2015, ("Fiscal 2014") included 53 weeks. Our consolidated financial statements include our wholly owned subsidiaries: Thoratec LLC Continuum Services, Inc., Apica Cardiovascular Technologies, Inc., and APK Advanced Medical Technologies, Inc. based in the U.S., Thoratec Europe Limited, based in the United Kingdom, Thoratec Switzerland GmbH, based in Switzerland, and Apica Cardiovascular Limited, based in Ireland. All intercompany transactions and balances have been eliminated in consolidation.
The preparation of financial statements in conformity with accounting principles generally accepted in the United States of America ("U.S. GAAP") requires management to make estimates and assumptions that affect the reported amounts of assets and liabilities, disclosure of contingent assets and liabilities at the date of the financial statements, and the reported amounts of net sales and expenses during the reported periods. Significant items subject to management's estimates include revenue recognition, the useful lives of property and equipment, allowance for doubtful accounts, valuation allowance for deferred tax assets, stock-based compensation, income tax uncertainties, valuation of goodwill and intangible assets, warranty accrual and contingent consideration. Actual results could differ materially from those estimates and assumptions.
Balance Sheet Reclassification
We have reclassified the warranty and related accrual balance from other accrued liabilities in the prior year consolidated balance sheet to conform to the current year presentation.
Cash and Cash Equivalents
Cash equivalents are defined as short-term, highly liquid investments with original maturities of 90 days or less at the date of purchase, consisting of money market funds and/or municipal bonds. The fair value of these investments is classified at Level 1 or Level 2. Refer to Note 3 for further discussion.
Investments
Our available for sale investments consist primarily of asset-backed securities, municipal bonds, corporate bonds, commercial paper, U. S. government agency securities, and auction rate securities. These are reported as short-term available-for-sale investments on the consolidated balance sheets, with the exception of auction rate securities, which are classified as long-term available-for-sale investments.
63
THORATEC CORPORATION
NOTES TO CONSOLIDATED FINANCIAL STATEMENTS (Continued)
Note 1. Operations and Summary of Significant Accounting Policies (Continued)
Our investments in available-for-sale securities are reported at fair value. Unrealized gains and losses, net of tax, related to changes in the fair value of securities are recognized in accumulated other comprehensive loss on our consolidated balance sheets. Changes in the fair value of available-for-sale securities impact the net income only when such securities are sold or an other-than-temporary impairment is recognized. Realized gains and losses on the sale of securities are determined by specific identification of each security's cost basis. We regularly review our investment portfolio to determine if any security is other-than-temporarily impaired, which would require us to record an impairment charge in the period any such determination is made. In making this judgment, we evaluate, among other things, the duration and extent to which the fair value of a security is less than its cost, the financial condition of the issuer and any changes thereto, and our intent to sell, or whether it is more likely than not that we will be required to sell the security before recovery of its amortized cost basis. Our assessment on whether a security is other-than-temporarily impaired could change in the future due to new developments or changes in assumptions related to any particular security.
Investments in privately held companies are included in Other long-term assets on our consolidated balance sheets and are accounted for using the cost method. We monitor these investments for impairments and make reductions in carrying values if we determine that an impairment charge is required based primarily on the financial condition and near-term prospects of these companies. In 2014, we invested $5.9 million in certain privately-held entities, which are included in "Other long-term assets" on our consolidated balance sheet. No impairment was reported for these investments in 2014.
Fair Value Measurement
The carrying amounts of certain of our financial instruments including cash and cash equivalents, accounts receivable, accounts payable and accrued liabilities approximate fair value due to their short maturities. Short-term investments are comprised of available-for-sale securities, which are carried at fair value. Other non-current assets, which include auction rate securities, deferred compensation plan assets, and marketable equity securities are carried at fair value. Foreign exchange contracts are stated at fair value based on prevailing financial market information.
Contingent Consideration
In connection with certain acquisitions, we may be required to pay future consideration that is contingent upon the achievement of specified development, regulatory approval or commercial sales-based milestone events. We record contingent consideration resulting from a business combination at its fair value on the acquisition date. At the end of each reporting period, we assess the valuation of the contingent consideration and record re-measurement adjustments as operating expenses in our consolidated statements of operations.
Increases or decreases in fair value of the contingent consideration liabilities can result from updates to assumptions such as the expected timing or probability of achieving the specified milestones, changes in projected revenues or changes in discount rates. Significant judgment is employed in determining these assumptions as of the acquisition date and for each subsequent period. Updates to assumptions could have a significant impact on our results of operations in any given period. Actual results may differ from estimates. Refer to Note 2 for further information.
64
THORATEC CORPORATION
NOTES TO CONSOLIDATED FINANCIAL STATEMENTS (Continued)
Note 1. Operations and Summary of Significant Accounting Policies (Continued)
Concentration of Credit Risks and Certain Other Risks
We sell our products primarily to large hospitals and distributors. Credit is extended to our customers; however credit risks are mitigated by our credit valuation process and reasonably short collection terms. We generally do not require collateral or other security to support accounts receivable and maintain allowances for potential credit losses. To date, credit losses have not been significant. Uncollectible accounts, if any, are written off against the allowance when it is deemed that a customer account is uncollectible.
We place cash and cash equivalents in the custody of financial institutions that management believes are of high credit quality, and at times, these balances may be in excess of the amount insured by the Federal Deposit Insurance Corporation. We also have short and long-term investments in municipal bonds, variable demand notes and auction rate securities, backed by U.S. Government or private insurers, which can be subject to certain credit risks. However, we mitigate the risks by investing in high-grade instruments, limiting our exposure to any one issuer, and monitoring the ongoing creditworthiness of the financial institutions and issuers.
We operate internationally and have significant operations and assets in the United Kingdom and Switzerland. We remain exposed to changes in law (including changes that result from international treaties and accords) that could adversely affect our results, such as increases in taxes or government fees; price controls; changes in health, environmental and medical regulations or other laws that increase our cost of compliance or reduce or delay available business opportunities. We are subject to certain risks and uncertainties and believe that changes in any of the following areas could have a material adverse effect on future financial position or results of operations: the ability to receive and maintain U.S. Food and Drug Administration ("FDA") and foreign regulatory authorities approvals to manufacture, market and sell our products; our ability to adequately and timely address issues raised by FDA inspections; the ability to direct and manage current and future growth and physician acceptance of our current or future products; our reliance on specialized suppliers; the ability to manufacture products on an efficient and timely basis and at a reasonable cost and in sufficient volume, including the ability to obtain timely deliveries of parts from suppliers; our ability to identify and correct quality issues in a timely manner and at a reasonable cost; new product development and introduction, including FDA approval and market receptiveness; the ability to protect our proprietary technologies or an infringement by us of others' patents; the number of heart transplants conducted; our dependence upon distributors and any changes made to our method of distribution; competition from other products; worldwide demand for circulatory support and graft products and the management of risks inherent in selling in foreign countries; foreign currency fluctuations; the long and variable sales and deployment cycle of our mechanical circulatory support ("MCS") products; the willingness of third party payors to cover and provide appropriate levels of reimbursement for our products; the ability to realize the full value of our intangible assets; product liability or other claims; the ability to attract and retain talented employees; stock price volatility due to general economic conditions or future issuances and sales of our stock; the integration of any current and future acquisitions of companies or technologies; the occurrence of catastrophic disasters; the ability to maintain profitability; claims relating to the handling, storage or disposal of hazardous chemicals and biomaterials; changes in legal and accounting regulations and standards; changes in tax regulations; and limitations on potential acquisitions and price of our common stock.
65
THORATEC CORPORATION
NOTES TO CONSOLIDATED FINANCIAL STATEMENTS (Continued)
Note 1. Operations and Summary of Significant Accounting Policies (Continued)
Inventories
Inventories are valued at the lower of cost (first-in, first-out) or market. Products may become obsolete due to market or economic conditions, technology changes, new product introductions or changes in strategic direction and may require estimates that include uncertain elements. Based on management's estimate, adjustments to reduce the value of inventory to its net realizable value, if required, are made for estimated excess or obsolete inventory or lower of cost of market.
Property, Plant, and Equipment
Property, plant, and equipment are stated at cost, net of accumulated depreciation. Depreciation is computed using the straight-line method based on estimated useful lives of two to 30 years. Leasehold improvements are amortized over the lesser of the useful life or the remaining term of the lease. Property, plant, and equipment also include certain medical devices rented to customers. Depreciation expense of all rental equipment included in our rental program is recognized ratably over two to three years and is recorded in cost of product sales.
Valuation of Long-Lived Assets and Intangible Assets
We evaluate the carrying value of long-lived assets, including intangible assets (subject to amortization), whenever events, changes in business circumstances or our planned use of long-lived assets indicate that their carrying amounts may not be fully recoverable or that their useful lives are no longer appropriate. If these facts and circumstances exist, we assess for recovery by comparing the carrying values of long-lived assets with their future undiscounted net cash flows. If the comparison indicates that impairment exists, long-lived assets are written down to their respective fair value based on discounted cash flows. Significant management judgment is required in the forecast of future operating results that is used in the preparation of expected undiscounted cash flows. In 2012, we recorded an impairment charge of $50.2 million related to intangibles associated with the PVAD and IVAD product lines. Additionally, in the fourth quarter of 2014, we recorded an impairment charge of $4.5 million related to the Apica ASC intangible asset. No impairment indicators were present for other intangible assets (subject to amortization) in 2014, 2013 and 2012. Refer to Note 6 for further discussion.
We also evaluate the carrying value of intangible assets (not subject to amortization) related to in-process research and development ("IPR&D") assets, which are considered to be indefinite-lived until the completion or abandonment of the associated research and development efforts. Accordingly, amortization of the IPR&D assets will not occur until the product reaches commercialization. During the period the assets are considered indefinite-lived, they will be tested for impairment on an annual basis in the fourth quarter, as well as between annual tests if we become aware of any events occurring or changes in circumstances that would indicate that the fair values of the IPR&D assets are less than their carrying amounts. If and when development is complete, which generally occurs when regulatory approval to market the product is obtained, the associated IPR&D assets would be deemed definite-lived and would then be amortized based on their estimated useful lives at that point in time. If the related project is terminated or abandoned, we may have an impairment related to the IPR&D asset, calculated as the excess of their carrying value over fair value. In the fourth quarter of 2014, we recorded an impairment charge of $7.7 million related to the DuraHeart II IPR&D—Refer to Note 6 for further discussion. No impairment of IPR&D assets was identified in our annual assessment in the fourth quarter of fiscal 2013. There were no IPR&D assets recorded in our consolidated financial statements in fiscal 2012.
66
THORATEC CORPORATION
NOTES TO CONSOLIDATED FINANCIAL STATEMENTS (Continued)
Note 1. Operations and Summary of Significant Accounting Policies (Continued)
Goodwill
We test goodwill for impairment on an annual basis in the fourth quarter of each fiscal year or more frequently if we believe indicators of impairment exist. The performance of the test involves a two-step process. The first step requires comparing the fair value of the reporting unit to its net book value, including goodwill. A potential impairment exists if the fair value of the reporting unit is lower than its net book value. The second step of the process is only performed if a potential impairment exists, and it involves comparing the aggregate fair value of the reporting unit's net assets other than goodwill to the fair value of the reporting unit as a whole. Goodwill is considered impaired, and an impairment charge is recorded, if the excess of the fair value of the reporting unit over the fair value of the net assets is less than the carrying value of goodwill. We found no impairment as a result of our fiscal 2014, 2013, and 2012 annual impairment reviews, as the fair value of our reporting unit was in excess of the carrying value.
Deferred Compensation Plan
We established a non-qualified, unfunded deferred compensation plan for certain management employees and our Board of Directors. Amounts deferred and contributed under the deferred compensation plan are credited or charged with the performance of investment options offered under the plan as elected by the participants. The liability for compensation deferred under this plan is included in "Other long-term liabilities" on our consolidated balance sheets. We manage the risk of changes in the fair value of the liability for deferred compensation by electing to match the liability under the plan with an investment that offsets a substantial portion of our exposure. The investments associated with the deferred compensation plan are included in "Other long-term assets" on our consolidated balance sheets at the cash surrender value of our corporate owned life insurance policies and the fair value of the mutual fund investments. Changes in the cash surrender value of our corporate owned life insurance policies and the fair value of mutual fund investments are included in our consolidated statements of operations for all periods presented.
Revenue Recognition and Accounts Receivable
We recognize revenue from product sales to customers when persuasive evidence of an arrangement exists, the product has been delivered or service has been performed, the selling price is fixed or determinable, collection is reasonably assured, and there are no further obligations to customers. Delivery of the product is considered to have occurred generally when shipped. Sales from products are not subject to rights of return and, historically, actual sales returns have not been significant. We sell products through our direct sales force and through distributors. Sales through distributors are recognized as revenue upon sale to the distributor as these sales are considered to be final and no right of return or price protection exists. We recognize sales of certain products to first-time customers when it has been determined that the customer has the ability to use the products.
Accounts receivable are recorded at the invoiced amount and do not bear interest. We maintain an allowance for doubtful accounts for estimated losses resulting from the inability of our customers to pay amounts due. The allowance for doubtful accounts is management's best estimate of the amount of probable credit losses in existing accounts receivable. We determine the allowance based on specific identification and historical write-off experience. Past due balances are reviewed individually for collectability. Account balances are charged off against the allowance when we believe it is probable the receivable will not be recovered.
67
THORATEC CORPORATION
NOTES TO CONSOLIDATED FINANCIAL STATEMENTS (Continued)
Note 1. Operations and Summary of Significant Accounting Policies (Continued)
Product Warranty
The sales of our products generally include a limited one-year warranty on product quality. Warranty and related costs are accrued for based on our best estimates when management determines that it is probable a charge or liability has been incurred and the amount of loss can be reasonably estimated. For new product introductions in which we may not have any historical experience, we make our estimates for warranty claims based on a combination of historical experience of other similar products sold and qualitative and quantitative information. While we believe that historical experience provides a reliable basis for estimating such warranty cost, unforeseen quality issues or component failure rates could result in future costs in excess of such estimates, or alternatively, improved quality and reliability in our products could result in actual expenses that are below those currently estimated.
The table below represents the changes in the warranty provision included in "Warranty and related accrual" on our consolidated balance sheets. The change in estimates was not significant for each of the fiscal years 2013 and 2012.
| |
2014 | 2013 | 2012 | |||||||
|---|---|---|---|---|---|---|---|---|---|---|
| |
(in thousands) |
|||||||||
Balance, beginning of the fiscal year |
$ | 9,899 | $ | 2,212 | $ | 2,452 | ||||
Additions |
13,494 | 10,464 | 1,492 | |||||||
Change in estimate |
(907 | ) | — | — | ||||||
Settlements |
(11,847 | ) | (2,777 | ) | (1,732 | ) | ||||
| | | | | | | | | | | |
Balance, end of the fiscal year |
$ | 10,639 | $ | 9,899 | $ | 2,212 | ||||
| | | | | | | | | | | |
| | | | | | | | | | | |
| | | | | | | | | | | |
Warranty activity in fiscal 2014 and 2013 includes new warranty additions and settlements related to sales of our HeartMate II Pocket Controller, which was introduced in 2013. Additionally, in September 2014 we made available a new version of the Pocket Controller to customers who purchased a previous version. We recorded an incremental $10.7 million expense based on the number of units which we estimated will be exchanged.
Advertising
All advertising costs are expensed as incurred and are included in selling, general and administrative in the consolidated statements of operations. Advertising expenses were $5.3 million, $5.8 million, and $5.9 million for fiscal 2014, 2013, and 2012, respectively.
Research and Development Expense
Research and development costs are charged to expense when incurred. Major components of research and development expenses consist of personnel costs, including salaries and benefits, and regulatory and clinical costs associated with our compliance with FDA regulations. Research and development costs are largely project driven, and the level of spending depends on the level of project activity planned and subsequently approved and conducted.
68
THORATEC CORPORATION
NOTES TO CONSOLIDATED FINANCIAL STATEMENTS (Continued)
Note 1. Operations and Summary of Significant Accounting Policies (Continued)
Share-Based Compensation
We account for share-based compensation costs in accordance with the accounting standards for share-based compensation, which require that all share-based payments to employees be recognized in the statements of operations based on their fair values.
- •
- The fair value of stock options ("options") on the grant date is estimated using the Black-Scholes option-pricing model using the
multiple-option approach. The Black-Scholes option pricing model requires the use of highly subjective and complex assumptions, including the option's expected term and the price volatility of the
underlying stock, to determine the fair value of award. We recognize the expense associated with options on an accelerated attribution method over the requisite service period.
- •
- The fair value of Restricted Stock Units ("RSUs") is based on the stock price on the grant date using a single-award approach. The
RSUs are subject to a service vesting condition and are recognized on a straight-line basis over the requisite service period. Certain RSUs are accounted for as liability awards and are re-measured at
fair value at the end of each reporting period, with the changes in fair value recorded to stock-based compensation expense in the period in which the change occurs.
- •
- The fair value of Performance Share Units ("PSUs") with service and performance conditions is based on the estimated number of PSUs
anticipated to be received by the recipient at the end of the performance period. Expense is recognized when it is probable that the performance condition will be met using the accelerated attribution
method over the requisite service period.
- •
- The fair value of PSUs with service and market conditions is estimated using a Monte Carlo simulation model applying multiple awards approach. Expense is recognized using the accelerated attribution method over the requisite service period.
We recognize share-based compensation expense for the portion of the equity award that is expected to vest over the requisite service period for those awards. We develop an estimate of the number of share-based awards which will ultimately vest, primarily based on historical experience. The estimated forfeiture rate is reassessed periodically throughout the requisite service period. Such estimates are revised if they differ materially from actual forfeitures. As required, the forfeiture estimates will be adjusted to reflect actual forfeitures when an award vests. For the award types discussed above, if an employee terminates employment prior to being vested in their award, then the award is forfeited.
Income Taxes
Income taxes are recorded under the asset and liability method, which requires the recognition of deferred tax assets and liabilities for the expected future tax consequences of events that have been included in the consolidated financial statements. Under this method, deferred tax assets and liabilities are determined based on the differences between the consolidated financial statements and tax basis of assets and liabilities using enacted tax rates in effect for the year in which the differences are expected to reverse. The effect of a change in tax rates on deferred tax assets and liabilities is recognized in income in the period that includes the enactment date.
69
THORATEC CORPORATION
NOTES TO CONSOLIDATED FINANCIAL STATEMENTS (Continued)
Note 1. Operations and Summary of Significant Accounting Policies (Continued)
We record net deferred tax assets to the extent we believe these assets will more likely than not be realized. In making such determination, we consider all available positive and negative evidence including future taxable income and ongoing prudent and feasible tax planning strategies. In the event we were to determine that we would be able to realize our deferred tax assets in the future in excess of our net recorded amount, an adjustment to the valuation allowance for the deferred tax asset would increase net income in the period such determination was made. Likewise, should we determine that we would not be able to realize all or part of our net deferred tax asset in the future, an adjustment to the valuation allowance for the deferred tax asset would be charged to net income in the period such determination was made.
We record uncertain tax positions in accordance with accounting standards on the basis of a two-step process whereby (1) we determine whether it is more likely than not that the tax positions will be sustained based on the technical merits of the position and (2) those tax positions that meet the more-likely-than-not recognition threshold, we recognize the largest amount of tax benefit that is greater than 50% likely to be realized upon ultimate settlement with the related tax authority.
We recognize interest and penalties related to unrecognized tax benefits within the income tax expense line in the accompanying consolidated statements of operations. Accrued interest and penalties are included within the related tax liability line on our consolidated balance sheets.
Other Comprehensive Income (Loss)
Other comprehensive income (loss) includes net income, unrealized gains and losses on available-for-sale investments and foreign currency translation adjustments.
Foreign Currency Translation
All assets and liabilities of our non-U.S. operations are translated into U.S. dollars at the period-end exchange rates and the resulting translation adjustments are included in other comprehensive income. The functional currencies of our non-U.S. operations are generally designated in their respective local currencies. The period-end translation of the non-functional currency assets and liabilities at the period-end exchange rates result in foreign currency gains and losses, which are included in "interest income and other" on the consolidated statement of operations.
Recent Accounting Pronouncements
In August 2014, the Financial Accounting Standards Board ("FASB") issued Accounting Standards Update ("ASU") No. 2014-15, Presentation of Financial Statements-Going Concern (Subtopic 205-40). This ASU provides guidance to determine when and how to disclose going-concern uncertainties in the financial statements. The new standard requires management to perform interim and annual assessments of an entity's ability to continue as a going concern within one year of the date that the financial statements are issued. An entity must provide certain disclosures if conditions or events raise substantial doubt about the entity's ability to continue as a going concern. The standard will be effective for us starting in fiscal 2017. We do not expect the adoption of this ASU to have an impact on our consolidated financial statements.
70
THORATEC CORPORATION
NOTES TO CONSOLIDATED FINANCIAL STATEMENTS (Continued)
Note 1. Operations and Summary of Significant Accounting Policies (Continued)
In May 2014, the FASB issued ASU No. 2014-09, Revenue from Contracts with Customers (Topic 606), which provides guidance for revenue recognition. This ASU affects any entity that either enters into contracts with customers to transfer goods or services or enters into contracts for the transfer of non-financial assets. The guidance in this ASU supersedes the revenue recognition requirements in Topic 605, Revenue Recognition, and most industry-specific guidance. This ASU also supersedes some cost guidance included in Subtopic 605-35, Revenue Recognition-Construction-Type and Production-Type Contracts. The standard will be effective for us starting in fiscal 2017. We have not yet evaluated the impact of the adoption of this ASU on our consolidated financial statements.
Note 2. Acquisitions
Acquisitions in fiscal years 2014 and 2013 were accounted for as business combinations. In accordance with authoritative guidance on business combination accounting, the assets and liabilities of the acquired companies were recorded as of the acquisition date, at their respective fair values, and are consolidated within our consolidated financial statements. The results of operations related to each company acquired have been included in our consolidated statements of operations from the date of acquisitions. All acquisition-related costs are expensed and recorded in selling, general and administrative expenses in our consolidated statement of operations for the periods presented.
Apica Acquisition in 2014
On July 2, 2014, we acquired all of the outstanding equity interests of Apica Cardiovascular Limited ("Apica") and certain related subsidiaries from the former stockholders of Apica (the "Apica Acquisition"). Under the terms of the Apica Acquisition, the initial purchase consideration was approximately $35.1 million (net of acquired cash and inclusive of the settlement of existing debt and Apica's direct acquisition-related transaction costs), and we will be obligated to make potential future milestone payments, based on regulatory approvals and commercial sales, of up to $40.0 million. Total purchase price allocation was estimated at $60.8 million at the acquisition date, including the initial purchase consideration of approximately $35.1 million and the estimated fair values for contingent consideration totaling $25.7 million, which was recorded as a non-current liability because such contingent consideration is expected to be settled no earlier than 2016. Prior to the acquisition, Apica was developing a surgical implantation system ("SIS") to improve the apical access and attachment of the Left Ventricular Assist Device ("LVAD") to the apex of the heart. We plan to couple the SIS with our HeartMate product line with the intention to obtain regional regulatory approvals for commercialization. In addition, Apica had developed the apical access, stabilization, and closure ("ASC") device, which is commercially sold in Europe and is used for transapical valve procedures. We incurred $2.3 million of acquisition-related costs in connection with the Apica Acquisition in 2014.
During the fourth quarter of 2014, we recorded adjustments to the preliminary purchase price allocation for liabilities assumed and the deferred tax liability that resulted in a net decrease to goodwill of $0.1 million, which is reflected in the table below.
71
THORATEC CORPORATION
NOTES TO CONSOLIDATED FINANCIAL STATEMENTS (Continued)
Note 2. Acquisitions (Continued)
The preliminary purchase price allocation as of the acquisition date (as adjusted) is summarized as follows (in thousands):
Current assets (excluding cash) |
$ | 548 | ||
Identifiable intangible assets: |
||||
Developed technology (ASC) |
5,300 | |||
IPR&D asset (SIS) |
26,500 | |||
Goodwill |
31,491 | |||
| | | | | |
Total assets |
63,839 | |||
Less: Liabilities assumed |
463 | |||
Deferred tax liability |
2,562 | |||
| | | | | |
Total estimated purchase price consideration |
60,814 | |||
Less: Contingent consideration |
25,700 | |||
| | | | | |
Cash paid or payable at the acquisition closing |
$ | 35,114 | ||
| | | | | |
| | | | | |
| | | | | |
We recorded an IPR&D asset of $26.5 million, which represents an estimate of the fair value of the in-process technology related to the SIS device. The fair value of the IPR&D asset was determined using the multi-period excess earnings method which is equal to the present value of the incremental after-tax cash flows attributable to that intangible asset, using a discount rate of 23% based on our best estimate of a market participant's after-tax weighted average cost of capital (WACC). We also recorded an ASC intangible asset of $5.3 million, which represents the estimated fair value of the technology associated with the ASC device. The fair value of the ASC intangible asset was determined using the replacement cost method, which represents what a market participant's estimated cost would be to obtain or develop the technology in its current state. The replacement cost method was utilized because of limited market opportunities associated with the ASC technology. In the fourth quarter of 2014, we discontinued the commercialization of the ASC device and impaired the unamortized net book value associated with the ASC intangible asset—Refer to Note 6 for further discussion.
Goodwill is calculated as the difference between the acquisition date fair value of the consideration transferred and the fair values assigned to the assets acquired, liabilities assumed and primarily represent the expected synergies of Apica with our technologies. The goodwill of $31.5 million was allocated to our sole operating segment (Cardiovascular group) and is not deductible for income tax purposes. The operating results of Apica from the date of acquisition, was $0.3 million in revenue from the sale of the ASC device and $7.5 million net loss, which includes the ASC intangible asset's impairment charge and is included in our consolidated statement of operations for fiscal 2014.
72
THORATEC CORPORATION
NOTES TO CONSOLIDATED FINANCIAL STATEMENTS (Continued)
Note 2. Acquisitions (Continued)
The following unaudited pro forma information presents the combined results of operations for fiscal 2014 and 2013 as if the Apica Acquisition had been completed as of the beginning of 2013. Actual 2014 acquisition-related transaction costs of $2.3 million, the amortization and impairment related to the ASC intangible asset recorded in fiscal 2014 were excluded from the 2014 pro forma results below and included in the 2013 pro forma results as if these items were incurred during the 2013 period. In addition, re-measurement to the Apica contingent consideration relating to the passage of time and foreign currency impact was also included in the 2013 pro forma results. All other adjustments to the pro forma results in 2014 and 2013 were not significant. The pro forma results do not reflect operating efficiencies or potential cost savings which may result from the consolidation of operations. The pro forma financial information is provided for comparative purposes only and does not purport to be indicative of consolidated results of operations for fiscal 2014 and 2013 periods, or for any other future period.
| |
Fiscal 2014 | Fiscal 2013 | |||||
|---|---|---|---|---|---|---|---|
| |
(in thousands) |
||||||
Product sales |
$ | 477,254 | $ | 502,821 | |||
Income before taxes |
72,635 | 88,499 | |||||
Net income |
53,752 | 65,052 | |||||
DuraHeart II Acquisition in 2013
On June 30, 2013, we acquired certain assets (the "Purchased Assets") and assumed certain liabilities from Terumo Corporation ("Terumo") related to the DuraHeart II Left Ventricular Assist System product line ("DuraHeart II") previously under development by Terumo (the "DuraHeart II Acquisition"). Under the terms of the DuraHeart II Acquisition, the initial purchase consideration was $13.0 million and we will be obligated to make potential future milestone payments, based on regulatory approvals and product sales, of up to $43.5 million. Total purchase price allocation was estimated at $31.8 million, including the initial purchase consideration of $13.0 million and the estimated fair values for contingent consideration totaling $18.8 million, which was recorded as a non-current liability because such contingent consideration is expected to be settled no earlier than 2016. As part of the agreement, Terumo also maintains the right to repurchase the Purchased Assets in the event that we do not fulfill certain conditions by specified dates. Additionally, we entered into a distribution partnership with Terumo, pursuant to which Terumo will commercialize DuraHeart II in Japan and potentially other parts of Asia, if and when local regulatory approvals are obtained. We incurred $2.0 million of acquisition-related costs in connection with the DuraHeart II Acquisition in fiscal 2013. The goodwill of $9.9 million equals the amount by which the purchase consideration exceeded the fair value of the purchased assets and was allocated to our sole operating segment and is deductible for income tax purposes.
73
THORATEC CORPORATION
NOTES TO CONSOLIDATED FINANCIAL STATEMENTS (Continued)
Note 2. Acquisitions (Continued)
The purchase price allocation as of the acquisition date is summarized as follows (in thousands):
Property, plant and equipment |
$ | 8,900 | ||
Identifiable intangible assets: |
||||
Favorable lease contract |
600 | |||
IPR&D asset |
12,400 | |||
Goodwill |
9,900 | |||
| | | | | |
Total estimated purchase price consideration |
31,800 | |||
Less: Contingent consideration |
18,800 | |||
| | | | | |
Cash paid at the acquisition closing |
$ | 13,000 | ||
| | | | | |
| | | | | |
| | | | | |
We recorded an IPR&D asset of $12.4 million, which represents an estimate of the fair value of the in-process technology related to the DuraHeart II program. The fair value of the IPR&D asset was determined using the multi-period excess earnings method which is equal to the present value of the incremental after-tax cash flows attributable to that intangible asset, discounted at 22.5% based on our best estimate of a market participant's after-tax WACC.
We recorded equipment totaling $8.9 million based on the fair value at the acquisition date. Of that amount, $8.1 million is related to equipment that is expected to be primarily used in the production of DuraHeart II units in anticipation of future clinical trials and throughout the commercialization of the product. Depreciation will commence upon production of the DuraHeart II units. Refer to Note 5 for further discussion on DuraHeart II equipment.
The following unaudited pro forma information presents the combined results of operations for fiscal 2013 and 2012 as if we had completed the DuraHeart II acquisition at the beginning of 2012. Actual 2013 acquisition related transaction costs of $2.0 million were excluded from the 2013 pro forma results below and included in the 2012 pro forma results as if these costs were incurred in the 2012 period. All other adjustments to the pro forma results in 2013 and 2012 were not significant. The pro forma financial information is provided for comparative purposes only and is not necessarily indicative of what actual results would have been had the acquisition occurred on the date indicated, nor do they give effect to synergies, cost savings, fair market value adjustments, immaterial depreciation expense and other changes expected to result from the acquisition. Accordingly, the pro forma financial results do not purport to be indicative of consolidated results of operations for fiscal 2013 and 2012, or for any other future period.
| |
Fiscal 2013 | Fiscal 2012 | |||||
|---|---|---|---|---|---|---|---|
| |
(in thousands) |
||||||
Product sales |
$ | 502,821 | $ | 491,654 | |||
Income before taxes |
85,086 | 43,645 | |||||
Net income |
62,543 | 31,703 | |||||
74
THORATEC CORPORATION
NOTES TO CONSOLIDATED FINANCIAL STATEMENTS (Continued)
Note 2. Acquisitions (Continued)
Contingent Consideration
Our acquisitions of Apica and DuraHeart II include payments of future contingent consideration upon the achievement of certain regulatory approvals and commercial sales milestones. With respect to each acquisition, we determined the initial fair value of the contingent consideration in connection with the regulatory and commercial sales milestones using various estimates, including probabilities of success, discount rates and the estimated amount of time until the conditions of the milestone payments are met. This fair value measurement was based on significant inputs not observable in the market, representing a Level 3 measurement within the fair value hierarchy (see Note 3 for more information about fair value measurements). The key assumptions used to determine the fair value of these contingent considerations associated with the regulatory milestones at the acquisition dates included a discount rate and probability-adjusted milestone payment date ranges. The key assumptions used to determine the fair value of these contingent considerations associated with the commercial sales milestones at the acquisition dates included a discount rate and probability-weighted expected milestone payment date ranges based on the aggregate number of commercial units sold.
The fair value of recorded contingent consideration is re-measured at each reporting period with the change in fair value recognized within operating expense in our consolidated statements of operations. We measure the liabilities on a recurring basis using Level 3 inputs. See Note 3 for further information regarding fair value measurements.
- •
- In 2014, the fair value of the Apica contingent consideration increased by $0.8 million, in which $0.7 million was
reported as research and development ("R&D") expense and $0.1 million was reported as selling, general and administrative ("SG&A") expense. The overall increase was a result of accretion
associated with the passage of time since the acquisition date.
- •
- In 2014, the fair value of the DuraHeart II contingent consideration decreased by $15.9 million ($9.9 million reported
as R&D expense and $6.0 million reported as SG&A expense) as a result of re-scoping the DuraHeart II project, including the changes in the probabilities of success and timing of when milestones
are expected to be met. In fiscal 2013, the fair value increased by $2.3 million ($0.8 million reported as R&D expense and $1.4 million reported as SG&A expense) as a result of
accretion.
- •
- We acquired the medical business of Levitronix LLC ("Levitronix Medical") in August 2011, which requires payments of future contingent consideration annually through August 2015, which is calculated as a 36% of annual revenues above agreed revenue targets. In fiscals 2014 and 2013 the fair value of the Levitronix Medical contingent consideration was re-measured by $(0.4) million and $4.4 million, respectively, as a result of changes in the estimated revenue and the scenarios probabilities and are reported as SG&A expense. There was no re-measurement adjustment in fiscal 2012.
75
THORATEC CORPORATION
NOTES TO CONSOLIDATED FINANCIAL STATEMENTS (Continued)
Note 3. Fair Value Measurements and Fair Value of Financial Instruments
Our financial assets and liabilities carried at fair value are primarily comprised of investments in money market funds, certificates of deposit, municipal and corporate bonds, commercial paper, U. S. government agency securities, variable demand notes, asset-backed securities, auction rate securities ("ARS"), forward contracts, certain investments held as assets under the deferred compensation plan, marketable equity securities and the contingent consideration in connection with acquisitions. The fair value accounting guidance requires that assets and liabilities be carried at fair value and classified in one of the following three categories:
Level 1: Quoted prices in active markets for identical assets or liabilities that we have the ability to access
Level 2: Observable market based inputs or unobservable inputs that are corroborated by market data such as quoted prices, interest rates and yield curves
Level 3: Inputs that are unobservable data points that are not corroborated by market data
We review the fair value hierarchy classification on a quarterly basis. Changes in the ability to observe valuation inputs may result in a reclassification of levels of certain securities within the fair value hierarchy. We recognize transfers into and out of levels within the fair value hierarchy in the period in which the actual event or change in circumstances that caused the transfer occurs. There were no transfers between Level 1, Level 2, and Level 3 during fiscal 2014, 2013, and 2012.
76
THORATEC CORPORATION
NOTES TO CONSOLIDATED FINANCIAL STATEMENTS (Continued)
Note 3. Fair Value Measurements and Fair Value of Financial Instruments (Continued)
The following table represents the fair value hierarchy for our financial assets and financial liabilities measured at fair value on a recurring basis:
| |
Total Fair Value |
Quoted Prices in Active Markets (Level 1) |
Significant Other Observable Inputs (Level 2) |
Significant Unobservable Inputs (Level 3) |
|||||||||
|---|---|---|---|---|---|---|---|---|---|---|---|---|---|
| |
(in thousands) |
||||||||||||
At January 3, 2015: |
|||||||||||||
Cash equivalents: |
|||||||||||||
Money market funds |
$ | 34,742 | $ | 34,742 | $ | — | $ | — | |||||
Commercial paper |
5,000 | — | 5,000 | — | |||||||||
Corporate bonds |
1,006 | — | 1,006 | — | |||||||||
Municipal bonds |
2,691 | — | 2,691 | — | |||||||||
Short-term investments: |
|||||||||||||
Municipal bonds |
117,681 | — | 117,681 | — | |||||||||
U.S. government agency securities |
8,340 | — | 8,340 | — | |||||||||
Corporate bonds |
19,632 | — | 19,632 | — | |||||||||
Commercial paper |
10,297 | — | 10,297 | — | |||||||||
Asset-backed securities |
1,714 | — | 1,714 | — | |||||||||
Prepaid expenses and other assets: |
|||||||||||||
Foreign exchange contracts |
3,759 | — | 3,759 | — | |||||||||
Long-term investments: |
|||||||||||||
Auction rate securities |
4,239 | — | — | 4,239 | |||||||||
Other long-term assets: |
|||||||||||||
Investments included in our deferred compensation plan |
1,552 | — | 1,552 | — | |||||||||
Marketable equity securities |
1,836 | 1,836 | — | — | |||||||||
Other accrued liabilities: |
|||||||||||||
Foreign exchange contracts |
913 | — | 913 | — | |||||||||
Contingent consideration (current and long-term portions) |
$ | 46,558 | $ | — | $ | — | $ | 46,558 | |||||
77
THORATEC CORPORATION
NOTES TO CONSOLIDATED FINANCIAL STATEMENTS (Continued)
Note 3. Fair Value Measurements and Fair Value of Financial Instruments (Continued)
| |
Total Fair Value |
Quoted Prices in Active Markets (Level 1) |
Significant Other Observable Inputs (Level 2) |
Significant Unobservable Inputs (Level 3) |
|||||||||
|---|---|---|---|---|---|---|---|---|---|---|---|---|---|
| |
(in thousands) |
||||||||||||
At December 28, 2013: |
|||||||||||||
Cash equivalents: |
|||||||||||||
Money market funds |
$ | 97,200 | $ | 97,200 | $ | — | $ | — | |||||
Commercial paper |
13,899 | — | 13,899 | — | |||||||||
Short-term investments: |
|||||||||||||
Municipal bonds |
142,486 | — | 142,486 | — | |||||||||
Variable demand notes |
6,700 | — | 6,700 | — | |||||||||
Corporate bonds |
5,507 | — | 5,507 | — | |||||||||
Commercial paper |
9,998 | — | 9,998 | — | |||||||||
Certificate of deposit |
2,000 | — | 2,000 | — | |||||||||
Prepaid expenses and other assets: |
|||||||||||||
Foreign exchange contracts |
592 | — | 592 | — | |||||||||
Long-term investments: |
|||||||||||||
Auction rate securities |
4,234 | — | — | 4,234 | |||||||||
Other long-term assets: |
|||||||||||||
Investments included in our deferred compensation plan |
1,700 | — | 1,700 | — | |||||||||
Marketable equity securities |
4,019 | 4,019 | — | — | |||||||||
Other accrued liabilities |
|||||||||||||
Foreign exchange contracts |
156 | — | 156 | — | |||||||||
Contingent consideration (current and long-term portions) |
$ | 43,346 | $ | — | $ | — | $ | 43,346 | |||||
Financial assets and liabilities are considered Level 2 when their fair values are determined using inputs that are observable in the market or can be derived principally from or corroborated by observable market data such as pricing for similar securities, recently executed transactions, cash flow models with yield curves, and benchmark securities. Our Level 2 financial assets and liabilities include short-term investments, foreign exchange instruments and certain of our deferred compensation plan securities. In addition, Level 2 financial instruments are valued using comparisons to like-kind financial instruments and models that use readily observable market data as their basis.
Financial assets and liabilities are considered Level 3 when their fair values are determined using pricing models, discounted cash flow methodologies, or similar techniques, and at least one significant model assumption or input is unobservable. Level 3 financial assets and liabilities include the following:
Auction rate securities—Due to limited market activity the determination of fair value requires significant judgment and estimates. The auction rate securities were valued using a discounted cash flow model over a five-year period based on estimated interest rates, the present value of future principal payments, and interest payments discounted at rates considered to reflect the current market conditions and the credit quality of auction rate securities.
78
THORATEC CORPORATION
NOTES TO CONSOLIDATED FINANCIAL STATEMENTS (Continued)
Note 3. Fair Value Measurements and Fair Value of Financial Instruments (Continued)
Contingent liabilities—The fair value of the contingent consideration of Levitronix Medical, DuraHeart II and Apica requires significant management judgment and estimates. The fair value of each contingent consideration is re-measured at the end of each reporting period with the change in fair value recorded in operating expense on our consolidated statements of operations. Actual amounts paid may differ from the obligations recorded. The fair value of the Levitronix Medical contingent consideration is calculated using the income approach, using various revenue assumptions and applying a probability to each scenario. Refer to Note 2 for a discussion of the fair value of the contingent consideration associated with the DuraHeart II and Apica acquisitions.
Available-for-sale investments are carried at fair value and are included in the tables above under short- and long-term investments. The aggregate market value, cost basis, and gross unrealized gains and losses of available-for-sale investments by major security type are as follows:
| |
Amortized Cost |
Gross Unrealized Gains |
Gross Unrealized Losses |
Fair Value |
|||||||||
|---|---|---|---|---|---|---|---|---|---|---|---|---|---|
| |
(in thousands) |
||||||||||||
At January 3, 2015: |
|||||||||||||
Short-term investments: |
|||||||||||||
Municipal bonds |
$ | 117,614 | $ | 83 | $ | (16 | ) | $ | 117,681 | ||||
U.S. government agency securities |
8,341 | — | (1 | ) | 8,340 | ||||||||
Corporate bonds |
19,655 | 1 | (24 | ) | 19,632 | ||||||||
Commercial paper |
10,297 | — | — | 10,297 | |||||||||
Asset-backed securities |
1,715 | — | (1 | ) | 1,714 | ||||||||
| | | | | | | | | | | | | | |
Total short-term investments |
$ | 157,622 | $ | 84 | $ | (42 | ) | $ | 157,664 | ||||
| | | | | | | | | | | | | | |
| | | | | | | | | | | | | | |
| | | | | | | | | | | | | | |
Long-term investments: |
|||||||||||||
Auction rate securities |
$ | 4,900 | $ | — | $ | (661 | ) | $ | 4,239 | ||||
Other long-term assets: |
|||||||||||||
Marketable equity securities |
2,996 | (1,160 | ) | 1,836 | |||||||||
| | | | | | | | | | | | | | |
Total long-term |
$ | 7,896 | $ | — | $ | (1,821 | ) | $ | 6,075 | ||||
| | | | | | | | | | | | | | |
| | | | | | | | | | | | | | |
| | | | | | | | | | | | | | |
At December 28, 2013: |
|||||||||||||
Short-term investments: |
|||||||||||||
Municipal bonds |
$ | 142,321 | $ | 178 | $ | (13 | ) | $ | 142,486 | ||||
Variable demand notes |
6,700 | — | — | 6,700 | |||||||||
Corporate bonds |
5,500 | 7 | — | 5,507 | |||||||||
Commercial paper |
9,998 | — | — | 9,998 | |||||||||
Certificate of deposit |
2,000 | — | — | 2,000 | |||||||||
| | | | | | | | | | | | | | |
Total short-term investments |
$ | 166,519 | $ | 185 | $ | (13 | ) | $ | 166,691 | ||||
| | | | | | | | | | | | | | |
| | | | | | | | | | | | | | |
| | | | | | | | | | | | | | |
Long-term investments: |
|||||||||||||
Auction rate securities |
$ | 4,900 | $ | — | $ | (666 | ) | $ | 4,234 | ||||
Other long-term assets: |
|||||||||||||
Marketable equity securities |
2,996 | 1,023 | — | 4,019 | |||||||||
| | | | | | | | | | | | | | |
Total long-term |
$ | 7,896 | $ | 1,023 | $ | (666 | ) | $ | 8,253 | ||||
| | | | | | | | | | | | | | |
| | | | | | | | | | | | | | |
| | | | | | | | | | | | | | |
79
THORATEC CORPORATION
NOTES TO CONSOLIDATED FINANCIAL STATEMENTS (Continued)
Note 3. Fair Value Measurements and Fair Value of Financial Instruments (Continued)
Our deferred compensation plan includes our corporate owned life insurance policies and mutual fund investments. The underlying mutual fund investments are deemed trading securities. The mutual fund investments' fair value and the cash surrender value of our corporate-owned life insurance policies are classified on our consolidated balance sheets in "Other long-term assets." The aggregate value of our deferred compensation plan assets as of January 3, 2015, and December 28, 2013 was $6.0 million and $5.2 million, respectively. The unrealized gain before tax from the change in the value of the deferred compensation plan was $0.3 million, $0.7 million, and $0.4 million in fiscal 2014, 2013, and 2012, respectively, and is included in our consolidated statement of operations.
The amortized cost and fair value of available-for-sale debt investments, by contractual maturity, were as follows:
| |
Amortized Cost |
Fair Value |
|||||
|---|---|---|---|---|---|---|---|
| |
(in thousands) |
||||||
At January 3, 2015: |
|||||||
Maturing within 1 year |
$ | 112,246 | $ | 112,305 | |||
Maturing after 1 year through 5 years |
45,376 | 45,359 | |||||
| | | | | | | | |
Short-term available-for-sale investments |
157,622 | 157,664 | |||||
Maturing after 5 years |
4,900 | 4,239 | |||||
| | | | | | | | |
|
$ | 162,522 | $ | 161,903 | |||
| | | | | | | | |
| | | | | | | | |
| | | | | | | | |
At December 28, 2013: |
|||||||
Maturing within 1 year |
$ | 138,451 | $ | 138,572 | |||
Maturing after 1 year through 5 years |
28,068 | 28,119 | |||||
| | | | | | | | |
Short-term available-for-sale investments |
166,519 | 166,691 | |||||
Maturing after 5 years |
4,900 | 4,234 | |||||
| | | | | | | | |
|
$ | 171,419 | $ | 170,925 | |||
| | | | | | | | |
| | | | | | | | |
| | | | | | | | |
The following table provides a roll forward of the fair value, as determined by Level 3 inputs, of the auction rate securities for fiscal 2014 and 2013:
| |
Auction rate securities |
||||||
|---|---|---|---|---|---|---|---|
| |
2014 | 2013 | |||||
| |
(in thousands) |
||||||
Balance, beginning of the fiscal year |
$ | 4,234 | $ | 10,607 | |||
Settlements at par |
— | (7,000 | ) | ||||
Change in unrealized gains included in other comprehensive income |
5 | 627 | |||||
| | | | | | | | |
Balance, end of the fiscal year |
$ | 4,239 | $ | 4,234 | |||
| | | | | | | | |
| | | | | | | | |
| | | | | | | | |
80
THORATEC CORPORATION
NOTES TO CONSOLIDATED FINANCIAL STATEMENTS (Continued)
Note 3. Fair Value Measurements and Fair Value of Financial Instruments (Continued)
The following table provides a roll forward of the fair value, as determined by Level 3 inputs, of contingent consideration (current and long-term portions) for fiscal 2014 and 2013:
| |
Contingent consideration | ||||||
|---|---|---|---|---|---|---|---|
| |
2014 | 2013 | |||||
| |
(in thousands) |
||||||
Balance, beginning of the fiscal year |
$ | 43,346 | $ | 22,052 | |||
Payments |
(6,962 | ) | (4,220 | ) | |||
Additions (See Note 2) |
25,700 | 18,800 | |||||
Change in fair value |
(15,526 | ) | 6,714 | ||||
| | | | | | | | |
Balance, end of the fiscal year |
$ | 46,558 | $ | 43,346 | |||
| | | | | | | | |
| | | | | | | | |
| | | | | | | | |
The following table presents quantitative information about the inputs and valuation methodologies used for our fair value measurements classified in Level 3 of the fair value hierarchy at January 3, 2015 and December 28, 2013:
| |
Fair Value at January 3, 2015 (in thousands) |
Valuation Methodology | Significant Unobservable Input | Weighted Average (range, if applicable) |
|||||
|---|---|---|---|---|---|---|---|---|---|
Auction rate securities |
$ | 4,239 | Discounted cash flow | Discount rate | 1.61% | ||||
|
Market credit spread | 2.83% | |||||||
|
Liquidity factor | 0% | |||||||
Levitronix Medical Contingent consideration |
$ |
14,902 |
Multiple outcome discounted cash flow |
Revenue |
$29.4 million for fiscal 2015; $50.0 million for fiscal 2014 |
||||
DuraHeart II Contingent consideration |
$ |
5,189 |
Multiple outcome discounted cash flow |
Milestone dates |
2017 to 2026 |
||||
|
Discount rate | 4.63% to 22.5% | |||||||
|
Percent probabilities assigned to scenarios |
5% to 67% | |||||||
Apica Contingent consideration |
$ |
26,467 |
Multiple outcome discounted cash flow |
Milestone dates |
2016 to 2020 |
||||
|
Discount rate | 4.63% | |||||||
|
Percent probabilities assigned to scenarios |
7.5% to 30% | |||||||
81
THORATEC CORPORATION
NOTES TO CONSOLIDATED FINANCIAL STATEMENTS (Continued)
Note 3. Fair Value Measurements and Fair Value of Financial Instruments (Continued)
| |
Fair Value at December 28, 2013 (in thousands) |
Valuation Methodology | Significant Unobservable Input | Weighted Average (range, if applicable) |
|||||
|---|---|---|---|---|---|---|---|---|---|
Auction rate securities |
$ | 4,234 | Discounted cash flow | Discount rate | 1.74% | ||||
|
Market credit spread | 2.86% | |||||||
|
Liquidity factor | 0.00% | |||||||
Levitronix Medical Contingent consideration |
$ |
22,253 |
Multiple outcome discounted cash flow |
Annual Revenue |
$42.8 million ($31.5 million to $49.9 million) |
||||
|
Discount rate | 1.10% (0.8% to 1.51%) | |||||||
|
Percent probabilities assigned to scenarios |
20% (2.5% to 50%) | |||||||
DuraHeart II Contingent consideration |
$ |
21,093 |
Multiple outcome discounted cash flow |
Milestone dates |
2016 to 2029 |
||||
|
Discount rate | 5.3% to 20.0% | |||||||
|
Percent probabilities Assigned to scenarios |
1% to 74% | |||||||
Auction Rate Securities
The significant unobservable inputs used in the fair value measurement of the auction rate securities are the weighted average discount rate, market credit spread and liquidity factor. A significant increase (decrease) in the discount rate in isolation could result in a significantly higher (lower) fair value measurement, whereas a significant increase (decrease) in the market credit spread and liquidity factor in isolation could result in a significantly lower (higher) fair value measurement. Although the discount rate as compared to the market credit spread and liquidity factors are not directly related, they will generally move in opposite directions.
The fair value of auction rate securities is calculated on a quarterly basis by senior management based on a collaborative effort of the corporate treasury and accounting groups. To assess the reasonableness of the fair value measurement, management compares its fair value measurement to the values calculated by independent third parties.
Contingent Consideration
The fair values of contingent consideration are measured using projected payment dates, discount rates, probabilities of payments, and projected revenues (for revenue-based considerations). Projected contingent payments amounts are discounted back to the current period using a discounted cash flow model. A significant increase (decrease) in the projected revenue in isolation could result in a significantly higher (lower) fair value measurement; a significant delay (acceleration) in the product development (including projected regulatory milestone) achievement date in isolation could result in a significantly lower (higher) fair value measurement; a significant increase (decrease) in the discount rate in isolation could result in a significantly lower (higher) fair value measurement; and the changes in the probability of occurrence between the outcomes in isolation could result in a significant change in fair value measurement.
82
THORATEC CORPORATION
NOTES TO CONSOLIDATED FINANCIAL STATEMENTS (Continued)
Note 3. Fair Value Measurements and Fair Value of Financial Instruments (Continued)
The fair values of the contingent consideration are calculated on a quarterly basis by management based on a collaborative effort of our regulatory, research and development, operations, finance and accounting groups, as appropriate. Potential valuation adjustments are made as additional information becomes available, including the progress toward achieving revenue and milestone targets as compared to initial projections, the impact of market competition and changes in actual and projected product mix and average selling price, with the impact of such adjustments being recorded in the consolidated statements of operations.
Assets and Liabilities That Are Measured at Fair Value on a Nonrecurring Basis
Non-marketable equity investments and non-financial assets, such as goodwill, intangible assets, and property, plant, and equipment (measured at fair value if a write-down is recognized) are evaluated for impairment annually or when indicators of impairment exist. In fiscal 2014, we recorded intangible assets impairment charges of $7.7 million and $4.5 million related to the DuraHeart II IPR&D asset and Apica developed technology intangible asset, respectively. In fiscal 2012, we recorded an impairment charge of $50.2 million for certain intangible assets used in connection with our PVAD and IVAD product line. Refer to Note 6 for further information. In fiscals 2014 and 2013, we recorded fixed asset write-downs of $3.7 million and $2.0 million, respectively. No write-down for fixed assets was recorded in fiscal 2012. Non-financial assets such as identified intangibles acquired in connection with our acquisitions are measured at fair value using Level 3 inputs, which include discounted cash flow methodologies, or similar techniques, when there is limited market activity and the determination of fair value requires significant judgment and estimates.
Note 4. Foreign Exchange Instruments
We utilize foreign currency forward exchange contracts and options with recognized financial institutions to manage our exposure to the impact of fluctuations in foreign currency exchange rates on certain intercompany balances and foreign currency denominated sales and purchase transactions. We do not use derivative financial instruments for speculative or trading purposes. These forward contracts are not designated as hedging instruments for accounting purposes. Principal hedged currencies include the Euro, British Pound Sterling, and U.S. Dollar. The periods of these forward contracts range up to approximately three months and the notional amounts are intended to be consistent with changes in the underlying exposures. We intend to exchange foreign currencies for U.S. Dollars at maturity.
Total gross notional amounts for outstanding derivatives instruments were as follows at the end of the fiscal year:
| |
2014 | 2013 | |||||
|---|---|---|---|---|---|---|---|
Forward contracts: |
|||||||
Euro (sell) |
€ | 15.8 million | € | 20.2 million | |||
British Pound Sterling (sell) |
£ | 1.5 million | £ | 1.3 million | |||
U.S. Dollar (sell) |
$ | 21.2 million | $ | 23.5 million | |||
U.S. Dollar (buy) |
$ | 59.0 million | $ | 60.0 million | |||
83
THORATEC CORPORATION
NOTES TO CONSOLIDATED FINANCIAL STATEMENTS (Continued)
Note 4. Foreign Exchange Instruments (Continued)
The following table shows the derivative instruments measured at gross fair value reported on our consolidated balance sheets:
| |
At January 3, 2015 | At December 28, 2013 | |||||||||||
|---|---|---|---|---|---|---|---|---|---|---|---|---|---|
| |
Prepaid expenses and other assets |
Other accrued liabilities |
Prepaid expenses and other assets |
Other accrued liabilities |
|||||||||
| |
(in thousands) |
||||||||||||
Derivatives not designated as hedging instruments (forward contracts) |
$ | 3,759 | $ | 913 | $ | 592 | $ | 156 | |||||
The following table shows the effect of derivative instruments not designated as hedging instruments and foreign currency transactions gains and losses, which were included in "Interest income and other" on the consolidated statements of operations in fiscal years:
| |
2014 | 2013 | 2012 | |||||||
|---|---|---|---|---|---|---|---|---|---|---|
| |
(in thousands) |
|||||||||
Foreign currency exchange gain (loss) on foreign contracts |
$ | 9,317 | $ | (1,480 | ) | $ | (1,921 | ) | ||
Foreign currency transactions gain (loss) |
$ | (12,389 | ) | $ | 1,814 | $ | 2,046 | |||
Note 5. Select Balance Sheet and Statement of Operations Information
The following tables provide details of selected consolidated balance sheets items as of the end of the fiscal year:
Inventories consisted of the following at the end of each fiscal year:
| |
2014 | 2013 | |||||
|---|---|---|---|---|---|---|---|
| |
(in thousands) |
||||||
Finished goods |
$ | 24,871 | $ | 22,885 | |||
Work-in-process |
18,135 | 13,739 | |||||
Raw materials |
19,198 | 23,669 | |||||
| | | | | | | | |
Total inventories |
$ | 62,204 | $ | 60,293 | |||
| | | | | | | | |
| | | | | | | | |
| | | | | | | | |
Property, plant and equipment, net consisted of the following at the end of each fiscal year:
| |
2014 | 2013 | |||||
|---|---|---|---|---|---|---|---|
| |
(in thousands) |
||||||
Land, building and improvements |
$ | 20,600 | $ | 20,594 | |||
Equipment and capitalized software |
56,696 | 61,383 | |||||
Furniture and leasehold improvements |
25,710 | 22,458 | |||||
| | | | | | | | |
Total property, plant and equipment |
103,006 | 104,435 | |||||
Less accumulated depreciation and amortization |
(51,775 | ) | (49,272 | ) | |||
| | | | | | | | |
Total property, plant and equipment, net |
$ | 51,231 | $ | 55,163 | |||
| | | | | | | | |
| | | | | | | | |
| | | | | | | | |
In 2014, we wrote down $3.7 million of equipment that had not yet been placed in service from the DuraHeart II acquisition. As of January 3, 2015, the remaining $4.4 million of equipment from the acquisition is expected to be placed in service in 2015 and is included in the "Equipment and capitalized software" line in the table above.
84
THORATEC CORPORATION
NOTES TO CONSOLIDATED FINANCIAL STATEMENTS (Continued)
Note 5. Select Balance Sheet and Statement of Operations Information (Continued)
Depreciation expense in fiscal years 2014, 2013, and 2012 was $8.9 million, $7.7 million, and $8.6 million, respectively.
Changes in accumulated other comprehensive losses by component of each fiscal year are as follows:
| |
Foreign currency items(A) |
Unrealized gain (loss) on available-for-sale securities(A) |
Total | |||||||
|---|---|---|---|---|---|---|---|---|---|---|
| |
(in thousands) |
|||||||||
Balance at December 29, 2012 |
$ | (13,928 | ) | $ | (1,141 | ) | $ | (15,069 | ) | |
Other comprehensive gain before reclassification |
889 | 1,677 | 2,566 | |||||||
Amounts reclassified from accumulated other comprehensive loss |
— | — | — | |||||||
| | | | | | | | | | | |
Net current period other comprehensive gain |
889 | 1,677 | 2,566 | |||||||
| | | | | | | | | | | |
Balance at December 28, 2013 |
(13,039 | ) | 536 | (12,503 | ) | |||||
Other comprehensive (loss) before reclassification |
(7,742 | ) | (1,777 | ) | (9,519 | ) | ||||
Amounts reclassified from accumulated other comprehensive loss |
— | — | — | |||||||
| | | | | | | | | | | |
Net current period other comprehensive gain |
(7,742 | ) | (1,777 | ) | (9,519 | ) | ||||
| | | | | | | | | | | |
Balance at January 3, 2015 |
$ | (20,781 | ) | $ | (1,241 | ) | $ | (22,022 | ) | |
| | | | | | | | | | | |
| | | | | | | | | | | |
| | | | | | | | | | | |
- (A)
- All amounts are net of tax.
Items included in "Other accrued liabilities" on our consolidated balance sheets that are in excess of 5% of total current liabilities are as follows:
| |
At January 3, 2015 |
At December 28, 2013 |
|||||
|---|---|---|---|---|---|---|---|
| |
(in thousands) |
||||||
Deferred revenue |
$ | 5,063 | $ | 3,624 | |||
Interest Income and Other
Interest income and other consisted of the following:
| |
Fiscal Years | |||||||||
|---|---|---|---|---|---|---|---|---|---|---|
| |
2014 | 2013 | 2012 | |||||||
Interest income |
$ | 728 | $ | 910 | $ | 1,183 | ||||
Foreign currency, net |
(3,073 | ) | 334 | 126 | ||||||
Other |
524 | 967 | 349 | |||||||
| | | | | | | | | | | |
Total interest income and other |
$ | (1,821 | ) | $ | 2,211 | $ | 1,658 | |||
| | | | | | | | | | | |
| | | | | | | | | | | |
| | | | | | | | | | | |
85
THORATEC CORPORATION
NOTES TO CONSOLIDATED FINANCIAL STATEMENTS (Continued)
Note 6. Goodwill and Intangible Assets, net
The carrying amount of goodwill and the changes in those balances of each fiscal year are as follows:
| |
2014 | 2013 | |||||
|---|---|---|---|---|---|---|---|
| |
(in thousands) |
||||||
Balance, beginning of the fiscal year |
$ | 205,764 | $ | 194,182 | |||
Goodwill additions |
31,491 | 9,900 | |||||
Foreign currency translation impact |
(11,962 | ) | 1,682 | ||||
| | | | | | | | |
Balance, end of fiscal year |
$ | 225,293 | $ | 205,764 | |||
| | | | | | | | |
| | | | | | | | |
| | | | | | | | |
In July 2014, we recorded goodwill of $31.5 million related to the Apica acquisition, which is not deductible for income tax purposes. In June 2013, we recorded goodwill of $9.9 million related to the DuraHeart II acquisition, which is deductible for income tax purposes. Refer to Note 2 for further information.
Intangible assets (net of accumulated amortization and impairment) were as follows:
| |
At January 3, 2015 | ||||||||||||
|---|---|---|---|---|---|---|---|---|---|---|---|---|---|
| |
Gross Amount |
Accumulated Amortization |
Accumulated Impairment |
Net Amount |
|||||||||
| |
(in thousands) |
||||||||||||
Intangible assets subject to amortization: |
|||||||||||||
Patents and trademarks |
$ | 43,532 | $ | (36,095 | ) | $ | — | $ | 7,437 | ||||
Core technology |
37,180 | (23,854 | ) | (12,642 | ) | 684 | |||||||
Developed technology |
133,373 | (85,613 | ) | (42,079 | ) | 5,681 | |||||||
Customer based relationships and other |
7,243 | (5,569 | ) | — | 1,674 | ||||||||
Pre-existing license agreement |
2,300 | (1,123 | ) | — | 1,177 | ||||||||
Foreign currency translation impact |
(411 | ) | — | — | (411 | ) | |||||||
| | | | | | | | | | | | | | |
|
223,217 | (152,254 | ) | (54,721 | ) | 16,242 | |||||||
Intangible assets not yet subject to amortization: |
|||||||||||||
DuraHeart II IPR&D |
12,400 | — | (7,700 | ) | 4,700 | ||||||||
Apica VAD Tool IPR&D |
26,500 | — | — | 26,500 | |||||||||
Foreign currency translation impact |
(2,954 | ) | — | — | (2,954 | ) | |||||||
| | | | | | | | | | | | | | |
Total intangible assets |
$ | 259,163 | $ | (152,254 | ) | $ | (62,421 | ) | $ | 44,488 | |||
| | | | | | | | | | | | | | |
| | | | | | | | | | | | | | |
| | | | | | | | | | | | | | |
86
THORATEC CORPORATION
NOTES TO CONSOLIDATED FINANCIAL STATEMENTS (Continued)
Note 6. Goodwill and Intangible Assets, net (Continued)
| |
At December 28, 2013 | ||||||||||||
|---|---|---|---|---|---|---|---|---|---|---|---|---|---|
| |
Gross Amount |
Accumulated Amortization |
Accumulated Impairment |
Net Amount |
|||||||||
| |
(in thousands) |
||||||||||||
Intangible assets subject to amortization: |
|||||||||||||
Patents and trademarks |
$ | 43,532 | $ | (34,755 | ) | $ | — | $ | 8,777 | ||||
Core technology |
37,180 | (22,986 | ) | (12,642 | ) | 1,552 | |||||||
Developed technology |
128,073 | (81,635 | ) | (37,600 | ) | 8,838 | |||||||
Pre-existing license agreement |
2,300 | (794 | ) | — | 1,506 | ||||||||
Customer based relationships and other |
7,246 | (4,043 | ) | — | 3,203 | ||||||||
Foreign currency translation impact |
127 | — | — | 127 | |||||||||
| | | | | | | | | | | | | | |
|
218,458 | (144,213 | ) | (50,242 | ) | 24,003 | |||||||
| | | | | | | | | | | | | | |
Intangible assets not yet subject to amortization: |
|||||||||||||
DuraHeart II IPR&D |
12,400 | — | — | 12,400 | |||||||||
| | | | | | | | | | | | | | |
Total intangible assets |
$ | 230,858 | $ | (144,213 | ) | $ | (50,242 | ) | $ | 36,403 | |||
| | | | | | | | | | | | | | |
| | | | | | | | | | | | | | |
| | | | | | | | | | | | | | |
2014 Impairments
In the fourth quarter of 2014, we made a decision to discontinue the commercialization of the ASC device included in the Apica acquisition in July 2014. Consequently, we determined that sufficient indicators of potential impairment existed to require an impairment assessment of related intangible assets. As discussed in Note 2, the acquisition date fair value of the ASC intangible assets was determined using the replacement cost method, which represented what a market participant's estimated cost would be to obtain or develop the technology in its current state. The replacement cost method was utilized because of limited market opportunities associated with the ASC technology. From the acquisition date to the beginning of December 2014, we recorded the amortization expense associated with the ASC intangible assets in "Cost of product sales" on our consolidated statement of operations. As part of the impairment assessment, management determined that the unamortized net carrying value of $4.5 million exceeded the fair value of $0. As a result, we recorded the impairment charge of $4.5 million in "Cost of product sales" on our consolidated statement of operations for fiscal 2014.
In connection with our annual IPR&D asset impairment assessment in the fourth quarter of 2014 and the re-scope of the DuraHeart II project, management updated its forecasts, including expected timing of clinical trials and receipts of regulatory approvals, costs to complete, and probabilities of meeting milestones and revenue targets. Key assumptions used to determine the fair value of the DuraHeart II IPR&D asset, based on Level 3 fair value hierarchy, included the expected cash flows from 2015 to 2034 and a 25% discount rate. As a result, the DuraHeart II IPR&D asset carrying value of $12.4 million was higher than the fair value of $4.7 million and resulted in an impairment charge of $7.7 million which was included in R&D expense on the consolidated statement of operations for fiscal 2014. If the discount rate applied in our analysis had been 1.00% higher than estimated, the resulting impact on the intangible impairment charge would not have been material. Changes in the judgments and estimates in our DuraHeart II IPR&D asset impairment assessment in the future, including changes in anticipated cash flows, probabilities and discount rate, could result in a significantly different estimated fair value and may result in an additional impairment charge.
87
THORATEC CORPORATION
NOTES TO CONSOLIDATED FINANCIAL STATEMENTS (Continued)
Note 6. Goodwill and Intangible Assets, net (Continued)
Annual impairment analysis of the Apica IPR&D assets related to the Apica VAD tool resulted in no impairment in the fiscal year ended January 3, 2015.
2012 Impairments
In February 2001, we merged with Thermo Cardiosystems, Inc. The components of identifiable intangible assets totaled $207.0 million, which included patents and trademarks, core technology, and developed technology (collectively referred to as the "PVAD and IVAD intangible assets"). During the fourth quarter of 2012, we determined that the downward trend in sales of the PVAD and IVAD product lines (collectively known as the Thoratec product line) for the first three quarters of 2012, which fell short of the forecast established at the beginning of 2012, should be expected to continue due primarily to 1) earlier treatment of heart failure patients with implantable ventricular assist devices as more clinicians become aware and willing to implant a Left Ventricular Assist Device, 2) an expanded range of competing therapies, 3) the continued evolution of products, including HeartMate II and CentriMag, and 4) increased usage of other competitive VADs providing biventricular support for the heart. Consequently, we determined that sufficient indicators of potential impairment existed to require an impairment assessment of our PVAD and IVAD intangible assets. These indicators included the recent business trends of the Thoratec product line, and changes in the competitive market landscape, both of which we believe contributed to the significant decline in sales in 2012, from $29.5 million and $28.1 million in fiscals 2010 and 2011, respectively, to $19.0 million in fiscal 2012. The fair value was based on the individual discounted cash flows of "Core technology" and "Developed technology" intangible asset categories within PVAD and IVAD. The decline in the fair value of these intangible assets resulted from lower projected revenue and profitability levels. The comparison between the undiscounted cash flows and the carrying value of the intangible assets resulted in the existence of impairment. Accordingly, the PVAD and IVAD intangible assets were written down to $12.6 million, resulting in an impairment charge of $50.2 million. The impairment charge of $50.2 million was reported in a separate line "Impairment of intangible assets" used in determining gross profit on the consolidated statement of operations for the fiscal year ended December 29, 2012, given that the amortization of these intangible assets is recorded to cost of product sales.
A key assumption used to determine the fair value of the PVAD and IVAD intangible assets in 2012, based on Level 3 fair value hierarchy, was the expected cash flow from 2013 to 2017 (discounted based on our best estimate of a market participant's after-tax WAAC). If the discount rate applied in our analysis had been 1.00% higher than estimated, the resulting impact on the intangible impairment charge would not have been material. Changes in the judgments and estimates in our analysis of intangible assets for possible impairment in the future, including anticipated cash flows and discount rate, could result in a significantly different estimate of the fair value of these intangible assets and may result in an additional impairment charge.
Intangible assets are amortized on either a straight-line or accelerated method based on the expected pattern of future benefits related to those respective intangible assets. Subsequent to the impairment of the core and developed technology associated with our PVAD and IVAD intangible assets in the fourth quarter of 2012, we changed our method of amortization from the straight-line method to an accelerated method to more closely reflect the expected pattern of benefits associated with the remaining carrying amount of these intangible assets.
88
THORATEC CORPORATION
NOTES TO CONSOLIDATED FINANCIAL STATEMENTS (Continued)
Note 6. Goodwill and Intangible Assets, net (Continued)
Except as discussed above, there was no indication of potential impairment related to other intangible assets in 2014, 2013, and 2012. Amortization expense related to intangible assets (subject to amortization) was $7.6 million, $10.3 million, and $11.1 million in fiscal years 2014, 2013, and 2012, respectively.
Patents and trademarks have remaining useful lives ranging from four to seven years, core and developed technology assets have remaining useful lives ranging from two to seven years, pre-existing license agreements have remaining useful lives of four years, and customer-based relationships have remaining lives of one to five years.
Estimated amortization expense for the next five fiscal years and all years thereafter are as follows:
| |
(in thousands) | |||
|---|---|---|---|---|
Fiscal year: |
||||
2015 |
$ | 4,649 | ||
2016 |
3,352 | |||
2017 |
2,483 | |||
2018 |
2,072 | |||
2019 |
1,677 | |||
Thereafter |
2,009 | |||
| | | | | |
Total |
$ | 16,242 | ||
| | | | | |
| | | | | |
| | | | | |
Note 7. Commitments and Contingencies
Legal Proceedings
From time to time we are involved in litigation arising out of claims in the normal course of business. Based on the information presently available, management believes that there are no claims or actions pending or threatened against us, the ultimate resolution of which will have a material effect on our financial position, liquidity or results of operations, although the results of litigation are inherently uncertain.
On January 24, 2014, we and three of our present and former officers were named as defendants in a complaint filed in the United States District Court for the Northern District of California. The action, entitled Cooper v. Thoratec Corp., Case No. 4:14-cv-00360, is a putative class action brought on behalf of purchasers of our securities between April 29, 2010, and November 27, 2013, inclusive (the "Class Period"), and alleges violations of Section 10(b) of the Securities Exchange Act of 1934 (the "Exchange Act"), and Rule 10b-5 promulgated thereunder, as well as Section 20(a) of the Exchange Act. On April 21, 2014, the Court appointed Bradley Cooper as Lead Plaintiff ("Plaintiff"). On June 20, 2014, Plaintiff filed an amended class action complaint ("Complaint"), adding a former officer of the Company as a defendant. The Complaint alleges that during the Class Period, Defendants made false or misleading statements in various SEC filings, press releases, earnings calls, and healthcare conferences regarding the Company's business and outlook, focusing primarily on Defendants' alleged failure to disclose that the HeartMate II Left Ventricular Assist Device had a purported increased rate of pump thrombosis during the Class Period. Plaintiff seeks unspecified damages, among other relief. Defendants moved to dismiss the Complaint on August 19, 2014. On November 26, 2014, the Court granted Defendants' motion to dismiss the Complaint in its entirety with leave to amend. Plaintiff filed a second amended complaint on January 20, 2015 (the "Amended Complaint"). In the Amended
89
THORATEC CORPORATION
NOTES TO CONSOLIDATED FINANCIAL STATEMENTS (Continued)
Note 7. Commitments and Contingencies (Continued)
Complaint, Plaintiff amended the Class Period from May 11, 2011 to August 6, 2014, inclusive, dropped a former officer of the Company as a defendant, and added Plaintiff Todd Labak, who is intended to replace Mr. Cooper because Mr. Cooper no longer has Thoratec stock purchases within the proposed Class Period, among other changes. Defendants intend to move to dismiss the Amended Complaint by March 23, 2015. Although the results of litigation are inherently uncertain, based on the information currently available, we do not believe the ultimate resolution of this action will have a material effect on our financial position, liquidity or results of operations.
Contingent Consideration
In August 2011, we acquired Levitronix Medical using a combination of cash and post-acquisition earn-out payments. The earn-out payments are payable annually over the next four years, calculated based on 36% of sales from Levitronix Medical in excess of $24.0 million per year. Each annual earn-out payment is contingent upon results of operations. As of January 3, 2015, the fair value of the remaining portion of the Levitronix Medical contingent consideration was $14.9 million, of which $9.4 million will be paid in the first quarter of 2015 (based on our fiscal 2014 revenue results for the CentriMag product line). The remaining portion of the contingent consideration related to fiscal 2015 (through August 4, 2015) will be adjusted for actual results for the period and will be paid in the third quarter of 2015.
In June 2013, we acquired DuraHeart II using a combination of cash and post-acquisition earn-out payments. The earn-out payments totaling $43.5 million will become payable by us upon reaching various regulatory and commercial sale milestones. As of January 3, 2015, the fair value of the DuraHeart II contingent consideration was $5.2 million. Refer to Note 2 for more information.
In July 2014, we acquired Apica using a combination of cash and post-acquisition earn-out payments. The earn-out payments totaling $40.0 million will become payable by us upon reaching certain regulatory and commercial sale milestones. As of January 3, 2015, the fair value of the Apica contingent consideration was $26.5 million. Refer to Note 2 for more information.
Leases
We lease certain manufacturing, office, research facilities, and equipment under operating leases that expire at various times, the longest of which expires on 2027. Future minimum lease payments for the next five years and thereafter are as follows:
| |
(in thousands) | |||
|---|---|---|---|---|
Fiscal year ended: |
||||
2015 |
$ | 3,030 | ||
2016 |
3,103 | |||
2017 |
3,047 | |||
2018 |
3,087 | |||
2019 |
2,977 | |||
Thereafter |
16,156 | |||
| | | | | |
Total |
$ | 31,400 | ||
| | | | | |
| | | | | |
| | | | | |
90
THORATEC CORPORATION
NOTES TO CONSOLIDATED FINANCIAL STATEMENTS (Continued)
Note 7. Commitments and Contingencies (Continued)
Rent expense for all operating leases for fiscal 2014, 2013, and 2012 was $3.9 million, $3.3 million, and $2.9 million, respectively.
Commitments
We have purchase order commitments, including both supply and inventory related agreements, totaling $73.8 million and $58.8 million as of January 3, 2015 and December 28, 2013, respectively.
We enter into standard indemnification provisions with many of our customers and certain other business partners in the ordinary course of business. These provisions include obligations to indemnify the customers, distributors and certain vendors against any claim brought by a third party to the extent any such claim alleges that our products infringe an intellectual property right of a third party, that the use of our products caused injury or death, or that our products were defective, in each case subject to certain limitations, including that the products be used in strict accordance with their FDA approved labeling. The maximum potential amount of future payments we could be required to make under these indemnification obligations is not estimable. However, we have not incurred any significant costs to defend lawsuits or settle claims related to these indemnification obligations. No material claims for such indemnification were outstanding as of January 3, 2015. We have not recorded any liabilities for these indemnification obligations as of January 3, 2015 and December 28, 2013.
Note 8. Credit Facility
On December 19, 2011, we signed an unsecured revolving credit facility agreement that provides for up to $50.0 million revolving credit that will expire on December 19, 2016. The interest rate charged on the amounts borrowed is LIBOR plus a margin (ranging from 0.75% to 1.25%). The agreement contains financial covenants with which we were in compliance as of January 3, 2015. The credit agreement permits us to use the facility for working capital and general corporate purposes. We have not had any borrowings under this credit facility in fiscal years 2014, 2013, and 2012.
Note 9. Share-Based Compensation
The 2006 Incentive Stock Plan (the "2006 Plan") was last amended in May 2014. Participation in the 2006 Plan is limited to employees, directors, and consultants. Shares reserved for future issuance under the 2006 Plan may be used for grants of options, RSUs, PSUs and other types of awards. Options granted under the 2006 Plan are either incentive or nonqualified stock options and generally become exercisable in equal annual installments over a period of four years from the date of grant and expire generally ten years from the grant date. RSUs generally vest in equal annual installments over a four-year period. PSUs generally vest over the performance period when the performance or market conditions are met.
The Board of Directors authorizes the granting of options, RSUs, PSUs and other type of awards to employees and consultants. The exercise prices of the options shall not be less than the fair market value of common stock on the date of grant. The fair value of RSUs granted is determined based on the number of RSUs granted and the quoted price of our common stock on the date of grant. As of January 3, 2015, approximately 2.7 million shares remained available for issuance under the 2006 Plan.
Additionally, we sponsor the Employee Stock Purchase Plan (the "ESPP") in which eligible employees may contribute up to 15% of their base compensation to purchase shares of common stock
91
THORATEC CORPORATION
NOTES TO CONSOLIDATED FINANCIAL STATEMENTS (Continued)
Note 9. Share-Based Compensation (Continued)
at a price equal to 85% of the lower of the market value of the stock at the beginning or end of each six-month offer period. In fiscal 2014, 187,860 shares of common stock were issued under the ESPP. As of January 3, 2015, 91,490 shares remained available for issuance under this plan.
Share-based compensation expense is presented on a consolidated basis and consists of the following:
| |
Fiscal Years | |||||||||
|---|---|---|---|---|---|---|---|---|---|---|
| |
2014 | 2013 | 2012 | |||||||
| |
(in thousands) |
|||||||||
Cost of product sales |
$ | 2,890 | $ | 2,365 | $ | 2,130 | ||||
Selling, general and administrative |
21,790 | 16,897 | 13,235 | |||||||
Research and development |
9,629 | 7,735 | 6,327 | |||||||
| | | | | | | | | | | |
Total share-based compensation expense before taxes |
34,309 | 26,997 | 21,692 | |||||||
Tax benefit for share-based compensation expense |
13,722 | 10,083 | 8,501 | |||||||
| | | | | | | | | | | |
Total share-based compensation expense (net of taxes) |
$ | 20,587 | $ | 16,914 | $ | 13,191 | ||||
| | | | | | | | | | | |
| | | | | | | | | | | |
| | | | | | | | | | | |
We receive a tax deduction for certain option exercises during the period the options are exercised, generally for the excess of the fair market value of the options at the date of exercise over the exercise prices of the options. The excess tax benefits (expense) (i.e., additional tax deductions in excess of the share-based compensation expense recognized) are reported as financing cash flows of $(0.1) million, $2.4 million, and $3.2 million for fiscal 2014, 2013, and 2012, respectively, on the consolidated statements of cash flows.
Cash proceeds from the exercise of options were $3.3 million, $16.7 million, and $10.1 million for fiscal 2014, 2013, and 2012, respectively. Cash proceeds from our ESPP were $4.9 million, $4.4 million, and $3.5 million for fiscal 2014, 2013, and 2012, respectively. The actual income tax benefit (expense) realized from option exercises was $(0.4) million, $2.4 million, and $3.4 million for fiscal 2014, 2013, and 2012, respectively.
Stock Options
The fair value of each option is estimated at the date of grant using the Black-Scholes option pricing formula with the following assumptions:
| |
Fiscal Years | |||||
|---|---|---|---|---|---|---|
| |
2014 | 2013 | 2012 | |||
Risk-free interest rate |
2.11% | 1.40% | 1.40% | |||
Expected volatility |
37% | 37% | 43% | |||
Expected option life |
4.63 - 5.26 years | 4.92 - 5.71 years | 4.76 - 5.84 years | |||
Dividends |
None | None | None | |||
Determining Fair Value for Options
- •
- Valuation and amortization method—We estimate the fair value of options granted using the Black-Scholes option-pricing formula. This fair value is then amortized over the requisite service periods of the awards.
92
THORATEC CORPORATION
NOTES TO CONSOLIDATED FINANCIAL STATEMENTS (Continued)
Note 9. Share-Based Compensation (Continued)
- •
- Expected term—The expected term of options represents the period of time
that options are expected to be outstanding. We use separate assumptions for groups of employees (for example, officers) that have similar historical exercise behavior, giving consideration to the
contractual terms of the share-based awards, vesting schedules and expectations of future employee behavior as influenced by changes to the terms of our share-based awards. The range above reflects
the expected option impact of these separate groups.
- •
- Expected volatility—Our expected volatility was based on a combination of
historical volatility trends and market-based implied volatility because we determined that this combination of historical volatility trends and market-based implied trends is reflective of market
conditions. In determining the extent of use of implied volatility, we considered: (i) the volume of market activity of traded options; (ii) the ability to reasonably match the input
variables of traded options to those of stock options granted by us, including the date of grant; (iii) the similarity of the exercise prices; and (iv) the length of term of traded
options.
- •
- Risk-free interest rate—The risk-free interest rate is based on the U.S.
Treasury yield curve on the date of grant.
- •
- Expected dividend—The expected dividend assumption is based on our current expectations about our anticipated dividend policy.
Option activity is summarized as follows:
| |
Number of Options (in thousands) |
Weighted Average Exercise Price Per Share |
Weighted Average Remaining Contract Life (years) |
|||||||
|---|---|---|---|---|---|---|---|---|---|---|
Outstanding as of December 31, 2011 (1,484 exercisable at $19.04 weighted average price per share) |
2,538 | $ | 22.46 | 5.96 | ||||||
Granted |
602 | 33.74 | ||||||||
Cancelled and expired |
(76 | ) | 31.13 | |||||||
Exercised |
(566 | ) | 17.78 | |||||||
| | | | | | | | | | | |
Outstanding as of December 29, 2012 (1,265 exercisable at $21.29 weighted average price per share) |
2,498 | $ | 25.98 | 6.27 | ||||||
Granted |
596 | 35.70 | ||||||||
Cancelled and expired |
(74 | ) | 32.45 | |||||||
Exercised |
(759 | ) | 21.97 | |||||||
| | | | | | | | | | | |
Outstanding as of December 28, 2013 (926 exercisable at $24.57 weighted average price per share) |
2,261 | $ | 29.68 | 6.95 | ||||||
Granted |
775 | 33.20 | ||||||||
Cancelled and expired |
(133 | ) | 34.64 | |||||||
Exercised |
(166 | ) | 19.72 | |||||||
| | | | | | | | | | | |
Outstanding as of January 3, 2015 |
2,737 | $ | 31.04 | 6.95 | ||||||
| | | | | | | | | | | |
| | | | | | | | | | | |
| | | | | | | | | | | |
As of January 3, 2015, there was $8.3 million of unrecognized compensation expense, net of estimated forfeitures, related to options, which we expect to recognize over a weighted average period of 1.38 years. The aggregate intrinsic value of in-the-money options outstanding as of January 3, 2015 was $7.9 million. The total intrinsic value of options exercised during fiscal 2014, 2013, and 2012 was
93
THORATEC CORPORATION
NOTES TO CONSOLIDATED FINANCIAL STATEMENTS (Continued)
Note 9. Share-Based Compensation (Continued)
$2.6 million, $12.8 million, and $10.0 million, respectively. The weighted average grant-date fair value of options granted during fiscal 2014, 2013, and 2012 was $14.86 per share, $13.00 per share, and $14.99 per share, respectively.
The following table summarizes outstanding options that have vested or are expected to vest and are exercisable as of January 3, 2015:
| |
Number of Shares |
Weighted Average Exercise Price |
Weighted Average Remaining Contractual Term |
Aggregate Intrinsic Value |
|||||||||
|---|---|---|---|---|---|---|---|---|---|---|---|---|---|
| |
(in thousands) |
|
(in years) |
(in millions) |
|||||||||
Vested or expected to vest |
2,659 | $ | 30.96 | 6.9 | $ | 7.8 | |||||||
Exercisable |
1,254 | $ | 28.19 | 5.2 | $ | 6.4 | |||||||
Options outstanding as of January 3, 2015 are summarized as follows:
| |
Options Outstanding | Options Exercisable | ||||||||||||||
|---|---|---|---|---|---|---|---|---|---|---|---|---|---|---|---|---|
| |
(in thousands, except contractual life and exercise price) | |||||||||||||||
Exercise Price Range
|
Number | Weighted Average Remaining Contractual Life (In Years) |
Weighted Average Exercise Price |
Number | Weighted Average Exercise Price |
|||||||||||
$9.44 - $27.30 |
827 | 5.12 | $ | 24.10 | 615 | $ | 23.26 | |||||||||
$28.10 - $33.99 |
877 | 6.85 | 32.37 | 479 | 31.91 | |||||||||||
$34.50 - $35.68 |
994 | 8.51 | 35.32 | 144 | 35.60 | |||||||||||
$35.92 - $42.89 |
36 | 7.76 | 38.45 | 15 | 39.96 | |||||||||||
$43.30 - $43.30 |
3 | 8.87 | 43.30 | 1 | 43.30 | |||||||||||
| | | | | | | | | | | | | | | | | |
|
2,737 | 6.95 | $ | 31.04 | 1,254 | $ | 28.19 | |||||||||
| | | | | | | | | | | | | | | | | |
| | | | | | | | | | | | | | | | | |
| | | | | | | | | | | | | | | | | |
Restricted Stock Units
As of January 3, 2015, we had $35.8 million of unrecognized compensation expense, net of estimated forfeitures, related to both equity and liability awards, which we expect to recognize over a weighted average period of 2.4 years. The aggregate intrinsic value of the RSUs outstanding was $51.3 million.
94
THORATEC CORPORATION
NOTES TO CONSOLIDATED FINANCIAL STATEMENTS (Continued)
Note 9. Share-Based Compensation (Continued)
RSU activity is summarized as follows:
| |
Number of Units (in thousands) |
Weighted Average Grant Date Fair Value |
Weighted Average Remaining Contract (in Years) |
|||||||
|---|---|---|---|---|---|---|---|---|---|---|
Outstanding units as of December 31, 2011 |
1,151 | $ | 28.88 | 1.50 | ||||||
Granted |
730 | 34.22 | ||||||||
Released |
(327 | ) | 28.54 | |||||||
Forfeited or expired |
(92 | ) | 30.74 | |||||||
| | | | | | | | | | | |
Outstanding units as of December 29, 2012 |
1,462 | $ | 31.52 | 1.37 | ||||||
Granted |
649 | 35.30 | ||||||||
Released |
(553 | ) | 30.74 | |||||||
Forfeited or expired |
(97 | ) | 32.91 | |||||||
| | | | | | | | | | | |
Outstanding units as of December 28, 2013 |
1,461 | $ | 33.40 | 1.27 | ||||||
Granted |
850 | 32.65 | ||||||||
Released |
(636 | ) | 32.43 | |||||||
Forfeited or expired |
(102 | ) | 34.72 | |||||||
| | | | | | | | | | | |
Outstanding units as of January 3, 2015 |
1,573 | $ | 33.31 | 1.36 | ||||||
| | | | | | | | | | | |
| | | | | | | | | | | |
| | | | | | | | | | | |
During the fourth quarter of fiscal 2014, we recorded a $2.9 million out-of-period adjustment to stock based compensation expense related to RSUs granted to certain employees from 2006 to 2014 that should have been accounted for as liability awards and re-measured at fair value at the end of each reporting period, with the changes in fair value recorded to stock-based compensation expense in the period in which the change occurs. The adjustment was not considered material to the fiscal year ended January 3, 2015 or any previously issued interim or annual consolidated financial statements.
Performance Share Units
We may issue PSUs representing hypothetical shares of our common stock. Each PSU reflects multiple shares that may be issued to the award recipient, with the number of shares to be issued determined based on performance and market conditions (referred to as either a "Performance Condition PSU" or a "Market Condition PSU"). The actual number of shares the recipient receives at the end of a performance period may range from 0% up to 200% of the target shares granted. Recipients generally must remain employed by us on a continuous basis through the end of the applicable performance period in order to receive shares subject to that award. The stock-based compensation costs for these PSUs, net of estimated forfeitures, are recorded over the three- or four-year vesting period based on a graded accelerated vesting method.
With respect to Performance Condition PSUs, any change in estimates affecting the number of shares to be issued upon vesting of the PSUs would be accounted for as a cumulative adjustment to the compensation expense in the period in which the change occurs. In 2014, we issued approximately 69,000 Performance Condition PSUs, which based on a change in management's estimate in 2014, resulted in our estimate that no shares are expected to be issuable.
On September 22, 2014, we granted approximately 188,000 Market Condition PSUs to our President and Chief Executive Officer. Share-based compensation expense related to these Market
95
THORATEC CORPORATION
NOTES TO CONSOLIDATED FINANCIAL STATEMENTS (Continued)
Note 9. Share-Based Compensation (Continued)
Condition PSUs was $0.6 million in 2014. As of January 3, 2015, we had $5.2 million of unrecognized compensation expense, net of estimated forfeitures, which we expect to recognize over a weighted average period of 2.75 years.
Employee Stock Purchase Plan
The estimated subscription date fair value of the offering under the ESPP for each of fiscal year 2014, 2013, and 2012 were $0.6 million as calculated using the Black-Scholes option pricing model and the following assumptions:
| |
Fiscal Years | |||||||||
|---|---|---|---|---|---|---|---|---|---|---|
| |
2014 | 2013 | 2012 | |||||||
Risk-free interest rate |
0.07 | % | 0.08 | % | 0.15 | % | ||||
Expected volatility |
34 | % | 29 | % | 39 | % | ||||
Expected option life |
0.50 years | 0.50 years | 0.50 years | |||||||
Dividends |
None | None | None | |||||||
As of January 3, 2015, there was $0.3 million of unrecognized compensation expense related to ESPP subscriptions that began on November 16, 2014, which we expect to recognize during the first 4.5 months of 2015.
Note 10. Common and Preferred Stock
We authorized 100 million shares of no par common stock, and 2.5 million shares of no par preferred stock, of which 540,541 shares have been designated Series A, 500,000 shares have been designated Series B and 100,000 shares have been designated Series RP.
The Series A preferred stock is entitled to cumulative annual dividends of $1.30 per share and has a liquidation preference of $9.25 per share plus cumulative unpaid dividends. We may redeem the Series A preferred stock at any time for its liquidation preference. Each share of Series A preferred stock is convertible into one-third of a share of common stock, after adjusting for earned but unpaid dividends. No shares of Series A preferred stock were outstanding for all periods presented.
The Series B preferred stock is senior to the Series A in all preferences. The Series B preferred stock is entitled to cumulative annual dividends of $0.96 per share and has a liquidation preference of $8.00 per share plus cumulative unpaid dividends. The Series B preferred stock is redeemable by us five years after its issuance for its liquidation preference. Each share of Series B preferred stock is convertible at any time into three and one-third shares of common stock and has certain anti-dilution provisions. Series B preferred shares vote on an as-converted basis. As of January 3, 2015, no shares of Series B preferred stock were outstanding.
96
THORATEC CORPORATION
NOTES TO CONSOLIDATED FINANCIAL STATEMENTS (Continued)
Note 10. Common and Preferred Stock (Continued)
On December 5, 2013, the Board of Directors authorized a new program to repurchase up to $200.0 million of our shares of common stock ("December 2013 program"), which will expire on December 31, 2015. In the three and twelve months ended January 3, 2015, we repurchased $37.0 million and $105.0 million, respectively, worth of shares of our common stock under the December 2013 program, of which $3.7 million was accrued in our consolidated balance sheets as of January 3, 2015 (reported in "other accrued liabilities") given that the cash settlement of the shares repurchased at the end of fiscal 2014 was not settled until after January 3, 2015. In addition, we repurchased $1.2 million worth of shares of our common stock in the first quarter of 2014 under our previous November 2012 program which expired in the first quarter of fiscal 2014. As of January 3, 2015, $95.0 million was available for repurchases of shares of our common stock under the December 2013 program. The December 2013 program may be accelerated, suspended, delayed or discontinued at any time.
We are incorporated in California, and as California law does not recognize treasury stock, the shares repurchased decreased the common shares outstanding. We recorded the $106.2 million of shares repurchased in the fiscal year ended January 3, 2015 by reducing the additional paid-in capital (APIC) balance by the average value per share reflected in the account prior to the repurchase and allocating the excess as a reduction of retained earnings. Based on this allocation, APIC decreased by $43.8 million and retained earnings decreased by $62.4 million in the consolidated statement of shareholders' equity.
We also purchased shares of our common stock that were not part of our publicly announced repurchase program, which represent the surrender value of shares of RSUs withheld in order to satisfy tax withholding obligations upon vesting. The shares purchased do not reduce the dollar value that may yet be purchased under our publicly announced repurchase programs. The aggregate value of shares purchased in 2014 was $8.3 million, which decreased APIC and retained earnings by $2.9 million and $5.4 million, respectively, based on the same allocation methodology discussed above. The aggregate value of shares purchased in 2013 was $7.6 million, which decreased APIC and retained earnings by $2.5 million and $5.1 million, respectively.
Note 11. Retirement Savings Plans
Substantially all of our U.S. employees are eligible to participate in a 401(k) retirement savings plan (the "Retirement Plan"). Under the Retirement Plan, employees may elect to contribute up to 100% of their eligible compensation to the Retirement Plan with the Company making discretionary matching contributions, subject to certain IRS limitations. The matching contribution was 50%, up to the first 6% of eligible employee plan contribution. Employees vest in the matching contribution at the rate of 25% per year, with full vesting after four years of service with us. In fiscal 2014, 2013, and 2012, we made matching contributions of $2.5 million, $2.3 million, and $2.0 million, respectively.
97
THORATEC CORPORATION
NOTES TO CONSOLIDATED FINANCIAL STATEMENTS (Continued)
Note 11. Retirement Savings Plans (Continued)
In 2004, we established a non-qualified, unfunded deferred compensation plan for certain management employees and our Board of Directors. Amounts deferred and contributed under the deferred compensation plan are credited or charged with the performance of investment options offered under the plan and elected by the participants. The liability for compensation deferred under this plan was $6.7 million and $5.9 million as of January 3, 2015 and December 28, 2013, respectively, and is included in "Other long-term liabilities" on our consolidated balance sheets. We manage the risk of changes in the fair value of the liability for deferred compensation by electing to match our liability under the plan with investments that offset a substantial portion of our exposure. The cash surrender value of these corporate owned life insurance policies and the fair value of the mutual fund investments aggregated $6.0 million and $5.2 million as of January 3, 2015 and December 28, 2013, respectively, and are included in "Other long-term assets" on the consolidated balance sheets.
Note 12. Income Taxes
Significant components of income taxes are as follows:
| |
Fiscal Years | |||||||||
|---|---|---|---|---|---|---|---|---|---|---|
| |
2014 | 2013 | 2012 | |||||||
| |
(in thousands) |
|||||||||
Current: |
||||||||||
Federal |
$ | 13,442 | $ | 25,909 | $ | 37,056 | ||||
State |
2,429 | 2,942 | 5,584 | |||||||
Foreign |
7,349 | 7,224 | 6,348 | |||||||
| | | | | | | | | | | |
|
23,220 | 36,075 | 48,988 | |||||||
Deferred: |
||||||||||
Federal |
(3,878 | ) | (9,363 | ) | (24,536 | ) | ||||
State |
(947 | ) | (503 | ) | (3,280 | ) | ||||
Foreign |
(693 | ) | 220 | (18 | ) | |||||
| | | | | | | | | | | |
|
(5,518 | ) | (9,646 | ) | (27,834 | ) | ||||
| | | | | | | | | | | |
Total income tax expense |
$ | 17,702 | $ | 26,429 | $ | 21,154 | ||||
| | | | | | | | | | | |
| | | | | | | | | | | |
| | | | | | | | | | | |
Income from operations before taxes generated from geographic areas is as follows:
| |
Fiscal Years | |||||||||
|---|---|---|---|---|---|---|---|---|---|---|
| |
2014 | 2013 | 2012 | |||||||
| |
(in thousands) |
|||||||||
Operations: |
||||||||||
Domestic |
$ | 30,810 | $ | 73,766 | $ | 50,351 | ||||
Foreign |
37,283 | 25,989 | 26,966 | |||||||
| | | | | | | | | | | |
Total income from operations before taxes |
$ | 68,093 | $ | 99,755 | $ | 77,317 | ||||
| | | | | | | | | | | |
| | | | | | | | | | | |
| | | | | | | | | | | |
98
THORATEC CORPORATION
NOTES TO CONSOLIDATED FINANCIAL STATEMENTS (Continued)
Note 12. Income Taxes (Continued)
The income tax expense in the accompanying statements of operations differs from the provision calculated by applying the U.S. federal statutory income tax rate of 35% to income before taxes due to the following:
| |
Fiscal Years | ||||||||||||||||||
|---|---|---|---|---|---|---|---|---|---|---|---|---|---|---|---|---|---|---|---|
| |
2014 | 2013 | 2012 | ||||||||||||||||
| |
(in thousands, except percentages) |
||||||||||||||||||
U.S. federal statutory income tax expense |
$ | 23,833 | 35.0 | % | $ | 34,914 | 35.0 | % | $ | 27,061 | 35.0 | % | |||||||
State income tax expense/(benefit), net of federal tax benefit |
(238 | ) | (0.3 | ) | 1,286 | 1.3 | 573 | 0.7 | |||||||||||
Non-deductible expenses |
375 | 0.6 | (93 | ) | (0.1 | ) | (326 | ) | (0.4 | ) | |||||||||
Research and development credits |
(2,322 | ) | (3.4 | ) | (4,676 | ) | (4.7 | ) | — | — | |||||||||
Foreign earnings permanently reinvested |
(2,445 | ) | (3.6 | ) | (1,891 | ) | (1.9 | ) | (2,348 | ) | (3.0 | ) | |||||||
Tax advantaged investment income |
(218 | ) | (0.3 | ) | (211 | ) | (0.2 | ) | (294 | ) | (0.4 | ) | |||||||
Return-to-provision true-up |
(737 | ) | (1.1 | ) | 395 | 0.4 | (563 | ) | (0.7 | ) | |||||||||
Compensation limitation write-down/(write-up) |
(605 | ) | (0.9 | ) | 638 | 0.6 | 536 | 0.7 | |||||||||||
Domestic production activities |
(1,555 | ) | (2.3 | ) | (2,698 | ) | (2.7 | ) | (3,225 | ) | (4.2 | ) | |||||||
Valuation allowance increase/(decrease) |
373 | 0.5 | (127 | ) | (0.1 | ) | (4 | ) | — | ||||||||||
Other |
17 | — | 112 | 0.1 | (319 | ) | (0.4 | ) | |||||||||||
Tax reserves |
1,224 | 1.8 | (1,220 | ) | (1.2 | ) | 63 | 0.1 | |||||||||||
| | | | | | | | | | | | | | | | | | | | |
Total income tax expense |
$ | 17,702 | 26.0 | % | $ | 26,429 | 26.5 | % | $ | 21,154 | 27.4 | % | |||||||
| | | | | | | | | | | | | | | | | | | | |
| | | | | | | | | | | | | | | | | | | | |
| | | | | | | | | | | | | | | | | | | | |
On January 2, 2013, the U.S. President signed into law The American Taxpayer Relief Act of 2012. This Act extended the research tax credit for two years to December 31, 2013. The extension of the research tax credit was retroactive and included amounts paid or incurred after December 31, 2011. As a result of the enactment after our fiscal year ended December 29, 2012, we recognized, in 2013, a benefit for qualifying amounts of $2.3 million incurred in 2012, which combined with the 2013 research and development credits, are reflected in "research and development credits" line in the table above. In addition, the 2014 federal research tax credit was retroactively extended in December 2014.
Deferred income taxes reflect the net tax effects of: (a) temporary differences between the carrying amounts of assets and liabilities for financial reporting purposes and the amounts used for income tax purposes, and (b) operating loss and tax credit carry forwards.
99
THORATEC CORPORATION
NOTES TO CONSOLIDATED FINANCIAL STATEMENTS (Continued)
Note 12. Income Taxes (Continued)
Significant components of deferred tax assets and liabilities are as follows:
| |
January 3, 2015 | December 28, 2013 | |||||
|---|---|---|---|---|---|---|---|
| |
(in thousands) |
||||||
Deferred tax assets: |
|||||||
Reserves and accruals |
$ | 10,098 | $ | 9,822 | |||
Inventory basis difference |
4,168 | 3,051 | |||||
Share-based compensation |
14,755 | 11,114 | |||||
Research and development and other credit carry forwards |
5,200 | 4,908 | |||||
NOL carryovers |
1,330 | — | |||||
Capital loss carryovers |
4,574 | 4,644 | |||||
Other, net |
1,217 | 530 | |||||
| | | | | | | | |
Total deferred tax assets |
41,342 | 34,069 | |||||
Valuation allowance |
(4,948 | ) | (4,644 | ) | |||
| | | | | | | | |
|
36,394 | 29,425 | |||||
| | | | | | | | |
Deferred tax liabilities: |
|||||||
Depreciation and amortization(1) |
(5,320 | ) | (2,055 | ) | |||
Other, net |
— | (304 | ) | ||||
| | | | | | | | |
Total deferred tax liabilities |
(5,320 | ) | (2,359 | ) | |||
| | | | | | | | |
Net deferred tax assets |
$ | 31,074 | $ | 27,066 | |||
| | | | | | | | |
| | | | | | | | |
| | | | | | | | |
Reported As: |
|||||||
Current deferred tax assets |
$ | 15,727 | $ | 15,161 | |||
Other long-term assets—deferred tax assets |
19,073 | 14,331 | |||||
Short-term deferred tax liabilities included in other accrued liabilities |
(134 | ) | (202 | ) | |||
Net long-term deferred tax liabilities |
(3,592 | ) | (2,224 | ) | |||
| | | | | | | | |
Net deferred tax assets |
$ | 31,074 | $ | 27,066 | |||
| | | | | | | | |
| | | | | | | | |
| | | | | | | | |
- (1)
- Amount previously reported as of December 28, 2013 as "purchased intangibles" for intangible asset basis differences within deferred tax assets have been combined to correctly present with all other intangible asset basis differences in the "Depreciation and amortization" line within deferred tax liabilities. The deferred tax assets and liabilities reported in our consolidated balance sheet at December 28, 2013 remain unchanged.
As of January 3, 2015, we had research and development tax credit carryovers for state purposes of $11.4 million. The majority of these state credits may be carried forward indefinitely.
As of January 3, 2015, we had $11.9 million of federal and state capital losses remaining from 2010, which may generally be carried back three years for federal purposes and carried forward five years up to 2015 for both federal and California purposes, which is fully reserved with a valuation allowance.
100
THORATEC CORPORATION
NOTES TO CONSOLIDATED FINANCIAL STATEMENTS (Continued)
Note 12. Income Taxes (Continued)
The valuation allowance for deferred tax assets as of January 3, 2015 and December 28, 2013, was approximately $4.9 million and $4.6 million, respectively. The valuation allowance of $4.9 million as of January 3, 2015, is related to capital loss and state tax credit carry forwards that, in the judgment of management, are more likely than not to be unrealizable. In assessing the recoverability of deferred tax assets, management considers whether it is more likely than not that some or all of the deferred tax assets will not be realized. The ultimate realization of deferred tax assets depends on the generation of future taxable income of the appropriate character during the periods in which those temporary differences are deductible. We do not currently anticipate recognizing capital gains that would enable us to utilize the capital loss carry forwards; therefore we have recorded a full valuation allowance against this deferred tax asset. We believe realization of all of our remaining net deferred tax assets as of January 3, 2015 is more likely than not based on the future reversal of temporary tax differences and upon future taxable earnings exclusive of reversing temporary differences.
We utilize the "short-cut" method for purposes of determining our hypothetical stock option pool of excess tax benefits. As of January 3, 2015, the stock option pool of excess tax benefits was $30.5 million.
The federal, state and foreign provisions do not reflect certain tax savings resulting from tax benefits associated with our various stock option plans. The savings were credited to additional paid-in-capital for $(0.4) million, $2.4 million, and $3.4 million in fiscal 2014, 2013, and 2012, respectively.
We provide for U.S. income taxes on the earnings of foreign subsidiaries unless such earnings are considered permanently reinvested in their respective foreign jurisdictions. As of January 3, 2015, the cumulative earnings on which U.S. income taxes have not been provided were $84.5 million. The amount of unrecognized deferred tax liability related to permanently reinvested earnings is $14.6 million. Foreign earnings were considered to be permanently reinvested in operations outside the U.S.
We evaluate tax positions for recognition using a more-likely- than-not recognition threshold, and those tax positions eligible for recognition are measured as the largest amount of tax benefit that is greater than 50% likely of being realized upon the effective settlement with a taxing authority that has full knowledge of all relevant information.
A reconciliation of the beginning and ending amount of gross unrecognized tax benefits is as follows:
| |
Fiscal Years | |||||||||
|---|---|---|---|---|---|---|---|---|---|---|
| |
2014 | 2013 | 2012 | |||||||
| |
(in thousands) |
|||||||||
Balance at beginning of fiscal year |
$ | 7,930 | $ | 9,965 | $ | 10,652 | ||||
Gross increases for tax positions related to the current year |
1,752 | 2,240 | 912 | |||||||
Gross increases for tax positions related to prior years |
1,160 | 1,418 | 282 | |||||||
Gross decreases for tax positions related to prior years |
(54 | ) | (466 | ) | (1,069 | ) | ||||
Settlements |
— | (2,528 | ) | (3 | ) | |||||
Lapse of statute of limitations |
(742 | ) | (2,699 | ) | (809 | ) | ||||
| | | | | | | | | | | |
Balance at end of fiscal year |
$ | 10,046 | $ | 7,930 | $ | 9,965 | ||||
| | | | | | | | | | | |
| | | | | | | | | | | |
| | | | | | | | | | | |
101
THORATEC CORPORATION
NOTES TO CONSOLIDATED FINANCIAL STATEMENTS (Continued)
Note 12. Income Taxes (Continued)
Included in the unrecognized tax benefits balance at January 3, 2015, December 28, 2013, and December 29, 2012, was $7.9 million, $6.7 million, and $8.1 million, respectively, which, if recognized, would impact our effective tax rate. Our policy for classifying interest and penalties associated with unrecognized income tax benefits is to include the following items in income tax expense:
| |
Fiscal Years | |||||||||
|---|---|---|---|---|---|---|---|---|---|---|
| |
2014 | 2013 | 2012 | |||||||
| |
(in thousands) |
|||||||||
Interest |
$ | 88 | $ | (198 | ) | $ | 27 | |||
Penalties |
— | (31 | ) | 22 | ||||||
Interest and penalties accrued on the consolidated balance sheets as of the end of each fiscal year:
| |
2014 | 2013 | |||||
|---|---|---|---|---|---|---|---|
| |
(in thousands) |
||||||
Interest |
$ | 321 | $ | 233 | |||
Penalties |
37 | 37 | |||||
We file U.S. federal tax returns, state tax returns and tax returns in other domestic and foreign jurisdictions, including the U.K., Switzerland and Ireland. The years 2011 through 2013 remain open to examination for U.S. purposes, 2011 through 2013 for U.K. purposes, 2011 through 2013 for Switzerland purposes, and 2010 through 2013 for most state jurisdictions. In 2015 and thereafter, it is reasonably possible that we will close certain years as a result of the lapse of the statute of limitations. This may further decrease our liability for unrecognized tax benefits by $1.9 million in 2015.
Note 13. Segment Disclosure
We have one operating and reporting segment (Cardiovascular group) which develops, manufactures and markets proprietary medical devices used for mechanical circulatory support for the treatment of heart failure patients. Our chief operating decision-maker reviews financial information presented on a consolidated basis for purposes of making operating decisions and assessing financial performance, accompanied by disaggregated revenue information by product line. We do not assess the performance of our individual product line on measures of profit or loss, or asset-based metrics. Therefore, the information below is presented only for revenues by product line, geography, and certain revenue category.
Product sales attributed to a country or region includes product sales to hospitals, physicians and distributors and is based on final destination where the products are sold. No individual customer accounted for more than 10% of product sales in fiscal 2014, 2013, and 2012. No individual customer accounted for more than 10% of consolidated accounts receivable as of January 3, 2015 and December 28, 2013.
102
THORATEC CORPORATION
NOTES TO CONSOLIDATED FINANCIAL STATEMENTS (Continued)
Note 13. Segment Disclosure (Continued)
Product sales by source were as follows:
| |
Fiscal Years | |||||||||
|---|---|---|---|---|---|---|---|---|---|---|
| |
2014 | 2013 | 2012 | |||||||
| |
(in thousands) |
|||||||||
Product sales by geographic location: |
||||||||||
Domestic (i.e. United States) |
$ | 375,164 | $ | 390,450 | $ | 400,526 | ||||
International |
102,396 | 112,371 | 91,128 | |||||||
| | | | | | | | | | | |
Total |
$ | 477,560 | $ | 502,821 | $ | 491,654 | ||||
| | | | | | | | | | | |
| | | | | | | | | | | |
| | | | | | | | | | | |
| |
Fiscal Years | |||||||||
|---|---|---|---|---|---|---|---|---|---|---|
| |
2014 | 2013 | 2012 | |||||||
| |
(in thousands) |
|||||||||
Product sales by product line: |
||||||||||
HeartMate |
$ | 415,966 | $ | 444,376 | $ | 434,546 | ||||
Thoratec |
9,196 | 12,482 | 19,035 | |||||||
CentriMag |
49,994 | 43,340 | 35,723 | |||||||
Other |
2,404 | 2,623 | 2,350 | |||||||
| | | | | | | | | | | |
Total |
$ | 477,560 | $ | 502,821 | $ | 491,654 | ||||
| | | | | | | | | | | |
| | | | | | | | | | | |
| | | | | | | | | | | |
| |
Fiscal Years | |||||||||
|---|---|---|---|---|---|---|---|---|---|---|
| |
2014 | 2013 | 2012 | |||||||
| |
(in thousands) |
|||||||||
Product sales by category: |
||||||||||
Pump |
$ | 337,179 | $ | 355,266 | $ | 356,310 | ||||
Non-pump |
137,977 | 144,932 | 132,994 | |||||||
Other |
2,404 | 2,623 | 2,350 | |||||||
| | | | | | | | | | | |
Total |
$ | 477,560 | $ | 502,821 | $ | 491,654 | ||||
| | | | | | | | | | | |
| | | | | | | | | | | |
| | | | | | | | | | | |
No individual country with sales originating outside of the U.S. accounted for more than 10% of consolidated product sales in fiscal 2014, 2013, and 2012. No individual country outside of the U.S. accounted for more than 10% of the consolidated property, plant and equipment as of January 3, 2015 and December 28, 2013.
Note 14. Earnings Per Share
Under the treasury stock method, the amount of assumed proceeds from unexercised options and RSUs include the amount of unrecognized compensation cost attributable to future services, assumed proceeds from the exercise of the options, and the incremental income tax benefit or liability that would be recorded in APIC when the award becomes deductible. PSUs are excluded from the shares used to compute diluted EPS until the performance or market conditions associated with the PSUs are met.
103
THORATEC CORPORATION
NOTES TO CONSOLIDATED FINANCIAL STATEMENTS (Continued)
Note 14. Earnings Per Share (Continued)
With respect to fiscal 2012, we previously granted restricted stock awards ("RSAs") under the 2006 Plan that were subject to repurchase and had non-forfeitable rights to receive dividends as common stock and therefore were considered to be participating securities. No RSAs have been issued since 2008 and all RSAs were fully vested at the end of fiscal 2012. Under the two-class method, basic and diluted net income per common share are determined by calculating net income per share for common stock and participating securities (e.g. RSAs) based on participation rights in undistributed earnings. Diluted net income per common share also considers the dilutive effect of in-the-money options and RSUs, calculated using the treasury stock methods.
Basic and diluted income per common share attributable to common shareholders under the two-class method was calculated as follows:
| |
Fiscal Years | |||||||||
|---|---|---|---|---|---|---|---|---|---|---|
| |
2014 | 2013 | 2012 | |||||||
| |
(in thousands, except per share data) |
|||||||||
Numerator |
||||||||||
Net income |
$ | 50,391 | $ | 73,326 | $ | 56,163 | ||||
Net income allocated to participating securities |
— | — | (12 | ) | ||||||
| | | | | | | | | | | |
Net income attributable to common shareholders |
$ | 50,391 | $ | 73,326 | $ | 56,151 | ||||
| | | | | | | | | | | |
| | | | | | | | | | | |
| | | | | | | | | | | |
Denominator |
||||||||||
Weighted average number of common shares used to compute basic EPS |
56,008 | 57,332 | 58,563 | |||||||
Dilutive effect of share-based compensation plans |
696 | 992 | 1,017 | |||||||
| | | | | | | | | | | |
Weighted average number of common shares used to compute diluted EPS |
56,704 | 58,324 | 59,580 | |||||||
| | | | | | | | | | | |
| | | | | | | | | | | |
| | | | | | | | | | | |
Net income per share |
||||||||||
Basic |
$ | 0.90 | $ | 1.28 | $ | 0.96 | ||||
| | | | | | | | | | | |
| | | | | | | | | | | |
| | | | | | | | | | | |
Diluted |
$ | 0.89 | $ | 1.26 | $ | 0.94 | ||||
| | | | | | | | | | | |
| | | | | | | | | | | |
| | | | | | | | | | | |
Potential common share equivalents that have been excluded where the inclusion would be anti-dilutive are as follows:
| |
Fiscal Years | |||||||||
|---|---|---|---|---|---|---|---|---|---|---|
| |
2014 | 2013 | 2012 | |||||||
| |
(in thousands) |
|||||||||
Options to purchase shares not included in the computation of diluted net income per common share because their inclusion would be antidilutive |
1,572 | 526 | 535 | |||||||
104
THORATEC CORPORATION
NOTES TO CONSOLIDATED FINANCIAL STATEMENTS (Continued)
Note 15. Quarterly Results of Operations (Unaudited)
The following is a summary of our unaudited quarterly results of operations for the fiscal 2014 and 2013:
| |
First | Second | Third | Fourth | |||||||||
|---|---|---|---|---|---|---|---|---|---|---|---|---|---|
| |
(in thousands, except per share data) |
||||||||||||
Fiscal Year 2014(A): |
|||||||||||||
Product sales |
$ | 125,697 | $ | 118,063 | $ | 105,839 | $ | 127,961 | |||||
Gross profit |
85,671 | 83,756 | 63,212 | 83,506 | |||||||||
Net income |
18,239 | 17,413 | 2,897 | 11,842 | |||||||||
Basic net income per common share |
$ | 0.32 | $ | 0.31 | $ | 0.05 | $ | 0.22 | |||||
Diluted net income per common share |
$ | 0.32 | $ | 0.30 | $ | 0.05 | $ | 0.21 | |||||
| |
First | Second | Third | Fourth | |||||||||
|---|---|---|---|---|---|---|---|---|---|---|---|---|---|
| |
(in thousands, except per share data) |
||||||||||||
Fiscal Year 2013: |
|||||||||||||
Product sales |
$ | 117,725 | $ | 130,479 | $ | 126,444 | $ | 128,173 | |||||
Gross profit |
82,652 | 89,479 | 85,486 | 81,652 | |||||||||
Net income |
18,170 | 23,189 | 18,904 | 13,063 | |||||||||
Basic net income per common share |
$ | 0.32 | $ | 0.40 | $ | 0.33 | $ | 0.23 | |||||
Diluted net income per common share |
$ | 0.31 | $ | 0.40 | $ | 0.32 | $ | 0.23 | |||||
- (A)
- During the fourth quarter of fiscal 2014, we recorded a $2.9 million out-of-period adjustment to stock based compensation expense related to RSUs granted to certain employees from 2006 to 2014 that should have been accounted for as liability awards and re-measured at fair value at the end of each reporting period, with the changes in fair value recorded to stock-based compensation expense in the period in which the change occurs. The adjustment was not considered material to the fiscal year ended January 3, 2015 or any previously issued interim or annual consolidated financial statements.
105
Item 9. Changes in and Disagreements with Accountants on Accounting and Financial Disclosure
None.
Item 9A. Controls and Procedures
Attached as exhibits to this Annual Report on Form 10-K are certifications of our Chief Executive Officer and Chief Financial Officer, which are required in accordance with Rule 13a-14 of the Securities Exchange Act of 1934, as amended (the "Exchange Act"). This "Controls and Procedures" section includes information concerning the controls and controls evaluation referred to in the certifications.
Disclosure Controls and Procedures
An evaluation was performed under the supervision and with the participation of our management, including our Chief Executive Officer and Chief Financial Officer, of the effectiveness of the design and operation of our disclosure controls and procedures, as defined in Rule 13a-15(e) under the Exchange Act, as of January 3, 2015. The evaluation of our disclosure controls and procedures included a review of our processes and implementation and the effect on the information generated for use in this Annual Report on Form 10-K. In the course of this evaluation, we sought to identify any significant deficiencies or material weaknesses in our disclosure controls and procedures, to determine whether we had identified any acts of fraud involving personnel who have a significant role in our disclosure controls and procedures, and to confirm that any necessary corrective action, including process improvements, was taken. This type of evaluation is done quarterly so that our conclusions concerning the effectiveness of these controls can be reported in our periodic reports filed with the SEC. The overall goals of these evaluation activities are to monitor our disclosure controls and procedures and to make modifications as necessary. We intend to maintain these disclosure controls and procedures, modifying them as circumstances warrant.
Based on that evaluation, our management, including the Chief Executive Officer and Chief Financial Officer, concluded that as of January 3, 2015, the Company's disclosure controls and procedures, as defined in Rule 13a-15(e) under the Exchange Act, were effective to provide reasonable assurance that information required to be disclosed by us in the reports that we file or submit under the Exchange Act is recorded, processed, summarized, and reported within the time periods specified in the SEC's rules and forms, and to provide reasonable assurance that such information is accumulated and communicated to our management, including our principal executive officer and principal financial officer, as appropriate to allow for timely decisions regarding required disclosures.
Management's Report on Internal Control Over Financial Reporting
Our management is responsible for establishing and maintaining adequate internal control over financial reporting to provide reasonable assurance regarding the reliability of our financial reporting and the preparation of financial statements for external purposes in accordance with generally accepted accounting principles.
Management assessed our internal control over financial reporting as of January 3, 2015, the end of our fiscal year. Management based its assessment on criteria established in "Internal Control—Integrated Framework (2013)" issued by the Committee of Sponsoring Organizations of the Treadway Commission. Management's assessment included evaluation of such elements as the design and operating effectiveness of key financial reporting controls, process documentation, accounting policies, and our overall control environment. This assessment is supported by testing and monitoring performed by our internal accounting and finance organization.
106
Based on our assessment, management has concluded that our internal control over financial reporting was effective as of January 3, 2015. The results of management's assessment were reviewed with the Audit Committee.
Our independent registered public accounting firm, Deloitte & Touche LLP, has issued a report on our internal control over financial reporting, which is included in Item 8 of this Annual Report on Form 10-K.
Changes to Internal Controls
There have been no changes in our internal controls over financial reporting during the quarter ended January 3, 2015 that have materially affected or are reasonably likely to materially affect our internal control over financial reporting.
Inherent Limitations on Controls and Procedures
Our management, including the Chief Executive Officer and the Chief Financial Officer, does not expect that our disclosure controls and procedures and our internal controls will prevent all errors and all fraud. A control system, no matter how well designed and operated, can only provide reasonable assurances that the objectives of the control system are met. The design of a control system reflects resource constraints; the benefits of controls must be considered relative to their costs. Because there are inherent limitations in all control systems, no evaluation of controls can provide absolute assurance that all control issues and instances of fraud, if any, within the Company have been or will be detected. As these inherent limitations are known features of the financial reporting process, it is possible to design into the process safeguards to reduce, though not eliminate, these risks. These inherent limitations include the realities that judgments in decision-making can be faulty and that breakdowns occur because of simple error or mistake. Controls can be circumvented by the individual acts of some persons, by collusion of two or more people, or by management override of the control. The design of any system of controls is based in part upon certain assumptions about the likelihood of future events. While our disclosure controls and procedures are designed to provide reasonable assurance of achieving their objectives, there can be no assurance that any design will succeed in achieving its stated goals under all future conditions. Over time, controls may become inadequate because of changes in conditions or deterioration in the degree of compliance with the policies or procedures. Because of the inherent limitations in a cost-effective control system, misstatements due to error or fraud may occur and not be detected.
We intend to review and evaluate the design and effectiveness of our disclosure controls and procedures on an ongoing basis and to improve our controls and procedures over time and to correct any deficiencies that we may discover in the future. While our Chief Executive Officer and Chief Financial Officer have concluded that, as of January 3, 2015, the design of our disclosure controls and procedures, as defined in Rule 13a-15(e) under the Exchange Act, was effective, future events affecting our business may cause us to significantly modify our disclosure controls and procedures.
None.
107
Item 10. Directors, Executive Officers and Corporate Governance
Certain information regarding our executive officers is included in Part I of this Annual Report on Form 10-K under the caption "Our Executive Officers." All other information regarding directors, executive officers and corporate governance required by Item 10 is incorporated herein by reference from the information under the captions "Board of Directors Structure and Compensation," "Election of Directors," "Section 16(a) Beneficial Ownership Reporting Compliance," "Code of Ethics and Corporate Governance," and in other applicable sections in the definitive proxy statement to be filed with the Securities and Exchange Commission pursuant to Regulation 14A for our 2015 annual meeting of shareholders.
Item 11. Executive Compensation
The information required by Item 11 is incorporated herein by reference from the information under the captions "Board of Directors Structure and Compensation," "Compensation Discussion and Analysis," "Report of the Compensation Committee of the Board of Directors" and "Executive Compensation" in the definitive proxy statement to be filed with the Securities and Exchange Commission pursuant to Regulation 14A for our 2015 annual meeting of shareholders.
Item 12. Security Ownership of Certain Beneficial Owners and Management and Related Stockholders Matters
The information required by Item 12 is incorporated herein by reference from the information under the captions "Security Ownership of Certain Beneficial Owners and Management" and "Securities Authorized for Issuance Under Equity Compensation Plans" in the definitive proxy statement to be filed with the Securities and Exchange Commission pursuant to Regulation 14A for our 2015 annual meeting of shareholders.
Item 13. Certain Relationships and Related Transactions, and Director Independence
The information required by Item 13 is incorporated herein by reference from the information under the caption "Certain Transactions" and "Board of Directors Structure and Compensation" in the definitive proxy statement to be filed with the Securities and Exchange Commission pursuant to Regulation 14A for our 2015 annual meeting of shareholders.
Item 14. Principal Accountant Fees and Services
The information required by Item 14 is incorporated herein by reference from the information under the caption "Fees Paid to Accountants for Services Rendered During Fiscal Years 2014 and 2013" in the definitive proxy statement to be filed with the Securities and Exchange Commission pursuant to Regulation 14A for our 2015 annual meeting of shareholders.
108
Item 15. Exhibit and Financial Statement Schedules
- (a)
- List
of documents filed as part of this report:
- 1.
- Financial Statements and Reports of Independent Registered Public Accounting Firm.
- 2.
- Financial Statement Schedules
Reference is made to the Index to Financial Statements under Item 8 of Part II of this Annual Report on Form 10-K, where these documents are included.
- 3.
- Exhibits
Schedule II—Valuation and Qualifying Accounts and Reserves for each of the three fiscal years ended January 3, 2015, December 28, 2013, and December 29, 2012. Other financial statement schedules are not included either because they are not required or the information is otherwise shown in our audited consolidated financial statements or the notes thereto.
Reference is made to the Exhibit Index on page 111 of this Annual Report on Form 10-K, where these documents are included.
109
THORATEC CORPORATION
SCHEDULE II—VALUATION AND QUALIFYING ACCOUNTS AND RESERVES
For Each of the Three Fiscal Years:
| |
Balance Beginning of Year |
Additions (charges to expense) |
Deductions | Balance End of Year |
|||||||||
|---|---|---|---|---|---|---|---|---|---|---|---|---|---|
| |
(in thousands) |
||||||||||||
Year Ended January 3, 2015(A): |
|||||||||||||
Allowance for doubtful accounts |
$ | 2,163 | $ | 2,321 | $ | (2,980 | ) | $ | 1,504 | ||||
Inventory reserves |
$ | 6,783 | $ | 5,562 | $ | (3,055 | ) | $ | 9,290 | ||||
Year Ended December 28, 2013(A): |
|||||||||||||
Allowance for doubtful accounts |
$ | 2,127 | $ | 1,106 | $ | (1,070 | ) | $ | 2,163 | ||||
Inventory reserves |
$ | 7,260 | $ | 2,508 | $ | (2,985 | ) | $ | 6,783 | ||||
Year Ended December 29, 2012(A): |
|||||||||||||
Allowance for doubtful accounts |
$ | 2,153 | $ | 36 | $ | (62 | ) | $ | 2,127 | ||||
Inventory reserves |
$ | 9,292 | $ | 1,313 | $ | (3,345 | ) | $ | 7,260 | ||||
- (A)
- The valuation and qualifying accounts and reserves.
110
| Exhibit Number |
Exhibit | ||
|---|---|---|---|
| 2.1 | Agreement and Plan of Merger by and among Levitronix LLC, Levitronix Technologies LLC, Pharos, LLC the Sellers named herein, the Consenting Parent Equity Holders named herein, Pharos, LLC, as the Sellers Representative, Thoratec Corporation, as the Purchaser, and Revere Merger Sub, LLC, as the Transitory Subsidiary dated as of August 3, 2011.(4) | ||
| 2.2 | Asset Purchase Agreement by and among Terumo Corporation, Terumo Heart Inc., and Thoratec Corporation, dated June 30, 2013.(5) | ||
| 2.3 | Equity Purchase Agreement, dated as of July 2, 2014, by and among Thoratec Switzerland GmbH, Apica Cardiovascular Limited, certain stockholders of Apica and the representative of such stockholders named therein and, for certain purposes set forth therein, Thoratec Corporation.(6) | ||
| 2.2 | Share Purchase Agreement, dated as of July 2, 2014, by and among Thoratec Switzerland GmbH, Enterprise Ireland and, for certain purposes set forth therein, Thoratec Corporation.(6) | ||
| 3.1 | (a) | Thoratec's Articles of Incorporation, as amended.(1) | |
| 3.2 | (b) | Amendment to Thoratec's Articles of Incorporation.(2) | |
| 3.2 | Thoratec's Amended and Restated By-Laws, as amended September 16, 2014.(3) | ||
| 10.1 | Form of Indemnification Agreement between Thoratec and its officers and directors.(7) | ||
| 10.2 | Lease Agreement dated July 25, 1996, between Main Street Associates and Thoratec, as amended.(8) | ||
| 10.3 | First Amendment to Lease Agreement originally between Main Street Associates and Thoratec dated July 25, 1996.(9) | ||
| 10.4 | Second Amendment to Lease Agreement originally between Main Street Associates and Thoratec dated July 25, 1996.(10) | ||
| 10.5 | Third Amendment to Lease, by and among Thoratec, Main Street Associates, and EJC Partners, L.P. dated October 6, 2011.(11) | ||
| 10.6 | Thoratec's 1997 Stock Option Plan, as amended.(12)* | ||
| 10.7 | Thoratec's 2002 Employee Stock Purchase Plan.(13)* | ||
| 10.8 | Thoratec Corporation Amended and Restated 2006 Incentive Stock Plan.(7)* | ||
| 10.9 | Grantor Trust Agreement between Thoratec and Wachovia Bank, National Association effective as of November 21, 2003.(14) | ||
| 10.10 | Description of the Executive Disability Income Protection Program.(15)* | ||
| 10.11 | Amended and Restated Separation Benefits Agreement by and between Thoratec and David A. Lehman, dated April 23, 2007.(16)* | ||
| 10.12 | Thoratec Corporation Amended and Restated Nonqualified Deferred Compensation Plan.(11)* | ||
| 10.13 | Description of Director Compensation Program.(17) | ||
| 10.14 | Amendment to the Amended and Restated Separation Benefits Agreement by and between Thoratec and David A. Lehman, dated November 16, 2009.(18)* | ||
| 10.15 | Separation Benefits Agreement by and between Thoratec and Taylor C. Harris, dated October 10, 2012.(17)* | ||
| 10.16 | Credit Agreement, dated as of December 19, 2011, among Thoratec, the financial institutions from time-to-time party thereto as lenders and Wells Fargo Bank, National Association, as administrative agent for the lenders.(19) | ||
| 10.17 | Thoratec Corporation FY 2014 Executive Incentive Plan, effective for certain executive officers of the Company.(20)* | ||
111
| Exhibit Number |
Exhibit | ||
|---|---|---|---|
| 10.18 | Separation Benefits Agreement by and between Thoratec and Vasant Padmanabhan, dated May 22, 2014.(2)* | ||
| 10.19 | Employment Agreement by and between Thoratec and D. Keith Grossman, dated September 21, 2014.(3)* | ||
| 10.20 | Transition and Separation Agreement by and between Thoratec and Gary F. Burbach, dated September 21, 2014. (3)* | ||
| 10.21 | Separation Benefits Agreement by and between Thoratec and Niamh Pellegrini, dated October 13, 2014.*# | ||
| 21 | Subsidiaries of Thoratec. | ||
| 23.1 | Consent of Independent Registered Public Accounting Firm. | ||
| 24 | Power of Attorney—Reference is made to page 115 hereof. | ||
| 31.1 | Section 302 Certification of Chief Executive Officer. | ||
| 31.2 | Section 302 Certification of Chief Financial Officer. | ||
| 32.1 | # | Section 906 Certification of Chief Executive Officer. | |
| 32.2 | # | Section 906 Certification of Chief Financial Officer. | |
| 101 | The following materials from Registrant's Annual Report on Form 10-K for the year ended January 3, 2015, formatted in Extensible Business Reporting Language (XBRL) includes: (i) Consolidated Balance Sheets as of January 3, 2015, and December 28, 2013, (ii) Consolidated Statements of Operations for the years ended January 3, 2015, December 28, 2013, and December 29, 2012, (iii) Consolidated Statements of Comprehensive Income for the for the years ended January 3, 2015, December 28, 2013, and December 29, 2012, (iv) Consolidated Statements of Shareholders' Equity for the years ended January 3, 2015, December 28, 2013, and December 29, 2012, (v) Consolidated Statements of Cash Flows for the years ended January 3, 2015, December 28, 2013, and December 29, 2012, and (vi) Notes to Consolidated Financial Statements. | ||
- (1)
- Filed as an Exhibit to Thoratec's Annual Report on Form 10-K for the fiscal year ended December 28, 2002, filed with the SEC on March 20, 2003, and incorporated herein by reference.
- (2)
- Filed as an Exhibit to Thoratec's Quarterly Report on Form 10-Q for the fiscal quarter ended June 28, 2014, filed with the SEC on August 7, 2014, and incorporated herein by reference.
- (3)
- Filed as an Exhibit to Thoratec's Form 8-K filed with the SEC on September 22, 2014, and incorporated herein by reference.
- (4)
- Filed as an Exhibit to Thoratec's Quarterly Report on Form 10-Q for the fiscal quarter ended October 1, 2011, filed with the SEC on November 7, 2011, and incorporated herein by reference.
- (5)
- Filed as an Exhibit to Thoratec's Form 8-K filed with the SEC on July 1, 2013, and incorporated herein by reference.
- (6)
- Filed as an Exhibit to Thoratec's Form 8-K filed with the SEC on July 2, 2014, and incorporated herein by reference.
- (7)
- Filed as an Appendix to Thoratec's Proxy Statement on Schedule 14A, filed with the SEC on April 9, 2014, and incorporated herein by reference.
- (8)
- Filed as an Exhibit to Thoratec's Quarterly Report on Form 10-Q for the fiscal quarter ended June 29, 1996, filed with the SEC on August 13, 1996, and incorporated herein by reference.
- (9)
- Filed as an Exhibit to Thoratec's Quarterly Report on Form 10-Q for the fiscal quarter ended June 28, 1997, filed with the SEC on July 30, 1997, and incorporated herein by reference.
- (10)
- Filed as an Exhibit to Thoratec's Quarterly Report on Form 10-Q for the fiscal quarter ended September 27, 1997, filed with the SEC on November 12, 1997, and incorporated herein by reference.
- (11)
- Filed as an Exhibit to Thoratec's Annual Report on Form 10-K for the fiscal year ended December 31, 2011, filed with the SEC on February 21, 2012, and incorporated herein by reference.
- (12)
- Filed as an Exhibit to Thoratec's Registration Statement on Form S-8 filed with the SEC on June 18, 2003, (Registration No. 333-106238), and incorporated herein by reference.
- (13)
- Filed as an Exhibit to Thoratec's Registration Statement on Form S-8 filed with the SEC on November 13, 2014, (Registration No. 333-200179), and incorporated herein by reference.
- (14)
- Filed as an Exhibit to Thoratec's Annual Report on Form 10-K for the fiscal year ended January 3, 2004, filed with the SEC on March 17, 2004, and incorporated herein by reference.
- (15)
- Filed as an Exhibit to Thoratec's Annual Report on Form 10-K for the fiscal year ended January 1, 2005, filed with the SEC on March 16, 2005, and incorporated herein by reference.
- (16)
- Filed as an Exhibit to Thoratec's Form 8-K filed with the SEC on April 27, 2007, and incorporated herein by reference.
- (17)
- Filed as an Exhibit to Thoratec's Annual Report on Form 10-K for the fiscal year ended December 29, 2012, filed with the SEC on February 20, 2013, and incorporated herein by reference.
112
- (18)
- Filed as an Exhibit to Thoratec's Annual Report on Form 10-K for the fiscal year ended January 1, 2011, filed with the SEC on February 24, 2010, and incorporated herein by reference.
- (19)
- Filed as an Exhibit to Thoratec's Form 8-K filed with the SEC on December 22, 2011, and incorporated herein by reference.
- (20)
- Filed as an Exhibit to Thoratec's Quarterly Report on Form 10-Q for the fiscal quarter ended March 29, 2014, filed with the SEC on May 7, 2014, and incorporated herein by reference.
- *
- Indicates a management contract or compensatory plan.
- #
- Furnished herewith.
113
Pursuant to the requirements of Section 13 or Section 15(d) of the Securities Exchange Act of 1934, as amended, the Registrant has duly caused this report to be signed on its behalf by the undersigned, thereunto duly authorized.
| THORATEC CORPORATION | ||||
By: |
/s/ D. KEITH GROSSMAN D. Keith Grossman President and Chief Executive Officer |
|||
Date: February 19, 2015
114
KNOW ALL PERSONS BY THESE PRESENTS that each person whose signature appears below constitutes and appoints D. Keith Grossman and David A. Lehman, and each of them, his or her true and lawful attorney-in-fact, with full power of substitution and resubstitution, to act for him or her and in his or her name, place and stead, in any and all capacities to sign any and all amendments to this annual report on Form 10-K and to file the same, with all exhibits thereto, and all documents in connection therewith, with the Securities and Exchange Commission, granting unto said attorneys-in-fact and agents, and each of them, full power and authority to do and perform each and every act and thing, which they, or any of them, may deem necessary or advisable to be done in connection with this annual report as fully to all intents and purposes as he might or could do in person, hereby ratifying and confirming all that said attorneys-in-fact and agents or any of them, or any substitute or substitutes for any or all of them, may lawfully do or cause to be done by virtue hereof.
In accordance with the Exchange Act, this report has been signed below by the following persons on behalf of the Thoratec Corporation and in the capacities and on the dates indicated.
Signature
|
Title
|
Date
|
||
|---|---|---|---|---|
| /s/ D. KEITH GROSSMAN D. Keith Grossman |
Chief Executive Officer, President and Director (Principal Executive Officer) |
February 19, 2015 | ||
/s/ TAYLOR C. HARRIS Taylor C. Harris |
Vice President and Chief Financial Officer (Principal Financial and Accounting Officer) |
February 19, 2015 |
||
/s/ NEIL F. DIMICK Neil F. Dimick |
Director and Chairman of the Board of Directors |
February 19, 2015 |
||
/s/ J. DANIEL COLE J. Daniel Cole |
Director |
February 19, 2015 |
||
/s/ STEVEN H. COLLIS Steven H. Collis |
Director |
February 19, 2015 |
||
/s/ WILLIAM A. HAWKINS William A. Hawkins |
Director |
February 19, 2015 |
||
/s/ PAUL A. LAVIOLETTE Paul A. LaViolette |
Director |
February 19, 2015 |
||
/s/ MARTHA H. MARSH Martha H. Marsh |
Director |
February 19, 2015 |
||
/s/ TODD C. SCHERMERHORN Todd C. Schermerhorn |
Director |
February 19, 2015 |
115