Attached files
| file | filename |
|---|---|
| 8-K - 8-K - FEDERAL HOME LOAN MORTGAGE CORP | d864333d8k.htm |
| EX-99.2 - EXHIBIT 99.2 - FEDERAL HOME LOAN MORTGAGE CORP | d864333dex992.htm |
Exhibit 99.1

|
News Release |
FOR IMMEDIATE RELEASE
February 19, 2015
MEDIA CONTACT: Lisa Gagnon
703-903-3385
INVESTOR CONTACT: Robin Phillips
571-382-4732
FREDDIE MAC REPORTS NET INCOME OF $7.7 BILLION FOR FULL-YEAR 2014;
COMPREHENSIVE INCOME OF $9.4 BILLION
2014 Marks Third Straight Year of Profitability
| — | Full-year 2014 net income and comprehensive income totaled $7.7 billion and $9.4 billion, respectively, primarily driven by: |
¡ Net interest income of $14.3 billion
¡ Settlement income of $6.1 billion related to private-label securities litigation
¡ Derivative losses of $8.3 billion driven mostly by declining interest rates
| — | Fourth quarter 2014 net income and comprehensive income totaled $227 million and $251 million, respectively, primarily driven by net interest income of $3.6 billion and derivative losses of $3.4 billion |
Derivatives Help Reduce Exposure to Interest-Rate Risk
| — | Freddie Mac uses derivatives to hedge its interest–rate risk exposure on an economic basis |
| — | The company’s sensitivity to interest rates on an economic basis remains low, as its duration gap averaged 0 months for 2014 |
| — | The company’s GAAP earnings are sensitive to interest rates as fair value changes on derivatives are included in earnings, while fair value changes associated with several of the types of assets and liabilities being economically hedged are not. Therefore, there were timing mismatches that affected earnings during 2014 |
Returned Additional $19.6 Billion to Taxpayers in 2014
| — | Based on December 31, 2014 net worth of $2.7 billion, the company’s March 2015 dividend obligation will be $0.9 billion, bringing total cumulative cash dividends paid to Treasury to $91.8 billion |
| — | Senior preferred stock held by Treasury remains $72.3 billion |
| — | The capital reserve amount used to calculate quarterly dividends under the Purchase Agreement was $2.4 billion for 2014 and is $1.8 billion for 2015 |
Business Continues to Improve
| — | Post-2008 book of business continued to grow and was 60 percent of single-family credit guarantee portfolio at December 31, 2014; HARP and other relief refinance loans represented an additional 20 percent |
| — | Transferred a portion of credit losses that could occur in adverse home price scenarios on $147.5 billion of single-family mortgages to the private market. This was achieved through innovative offerings such as STACR® debt notes and ACISSM reinsurance transactions in 2014 |
| — | Reduced legacy risk from the mortgage-related investment portfolio through sales of $16.5 billion of less liquid assets (including a pilot transaction of $0.6 billion of seriously delinquent single-family loans) in 2014 |
| — | Delinquency rates continued to decline and remained below industry benchmarks at December 31, 2014 |
¡ Single-family serious delinquency rate was 1.88 percent, the lowest since January 2009
¡ Multifamily delinquency rate was 0.04 percent
| — | Multifamily new business volume remained strong at $28.3 billion in 2014. The company continues to transfer the majority of the credit risk on its new multifamily mortgages to the private market through K-deal offerings |
Helped over 14 million families to buy, rent or keep their homes since 2009
| — | Provided $2.5 trillion in liquidity to the mortgage market that funded approximately 11 million single-family homes and 2 million multifamily rental units |
| — | Provided foreclosure alternatives to 1.1 million borrowers |
Freddie Mac Fourth Quarter 2014 Financial Results
February 19, 2015
Page 2
McLean, VA — Freddie Mac (OTCQB: FMCC) today reported net income of $7.7 billion for the full-year 2014, compared to $48.7 billion for the full-year 2013. The company also reported comprehensive income of $9.4 billion for the full-year 2014, compared to $51.6 billion for the full-year 2013. As discussed below, 2013 financial results benefited from the release of the deferred tax asset valuation allowance.
“2014 marked another year of solid financial and operating performance for Freddie Mac, enabling us to return an additional $20 billion to the nation’s taxpayers,” said Donald H. Layton, chief executive officer. “We made tremendous progress in materially reducing taxpayer exposure to risk, increasing market share between the GSEs through improved customer focus and service, and making our operations better through innovation and efficiency. At the same time, working with FHFA we helped to further strengthen the housing finance system in America.”
Summary Financial Results (1)
| Three Months Ended | Full-Year | |||||||||||||||||||||||||
| ($ Billions) | 12/31/14 | 9/30/14 | Change | 2014 | 2013 | Change | ||||||||||||||||||||
| 1 |
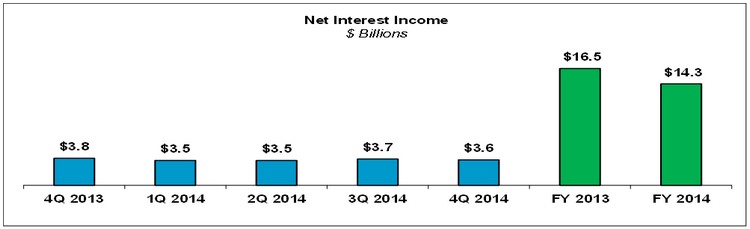
Net interest income | $ | 3.6 | $ | 3.7 | $ | (0.1 | ) | $ | 14.3 | $ | 16.5 | $ | (2.2 | ) | |||||||||||
| 2 |
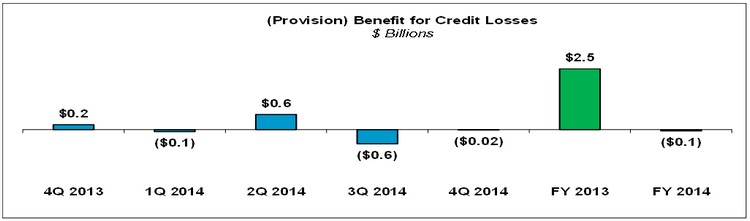
(Provision) benefit for credit losses | (0.0 | ) | (0.6 | ) | 0.6 | (0.1 | ) | 2.5 | (2.5 | ) | |||||||||||||||
| 3 |
Derivative gains (losses) | (3.4 | ) | (0.6 | ) | (2.8 | ) | (8.3 | ) | 2.6 | (10.9 | ) | ||||||||||||||
| 4 |
Other non-interest income | 0.8 | 1.4 | (0.6 | ) | 8.2 | 5.9 | 2.3 | ||||||||||||||||||
| 5 |
Non-interest expense | (0.8 | ) | (0.8 | ) | (0.0 | ) | (3.1 | ) | (2.1 | ) | (1.0 | ) | |||||||||||||
|
|
|
|
|
|
|
|
|
|
|
|
|
|||||||||||||||
| 6 |
Pre-tax income | $ | 0.2 | $ | 3.0 | $ | (2.9 | ) | $ | 11.0 | $ | 25.4 | $ | (14.4 | ) | |||||||||||
| 7 |
Income tax benefit (expense) | 0.1 | (1.0 | ) | 1.0 | (3.3 | ) | 23.3 | (26.6 | ) | ||||||||||||||||
|
|
|
|
|
|
|
|
|
|
|
|
|
|||||||||||||||
| 8 |
Net income | $ | 0.2 | $ | 2.1 | $ | (1.9 | ) | $ | 7.7 | $ | 48.7 | $ | (41.0 | ) | |||||||||||
| 9 |
Total other comprehensive income | 0.0 | 0.7 | (0.7 | ) | 1.7 | 2.9 | (1.2 | ) | |||||||||||||||||
|
|
|
|
|
|
|
|
|
|
|
|
|
|||||||||||||||
| 10 |
Comprehensive income | $ | 0.3 | $ | 2.8 | $ | (2.5 | ) | $ | 9.4 | $ | 51.6 | $ | (42.2 | ) | |||||||||||
|
|
|
|
|
|
|
|
|
|
|
|
|
|||||||||||||||
|
|
|
|
|
|
|
|
|
|
|
|
|
|||||||||||||||
| (1) | Columns and rows may not add due to rounding. See “Appendix – Financial Results Discussion” section for additional information about the company’s financial results for the fourth quarter and full year of 2014. |
Full-Year 2014 Financial Results – Freddie Mac’s 2014 net income and comprehensive income declined from 2013 by $41.0 billion and $42.2 billion, respectively. 2013 results included an income tax benefit of $23.3 billion that primarily resulted from the release of the deferred tax asset valuation allowance in the third quarter of 2013. The decreases in 2014 net income and comprehensive income were further driven by:
| — | a shift from derivative gains of $2.6 billion in 2013 to derivative losses of $8.3 billion in 2014 primarily due to declining long-term interest rates in 2014; |
| — | a shift from a benefit for credit losses of $2.5 billion in 2013 to a provision for credit losses of $0.1 billion in 2014 primarily due to lower home-price growth and smaller recoveries from representation and warranty settlements in 2014; and |
| — | a decrease in net interest income of $2.2 billion primarily due to a continued decline in the company’s mortgage-related investments portfolio. |
Fourth Quarter 2014 Financial Results – Fourth quarter 2014 net income and comprehensive income declined from the third quarter of 2014 by $1.9 billion and $2.5 billion, respectively. These decreases were primarily driven by:
| — | an increase in derivative losses of $2.8 billion due to declining long-term interest rates and flattening of the yield curve; |
Freddie Mac Fourth Quarter 2014 Financial Results
February 19, 2015
Page 3
| — | a decrease in settlement income of $1.2 billion as there were no private-label securities (PLS) litigation settlements in the fourth quarter of 2014; |
| — | a decrease in total other comprehensive income of $0.7 billion mostly due to lower fair value gains on non-agency available-for-sale (AFS) securities; partially offset by |
| — | a shift from income tax expense of $1.0 billion in the third quarter of 2014 to an income tax benefit of $0.1 billion in the fourth quarter of 2014. |
Variability and Sustainability of Earnings – Freddie Mac’s financial results are subject to significant earnings and net worth variability from period to period. This variability can be driven by changes in interest rates, the yield curve, implied volatility, home prices and mortgage spreads, as well as other factors that can affect the company’s financial results (e.g., see further discussion below on derivative gains and losses). In addition, as discussed previously, the company’s earnings in 2013 and 2014 included a number of items that are not sustainable over the long term. Furthermore, declines in the size of the company’s mortgage-related investments portfolio, as required by FHFA and the Purchase Agreement with Treasury, will reduce earnings over the long term.
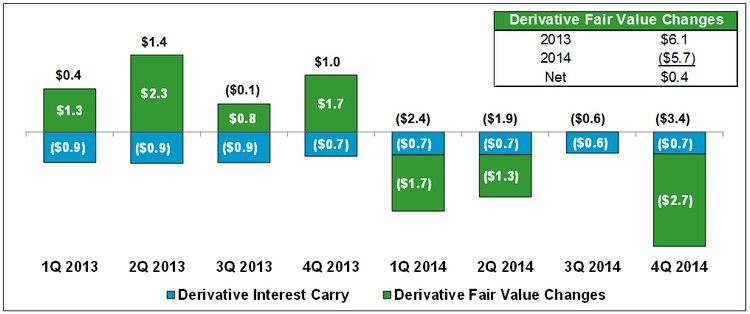
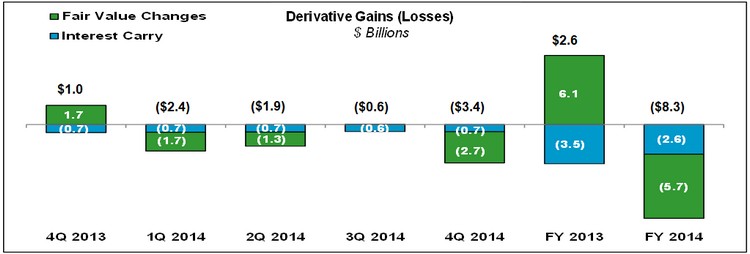
Derivative Gains and Losses – Freddie Mac uses its derivative portfolio to economically hedge its interest-rate risk exposure. As shown in the table below, gains and losses on the company’s derivative portfolio can change as interest rates change and include both derivative fair value changes and derivative interest carry. Derivative interest carry (i.e., accrual of periodic settlements) represents the net amount the company accrues for interest-rate swap payments it will make or receive during a period – similar to interest expense. Fair value changes on derivatives are included in GAAP earnings, while fair value changes associated with several of the types of assets and liabilities being economically hedged are not. Therefore, there were timing mismatches that affected earnings during 2014, which did not fully reflect the underlying economics of the company’s business.
Derivative Gains (Losses): Fair Value Changes vs. Interest Carry ($ Billions)
Freddie Mac Fourth Quarter 2014 Financial Results
February 19, 2015
Page 4
Treasury Draw and Dividend Payments – Based on Freddie Mac’s net worth of $2.7 billion at December 31, 2014, less the $1.8 billion capital reserve, the company’s March 2015 dividend obligation to Treasury under the Purchase Agreement will be $0.9 billion, bringing total cumulative cash dividends paid to Treasury to $91.8 billion. The liquidation preference of the senior preferred stock held by Treasury remains $72.3 billion at December 31, 2014, as dividend payments do not offset prior Treasury draws.
Business Highlights
Single-family Guarantee segment
| — | Single-family segment earnings were $1.5 billion and $0.5 billion for the full-year and fourth quarter of 2014, respectively. |
| — | Post-2008 book of business continued to grow and was 60 percent of single-family credit guarantee portfolio at December 31, 2014. |
| ¡ | HARP and other relief refinance loans were an additional 20 percent. |
| ¡ | 2005-2008 legacy book gradually declined to 13 percent. |
| — | Average management and guarantee fees charged on new acquisitions were 57.4 basis points in 2014, up from 51.4 basis points in 2013. |
| — | Single-family serious delinquency rate was 1.88 percent at December 31, 2014, down from 2.39 percent at December 31, 2013. The single-family serious delinquency rate at December 31, 2014 was substantially below the rate for the entire U.S. mortgage market. |
| — | Executed a pilot transaction in which the company sold $0.6 billion in UPB of seriously delinquent unsecuritized single-family loans during 2014. |
| — | Through its innovative offerings of Structured Agency Credit Risk® (STACR) debt notes and Agency Credit Insurance StructureSM (ACIS reinsurance) transactions, Freddie Mac has transferred a portion of credit losses that could occur in adverse home price scenarios. However, the company continues to be exposed to credit losses through its retained first loss positions. |
| ¡ | In 2014, the company transferred a portion of credit losses on $147.5 billion of single-family mortgages to the private market. |
| ¡ | Freddie Mac recently settled its first STACR debt note that will transfer first loss, in addition to mezzanine loss positions, to the private market. |
Investments segment
| — | Investments segment comprehensive income (loss) was $6.5 billion and $(0.5) billion for the full-year and fourth quarter of 2014, respectively. |
| — | The company’s mortgage-related investments portfolio was $408.4 billion at December 31, 2014, a decline of $52.6 billion from December 31, 2013, and remained below the December 31, 2014 Purchase Agreement limit of $470 billion. |
| — | The company’s less liquid assets declined by $47.0 billion to $239.3 billion at December 31, 2014 from December 31, 2013. This includes on-going portfolio liquidations and: |
| ¡ | Sales of $13.8 billion of PLS (including sales related to PLS settlements) in 2014. |
| ¡ | Securitization of $7.0 billion of single-family reperforming and modified loans in 2014. |
| — | Reached agreements with 10 institutions to settle PLS litigation that contributed $6.1 billion to Freddie Mac’s pre-tax income in 2014. |
Freddie Mac Fourth Quarter 2014 Financial Results
February 19, 2015
Page 5
| — | Continued to maintain a low sensitivity to interest rates on an economic basis as the company’s duration gap and portfolio market value sensitivity (PMVS)-L averaged zero months and $69 million for 2014, respectively. |
Multifamily segment
| — | Multifamily segment comprehensive income was $1.5 billion and $0.3 billion for the full-year and fourth quarter of 2014, respectively. |
| — | New purchase volume remained strong at $28.3 billion in 2014. A majority of the credit risk on these new multifamily mortgages is transferred to the private market through K-deal offerings. |
| — | Issued $21.3 billion in Freddie Mac securities through 17 K-deal offerings. |
| — | Multifamily delinquency rate remained low at 4 basis points at December 31, 2014, reflecting the company’s continued strong portfolio performance. |
| — | Provided financing for over 413,000 rental units in 2014, 90 percent of which are affordable to families earning low to moderate incomes. |
| — | Introduced a new Small Balance Loan offering to provide seller/servicers a dedicated platform to originate and sell loans for smaller rental properties. |
Housing Market Support
Freddie Mac supports the U.S. housing market by ensuring credit availability for new and refinanced mortgages as well as rental housing. The company also helps struggling homeowners avoid foreclosure and helps stabilize communities nationwide. Since the beginning of 2009, Freddie Mac has helped approximately 13 million American families own or rent a home and over one million families avoid foreclosure. At the same time, the company is working with FHFA, its customers and the industry to build a stronger housing finance system for the nation.
Preventing Foreclosures – Freddie Mac helps struggling borrowers retain their homes or otherwise avoid foreclosure. During 2014, the company completed 120,000 single-family loan workouts, bringing the total number of homeowners the company has helped to avoid foreclosure to over one million since the beginning of 2009. When foreclosure is unavoidable, Freddie Mac has helped to further stabilize communities by focusing its real estate owned home sales on owner-occupants, who have made up two–thirds of its purchasers since the beginning of 2009, and by promoting industry-leading standards for property preservation.
Freddie Mac Fourth Quarter 2014 Financial Results
February 19, 2015
Page 6
Number of Families Helped
| (Thousands) | 2009 | 2010 | 2011 | 2012 | 2013 | 2014 | Cumulative Total |
|||||||||||||||||||||||
| 1 |
Number of families helped to own or rent a home | 2,480 | 2,089 | 1,830 | 2,472 | 2,458 | 1,627 | 12,956 | ||||||||||||||||||||||
| 2 |
Relief refinance borrowers (includes HARP)(1) | 169 | 533 | 453 | 687 | 611 | 179 | 2,632 | ||||||||||||||||||||||
| 3 |
Other refinance borrowers(1) | 1,595 | 947 | 740 | 996 | 944 | 429 | 5,651 | ||||||||||||||||||||||
| 4 |
Purchase borrowers(1) | 460 | 378 | 326 | 353 | 515 | 606 | 2,638 | ||||||||||||||||||||||
| 5 |
Multifamily rental units | 256 | 231 | 311 | 436 | 388 | 413 | 2,035 | ||||||||||||||||||||||
| 6 |
Number of families helped to avoid foreclosure(2) | 133 | 275 | 208 | 169 | 168 | 120 | 1,073 | ||||||||||||||||||||||
| 7 |
Loan modifications | 65 | 170 | 109 | 70 | 83 | 67 | 564 | ||||||||||||||||||||||
| 8 |
Repayment plans | 34 | 31 | 33 | 33 | 29 | 25 | 185 | ||||||||||||||||||||||
| 9 |
Forbearance agreements | 15 | 35 | 20 | 13 | 12 | 9 | 104 | ||||||||||||||||||||||
| 10 |
Short sales & deed-in-lieu of foreclosure transactions | 19 | 39 | 46 | 53 | 44 | 19 | 220 | ||||||||||||||||||||||
| 11 |
Total (lines 1+6) | 2,613 | 2,364 | 2,038 | 2,641 | 2,626 | 1,747 | 14,029 | ||||||||||||||||||||||
| (1) | For the periods presented, a borrower may be counted more than once if the company purchased more than one loan (purchase or refinance mortgage) relating to the same borrower. |
| (2) | Represents single-family loan workouts. These categories are not mutually exclusive and a borrower in one category may also be included in another category in the same period. For the periods presented, a borrower may subsequently go into foreclosure. |
Providing Liquidity – Freddie Mac provides access to financing for new and refinanced mortgages and rental housing. In 2014, the company provided $291.4 billion in liquidity to the market through its purchases of loans and issuances of mortgage-related securities, funding 1.2 million single-family homes and over 413,000 multifamily rental units. The company’s mortgage purchase volume reflected a higher percentage of home purchase loans in 2014, with refinance volume making up only 48 percent of single-family mortgage purchase volume as compared to 73 percent in 2013.
Freddie Mac is working to improve access to affordable mortgage credit for America’s families. During 2014, the company announced the introduction of a new mortgage initiative with a down payment option as low as three percent to help qualified borrowers with limited savings buy a home. The company also introduced a new multifamily offering to finance small rental properties that make up nearly one-third of the rental market. Freddie Mac is also providing increased certainty to its customers through enhanced policies, including the representation and warranty framework and new technologies such as Quality Control Information Manager. Expanding access to mortgage credit continues to be a top priority for the company in 2015.
Freddie Mac Fourth Quarter 2014 Financial Results
February 19, 2015
Page 7
Market Liquidity Provided (1)
| ($ Billions) | 2009 | 2010 | 2011 | 2012 | 2013 | 2014 | Cumulative Total |
|||||||||||||||||||||||
| 1 |
Single-family purchases or issuances(1) | $ | 483 | $ | 390 | $ | 321 | $ | 427 | $ | 423 | $ | 255 | $ 2,299 | ||||||||||||||||
| 2 |
Relief refinance mortgages (includes HARP) | 35 | 106 | 82 | 123 | 99 | 27 | 472 | ||||||||||||||||||||||
| 3 |
Other refinance mortgages | 345 | 200 | 168 | 228 | 210 | 94 | 1,245 | ||||||||||||||||||||||
| 4 |
Purchase mortgages | 94 | 78 | 71 | 76 | 114 | 134 | 567 | ||||||||||||||||||||||
| 5 |
Other(2) | 9 | 6 | - | - | - | - | 15 | ||||||||||||||||||||||
| 6 |
Multifamily loan purchases or guarantees(1)(3) | $ | 17 | $ | 16 | $ | 20 | $ | 29 | $ | 26 | $ | 28 | $ 136 | ||||||||||||||||
| 7 |
Other(4) | $ | 46 | $ | - | $ | 8 | $ | - | $ | 4 | $ | 8 | $ 66 | ||||||||||||||||
| 8 |
Total (lines 1+6+7) | $ | 546 | $ | 406 | $ | 349 | $ | 456 | $ | 453 | $ | 291 | $ 2,501 | ||||||||||||||||
| (1) | Based on unpaid principal balance (UPB) and includes other guarantee commitments. |
| (2) | Includes Ginnie Mae Certificates, HFA initiative-related guarantees, and Other Guarantee Transactions. |
| (3) | Excludes Multifamily issuances of K-deals. |
| (4) | Consists of non-Freddie Mac mortgage-related securities purchased for the company’s mortgage-related investments portfolio. |
Building a Stronger Mortgage Market –Working with FHFA and the industry, Freddie Mac is building a stronger, more efficient mortgage market that benefits the nation’s homebuyers, renters and taxpayers. Strengthening fundamental systems and infrastructure is a critical aspect of this work. In 2014, the company made further enhancements to its representation and warranty framework, including providing lenders with additional clarity about life of loan exclusions. Freddie Mac also worked with Fannie Mae under the direction of FHFA in assisting mortgage insurers to implement new master policies, and continued to make progress toward new eligibility standards. Further progress was made in 2014 to develop a Common Securitization Platform and prepare for a single security.
About Freddie Mac’s Conservatorship
Since September 2008, Freddie Mac has been operating under conservatorship, with FHFA as Conservator. The support provided by Treasury pursuant to the Purchase Agreement enables the company to maintain access to the debt markets and have adequate liquidity to conduct its normal business operations. Based on Freddie Mac’s net worth of $2.7 billion at December 31, 2014, less the 2015 capital reserve amount of $1.8 billion, the company’s dividend obligation to Treasury in March 2015 will be $0.9 billion. Including the March 2015 dividend obligation, Freddie Mac’s aggregate cash dividends paid to Treasury will total $91.8 billion, $20.5 billion more than cumulative cash draws of $71.3 billion received from Treasury through December 31, 2014. Under the Purchase Agreement, the payment of dividends does not reduce the outstanding liquidation preference. Accordingly, Treasury still maintains a liquidation preference of $72.3 billion on the company’s senior preferred stock as of December 31, 2014.
Freddie Mac Fourth Quarter 2014 Financial Results
February 19, 2015
Page 8
Treasury Draws and Dividend Payments
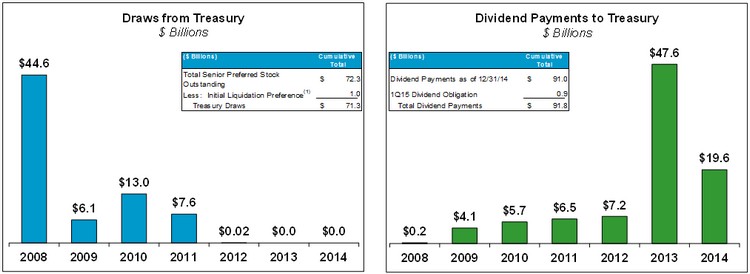
| (1) | The initial $1 billion liquidation preference of senior preferred stock was issued to Treasury in September 2008 as consideration for Treasury’s funding commitment. The company received no cash proceeds as a result of issuing this initial $1 billion liquidation preference of senior preferred stock. |
The Purchase Agreement does not allow the company to retain capital. Beginning in 2013, the required quarterly senior preferred stock dividend equals the amount, if any, by which the company’s net worth as of the end of the preceding quarter exceeds an applicable capital reserve amount. The applicable capital reserve amount was $2.4 billion for 2014, and is $1.8 billion for 2015. It will be reduced by $600 million each year thereafter until it reaches zero on January 1, 2018.
The amount of remaining funding available to Freddie Mac under the Purchase Agreement with Treasury is $140.5 billion, and will be reduced by any future draws.
Freddie Mac is not permitted to redeem the senior preferred stock prior to the termination of Treasury’s funding commitment under the Purchase Agreement. The limited circumstances under which Treasury’s funding commitment will terminate are described in “NOTE 2: CONSERVATORSHIP AND RELATED MATTERS – Purchase Agreement and Warrant” in the company’s Annual Report on Form 10-K for the year ended December 31, 2014.
Additional Information
For more information, including that related to Freddie Mac’s financial results, conservatorship and related matters, see the company’s Annual Report on Form 10-K for the year ended December 31, 2014, and the company’s Financial Results Supplement. These documents are available on the Investor Relations page of the company’s Web site at www.FreddieMac.com/investors.
Additional information about Freddie Mac and its business is also set forth in the company’s filings with the SEC, which are available on the Investor Relations page of the company’s Web site at www.FreddieMac.com/investors and the SEC’s Web site at www.sec.gov. Freddie Mac encourages all investors and interested members of the public to review these materials for a more complete understanding of the company’s financial results and related disclosures.
Freddie Mac Fourth Quarter 2014 Financial Results
February 19, 2015
Page 9
Webcast Announcement
Management will host a conference call at 9 a.m. Eastern Time on February 19, 2015 to discuss the company’s results with the media. The conference call will be concurrently webcast. To access the live audio webcast, use the following link: http://www.visualwebcaster.com/event.asp?id=101452. The replay will be available on the company’s Web site at www.FreddieMac.com/investors. All materials related to the call will be available on the Investor Relations page of the company’s Web site at www.FreddieMac.com/investors.
* * * *
This press release contains forward-looking statements, which may include statements pertaining to the conservatorship, the company’s current expectations and objectives for its single-family, multifamily and investment businesses, its loan workout initiatives and other efforts to assist the U.S. residential mortgage market, liquidity, capital management, economic and market conditions and trends, market share, the effect of legislative and regulatory developments and new accounting guidance, credit quality of loans the company owns or guarantees, and results of operations and financial condition on a GAAP, Segment Earnings and fair value basis. Forward-looking statements involve known and unknown risks and uncertainties, some of which are beyond the company’s control. Management’s expectations for the company’s future necessarily involve a number of assumptions, judgments and estimates, and various factors, including changes in market conditions, liquidity, mortgage spreads, credit outlook, actions by the U.S. government (including FHFA, Treasury and Congress), and the impacts of legislation or regulations and new or amended accounting guidance, could cause actual results to differ materially from these expectations. These assumptions, judgments, estimates and factors are discussed in the company’s Annual Report on Form 10-K for the year ended December 31, 2014, which is available on the Investor Relations page of the company’s Web site at www.FreddieMac.com/investors and the SEC’s Web site at www.sec.gov. The company undertakes no obligation to update forward-looking statements it makes to reflect events or circumstances occurring after the date of this press release.
Freddie Mac was established by Congress in 1970 to provide liquidity, stability and affordability to the nation’s residential mortgage markets. Freddie Mac supports communities across the nation by providing mortgage capital to lenders. Today Freddie Mac is making home possible for approximately one in four home borrowers and is one of the largest sources of financing for multifamily housing. Additional information is available at FreddieMac.com, Twitter @FreddieMac and Freddie Mac’s blog FreddieMac.com/blog.
# # #
Freddie Mac Fourth Quarter 2014 Financial Results
February 19, 2015
Page 10
Appendix – Financial Results Discussion
Summary Consolidated Statements of Comprehensive Income (1)
| Three Months Ended | Full-Year | |||||||||||||||||||||||||
| ($ Billions) | 12/31/14 | 9/30/14 | Change | 2014 | 2013 | Change | ||||||||||||||||||||
| 1 |
Net interest income | $ | 3.6 | $ | 3.7 | $ | (0.1 | ) | $ | 14.3 | $ | 16.5 | $ | (2.2 | ) | |||||||||||
| 2 |
(Provision) benefit for credit losses | (0.0 | ) | (0.6 | ) | 0.6 | (0.1 | ) | 2.5 | (2.5 | ) | |||||||||||||||
| 3 |
Derivative gains (losses) | (3.4 | ) | (0.6 | ) | (2.8 | ) | (8.3 | ) | 2.6 | (10.9 | ) | ||||||||||||||
| 4 |
Other non-interest income | 0.8 | 1.4 | (0.6 | ) | 8.2 | 5.9 | 2.3 | ||||||||||||||||||
|
|
|
|
|
|
|
|
|
|
|
|
|
|||||||||||||||
| 5 |
Non-interest income (expense) | (2.6 | ) | 0.8 | (3.3 | ) | (0.1 | ) | 8.5 | (8.6 | ) | |||||||||||||||
| 6 |
Administrative expenses | (0.5 | ) | (0.5 | ) | (0.0 | ) | (1.9 | ) | (1.8 | ) | (0.1 | ) | |||||||||||||
| 7 |
REO operations income (expense) | (0.1 | ) | (0.1 | ) | 0.0 | (0.2 | ) | 0.1 | (0.3 | ) | |||||||||||||||
| 8 |
Other non-interest expense | (0.3 | ) | (0.2 | ) | (0.0 | ) | (1.0 | ) | (0.4 | ) | (0.6 | ) | |||||||||||||
|
|
|
|
|
|
|
|
|
|
|
|
|
|||||||||||||||
| 9 |
Non-interest expense | (0.8 | ) | (0.8 | ) | (0.0 | ) | (3.1 | ) | (2.1 | ) | (1.0 | ) | |||||||||||||
| 10 |
Pre-tax income | 0.2 | 3.0 | (2.9 | ) | 11.0 | 25.4 | (14.4 | ) | |||||||||||||||||
| 11 |
Income tax benefit (expense) | 0.1 | (1.0 | ) | 1.0 | (3.3 | ) | 23.3 | (26.6 | ) | ||||||||||||||||
|
|
|
|
|
|
|
|
|
|
|
|
|
|||||||||||||||
| 12 |
Net income | $ | 0.2 | $ | 2.1 | $ | (1.9 | ) | $ | 7.7 | $ | 48.7 | $ | (41.0 | ) | |||||||||||
| 13 |
Total other comprehensive income | 0.0 | 0.7 | (0.7 | ) | 1.7 | 2.9 | (1.2 | ) | |||||||||||||||||
|
|
|
|
|
|
|
|
|
|
|
|
|
|||||||||||||||
| 14 |
Comprehensive income | $ | 0.3 | $ | 2.8 | $ | (2.5 | ) | $ | 9.4 | $ | 51.6 | $ | (42.2 | ) | |||||||||||
|
|
|
|
|
|
|
|
|
|
|
|
|
|||||||||||||||
|
|
|
|
|
|
|
|
|
|
|
|
|
|||||||||||||||
| (1) | Columns and rows may not add due to rounding. |
Net interest income was $14.3 billion for the full-year 2014, compared to $16.5 billion for the full-year 2013. Net interest yield was 74 basis points for the full-year 2014, compared to 82 basis points for the full-year 2013. The decreases in both net interest income and net interest yield primarily reflect a decline in the balance of higher-yielding mortgage-related assets due to continued liquidations, partially offset by lower funding costs.
Net interest income for the fourth quarter of 2014 was $3.6 billion, compared to $3.7 billion for the third quarter of 2014. Net interest yield for the fourth quarter of 2014 was 74 basis points, compared to 77 basis points for the third quarter of 2014. The decreases in both net interest income and net interest yield primarily reflect a decline in the balance of higher-yielding mortgage-related assets due to continued liquidations.
Freddie Mac Fourth Quarter 2014 Financial Results
February 19, 2015
Page 11
(Provision) benefit for credit losses was a provision of $0.1 billion for the full-year 2014, compared to a benefit of $2.5 billion for the full-year 2013. The shift was primarily driven by lower home-price growth and smaller recoveries from representation and warranty settlements in 2014.
Provision for credit losses for the fourth quarter of 2014 was $17 million, compared to $0.6 billion for the third quarter of 2014. Loss severity during the fourth quarter of 2014 was flat, whereas during the third quarter of 2014 loss severity slightly worsened.
Freddie Mac’s loan loss reserves were $21.9 billion at December 31, 2014, compared to $22.7 billion at September 30, 2014 and $24.7 billion at December 31, 2013. The company’s loan loss reserve balance is increased by a provision for credit losses (and decreased by a benefit for credit losses) and reduced by charge-offs.
Derivative gains (losses) include both fair value changes and derivative interest carry (i.e., accrual of periodic settlements). Derivative losses were $8.3 billion for the full-year 2014, compared to derivative gains of $2.6 billion for the full-year 2013. The shift was primarily driven by a decline in long-term interest rates during 2014 versus an increase in such rates during 2013.
Derivative losses for the fourth quarter of 2014 were $3.4 billion, compared to $0.6 billion for the third quarter of 2014. The higher losses were primarily driven by a decline in long-term interest rates and flattening of the yield curve during the fourth quarter.
Freddie Mac Fourth Quarter 2014 Financial Results
February 19, 2015
Page 12
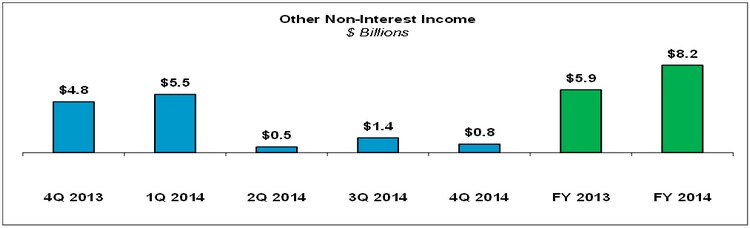
Other non-interest income was $8.2 billion for the full-year 2014, compared to $5.9 billion for the full-year 2013. The increase was mostly driven by a $0.6 billion increase in settlement proceeds related to PLS litigation in 2014 and lower net impairment expense. 2013 net impairment expense included the impact of implementing enhanced model assumptions for non-agency mortgage-related securities.
Other non-interest income for the fourth quarter of 2014 was $0.8 billion, compared to $1.4 billion for the third quarter of 2014. There were no PLS settlements in the fourth quarter of 2014 while third quarter 2014 results included settlement income of $1.2 billion.
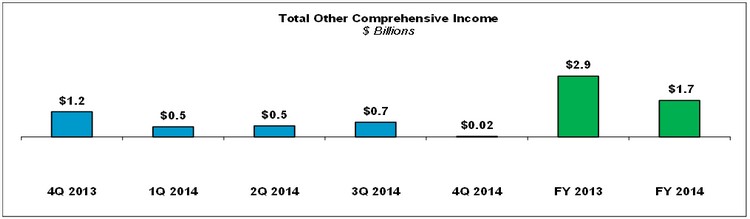
Total other comprehensive income was $1.7 billion for the full-year 2014, compared to $2.9 billion for the full-year 2013. The decrease was primarily driven by lower fair value gains as non-agency security prices increased less in 2014 compared to 2013.
Total other comprehensive income for the fourth quarter of 2014 was $24 million, compared to $0.7 billion for the third quarter of 2014. The decrease was mostly driven by lower fair value gains as non-agency security prices remained relatively flat during the fourth quarter of 2014 versus a significant increase during the third quarter of 2014.
Freddie Mac Fourth Quarter 2014 Financial Results
February 19, 2015
Page 13
Segment Financial Results
Freddie Mac’s operations consist of three reportable segments, which are based on the type of business activities each performs — Single-family Guarantee, Investments and Multifamily. Certain activities that are not part of a reportable segment are included in the All Other category.
Summary of Segment Earnings (Loss) and Comprehensive Income (Loss) (1)(2)
| Three Months Ended | Full-Year | |||||||||||||||||||||||||
| ($ Billions) | 12/31/14 | 9/30/14 | Change | 2014 | 2013 | Change | ||||||||||||||||||||
| Segment Earnings (loss), net of taxes | ||||||||||||||||||||||||||
| 1 |
Single-family Guarantee | $ | 0.5 | $ | 0.2 | $ | 0.3 | $ | 1.5 | $ | 5.8 | $ | (4.2 | ) | ||||||||||||
| 2 |
Investments | (0.5 | ) | 1.4 | (2.0 | ) | 4.5 | 15.9 | (11.4 | ) | ||||||||||||||||
| 3 |
Multifamily | 0.3 | 0.4 | (0.1 | ) | 1.6 | 3.1 | (1.4 | ) | |||||||||||||||||
| 4 |
All Other(3) | - | - | - | - | 23.9 | (23.9 | ) | ||||||||||||||||||
|
|
|
|
|
|
|
|
|
|
|
|
|
|||||||||||||||
| 5 |
Total Segment Earnings, net of taxes | $ | 0.2 | $ | 2.1 | $ | (1.9 | ) | $ | 7.7 | $ | 48.7 | $ | (41.0 | ) | |||||||||||
|
|
|
|
|
|
|
|
|
|
|
|
|
|||||||||||||||
| Comprehensive income (loss) of segments |
||||||||||||||||||||||||||
| 6 |
Single-family Guarantee | $ | 0.5 | $ | 0.2 | $ | 0.3 | $ | 1.5 | $ | 5.8 | $ | (4.3 | ) | ||||||||||||
| 7 |
Investments | (0.5 | ) | 2.3 | (2.7 | ) | 6.5 | 20.3 | (13.8 | ) | ||||||||||||||||
| 8 |
Multifamily | 0.3 | 0.3 | (0.0 | ) | 1.5 | 1.5 | 0.0 | ||||||||||||||||||
| 9 |
All Other(3) | - | - | (0.0 | ) | - | 24.0 | (24.1 | ) | |||||||||||||||||
|
|
|
|
|
|
|
|
|
|
|
|
|
|||||||||||||||
| 10 |
Comprehensive income of segments | $ | 0.3 | $ | 2.8 | $ | (2.5 | ) | $ | 9.4 | $ | 51.6 | $ | (42.2 | ) | |||||||||||
|
|
|
|
|
|
|
|
|
|
|
|
|
|||||||||||||||
|
|
|
|
|
|
|
|
|
|
|
|
|
|||||||||||||||
| (1) | Columns and rows may not add due to rounding. |
| (2) | The financial performance of the company’s Single-Family Guarantee segment is measured based on its contribution to GAAP net income (loss). The company’s Investments segment and Multifamily segment are measured based on each segment’s contribution to GAAP comprehensive income (loss). |
| (3) | For 2013, “All other” category primarily reflects the impact of releasing the valuation allowance against net deferred tax assets. |
Single-family Guarantee segment earnings were $1.5 billion for the full-year 2014, compared to $5.8 billion for the full-year 2013. The decrease was mostly driven by a shift from a benefit for credit losses in 2013 to a provision for credit losses in 2014 due to lower home-price growth and smaller recoveries from representation and warranty settlements in 2014.
Single-family Guarantee segment earnings were $0.5 billion for the fourth quarter of 2014, compared to $0.2 billion for the third quarter of 2014. The increase was primarily driven by lower provision for credit losses as loss severity during the fourth quarter of 2014 was flat, whereas during the third quarter of 2014 loss severity slightly worsened.
Investments segment comprehensive income was $6.5 billion for the full-year 2014, compared to $20.3 billion for the full-year 2013. The decrease was primarily due to a shift to derivative losses in 2014 from derivative gains in 2013 driven by a decline in long-term interest rates, and lower fair value gains as non-agency security prices increased less in 2014 compared to 2013.
Freddie Mac Fourth Quarter 2014 Financial Results
February 19, 2015
Page 14
Investments segment comprehensive loss was $0.5 billion for the fourth quarter of 2014, compared to comprehensive income of $2.3 billion for the third quarter of 2014. The decrease was primarily due to higher derivative losses driven by a decline in long-term interest rates, and lower fair value gains as non-agency security prices remained relatively flat during the fourth quarter of 2014 versus a significant increase during the third quarter of 2014. In addition, there was no settlement income related to PLS litigation during the fourth quarter of 2014 compared to $1.2 billion of income from PLS settlements during the third quarter of 2014.
Multifamily segment comprehensive income was $1.5 billion for the full-year 2014, relatively unchanged from the full-year 2013. Multifamily segment comprehensive income was $0.3 billion for the fourth quarter of 2014, relatively unchanged from the third quarter of 2014.