Attached files
| file | filename |
|---|---|
| EX-32 - EX-32 - ZF TRW AUTOMOTIVE HOLDINGS CORP | a2222951zex-32.htm |
| EX-31.(B) - EX-31.(B) - ZF TRW AUTOMOTIVE HOLDINGS CORP | a2222951zex-31_b.htm |
| EX-21.1 - EX-21.1 - ZF TRW AUTOMOTIVE HOLDINGS CORP | a2222951zex-21_1.htm |
| EX-23.1 - EX-23.1 - ZF TRW AUTOMOTIVE HOLDINGS CORP | a2222951zex-23_1.htm |
| EXCEL - IDEA: XBRL DOCUMENT - ZF TRW AUTOMOTIVE HOLDINGS CORP | Financial_Report.xls |
| EX-31.(A) - EX-31.(A) - ZF TRW AUTOMOTIVE HOLDINGS CORP | a2222951zex-31_a.htm |
Use these links to rapidly review the document
TABLE OF CONTENTS
PART IV
UNITED STATES
SECURITIES AND EXCHANGE COMMISSION
Washington, DC 20549
FORM 10-K
| ý | ANNUAL REPORT PURSUANT TO SECTION 13 OR 15(d) OF THE SECURITIES EXCHANGE ACT OF 1934 | |
For the fiscal year ended December 31, 2014 |
||
OR |
||
o |
TRANSITION REPORT PURSUANT TO SECTION 13 OR 15(d) OF THE SECURITIES EXCHANGE ACT OF 1934 |
|
For the transition period from to . |
||
Commission File No. 001-31970
![]()
TRW Automotive Holdings Corp.
(Exact name of registrant as specified in its charter)
| Delaware (State or other jurisdiction of incorporation or organization) |
81-0597059 (I.R.S. Employer Identification Number) |
12001 Tech Center Drive
Livonia, Michigan 48150
(734) 855-2600
(Address, Including Zip Code, and Telephone Number, Including Area Code, of Registrant's Principal Executive Offices)
Securities registered pursuant to Section 12(b) of the Act:
| Title of Each Class | Name of Each Exchange on Which Registered | |
|---|---|---|
| Common Stock, $0.01 par value per share | New York Stock Exchange |
Securities registered pursuant to Section 12(g) of the Act: None
Indicate by check mark if the registrant is a well-known seasoned issuer, as defined in Rule 405 of the Securities Act. Yes ý No o
Indicate by check mark if the registrant is not required to file reports pursuant to Section 13 or Section 15(d) of the Act. Yes o No ý
Indicate by check mark whether the registrant: (1) has filed all reports required to be filed by Section 13 or 15(d) of the Securities Exchange Act of 1934 during the preceding 12 months (or for such shorter period that the registrant was required to file such reports), and (2) has been subject to such filing requirements for the past 90 days. Yes ý No o
Indicate by check mark whether the registrant has submitted electronically and posted on its corporate Website, if any, every Interactive Data File required to be submitted and posted pursuant to Rule 405 of Regulation S-T (§232.405 of this chapter) during the preceding 12 months (or for such shorter period that the registrant was required to submit and post such files). Yes ý No o
Indicate by check mark if disclosure of delinquent filers pursuant to Item 405 of Regulation S-K (§229.405 of this chapter) is not contained herein, and will not be contained, to the best of registrant's knowledge, in definitive proxy or information statements incorporated by reference in Part III of this Form 10-K or any amendment to this Form 10-K. ý
Indicate by check mark whether the registrant is a large accelerated filer, an accelerated filer, a non-accelerated filer, or a smaller reporting company. See the definitions of "large accelerated filer," "accelerated filer" and "smaller reporting company" in Rule 12b-2 of the Exchange Act (Check one):
| Large accelerated filer ý | Accelerated filer o | Non-accelerated filer o | Smaller reporting company o |
Indicate by check mark whether the registrant is a shell company (as defined in Rule 12b-2 of the Exchange Act). Yes o No ý
As of June 27, 2014, the last business day of the registrant's most recently completed second fiscal quarter, the aggregate market value of the registrant's Common Stock, $0.01 par value per share, held by non-affiliates of the registrant was approximately $9.8 billion based on the closing sale price of the registrant's Common Stock as reported on the New York Stock Exchange on that date. As of February 9, 2015, the number of shares outstanding of the registrant's Common Stock was 114,972,298.
Documents Incorporated by Reference
Certain portions, as expressly described in this report, of the Registrant's Proxy Statement for the 2014 Annual Meeting of the Stockholders, to be filed within 120 days of December 31, 2014, are incorporated by reference into Part III, Items 10-14.
TRW Automotive Holdings Corp.
Index
1
The Company
TRW Automotive Holdings Corp. (together with its subsidiaries, "we," "our," "us," "TRW Automotive" or the "Company") is a Delaware corporation formed in 2002 with a business history stretching back to the turn of the twentieth century. Our common stock is traded on the New York Stock Exchange under the ticker symbol TRW.
The Company is among the world's largest and most diversified suppliers of automotive systems, modules and components to global automotive original equipment manufacturers ("OEMs") and related aftermarkets. We conduct substantially all of our operations through subsidiaries. These operations primarily encompass the design, manufacture and sale of active and passive safety related products and systems. Active safety related products and systems principally refer to vehicle dynamic controls (primarily braking and steering) and electronics (primarily driver assistance systems), and passive safety related products and systems principally refer to occupant restraints (primarily airbags and seat belts) and electronics (primarily airbag electronic control units, and crash and occupant weight sensors).
We operate our business along four segments: Chassis Systems, Occupant Safety Systems, Electronics and Automotive Components. We are primarily a "Tier 1" original equipment supplier, with approximately 82% of our end-customer sales in 2014 made to major OEMs. Of our 2014 sales, approximately 42% were in Europe, 33% were in North America, 21% were in Asia, and 4% were in the rest of the world.
Merger Agreement
On September 15, 2014, we entered into an Agreement and Plan of Merger (the "Merger Agreement") with ZF Friedrichshafen AG, a stock corporation organized and existing under the laws of the Federal Republic of Germany ("ZF"), and MSNA, Inc., a Delaware corporation ("Merger Sub") and a wholly owned subsidiary of ZF held directly by ZF North America, Inc. ("ZNA"), pursuant to which Merger Sub will be merged with and into the Company (the "ZF Merger") with the Company surviving the ZF Merger as an indirect wholly owned subsidiary of ZF. At a special stockholders meeting held on November 19, 2014, our stockholders adopted the Merger Agreement.
At the effective time of the ZF Merger, each share of our common stock issued and outstanding (other than any shares of our common stock held by ZF, ZNA, Merger Sub or any other wholly owned subsidiary of ZF, treasury shares held by us and shares owned by stockholders who have properly made and not withdrawn a demand for appraisal rights under Delaware law) will be converted into the right to receive $105.60 in cash, without interest (the "Merger Consideration"). In addition, at the effective time of the ZF Merger, (i) all then-outstanding Company stock options, restricted stock units, phantom stock units and performance share units (which will vest at the "maximum level" of performance), whether vested or unvested, will be converted into the right to receive the Merger Consideration, less the exercise price of such awards, if any, and (ii) all then-outstanding Company stock appreciation rights, whether vested or unvested, will be converted into the right to receive an amount in cash equal to the excess of the lesser of the Merger Consideration and the "maximum value" of such stock appreciation right over the fair market value per share at the relevant grant date. The consummation of the ZF Merger is subject to the receipt of antitrust approvals in the United States and certain other jurisdictions and other customary closing conditions. The transaction is expected to close in the first half of 2015. If completed, the ZF Merger will result in the Company becoming a wholly owned subsidiary of ZF and our shares will no longer be listed on any public market.
2
Additional information about the ZF Merger and the Merger Agreement, including circumstances under which the Merger Agreement can be terminated and the ramifications of such termination, as well as other terms and conditions, is set forth in our Current Report on Form 8-K filed with the Securities and Exchange Commission ("SEC") on September 15, 2014 and in our definitive proxy statement filed with the SEC on October 20, 2014 (as supplemented) with respect to the related special meeting of stockholders.
Engine Valve Divestiture
On September 10, 2014, the Company announced it entered into a definitive agreement to divest its engine valve business for a purchase price of $385 million in cash, which is subject to adjustment in accordance with the agreement. The business to be divested had annual sales of approximately $592 million. On February 6, 2015, we closed the sale of our wholly-owned engine valve subsidiaries which represented the material portion of the business to be divested. The closing did not include the transfer of several of our joint ventures involved in the business.
Available Company Information
TRW Automotive Holdings Corp.'s Internet website is www.trw.com. Our annual reports on Form 10-K, quarterly reports on Form 10-Q, current reports on Form 8-K and amendments to those reports filed or furnished pursuant to section 13(a) or 15(d) of the Securities Exchange Act of 1934 are available free of charge through our website as soon as reasonably practicable after they are electronically filed with, or furnished to, the Securities and Exchange Commission. Our Audit Committee Charter, Compensation Committee Charter, Corporate Governance and Nominating Committee Charter, Corporate Governance Guidelines and Standards of Conduct (our code of business conduct and ethics) are also available on our website. From time to time we may amend our Standards of Conduct. We intend to disclose, by posting on our website, information about any amendments, as well as information concerning any waiver of the Standards of Conduct that may be granted by the Board, in accordance with SEC regulations.
Business Developments, Strategy, and Industry Trends
Our Business Developments and Strategy. We are a leader in the global automotive supply industry due to the strength of our products and systems, technological capabilities and systems integration skills, global presence, cost competitiveness and quality performance. Over the last decade, we have experienced sales growth in many of our product lines due to an increasing focus by both governments and consumers on safety and fuel efficiency and increasing recognition of new safety technologies by new car assessment programs. We believe that such focus is continuing as evidenced by ongoing regulatory activities, as well as advances in the electrification of vehicles. We believe that these trends will help drive growth in our advanced safety and fuel efficient products and systems, which include: electronic stability control systems, brake controls for regenerative brake systems, electric park brake and electrically assisted power steering systems, curtain and side airbag systems, active seat belt pretensioning and retractor systems, occupant sensing systems, front and side crash sensors, vehicle rollover sensors, tire pressure monitoring systems, and driver assistance systems.
Throughout our long history as a leading supplier to major OEMs, we have focused on products and systems for which we have a technological advantage. We have extensive technical experience in a focused range of safety-related product lines and strong systems integration skills. These strengths enable us to provide comprehensive, systems-based solutions for our OEM customers. We have a broad and established global presence and sell to major OEMs across the world's major vehicle producing regions, including the expanding Chinese market. We believe our business diversification mitigates our exposure to the risks of any one geographic economy, product line or major customer concentration. It
3
also enables us to extend our portfolio of products and new technologies across our customer base and geographic regions, and provides us the necessary scale to optimize our cost structure.
In general, our long-term strategic objectives are geared toward profitably growing our business, expanding our newer, innovative technologies, winning new contracts, generating cash, strengthening our market position, and enhancing shareholder value. On an ongoing basis, we evaluate our competitive position in the global automotive supply industry and determine what actions may be required to maintain and improve that position.
We believe that a continued focus on research, development and engineering activities is critical to maintaining our leadership position in the industry and meeting our long-term objectives. We also continue to focus on our growth strategies, cash generation and capital structure improvement, while managing through near-term industry challenges, such as the fragile economic conditions in Europe, and developments in emerging markets (e.g., China). Our commitment to invest in facilities and infrastructure in order to support new business awards and achieve our long-term growth plans is evidenced by our projections of continued increases in capital expenditures through 2015.
Focus on Safety. Consumers, and therefore OEMs, are increasingly focused on, and governments and International New Car Assessment Programs ("NCAP") are increasingly requiring, improved safety in vehicles. For example, the U.S. National Highway Traffic Safety Administration ("NHTSA") in 2014 announced its first regulation for driver assistance technology, requiring compulsory fitment of rear back-up cameras starting in 2018. In Europe, lane departure warning and automatic emergency braking will become mandatory on all commercial vehicles beginning in November 2015. Further, over the last few years, automobile safety regulations in emerging markets have increased significantly. For example, Brazilian (by 2014) and Indian (by 2015) governments have mandated the use of driver and passenger airbags and anti-lock braking systems for all vehicles sold in their respective markets.
Each year the requirements that must be met to earn top ratings under various country/regional NCAP regimes become more extensive. For example, in its most recent protocol (starting with 2011 models), U.S. NCAP introduced tougher tests and rigorous new 5-star safety ratings that include information about vehicle safety and crash avoidance technologies. In 2013 and 2014, Euro NCAP began testing vehicles equipped with crash avoidance technologies to assess the effectiveness, in both low-speed ("City") and higher speed ("Inter-Urban") conditions, of autonomous emergency braking and forward collision warning systems in helping drivers to avoid or to mitigate a crash. This year, Euro NCAP will begin testing under a new protocol for pedestrian protection. Programs in emerging markets are similarly increasing the stringency of their testing requirements, with both Latin NCAP and China NCAP upgrading testing and rating protocols in 2014 and 2015, respectively. This year, India will begin testing and rating car safety under the newly established Bharat New Vehicle Safety Assessment Program.
The Alliance of Automobile Manufacturers and the Insurance Institute for Highway Safety ("IIHS") monitor and report vehicle manufacturer compliance with voluntary performance criteria which encompass a wide range of occupant protection technologies and designs, including enhanced matching of vehicle front structural components and enhanced side-impact protection through the use of features such as side airbags, airbag curtains and revised side-impact structures. IIHS recently rolled out new versions of its small and moderate offset frontal crash tests, which put more structural stress on vehicles and potentially expose more weaknesses that can contribute to occupant injuries in real-world crashes. IIHS also has adopted testing protocols for crash avoidance systems and its crash avoidance ratings of low-speed systems in the United States have been in existence since 2013.
Focus on Fuel Efficiency and Greenhouse Gas Emissions. Consumers, and therefore OEMs, are increasingly focused on, and governments are increasingly requiring, improved fuel efficiency and reduced greenhouse gas emissions from vehicles. In 2012, the U.S. Environmental Protection Agency (the "EPA") and NHTSA jointly approved a rule requiring model year 2017 through 2025 passenger
4
cars, light-duty trucks and medium-duty passenger vehicles to reduce greenhouse gas emissions and improve fuel economy. These standards require those vehicles to meet a specified average emission level in model year 2025 equivalent to 54.5 miles per gallon, if achieved exclusively through fuel economy improvements. These standards include miles per gallon requirements under NHTSA's Corporate Average Fuel Economy Standards ("CAFE") program. In 2012, the European Commission proposed regulations to reduce the average CO2 emissions of all new passenger cars sold in Europe by 30% to 95 grams per kilometer by 2020; and for light trucks and vans by 19% to 147 grams per kilometer by 2020. In 2013, the United States previously announced it will provide assistance to China in drafting stricter emissions standards. As such the EPA and the Department of Energy will assist China with its VI standards which, along with its China V standards, will reduce allowable sulfur content by 80% by 2017.
The desire to lessen environmental impacts and reduce oil dependence is also spurring interest in green technologies and alternative fuels. As such, there is an increased focus on production of advanced powertrain, direct injection and start/stop technologies and hybrid and electric vehicles because of their fuel efficiency, and developing ethanol, hydrogen, natural gas and other clean burning fuel sources for vehicles.
Globalization. The automotive industry continues to become more global and both OEMs and suppliers must balance resources and production capacity to efficiently address diverse consumer needs and preferences as well as unique market dynamics. Developing automotive markets, such as China and Brazil, represent significant growth opportunities; however, vehicle affordability remains a challenge in these markets, highlighting the need for OEMs and suppliers to meet differing requirements of consumers in both mature and emerging markets. To lower costs, OEMs continue to shift their production facilities from high-cost regions such as the U.S., Canada, and Western Europe to lower-cost regions such as China, India, Eastern Europe, and Mexico. Through these localization efforts, labor and transportation costs can be lowered, while positioning operations in markets with the highest potential for future growth. Additionally, to serve multiple markets more cost effectively, OEMs continue to move to fewer and more global vehicle platforms, which typically are designed in one location but are produced and sold in many different markets around the world, thereby enabling design cost savings and economies of scale through the production of a greater number of models from each platform. Suppliers having operations in the geographic markets in which OEMs produce global platforms are better positioned to meet OEMs' needs more economically and efficiently, thus making global coverage a source of significant competitive advantage.
Increased Electronic Content and Electronics Integration. The electronic content of vehicles has increased in recent years. Consumer and regulatory requirements in Europe and the United States for improved automotive safety and environmental performance, as well as consumer demand for increased vehicle performance and functionality at lower cost, have largely driven the increase in electronic content. Electronics integration generally refers to replacing mechanical with electronic components and integrating mechanical and electrical functions within the vehicle. This allows OEMs to achieve a reduction in the weight of vehicles and the number of mechanical parts, resulting in easier assembly, enhanced fuel economy, improved emissions control, increased safety and better vehicle performance. We believe that electronic content per vehicle will continue to increase as consumers seek more competitively-priced ride and handling performance, safety, security and convenience options in vehicles, such as electronic stability control, electric power steering, airbags, active seat belts, keyless and passive entry, tire pressure monitoring, and driver assistance systems.
Inflation and Pricing Pressure. Overall commodity volatility is an ongoing concern in the industry and has been a considerable operational and financial focus for us. As production levels rise, commodity inflationary pressures may increase, both in the automotive industry and in the broader economy. We continue to monitor commodity costs and work with our suppliers and customers to
5
manage changes in such costs. However, when costs increase, it is generally difficult to pass the full extent of increased prices for manufactured components and raw materials through to our customers in the form of price increases and, even if passed through to some extent, the recovery is typically on a delayed basis.
Additionally, pressure from OEM customers to reduce prices is characteristic of the automotive supply industry. Virtually all OEMs have policies of seeking price reductions each year. Historically, we have taken steps to reduce costs and minimize or resist price reductions. However, to the extent our cost reductions are not sufficient to support committed price reductions, our profit margins could be negatively affected.
Product Mix. Product mix tends to be influenced by a variety of factors such as gasoline prices, consumer income and wealth and governmental regulations (e.g. fuel economy standards driving higher volumes of small car production). In Europe, demand has historically tended to be toward smaller, more fuel efficient vehicles. In North America, product mix tends to be more correlated to short-term fluctuations in the price of gasoline and consumer sentiment and wealth, thereby causing production to swing between sport utility vehicles/light trucks and more economical passenger cars. Recent improvements in the U.S. housing market and overall economy, as well as lower gasoline prices have led to a higher level of light duty pickup truck production in 2014. In general, sport utility vehicles and light duty pickup trucks tend to be more profitable for OEMs and suppliers, while smaller, more fuel efficient vehicles tend to be less profitable for OEMs and suppliers.
Supply Base. As production levels fluctuate and overall economic concerns remain, Tier 2 and Tier 3 suppliers face the challenges of managing through increased working capital and capital expenditure requirements. There are concerns about suppliers' viability stemming from broader industry restructuring actions in Europe. Further, in some cases, capacity constraints, limited availability of raw materials or components or financial instability of the Tier 2 and Tier 3 supply base can pose a risk of supply disruption to us. We have dedicated resources and systems to closely monitor the viability and performance of our supply base and are constantly evaluating opportunities to mitigate the risk and/or effects of any supplier disruption.
Foreign Currencies. During the fourth quarter of 2014, the U.S. dollar strengthened against all major global currencies. We continually monitor the impact of foreign currency exchange fluctuations on our operations. Our operating results will continue to be impacted by our buying, selling and borrowing in currencies other than the functional currency of our operating companies. In order to abate the impact of fluctuations in exchange rates between these currencies and to delay the impact of adverse exchange rate trends, we utilize hedging instruments where appropriate, taking into consideration their cost and their effectiveness. However, this does not insulate us completely from currency fluctuation effects.
For further discussion on industry trends, see "Item 7—Management's Discussion and Analysis of Financial Condition and Results of Operations."
Business Segment Information
See "Segment Results of Operations" under "Item 7—Management's Discussion and Analysis of Financial Condition and Results of Operations" and Note 20 to our consolidated financial statements included under Item 8 of this Report for further information on our segments.
6
Sales by Product Line. Our 2014, 2013 and 2012 sales by product line, listed in order of current year revenue, are as follows:
| |
Percentage of Sales | |||||||||
|---|---|---|---|---|---|---|---|---|---|---|
Product Line
|
2014 | 2013 | 2012 | |||||||
Foundation brakes |
17.0 | % | 15.5 | % | 14.9 | % | ||||
Steering gears and systems |
15.7 | % | 15.5 | % | 15.9 | % | ||||
Modules |
11.1 | % | 15.5 | % | 16.1 | % | ||||
Airbags |
10.5 | % | 10.2 | % | 10.2 | % | ||||
Brake controls |
8.3 | % | 7.8 | % | 7.2 | % | ||||
Aftermarket |
7.4 | % | 7.2 | % | 7.3 | % | ||||
Seat belts |
7.2 | % | 6.9 | % | 6.8 | % | ||||
Electronics |
5.8 | % | 4.4 | % | 4.3 | % | ||||
Body controls |
4.5 | % | 4.6 | % | 4.3 | % | ||||
Steering wheels |
4.5 | % | 4.3 | % | 4.4 | % | ||||
Engine valves |
3.4 | % | 3.5 | % | 3.8 | % | ||||
Engineered fasteners and components |
2.8 | % | 2.8 | % | 2.8 | % | ||||
Linkage and suspension |
1.8 | % | 1.8 | % | 2.0 | % | ||||
Chassis Systems
Our Chassis Systems segment focuses on the design, manufacture and sale of products and systems relating to braking, steering, modules, and linkage and suspension. We sell our Chassis Systems products and systems primarily to OEMs and other Tier 1 suppliers. We also sell these products and systems to the global aftermarket through both OEM service organizations and independent distribution networks. We believe our Chassis Systems segment is well-positioned to capitalize on growth trends toward (1) increasing active safety systems, particularly in the areas of electric power steering, electronic vehicle stability control and other advanced braking systems and integrated vehicle control systems; (2) increasing electronic content per vehicle; (3) integration of active and passive safety systems; (4) improving fuel economy and reducing CO2 emissions and (5) legislative-and market-driven demand in emerging markets.
Occupant Safety Systems
Our Occupant Safety Systems segment focuses on the design, manufacture and sale of products and systems relating to airbags, seat belts, and steering wheels. We sell our Occupant Safety Systems products and systems primarily to OEMs and other Tier 1 suppliers. We also sell these products and systems to OEM service organizations. We believe our Occupant Safety Systems segment is well-positioned to capitalize on growth trends toward (1) increasing passive safety systems, particularly in the areas of side, curtain and knee airbag systems, and active seat belt pretensioning and retractor systems; (2) increasing electronic content per vehicle; (3) integration of active and passive safety systems and (4) legislative- and market-driven demand in emerging markets.
Electronics
Our Electronics segment focuses on the design, manufacture and sale of electronics components and systems in the areas of safety, chassis, radio frequency ("RF"), powertrain, and driver assistance systems, including cameras and radars. We sell our Electronics products and systems primarily to OEMs and to our Chassis Systems segment (braking and steering applications). We also sell these products and systems to OEM service organizations. We believe our Electronics segment is well-positioned to capitalize on growth trends toward (1) increasing electronic content per vehicle; (2) increasing active safety systems, particularly in the areas of electric power steering, electronic
7
vehicle stability control, integrated vehicle control systems, and driver assistance systems; (3) increasing passive safety systems, particularly in the areas of side, curtain and knee airbag systems and active seat belt pretensioning and retractor systems; (4) integration of active and passive safety systems; (5) improving fuel economy and reducing CO2 emissions and (6) legislative- and market-driven demand in emerging markets.
Automotive Components
Our Automotive Components segment focuses on the design, manufacture and sale of body controls, engine valves, and engineered fasteners and components. We sell our Automotive Components products primarily to OEMs and other Tier 1 suppliers, and to certain non-automotive markets and customers. We also sell these products to OEM service organizations. In addition, we sell some engine valve and body control products to independent distributors for the automotive aftermarket. We believe our Automotive Components segment is well-positioned to capitalize on growth trends toward (1) multi-valve and more fuel-efficient engines; (2) increasing electronic content per vehicle; (3) improving fuel economy and reducing CO2 emissions and (4) legislative- and market-driven demand in emerging markets. On February 6, 2015, we closed the sale of our wholly-owned engine valve subsidiaries which represented the material portion of the business to be divested. The closing did not include the transfer of several of our joint ventures involved in the business.
Financial Information About Geographic Areas
We have significant manufacturing operations outside the United States and, in 2014, approximately 74% of our sales originated outside the United States. See Note 20 to our consolidated financial statements included in Item 8 of this Report for financial information by geographic area. Also, see Item 1A "Risk Factors" for a description of risks inherent in our international operations.
Customers
We sell to all major OEM customers across the world's major vehicle producing regions. We also sell products to the global aftermarket as replacement parts for current production and older vehicles, through both OEM service organizations and independent distribution networks. Although business with any given customer is typically split among numerous contracts, the loss of, or a significant reduction in purchases by, one or more of those major customers could materially and adversely affect our business, results of operations and financial condition. Primary end-customer sales (by OEM group) for the years ended December 31, were:
| |
|
Percentage of Sales |
|||||||
|---|---|---|---|---|---|---|---|---|---|
OEM Group
|
OEMs | 2014 | 2013 | ||||||
Volkswagen |
Volkswagen, Audi, Skoda, Seat, Porsche | 25.8 | % | 24.7 | % | ||||
Ford |
Ford | 18.3 | % | 18.5 | % | ||||
Fiat(a) |
Chrysler, Fiat, Ferrari, Maserati, Alfa Romeo | 13.5 | % | 13.5 | % | ||||
GM |
General Motors, Opel | 7.3 | % | 10.1 | % | ||||
All Other |
35.1 | % | 33.2 | % | |||||
- (a)
- For presentation purposes, in 2013 Fiat was combined with Chrysler, which represented 9.9% of sales.
Competition
The automotive supply industry is extremely competitive. OEMs rigorously evaluate us and other suppliers based on many criteria such as quality, price/cost competitiveness, product and system
8
performance, reliability and timeliness of delivery, new product and system technology development capability, excellence and flexibility in operations, degree of global and local presence, effectiveness of customer service and overall management capability. We believe that we will continue to be able to compete effectively for our customers' business because of the high quality of our products and systems, our product and system technology innovations, our strong global presence, our ongoing cost reduction efforts, our continued investments in strengthening these positions, and our financial strength and stability.
Within each of our product segments, we face significant competition. Our principal competitors include Advics, Bosch, Continental, JTEKT, Nexteer and ZF in the Chassis Systems segment; Autoliv, Key Safety, and Takata in the Occupant Safety Systems segment; Autoliv, Bosch, Continental, Delphi, Denso, and Magna in the Electronics segment; and Delphi, Eaton, ITW, Kostal, Nifco, Raymond, Tokai Rika, and Valeo in the Automotive Components segment.
Joint Ventures
Joint ventures represent an important part of our business, both operationally and strategically. We have used joint ventures to enter into geographic markets, to gain new customers, strengthen positions with existing customers, and develop new technologies. However, certain risks exist or are increased in joint ventures when compared to conducting operations through wholly-owned entities. See Item 1A "Risk Factors" for a description of such risks.
The following table shows our significant unconsolidated joint ventures in which we have a 49% or greater interest that are accounted for under the equity method:
Country
|
Name | Our Ownership Percentage |
Products | 2014 Sales |
|||||||
|---|---|---|---|---|---|---|---|---|---|---|---|
| |
|
|
|
(Dollars in millions) |
|||||||
Brazil |
SM-Sistemas Modulares Ltda. | 50.0 | % | Brake modules | $ | 13.5 | |||||
China |
Shanghai TRW Automotive Safety Systems Company Ltd. |
50.0 |
% |
Seat belt systems, airbags and steering wheels |
253.7 |
||||||
|
CSG TRW Chassis Systems Co., Ltd. |
50.0 |
% |
Foundation brakes |
361.9 |
||||||
India |
Brakes India Limited |
49.0 |
% |
Foundation brakes, anti-lock braking systems, actuation brakes, valves and hoses |
571.7 |
||||||
|
Rane TRW Steering Systems Limited |
50.0 |
% |
Steering gears, systems and components and seat belt systems |
97.2 |
||||||
|
TRW Sun Steering Wheels |
49.0 |
% |
Steering wheels and injection molded seats |
15.0 |
||||||
Intellectual Property
We own a significant quantity of intellectual property, including a large number of patents, trademarks, copyrights and trade secrets, and are involved in numerous licensing arrangements. Our intellectual property plays an important role in maintaining our competitive position in a number of the markets that we serve. While no single patent, copyright, trade secret or license, or group of related patents, copyrights, trade secrets or licenses, is, in our opinion, of such value to us that our business would be materially affected by the expiration or termination thereof, taken in the aggregate, these intellectual property rights provide meaningful protection for our products and technical innovations. However, we view the name TRW Automotive and primary mark "TRW" as material to our business as a whole. We own a number of secondary trade names and trademarks applicable to certain of our
9
businesses and products that we view as important to such businesses and products as well. Our general policy is to apply for patents on an ongoing basis to protect our patentable developments.
We have entered into numerous technology license agreements that either strategically capitalize on our intellectual property rights or provide a conduit for us into third-party intellectual property rights useful in our businesses. In many of the agreements, we license technology to our suppliers, joint venture companies and other local manufacturers in support of product production for our customers and us. In other agreements, we license the technology to other companies to obtain royalty income.
Research, Development and Engineering
We operate a global network of technical centers worldwide where we employ and contract several thousand engineers, researchers, designers, technicians and their supporting functions. This global network allows us to develop active and passive automotive safety technologies while improving existing products and systems. We utilize sophisticated testing and computer simulation equipment and employ various tools to improve efficiency and reduce cost.
We believe that continued research, development and engineering activities are critical to maintaining our leadership position in the industry and will provide us with a competitive advantage as we seek additional business with new and existing customers. Our research and development costs were approximately $230 million, $193 million, and $164 million for the years ended December 31, 2014, 2013, and 2012, respectively. Total company-funded engineering expenses including research and development costs were approximately $957 million, $905 million and $834 million for the years ended December 31, 2014, 2013, and 2012, respectively. Excluding our modules and aftermarket sales, which do not directly benefit from such activities, our total company-funded research, development and engineering expenses were approximately 6.6%, 6.7% and 6.6% of sales for the years ended December 31, 2014, 2013, and 2012, respectively.
Seasonality
Our business is moderately seasonal because our largest North American customers typically halt operations for approximately two weeks in July and one week in December. Additionally, customers in Europe historically shut down vehicle production during portions of August and one week in December. Accordingly, our third and fourth quarter results may reflect these trends.
Backlog
The dollar amount of backlog orders believed to be firm is immaterial to us. While we receive individual purchase orders from OEMs for products to be supplied for a particular vehicle model or vehicle platform, we typically produce products in response to our customers' purchase order releases under which the volume of production can fluctuate. Further, the purchase orders typically do not provide for minimum quantities and in many cases can be terminated by our customers. As a result, our actual sales under each purchase order are dependent on the number of vehicles that our customers actually produce which use the products we supply as well as the timing of such production.
Supply Base—Manufactured Components and Raw Materials
We purchase various manufactured components and raw materials for use in our manufacturing processes, including castings, electronic parts, molded plastic parts, finished subcomponents, fabricated metal, aluminum, steel, resins, textiles, leather and wood. All of these components and raw materials are available from numerous sources, although certain of them, such as rare earth metals, may be geographically concentrated. Because we purchase various types of equipment, raw materials and component parts from our suppliers, we may be adversely affected by their failure to perform as expected or their inability to adequately mitigate inflationary, industry, or economic pressures. Strain on
10
our supply base may possibly lead to delivery delays, production issues or delivery of non-conforming products by our suppliers. As such, we continue to monitor our vendor base for the best source of supply and work with those vendors and customers to attempt to mitigate the impact of the pressures mentioned above.
Consistent with just-in-time delivery standards generally used in the industry, we normally do not carry inventories of these items in excess of those reasonably required to meet our production and shipping schedules. Although we have been able to successfully mitigate the impact of supply shortages that have arisen in recent years, the possibility of shortages exists, especially in light of the increase in working capital demands on our suppliers as production levels increase.
Employees
As of December 31, 2014, we had approximately 66,900 full-time employees and approximately 12,000 temporary/contract employees (excluding employees who were on approved forms of leave).
As of December 31, 2013, we had approximately 67,100 full-time employees and approximately 11,100 temporary/contract employees (excluding employees who were on approved forms of leave).
Environmental Matters
Governmental requirements relating to the discharge of materials into the environment, or otherwise relating to the protection of the environment, have had, and will continue to have, an effect on our operations and us. We have made, and continue to make, expenditures for projects relating to the environment, including pollution control devices for new and existing facilities. We are conducting a number of environmental investigations and remedial actions at current and former locations to comply with applicable requirements and, along with other companies, have been named a potentially responsible party for certain waste management sites. Each of these matters is subject to various uncertainties, and some of these matters may be resolved unfavorably to us. Further information regarding environmental matters, including the related reserves, is contained in Note 19 to our consolidated financial statements included in Item 8 of this Report, and is incorporated herein by reference.
We do not believe that compliance with environmental protection laws and regulations will have a material effect on our capital expenditures, earnings or competitive position. Our capital expenditures pertaining to environmental control during each of 2015 and 2016 are not expected to be material to us.
11
You should carefully consider the risks described below and other information contained in this Annual Report on Form 10-K when considering an investment decision with respect to our securities. All material risks currently known to management are described below. The occurrence of any of the events discussed in the risk factors below could have a material adverse effect on our results of operations, financial condition and/or cash flow, and the impact could be compounded if multiple risks were to occur.
The occurrence of any event, change or other circumstances that could give rise to the termination of the Merger Agreement could have a material adverse affect on us and our stock price.
As described in the following risk factor, we could experience certain consequences related to the termination of the Merger Agreement and failure to consummate the ZF Merger. In addition, pursuant to the terms of the Merger Agreement, if the Merger Agreement is terminated under certain circumstances a termination fee of $450 million will be payable by us to ZF. There can be no assurance that the Merger Agreement will not be terminated under the circumstances triggering this obligation. If triggered, payment of the termination fee will negatively impact our results of operations, financial condition and cash flows and such impact will be over and above the consequences described below related to the failure to consummate the ZF Merger.
The proposed ZF Merger may not be consummated or may not be consummated in the timeframe or manner currently anticipated, which could have a material adverse effect on us and our stock price.
Although our stockholders have adopted the Merger Agreement, the proposed ZF Merger remains subject to various closing conditions such as antitrust approvals in the United States and certain other jurisdictions, among other customary closing conditions. It is possible that a government entity may prohibit, delay or refuse to grant approval for the consummation of the ZF Merger. If any condition to the closing of the ZF Merger is not satisfied or, if permissible, waived, the ZF Merger will not be completed. In addition, satisfying the conditions to the closing of the ZF Merger may take longer than we expect. There can be no assurance that any of the remaining conditions to closing will be satisfied or waived or that other events will not intervene to delay or result in the failure to consummate the ZF Merger.
Since the proposed ZF Merger was announced, the Company, members of our board of directors, ZF, Merger Sub and others have been named as defendants in one or more of the purported class actions filed by purported stockholders of the Company challenging the proposed ZF Merger. The actions seek, among other forms of relief, an order enjoining the ZF Merger, rescinding the Merger Agreement to the extent it has already been implemented, and awarding attorneys' fees and costs. The Company and the other named defendants have reached an agreement in principle to settle the pending lawsuits. That agreement is subject to court approval. We anticipate the litigation will be resolved and will not interfere with or delay the closing, but until court approval is obtained and the cases are dismissed, some uncertainty remains. See Part I, Item 3 of this Report for further information on litigation relating to the ZF Merger.
If the ZF Merger is not completed for any reason, the price of our common stock may decline to the extent that the current market price may reflect an assumption that the ZF Merger will be consummated at the per share merger consideration of $105.60 in cash specified in the Merger Agreement. Investor confidence could also decline. Further, we have expended, and continue to expend, significant management resources in an effort to complete the ZF Merger. We also are, and will become, obligated to pay certain professional fees and related expenses in connection with the negotiation of the Merger Agreement and performance thereunder, whether or not the ZF Merger is completed, and these expenses will impact our results of operations. If the ZF Merger is not completed
12
we will have incurred these costs, including the diversion of management resources, for which we will have received little or no benefit.
Further, any delay in closing or a failure to close the ZF Merger could exacerbate any negative impact on our business and our relationships with our customers, suppliers, joint venture partners, other parties with which we maintain business relationships, or employees as described in the risk factors below, as well as negatively impact our ability to implement alternative business plans.
Disruption of management's attention from our ongoing business operations due to the proposed ZF Merger.
We have expended, and continue to expend, significant management resources in an effort to complete the ZF Merger. Management's attention may be diverted away from the day-to-day operations of our business and execution of our existing business plan in our efforts to complete the ZF Merger. This diversion of management resources could disrupt operations and have an adverse effect on our operating results and business.
The announcement of the proposed ZF Merger could disrupt our relationships with our customers, suppliers, joint venture partners and others, as well as our operating results and business generally.
Whether or not the ZF Merger is ultimately consummated, as a result of uncertainty related to the proposed transaction, risks relating to the impact of the announcement of the ZF Merger on our business include the following:
- •
- our employees may experience uncertainty about their future roles, which might adversely affect our ability to retain and hire key
personnel and other employees;
- •
- customers, suppliers, joint venture partners and other parties with which we maintain business relationships may experience
uncertainty about our future and seek alternative relationships with third parties, seek to alter their business relationships with us or fail to extend an existing relationship with us; and
- •
- we have expended and will continue to expend significant costs, fees and expenses for professional services and transaction costs in connection with the proposed ZF Merger; these costs will impact our results of operations regardless of whether or not the ZF Merger is consummated.
Further, the Merger Agreement restricts us from taking certain actions without ZF's consent while the ZF Merger is pending. These restrictions may, among other matters, prevent us from pursuing otherwise attractive business opportunities, making certain investments or acquisitions, selling assets, engaging in capital expenditures in excess of certain agreed limits, incurring certain indebtedness or making certain other changes to our business pending the closing of the ZF Merger. These restrictions could have an adverse effect on our business, financial condition and results of operations.
In addition to the foregoing, the amount of the per share merger consideration to be paid in cash pursuant to the Merger Agreement is fixed and will not be adjusted for changes in our business, assets, liabilities, prospects, outlook, financial condition or results of operation or in the event of any change in the market price of, analyst estimates of, or projections relating to, our common stock. Therefore, the market value of our common stock may vary significantly from the value on the date the Merger Agreement was executed or at other later dates.
Strengthening of the U.S. dollar, as well as other foreign currency exchange rate fluctuations, could materially impact our results of operations.
In 2014, approximately 74% of our sales originated outside the United States. We translate sales and other results denominated in foreign currencies into U.S. dollars for our consolidated financial
13
statements. This translation is based on average exchange rates during a reporting period. The U.S. dollar has been strengthening against many international currencies, including the euro, the British pound, the Mexican peso, the Czech koruna and the Brazilian real. For example, the euro-to-dollar spot exchange rate fell from 1:1.3783 on December 31, 2013 to 1:1.2160 on December 31, 2014. As the exchange rate of the U.S. dollar strengthens, our reported international sales and earnings are reduced because foreign currencies translate into fewer U.S. dollars.
Separately, while we generally produce in the same geographic markets as our products are sold, our sales are more concentrated in U.S. dollars and in euros than our expenses, and therefore our profit margins and earnings could be reduced due to fluctuations or adverse trends in foreign currency exchange rates. While we employ financial instruments to hedge certain of these exposures, this does not insulate us completely from currency fluctuation effects.
Economic conditions could have a material adverse effect on our business, results of operations and the viability of our supply base.
Automotive sales and production are highly cyclical and depend on, among other things, general economic conditions and consumer spending and preferences. Consumer spending and preferences can be affected by a number of issues, including employment levels, changes in expendable income due to the pace of wage growth and changes in personal tax rates, fuel costs, real estate values, the availability of consumer financing and concerns about the economy. Vehicle sales and production can also be impacted by the age of the vehicle fleet and applicable scrappage rates. As the volume of automotive production fluctuates, the demand for our products also fluctuates. Production levels in Europe and North America most notably affect us given our concentration of sales in those regions, which accounted for 42% and 33%, respectively, of our 2014 sales.
Caution over the European economy continues to exist, given ongoing debt concerns, high unemployment and a general lack of consumer confidence, as well as fears of deflation. Although 2014 European vehicle production levels improved over 2013, they remained at historically low levels and excess automotive manufacturing capacity continues to exist. This has negatively impacted our sales and led to restructuring efforts by us and others in the region. However, high levels of fixed costs and long lead times in Europe can make it difficult to adjust our cost base to the extent necessary, or to make such adjustments on a timely basis, impacting our profitability. Restructuring actions beyond those currently anticipated could also be required. Reduced European sales and production levels and any resulting cost-cutting and downsizing actions implemented by us or others in our industry could also have a negative economic effect on our supply base. In addition, rapidly changing industry conditions such as volatile production volumes and other factors can also adversely affect our supply chain. Such impacts on our suppliers could negatively affect our business through inability to meet our commitments (or inability to meet them without excess expense) because of our suppliers' inability to perform.
We are subject to risks associated with our non-U.S. operations that could have an adverse effect on our business, results of operations and financial condition.
We have significant operations outside the United States, and expanding our operations in certain emerging markets such as China and building our business relationships with Asian automotive manufacturers are important elements of our growth strategy. Operations outside of the United States, particularly operations in emerging markets, are subject to various risks which may not be present or as significant for operations within U.S. markets, and our exposure to these risks increases as we expand. Government actions in markets subject to governmental control, both in terms of policy-setting as well as actions directly affecting our operations, could negatively affect our results of operations and cash flows in those areas.
14
Risks inherent in our international operations include: exposure to local economic conditions, such as those currently existing in Europe and Brazil; wage inflation in emerging markets; social plans that prohibit or increase the cost of certain restructuring actions, particularly in certain European countries; increases in working capital requirements related to long supply chains or regional terms of business; foreign currency exchange rate fluctuations such as the depreciation of many international currencies against the U.S. dollar; currency exchange controls; restrictive governmental actions such as restrictions on transfer or repatriation of funds; variations in protection of intellectual property and other legal rights; import or export licensing requirements; the difficulty of enforcing agreements and collecting receivables through certain foreign legal systems; trade protection matters; restrictions on acquisitions or joint ventures; increased risk of corruption; changes in laws and regulations, including those of the United States affecting trade and foreign investment; more expansive legal rights of foreign labor unions; the potential for expropriations of property; exposure to local public health concerns and the resultant impact on economic and political conditions; the potential instability of foreign governments and unsettled social and political conditions in general; and possible terrorist attacks, drug cartel related violence such as in Mexico or acts of war or hostilities from local populations. Certain regions, including Asia and Latin America, are more economically and politically volatile and, as a result, our business units that operate in these regions could be subject to significant fluctuations in sales and operating income. Further, there are potential tax inefficiencies in repatriating funds from non-U.S. subsidiaries. The likelihood of such occurrences and their potential effect on the Company vary from country to country and are unpredictable.
Our non-U.S. operations include joint ventures and other alliances, most significantly in the Asia-Pacific region. Additional risks characteristic of these arrangements include the risk of conflicts arising between us and our joint venture partners and the lack of unilateral control of management. We also risk circumstances where our joint venture partner may fail to satisfy its obligations, which could result in increased liabilities to us. Further, our ability to repatriate funds may be constrained by the terms of particular agreements with our joint venture partners.
These and other factors may have an adverse effect on our international operations and, therefore, on our business, results of operations and financial condition, which may become more pronounced as we expand further in these areas.
Developments related to antitrust investigations by government regulators could have a material adverse effect on our financial condition, results of operations and cash flows, as well as our reputation.
We are subject to a variety of laws and regulations that govern our business both in the United States and internationally, including those relating to competition (antitrust). Antitrust authorities, including those in the United States and Europe, are investigating possible violations of competition (antitrust) laws by automotive parts suppliers (referred to herein as the "Antitrust Investigations"). The U.S. Department of Justice (the "DOJ") initiated an investigation into our Occupant Safety Systems business in June 2011, which was concluded when the court approved a plea agreement between one of our German subsidiaries and the DOJ. Also in June 2011 the European Commission initiated an Antitrust Investigation which includes the Company, among others, and which is ongoing. While the duration and outcome of the European Commission's investigation is uncertain, a determination that the Company has violated European competition (antitrust) laws could result in significant penalties which could have a material adverse effect on our financial condition, results of operations and cash flows, as well as our reputation. European competition law investigations often continue for several years and have resulted in the imposition of significant fines by the European Commission, in some cases, for violations at other companies. At this point, we cannot estimate the ultimate financial impact resulting from the European investigation. However, developments related to such investigations could have a material adverse effect on our financial condition, results of operations and cash flows, as well as our reputation.
15
Continuing pricing pressures from our customers may adversely affect our profitability.
Pricing pressure in the automotive supply industry has been substantial and is likely to continue. Vehicle manufacturers possess significant leverage over their suppliers, including us, because the automotive supply industry is highly competitive, serves a limited number of customers, and has a high fixed cost base. Virtually all vehicle manufacturers seek price reductions in both the initial bidding process and during the term of the contract. Estimating such amounts is subject to uncertainties because any price reductions are a result of negotiations with our customers and other factors. Price reductions have impacted our sales and profit margins in the past. If we are not able to offset price reductions through improved operating efficiencies and reduced expenditures, those price reductions may adversely affect our sales and profitability in the future.
We face significant global competition that could adversely affect our sales, profitability and financial condition.
The global automotive supply industry is highly competitive. We compete with other automotive suppliers on the basis of technological innovation, quality, delivery, price, program launch support and overall customer service, among other things. Our competitors include a number of domestic and international suppliers, some of which have established strong relationships with significant vehicle manufacturers. Our ability to compete successfully depends, in large part, on our ability to continue to innovate and manufacture products that have commercial success with consumers, differentiate our products from those of our competitors, continue to deliver quality products in the time frames required by our customers, leverage our global footprint and maintain low-cost production. Our competitors may develop products that are superior to our own, produce products similar to ours at a lower cost or adapt more quickly than we do to new technologies or evolving customer requirements or consumer preferences. Furthermore, establishing a strong position in the Chinese market is a key component of our global growth strategy. While the automotive supply market in China is already highly competitive, as the size of the Chinese market continues to increase, additional competitors may seek to enter the Chinese market, and may act aggressively to establish their market share, increasing the competitiveness further. Competition can lead to price reductions, reduced margins and an inability to gain or hold market share. If we are unable to compete successfully, our sales, profitability and financial condition could be adversely affected.
A disruption in our information technology ("IT") systems could adversely impact our business and operations.
We rely on the accuracy, capacity and security of our IT systems, some of which are managed or hosted by third parties, and our ability to continually update these systems in response to the changing needs of our business. We have incurred costs and may incur significant additional costs in order to implement the security measures that we feel are appropriate to protect our IT systems. Our security measures are focused on the prevention, detection and remediation of damage from computer viruses, natural or man-made disasters, unauthorized access, cyber attacks and other similar disruptions. However, despite the security measures we had implemented, unauthorized access to certain of our systems was detected in November 2012. Although we found no evidence that any data was actually taken and the functionality of our systems was unaffected, future attacks could result in our systems or data being breached and/or damaged by computer viruses or unauthorized physical or electronic access. Such a breach could result in not only business disruption, but also theft of our intellectual property or trade secrets and/or unauthorized access to controlled data and personal information stored in connection with our human resources function. Any interruption, outage or breach of our IT systems could adversely affect our business operations. Further, as we continue to increase our use of centralized shared service centers for efficiency purposes, the significance of any interruption or breach of the related IT systems will increase. To the extent that any data is lost or destroyed or any
16
confidential information is inappropriately disclosed or used, it could adversely affect our competitive position or customer relationships, harm our business and possibly lead to claims or liability based upon alleged breaches of contract or applicable laws.
We could be adversely affected by any shortage of supplies causing a production disruption.
We, our customers, or other suppliers may experience supply shortages of, or delays in the supply of, components or raw materials. This could be caused by a number of factors, including insufficient production line capacity for a particular product or manpower or working capital constraints or other factors, including weather emergencies and natural or man-made disasters impacting the accessibility of raw materials or components, labor or social/political unrest, commercial disputes, public health concerns or acts of terrorism or other hostilities. Due to the industry's reliance on "just-in-time" delivery of components during the assembly and manufacture of vehicles, oftentimes only minimal inventories of supplies are readily available. Further, if an issue arises, many components cannot be re-sourced quickly or inexpensively to another supplier due to, among other things, long lead times to full production, the unavailability of other suppliers or demands imposed by alternative suppliers. Although we consider the production capacities, financial condition and physical locations of suppliers in our selection process, there is no assurance that the foregoing factors will not result in any shortages or delays. Further, we and others in our industry have been rationalizing and consolidating our supply base in order to manage and reduce the cost of purchased goods and services and, due to the turbulence in the automotive industry, several suppliers have ceased operations. As a result, there is greater dependence on fewer sources of supply for certain components and materials. Further, suppliers may face capacity constraints as the industry recovery progresses or liquidity issues in light of economic pressures. These factors could increase the possibility of a supply shortage of a particular component or material.
Similarly, if any of our customers experience a material supply shortage, either directly or as a result of a disruption at another supplier, that customer may halt or limit the purchase of our products. Such production interruptions could impede a ramp-up in vehicle production and could have a material adverse effect on our business, results of operations and financial condition.
Our business and results of operations would be materially and adversely affected if we lost any of our largest customers, lost a significant portion of their business, or if their production levels significantly declined, particularly with respect to models for which we are a significant supplier.
In general, our financial results are more closely correlated to production by Volkswagen as well as the Detroit Three (defined as FCA US LLC—formerly known as Chrysler Group LLC, and a subsidiary of Fiat Chrysler Automobiles N.V., Ford Motor Company and General Motors Company, combined), given our higher sales content with these manufacturers. For the year ended December 31, 2014, sales to these customers, which represent our four largest customer groups on a worldwide basis, were approximately 61% of our total sales. Although business with each customer is typically split among numerous contracts, if we lost a major customer or a major customer significantly reduced its purchases of our products, there could be a material adverse affect on our business, results of operations and financial condition.
As a result, our revenue may be disproportionately affected by decreases in the businesses or market share of any of our largest customers. Further, because our customers typically have no obligation to purchase a specific quantity of parts, a decline in their production levels on vehicle platforms where we provide significant content or there is significant volume could have an adverse effect on our business and financial condition. Their production levels could decline due to the lack of commercial success of a particular vehicle or platform or a temporary or prolonged sales mix shift based upon changing consumer preferences, customer incentives, changing customer inventory levels, production disruptions or other events.
17
Our ability to reduce the risks inherent in certain concentrations of business and thereby maintain our financial performance going forward will depend, in part, on our ability to continue to diversify our sales on a customer, product and geographic basis. As a result, if any of the factors described above causes any of our largest customers to halt or significantly reduce purchases of our products, it would harm our results of operations, financial condition and liquidity.
We may incur material losses and costs in connection with our contingent liabilities and tax matters.
We are involved in legal and regulatory proceedings that, from time to time, are significant. These proceedings typically involve claims that arise in the normal course of business, including commercial or contractual disputes, intellectual property matters, product liability claims including asbestos claims, environmental issues, tax matters and employment matters. We are also subject to a pending antitrust investigation in the European Union that is addressed in another risk factor above.
In our business we have an inherent risk of product liability and warranty claims. Over the past year, there has been a significant increase in the level of scrutiny given to vehicle safety issues, with new attention being given to the suppliers whose products could be involved in recall related issues. Inquiries are being conducted not only by traditional regulators such as the National Highway Traffic Safety Administration ("NHTSA"), but state Attorneys General have commenced investigations and U.S. Congressional hearings have also been conducted in which vehicle manufacturers and in some cases suppliers are being called to testify as to particular product performance and safety risks. Historically we have been required to participate in product recalls, and are likely to do so in the future. Possibly as a result of the enhanced scrutiny, vehicle manufacturers have experienced a higher level of recall campaigns in recent years, reaching an all-time record 63.8 million vehicles recalled in the United States in 2014 according to some reports. Given the increased scrutiny around automotive safety issues, it is possible that NHTSA will be more likely to require additional recalls and that, likewise, vehicle manufacturers may also be inclined to initiate more recalls than they perhaps would have in the past. Vehicle manufacturers often seek contribution from their suppliers when faced with product liability, warranty and recall claims. In addition, we have been subject to continuing efforts by our customers to change contract terms and conditions concerning warranty and recall participation. Further, recalls or other investigations involving our products can harm our reputation and cause us to lose business, particularly if they cause our customers to lose confidence in the safety of our products. Also, as vehicle manufacturers lengthen their warranty commitments to consumers and the affected vehicles age, warranty claims may increase. Finally, our costs to defend certain product liability cases have increased due to the bankruptcies of Chrysler LLC and General Motors Corporation.
Certain of our subsidiaries have been subject in recent years to asbestos-related claims which, in general, seek damages for illnesses alleged to have resulted from exposure to asbestos used in certain components sold in the past by our subsidiaries. While, based on our experience, management believes that only a small proportion of the claimants has or will ever develop any asbestos-related illness, litigation can be unpredictable.
Our recorded liabilities and estimates of reasonably possible losses for our contingent liabilities are based on our assessment of potential liability using the information available to us at the time and, as applicable, any past experience and trends with respect to similar matters. However, litigation is inherently uncertain, and such claims could have a material adverse effect on our business, financial condition, results of operations and cash flows.
Adverse changes in the underlying profitability and financial outlook of our operations in many jurisdictions could lead to changes in our valuation allowances against deferred tax assets. Additionally, changes in tax laws in the U.S. or in other countries where we have operations could adversely affect deferred tax assets and liabilities and the overall provision for income taxes. Further, we are subject to tax audits by governmental authorities in the U.S. and numerous international jurisdictions, which are
18
inherently uncertain. Negative or unexpected results from one or more such tax audits or changes to tax laws governing the jurisdictions in which we operate could adversely affect our business, our results of operations and financial condition.
For further information regarding our contingent liabilities and tax matters, refer to Notes 19 and 10, respectively, of our consolidated financial statements.
If we are unable to protect our intellectual property rights, this could have a material adverse impact on our business and our competitive position.
We own significant intellectual property, including a large number of patents, trademarks, copyrights and trade secrets, and are involved in numerous licensing arrangements. Our intellectual property plays an important role in maintaining our competitive position in a number of the markets that we serve. Our competitors may develop technologies that are similar or superior to our proprietary technologies or design around the patents we own or license. Further, as we expand our operations in jurisdictions where the protection of intellectual property rights is less robust, such as China where we have built an extensive research and development facility, the risk of others duplicating our proprietary technologies increases, despite efforts we undertake to protect them. As we adopt new technologies, we face an inherent risk of exposure to the claims of others that we have allegedly violated their intellectual property rights. We have faced legal challenges to our intellectual property rights and will continue to face such challenges, which we vigorously defend. Although management believes that the loss or expiration of any single intellectual property right would not have a material effect on our results of operations or financial position, there can be no assurance that multiple patents and other intellectual property rights will not be invalidated or circumvented by third parties. As a result, developments or assertions by or against us relating to intellectual property rights, and any inability to protect these rights, could materially adversely impact our business and our competitive position.
Governmental regulations increase our costs and could adversely affect our business, reputation and results of operations.
Our global operations are subject to a variety of federal, state, local and international laws and regulations which may have a direct or indirect effect on our business. Compliance with the various laws and regulations increases our cost of doing business and, in some cases, restricts our ability to conduct business. These regulations are numerous and often inconsistent, and include:
- •
- The Transportation Recall Enhancement, Accountability and Documentation (or TREAD) Act with respect to reporting certain claims
- •
- Environmental and occupational health and safety legislation
- •
- Sanctioned country restrictions
- •
- Immigration and international trade, including import and export laws
- •
- Competition (or antitrust) laws
- •
- Anti-corruption laws such as the U.S. Foreign Corrupt Practices Act and the U.K. Bribery Act
- •
- Conflict minerals requirements
- •
- U.S. Patient Protection and Affordable Care Act
- •
- Data privacy requirements
- •
- Tax laws
- •
- Accounting requirements
19
The laws and regulations governing environmental and occupational safety and health, in particular, are complicated, change frequently and have tended to become stricter over time. We may not be in complete compliance with such laws and regulations at all times. As an owner and operator, we could also be responsible under some laws for responding to contamination detected at any of our operating sites or at third party sites to which our wastes were sent for disposal, regardless of whether we caused the contamination or the legality of the original activity. Our costs or liabilities relating to these matters may be more than the amount we have reserved and the difference may be material. Further, as we sell or close facilities around the world, environmental assessments and investigations will continue to be performed and additional costs related to remediation, demolition or decommissioning may result.
Compliance with multiple laws and regulations increases our cost of doing business. Further, violations of laws and regulations could result in civil and criminal fines, penalties and sanctions against us, our officers or our employees, as well as prohibitions on the conduct of our business and on our ability to offer our products in one or more countries, and could also materially affect our reputation, business and results of operations. Violations of environmental laws could also result in obligations to investigate or remediate contamination or third party property damage or personal injury claims allegedly due to the migration of contaminants off-site. Although we have implemented policies and procedures designed to ensure compliance with applicable laws and regulations, there can be no assurance that our employees, contractors or agents will not violate our policies or applicable laws and regulations.
Work stoppages or other labor issues at our facilities or the facilities of our customers or those in our supply chain could have a material adverse effect on our business, results of operations and financial condition.
Due to normal and ordinary labor negotiations or as a result of a specific labor dispute, a work stoppage may occur in our facilities or those of our customers or other suppliers. Restructuring and other actions taken to address negative industry trends in recent years, coupled with the industry recovery in North America, or social/political and economic pressures in Europe may have the effect of exacerbating labor relations problems which could increase the possibility of such a work stoppage. In addition, labor work stoppages by other groups on which the supply chain depends, such as port workers or other logistics groups, could also negatively impact us. If any of our customers experience a material work stoppage, either directly or as a result of a work stoppage at another supplier, that customer may halt or limit the purchase of our products. Similarly, a work stoppage at our facilities or one of our own suppliers or others in the supply/delivery chain could limit or stop our production of or ability to deliver the affected products. Such interruptions could have a material adverse effect on our business, results of operations and financial condition.
Commodity inflationary pressures may adversely affect our profitability and the viability of our Tier 2 and Tier 3 supply base.
Despite the stabilization over the past year in the cost of most of the commodities we use in our business, we remain susceptible to commodity inflationary pressures. These pressures have in the past, and may again in the future, put significant operational and financial burdens on us and our suppliers, potentially resulting in declining margins and operating results. It is generally difficult to pass the full extent of increased prices for manufactured components and raw materials through to our customers and, even if passed through to some extent, the recovery is typically on a delayed basis. Furthermore, our suppliers may not be able to handle the commodity cost increases. The unstable condition of some of our suppliers or their failure to perform has in the past caused us to incur additional costs which negatively impacted certain of our businesses. If inflationary pressures return, our suppliers may not be able to perform as we expect, which may have a negative impact on our results of operations and financial condition.
20
Our pension and other postretirement benefits obligations are significant and the related expense and funding requirements of our pension plans could materially increase, reducing our profitability.
We face the continuing burden of significant pension and other postretirement liabilities. Although we have made notable progress in abating a significant portion of our pension liabilities under certain of our defined benefit pension plans, including the two largest (our U.S. salaried pension plan and our U.K. pension plan), through pension buyouts and annuitizations, a significant number of our employees and former employees remain entitled to benefits under defined benefit pension plans or retirement/termination indemnity plans. The obligations and expense recognized in our financial statements for these plans is actuarially determined based on certain assumptions which are driven by market conditions, including interest rates. Additionally, market conditions impact the underlying value of the assets held by the plans for settlement of these obligations. Further declines in interest rates or the market values of the securities held by the plans, or certain other changes, could negatively affect the funded status of these plans and the level and timing of future contributions. Additionally, these factors could significantly increase our pension expense and reduce our profitability. See Note 11 of our consolidated financial statements for more information about these plans.
We also sponsor other postretirement employee benefits ("OPEB") primarily in the United States and Canada. We fund our OPEB costs on a pay-as-you-go basis; accordingly, the related plans have no assets. We are subject to increased OPEB cash outlays and costs due to increasing health care costs, among other factors. Increases in the expected costs of health care in excess of current assumptions could increase our actuarially determined obligations and our related OPEB expense along with future cash outlays.
ITEM 1B. UNRESOLVED STAFF COMMENTS
None.
Our principal executive offices are located in Livonia, Michigan. Our operations include numerous manufacturing, research and development, warehousing facilities and offices. We own or lease principal facilities located in 12 states in the United States and in 23 other countries as follows: Brazil, Canada, China, the Czech Republic, France, Germany, Italy, Japan, Malaysia, Mexico, Poland, Portugal, Romania, Singapore, Slovakia, South Africa, South Korea, Spain, Sweden, Thailand, Tunisia, Turkey, and the United Kingdom.
Approximately 53% of our principal facilities are used by the Chassis Systems segment, 22% are used by the Occupant Safety Systems segment, 4% are used by the Electronics segment and 21% are used by the Automotive Components segment. Our corporate headquarters are contained within the Chassis Systems segment numbers below. We consider our facilities to be adequate for our current uses.
Of the total number of principal facilities operated by us, approximately 58% of such facilities are owned and 42% are leased.
A summary of our principal facilities, by segment, type of facility and geographic region, as of December 31, 2014 is set forth in the following tables. Additionally, where more than one segment utilizes a single facility, that facility is categorized by the purposes for which it is primarily used.
21
Chassis Systems
Principal Use of Facility
|
North America |
Europe | Asia Pacific(2) |
Other(2) | Total | |||||||||||
|---|---|---|---|---|---|---|---|---|---|---|---|---|---|---|---|---|
Manufacturing(1) |
20 | 25 | 15 | 4 | 64 | |||||||||||
Research and Development |
3 | 4 | 4 | 1 | 12 | |||||||||||
Warehouse |
2 | 5 | 3 | 2 | 12 | |||||||||||
Office |
2 | 5 | 4 | — | 11 | |||||||||||
| | | | | | | | | | | | | | | | | |
Total number of facilities |
27 | 39 | 26 | 7 | 99 | |||||||||||
| | | | | | | | | | | | | | | | | |
| | | | | | | | | | | | | | | | | |
| | | | | | | | | | | | | | | | | |
Occupant Safety Systems
Principal Use of Facility
|
North America |
Europe | Asia Pacific |
Other | Total | |||||||||||
|---|---|---|---|---|---|---|---|---|---|---|---|---|---|---|---|---|
Manufacturing(1) |
5 | 23 | 1 | 1 | 30 | |||||||||||
Research and Development |
2 | 2 | — | — | 4 | |||||||||||
Warehouse |
2 | 3 | — | — | 5 | |||||||||||
Office |
1 | 1 | — | — | 2 | |||||||||||
| | | | | | | | | | | | | | | | | |
Total number of facilities |
10 | 29 | 1 | 1 | 41 | |||||||||||
| | | | | | | | | | | | | | | | | |
| | | | | | | | | | | | | | | | | |
| | | | | | | | | | | | | | | | | |
Electronics
Principal Use of Facility
|
North America |
Europe | Asia Pacific |
Other | Total | |||||||||||
|---|---|---|---|---|---|---|---|---|---|---|---|---|---|---|---|---|
Manufacturing(1) |
2 | 3 | 1 | — | 6 | |||||||||||
Research and Development |
2 | — | — | — | 2 | |||||||||||
| | | | | | | | | | | | | | | | | |
Total number of facilities |
4 | 3 | 1 | — | 8 | |||||||||||
| | | | | | | | | | | | | | | | | |
| | | | | | | | | | | | | | | | | |
| | | | | | | | | | | | | | | | | |
Automotive Components
Principal Use of Facility
|
North America |
Europe | Asia Pacific |
Other | Total | |||||||||||
|---|---|---|---|---|---|---|---|---|---|---|---|---|---|---|---|---|
Manufacturing(1) |
7 | 20 | 8 | 3 | 38 | |||||||||||
Office |
1 | — | — | — | 1 | |||||||||||
| | | | | | | | | | | | | | | | | |
Total number of facilities |
8 | 20 | 8 | 3 | 39 | |||||||||||
| | | | | | | | | | | | | | | | | |
| | | | | | | | | | | | | | | | | |
| | | | | | | | | | | | | | | | | |
- (1)
- Although
primarily classified as Manufacturing locations, several sites maintain a large Research and Development presence located within the same facility.
- (2)
- For management reporting purposes Chassis Systems—Asia Pacific and Other contain several primarily Occupant Safety Systems facilities including Research and Development Technical Centers and Manufacturing locations.
Antitrust Matters
Antitrust authorities, including those in the United States and Europe, are investigating possible violations of competition (antitrust) laws by automotive parts suppliers (referred to herein as the "Antitrust Investigations"). The U.S. Department of Justice ("DOJ") initiated an investigation into the
22
Company's Occupant Safety Systems business in June 2011, which was concluded in 2012 when the court approved a plea agreement between one of our German subsidiaries and the DOJ. Also in June 2011, the European Commission initiated an Antitrust Investigation which includes the Company, among others, and which is ongoing. While the duration and outcome of the European Commission's investigation is uncertain, a determination that we have violated European competition (antitrust) laws could result in significant penalties which could have a material adverse effect on its financial condition, results of operations and cash flows, as well as its reputation. While we cannot estimate the ultimate financial impact resulting from the European investigation, we will continue to evaluate developments in this matter on a regular basis and will record an accrual as and when appropriate.
Our policy is to comply with all laws and regulations, including all antitrust and competition laws. We are cooperating fully with the competition authorities in the context of their ongoing investigations.
We have settled, for amounts that are immaterial to us, certain purported class action lawsuits filed on behalf of vehicle purchasers, lessors, dealers and direct purchasers alleging that the Company and certain of its competitors conspired to fix and raise prices for Occupant Safety Systems products. These lawsuits were filed on various dates from June 2012 through May 2014 in, or were consolidated in, the United States District Court for the Eastern District of Michigan. Once the court approves the settlements, those cases will be dismissed. We have also settled, for an amount that is immaterial to us, similar cases filed in various courts in Canada on behalf of vehicle purchasers, lessors, dealers and direct purchasers.
Transaction Litigation
Following the announcement of the execution of the Merger Agreement on September 15, 2014, seven purported stockholders of the Company initiated legal actions challenging the merger. On September 19, 2014, purported stockholder New Jersey Laborers Pension Fund filed a putative class action complaint in the Oakland County Circuit Court in the State of Michigan against the Company, ZF, ZNA, Merger Sub, and the members of the Company's board of directors (the "Company Board"), in an action styled New Jersey Laborers Pension Fund vs. TRW Automotive Holdings Corp., et al., No. 2014-143032-CB. On September 26, 2014, purported stockholder Joseph Bidwell filed a putative class action complaint in the Wayne County Circuit Court in the State of Michigan against the Company, ZF, ZNA, Merger Sub, and the members of the Company Board, in an action styled Bidwell vs. TRW Automotive Holdings Corp., et al., No. 14-012463-CB. On October 3, 2014, purported stockholder Daniel Fumia filed a putative class action complaint in Wayne County Circuit Court in the State of Michigan against the Company, ZF, ZNA, Merger Sub, and the members of the Company Board, in an action styled Daniel Fumia v. James F. Albaugh, Francois J. Castaing, Robert L. Friedman, Michael R. Gambrell, J. Michael Losh, David W. Meline, Jody G. Miller, MSNA, Inc., John C. Plant, Neil P. Simpkins, David S. Taylor, TRW Automotive Holdings Corp., ZF Friedrichshafen AG, ZF North America, Inc., No. 14-012818-CB. On October 6, 2014, purported stockholder Alan Abramson filed a putative class action complaint in the Court of Chancery of the State of Delaware against the Company, the members of the Company Board, ZF and Merger Sub, in an action styled Abramson vs. TRW Automotive Holdings Corp., et al., No. 10203- VCL. On October 15, 2014, purported stockholder Zhao Nie filed a putative class action complaint in the Court of Chancery of the State of Delaware against the Company, ZF, ZNA, Merger Sub and the Company Board in an action styled Nie vs. TRW Automotive Holdings Corp., et al., No. 10236-VCL. On October 21, 2014, purported stockholder Luther Berry and purported stockholder I.U.O.E. Local 132 Health and Welfare Fund each filed a putative class action complaint in the Court of Chancery of the State of Delaware against the Company, the members of the Company Board, ZF and Merger Sub, in actions styled Berry vs. TRW Automotive Holdings Corp., et al., No. 10264-VCL and I.U.O.E. Local 132 Health and Welfare Fund vs. TRW Automotive Holdings Corp., et al., No. 10265-VCL, respectively. The complaints include claims for breach of fiduciary duty against the individual directors, alleging that the directors violated the duties
23
of loyalty, good faith and due care owed to our stockholders. The complaints also include claims for aiding and abetting breaches of fiduciary duty. The plaintiffs seek, among other forms of relief, an order enjoining the transaction, rescinding the Merger Agreement to the extent it has already been implemented, and awarding attorneys' fees and costs.
On November 12, 2014, plaintiffs, the Company and other named defendants entered into a memorandum of understanding (the "MOU") agreeing in principle to settle all pending actions in exchange for the Company's agreement to make certain supplemental disclosures, which were filed on the same date in a supplement to TRW's October 20, 2014 definitive proxy statement. Pursuant to the MOU, the parties intend to settle, subject to court approval, certain claims, while the other pending litigation will be dismissed. We anticipate the litigation will be resolved and will not interfere with or delay the closing, but until court approval is obtained and the cases are dismissed, some uncertainty remains. The settlement contemplated by the MOU is not, and should not be construed as, an admission of wrongdoing or liability by any defendant.
Other Contingencies
The information concerning other legal proceedings involving the Company contained in Note 19 of our consolidated financial statements included in Item 8 of this Report is incorporated herein by reference.
ITEM 4. MINE SAFETY DISCLOSURES
Not applicable.
24
ITEM 5. MARKET FOR REGISTRANT'S COMMON EQUITY, RELATED STOCKHOLDER MATTERS AND ISSUER PURCHASES OF EQUITY SECURITIES
Our common stock is listed on the New York Stock Exchange under the symbol "TRW". As of February 9, 2015, we had 114,972,298 shares of common stock, $0.01 par value, outstanding (114,976,966 shares issued less 4,668 shares held as treasury stock) and 51 holders of record of such common stock. The transfer agent and registrar for our common stock is Computershare Trust Company, N.A.
The tables below show the high and low sales prices for our common stock as reported by the New York Stock Exchange for each of our fiscal quarters in 2014 and 2013.
| |
Price Range of Common Stock | ||||||||||||
|---|---|---|---|---|---|---|---|---|---|---|---|---|---|
| |
Years Ended December 31, | ||||||||||||
| |
2014 | 2013 | |||||||||||
| |
High | Low | High | Low | |||||||||
4th Quarter |
$ | 103.72 | $ | 97.04 | $ | 80.22 | $ | 70.50 | |||||
3rd Quarter |
107.25 | 88.56 | 74.00 | 65.60 | |||||||||
2nd Quarter |
89.56 | 78.02 | 67.12 | 52.48 | |||||||||
1st Quarter |
84.17 | 68.72 | 63.19 | 53.02 | |||||||||
Issuer Repurchases of Equity Securities
The Company has two share repurchase programs in place, consisting of a $2 billion program that extends through December 31, 2016 (the "$2 Billion Program"), and a program that is intended to offset, on an ongoing basis, the dilution created by the Company's stock incentive plan for up to 1.5 million shares in 2014 and each subsequent year (the "Anti-Dilution Program"). The Anti-Dilution program does not have an expiration date.
No share repurchases were made in the fourth quarter of 2014. In the first quarter of 2014, the Company had entered into an accelerated share repurchase ("ASR") agreement with a third-party financial institution to repurchase the Company's common stock. Pursuant to the ASR agreement, the Company made an up-front payment of $400 million, and received an initial delivery of approximately 3.9 million shares of common stock in the first quarter of 2014. Upon settlement in the third quarter of 2014, the Company received approximately 0.7 million additional shares resulting in an overall weighted average price per share of $88.08 under the ASR agreement.
Approximately $1.1 billion in dollar value of shares may yet be purchased under the terms of the $2 Billion Program. During the first quarter of 2014, the Company reached its 2014 board-authorized limit under the Anti-Dilution Program, although additional shares may be purchased under the terms of the Anti-Dilution Program in 2015 and subsequent years. However, pursuant to the terms of its Merger Agreement with ZF, the Company is restricted from repurchasing additional shares of its common stock under its share repurchase programs without ZF's consent.
Further, both repurchase programs may be modified, suspended or terminated by the board of directors at any time without prior notice. Under both programs, the Company may acquire shares from time to time through open market purchases, block trades, privately negotiated transactions including accelerated share repurchase transactions, other derivative transactions, or otherwise, at such times and in such amounts as Company management deems appropriate, given prevailing financial and market conditions. Repurchases may also be made under trading plans that may be adopted from time to time in accordance with Rule 10b5-1 of the Securities Exchange Act, which would permit the
25
Company to repurchase shares when it might otherwise be precluded from doing so under insider trading laws. However, the Company is not obligated to repurchase any shares under either program.
In addition, the independent trustee of our 401(k) plans purchases shares in the open market to fund (i) investments by employees in our common stock, one of the investment options available under such plans, and (ii) matching contributions in Company stock we provide under certain of such plans. In addition, our stock incentive plan permits payment of an option exercise price by means of cashless exercise through a broker and permits the satisfaction of the minimum statutory tax obligations upon exercise of options through stock withholding. Further, while our stock incentive plan also permits the satisfaction of the minimum statutory tax obligations upon the vesting of restricted stock units and the exercise of stock-settled stock appreciation rights through stock withholding, the shares withheld for such purpose are issued directly to us and are then immediately retired and returned to our authorized but unissued reserve. The Company does not believe that the foregoing purchases or transactions are issuer repurchases for the purposes of Item 5 of this Report on Form 10-K.
Our amended and restated credit agreement contains covenants that could restrict, under certain circumstances, our ability to repurchase shares of our common stock. Certain of the indentures governing our outstanding notes also limit our ability to repurchase shares.
Dividend Policy
We do not currently pay any cash dividends on our common stock, and instead intend to retain earnings for capital structure improvements, future operations, expansion and debt maturities. The amounts available to us to pay cash dividends are restricted by our debt agreements. Our amended and restated credit agreement contains covenants that could restrict, under certain circumstances, our ability to pay dividends on our common stock. Certain of the indentures governing our outstanding notes also limit our ability to pay dividends. Further, pursuant to the terms of the Merger Agreement with ZF, we are restricted from paying dividends without ZF's consent. Any decision to declare and pay dividends in the future will be made at the discretion of our board of directors and will depend on, among other things, our results of operations, cash requirements, financial condition, contractual restrictions and other factors that our board of directors may deem relevant.
Equity Compensation Plan Information
The following table provides information about our equity compensation plans as of December 31, 2014.
Plan Category
|
Number of Securities to be Issued Upon Exercise of Outstanding Options, Warrants and Rights |
Weighted-Average Exercise Price of Outstanding Options, Warrants and Rights |
Number of Securities Remaining Available for Future Issuance Under Equity Compensation Plans(1) |
|||||||
|---|---|---|---|---|---|---|---|---|---|---|
Equity compensation plans approved by security holders(2) |
3,294,568 | $ | 60.73 | (3) | 3,379,736 | |||||
Equity compensation plans not approved by security holders |
N/A | N/A | N/A | |||||||
| | | | | | | | | | | |
Total |
3,294,568 | $ | 60.73 | 3,379,736 | ||||||
| | | | | | | | | | | |
| | | | | | | | | | | |
| | | | | | | | | | | |
- (1)
- All of the securities remaining available for future issuance are available under our 2012 plan. The number shown excludes securities outstanding under such plan which are included in the first column, "Number of Securities to be Issued Upon Exercise of Outstanding Options, Warrants and Rights."
26
- (2)
- The
2003 plan was approved by our stockholders prior to our initial public offering; our public stockholders approved an amendment to that plan in 2009 that
increased the number of shares subject to the plan. Our public stockholders approved our 2012 plan in May 2012.
- (3)
- Represents the weighted average exercise price of 214,663 outstanding stock options and 2,320,699 outstanding stock-settled stock appreciation rights as of December 31, 2014. The remaining securities to be issued upon exercise of outstanding options, warrants and rights as of December 31, 2014 are comprised of 676,131 restricted stock units, 12,650 phantom stock units and performance stock units under which up to 70,425 shares may be issued (based on the maximum performance thereunder), which have no exercise price and have been excluded from the calculation of the weighted average exercise price above.
Stock Performance Graph
The graph below provides an indicator of our cumulative total stockholder return compared with Standard & Poor's 500 Stock Index and the Standard & Poor's Supercomposite Auto Parts & Equipment Index based on currently available data. The graph assumes an initial investment of $100 on December 31, 2009 and reflects the cumulative total return on that investment, including the reinvestment of all dividends where applicable, through December 31, 2014. Each of these December dates represents the last trading date of the applicable year.
Comparison of 5 Year Cumulative Total Return
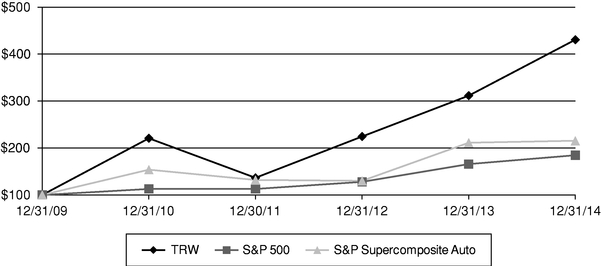
| |
Ticker | 12/31/09 | 12/31/10 | 12/30/11 | 12/31/12 | 12/31/13 | 12/31/14 | ||||||||||||||
|---|---|---|---|---|---|---|---|---|---|---|---|---|---|---|---|---|---|---|---|---|---|
TRW Automotive |
TRW | $ | 100.00 | $ | 220.69 | $ | 136.52 | $ | 224.50 | $ | 311.52 | $ | 430.70 | ||||||||
S&P 500 |
SPX | $ | 100.00 | $ | 112.78 | $ | 112.78 | $ | 127.90 | $ | 165.76 | $ | 184.64 | ||||||||
S&P Supercomposite Auto Parts and Equipment Index |
S15AUTP | $ | 100.00 | $ | 153.86 | $ | 131.89 | $ | 130.10 | $ | 211.27 | $ | 215.51 | ||||||||
27
ITEM 6. SELECTED FINANCIAL DATA
The following tables should be read in conjunction with "Item 7—Management's Discussion and Analysis of Financial Condition and Results of Operations" and our consolidated financial statements included under Item 8 below.
| |
Years Ended December 31, | |||||||||||||||
|---|---|---|---|---|---|---|---|---|---|---|---|---|---|---|---|---|
| |
2014 | 2013 | 2012 | 2011 | 2010 | |||||||||||
| |
(In millions, except per share amounts) |
|||||||||||||||
Statements of Operations Data: |
||||||||||||||||
Sales |
$ | 17,539 | $ | 17,435 | $ | 16,444 | $ | 16,244 | $ | 14,383 | ||||||
Net earnings |
334 | 1,007 | 1,041 | 1,195 | 875 | |||||||||||
Net earnings attributable to TRW |
293 | 970 | 1,008 | 1,157 | 834 | |||||||||||
Earnings Per Share: |
||||||||||||||||
Basic earnings per share: |
||||||||||||||||
Earnings per share |
$ | 2.62 | $ | 8.25 | $ | 8.24 | $ | 9.37 | $ | 6.96 | ||||||
Weighted average shares |
111.7 | 117.6 | 122.4 | 123.5 | 119.8 | |||||||||||
Diluted earnings per share: |
||||||||||||||||
Earnings per share |
$ | 2.54 | $ | 7.85 | $ | 7.83 | $ | 8.82 | $ | 6.49 | ||||||
Weighted average shares |
118.0 | 124.6 | 129.7 | 133.0 | 131.3 | |||||||||||
| |
As of December 31, | |||||||||||||||
|---|---|---|---|---|---|---|---|---|---|---|---|---|---|---|---|---|
| |
2014 | 2013 | 2012 | 2011 | 2010 | |||||||||||
| |
(Dollars in millions) |
|||||||||||||||
Balance Sheet Data: |
||||||||||||||||
Total assets |
$ | 11,294 | $ | 12,252 | $ | 10,857 | $ | 10,262 | $ | 9,288 | ||||||
Total liabilities |
7,256 | 7,856 | 7,088 | 7,123 | 7,050 | |||||||||||
Total debt (including short-term debt and current portion of long-term debt) |
1,578 | 2,114 | 1,462 | 1,532 | 1,846 | |||||||||||
28
ITEM 7. MANAGEMENT'S DISCUSSION AND ANALYSIS OF FINANCIAL CONDITION AND RESULTS OF OPERATIONS
EXECUTIVE OVERVIEW
Our Business
We are among the world's largest and most diversified suppliers of automotive systems, modules and components to global automotive original equipment manufacturers, or OEMs, and related aftermarkets. Our operations primarily encompass the design, manufacture and sale of active and passive safety related products and systems, which often includes the integration of electronics components and systems. We operate our business along four segments: Chassis Systems, Occupant Safety Systems, Electronics and Automotive Components.
We are primarily a "Tier 1" supplier, with approximately 82% of our end-customer sales in 2014 made to major OEMs. Of our 2014 sales, approximately 42% were in Europe, 33% were in North America, 21% were in Asia, and 4% were in the rest of the world.
Merger Agreement
On September 15, 2014, we entered into a Merger Agreement with ZF, Merger Sub and ZNA, pursuant to which Merger Sub will be merged with and into the Company (the "ZF Merger") with the Company surviving the ZF Merger as an indirect wholly owned subsidiary of ZF. The transaction is expected to close in the first half of 2015. See "Merger Agreement" in Part I, Item 1, of this Report and Note 2 to our consolidated financial statements included in Item 8 of this Report for further information.
Engine Valve Divestiture
On September 10, 2014, the Company announced it entered into a definitive agreement to divest its engine valve business. On February 6, 2015, we closed the sale of our wholly-owned engine valve subsidiaries which represented the material portion of the business to be divested. The closing did not include the transfer of several of our joint ventures involved in the business. See "Engine Valve Divestiture" in Part I, Item 1, of this Report and Note 4 to our consolidated financial statements included in Item 8 of this Report for further information.
Financial Results
For the year ended December 31, 2014:
- •
- Our net sales were $17.5 billion, which represents an increase of $104 million from the prior year. The increase in
sales was driven primarily by higher demand for our active and passive safety products and growth in vehicle production in our major markets, which more than offset the impact of lower sales of
$801 million related to exiting certain of our brake component and modules businesses in North America and the negative effects of foreign currency exchange. During 2014, the positive effects
of foreign currency exchange during the first nine months were more than offset by the strengthening of the U.S. dollar during the fourth quarter.
- •
- Operating income was $501 million compared to $1,227 million from the prior year. The decrease in operating income of $726 million resulted primarily from significant pension settlement actions in 2014 within the U.K., U.S., and Canadian pension plans which totaled $790 million, as well as merger and transaction fees, an increase in restructuring costs, and planned cost increases to support future growth. These items were partially offset by the positive impact of the higher level of sales.
29
- •
- Net earnings attributable to TRW were $293 million compared to $970 million from the prior year. This decrease of
$677 million was primarily the result of lower operating income, partially offset by a decrease in interest expense, lower income tax expense, and lower losses recognized on the retirement of
debt.
- •
- We generated positive operating cash flow of $954 million compared to $1,126 million from the prior year, while capital
expenditures were $694 million compared to $735 million from the prior year. The decrease in positive operating cash flow of $172 million resulted primarily from higher pension
contributions, increased working capital requirements, higher outflows related to withholding taxes on certain equity awards, and higher cash paid for taxes, partially offset by higher inflows for
value-added taxes and higher cash earnings.
- •
- Our cash on hand at year end was $1,031 million, a decrease of $698 million from the prior year end. During the year, we utilized $400 million of cash on hand to repurchase approximately 4.6 million shares of common stock under our repurchase programs. In addition, upon maturity of our 6.375% Senior Notes and 7.00% Senior Notes, we repaid the outstanding principal amount totaling $469 million.
Recent Trends and Market Conditions
Our business and operating results are directly affected by the relative strength of the global automotive industry, which tends to be driven by macroeconomic factors such as consumer confidence, fluctuating commodity and fuel prices and regulatory/governmental initiatives. In addition to the items described in "Business" in Part I, Item 1 of this Report, the primary trends and market conditions impacting our business in 2014 included:
General Economic Conditions:
The global automotive industry remains susceptible to uncertain economic conditions that could adversely impact consumer demand for vehicles. While the U.S. economy has continued to recover after a slow start earlier in the year, global economic sentiment remains cautious given increased concern that the fragile recovery in Europe is weakening, and continued volatility within the emerging markets, including the slowing pace of economic growth in China.
During 2014, while vehicle production levels in our major markets increased, expectations were tempered by geopolitical tension and concerns over economic growth. In North America, with the economy showing signs of sustained growth, consumer vehicle demand was at the highest level since before the U.S. recession. In Europe, stimulus measures intended to lessen the risk of deflation and spur economic growth are continuing. In China, the automotive industry continues to expand with automotive suppliers benefiting from increased production levels.
In light of increased attention by U.S. regulators, the industry's sensitivity to product performance has been heightened as evidenced by a higher level of product recalls during 2014. Despite this activity, consumer confidence, demand and production levels have remained strong.
Production Levels:
Vehicle production levels in North America, Europe and China during 2014 continued on a positive trend.
In 2014, approximately 42% of our sales originated in Europe. Production levels in this region were 3% higher in 2014 compared to 2013, primarily due to the release of pent-up demand for vehicles compared to the prior year. We are cautiously optimistic that consumer demand levels will remain steady for 2015, however, we will continue to monitor the geopolitical concerns, primarily
30
in Russia, and more general concerns over potential deflation that could impact the fragile economic environment in the region.
In 2014, approximately 33% of our sales originated in North America. Production levels in this region were 5% higher in 2014 compared to 2013, primarily due to improved consumer demand that was buoyed by the recovering economy and lower gas prices. The Detroit Three (defined as FCA US LLC, Ford Motor Company, and General Motors Company, combined) production levels were consistent with overall production levels within North America during the first half of 2014; however for the remainder of the year, the Detroit Three lagged behind the overall growth in production levels within North America. In general, our financial results are more closely correlated to the production by the Detroit Three given our higher sales content to these manufacturers compared to other manufacturers.
In 2014, approximately 25% of our sales originated in regions outside of Europe and North America (primarily China, which comprised approximately 18% of total sales). Despite a general moderation of economic growth compared to original expectations, increased consumer demand in China drove an increase of 9% in production levels during 2014 compared to 2013. In Brazil, production levels were down 14% due to economic volatility in the country. We will continue to monitor this market, which represented 4% of our 2014 sales, given the challenging conditions experienced.
Foreign Currencies:
Given the global nature of our operations, we are subject to fluctuations in foreign exchanges rates. During 2014, we experienced a nominal impact from foreign currency effects on our reported earnings in U.S. dollars compared to 2013. However, we will monitor the impacts of currency exchange movements given recent strengthening of the U.S. dollar against many international currencies.
Changes to Our Debt and Capital Structure
During 2014, we continued to focus on improving the strength, flexibility, and cost efficiency of our capital structure, resulting in outstanding debt of $1.6 billion and a cash balance of $1.0 billion at December 31, 2014. On March 15, 2014, our 6.375% Senior Notes and 7.00% Senior Notes matured and we repaid the outstanding principal amount totaling $469 million. During 2014, note holders exchanged $116.3 million in principal amount of our 3.5% Exchangeable Senior Notes for 3.9 million shares of common stock.
As market conditions warrant, we may, from time to time, repurchase debt, including exchangeable debt securities, securities issued by the Company or its subsidiaries, in privately negotiated or open market transactions, by tender offer, exchange offer, or by other means, or we may optionally redeem such debt securities.
In connection with our publicly announced share repurchase programs, during 2014, we utilized $400 million of cash on hand and in the first quarter of 2014 initially received approximately 3.9 million shares of common stock under an accelerated share repurchase ("ASR") program. Upon settlement in the third quarter of 2014, the Company received approximately 0.7 million additional shares. See "Issuer Repurchases of Equity Securities" in Part II, Item 5, of this Report for further information regarding the share repurchase programs.
See "LIQUIDITY AND CAPITAL RESOURCES" below and Note 13 to our consolidated financial statements included in Item 8 of this Report for further information.
31
CRITICAL ACCOUNTING ESTIMATES
Our significant accounting policies are described in Note 3 to our consolidated financial statements included under Item 8 of this Report. Certain of our accounting policies require the application of significant judgment by management in selecting the appropriate assumptions for calculating financial estimates. These policies require the most difficult, subjective or complex judgments that management makes in the preparation of the financial statements and accompanying notes. We consider an accounting estimate to be critical if (i) it requires us to make assumptions about matters that were uncertain at the time we were making the estimate, or (ii) changes in the estimate or different estimates that we could have selected could have had a material impact on our financial condition or results of operations. Such critical accounting estimates are discussed below. For these, materially different amounts could be reported under varied conditions and assumptions. Other items in our consolidated financial statements require estimation, however, in our judgment, they are not as critical as those discussed below.
Goodwill and Other Indefinite-Lived Intangible Assets. Our goodwill and trademark indefinite-lived intangible assets are tested for impairment as of October 31 of each year for all of our reporting units, and more frequently if events occur or circumstances change that would warrant such a review. For our goodwill analysis, fair values are based on the cash flows projected in the reporting units' strategic plans and long-range planning forecasts, discounted at a risk-adjusted rate of return. Our long-range planning forecasts are based on our assessment of revenue growth rates generally based on industry specific data, external vehicle build assumptions published by widely used external sources, and customer market share data based on known and targeted awards over a five-year period. The projected profit margin assumptions included in the plans are based on the current cost structure, anticipated price givebacks provided to our customers and cost reductions/increases. If different assumptions were used in these plans, the related cash flows used in measuring fair value could be different and impairment of goodwill might be required to be recorded.
For our trademark indefinite-lived intangible assets, fair value is determined utilizing the relief from royalty method, which is based on projected cash flows, discounted at a risk-adjusted rate of return.
As of December 31, 2014, goodwill and indefinite-lived intangible assets were approximately $2,013 million, or 18% of our total assets. See Note 8 to our consolidated financial statements included in Item 8 of this Report for further information on our annual analysis of goodwill and indefinite-lived intangible assets.
Impairment of Long-Lived Assets. We evaluate long-lived assets for impairment when events and circumstances indicate that the assets may be impaired and the projected undiscounted cash flows to be generated by those assets are less than their carrying value. Fair value is determined using projected discounted cash flows or appraisals. See Note 14 to our consolidated financial statements included in Item 8 of this Report for further information on our evaluation of long-lived assets for impairment.
Product Recalls. We are at risk for product recall costs. Recall costs are costs incurred when a customer or we decide to recall a product through a formal campaign, soliciting the return of specific products due to a known or suspected safety concern. In addition, NHTSA has the authority, under certain circumstances, to require recalls to remedy safety concerns. Product recall costs typically include the cost of the product being replaced, customer cost of the recall and labor to remove and replace the defective part.
Recall costs are recorded based on management estimates developed utilizing actuarially established loss projections based on historical claims data. Based on this actuarial estimation methodology, we accrue for expected but unannounced recalls when revenues are recognized upon
32
shipment of product. In addition, as recalls are announced, we review the actuarial estimation methodology and make appropriate adjustments to the accrual, if necessary.
Valuation Allowances on Deferred Income Tax Assets. We review the likelihood that we will realize the benefit of our deferred tax assets and therefore the need for valuation allowances on a quarterly basis, or more frequently if events indicate that a review is required. In determining the requirement for a valuation allowance, the historical and projected financial results of the legal entity or consolidated group recording the net deferred tax asset is considered, along with all other available positive and negative evidence. The factors considered in our determination of the probability of the realization of the deferred tax assets include, but are not limited to: recent historical financial results, historical taxable income, projected future taxable income, the expected timing of the reversals of existing temporary differences and tax planning strategies. If, based upon the weight of available evidence, it is more likely than not the deferred tax assets will not be realized, a valuation allowance is recorded.
Concluding that a valuation allowance is not required is difficult when there is significant negative evidence which is objective and verifiable, such as cumulative losses in recent years. We utilize a rolling twelve quarters of pre-tax income or loss adjusted for significant permanent book to tax differences as a measure of our cumulative results in recent years. In certain jurisdictions, our analysis indicates that we have cumulative three year historical losses on this basis. This is considered significant negative evidence which is objective and verifiable and therefore, difficult to overcome. However, the three year loss position is not solely determinative and accordingly, we consider all other available positive and negative evidence in our analysis. Based upon this analysis, we believe it is more likely than not that the net deferred tax asset in certain foreign jurisdictions may not be realized in the future. Accordingly, we maintain a valuation allowance related to those net deferred tax assets.
Pensions. We account for our defined benefit pension plans using amounts determined on an actuarial basis. This determination involves the selection of various assumptions, including expected rates of return on plan assets and discount rates.
A key assumption in determining our net pension expense is the expected long-term rate of return on plan assets. The expected return on plan assets is determined by applying the expected long-term rate of return on assets to a calculated market-related value of plan assets, which recognizes changes in the fair value of plan assets in a systematic manner over five years. Asset gains and losses will be amortized over five years in determining the market-related value of assets used to calculate the expected return component of pension income. We review our long-term rate of return assumptions annually through comparison of our historical actual rates of return with our expectations, and consultation with our actuaries and investment advisors regarding their expectations for future returns. While we believe our assumptions of future returns are reasonable and appropriate, significant differences in our actual experience or significant changes in our assumptions may materially affect our pension obligations and our future pension expense. The weighted average expected long-term rate of return on assets used to determine net periodic benefit cost was 6.38% for 2014 compared to 6.44% for 2013 and 6.48% for 2012.
Another key assumption in determining our net pension expense is the assumed discount rate to be used to discount plan liabilities. The discount rate reflects the current rate at which the pension obligations could be effectively settled. In estimating this rate, we look to rates of return on high quality, fixed-income investments that receive one of the highest ratings given by a recognized ratings agency, and that have cash flows similar to those of the underlying benefit obligation. The weighted average discount rate used to calculate the benefit obligations as of December 31, 2014 was 3.39% compared to 4.51% as of December 31, 2013. The weighted average discount rate used to determine net periodic benefit cost for 2014 was 4.51% compared to 4.16% for 2013 and 4.76% for 2012.
33
Based on our assumptions as of December 31, 2014, the measurement date, a change in these assumptions, holding all other assumptions constant, would have the following effect on our pension costs and obligations on an annual basis:
| |
Increase | Decrease | |||||||||||||||||
|---|---|---|---|---|---|---|---|---|---|---|---|---|---|---|---|---|---|---|---|
| |
U.S. | U.K. | All Other |
U.S. | U.K. | All Other |
|||||||||||||
| |
(Dollars in millions) |
||||||||||||||||||
Impact on Net Periodic Benefit Cost: |
|||||||||||||||||||
.25% change in discount rate |
$ | (1 | ) | $ | (2 | ) | $ | (3 | ) | $ | 1 | $ | 1 | $ | 3 | ||||
.25% change in expected long-term rate of return |
— | (5 | ) | — | — | 5 | — | ||||||||||||
Impact on Obligations: |
|||||||||||||||||||
.25% change in discount rate |
$ | (13 | ) | $ | (67 | ) | $ | (35 | ) | $ | 13 | $ | 70 | $ | 37 | ||||
The policies we have used (most notably the use of a calculated value of plan assets for pensions as described above and the use of the minimum corridor approach to amortize gains and losses) generally reduce the volatility of pension expense that would otherwise result from changes in the value of the pension plan assets and pension liability discount rates. A substantial portion of our pension benefits relate to our plans in the United States and the United Kingdom.
As a result of our significant pension abatement actions in 2014, which included pension obligation reductions totaling approximately $5 billion and settlement charges of $790 million, our 2015 pension income is estimated to be approximately $56 million in the U.K., while our pension expense is estimated to be approximately $6 million in the U.S. and $61 million in the rest of the world (based on December 31, 2014 exchange rates). During 2015, our expected funding is £5 million, or $7 million, for the U.K. pension plan, representing a one-time contribution in respect of certain 2014 liability settlement actions, and $29 million for pension plans in the rest of the world. However, we may, at our discretion, make additional contributions. We do not expect to make any funding contributions to the U.S. plans in 2015.
As of December 31, 2014, the U.K. plan is in an overfunded position on both a U.S. GAAP and U.K. statutory basis. The most recent triennial funding valuation of the U.K. plan, dated March 31, 2012, was filed in February of 2013. This funding valuation, calculated on a U.K. statutory basis, reflected a deficit of £130 million (or $207 million at that time). We agreed with the U.K. plan trustee to make £30 million in annual contributions, which were to continue until the earlier of 2023 or until the Plan reached a funding level of 101% for a sustained period on a U.K. statutory funding basis. The sustained funding level was deemed to have occurred as of February 28, 2014; however, we continued to make discretionary contributions through November 2014 totaling £25 million. We do not intend to make further discretionary contributions.
Other Postretirement Benefits. We account for our postemployment benefits other than pensions ("OPEB") using amounts determined on an actuarial basis. This determination involves the selection of various assumptions, including a discount rate and health care cost trend rates used to value benefit obligations. The discount rate reflects the current rate at which the OPEB liabilities could be effectively settled at the end of the year. In estimating this rate, we look to rates of return on high quality, fixed-income investments that receive one of the highest ratings given by a recognized ratings agency and that have cash flows similar to those of the underlying benefit obligation. We develop our estimate of the health care cost trend rates used to value the benefit obligation through review of our recent health care cost trend experience and through discussions with our actuary regarding the experience of similar companies. Changes in the assumed discount rate or health care cost trend rate can have a significant impact on our actuarially determined liability and related OPEB expense.
34
The following are the significant assumptions used in the measurement of the accumulated projected benefit obligation ("APBO") as of the measurement date for each year:
| |
2014 | 2013 | |||||||||||
|---|---|---|---|---|---|---|---|---|---|---|---|---|---|
| |
U.S. | Rest of World |
U.S. | Rest of World |
|||||||||
Discount rate |
4.00 | % | 3.75 | % | 5.00 | % | 4.75 | % | |||||
Initial health care cost trend rate at end of year |
7.00 | % | 4.50 | % | 6.90 | % | 4.00 | % | |||||
Ultimate health care cost trend rate |
4.50 | % | 5.00 | % | 5.00 | % | 5.00 | % | |||||
Year in which ultimate rate is reached |
2022 | 2017 | 2018 | 2017 | |||||||||
Based on our assumptions as of December 31, 2014, the measurement date, a change in these assumptions, holding all other assumptions constant, would have the following effect on our OPEB expense and obligation on an annual basis:
| |
Increase | Decrease | |||||||||||
|---|---|---|---|---|---|---|---|---|---|---|---|---|---|
| |
U.S. | Rest of World |
U.S. | Rest of World |
|||||||||
| |
(Dollars in millions) |
||||||||||||
Impact on Net Postretirement Benefit Cost: |
|||||||||||||
1% change in assumed health care cost trend rate |
$ | 1 | $ | — | $ | (1 | ) | $ | — | ||||
Impact on Obligation: |
|||||||||||||
0.25% change in discount rate |
$ | (6 | ) | $ | (2 | ) | $ | 6 | $ | 3 | |||
1% change in assumed health care cost trend rate |
21 | 7 | (18 | ) | (7 | ) | |||||||
Our 2015 OPEB expense is estimated to be de minimis (based on December 31, 2014 exchange rates), which includes the effects of the adoption of certain amendments which modify future benefits for participants. We fund our OPEB obligation on a pay-as-you-go basis. In 2015, we expect to contribute approximately $32 million to our OPEB plans.
35
RESULTS OF OPERATIONS
The following consolidated statements of earnings compare the results of earnings for the periods presented:
Total Company Results of Operations
Consolidated Statements of Earnings
| |
|
|
|
Variance | ||||||||||||
|---|---|---|---|---|---|---|---|---|---|---|---|---|---|---|---|---|
| |
Years Ended December 31, | |||||||||||||||
| |
2014 vs. 2013 |
2013 vs. 2012 |
||||||||||||||
| |
2014 | 2013 | 2012 | |||||||||||||
| |
(Dollars in millions) |
|||||||||||||||
Sales |
$ | 17,539 | $ | 17,435 | $ | 16,444 | $ | 104 | $ | 991 | ||||||
Cost of sales |
15,473 | 15,505 | 14,655 | (32 | ) | 850 | ||||||||||
| | | | | | | | | | | | | | | | | |
Gross profit |
2,066 | 1,930 | 1,789 | 136 | 141 | |||||||||||
Administrative and selling expenses |
669 | 607 | 594 | 62 | 13 | |||||||||||
Pension and postretirement benefit settlement and curtailment expenses |
790 | 31 | 52 | 759 | (21 | ) | ||||||||||
Restructuring charges and asset impairments |
84 | 66 | 95 | 18 | (29 | ) | ||||||||||
Transaction costs |
20 | — | — | 20 | — | |||||||||||
Other expense (income)—net |
2 | (1 | ) | (37 | ) | 3 | 36 | |||||||||
| | | | | | | | | | | | | | | | | |
Operating income |
501 | 1,227 | 1,085 | (726 | ) | 142 | ||||||||||
Interest expense—net |
109 | 132 | 111 | (23 | ) | 21 | ||||||||||
Loss on retirement of debt—net |
7 | 20 | 6 | (13 | ) | 14 | ||||||||||
Equity in earnings of affiliates, net of tax |
(45 | ) | (46 | ) | (40 | ) | 1 | (6 | ) | |||||||
| | | | | | | | | | | | | | | | | |
Earnings before income taxes |
430 | 1,121 | 1,008 | (691 | ) | 113 | ||||||||||
Income tax expense (benefit) |
96 | 114 | (33 | ) | (18 | ) | 147 | |||||||||
| | | | | | | | | | | | | | | | | |
Net earnings |
334 | 1,007 | 1,041 | (673 | ) | (34 | ) | |||||||||
Less: Net earnings attributable to noncontrolling interest, net of tax |
41 | 37 | 33 | 4 | 4 | |||||||||||
| | | | | | | | | | | | | | | | | |
Net earnings attributable to TRW |
$ | 293 | $ | 970 | $ | 1,008 | $ | (677 | ) | $ | (38 | ) | ||||
| | | | | | | | | | | | | | | | | |
| | | | | | | | | | | | | | | | | |
| | | | | | | | | | | | | | | | | |
Sales
Changes in both vehicle production levels and our sales, by major geographic region, are presented below:
| |
2014 vs. 2013 Variance |
2013 vs. 2012 Variance |
|||||||||||
|---|---|---|---|---|---|---|---|---|---|---|---|---|---|
| |
Vehicle Production(a) |
TRW Sales |
Vehicle Production(a) |
TRW Sales |
|||||||||
North America |
5 | % | (7 | )% | 5 | % | 5 | % | |||||
Europe |
3 | % | 4 | % | — | % | 2 | % | |||||
Rest of World |
3 | % | 6 | % | 5 | % | 17 | % | |||||
- (a)
- Source: Primarily IHS Automotive light vehicle production forecast.
36
Cost of Sales
Changes in the major components within our cost of sales are presented below:
| |
(Dollars in millions) |
|||
|---|---|---|---|---|
Cost of sales, year ended December 31, 2012 |
$ | 14,655 | ||
Material |
602 | |||
Labor and other |
230 | |||
Depreciation |
18 | |||
| | | | | |
Cost of sales, year ended December 31, 2013 |
15,505 | |||
Material |
(97 | ) | ||
Labor and other |
35 | |||
Depreciation |
30 | |||
| | | | | |
Cost of sales, year ended December 31, 2014 |
$ | 15,473 | ||
| | | | | |
| | | | | |
| | | | | |
Comparison of the Year Ended December 31, 2014 to the Year Ended December 31, 2013
Sales for the year ended December 31, 2014 increased by $104 million, or 1%, compared to the year ended December 31, 2013. The increase in sales was driven by higher production volume, primarily in North America and China, and increased demand for our active and passive safety products, together totaling $960 million, partially offset by lower sales of $801 million as a result of exiting certain of our brake component and modules businesses in North America during the first quarter of 2014 and the unfavorable impact of foreign currency exchange of $55 million.
TRW sales in North America for the year ended December 31, 2014 experienced a 7% decrease primarily due to exiting certain of our brake component and modules businesses in North America during the first quarter of 2014. Excluding the impact of exiting these businesses, sales increased 7% in North America, which was more than the vehicle production increase in the region due to a favorable concentration of customers and increased demand for our safety products. In Europe, excluding the impact of foreign currency exchange, sales increased 3%, which was consistent with the vehicle production increase in the region. In the Rest of World, excluding the impact of foreign currency exchange, sales increased 8%, which was more than the industry production increase of 3%, due to the mix of platforms and products sold.
Cost of sales decreased by $32 million for the year ended December 31, 2014 compared to the year ended December 31, 2013. The decrease was driven primarily by lower cost of sales of $709 million as a result of exiting certain of our brake component and modules businesses in North America as well as the favorable impact of foreign currency exchange of $48 million, substantially offset by additional costs associated with increased volume (net of cost reductions) of $725 million.
Gross profit, as a percentage of sales, for the year ended December 31, 2014 was 11.8% compared to 11.1% for the year ended December 31, 2013. This improvement was driven primarily by additional cost reductions and the favorable profit impact of additional volume, partially offset by a higher proportion of lower-margin business.
Gross profit increased by $136 million compared to the year ended December 31, 2013. The increase was primarily driven by the favorable impact of higher volume (net of a higher proportion of lower margin business) of $230 million and increased cost reductions in excess of non-commodity inflation, salary and other costs of $5 million, partially offset by a reduction in profit of $92 million as a result of exiting certain of our brake component and modules businesses in North America and the unfavorable impact of foreign currency exchange of $7 million.
37
Administrative and selling expenses, as a percentage of sales, were 3.8% for the year ended December 31, 2014 compared to 3.5% for the year ended December 31, 2013. The increase of $62 million was driven by higher salary and other compensation costs of $45 million and increased non-commodity inflation and other expenses of $19 million, partially offset by the favorable impact of foreign currency exchange of $2 million.
Pension and postretirement benefit settlement and curtailment expenses increased by $759 million for the year ended December 31, 2014 compared to the year ended December 31, 2013. The increase was a result of our significant pension abatement actions in 2014 within the U.K., U.S., and Canadian pension plans that reduced our gross pension obligations by approximately $5 billion.
Restructuring charges and asset impairments increased by $18 million for the year ended December 31, 2014 compared to the year ended December 31, 2013. This was driven by overall higher severance, curtailment and other charges of $8 million, primarily related to our overall restructuring efforts in Europe, and an increase in asset impairments of $10 million.
Transaction costs were $20 million for the year ended December 31, 2014. These costs primarily consisted of financial advisory and legal fees related to the ZF merger and the engine valve divestiture.
Other expense (income)—net increased by $3 million for the year ended December 31, 2014 compared to the year ended December 31, 2013. This change was due to an increase in other expenses of $15 million related to other legal matters, partially offset by a favorable impact in foreign currency exchange of $9 million, and an increase in royalty and grant income of $3 million.
Interest expense—net decreased by $23 million for the year ended December 31, 2014 compared to the year ended December 31, 2013, primarily as the result of both lower average debt levels and lower average borrowing rates of our senior notes, both reflecting the maturity in the first quarter 2014 of our 6.375% and 7.25% Senior Notes, partially offset by increased other debt levels.
Loss on retirement of debt was $7 million for the year ended December 31, 2014 compared to $20 million for the year ended December 31, 2013. In 2014 and 2013, Exchangeable Senior Note holders exchanged approximately $116 million and $26 million, respectively, in principal amount of notes for approximately 3,940,000 and 880,000 shares, respectively, of Company stock. In conjunction with the exchanges, we recorded a loss on retirement of debt of $7 million and $3 million, respectively, including the write-off of a portion of related debt issuance costs and debt discount.
During 2013, we exercised our option to redeem $205 million in principal amount outstanding of our 8.875% notes due in December 2017 at a price of 104.438% of par and recorded a loss on retirement of debt of $12 million, which included the redemption premium and write-off of related debt issue costs and discounts. In addition, during 2013, we repurchased portions of our senior unsecured notes due in 2014 and 2017 totaling $91 million in principal amount and recorded a loss on retirement of debt of $5 million, which included the write-off of a portion of related debt issue costs.
Income tax expense for the year ended December 31, 2014 was $96 million on pre-tax earnings of $430 million compared to income tax expense of $114 million on pre-tax earnings of $1,121 million for the year ended December 31, 2013. Income tax expense for the period ended December 31, 2014 includes a net tax benefit of approximately $25 million related to favorable tax rulings received in a foreign jurisdiction and our ability to release certain valuation allowances and a net tax expense of $32 million resulting from increases in our global valuation allowance. Income tax expense for the year ended December 31, 2013 includes a tax benefit of approximately $153 million related to our ability to utilize historical foreign tax credits in future periods and the corresponding recognition of a deferred tax asset. Income tax expense for the period ended December 31, 2013 also includes a tax benefit of approximately $43 million relating to the enactment of various tax legislation during the year and a net tax expense of $17 million resulting from net losses in certain foreign jurisdictions with no corresponding tax benefit due to increases in our valuation allowances. The income tax rate for both
38
periods varies from the United States statutory income tax rate due primarily to the items noted above as well as favorable foreign tax rates, holidays, and credits.
Comparison of the Year Ended December 31, 2013 to the Year Ended December 31, 2012
Sales for the year ended December 31, 2013 increased by $991 million, or 6%, compared to the year ended December 31, 2012. The increase in sales was driven by higher production volume primarily in North America and Asia Pacific and increased global module sales, together totaling $843 million, and the favorable impact of foreign currency exchange of $176 million, partially offset by lower sales of $28 million related to a business divested in the third quarter of 2012.
The change in TRW sales in North America for the year ended December 31, 2013 was consistent with the vehicle production changes in the region. In Europe, sales were positively impacted by foreign currency exchange, primarily due to the performance of the euro against the U.S. dollar. Excluding the impact of foreign currency exchange, sales decreased 1% in Europe, which was only slightly less than the flat vehicle production level. In the Rest of World, the increase in our sales outpaced the industry production increase due to a favorable concentration of customers, particularly in China, and increased demand for our safety products.
Cost of sales increased by $850 million, or 6%, for the year ended December 31, 2013 compared to the year ended December 31, 2012. The increase was driven primarily by additional costs associated with higher volume and inflation, together totaling $680 million, and the unfavorable impact of foreign currency exchange of $170 million.
Gross profit, as a percentage of sales, for the year ended December 31, 2013 was 11.1% compared to 10.9% for the year ended December 31, 2012. This improvement was driven primarily by additional cost reductions and the favorable profit impact of additional volume, partially offset by a higher proportion of lower-margin business.
Gross profit increased by $141 million compared to the year ended December 31, 2012. The increase in gross profit was driven primarily by the favorable impact of higher sales (net of a higher proportion of lower margin business) of $191 million, the favorable impact of foreign currency exchange of $6 million, and the elimination of a loss from a business divested in the third quarter of 2012 of $5 million. Partially offsetting these favorable items was the unfavorable impact of non-commodity inflation, salary and other items of $61 million.
Administrative and selling expenses, as a percentage of sales, were 3.5% for the year ended December 31, 2013 compared to 3.6% for the year ended December 31, 2012. The increase of $13 million was primarily driven by the unfavorable impact of increased share-based compensation expense of $12 million, unfavorable foreign currency exchange of $5 million, and increased amortization of intangible assets of $2 million. These increases were partially offset by lower cost reductions in excess of non-commodity inflation, salary and other items of $6 million.
Pension and postretirement benefit settlement and curtailment expenses decreased by $21 million for the year ended December 31, 2013 compared to the year ended December 31, 2012. This decrease was driven by a lower net loss related to settlement and curtailment activity within the U.S. salaried pension plan and for certain retiree medical benefits.
Restructuring charges and asset impairments decreased by $29 million for the year ended December 31, 2013 compared to the year ended December 31, 2012. This was driven by overall lower severance and other charges of $35 million, primarily related to our overall restructuring efforts in Europe, partially offset by an increase in asset impairments of $5 million.
Other income—net decreased by $36 million for the year ended December 31, 2013 compared to the year ended December 31, 2012. This decrease was due to an unfavorable increase in foreign
39
currency exchange losses of $15 million, a decrease in other miscellaneous income of $7 million and in net gains on sales of assets of $6 million, an increase in the provision for bad debts of $5 million and an unfavorable change in the marking to market of forward electricity purchase contracts of $4 million.
Interest expense—net increased by $21 million for the year ended December 31, 2013 compared to the year ended December 31, 2012, primarily as the result of increased debt levels, including the issuances of the 4.5% and 4.45% Senior Notes, and reduced interest income.
Loss on retirement of debt was $20 million for the year ended December 31, 2013 compared to $6 million for the year ended December 31, 2012. During 2013, we exercised our option to redeem $205 million in principal amount outstanding of our 8.875% notes due in December 2017 at a price of 104.438% of par and recorded a loss on retirement of debt of $12 million, which included the redemption premium and write-off of related debt issue costs and discounts. In addition, we repurchased portions of our senior unsecured notes due in 2014 and 2017 totaling $91 million in principal amount and recorded a loss on retirement of debt of $5 million, which included the write-off of a portion of related debt issue costs. Exchangeable senior note holders exchanged approximately $26 million in principal amount of notes for approximately 880,000 shares of Company stock. In conjunction with the exchange, we recorded a loss on retirement of debt of $3 million, which included the write-off of a portion of related debt issue costs and debt discount.
During 2012, we repurchased portions of our senior unsecured notes totaling $48 million in principal amount and recorded a loss on retirement of debt of $5 million which included the write-off of a portion of related debt issue costs. In addition, we entered into the Eighth Credit Agreement and recorded a loss on retirement of debt of $1 million related to the write-off of a portion of debt issuance costs associated with the prior credit agreement.
Income tax expense for the year ended December 31, 2013 was $114 million on pre-tax earnings of $1,121 million compared to income tax benefit of $33 million on pre-tax earnings of $1,008 million for the year ended December 31, 2012. Income tax expense for the year ended December 31, 2013 includes a tax benefit of approximately $153 million related to our ability to utilize historical foreign tax credits in future periods and the corresponding recognition of a deferred tax asset. Income tax expense for the period ended December 31, 2013 also includes a tax benefit of approximately $43 million relating to the enactment of various tax legislation during the year and a net tax expense of $17 million resulting from net losses in certain foreign jurisdictions with no corresponding tax benefit due to increases in our valuation allowances. Income tax benefit for the year ended December 31, 2012 includes a tax benefit of approximately $255 million related to various tax planning and legal entity restructuring actions. Income tax benefit for the year ended December 31, 2012 also includes a net benefit of $63 million related to reductions in our global valuation allowance on net deferred tax assets. The income tax rate for both periods varies from the United States statutory income tax rate due primarily to the items noted above as well as favorable foreign tax rates, holidays, and credits.
40
SEGMENT RESULTS OF OPERATIONS
Comparison of the Year Ended December 31, 2014 and December 31, 2013:
Sales, Including Intersegment Sales
| |
Years Ended December 31, | Variance Drivers: | |||||||||||||||||
|---|---|---|---|---|---|---|---|---|---|---|---|---|---|---|---|---|---|---|---|
| |
2014 | 2013 | 2014 vs. 2013 Variance |
Volume | Foreign Currency |
Other | |||||||||||||
| |
(Dollars in millions) |
|
|
|
|||||||||||||||
Chassis Systems |
$ | 11,370 | $ | 11,506 | $ | (136 | ) | $ | 738 | $ | (73 | ) | $ | (801 | ) | ||||
Occupant Safety Systems |
3,496 | 3,444 | 52 | 120 | 13 | (81 | ) | ||||||||||||
Electronics |
1,546 | 1,264 | 282 | 274 | 8 | — | |||||||||||||
Automotive Components |
1,965 | 1,983 | (18 | ) | (16 | ) | (2 | ) | — | ||||||||||
| | | | | | | | | | | | | | | | | | | | |
Segment Sales |
18,377 | 18,197 | 180 | 1,116 | (54 | ) | (882 | ) | |||||||||||
Intersegment eliminations |
(838 | ) | (762 | ) | (76 | ) | |||||||||||||
| | | | | | | | | | | | | | | | | | | | |
Total sales |
$ | 17,539 | $ | 17,435 | $ | 104 | |||||||||||||
| | | | | | | | | | | | | | | | | | | | |
| | | | | | | | | | | | | | | | | | | | |
| | | | | | | | | | | | | | | | | | | | |
- •
- The following items are included in Other above:
- •
- The unfavorable impact of lower sales of $801 million in Chassis Systems as a result of exiting certain of our
brake component and modules businesses in North America during the first quarter of 2014.
- •
- The unfavorable impact of price reductions provided to customers of $81 million in Occupant Safety Systems.
- •
- The impact of foreign currency exchange primarily relates to the euro. In our Chassis Systems segment, foreign currency exchange was also substantially impacted by the unfavorable impact of the Brazilian real.
Cost of Sales
| |
Years Ended December 31, | Variance Components: | Variance Drivers: | ||||||||||||||||||||||
|---|---|---|---|---|---|---|---|---|---|---|---|---|---|---|---|---|---|---|---|---|---|---|---|---|---|
| |
2014 | 2013 | 2014 vs. 2013 Variance |
Material Cost |
Labor and Other Costs |
Volume and Inflation |
Foreign Currency |
Other | |||||||||||||||||
| |
(Dollars in millions) |
|
|
|
|||||||||||||||||||||
Chassis Systems |
$ | 10,155 | $ | 10,369 | $ | (214 | ) | $ | (194 | ) | $ | (20 | ) | $ | 551 | $ | (56 | ) | $ | (709 | ) | ||||
Occupant Safety Systems |
3,149 | 3,119 | 30 | 4 | 26 | 29 | 1 | — | |||||||||||||||||
Electronics |
1,376 | 1,119 | 257 | 194 | 63 | 240 | 17 | — | |||||||||||||||||
Automotive Components |
1,726 | 1,768 | (42 | ) | (27 | ) | (15 | ) | (38 | ) | (4 | ) | — | ||||||||||||
| | | | | | | | | | | | | | | | | | | | | | | | | | |
Segment cost of sales before intersegment eliminations |
16,406 | 16,375 | 31 | (23 | ) | 54 | 782 | (42 | ) | (709 | ) | ||||||||||||||
Intersegment eliminations |
(838 | ) | (762 | ) | (76 | ) | |||||||||||||||||||
| | | | | | | | | | | | | | | | | | | | | | | | | | |
Segment cost of sales |
$ | 15,568 | $ | 15,613 | $ | (45 | ) | ||||||||||||||||||
| | | | | | | | | | | | | | | | | | | | | | | | | | |
| | | | | | | | | | | | | | | | | | | | | | | | | | |
| | | | | | | | | | | | | | | | | | | | | | | | | | |
- •
- The Volume and Inflation category above represents amounts net of cost reduction efforts.
- •
- The increase in cost of sales related to foreign currency exchange primarily relates to the euro.
- •
- The following items are included in Other above:
- •
- The reduction of $709 million in cost of sales in Chassis Systems as a result of exiting certain of our brake component and modules businesses in North America.
41
Earnings Before Taxes
| |
Years Ended December 31, | Variance Drivers: | |||||||||||||||||||||||
|---|---|---|---|---|---|---|---|---|---|---|---|---|---|---|---|---|---|---|---|---|---|---|---|---|---|
| |
2014 | 2013 | 2014 vs. 2013 Variance |
Volume | Foreign Currency |
Cost (Increases)/ Reductions |
Restructuring | Other | |||||||||||||||||
| |
(Dollars in millions) |
|
|
|
|
|
|||||||||||||||||||
Chassis Systems |
$ | 831 | $ | 841 | $ | (10 | ) | $ | 144 | $ | (7 | ) | $ | (12 | ) | $ | (46 | ) | $ | (89 | ) | ||||
Occupant Safety Systems |
282 | 239 | 43 | 38 | 14 | 42 | 30 | (81 | ) | ||||||||||||||||
Electronics |
144 | 126 | 18 | 47 | (8 | ) | (22 | ) | 1 | — | |||||||||||||||
Automotive Components |
168 | 150 | 18 | (4 | ) | 2 | 24 | (4 | ) | — | |||||||||||||||
| | | | | | | | | | | | | | | | | | | | | | | | | | |
Segment earnings before taxes |
1,425 | 1,356 | 69 | 225 | 1 | 32 | (19 | ) | (170 | ) | |||||||||||||||
Corporate expense and other |
(920 | ) | (120 | ) | (800 | ) | |||||||||||||||||||
Interest expense—net |
(109 | ) | (132 | ) | 23 | ||||||||||||||||||||
Loss on retirement of debt—net |
(7 | ) | (20 | ) | 13 | ||||||||||||||||||||
Net earnings attributable to noncontrolling interest, net of tax |
41 | 37 | 4 | ||||||||||||||||||||||
| | | | | | | | | | | | | | | | | | | | | | | | | | |
Earnings before income taxes |
$ | 430 | $ | 1,121 | $ | (691 | ) | ||||||||||||||||||
| | | | | | | | | | | | | | | | | | | | | | | | | | |
| | | | | | | | | | | | | | | | | | | | | | | | | | |
| | | | | | | | | | | | | | | | | | | | | | | | | | |
- •
- The Volume category above includes the net impact of a higher proportion of lower margin business, including the introduction of new
products at initial lower margins in our Electronics segment.
- •
- The unfavorable impact of foreign currency exchange in our Chassis Systems segment primarily relates to the Brazilian real and Chinese
renminbi, which outweighed the favorable impact of the euro. The favorable impact of foreign currency exchange in our Occupant Safety Systems relates to the euro. The unfavorable impact of foreign
currency exchange in our Electronics segment primarily relates to the cross-currency impact of the euro and U.S. dollar to the U.K. pound sterling.
- •
- The Cost Reductions category above represents cost savings in excess of growth costs, such as salary and engineering costs, as well as
non-commodity inflation and other costs.
- •
- The following items are included in Other above:
- •
- The reduction in profit of $89 million in our Chassis Systems segment as a result of exiting certain of our brake
component and modules businesses in North America
- •
- The unfavorable impact of price reductions provided to customers of $81 million in Occupant Safety Systems.
- •
- Certain income and costs not associated with the current operations of our segments are recorded within Corporate. For example, we recognize transactions related to our closed pension plan in the U.K. within Corporate. This plan included hourly employees, substantially all of whom are not actively employed by the Company. Other items recognized within Corporate include costs associated with corporate staff and related expenses, financing costs and gains or losses on the retirement of debt, and certain settlements and curtailments of benefit plans.
42
Comparison of the Year Ended December 31, 2013 and December 31, 2012:
Sales, Including Intersegment Sales
| |
Years Ended December 31, | Variance Drivers: | |||||||||||||||||
|---|---|---|---|---|---|---|---|---|---|---|---|---|---|---|---|---|---|---|---|
| |
2013 | 2012 | 2013 vs. 2012 Variance |
Volume | Foreign Currency |
Other | |||||||||||||
| |
(Dollars in millions) |
|
|
|
|||||||||||||||
Chassis Systems |
$ | 11,506 | $ | 10,705 | $ | 801 | $ | 751 | $ | 78 | $ | (28 | ) | ||||||
Occupant Safety Systems |
3,444 | 3,377 | 67 | 84 | 70 | (87 | ) | ||||||||||||
Electronics |
1,264 | 1,168 | 96 | 123 | 6 | (33 | ) | ||||||||||||
Automotive Components |
1,983 | 1,898 | 85 | 56 | 29 | — | |||||||||||||
| | | | | | | | | | | | | | | | | | | | |
Segment Sales |
18,197 | 17,148 | 1,049 | 1,014 | 183 | (148 | ) | ||||||||||||
Intersegment eliminations |
(762 | ) | (704 | ) | (58 | ) | |||||||||||||
| | | | | | | | | | | | | | | | | | | | |
Total sales |
$ | 17,435 | $ | 16,444 | $ | 991 | |||||||||||||
| | | | | | | | | | | | | | | | | | | | |
| | | | | | | | | | | | | | | | | | | | |
| | | | | | | | | | | | | | | | | | | | |
- •
- The following items are included in Other above:
- •
- The unfavorable impact of price reductions provided to customers of $87 million in Occupant Safety Systems and
$33 million in Electronics.
- •
- The unfavorable impact of lower sales of $28 million in Chassis Systems related to a business divested in the
third quarter of 2012.
- •
- The favorable impact of foreign currency exchange primarily relates to the euro.
Cost of Sales
| |
Years Ended December 31, | Variance Components: | Variance Drivers: | ||||||||||||||||||||||
|---|---|---|---|---|---|---|---|---|---|---|---|---|---|---|---|---|---|---|---|---|---|---|---|---|---|
| |
2013 | 2012 | 2013 vs. 2012 Variance |
Material Cost |
Labor and Other Costs |
Volume and Inflation |
Foreign Currency |
Other | |||||||||||||||||
| |
(Dollars in millions) |
|
|
|
|||||||||||||||||||||
Chassis Systems |
$ | 10,369 | $ | 9,692 | $ | 677 | $ | 548 | $ | 129 | $ | 625 | $ | 85 | $ | (33 | ) | ||||||||
Occupant Safety Systems |
3,119 | 3,057 | 62 | 17 | 45 | (1 | ) | 63 | — | ||||||||||||||||
Electronics |
1,119 | 1,024 | 95 | 71 | 24 | 92 | 3 | — | |||||||||||||||||
Automotive Components |
1,768 | 1,711 | 57 | 28 | 29 | 32 | 25 | — | |||||||||||||||||
| | | | | | | | | | | | | | | | | | | | | | | | | | |
Segment cost of sales before intersegment eliminations |
16,375 | 15,484 | 891 | 664 | 227 | 748 | 176 | (33 | ) | ||||||||||||||||
Intersegment eliminations |
(762 | ) | (704 | ) | (58 | ) | |||||||||||||||||||
| | | | | | | | | | | | | | | | | | | | | | | | | | |
Segment cost of sales |
$ | 15,613 | $ | 14,780 | $ | 833 | |||||||||||||||||||
| | | | | | | | | | | | | | | | | | | | | | | | | | |
| | | | | | | | | | | | | | | | | | | | | | | | | | |
| | | | | | | | | | | | | | | | | | | | | | | | | | |
- •
- The Volume and Inflation category above represents amounts net of cost reduction efforts.
- •
- The unfavorable impact of foreign currency exchange primarily relates to the euro.
- •
- The following items are included in Other above:
- •
- The reduction of $33 million in cost of sales in Chassis Systems related to a business divested in the third quarter of 2012.
43
Earnings Before Taxes
| |
Years Ended December 31, | Variance Drivers: | |||||||||||||||||||||||
|---|---|---|---|---|---|---|---|---|---|---|---|---|---|---|---|---|---|---|---|---|---|---|---|---|---|
| |
2013 | 2012 | 2013 vs. 2012 Variance |
Volume | Foreign Currency |
Cost (Increases)/ Reductions |
Restructuring | Other | |||||||||||||||||
| |
(Dollars in millions) |
|
|
|
|
|
|||||||||||||||||||
Chassis Systems |
$ | 841 | $ | 669 | $ | 172 | $ | 155 | $ | (14 | ) | $ | (15 | ) | $ | 41 | $ | 5 | |||||||
Occupant Safety Systems |
239 | 254 | (15 | ) | 8 | 4 | 77 | (17 | ) | (87 | ) | ||||||||||||||
Electronics |
126 | 132 | (6 | ) | 8 | 2 | 18 | (1 | ) | (33 | ) | ||||||||||||||
Automotive Components |
150 | 115 | 35 | 19 | 4 | 5 | 7 | — | |||||||||||||||||
| | | | | | | | | | | | | | | | | | | | | | | | | | |
Segment earnings before taxes |
1,356 | 1,170 | 186 | 190 | (4 | ) | 85 | 30 | (115 | ) | |||||||||||||||
Corporate expense and other |
(120 | ) | (78 | ) | (42 | ) | |||||||||||||||||||
Interest expense—net |
(132 | ) | (111 | ) | (21 | ) | |||||||||||||||||||
Loss on retirement of debt—net |
(20 | ) | (6 | ) | (14 | ) | |||||||||||||||||||
Net earnings attributable to noncontrolling interest, net of tax |
37 | 33 | 4 | ||||||||||||||||||||||
| | | | | | | | | | | | | | | | | | | | | | | | | | |
Earnings before income taxes |
$ | 1,121 | $ | 1,008 | $ | 113 | |||||||||||||||||||
| | | | | | | | | | | | | | | | | | | | | | | | | | |
| | | | | | | | | | | | | | | | | | | | | | | | | | |
| | | | | | | | | | | | | | | | | | | | | | | | | | |
- •
- The Volume category above includes the net impact of a higher proportion of lower margin business, including the introduction of new
products at initial lower margins in our Electronics segment.
- •
- The unfavorable impact of foreign currency exchange in our Chassis Systems segment primarily relates to the Brazilian real, which
outweighed the favorable impact of the euro. The Occupant Safety Systems, Electronics and Automotive Components segments were primarily impacted by the euro.
- •
- The Cost Reductions category above represents cost savings in excess of growth costs, such as salary and engineering costs, as well as
non-commodity inflation and other costs.
- •
- The following items are included in Other above:
- •
- The unfavorable impact of price reductions provided to customers of $87 million in Occupant Safety Systems and
$33 million in Electronics.
- •
- The elimination of a loss of $5 million in Chassis Systems related to a business divested in the third quarter of 2012.
LIQUIDITY AND CAPITAL RESOURCES
On an annual basis, our primary source of liquidity is cash flows generated from operations. At various points during the course of a given year, we may be in an operating cash usage position, which is not unusual given the seasonality of our business. We also have available liquidity under our Revolving Credit Facility and the other credit facilities described below, subject to certain conditions. We continuously monitor our working capital position and associated cash requirements and explore opportunities to more effectively manage our inventory and capital spending. Working capital is highly influenced by the timing of cash flows associated with sales and purchases, and therefore can be difficult to manage at times. Further, with our growth in emerging markets and the move by OEMs to more global platforms, our working capital may increase accordingly. Although we have historically been successful in managing the timing of our cash flows, future success will depend on the financial position of our customers and suppliers, and on industry conditions.
44
We believe that funds generated from operations, cash on hand and available borrowing capacity will be adequate to fund our liquidity requirements. These requirements, which are significant, generally consist of working capital requirements, company-sponsored research and development programs, capital expenditures, debt service requirements, cash taxes, and contributions for pensions and postretirement benefits other than pensions. In addition, we have been using available funds to reduce debt and to repurchase shares of our common stock under board-approved share repurchase programs. Our current financing plans are intended to provide flexibility in worldwide financing activities and permit us to respond to changing conditions in credit markets. However, our ability to continue to fund these items, to repurchase shares of common stock and to reduce debt (subject to the provisions of the Merger Agreement with ZF) may be affected by general economic, industry specific, financial market, competitive, legislative and regulatory factors, including factors relating to the ongoing Antitrust Investigations.
As of December 31, 2014, the amount of cash and cash equivalents held by foreign subsidiaries was $820 million. If these funds were repatriated to the U.S., we would be required to provide for U.S. federal and state income tax, foreign income tax, and foreign withholding taxes. We have already provided for such taxes on a significant portion of this cash and cash equivalents that are not deemed to be permanently reinvested. However, for the entities that hold the remainder of such cash and cash equivalents, we have not provided for such taxes as it is our intention that those funds are permanently reinvested outside the U.S. and our current plans do not demonstrate a need to repatriate them to fund our U.S. operations.
Cash Flows
Operating Activities. Cash provided by operating activities was $954 million, $1,126 million and $956 million for the years ended December 31, 2014, 2013 and 2012, respectively.
The decrease in cash provided by operations for 2014 compared to 2013 was primarily the result of higher pension contributions of $153 million, increased working capital requirements of $50 million, higher outflows related to withholding taxes on certain equity awards of $31 million, and higher cash paid for taxes of $27 million, partially offset by higher inflows for value-added taxes of $47 million and higher cash earnings.
The increase in cash provided by operations for 2013 compared to 2012 was primarily the result of higher cash earnings, a reduction in cash outflows for other liabilities primarily relating to customer pricing, warranty and recall matters of $120 million, lower cash paid for taxes and pension of $40 million and $17 million, respectively, as well as the non-recurrence of employee benefit-related payments of $40 million, which included the payout for certain cash incentive and retention awards for executive officers and vice presidents that vested and were paid in 2012. These favorable variances in operating cash flows were partially offset by increased working capital requirements of $180 million and higher outflows for restructuring and other severance-related payments of $69 million.
Investing Activities. Cash used in investing activities was $708 million, $734 million and $608 million for the years ended December 31, 2014, 2013 and 2012, respectively.
Capital expenditures were $694 million, $735 million and $623 million for the years ended December 31, 2014, 2013 and 2012, respectively. These capital expenditures were primarily related to investing in new facilities, upgrading existing products, continuing new product launches, and infrastructure and equipment at our facilities to support our manufacturing and cost reduction efforts. In 2012, a significant portion of our capital expenditures were made to support our strategic growth in China and Brazil. As we continue with our expansion plans, we expect to spend between $650 million and $690 million on capital expenditures during 2015, depending on timing of expenditures, as we continue to invest in our strategic priorities and growth.
45
During 2014, the Company made an initial equity contribution of $17 million in a newly formed joint venture in Mexico. The joint venture will supply castings to our North American Braking operations through a long-term supply arrangement.
Financing Activities. Cash used in financing activities was $854 million for the year ended December 31, 2014, cash provided by financing activities was $110 million for the year ended December 31, 2013, and cash used in financing activities was $385 million for the year ended December 31, 2012.
During 2014, we repaid the outstanding principal balance of $469 million upon maturity of our 6.375% Senior Notes and 7.00% Senior Notes. During 2013 and 2012, we utilized $309 million and $53 million, respectively, of cash on hand to optionally repurchase portions of our senior unsecured notes totaling $296 million and $48 million, respectively, in principal amount. In addition, we also utilized $33 million, $31 million, and $33 million of cash on hand to redeem other long-term debt during 2014, 2013, and 2012, respectively.
During 2014, 2013, and 2012, we used $400 million, $520 million, and $268 million, respectively, to repurchase approximately 4.6 million, 7.5 million, and 5.6 million shares, respectively, of our common stock.
During 2013, we received $394 million and $395 million of proceeds, net of fees, from the issuance of $400 million and $400 million in principal amount of 4.50% senior unsecured notes and 4.45% senior unsecured notes, respectively. Further, we also received $13 million and $90 million of proceeds under various borrowing arrangements during 2014 and 2013, respectively.
In addition, certain of our subsidiaries paid dividends of $36 million, $31 million and $46 million, respectively, to noncontrolling stockholders during 2014, 2013 and 2012. Also during these periods, we received $3 million, $30 million and $21 million, respectively, of net proceeds from the exercise of stock options.
Other Sources of Liquidity
The Eighth Credit Agreement provides for senior credit facilities consisting of (i) a revolving credit facility in the amount of $1.4 billion which matures in September 2017, subject to certain conditions (the "Revolving Credit Facility"), and (ii) additional availability which may be used in the future for one or more term loans or additional revolving facilities (together with the Revolving Credit Facility, the "Facilities"). As of December 31, 2014, we had no outstanding borrowings under our Revolving Credit Facility, resulting in approximately $1.4 billion of availability. See "—Senior Credit Facilities" in Note 13 to our consolidated financial statements included in Item 8 of this Report for a description of these facilities.
As of December 31, 2014, our subsidiaries in the United States, European region and Asia Pacific region also had various uncommitted credit facilities with individual banks, of which $525 million, $195 million, and $189 million, respectively, was unutilized.
We may draw down on and use proceeds from these credit facilities, including our Revolving Credit Facility, from month to month in conjunction with available cash on hand in order to fund normal working capital needs. As of December 31, 2014, we had short-term borrowings under uncommitted credit facilities totaling $221 million, while during the fourth quarter we had up to $323 million, in aggregate, outstanding under these credit facilities.
The Eighth Credit Agreement governs our Facilities and contains a number of covenants, including financial covenants, that would impact our ability to borrow on the facility if not met and covenants that restrict, among other things and subject to certain exceptions, the ability to incur additional indebtedness, repay or repurchase other indebtedness, repurchase capital stock and pay cash dividends
46
on our common stock. As of December 31, 2014, we were in compliance with all of our financial covenants. Such covenants are described in more detail in Note 13 to our consolidated financial statements included in Item 8 of this Report.
Other Capital Transactions Impacting Liquidity
Share Repurchase Programs. During 2014, we repurchased 1.5 million shares of our common stock under the Anti-Dilution Program and approximately 3.1 million shares of our common stock under the $2 Billion Program using $400 million in total. See Part II, Item 5, above and Note 17 to our consolidated financial statements included in Item 8 of this Report for further information.
Contractual Obligations and Commitments
The following table reflects our significant contractual obligations as of December 31, 2014:
| |
Less Than One Year |
One to Three Years |
Three to Five Years |
More Than Five Years |
Total | |||||||||||
|---|---|---|---|---|---|---|---|---|---|---|---|---|---|---|---|---|
| |
(Dollars in millions) |
|||||||||||||||
Short-term borrowings |
$ | 222 | $ | — | $ | — | $ | — | $ | 222 | ||||||
Long-term debt obligations |
71 | (b) | 469 | 1 | 802 | 1,343 | ||||||||||
Capital lease obligations |
2 | 4 | 5 | 3 | 14 | |||||||||||
Operating lease obligations |
60 | 98 | 91 | 54 | 303 | |||||||||||
Projected interest payment on long-term debt(a) |
91 | 128 | 72 | 98 | 389 | |||||||||||
| | | | | | | | | | | | | | | | | |
Total |
$ | 446 | $ | 699 | $ | 169 | $ | 957 | $ | 2,271 | ||||||
| | | | | | | | | | | | | | | | | |
| | | | | | | | | | | | | | | | | |
| | | | | | | | | | | | | | | | | |
- (a)
- Long
term debt includes both fixed rate and variable rate obligations. As of December 31, 2014, approximately 14% of our total debt was at variable
interest rates. The projected interest payment obligations are based upon (1) fixed rates where appropriate and (2) projected London Interbank Borrowing Rates ("LIBOR") obtained from
third parties plus applicable margins as of the current balance sheet date for variable rate obligations. The projected interest payment obligations are also based upon debt outstanding at the balance
sheet date and assume retirement at scheduled maturity dates.
- (b)
- Upon issuance of our exchangeable notes a debt discount was recognized as a decrease in debt and an increase in equity. Accordingly, the fair value and carrying value of long-term fixed rate debt is net of the unamortized discount of $1 million as of December 31, 2014. The debt discount does not affect the actual amount we are required to repay, therefore it is excluded in the contractual obligation table but is reflected in the carrying value disclosed in Note 13 of this Report.
As of December 31, 2014, we have unrecognized tax benefits of $168 million. However, due to a high degree of uncertainty regarding the timing of such future cash outflows, reasonable estimates cannot be made regarding the period of cash settlement with the applicable taxing authority.
In addition to the obligations discussed above, we sponsor defined benefit pension plans that cover a significant portion of our U.S. employees and certain non-U.S. employees. Our pension plans in the U.S. are funded in conformity with the minimum funding requirements of the Pension Protection Act of 2006. Additionally, we periodically make discretionary contributions to the plans in support of risk management initiatives. Funding for our pension plans in other countries is based upon actuarial recommendations or statutory requirements. In 2015, our expected funding is £5 million, or $7 million for the U.K. plan and $29 million for pension plans in the rest of the world, however, we may, at our discretion, make additional contributions. We do not expect to make any funding contributions to the U.S. plans in 2015.
47
We sponsor OPEB plans that cover a substantial number of our U.S. and certain non-U.S. retirees and provide benefits to certain eligible employees and dependents upon retirement. We are subject to increased OPEB cash costs due to, among other factors, rising health care costs. We fund our OPEB obligations on a pay-as-you-go basis. In 2015, we expect to contribute approximately $32 million to our OPEB plans.
We also have liabilities recorded for various environmental matters. As of December 31, 2014, we had reserves for environmental matters of $71 million. We expect to pay approximately $20 million in 2015 in relation to these matters.
In addition to the contractual obligations and commitments noted above, we have contingent obligations in the form of severance and bonus payments for our executive officers. We have no unconditional purchase obligations other than those related to inventory, services, tooling and property, plant and equipment in the ordinary course of business.
Other Commitments. Continuing pressure from customers to reduce prices is characteristic of the automotive parts industry. Historically, we have taken steps to reduce costs and minimize and/or resist price reductions; however, to the extent we are unsuccessful at resisting price reductions, or are not able to offset price reductions through improved operating efficiencies and reduced expenditures, such price reductions may have a material adverse effect on our financial condition, results of operations and cash flows.
In addition to pricing concerns, customers continue to seek changes in terms and conditions in our contracts concerning warranty and recall participation and payment terms on products shipped. We believe that the likely resolution of these proposed modifications will not have a material adverse effect on our financial condition, results of operations or cash flows.
Off-Balance Sheet Arrangements
We do not have material off-balance sheet arrangements. We do not have guarantees related to unconsolidated entities, which have, or are reasonably likely to have, a material current or future effect on our financial position, results of operations or cash flows.
CONTINGENCIES
The information concerning the ongoing Antitrust Matters and Transaction Litigation contained in Item 3 "Legal Proceedings" of this Report and the information concerning other contingencies, including environmental contingencies and the amount currently held in reserve for environmental matters, contained in Note 19 to our consolidated financial statements included in Item 8 of this Report, is incorporated herein by reference. The additional information concerning environmental matters included in Item 1 "Business—Environmental Matters" of this Report is also incorporated herein by reference.
RECENTLY ISSUED ACCOUNTING PRONOUNCEMENTS
See Note 3 to our consolidated financial statements included in Item 8 of this Report for a discussion of recently issued accounting pronouncements.
OUTLOOK
On September 15, 2014, we announced the Merger Agreement with ZF. The closing of the transaction is subject to receipt of antitrust approvals and other customary closing conditions. The transaction is expected to close in the first half of 2015. In the interim, we will continue to execute our existing business plan.
48
We expect full year 2015 sales to be in the range of $16.6 billion to $16.9 billion, including first quarter sales of approximately $4.2 billion. These sales figures are based on expected 2015 production levels of 17.4 million units in North America, 20.0 million units in Europe, the divestiture of our engine valve business, continued expansion in vehicle production volumes in China, and our expectations for foreign currency exchange rates. We expect our full year 2015 effective tax rate to be approximately 27% to 29%.
In general, we expect global production levels to increase slightly in 2015 compared to 2014. In North America, the industry continues in a positive direction with expected production levels in 2015 to be comparable to 2014. Production levels for the Detroit Three (defined as FCA US LLC, Ford Motor Company, and General Motors Company, combined), are expected to lag behind the production levels for the region. In general, our financial results are more closely correlated to the production by the Detroit Three given our higher sales content to these manufacturers compared to the Japanese manufacturers. In Europe, production levels are expected to be relatively flat in 2015 compared to 2014, particularly given the fragile economic environment. At the same time, growth in China is expected to continue at a moderate pace in 2015. Considering the expected long-term growth within this region, we continue to invest appropriate levels of capital, engineering and infrastructure to underpin our expansion and position us to benefit from these growth opportunities.
We continue to evaluate our global footprint to ensure that we are properly configured and sized based on changing market conditions and the production plans of our customers. We will continue to assess our cost base primarily in Europe, and in 2015 we intend to continue our restructuring efforts, including plant rationalizations, targeted workforce reductions and adjustments to certain of our fixed costs, to align our operations with the existing environment in those regions. As a result, we expect to incur restructuring charges of approximately $60 million in 2015. We believe these efforts are necessary actions in order to preserve our competitiveness and will provide lasting benefit over the long term.
While we expect net commodity price movements to be immaterial in 2015, we will continue to monitor commodity costs and work with our suppliers and customers to manage changes in such costs as required.
The Antitrust Investigation by the European Commission is ongoing. While we cannot estimate the ultimate financial impact of the European investigation at this time, we will continue to evaluate developments in this matter on a regular basis and will record an accrual as and when appropriate.
Despite the various challenges that the automotive industry faces, we are confident that we will manage through them successfully. We believe that our growth prospects, strong balance sheet, ability to generate cash and our broad array of innovative products provide a firm foundation for continued profitability.
FORWARD-LOOKING STATEMENTS
This Report includes "forward-looking statements," as that term is defined by the federal securities laws. Forward-looking statements include statements concerning our plans, intentions, objectives, goals, strategies, forecasts, future events, future revenue or performance, capital expenditures, financing needs, business trends and other information that is not historical information. When used in this Report, the words "estimates," "expects," "anticipates," "projects," "plans," "intends," "believes," "forecasts," and future or conditional verbs, such as "will," "should," "could" or "may," as well as variations of such words or similar expressions are intended to identify forward-looking statements, although not all forward-looking statements are so designated. All forward-looking statements, including, without limitation, management's examination of historical operating trends and data, are based upon our current expectations and various assumptions, and apply only as of the date of this Report. Our expectations, beliefs and projections are expressed in good faith and we believe there is a
49
reasonable basis for them. However, there can be no assurance that management's expectations, beliefs and projections will be achieved.
There are a number of risks, uncertainties and other important factors that could cause our actual results to differ materially from those suggested by our forward-looking statements, including those set forth in Item 1A "Risk Factors" in this Report, in "—Executive Overview" above, and in our other filings with the Securities and Exchange Commission. All forward-looking statements are expressly qualified in their entirety by such cautionary statements. We undertake no obligation to update or revise forward-looking statements which have been made to reflect events or circumstances that arise after the date made or to reflect the occurrence of unanticipated events.
ITEM 7A. QUANTITATIVE AND QUALITATIVE DISCLOSURES ABOUT MARKET RISKS
Our primary market risks arise from fluctuations in foreign currency exchange rates, interest rates and commodity prices. We manage foreign currency exchange rate risk, interest rate risk and, to a lesser extent, commodity price risk by utilizing various derivative instruments. We limit the use of such instruments to hedging activities; we do not use such instruments for speculative or trading purposes. If we did not use derivative instruments, our exposure to such risks would be higher. We are exposed to credit loss in the event of nonperformance by the counterparty to the derivative financial instruments. We attempt to manage this exposure by entering into agreements directly with a number of major financial institutions that meet our credit standards and that are expected to fully satisfy their obligations under the contracts. However, given historical disruptions in the financial markets, including the bankruptcy, insolvency or restructuring of certain financial institutions, there is no guarantee that the financial institutions with whom we contract will be able to fully satisfy their contractual obligations.
Foreign Currency Exchange Rate Risk. We enter into forward contracts and, to a lesser extent, options to hedge portions of our foreign currency denominated forecasted revenues, purchases and the subsequent cash flow from adverse movements in exchange rates. Foreign currency exposures are reviewed monthly and any natural offsets are considered prior to entering into a derivative financial instrument. As of December 31, 2014, approximately 17% of our total debt was in foreign currencies, compared to 23% as of December 31, 2013.
Interest Rate Risk. We are subject to interest rate risk in connection with variable-rate debt. In order to manage interest costs, we may occasionally utilize interest rate swap agreements to exchange fixed- and variable-rate interest payment obligations over the life of the agreements. As of December 31, 2014 and 2013, approximately 14% and 8%, respectively, of our total debt was at variable interest rates.
Commodity Price Risk. From time to time, we may utilize derivative financial instruments to manage select commodity price risks. Forward purchase agreements generally meet the criteria to be accounted for as normal purchases. Forward purchase agreements which do not or no longer meet these criteria are classified and accounted for as derivatives.
Sensitivity Analysis. We utilize a sensitivity analysis model to calculate the fair value, cash flows or statement of earnings impact that a hypothetical 10% change in market rates would have on our debt and derivative instruments. For derivative instruments, we utilized applicable forward rates in effect as of December 31, 2014 to calculate the fair value or cash flow impact resulting from this hypothetical change in market rates. The analyses also do not factor in a potential change in the level of variable
50
rate borrowings or derivative instruments outstanding that could take place if these hypothetical conditions prevailed. The results of the sensitivity model calculations follow:
Market Risk
| |
Assuming a 10% U.S.$ Strengthening |
Assuming a 10% U.S.$ Weakening |
Favorable (Unfavorable) Change in |
|||||
|---|---|---|---|---|---|---|---|---|
| |
(Dollars in millions) |
|||||||
Foreign Currency Rate Sensitivity: |
||||||||
—Forward sales contracts of U.S.$ and net purchased U.S.$ put options |
$ | (73 | ) | $ | 74 | Fair value | ||
—Forward purchase contracts of U.S.$ and net purchased U.S.$ call options |
$ | 27 | $ | (27 | ) | Fair value | ||
—Foreign currency denominated debt |
$ | 27 | $ | (27 | ) | Fair value | ||
| |
Assuming a 10% Increase in Rates |
Assuming a 10% Decrease in Rates |
Favorable (Unfavorable) Change in |
|||||
|---|---|---|---|---|---|---|---|---|
| |
(Dollars in millions) |
|||||||
Interest Rate Sensitivity: |
||||||||
Debt |
||||||||
—Fixed rate |
$ | 22 | $ | (29 | ) | Fair value | ||
—Variable rate |
$ | (1 | ) | $ | 1 | Cash flow | ||
51
ITEM 8. FINANCIAL STATEMENTS AND SUPPLEMENTARY DATA
TRW Automotive Holdings Corp.
Consolidated Statements of Earnings
| |
Years Ended December 31, | |||||||||
|---|---|---|---|---|---|---|---|---|---|---|
| |
2014 | 2013 | 2012 | |||||||
| |
(In millions, except per share amounts) |
|||||||||
Sales |
$ | 17,539 | $ | 17,435 | $ | 16,444 | ||||
Cost of sales |
15,473 | 15,505 | 14,655 | |||||||
| | | | | | | | | | | |
Gross profit |
2,066 | 1,930 | 1,789 | |||||||
Administrative and selling expenses |
669 | 607 | 594 | |||||||
Pension and postretirement benefit settlement and curtailment expenses |
790 | 31 | 52 | |||||||
Restructuring charges and asset impairments |
84 | 66 | 95 | |||||||
Transaction costs |
20 | — | — | |||||||
Other expense (income)—net |
2 | (1 | ) | (37 | ) | |||||
| | | | | | | | | | | |
Operating income |
501 | 1,227 | 1,085 | |||||||
Interest expense—net |
109 | 132 | 111 | |||||||
Loss on retirement of debt—net |
7 | 20 | 6 | |||||||
Equity in earnings of affiliates, net of tax |
(45 | ) | (46 | ) | (40 | ) | ||||
| | | | | | | | | | | |
Earnings before income taxes |
430 | 1,121 | 1,008 | |||||||
Income tax expense (benefit) |
96 | 114 | (33 | ) | ||||||
| | | | | | | | | | | |
Net earnings |
334 | 1,007 | 1,041 | |||||||
Less: Net earnings attributable to noncontrolling interest, net of tax |
41 | 37 | 33 | |||||||
| | | | | | | | | | | |
Net earnings attributable to TRW |
$ | 293 | $ | 970 | $ | 1,008 | ||||
| | | | | | | | | | | |
| | | | | | | | | | | |
| | | | | | | | | | | |
Basic earnings per share: |
||||||||||
Earnings per share |
$ | 2.62 | $ | 8.25 | $ | 8.24 | ||||
| | | | | | | | | | | |
| | | | | | | | | | | |
| | | | | | | | | | | |
Weighted average shares outstanding |
111.7 | 117.6 | 122.4 | |||||||
| | | | | | | | | | | |
| | | | | | | | | | | |
| | | | | | | | | | | |
Diluted earnings per share: |
||||||||||
Earnings per share |
$ | 2.54 | $ | 7.85 | $ | 7.83 | ||||
| | | | | | | | | | | |
| | | | | | | | | | | |
| | | | | | | | | | | |
Weighted average shares outstanding |
118.0 | 124.6 | 129.7 | |||||||
| | | | | | | | | | | |
| | | | | | | | | | | |
| | | | | | | | | | | |
See accompanying notes to consolidated financial statements.
52
TRW Automotive Holdings Corp.
Consolidated Statements of Comprehensive Earnings
| |
Years Ended December 31, | |||||||||
|---|---|---|---|---|---|---|---|---|---|---|
| |
2014 | 2013 | 2012 | |||||||
| |
(Dollars in millions) |
|||||||||
Net earnings |
$ | 334 | $ | 1,007 | $ | 1,041 | ||||
Other comprehensive earnings (losses): |
||||||||||
Foreign currency translation |
(277 | ) | (37 | ) | 72 | |||||
Retirement obligations, net of tax(a) |
(96 | ) | 154 | (260 | ) | |||||
Deferred cash flow hedges, net of tax(b) |
3 | (26 | ) | 58 | ||||||
| | | | | | | | | | | |
Total other comprehensive (losses) earnings |
(370 | ) | 91 | (130 | ) | |||||
Comprehensive (losses) earnings |
(36 | ) | 1,098 | 911 | ||||||
Less: Comprehensive earnings attributable to noncontrolling interest |
30 | 42 | 38 | |||||||
| | | | | | | | | | | |
Comprehensive (losses) earnings attributable to TRW |
$ | (66 | ) | $ | 1,056 | $ | 873 | |||
| | | | | | | | | | | |
| | | | | | | | | | | |
| | | | | | | | | | | |
- (a)
- Tax
on retirement obligations for the years ended December 31, 2014, 2013 and 2012 was $29 million, $(66) million, and $126 million,
respectively.
- (b)
- Tax on deferred cash flow hedges for the years ended December 31, 2014, 2013 and 2012 was $6 million, $7 million, and $(19) million, respectively.
See accompanying notes to consolidated financial statements.
53
TRW Automotive Holdings Corp.
Consolidated Balance Sheets
| |
As of December 31, | ||||||
|---|---|---|---|---|---|---|---|
| |
2014 | 2013 | |||||
| |
(Dollars in millions) |
||||||
ASSETS |
|||||||
Current assets: |
|||||||
Cash and cash equivalents |
$ | 1,031 | $ | 1,729 | |||
Accounts receivable—net |
2,432 | 2,478 | |||||
Inventories |
972 | 1,019 | |||||
Prepaid expenses and other current assets |
187 | 178 | |||||
Deferred income taxes |
226 | 224 | |||||
Assets held-for-sale |
252 | — | |||||
| | | | | | | | |
Total current assets |
5,100 | 5,628 | |||||
Property, plant and equipment—net |
2,645 |
2,718 |
|||||
Goodwill |
1,749 | 1,760 | |||||
Intangible assets—net |
291 | 292 | |||||
Pension assets |
663 | 1,059 | |||||
Deferred income taxes |
336 | 316 | |||||
Other assets |
510 | 479 | |||||
| | | | | | | | |
Total assets |
$ | 11,294 | $ | 12,252 | |||
| | | | | | | | |
| | | | | | | | |
| | | | | | | | |
LIABILITIES AND EQUITY |
|||||||
Current liabilities: |
|||||||
Short-term debt |
$ | 222 | $ | 159 | |||
Current portion of long-term debt |
72 | 482 | |||||
Trade accounts payable |
2,423 | 2,597 | |||||
Accrued compensation |
253 | 285 | |||||
Income taxes |
11 | 27 | |||||
Other current liabilities |
1,259 | 1,205 | |||||
Liabilities related to assets held-for-sale |
104 | — | |||||
| | | | | | | | |
Total current liabilities |
4,344 | 4,755 | |||||
Long-term debt |
1,284 | 1,473 | |||||
Postretirement benefits other than pensions |
346 | 375 | |||||
Pension benefits |
774 | 676 | |||||
Deferred income taxes |
47 | 145 | |||||
Long-term liabilities |
461 | 432 | |||||
| | | | | | | | |
Total liabilities |
7,256 | 7,856 | |||||
Commitments and contingencies |
|||||||
Stockholders' equity: |
|||||||
Capital stock |
1 | 1 | |||||
Paid-in-capital |
1,829 | 1,715 | |||||
Retained earnings |
2,751 | 2,858 | |||||
Accumulated other comprehensive losses |
(739 | ) | (380 | ) | |||
| | | | | | | | |
Total TRW stockholders' equity |
3,842 | 4,194 | |||||
Noncontrolling interest |
196 | 202 | |||||
| | | | | | | | |
Total equity |
4,038 | 4,396 | |||||
| | | | | | | | |
Total liabilities and equity |
$ | 11,294 | $ | 12,252 | |||
| | | | | | | | |
| | | | | | | | |
| | | | | | | | |
See accompanying notes to consolidated financial statements.
54
TRW Automotive Holdings Corp.
Consolidated Statements of Cash Flows
| |
Years Ended December 31, | |||||||||
|---|---|---|---|---|---|---|---|---|---|---|
| |
2014 | 2013 | 2012 | |||||||
| |
(Dollars in millions) |
|||||||||
Operating Activities |
||||||||||
Net earnings |
$ | 334 | $ | 1,007 | $ | 1,041 | ||||
Adjustments to reconcile net earnings to net cash provided by operating activities: |
||||||||||
Depreciation and amortization |
444 | 430 | 409 | |||||||
Net pension and other postretirement benefits income and contributions |
356 | (244 | ) | (224 | ) | |||||
Net gain on sales of assets and divestitures |
— | — | (6 | ) | ||||||
Amortization of debt issuance costs |
6 | 6 | 5 | |||||||
Loss on retirement of debt—net |
7 | 20 | 6 | |||||||
Asset impairment charges |
19 | 9 | 4 | |||||||
Deferred income taxes |
(94 | ) | (47 | ) | (204 | ) | ||||
Share-based compensation expense |
36 | 36 | 21 | |||||||
Exchangeable bond premium amortization |
7 | 10 | 7 | |||||||
Other—net |
(27 | ) | (21 | ) | (32 | ) | ||||
Changes in assets and liabilities: |
||||||||||
Accounts receivable—net |
(148 | ) | (266 | ) | 76 | |||||
Inventories |
(73 | ) | (42 | ) | (113 | ) | ||||
Trade accounts payable |
16 | 153 | 62 | |||||||
Prepaid expense and other assets |
(69 | ) | 3 | (47 | ) | |||||
Other liabilities |
140 | 72 | (49 | ) | ||||||
| | | | | | | | | | | |
Net cash provided by operating activities |
954 | 1,126 | 956 | |||||||
Investing Activities |
||||||||||
Capital expenditures, including other intangible assets |
(694 | ) | (735 | ) | (623 | ) | ||||
Net proceeds from asset sales and divestitures |
3 | 1 | 15 | |||||||
Investment in non-consolidated joint venture assets |
(17 | ) | — | — | ||||||
| | | | | | | | | | | |
Net cash used in investing activities |
(708 | ) | (734 | ) | (608 | ) | ||||
Financing Activities |
||||||||||
Change in short-term debt |
67 | 90 | — | |||||||
Proceeds from issuance of long-term debt, net of fees |
13 | 881 | 3 | |||||||
Fees paid to refinance credit facility |
— | — | (9 | ) | ||||||
Redemption of long-term debt |
(501 | ) | (340 | ) | (86 | ) | ||||
Repurchase of capital stock |
(400 | ) | (520 | ) | (268 | ) | ||||
Proceeds from exercise of stock options |
3 | 30 | 21 | |||||||
Dividends paid to noncontrolling interest |
(36 | ) | (31 | ) | (46 | ) | ||||
| | | | | | | | | | | |
Net cash (used in) provided by financing activities |
(854 | ) | 110 | (385 | ) | |||||
Effect of exchange rate changes on cash |
(80 | ) | 4 | 19 | ||||||
Change in cash held-for-sale |
(10 | ) | — | — | ||||||
| | | | | | | | | | | |
(Decrease) increase in cash and cash equivalents |
(698 | ) | 506 | (18 | ) | |||||
Cash and cash equivalents at beginning of period |
1,729 | 1,223 | 1,241 | |||||||
| | | | | | | | | | | |
Cash and cash equivalents at end of period |
$ | 1,031 | $ | 1,729 | $ | 1,223 | ||||
| | | | | | | | | | | |
| | | | | | | | | | | |
| | | | | | | | | | | |
Supplemental Cash Flow Information: |
||||||||||
Interest paid |
$ | 105 | $ | 112 | $ | 106 | ||||
Income tax paid—net |
$ | 184 | $ | 157 | $ | 197 | ||||
See accompanying notes to consolidated financial statements.
55
TRW Automotive Holdings Corp.
Consolidated Statements of Stockholders' Equity
| |
TRW Stockholders' Equity | |
|
|||||||||||||||||||
|---|---|---|---|---|---|---|---|---|---|---|---|---|---|---|---|---|---|---|---|---|---|---|
| |
Number of Shares |
Capital Stock and Paid-in-Capital |
Retained Earnings |
Accumulated Other Comprehensive Earnings (Losses) |
Total TRW Stockholders' Equity |
Non- controlling Interest |
Total Equity |
|||||||||||||||
| |
(In millions, except share data) |
|||||||||||||||||||||
Balance at December 31, 2011 |
123,751,455 | $ | 1,603 | $ | 1,668 | $ | (331 | ) | $ | 2,940 | $ | 199 | $ | 3,139 | ||||||||
Net earnings |
— | — | 1,008 | — | 1,008 | 33 | 1,041 | |||||||||||||||
Other comprehensive (loss) income |
— | — | — | (135 | ) | (135 | ) | 5 | (130 | ) | ||||||||||||
Dividends paid |
— | — | — | — | — | (46 | ) | (46 | ) | |||||||||||||
Share-based compensation activity |
||||||||||||||||||||||
Sale of common stock under stock option plans |
887,392 | 21 | — | — | 21 | — | 21 | |||||||||||||||
Issuance of common stock upon vesting of restricted stock units and exercise of stock-settled stock appreciation rights |
345,691 | (10 | ) | — | — | (10 | ) | — | (10 | ) | ||||||||||||
Share-based compensation expense |
— | 21 | — | — | 21 | — | 21 | |||||||||||||||
Excess tax benefits on share-based compensation |
— | 1 | — | — | 1 | — | 1 | |||||||||||||||
Repurchase of common stock |
(5,612,491 | ) | — | (268 | ) | — | (268 | ) | — | (268 | ) | |||||||||||
| | | | | | | | | | | | | | | | | | | | | | | |
Balance at December 31, 2012 |
119,372,047 | 1,636 | 2,408 | (466 | ) | 3,578 | 191 | 3,769 | ||||||||||||||
Net earnings |
— | — | 970 | — | 970 | 37 | 1,007 | |||||||||||||||
Other comprehensive income |
— | — | — | 86 | 86 | 5 | 91 | |||||||||||||||
Dividends paid |
— | — | — | — | — | (31 | ) | (31 | ) | |||||||||||||
Share-based compensation activity |
||||||||||||||||||||||
Sale of common stock under stock option plans |
1,269,207 | 30 | — | — | 30 | — | 30 | |||||||||||||||
Issuance of common stock upon vesting of restricted stock units and exercise of stock-settled stock appreciation rights |
324,947 | (13 | ) | — | — | (13 | ) | — | (13 | ) | ||||||||||||
Share-based compensation expense |
— | 36 | — | — | 36 | — | 36 | |||||||||||||||
Excess tax benefits on share-based compensation |
— | 1 | — | — | 1 | — | 1 | |||||||||||||||
Repurchase of common stock |
(7,547,751 | ) | — | (520 | ) | — | (520 | ) | — | (520 | ) | |||||||||||
Conversion of 3.5% exchangeable notes |
880,350 | 26 | — | — | 26 | — | 26 | |||||||||||||||
| | | | | | | | | | | | | | | | | | | | | | | |
Balance at December 31, 2013 |
114,298,800 | 1,716 | 2,858 | (380 | ) | 4,194 | 202 | 4,396 | ||||||||||||||
Net earnings |
— | — | 293 | — | 293 | 41 | 334 | |||||||||||||||
Other comprehensive loss |
— | — | — | (359 | ) | (359 | ) | (11 | ) | (370 | ) | |||||||||||
Dividends paid |
— | — | — | — | — | (36 | ) | (36 | ) | |||||||||||||
Share-based compensation activity |
||||||||||||||||||||||
Sale of common stock under stock option plans |
219,934 | 3 | — | — | 3 | — | 3 | |||||||||||||||
Issuance of common stock upon vesting of restricted stock units and exercise of stock-settled stock appreciation rights |
632,467 | (44 | ) | — | — | (44 | ) | — | (44 | ) | ||||||||||||
Share-based compensation expense |
— | 36 | — | — | 36 | — | 36 | |||||||||||||||
Excess tax benefits on share-based compensation |
— | 2 | — | — | 2 | — | 2 | |||||||||||||||
Repurchase of common stock |
(4,541,201 | ) | — | (400 | ) | — | (400 | ) | — | (400 | ) | |||||||||||
Conversion of 3.5% exchangeable notes |
3,937,079 | 117 | — | — | 117 | — | 117 | |||||||||||||||
| | | | | | | | | | | | | | | | | | | | | | | |
Balance at December 31, 2014 |
114,547,079 | $ | 1,830 | $ | 2,751 | $ | (739 | ) | $ | 3,842 | $ | 196 | $ | 4,038 | ||||||||
| | | | | | | | | | | | | | | | | | | | | | | |
| | | | | | | | | | | | | | | | | | | | | | | |
| | | | | | | | | | | | | | | | | | | | | | | |
See accompanying notes to consolidated financial statements.
56
TRW Automotive Holdings Corp.
Notes to Consolidated Financial Statements
1. Description of Business
TRW Automotive Holdings Corp. (together with its subsidiaries, referred to herein as the "Company") is among the world's largest and most diversified suppliers of automotive systems, modules and components to global automotive original equipment manufacturers ("OEMs") and related aftermarkets. The Company conducts substantially all of its operations through subsidiaries. These operations primarily encompass the design, manufacture and sale of active and passive safety related products and systems. Active safety related products and systems principally refer to vehicle dynamic controls (primarily braking and steering), and passive safety related products and systems principally refer to occupant restraints (primarily airbags and seat belts) and safety electronics (primarily electronic control units and crash and occupant weight sensors). The Company is primarily a "Tier 1" supplier (a supplier that sells to OEMs). In 2014, approximately 82% of the Company's end-customer sales were to major OEMs.
2. Merger
On September 15, 2014, the Company entered into an Agreement and Plan of Merger (the "Merger Agreement") with ZF Friedrichshafen AG, a stock corporation organized and existing under the laws of the Federal Republic of Germany ("ZF"), and MSNA, Inc., a Delaware corporation ("Merger Sub") and a wholly owned subsidiary of ZF held directly by ZF North America, Inc. ("ZNA"), pursuant to which Merger Sub will be merged with and into the Company (the "ZF Merger") with the Company surviving the ZF Merger as an indirect wholly owned subsidiary of ZF. At a special stockholders meeting held on November 19, 2014, the Company's stockholders adopted the Merger Agreement.
At the effective time of the ZF Merger, each share of the Company's common stock issued and outstanding (other than any shares of Company common stock held by ZF, ZNA, Merger Sub or any other wholly owned subsidiary of ZF, treasury shares held by the Company and shares owned by stockholders who have properly made and not withdrawn a demand for appraisal rights under Delaware law) will be converted into the right to receive $105.60 in cash, without interest (the "Merger Consideration"). In addition, at the effective time of the ZF Merger, (i) all then-outstanding Company stock options, restricted stock units ("RSUs"), phantom stock units ("PSUs") and performance share units ("Performance Units," which will vest at the "maximum level" of performance), whether vested or unvested, will be converted into the right to receive the Merger Consideration, less the exercise price of such awards, if any, and (ii) all then-outstanding Company stock-settled stock appreciation rights ("SSARs"), whether vested or unvested, will be converted into the right to receive an amount in cash equal to the excess of the lesser of the Merger Consideration and the "maximum value" of such stock appreciation right over the fair market value per share at the relevant grant date. The consummation of the ZF Merger is subject to the receipt of antitrust approvals in the United States and certain other jurisdictions and other customary closing conditions. The transaction is expected to close in the first half of 2015. If completed, the ZF Merger will result in the Company becoming a wholly owned subsidiary of ZF and its shares will no longer be listed on any public market.
3. Basis of Presentation and Summary of Significant Accounting Policies
Basis of Presentation
The consolidated financial statements are prepared in accordance with United States generally accepted accounting principles ("GAAP").
57
TRW Automotive Holdings Corp.
Notes to Consolidated Financial Statements (Continued)
3. Basis of Presentation and Summary of Significant Accounting Policies (Continued)
Summary of Significant Accounting Policies
Principles of Consolidation. The consolidated financial statements reflect the financial position and operating results of the Company, including wholly owned subsidiaries and investees that the Company controls. Investments in entities that the Company does not control, but has the ability to exercise significant influence over operating and financial policies, are accounted for under the equity method. Investments in entities in which the Company does not have the ability to exercise significant influence are accounted for under the cost method. Noncontrolling interests in consolidated subsidiaries in the consolidated balance sheets represent minority stockholders' proportionate share of the equity in such subsidiaries. All intercompany transactions and balances are eliminated in consolidation.
Use of Estimates. The preparation of financial statements in conformity with GAAP requires management to make estimates and assumptions that affect the reported amounts of assets and liabilities, disclosures of contingent assets and liabilities and reported amounts of revenues and expenses in the consolidated statements of earnings. Considerable judgment is often involved in making these determinations; the use of different assumptions could result in significantly different results. Management believes its assumptions and estimates are reasonable and appropriate. However, actual results could differ from those estimates.
Foreign Currency. The financial statements of foreign subsidiaries are translated to U.S. dollars at end-of-period exchange rates for assets and liabilities and at an average exchange rate for each period for revenues and expenses. Translation adjustments for those subsidiaries whose local currency is their functional currency are recorded as a component of accumulated other comprehensive earnings (losses) in stockholders' equity. Transaction gains and losses arising from fluctuations in foreign currency exchange rates on transactions denominated in currencies other than the functional currency are recognized in earnings as incurred, except for those transactions which hedge purchase commitments and for those intercompany balances which are designated as being of a long-term investment nature.
Revenue Recognition. Sales are recognized when there is persuasive evidence of a sales agreement, the delivery of goods has occurred, the sales price is fixed or determinable and collection of related billings is reasonably assured. Sales are recorded upon shipment of product to customers and transfer of title and risk of loss under standard commercial terms (typically F.O.B. shipping point). In those limited instances where other terms are negotiated and agreed, revenue is recorded when title and risk of loss are transferred to the customer.
Earnings per Share. Basic earnings per share are calculated by dividing net earnings by the weighted average shares outstanding during the period. Diluted earnings per share reflect the weighted average impact of all potentially dilutive securities from the date of issuance, including stock options, RSUs, SSARs and Performance Units. Further, if the inclusion of shares potentially issuable for the Company's 3.50% exchangeable senior unsecured notes (see Note 13) is more dilutive than the inclusion of the interest expense for those exchangeable notes, the Company utilizes the "if-converted" method to calculate diluted earnings per share. Under the if-converted method, the Company adjusts net earnings to add back interest expense and amortization of the discount recognized on the exchangeable notes and includes the number of shares potentially issuable related to the exchangeable notes in the weighted average shares outstanding.
58
TRW Automotive Holdings Corp.
Notes to Consolidated Financial Statements (Continued)
3. Basis of Presentation and Summary of Significant Accounting Policies (Continued)
If the average market price of the Company's common stock exceeds the exercise price of stock options outstanding or the grant date fair market value per share of the Company's stock for SSARs, the treasury stock method is used to determine the incremental number of shares to be included in the diluted earnings per share computation.
Net earnings attributable to TRW and the weighted average shares outstanding used in calculating basic and diluted earnings per share were:
| |
Years Ended December 31, | |||||||||
|---|---|---|---|---|---|---|---|---|---|---|
| |
2014 | 2013 | 2012 | |||||||
| |
(In millions, except per share amounts) |
|||||||||
Net earnings attributable to TRW |
$ | 293 | $ | 970 | $ | 1,008 | ||||
Interest expense on exchangeable notes, net of tax |
3 | 4 | 4 | |||||||
Amortization of discount on exchangeable notes, net of tax |
4 | 4 | 4 | |||||||
| | | | | | | | | | | |
Net earnings attributable to TRW for purposes of calculating diluted earnings per share |
$ | 300 | $ | 978 | $ | 1,016 | ||||
| | | | | | | | | | | |
| | | | | | | | | | | |
| | | | | | | | | | | |
Basic: |
||||||||||
Weighted average shares outstanding |
111.7 | 117.6 | 122.4 | |||||||
| | | | | | | | | | | |
| | | | | | | | | | | |
| | | | | | | | | | | |
Basic earnings per share |
$ | 2.62 | $ | 8.25 | $ | 8.24 | ||||
| | | | | | | | | | | |
| | | | | | | | | | | |
| | | | | | | | | | | |
Diluted: |
||||||||||
Weighted average shares outstanding |
111.7 | 117.6 | 122.4 | |||||||
Effect of dilutive stock options, RSUs and SSARs |
1.6 | 1.3 | 1.4 | |||||||
Shares applicable to exchangeable notes |
4.7 | 5.7 | 5.9 | |||||||
| | | | | | | | | | | |
Diluted weighted average shares outstanding |
118.0 | 124.6 | 129.7 | |||||||
| | | | | | | | | | | |
| | | | | | | | | | | |
| | | | | | | | | | | |
Diluted earnings per share |
$ | 2.54 | $ | 7.85 | $ | 7.83 | ||||
| | | | | | | | | | | |
| | | | | | | | | | | |
| | | | | | | | | | | |
For the years ended December 31, 2014, 2013 and 2012, the number of securities excluded from the calculation of diluted earnings per share because the inclusion of such securities in the calculation would have been anti-dilutive was approximately 0.4 million, 0.8 million, and 2.1 million, respectively.
Cash and Cash Equivalents. Cash and cash equivalents include all highly liquid investments with remaining maturity dates of three months or less at time of purchase.
Accounts Receivable. Receivables are stated at amounts estimated by management to be the net realizable value. An allowance for doubtful accounts is recorded when it is probable amounts will not be collected based on specific identification of customer circumstances or age of the receivable. The allowance for doubtful accounts was $26 million and $29 million as of December 31, 2014 and 2013, respectively. Accounts receivable are written off when it becomes apparent such amounts will not be collected. Collateral is not typically required, nor is interest charged on accounts receivable balances.
Inventories. Inventories are stated at the lower of cost or market, with cost determined by the first-in, first-out (FIFO) method. Cost includes the cost of materials, direct labor, in-bound freight and the applicable share of manufacturing overhead.
59
TRW Automotive Holdings Corp.
Notes to Consolidated Financial Statements (Continued)
3. Basis of Presentation and Summary of Significant Accounting Policies (Continued)
Property, Plant and Equipment. Property, plant and equipment are stated at cost less accumulated depreciation. Generally, estimated useful lives are as follows:
| |
Estimated Useful Lives |
|
|---|---|---|
Buildings |
30 to 40 years | |
Machinery and equipment |
5 to 10 years | |
Computers and capitalized software |
3 to 5 years |
Depreciation is computed over the assets' estimated useful lives, using the straight-line method for the majority of depreciable assets. Amortization expense for assets held under capital leases is included in depreciation expense.
Product Tooling. Product tooling is tooling that is limited to the manufacture of a specific part or parts of the same basic design. Product tooling includes dies, patterns, molds and jigs. Customer-owned tooling for which reimbursement was contractually guaranteed by the customer is classified in other assets on the consolidated balance sheets. When contractually guaranteed charges are approved for billing to the customer, such charges are reclassified into accounts receivable. Tooling owned by the Company is capitalized as property, plant and equipment, and amortized as cost of sales over its estimated economic life, not to exceed five years.
Pre-production Costs. Pre-production engineering and research and development costs for which the customer does not contractually guarantee reimbursement are expensed as incurred.
Goodwill and Other Intangible Assets. The Company performs either a quantitative or qualitative assessment of goodwill for impairment on an annual basis or more frequently if an event occurs or circumstances indicate the carrying amount may be impaired. Goodwill impairment testing is performed at the reporting unit level. To quantitatively test goodwill for impairment, the fair value of each reporting unit is determined and compared to the carrying value. If the carrying value exceeds the fair value, then impairment may exist and further evaluation is required. The qualitative assessment considers several factors at the reporting unit level including the excess of fair value over carrying value as of the last quantitative impairment test, the length of time since the last fair value measurement, the current carrying value, market and industry metrics, actual performance compared to forecasted performance, and our current outlook on the business. If the qualitative assessment indicates it is more likely than not that goodwill is impaired, the reporting unit is quantitatively tested for impairment.
Other indefinite-lived intangible assets are subject to impairment analysis annually. Indefinite-lived intangible assets are tested for impairment by comparing the fair value to the carrying value. If the carrying value exceeds the fair value, the asset is adjusted to fair value. Definite-lived intangible assets are amortized over their estimated useful lives, and tested for impairment in accordance with the methodology discussed in "Asset Impairment Losses."
Asset Impairment Losses. Asset impairment losses are recorded on long-lived assets and definite-lived intangible assets when events and circumstances indicate that such assets may be impaired and the projected undiscounted net cash flows to be generated by those assets are less than their carrying amounts. If estimated future undiscounted cash flows are not sufficient to recover the carrying value of the assets, the assets are adjusted to their fair values. Fair value is determined using appraisals or discounted cash flow calculations.
60
TRW Automotive Holdings Corp.
Notes to Consolidated Financial Statements (Continued)
3. Basis of Presentation and Summary of Significant Accounting Policies (Continued)
Environmental Costs. Costs related to environmental assessments and remediation efforts at current operating facilities, previously owned or operated facilities, and U.S. Environmental Protection Agency Superfund or other waste site locations are accrued when it is probable that a liability has been incurred and the amount of that liability can be reasonably estimated. Estimated costs are recorded at undiscounted amounts, based on experience and assessments, and are regularly evaluated. The liabilities are recorded in other current liabilities and long-term liabilities in the consolidated balance sheets.
Debt Issuance Costs. The costs related to the issuance of long-term debt are deferred and amortized into interest expense over the life of each respective debt issuance. Deferred amounts associated with debt extinguished prior to maturity are expensed upon extinguishment as a loss on retirement of debt.
Warranties. Product warranty liabilities are recorded based upon management estimates including such factors as the written agreement with the customer, the length of the warranty period, the historical performance of the product and likely changes in performance of newer products and the mix and volume of products sold. Product warranty liabilities are reviewed on a regular basis and adjusted to reflect actual experience.
The following table presents the movement in the product warranty liability for the periods indicated:
| |
Years Ended December 31, |
||||||
|---|---|---|---|---|---|---|---|
| |
2014 | 2013 | |||||
| |
(Dollars in millions) |
||||||
Beginning balance |
$ | 152 | $ | 140 | |||
Current period accruals, net of changes in estimates |
53 | 58 | |||||
Liabilities held-for-sale |
(2 | ) | — | ||||
Used for purposes intended |
(40 | ) | (47 | ) | |||
Effects of foreign currency translation |
(9 | ) | 1 | ||||
| | | | | | | | |
Ending balance |
$ | 154 | $ | 152 | |||
| | | | | | | | |
| | | | | | | | |
| | | | | | | | |
Product Recall. Recall costs typically include the cost of the product being replaced, customer cost of the recall and labor to remove and replace the defective part. Recall costs are recorded based on management estimates developed utilizing actuarially established loss projections based on historical claims data. Based on this actuarial estimation methodology, the Company accrues for expected but unannounced recalls when revenues are recognized upon the shipment of product. In addition, as recalls are announced, the Company reviews the actuarial estimation methodology and makes the appropriate adjustments to the accrual, if necessary.
Research and Development. Research and development programs include research and development for commercial products. Costs for such programs are expensed as incurred. Any reimbursements received from customers are netted against such expenses. Research and development expenses were $230 million, $193 million, and $164 million for the years ended December 31, 2014, 2013, and 2012, respectively.
61
TRW Automotive Holdings Corp.
Notes to Consolidated Financial Statements (Continued)
3. Basis of Presentation and Summary of Significant Accounting Policies (Continued)
Shipping and Handling. Shipping costs include payments to third-party shippers to move products to customers. Handling costs include costs from the point the products were removed from finished goods inventory to when provided to the shipper. Shipping and handling costs are expensed as incurred as cost of sales.
Income Taxes. Deferred tax assets and liabilities are recognized for the future tax consequences attributable to differences between the financial statement carrying amounts of existing assets and liabilities and their respective tax bases and operating loss and tax credit carryforwards. Deferred tax assets and liabilities are measured using enacted tax rates expected to apply to taxable income in the years in which those temporary differences are expected to be recovered or settled. The effect on deferred tax assets and liabilities of a change in tax rates is recognized in income in the period that includes the enactment date. A valuation allowance is recognized to reduce the deferred tax assets to the amount management believes is more likely than not to be realized.
Financial Instruments. Gains or losses on derivative instruments that have been designated and qualify as hedges of the exposure to changes in the fair value of an asset or a liability, as well as the offsetting gain or loss on the hedged item, are recognized in net earnings during the period of the change in fair values. For derivative instruments that have been designated and qualify as hedges of the exposure to variability in expected future cash flows, the gain or loss on the derivative is initially reported as a component of other comprehensive earnings and reclassified to the consolidated statements of earnings when the underlying hedged transaction affects net earnings. Any gain or loss on the derivative in excess of the cumulative change in the present value of future cash flows of the hedged item is recognized in net earnings during the period of change. Derivatives not designated as hedges are adjusted to fair value through net earnings.
Share-based Compensation. The Company recognizes compensation expense related to Performance Units subject to cliff vesting and time-vested stock options, SSARs, and RSUs subject to graded vesting using the straight-line method over the applicable service period. Share-based awards that are settled in cash are subject to liability accounting. Accordingly, the fair value for such awards is calculated on a quarterly basis, and the liability is adjusted and expense is recognized, based on changes to the percentage of time vested.
62
TRW Automotive Holdings Corp.
Notes to Consolidated Financial Statements (Continued)
3. Basis of Presentation and Summary of Significant Accounting Policies (Continued)
Accumulated Other Comprehensive Earnings (Losses). The following table presents changes in accumulated other comprehensive earnings (losses) attributable to TRW by component (excluding noncontrolling interest):
| |
Foreign Currency Translation |
Retirement Obligations |
Deferred Cash Flow Hedges |
Total | |||||||||
|---|---|---|---|---|---|---|---|---|---|---|---|---|---|
| |
(Dollars in millions) |
||||||||||||
For the year ended December 31, 2014: |
|||||||||||||
Beginning balance attributable to TRW, net of tax |
$ | 41 | $ | (405 | ) | $ | (16 | ) | $ | (380 | ) | ||
Other comprehensive earnings (losses) before reclassifications, net of tax |
(266 | ) | (96 | ) | (1 | ) | (363 | ) | |||||
Amounts reclassified from accumulated other comprehensive earnings (losses), net of tax |
— | — | (a) | 4 | 4 | ||||||||
| | | | | | | | | | | | | | |
Other comprehensive earnings (losses), net of tax |
(266 | ) | (96 | ) | 3 | (359 | ) | ||||||
| | | | | | | | | | | | | | |
Ending balance attributable to TRW, net of tax |
$ | (225 | ) | $ | (501 | ) | $ | (13 | ) | $ | (739 | ) | |
| | | | | | | | | | | | | | |
| | | | | | | | | | | | | | |
| | | | | | | | | | | | | | |
For the year ended December 31, 2013: |
|||||||||||||
Beginning balance attributable to TRW, net of tax |
$ | 83 | $ | (559 | ) | $ | 10 | $ | (466 | ) | |||
Other comprehensive earnings (losses) before reclassifications, net of tax |
(42 | ) | 134 | (25 | ) | 67 | |||||||
Amounts reclassified from accumulated other comprehensive earnings (losses), net of tax |
— | 20 | (b) | (1 | ) | 19 | |||||||
| | | | | | | | | | | | | | |
Other comprehensive earnings (losses), net of tax |
(42 | ) | 154 | (26 | ) | 86 | |||||||
| | | | | | | | | | | | | | |
Ending balance attributable to TRW, net of tax |
$ | 41 | $ | (405 | ) | $ | (16 | ) | $ | (380 | ) | ||
| | | | | | | | | | | | | | |
| | | | | | | | | | | | | | |
| | | | | | | | | | | | | | |
- (a)
- Includes
actuarial gains of $12 million, reduced by prior service cost of $12 million, net of de minimis tax.
- (b)
- Includes actuarial gains of $46 million, reduced by prior service cost of $17 million, net of tax of $9 million.
Recently Adopted or Issued Accounting Pronouncements. In April 2014, the Financial Accounting Standards Board ("FASB") issued Accounting Standards Update ("ASU") No. 2014-08, "Presentation of Financial Statements (Topic 205) and Property, Plant, and Equipment (Topic 360): Reporting Discontinued Operations and Disclosures of Disposals of Components of an Entity," which changes the criteria for determining which disposals can be presented as discontinued operations and modifies related disclosure requirements. Under the new guidance, discontinued operations and assets held for sale represent a strategic shift that has or will have a major effect on an entity's operations and financial results. The Company adopted this guidance during the second quarter of 2014 and applied it prospectively to new disposals and new classifications of disposal groups as held for sale. The adoption of this guidance had no impact on the Company's financial statements.
In May 2014, the FASB issued ASU No. 2014-09, "Revenue from Contracts with Customers (Topic 606)," which provides a single revenue recognition model intended to improve comparability over a range of industries, companies and geographical boundaries and is intended to enhance disclosures. The standard is effective retrospectively for fiscal years (and interim reporting periods
63
TRW Automotive Holdings Corp.
Notes to Consolidated Financial Statements (Continued)
3. Basis of Presentation and Summary of Significant Accounting Policies (Continued)
within those years) beginning after December 15, 2016. Early adoption is not permitted. The Company continues to assess the potential impact on its operations and financial statements.
4. Assets Held-For-Sale
On September 10, 2014, the Company entered into a definitive agreement to divest its engine valve business for a purchase price of $385 million in cash, which is subject to adjustment in accordance with the agreement. On February 6, 2015, the Company closed the sale of its wholly-owned engine valve subsidiaries which represented the material portion of the business to be divested. The closing did not include the transfer of several of the Company's joint ventures involved in the business. The engine valve business is reported within the Automotive Components segment (see Note 20).
This divestiture qualified for held-for-sale accounting treatment, and as such, the assets and liabilities associated with the transaction are separately classified as held-for-sale in the consolidated balance sheet as of December 31, 2014 and depreciation of long-lived assets has ceased. The divestiture did not meet the criteria for presentation as a discontinued operation.
The major classes of assets and liabilities held-for-sale were as follows:
| |
As of December 31, 2014 |
|||
|---|---|---|---|---|
| |
(Dollars in millions) |
|||
Cash |
$ | 10 | ||
Accounts receivable—net |
23 | |||
Inventories |
44 | |||
Prepaid expenses and other current assets |
6 | |||
Property, plant and equipment—net |
158 | |||
Other assets |
11 | |||
| | | | | |
Total assets held-for-sale |
$ | 252 | ||
| | | | | |
| | | | | |
| | | | | |
Trade accounts payable |
$ | 24 | ||
Accrued compensation |
15 | |||
Other current liabilities |
24 | |||
Pension and defined contribution benefits |
41 | |||
| | | | | |
Total liabilities related to assets held-for-sale |
$ | 104 | ||
| | | | | |
| | | | | |
| | | | | |
Earnings before income taxes for the engine valve business were as follows:
| |
Years Ended December 31, | |||||||||
|---|---|---|---|---|---|---|---|---|---|---|
| |
2014 | 2013 | 2012 | |||||||
| |
(Dollars in millions) |
|||||||||
Earnings before income taxes |
$ | 47 | $ | 39 | $ | 42 | ||||
Less: Earnings attributable to noncontrolling interest |
4 | 5 | 3 | |||||||
| | | | | | | | | | | |
Earnings before income taxes attributable to TRW |
$ | 43 | $ | 34 | $ | 39 | ||||
| | | | | | | | | | | |
| | | | | | | | | | | |
| | | | | | | | | | | |
64
TRW Automotive Holdings Corp.
Notes to Consolidated Financial Statements (Continued)
5. Inventories
The major classes of inventory are as follows:
| |
As of December 31, |
||||||
|---|---|---|---|---|---|---|---|
| |
2014 | 2013 | |||||
| |
(Dollars in millions) |
||||||
Finished products and work in process |
$ | 470 | $ | 499 | |||
Raw materials and supplies |
502 | 520 | |||||
| | | | | | | | |
Total inventories |
$ | 972 | $ | 1,019 | |||
| | | | | | | | |
| | | | | | | | |
| | | | | | | | |
6. Investment in Joint Venture Affiliate
During 2014, the Company made equity and working capital contributions of $17 million in a newly-formed joint venture of which the Company owns a 30% share. This joint venture will construct and operate a casting foundry in order to supply castings to the Company's North American Braking operations through a long-term supply arrangement, which is deemed to contain an embedded lease arrangement. For accounting purposes only, the Company is deemed to be the owner of the casting foundry during the construction period. Therefore, the Company recorded $46 million as construction-in-process and $32 million in long-term liabilities. The liability does not represent a legal obligation to pay cash.
7. Property, Plant and Equipment
The major classes of property, plant and equipment are as follows:
| |
As of December 31, | ||||||
|---|---|---|---|---|---|---|---|
| |
2014 | 2013 | |||||
| |
(Dollars in millions) |
||||||
Property, plant and equipment: |
|||||||
Land and improvements |
$ | 174 | $ | 213 | |||
Buildings |
752 | 831 | |||||
Machinery and equipment |
5,682 | 5,985 | |||||
Computers and capitalized software |
102 | 109 | |||||
| | | | | | | | |
|
6,710 | 7,138 | |||||
Accumulated depreciation and amortization: |
|||||||
Land and improvements |
(27 | ) | (33 | ) | |||
Buildings |
(377 | ) | (416 | ) | |||
Machinery and equipment |
(3,583 | ) | (3,879 | ) | |||
Computers and capitalized software |
(78 | ) | (92 | ) | |||
| | | | | | | | |
|
(4,065 | ) | (4,420 | ) | |||
| | | | | | | | |
Total property, plant and equipment—net |
$ | 2,645 | $ | 2,718 | |||
| | | | | | | | |
| | | | | | | | |
| | | | | | | | |
Depreciation expense was $440 million, $416 million, and $397 million for the years ended December 31, 2014, 2013 and 2012, respectively.
65
TRW Automotive Holdings Corp.
Notes to Consolidated Financial Statements (Continued)
8. Goodwill and Intangible Assets
Goodwill
The changes in goodwill are as follows:
| |
Chassis Systems Segment |
Occupant Safety Systems Segment |
Electronics Segment |
Automotive Components Segment |
Total | |||||||||||
|---|---|---|---|---|---|---|---|---|---|---|---|---|---|---|---|---|
| |
(Dollars in millions) |
|||||||||||||||
Balance as of December 31, 2012 |
$ | 796 | $ | 537 | $ | 423 | $ | — | $ | 1,756 | ||||||
Allocation of goodwill due to change in segment reporting |
275 | — | (275 | ) | — | — | ||||||||||
Effects of foreign currency translation |
— | 4 | — | — | 4 | |||||||||||
| | | | | | | | | | | | | | | | | |
Balance as of December 31, 2013 |
1,071 | 541 | 148 | — | 1,760 | |||||||||||
Effects of foreign currency translation |
(1 | ) | (10 | ) | — | — | (11 | ) | ||||||||
| | | | | | | | | | | | | | | | | |
Balance as of December 31, 2014 |
$ | 1,070 | $ | 531 | $ | 148 | $ | — | $ | 1,749 | ||||||
| | | | | | | | | | | | | | | | | |
| | | | | | | | | | | | | | | | | |
| | | | | | | | | | | | | | | | | |
Annual Assessment. The Company performed its annual assessment of goodwill for its Chassis Systems, Occupant Safety Systems and Electronics segments as of October 31, 2014, 2013 and 2012. In 2014 and 2012, the Company performed a qualitative assessment of goodwill, and concluded that it is more likely than not that each reporting unit's fair value exceeded its carrying value, thus further impairment testing was not necessary. In 2013, the Company performed a quantitative impairment analysis of goodwill, which indicated that the estimated fair value of each reporting unit substantially exceeded its corresponding carrying amount, and as such, no reporting unit was at risk for impairment.
Intangible assets
The following table reflects intangible assets and related accumulated amortization:
| |
As of December 31, | ||||||||||||||||||
|---|---|---|---|---|---|---|---|---|---|---|---|---|---|---|---|---|---|---|---|
| |
2014 | 2013 | |||||||||||||||||
| |
Gross Carrying Amount |
Accumulated Amortization |
Net Carrying Amount |
Gross Carrying Amount |
Accumulated Amortization |
Net Carrying Amount |
|||||||||||||
| |
(Dollars in millions) |
||||||||||||||||||
Definite-lived intangible assets: |
|||||||||||||||||||
Customer relationships |
$ | 67 | $ | (67 | ) | $ | — | $ | 67 | $ | (67 | ) | $ | — | |||||
Developed technology and other intangible assets |
120 | (93 | ) | 27 | 119 | (91 | ) | 28 | |||||||||||
| | | | | | | | | | | | | | | | | | | | |
Total |
187 | $ | (160 | ) | 27 | 186 | $ | (158 | ) | 28 | |||||||||
| | | | | | | | | | | | | | | | | | | | |
| | | | | | | | | | | | | | | | | | | | |
| | | | | | | | | | | | | | | | | | | | |
Indefinite-lived intangible assets: |
|||||||||||||||||||
Trademarks |
264 | 264 | 264 | 264 | |||||||||||||||
| | | | | | | | | | | | | | | | | | | | |
Total |
$ | 451 | $ | 291 | $ | 450 | $ | 292 | |||||||||||
| | | | | | | | | | | | | | | | | | | | |
| | | | | | | | | | | | | | | | | | | | |
| | | | | | | | | | | | | | | | | | | | |
Amortization of intangible assets was $4 million, $14 million, and $12 million for the years ended 2014, 2013, and 2012, respectively. The Company performed its annual impairment analysis for its
66
TRW Automotive Holdings Corp.
Notes to Consolidated Financial Statements (Continued)
8. Goodwill and Intangible Assets (Continued)
indefinite-lived trademarks as of October 31, 2014, 2013 and 2012 using a quantitative assessment, and concluded that no impairment existed as of the testing dates.
Customer relationships and developed technology have been fully amortized. The weighted average amortization periods for other intangible assets subject to amortization are as follows:
| |
Weighted Average Amortization Period |
|
|---|---|---|
Other intangible assets |
9 years |
The Company expects that ongoing amortization expense for other intangibles will approximate the following:
| |
(Dollars in millions) | |||
|---|---|---|---|---|
Fiscal year 2015 |
$ | 3 | ||
Fiscal year 2016 |
1 | |||
2017 and beyond |
23 | |||
The expected amortization expense for 2017 and beyond primarily relates to land use rights.
9. Other Expense (Income)—Net
The following table provides details of other expense (income)—net:
| |
Years Ended December 31, |
|||||||||
|---|---|---|---|---|---|---|---|---|---|---|
| |
2014 | 2013 | 2012 | |||||||
| |
(Dollars in millions) |
|||||||||
Net provision for bad debts |
$ | 4 | $ | 4 | $ | (1 | ) | |||
Net gains on sales of assets and divestitures |
— | — | (6 | ) | ||||||
Foreign currency exchange losses |
8 | 17 | 2 | |||||||
Royalty and grant income |
(22 | ) | (19 | ) | (18 | ) | ||||
Miscellaneous other expense (income) |
12 | (3 | ) | (14 | ) | |||||
| | | | | | | | | | | |
Other expense (income)—net |
$ | 2 | $ | (1 | ) | $ | (37 | ) | ||
| | | | | | | | | | | |
| | | | | | | | | | | |
| | | | | | | | | | | |
67
TRW Automotive Holdings Corp.
Notes to Consolidated Financial Statements (Continued)
10. Income Taxes
Income tax expense (benefit) for each of the periods presented is as follows:
| |
Years Ended December 31, | |||||||||
|---|---|---|---|---|---|---|---|---|---|---|
| |
2014 | 2013 | 2012 | |||||||
| |
(Dollars in millions) |
|||||||||
The components of earnings before income taxes are as follows: |
||||||||||
U.S. |
$ | 195 | $ | 331 | $ | 464 | ||||
Non-U.S. |
235 | 790 | 544 | |||||||
| | | | | | | | | | | |
|
$ | 430 | $ | 1,121 | $ | 1,008 | ||||
| | | | | | | | | | | |
| | | | | | | | | | | |
| | | | | | | | | | | |
Significant components of the provision for income taxes are as follows: |
||||||||||
Current |
||||||||||
Non-U.S. |
$ | 190 | $ | 161 | $ | 169 | ||||
U.S. State and Local |
— | — | 2 | |||||||
| | | | | | | | | | | |
Total current |
190 | 161 | 171 | |||||||
Deferred |
||||||||||
U.S. Federal |
30 | (39 | ) | (98 | ) | |||||
Non-U.S. |
(127 | ) | (1 | ) | (97 | ) | ||||
U.S. State and Local |
3 | (7 | ) | (9 | ) | |||||
| | | | | | | | | | | |
Total deferred |
(94 | ) | (47 | ) | (204 | ) | ||||
| | | | | | | | | | | |
Income tax expense (benefit) |
$ | 96 | $ | 114 | $ | (33 | ) | |||
| | | | | | | | | | | |
| | | | | | | | | | | |
| | | | | | | | | | | |
The reconciliation of income taxes calculated at the U.S. federal statutory income tax rate of 35% to income tax expense (benefit) is: |
||||||||||
Income taxes at U.S. statutory rate |
$ | 150 | $ | 392 | $ | 353 | ||||
U.S. state and local income taxes net of U.S. federal tax benefit |
3 | (6 | ) | (7 | ) | |||||
Difference in income tax on foreign earnings, losses and remittances |
5 | (23 | ) | (197 | ) | |||||
Tax holidays and incentives |
(28 | ) | (32 | ) | (38 | ) | ||||
Valuation allowance |
7 | 17 | (63 | ) | ||||||
Foreign and other tax credits |
(47 | ) | (196 | ) | (82 | ) | ||||
Impact of tax legislation |
(3 | ) | (43 | ) | (9 | ) | ||||
Nondeductible expenses |
9 | 8 | 12 | |||||||
Other |
— | (3 | ) | (2 | ) | |||||
| | | | | | | | | | | |
|
$ | 96 | $ | 114 | $ | (33 | ) | |||
| | | | | | | | | | | |
| | | | | | | | | | | |
| | | | | | | | | | | |
For the year ended December 31, 2014, the reconciliation above provides for an incremental tax expense associated with foreign earnings, losses and remittances, which is substantially impacted by the net pension settlement and curtailment loss in the United Kingdom which has a statutory tax rate substantially lower than the U.S. statutory rate. Income tax expense for the year ended December 31, 2013 includes a tax benefit of approximately $196 million related to our ability to utilize U.S. foreign tax credits and various tax legislation enacted during the year. Income tax benefit for the year ended December 31, 2012 includes a tax benefit of approximately $255 million related to various tax planning and legal entity restructuring actions.
68
TRW Automotive Holdings Corp.
Notes to Consolidated Financial Statements (Continued)
10. Income Taxes (Continued)
Deferred tax assets and liabilities result from differences in the bases of assets and liabilities for tax and financial statement purposes. The approximate tax effect of each type of temporary difference and carryforward that gives rise to a significant portion of the deferred tax assets and liabilities are as follows:
| |
As of December 31, |
||||||
|---|---|---|---|---|---|---|---|
| |
2014 | 2013 | |||||
| |
(Dollars in millions) |
||||||
Deferred tax assets: |
|||||||
Pensions and postretirement benefits other than pensions |
$ | 274 | $ | 218 | |||
Inventory |
40 | 41 | |||||
Reserves and accruals |
315 | 327 | |||||
Net operating loss and credit carryforwards |
617 | 682 | |||||
Fixed assets and intangibles |
65 | 58 | |||||
Other |
73 | 69 | |||||
| | | | | | | | |
Total deferred tax assets |
1,384 | 1,395 | |||||
Valuation allowance for deferred tax assets |
(274 | ) | (295 | ) | |||
| | | | | | | | |
Net deferred tax assets |
1,110 | 1,100 | |||||
| | | | | | | | |
Deferred tax liabilities: |
|||||||
Pensions and postretirement benefits other than pensions |
(100 | ) | (200 | ) | |||
Fixed assets and intangibles |
(282 | ) | (266 | ) | |||
Undistributed earnings of foreign subsidiaries |
(104 | ) | (116 | ) | |||
Deferred gain |
(56 | ) | (59 | ) | |||
Other |
(63 | ) | (81 | ) | |||
| | | | | | | | |
Total deferred tax liabilities |
(605 | ) | (722 | ) | |||
| | | | | | | | |
Net deferred taxes |
$ | 505 | $ | 378 | |||
| | | | | | | | |
| | | | | | | | |
| | | | | | | | |
The Company has separately reflected the current deferred tax asset and the long term deferred tax assets and liabilities on the consolidated balance sheets for December 31, 2014 and 2013. However, the current deferred tax liability of $9 million as of December 31, 2014 and $17 million as of December 31, 2013 is included in other current liabilities on the consolidated balance sheets. The table above includes the applicable deferred tax assets of $2 million and deferred tax liabilities of $4 million related to the Company's engine valve business which is classified as held for sale as of December 31, 2014.
As of December 31, 2014 and 2013, the Company had deferred tax assets from domestic and foreign net operating loss and tax credit carryforwards of approximately $617 million and $682 million, respectively. Approximately $220 million of the deferred tax assets at December 31, 2014 relate to net operating loss carryforwards or tax credits that can be carried forward indefinitely with the remainder expiring between 2015 and 2034. The deferred tax asset relating to U.S. tax credit carryforwards as of December 31, 2014 is lower than the actual amount reported and expected to be reported on our U.S. tax returns by approximately $147 million. This difference is the result of tax deductions in excess of financial statement amounts for stock based compensation and tax deductible goodwill. When these
69
TRW Automotive Holdings Corp.
Notes to Consolidated Financial Statements (Continued)
10. Income Taxes (Continued)
amounts are realized, the Company will record a credit to additional paid in capital and financial statement goodwill, respectively.
The Company has provided deferred income taxes for the estimated U.S. federal income tax, foreign income tax, and applicable withholding tax effects of earnings of subsidiaries expected to be distributed to the Company. Deferred income taxes have not been provided on approximately $3.4 billion of undistributed earnings of certain foreign subsidiaries as such amounts are considered to be permanently reinvested. Determination of the amount of unrecognized deferred income tax liability relating to the remittance of such undistributed earnings is not practicable.
In determining the requirement for a valuation allowance, the historical and projected financial results of the legal entity or consolidated group recording the net deferred tax asset is considered, along with all other available positive and negative evidence. Concluding that a valuation allowance is not required is difficult when there is significant negative evidence which is objective and verifiable, such as cumulative losses in recent years. However, the three year loss position is not solely determinative and accordingly, we consider all other available positive and negative evidence in our analysis. The Company utilizes a rolling twelve quarters of pre-tax income or loss adjusted for significant permanent book to tax differences as a measure of our cumulative results in recent years. If, based upon the weight of available evidence, it is more likely than not the deferred tax assets will not be realized, a valuation allowance is recorded. Based upon this analysis, we believe it is more likely than not that the net deferred tax asset in certain foreign jurisdictions may not be realized in the future. Accordingly, we maintain a valuation allowance related to those net deferred tax assets.
During 2014, the Company recorded a net tax expense of $7 million related to increases in our global valuation allowance against net deferred tax assets, which is comprised of two items: 1) a net tax expense of $27 million resulting from net losses in certain foreign jurisdictions with no corresponding tax benefit due to increases in our valuation allowances, and 2) a net tax benefit of $20 million resulting from changes in determinations relating to the potential realization of deferred tax assets and the resulting reversal of a valuation allowance on certain deferred tax assets in Poland partially offset by the generation of a valuation allowance in Italy. During 2013, the Company recorded a net tax expense of $17 million resulting from net losses in certain foreign jurisdictions with no corresponding tax benefit due to increases in our valuation allowances. During 2012, the Company recorded a net tax benefit of $63 million related to reductions in our global valuation allowance against net deferred tax assets, which is comprised of two items: 1) a net tax expense of $37 million resulting from net losses in certain foreign jurisdictions with no corresponding tax benefit due to increases in our valuation allowances, and 2) a net tax benefit of $100 million resulting from changes in determinations relating to the potential realization of deferred tax assets and the resulting reversal of a valuation allowance on net deferred tax assets in Canada and certain other foreign subsidiaries.
At December 31, 2014, 2013, and 2012, the Company had $168 million, $176 million, and $160 million of gross unrecognized tax benefits, respectively. In addition, at December 31, 2014, 2013, and 2012 the amount of unrecognized tax benefits that, if recognized, would affect the effective tax rate was $129 million, $136 million, and $118 million, respectively. The gross unrecognized tax benefits differ from the amount that would affect the effective tax rate due to the impact of valuation allowances, and foreign country offsets relating to transfer pricing adjustments.
70
TRW Automotive Holdings Corp.
Notes to Consolidated Financial Statements (Continued)
10. Income Taxes (Continued)
A reconciliation of the beginning and ending amounts of unrecognized tax benefits is as follows:
| |
2014 | 2013 | 2012 | |||||||
|---|---|---|---|---|---|---|---|---|---|---|
| |
(Dollars in millions) |
|||||||||
Balance, January 1, |
$ | 176 | $ | 160 | $ | 148 | ||||
Additions based on tax positions related to the current year |
16 | 14 | 12 | |||||||
Additions for tax positions of prior years |
8 | 32 | 40 | |||||||
Reductions for tax positions of prior years |
(7 | ) | (28 | ) | (23 | ) | ||||
Reductions for settlements |
(7 | ) | (1 | ) | (17 | ) | ||||
Reductions due to lapse in statute of limitations |
(8 | ) | (3 | ) | (3 | ) | ||||
Change attributable to foreign currency translation |
(10 | ) | 2 | 3 | ||||||
| | | | | | | | | | | |
Balance, December 31, |
$ | 168 | $ | 176 | $ | 160 | ||||
| | | | | | | | | | | |
| | | | | | | | | | | |
| | | | | | | | | | | |
The Company operates globally but considers its more significant tax jurisdictions to include the United States, Germany, China, the Czech Republic, Poland, Spain, and the United Kingdom. Generally, the Company has years open to tax examination in significant tax jurisdictions from 2009 forward. The income tax returns of several subsidiaries in various tax jurisdictions are currently under examination. Although it is not possible to predict the timing of the conclusions of all ongoing tax audits with accuracy, it is possible that some or all of these examinations will conclude within the next 12 months. It is also reasonably possible that certain statute of limitations may expire relating to various foreign jurisdictions within the next 12 months. As such, it is possible that a change in the Company's gross unrecognized tax benefits may occur; however, it is not possible to reasonably estimate the effect this may have upon the gross unrecognized tax benefits.
The Company recognizes interest and penalties with respect to unrecognized tax benefits as a component of income tax expense. At December 31, 2014, 2013, and 2012, accrued interest and penalties related to unrecognized tax benefits was $42 million, $36 million, and $24 million, respectively. Tax expense for the years ended December 31, 2014, 2013, and 2012 includes net interest and penalties of $10 million, $12 million, and $1 million, respectively on unrecognized tax benefits.
On July 17, 2013, the United Kingdom—Finance Bill of 2013 received Royal Assent, thereby becoming law as the Finance Act of 2013 (the "2013 Act"). The 2013 Act provides for a reduction to the corporate income tax rate from 23% to 21% effective April 1, 2014, with a further reduction to 20% effective April 1, 2015. The impact of this tax legislation was a tax benefit of approximately $21 million recorded during 2013.
On January 2, 2013, the American Taxpayer Relief Act of 2012 was enacted, which retroactively reinstated and extended various tax provisions applicable to the Company, including the research and development tax credit and the look through rules for controlling foreign corporations. The impact of this tax legislation was a tax benefit of approximately $15 million recorded during 2013.
On July 17, 2012, the United Kingdom—Finance Bill of 2012 received Royal Assent, thereby becoming law as the Finance Act of 2012 (the "2012 Act"). The 2012 Act provides for a reduction to the corporate income tax rate from 25% to 24% effective April 1, 2012, with a further reduction to 23% effective April 1, 2013. The impact of this tax legislation was a tax benefit of approximately $9 million recorded during 2012.
71
TRW Automotive Holdings Corp.
Notes to Consolidated Financial Statements (Continued)
11. Retirement Benefits
Pension Plans
A significant number of employees of the Company and its subsidiaries participate in the Company's defined benefit plans or retirement/termination indemnity plans.
The following table provides a reconciliation of the changes in the plans' benefit obligation and fair value of assets for the years ended December 31, 2014 and 2013 and a statement of the funded status as of December 31, 2014 and 2013:
| |
2014 | 2013 | |||||||||||||||||
|---|---|---|---|---|---|---|---|---|---|---|---|---|---|---|---|---|---|---|---|
| |
U.S. | U.K. | Rest of World |
U.S. | U.K. | Rest of World |
|||||||||||||
| |
(Dollars in millions) |
||||||||||||||||||
Total accumulated benefit obligation at December 31, |
$ | 349 | $ | 1,460 | $ | 754 | $ | 767 | $ | 4,730 | $ | 865 | |||||||
| | | | | | | | | | | | | | | | | | | | |
| | | | | | | | | | | | | | | | | | | | |
| | | | | | | | | | | | | | | | | | | | |
Change in benefit obligation: |
|||||||||||||||||||
Benefit obligations at beginning of period |
$ | 769 | $ | 4,729 | $ | 930 | $ | 1,073 | $ | 4,730 | $ | 955 | |||||||
Service cost |
2 | — | 21 | 2 | — | 23 | |||||||||||||
Interest cost |
37 | 206 | 34 | 42 | 189 | 36 | |||||||||||||
Plan amendments |
— | 7 | 2 | — | — | 1 | |||||||||||||
Actuarial (gain) loss |
105 | 1,384 | 237 | (133 | ) | (7 | ) | (34 | ) | ||||||||||
Foreign currency exchange rate changes |
— | (321 | ) | (113 | ) | — | 95 | — | |||||||||||
Settlement/Curtailment (gain) loss |
(520 | ) | (4,283 | ) | (224 | ) | (153 | ) | — | — | |||||||||
Benefits paid |
(43 | ) | (262 | ) | (46 | ) | (62 | ) | (278 | ) | (51 | ) | |||||||
| | | | | | | | | | | | | | | | | | | | |
Benefit obligations at December 31, |
350 | 1,460 | 841 | 769 | 4,729 | 930 | |||||||||||||
| | | | | | | | | | | | | | | | | | | | |
Change in plan assets: |
|||||||||||||||||||
Fair value of plan assets at beginning of period |
695 | 5,763 | 328 | 804 | 5,552 | 303 | |||||||||||||
Actual return on plan assets, less plan expense |
82 | 1,022 | 31 | 46 | 320 | 48 | |||||||||||||
Foreign currency exchange rate changes |
— | (361 | ) | (26 | ) | — | 122 | (23 | ) | ||||||||||
Company contributions |
41 | 219 | 61 | 60 | 47 | 51 | |||||||||||||
Settlements |
(520 | ) | (4,283 | ) | (223 | ) | (153 | ) | — | — | |||||||||
Benefits paid |
(43 | ) | (262 | ) | (46 | ) | (62 | ) | (278 | ) | (51 | ) | |||||||
| | | | | | | | | | | | | | | | | | | | |
Fair value of plan assets at December 31, |
255 | 2,098 | 125 | 695 | 5,763 | 328 | |||||||||||||
| | | | | | | | | | | | | | | | | | | | |
Funded status at December 31, |
$ | (95 | ) | $ | 638 | $ | (716 | ) | $ | (74 | ) | $ | 1,034 | $ | (602 | ) | |||
| | | | | | | | | | | | | | | | | | | | |
| | | | | | | | | | | | | | | | | | | | |
| | | | | | | | | | | | | | | | | | | | |
During 2014, the Company undertook a number of actions to abate a significant portion of pension obligations in the U.S., U.K. and Canada by offering lump sum payments to certain active and former employees and entering into group annuity contracts with third party carriers to pay and administer future annuity payments related to substantially all retirees. These actions resulted in settlement charges of $117 million, $600 million and $73 million in the U.S., U.K. and Canada, respectively. A significant portion of these actions were financed with plan assets; however, additional cash contributions of $163 million and $12 million in the U.K. and Canada, respectively, were required.
During 2013 and 2012, the Company undertook a number of similar actions in respect of its U.S. defined benefit plans. Participants who accepted the offers received lump sum payments in the amount
72
TRW Automotive Holdings Corp.
Notes to Consolidated Financial Statements (Continued)
11. Retirement Benefits (Continued)
of $148 million and $298 million which were paid from plan assets in 2013 and 2012, respectively. The Company recognized settlement losses of $35 million in 2013 and $88 million in 2012.
The following table provides the amounts recognized in the consolidated balance sheets:
| |
As of December 31, | ||||||||||||||||||
|---|---|---|---|---|---|---|---|---|---|---|---|---|---|---|---|---|---|---|---|
| |
2014 | 2013 | |||||||||||||||||
| |
U.S. | U.K. | Rest of World |
U.S. | U.K. | Rest of World |
|||||||||||||
| |
(Dollars in millions) |
||||||||||||||||||
Non-current assets |
$ | 2 | $ | 638 | $ | 23 | $ | 2 | $ | 1,034 | $ | 23 | |||||||
Current liabilities |
— | — | (22 | ) | — | — | (25 | ) | |||||||||||
Liabilities held-for-sale |
— | — | (40 | ) | — | — | — | ||||||||||||
Long-term liabilities |
(97 | ) | — | (677 | ) | (76 | ) | — | (600 | ) | |||||||||
| | | | | | | | | | | | | | | | | | | | |
Net amount recognized |
$ | (95 | ) | $ | 638 | $ | (716 | ) | $ | (74 | ) | $ | 1,034 | $ | (602 | ) | |||
| | | | | | | | | | | | | | | | | | | | |
| | | | | | | | | | | | | | | | | | | | |
| | | | | | | | | | | | | | | | | | | | |
The pre-tax amounts recognized in accumulated other comprehensive earnings (losses) consist of:
| |
As of December 31, | ||||||||||||||||||
|---|---|---|---|---|---|---|---|---|---|---|---|---|---|---|---|---|---|---|---|
| |
2014 | 2013 | |||||||||||||||||
| |
U.S. | U.K. | Rest of World |
U.S. | U.K. | Rest of World |
|||||||||||||
| |
(Dollars in millions) |
||||||||||||||||||
Prior service benefit (cost) |
$ | — | $ | — | $ | (4 | ) | $ | — | $ | — | $ | (3 | ) | |||||
Net gain (loss) |
(80 | ) | (210 | ) | (300 | ) | (132 | ) | (144 | ) | (197 | ) | |||||||
| | | | | | | | | | | | | | | | | | | | |
Accumulated other comprehensive earnings (loss) |
$ | (80 | ) | $ | (210 | ) | $ | (304 | ) | $ | (132 | ) | $ | (144 | ) | $ | (200 | ) | |
| | | | | | | | | | | | | | | | | | | | |
| | | | | | | | | | | | | | | | | | | | |
| | | | | | | | | | | | | | | | | | | | |
Information for pension plans with an accumulated benefit obligation in excess of plan assets is as follows:
| |
As of December 31, | ||||||||||||
|---|---|---|---|---|---|---|---|---|---|---|---|---|---|
| |
2014 | 2013 | |||||||||||
| |
U.S. | Rest of World |
U.S. | Rest of World |
|||||||||
| |
(Dollars in millions) |
||||||||||||
Projected benefit obligation |
$ | 341 | $ | 752 | $ | 748 | $ | 636 | |||||
Accumulated benefit obligation |
339 | 665 | 746 | 572 | |||||||||
Fair value of assets |
244 | 13 | 672 | 11 | |||||||||
73
TRW Automotive Holdings Corp.
Notes to Consolidated Financial Statements (Continued)
11. Retirement Benefits (Continued)
The following table provides the components of net pension cost (income) and other amounts recognized in other comprehensive (earnings) loss for the Company's defined benefit pension plans and defined contribution plans:
| |
Years Ended December 31, | |||||||||||||||||||||||||||
|---|---|---|---|---|---|---|---|---|---|---|---|---|---|---|---|---|---|---|---|---|---|---|---|---|---|---|---|---|
| |
2014 | 2013 | 2012 | |||||||||||||||||||||||||
| |
U.S. | U.K. | Rest of World |
U.S. | U.K. | Rest of World |
U.S. | U.K. | Rest of World |
|||||||||||||||||||
| |
(Dollars in millions) |
|||||||||||||||||||||||||||
Net pension cost (income) |
||||||||||||||||||||||||||||
Defined benefit plans: |
||||||||||||||||||||||||||||
Service cost |
$ | 2 | $ | — | $ | 21 | $ | 2 | $ | — | $ | 23 | $ | 4 | $ | — | $ | 19 | ||||||||||
Interest cost |
37 | 206 | 34 | 42 | 189 | 36 | 59 | 215 | 38 | |||||||||||||||||||
Expected return on plan assets |
(49 | ) | (341 | ) | (16 | ) | (59 | ) | (315 | ) | (20 | ) | (80 | ) | (328 | ) | (20 | ) | ||||||||||
Settlement/Curtailment (gain) loss |
117 | 600 | 72 | 35 | — | — | 92 | — | 2 | |||||||||||||||||||
Amortization of prior service (benefit) cost |
— | — | 1 | — | — | 1 | 2 | — | — | |||||||||||||||||||
Amortization of net (gain) loss |
8 | — | 11 | 27 | — | 18 | 19 | — | 9 | |||||||||||||||||||
| | | | | | | | | | | | | | | | | | | | | | | | | | | | | |
Defined benefit plans |
115 | 465 | 123 | 47 | (126 | ) | 58 | 96 | (113 | ) | 48 | |||||||||||||||||
Defined contribution plans cost |
23 | 4 | 24 | 22 | 3 | 16 | 22 | 3 | 16 | |||||||||||||||||||
| | | | | | | | | | | | | | | | | | | | | | | | | | | | | |
Net pension cost (income) |
138 | 469 | 147 | 69 | (123 | ) | 74 | 118 | (110 | ) | 64 | |||||||||||||||||
| | | | | | | | | | | | | | | | | | | | | | | | | | | | | |
Other changes in plan assets and benefit obligations recognized in other comprehensive (earnings) loss |
||||||||||||||||||||||||||||
Prior service (benefit) cost |
— | 7 | 2 | — | — | (1 | ) | — | — | 1 | ||||||||||||||||||
Net (gain) loss |
72 | 703 | 223 | (120 | ) | (12 | ) | (61 | ) | 33 | 295 | 125 | ||||||||||||||||
Effect of exchange rates on amounts included in AOCI |
— | (45 | ) | (36 | ) | — | 3 | (4 | ) | — | (2 | ) | 7 | |||||||||||||||
Amortization or curtailment recognition of prior service benefit (cost) |
— | (7 | ) | (1 | ) | — | — | 1 | (2 | ) | — | (1 | ) | |||||||||||||||
Amortization or settlement recognition of net gain (loss) |
(125 | ) | (592 | ) | (84 | ) | (62 | ) | — | (19 | ) | (110 | ) | — | (11 | ) | ||||||||||||
| | | | | | | | | | | | | | | | | | | | | | | | | | | | | |
Total recognized in other comprehensive (earnings) loss |
(53 | ) | 66 | 104 | (182 | ) | (9 | ) | (84 | ) | (79 | ) | 293 | 121 | ||||||||||||||
| | | | | | | | | | | | | | | | | | | | | | | | | | | | | |
Total recognized net pension (income) cost and other comprehensive (earnings) loss |
$ | 85 | $ | 535 | $ | 251 | $ | (113 | ) | $ | (132 | ) | $ | (10 | ) | $ | 39 | $ | 183 | $ | 185 | |||||||
| | | | | | | | | | | | | | | | | | | | | | | | | | | | | |
| | | | | | | | | | | | | | | | | | | | | | | | | | | | | |
| | | | | | | | | | | | | | | | | | | | | | | | | | | | | |
74
TRW Automotive Holdings Corp.
Notes to Consolidated Financial Statements (Continued)
11. Retirement Benefits (Continued)
The estimated amounts that will be amortized from accumulated other comprehensive earnings over the next fiscal year are as follows:
| |
Year Ending December 31, 2015 |
||||||
|---|---|---|---|---|---|---|---|
| |
U.S. | Rest of World |
|||||
| |
(Dollars in millions) |
||||||
Prior service (benefit) cost |
$ | — | $ | 1 | |||
Net (gain) loss |
7 | 29 | |||||
| | | | | | | | |
Total |
$ | 7 | $ | 30 | |||
| | | | | | | | |
| | | | | | | | |
| | | | | | | | |
Plan Assumptions. The weighted-average assumptions used to determine net periodic benefit cost were:
| |
Years Ended December 31, | |||||||||||||||||||||||||||
|---|---|---|---|---|---|---|---|---|---|---|---|---|---|---|---|---|---|---|---|---|---|---|---|---|---|---|---|---|
| |
2014 | 2013 | 2012 | |||||||||||||||||||||||||
| |
U.S. | U.K. | Rest of World |
U.S. | U.K. | Rest of World |
U.S. | U.K. | Rest of World |
|||||||||||||||||||
Discount rate |
5.00 | % | 4.50 | % | 4.18 | % | 4.00 | % | 4.25 | % | 3.90 | % | 4.75 | % | 4.75 | % | 4.82 | % | ||||||||||
Expected long-term return on plan assets |
7.50 | % | 6.25 | % | 6.31 | % | 7.75 | % | 6.25 | % | 6.53 | % | 7.75 | % | 6.25 | % | 6.50 | % | ||||||||||
Rate of increase in compensation levels |
3.50 | % | N/A | 2.90 | % | 5.00 | % | N/A | 2.90 | % | 4.76 | % | N/A | 2.92 | % | |||||||||||||
To develop the expected long-term rate of return on asset assumptions, the Company considered the historical returns and the future expectations for returns for each asset class, as well as the target asset allocation of the pension portfolio. The U.K. pension plan and certain of the U.S. pension plans are closed to future benefits, therefore the rate of increase in compensation was not applicable in determining the net period benefit cost for 2014, 2013 and 2012, nor in determining the benefit obligation as of December 31, 2014 and 2013.
The weighted-average assumptions used to calculate the benefit obligations were:
| |
As of December 31, | ||||||||||||||||||
|---|---|---|---|---|---|---|---|---|---|---|---|---|---|---|---|---|---|---|---|
| |
2014 | 2013 | |||||||||||||||||
| |
U.S. | U.K. | Rest of World |
U.S. | U.K. | Rest of World |
|||||||||||||
Discount rate |
4.25 | % | 3.75 | % | 2.41 | % | 5.00 | % | 4.50 | % | 4.18 | % | |||||||
Rate of increase in compensation levels |
5.00 | % | N/A | 2.89 | % | 3.50 | % | N/A | 2.90 | % | |||||||||
Plan Assets. The U.S. and U.K. plan assets represent approximately 95% of the total plan assets of defined benefit plans. All remaining assets are deemed immaterial and not reflected below.
The goals and investment objectives of the asset strategy are to ensure that there is an adequate level of assets to meet benefit obligations to participants and retirees over the life of the participants and maintain liquidity in the plan assets sufficient to cover current benefit obligations. Risk is managed by investing in a broad range of asset classes and the use of liability matching derivative instruments.
75
TRW Automotive Holdings Corp.
Notes to Consolidated Financial Statements (Continued)
11. Retirement Benefits (Continued)
Within the asset classes, investments are made in a broad range of individual securities. There are no equity securities of the Company in the equity asset category.
The investment policies for the U.K. and U.S. pension plans are based on a low volatility and risk asset allocation that targets a sufficient level of return to meet benefit payments as they become due over the long term. The investment policy includes a significant allocation to a liability driven cash-flow matching strategy which also includes a substantial interest rate hedging program as well as an inflation hedging program in the U.K. The remaining assets are invested mainly in physical and synthetic equities (with a degree of protection from downside risk), a range of U.K., U.S. and other credit opportunities (including asset backed securities) and property to achieve a diversified real return to meet the expected future liability outflows.
As of December 31, 2014, the investment policy resulted in an asset allocation for all plans of 52% in fixed income investments, 5% in equity and structured equity investments, 4% in real estate, and 39% in cash and other investments. Equity investments include investments in large-cap and mid-cap companies and mutual funds located throughout the world. Structured equity investments include equity option "collar" structures which reduce the outright exposure to falls in the levels of underlying equity markets. Fixed income securities include government bonds, corporate bonds of companies from diversified industries, asset backed securities and collateral assets held in government bonds for structured equity holdings. Real estate includes investments in real estate and funds that invest in real estate. Cash and other investments primarily include cash held by the plan, U.K. government treasuries and certain types of derivative instruments including interest rate and inflation swaps that are utilized to manage risks associated with the assets held by the plan.
The fair values of the Company's U.S. and U.K. pension plan assets by asset category using the fair value three-level hierarchy (see Note 12) are as follows:
| |
As of December 31, | ||||||||||||||||||
|---|---|---|---|---|---|---|---|---|---|---|---|---|---|---|---|---|---|---|---|
| |
2014 | 2013 | |||||||||||||||||
| |
Level 1 | Level 2 | Level 3 | Level 1 | Level 2 | Level 3 | |||||||||||||
| |
(Dollars in millions) |
||||||||||||||||||
Cash and cash equivalents |
$ | 943 | $ | — | $ | — | $ | 656 | $ | — | $ | — | |||||||
Fixed income investments: |
|||||||||||||||||||
Corporate bonds |
— | 109 | — | — | 1,864 | — | |||||||||||||
U.K. government guaranteed bonds |
359 | — | — | 1,724 | — | — | |||||||||||||
Collateral assets for structured equity holdings |
86 | — | — | 80 | — | — | |||||||||||||
Asset backed securities |
— | 665 | — | — | 1,081 | — | |||||||||||||
Equities: |
|||||||||||||||||||
Common stock |
2 | — | — | 4 | — | — | |||||||||||||
Structured equity holdings |
— | 114 | — | — | 916 | — | |||||||||||||
Real estate |
— | 99 | — | — | 148 | — | |||||||||||||
Other |
— | (24 | ) | — | — | (15 | ) | — | |||||||||||
| | | | | | | | | | | | | | | | | | | | |
Total assets at fair value |
$ | 1,390 | $ | 963 | $ | — | $ | 2,464 | $ | 3,994 | $ | — | |||||||
| | | | | | | | | | | | | | | | | | | | |
| | | | | | | | | | | | | | | | | | | | |
| | | | | | | | | | | | | | | | | | | | |
Contributions. In 2015, the Company's minimum expected funding is $7 million for the U.K. pension plan and approximately $29 million for pension plans in the rest of the world. However, the
76
TRW Automotive Holdings Corp.
Notes to Consolidated Financial Statements (Continued)
11. Retirement Benefits (Continued)
Company may, at its discretion, make additional contributions. The Company does not expect to make any funding contributions to the U.S. plans in 2015.
Expected Future Pension Benefit Payments. The following pension benefit payments, which reflect current obligations and expected future service, as appropriate, are expected to be paid from the underlying plans to the participants:
Years Ending December 31,
|
U.S. | U.K. | Rest of World |
|||||||
|---|---|---|---|---|---|---|---|---|---|---|
| |
(Dollars in millions) |
|||||||||
2015 |
$ | 7 | $ | 29 | $ | 24 | ||||
2016 |
36 | 24 | 26 | |||||||
2017 |
10 | 26 | 28 | |||||||
2018 |
11 | 28 | 30 | |||||||
2019 |
12 | 32 | 31 | |||||||
2020 - 2024 |
76 | 225 | 183 | |||||||
Other Benefits. The Company also sponsors qualified defined contribution pension plans covering employees at certain operations and an unfunded non-qualified defined contribution plan for a select group of highly compensated employees. These plans allow participants to defer compensation, and generally provide employer matching contributions.
Postretirement Benefits Other Than Pensions ("OPEB")
The Company provides health care and life insurance benefits for a substantial number of its retired employees in the United States and Canada, and for certain future retirees. The health care plans provide for the sharing of costs, in the form of retiree contributions, deductibles and coinsurance. Life insurance benefits are generally noncontributory. The Company's policy is to fund the cost of postretirement health care and life insurance benefits as those benefits become payable.
77
TRW Automotive Holdings Corp.
Notes to Consolidated Financial Statements (Continued)
11. Retirement Benefits (Continued)
The following table provides a reconciliation of the changes in the plans' benefit obligation and fair value of assets during the years ended December 31, 2014 and December 31, 2013, and a statement of the funded status of the programs as of December 31, 2014 and 2013:
| |
2014 | 2013 | |||||||||||
|---|---|---|---|---|---|---|---|---|---|---|---|---|---|
| |
U.S. | Rest of World |
U.S. | Rest of World |
|||||||||
| |
(Dollars in millions) |
||||||||||||
Change in benefit obligation: |
|||||||||||||
Benefit obligations at beginning of period |
$ | 323 | $ | 88 | $ | 330 | $ | 103 | |||||
Service cost |
— | 1 | 1 | 1 | |||||||||
Interest cost |
15 | 4 | 14 | 4 | |||||||||
Actuarial (gain) loss |
(23 | ) | 10 | (40 | ) | (10 | ) | ||||||
Foreign currency exchange rate changes |
— | (7 | ) | — | (6 | ) | |||||||
Plan amendments |
— | — | 57 | 3 | |||||||||
Plan participant contributions |
1 | — | 1 | — | |||||||||
Benefits paid |
(28 | ) | (6 | ) | (40 | ) | (7 | ) | |||||
| | | | | | | | | | | | | | |
Benefit obligations at December 31, |
288 | 90 | 323 | 88 | |||||||||
| | | | | | | | | | | | | | |
Change in plan assets: |
|||||||||||||
Fair value of plan assets at beginning of period |
— | — | — | — | |||||||||
Company contributions |
27 | 6 | 39 | 7 | |||||||||
Plan participant contributions |
1 | — | 1 | — | |||||||||
Benefits paid |
(28 | ) | (6 | ) | (40 | ) | (7 | ) | |||||
| | | | | | | | | | | | | | |
Fair value of plan assets at December 31, |
— | — | — | — | |||||||||
| | | | | | | | | | | | | | |
Funded status at December 31, |
$ | (288 | ) | $ | (90 | ) | $ | (323 | ) | $ | (88 | ) | |
| | | | | | | | | | | | | | |
| | | | | | | | | | | | | | |
| | | | | | | | | | | | | | |
The following table provides the amounts recognized in the consolidated balance sheets:
| |
As of December 31, | ||||||||||||
|---|---|---|---|---|---|---|---|---|---|---|---|---|---|
| |
2014 | 2013 | |||||||||||
| |
U.S. | Rest of World |
U.S. | Rest of World |
|||||||||
| |
(Dollars in millions) |
||||||||||||
Current liabilities |
$ | (26 | ) | $ | (6 | ) | $ | (30 | ) | $ | (6 | ) | |
Long-term liabilities |
(262 | ) | (84 | ) | (293 | ) | (82 | ) | |||||
| | | | | | | | | | | | | | |
Total amount recognized |
$ | (288 | ) | $ | (90 | ) | $ | (323 | ) | $ | (88 | ) | |
| | | | | | | | | | | | | | |
| | | | | | | | | | | | | | |
| | | | | | | | | | | | | | |
78
TRW Automotive Holdings Corp.
Notes to Consolidated Financial Statements (Continued)
11. Retirement Benefits (Continued)
The pre-tax amounts recognized in accumulated other comprehensive earnings (losses) consist of:
| |
As of December 31, | ||||||||||||
|---|---|---|---|---|---|---|---|---|---|---|---|---|---|
| |
2014 | 2013 | |||||||||||
| |
U.S. | Rest of World |
U.S. | Rest of World |
|||||||||
| |
(Dollars in millions) |
||||||||||||
Prior service benefit (cost) |
$ | 50 | $ | 10 | $ | 58 | $ | 17 | |||||
Net gain (loss) |
19 | (7 | ) | (2 | ) | 2 | |||||||
| | | | | | | | | | | | | | |
Accumulated other comprehensive earnings (loss) |
$ | 69 | $ | 3 | $ | 56 | $ | 19 | |||||
| | | | | | | | | | | | | | |
| | | | | | | | | | | | | | |
| | | | | | | | | | | | | | |
The following table provides the components of net postretirement benefit (income) cost and other amounts recognized in other comprehensive (earnings) loss for the plans.
| |
Years Ended December 31, | ||||||||||||||||||
|---|---|---|---|---|---|---|---|---|---|---|---|---|---|---|---|---|---|---|---|
| |
2014 | 2013 | 2012 | ||||||||||||||||
| |
U.S. | Rest of World |
U.S. | Rest of World |
U.S. | Rest of World |
|||||||||||||
| |
(Dollars in millions) |
||||||||||||||||||
Net postretirement benefit (income) cost: |
|||||||||||||||||||
Service cost |
$ | — | $ | 1 | $ | 1 | $ | 1 | $ | 1 | $ | 1 | |||||||
Interest cost |
15 | 4 | 14 | 4 | 16 | 5 | |||||||||||||
Curtailment/Settlement (gain) loss |
— | — | (29 | ) | — | (36 | ) | — | |||||||||||
Amortization of prior service (benefit) cost |
(8 | ) | (5 | ) | (13 | ) | (5 | ) | (22 | ) | (7 | ) | |||||||
Amortization of net (gain) loss |
(2 | ) | — | 1 | 1 | — | 1 | ||||||||||||
| | | | | | | | | | | | | | | | | | | | |
Net postretirement benefit (income) cost |
5 | — | (26 | ) | 1 | (41 | ) | — | |||||||||||
| | | | | | | | | | | | | | | | | | | | |
Other changes in plan assets and benefit obligations recognized in other comprehensive (earnings) loss: |
|||||||||||||||||||
Prior service (benefit) cost |
— | — | 57 | 3 | — | 3 | |||||||||||||
Net (gain) loss |
(23 | ) | 10 | (40 | ) | (9 | ) | (6 | ) | (8 | ) | ||||||||
Amortization or curtailment recognition of prior service benefit (cost) |
8 | 5 | 31 | 5 | 51 | 6 | |||||||||||||
Amortization or settlement recognition of net gain (loss) |
2 | 1 | 9 | — | 6 | (1 | ) | ||||||||||||
| | | | | | | | | | | | | | | | | | | | |
Total recognized in other comprehensive (earnings) loss |
(13 | ) | 16 | 57 | (1 | ) | 51 | — | |||||||||||
| | | | | | | | | | | | | | | | | | | | |
Total recognized net postretirement benefit (income) cost and other comprehensive (earnings) loss |
$ | (8 | ) | $ | 16 | $ | 31 | $ | — | $ | 10 | $ | — | ||||||
| | | | | | | | | | | | | | | | | | | | |
| | | | | | | | | | | | | | | | | | | | |
| | | | | | | | | | | | | | | | | | | | |
Curtailments and Settlements. The Company recorded curtailment/settlement gains during the years ended December 31, 2013 and 2012 of approximately $28 million and $36 million, respectively, related to the termination of retiree medical benefits for certain salaried and hourly employees. In addition, during the year ended December 31, 2013, the Company recorded settlement gains of approximately $1 million related to retiree medical buyouts.
79
TRW Automotive Holdings Corp.
Notes to Consolidated Financial Statements (Continued)
11. Retirement Benefits (Continued)
The estimated amounts that will be amortized from accumulated other comprehensive earnings over the next fiscal year are as follows:
| |
Year Ending December 31, 2015 |
||||||
|---|---|---|---|---|---|---|---|
| |
U.S. | Rest of World |
|||||
| |
(Dollars in millions) |
||||||
Prior service (benefit) cost |
$ | (7 | ) | $ | (5 | ) | |
Net actuarial (gain) loss |
(4 | ) | — | ||||
| | | | | | | | |
Total |
$ | (11 | ) | $ | (5 | ) | |
| | | | | | | | |
| | | | | | | | |
| | | | | | | | |
Plan Assumptions. The weighted-average assumptions used to determine net postretirement benefit (income) cost were:
| |
Years Ended December 31, | ||||||||||||||||||
|---|---|---|---|---|---|---|---|---|---|---|---|---|---|---|---|---|---|---|---|
| |
2014 | 2013 | 2012 | ||||||||||||||||
| |
U.S. | Rest of World |
U.S. | Rest of World |
U.S. | Rest of World |
|||||||||||||
Discount rate |
5.00 | % | 4.75 | % | 4.00 | % | 4.00 | % | 4.75 | % | 4.50 | % | |||||||
The discount rate and assumed health care cost trend rates used in the measurement of the benefit obligation as of the applicable measurement dates were:
| |
As of December 31, | ||||||||||||
|---|---|---|---|---|---|---|---|---|---|---|---|---|---|
| |
2014 | 2013 | |||||||||||
| |
U.S. | Rest of World |
U.S. | Rest of World |
|||||||||
Discount rate |
4.00 | % | 3.75 | % | 5.00 | % | 4.75 | % | |||||
Initial health care cost trend rate at end of year |
7.00 | % | 4.50 | % | 6.90 | % | 4.00 | % | |||||
Ultimate health care cost trend rate |
4.50 | % | 5.00 | % | 5.00 | % | 5.00 | % | |||||
Year in which ultimate rate is reached |
2022 | 2017 | 2018 | 2017 | |||||||||
A one-percentage-point change in the assumed health care cost trend rate would have had the following effects:
| |
One-Percentage-Point | ||||||||||||
|---|---|---|---|---|---|---|---|---|---|---|---|---|---|
| |
Increase | Decrease | |||||||||||
| |
U.S. | Rest of World |
U.S. | Rest of World |
|||||||||
| |
(Dollars in millions) |
||||||||||||
Effect on total of service and interest cost components for the year ended December 31, 2014 |
$ | 1 | $ | — | $ | (1 | ) | $ | — | ||||
Effect on postretirement benefit obligation as of measurement date |
$ | 21 | $ | 7 | $ | (18 | ) | $ | (7 | ) | |||
80
TRW Automotive Holdings Corp.
Notes to Consolidated Financial Statements (Continued)
11. Retirement Benefits (Continued)
Contributions. The Company funds its OPEB obligations on a pay-as-you-go basis. In 2015, the Company expects to contribute approximately $32 million to its OPEB plans.
Expected Future Postretirement Benefit Payments. The following postretirement benefit payments, which reflect expected future service, as appropriate, are expected to be paid:
Years Ending December 31,
|
U.S. | Rest of World |
|||||
|---|---|---|---|---|---|---|---|
| |
(Dollars in millions) |
||||||
2015 |
$ | 27 | $ | 5 | |||
2016 |
26 | 5 | |||||
2017 |
25 | 5 | |||||
2018 |
24 | 5 | |||||
2019 |
23 | 5 | |||||
2020 - 2024 |
96 | 28 | |||||
12. Fair Value Measurements and Financial Instruments
The inputs to valuation techniques used to measure fair value are prioritized into a three-level hierarchy. This hierarchy gives the highest priority to quoted prices in active markets for identical assets and liabilities and lowest priority to unobservable inputs, as follows:
Level 1. Inputs are quoted prices (unadjusted) in active markets for identical assets or liabilities that the Company can access at the measurement date.
Level 2. Inputs are other than quoted prices that are observable for the asset or liability, either directly or indirectly.
Level 3. Unobservable inputs are supported by little or no market activity. The unobservable inputs represent the Company's best assumptions of how market participants would price the assets or liabilities.
Items Measured at Fair Value on a Recurring Basis
The fair value measurements for assets and liabilities recognized in the Company's consolidated balance sheet are as follows:
| |
As of December 31, |
|
||||||
|---|---|---|---|---|---|---|---|---|
| |
Measurement Approach |
|||||||
| |
2014 | 2013 | ||||||
| |
(Dollars in millions) |
|
||||||
Foreign currency exchange contracts—current assets |
$ | 7 | $ | 6 | Level 2 | |||
Foreign currency exchange contracts—noncurrent assets |
2 | — | Level 2 | |||||
Foreign currency exchange contracts—current liability |
13 | 5 | Level 2 | |||||
Foreign currency exchange contracts—noncurrent liability |
13 | 9 | Level 2 | |||||
The Company's foreign currency exchange contracts are recorded at fair value derived principally from or corroborated by observable market data under the market approach. Inputs include quoted
81
TRW Automotive Holdings Corp.
Notes to Consolidated Financial Statements (Continued)
12. Fair Value Measurements and Financial Instruments (Continued)
prices for similar assets and liabilities (risk adjusted), and market-corroborated inputs, such as market comparables, interest rates, yield curves and other items that allow value to be determined. The Company uses quoted currency forward rates and quoted interest rate curves, respectively, to calculate forward values, and then discounting the forward values. In addition, the Company's calculation of the fair value of its foreign currency option contracts uses quoted currency volatilities.
The discount rates for all derivative contracts are based on quoted bank deposit or swap interest rates. For contracts which, when aggregated by counterparty, are in a liability position, the rates are adjusted by the credit spread which market participants would apply if buying these contracts from the Company's counterparties.
There were no changes in the Company's valuation techniques during the year ended December 31, 2014.
Items Measured at Fair Value on a Nonrecurring Basis
In addition to items that are measured at fair value on a recurring basis, we also have assets that may be measured at fair value on a nonrecurring basis. These assets include long-lived assets, intangible assets and investments in affiliates which may be written down to fair value as a result of impairment.
The Company has determined that the fair value measurements related to each of these assets rely primarily on Company-specific inputs and the Company's assumptions about the use of the assets, as observable inputs are not available. As such, the Company has determined that each of these fair value measurements reside within Level 3 of the fair value hierarchy. To determine the fair value of long-lived assets, the Company utilizes the projected cash flows expected to be generated by the long-lived assets, then discounts the future cash flows over the useful life of the long-lived assets by using a risk-adjusted rate for the Company. The Company records asset impairments associated with its determination of the fair value of its long-lived assets that exhibited indicators of impairment (see Note 14).
Financial Instruments Not Carried at Fair Value
The carrying value and estimated fair value of financial instruments that are not carried on the Company's balance sheet at fair value are as follows:
| |
As of December 31, | |
||||||||||||
|---|---|---|---|---|---|---|---|---|---|---|---|---|---|---|
| |
2014 | 2013 | |
|||||||||||
| |
Carrying Value |
Fair Value |
Carrying Value |
Fair Value |
Measurement Approach |
|||||||||
| |
(Dollars in millions) |
|
||||||||||||
Short-term debt, fixed and floating rate |
$ | 222 | $ | 222 | $ | 159 | $ | 159 | Level 2 | |||||
Fixed rate long-term debt |
$ | 1,326 | $ | 1,389 | $ | 1,821 | $ | 1,884 | Level 2 | |||||
Fixed rate exchangeable notes |
$ | 30 | $ | 109 | $ | 134 | $ | 375 | Level 2 | |||||
The carrying value of short-term debt approximates fair value because of the short term nature of these instruments. The fair value of long-term debt was determined primarily from quoted market prices, as provided by participants in the secondary marketplace. For long-term debt without a quoted market price, the Company estimates the fair value using discounted cash flow models with market based borrowing rates for similar types of arrangements.
82
TRW Automotive Holdings Corp.
Notes to Consolidated Financial Statements (Continued)
12. Fair Value Measurements and Financial Instruments (Continued)
Derivative Instruments and Hedging Activities
The Company is exposed to fluctuations in foreign currency exchange rates, interest rates and commodity prices. The Company enters into derivative instruments primarily to hedge portions of its forecasted foreign currency denominated cash flows and designates these derivative instruments as cash flow hedges in order to qualify for hedge accounting. Certain foreign exchange contracts that do not qualify for hedge accounting are entered into hedge recognized foreign currency transactions. All gains or losses on derivative instruments which are not designated for hedge accounting treatment or do not qualify for hedge accounting, or result from hedge ineffectiveness, are reported in earnings immediately.
In addition, the Company is exposed to credit loss in the event of nonperformance by the counterparty to the derivative financial instruments. The Company attempts to limit this exposure by entering into agreements directly with a number of major financial institutions that meet the Company's credit standards and that are expected to fully satisfy their obligations under the contracts, and by monitoring the Company's credit exposure to each counterparty in light of its current credit quality.
As of December 31, 2014, the Company had a notional value of $2.6 billion in foreign exchange contracts outstanding. These foreign exchange contracts mature at various dates through December 2017. Foreign currency exposures are reviewed monthly and any natural offsets are considered prior to entering into a derivative financial instrument.
Cash Flow Hedges. For any derivative instrument that is designated and qualifies as a cash flow hedge, the effective portion of the gain or loss on the derivative is reported as a component of Other Comprehensive Income ("OCI"), and is subsequently reclassified into earnings in the period which the hedged transaction affects earnings. Gains and losses on the derivative representing either hedge ineffectiveness or hedge components excluded from the assessment of effectiveness are recognized in earnings. Such amounts were immaterial for the years ended December 31, 2014, 2013 and 2012.
For the years ended December 31, 2014, 2013 and 2012, the effective portion of gains and losses on derivatives designated as cash flow hedges and recognized in OCI was a loss of $6 million, a loss of $33 million and a gain of $80 million, respectively, which were related to foreign currency exchange contracts. The effective portion of gains and losses on cash flow hedges reclassified from OCI into the statement of earnings for the years ended December 31, 2014, 2013 and 2012 was a loss of $5 million, a gain of $1 million and a gain of $3 million, respectively, and was included in various line items on the statement of earnings. Gains and losses reclassified into earnings include the discontinuance of cash flow hedges, which were immaterial for the years ended December 31, 2014, 2013 and 2012. Approximately $3 million of losses, net of tax, which are included in OCI, are expected to be reclassified into earnings in 2015.
Fair Value Hedges. For any derivative instrument that is designated and qualifies as a fair value hedge, the gain or loss on the derivative as well as the offsetting loss or gain on the underlying hedged item is recognized in current earnings. As of December 31, 2014 and 2013, the Company had no fair value hedges outstanding.
83
TRW Automotive Holdings Corp.
Notes to Consolidated Financial Statements (Continued)
12. Fair Value Measurements and Financial Instruments (Continued)
Undesignated Derivatives. For the years ended December 31, 2014, 2013 and 2012, the Company recognized a loss of $25 million, a loss of $5 million, and a gain of $14 million, respectively, in other expense (income)—net, for derivative instruments not designated as hedging instruments.
Credit-Risk-Related Contingent Features. The Company has entered into International Swaps and Derivatives Association ("ISDA") agreements with each of its significant derivative counterparties. These agreements provide bilateral netting and offsetting of accounts that are in a liability position with those that are in an asset position. These agreements do not require the Company to maintain a minimum credit rating in order to be in compliance with the terms of the agreements and do not contain any margin call provisions or collateral requirements that could be triggered by derivative instruments in a net liability position. As of December 31, 2014, the Company had not posted any collateral to support its derivatives in a liability position.
Offsetting of Derivative Assets and Liabilities
The following table reflects the fair value of derivative assets and liabilities; the amounts consist of interest rate contracts and foreign currency exchange contracts, none of which are individually significant:
| |
As of December 31, | ||||||||||||||||||
|---|---|---|---|---|---|---|---|---|---|---|---|---|---|---|---|---|---|---|---|
| |
2014 | 2013 | |||||||||||||||||
| |
Gross Amounts Recognized |
Gross Amounts Offset |
Net Amounts Reported |
Gross Amounts Recognized |
Gross Amounts Offset |
Net Amounts Reported |
|||||||||||||
| |
(Dollars in millions) |
||||||||||||||||||
Derivative Assets: |
|||||||||||||||||||
Foreign Currency |
$ | 45 | $ | (36 | ) | $ | 9 | $ | 42 | $ | (36 | ) | $ | 6 | |||||
Derivative Liabilities: |
|||||||||||||||||||
Foreign Currency |
62 | (36 | ) | 26 | 50 | (36 | ) | 14 | |||||||||||
84
TRW Automotive Holdings Corp.
Notes to Consolidated Financial Statements (Continued)
13. Debt
Total outstanding debt of the Company consisted of the following:
| |
As of December 31, | ||||||
|---|---|---|---|---|---|---|---|
| |
2014 | 2013 | |||||
| |
(Dollars in millions) |
||||||
Short-term debt |
$ | 222 | $ | 159 | |||
| | | | | | | | |
| | | | | | | | |
| | | | | | | | |
Long-term debt: |
|||||||
6.375% Senior Notes, due 2014 |
$ | — | $ | 234 | |||
7.00% Senior Notes, due 2014 |
— | 233 | |||||
7.25% Senior Notes, due 2017 |
444 | 446 | |||||
4.50% Senior Notes, due 2021 |
400 | 400 | |||||
4.45% Senior Notes, due 2023 |
400 | 400 | |||||
Exchangeable senior notes, due 2015 |
30 | 134 | |||||
Revolving credit facility |
— | — | |||||
Capitalized leases |
14 | 18 | |||||
Other borrowings |
68 | 90 | |||||
| | | | | | | | |
Total long-term debt |
1,356 | 1,955 | |||||
Less current portion |
72 | 482 | |||||
| | | | | | | | |
Long-term debt, net of current portion |
$ | 1,284 | $ | 1,473 | |||
| | | | | | | | |
| | | | | | | | |
| | | | | | | | |
The weighted average interest rate on the Company's debt as of December 31, 2014 and 2013 was 5.4% and 5.9%, respectively. The maturities of long-term debt outstanding as of December 31, 2014 are:
Years Ended December 31,
|
(Dollars in millions) | |||
|---|---|---|---|---|
2015 |
$ | 72 | ||
2016 |
25 | |||
2017 |
448 | |||
2018 |
3 | |||
2019 |
3 | |||
Thereafter |
805 | |||
| | | | | |
Total |
$ | 1,356 | ||
| | | | | |
| | | | | |
| | | | | |
Senior Notes
4.45% Senior Notes. In November 2013, the Company issued $400 million in aggregate principal amount of 4.45% senior unsecured notes due 2023 in a private placement. Interest is payable semi-annually on December 1 and June 1 of each year.
4.50% Senior Notes. In February 2013, the Company issued $400 million in aggregate principal amount of 4.50% senior unsecured notes due 2021 in a private placement. Interest is payable semi-annually on March 1 and September 1 of each year.
85
TRW Automotive Holdings Corp.
Notes to Consolidated Financial Statements (Continued)
13. Debt (Continued)
7.25% Senior Notes. In March 2007, the Company issued $600 million in aggregate principal amount of 7.25% senior unsecured notes due 2017 in a private placement. Interest is payable semi-annually on March 15 and September 15 of each year.
6.375% Senior Notes and 7.00% Senior Notes Issued in 2007. On March 15, 2014, the 6.375% Senior Notes and 7.00% Senior Notes matured and the Company paid the principal amounts outstanding of €170 million and $233 million, respectively.
Senior Note Repurchases. During 2013 and 2012, the Company repurchased portions of its senior notes due in 2014 and 2017 totaling approximately $91 million and $48 million, respectively, in principal amount and recorded a loss on retirement of debt of $5 million in each year, including the write-off of a portion of debt issuance costs, discounts and premiums. The repurchased notes were retired upon settlement.
Exchangeable Senior Notes
In November 2009, the Company issued approximately $259 million in aggregate principal amount of 3.50% exchangeable senior unsecured notes due 2015 (the "Exchangeable Senior Notes") in a private placement. Prior to September 1, 2015, the notes are exchangeable only upon specified events or conditions being met and, thereafter, at any time. One condition was met as of December 31, 2014, and as such, the notes are exchangeable in the first quarter of 2015. They will remain exchangeable in subsequent quarters if the condition continues to be met, which occurs if the last reported sale price of the Company's common stock for at least 20 of the last 30 trading days of the immediately preceding quarter is greater than $38.415, subject to adjustment. The initial exchange rate is 33.8392 shares of the Company's common stock per $1,000 principal amount of notes. The Company's exchange obligation may be settled, at its option, in shares of its stock, cash or a combination of cash and shares of its stock. Interest is payable on June 1 and December 1 of each year. The Exchangeable Senior Notes will mature on December 1, 2015, unless earlier exchanged, repurchased by the Company at the holder's option upon a fundamental change, or optionally redeemed by the Company as provided in the indenture.
The Exchangeable Senior Notes were recorded with a debt discount which decreased debt and increased paid-in-capital in order to separate the liability and embedded equity components. The debt component will accrete up to the principal amount to effectively yield 9.0% over the term of the debt. The debt discount as of December 31, 2014 and December 31, 2013 was $1 million and $14 million, respectively. The total interest expense recognized for the years ended December 31, 2014, 2013 and 2012, was approximately $11 million, $13 million and $13 million, respectively, including $5 million, $6 million and $6 million in each respective period relating to the stated coupon rate.
Exchangeable Senior Notes—Exchanges. In 2014 and 2013 Exchangeable Senior Note holders exchanged approximately $116 million and $26 million, respectively, in principal amount of notes for 3,937,079 and 880,350 shares, respectively, of Company stock. In conjunction with the exchanges, the Company recorded a loss on retirement of debt of $7 million and $3 million, respectively, including the write-off of a portion of related debt issuance costs and debt discount, as well as a reduction of $289 million and $37 million, respectively, to paid-in-capital relating to the conversion feature of the Exchangeable Senior Notes.
86
TRW Automotive Holdings Corp.
Notes to Consolidated Financial Statements (Continued)
13. Debt (Continued)
Senior Credit Facilities
During the third quarter of 2012, the Company entered into its Eighth Amended and Restated Credit Agreement (the "Eighth Credit Agreement") with the lenders party thereto. The Eighth Credit Agreement provides for senior credit facilities consisting of (i) a revolving credit facility in the amount of $1.4 billion which matures in September 2017, subject to certain conditions described below (the "Revolving Credit Facility"), and (ii) additional availability which may be used in the future for one or more term loans or additional revolving facilities (together with the Revolving Credit Facility, the "Facilities"). All of the Facilities are undrawn. The Company paid fees and expenses totaling approximately $9 million relating to the transaction. For the year ended December 31, 2012, the Company recorded a loss on retirement of debt of $1 million related to the write-off of a portion of debt issuance costs associated with the prior credit agreement.
The Revolving Credit Facility will mature on September 28, 2017; provided that if, as of the last fiscal day of October 2016, an aggregate amount of the 7.25% Senior Notes in excess of $100 million remains outstanding and the amount of available liquidity does not exceed the aggregate amount of cash necessary to redeem the 7.25% Senior Notes by at least $500 million, then the maturity date of the Revolving Credit Facility will be 20 business days after such date.
The commitment fee and the applicable margin for borrowing on the Revolving Credit Facility are subject to a ratings-based grid. The applicable margin in effect as of December 31, 2014 was 0.25% with respect to base rate borrowings, 1.25% with respect to eurocurrency borrowings, and the commitment fee on the undrawn amounts under the Revolving Credit Facility was 0.25%.
The Company received an investment grade corporate credit rating with a stable outlook from Standard & Poor's Rating Services in the third quarter of 2013. Due to such investment grade rating, under the terms of the Revolving Credit Facility, the Company gave notice which automatically released the collateral securing the obligations under the facility. The Company may be required to reinstate the released collateral if the Company no longer has an investment grade corporate credit rating with a stable outlook from at least one of the required rating agencies.
Other Borrowings
The Company has borrowings under uncommitted credit agreements in several of the countries in which it operates. The borrowings are from various individual banks at quoted market interest rates. As of December 31, 2014, the Company had short-term borrowings under uncommitted credit facilities totaling $221 million.
Debt Repurchases
As market conditions warrant, the Company may from time to time repurchase debt securities, including exchangeable debt securities, issued by the Company or its subsidiaries, in privately negotiated or open market transactions, by tender offer, exchange offer, or by other means, or the Company may optionally redeem such debt securities.
Debt Covenants
Senior Notes. The indentures governing the 2007 Senior Notes, 4.50% Senior Notes and 4.45% Senior Notes contain covenants that impose significant restrictions on the Company's business. The
87
TRW Automotive Holdings Corp.
Notes to Consolidated Financial Statements (Continued)
13. Debt (Continued)
indentures for the 2007 Senior Notes contain covenants that could restrict, subject to a number of qualifications and limitations, the ability of TRW Automotive Inc., a wholly owned subsidiary of the Company ("TAI"), and its subsidiaries to pay certain dividends and distributions, or repurchase equity interests of the Company and certain of its subsidiaries (unless certain conditions are met). All the indentures contain covenants that, among other things, could restrict, subject to a number of qualifications and limitations, the ability of TAI and its subsidiaries to incur liens, engage in mergers or consolidations, and enter into sale and leaseback transactions. The indentures for each of the Company's outstanding notes also contain customary events of default.
Senior Credit Facilities. The Company's Eighth Credit Agreement contains various customary covenants that could restrict, subject to certain exceptions, the ability of the Company and its subsidiaries to incur additional indebtedness or issue preferred stock; repurchase or repay other indebtedness; repurchase capital stock; pay dividends; create liens on assets; make investments, loans or advances; make certain acquisitions; engage in mergers or consolidations; enter into sale and leaseback transactions; engage in certain transactions with affiliates; amend certain material agreements; and change the business conducted by the Company.
As of December 31, 2014, the Company was in compliance with all of its debt covenants.
Potential Impact of the ZF Merger. The ZF Merger, if consummated, is expected to cause a change of control triggering event as defined in the Company's respective Senior Note indentures and a fundamental change as defined in the Exchangeable Senior Note indenture. In general, upon the occurrence of a change of control triggering event under the Senior Note indentures, the Company is required to offer to repurchase the Senior Notes, for a certain period of time, at a price of 101% of par, plus accrued and unpaid interest. Upon the occurrence of a fundamental change under the Exchangeable Senior Note indenture, the Company is required to offer to repurchase the Exchangeable Senior Notes, for a certain period of time, at a price of 100% of par, plus accrued and unpaid interest. Additionally, if the ZF Merger is consummated, the Company anticipates terminating the Eighth Credit Agreement.
14. Restructuring Charges and Asset Impairments
On an ongoing basis, the Company evaluates its business and objectives to ensure that it is properly configured and sized based on changing market conditions. Accordingly, the Company implements certain restructuring initiatives, including plant rationalizations and targeted workforce reduction efforts, as it deems appropriate.
The Company's restructuring charges consist of severance, retention and outplacement services and severance-related postemployment benefits (collectively, "severance and other charges"), curtailment losses (gains) related to reductions of pension and retiree medical benefit obligations due to headcount reductions, and asset impairments related to restructuring activities.
88
TRW Automotive Holdings Corp.
Notes to Consolidated Financial Statements (Continued)
14. Restructuring Charges and Asset Impairments (Continued)
For the years ended December 31, 2014, 2013, and 2012, restructuring charges and asset impairments include the following:
| |
Chassis Systems Segment |
Occupant Safety Systems Segment |
Electronics Segment |
Automotive Components Segment |
Corporate | Total | |||||||||||||
|---|---|---|---|---|---|---|---|---|---|---|---|---|---|---|---|---|---|---|---|
| |
(Dollars in millions) |
||||||||||||||||||
For the year ended December 31, 2014: |
|||||||||||||||||||
Severance and other charges—net |
$ | 55 | $ | 7 | $ | — | $ | 4 | $ | — | $ | 66 | |||||||
Curtailment gain—net |
(1 | ) | — | — | — | — | (1 | ) | |||||||||||
Asset impairments related to restructuring activities |
12 | — | — | — | — | 12 | |||||||||||||
| | | | | | | | | | | | | | | | | | | | |
Total restructuring charges |
66 | 7 | — | 4 | — | 77 | |||||||||||||
Other asset impairments |
7 | — | — | — | — | 7 | |||||||||||||
| | | | | | | | | | | | | | | | | | | | |
Total restructuring charges and asset impairments |
$ | 73 | $ | 7 | $ | — | $ | 4 | $ | — | $ | 84 | |||||||
| | | | | | | | | | | | | | | | | | | | |
| | | | | | | | | | | | | | | | | | | | |
| | | | | | | | | | | | | | | | | | | | |
For the year ended December 31, 2013: |
|||||||||||||||||||
Severance and other charges |
$ | 22 | $ | 36 | $ | — | $ | (3 | ) | $ | 1 | $ | 56 | ||||||
Curtailment loss—net |
1 | — | — | — | — | 1 | |||||||||||||
Asset impairments related to restructuring activities |
— | 1 | — | 1 | — | 2 | |||||||||||||
| | | | | | | | | | | | | | | | | | | | |
Total restructuring charges |
23 | 37 | — | (2 | ) | 1 | 59 | ||||||||||||
Other asset impairments |
4 | — | 1 | 2 | — | 7 | |||||||||||||
| | | | | | | | | | | | | | | | | | | | |
Total restructuring charges and asset impairments |
$ | 27 | $ | 37 | $ | 1 | $ | — | $ | 1 | $ | 66 | |||||||
| | | | | | | | | | | | | | | | | | | | |
| | | | | | | | | | | | | | | | | | | | |
| | | | | | | | | | | | | | | | | | | | |
For the year ended December 31, 2012: |
|||||||||||||||||||
Severance and other charges |
$ | 64 | $ | 20 | $ | — | $ | 7 | $ | — | $ | 91 | |||||||
Asset impairments related to restructuring activities |
2 | — | — | — | — | 2 | |||||||||||||
| | | | | | | | | | | | | | | | | | | | |
Total restructuring charges |
66 | 20 | — | 7 | — | 93 | |||||||||||||
Other asset impairments |
2 | — | — | — | — | 2 | |||||||||||||
| | | | | | | | | | | | | | | | | | | | |
Total restructuring charges and asset impairments |
$ | 68 | $ | 20 | $ | — | $ | 7 | $ | — | $ | 95 | |||||||
| | | | | | | | | | | | | | | | | | | | |
| | | | | | | | | | | | | | | | | | | | |
| | | | | | | | | | | | | | | | | | | | |
During 2014, 2013, and 2012, the Company incurred restructuring charges as part of the Company's ongoing effort to better align the Company's cost structure with global automotive market
89
TRW Automotive Holdings Corp.
Notes to Consolidated Financial Statements (Continued)
14. Restructuring Charges and Asset Impairments (Continued)
conditions. Based on such conditions, primarily within the European and North American automotive market for 2014, and the European automotive market for 2013 and 2012, we incurred the following:
| |
Years Ended December 31, |
|||||||||
|---|---|---|---|---|---|---|---|---|---|---|
| |
2014 | 2013 | 2012 | |||||||
| |
(Dollars in millions) |
|||||||||
Closure or planned closure of various facilities |
$ | 54 | $ | 31 | $ | 35 | ||||
Workforce reduction initiatives |
23 | 28 | 58 | |||||||
| | | | | | | | | | | |
Total restructuring charges |
$ | 77 | $ | 59 | $ | 93 | ||||
| | | | | | | | | | | |
| | | | | | | | | | | |
| | | | | | | | | | | |
Asset impairments related to write-downs of: |
||||||||||
Machinery and equipment |
$ | 7 | $ | 6 | $ | 2 | ||||
Buildings |
— | 1 | — | |||||||
| | | | | | | | | | | |
Total asset impairments |
$ | 7 | $ | 7 | $ | 2 | ||||
| | | | | | | | | | | |
| | | | | | | | | | | |
| | | | | | | | | | | |
Restructuring Reserves
The following table illustrates the movement of the restructuring reserves for severance and other charges, including reserves related to severance-related postemployment benefits for both periods presented:
| |
Years Ended December 31, |
||||||
|---|---|---|---|---|---|---|---|
| |
2014 | 2013 | |||||
| |
(Dollars in millions) |
||||||
Beginning balance |
$ | 88 | $ | 121 | |||
Current period accruals, net of changes in estimates |
66 | 56 | |||||
Liabilities held-for-sale |
(2 | ) | — | ||||
Used for purposes intended |
(69 | ) | (95 | ) | |||
Effects of foreign currency translation and transfers |
(9 | ) | 6 | ||||
| | | | | | | | |
Ending balance |
$ | 74 | $ | 88 | |||
| | | | | | | | |
| | | | | | | | |
| | | | | | | | |
Of the $74 million restructuring reserve accrued as of December 31, 2014, approximately $70 million is expected to be paid in 2015. The remaining balance is expected to be paid in 2016 through 2017 and is comprised primarily of involuntary employee termination arrangements in Europe.
15. Lease Commitments
The Company leases certain offices, manufacturing and research buildings, machinery, automobiles and computer and other equipment. Such leases, some of which are noncancelable and in many cases include renewals, are set to expire at various dates. Rental expense for operating leases was $110 million, $111 million, and $112 million for the years ended December 31, 2014, 2013, and 2012, respectively.
90
TRW Automotive Holdings Corp.
Notes to Consolidated Financial Statements (Continued)
15. Lease Commitments (Continued)
As of December 31, 2014, the future minimum lease payments for noncancelable capital and operating leases with initial terms in excess of one year were as follows:
Years Ended December 31,
|
Capital Leases |
Operating Leases |
|||||
|---|---|---|---|---|---|---|---|
| |
(Dollars in millions) |
||||||
2015 |
$ | 3 | $ | 60 | |||
2016 |
3 | 51 | |||||
2017 |
3 | 47 | |||||
2018 |
3 | 43 | |||||
2019 |
2 | 48 | |||||
Thereafter |
3 | 54 | |||||
| | | | | | | | |
Total minimum payments required |
$ | 17 | $ | 303 | |||
| | | | | | | | |
| | | | | | | | |
| | | | | | | | |
Less amounts representing interest |
3 | ||||||
| | | | | | | | |
Present value of net minimum capital lease payments |
14 | ||||||
Less current installments |
2 | ||||||
| | | | | | | | |
Obligations under capital leases, excluding current installments |
$ | 12 | |||||
| | | | | | | | |
| | | | | | | | |
| | | | | | | | |
16. Transaction Costs
The Company incurred transaction and merger-related costs of $20 million for financial advisory and legal fees related to the ZF Merger (see Note 2) and the engine valve divestiture (see Note 4) for the year ended December 31, 2014.
17. Capital Stock
The Company's authorized capital stock consists of (i) 500 million shares of common stock, par value $.01 per share (the "Common Stock"), of which 114,547,079 shares were issued and outstanding as of December 31, 2014, net of 4,668 shares of treasury stock withheld at cost to satisfy tax obligations for a specific grant under the Company's stock-based compensation plan; and (ii) 250 million shares of preferred stock, par value $.01 per share, including 500,000 shares of Series A junior participating preferred stock, of which no shares are currently issued or outstanding.
From time to time, capital stock is issued in conjunction with the exercise of stock options and stock-settled stock appreciation rights and the vesting of restricted stock units issued as part of the Company's stock incentive plan (see Note 18).
Share Repurchase Programs. The Company has two share repurchase programs in place, consisting of a $2 billion program that extends through December 31, 2016 (the "$2 Billion Program"), and a program that is intended to offset, on an ongoing basis, the dilution created by the Company's stock incentive plan for up to 1.5 million shares in 2014 and each subsequent year (the "Anti-Dilution Program"). The Anti-Dilution program does not have an expiration date. The Company is not obligated to repurchase any shares under either program.
In the first quarter of 2014, the Company entered into an accelerated share repurchase ("ASR") agreement with a third-party financial institution to repurchase the Company's common stock. Under the ASR agreement, the Company made an up-front payment of $400 million and received an initial
91
TRW Automotive Holdings Corp.
Notes to Consolidated Financial Statements (Continued)
17. Capital Stock (Continued)
delivery of approximately 3.9 million shares in the first quarter of 2014. Upon settlement in the third quarter of 2014, the Company received approximately 0.7 million additional shares, resulting in an overall weighted average price per share of $88.08 under the ASR agreement. Of the total number of shares repurchased, 1.5 million shares were purchased under the Anti-Dilution Program and approximately 3.1 million shares were purchased under the $2 Billion Program.
Pursuant to the terms of the Merger Agreement with ZF, the Company is restricted from repurchasing additional shares of its common stock under the share repurchase programs without ZF's consent.
18. Share-Based Compensation
Equity Awards
Effective in February 2003, the Company established the TRW Automotive Holdings Corp. 2003 Stock Incentive Plan (as amended, the "2003 Plan"), under which stock options, stock appreciation rights, and restricted stock units remain outstanding. Effective in May 2012, the Company's shareholders approved the TRW Automotive Holdings Corp. 2012 Stock Incentive Plan (the "2012 Plan" and, together with the 2003 Plan, the "Plan"). The 2012 Plan permits the grant of up to 6.15 million stock options, stock appreciation rights, restricted stock units and other stock-based awards to the employees, directors or consultants of the Company or its affiliates. As a result of the shareholders' approval of the 2012 Plan, no new awards will be granted under the 2003 Plan. Further, pursuant to the terms of the Merger Agreement with ZF, the Company is restricted from issuing additional equity awards under the Plan without ZF's consent although alternate non-equity based awards may be awarded.
As of December 31, 2014, the Company had 3,379,736 shares of Common Stock available for issuance under the 2012 Plan. In addition, 214,663 stock options, 2,320,699 SSARs, 676,131 nonvested RSUs, 12,650 nonvested PSUs, and Performance Units under which up to 70,425 shares may be issued (based on maximum performance thereunder) were outstanding as of December 31, 2014. Under the terms of the respective grants, all of the SSARs and stock options have an 8-year term and vest ratably over three years, substantially all of the RSUs vest ratably over three years, a majority of the PSUs cliff vest after three years and Performance Units cliff vest after their three-year performance period. As a result of changes to retirement provisions in the equity award agreements beginning in 2013, the Company applies a non-substantive vesting period approach for certain of the awards granted in 2014 and 2013 whereby expense is accelerated for those employees who receive awards and are eligible to retire prior to the award vesting.
The significant equity award grants during 2014, 2013 and 2012 are as follows:
| |
February 21, 2014 |
February 22, 2013 |
February 23, 2012 |
||||||||||||||||
|---|---|---|---|---|---|---|---|---|---|---|---|---|---|---|---|---|---|---|---|
| |
SSARs | RSUs | SSARs | RSUs | SSARs | RSUs | |||||||||||||
Number Granted |
850,900 | 284,723 | 1,199,551 | 428,169 | 1,282,518 | 515,523 | |||||||||||||
Grant date fair market value |
$ | 82.50 | $ | 58.20 | $ | 45.11 | |||||||||||||
Maximum value |
$ | 130.00 | $ | 110.00 | $ | 95.00 | |||||||||||||
92
TRW Automotive Holdings Corp.
Notes to Consolidated Financial Statements (Continued)
18. Share-Based Compensation (Continued)
The exercise price of the SSARs and stock options is equal to the fair market value under the applicable plan of the Company common stock on the grant date. For awards granted in 2014 and 2013, the fair market value is the closing stock price. For awards granted in 2012, the fair market value is calculated as the average of the high and low stock price.
The total share-based compensation expense recognized for the Plan was as follows:
| |
Years Ended December 31, |
|||||||||
|---|---|---|---|---|---|---|---|---|---|---|
| |
2014 | 2013 | 2012 | |||||||
| |
(Dollars in millions) |
|||||||||
SSARs and stock options |
$ | 9 | $ | 10 | $ | 5 | ||||
RSUs |
24 | 26 | 16 | |||||||
Performance Units |
3 | — | — | |||||||
| | | | | | | | | | | |
Total share-based compensation expense |
$ | 36 | $ | 36 | $ | 21 | ||||
| | | | | | | | | | | |
| | | | | | | | | | | |
| | | | | | | | | | | |
The Company uses historical data to estimate SSAR and option exercise and employee termination assumptions within the Black-Scholes option pricing valuation model. The expected volatilities are primarily developed using historical data of the Company. The expected life of SSARs and options granted represents the period of time that they are expected to be outstanding. The risk free rate is based on U.S. Treasury zero-coupon yield curves with a remaining term equal to the expected SSAR and option life.
Fair value for SSARs was estimated at the date of grant using the Black-Scholes option pricing model using the following weighted-average assumptions:
| |
February 21, 2014 |
February 22, 2013 |
February 23, 2012 |
|||||||
|---|---|---|---|---|---|---|---|---|---|---|
Expected volatility |
61.1 | % | 79.3 | % | 79.3 | % | ||||
Dividend yield |
0.00 | % | 0.00 | % | 0.00 | % | ||||
Expected life |
5.0 years | 5.0 years | 5.0 years | |||||||
Risk-free rate |
1.53 | % | 0.83 | % | 0.89 | % | ||||
93
TRW Automotive Holdings Corp.
Notes to Consolidated Financial Statements (Continued)
18. Share-Based Compensation (Continued)
A summary of SSAR and stock option activity under the Plan and changes for the year ended December 31, 2014 is presented below:
| |
Thousands of Options and SSARs |
Weighted- Average Exercise Price |
Weighted- Average Remaining Contractual Term |
Aggregate Intrinsic Value |
|||||||||
|---|---|---|---|---|---|---|---|---|---|---|---|---|---|
| |
|
|
|
(Dollars in millions) |
|||||||||
Outstanding as of January 1, 2014 |
3,572 | $ | 47.88 | ||||||||||
Granted |
851 | 82.50 | |||||||||||
Exercised |
(1,786 | ) | 45.89 | ||||||||||
Forfeited or expired |
(102 | ) | 52.09 | ||||||||||
| | | | | | | | | | | | | | |
Outstanding as of December 31, 2014 |
2,535 | 60.73 | 6.0 | $ | 104 | ||||||||
| | | | | | | | | | | | | | |
| | | | | | | | | | | | | | |
| | | | | | | | | | | | | | |
Exercisable as of December 31, 2014 |
577 | $ | 42.01 | 4.5 | $ | 35 | |||||||
| | | | | | | | | | | | | | |
| | | | | | | | | | | | | | |
| | | | | | | | | | | | | | |
The weighted-average grant-date fair value of SSARs granted during the years ended December 31, 2014, 2013 and 2012 was $9.29, $7.23, and $6.58, respectively. The total intrinsic value of SSARs and stock options exercised during the years ended December 31, 2014, 2013 and 2012 was $85 million, $57 million and $26 million, respectively.
A summary of the status of the Company's nonvested RSUs as of December 31, 2014, and changes during the year ended December 31, 2014, is presented below:
| |
Thousands of Restricted Stock Units |
Weighted- Average Grant-Date Fair Value |
|||||
|---|---|---|---|---|---|---|---|
Nonvested Units |
|||||||
Nonvested as of January 1, 2014 |
805 | $ | 52.96 | ||||
Granted |
299 | 82.44 | |||||
Vested |
(384 | ) | 52.36 | ||||
Forfeited |
(44 | ) | 59.66 | ||||
| | | | | | | | |
Nonvested as of December 31, 2014 |
676 | $ | 65.92 | ||||
| | | | | | | | |
| | | | | | | | |
| | | | | | | | |
In addition, 142,911 of the outstanding RSUs are applicable to retirement eligible employees as of December 31, 2014.
The total fair value of RSUs vested and distributed during the years ended December 31, 2014, 2013 and 2012 were $32 million, $26 million and $22 million, respectively.
As of December 31, 2014, there was $24 million of total unrecognized compensation cost related to nonvested share-based compensation arrangements granted under the Plan. Such cost is expected to be recognized over a weighted-average period of approximately two years.
Potential Impact of the ZF Merger on Equity Awards
If consummated, at the effective time of the ZF Merger, (i) all then-outstanding Company stock options, RSUs, PSUs and Performance Units (which will vest at the "maximum level" of performance),
94
TRW Automotive Holdings Corp.
Notes to Consolidated Financial Statements (Continued)
18. Share-Based Compensation (Continued)
whether vested or unvested, will be converted into the right to receive the Merger Consideration, less the exercise price of such awards, if any, and (ii) all then-outstanding Company SSARs, whether vested or unvested, will be converted into the right to receive an amount in cash equal to the excess of the lesser of the Merger Consideration and the "maximum value" of such SSAR over the fair market value per share at the relevant grant date.
Cash Awards
For the years ended December 31, 2014, 2013 and 2012, the Company recognized compensation expense associated with its cash-settled share-based compensation and retention awards of de minimis, $1 million and $4 million, respectively. During 2014, the final tranche of the cash incentive awards granted in 2011 were paid to fully satisfy the obligation for these awards.
19. Contingencies
Various claims, lawsuits and administrative proceedings are pending or threatened against the Company or its subsidiaries, covering a wide range of matters that arise in the ordinary course of the Company's business activities with respect to commercial, patent, product liability, environmental and occupational safety and health law matters. In addition, the Company and its subsidiaries are conducting a number of environmental investigations and remedial actions at current and former locations of certain of the Company's subsidiaries. Along with other companies, certain subsidiaries of the Company have been named potentially responsible parties for certain waste management sites. Each of these matters is subject to various uncertainties, and some of these matters may be resolved unfavorably with respect to the Company or the relevant subsidiary. A reserve estimate for each environmental matter is established using standard engineering cost estimating techniques on an undiscounted basis. In the determination of such costs, consideration is given to the professional judgment of Company environmental engineers, in consultation with outside environmental specialists, when necessary. At multi-party sites, the reserve estimate also reflects the expected allocation of total project costs among the various potentially responsible parties.
As of December 31, 2014, and 2013, the Company had reserves for environmental matters of $71 million and $68 million, respectively. In addition, the Company has established a receivable for a portion of this environmental liability as a result of its right to indemnification for 50% of any environmental liabilities associated with the operation or ownership of the Company's automotive business existing at or prior to March 2003. The Company believes any liability, in excess of amounts accrued in its financial statements, that may result from the resolution of environmental matters for which sufficient information is available to support these cost estimates, will not have a material adverse effect on the Company's financial position, results of operations or cash flows.
The Company faces an inherent business risk of exposure to product liability, recall and warranty claims in the event that its products actually or allegedly fail to perform as expected or the use of its products results, or is alleged to result, in bodily injury and/or property damage. Accordingly, the Company could experience material warranty, recall or product liability losses in the future. For further information, including quantification of the Company's product warranty liability, see the description of "Warranties" in Note 3.
While certain of the Company's subsidiaries have been subject in recent years to asbestos-related claims, management believes that such claims will not have a material adverse effect on the Company's
95
TRW Automotive Holdings Corp.
Notes to Consolidated Financial Statements (Continued)
19. Contingencies (Continued)
financial statements. In general, these claims seek damages for illnesses alleged to have resulted from exposure to asbestos used in certain components sold in the past by the Company's subsidiaries. Management believes that the majority of the claimants were vehicle mechanics. The vast majority of these claims name as defendants numerous manufacturers and suppliers of a variety of products allegedly containing asbestos. Management believes that, to the extent any of the products sold by the Company's subsidiaries and at issue in these cases contained asbestos, the asbestos was encapsulated. Based upon several years of experience with such claims, management believes that only a small proportion of the claimants has or will ever develop any asbestos-related illness.
Neither settlement costs in connection with asbestos claims nor annual legal fees to defend these claims have been material in the past. These claims are strongly disputed by the Company and it has been its policy to defend against them aggressively. Many of these cases have been dismissed without any payment whatsoever. Moreover, there is significant insurance coverage with solvent carriers with respect to these claims. However, while costs to defend and settle these claims in the past have not been material, there can be no assurances that this will remain so in the future.
Management believes that the ultimate resolution of the foregoing contingencies will not have a material effect on the Company's financial statements as a whole.
Antitrust Matters
Antitrust authorities, including those in the United States and Europe, are investigating possible violations of competition (antitrust) laws by automotive parts suppliers (referred to herein as the "Antitrust Investigations"). The U.S. Department of Justice ("DOJ") initiated an investigation into the Company's Occupant Safety Systems business in June 2011, which was concluded in 2012 when the court approved a plea agreement between one of the Company's German subsidiaries and the DOJ. Also in June 2011, the European Commission initiated an Antitrust Investigation which includes the Company, among others, and which is ongoing. While the duration and outcome of the European Commission's investigation is uncertain, a determination that the Company has violated European competition (antitrust) laws could result in significant penalties which could have a material adverse effect on its financial condition, results of operations and cash flows, as well as its reputation. While the Company cannot estimate the ultimate financial impact resulting from the European investigation, it will continue to evaluate developments in this matter on a regular basis and will record an accrual as and when appropriate.
The Company's policy is to comply with all laws and regulations, including all antitrust and competition laws. The Company is cooperating fully with the competition authorities in the context of their ongoing investigations.
The Company has settled, for amounts that are immaterial to the Company, certain purported class action lawsuits filed on behalf of vehicle purchasers, lessors, dealers, and direct purchasers alleging that the Company and certain of its competitors conspired to fix and raise prices for Occupant Safety Systems products. These lawsuits were filed on various dates from June 2012 through May 2014 in, or were consolidated in, the United States District Court for the Eastern District of Michigan. Once the court approves the settlements, those cases will be dismissed. The Company has also settled, for an amount that is immaterial to the Company, similar cases filed in various courts in Canada on behalf of vehicle purchasers, lessors, dealers and direct purchasers.
96
TRW Automotive Holdings Corp.
Notes to Consolidated Financial Statements (Continued)
19. Contingencies (Continued)
Transaction Litigation
Following the announcement of the execution of the Merger Agreement on September 15, 2014, the Company, members of our board of directors, ZF, Merger Sub and others have been named as defendants in one or more of the purported class actions filed by purported stockholders of the Company challenging the proposed ZF Merger. The actions seek, among other forms of relief, an order enjoining the ZF Merger, rescinding the Merger Agreement to the extent it has already been implemented, and awarding attorneys' fees and costs. On November 12, 2014, plaintiffs, the Company and other named defendants entered into a memorandum of understanding (the "MOU") agreeing in principle to settle all pending actions in exchange for the Company's agreement to make certain supplemental disclosures, which were filed on the same date in a supplement to TRW's October 20, 2014 definitive proxy statement. Pursuant to the MOU, the parties intend to settle, subject to court approval, certain claims, while the other pending litigation will be dismissed. The Company anticipates the litigation will be resolved and will not interfere with or delay the closing, but until court approval is obtained and the cases are dismissed, some uncertainty remains. The settlement contemplated by the MOU is not, and should not be construed as, an admission of wrongdoing or liability by any defendant.
20. Segment Information
The Company is a U.S.-based international business providing advanced technology products and systems for the automotive markets. The Company has four reportable segments: Chassis Systems, Occupant Safety Systems, Electronics and Automotive Components.
The principal customers for the Company's automotive products are the North American, European and Asian vehicle manufacturers.
Segment Information. The Company designs, manufactures and sells a broad range of steering, suspension and braking products, seat belts, airbags, steering wheels, safety electronics, engine valves, engineered fasteners, body control systems, and other components and systems for passenger cars, light trucks and commercial vehicles. A description of the products and services provided by each of the segments follows.
Chassis Systems—Active safety systems and other systems and components in the area of foundation brakes, anti-lock braking systems and other brake control systems (including electronic vehicle stability control), steering gears and systems (including electric power steering), linkage and suspension and modules.
Occupant Safety Systems—Passive safety systems and components in the areas of airbags, seat belts and steering wheels.
Electronics—Safety, radio frequency, chassis, and powertrain electronics and camera- and radar-based driver assistance systems.
Automotive Components—Body controls, engine valves, and engineered fasteners and plastic components (see Note 4).
The accounting policies of the segments are the same as those described in Note 3 under "Summary of Significant Accounting Policies." The Company evaluates operating performance based on segment earnings before taxes and segment assets.
97
TRW Automotive Holdings Corp.
Notes to Consolidated Financial Statements (Continued)
20. Segment Information (Continued)
The following income and expense items are not included in segment earnings before taxes:
- •
- Corporate expense and other, which primarily represents costs associated with corporate staff and related expenses, including certain
litigation and net employee benefits income (expense).
- •
- Financing costs, which represents debt-related interest and accounts receivable securitization costs.
- •
- Gain (loss) on retirement of debt.
The following tables present certain financial information by segment:
| |
Years Ended December 31, | |||||||||
|---|---|---|---|---|---|---|---|---|---|---|
| |
2014 | 2013 | 2012 | |||||||
| |
(Dollars in millions) |
|||||||||
Sales to external customers: |
||||||||||
Chassis Systems |
$ | 11,354 | $ | 11,492 | $ | 10,685 | ||||
Occupant Safety Systems |
3,357 | 3,314 | 3,287 | |||||||
Electronics |
937 | 721 | 654 | |||||||
Automotive Components |
1,891 | 1,908 | 1,818 | |||||||
| | | | | | | | | | | |
Total sales to external customers |
$ | 17,539 | $ | 17,435 | $ | 16,444 | ||||
| | | | | | | | | | | |
| | | | | | | | | | | |
| | | | | | | | | | | |
Intersegment sales: |
||||||||||
Chassis Systems |
$ | 16 | $ | 14 | $ | 20 | ||||
Occupant Safety Systems |
139 | 130 | 90 | |||||||
Electronics |
609 | 543 | 514 | |||||||
Automotive Components |
74 | 75 | 80 | |||||||
| | | | | | | | | | | |
Total intersegment sales |
$ | 838 | $ | 762 | $ | 704 | ||||
| | | | | | | | | | | |
| | | | | | | | | | | |
| | | | | | | | | | | |
Total segment sales: |
||||||||||
Chassis Systems |
$ | 11,370 | $ | 11,506 | $ | 10,705 | ||||
Occupant Safety Systems |
3,496 | 3,444 | 3,377 | |||||||
Electronics |
1,546 | 1,264 | 1,168 | |||||||
Automotive Components |
1,965 | 1,983 | 1,898 | |||||||
| | | | | | | | | | | |
Total segment sales |
$ | 18,377 | $ | 18,197 | $ | 17,148 | ||||
| | | | | | | | | | | |
| | | | | | | | | | | |
| | | | | | | | | | | |
Earnings before taxes: |
||||||||||
Chassis Systems |
$ | 831 | $ | 841 | $ | 669 | ||||
Occupant Safety Systems |
282 | 239 | 254 | |||||||
Electronics |
144 | 126 | 132 | |||||||
Automotive Components |
168 | 150 | 115 | |||||||
| | | | | | | | | | | |
Segment earnings before taxes |
1,425 | 1,356 | 1,170 | |||||||
Corporate expense and other |
(920 | ) | (120 | ) | (78 | ) | ||||
Interest expense—net |
(109 | ) | (132 | ) | (111 | ) | ||||
Loss on retirement of debt—net |
(7 | ) | (20 | ) | (6 | ) | ||||
Net earnings attributable to noncontrolling interest, net of tax |
41 | 37 | 33 | |||||||
| | | | | | | | | | | |
Earnings before income taxes |
$ | 430 | $ | 1,121 | $ | 1,008 | ||||
| | | | | | | | | | | |
| | | | | | | | | | | |
| | | | | | | | | | | |
98
TRW Automotive Holdings Corp.
Notes to Consolidated Financial Statements (Continued)
20. Segment Information (Continued)
| |
Years Ended December 31, | |||||||||
|---|---|---|---|---|---|---|---|---|---|---|
| |
2014 | 2013 | 2012 | |||||||
| |
(Dollars in millions) |
|||||||||
Capital expenditures: |
||||||||||
Chassis Systems |
$ | 418 | $ | 461 | $ | 364 | ||||
Occupant Safety Systems |
118 | 112 | 104 | |||||||
Electronics |
70 | 80 | 61 | |||||||
Automotive Components |
76 | 77 | 86 | |||||||
Corporate |
12 | 5 | 8 | |||||||
| | | | | | | | | | | |
|
$ | 694 | $ | 735 | $ | 623 | ||||
| | | | | | | | | | | |
| | | | | | | | | | | |
| | | | | | | | | | | |
Depreciation and amortization: |
||||||||||
Chassis Systems |
$ | 250 | $ | 243 | $ | 228 | ||||
Occupant Safety Systems |
83 | 79 | 80 | |||||||
Electronics |
51 | 42 | 38 | |||||||
Automotive Components |
55 | 63 | 60 | |||||||
Corporate |
5 | 3 | 3 | |||||||
| | | | | | | | | | | |
|
$ | 444 | $ | 430 | $ | 409 | ||||
| | | | | | | | | | | |
| | | | | | | | | | | |
| | | | | | | | | | | |
The Company accounts for intersegment sales or transfers at current market prices.
The following table presents certain balance sheet information by segment:
| |
December 31, | ||||||
|---|---|---|---|---|---|---|---|
| |
2014 | 2013 | |||||
| |
(Dollars in millions) |
||||||
Segment assets: |
|||||||
Chassis Systems |
$ | 5,842 | $ | 5,632 | |||
Occupant Safety Systems |
2,024 | 2,162 | |||||
Electronics |
1,247 | 1,019 | |||||
Automotive Components |
803 | 852 | |||||
| | | | | | | | |
Segment assets |
9,916 | 9,665 | |||||
Corporate assets |
812 | 2,047 | |||||
| | | | | | | | |
Segment and corporate assets |
10,728 | 11,712 | |||||
Deferred tax assets |
566 | 540 | |||||
| | | | | | | | |
Total assets |
$ | 11,294 | $ | 12,252 | |||
| | | | | | | | |
| | | | | | | | |
| | | | | | | | |
Corporate assets principally consist of cash and cash equivalents and pension assets.
99
TRW Automotive Holdings Corp.
Notes to Consolidated Financial Statements (Continued)
20. Segment Information (Continued)
Geographic Information. The following table presents certain information concerning principal geographic areas:
| |
United States |
China | Germany | Rest of World |
Total | |||||||||||
|---|---|---|---|---|---|---|---|---|---|---|---|---|---|---|---|---|
| |
(Dollars in millions) |
|||||||||||||||
Sales to external customers: |
||||||||||||||||
Year Ended December 31, 2014 |
$ | 4,496 | $ | 3,131 | $ | 2,097 | $ | 7,815 | $ | 17,539 | ||||||
Year Ended December 31, 2013 |
4,992 | 2,758 | 2,199 | 7,486 | 17,435 | |||||||||||
Year Ended December 31, 2012 |
4,713 | 2,201 | 2,330 | 7,200 | 16,444 | |||||||||||
Property, plant and equipment—net: |
||||||||||||||||
As of December 31, 2014 |
$ | 567 | $ | 565 | $ | 394 | $ | 1,119 | $ | 2,645 | ||||||
As of December 31, 2013 |
534 | 478 | 430 | 1,276 | 2,718 | |||||||||||
As of December 31, 2012 |
563 | 357 | 403 | 1,062 | 2,385 | |||||||||||
Sales are attributable to geographic areas based on the location of the assets generating the sales. Inter-area sales are not significant to the total sales of any geographic area.
Customer Concentration. Sales to the Company's largest-end-customers (including sales within the vehicle manufacturer's group) on a worldwide basis are as follows:
| |
Volkswagen AG |
Ford Motor Company |
Fiat Chrysler Automobiles N.V.(a) |
General Motors |
Aggregate Percent of Total Sales |
|||||||||||
|---|---|---|---|---|---|---|---|---|---|---|---|---|---|---|---|---|
| |
(Dollars in millions) |
|||||||||||||||
Year Ended December 31, 2014 |
$ | 4,525 | $ | 3,210 | $ | 2,368 | $ | 1,288 | 64.9 | % | ||||||
Year Ended December 31, 2013 |
4,298 | 3,234 | 2,359 | 1,757 | 66.8 | % | ||||||||||
Year Ended December 31, 2012 |
3,863 | 2,897 | 2,290 | 1,649 | 65.1 | % | ||||||||||
- (a)
- Effective in 2014, Fiat Chrysler Automobiles N.V. includes FCA US LLC (formerly known as Chrysler Group LLC), which was shown on a standalone basis for the years ended 2013 and 2012.
21. Unconsolidated Affiliates
As of December 31, 2014 and 2013, the Company's investment in affiliates was $231 million and $207 million, respectively.
100
TRW Automotive Holdings Corp.
Notes to Consolidated Financial Statements (Continued)
21. Unconsolidated Affiliates (Continued)
The Company's beneficial ownership in affiliates accounted for under the equity method follows:
| |
As of December 31, | |||||||||
|---|---|---|---|---|---|---|---|---|---|---|
| |
2014 | 2013 | 2012 | |||||||
SM-Sistemas Modulares Ltda. (Brazil) |
50 | % | 50 | % | 50 | % | ||||
ABC Sistemas E Modulos Ltda. (Brazil) |
33 | % | 33 | % | 33 | % | ||||
CSG TRW Chassis Systems Co., Ltd. (China) |
50 | % | 50 | % | 50 | % | ||||
Shanghai TRW Automotive Safety Systems Company Ltd. (China) |
50 | % | 50 | % | 50 | % | ||||
Shin-Han (Beijing) Automobile Parts System Co., Ltd (China)(a) |
30 | % | 30 | % | 30 | % | ||||
Fuji Valve (Guangdong) Co., Ltd. (China)(a) |
25 | % | 25 | % | 25 | % | ||||
TH Braking Company S.A.S. (France) |
50 | % | 50 | % | 50 | % | ||||
Rane TRW Steering Systems Limited (India) |
50 | % | 50 | % | 50 | % | ||||
Brakes India Limited (India) |
49 | % | 49 | % | 49 | % | ||||
TRW Sun Steering Wheels Private Limited (India) |
49 | % | 49 | % | 49 | % | ||||
Evercast, S.A. de C.V. (Mexico) |
30 | % | — | — | ||||||
Shin Han Valve Industrial Company, Ltd. (South Korea)(a) |
25 | % | 25 | % | 25 | % | ||||
Componentes Venezolanos de Direccion, S.A. (Venezuela)(a) |
40 | % | 40 | % | 40 | % | ||||
- (a)
- These affiliates are classified as held-for-sale (see Note 4).
22. Quarterly Financial Information (Unaudited)
| |
For the 2014 Quarter Ended | For the 2013 Quarter Ended | |||||||||||||||||||||||
|---|---|---|---|---|---|---|---|---|---|---|---|---|---|---|---|---|---|---|---|---|---|---|---|---|---|
| |
March 28 | June 27 | September 26 | December 31 | March 29 | June 28 | September 27 | December 31 | |||||||||||||||||
| |
(Dollars in millions, except per share amounts) |
||||||||||||||||||||||||
Sales |
$ | 4,442 | $ | 4,593 | $ | 4,156 | $ | 4,348 | $ | 4,213 | $ | 4,514 | $ | 4,212 | $ | 4,496 | |||||||||
Gross profit |
500 | 567 | 475 | 524 | 427 | 531 | 450 | 522 | |||||||||||||||||
Pension and postretirement benefit settlement and curtailment expenses |
— | — | — | 790 | — | — | — | 31 | |||||||||||||||||
Restructuring charges and asset impairments |
20 | 6 | 10 | 48 | 37 | 1 | 5 | 23 | |||||||||||||||||
Loss on retirement of debt—net |
— | — | — | 7 | — | 5 | — | 15 | |||||||||||||||||
Earnings (loss) before income taxes |
287 | 367 | 278 | (502 | ) | 235 | 357 | 268 | 261 | ||||||||||||||||
Net earnings (loss) attributable to TRW |
199 | 265 | 189 | (360 | ) | 162 | 248 | 197 | 363 | ||||||||||||||||
Basic earnings (loss) per share |
$ | 1.76 | $ | 2.39 | $ | 1.70 | $ | (3.22 | ) | $ | 1.35 | $ | 2.09 | $ | 1.68 | $ | 3.15 | ||||||||
Diluted earnings (loss) per share |
$ | 1.68 | $ | 2.27 | $ | 1.61 | $ | (3.22 | ) | $ | 1.29 | $ | 1.99 | $ | 1.60 | $ | 3.00 | ||||||||
101
REPORT OF ERNST & YOUNG LLP, INDEPENDENT REGISTERED
PUBLIC ACCOUNTING FIRM
To
the Board of Directors and Shareholders of TRW Automotive Holdings Corp.
Livonia, Michigan
We have audited the accompanying consolidated balance sheets of TRW Automotive Holdings Corp. as of December 31, 2014 and 2013, and the related consolidated statements of earnings, comprehensive earnings, stockholders' equity, and cash flows for each of the three years in the period ended December 31, 2014. Our audits also included the financial statement schedule included as Item 15(a)(2). These financial statements and schedule are the responsibility of the Company's management. Our responsibility is to express an opinion on these financial statements and schedule based on our audits.
We conducted our audits in accordance with the standards of the Public Company Accounting Oversight Board (United States). Those standards require that we plan and perform the audit to obtain reasonable assurance about whether the financial statements are free of material misstatement. An audit includes examining, on a test basis, evidence supporting the amounts and disclosures in the financial statements. An audit also includes assessing the accounting principles used and significant estimates made by management, as well as evaluating the overall financial statement presentation. We believe that our audits provide a reasonable basis for our opinion.
In our opinion, the financial statements referred to above present fairly, in all material respects, the consolidated financial position of TRW Automotive Holdings Corp. at December 31, 2014 and 2013, and the consolidated results of its operations and its cash flows for each of the three years in the period ended December 31, 2014, in conformity with U.S. generally accepted accounting principles. Also, in our opinion, the related financial statement schedule, when considered in relation to the basic financial statements taken as a whole, presents fairly in all material respects the information set forth therein.
We also have audited, in accordance with the standards of the Public Company Accounting Oversight Board (United States), TRW Automotive Holdings Corp.'s internal control over financial reporting as of December 31, 2014, based on criteria established in Internal Control—Integrated Framework issued by the Committee of Sponsoring Organizations of the Treadway Commission (2013 framework) and our report dated February 13, 2015 expressed an unqualified opinion thereon.
/s/
Ernst & Young LLP
Detroit, Michigan
February 13, 2015
102
REPORT OF ERNST & YOUNG LLP, INDEPENDENT REGISTERED
PUBLIC ACCOUNTING FIRM
To
the Board of Directors and Shareholders of TRW Automotive Holdings Corp.
Livonia, Michigan
We have audited TRW Automotive Holdings Corp.'s internal control over financial reporting as of December 31, 2014, based on criteria established in Internal Control—Integrated Framework issued by the Committee of Sponsoring Organizations of the Treadway Commission (2013 framework) (the COSO criteria). TRW Automotive Holdings Corp.'s management is responsible for maintaining effective internal control over financial reporting, and for its assessment of the effectiveness of internal control over financial reporting included in the accompanying Management's Report on Internal Control over Financial Reporting. Our responsibility is to express an opinion on the company's internal control over financial reporting based on our audit.
We conducted our audit in accordance with the standards of the Public Company Accounting Oversight Board (United States). Those standards require that we plan and perform the audit to obtain reasonable assurance about whether effective internal control over financial reporting was maintained in all material respects. Our audit included obtaining an understanding of internal control over financial reporting, assessing the risk that a material weakness exists, testing and evaluating the design and operating effectiveness of internal control based on the assessed risk, and performing such other procedures as we considered necessary in the circumstances. We believe that our audit provides a reasonable basis for our opinion.
A company's internal control over financial reporting is a process designed to provide reasonable assurance regarding the reliability of financial reporting and the preparation of financial statements for external purposes in accordance with generally accepted accounting principles. A company's internal control over financial reporting includes those policies and procedures that (1) pertain to the maintenance of records that, in reasonable detail, accurately and fairly reflect the transactions and dispositions of the assets of the company; (2) provide reasonable assurance that transactions are recorded as necessary to permit preparation of financial statements in accordance with generally accepted accounting principles, and that receipts and expenditures of the company are being made only in accordance with authorizations of management and directors of the company; and (3) provide reasonable assurance regarding prevention or timely detection of unauthorized acquisition, use, or disposition of the company's assets that could have a material effect on the financial statements.
Because of its inherent limitations, internal control over financial reporting may not prevent or detect misstatements. Also, projections of any evaluation of effectiveness to future periods are subject to the risk that controls may become inadequate because of changes in conditions, or that the degree of compliance with the policies or procedures may deteriorate.
In our opinion, TRW Automotive Holdings Corp. maintained, in all material respects, effective internal control over financial reporting as of December 31, 2014, based on the COSO criteria.
We also have audited, in accordance with the standards of the Public Company Accounting Oversight Board (United States), the consolidated balance sheets of TRW Automotive Holdings Corp. as of December 31, 2014 and 2013, and the related consolidated statements of earnings, comprehensive earnings, stockholders' equity, and cash flows for each of the three years in the period ended December 31, 2014 and our report dated February 13, 2015 expressed an unqualified opinion thereon.
/s/ Ernst & Young LLP
Detroit,
Michigan
February 13, 2015
103
ITEM 9. CHANGES IN AND DISAGREEMENTS WITH ACCOUNTANTS ON ACCOUNTING AND FINANCIAL DISCLOSURE
None.
ITEM 9A. CONTROLS AND PROCEDURES
Evaluation of Disclosure Controls and Procedures. Our Chief Executive Officer and Chief Financial Officer, based on their evaluation of the effectiveness of the Company's disclosure controls and procedures (as defined in Rule 13a—15(e) under the Securities Exchange Act of 1934) as of December 31, 2014, have concluded that the Company's disclosure controls and procedures are effective to ensure that information required to be disclosed by the Company in the reports that it files and submits under the Securities Exchange Act of 1934 (the "Exchange Act") is recorded, processed, summarized and reported within the specified time periods and is accumulated and communicated to the Company's management as appropriate to allow timely decisions regarding required disclosure.
Management's Report on Internal Control over Financial Reporting. Management is responsible for establishing and maintaining adequate internal control over financial reporting, as such term is defined in Rule 13a-15(f) of the Exchange Act. The Company's internal control over financial reporting is a process designed to provide reasonable assurance regarding the reliability of financial reporting and the preparation of financial statements for external purposes in accordance with United States generally accepted accounting principles.
Because of its inherent limitations, a system of internal control over financial reporting can provide only reasonable assurance and may not prevent or detect misstatements. Further, because of changes in conditions, effectiveness of internal controls over financial reporting may vary over time.
Under the supervision and with the participation of our management, including our Chief Executive Officer and Chief Financial Officer, the Company conducted an assessment of the effectiveness of its internal control over financial reporting as of December 31, 2014. The assessment was based on criteria established in the framework entitled, Internal Control—Integrated Framework, issued by the Committee of Sponsoring Organizations of the Treadway Commission (2013 framework) (the COSO criteria).
Based on this assessment, using the criteria referenced above, management concluded that our internal control over financial reporting was effective as of December 31, 2014. The effectiveness of the Company's internal control over financial reporting as of December 31, 2014 has been audited by Ernst & Young, LLP, an independent registered public accounting firm, as stated in their attestation report included herein.
Changes in Internal Control over Financial Reporting. There was no change in the Company's internal controls over financial reporting that occurred during the fourth fiscal quarter of 2014 that has materially affected, or is reasonably likely to materially affect, the Company's internal control over financial reporting.
None.
104
ITEM 10. DIRECTORS, EXECUTIVE OFFICERS AND CORPORATE GOVERNANCE
The information required by Item 10 regarding executive officers and directors is incorporated by reference from the information under the captions "Executive Officers" and "The Board of Directors—Director Information" in the Company's definitive Proxy Statement for the 2015 Annual Meeting of the Stockholders (the "Proxy Statement"), which will be filed within 120 days after December 31, 2014. The information required by Item 10 regarding the audit committee and audit committee financial expert disclosure is incorporated by reference from the information under the caption "The Board of Directors—Committees of the Board of Directors" in the Proxy Statement. The information required by Item 10 regarding our code of ethics is incorporated by reference from the information under the caption "Available Company Information" in Part I, Item 1 of this Report and under the caption "The Board of Directors—Code of Ethics" in the Proxy Statement.
Disclosure of delinquent Section 16 filers required by Item 10, if any, pursuant to Item 405 of Regulation S-K would be contained under the caption "Security Ownership of Certain Beneficial Owners and Management—Section 16(a) Beneficial Ownership Reporting Compliance" in the Proxy Statement. However, to the best of the Company's knowledge, no such disclosure will be made.
ITEM 11. EXECUTIVE COMPENSATION
The information required by Item 11 is incorporated by reference from the information under the following captions in the Proxy Statement: "Compensation Committee Report," "Compensation Discussion and Analysis," "Compensation of Executive Officers," and "The Board of Directors—Director Compensation."
ITEM 12. SECURITY OWNERSHIP OF CERTAIN BENEFICIAL OWNERS AND MANAGEMENT AND RELATED STOCKHOLDER MATTERS
The information required by Item 12 relating to security ownership is incorporated by reference from the information under the caption "Security Ownership of Certain Beneficial Owners and Management" in the Proxy Statement.
The information required by Item 12 relating to securities authorized for issuance under equity compensation plans is incorporated herein by reference from information under the caption "Equity Compensation Plan Information" in Part II, Item 5 of this Report.
ITEM 13. CERTAIN RELATIONSHIPS AND RELATED TRANSACTIONS, AND DIRECTOR INDEPENDENCE
The information required by Item 13 regarding transactions with related persons is incorporated by reference from the information under the caption "Transactions with Related Persons" in the Proxy Statement.
The information required by Item 13 regarding director independence is incorporated by reference from the information under the caption "The Board of Directors" in the Proxy Statement.
ITEM 14. PRINCIPAL ACCOUNTING FEES AND SERVICES
The information required by Item 14 is incorporated by reference from the information under the caption "Independent Registered Public Accounting Firm Fees" in the Proxy Statement.
105
ITEM 15. EXHIBITS, FINANCIAL STATEMENT SCHEDULES
- (a)
- (1) Financial Statements
106
- (2)
- Financial Statement Schedule—
SCHEDULE II
Valuation and Qualifying Accounts for
the years ended December 31, 2014, 2013 and 2012
| |
Balance at Beginning of Period |
Charged to Costs and Expenses |
Charged (Credited) to Other Accounts |
Deductions | Balance at End of Period |
|||||||||||
|---|---|---|---|---|---|---|---|---|---|---|---|---|---|---|---|---|
| |
(Dollars in millions) |
|||||||||||||||
Year ended December 31, 2014 |
||||||||||||||||
Allowance for doubtful accounts |
$ | 29 | $ | 4 | $ | — | $ | (7 | )(a) | $ | 26 | |||||
Deferred tax asset valuation allowance |
295 | 7 | (28 | ) | — | 274 | ||||||||||
Year ended December 31, 2013 |
||||||||||||||||
Allowance for doubtful accounts |
$ | 30 | $ | 4 | $ | — | $ | (5 | )(a) | $ | 29 | |||||
Deferred tax asset valuation allowance |
250 | 17 | 28 | — | 295 | |||||||||||
Year ended December 31, 2012 |
||||||||||||||||
Allowance for doubtful accounts |
$ | 38 | $ | (1 | ) | $ | — | $ | (7 | )(a) | $ | 30 | ||||
Deferred tax asset valuation allowance |
273 | (63 | ) | 40 | — | 250 | ||||||||||
- (a)
- Uncollectible accounts written off, net of recoveries.
The other schedules have been omitted because they are not applicable or are not required or the information to be set forth therein is included in the Consolidated Financial Statements or notes thereto.
107
- (3)
- Exhibits (including those incorporated by reference). All references to "Registrant" below pertain to TRW Automotive Holdings Corp. and all references to TAI pertain to TRW Automotive Inc. (f/k/a TRW Automotive Acquisition Corp. and Roadster Acquisition Corp.). Documents listed below that are incorporated by reference from a filing other than a registration statement and are more than five years old can be found under SEC file number 001-31970.
| |
|
Incorporated By Reference | |
|||||||||||||
|---|---|---|---|---|---|---|---|---|---|---|---|---|---|---|---|---|
| Exhibit Number |
Exhibit Description | Form | Exhibit | Filing Date |
Filed Herewith |
|||||||||||
| 2.1 | (a) | The Master Purchase Agreement, dated as of November 18, 2002 (the "MPA") between BCP Acquisition Company L.L.C. ("BCP") and Northrop Grumman Corporation ("Northrop") | TAI S-4 | 2.1 | 07/01/2003 | |||||||||||
| (b) | Amendment No. 1, dated December 20, 2002, to the MPA among BCP, Northrop, TRW Inc. and TAI | TAI S-4 | 2.2 | 07/01/2003 | ||||||||||||
| (c) | Amendment No. 2, dated February 28, 2003, to the MPA among BCP, Northrop, Northrop Grumman Space & Mission Systems Corp. ("NGS&MS") and TAI | TAI S-4 | 2.3 | 07/01/2003 | ||||||||||||
| (d) | Amendment No. 3, dated December 19, 2011, to the MPA among Northrop, NGS&MS, TAI, BCP and Automotive Investors, L.L.C. | 10-K | 2.1(d | ) | 02/16/2012 | |||||||||||
| 2.2 | Agreement and Plan of Merger, dated as of September 15, 2014, by and among Registrant, ZF Friedrichshafen AG and MSNA, Inc. | 8-K | 2.1 | 09/15/2014 | ||||||||||||
| 3.1 | Second Amended and Restated Certificate of Incorporation of Registrant | 10-K | 3.1 | 03/29/2004 | ||||||||||||
| 3.2 | Fourth Amended and Restated By-Laws of Registrant | 8-K | 3.1 | 02/14/2014 | ||||||||||||
| 4.1 | Form of Certificate of Common Stock of Registrant, as approved February 2010 | 10-K | 4.1 | 02/25/2010 | ||||||||||||
Registrant, in accordance with Item 601(b)(4)(iii)(A) of Regulation S-K has omitted filing instruments defining the rights of holders of long-term debt of Registrant or any of its subsidiaries, which debt does not exceed 10% of the total assets of Registrant and its subsidiaries on a consolidated basis, and agrees to furnish to the SEC copies of such instruments upon request.
108
| |
|
Incorporated By Reference | |
|||||||||||||
|---|---|---|---|---|---|---|---|---|---|---|---|---|---|---|---|---|
| Exhibit Number |
Exhibit Description | Form | Exhibit | Filing Date |
Filed Herewith |
|||||||||||
| 10.1 | Eighth Amended and Restated Credit Agreement, dated as of September 28, 2012, among TAI, Registrant, certain of Registrant's foreign subsidiaries, the lenders party thereto from time to time, JPMorgan Chase Bank, N.A., as administrative agent, Bank of America, N.A., as syndication agent, and J.P. Morgan Securities LLC and Merrill Lynch, Pierce, Fenner & Smith Incorporated, as lead arrangers | 8-K | 10.1 | 10/01/2012 | ||||||||||||
| 10.2 | Amended and Restated U.S. Guarantee and Collateral Agreement, dated as of September 28, 2012, among TAI, Registrant, certain specified subsidiaries of Registrant and JPMorgan Chase Bank, N.A., as collateral agent | 10-Q | 10.2 | 10/30/2012 | ||||||||||||
| 10.3 | Amended and Restated Foreign Guarantee, dated as of September 28, 2012, among each foreign subsidiary of Registrant and JPMorgan Chase Bank, N.A., as collateral agent | 10-Q | 10.4 | 10/30/2012 | ||||||||||||
| 10.4 | Insurance Allocation Agreement, dated as of February 28, 2003, between NGS&MS. and TAI | TAI S-4 | 10.15 | 07/01/2003 | ||||||||||||
| 10.5 | Employee Stockholders Agreement, dated as of February 28, 2003, by and among Registrant and the other parties named therein | TAI S-4 | 10.18 | 07/01/2003 | ||||||||||||
| 10.6 | (a) | Letter Agreement, dated May 27, 2003, between John C. Plant and TAI | TAI S-4 | 10.37 | 07/01/2003 | |||||||||||
| (b) | Employment Agreement, dated as of February 6, 2003 between TAI, TRW Limited and John C. Plant | TAI S-4 | 10.22 | 07/01/2003 | ||||||||||||
| (c) | Amendment dated as of December 16, 2004 to Employment Agreement of John C. Plant | 10-K | 10.45 | 02/23/2005 | ||||||||||||
| (d) | Second Amendment dated as of February 22, 2005 to Employment Agreement of John C. Plant | 10-K | 10.51 | 02/23/2005 | ||||||||||||
| (e) | Third Amendment dated as of July 28, 2006 to Employment Agreement of John C. Plant | 10-Q | 10.1 | 08/02/2006 | ||||||||||||
109
| |
|
Incorporated By Reference | |
|||||||||||||
|---|---|---|---|---|---|---|---|---|---|---|---|---|---|---|---|---|
| Exhibit Number |
Exhibit Description | Form | Exhibit | Filing Date |
Filed Herewith |
|||||||||||
| (f) | Fourth Amendment dated as of December 18, 2008 to Employment Agreement of John C. Plant | 8-K | 10.5 | 12/22/2008 | ||||||||||||
| (g) | Sixth Amendment dated as of November 20, 2009 to Employment Agreement of John C. Plant | 10-K | 10.15(g | ) | 02/25/2010 | |||||||||||
| (h) | Amended and Restated TRW Automotive Supplemental Retirement Income Plan, effective January 1, 2009 | 8-K | 10.1 | 12/22/2008 | ||||||||||||
| (i) | John C. Plant 2009 Supplemental Retirement Plan, effective as of January 1, 2009 | 8-K | 10.6 | 12/22/2008 | ||||||||||||
| (j) | Form of Amendment to John C. Plant 2009 Supplemental Retirement Plan | 8-K | 10.1 | 11/16/2012 | ||||||||||||
| 10.7 | (a) | Employment Agreement, dated as of February 13, 2003 by and between TAI and Joseph S. Cantie | TAI S-4 | 10.25 | 07/01/2003 | |||||||||||
| (b) | Amendment dated as of April 30, 2004 to Employment Agreement of Joseph S. Cantie | 10-Q | 10.4 | 05/07/2004 | ||||||||||||
| (c) | Second Amendment dated as of December 16, 2004 to Employment Agreement of Joseph S. Cantie | 10-K | 10.49 | 02/23/2005 | ||||||||||||
| (d) | Third Amendment dated as of July 29, 2005 to Employment Agreement of Joseph S. Cantie | 10-Q | 10.3 | 08/02/2005 | ||||||||||||
| 10.8 | (a) | Employment Agreement, dated as of February 28, 2003 by and between TAI, TRW Limited and Steven Lunn | TAI S-4 | 10.23 | 07/01/2003 | |||||||||||
| (b) | Amendment dated as of December 16, 2004 to Employment Agreement of Steven Lunn | 10-K | 10.46 | 02/23/2005 | ||||||||||||
| (c) | Second Amendment dated as of January 12, 2009 to Employment Agreement of Steven Lunn | 8-K | 10.1 | 01/13/2009 | ||||||||||||
| (d) | Fourth Amendment dated as of November 30, 2010 to Employment Agreement of Steven Lunn | 10-K | 10.13(d | ) | 02/17/2011 | |||||||||||
| (e) | Declaration of Trust, the TRW Retirement Benefit Plan, dated November 1, 2010 between TAI and Barclays Wealth Trustees (Guernsey) Limited | 10-K | 10.13(g | ) | 02/17/2011 | |||||||||||
110
| |
|
Incorporated By Reference | |
|||||||||||||
|---|---|---|---|---|---|---|---|---|---|---|---|---|---|---|---|---|
| Exhibit Number |
Exhibit Description | Form | Exhibit | Filing Date |
Filed Herewith |
|||||||||||
| 10.9 | (a) | Employment Agreement dated as of January 1, 2014, by and between TAI and Patrick Olney | 10-K | 10.9(a | ) | 02/14/2014 | ||||||||||
| (b) | Agreement Regarding Signing Bonus, as of January 1, 2014, by and between TAI and Patrick Olney | 10-K | 10.9(b | ) | 02/14/2014 | |||||||||||
| 10.10 | (a) | Employment Agreement, dated as of February 27, 2003 by and between TRW Limited and Peter J. Lake | TAI S-4 | 10.24 | 07/01/2003 | |||||||||||
| (b) | Amendment dated as of April 30, 2004 to Employment Agreement of Peter J. Lake | 10-Q | 10.5 | 05/07/2004 | ||||||||||||
| (c) | Second Amendment dated as of December 16, 2004 to Employment Agreement of Peter J. Lake | 10-K | 10.47 | 02/23/2005 | ||||||||||||
| (d) | Third Amendment dated as of July 29, 2005 to Employment Agreement of Peter J. Lake | 10-Q | 10.1 | 08/02/2005 | ||||||||||||
| (e) | Fourth Amendment dated as of November 12, 2008 to Employment Agreement of Peter J. Lake | 8-K | 10.4 | 11/13/2008 | ||||||||||||
| (f) | Fifth Amendment dated as of December 18, 2008 to Employment Agreement of Peter J. Lake | 8-K | 10.4 | 12/22/2008 | ||||||||||||
| (g) | Seventh Amendment to Employment Agreement, dated as of October 1, 2009, among TAI, TRW Limited and Peter J. Lake | 8-K | 10.1 | 09/30/2009 | ||||||||||||
| 10.11 | (a) | Employment Agreement dated as of August 16, 2004 by and between TAI and Neil E. Marchuk | 10-Q | 10.1 | 11/04/2004 | |||||||||||
| (b) | Amendment dated as of December 16, 2004 to Employment Agreement of Neil E. Marchuk | 10-K | 10.5 | 02/23/2005 | ||||||||||||
| (c) | Second Amendment dated as of July 29, 2005 to Employment Agreement of Neil E. Marchuk | 10-Q | 10.4 | 08/02/2005 | ||||||||||||
| (d) | Sixth Amendment dated as of February 18, 2009 to Employment Agreement of Neil E. Marchuk | 10-Q | 10.1 | 05/06/2009 | ||||||||||||
| 10.12 | (a) | Employment Agreement, dated as of February 1, 2010 by and between TAI and Robin A. Walker-Lee | 10-K | 10.17 | 02/17/2011 | |||||||||||
| (b) | Second Amendment dated as of February 15, 2012 to Employment Agreement of Robin A. Walker-Lee | 10-Q | 10.1 | 05/01/2012 | ||||||||||||
111
| |
|
Incorporated By Reference | |
|||||||||||||
|---|---|---|---|---|---|---|---|---|---|---|---|---|---|---|---|---|
| Exhibit Number |
Exhibit Description | Form | Exhibit | Filing Date |
Filed Herewith |
|||||||||||
| 10.13 | (a) | Form of Fourth Amendment to Employment Agreement, dated as of November 12, 2008, between TAI and each of Joseph S. Cantie and Neil E. Marchuk | 8-K | 10.3 | 11/13/2008 | |||||||||||
| (b) | Form of Fifth Amendment to Employment Agreement, dated as of December 18, 2008, between TAI and each of Joseph S. Cantie and Neil E. Marchuk | 8-K | 10.3 | 12/22/2008 | ||||||||||||
| (c) | Form of Amendment to Employment Agreement, dated as of February 26, 2009, between TAI and/or TRW Limited, as applicable, and each of John C. Plant, Steven Lunn, Peter J. Lake, Joseph S. Cantie and Neil E. Marchuk | 8-K | 10.1 | 02/24/2009 | ||||||||||||
| (d) | Form of Amendment to Employment Agreement, dated November 16, 2011, between TAI and each of Joseph S. Cantie, Peter J. Lake, Neil E. Marchuk and Robin A. Walker-Lee | 8-K | 10.1 | 11/18/2011 | ||||||||||||
| (e) | Form of Amendment to Employment Agreement, dated November 12, 2014, between TAI and each of Joseph S. Cantie, Peter J. Lake, Neil E. Marchuk, G. Patrick Olney, and Robin A. Walker-Lee | 8-K | 10.1 | 11/14/2014 | ||||||||||||
| 10.14 | TRW Automotive Benefits Equalization Plan effective January 1, 2009 | 10-K | 10.19 | 02/17/2011 | ||||||||||||
| 10.15 | Form of TAI Executive Officer Cash Incentive Award Agreement between TAI and each of the Registrant's executive officers | 8-K | 10.1 | 02/26/2010 | ||||||||||||
| 10.16 | Form of Indemnification Agreement between the Registrant and each of its directors and executive officers | 8-K | 10.5 | 11/13/2008 | ||||||||||||
| 10.17 | (a) | Amended and Restated TRW Automotive Holdings Corp. 2003 Stock Incentive Plan | DEF 14A | Appendix A | 04/03/2009 | |||||||||||
| (b) | First Amendment to Amended & Restated TRW Automotive Holdings Corp. 2003 Stock Incentive Plan, dated as of February 18, 2009 | 10-Q | 10.2 | 05/06/2009 | ||||||||||||
112
| |
|
Incorporated By Reference | |
|||||||||||||
|---|---|---|---|---|---|---|---|---|---|---|---|---|---|---|---|---|
| Exhibit Number |
Exhibit Description | Form | Exhibit | Filing Date |
Filed Herewith |
|||||||||||
| (c) | Form of General Non-Qualified Stock Open Agreement | TAI S-4 | 10.21 | 07/01/2003 | ||||||||||||
| (d) | Form of Chief Executive Officer Non-Qualified Stock Option Agreement | 8-K | 10.1 | 02/25/2005 | ||||||||||||
| (e) | Form of Executive Officer Non-Qualified Stock Option Agreement | 8-K | 10.2 | 02/25/2005 | ||||||||||||
| (f) | Form of General Restricted Stock Unit Agreement | 10-K | 10.24(f | ) | 02/17/2011 | |||||||||||
| (g) | Form of Chief Executive Officer Restricted Stock Unit Agreement | 8-K | 10.3 | 02/25/2005 | ||||||||||||
| (h) | Form of Executive Officer Restricted Stock Unit Agreement | 8-K | 10.4 | 02/25/2005 | ||||||||||||
| (i) | Form of Director Restricted Stock Unit Agreement | 8-K | 10.5 | 02/25/2005 | ||||||||||||
| (j) | Form of Chief Executive Officer Stock-Settled Stock Appreciation Rights ("SSAR") Agreement | 8-K | 10.3 | 02/26/2010 | ||||||||||||
| (k) | Form of Executive Officer SSAR Agreement | 8-K | 10.2 | 02/26/2010 | ||||||||||||
| (l) | Form of General Stock-Settled SSAR Agreement | 10-K | 10.24(l | ) | 02/17/2011 | |||||||||||
| 10.18 | (a) | TRW Automotive Holdings Corp. 2012 Stock Incentive Plan | DEF 14A | Appendix A | 03/29/2012 | |||||||||||
| (b) | Form of Chief Executive Officer SSAR Agreement | 10-Q | 10.1 | 04/30/2013 | ||||||||||||
| (c) | Form of Executive Officer SSAR Agreement | 10-Q | 10.2 | 04/30/2013 | ||||||||||||
| (d) | Form of General SSAR Agreement | 10-Q | 10.3 | 04/30/2013 | ||||||||||||
| (e) | Form of Chief Executive Officer Restricted Stock Unit Agreement | 10-Q | 10.4 | 04/30/2013 | ||||||||||||
| (f) | Form of Executive Officer Restricted Stock Unit Agreement | 10-Q | 10.5 | 04/30/2013 | ||||||||||||
| (g) | Form of General Restricted Stock Unit Agreement | 10-Q | 10.6 | 04/30/2013 | ||||||||||||
| (h) | Form of Director Restricted Stock Unit Agreement | 10-Q | 10.7 | 04/30/2013 | ||||||||||||
| (i) | Form of General Non-Qualified Stock Option Agreement | 10-Q | 10.8 | 04/30/2013 | ||||||||||||
| (j) | Form of Executive Officer Performance Stock Unit Agreement | 8-K | 10.3 | 02/14/2014 | ||||||||||||
| 21.1 | List of Subsidiaries | X | ||||||||||||||
| 23.1 | Consent of Ernst & Young LLP | X | ||||||||||||||
113
| |
|
Incorporated By Reference | |
|||||||||||||
|---|---|---|---|---|---|---|---|---|---|---|---|---|---|---|---|---|
| Exhibit Number |
Exhibit Description | Form | Exhibit | Filing Date |
Filed Herewith |
|||||||||||
| 31 | (a) | Certification Pursuant to Rule 13a-14(a) under the Securities Exchange Act of 1934, as adopted pursuant to §302 of the Sarbanes-Oxley Act of 2002 | X | |||||||||||||
| (b) | Certification Pursuant to Rule 13a-14(a) under the Securities Exchange Act of 1934, as adopted pursuant to §302 of the Sarbanes-Oxley Act of 2002 | X | ||||||||||||||
| 32 | Certification Pursuant to 18 U.S.C. §1350, As Adopted Pursuant to §906 of the Sarbanes-Oxley Act of 2002 | X | ||||||||||||||
| 101.INS | XBRL Instance Document | X | ||||||||||||||
| 101.SCH | XBRL Taxonomy Extension Schema Document | X | ||||||||||||||
| 101.CAL | XBRL Taxonomy Extension Calculation Linkbase Document | X | ||||||||||||||
| 101.LAB | XBRL Taxonomy Extension Label Linkbase Document | X | ||||||||||||||
| 101.PRE | XBRL Taxonomy Extension Presentation Linkbase Document | X | ||||||||||||||
| 101.DEF | XBRL Taxonomy Extension Definition Linkbase Document | X | ||||||||||||||
114
Pursuant to the requirements of Section 13 or 15(d) of the Securities Exchange Act of 1934, the registrant has duly caused this report to be signed on its behalf by the undersigned, thereunto duly authorized.
| TRW Automotive Holdings Corp. (Registrant) |
||||
Date: February 13, 2015 |
By: |
/s/ JOSEPH S. CANTIE Joseph S. Cantie Executive Vice President and Chief Financial Officer (On behalf of the Registrant and as Principal Financial Officer) |
||
Pursuant to the requirements of the Securities Exchange Act of 1934, this report has been signed below as of February 13, 2015 by the following persons on behalf of the registrant and in the capacities indicated.
Signature
|
Title
|
|
|---|---|---|
| /s/ JOHN C. PLANT John C. Plant |
Chairman of the Board, President and Chief Executive Officer (Principal Executive Officer) |
|
/s/ JOSEPH S. CANTIE Joseph S. Cantie |
Executive Vice President and Chief Financial Officer (Principal Financial Officer) |
|
/s/ TAMMY S. MITCHELL Tammy S. Mitchell |
Controller (Principal Accounting Officer) |
|
/s/ NEIL P. SIMPKINS Neil P. Simpkins |
Lead Independent Director |
|
/s/ JAMES F. ALBAUGH James F. Albaugh |
Director |
|
/s/ FRANCOIS J. CASTAING Francois J. Castaing |
Director |
115
Signature
|
Title
|
|
|---|---|---|
| /s/ ROBERT L. FRIEDMAN Robert L. Friedman |
Director | |
/s/ MICHAEL R. GAMBRELL Michael R. Gambrell |
Director |
|
/s/ J. MICHAEL LOSH J. Michael Losh |
Director |
|
/s/ DAVID W. MELINE David W. Meline |
Director |
|
/s/ JODY G. MILLER Jody G. Miller |
Director |
|
/s/ DAVID S. TAYLOR David S. Taylor |
Director |
116